Ophthalmic Epidemiology, 15:224–233 ISSN: 0928-6586 print / 1744-5086 online Copyright c 2008 Informa Healthcare USA, Inc. DOI: 10.1080/09286580802256559 An Evaluation of the 10-item Vision Core Measure 1 (VCM1) Scale (the Core Module of the Vision-Related Quality of Life scale) Using Rasch Analysis Ecosse L. Lamoureux, 1,4 Konrad Pesudovs, 2 Julie F. Pallant, 3 Gwyn Rees, 1 Jennifer B. Hassell, 1 Lynda E. Caudle, 2 and Jill E. Keeffe 1,4 1 Centre for Eye Research Australia, University of Melbourne, Melbourne, Australia 2 NH&MRC Centre for Clinical Eye Research, Flinders University and Flinders Medical Centre, Adelaide, Australia 3 School of Rural Health, University of Melbourne, Shepparton, Australia 4 Vision CRC-Sydney, Australia ABSTRACT Purpose: To assess and re-engineer the Vision Core Measure 1 (VCM1) questionnaire in low vision (LV) and cataract participants using Rasch analysis. Methods: 295 participants drawn from a low vision clinic and 181 from a cataract surgery waiting list completed the 10-item VCM1. Unidimensionality, item fit to the model, response category performance, differential item functioning (DIF) and targeting of items to patients were assessed. Category collapsing and item removal were considered to improve the questionnaire. Results: The initial fit of the VCM1 (combined populations) to the Rasch model showed lack of fit (χ2 = 83.3, df = 50, p = 0.002). There was evidence of DIF between the two populations which could not be resolved. Consequently, each population was assessed separately. Irrespective of the population, disor- dering of response category thresholds was evident. However, collapsing categories produced ordered thresholds and resulted in fit to the Rasch model for the LV (Total χ2 = 41.6, df = 30; p = 0.08) and cataract population (Total χ2 = 17.9, df = 20, p = 0.59). Overall, the VCM1 behaved as a unidimensional scale for each population and no item showed evidence of DIF. Item targeting to patients was however sub-optimal particularly for the cataract population. Conclusion: The VCM1 questionnaire could be improved by shortening the response scale, although different response categories are required for cataract and LV populations. Calibration of items also dif- fered across populations. While the VCM1 performs well within the Rasch model, in line with its initial purpose, it requires the addition of items to satisfactorily target low vision and cataract populations. INTRODUCTION Although objective vision impairment measures such as visual acuity are important, a comprehensive assessment of oph- thalmic outcomes should also include measurement from the patient’s point of view. 1 Patient-centered functioning is usu- ally assessed using questionnaires and over thirty vision-related Received 23 March 2008; accepted 17 May 2008 Keywords: VCM1, Rasch analysis, low vision, cataract, quality of life Correspondence to: Dr. Ecosse Lamoureux Centre for Eye Research Australia Department of Ophthalmology University of Melbourne, 32 Gisborne St East Melbourne Victoria 3002, Australia. E-mail: [email protected] quality of life instruments have been recently reviewed. 1–4 One of these is the Vision Core Measure1 (VCM1), the core com- ponent of the Vision-Related Quality of Life (VQOL), devel- oped in Great Britain for individuals with visual impairment. 5 The 10-item VCM1 scale assesses the patient’s global feelings and perceptions associated with visual impairment so could be termed a quality of life (QOL) measure. The VCM1 has been used for cataract surgery and low vi- sion rehabilitation, using a summary score or a mean value. 6–10 Summary scoring, also termed Likert scoring, allocates an ordinal assignment of a numerical value to a participant’s re- sponse. However, one limitation of this system is the erroneous assumption that it produces an interval scale. The validity of summary scores has been questioned by modern test theory, which includes Rasch analysis. 1,11–13 Rasch analysis provides estimates of measures on a linear interval scale. 1,14,15 It also cal- culates item difficulty in relation to person ability and assesses the scale validity in particular the item and person fit to the 224 July–August 2008 Ophthalmic Epidemiology Downloaded By: [Lamoureux, Ecosse L.] At: 06:14 9 September 2008

Welcome message from author
This document is posted to help you gain knowledge. Please leave a comment to let me know what you think about it! Share it to your friends and learn new things together.
Transcript
Ophthalmic Epidemiology, 15:224–233ISSN: 0928-6586 print / 1744-5086 onlineCopyright c© 2008 Informa Healthcare USA, Inc.DOI: 10.1080/09286580802256559
An Evaluation of the 10-item Vision Core Measure 1(VCM1) Scale (the Core Module of the Vision-Related
Quality of Life scale) Using Rasch AnalysisEcosse L. Lamoureux,1,4 Konrad Pesudovs,2 Julie F. Pallant,3 Gwyn Rees,1 Jennifer B. Hassell,1 Lynda E. Caudle,2 and
Jill E. Keeffe1,4
1Centre for Eye Research Australia, University of Melbourne, Melbourne, Australia2NH&MRC Centre for Clinical Eye Research, Flinders University and Flinders Medical Centre, Adelaide, Australia
3School of Rural Health, University of Melbourne, Shepparton, Australia4Vision CRC-Sydney, Australia
ABSTRACT
Purpose: To assess and re-engineer the Vision Core Measure 1 (VCM1) questionnaire in lowvision (LV) and cataract participants using Rasch analysis. Methods: 295 participants drawnfrom a low vision clinic and 181 from a cataract surgery waiting list completed the 10-itemVCM1. Unidimensionality, item fit to the model, response category performance, differentialitem functioning (DIF) and targeting of items to patients were assessed. Category collapsingand item removal were considered to improve the questionnaire. Results: The initial fit of theVCM1 (combined populations) to the Rasch model showed lack of fit (χ2 = 83.3, df = 50, p =0.002). There was evidence of DIF between the two populations which could not be resolved.Consequently, each population was assessed separately. Irrespective of the population, disor-dering of response category thresholds was evident. However, collapsing categories producedordered thresholds and resulted in fit to the Rasch model for the LV (Total χ2 = 41.6, df = 30; p =0.08) and cataract population (Total χ2 = 17.9, df = 20, p = 0.59). Overall, the VCM1 behaved asa unidimensional scale for each population and no item showed evidence of DIF. Item targetingto patients was however sub-optimal particularly for the cataract population. Conclusion: TheVCM1 questionnaire could be improved by shortening the response scale, although differentresponse categories are required for cataract and LV populations. Calibration of items also dif-fered across populations. While the VCM1 performs well within the Rasch model, in line with itsinitial purpose, it requires the addition of items to satisfactorily target low vision and cataractpopulations.
INTRODUCTION
Although objective vision impairment measures such asvisual acuity are important, a comprehensive assessment of oph-thalmic outcomes should also include measurement from thepatient’s point of view.1 Patient-centered functioning is usu-ally assessed using questionnaires and over thirty vision-related
Received 23 March 2008; accepted 17 May 2008Keywords: VCM1, Rasch analysis, low vision, cataract,quality of lifeCorrespondence to:Dr. Ecosse LamoureuxCentre for Eye Research AustraliaDepartment of OphthalmologyUniversity of Melbourne, 32 Gisborne StEast Melbourne Victoria3002, Australia. E-mail: [email protected]
quality of life instruments have been recently reviewed.1–4 Oneof these is the Vision Core Measure1 (VCM1), the core com-ponent of the Vision-Related Quality of Life (VQOL), devel-oped in Great Britain for individuals with visual impairment.5
The 10-item VCM1 scale assesses the patient’s global feelingsand perceptions associated with visual impairment so could betermed a quality of life (QOL) measure.
The VCM1 has been used for cataract surgery and low vi-sion rehabilitation, using a summary score or a mean value.6–10 Summary scoring, also termed Likert scoring, allocates anordinal assignment of a numerical value to a participant’s re-sponse. However, one limitation of this system is the erroneousassumption that it produces an interval scale. The validity ofsummary scores has been questioned by modern test theory,which includes Rasch analysis.1,11–13 Rasch analysis providesestimates of measures on a linear interval scale.1,14,15 It also cal-culates item difficulty in relation to person ability and assessesthe scale validity in particular the item and person fit to the
224 July–August 2008 Ophthalmic Epidemiology
Downloaded By: [Lamoureux, Ecosse L.] At: 06:14 9 September 2008
overall construct.16–19 Critically, Rasch analysis can assess ifthe items used are appropriately targeted at the population beingassessed.1,20,21
The conventional psychometric attributes of the VCM1 havebeen reported,5,22 but the ability of the scale to provide fun-damental measurement has not been empirically demonstrated.Given the substantial advantages offered by Rasch analysis andthat the VCM1 questionnaire has been used with cataract andlow vision patients,9,10,23 we assessed its validity and measure-ment properties in these two important ophthalmic populationsusing Rasch analysis.
METHODS
Participants
First time referrals to low vision rehabilitation centers acrossVictoria (a southern state of Australia) participated in this study.An ophthalmologist report, providing the cause of vision lossand visual acuities, was required for each participant. The eli-gibility criteria included best presenting visual acuity (VA) <
6/12 (or >6/12 with restricted fields), ≥18 years of age and theability to converse in English.
Participants with cataract were drawn from the public surgerywaiting list of the ophthalmology service at Flinders MedicalCentre, Adelaide (South Australia). All patients on this list hadbeen previously assessed in the eye clinic and reported diffi-culty performing everyday tasks because of their vision. Theyall had cataract, the removal of which was judged to be likelyto remove their visual disability. By these criteria, they werelisted for cataract surgery.24 Other inclusion criteria were aged18 years or older, no severe cognitive impairment and abilityto converse in English without the need for an interpreter. Eth-ical approval was obtained for both populations and a consentform was signed by each patient who agreed to participate. Thisresearch adhered to the tenets of the Declaration of Helsinki.
The VCM1
Similar to the VQOL,5 the Impact of Visual Impairment (IVI)questionnaire25 used the 10 items of the VCM1 as its core (Table1). The VCM1 includes content related to the overall constructof quality of life feelings and perceptions associated with visualimpairment (QoL). The content of these 10 items is best con-sidered to be quality of life as they pertain to concerns and feel-ings. There are no visual disability or activity limitation items.All participants completed the IVI but we are however report-ing only the participants’ responses to the ten VCM1 items inthis manuscript. The IVI has been assessed using Rasch analysispreviously,26 whereas the 10 core items have not, but have beenused alone as a measure by others.10,23,27,28 All items are pre-ceded by “In the past month . . . ” and VCM1 item responses wereassigned the following numerical values; “not at all” (0), “veryrarely” (1) “a little of the time” (2) “a fair amount of the time”(3) “a lot of the time” (4) and “all the time” (5). According to itsconventional validation,5 it was expected that the items of theVCM1 will conform to a unidimensional and interval scaling.
Table 1. The 10 items of the Vision Core Measure1 (VCM1)questionnaire “In the past month . . . ”
1. How often has your eyesight made you concerned or worriedabout your general safety at home?
2. How often has your eyesight made you concerned or worriedabout your general safety outside of your home?
3. How often has your eyesight stopped you from doing the thingsyou want to do?
4. Have you felt embarrassed because of your eyesight?5. Have you felt frustrated or annoyed because of your eyesight?6. Have you felt lonely or isolated because of your eyesight?7. Have you felt sad or low because of your eyesight?8. How often have you worried about your eyesight getting worse?9. How often has your eyesight made you concerned or worried
about coping with everyday life?10. How much has your eyesight interfered with your life in general?
Rasch analysis
The VCM1 data, from the two populations combined(cataract and low vision), were initially assessed for fit to theRasch model29 using the RUMM2020 software (RUMM Lab-oratory, Perth, Australia).30 The Rasch model assumes that theprobability of a respondent affirming an item is a logistic func-tion of the relative distance between the item location and therespondent location on a linear scale. Hence, it is anticipatedthat the probability of endorsing a particular rating category willincrease monotonically with the difference between the respon-dent’s level of QoL in performing daily activities and the levelof QoL required for the task. Where the data meet the Raschmodel expectations, a transformation of the ordinal raw scoreinto a true Rasch scale is achieved.31,32
To facilitate the interpretation the VCM1 rating scale, thescoring was reversed for the Rasch analysis (0 as 5, 1 as 4, 2 as 3,3 as 2, 4 as 1, and 5 as 0). A positive item, measured in logits (theunit of measure used by Rasch for calibrating items and measur-ing persons) on the Rasch scale indicates that the item requiresa higher level of vision-specific QoL than the mean of the items,while a negative item logit suggests that the item requires a lowerlevel of vision-specific QoL than the average. A positive personlogit score suggests that the person’s level of vision-specific QoLis higher than the mean required level of vision-specific QoL forthe items. Conversely, if a person logit score is negative, theperson’s perceived level of vision-specific QoL is lower than theaverage required level of vision-specific QoL.
Four overall performance statistics are considered. Two areFit statistics which represent the residuals between the expectedestimate and actual values for each person-item, summed overall items for each person and over all persons for each item. Themean square residuals are transformed to approximate a z-scoreand represent a standardized normal distribution where perfectfit to the model would have a mean of approximately 0 and astandard deviation of 1.
An item-trait interaction score reported as a Chi-Square (χ2),which reflects the property of invariance across the trait, is alsoprovided. This is calculated by adding the chi-square values forthe individual scale items with the determination of significance
Ophthalmic Epidemiology July–August 2008 225
Downloaded By: [Lamoureux, Ecosse L.] At: 06:14 9 September 2008
using the associated summated degrees of freedom. A non-significant Bonferroni-adjusted probability value (p = 0.005:0.05/10 VCM1 items) suggests no substantial deviation from themodel and indicates that the hierarchical ordering of the itemsis consistent across all levels of the underlying trait. A personseparation reliability score ranging between 0 and 1 indicateshow well the items of the instrument separate the respondents.
A person separation reliability (PSR) score ranging between0 and 1 indicates how well the items of the instrument separatethe respondents. For example, a PSR value of 0.7 represents theability to distinguish two distinct strata of person ability.33,34 Avalue of 0.9 represents the ability to distinguish four strata ofperson ability.
In the event of misfit, removal of items is considered if theydemonstrate fit residual values >2.5 or less than Bonferroni-adjusted probability scores (p = 0.005 (0.05/10 items). Thepresence of disordered thresholds is also determined. Disorderedthresholds occur when participants have difficulty discriminat-ing between the response options. This means literally that acategory expected to be “harder” than an adjacent category wasactually “easier,” but often represents interchangeability of cat-egories. Category collapsing is often the solution to disorderedthresholds, which can improve overall fit to the model.
Misfit of the data to the Rasch model could also be linked withdifferential item functioning (DIF) where different groups withinthe sample (e.g. gender, eye disease, levels of visual acuity, etc),despite equal levels of the underlying trait, respond differentlyto an individual item. DIF can be detected both graphically andstatistically using analysis of variance comparing scores acrosseach level of the person factor and across different levels of trait(referred to as class intervals).
Unidimensionality provides further evidence that the instru-ment is measuring the underlying trait (quality of life) that itpurports to measure. The unidimensionality of the VCM1 wasassessed using Principal Components Analysis (PCA) of theresiduals. Unidimensionality is formally tested in RUMM2020by allowing the pattern of factor loadings on the first componentto determine “subsets” of items (“positive” and “negative” load-ings subsets). If person estimates derived from these two subsetsof items statistically differ (using independent t-test provided inRUMM) from the estimates derived from the full scale, a breachof the assumption of unidimensionality is indicated.35
Targeting was also assessed as it was important to determineif the VCM1 items were particularly suitable to assess qualityof life associated with low vision or cataract. Poorly targetedmeasures are limited by floor or ceiling effects, display an unevenspread of items across the full range of respondent’s scores andshow insufficient items to assess the full range of the sample trait.
RESULTS
Participant characteristics
The characteristics of the low vision (n = 295) and cataractparticipants (n = 181) who completed the VCM1 are shown inTables 2 and 3. Most participants were elderly, female and re-
Table 2. Characteristics of the low vision participants (n = 295)
Age (y) Mean ± SD 78.1 ±12.8
Gender Men 106 (36%)Women 189 (64%)
Visual acuity <6/12 to 6/18 126 (43%)<6/18 to 6/60 134 (45%)<6/60 35 (12%)
Main cause of visionloss
Age-related maculardegeneration
163 (55%)
Diabetic retinopathy 45 (15%)Glaucoma 35 (12%)Other 52 (18%)
Duration of visionimpairment (y)
Median (min, max) 3 (0.4 – 84)
Comorbidity “Yes” 242 (82%)“No” 53 (18%)
Comorbidity affect ondaily living?
“Not at all” 57 (24%)
“A little” 85 (35%)“A great deal” 100 (41%)
SD = standard deviation.
ported some general medical comorbidity. The majority of thelow vision participants had age-related macular degeneration,and the majority of cataract participants had bilateral cataract anddid not have ocular comorbidity. Notably, the cataract patientshad better binocular visual acuity than the low vision patients,but this represents genuine differences between these clinicalpopulations; patients present for cataract surgery at lower levelsof impairment than people present for low vision care. The rateof cataract patients with visual acuity better than 6/12 is compa-rable to that reported in a British public cataract surgery waitinglist.23
Table 3. Characteristics of the cataract participants (n = 181)
Age (y) Mean ± SD 72.2 ±11.9
Gender Men 71 (39%)Women 110 (61%)
Visual acuity >6/12 120 (66%)<6/12 to 6/18 43 (24%)<6/18 to 6/60 18 (10%)<6/60 0 (0%)Awaiting second eye
surgery74 (41%)
Ocular comorbidity “Yes” 46 (25%)“No” 135 (75%)
Duration of cataract (y) Median (min, max) 2 (0, 31)Systemic comorbidity “Yes” 117 (65%)
“No” 64 (35%)Comorbidity affect on daily
living?“No impact” 14 (22%)
“Moderately” 24 (37%)“A lot” 26 (41%)
SD = standard deviation.
226 July–August 2008 Ophthalmic Epidemiology
Downloaded By: [Lamoureux, Ecosse L.] At: 06:14 9 September 2008
Overall fit of the VCM1 combined data to theRasch model
Since the item wording and response category choices areconsistent across items it was appropriate to use a single Andrichrating scale in RUMM 2020 analysis.36 Rasch analysis of the10-item VCM1 showed lack of fit to the Rasch model witha significant Item-Trait Interaction total χ2 probability value(p = 0.0000). Two items namely item 2- “How often has youreyesight made you concerned or worried about your generalsafety outside of your home?” and item 6 “Have you felt lonelyor isolated because of your eyesight?” demonstrated extremefit residual values and probabilities below the Bonferroni ad-justment threshold. Removing these items produced more itemswith extreme fit residuals values (>2.5) and no improvement inthe χ2 probability value. There was also evidence of DIF be-tween the two eye disease populations on a number of items.Therefore it was not appropriate to combine these two pop-ulations and it was decided to assess if the VCM1 was anappropriate scale to assess quality of life in each populationseparately.
Low vision
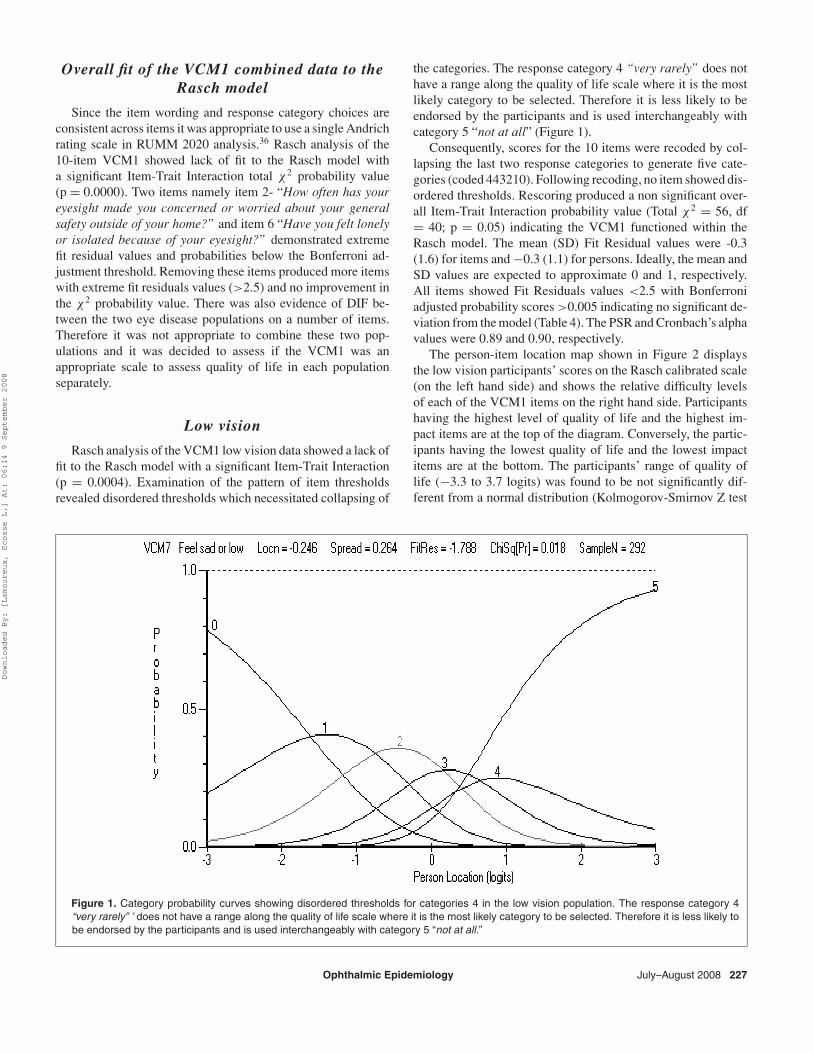
Rasch analysis of the VCM1 low vision data showed a lack offit to the Rasch model with a significant Item-Trait Interaction(p = 0.0004). Examination of the pattern of item thresholdsrevealed disordered thresholds which necessitated collapsing of
the categories. The response category 4 “very rarely” does nothave a range along the quality of life scale where it is the mostlikely category to be selected. Therefore it is less likely to beendorsed by the participants and is used interchangeably withcategory 5 “not at all” (Figure 1).
Consequently, scores for the 10 items were recoded by col-lapsing the last two response categories to generate five cate-gories (coded 443210). Following recoding, no item showed dis-ordered thresholds. Rescoring produced a non significant over-all Item-Trait Interaction probability value (Total χ2 = 56, df= 40; p = 0.05) indicating the VCM1 functioned within theRasch model. The mean (SD) Fit Residual values were -0.3(1.6) for items and −0.3 (1.1) for persons. Ideally, the mean andSD values are expected to approximate 0 and 1, respectively.All items showed Fit Residuals values <2.5 with Bonferroniadjusted probability scores >0.005 indicating no significant de-viation from the model (Table 4). The PSR and Cronbach’s alphavalues were 0.89 and 0.90, respectively.
The person-item location map shown in Figure 2 displaysthe low vision participants’ scores on the Rasch calibrated scale(on the left hand side) and shows the relative difficulty levelsof each of the VCM1 items on the right hand side. Participantshaving the highest level of quality of life and the highest im-pact items are at the top of the diagram. Conversely, the partic-ipants having the lowest quality of life and the lowest impactitems are at the bottom. The participants’ range of quality oflife (−3.3 to 3.7 logits) was found to be not significantly dif-ferent from a normal distribution (Kolmogorov-Smirnov Z test
Figure 1. Category probability curves showing disordered thresholds for categories 4 in the low vision population. The response category 4“very rarely” ’ does not have a range along the quality of life scale where it is the most likely category to be selected. Therefore it is less likely tobe endorsed by the participants and is used interchangeably with category 5 “not at all.”
Ophthalmic Epidemiology July–August 2008 227
Downloaded By: [Lamoureux, Ecosse L.] At: 06:14 9 September 2008
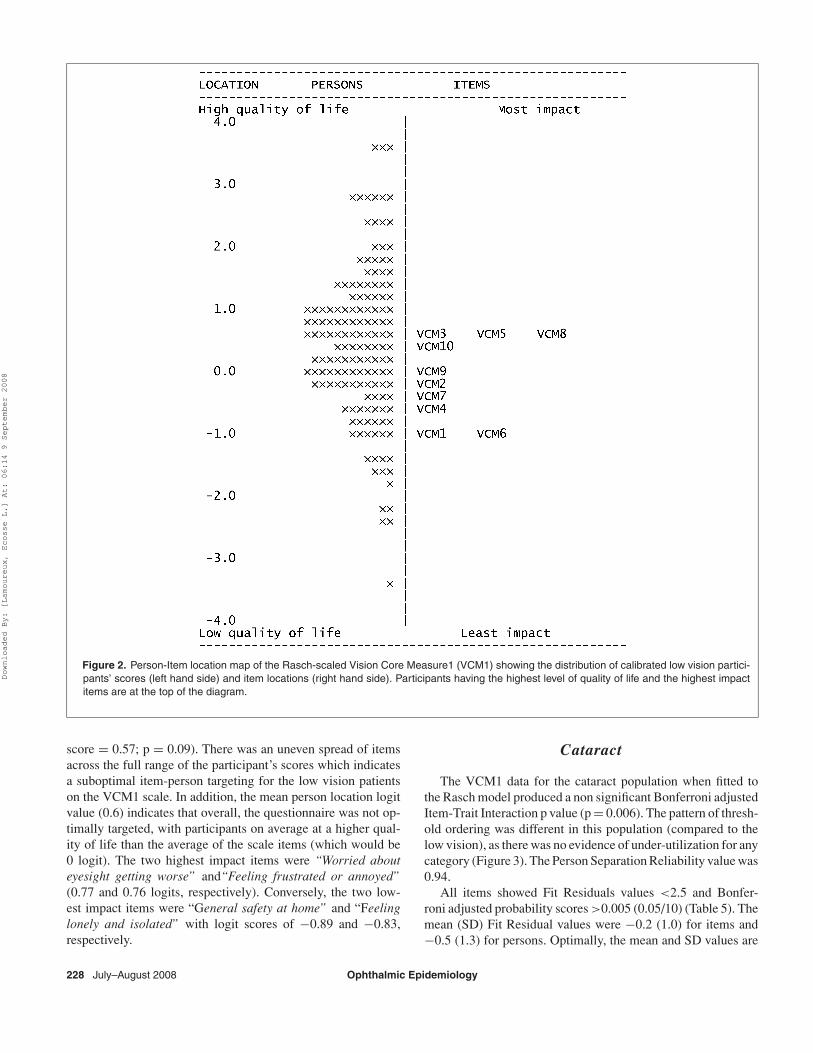
Figure 2. Person-Item location map of the Rasch-scaled Vision Core Measure1 (VCM1) showing the distribution of calibrated low vision partici-pants’ scores (left hand side) and item locations (right hand side). Participants having the highest level of quality of life and the highest impactitems are at the top of the diagram.
score = 0.57; p = 0.09). There was an uneven spread of itemsacross the full range of the participant’s scores which indicatesa suboptimal item-person targeting for the low vision patientson the VCM1 scale. In addition, the mean person location logitvalue (0.6) indicates that overall, the questionnaire was not op-timally targeted, with participants on average at a higher qual-ity of life than the average of the scale items (which would be0 logit). The two highest impact items were “Worried abouteyesight getting worse” and“Feeling frustrated or annoyed”(0.77 and 0.76 logits, respectively). Conversely, the two low-est impact items were “General safety at home” and “Feelinglonely and isolated” with logit scores of −0.89 and −0.83,respectively.
Cataract
The VCM1 data for the cataract population when fitted tothe Rasch model produced a non significant Bonferroni adjustedItem-Trait Interaction p value (p = 0.006). The pattern of thresh-old ordering was different in this population (compared to thelow vision), as there was no evidence of under-utilization for anycategory (Figure 3). The Person Separation Reliability value was0.94.
All items showed Fit Residuals values <2.5 and Bonfer-roni adjusted probability scores >0.005 (0.05/10) (Table 5). Themean (SD) Fit Residual values were −0.2 (1.0) for items and−0.5 (1.3) for persons. Optimally, the mean and SD values are
228 July–August 2008 Ophthalmic Epidemiology
Downloaded By: [Lamoureux, Ecosse L.] At: 06:14 9 September 2008
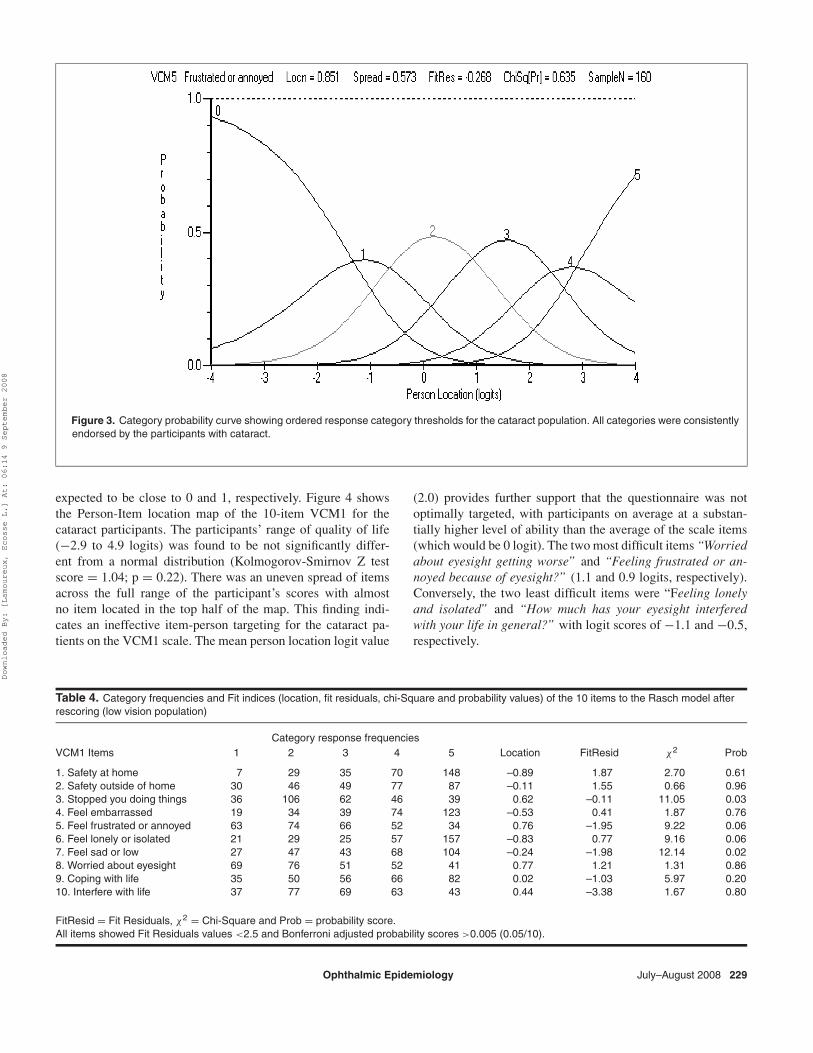
Figure 3. Category probability curve showing ordered response category thresholds for the cataract population. All categories were consistentlyendorsed by the participants with cataract.
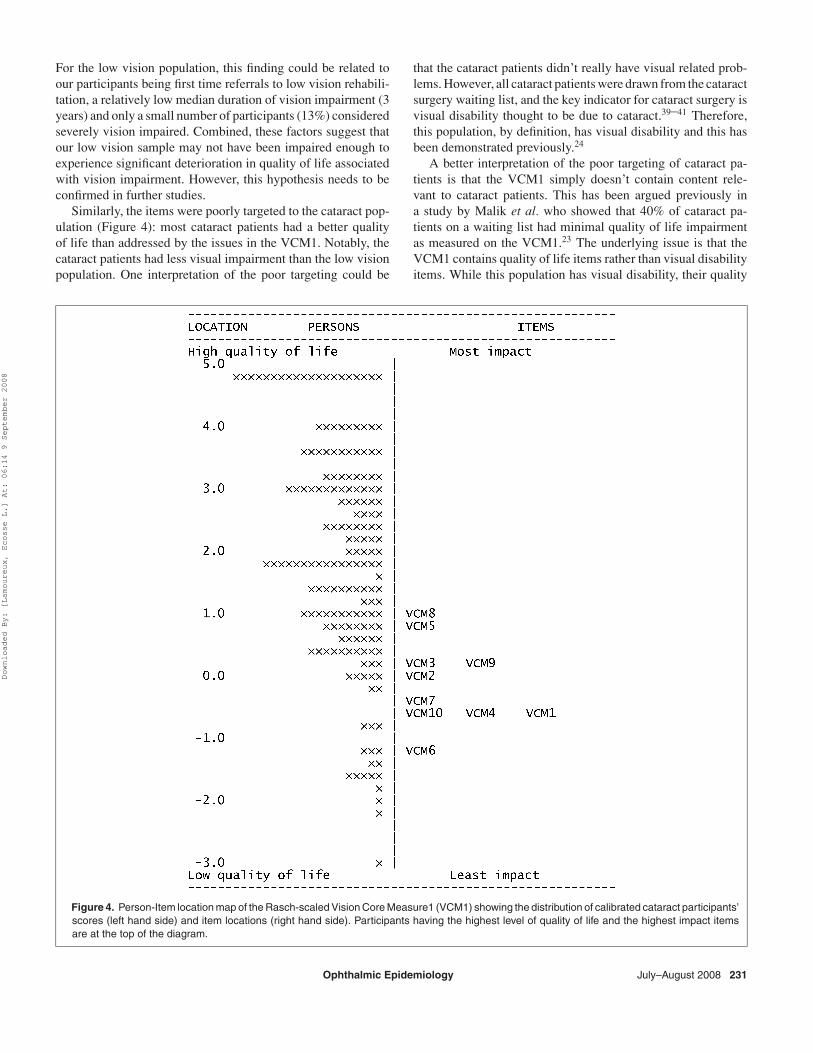
expected to be close to 0 and 1, respectively. Figure 4 showsthe Person-Item location map of the 10-item VCM1 for thecataract participants. The participants’ range of quality of life(−2.9 to 4.9 logits) was found to be not significantly differ-ent from a normal distribution (Kolmogorov-Smirnov Z testscore = 1.04; p = 0.22). There was an uneven spread of itemsacross the full range of the participant’s scores with almostno item located in the top half of the map. This finding indi-cates an ineffective item-person targeting for the cataract pa-tients on the VCM1 scale. The mean person location logit value
(2.0) provides further support that the questionnaire was notoptimally targeted, with participants on average at a substan-tially higher level of ability than the average of the scale items(which would be 0 logit). The two most difficult items “Worriedabout eyesight getting worse” and “Feeling frustrated or an-noyed because of eyesight?” (1.1 and 0.9 logits, respectively).Conversely, the two least difficult items were “Feeling lonelyand isolated” and “How much has your eyesight interferedwith your life in general?” with logit scores of −1.1 and −0.5,respectively.
Table 4. Category frequencies and Fit indices (location, fit residuals, chi-Square and probability values) of the 10 items to the Rasch model afterrescoring (low vision population)
Category response frequenciesVCM1 Items 1 2 3 4 5 Location FitResid χ2 Prob
1. Safety at home 7 29 35 70 148 –0.89 1.87 2.70 0.612. Safety outside of home 30 46 49 77 87 –0.11 1.55 0.66 0.963. Stopped you doing things 36 106 62 46 39 0.62 –0.11 11.05 0.034. Feel embarrassed 19 34 39 74 123 –0.53 0.41 1.87 0.765. Feel frustrated or annoyed 63 74 66 52 34 0.76 –1.95 9.22 0.066. Feel lonely or isolated 21 29 25 57 157 –0.83 0.77 9.16 0.067. Feel sad or low 27 47 43 68 104 –0.24 –1.98 12.14 0.028. Worried about eyesight 69 76 51 52 41 0.77 1.21 1.31 0.869. Coping with life 35 50 56 66 82 0.02 –1.03 5.97 0.2010. Interfere with life 37 77 69 63 43 0.44 –3.38 1.67 0.80
FitResid = Fit Residuals, χ2 = Chi-Square and Prob = probability score.All items showed Fit Residuals values <2.5 and Bonferroni adjusted probability scores >0.005 (0.05/10).
Ophthalmic Epidemiology July–August 2008 229
Downloaded By: [Lamoureux, Ecosse L.] At: 06:14 9 September 2008
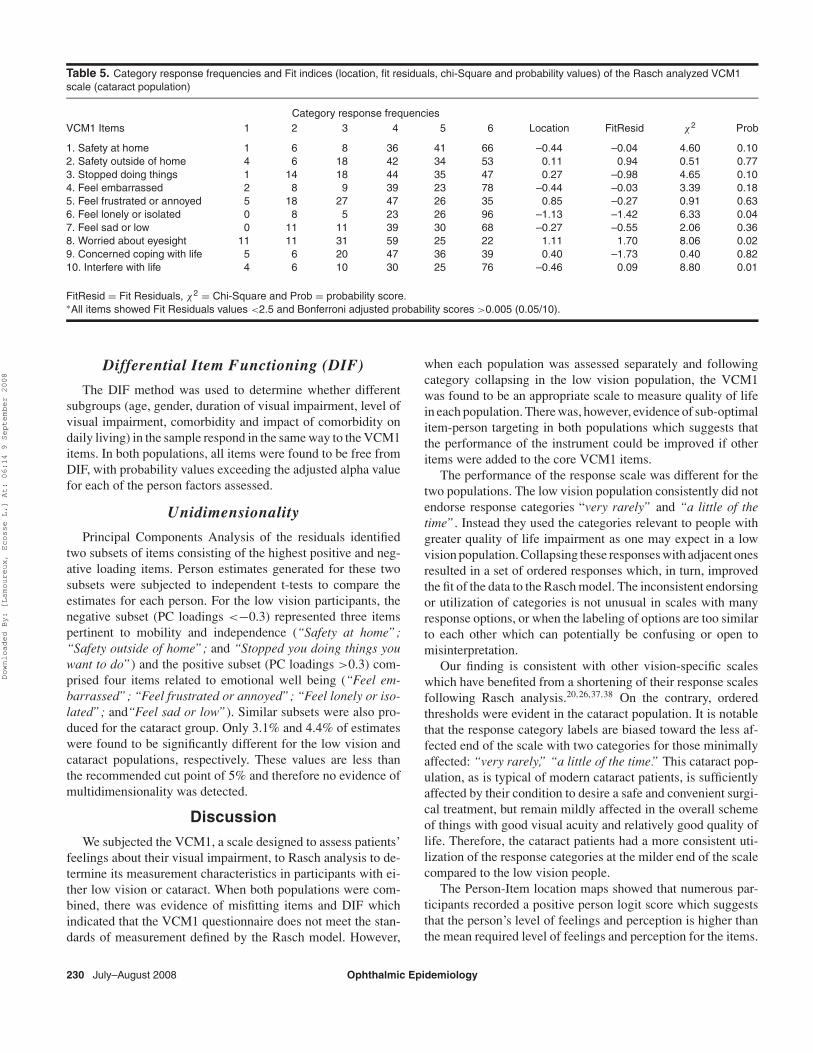
Table 5. Category response frequencies and Fit indices (location, fit residuals, chi-Square and probability values) of the Rasch analyzed VCM1scale (cataract population)
Category response frequenciesVCM1 Items 1 2 3 4 5 6 Location FitResid χ2 Prob
1. Safety at home 1 6 8 36 41 66 –0.44 –0.04 4.60 0.102. Safety outside of home 4 6 18 42 34 53 0.11 0.94 0.51 0.773. Stopped doing things 1 14 18 44 35 47 0.27 –0.98 4.65 0.104. Feel embarrassed 2 8 9 39 23 78 –0.44 –0.03 3.39 0.185. Feel frustrated or annoyed 5 18 27 47 26 35 0.85 –0.27 0.91 0.636. Feel lonely or isolated 0 8 5 23 26 96 –1.13 –1.42 6.33 0.047. Feel sad or low 0 11 11 39 30 68 –0.27 –0.55 2.06 0.368. Worried about eyesight 11 11 31 59 25 22 1.11 1.70 8.06 0.029. Concerned coping with life 5 6 20 47 36 39 0.40 –1.73 0.40 0.8210. Interfere with life 4 6 10 30 25 76 –0.46 0.09 8.80 0.01
FitResid = Fit Residuals, χ2 = Chi-Square and Prob = probability score.∗All items showed Fit Residuals values <2.5 and Bonferroni adjusted probability scores >0.005 (0.05/10).
Differential Item Functioning (DIF)
The DIF method was used to determine whether differentsubgroups (age, gender, duration of visual impairment, level ofvisual impairment, comorbidity and impact of comorbidity ondaily living) in the sample respond in the same way to the VCM1items. In both populations, all items were found to be free fromDIF, with probability values exceeding the adjusted alpha valuefor each of the person factors assessed.
Unidimensionality
Principal Components Analysis of the residuals identifiedtwo subsets of items consisting of the highest positive and neg-ative loading items. Person estimates generated for these twosubsets were subjected to independent t-tests to compare theestimates for each person. For the low vision participants, thenegative subset (PC loadings <−0.3) represented three itemspertinent to mobility and independence (“Safety at home”;“Safety outside of home”; and “Stopped you doing things youwant to do”) and the positive subset (PC loadings >0.3) com-prised four items related to emotional well being (“Feel em-barrassed”; “Feel frustrated or annoyed”; “Feel lonely or iso-lated”; and“Feel sad or low”). Similar subsets were also pro-duced for the cataract group. Only 3.1% and 4.4% of estimateswere found to be significantly different for the low vision andcataract populations, respectively. These values are less thanthe recommended cut point of 5% and therefore no evidence ofmultidimensionality was detected.
Discussion
We subjected the VCM1, a scale designed to assess patients’feelings about their visual impairment, to Rasch analysis to de-termine its measurement characteristics in participants with ei-ther low vision or cataract. When both populations were com-bined, there was evidence of misfitting items and DIF whichindicated that the VCM1 questionnaire does not meet the stan-dards of measurement defined by the Rasch model. However,
when each population was assessed separately and followingcategory collapsing in the low vision population, the VCM1was found to be an appropriate scale to measure quality of lifein each population. There was, however, evidence of sub-optimalitem-person targeting in both populations which suggests thatthe performance of the instrument could be improved if otheritems were added to the core VCM1 items.
The performance of the response scale was different for thetwo populations. The low vision population consistently did notendorse response categories “very rarely” and “a little of thetime”. Instead they used the categories relevant to people withgreater quality of life impairment as one may expect in a lowvision population. Collapsing these responses with adjacent onesresulted in a set of ordered responses which, in turn, improvedthe fit of the data to the Rasch model. The inconsistent endorsingor utilization of categories is not unusual in scales with manyresponse options, or when the labeling of options are too similarto each other which can potentially be confusing or open tomisinterpretation.
Our finding is consistent with other vision-specific scaleswhich have benefited from a shortening of their response scalesfollowing Rasch analysis.20,26,37,38 On the contrary, orderedthresholds were evident in the cataract population. It is notablethat the response category labels are biased toward the less af-fected end of the scale with two categories for those minimallyaffected: “very rarely,” “a little of the time.” This cataract pop-ulation, as is typical of modern cataract patients, is sufficientlyaffected by their condition to desire a safe and convenient surgi-cal treatment, but remain mildly affected in the overall schemeof things with good visual acuity and relatively good quality oflife. Therefore, the cataract patients had a more consistent uti-lization of the response categories at the milder end of the scalecompared to the low vision people.
The Person-Item location maps showed that numerous par-ticipants recorded a positive person logit score which suggeststhat the person’s level of feelings and perception is higher thanthe mean required level of feelings and perception for the items.
230 July–August 2008 Ophthalmic Epidemiology
Downloaded By: [Lamoureux, Ecosse L.] At: 06:14 9 September 2008
For the low vision population, this finding could be related toour participants being first time referrals to low vision rehabili-tation, a relatively low median duration of vision impairment (3years) and only a small number of participants (13%) consideredseverely vision impaired. Combined, these factors suggest thatour low vision sample may not have been impaired enough toexperience significant deterioration in quality of life associatedwith vision impairment. However, this hypothesis needs to beconfirmed in further studies.
Similarly, the items were poorly targeted to the cataract pop-ulation (Figure 4): most cataract patients had a better qualityof life than addressed by the issues in the VCM1. Notably, thecataract patients had less visual impairment than the low visionpopulation. One interpretation of the poor targeting could be
that the cataract patients didn’t really have visual related prob-lems. However, all cataract patients were drawn from the cataractsurgery waiting list, and the key indicator for cataract surgery isvisual disability thought to be due to cataract.39–41 Therefore,this population, by definition, has visual disability and this hasbeen demonstrated previously.24
A better interpretation of the poor targeting of cataract pa-tients is that the VCM1 simply doesn’t contain content rele-vant to cataract patients. This has been argued previously ina study by Malik et al. who showed that 40% of cataract pa-tients on a waiting list had minimal quality of life impairmentas measured on the VCM1.23 The underlying issue is that theVCM1 contains quality of life items rather than visual disabilityitems. While this population has visual disability, their quality
Figure 4. Person-Item location map of the Rasch-scaled Vision Core Measure1 (VCM1) showing the distribution of calibrated cataract participants’scores (left hand side) and item locations (right hand side). Participants having the highest level of quality of life and the highest impact itemsare at the top of the diagram.
Ophthalmic Epidemiology July–August 2008 231
Downloaded By: [Lamoureux, Ecosse L.] At: 06:14 9 September 2008
of life was largely not affected by this. There may be funda-mental reasons for this, for instance, cataract patients expectthat surgery will remove their problems, so they don’t have anylong term concerns about visual impairment and its impacts.Regardless of the mechanism, it appears that the VCM1, on itsown, is not a suitable outcome instrument for cataract patients.An instrument which specifically measures visual disability ora hybrid of the VCM1 and such an instrument would be moreappropriate.
In conclusion, the application of Rasch analysis model doesnot support the structure of the original VCM1 and its rating scale(for the low vision group), which, in its raw form is essentiallyordinal. The performance across the two disease groups differedand targeting was suboptimal, in particular in the cataract par-ticipants, suggesting that items should be added to optimize theinstrument performance. The modified VCM1 scale did howeverachieve fit to the Rasch model for both populations.
REFERENCES1. Pesudovs K. Patient-centered measurement in ophthalmology - A
paradigm shift. BMC Ophthalmol. 2006;6:25.2. de Boer MR, Moll AC, de Vet HC, Terwee CB, Volker-Dieben HJ,
van Rens GH. Psychometric properties of vision-related quality oflife questionnaires: A systematic review. Ophthalmic Physiol Opt.2004;24:257–73.
3. Massof RW, Rubin GS. Visual function assessment question-naires. Surv Ophthalmology 2001;45:531–48.
4. Margolis MK, Coyne K, Kennedy-Martin T, Baker T, Schein O, Re-vicki DA. Vision-specific instruments for the assessment of health-related quality of life and visual functioning: A literature review.Pharmacoeconomics 2002;20:791–812.
5. Frost NA, Sparrow JM, Durant JS, Donovan JL, Peters TJ, BrookesST. Development of a questionnaire for measurement of vision-related quality of life. Ophthalmic Epidemiol. 1998;5: 185–210.
6. Gardiner AM, Armstrong RA, Dunne MC, Murray PI. Correlationbetween visual function and visual ability in patients with uveitis.Br J Opthalmol. 2002;86:993–6.
7. de Boer MR, de Vet HC, Terwee CB, Moll AC, Volker-Dieben HJ,van Rens GH. Changes to the subscales of two vision-related qual-ity of life questionnaires are proposed. J Clin Epidemiol. 2005;58:1260–8.
8. de Boer MR, Terwee CB, de Vet HC, Moll AC, Volker-DiebenHJ, van Rens GH. Evaluation of cross-sectional and longitudi-nal construct validity of two vision-related quality of life ques-tionnaires: The LVQOL and VCM1. Qual Life Res. 2006;15:233–48.
9. Tinley CG, Frost A, Hakin KN, McDermott W, Ewings P. Is visualoutcome compromised when next day review is omitted after pha-coemulsification surgery? A randomised control trial. Br J Opthal-mol. 2003;87:350–5.
10. Reeves BC, Harper RA, Russell WB. Enhanced low vision reha-bilitation for people with age related macular degeneration: A ran-domised controlled trial. Br J Opthalmol. 2004;88:1443–9.
11. Wright BD, Linacre JM. Observations are always ordinal, measure-ments must be interval. Arch Phys Med Rehabil. 1989;70:857–60.
12. Fisher WP, Jr, Eubanks R, Marier RL. Equating the MOS SF36and the LSU HSI Physical Functioning Scales.J Outcome Meas.1997;1:329–62.
13. Massof RW. The measurement of vision disability. Optom Vis Sci.2002;79:516–52.
14. Garamendi E, Pesudovs K, Stevens MJ, Elliott DB. The RefractiveStatus and Vision Profile: Evaluation of psychometric properties
and comparison of Rasch and summated Likert-scaling. VisionRes. 2006;46:1375–83.
15. Norquist JM, Fitzpatrick R, Dawson J, Jenkinson C. Comparingalternative Rasch-based methods vs raw scores in measuringchange in health. Med Care 2004;42:I25–36.
16. Lamoureux E, Pallant J, Pesudovs K, Tennant A, Rees G,O’Connor P, Keeffe J. A self-assessment instrument designed toassess restriction of participation in people with low vision: Gener-alizability to patients with age-related macular degeneration. Oph-thalmic Epidemiol. 2008: In Press.
17. Lamoureux EL, Ferraro JG, Pallant JF, Pesudovs K, Rees G, KeeffeJE. Are standard instruments valid for the assessment of qualityof life and symptoms in glaucoma? Optom Vis Sci. 2007;84:789–96.
18. Lamoureux EL, Pallant JF, Pesudovs K, Hassell JB, Keeffe JE. TheImpact of Vision Impairment Questionnaire: An evaluation of itsmeasurement properties using Rasch analysis.Invest OpthalmolVis Sci. 2006;47:4732–41.
19. Lamoureux EL, Pallant JF, Pesudovs K, Rees G, Hassell JB, Ke-effe JE. The Impact Of Vision Impairment Questionnaire: An as-sessment of its domain structure using confirmatory factor anal-ysis and Rasch analysis. Invest Opthalmol Vis Sci. 2007;48:1001–6.
20. Pesudovs K, Garamendi E, Keeves JP, Elliott DB. The Activi-ties of Daily Vision Scale for cataract surgery outcomes: Re-evaluating validity with Rasch analysis.Invest Opthalmol Vis Sci.2003; 44:2892–9.
21. Pesudovs K, Garamendi E, Elliott DB. The Quality of LifeImpact of Refractive Correction (QIRC) Questionnaire: De-velopment and validation. Optom Vis Sci. 2004;81:769–77.
22. Frost NA, Sparrow JM, Hopper CD, Peters TJ. Reliability of theVCM1 Questionnaire when administered by post and by telephone.Ophthalmic Epidemiol. 2001;8:1–11.
23. Malik R, Frost NA, Sparrow JM, Hale L. The Bristol Cataract ListingSurvey:Profile of listed patients with visual acuity 6/12 or better.Eye 2005;19:406–10.
24. Kirkwood BJ, Pesudovs K, Latimer P, Coster DJ. The efficacy ofa nurse-led preoperative cataract assessment and postoperativecare clinic.Med J Aust. 2006;184:278–81.
25. Weih LM, Hassell JB, Keeffe JE. Assessment of the impactof vision impairment. Invest Opthalmol Vis Sci. 2002;43:927–35.
26. Lamoureux E, Pallant J, Pesudovs K, Hassell J, Keeffe J. The Im-pact of Vision Impairment Questionnaire: an evaluation of its mea-surement properties using Rasch analysis. Invest Opthalmol VisSci. 2006;47:4732–41.
27. Murphy CC, Greiner K, Plskova J, Frost NA, Forrester JV, DickAD. Validity of using vision-related quality of life as a treatmentend-point in intermediate and posterior uveitis. Br J Opthalmol.2007;91:154–156.
28. Murphy CC, Hughes EH, Frost NA, Dick AD. Quality of life andvisual function in patients with intermediate uveitis. Br J Opthalmol.2005;89:1161–5.
29. Rasch G. Probabilistic Models for Some Intelligence and Attain-ment Tests. Chicago: University of Chicago Press, 1960.
30. Andrich D, Lyne A, Sheridan B, Luo G. RUMM 2020. Perth: RUMMLaboratory, 2003.
31. van Alphen A, Halfens R, Hasman A, Imbos T. Likert or Rasch?Nothing is more applicable than good theory. J Adv Nurs.1994;20:196–201.
32. Tennant A, McKenna SP, Hagell P. Application of Rasch analysisin the development and application of quality of life instruments.Value Health 2004; 7 Suppl 1: S22–6.
33. Fisher W. Reliability statistics. Rasch Measure Trans. 1992;6: 238.34. Wright B, Master G. Rating Scale Analysis. Chicago: MESA Press,
1982.
232 July–August 2008 Ophthalmic Epidemiology
Downloaded By: [Lamoureux, Ecosse L.] At: 06:14 9 September 2008
35. Smith EV. Detecting and evaluation the impact of multidimension-ality using item fit statistics and principal component analysis ofresiduals. J Appl Measure. 2002;3:205–31.
36. Andrich D. Rating formulation for ordered response categories.Psychometrika 1978;43: 561–73.
37. Velozo CA, Lai JS, Mallinson T, Hauselman E. Maintaining instru-ment quality while reducing items: Application of Rasch analysisto a self-report of visual function. J Outcome Meas. 2000;4: 667–80.
38. Stelmack JA, Szlyk JP, Stelmack TR, Demers-Turco P, WilliamsRT, Moran D, Massof RW. Psychometric properties of the Veter-
ans Affairs Low-Vision Visual Functioning Questionnaire. InvestOpthalmol Vis Sci. 2004;45:3919–28.
39. Pesudovs K, Coster DJ. An instrument for assessment of sub-jective visual disability in cataract patients. Br J Opthalmol.998;82:617–24.
40. Pesudovs K, Coster DJ. Cataract surgery reduces subjective visualdisability. Aust N Z J Ophthalmol.1997; 25 Suppl 1: S3–5.
41. Lamoureux EL, Hooper CY, Lim L, Pallant JF, Hunt N, Keeffe JE,Guymer RH. impact of cataract surgery on quality of life in patientswith early age-related macular degeneration. Optom Vis Sci. 2007;84: 683–8.
Ophthalmic Epidemiology July–August 2008 233
Downloaded By: [Lamoureux, Ecosse L.] At: 06:14 9 September 2008
Related Documents