AN EVALUATION OF REAL ESTATE DEVELOPMENT FEASIBILITY SOFTWARE OPTIONS Dr Tim Havard, The Oakbrook Consultancy Michael Waters MRICS, Heriot-Watt University (Dubai Campus) PAPER SYNOPSIS Property development has long-been noted for being a risky process. As a result, participants in property development have often tried to apply mainstream financial modeling techniques to ‘accurately’ appraise their options, with a view that the KPIs that stem from these are the same. Ultimately this has led many practitioners to work on the assumptions that conventional spreadsheet models, such as those developed in Excel, are adequate. However, financial appraisals and development appraisals are somewhat different. For instance, the highly geared/sensitive nature of development means that only small market movements can turn a project not viable. During property booms, overlooked elements or erroneous spreadsheet models may have not seen a project fail as the shortfalls in a developer’s profit were nearly always eroded by the sheer presence rising rents or sales values (income). However, today’s development arena is a stark contrast. Post global financial crisis lessons - feasibilities run on over assumptions or error will no longer be sufficient. This paper explores the range of options for practitioners involved in property development feasibilities, highlighting a number of conventional spreadsheet models currently available in the market. We find that although a conventional spreadsheet can be run to mimic the property development process, often they become a redundant or erroneous application on multiple projects scenarios. A transparent, standardized appraisal framework that is flexible and has the functionality to be easily scrutinized, such as the Estate Master Professional Property Software, is where one needs to be, especially as we are moving towards a world of joint-ventures and risk-avoidance. This paper may have the solutions you need to work profitably within real estate development. KEYWORDS: financial modeling, discounted cash flow, development feasibility

Welcome message from author
This document is posted to help you gain knowledge. Please leave a comment to let me know what you think about it! Share it to your friends and learn new things together.
Transcript

AN EVALUATION OF REAL ESTATE DEVELOPMENT FEASIBILITY SOFTWARE OPTIONS
Dr Tim Havard, The Oakbrook Consultancy
Michael Waters MRICS, Heriot-Watt University (Dubai Campus)
PAPER SYNOPSIS
Property development has long-been noted for being a risky process. As a result, participants in property
development have often tried to apply mainstream financial modeling techniques to ‘accurately’
appraise their options, with a view that the KPIs that stem from these are the same. Ultimately this has
led many practitioners to work on the assumptions that conventional spreadsheet models, such as those
developed in Excel, are adequate. However, financial appraisals and development appraisals are
somewhat different. For instance, the highly geared/sensitive nature of development means that only
small market movements can turn a project not viable. During property booms, overlooked elements or
erroneous spreadsheet models may have not seen a project fail as the shortfalls in a developer’s profit
were nearly always eroded by the sheer presence rising rents or sales values (income). However, today’s
development arena is a stark contrast. Post global financial crisis lessons - feasibilities run on over
assumptions or error will no longer be sufficient. This paper explores the range of options for
practitioners involved in property development feasibilities, highlighting a number of conventional
spreadsheet models currently available in the market. We find that although a conventional spreadsheet
can be run to mimic the property development process, often they become a redundant or erroneous
application on multiple projects scenarios. A transparent, standardized appraisal framework that is
flexible and has the functionality to be easily scrutinized, such as the Estate Master Professional Property
Software, is where one needs to be, especially as we are moving towards a world of joint-ventures and
risk-avoidance. This paper may have the solutions you need to work profitably within real estate
development.
KEYWORDS: financial modeling, discounted cash flow, development feasibility
INTRODUCTION
The valuation of land with development potential has been confined to the application of two core
techniques – the developer’s budget (or residual land valuation) and the Discounted Cash Flow (DCF)
approach. Both are widely used methods of evaluating viability in property development. This analysis
is achieved, whereby in all budgets, there is a value (or income) side and a cost side and both sides
should balance. This maxim can be used to ascertain the amount of an unknown development cost
factor (e.g. the cost of the site). By subtracting the known cost items from the total value (or income)
side of the budget, the unknown cost can be derived (i.e. the figure that balances the budget). What is
left over (i.e. the balancing sum or ‘residual’) is, in this case, the maximum sum the developer could
offer to purchase the development site. “That sounds simple, nothing too complex that perhaps could
not be modelled in a conventional spreadsheet interface, such as Microsoft Excel”. On face value, such a
statement could seem correct. However, what is overlooked in many conventional spreadsheet
applications is the simplistic view of land valuation techniques. The sheer number of data assumptions
that must be formed to undertake the appraisal, as well as the high-level of interactions that take place
within the dataset means the entire process is rather subjective and perhaps more worrying, prone to
large variances. In the UK, the Lands Tribunal has demonstrated a reluctance to accept the residual
technique as a primary method of valuation within the aegis of their jurisdiction. The Tribunal claims
that residual valuations are far from being a good indicator of values as minor adjustments to the
variables used can have a major effect on the resultant valuation. What outcomes the Lands Tribunal
eludes too, is that not only that a valuer could prove anything (i.e. could arrive at the answer they
wanted), but the fact that small changes (or errors) in the calculations can have vastly different results.
The incestuous nature of the data assumptions required also means that the magnitude of error, when
errors do occur are both professionally and financially crippling. Leaving aside the strictures of the
Tribunal, the residual method, as any valuation method, can also be used in an unprofessional manner.
Even when a developer is using the method in a 'professional' manner, the figures used are estimates or
guesses. This is not the same issue as that raised above, which referred to manipulating figures to get a
desired answer. Rather, a large limitation in development feasibility relates to the uncertainty
surrounding the figures used in the appraisal. Even when a developer makes every effort to obtain the
'correct' figures, these are still 'guesses'. Consequently, arriving at the 'right' answer is problematic. It
should also be added that using a cash-flow approach does not make the values of the variables used
(e.g. a rent of £250/m2) any more 'certain' or accurate than they would be in a conventional budget

appraisal (i.e. the issues of uncertainty and risk are still present). That said, development feasibility are
prone to both inherent and mechanical error.
A worked example
Before we look at this in detail, lets first address a specific issue with development feasibility studies –
that the geared relationship between cost and value magnifies the effect of any errors made. A well-
known issue with all development appraisals is that the relationship between the residual outcome is
highly geared and very sensitive to the assumed inputs. This is a crucial element to understand, and can
be examined with some simple examples. Let us assume that an initial appraisal produces the following
broad figures:
Value on Completion £10,000,000
Development Costs (inc . interest) (£6,000,000)
Land Cost (inc. holding costs and interest) (£2,300,000)
Development Profit £1,700,000
This is a profit of 20.48% on costs.
If, between doing the appraisal and the development being completed, values fall 5%, the following
happens to the development profitability:
Value On Completion £9,500,000
Development Costs (inc . interest) (£6,000,000)
Land Cost (inc. holding costs and interest) (£2,300,000)
Development Profit £1,200,000
Although this is still a 14.45% profit on cost, it can be seen that the 5% drop in values, something which
can easily happen over the period from inception to completion of a development, has been magnified
into a 30% drop in profitability. This is worrying above but often deterioration in values is accompanied
by an increase in length of time to let or sell the scheme. This increase in time increases costs,
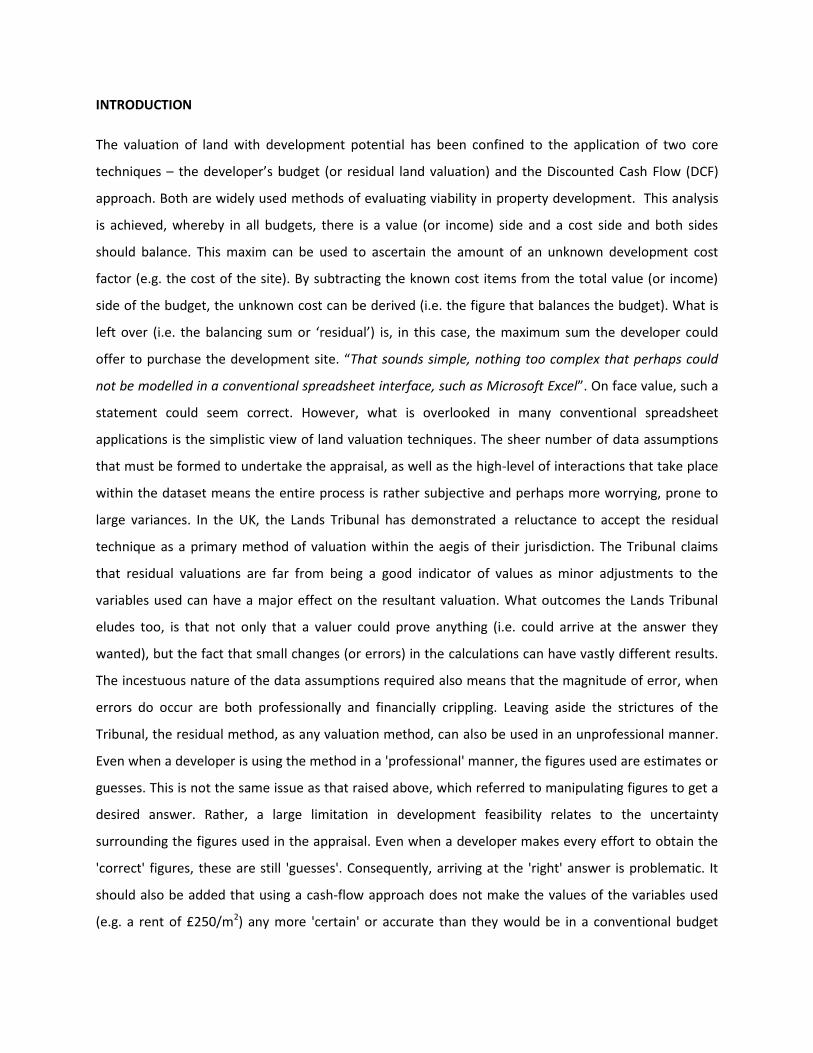
essentially due to a rise in interest charges. If we look at a 10% drop in values combined with a 10%
increase in costs produces the following effect on profitability:-
Value On Completion £9,000,000
Development Costs (inc . interest) (£6,600,000)
Land Cost (inc. holding costs and interest) (£2,530,000)
Development Profit (Loss) (£130,000)
The scheme makes a substantial loss.
The lesson of this is threefold:
Firstly, the highly geared/sensitive nature of development means that only small market
movements can turn a project not viable. This is one of the reasons why development is a high-
risk activity and also why repeated appraisals and research throughout the period running up to
the development start are essential.
The second lesson is how accurate the appraisal needs to be; the outcome above can also be
achieved with no deterioration in the market but by the appraiser/developer being slightly
optimistic about sale or leasing prices and underestimating the cost or timing elements, i.e. that
many errors are not mechanical but are errors in forecasting. It underscores the need for the
inputs to the appraisal to be as accurate and carefully considered as possible.
Finally, it underscores the need to have a reliable model or framework for constructing the
appraisals. Small errors in either cost or value can be magnified – and, unfortunately, those
errors can be critical. These are the errors that can arise as a result of using self-created
spreadsheets.
What are the options when undertaking development feasibilities?
Financial analysts or valuation teams worldwide have two distinct options for undertaking the valuation
of land with development potential, namely these are:
Undertake the appraisal using an in-house model in Microsoft Excel or similar spreadsheet
processing interface; or
Undertake the appraisal using a software programme, such as Estate Master. This software is a
good example of a professionally written and tested software suite for development feasibility,
budget management and valuation. All its inputs and preferences are documented and its
cashflow outputs show a high-level of detail for both validation and auditing.

Excel development appraisal spreadsheet types
For reasons of accuracy there has been a general pressure in the development industry to move from
the simple residual to cash flow approaches. However, there are problems with cash flow feasibility
studies which have meant that some sections of the industry have resisted their use. The first principle
complaint about the models is that they are time consuming to produce from scratch, particularly
compared with residual models. Once a template model has been developed however, this time can be
reduced. Nonetheless, there are inherent risks of error when existing models are adapted to meet the
needs of different feasibility studies. The second major complaint is the level of detail required in the
assumptions that go into the construction of the cash flow template. Again there are elements of truth
in this; the models are far more complex and transparent yet many of the assumptions required can
reasonably be made from past experience from similar projects and are not that far removed from the
sweeping, broad-brush ones made in the residual models.
The final major complaint is one that is valid; the increased complexity of the cash flow models means
that there is more risk of error creeping in. These are not so much errors of assumption but more simple
mistakes in calculation or cell reference. Spreadsheet cash flow models have to be very carefully audited
and, often, there is insufficient time to do this. This is undeniable and is why many are advocates of
using proprietary models where these types of errors can be virtually eliminated.
There is, however, more than one type of spreadsheet model used in development appraisal practice,
mainly using the ubiquitous Microsoft Excel, although there is some up use of Open Office and Libre
Office applications. Essentially, our experience has shown that the models fall into three broad types -
1. ‘Simple’ self-created calculation sheets lacking time specific dialogue references
2. More sophisticated self-created sheets with time specific dialogue references
3. Professional created complex sheets
These models usability and propensity to be vulnerable to errors varies and it is therefore important to
look at the outline characteristics of each.
The first type is typical of the majority of self-created sheets, where the user, probably self-taught on
Excel, has produced an often unique or tailored spreadsheet to conduct a particular project. This is
normally done in essentially a two-stage process. In the first stage we need to establish the calculation

assumptions – the broad timescales, the net and built areas, the likely rent and sale values, the likely
interest rates etc. These are outlined for the example appraised below (fig 1). The second stage is to put
these assumptions into a logical time framework – the spreadsheet itself, completing the necessary
calculations as appropriate (fig 4 to 6). It is often appropriate to do these two actions in two separate
worksheets in the Excel workbook (fig 2 and 3, showing Excel cell references). The results are presented
in figure 7.
Areas Gross Net
Construction
Costs
Rental
Values Yields
Rent
Free
Office 1,300 m2 1,079 m2 £ 800 £ 185 6.50% 6 Months
Retail Warehouse 1,000 m2 950 m2 £ 600 £ 230 6.25% 6 Months
Landscaping (hard&soft) 3,000 m2 3,000 m2 £ 250

Figure 1: The calculation assumptions in detail
Figure 2: Using Excel for development appraisals; Inputs on a separate worksheet from cash flow
Fees
Architect 4.00%
Quantity Surveyor 2.00%
Structural Engineer 1.00%
M&E Engineer 1.00%
Project Manager 1.00%
Site Safety 0.75%
Landscape Architect 2.00%
Planning Consultant £ 12,000.00
Planning Fee £ 15,000.00
Sale Agent 1.00%
Sale Legal 1.00%
Land Agent 1.00%
Land Legal 1.00%
Letting Agent 10.00%
Letting Legal 5.00%
Stamp Duty 4.00%
Incoming purchasers Costs 6.00%
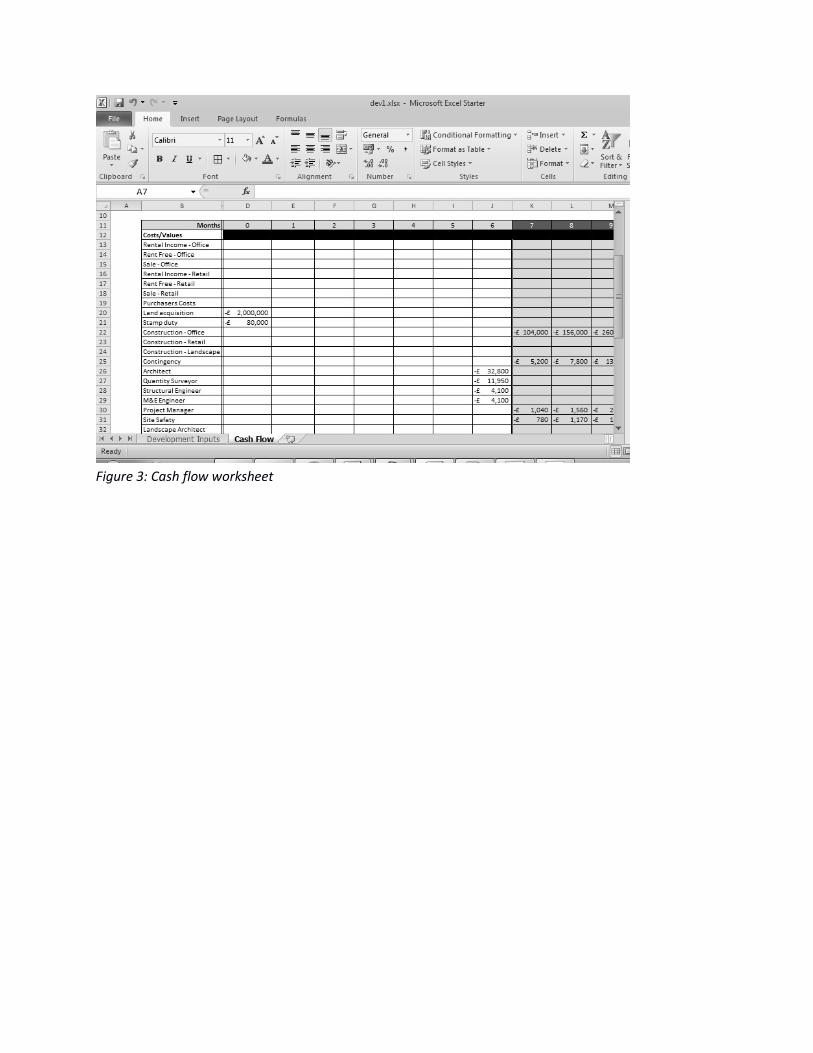
Figure 3: Cash flow worksheet

Figure 4: Pre-construction phase of cash flow

Figure 5: Construction phase of cash flow

Figure 6: Post-construction phase of project
Figure 7: Performance analysis

We believe that most people involved in the industry will have constructed similar spreadsheets. These
‘one-off’, specifically constructed models may have the sophistication of calculation by reference to
named cells but normally sees these calculations manually distributed into a static time framework (see
extract in figure 8, below) rather than using the more complex type of dynamic timing as covered in the
models below which are more time consuming to create and require more in depth auditing for errors.
Fig. 8: Extract from the type one spreadsheet model showing formulas
The second type of spreadsheet is better because of the introduction of logical statements that control
time assumptions in the appraisal. An example of this was presented by Peter Brown in a series of
articles for the Institute of Revenues Rating and Valuation (IRRV) in 2011
(http://www.irrv.net/home/item.asp?id=1319 where the models displayed below can be downloaded).

Figure 9: Extract from Peter Brown’s Development Appraisal Model
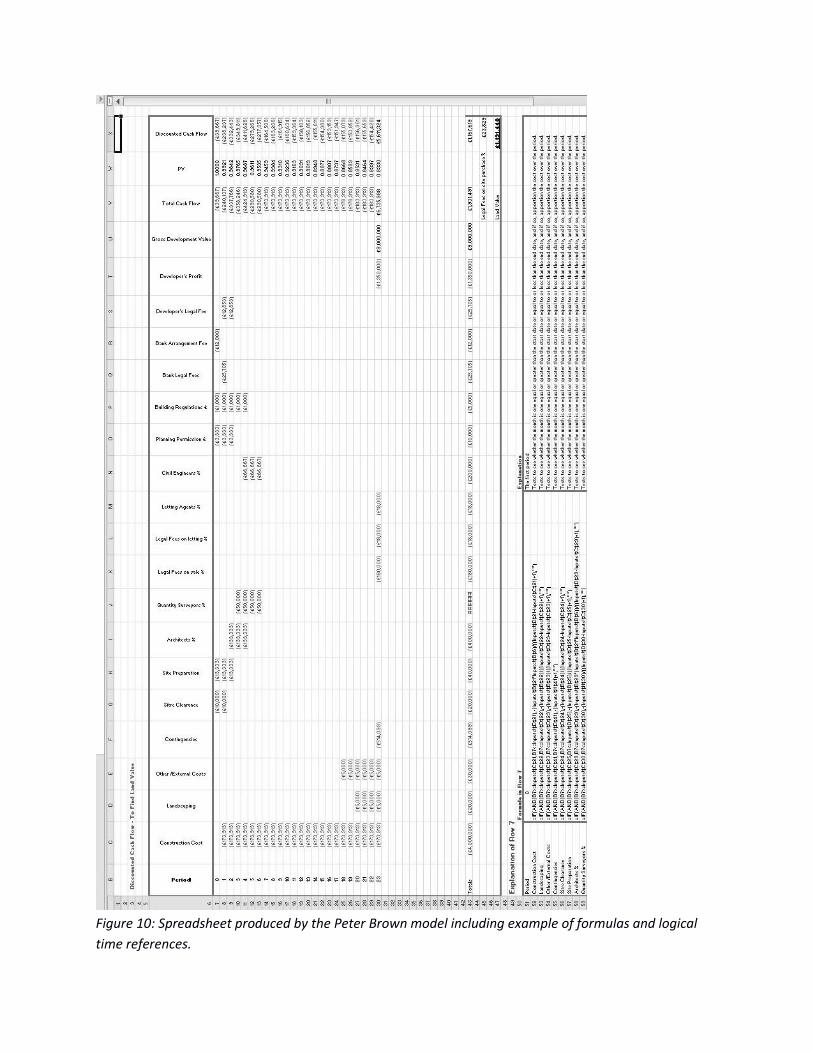
Figure 10: Spreadsheet produced by the Peter Brown model including example of formulas and logical
time references.

These type two spreadsheets have a much more sophisticated treatment of time. The development time
framework shrinks or contracts according to the entry made into cell B17 (see fig 9, above). Other, time
specific items, are entered and distributed into the cash flow using the formulas entered into the start –
end boxes. The strength of these types of spreadsheet are their ease and flexibity of use once created
and the lack of need to re-audit when timing assumptions are changed. Their weaknesses are twofold;
firstly they need more time and underlying knowledge to be created and audited for errors initially.
Secondly, they are vulnerable to later changes, their complexity can hide errors that have come about
by a hurried change of the fundamental formula, something that can frequently happen on a project to
deal with a specific change in assumptions. Although formulas can be write-protected, often the security
process can be bypassed or turned off completely.
The third type of spreadsheet is the more sophisticated, often professionally produced models. An
example is the UK Government’s Homes and Communities Agency (HCA) Development Appraisal Tool
(DAT) (Figure 10).
(downloadable from http://www.homesandcommunities.co.uk/ourwork/development-appraisal-tool).
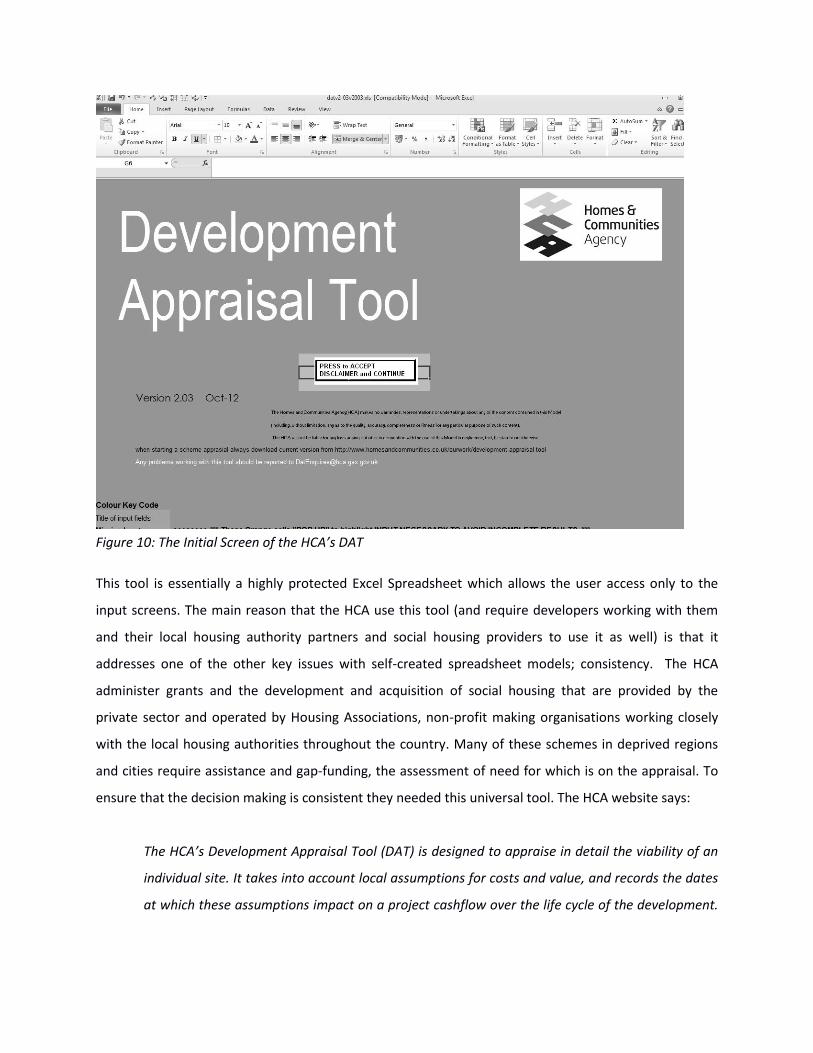
Figure 10: The Initial Screen of the HCA’s DAT
This tool is essentially a highly protected Excel Spreadsheet which allows the user access only to the
input screens. The main reason that the HCA use this tool (and require developers working with them
and their local housing authority partners and social housing providers to use it as well) is that it
addresses one of the other key issues with self-created spreadsheet models; consistency. The HCA
administer grants and the development and acquisition of social housing that are provided by the
private sector and operated by Housing Associations, non-profit making organisations working closely
with the local housing authorities throughout the country. Many of these schemes in deprived regions
and cities require assistance and gap-funding, the assessment of need for which is on the appraisal. To
ensure that the decision making is consistent they needed this universal tool. The HCA website says:
The HCA’s Development Appraisal Tool (DAT) is designed to appraise in detail the viability of an
individual site. It takes into account local assumptions for costs and value, and records the dates
at which these assumptions impact on a project cashflow over the life cycle of the development.
This will help to identify the residual land value or funding deficit. It is intended to be transparent
and easy to use by both delivery teams and client organisations.
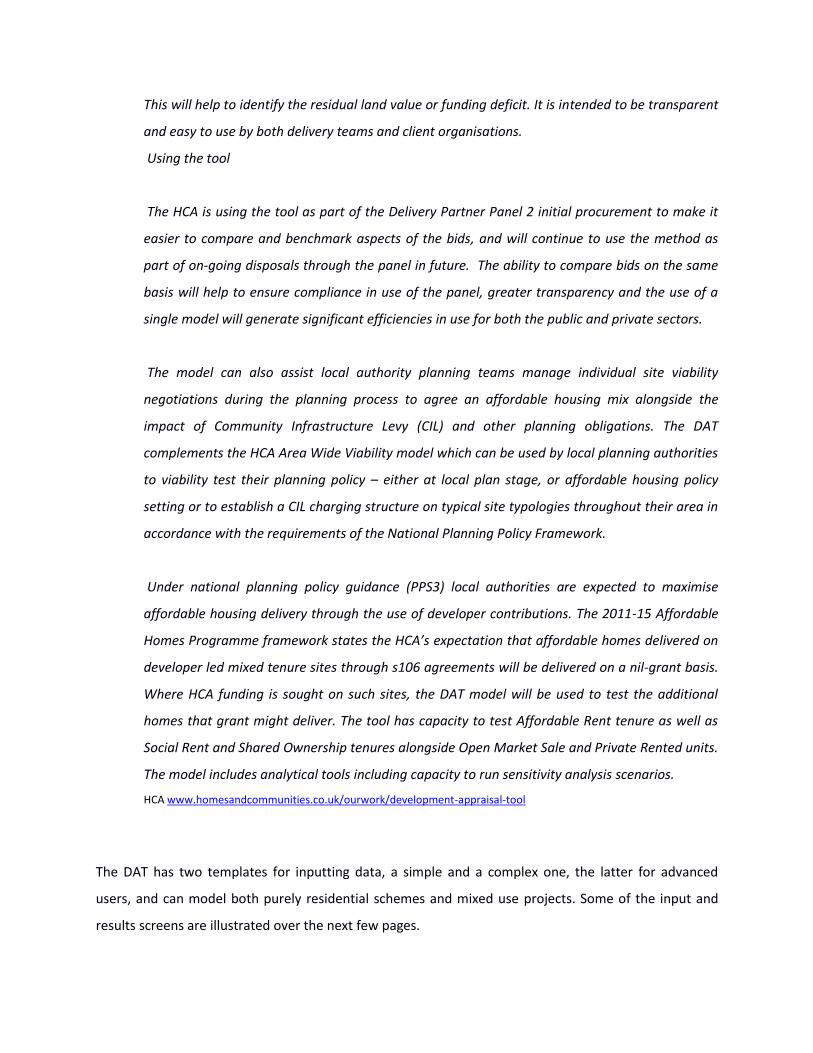
Using the tool
The HCA is using the tool as part of the Delivery Partner Panel 2 initial procurement to make it
easier to compare and benchmark aspects of the bids, and will continue to use the method as
part of on-going disposals through the panel in future. The ability to compare bids on the same
basis will help to ensure compliance in use of the panel, greater transparency and the use of a
single model will generate significant efficiencies in use for both the public and private sectors.
The model can also assist local authority planning teams manage individual site viability
negotiations during the planning process to agree an affordable housing mix alongside the
impact of Community Infrastructure Levy (CIL) and other planning obligations. The DAT
complements the HCA Area Wide Viability model which can be used by local planning authorities
to viability test their planning policy – either at local plan stage, or affordable housing policy
setting or to establish a CIL charging structure on typical site typologies throughout their area in
accordance with the requirements of the National Planning Policy Framework.
Under national planning policy guidance (PPS3) local authorities are expected to maximise
affordable housing delivery through the use of developer contributions. The 2011-15 Affordable
Homes Programme framework states the HCA’s expectation that affordable homes delivered on
developer led mixed tenure sites through s106 agreements will be delivered on a nil-grant basis.
Where HCA funding is sought on such sites, the DAT model will be used to test the additional
homes that grant might deliver. The tool has capacity to test Affordable Rent tenure as well as
Social Rent and Shared Ownership tenures alongside Open Market Sale and Private Rented units.
The model includes analytical tools including capacity to run sensitivity analysis scenarios.
HCA www.homesandcommunities.co.uk/ourwork/development-appraisal-tool
The DAT has two templates for inputting data, a simple and a complex one, the latter for advanced
users, and can model both purely residential schemes and mixed use projects. Some of the input and
results screens are illustrated over the next few pages.

Figure 11: HCA DAT Site details screen
Figure 12: Residential Property Input Screen

Figure 13: HCA DAT Time Framework Entry
Figure 14: HCA DAT Cost Data Entry

Figure 15: HCA DAT Non-Residential Property Data Entry screen
The model then produces a summary output and a series of cash flow outputs which are not editable –
i.e. they are outputs only.
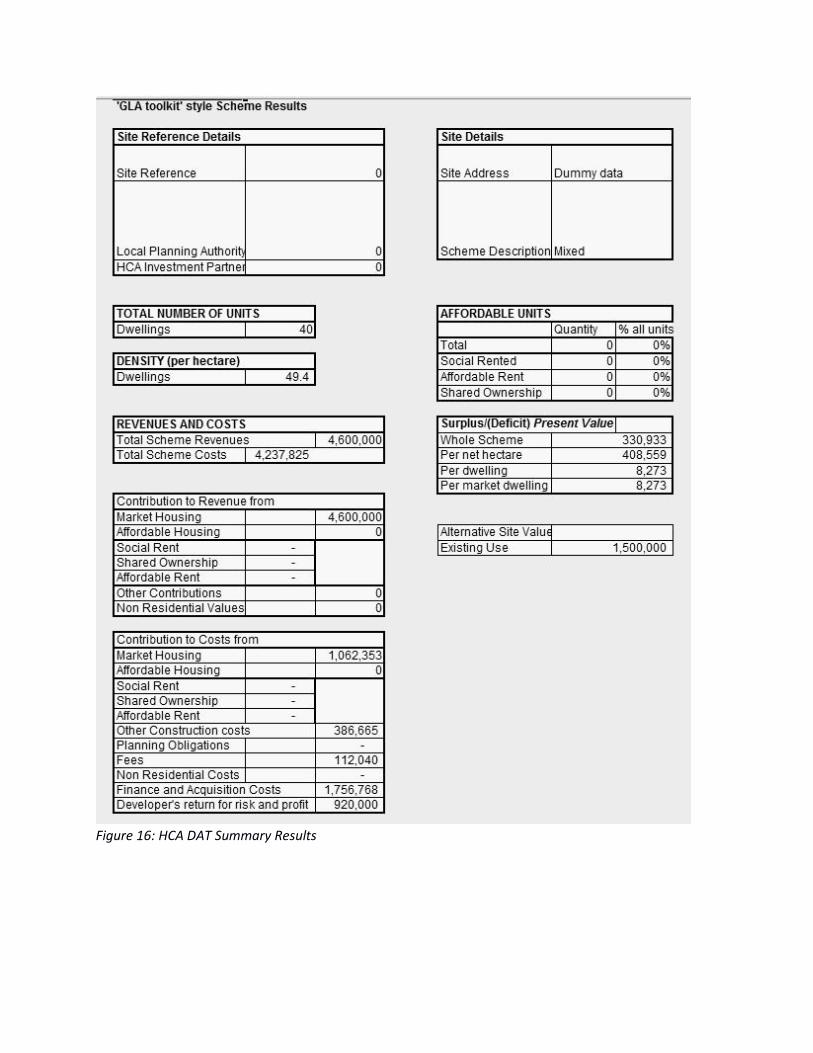
Figure 16: HCA DAT Summary Results

Figure 17: HCA DAT Cash Flow output extract
Although this Excel spreadsheet model has a specific purpose, it has characteristics that are typical of
many such ‘professional’ type Excel models. It does give the HCA the consistency it desires and,
presuming that it has been constructed correctly and fully audited, will be reliable. That however, is one
of its drawbacks; the model is opaque, the user cannot easily interrogate the model to see how the
calculations are actually being done. The whole structure of the programme with its multiple screens for
input and outputs is ungainly and relatively complex, although the model does prevent serious errors
being saved. The model has attempted to be comprehensive but it is still inflexible, it does not allow the
user to model specific features or complexities of their projects, perhaps forcing the user to make
unrealistic assumptions that are not applicable to their circumstances.

Vulnerability of Spreadsheet Types to Typical Sources of Error
Although the previous section was intended as a review of the broad categories of spreadsheets used in
development feasibility studies, we have already started to identify areas where these models are sub-
optimal in terms of vulnerability to mechanical or construction errors (as opposed to forecasting errors
which is inherent in all appraisal models). A starting point is to identify the most like types and sources
of mechanical or construction errors in spreadsheets. It is difficult to be definitive about this and cite
real world examples as few developers are willing to advertise or admit to their mistakes however these
sources of errors have been observed in practice and have been experienced personally by the authors:
(i) Errors due to time pressure– Many workplaces are high-pressure environments with
appraisers having to do often complex work within a short timescale
(ii) Failure to properly audit the spreadsheet -Auditing can eliminate errors from spreadsheet
but every creation of a spreadsheet item or change to a spreadsheet model requires an
audit trail to be followed which costs the developer time – standardised models such as
Estate Master DF do not need the same audit therefore save the developer considerable
time in checking the mechanics of the calculations
(iii) Incorrect modification of an existing spreadsheet model (and a presumed failure to audit) –
This is a common set of circumstances. Development projects are not static, there are
always many changes from the initial appraisal, where many assumptions have to be made,
to the final appraisal immediately prior to work on site.
(iv) Application of an existing model to new development projects – it is a natural thing when
considerable time effort has been invested in the creation of a spreadsheet model to spread
the cost (and save time) by applying and adapting the model for different projects. This
opens up the possibility of modification errors as in (iii) above but also in the perpetuation
of errors from earlier projects because the assumption will have been made that the applied
model will have been audited and is error free on the earlier projects
The type one, simple, project specific, manually linked models are particularly vulnerable to all of these
sources of errors. This is particularly serious as these are the models probably the most commonly used
in development appraisal practice. The models will probably have been audited for errors in their initial
use but, as noted, modification over the project life is inevitable. Also, almost inevitably, once a model
has been created, used and become familiar to a project team, it will almost certainly be applied to

other projects. These spreadsheets are often used by smaller developers who will not have the luxury of
extensive staffing, so it is likely that it is these organisations that will be under the greatest time
pressure and will have little available to properly audit and re-audit for errors when changes are made.
They are particularly vulnerable to errors.
The type two models are more sophisticated and are usually designed to be applied across a range of
projects rather than be constructed for one in particular. They should, therefore be more reliable. They
are not immune from error however and their relative sophistication can lull the user into a false sense
of security into believing that they are fool-proof. In fact, their relative complexity is also an area of
vulnerability; changes made are more difficult to do properly and the downstream effects of the
alterations are often more difficult to appreciate. Development projects are so varied – different
phasing, special cost distributions etc. – that it is very difficult, if not impossible,to design a spreadsheet
template that will meet all variations. Ideally any changes should be made by the original model creator
and properly audited however the practicalities of working on development projects means that this
cannot be assured.
The type three models should be more reliable because they have been professionally produced and
tested and designed for a range of projects however this does not make them issue free. For one thing is
they are complex and opaque. A user may make a data entry error but not realise that they have erred.
Another issue arises out of the fact that these models have a special purpose in their design. This tends
to mean that they are limited in modelling other factors, elements that are probably very important to
the developer. The HCA model is a case in point; although it does impose consistency across appraisals
on developers there are elements – the modelling of the non-residential elements in particular is a gross
oversimplification and inadequate, yet the developer is forced to use it (and this itself is a potential
source of error). Fundamentally too, for all the protection placed on the input screens, the model is still
based on Excel. People with sufficient knowledge of Excel can turn this protection off and modify the
underlying formulas – and this applies to most if not all of these sophisticated Excel models. Although
this can produce the required tailoring to suit the requirements of a specific project, the complex
opacity of these models makes them equally vulnerable to errors.
A final point in this argument is to consider the increasing investment in time and money in these
models. The advantages of the simple, project specific models is that they are relatively cheap and
flexible, if very vulnerable to errors. This situation can be improved by investing in a professionally
produced system but this still produce a sub-optimal result yet the cost of producing them almost
certainly outstrips the cost of purchasing licences of tried and tested, consistent and reliable, yet flexible
proprietary systems such as Estate Master DF.
CONCLUSIONS & RECOMMENDATIONS
The emergence of the electronic spreadsheet came about as the demand for financiers to examine and
analyse large corporate deals. These applications were soon rolled over to real estate appraisals and
valuation work. However according to many authors including Diemer (2002) the emergence is not one
that has come about without erroneous application. According to his paper, “a primary cause of
spreadsheet risk is user error”. In support of such a sweeping statement, studies have shown that
somewhere in the region of 30-90% of all spreadsheets suffer from “at least one major user error” and
another similar study undertaken by a large global accountancy firm found that 91% of all spreadsheets
audited contained errors. Further analysis showed that more significant levels of error emerged when
users were working within the opaque realms of a spreadsheet created by another person. Of course
not all spreadsheet errors are on the danger critical scale. Given that business and investment decisions
are being made based on the outputs of an electronic spreadsheet, add to that the magnitude of the
monetary sums being invested, even the presence of fractional errors – could potentially be disastrous
for an acquisition or disposal case.
One of the core reasons behind the presence of errors in conventional spreadsheets has been the lack of
monitoring and ability to track the changes made between users. The lack of transparency between
users and their ability to make changes, intentional or non-intentional, makes mistakes more difficult to
track. The spreadsheet approach when compared to Estate Master lacks any real consolidation of
information that can be easily followed by multiple users, whether they be internal or external to the
organisation. The significance of spreadsheet applications in property valuation tasks clearly cannot be
completely pushed aside, as there is functionality for real estate professionals. However, their
limitations in terms of longevity and cross-departmental or organizational attributes do appear to suffer.
Advances being made in the programming of appropriate software databases, such as Estate Master,
are building on the benefits of spreadsheet interfacing, however they also remedy the limitations or
perceived drawbacks of electronic spreadsheets discussed above. For instance, cash flow forecasting for
the income returns needs to be explicit in the assumptions and may need detail on sales revenue
profiles or even a need to include a tenancy schedule separately with explicit assumptions for vacancies,
rent reviews, lease expiries and so forth. This is often overlooked in conventional spreadsheet

applications. There is, therefore, a requirement for a high level of consistency, accuracy and
transparency in the forecasting used for development feasibilities. The valuation undertaken needs to
demonstrate consistency between variables and methods applied as well as a need to be
mathematically accurate. The process of including rationale assumptions also needs to be transparent
such that each component of the valuation is capable of explicit explanation or scrutiny. These
requirements are challenging tasks to achieve in the opaque world of a conventional spreadsheet.
In summary, much of the decision-making as to which option should be adopted comes under the
following criteria;
purpose of the appraisal work (in-house v client instruction (external);
professional ethics;
attitudes towards satisfying due diligence and professional indemnity;
budget;
staff retention and turnover; and
valuation skills (and expertise of the team)).
Some organisations with a limited budget, or lack of appreciation to the complexity involved in
development valuation work may, and indeed do, settle for an in-house manual spreadsheet to serve
these functions. Calculations and cell linkages are derived from an MBA-educated list of assumptions
and typically built with a current development project in mind. It is “fit for purpose”, however its
applications are written within a narrowly-defined brief of, let’s stay, a high-rise residential
development. These same functionalities cannot be transferred over to the newly-instructed shopping
mall development. Equally realistic would be the outcome that the employee, who has spent many a
month writing the functions in the spreadsheet, is soon offered a higher-paid position with the firm’s
competitor. Whether they take the model with them or not, it would be a laborious, if not an impossible
task, to dissect the algorithms and formulae expressed in the model – it just isn’t a transparent way of
doing business!! Banks, joint-venture partners and government authorities also favour cash-flow
appraisals undertaken on a standardised platform, such as Estate Master, largely due to the fact that the
functions within the software are ‘fixed’ and less prone to errors or manipulations.

References
Brown, P M (2011) ‘Appraisal Spreadsheets’, Institute of Revenues Rating and Valuation. Accessed
March 2011 www.irrv.net
Diemer, D (2002) ‘Database management systems help solve spreadsheet shortcomings’, JPEM.
Accessed January 2012. www.ipem.org
Homes and Communities Agency (2013) www.homesandcommunities.co.uk
Millington, A F (2000) Property Development. London: Estates Gazette,
RICS (2008) ‘Valuation Information Paper 12: Valuation of development land’, The Royal
Institution of Chartered Surveyors, March 2008. Accessed January 2012. www.rics.org
Schallow D and Schallow C (2012) ‘Controlling Type I and Type II errors for Investors’, Journal of
Financial Services Professionals.
Wilkinson, S (2008) Property Development. London: Spon (4lh ed.)
Related Documents