2021 © Underwriters Laboratories Inc. Report 200 | 1 WILDFIRE SAFETY RESEARCH An Evaluation of DIY Air Filtration Aika Davis, PhD, Underwriters Laboratories Inc. Marilyn Black, PhD, Underwriters Laboratories Inc. JULY 2021

Welcome message from author
This document is posted to help you gain knowledge. Please leave a comment to let me know what you think about it! Share it to your friends and learn new things together.
Transcript
2021© Underwriters Laboratories Inc. Report 200 | 1
WILDFIRE SAFETY RESEARCH
An Evaluation of DIY Air Fi ltrationAika Davis, PhD, Underwriters Laboratories Inc.Marilyn Black, PhD, Underwriters Laboratories Inc.
JULY 2021
2021© Underwriters Laboratories Inc. Report 200 | 2
1. EXECUTIVE SUMMARY 41.1 Background 4
1.2 Research Objectives 4
1.3 Highlights of Findings 4
1.4 Key Observations 4
2. MATERIALS AND METHODS 62.1 Box Fan Descriptions 6
2.2 Filter Preparations 6
2.3 Filter Test Protocols 7
2.4 Blocked Test Protocols 8
3. RESULTS AND DISCUSSION 93.1 Temperature Time Series 9
3.2 Filter and Blocked Conditions 11
3.3 Safety Implications 14
4. ACKNOWLEDGEMENTS 16
5. REFERENCES 16
Table of Contents
2021© Underwriters Laboratories Inc. Report 200 | 3
FIGURE 1: THE FIVE STUDIED BOX FANS. 6
FIGURE 2: PICTURES OF TESTED BOX FANS WITH FILTERS AND THERMOCOUPLES ATTACHED. 7
FIGURE 3: PICTURES OF THE TESTED BOX FANS WITH THERMOCOUPLES ATTACHED, ONE SIDE BLOCKED (LEFT) AND BOTH SIDES BLOCKED WHEN LYING FACE DOWN (RIGHT). 8
FIGURE 4: TIME SERIES PLOTS FOR TEMPERATURES OF INTERNAL FAN COMPONENTS FOR ALL 5 TESTED FAN MODELS (INCLUDING THE REPLICATE TEST FOR FAN 1). EACH GRAPH SHOWS FOUR CONSECUTIVE 20-MIN TESTS IN ORDER OF NO FILTER (SHADED BLUE), CLEAN FILTER (GREEN), SMOKE FILTER (YELLOW), AND DUST FILTER (ORANGE). 9
FIGURE 5: TIME SERIES PLOTS FOR TEMPERATURES OF EXTERNAL FAN PARTS FOR ALL 5 TESTED FAN MODELS (INCLUDING THE REPLICATE TEST FOR FAN 1). EACH GRAPH SHOWS FOUR CONSECUTIVE 20-MIN TESTS IN ORDER OF NO FILTER (SHADED BLUE), CLEAN FILTER (GREEN), SMOKE FILTER (YELLOW), AND DUST FILTER (ORANGE). NOTE THE TEMPERATURE RANGE ON Y AXIS IS DIFFERENT FOR EACH FAN. 10
FIGURE 6: BOX FAN PART TEMPERATURES OVER 7 HOURS OF OPERATION WITH BOTH SIDES OF FANS BLOCKED. 11
FIGURE 7: AVERAGE TEMPERATURE DIFFERENCE FROM AMBIENT AT 1) MOTOR CASING, 2) WINDING, 3) POWER CABLE AT MOTOR, 4) GUARD, 5) OUTPUT AIR, AND 6) SWITCH FOR ALL FAN/FILTER SCENARIOS. FAN 1 DATA IS THE AVERAGE OF FAN 1-1 AND FAN 1-2 OF THE FILTER TESTS. 12
FIGURE 8: VOLTAGE, CURRENT, AND CALCULATED RESISTANCE LISTED FOR NO FILTER, CLEAN FILTER, SMOKE LADEN FILTER, DUST LADEN FILTER CONDITIONS FOR THE FIVE FANS. FAN 1 DATA IS THE AVERAGE OF FAN 1-1 AND FAN 1-2. 13
Table of Figures
TABLE 1: TEMPERATURE THRESHOLDS FOR FIRE POTENTIAL AND HUMAN INJURY BY FAN PARTS AND MAXIMUM OBSERVED TEMPERATURE FROM THIS STUDY. 15
Table of Tables
2021© Underwriters Laboratories Inc. Report 200 | 4
1. EXECUTIVE SUMMARY
1.1 Background
Household use of portable air cleaners has increased in the face of recent wildland fire activity and in response to COVID-19. Some local agencies have begun recommending Do-It-Yourself (DIY) air cleaners (i.e., furnace air filter attached to electric box fans) during smoke events as DIYs offer an affordable and accessible alternative to commercially available air cleaners, which frequently sell out during smoke events. However, there are concerns regarding the safety of DIY air cleaners as these consumer fans are not being used as intended by the manufacturers and have not been evaluated by safety certification processes.
1.2 Research Objectives
Chemical Insights (CI) of Underwriters Laboratories with support of the Office of Research and Development at U.S. EPA conducted a study assessing the potential fire risks of operating DIY air cleaners. Specifically, this study evaluated the risks of fan overheating and potential fire ignition resulting from different fan/filter test scenarios.
Five different electric box fan models (approximately 20” × 20” in size) were tested with a filter attached to the back side of each fan. A single layer of duct tape was used to attach the filter to the fan by applying to all four sides. While many DIY fan/filter configurations exist, this single filter construction was selected to put the largest stress on the box fan since a single filter results in a larger pressure drop than multi-filter configurations. Additionally, this is expected to be the most widely used DIY configuration due to its simplicity.
Four filter scenarios were evaluated as described below, resulting in 20 combined fan and filter tests:
• No filter attached as the control fan,• New unused 20” × 20” filter with a MERV (minimum efficiency reporting value) 13 rating,• Smoke laden MERV 13 filter prepared with smoke from biomass burning to represent a loaded filter due to a wildfire, and• Dust laden MERV 13 filter prepared with standardized dust composition to represent a worst-case scenario loading from typical
blockage generated by extended household use.
In addition to the four filter scenarios, laboratory evaluations were made to determine the effects of extreme fan/filter air flow obstruction. For these blocked tests, two scenarios were evaluated:
• One-sided obstruction (i.e., complete obstruction on the back side).• Two-sided obstruction (i.e., complete obstruction on the back side and the fan tipped onto its front face, resulting in blockage on both
sides).
For all test scenarios, fans were operated for at least 20 minutes while continuously monitoring temperatures on the box fans’ exterior surfaces (including the plastic fan guard and switches) as well as internal fan components (including the power cord connection at the motor, the motor housing, and motor windings); temperature of output airflow coming out the fan was also monitored. Tests were conducted for at least 7 hours for the extreme conditions where both sides of the fan were blocked.
1.3 Highlights of Findings
Across all fan/filter test scenarios, the most notable temperature increases were observed at the motor and motor windings. However, all measured temperatures fell below the maximum acceptable thresholds defined by the market safety standard for electric fans (UL 507). Exterior surfaces that can come into direct contact with people remained below 36 °C, which is below the first-degree burn potential of 47.5 °C. Further, an extreme scenario where both the front and back of the fan were blocked for an extended period of 7 hours did not pose any observable fire hazards. And after an initial rise, temperature remained steady throughout the test.
1.4 Key Observations
• Fire ignition was not achieved with any of the filter/fan test scenarios.• Some variability was noted across fan brands for maximum temperatures in the various scenarios, but maximum measured
temperatures were all below the maximum allowable criteria for fire concern as defined by industry standards.• The different brands of fans showed similar temperature patterns across the filter scenarios.• Attaching a filter resulted in an increase in motor, winding, and power cord temperatures in the operating fan regardless of filter
type (i.e., clean, smoke-loaded, and dust-loaded filters).• Temperatures at the guard, switch, and output air were near or lower than ambient room air temperature for all test scenarios
except for the two-sided obstruction tests where temperatures increased at all three locations. Even with the temperature increase, the parts remained below temperature thresholds that may pose a burn hazard.
• The highest temperature was observed at/near the winding on fans with a dust laden filter, where the peak increase in temperature (relative to ambient) measured 57 °C.
• For the extreme conditions where both sides of the fan were blocked, measured temperatures increased over the course of the first
2021© Underwriters Laboratories Inc. Report 200 | 5
20 minutes and then temperatures remained steady for an extended 7-hour run period.• Air flow reductions were observed when filters were placed on the fans with a maximum of 29% flow reduction for the addition of
clean filters, 31% reduction for smoke/soot laden filters, and 70% reduction for dust laden filters.• Filter conditions did not influence current, resistance, nor power applied to the fan.
2021© Underwriters Laboratories Inc. Report 200 | 6
2. MATERIALS AND METHODS
2.1 Box Fan Descriptions
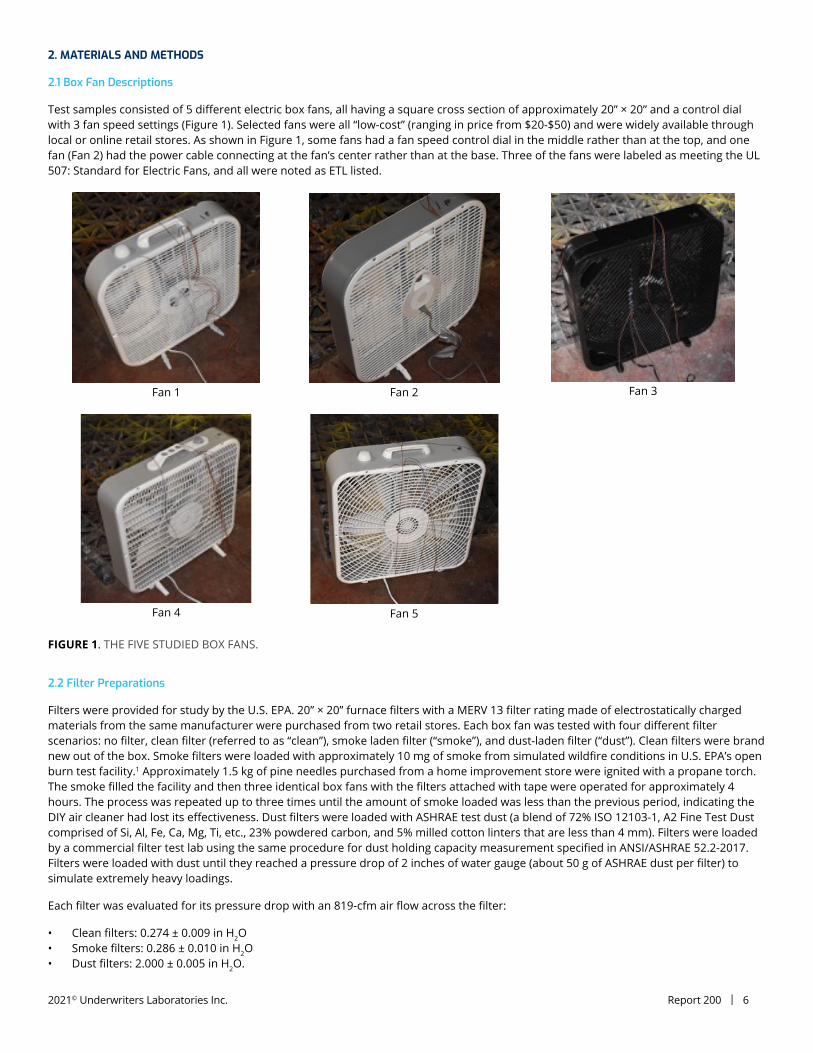
Test samples consisted of 5 different electric box fans, all having a square cross section of approximately 20” × 20” and a control dial with 3 fan speed settings (Figure 1). Selected fans were all “low-cost” (ranging in price from $20-$50) and were widely available through local or online retail stores. As shown in Figure 1, some fans had a fan speed control dial in the middle rather than at the top, and one fan (Fan 2) had the power cable connecting at the fan’s center rather than at the base. Three of the fans were labeled as meeting the UL 507: Standard for Electric Fans, and all were noted as ETL listed.
Fan 1 Fan 2 Fan 3
Fan 4 Fan 5
FIGURE 1. THE FIVE STUDIED BOX FANS.
2.2 Filter Preparations
Filters were provided for study by the U.S. EPA. 20” × 20” furnace filters with a MERV 13 filter rating made of electrostatically charged materials from the same manufacturer were purchased from two retail stores. Each box fan was tested with four different filter scenarios: no filter, clean filter (referred to as “clean”), smoke laden filter (“smoke”), and dust-laden filter (“dust”). Clean filters were brand new out of the box. Smoke filters were loaded with approximately 10 mg of smoke from simulated wildfire conditions in U.S. EPA’s open burn test facility.1 Approximately 1.5 kg of pine needles purchased from a home improvement store were ignited with a propane torch. The smoke filled the facility and then three identical box fans with the filters attached with tape were operated for approximately 4 hours. The process was repeated up to three times until the amount of smoke loaded was less than the previous period, indicating the DIY air cleaner had lost its effectiveness. Dust filters were loaded with ASHRAE test dust (a blend of 72% ISO 12103-1, A2 Fine Test Dust comprised of Si, Al, Fe, Ca, Mg, Ti, etc., 23% powdered carbon, and 5% milled cotton linters that are less than 4 mm). Filters were loaded by a commercial filter test lab using the same procedure for dust holding capacity measurement specified in ANSI/ASHRAE 52.2-2017. Filters were loaded with dust until they reached a pressure drop of 2 inches of water gauge (about 50 g of ASHRAE dust per filter) to simulate extremely heavy loadings.
Each filter was evaluated for its pressure drop with an 819-cfm air flow across the filter:
• Clean filters: 0.274 ± 0.009 in H2O• Smoke filters: 0.286 ± 0.010 in H2O• Dust filters: 2.000 ± 0.005 in H2O.
2021© Underwriters Laboratories Inc. Report 200 | 7
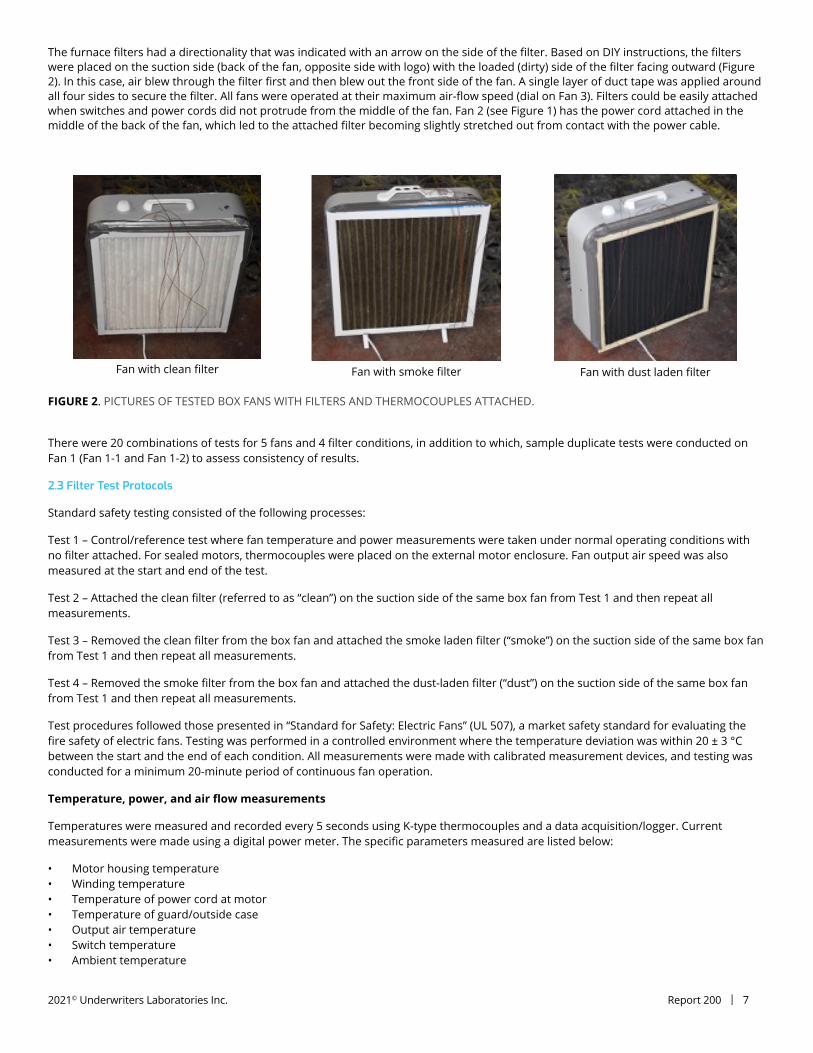
The furnace filters had a directionality that was indicated with an arrow on the side of the filter. Based on DIY instructions, the filters were placed on the suction side (back of the fan, opposite side with logo) with the loaded (dirty) side of the filter facing outward (Figure 2). In this case, air blew through the filter first and then blew out the front side of the fan. A single layer of duct tape was applied around all four sides to secure the filter. All fans were operated at their maximum air-flow speed (dial on Fan 3). Filters could be easily attached when switches and power cords did not protrude from the middle of the fan. Fan 2 (see Figure 1) has the power cord attached in the middle of the back of the fan, which led to the attached filter becoming slightly stretched out from contact with the power cable.
Fan with clean filter Fan with smoke filter Fan with dust laden filter
There were 20 combinations of tests for 5 fans and 4 filter conditions, in addition to which, sample duplicate tests were conducted on Fan 1 (Fan 1-1 and Fan 1-2) to assess consistency of results.
2.3 Filter Test Protocols
Standard safety testing consisted of the following processes:
Test 1 – Control/reference test where fan temperature and power measurements were taken under normal operating conditions with no filter attached. For sealed motors, thermocouples were placed on the external motor enclosure. Fan output air speed was also measured at the start and end of the test.
Test 2 – Attached the clean filter (referred to as “clean”) on the suction side of the same box fan from Test 1 and then repeat all measurements.
Test 3 – Removed the clean filter from the box fan and attached the smoke laden filter (“smoke”) on the suction side of the same box fan from Test 1 and then repeat all measurements.
Test 4 – Removed the smoke filter from the box fan and attached the dust-laden filter (“dust”) on the suction side of the same box fan from Test 1 and then repeat all measurements.
Test procedures followed those presented in “Standard for Safety: Electric Fans” (UL 507), a market safety standard for evaluating the fire safety of electric fans. Testing was performed in a controlled environment where the temperature deviation was within 20 ± 3 °C between the start and the end of each condition. All measurements were made with calibrated measurement devices, and testing was conducted for a minimum 20-minute period of continuous fan operation.
Temperature, power, and air flow measurements
Temperatures were measured and recorded every 5 seconds using K-type thermocouples and a data acquisition/logger. Current measurements were made using a digital power meter. The specific parameters measured are listed below:
• Motor housing temperature • Winding temperature • Temperature of power cord at motor • Temperature of guard/outside case • Output air temperature • Switch temperature• Ambient temperature
FIGURE 2. PICTURES OF TESTED BOX FANS WITH FILTERS AND THERMOCOUPLES ATTACHED.
2021© Underwriters Laboratories Inc. Report 200 | 8
• Voltage • Amperage• Wattage
For unsealed motors, the thermocouple was placed on the motor stator winding.
Output air flow velocities were measured at 6 points across the fan surface using an anemometer at before and after each 20-minute test.
2.4 Blocked Test Protocols
Two additional tests were conducted to simulate more extreme obstruction scenarios where fans become fully blocked on one or both sides:
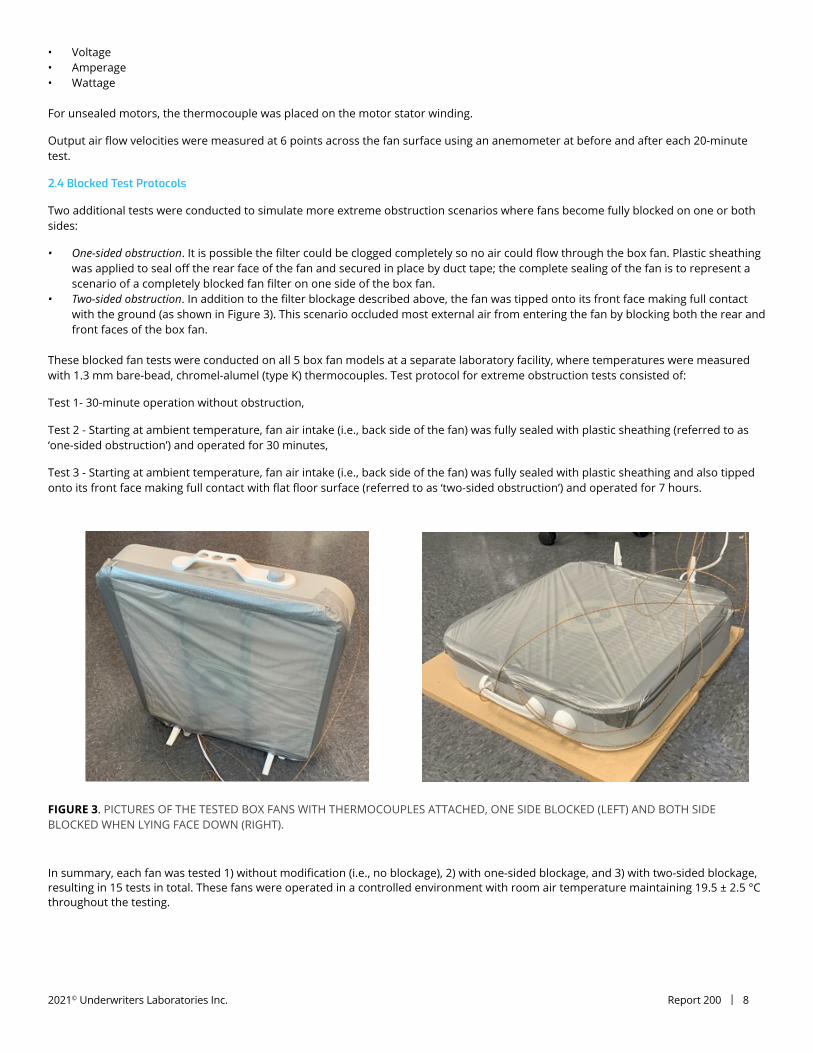
• One-sided obstruction. It is possible the filter could be clogged completely so no air could flow through the box fan. Plastic sheathing was applied to seal off the rear face of the fan and secured in place by duct tape; the complete sealing of the fan is to represent a scenario of a completely blocked fan filter on one side of the box fan.
• Two-sided obstruction. In addition to the filter blockage described above, the fan was tipped onto its front face making full contact with the ground (as shown in Figure 3). This scenario occluded most external air from entering the fan by blocking both the rear and front faces of the box fan.
These blocked fan tests were conducted on all 5 box fan models at a separate laboratory facility, where temperatures were measured with 1.3 mm bare-bead, chromel-alumel (type K) thermocouples. Test protocol for extreme obstruction tests consisted of:
Test 1- 30-minute operation without obstruction,
Test 2 - Starting at ambient temperature, fan air intake (i.e., back side of the fan) was fully sealed with plastic sheathing (referred to as ‘one-sided obstruction’) and operated for 30 minutes,
Test 3 - Starting at ambient temperature, fan air intake (i.e., back side of the fan) was fully sealed with plastic sheathing and also tipped onto its front face making full contact with flat floor surface (referred to as ‘two-sided obstruction’) and operated for 7 hours.
FIGURE 3. PICTURES OF THE TESTED BOX FANS WITH THERMOCOUPLES ATTACHED, ONE SIDE BLOCKED (LEFT) AND BOTH SIDE BLOCKED WHEN LYING FACE DOWN (RIGHT).
In summary, each fan was tested 1) without modification (i.e., no blockage), 2) with one-sided blockage, and 3) with two-sided blockage, resulting in 15 tests in total. These fans were operated in a controlled environment with room air temperature maintaining 19.5 ± 2.5 °C throughout the testing.
2021© Underwriters Laboratories Inc. Report 200 | 9
3. RESULTS AND DISCUSSION
3.1 Temperature Time Series
Filter Test
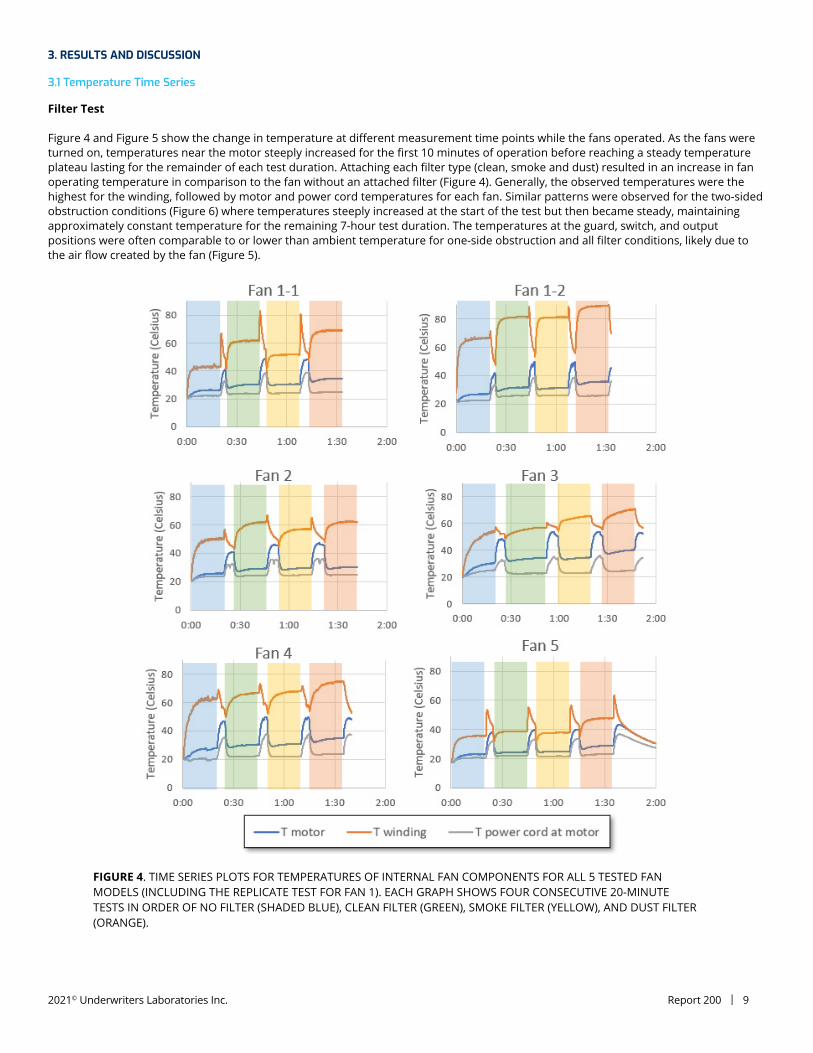
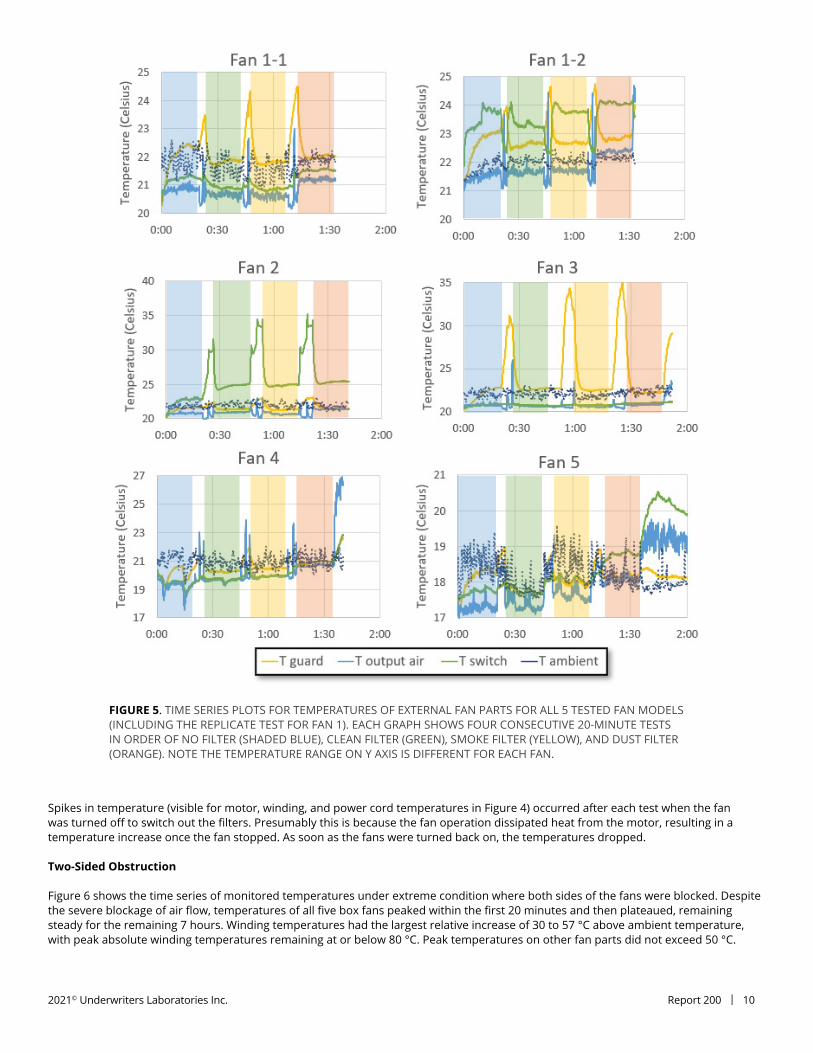
Figure 4 and Figure 5 show the change in temperature at different measurement time points while the fans operated. As the fans were turned on, temperatures near the motor steeply increased for the first 10 minutes of operation before reaching a steady temperature plateau lasting for the remainder of each test duration. Attaching each filter type (clean, smoke and dust) resulted in an increase in fan operating temperature in comparison to the fan without an attached filter (Figure 4). Generally, the observed temperatures were the highest for the winding, followed by motor and power cord temperatures for each fan. Similar patterns were observed for the two-sided obstruction conditions (Figure 6) where temperatures steeply increased at the start of the test but then became steady, maintaining approximately constant temperature for the remaining 7-hour test duration. The temperatures at the guard, switch, and output positions were often comparable to or lower than ambient temperature for one-side obstruction and all filter conditions, likely due to the air flow created by the fan (Figure 5).
FIGURE 4. TIME SERIES PLOTS FOR TEMPERATURES OF INTERNAL FAN COMPONENTS FOR ALL 5 TESTED FAN MODELS (INCLUDING THE REPLICATE TEST FOR FAN 1). EACH GRAPH SHOWS FOUR CONSECUTIVE 20-MINUTE TESTS IN ORDER OF NO FILTER (SHADED BLUE), CLEAN FILTER (GREEN), SMOKE FILTER (YELLOW), AND DUST FILTER (ORANGE).
2021© Underwriters Laboratories Inc. Report 200 | 10
FIGURE 5. TIME SERIES PLOTS FOR TEMPERATURES OF EXTERNAL FAN PARTS FOR ALL 5 TESTED FAN MODELS (INCLUDING THE REPLICATE TEST FOR FAN 1). EACH GRAPH SHOWS FOUR CONSECUTIVE 20-MINUTE TESTS IN ORDER OF NO FILTER (SHADED BLUE), CLEAN FILTER (GREEN), SMOKE FILTER (YELLOW), AND DUST FILTER (ORANGE). NOTE THE TEMPERATURE RANGE ON Y AXIS IS DIFFERENT FOR EACH FAN.
Spikes in temperature (visible for motor, winding, and power cord temperatures in Figure 4) occurred after each test when the fan was turned off to switch out the filters. Presumably this is because the fan operation dissipated heat from the motor, resulting in a temperature increase once the fan stopped. As soon as the fans were turned back on, the temperatures dropped.
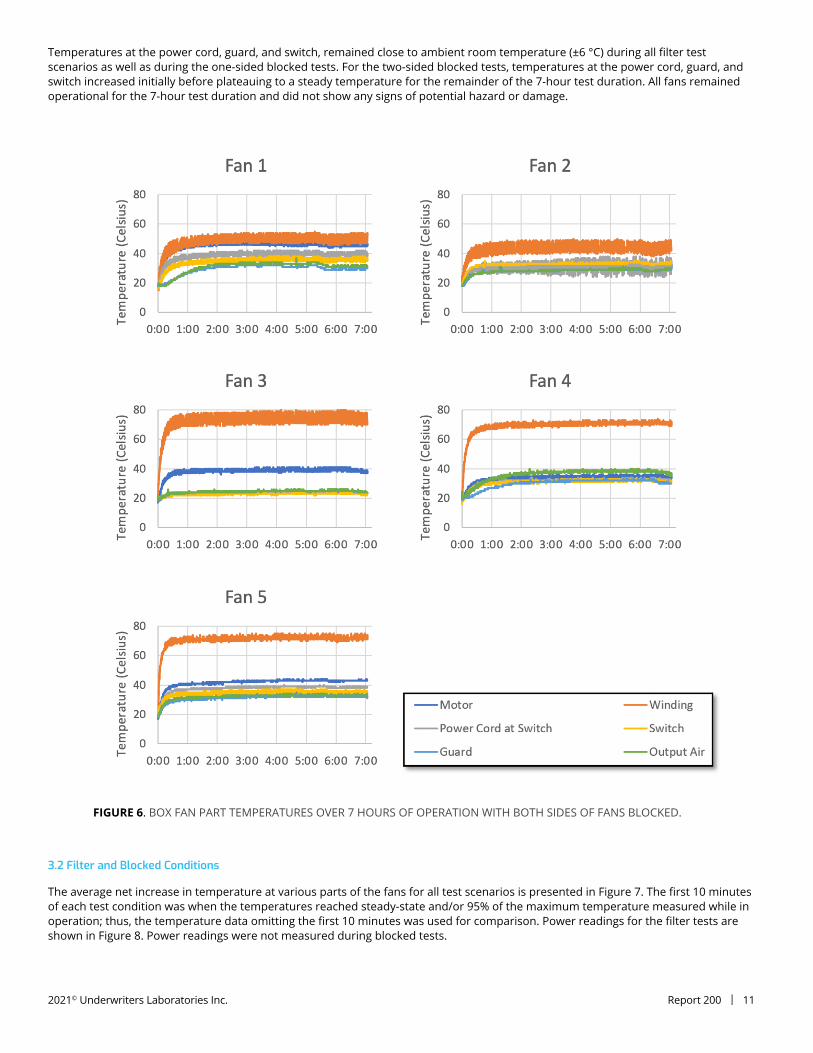
Two-Sided Obstruction
Figure 6 shows the time series of monitored temperatures under extreme condition where both sides of the fans were blocked. Despite the severe blockage of air flow, temperatures of all five box fans peaked within the first 20 minutes and then plateaued, remaining steady for the remaining 7 hours. Winding temperatures had the largest relative increase of 30 to 57 °C above ambient temperature, with peak absolute winding temperatures remaining at or below 80 °C. Peak temperatures on other fan parts did not exceed 50 °C.
2021© Underwriters Laboratories Inc. Report 200 | 11
FIGURE 6. BOX FAN PART TEMPERATURES OVER 7 HOURS OF OPERATION WITH BOTH SIDES OF FANS BLOCKED.
Temperatures at the power cord, guard, and switch, remained close to ambient room temperature (±6 °C) during all filter test scenarios as well as during the one-sided blocked tests. For the two-sided blocked tests, temperatures at the power cord, guard, and switch increased initially before plateauing to a steady temperature for the remainder of the 7-hour test duration. All fans remained operational for the 7-hour test duration and did not show any signs of potential hazard or damage.
3.2 Filter and Blocked Conditions
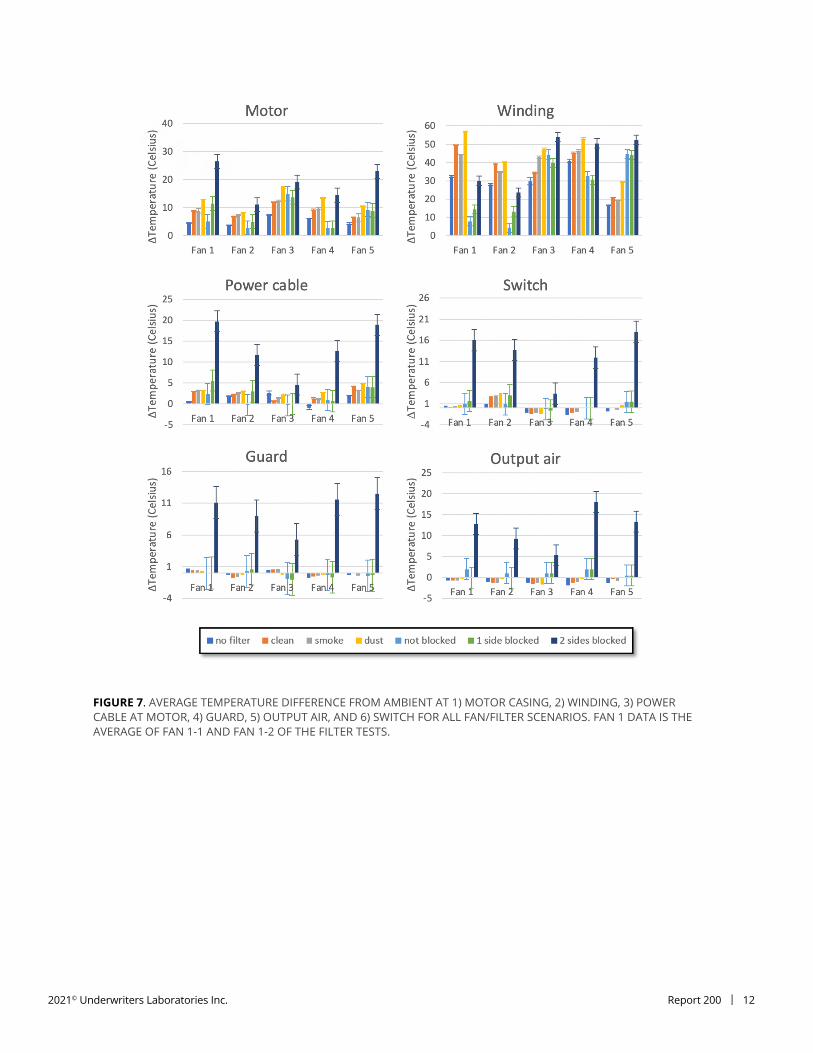
The average net increase in temperature at various parts of the fans for all test scenarios is presented in Figure 7. The first 10 minutes of each test condition was when the temperatures reached steady-state and/or 95% of the maximum temperature measured while in operation; thus, the temperature data omitting the first 10 minutes was used for comparison. Power readings for the filter tests are shown in Figure 8. Power readings were not measured during blocked tests.
2021© Underwriters Laboratories Inc. Report 200 | 12
FIGURE 7. AVERAGE TEMPERATURE DIFFERENCE FROM AMBIENT AT 1) MOTOR CASING, 2) WINDING, 3) POWER CABLE AT MOTOR, 4) GUARD, 5) OUTPUT AIR, AND 6) SWITCH FOR ALL FAN/FILTER SCENARIOS. FAN 1 DATA IS THE AVERAGE OF FAN 1-1 AND FAN 1-2 OF THE FILTER TESTS.
2021© Underwriters Laboratories Inc. Report 200 | 13
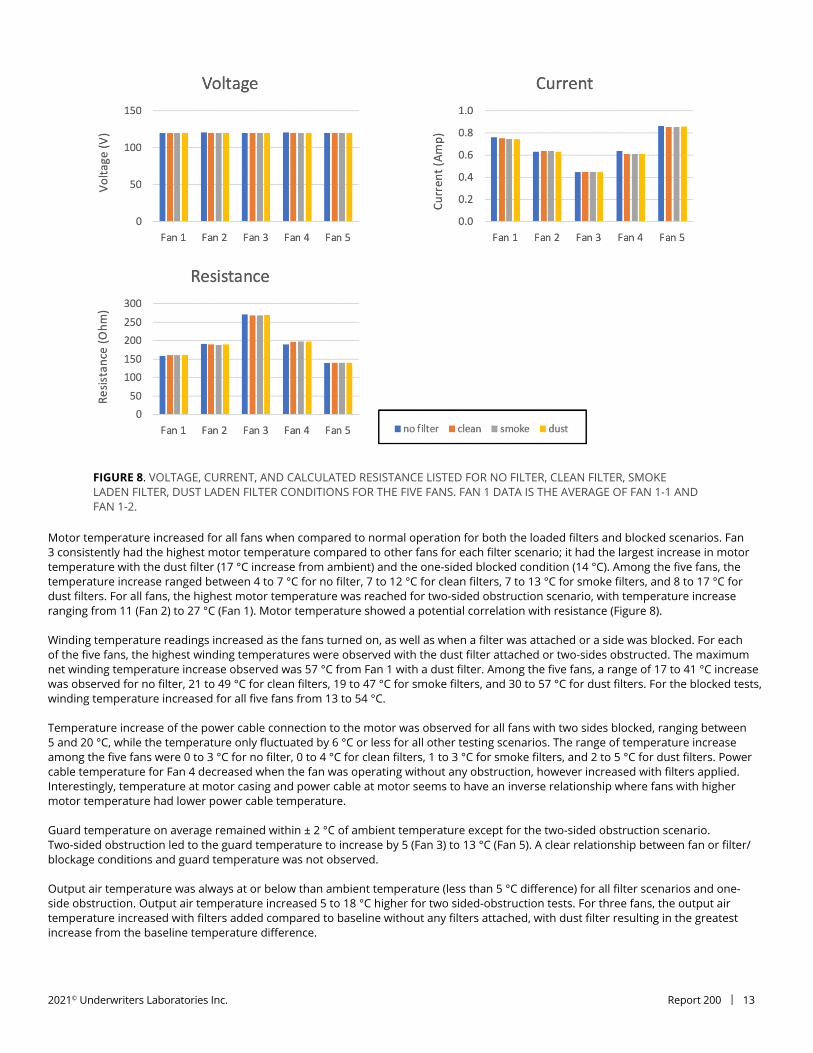
FIGURE 8. VOLTAGE, CURRENT, AND CALCULATED RESISTANCE LISTED FOR NO FILTER, CLEAN FILTER, SMOKE LADEN FILTER, DUST LADEN FILTER CONDITIONS FOR THE FIVE FANS. FAN 1 DATA IS THE AVERAGE OF FAN 1-1 AND FAN 1-2.
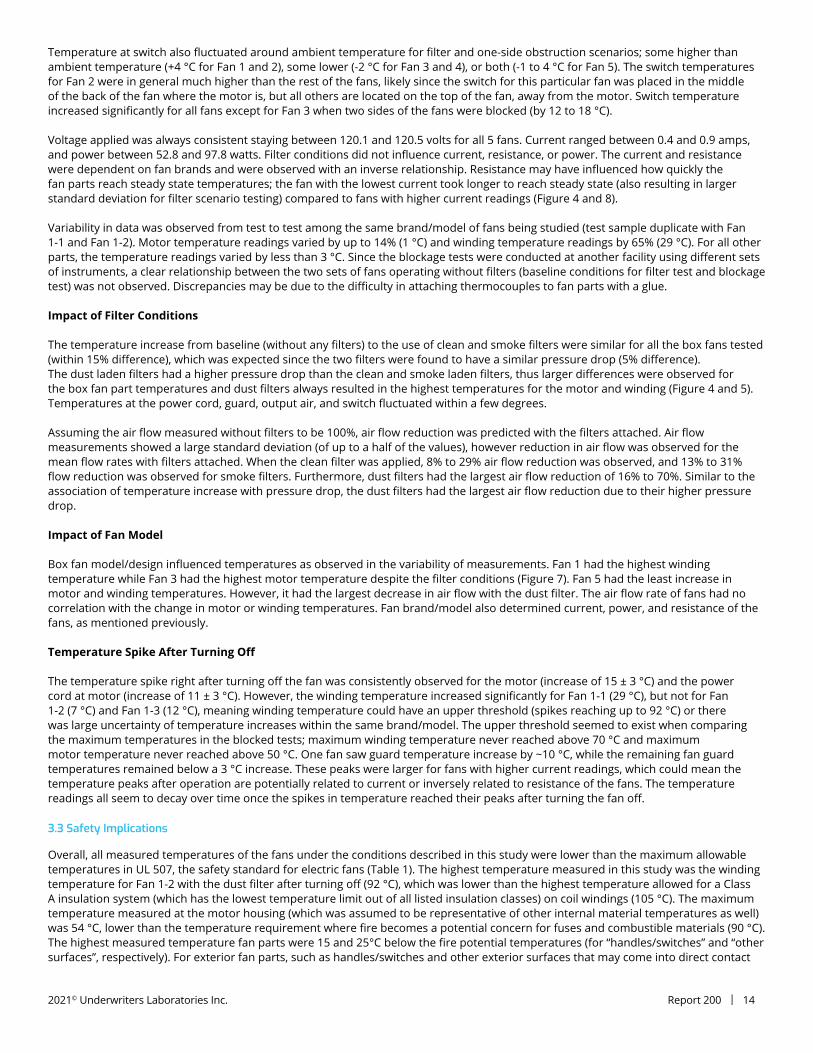
Motor temperature increased for all fans when compared to normal operation for both the loaded filters and blocked scenarios. Fan 3 consistently had the highest motor temperature compared to other fans for each filter scenario; it had the largest increase in motor temperature with the dust filter (17 °C increase from ambient) and the one-sided blocked condition (14 °C). Among the five fans, the temperature increase ranged between 4 to 7 °C for no filter, 7 to 12 °C for clean filters, 7 to 13 °C for smoke filters, and 8 to 17 °C for dust filters. For all fans, the highest motor temperature was reached for two-sided obstruction scenario, with temperature increase ranging from 11 (Fan 2) to 27 °C (Fan 1). Motor temperature showed a potential correlation with resistance (Figure 8).
Winding temperature readings increased as the fans turned on, as well as when a filter was attached or a side was blocked. For each of the five fans, the highest winding temperatures were observed with the dust filter attached or two-sides obstructed. The maximum net winding temperature increase observed was 57 °C from Fan 1 with a dust filter. Among the five fans, a range of 17 to 41 °C increase was observed for no filter, 21 to 49 °C for clean filters, 19 to 47 °C for smoke filters, and 30 to 57 °C for dust filters. For the blocked tests, winding temperature increased for all five fans from 13 to 54 °C.
Temperature increase of the power cable connection to the motor was observed for all fans with two sides blocked, ranging between 5 and 20 °C, while the temperature only fluctuated by 6 °C or less for all other testing scenarios. The range of temperature increase among the five fans were 0 to 3 °C for no filter, 0 to 4 °C for clean filters, 1 to 3 °C for smoke filters, and 2 to 5 °C for dust filters. Power cable temperature for Fan 4 decreased when the fan was operating without any obstruction, however increased with filters applied. Interestingly, temperature at motor casing and power cable at motor seems to have an inverse relationship where fans with higher motor temperature had lower power cable temperature.
Guard temperature on average remained within ± 2 °C of ambient temperature except for the two-sided obstruction scenario.Two-sided obstruction led to the guard temperature to increase by 5 (Fan 3) to 13 °C (Fan 5). A clear relationship between fan or filter/blockage conditions and guard temperature was not observed.
Output air temperature was always at or below than ambient temperature (less than 5 °C difference) for all filter scenarios and one-side obstruction. Output air temperature increased 5 to 18 °C higher for two sided-obstruction tests. For three fans, the output air temperature increased with filters added compared to baseline without any filters attached, with dust filter resulting in the greatest increase from the baseline temperature difference.
2021© Underwriters Laboratories Inc. Report 200 | 14
Temperature at switch also fluctuated around ambient temperature for filter and one-side obstruction scenarios; some higher than ambient temperature (+4 °C for Fan 1 and 2), some lower (-2 °C for Fan 3 and 4), or both (-1 to 4 °C for Fan 5). The switch temperatures for Fan 2 were in general much higher than the rest of the fans, likely since the switch for this particular fan was placed in the middle of the back of the fan where the motor is, but all others are located on the top of the fan, away from the motor. Switch temperature increased significantly for all fans except for Fan 3 when two sides of the fans were blocked (by 12 to 18 °C).
Voltage applied was always consistent staying between 120.1 and 120.5 volts for all 5 fans. Current ranged between 0.4 and 0.9 amps, and power between 52.8 and 97.8 watts. Filter conditions did not influence current, resistance, or power. The current and resistance were dependent on fan brands and were observed with an inverse relationship. Resistance may have influenced how quickly the fan parts reach steady state temperatures; the fan with the lowest current took longer to reach steady state (also resulting in larger standard deviation for filter scenario testing) compared to fans with higher current readings (Figure 4 and 8).
Variability in data was observed from test to test among the same brand/model of fans being studied (test sample duplicate with Fan 1-1 and Fan 1-2). Motor temperature readings varied by up to 14% (1 °C) and winding temperature readings by 65% (29 °C). For all other parts, the temperature readings varied by less than 3 °C. Since the blockage tests were conducted at another facility using different sets of instruments, a clear relationship between the two sets of fans operating without filters (baseline conditions for filter test and blockage test) was not observed. Discrepancies may be due to the difficulty in attaching thermocouples to fan parts with a glue.
Impact of Filter Conditions
The temperature increase from baseline (without any filters) to the use of clean and smoke filters were similar for all the box fans tested (within 15% difference), which was expected since the two filters were found to have a similar pressure drop (5% difference). The dust laden filters had a higher pressure drop than the clean and smoke laden filters, thus larger differences were observed for the box fan part temperatures and dust filters always resulted in the highest temperatures for the motor and winding (Figure 4 and 5). Temperatures at the power cord, guard, output air, and switch fluctuated within a few degrees.
Assuming the air flow measured without filters to be 100%, air flow reduction was predicted with the filters attached. Air flow measurements showed a large standard deviation (of up to a half of the values), however reduction in air flow was observed for the mean flow rates with filters attached. When the clean filter was applied, 8% to 29% air flow reduction was observed, and 13% to 31% flow reduction was observed for smoke filters. Furthermore, dust filters had the largest air flow reduction of 16% to 70%. Similar to the association of temperature increase with pressure drop, the dust filters had the largest air flow reduction due to their higher pressure drop.
Impact of Fan Model
Box fan model/design influenced temperatures as observed in the variability of measurements. Fan 1 had the highest winding temperature while Fan 3 had the highest motor temperature despite the filter conditions (Figure 7). Fan 5 had the least increase in motor and winding temperatures. However, it had the largest decrease in air flow with the dust filter. The air flow rate of fans had no correlation with the change in motor or winding temperatures. Fan brand/model also determined current, power, and resistance of the fans, as mentioned previously.
Temperature Spike After Turning Off
The temperature spike right after turning off the fan was consistently observed for the motor (increase of 15 ± 3 °C) and the power cord at motor (increase of 11 ± 3 °C). However, the winding temperature increased significantly for Fan 1-1 (29 °C), but not for Fan 1-2 (7 °C) and Fan 1-3 (12 °C), meaning winding temperature could have an upper threshold (spikes reaching up to 92 °C) or there was large uncertainty of temperature increases within the same brand/model. The upper threshold seemed to exist when comparing the maximum temperatures in the blocked tests; maximum winding temperature never reached above 70 °C and maximum motor temperature never reached above 50 °C. One fan saw guard temperature increase by ~10 °C, while the remaining fan guard temperatures remained below a 3 °C increase. These peaks were larger for fans with higher current readings, which could mean the temperature peaks after operation are potentially related to current or inversely related to resistance of the fans. The temperature readings all seem to decay over time once the spikes in temperature reached their peaks after turning the fan off.
3.3 Safety Implications
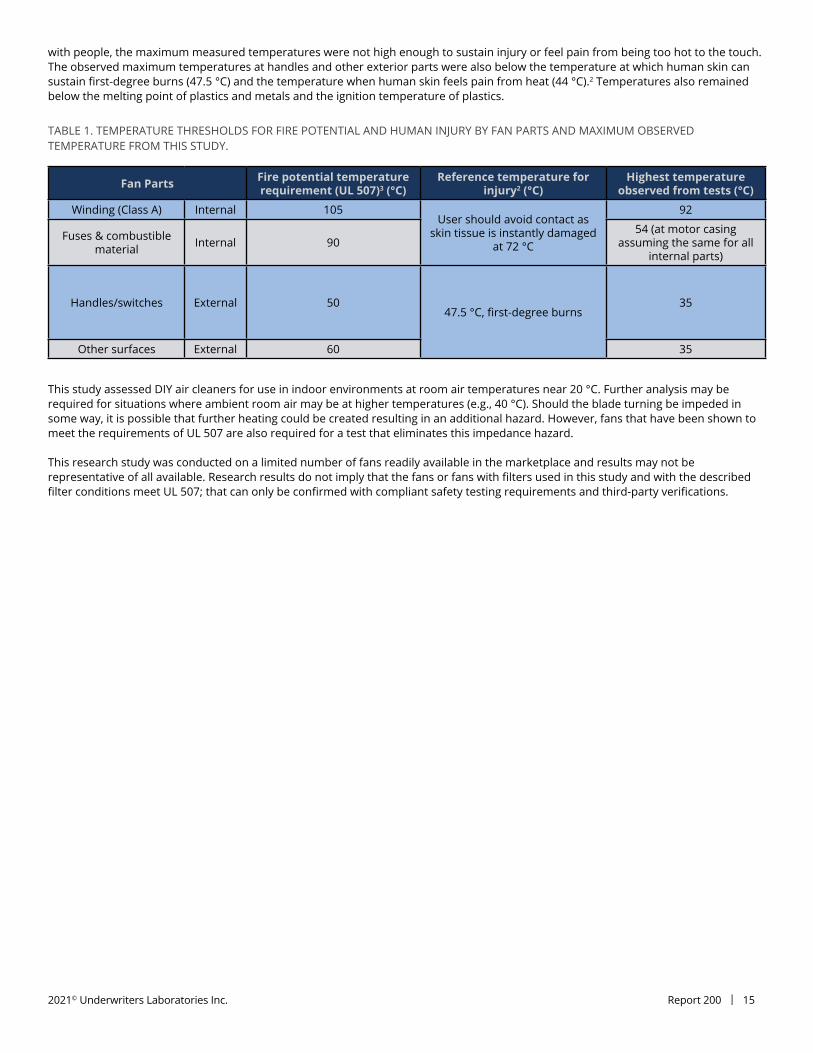
Overall, all measured temperatures of the fans under the conditions described in this study were lower than the maximum allowable temperatures in UL 507, the safety standard for electric fans (Table 1). The highest temperature measured in this study was the winding temperature for Fan 1-2 with the dust filter after turning off (92 °C), which was lower than the highest temperature allowed for a Class A insulation system (which has the lowest temperature limit out of all listed insulation classes) on coil windings (105 °C). The maximum temperature measured at the motor housing (which was assumed to be representative of other internal material temperatures as well) was 54 °C, lower than the temperature requirement where fire becomes a potential concern for fuses and combustible materials (90 °C). The highest measured temperature fan parts were 15 and 25°C below the fire potential temperatures (for “handles/switches” and “other surfaces”, respectively). For exterior fan parts, such as handles/switches and other exterior surfaces that may come into direct contact
2021© Underwriters Laboratories Inc. Report 200 | 15
TABLE 1. TEMPERATURE THRESHOLDS FOR FIRE POTENTIAL AND HUMAN INJURY BY FAN PARTS AND MAXIMUM OBSERVED TEMPERATURE FROM THIS STUDY.
Fan Parts Fire potential temperature requirement (UL 507)3 (°C)
Reference temperature for injury2 (°C)
Highest temperatureobserved from tests (°C)
Winding (Class A) Internal 105User should avoid contact as
skin tissue is instantly damaged at 72 °C
92
Fuses & combustible material Internal 90
54 (at motor casingassuming the same for all
internal parts)
Handles/switches External 5047.5 °C, first-degree burns
35
Other surfaces External 60 35
This study assessed DIY air cleaners for use in indoor environments at room air temperatures near 20 °C. Further analysis may be required for situations where ambient room air may be at higher temperatures (e.g., 40 °C). Should the blade turning be impeded in some way, it is possible that further heating could be created resulting in an additional hazard. However, fans that have been shown to meet the requirements of UL 507 are also required for a test that eliminates this impedance hazard.
This research study was conducted on a limited number of fans readily available in the marketplace and results may not be representative of all available. Research results do not imply that the fans or fans with filters used in this study and with the described filter conditions meet UL 507; that can only be confirmed with compliant safety testing requirements and third-party verifications.
with people, the maximum measured temperatures were not high enough to sustain injury or feel pain from being too hot to the touch. The observed maximum temperatures at handles and other exterior parts were also below the temperature at which human skin can sustain first-degree burns (47.5 °C) and the temperature when human skin feels pain from heat (44 °C).2 Temperatures also remained below the melting point of plastics and metals and the ignition temperature of plastics.
2021© Underwriters Laboratories Inc. Report 200 | 16
4. ACKNOWLEDGEMENTS
We would like to thank Amara Holder, Ph.D., and Heidi Vreeland, Ph.D. from the Office of Research and Development at U.S. Environmental Protection Agency for their partnership in conducting this research. We are grateful to Mark Titus and staff from Small Appliances Lab, UL LLC and Stephen Kerber, Ph.D., and his team from UL Fire Safety Research Institute for executing the experiments.
5. REFERENCES
1. Grandesso E, Gullett B, Touati A, Tabor D. Effect of Moisture, Charge Size, and Chlorine Concentration on PCDD/F Emissions from Simulated Open Burning of Forest Biomass. Environ Sci Technol. 2011;45(9):3887-3894. doi:10.1021/Es103686t
2. ASTM C1055-20. Guide for Heated System Surface Conditions that Produce Contact Burn Injuries. ASTM International; 2020. doi:10.1520/C1055-20
3. UL. UL 507: Standard for Safety: Electric Fans. Published online 2020. Accessed April 29, 2021. https://standardscatalog.Ul.Com/productdetail.Aspx?Productid=ul507
4. Puget Sound Clean Air Agency. DIY Air Filter. https://pscleanair.Gov/525/diy-air-filter

2021© Underwriters Laboratories Inc. Report 200 | 17
An Institute of Underwriters Laboratories Inc.2211 Newmarket Parkway, Suite 106, Marietta, GA 30067
[email protected] insights.org
© 2021 Underwriters Laboratories Inc.
Related Documents