An Environmental Streamflow Assessment for the Santiam River Basin, Oregon By John C. Risley, J. Rose Wallick, Joseph F. Mangano, and Krista L. Jones Prepared in cooperation with the U.S. Army Corps of Engineers Open-File Report 2012–1133 U.S. Department of the Interior U.S. Geological Survey

Welcome message from author
This document is posted to help you gain knowledge. Please leave a comment to let me know what you think about it! Share it to your friends and learn new things together.
Transcript
An Environmental Streamflow Assessment for the Santiam River Basin, Oregon
By John C. Risley, J. Rose Wallick, Joseph F. Mangano, and Krista L. Jones
Prepared in cooperation with the U.S. Army Corps of Engineers
Open-File Report 2012–1133
U.S. Department of the Interior
U.S. Geological Survey

Cover: North Santiam River downstream from Detroit Lake near Niagara at about river mile 57. (Photograph by Casey Lovato, U.S. Geological Survey, June 2011.)

An Environmental Streamflow Assessment for the Santiam River Basin, Oregon
By John C. Risley, J. Rose Wallick, Joseph F. Mangano, and Krista L. Jones
Prepared in cooperation with the U.S. Army Corps of Engineers
Open-File Report 2012–1133
U.S. Department of the Interior U.S. Geological Survey
ii
U.S. Department of the Interior KEN SALAZAR, Secretary
U.S. Geological Survey Marcia K. McNutt, Director
U.S. Geological Survey, Reston, Virginia: 2012
For more information on the USGS—the Federal source for science about the Earth, its natural and living resources, natural hazards, and the environment, visit http://www.usgs.gov or call 1–888–ASK–USGS. For an overview of USGS information products, including maps, imagery, and publications, visit http://www.usgs.gov/pubprod To order this and other USGS information products, visit http://store.usgs.gov
Suggested citation: Risley, J.C., Wallick, J.R., Mangano, J.F., and Jones, K.F., 2012, An environmental streamflow assessment for the Santiam River basin, Oregon: U.S. Geological Survey Open-File Report 2012-1133, 66 p.
Any use of trade, product, or firm names is for descriptive purposes only and does not imply endorsement by the U.S. Government.
Although this report is in the public domain, permission must be secured from the individual copyright owners to reproduce any copyrighted material contained within this report.
iii
Contents
Abstract ......................................................................................................................................................................... 1
Introduction .................................................................................................................................................................... 2 Scope of the Study ..................................................................................................................................................... 2 Purpose of the Report ................................................................................................................................................ 2 Description of the Study Area .................................................................................................................................... 4 Study Framework ....................................................................................................................................................... 6 Streamflow Regulation ............................................................................................................................................... 8
Previous Santiam River basin Studies ......................................................................................................................10 Environmental Regulatory Issues .............................................................................................................................11
Methods ........................................................................................................................................................................12 Streamflow Data .......................................................................................................................................................12
Measured and Estimated Streamflow ....................................................................................................................12
Computed Unregulated Streamflow ......................................................................................................................14
Computed Regulated Streamflow ..........................................................................................................................14 Bankfull Discharge Estimation Methods ....................................................................................................................14 Indicators of Hydrologic Alteration ............................................................................................................................17
Water-Use Compilation .............................................................................................................................................18 North Santiam River ..............................................................................................................................................18 South Santiam River .............................................................................................................................................18
Main-Stem Santiam River......................................................................................................................................19 Pre- and Post-Dam Comparisons .............................................................................................................................19
Streamflow Assessment ...............................................................................................................................................20 North Santiam River ..................................................................................................................................................21 South Santiam River .................................................................................................................................................32
Main-Stem Santiam River .........................................................................................................................................39 Geomorphic and Ecological Synopsis ..........................................................................................................................43
Geomorphic Characteristics of Study Reaches .........................................................................................................44
North Santiam River Channel Morphology ............................................................................................................44 South Santiam River Channel Morphology............................................................................................................47
Main-Stem Santiam River Channel Morphology ....................................................................................................49 Terrestrial and Aquatic Habitats and Key Species ....................................................................................................50 Potential Geomorphic and Ecological Response to Environmental Flow Releases ..................................................51
Future Studies ..............................................................................................................................................................52 Streamflow Data and Analysis ..................................................................................................................................53 Bed-Material Transport Rates and Sediment Budget ................................................................................................53 Detailed Channel and Flood-Plain Morphology Assessment ....................................................................................54 Terrestrial and Aquatic Responses ...........................................................................................................................54
Summary ......................................................................................................................................................................55 Acknowledgements.......................................................................................................................................................57 References Cited ..........................................................................................................................................................57 Appendix A. Streamflow Data Time-Series Extension ..................................................................................................61
Appendix B. U.S. Army Corps of Engineers Computed Unregulated Streamflow Data Time Series ............................61 Appendix C. Indicators of Hydrologic Alteration Results ...............................................................................................66 Appendix D. Description of Study Reaches ..................................................................................................................66
iv
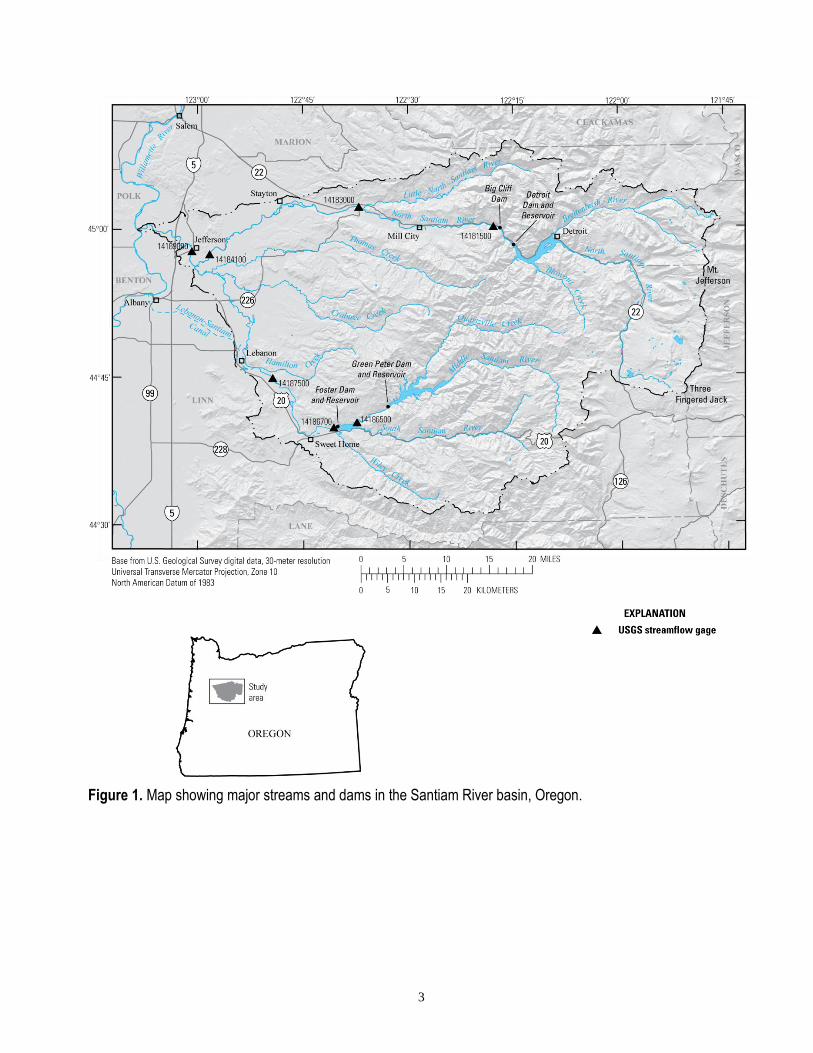
Figures Figure 1. Map showing major streams and dams in the Santiam River basin, Oregon. ................................................ 3
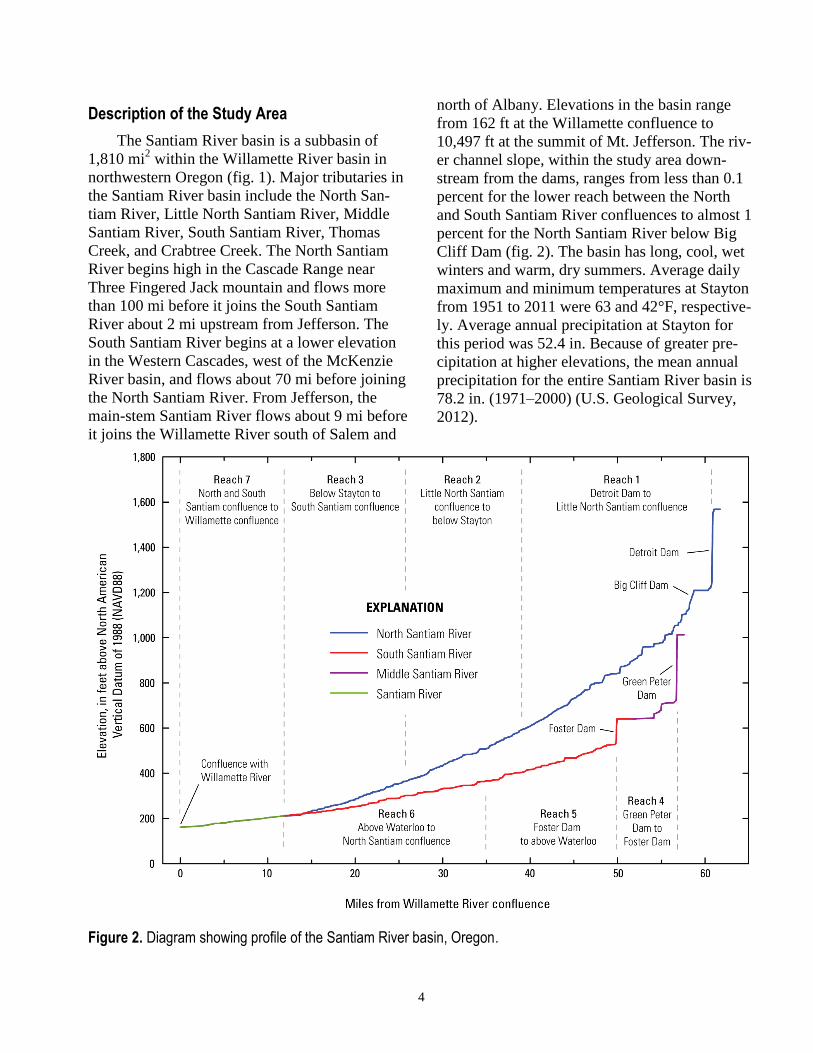
Figure 2. Diagram showing profile of the Santiam River basin, Oregon. ....................................................................... 4
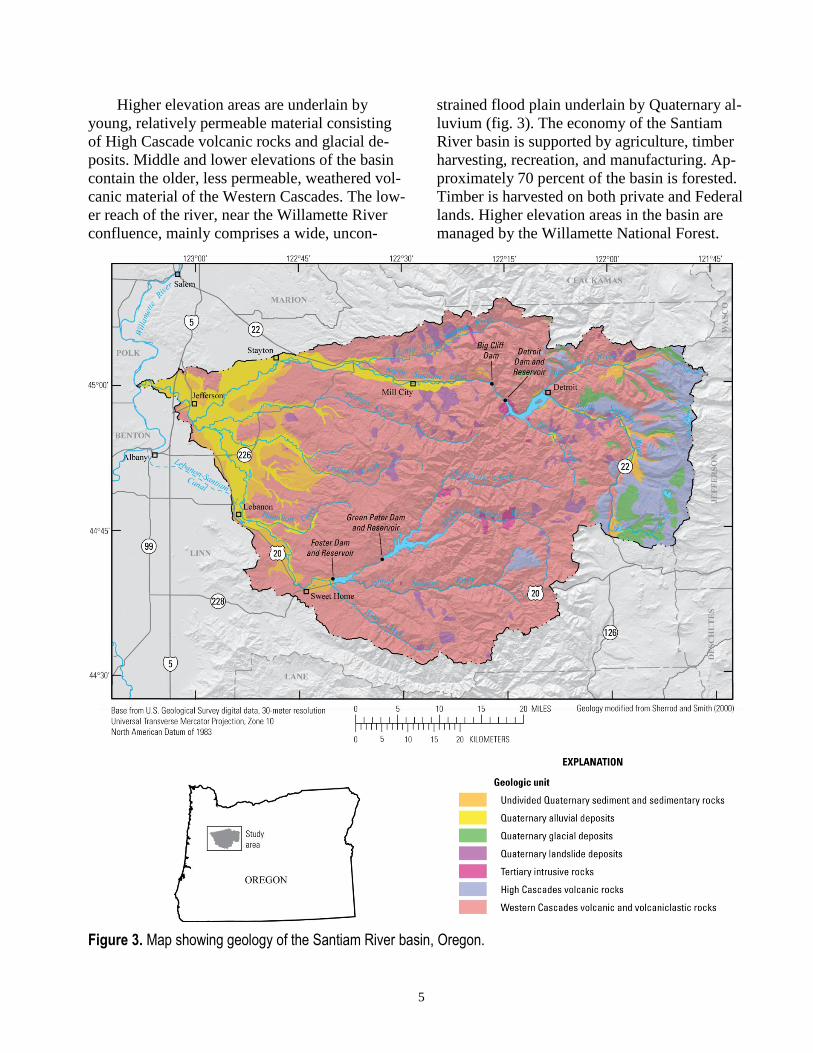
Figure 3. Map showing geology of the Santiam River basin, Oregon. .......................................................................... 5
Figure 4. Map showing location of study reaches, Santiam River basin, Oregon. ........................................................ 7
Figure 5. Diagram showing dams and selected streamflow gaging stations in the Santiam River basin, Oregon. ....... 9
Figure 6. Graph showing daily mean streamflow in Reach 2 at North Santiam River at Mehama, Oregon (14183000), water years 1922–2011. .............................................................................................................................................. 21
Figure 7. Graph showing mean daily streamflow in Reach 1 at North Santiam River at Niagara, Oregon (14181500), water years 1953–2009. .............................................................................................................................................. 22
Figure 8. Graph showing mean daily streamflow in Reach 2 at North Santiam River at Mehama, Oregon (14183000), water years 1953–2009. .............................................................................................................................................. 22
Figure 9. Graph showing mean daily streamflow in Reach 3 at North Santiam River at Green’s Bridge near Jefferson, Oregon (14184100), water years 1953–2009. ............................................................................................................. 23
Figure 10. Graph showing daily mean streamflow in Reach 1 at North Santiam River at Niagara, Oregon (14181500), water year 1975. .......................................................................................................................................................... 24
Figure 11. Graph showing daily mean streamflow in Reach 2 at North Santiam River at Mehama, Oregon (14183000), water year 1975. ...................................................................................................................................... 24
Figure 12. Graph showing daily mean streamflow in Reach 3 at North Santiam River at Green’s Bridge near Jefferson, Oregon (14184100), water year 1975. ........................................................................................................ 25
Figure 13. Graph showing percent of daily mean streamflows equaled or exceeded in Reach 1 at North Santiam River at Niagara, Oregon (14181500), water years 1953–2009. ................................................................................. 31
Figure 14. Graph showing percent of daily mean streamflows equaled or exceeded in Reach 2 at North Santiam River at Mehama, Oregon (14183000), water years 1953–2009. ................................................................................ 31
Figure 15. Graph showing percent of daily mean streamflows equaled or exceeded in Reach 3 at North Santiam River at Green’s Bridge near Jefferson, Oregon (14184100), water years 1953–2009. .............................................. 32
Figure 16. Graph showing daily mean streamflow in Reach 6 at South Santiam River at Waterloo, Oregon (14187500), water years 1924–2011. .......................................................................................................................... 33
Figure 17. Graph showing mean daily streamflow in Reach 4 at Middle Santiam River at mouth near Foster, Oregon (14186500), water years 1967–2009. .......................................................................................................................... 34
Figure 18. Graph showing mean daily streamflow in Reach 5 at South Santiam River at Foster, Oregon (14186700), water years 1967–2009. .............................................................................................................................................. 34
Figure 19. Graph showing mean daily streamflow in Reach 6 at South Santiam River at Waterloo, Oregon (14187500), water years 1967–2009. .......................................................................................................................... 35
Figure 20. Graph showing daily mean streamflow in Reach 4 at Middle Santiam River at mouth near Foster, Oregon (14186500), water year 1975. ...................................................................................................................................... 36
Figure 21. Graph showing daily mean streamflow in Reach 5 at South Santiam River at Foster, Oregon (14186700), water year 1975. .......................................................................................................................................................... 36
Figure 22. Graph showing daily mean streamflow in Reach 6 at South Santiam River at Waterloo, Oregon (14187500), water year 1975. ...................................................................................................................................... 37
Figure 23. Graph showing percent of daily mean streamflows equaled or exceeded in Reach 4 at Middle Santiam River at mouth near Foster, Oregon (14186500), water years 1967–2009. ................................................................. 38
Figure 24. Graph showing percent of daily mean streamflows equaled or exceeded in Reach 5 at South Santiam River at Foster, Oregon (14186700), water years 1967–2009. .................................................................................... 38
v
Figure 25. Graph showing percent of daily mean streamflows equaled or exceeded in Reach 6 at South Santiam River at Waterloo, Oregon (14187500), water years 1967–2009. ................................................................................ 39
Figure 26. Graph showing daily mean streamflow in Reach 7 at Santiam River at Jefferson, Oregon (14189000), water years 1940–2011. .............................................................................................................................................. 40
Figure 27. Graph showing mean daily streamflow in Reach 7 at Santiam River at Jefferson, Oregon (14189000), water years 1953–2009. .............................................................................................................................................. 41
Figure 28. Graph showing daily mean streamflow in Reach 7 at Santiam River at Jefferson, Oregon (14189000), water year 1975. .......................................................................................................................................................... 42
Figure 29. Graph showing percent of daily mean streamflows equaled or exceeded in Reach 7 at Santiam River at Jefferson, Oregon (14189000), water years 1953–2009. ............................................................................................ 43
Figure 30. Aerial photograph showing channel and flood-plain morphology in study Reach 1 of the Santiam River basin, Oregon, on the North Santiam River. ................................................................................................................ 44
Figure 31. Map showing surficial geology and revetments in alluvial segments of the Santiam River, Oregon, study area. ............................................................................................................................................................................ 46
Figure 32. Aerial photograph showing channel and flood-plain morphology in study Reach 3 of the Santiam River basin, Oregon, on the North Santiam River. ................................................................................................................ 47
Figure 33. Aerial photograph showing channel and flood-plain morphology in study Reach 5 of the Santiam River basin, Oregon, on the South Santiam River. ............................................................................................................... 48
Figure 34. Aerial photograph showing channel and flood-plain morphology in study Reach 6 of the Santiam River basin, Oregon, on the South Santiam River. ............................................................................................................... 49
Figure 35. Aerial photograph showing channel and flood-plain morphology in study Reach 7 of the Santiam River basin, Oregon, Santiam River main stem. ................................................................................................................... 50
Tables Table 1. Study reach locations in the Santiam River basin, Oregon .............................................................................. 8
Table 2. Dams in the Santiam River Basin, Oregon .................................................................................................... 10
Table 3. Minimum and maximum streamflow objectives below Big Cliff and Foster Dams ......................................... 11
Table 4. U.S. Geological Survey streamflow gaging stations in the Santiam River basin, Oregon .............................. 13
Table 5. Study-reach streamflow gaging stations and bankfull discharge and flood estimates, Santiam River basin, Oregon......................................................................................................................................................................... 15
Table 6. Indicators of Hydrologic Alteration streamflow statistics at study reach streamflow gaging stations based on unregulated streamflow conditions in the Santiam River basin, Oregon, for water years 1953–2009. ........................ 17
Table 7. Salem, Oregon, and Waterloo, Oregon, median monthly precipitation totals. ............................................... 20
Table 8. Pre- and post-dam flood statistics for selected Santiam River basin, Oregon, streamflow gaging stations, computed from annual peak streamflow data based on the Bulletin 17B Log Pearson III method. ............................. 26
Table 9. One-day maximum annual streamflow statistics from regulated and unregulated daily mean streamflows for the Santiam River, Oregon. ......................................................................................................................................... 27
Table 10. Seven-day minimum annual streamflow statistics from regulated and unregulated daily mean streamflows for the Santiam River, Oregon. .................................................................................................................................... 28
Table 11. Median monthly streamflow statistics from regulated and unregulated daily mean streamflows for the Santiam River, Oregon ................................................................................................................................................ 29
Table 12. Streamflow exceedance statistics from regulated and unregulated daily mean streamflows for the Santiam River, Oregon. ............................................................................................................................................................. 30

vi
Conversion Factors
Inch/Pound to SI
Multiply By To obtain
Length
inch (in.) 25.4 millimeter (mm)
foot (ft) 0.3048 meter (m)
mile (mi) 1.609 kilometer (km)
Area
square yard (yd2) 0.08361 square meter (m
2)
square mile (mi2) 2.590 square kilometer (km
2)
Volume
cubic foot (ft3) 0.02832 cubic meter (m
3)
acre-foot (acre-ft) 1,233 cubic meter (m3)
Flow rate
cubic foot per second (ft3/s) 0.02832 cubic meter per second (m
3/s)
cubic foot per second per square mile
[(ft3/s)/mi
2]
0.01093 cubic meter per second per
square kilometer [(m3/s)/km
2]
Temperature in degrees Celsius (°C) may be converted to degrees Fahrenheit (°F) as follows:
°F=(1.8×°C)+32.
Temperature in degrees Fahrenheit (°F) may be converted to degrees Celsius (°C) as follows:
°C=(°F-32)/1.8.
Vertical coordinate information is referenced to the North American Vertical Datum of 1988 (NAVD 88).
Horizontal coordinate information is referenced to the North American Datum of 1983 (NAD 83).
Elevation, as used in this report, refers to distance above the vertical datum.
1
An Environmental Streamflow Assessment for the Santiam River Basin, Oregon
By John C. Risley, J. Rose Wallick, Joseph F. Mangano, and Krista L. Jones
Abstract The Santiam River is a tributary of the Wil-
lamette River in northwestern Oregon and drains an area of 1,810 square miles. The U.S. Army Corps of Engineers (USACE) operates four dams in the basin, which are used primarily for flood control, hydropower production, recreation, and water-quality improvement. The Detroit and Big Cliff Dams were constructed in 1953 on the North Santiam River. The Green Peter and Foster Dams were completed in 1967 on the South San-tiam River. The impacts of the structures have included a decrease in the frequency and magni-tude of floods and an increase in low flows. For three North Santiam River reaches, the median of annual 1-day maximum streamflows decreased 42–50 percent because of regulated streamflow conditions. Likewise, for three reaches in the South Santiam River basin, the median of annual 1-day maximum streamflows decreased 39–52 percent because of regulation.
In contrast to their effect on high flows, the dams increased low flows. The median of annual 7-day minimum flows in six of the seven study reaches increased under regulated streamflow conditions between 60 and 334 percent. On a sea-sonal basis, median monthly streamflows de-creased from February to May and increased from September to January in all the reaches. However, the magnitude of these impacts usually decreased farther downstream from dams because of cumulative inflow from unregulated tributaries and groundwater entering the North, South, and main-stem Santiam Rivers below the dams. A Wilcox rank-sum test of monthly precipitation data from Salem, Oregon, and Waterloo, Oregon, found no significant difference between the pre-
and post-dam periods, which suggests that the construction and operation of the dams since the 1950s and 1960s are a primary cause of altera-tions to the Santiam River basin streamflow re-gime.
In addition to the streamflow analysis, this report provides a geomorphic characterization of the Santiam River basin and the associated con-ceptual framework for assessing possible geo-morphic and ecological changes in response to river-flow modifications. Suggestions for future biomonitoring and investigations are also pro-vided. This study was one in a series of similar tributary streamflow and geomorphic studies conducted for the Willamette Sustainable Rivers Project. The Sustainable Rivers Project is a na-tional effort by the USACE and The Nature Con-servancy to develop environmental flow require-ments in regulated river systems.
2
Introduction
In 2002, The Nature Conservancy (The Na-
ture Conservancy) and the U.S. Army Corps of
Engineers (USACE) formed the Sustainable Riv-
ers Project (The Nature Conservancy, 2009), a
partnership aimed at developing, implementing,
and refining environmental flow requirements
downstream from dams. Environmental flows can
be defined as the streamflow needed to sustain
ecosystems while continuing to meet human
needs. Developing environmental flow require-
ments typically involves a collective process of
stakeholders to identify and prioritize streamflow
objectives. The process is a series of steps and
feedback loops that include defining the stream-
flow requirements, implementing them into the
dam operations, monitoring and modeling the
streamflow changes and their effect on the river
ecosystem, and then adjusting and refining the
streamflow requirements if necessary. In addition
to dams, other anthropogenic factors in a water-
shed can contribute to freshwater ecosystem deg-
radation, such as water diversions, channel re-
vetment, timber harvest, wetland draining, inva-
sive species, gravel mining, and other factors,
which also are commonly considered during the
development process (Tharme, 2003; Acreman
and Dunbar, 2004; Richter and others, 2006; The
Nature Conservancy, 2009).
The Santiam River environmental flow study
is a collaborative effort of the USACE, The Na-
ture Conservancy, and the U.S. Geological Sur-
vey (USGS) to develop environmental flow re-
quirements for the Santiam River, which is a trib-
utary of the Willamette River in northwestern Or-
egon (fig. 1).
Scope of the Study
As a continuation of the Willamette Sustain-
able Rivers Project, the streamflow and geo-
morphic analyses from this study will assist the
USACE and The Nature Conservancy in develop-
ing an environmental flow framework for the
Santiam River basin. The framework will sup-
plement a broader assemblage of ecological, hy-
drologic, and geomorphologic baseline data. The
analyses include an assessment of changes to the
ecosystem resulting from anthropogenic activi-
ties, such as dam operations and water withdraw-
als that have taken place in the basin.
The goals of this study are to analyze stream-
flow trends in the main reaches of the Santiam
River basin and describe geomorphic and biolog-
ical conditions to facilitate the development of
environmental flow guidelines. Tasks to achieve
these goals include:
1. Characterize streamflows in reaches under
regulated and unregulated conditions.
2. Qualitatively describe dominant geomorphic
and ecologic issues in reaches that could be
affected by environmental flow modifica-
tions.
3. Communicate study results in a report and at
future environmental flow workshops.
Purpose of the Report
This report will provide Santiam River basin
stakeholders with a compilation of streamflow
conditions under regulated and unregulated con-
ditions in various reaches in the basin that are de-
fined by their geomorphic and ecological charac-
teristics. Using streamflow data and the results
from the analysis of the data, it will be possible to
identify the rate, frequency, duration, and timing
of flow releases from Santiam River basin dams
needed at downstream locations to achieve spe-
cific ecological and geomorphic objectives.
3
Figure 1. Map showing major streams and dams in the Santiam River basin, Oregon.
4
Description of the Study Area
The Santiam River basin is a subbasin of
1,810 mi2 within the Willamette River basin in
northwestern Oregon (fig. 1). Major tributaries in
the Santiam River basin include the North San-
tiam River, Little North Santiam River, Middle
Santiam River, South Santiam River, Thomas
Creek, and Crabtree Creek. The North Santiam
River begins high in the Cascade Range near
Three Fingered Jack mountain and flows more
than 100 mi before it joins the South Santiam
River about 2 mi upstream from Jefferson. The
South Santiam River begins at a lower elevation
in the Western Cascades, west of the McKenzie
River basin, and flows about 70 mi before joining
the North Santiam River. From Jefferson, the
main-stem Santiam River flows about 9 mi before
it joins the Willamette River south of Salem and
north of Albany. Elevations in the basin range
from 162 ft at the Willamette confluence to
10,497 ft at the summit of Mt. Jefferson. The riv-
er channel slope, within the study area down-
stream from the dams, ranges from less than 0.1
percent for the lower reach between the North
and South Santiam River confluences to almost 1
percent for the North Santiam River below Big
Cliff Dam (fig. 2). The basin has long, cool, wet
winters and warm, dry summers. Average daily
maximum and minimum temperatures at Stayton
from 1951 to 2011 were 63 and 42°F, respective-
ly. Average annual precipitation at Stayton for
this period was 52.4 in. Because of greater pre-
cipitation at higher elevations, the mean annual
precipitation for the entire Santiam River basin is
78.2 in. (1971–2000) (U.S. Geological Survey,
2012).
Figure 2. Diagram showing profile of the Santiam River basin, Oregon.
5
Higher elevation areas are underlain by
young, relatively permeable material consisting
of High Cascade volcanic rocks and glacial de-
posits. Middle and lower elevations of the basin
contain the older, less permeable, weathered vol-
canic material of the Western Cascades. The low-
er reach of the river, near the Willamette River
confluence, mainly comprises a wide, uncon-
strained flood plain underlain by Quaternary al-
luvium (fig. 3). The economy of the Santiam
River basin is supported by agriculture, timber
harvesting, recreation, and manufacturing. Ap-
proximately 70 percent of the basin is forested.
Timber is harvested on both private and Federal
lands. Higher elevation areas in the basin are
managed by the Willamette National Forest.
Figure 3. Map showing geology of the Santiam River basin, Oregon.
6
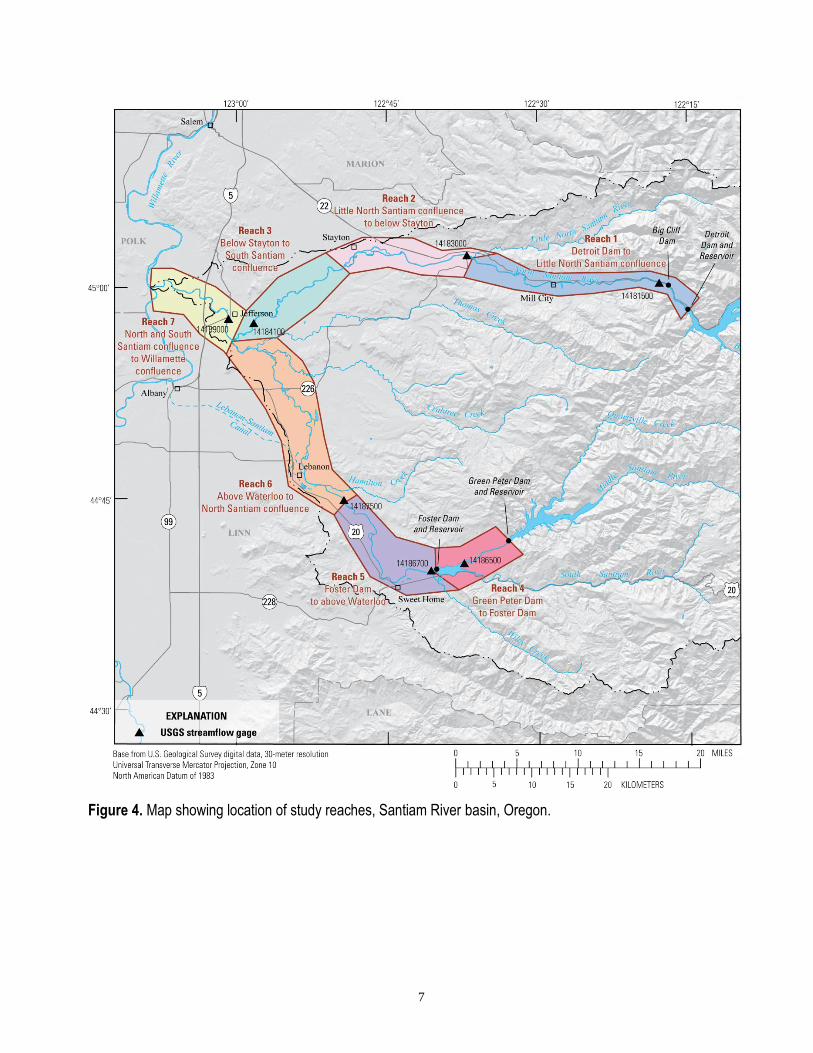
Study Framework
The Santiam River system in the study area
was divided into seven reaches, each having dis-
tinct streamflow, geomorphic, and ecological
conditions (fig. 4, table 1). The North Santiam
River portion of the study area was divided into
three reaches. Reach 1 extends from Detroit Dam
to the confluence of the Little North Santiam
River. Reach 2 continues downstream to river
mile (RM) 26 near Stayton. Reach 3 continues
downstream to the South Santiam River conflu-
ence. The South Santiam River basin was also
divided into three reaches. Reach 4 is along the
Middle Santiam River, a tributary of the South
Santiam River, between Green Peter Dam and
Foster Lake reservoir. Reaches 5 and 6 extend
from Foster Dam to RM 23.4 (upstream from
USGS streamflow gaging station (hereinafter
“gage”) at Waterloo [14187500]) and from RM
23.4 to the North Santiam River confluence, re-
spectively. The final reach, Reach 7, extends
from confluence of the North and South Santiam
Rivers through Jefferson to the Willamette River
confluence. For all reaches where the down-
stream boundary is near a major stream conflu-
ence, the downstream boundary was set just up-
stream from the confluence. Streamflow from the
confluent stream is included in the streamflow of
the next downstream reach. This was done to
minimize the difference in streamflow between
both ends of the reach and to use a single repre-
sentative reach discharge in the analyses.
7
Figure 4. Map showing location of study reaches, Santiam River basin, Oregon.

8
Table 1. Study reach locations in the Santiam River basin, Oregon.
Reach number River name Upstream end description
Upstream end river
mile Downstream end description
Reach length (miles)
Northern basin
1 North Santiam Detroit Dam 60.9 Little North Santiam River con-
fluence
21.7
2 North Santiam Little North Santiam River
confluence
39.2 Below Stayton, Oregon 13.2
3 North Santiam Below Stayton, Oregon 26.0 South Santiam confluence 14.2
Southern basin
4 Middle Santiam Green Peter Dam 5.5 Foster Dam 5.5
5 South Santiam Foster Dam 38.1 Above Waterloo, Oregon 14.7
6 South Santiam Above Waterloo, Oregon 23.4 N. Santiam River confluence 23.4
Lower basin
7 Lower Santiam North and South Santiam Riv-
er confluence
11.8 Willamette confluence 11.8
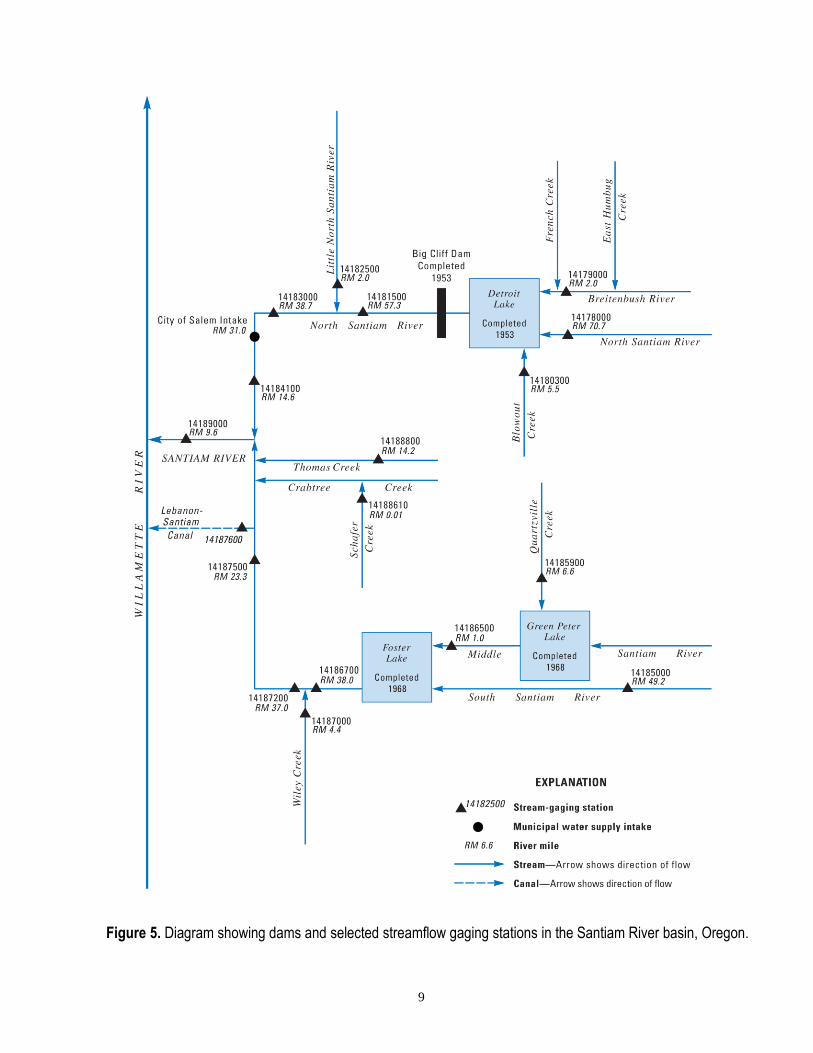
Streamflow Regulation
The USACE operates four dams in the San-
tiam River basin (fig. 5, table 2). The Detroit and
the Big Cliff Dams, on the North Santiam River,
were completed in 1953. In addition to flood con-
trol and recreation uses, the Detroit Dam also
produces up to 100 megawatts of power. The
smaller Big Cliff Dam, 3 mi downstream from
the Detroit Dam, is also used for hydropower
production and for regulating power-generating
water releases from Detroit Dam. The Green Pe-
ter and Foster Dams, in the South Santiam River
basin, were completed in 1968. The two dams
work in conjunction to provide flood control, hy-
dropower production, irrigation supply, recrea-
tion, water-quality improvement, and aquatic
habitat. Foster Dam, about 7 mi downstream from
Green Peter Dam, is used to produce hydropower
and regulate power-generating water releases
from Green Peter Dam. The Green Peter and Fos-
ter Dams have generators capable of producing a
combined total of 100 megawatts. Surface-water
withdrawals for urban water supply and irrigation
are made at locations downstream from the dams.
The city of Salem withdraws approximately 67
ft3/s from the North Santiam River at RM 31.0 on
Geren Island (Oregon Water Resources Depart-
ment, 2012). On the South Santiam River, an av-
erage of 90 ft3/s of streamflow (water years
1993–2011) was diverted mostly for municipal
water supply to the Lebanon-Santiam Canal at
RM 20.8 as measured at the USGS gage on the
canal (14187600).
9
Figure 5. Diagram showing dams and selected streamflow gaging stations in the Santiam River basin, Oregon.
10
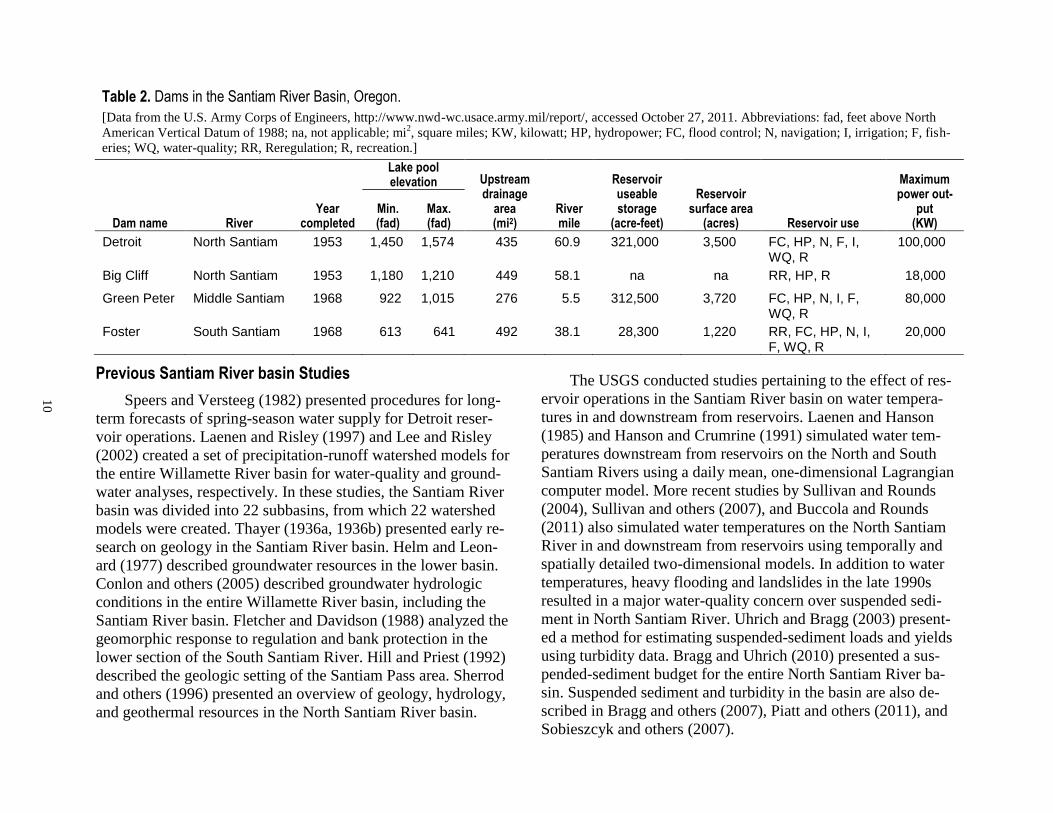
Table 2. Dams in the Santiam River Basin, Oregon.
[Data from the U.S. Army Corps of Engineers, http://www.nwd-wc.usace.army.mil/report/, accessed October 27, 2011. Abbreviations: fad, feet above North
American Vertical Datum of 1988; na, not applicable; mi2, square miles; KW, kilowatt; HP, hydropower; FC, flood control; N, navigation; I, irrigation; F, fish-
eries; WQ, water-quality; RR, Reregulation; R, recreation.]
Dam name River Year
completed
Lake pool elevation Upstream
drainage area (mi2)
River mile
Reservoir useable storage
(acre-feet)
Reservoir surface area
(acres) Reservoir use
Maximum power out-
put (KW)
Min. (fad)
Max. (fad)
Detroit North Santiam 1953 1,450 1,574 435 60.9 321,000 3,500 FC, HP, N, F, I, WQ, R
100,000
Big Cliff North Santiam 1953 1,180 1,210 449 58.1 na na RR, HP, R 18,000
Green Peter Middle Santiam 1968 922 1,015 276 5.5 312,500 3,720 FC, HP, N, I, F, WQ, R
80,000
Foster South Santiam 1968 613 641 492 38.1 28,300 1,220 RR, FC, HP, N, I, F, WQ, R
20,000
Previous Santiam River basin Studies
Speers and Versteeg (1982) presented procedures for long-
term forecasts of spring-season water supply for Detroit reser-
voir operations. Laenen and Risley (1997) and Lee and Risley
(2002) created a set of precipitation-runoff watershed models for
the entire Willamette River basin for water-quality and ground-
water analyses, respectively. In these studies, the Santiam River
basin was divided into 22 subbasins, from which 22 watershed
models were created. Thayer (1936a, 1936b) presented early re-
search on geology in the Santiam River basin. Helm and Leon-
ard (1977) described groundwater resources in the lower basin.
Conlon and others (2005) described groundwater hydrologic
conditions in the entire Willamette River basin, including the
Santiam River basin. Fletcher and Davidson (1988) analyzed the
geomorphic response to regulation and bank protection in the
lower section of the South Santiam River. Hill and Priest (1992)
described the geologic setting of the Santiam Pass area. Sherrod
and others (1996) presented an overview of geology, hydrology,
and geothermal resources in the North Santiam River basin.
The USGS conducted studies pertaining to the effect of res-
ervoir operations in the Santiam River basin on water tempera-
tures in and downstream from reservoirs. Laenen and Hanson
(1985) and Hanson and Crumrine (1991) simulated water tem-
peratures downstream from reservoirs on the North and South
Santiam Rivers using a daily mean, one-dimensional Lagrangian
computer model. More recent studies by Sullivan and Rounds
(2004), Sullivan and others (2007), and Buccola and Rounds
(2011) also simulated water temperatures on the North Santiam
River in and downstream from reservoirs using temporally and
spatially detailed two-dimensional models. In addition to water
temperatures, heavy flooding and landslides in the late 1990s
resulted in a major water-quality concern over suspended sedi-
ment in North Santiam River. Uhrich and Bragg (2003) present-
ed a method for estimating suspended-sediment loads and yields
using turbidity data. Bragg and Uhrich (2010) presented a sus-
pended-sediment budget for the entire North Santiam River ba-
sin. Suspended sediment and turbidity in the basin are also de-
scribed in Bragg and others (2007), Piatt and others (2011), and
Sobieszcyk and others (2007).

11
Environmental Regulatory Issues
In early 1999, the National Marine Fisheries
Service (NMFS) listed Upper Willamette River
Chinook salmon (Oncorhynchus tshawytscha)
and the Upper Willamette River steelhead (On-
corhynchus mykiss) in the Santiam River basin
and other upper Willamette River basins as
threatened under the Federal Endangered Species
Act (ESA). In 1993, the U.S. Fish and Wildlife
Service (USFWS) listed the Oregon chub (Ore-
gonichthys crameri) as endangered in Marion and
Linn Counties, which includes the Santiam River
basin. In 2010, the Oregon chub was reclassified
from endangered to threatened. As a result of the-
se listings, the USACE submitted its first Biolog-
ical Assessment in 2000 and a supplemental Bio-
logical Assessment in 2007 for the Willamette
River basin that included specific recovery plans
for the Santiam River basin (U.S. Army Corps of
Engineers, 2000, 2007).
In July 2008, NMFS released their decision
on the Biological Assessment plans through a
Willamette Project Biological Opinion (National
Marine Fisheries Service, 2008a; 2008b). The
USFWS also released a Biological Opinion for
the Willamette River basin because they have ju-
risdiction over the Oregon chub (U.S. Fish and
Wildlife Service, 2008). NMFS and the USFWS
decided that the USACE Biological Assessment
plans were insufficient for mitigating the effect of
the water projects on critical habitat. The Biolog-
ical Opinion ordered additional measures, which
included improved fish passage, temperature con-
trol, and changes in downstream streamflows.
The Biological Opinion includes flow-release
targets for Big Cliff and Foster Dams for differ-
ent seasonal life histories for the ESA-listed fish
(table 3). The Biological Opinion also includes a
measure for implementing environmental flow
releases from the dams.
Table 3. Minimum and maximum streamflow objectives below Big Cliff and Foster Dams.
[Source: National Marine Fisheries Service, 2008]
Period Primary Use Minimum flow (ft
3/s)
Maximum flow (ft
3/s)
Big Cliff Dam
September 1–October 15 Chinook spawning 1,500 3,000
October 16–January 31 Chinook incubation 1,200
February 1–March 15 Chinook rearing/adult migration 1,000
March 16–May 31 steelhead spawning 1,500 3,000
June 1–July 15 steelhead incubation 1,200
July 16–August 31 steelhead rearing 1,000
Foster Dam
September 1–October 15 Chinook spawning 1,500 3,000
October 16–January 31 Chinook incubation 1,100
February 1–March 15 Chinook rearing 800
March 16–May 15 steelhead spawning 1,500 3,000
May 16–June 30 steelhead incubation 1,100
July 1–August 31 steelhead rearing 800
12
The Oregon Department of Environmental
Quality (ODEQ), as required under the Federal
Clean Water Act, released a stream-temperature
Total Maximum Daily Load (TMDL) plan in
2006 for the Willamette River basin (Oregon De-
partment of Environmental Quality, 2006).
Stream reaches in the North and South Santiam
River basins found to be thermally impaired and
not meeting state temperature standards for salm-
onid rearing, spawning, and cold-water refuges,
as a result of reservoir releases, channel geomor-
phology alterations, streamflow diversions, and
limited riparian shade, were placed on the Federal
Clean Water Act section 303(d) list as having ex-
ceeded their temperature TMDL.
Methods
For this study, various methods were em-
ployed to assess the effects of dams and with-
drawals on streamflows. These included a compi-
lation of measured and estimated daily mean gage
statistics under regulated and unregulated condi-
tions, bankfull streamflow estimation, pre- and
post-dam peak-flow analysis, and a pre- and post-
dam period climate comparison.
Streamflow Data
Measured and Estimated Streamflow
The USGS began continuous streamflow
monitoring within the Santiam River basin (table
4) in the 1920s. Eighteen of these stations were
active during water year 2011. The stations with
the longest streamflow time series are the North
Santiam River at Mehama (14183000: 1921–
2011) and the South Santiam River at Waterloo
(14187500: 1923–2011). From 2005 to 2010, the
USGS also operated eight temporary streamflow
measurement sites (14183430, 14183450,
14183500, 14183550, 14183570, 14183580,
14183585, and 14183590) in the vicinity of Ger-
en Island on the North Santiam River. (Map at
http://or.water.usgs.gov/northsantiam/sites/).
Streamflow and stage were measured intermit-
tently at these sites during six summers to create
rating curves. One station was upstream from
Geren Island, five stations were in the north and
south channels around the island, and two sta-
tions were in side diversion cannels. The purpose
of the data monitoring was to gain a better under-
standing of the spatial and temporal distribution
of surface waters during low-flow conditions up-
stream and downstream from the island, in the
alcoves and secondary channels, and near the Sa-
lem municipal water-supply intakes.
Seven of the gages from table 4 were repre-
sentative of flow conditions in the seven defined
study reaches and could be used in the statistical
analyses (table 5). Streamflow data for Reaches
1, 2, 6, and 7 represented unregulated and regu-
lated flow conditions because they extended from
the 1920s and 1930s to water year 2011. Howev-
er, for the other three reaches (Reaches 3, 4, and
5), it was necessary to augment the measured
streamflow period with computed regulated and
computed unregulated daily mean streamflow
time series provided by the USACE. Microsoft®
Excel® files containing measured and estimated
daily mean streamflows for the seven reaches can
be downloaded from the link in Appendix A.

13
Table 4. U.S. Geological Survey streamflow gaging stations in the Santiam River basin, Oregon.—continued
[A water year is from October 1 of the previous year to September 30. Abbreviations: mi2, square miles; *, stage or eleva-
tion data only; na, not applicable.]
Station number Streamflow station name
Drainage area (mi2)
Period of record (water years)
14178000 North Santiam River below Boulder Creek near Detroit, Oregon 216 1928–2011
14178700 East Humbug Creek near Detroit, Oregon 7.32 1978–1994
14179000 Breitenbush River above French Creek near Detroit, Oregon 108 1932–1987;
1998–2011
14179100 French Creek near Detroit, Oregon 9.9 2002–2005
14180300 Blowout Creek near Detroit, Oregon 26.0 1998–2011
14180500 Detroit Lake near Detroit, Oregon 437 1953–2004*
14181500 North Santiam River at Niagara, Oregon 453 1938–2011
14181750 Rock Creek near Mill City, Oregon 14.8 2005–2008
14182400 Little North Santiam River below Canyon Creek near Mehama, Oregon 93.0 2007–2008
14182500 Little North Santiam River near Mehama, Oregon 112 1931–2011
14183000 North Santiam River at Mehama, Oregon 654 1921–2011
14184100 North Santiam River at Greens Bridge near Jefferson, Oregon 736 1964–1967;
2011
14185000 South Santiam River below Cascadia, Oregon 174 1935–2011
14185700 Middle Santiam River near Upper Soda, Oregon 74.6 1981–1994
14185800 Middle Santiam River near Cascadia, Oregon 104 1964–1981;
1988
14185880 Packers Gulch near Cascadia, Oregon 7.45 1983–1986
14185900 Quartzville Creek near Cascadia, Oregon 99.2 1963–2011
14186000 Middle Santiam River near Foster, Oregon 271 1931–1947
14186100 Green Peter Lake near Foster, Oregon 273 1974–2003*
14186200 Middle Santiam River below Green Peter Lake near Foster, Oregon 273 2010–2011*
14186500 Middle Santiam River at mouth near Foster, Oregon 287 1950–1966
14186600 Foster Lake at Foster, Oregon 492 1974–2003*
14186700 South Santiam River at Foster, Oregon 493 1966–1973
14187000 Wiley Creek near Foster, Oregon 51.8 1947–1973;
1988–2011
14187100 Wiley Creek at Foster, Oregon 62.3 1973–1988
14187200 South Santiam River near Foster, Oregon 557 1973–2011
14187500 South Santiam River at Waterloo, Oregon 640 1923–2011
14
Table 4. U.S. Geological Survey streamflow gaging stations in the Santiam River basin, Oregon.—continued
[A water year is from October 1 of the previous year to September 30. Abbreviations: mi2, square miles; *, stage or eleva-
tion data only; na, not applicable.]
Station number Streamflow station name
Drainage area (mi2)
Period of record (water years)
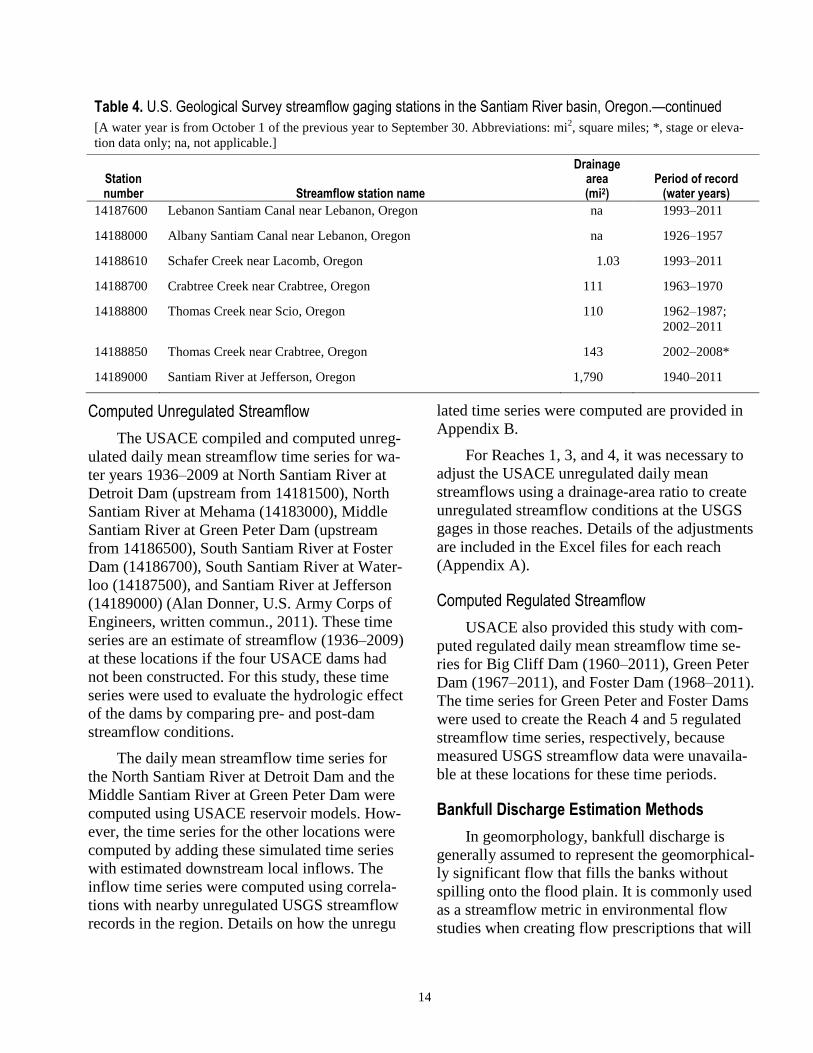
14187600 Lebanon Santiam Canal near Lebanon, Oregon na 1993–2011
14188000 Albany Santiam Canal near Lebanon, Oregon na 1926–1957
14188610 Schafer Creek near Lacomb, Oregon 1.03 1993–2011
14188700 Crabtree Creek near Crabtree, Oregon 111 1963–1970
14188800 Thomas Creek near Scio, Oregon 110 1962–1987;
2002–2011
14188850 Thomas Creek near Crabtree, Oregon 143 2002–2008*
14189000 Santiam River at Jefferson, Oregon 1,790 1940–2011
Computed Unregulated Streamflow
The USACE compiled and computed unreg-
ulated daily mean streamflow time series for wa-
ter years 1936–2009 at North Santiam River at
Detroit Dam (upstream from 14181500), North
Santiam River at Mehama (14183000), Middle
Santiam River at Green Peter Dam (upstream
from 14186500), South Santiam River at Foster
Dam (14186700), South Santiam River at Water-
loo (14187500), and Santiam River at Jefferson
(14189000) (Alan Donner, U.S. Army Corps of
Engineers, written commun., 2011). These time
series are an estimate of streamflow (1936–2009)
at these locations if the four USACE dams had
not been constructed. For this study, these time
series were used to evaluate the hydrologic effect
of the dams by comparing pre- and post-dam
streamflow conditions.
The daily mean streamflow time series for
the North Santiam River at Detroit Dam and the
Middle Santiam River at Green Peter Dam were
computed using USACE reservoir models. How-
ever, the time series for the other locations were
computed by adding these simulated time series
with estimated downstream local inflows. The
inflow time series were computed using correla-
tions with nearby unregulated USGS streamflow
records in the region. Details on how the unregu
lated time series were computed are provided in
Appendix B.
For Reaches 1, 3, and 4, it was necessary to
adjust the USACE unregulated daily mean
streamflows using a drainage-area ratio to create
unregulated streamflow conditions at the USGS
gages in those reaches. Details of the adjustments
are included in the Excel files for each reach
(Appendix A).
Computed Regulated Streamflow
USACE also provided this study with com-
puted regulated daily mean streamflow time se-
ries for Big Cliff Dam (1960–2011), Green Peter
Dam (1967–2011), and Foster Dam (1968–2011).
The time series for Green Peter and Foster Dams
were used to create the Reach 4 and 5 regulated
streamflow time series, respectively, because
measured USGS streamflow data were unavaila-
ble at these locations for these time periods.
Bankfull Discharge Estimation Methods
In geomorphology, bankfull discharge is
generally assumed to represent the geomorphical-
ly significant flow that fills the banks without
spilling onto the flood plain. It is commonly used
as a streamflow metric in environmental flow
studies when creating flow prescriptions that will
15
meet the habitat needs of an aquatic or terrestrial species at vari-
ous life stages. The estimation of bankfull discharge has substan-
tial uncertainty because it has to be estimated at a specific loca-
tion and is not necessarily representative of a reach. Wolman and
Miller (1960) defined bankfull discharge as having a recurrence
interval of 1.5 years in a variety of rivers. However, that ap-
proach could not be used consistently in all seven study reaches,
because not all the reaches have an adequate number of years of
pre-dam peak-flow data to complete a flood-frequency analysis.
For this study, several methods of estimating bankfull dis-
charge were compared and evaluated. These included bankfull-
discharge estimates provided by the USACE, unit-discharge es-
timates based on USACE estimates, field observations at gages,
calculation of the 1.5-year peak-flow frequency, and channel
cross-section plots derived from high-flow measurement data
(table 5). Estimates based on the latter method are not included
in the table because of insufficient channel detail in the data or
because flow events had insufficient magnitude.
Bankfull flood stage and discharge estimates for gages in
Reaches 2, 6, and 7 were previously determined by the USACE
using field-site-level surveys, aerial photography, and flood
analyses (Keith Duffy, U.S. Army Corps of Engineers, written
commun., 2011). The corresponding gages, which include North
Santiam River at Mehama, Oregon (14183000) (Reach 2), South
Santiam River at Waterloo, Oregon (14187500) (Reach 6), and
Santiam River at Jefferson, Oregon (14189000) (Reach 7), have
the longest streamflow records in the Santiam River basin and
also are used as flood-forecast sites by the U.S. National Weath-
er Service River Forecasting Center.
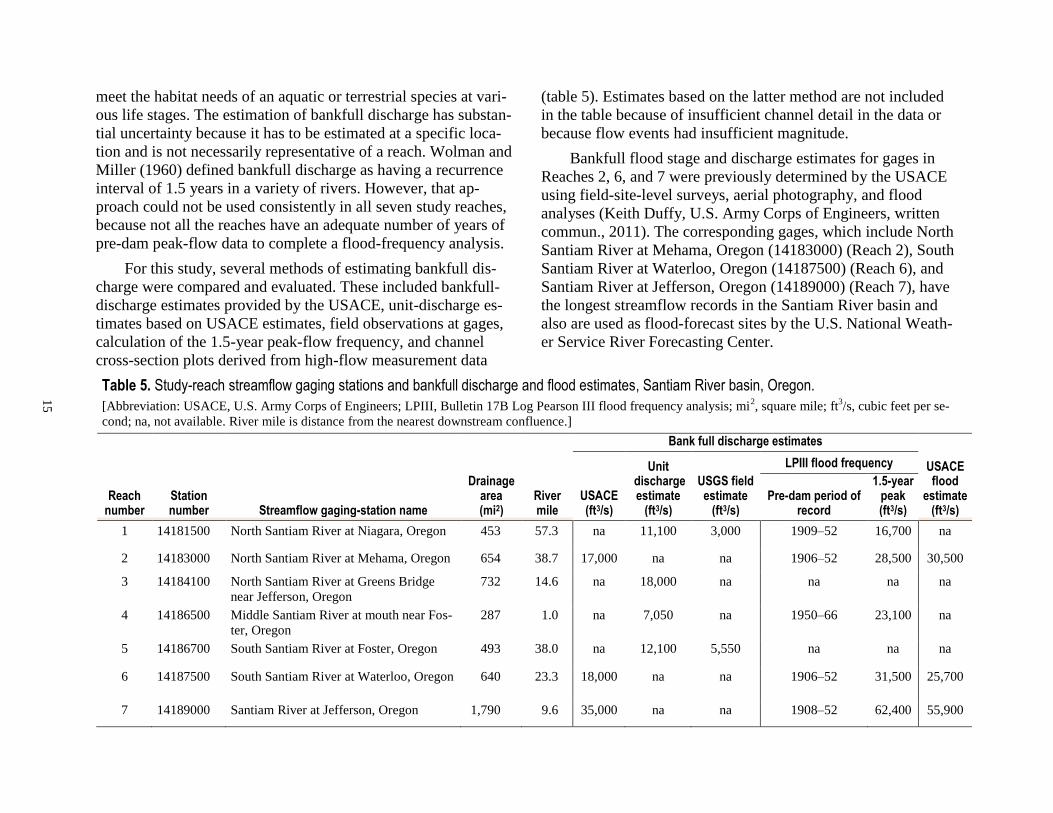
Table 5. Study-reach streamflow gaging stations and bankfull discharge and flood estimates, Santiam River basin, Oregon.
[Abbreviation: USACE, U.S. Army Corps of Engineers; LPIII, Bulletin 17B Log Pearson III flood frequency analysis; mi2, square mile; ft
3/s, cubic feet per se-
cond; na, not available. River mile is distance from the nearest downstream confluence.]
Reach number
Station number Streamflow gaging-station name
Drainage area (mi2)
River mile
Bank full discharge estimates
USACE flood
estimate (ft3/s)
USACE (ft3/s)
Unit discharge estimate
(ft3/s)
USGS field estimate
(ft3/s)
LPIII flood frequency
Pre-dam period of record
1.5-year peak (ft3/s)
1 14181500 North Santiam River at Niagara, Oregon 453 57.3 na 11,100 3,000 1909–52 16,700 na
2 14183000 North Santiam River at Mehama, Oregon 654 38.7 17,000 na na 1906–52 28,500 30,500
3 14184100 North Santiam River at Greens Bridge
near Jefferson, Oregon
732 14.6 na 18,000 na na na na
4 14186500 Middle Santiam River at mouth near Fos-
ter, Oregon
287 1.0 na 7,050 na 1950–66 23,100 na
5 14186700 South Santiam River at Foster, Oregon 493 38.0 na 12,100 5,550 na na na
6 14187500 South Santiam River at Waterloo, Oregon 640 23.3 18,000 na na 1906–52 31,500 25,700
7 14189000 Santiam River at Jefferson, Oregon 1,790 9.6 35,000 na na 1908–52 62,400 55,900
16
For gages in the other study reaches, Reach 1
(14181500), Reach 3 (14184100), Reach 4
(14186500), and Reach 5 (14186700), bankfull
discharge was estimated using an average of the
unit discharges of the three USACE estimates for
Reaches 2, 6, and 7. The unit discharges were
computed by dividing the USACE estimates by
the upstream drainage areas of the gages. The av-
erage of the three unit discharges was 24.6
(ft3/s)/mi
2. This value was multiplied by the up-
stream drainage areas of the Reach 1, Reach 3,
Reach 4, and Reach 5 gages to get bankfull dis-
charge estimates for those reaches.
Field estimates of bankfull stage were made
by the USGS for this study in January 2011 at the
gages for Reach 1, North Santiam River at Niaga-
ra, Oregon (14181500), and for Reach 5, South
Santiam River at Foster, Oregon (14186700).
Stage height was estimated using a hand-held
leveler because time and funding restrictions pre-
cluded measuring stage heights using a transit
and rod. At both gages, readings from outside
staff gages were taken while standing just below
flood-plain level. The height of the observer was
then subtracted from the staff reading. With a
bankfull stage estimate, the bankfull discharge
could be determined using the rating curve. In
comparison to the other two methods of bankfull
discharge estimation, these field observation es-
timates were considerably smaller.
A major limitation with bankfull discharge
estimates made from field observation is that
their representation of the reach is limited to
proximity of the gage. It was not possible to
make a bankfull discharge field estimate at the
Reach 3 gage, South Santiam River at Green’s
Bridge near Jefferson (14184100), because of
visual obstructions in the line of sight. It was also
not possible to make a bankfull discharge field
estimate at the Reach 4 gage, Middle Santiam
River at mouth near Foster (14186500) because it
was active only during the pre-dam period (1950–
66) and is now submerged beneath Foster Reser-
voir. Field estimates were not made at gages for
Reach 2, North Santiam River at Mehama
(14183000), Reach 6, South Santiam River at
Waterloo (14187500), or Reach 7, Santiam River
at Jefferson (14189000) because the USACE had
previously estimated bankfull discharge at those
sites.
Using measured pre-dam annual peak-flow
data, the 1.5-year flood frequency, based on the
Bulletin 17B Log Pearson III method (Interagen-
cy Committee on Water Data, 1982), was com-
puted for the gages in Reaches 1, 2, 6, and 7. It
was not possible to compute a flood frequency
for the Reach 3 and Reach 5 gages, 14184100
and 14186700, respectively, because their records
did not contain peak-flow data during the pre-
dam period. As shown in table 5, the 1.5-year
flood frequencies were higher than the other
USACE bankfull discharge estimates for the
Reach 2 (14183000), Reach 6 (14187500), and
Reach 7 (14189000) gages.
To estimate bankfull discharge from channel
cross-section plots, it is sometimes possible to
create the plots using stage and discharge data
from USGS discharge measurement notes from
gages. With a detailed channel cross section dur-
ing a measured high-flow event, bank and flood-
plain features can sometimes be defined to esti-
mate the bankfull stage. With a bankfull stage
estimate, the bankfull discharge can be deter-
mined from the rating curve. The bankfull stage
estimate could not be estimated at the Reach 1
gage on the North Santiam River at Niagara
(14181500) and the Reach 4 gage at the Middle
Santiam River at the mouth near Foster
(1418650) because the channel cross-section
plots from these high-flow events contained in-
sufficient detail to delineate the streambank and
flood-plain features. Bankfull stage estimates for
Reach 3 gage on the North Santiam River at
Green’s Bridge near Jefferson (14184200) and
the Reach 5 gage on the South Santiam River at
Foster (14186700) were not made because the
magnitude of high-flow measurements was insuf-
ficient.
17
Indicators of Hydrologic Alteration
Developed by The Nature Conservancy for
the Sustainable Rivers Project, the Indicators of
Hydrologic Alteration (IHA) software program
allows users to compute streamflow statistics that
can be used to quantify hydrologic changes re-
sulting from the construction of dams and diver-
sion canals in a river basin (The Nature Conserv-
ancy, 2007). For a given daily mean streamflow
record, the program computes an extreme low-
flow threshold, high-flow threshold, small floods
(2-year events), and large floods (10-year events)
(table 6). The high-flow threshold, which is also
the 25 percent streamflow exceedance, is analo-
gous to a high-flow pulse. The extreme low-flow
category includes the lowest 10 percent of daily
mean streamflows that are less than the high-flow
threshold. The IHA program estimates flood
magnitudes for the 2- and 10-year recurrence in-
tervals using a Weibull distribution.
Streamflow statistics in table 6 were comput-
ed using data provided by the USACE represent-
ing unregulated streamflow conditions for each
reach. A common period (water years 1953–
2009) was used for all seven reaches. Like bank-
full flow estimates, estimates of low flows, pulse
flows, small floods, and large floods are used in
environmental flow studies to define flow pre-
scriptions that will meet the habitat needs of an
aquatic or terrestrial species at various life stages.
Output from the IHA program can be download-
ed at the link in Appendix C.
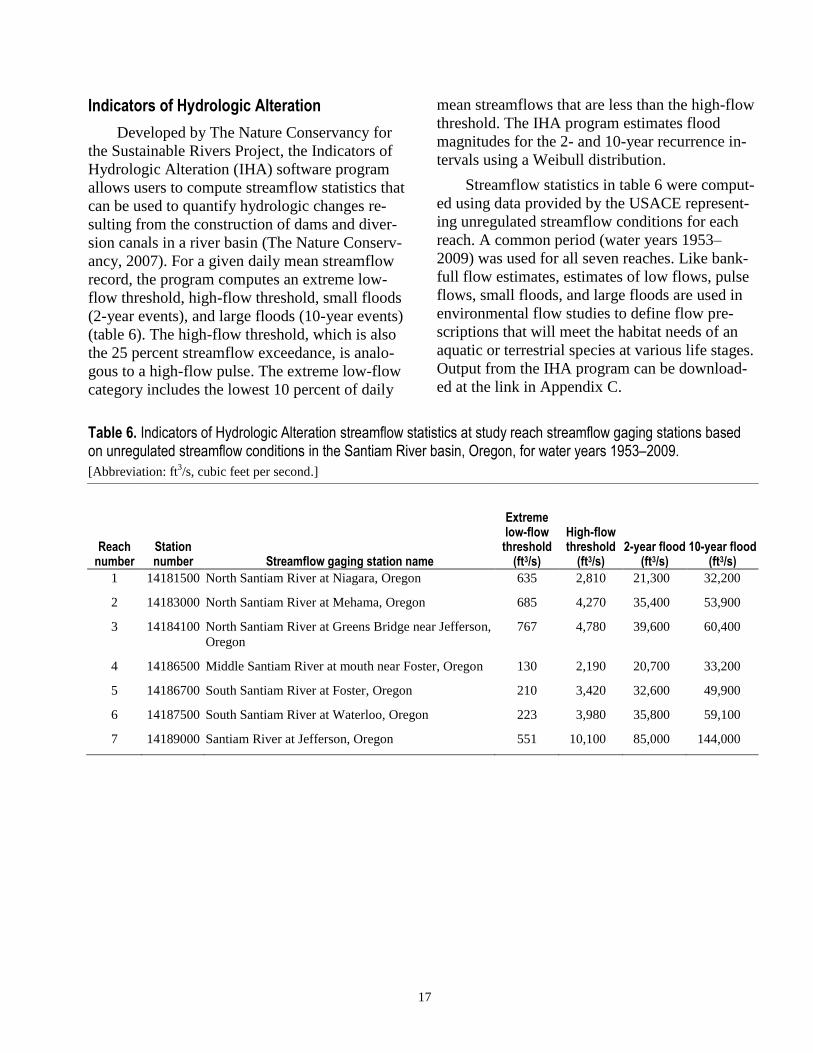
Table 6. Indicators of Hydrologic Alteration streamflow statistics at study reach streamflow gaging stations based on unregulated streamflow conditions in the Santiam River basin, Oregon, for water years 1953–2009.
[Abbreviation: ft3/s, cubic feet per second.]
Reach number
Station number Streamflow gaging station name
Extreme low-flow
threshold (ft3/s)
High-flow threshold
(ft3/s) 2-year flood
(ft3/s) 10-year flood
(ft3/s)
1 14181500 North Santiam River at Niagara, Oregon 635 2,810 21,300 32,200
2 14183000 North Santiam River at Mehama, Oregon 685 4,270 35,400 53,900
3 14184100 North Santiam River at Greens Bridge near Jefferson,
Oregon
767 4,780 39,600 60,400
4 14186500 Middle Santiam River at mouth near Foster, Oregon 130 2,190 20,700 33,200
5 14186700 South Santiam River at Foster, Oregon 210 3,420 32,600 49,900
6 14187500 South Santiam River at Waterloo, Oregon 223 3,980 35,800 59,100
7 14189000 Santiam River at Jefferson, Oregon 551 10,100 85,000 144,000
18
Water-Use Compilation
Major surface-water withdrawals along the
lower reaches of the North Santiam, South San-
tiam, and Santiam Rivers were compiled in order
to quantify natural streamflow conditions. Much
of the water-use data and information was from
the Oregon Water Resources Department website
(http://www.wrd.state.or.us) and Sullivan and
Rounds (2004).
North Santiam River
For Reach 1, from Detroit Dam to the Little
North Santiam River confluence, direct surface-
water withdrawals are minimal. The towns of
Gates (RM 51.2) and Mill City (RM 47.5) with-
draw 0.13 and 0.35 ft3/s on a mean annual basis,
respectively, for municipal water supply. Howev-
er, downstream from the Little North Santiam
River confluence to RM 26 (Reach 2), surface-
water withdrawals are more significant. The city
of Salem withdraws approximately 67 ft3/s on a
mean annual basis from intakes near Geren Island
at RM 31. The city of Stayton and the Santiam
Water Control District withdraw approximately
260 ft3/s on a mean annual basis at RM 29.5. At
RM 27.0, NORPAC Foods withdraws 0.40 ft3/s
from June to October. In Reach 3, from RM 26 to
the South Santiam River confluence, approxi-
mately 40 ft3/s is withdrawn from May to Sep-
tember by the Sidney Irrigation Cooperative at
RM 19.6.
Water-use data for the North Santiam River
was used for extending the measured daily mean
streamflow time series for the Reach 3 gage,
North Santiam River at Green’s Bridge near Jef-
ferson (14184100). The period of operation for
this station was from water years 1964 to 1967
and 2006 to 2011. To create a longer time series
(water years 1951–2011) for this site, daily mean
streamflow data from the upstream gage, North
Santiam River at Mehama (14183000), were pro-
portionally adjusted to the increased drainage ar-
ea of the Reach 3 Green’s Bridge near Jefferson
gage (14184100). These adjusted streamflows
were used to fill in missing periods in the meas-
ured (14184100) streamflow time series. Next, all
major surface-water withdrawals between the two
gages (14183000 and 14184100) were subtracted
from the estimated 14184100 streamflow time
series. Monthly surface-water withdrawals
(2001–2011) for Salem, Stayton Water Control
District, NORPAC Foods, and Sidney Irrigation
Cooperative were compiled and summed. This
amount was offset by effluent from Stayton (3.33
ft3/s on a mean annual basis) at RM 27.5. Month-
ly net water withdrawals were converted to daily
values and then smoothed using a 30-day running
average. Estimated mean annual net water with-
drawal between the two gages (14183000 and
14184100) was 335 ft3/s (water years 2001–
2010).
Prior to its subtraction from the estimated
streamflow time series for Green’s Bridge near
Jefferson (14184100), Salem municipal-use with-
drawals and Stayton effluent return flows were
adjusted for population growth between 1950 and
2011. Using Marion County population for 1950,
1960, 1970, 1980, 1990, 2000, and 2010 from the
U.S. Census, a regression was created to estimate
the county population for each year from 1950
and 2011. Monthly-mean Salem municipal-use
withdrawals and Stayton effluent return flows for
the 2001 to 2010 were adjusted to 1950 using a
ratio of the population in the earlier year to the
population in 2010. However, estimated with-
drawals for irrigation use were not adjusted for
population growth on the assumption that irriga-
tion use has not increased as rapidly as municipal
use has from 1951 to 2011.
South Santiam River
For Reach 4, from Green Peter Dam to Fos-
ter Dam, withdrawals from the Middle Santiam
River (which flows into the South Santiam River)
are minimal or nearly nonexistent. However, in
Reach 5, downstream from Foster Dam to RM
23.4, above the Waterloo gage (14187500), mean
annual water use reported by the City of Sweet
Home was 1.76 ft3/s for water years 2001–2010.
In Reach 6, which extends from the Waterloo
19
gage (14187500) to the North Santiam River con-
fluence, water is diverted from the South Santiam
River through the Lebanon-Santiam Canal at RM
20.9, upstream of Lebanon. For water years
1992–2011, mean annual streamflow was 89 ft3/s
as measured at the USGS gage (14187600) on the
canal and near the canal diversion point on the
river. Since 2007, withdrawals from the river to
the canal have been as high as 200 ft3/s during the
summer. The canal water is used for irrigation,
small project hydropower generation, and munic-
ipal water supply for Lebanon and Albany. Leba-
non withdrew 3.01 ft3/s (average for water years
2001–2010) from the canal (Oregon Water Re-
sources Department, 2012). Previously, the canal
diverted water from the South Santiam River at a
location slightly downstream from Lebanon at
RM 17.0 and was known as the “Albany-Santiam
Canal.” Mean annual streamflow in the canal dur-
ing this earlier period was 209 ft3/s (water years
1926–1957) as measured at the inactive USGS
gage (14188000) on the canal.
In addition to the Sweet Home municipal
water supply and the Lebanon-Santiam Canal,
other substantial diversions in the South Santiam
River are for irrigation. From RM 21.1 to the
North Santiam River confluence, mean direct sur-
face-water withdrawals for irrigation are 16.9
ft3/s annually, on the basis of Oregon Water Re-
sources Department water-availability data
(Cooper, 2002; Oregon Water Resources De-
partment, 2012).
Main-Stem Santiam River
Surface-water withdrawals in Reach 7, from
the confluence of the North and South Santiam
Rivers to the Willamette River confluence, in-
clude the Jefferson municipal water supply and
irrigation for agricultural. Mean annual water use
reported by the City of Jefferson was 0.51 ft3/s
for water years 2001–2010. Surface-water with-
drawals for irrigation from the Santiam River in
Reach 7 are 5.02 ft3/s on a mean annual basis
based on Oregon Water Resources Department
water-availability data (Cooper, 2002).
Pre- and Post-Dam Comparisons
Statistical and graphical comparisons were
used to assess the effects of dams on streamflows.
These included comparisons of annual peak and
daily mean streamflow data measured before and
after the dams were constructed. Comparisons
were also made of post-dam period measured dai-
ly mean streamflows with the post-dam period
computed unregulated daily mean streamflows
provided by the USACE.
Comparisons of pre- and post-dam period
measured streamflow data were possible in four
of the reaches, which had lengthy continuous
streamflow records that began in the 1920s or
1930s. These included North Santiam River at
Niagara (14181500), North Santiam River at Me-
hama (14183000), South Santiam River at Water-
loo (14187500), and Santiam River at Jefferson
(14189000). In using this method of comparison,
it was necessary to determine whether climate
was a contributing factor to changes in stream-
flow by evaluating monthly precipitation data at
Salem and Waterloo from the pre- and post-dam
periods. On the basis of a Wilcox rank-sum test,
there was no significant difference in monthly
precipitation between the two periods. The p-
values for all the months, with the exception of
February in Salem, were greater than 0.5
(table 7).
20
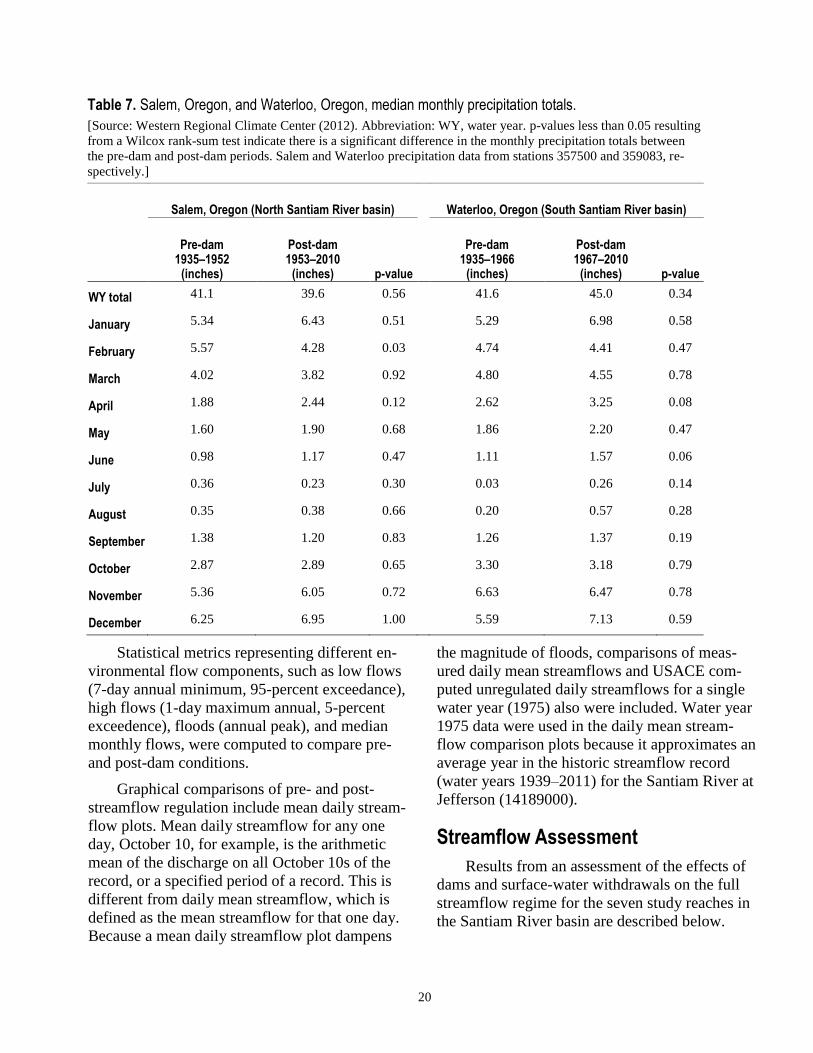
Table 7. Salem, Oregon, and Waterloo, Oregon, median monthly precipitation totals.
[Source: Western Regional Climate Center (2012). Abbreviation: WY, water year. p-values less than 0.05 resulting
from a Wilcox rank-sum test indicate there is a significant difference in the monthly precipitation totals between
the pre-dam and post-dam periods. Salem and Waterloo precipitation data from stations 357500 and 359083, re-
spectively.]
Salem, Oregon (North Santiam River basin)
Waterloo, Oregon (South Santiam River basin)
Pre-dam 1935–1952
(inches)
Post-dam 1953–2010
(inches) p-value
Pre-dam 1935–1966
(inches)
Post-dam 1967–2010
(inches) p-value
WY total 41.1 39.6 0.56 41.6 45.0 0.34
January 5.34 6.43 0.51 5.29 6.98 0.58
February 5.57 4.28 0.03 4.74 4.41 0.47
March 4.02 3.82 0.92 4.80 4.55 0.78
April 1.88 2.44 0.12 2.62 3.25 0.08
May 1.60 1.90 0.68 1.86 2.20 0.47
June 0.98 1.17 0.47 1.11 1.57 0.06
July 0.36 0.23 0.30 0.03 0.26 0.14
August 0.35 0.38 0.66 0.20 0.57 0.28
September 1.38 1.20 0.83 1.26 1.37 0.19
October 2.87 2.89 0.65 3.30 3.18 0.79
November 5.36 6.05 0.72 6.63 6.47 0.78
December 6.25 6.95 1.00 5.59 7.13 0.59
Statistical metrics representing different en-
vironmental flow components, such as low flows
(7-day annual minimum, 95-percent exceedance),
high flows (1-day maximum annual, 5-percent
exceedence), floods (annual peak), and median
monthly flows, were computed to compare pre-
and post-dam conditions.
Graphical comparisons of pre- and post-
streamflow regulation include mean daily stream-
flow plots. Mean daily streamflow for any one
day, October 10, for example, is the arithmetic
mean of the discharge on all October 10s of the
record, or a specified period of a record. This is
different from daily mean streamflow, which is
defined as the mean streamflow for that one day.
Because a mean daily streamflow plot dampens
the magnitude of floods, comparisons of meas-
ured daily mean streamflows and USACE com-
puted unregulated daily streamflows for a single
water year (1975) also were included. Water year
1975 data were used in the daily mean stream-
flow comparison plots because it approximates an
average year in the historic streamflow record
(water years 1939–2011) for the Santiam River at
Jefferson (14189000).
Streamflow Assessment
Results from an assessment of the effects of
dams and surface-water withdrawals on the full
streamflow regime for the seven study reaches in
the Santiam River basin are described below.
21
North Santiam River
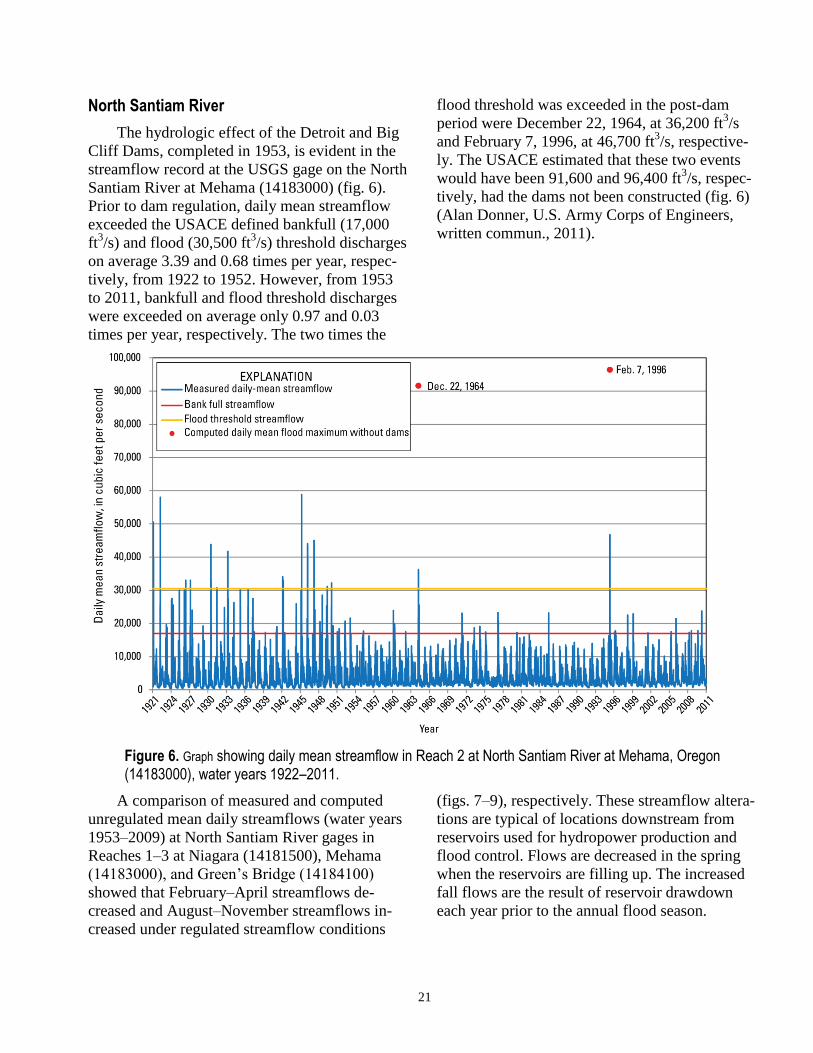
The hydrologic effect of the Detroit and Big
Cliff Dams, completed in 1953, is evident in the
streamflow record at the USGS gage on the North
Santiam River at Mehama (14183000) (fig. 6).
Prior to dam regulation, daily mean streamflow
exceeded the USACE defined bankfull (17,000
ft3/s) and flood (30,500 ft
3/s) threshold discharges
on average 3.39 and 0.68 times per year, respec-
tively, from 1922 to 1952. However, from 1953
to 2011, bankfull and flood threshold discharges
were exceeded on average only 0.97 and 0.03
times per year, respectively. The two times the
flood threshold was exceeded in the post-dam
period were December 22, 1964, at 36,200 ft3/s
and February 7, 1996, at 46,700 ft3/s, respective-
ly. The USACE estimated that these two events
would have been 91,600 and 96,400 ft3/s, respec-
tively, had the dams not been constructed (fig. 6)
(Alan Donner, U.S. Army Corps of Engineers,
written commun., 2011).
Figure 6. Graph showing daily mean streamflow in Reach 2 at North Santiam River at Mehama, Oregon (14183000), water years 1922–2011.
A comparison of measured and computed
unregulated mean daily streamflows (water years
1953–2009) at North Santiam River gages in
Reaches 1–3 at Niagara (14181500), Mehama
(14183000), and Green’s Bridge (14184100)
showed that February–April streamflows de-
creased and August–November streamflows in-
creased under regulated streamflow conditions
(figs. 7–9), respectively. These streamflow altera-
tions are typical of locations downstream from
reservoirs used for hydropower production and
flood control. Flows are decreased in the spring
when the reservoirs are filling up. The increased
fall flows are the result of reservoir drawdown
each year prior to the annual flood season.

22
Figure 7. Graph showing mean daily streamflow in Reach 1 at North Santiam River at Niagara, Oregon (14181500), water years 1953–2009.
Figure 8. Graph showing mean daily streamflow in Reach 2 at North Santiam River at Mehama, Oregon (14183000), water years 1953–2009.
23
Figure 9. Graph showing mean daily streamflow in Reach 3 at North Santiam River at Green’s Bridge near Jefferson, Oregon (14184100), water years 1953–2009.
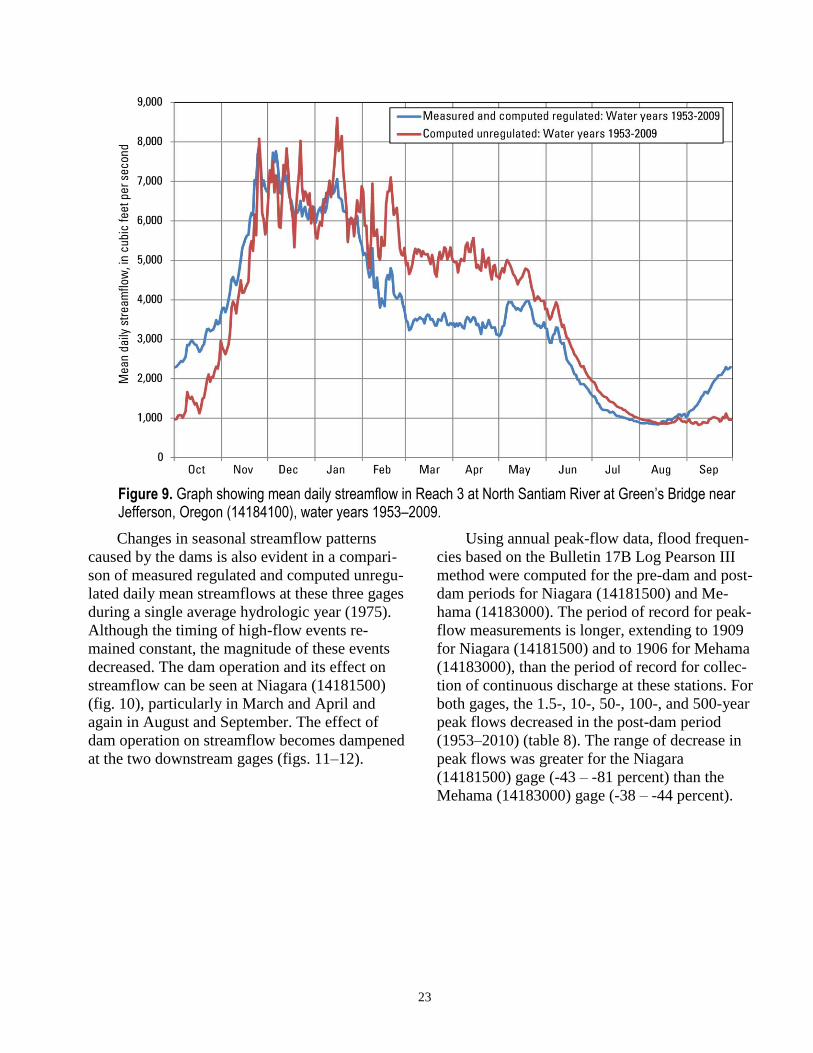
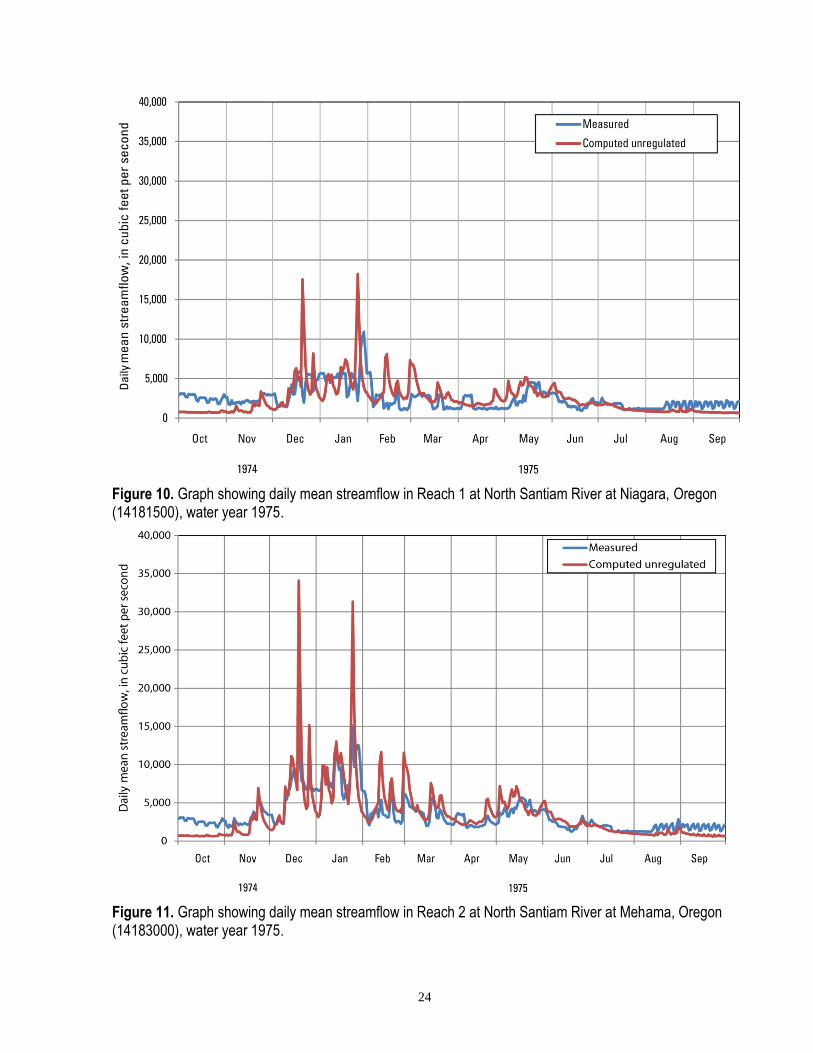
Changes in seasonal streamflow patterns
caused by the dams is also evident in a compari-
son of measured regulated and computed unregu-
lated daily mean streamflows at these three gages
during a single average hydrologic year (1975).
Although the timing of high-flow events re-
mained constant, the magnitude of these events
decreased. The dam operation and its effect on
streamflow can be seen at Niagara (14181500)
(fig. 10), particularly in March and April and
again in August and September. The effect of
dam operation on streamflow becomes dampened
at the two downstream gages (figs. 11–12).
Using annual peak-flow data, flood frequen-
cies based on the Bulletin 17B Log Pearson III
method were computed for the pre-dam and post-
dam periods for Niagara (14181500) and Me-
hama (14183000). The period of record for peak-
flow measurements is longer, extending to 1909
for Niagara (14181500) and to 1906 for Mehama
(14183000), than the period of record for collec-
tion of continuous discharge at these stations. For
both gages, the 1.5-, 10-, 50-, 100-, and 500-year
peak flows decreased in the post-dam period
(1953–2010) (table 8). The range of decrease in
peak flows was greater for the Niagara
(14181500) gage (-43 – -81 percent) than the
Mehama (14183000) gage (-38 – -44 percent).
24
Figure 10. Graph showing daily mean streamflow in Reach 1 at North Santiam River at Niagara, Oregon (14181500), water year 1975.
Figure 11. Graph showing daily mean streamflow in Reach 2 at North Santiam River at Mehama, Oregon (14183000), water year 1975.

25
Figure 12. Graph showing daily mean streamflow in Reach 3 at North Santiam River at Green’s Bridge near Jefferson, Oregon (14184100), water year 1975.

26
Table 8. Pre- and post-dam flood statistics for selected Santiam River basin, Oregon, streamflow gaging stations, computed from annual peak streamflow data based on the Bulletin 17B Log Pearson III method.
[Abbreviations: POR, period of record in water years; ft3/s, cubic feet per second.]
Station number
Streamflow gaging-station name and study reach number
Recurrence interval (years)
Pre-dam period Post-dam period
Percent change POR
Streamflow (ft3/s)
POR Streamflow
(ft3/s)
14181500 North Santiam River at
Niagara, Oregon, Reach 1
1.5 1909–
1952
16,700 1953–
2010
9,540 -43
10 44,700 15,200 -66
50 69,600 18,000 -74
100 81,300 19,000 -77
500 111,000 21,100 -81
14183000 North Santiam River at
Mehama, Oregon, Reach 2
1.5 1906–
1952
28,500 1953–
2010
17,800 -38
10 58,300 32,700 -44
50 79,800 45,500 -43
100 89,000 51,500 -42
500 111,000 67,200 -39
14187500 South Santiam River at
Waterloo, Oregon, Reach 6
1.5 1906–
1966
31,500 1967–
2010
14,200 -55
10 65,600 20,900 -68
50 91,300 24,800 -73
100 103,000 26,300 -74
500 130,000 29,700 -77
14189000 Santiam River at Jefferson,
Oregon, Reach 7
1.5 1908–
1952
62,400 1953–
2010
44,200 -29
10 152,000 102,000 -33
50 231,000 157,000 -32
100 268,000 184,000 -31
500 364,000 259,000 -29
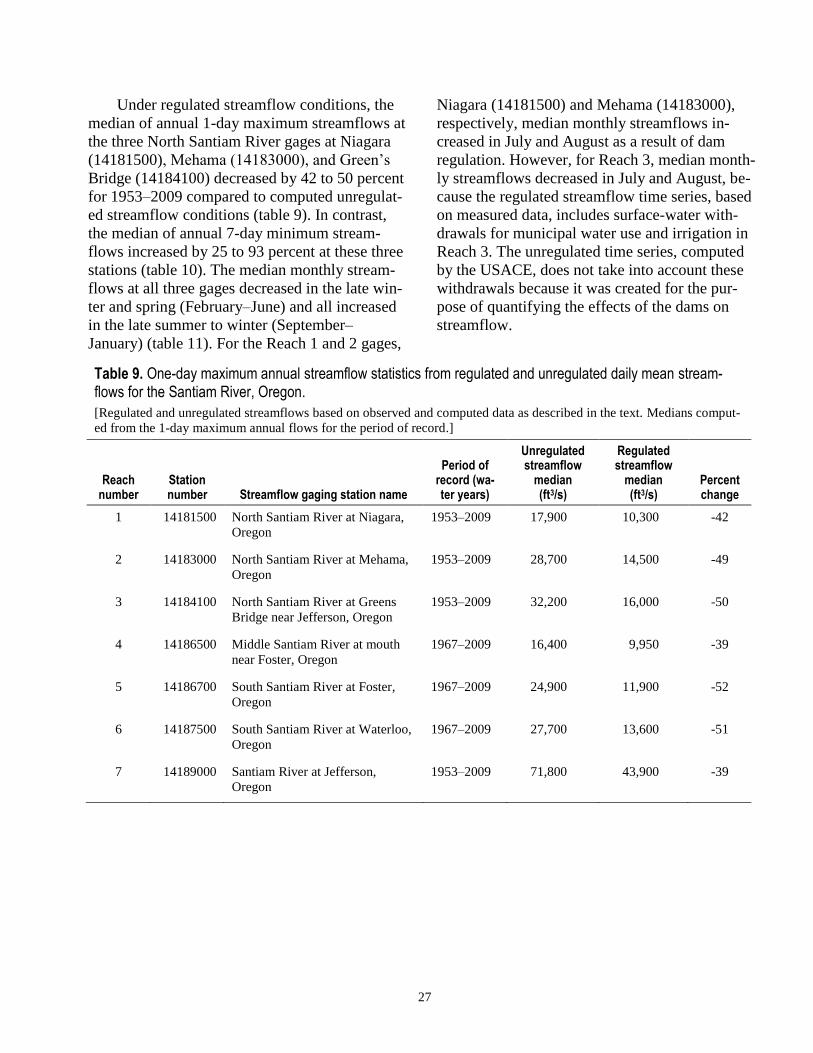
27
Under regulated streamflow conditions, the
median of annual 1-day maximum streamflows at
the three North Santiam River gages at Niagara
(14181500), Mehama (14183000), and Green’s
Bridge (14184100) decreased by 42 to 50 percent
for 1953–2009 compared to computed unregulat-
ed streamflow conditions (table 9). In contrast,
the median of annual 7-day minimum stream-
flows increased by 25 to 93 percent at these three
stations (table 10). The median monthly stream-
flows at all three gages decreased in the late win-
ter and spring (February–June) and all increased
in the late summer to winter (September–
January) (table 11). For the Reach 1 and 2 gages,
Niagara (14181500) and Mehama (14183000),
respectively, median monthly streamflows in-
creased in July and August as a result of dam
regulation. However, for Reach 3, median month-
ly streamflows decreased in July and August, be-
cause the regulated streamflow time series, based
on measured data, includes surface-water with-
drawals for municipal water use and irrigation in
Reach 3. The unregulated time series, computed
by the USACE, does not take into account these
withdrawals because it was created for the pur-
pose of quantifying the effects of the dams on
streamflow.
Table 9. One-day maximum annual streamflow statistics from regulated and unregulated daily mean stream-flows for the Santiam River, Oregon.
[Regulated and unregulated streamflows based on observed and computed data as described in the text. Medians comput-
ed from the 1-day maximum annual flows for the period of record.]
Reach number
Station number Streamflow gaging station name
Period of record (wa-ter years)
Unregulated streamflow
median (ft3/s)
Regulated streamflow
median (ft3/s)
Percent change
1 14181500 North Santiam River at Niagara,
Oregon
1953–2009 17,900 10,300 -42
2 14183000 North Santiam River at Mehama,
Oregon
1953–2009 28,700 14,500 -49
3 14184100 North Santiam River at Greens
Bridge near Jefferson, Oregon
1953–2009 32,200 16,000 -50
4 14186500 Middle Santiam River at mouth
near Foster, Oregon
1967–2009 16,400 9,950 -39
5 14186700 South Santiam River at Foster,
Oregon
1967–2009 24,900 11,900 -52
6 14187500 South Santiam River at Waterloo,
Oregon
1967–2009 27,700 13,600 -51
7 14189000 Santiam River at Jefferson,
Oregon
1953–2009 71,800 43,900 -39

28
Table 10. Seven-day minimum annual streamflow statistics from regulated and unregulated daily mean stream-flows for the Santiam River, Oregon.
[Regulated and unregulated streamflows based on observed and computed data as described in the text. Medians were
computed from the 7-day minimum annual flows for the period of records.]
Reach number
Station number Streamflow gaging station name
Period of record
(water years)
Unregulated streamflow
median (ft3/s)
Regulated streamflow
median (ft3/s)
Percent change
1 14181500 North Santiam River at Niagara,
Oregon
1953–2009 579 928 60
2 14183000 North Santiam River at Mehama,
Oregon
1953–2009 554 1,070 93
3 14184100 North Santiam River at Greens
Bridge near Jefferson, Oregon
1953–2009 620 773 25
4 14186500 Middle Santiam River at mouth
near Foster, Oregon
1967–2009 85.6 52.6 -39
5 14186700 South Santiam River at Foster,
Oregon
1967–2009 155 636 310
6 14187500 South Santiam River at Waterloo,
Oregon
1967–2009 145 631 335
7 14189000 Santiam River at Jefferson, Oregon 1953–2009 359 1,210 237
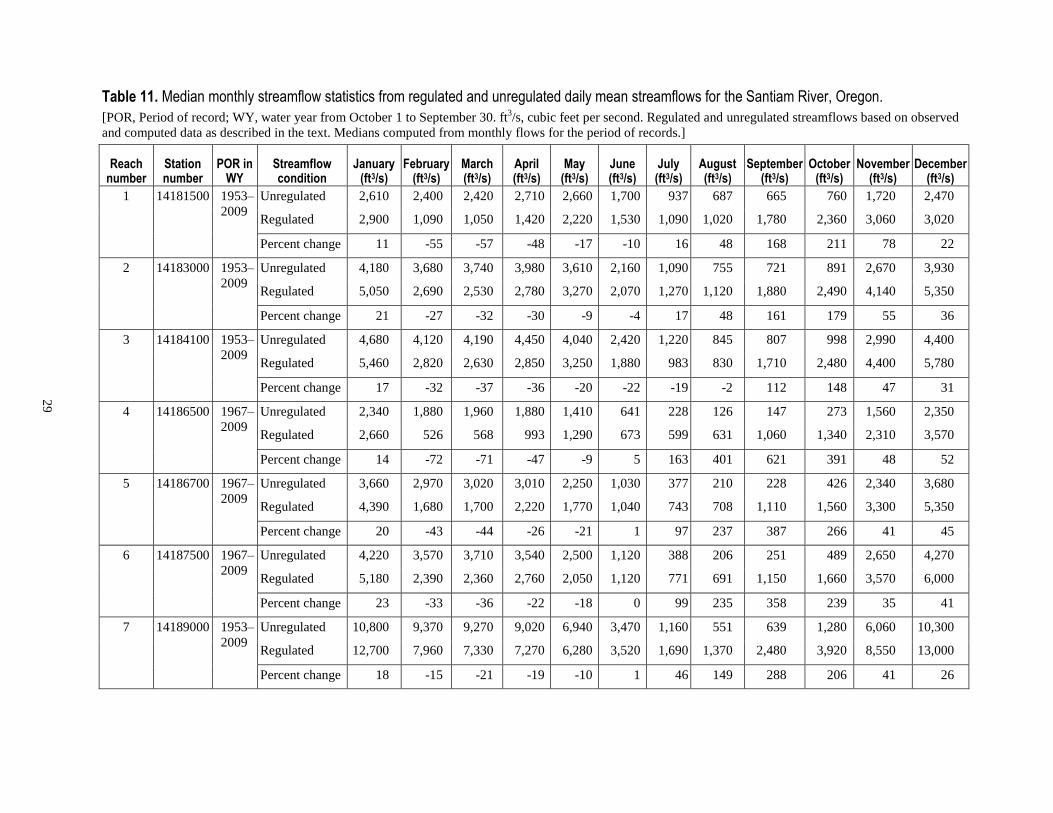
29
Table 11. Median monthly streamflow statistics from regulated and unregulated daily mean streamflows for the Santiam River, Oregon.
[POR, Period of record; WY, water year from October 1 to September 30. ft3/s, cubic feet per second. Regulated and unregulated streamflows based on observed
and computed data as described in the text. Medians computed from monthly flows for the period of records.]
Reach number
Station number
POR in WY
Streamflow condition
January (ft3/s)
February (ft3/s)
March (ft3/s)
April (ft3/s)
May (ft3/s)
June (ft3/s)
July (ft3/s)
August (ft3/s)
September (ft3/s)
October (ft3/s)
November (ft3/s)
December (ft3/s)
1 14181500 1953–
2009
Unregulated 2,610 2,400 2,420 2,710 2,660 1,700 937 687 665 760 1,720 2,470
Regulated 2,900 1,090 1,050 1,420 2,220 1,530 1,090 1,020 1,780 2,360 3,060 3,020
Percent change 11 -55 -57 -48 -17 -10 16 48 168 211 78 22
2 14183000 1953–
2009
Unregulated 4,180 3,680 3,740 3,980 3,610 2,160 1,090 755 721 891 2,670 3,930
Regulated 5,050 2,690 2,530 2,780 3,270 2,070 1,270 1,120 1,880 2,490 4,140 5,350
Percent change 21 -27 -32 -30 -9 -4 17 48 161 179 55 36
3 14184100 1953–
2009
Unregulated 4,680 4,120 4,190 4,450 4,040 2,420 1,220 845 807 998 2,990 4,400
Regulated 5,460 2,820 2,630 2,850 3,250 1,880 983 830 1,710 2,480 4,400 5,780
Percent change 17 -32 -37 -36 -20 -22 -19 -2 112 148 47 31
4 14186500 1967–
2009
Unregulated 2,340 1,880 1,960 1,880 1,410 641 228 126 147 273 1,560 2,350
Regulated 2,660 526 568 993 1,290 673 599 631 1,060 1,340 2,310 3,570
Percent change 14 -72 -71 -47 -9 5 163 401 621 391 48 52
5 14186700 1967–
2009
Unregulated 3,660 2,970 3,020 3,010 2,250 1,030 377 210 228 426 2,340 3,680
Regulated 4,390 1,680 1,700 2,220 1,770 1,040 743 708 1,110 1,560 3,300 5,350
Percent change 20 -43 -44 -26 -21 1 97 237 387 266 41 45
6 14187500 1967–
2009
Unregulated 4,220 3,570 3,710 3,540 2,500 1,120 388 206 251 489 2,650 4,270
Regulated 5,180 2,390 2,360 2,760 2,050 1,120 771 691 1,150 1,660 3,570 6,000
Percent change 23 -33 -36 -22 -18 0 99 235 358 239 35 41
7 14189000 1953–
2009
Unregulated 10,800 9,370 9,270 9,020 6,940 3,470 1,160 551 639 1,280 6,060 10,300
Regulated 12,700 7,960 7,330 7,270 6,280 3,520 1,690 1,370 2,480 3,920 8,550 13,000
Percent change 18 -15 -21 -19 -10 1 46 149 288 206 41 26
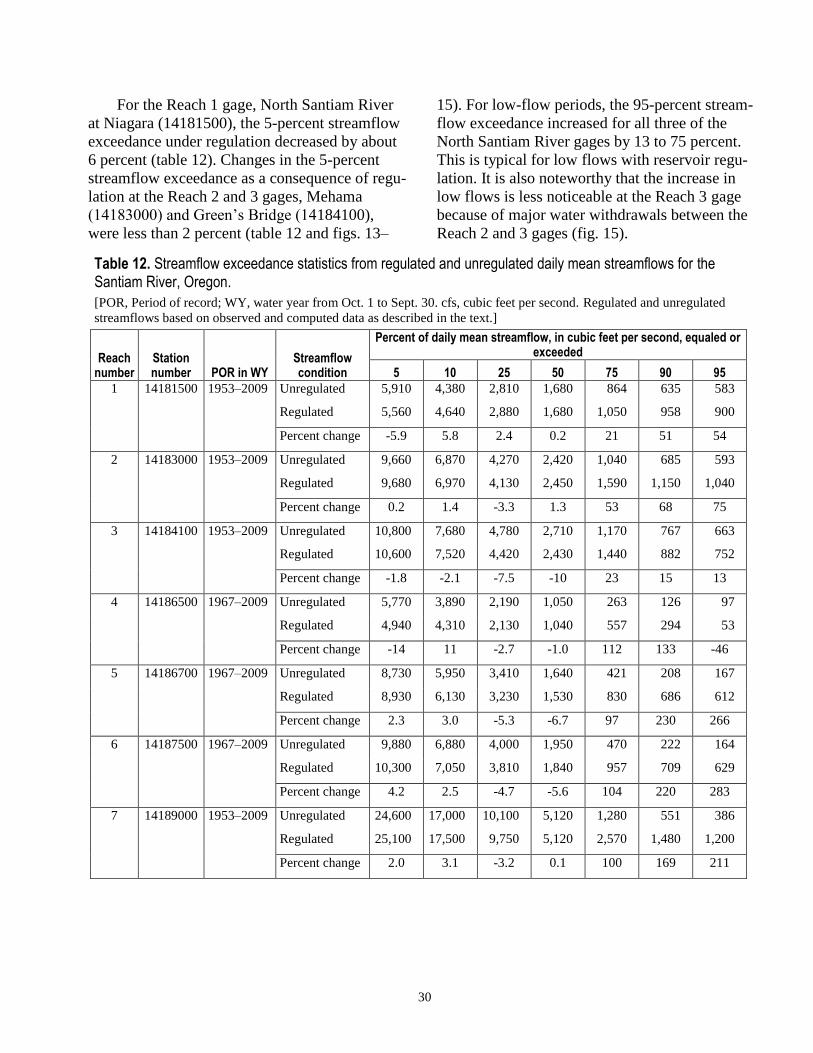
30
For the Reach 1 gage, North Santiam River
at Niagara (14181500), the 5-percent streamflow
exceedance under regulation decreased by about
6 percent (table 12). Changes in the 5-percent
streamflow exceedance as a consequence of regu-
lation at the Reach 2 and 3 gages, Mehama
(14183000) and Green’s Bridge (14184100),
were less than 2 percent (table 12 and figs. 13–
15). For low-flow periods, the 95-percent stream-
flow exceedance increased for all three of the
North Santiam River gages by 13 to 75 percent.
This is typical for low flows with reservoir regu-
lation. It is also noteworthy that the increase in
low flows is less noticeable at the Reach 3 gage
because of major water withdrawals between the
Reach 2 and 3 gages (fig. 15).
Table 12. Streamflow exceedance statistics from regulated and unregulated daily mean streamflows for the Santiam River, Oregon.
[POR, Period of record; WY, water year from Oct. 1 to Sept. 30. cfs, cubic feet per second. Regulated and unregulated
streamflows based on observed and computed data as described in the text.]
Reach number
Station number POR in WY
Streamflow condition
Percent of daily mean streamflow, in cubic feet per second, equaled or exceeded
5 10 25 50 75 90 95
1 14181500 1953–2009 Unregulated 5,910 4,380 2,810 1,680 864 635 583
Regulated 5,560 4,640 2,880 1,680 1,050 958 900
Percent change -5.9 5.8 2.4 0.2 21 51 54
2 14183000 1953–2009 Unregulated 9,660 6,870 4,270 2,420 1,040 685 593
Regulated 9,680 6,970 4,130 2,450 1,590 1,150 1,040
Percent change 0.2 1.4 -3.3 1.3 53 68 75
3 14184100 1953–2009 Unregulated 10,800 7,680 4,780 2,710 1,170 767 663
Regulated 10,600 7,520 4,420 2,430 1,440 882 752
Percent change -1.8 -2.1 -7.5 -10 23 15 13
4 14186500 1967–2009 Unregulated 5,770 3,890 2,190 1,050 263 126 97
Regulated 4,940 4,310 2,130 1,040 557 294 53
Percent change -14 11 -2.7 -1.0 112 133 -46
5 14186700 1967–2009 Unregulated 8,730 5,950 3,410 1,640 421 208 167
Regulated 8,930 6,130 3,230 1,530 830 686 612
Percent change 2.3 3.0 -5.3 -6.7 97 230 266
6 14187500 1967–2009 Unregulated 9,880 6,880 4,000 1,950 470 222 164
Regulated 10,300 7,050 3,810 1,840 957 709 629
Percent change 4.2 2.5 -4.7 -5.6 104 220 283
7 14189000 1953–2009 Unregulated 24,600 17,000 10,100 5,120 1,280 551 386
Regulated 25,100 17,500 9,750 5,120 2,570 1,480 1,200
Percent change 2.0 3.1 -3.2 0.1 100 169 211
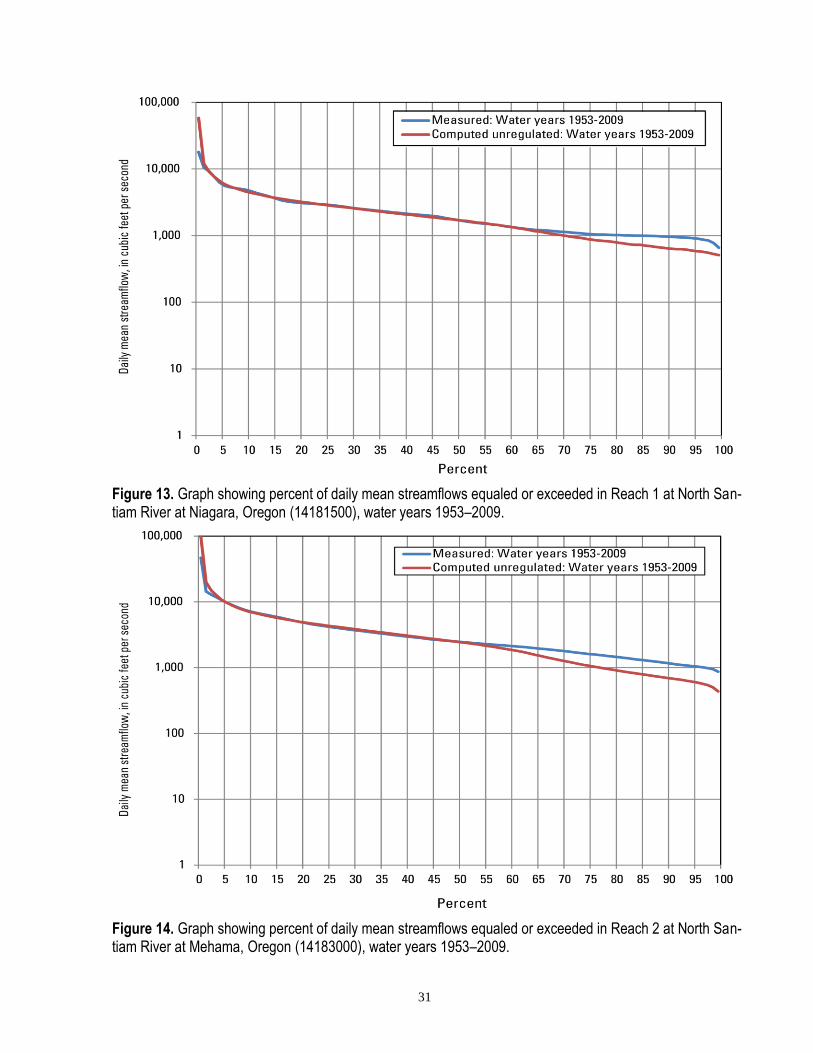
31
Figure 13. Graph showing percent of daily mean streamflows equaled or exceeded in Reach 1 at North San-tiam River at Niagara, Oregon (14181500), water years 1953–2009.
Figure 14. Graph showing percent of daily mean streamflows equaled or exceeded in Reach 2 at North San-tiam River at Mehama, Oregon (14183000), water years 1953–2009.
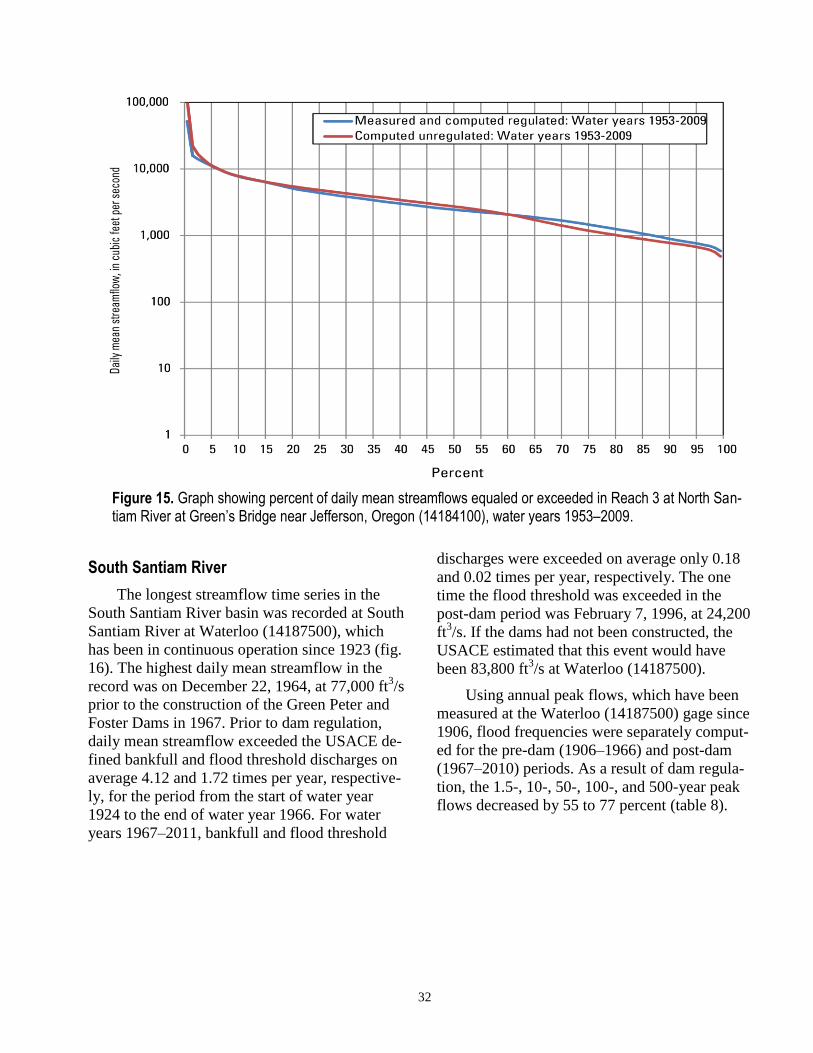
32
Figure 15. Graph showing percent of daily mean streamflows equaled or exceeded in Reach 3 at North San-tiam River at Green’s Bridge near Jefferson, Oregon (14184100), water years 1953–2009.
South Santiam River
The longest streamflow time series in the
South Santiam River basin was recorded at South
Santiam River at Waterloo (14187500), which
has been in continuous operation since 1923 (fig.
16). The highest daily mean streamflow in the
record was on December 22, 1964, at 77,000 ft3/s
prior to the construction of the Green Peter and
Foster Dams in 1967. Prior to dam regulation,
daily mean streamflow exceeded the USACE de-
fined bankfull and flood threshold discharges on
average 4.12 and 1.72 times per year, respective-
ly, for the period from the start of water year
1924 to the end of water year 1966. For water
years 1967–2011, bankfull and flood threshold
discharges were exceeded on average only 0.18
and 0.02 times per year, respectively. The one
time the flood threshold was exceeded in the
post-dam period was February 7, 1996, at 24,200
ft3/s. If the dams had not been constructed, the
USACE estimated that this event would have
been 83,800 ft3/s at Waterloo (14187500).
Using annual peak flows, which have been
measured at the Waterloo (14187500) gage since
1906, flood frequencies were separately comput-
ed for the pre-dam (1906–1966) and post-dam
(1967–2010) periods. As a result of dam regula-
tion, the 1.5-, 10-, 50-, 100-, and 500-year peak
flows decreased by 55 to 77 percent (table 8).

33
Figure 16. Graph showing daily mean streamflow in Reach 6 at South Santiam River at Waterloo, Oregon (14187500), water years 1924–2011.
Following a similar pattern as the North San-
tiam gages, a comparison of measured and com-
puted unregulated mean daily streamflows (water
years 1967–2009) at the three South Santiam
River basin gages (Reaches 4–6) showed that
February–May streamflows decreased and July–
November streamflows increased under regulated
streamflow conditions (figs. 17–19). The Middle
Santiam River at mouth near Foster (14186500)
gage (Reach 4) shows the effects of regulation
from Green Peter Dam. The Reach 5 gage is on
the South Santiam River at Foster (14186700)
just below Foster Dam. Farther downstream, in
Reach 6, the streamflow record for Waterloo
(14187500) at RM 23.3 shows the effects of Fos-
ter Dam streamflow regulation combined with
unregulated inflow from Wiley, Ames, and
McDowell Creeks.

34
Figure 17. Graph showing mean daily streamflow in Reach 4 at Middle Santiam River at mouth near Foster, Ore-gon (14186500), water years 1967–2009.
Figure 18. Graph showing mean daily streamflow in Reach 5 at South Santiam River at Foster, Oregon (14186700), water years 1967–2009.
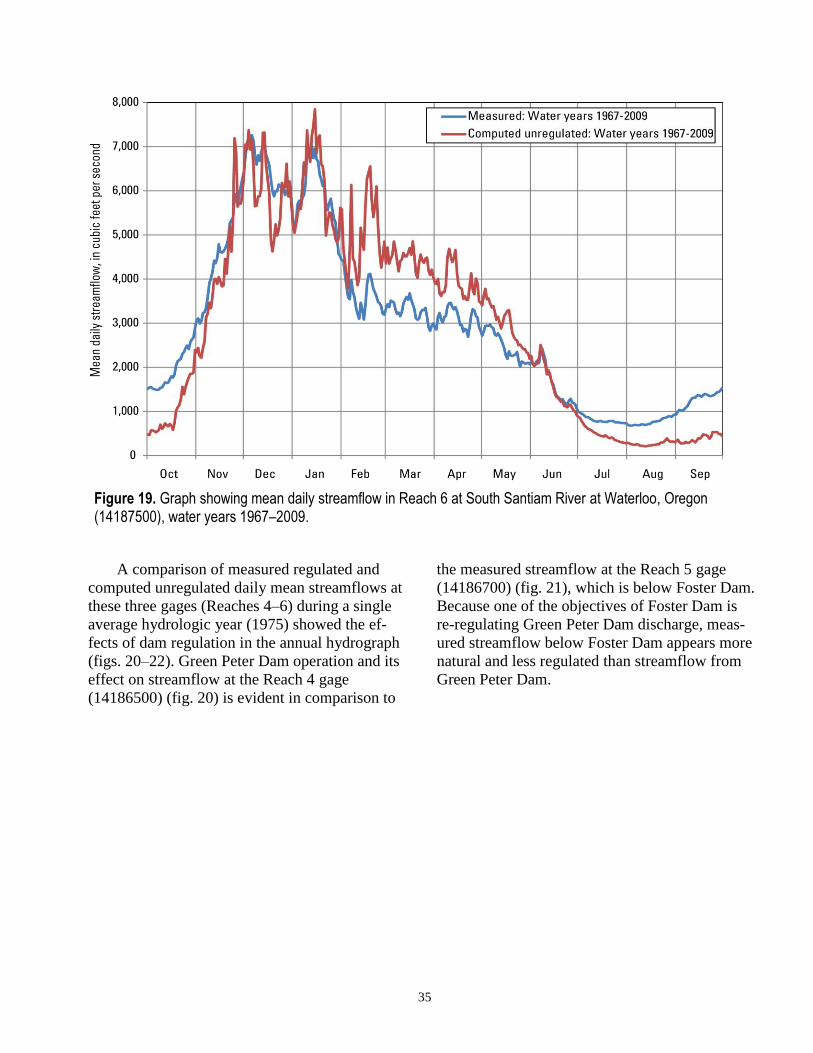
35
Figure 19. Graph showing mean daily streamflow in Reach 6 at South Santiam River at Waterloo, Oregon (14187500), water years 1967–2009.
A comparison of measured regulated and
computed unregulated daily mean streamflows at
these three gages (Reaches 4–6) during a single
average hydrologic year (1975) showed the ef-
fects of dam regulation in the annual hydrograph
(figs. 20–22). Green Peter Dam operation and its
effect on streamflow at the Reach 4 gage
(14186500) (fig. 20) is evident in comparison to
the measured streamflow at the Reach 5 gage
(14186700) (fig. 21), which is below Foster Dam.
Because one of the objectives of Foster Dam is
re-regulating Green Peter Dam discharge, meas-
ured streamflow below Foster Dam appears more
natural and less regulated than streamflow from
Green Peter Dam.
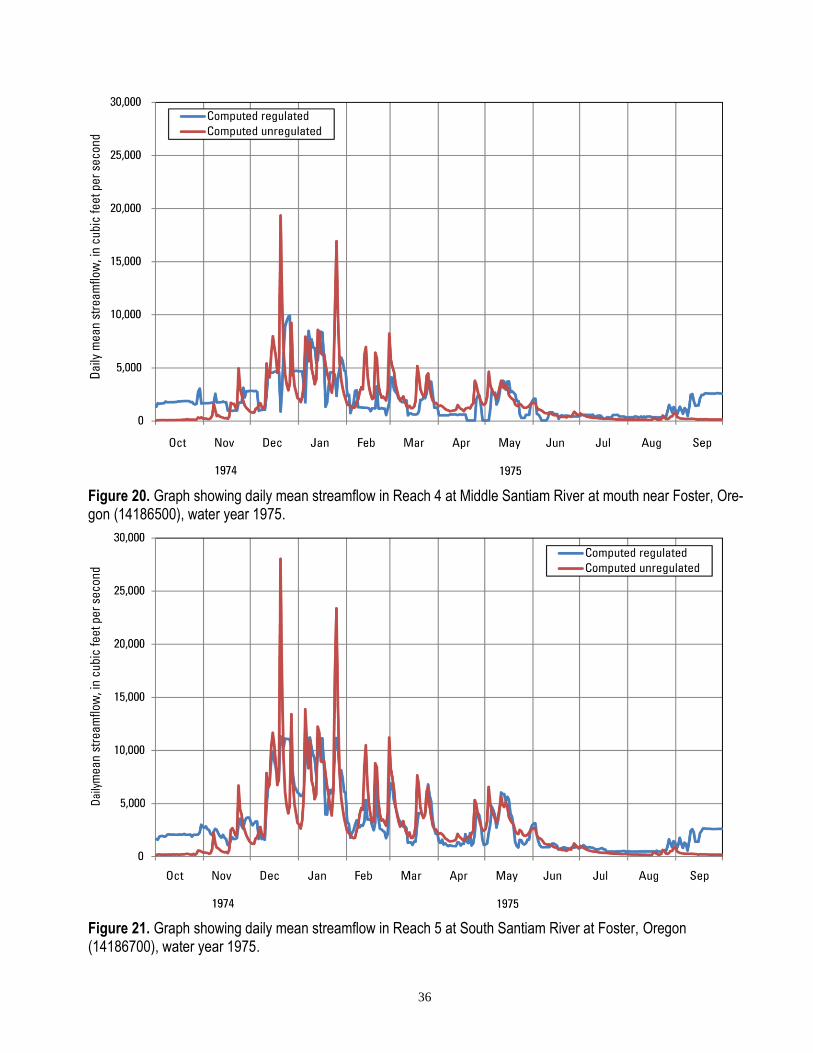
36
Figure 20. Graph showing daily mean streamflow in Reach 4 at Middle Santiam River at mouth near Foster, Ore-gon (14186500), water year 1975.
Figure 21. Graph showing daily mean streamflow in Reach 5 at South Santiam River at Foster, Oregon (14186700), water year 1975.

37
Figure 22. Graph showing daily mean streamflow in Reach 6 at South Santiam River at Waterloo, Oregon (14187500), water year 1975.
Under regulated streamflow conditions for 1967–2009, the median annual 1-day maximum streamflow at the three gages (Middle Santiam River at mouth near Foster [14186500], South Santiam River at Foster [14186700], and South Santiam River at Waterloo [14187500]) de-creased by 39 to 52 percent in comparison to computed unregulated streamflow conditions (ta-ble 9). In contrast, the median of annual 7-day minimum streamflows increased by 310 to 335 percent at Foster (14186700) and Waterloo (14187500) gages, respectively (table 10). Both those gages are downstream from Foster Dam. However, for the gage below Green Peter Dam (Middle Santiam River at mouth near Foster [14186500]), the median annual 7-day minimum streamflow decreased by 39 percent. Summer low flows commonly increased as a result of dam regulation. The decrease in low flows for the Reach 4 gage below Green Peter Dam may have been because of an error in the regulated stream-flow time series. The 1967–2009 regulated streamflow time series for this station was entire-ly computed because the gage was discontinued in 1966. The time series, provided by USACE,
was compiled from reservoir modeling output and contained many consecutive days of exactly 50 ft
3/s of discharge.
The median monthly streamflows at the three Reach 4–6 gages (Middle Santiam River at mouth near Foster [14186500], South Santiam River at Foster [14186700], and South Santiam River at Waterloo [14187500]) decreased in the late win-ter and spring (February–May) and increased from summer to winter (July–January) as a result of dam regulation (table 11).
For the two gages below Foster Dam, South Santiam at Foster (14186700) and at Waterloo (14187500), the 5-percent streamflow exceedance increased slightly (less than 5 percent) under reg-ulation (figs. 23–25; table 12). The 95-percent streamflow exceedance increased 266 and 283 percent for gages 14186700 and 14187500, re-spectively. However, the 95-percent streamflow exceedance for the gage below Green Peter Dam (14186500) decreased by 46 percent, possibly because of an error in the computed streamflow time series as previously mentioned.
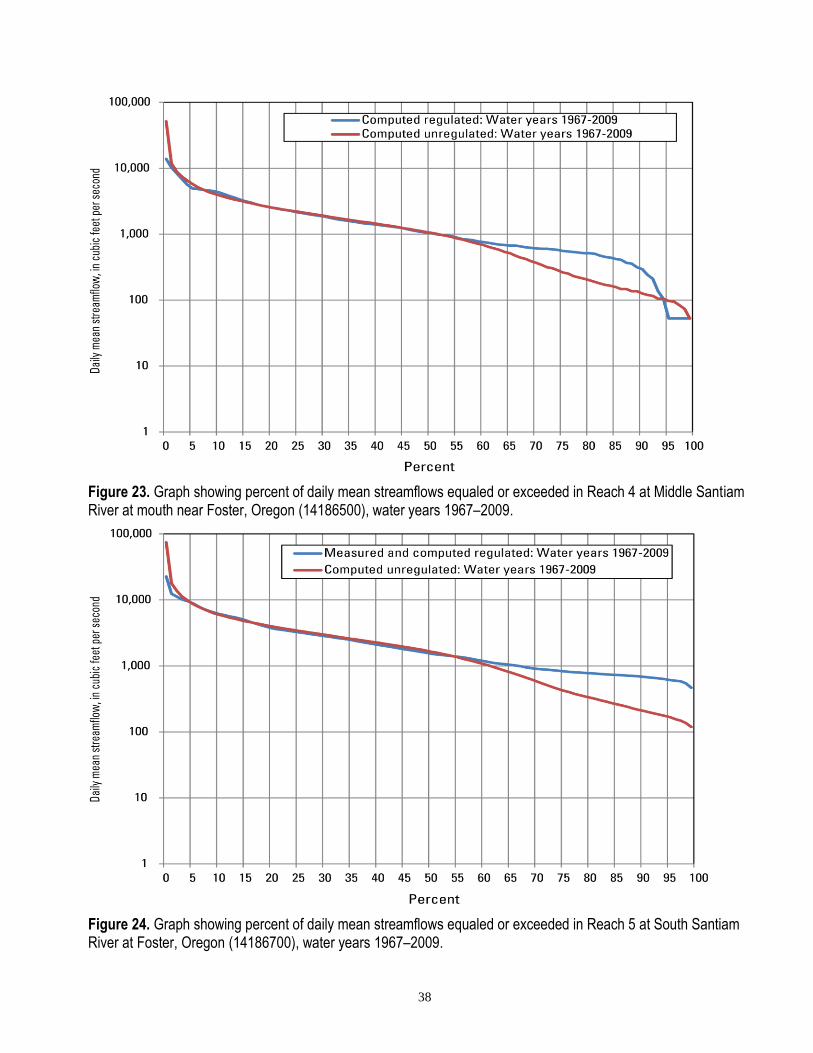
38
Figure 23. Graph showing percent of daily mean streamflows equaled or exceeded in Reach 4 at Middle Santiam River at mouth near Foster, Oregon (14186500), water years 1967–2009.
Figure 24. Graph showing percent of daily mean streamflows equaled or exceeded in Reach 5 at South Santiam River at Foster, Oregon (14186700), water years 1967–2009.
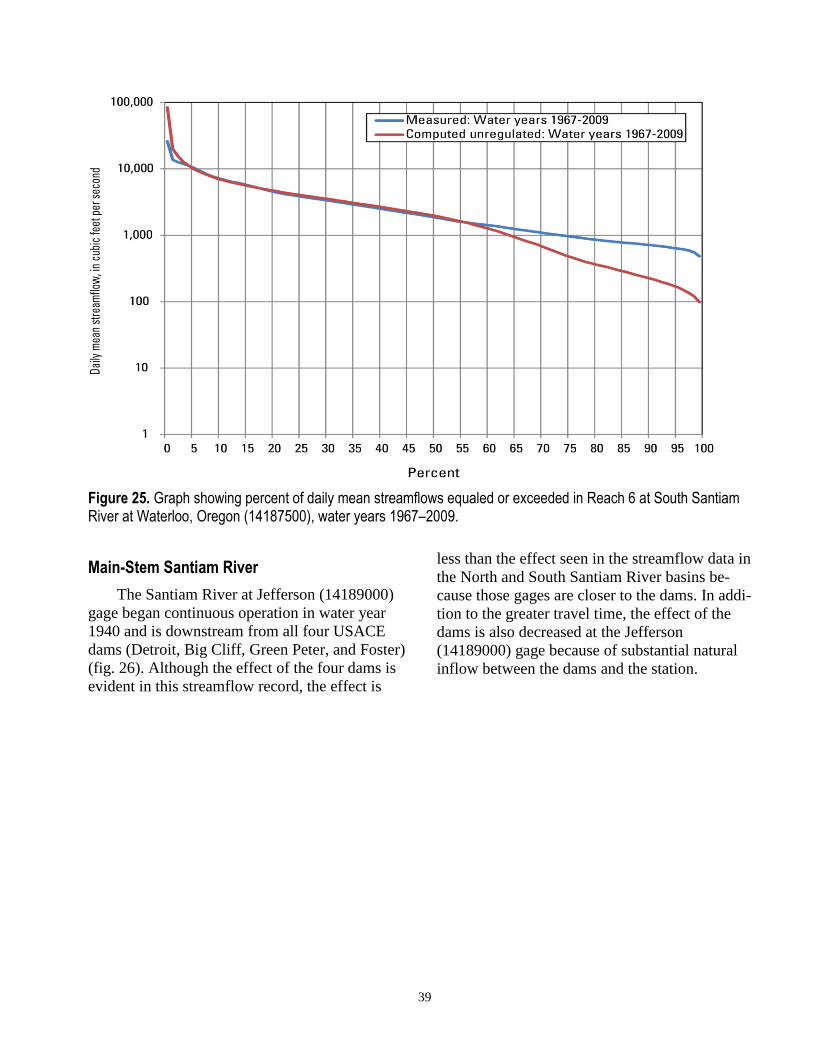
39
Figure 25. Graph showing percent of daily mean streamflows equaled or exceeded in Reach 6 at South Santiam River at Waterloo, Oregon (14187500), water years 1967–2009.
Main-Stem Santiam River
The Santiam River at Jefferson (14189000)
gage began continuous operation in water year
1940 and is downstream from all four USACE
dams (Detroit, Big Cliff, Green Peter, and Foster)
(fig. 26). Although the effect of the four dams is
evident in this streamflow record, the effect is
less than the effect seen in the streamflow data in
the North and South Santiam River basins be-
cause those gages are closer to the dams. In addi-
tion to the greater travel time, the effect of the
dams is also decreased at the Jefferson
(14189000) gage because of substantial natural
inflow between the dams and the station.
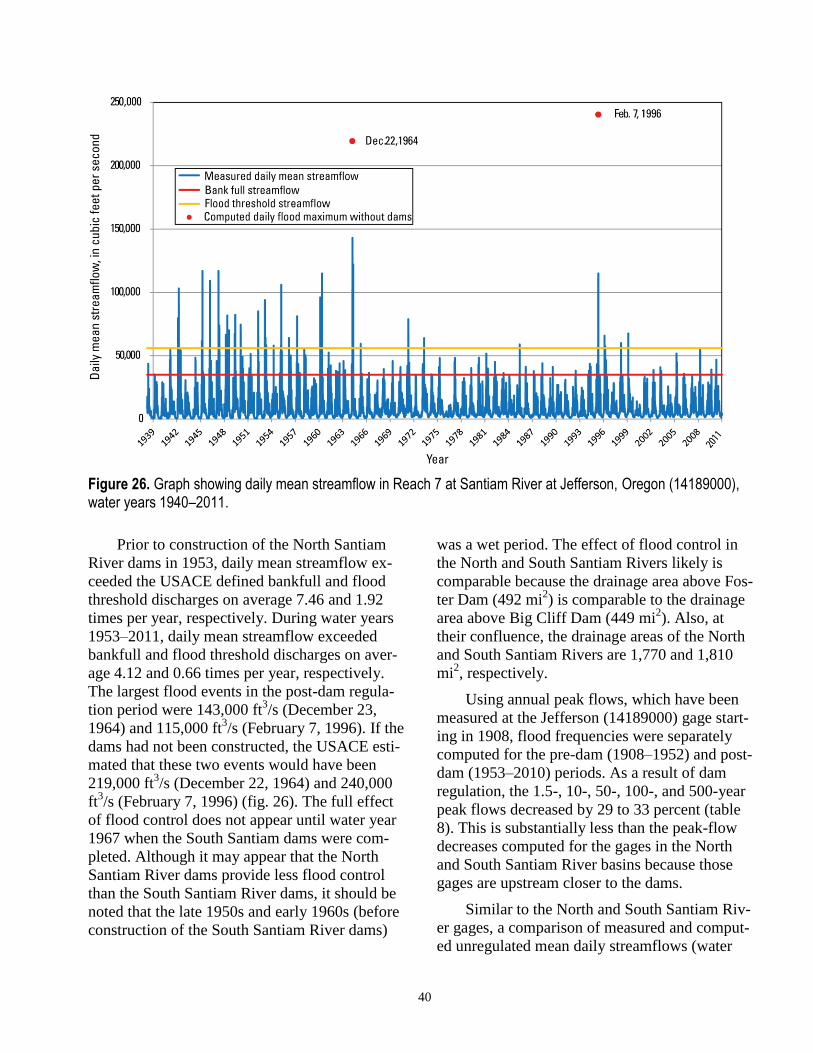
40
Figure 26. Graph showing daily mean streamflow in Reach 7 at Santiam River at Jefferson, Oregon (14189000), water years 1940–2011.
Prior to construction of the North Santiam
River dams in 1953, daily mean streamflow ex-
ceeded the USACE defined bankfull and flood
threshold discharges on average 7.46 and 1.92
times per year, respectively. During water years
1953–2011, daily mean streamflow exceeded
bankfull and flood threshold discharges on aver-
age 4.12 and 0.66 times per year, respectively.
The largest flood events in the post-dam regula-
tion period were 143,000 ft3/s (December 23,
1964) and 115,000 ft3/s (February 7, 1996). If the
dams had not been constructed, the USACE esti-
mated that these two events would have been
219,000 ft3/s (December 22, 1964) and 240,000
ft3/s (February 7, 1996) (fig. 26). The full effect
of flood control does not appear until water year
1967 when the South Santiam dams were com-
pleted. Although it may appear that the North
Santiam River dams provide less flood control
than the South Santiam River dams, it should be
noted that the late 1950s and early 1960s (before
construction of the South Santiam River dams)
was a wet period. The effect of flood control in
the North and South Santiam Rivers likely is
comparable because the drainage area above Fos-
ter Dam (492 mi2) is comparable to the drainage
area above Big Cliff Dam (449 mi2). Also, at
their confluence, the drainage areas of the North
and South Santiam Rivers are 1,770 and 1,810
mi2, respectively.
Using annual peak flows, which have been
measured at the Jefferson (14189000) gage start-
ing in 1908, flood frequencies were separately
computed for the pre-dam (1908–1952) and post-
dam (1953–2010) periods. As a result of dam
regulation, the 1.5-, 10-, 50-, 100-, and 500-year
peak flows decreased by 29 to 33 percent (table
8). This is substantially less than the peak-flow
decreases computed for the gages in the North
and South Santiam River basins because those
gages are upstream closer to the dams.
Similar to the North and South Santiam Riv-
er gages, a comparison of measured and comput-
ed unregulated mean daily streamflows (water
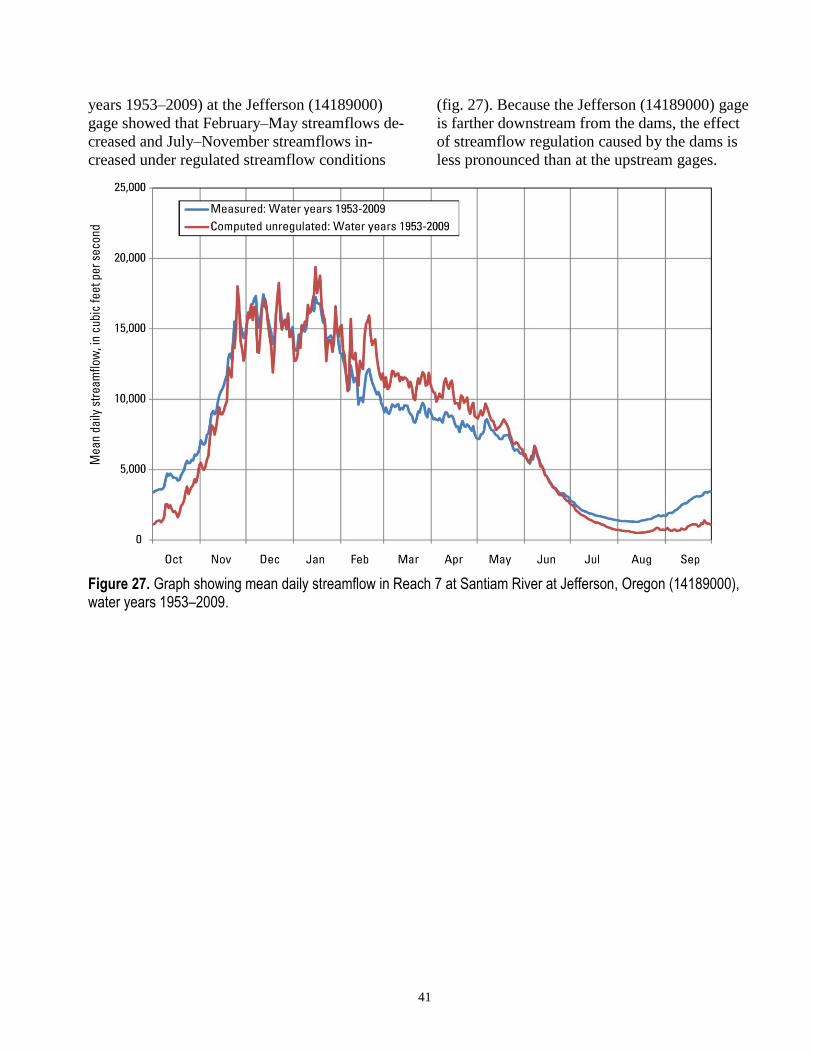
41
years 1953–2009) at the Jefferson (14189000)
gage showed that February–May streamflows de-
creased and July–November streamflows in-
creased under regulated streamflow conditions
(fig. 27). Because the Jefferson (14189000) gage
is farther downstream from the dams, the effect
of streamflow regulation caused by the dams is
less pronounced than at the upstream gages.
Figure 27. Graph showing mean daily streamflow in Reach 7 at Santiam River at Jefferson, Oregon (14189000), water years 1953–2009.
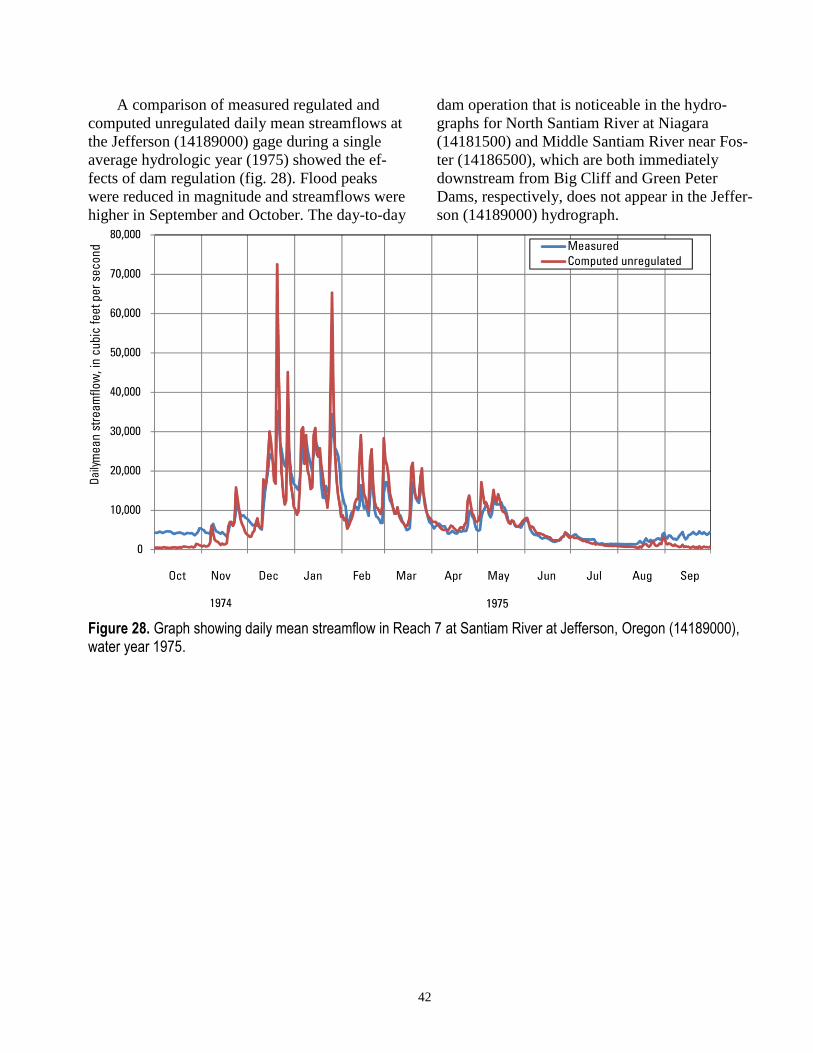
42
A comparison of measured regulated and
computed unregulated daily mean streamflows at
the Jefferson (14189000) gage during a single
average hydrologic year (1975) showed the ef-
fects of dam regulation (fig. 28). Flood peaks
were reduced in magnitude and streamflows were
higher in September and October. The day-to-day
dam operation that is noticeable in the hydro-
graphs for North Santiam River at Niagara
(14181500) and Middle Santiam River near Fos-
ter (14186500), which are both immediately
downstream from Big Cliff and Green Peter
Dams, respectively, does not appear in the Jeffer-
son (14189000) hydrograph.
Figure 28. Graph showing daily mean streamflow in Reach 7 at Santiam River at Jefferson, Oregon (14189000), water year 1975.
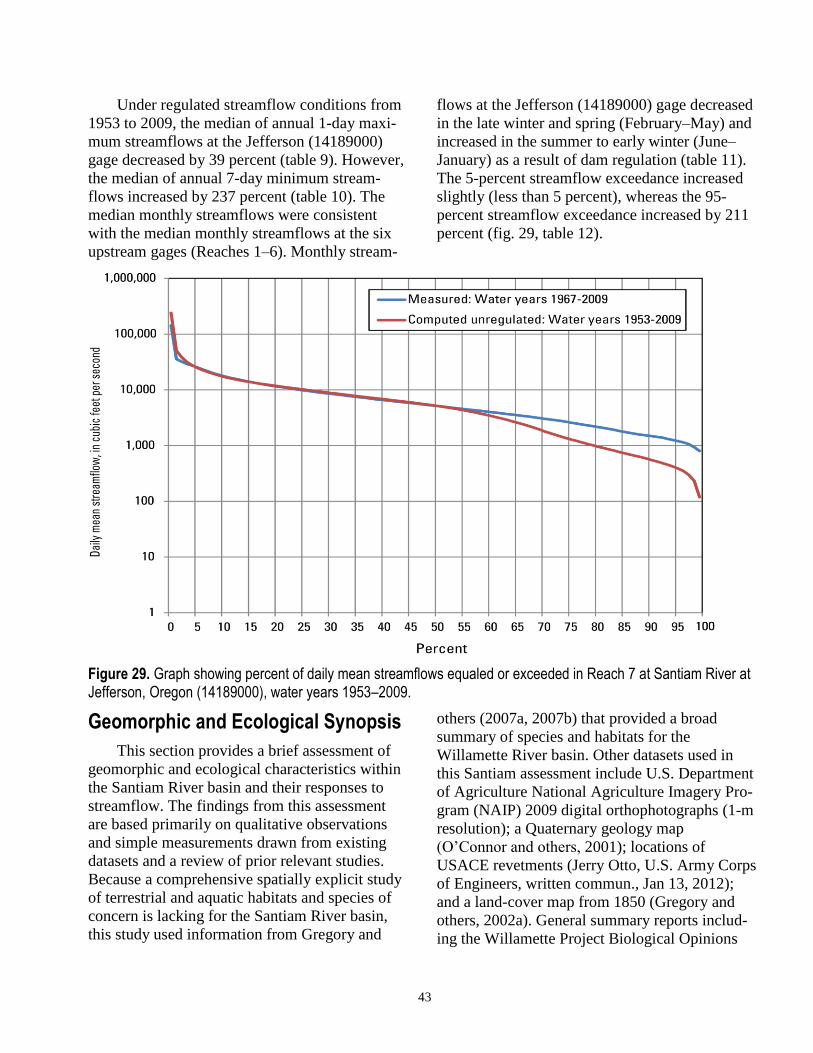
43
Under regulated streamflow conditions from
1953 to 2009, the median of annual 1-day maxi-
mum streamflows at the Jefferson (14189000)
gage decreased by 39 percent (table 9). However,
the median of annual 7-day minimum stream-
flows increased by 237 percent (table 10). The
median monthly streamflows were consistent
with the median monthly streamflows at the six
upstream gages (Reaches 1–6). Monthly stream-
flows at the Jefferson (14189000) gage decreased
in the late winter and spring (February–May) and
increased in the summer to early winter (June–
January) as a result of dam regulation (table 11).
The 5-percent streamflow exceedance increased
slightly (less than 5 percent), whereas the 95-
percent streamflow exceedance increased by 211
percent (fig. 29, table 12).
Figure 29. Graph showing percent of daily mean streamflows equaled or exceeded in Reach 7 at Santiam River at Jefferson, Oregon (14189000), water years 1953–2009.
Geomorphic and Ecological Synopsis
This section provides a brief assessment of
geomorphic and ecological characteristics within
the Santiam River basin and their responses to
streamflow. The findings from this assessment
are based primarily on qualitative observations
and simple measurements drawn from existing
datasets and a review of prior relevant studies.
Because a comprehensive spatially explicit study
of terrestrial and aquatic habitats and species of
concern is lacking for the Santiam River basin,
this study used information from Gregory and
others (2007a, 2007b) that provided a broad
summary of species and habitats for the
Willamette River basin. Other datasets used in
this Santiam assessment include U.S. Department
of Agriculture National Agriculture Imagery Pro-
gram (NAIP) 2009 digital orthophotographs (1-m
resolution); a Quaternary geology map
(O’Connor and others, 2001); locations of
USACE revetments (Jerry Otto, U.S. Army Corps
of Engineers, written commun., Jan 13, 2012);
and a land-cover map from 1850 (Gregory and
others, 2002a). General summary reports includ-
ing the Willamette Project Biological Opinions
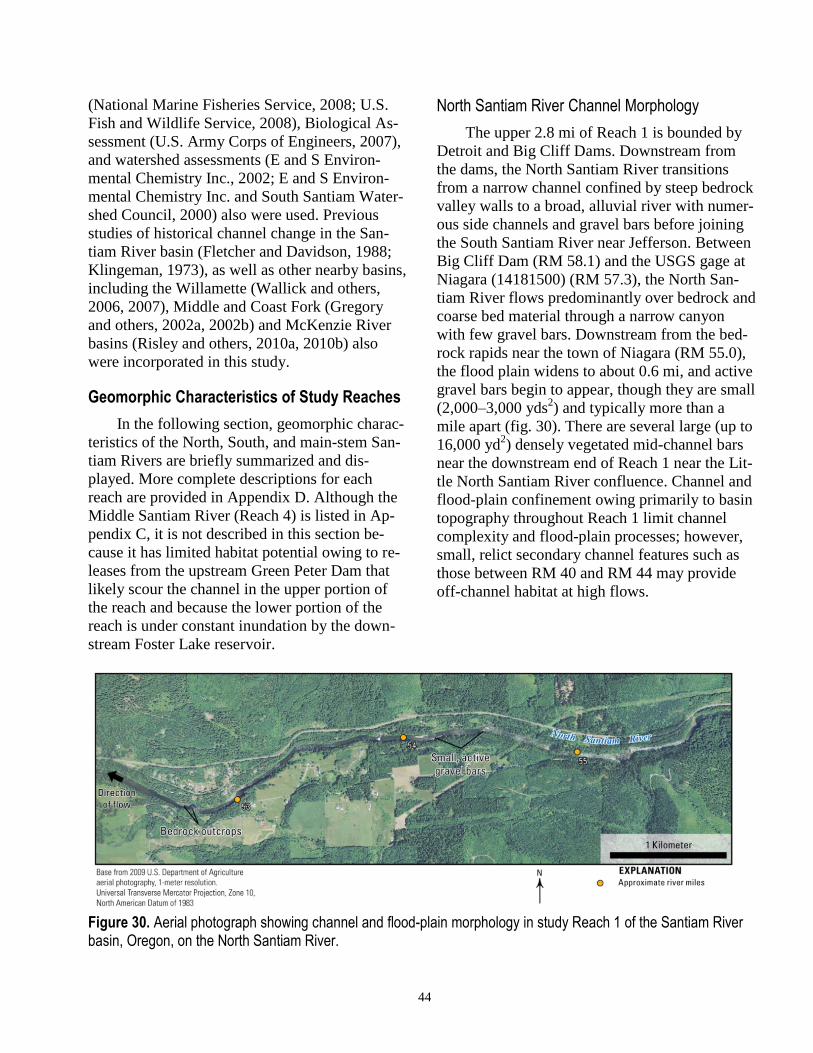
44
(National Marine Fisheries Service, 2008; U.S.
Fish and Wildlife Service, 2008), Biological As-
sessment (U.S. Army Corps of Engineers, 2007),
and watershed assessments (E and S Environ-
mental Chemistry Inc., 2002; E and S Environ-
mental Chemistry Inc. and South Santiam Water-
shed Council, 2000) also were used. Previous
studies of historical channel change in the San-
tiam River basin (Fletcher and Davidson, 1988;
Klingeman, 1973), as well as other nearby basins,
including the Willamette (Wallick and others,
2006, 2007), Middle and Coast Fork (Gregory
and others, 2002a, 2002b) and McKenzie River
basins (Risley and others, 2010a, 2010b) also
were incorporated in this study.
Geomorphic Characteristics of Study Reaches
In the following section, geomorphic charac-
teristics of the North, South, and main-stem San-
tiam Rivers are briefly summarized and dis-
played. More complete descriptions for each
reach are provided in Appendix D. Although the
Middle Santiam River (Reach 4) is listed in Ap-
pendix C, it is not described in this section be-
cause it has limited habitat potential owing to re-
leases from the upstream Green Peter Dam that
likely scour the channel in the upper portion of
the reach and because the lower portion of the
reach is under constant inundation by the down-
stream Foster Lake reservoir.
North Santiam River Channel Morphology
The upper 2.8 mi of Reach 1 is bounded by
Detroit and Big Cliff Dams. Downstream from
the dams, the North Santiam River transitions
from a narrow channel confined by steep bedrock
valley walls to a broad, alluvial river with numer-
ous side channels and gravel bars before joining
the South Santiam River near Jefferson. Between
Big Cliff Dam (RM 58.1) and the USGS gage at
Niagara (14181500) (RM 57.3), the North San-
tiam River flows predominantly over bedrock and
coarse bed material through a narrow canyon
with few gravel bars. Downstream from the bed-
rock rapids near the town of Niagara (RM 55.0),
the flood plain widens to about 0.6 mi, and active
gravel bars begin to appear, though they are small
(2,000–3,000 yds2) and typically more than a
mile apart (fig. 30). There are several large (up to
16,000 yd2) densely vegetated mid-channel bars
near the downstream end of Reach 1 near the Lit-
tle North Santiam River confluence. Channel and
flood-plain confinement owing primarily to basin
topography throughout Reach 1 limit channel
complexity and flood-plain processes; however,
small, relict secondary channel features such as
those between RM 40 and RM 44 may provide
off-channel habitat at high flows.
Figure 30. Aerial photograph showing channel and flood-plain morphology in study Reach 1 of the Santiam River basin, Oregon, on the North Santiam River.
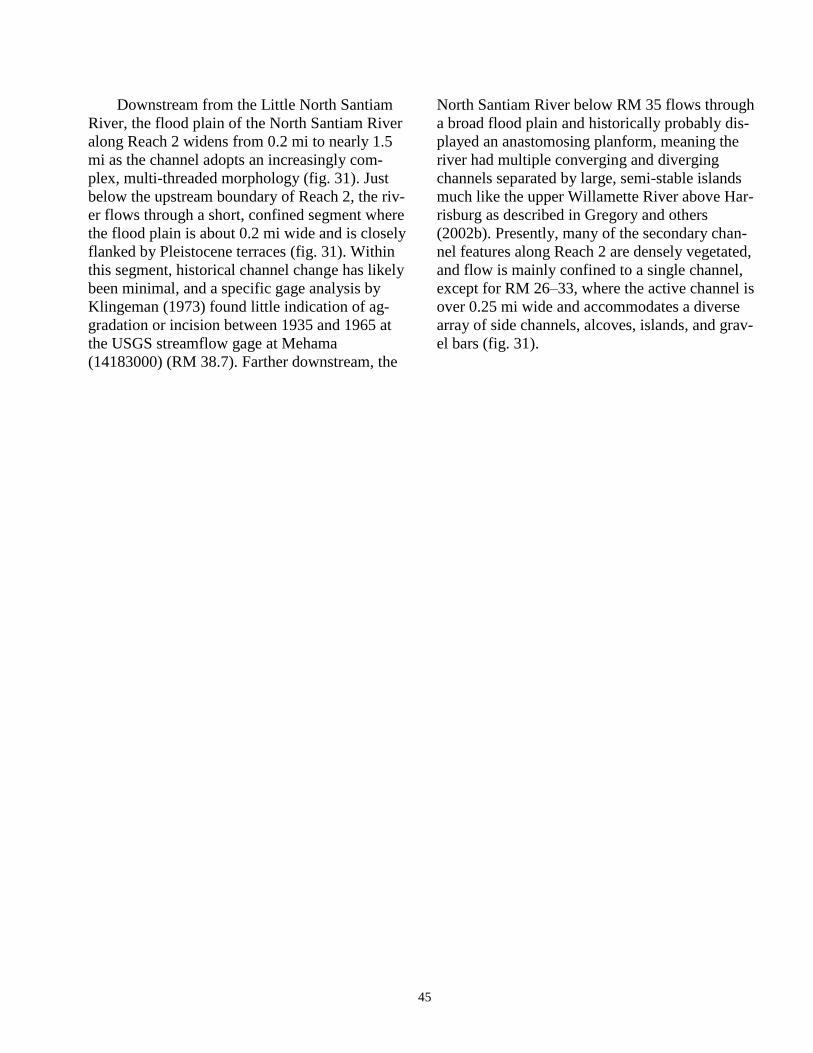
45
Downstream from the Little North Santiam
River, the flood plain of the North Santiam River
along Reach 2 widens from 0.2 mi to nearly 1.5
mi as the channel adopts an increasingly com-
plex, multi-threaded morphology (fig. 31). Just
below the upstream boundary of Reach 2, the riv-
er flows through a short, confined segment where
the flood plain is about 0.2 mi wide and is closely
flanked by Pleistocene terraces (fig. 31). Within
this segment, historical channel change has likely
been minimal, and a specific gage analysis by
Klingeman (1973) found little indication of ag-
gradation or incision between 1935 and 1965 at
the USGS streamflow gage at Mehama
(14183000) (RM 38.7). Farther downstream, the
North Santiam River below RM 35 flows through
a broad flood plain and historically probably dis-
played an anastomosing planform, meaning the
river had multiple converging and diverging
channels separated by large, semi-stable islands
much like the upper Willamette River above Har-
risburg as described in Gregory and others
(2002b). Presently, many of the secondary chan-
nel features along Reach 2 are densely vegetated,
and flow is mainly confined to a single channel,
except for RM 26–33, where the active channel is
over 0.25 mi wide and accommodates a diverse
array of side channels, alcoves, islands, and grav-
el bars (fig. 31).

46
Figure 31. Map showing surficial geology and revetments for alluvial segments of the Santiam River, Oregon, study area. Late Pleistocene alluvium is a combination of units Qff2, Qg1, and Qg2; Holocene alluvium is a combi-nation of units Qalc, Qalf, Qau, and Qbf; all other units shown from O’Connor and others (2001).
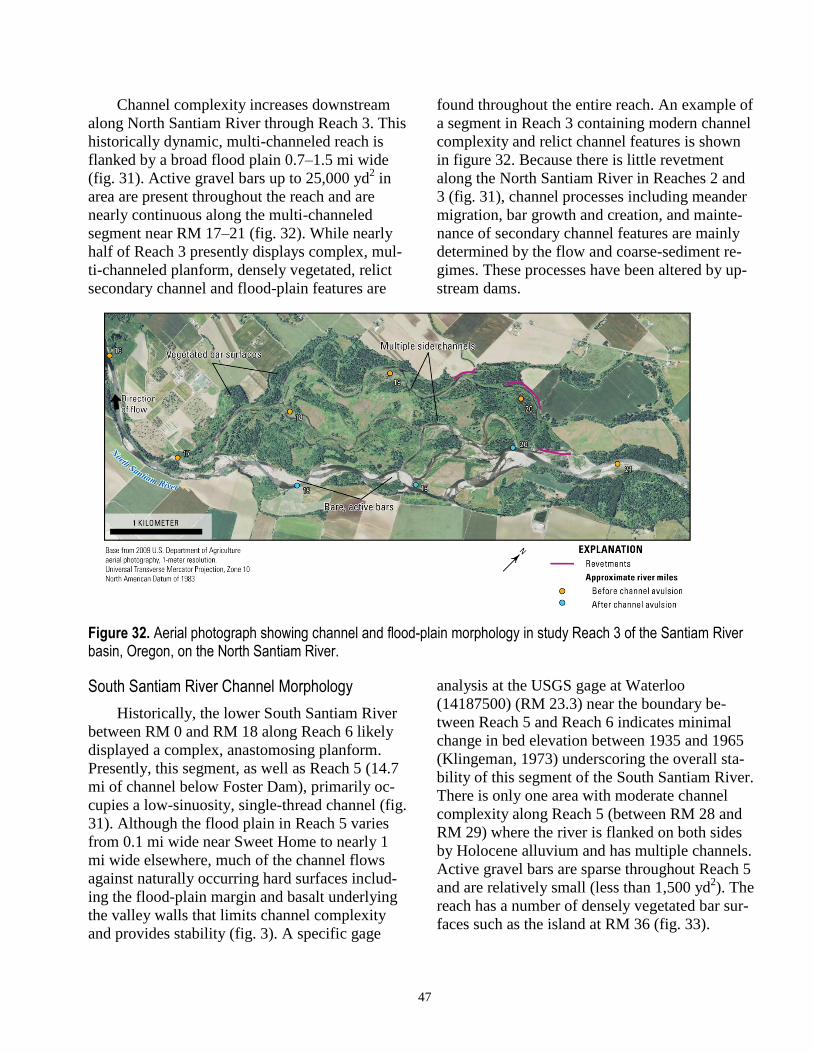
47
Channel complexity increases downstream
along North Santiam River through Reach 3. This
historically dynamic, multi-channeled reach is
flanked by a broad flood plain 0.7–1.5 mi wide
(fig. 31). Active gravel bars up to 25,000 yd2 in
area are present throughout the reach and are
nearly continuous along the multi-channeled
segment near RM 17–21 (fig. 32). While nearly
half of Reach 3 presently displays complex, mul-
ti-channeled planform, densely vegetated, relict
secondary channel and flood-plain features are
found throughout the entire reach. An example of
a segment in Reach 3 containing modern channel
complexity and relict channel features is shown
in figure 32. Because there is little revetment
along the North Santiam River in Reaches 2 and
3 (fig. 31), channel processes including meander
migration, bar growth and creation, and mainte-
nance of secondary channel features are mainly
determined by the flow and coarse-sediment re-
gimes. These processes have been altered by up-
stream dams.
Figure 32. Aerial photograph showing channel and flood-plain morphology in study Reach 3 of the Santiam River basin, Oregon, on the North Santiam River.
South Santiam River Channel Morphology
Historically, the lower South Santiam River
between RM 0 and RM 18 along Reach 6 likely
displayed a complex, anastomosing planform.
Presently, this segment, as well as Reach 5 (14.7
mi of channel below Foster Dam), primarily oc-
cupies a low-sinuosity, single-thread channel (fig.
31). Although the flood plain in Reach 5 varies
from 0.1 mi wide near Sweet Home to nearly 1
mi wide elsewhere, much of the channel flows
against naturally occurring hard surfaces includ-
ing the flood-plain margin and basalt underlying
the valley walls that limits channel complexity
and provides stability (fig. 3). A specific gage
analysis at the USGS gage at Waterloo
(14187500) (RM 23.3) near the boundary be-
tween Reach 5 and Reach 6 indicates minimal
change in bed elevation between 1935 and 1965
(Klingeman, 1973) underscoring the overall sta-
bility of this segment of the South Santiam River.
There is only one area with moderate channel
complexity along Reach 5 (between RM 28 and
RM 29) where the river is flanked on both sides
by Holocene alluvium and has multiple channels.
Active gravel bars are sparse throughout Reach 5
and are relatively small (less than 1,500 yd2). The
reach has a number of densely vegetated bar sur-
faces such as the island at RM 36 (fig. 33).
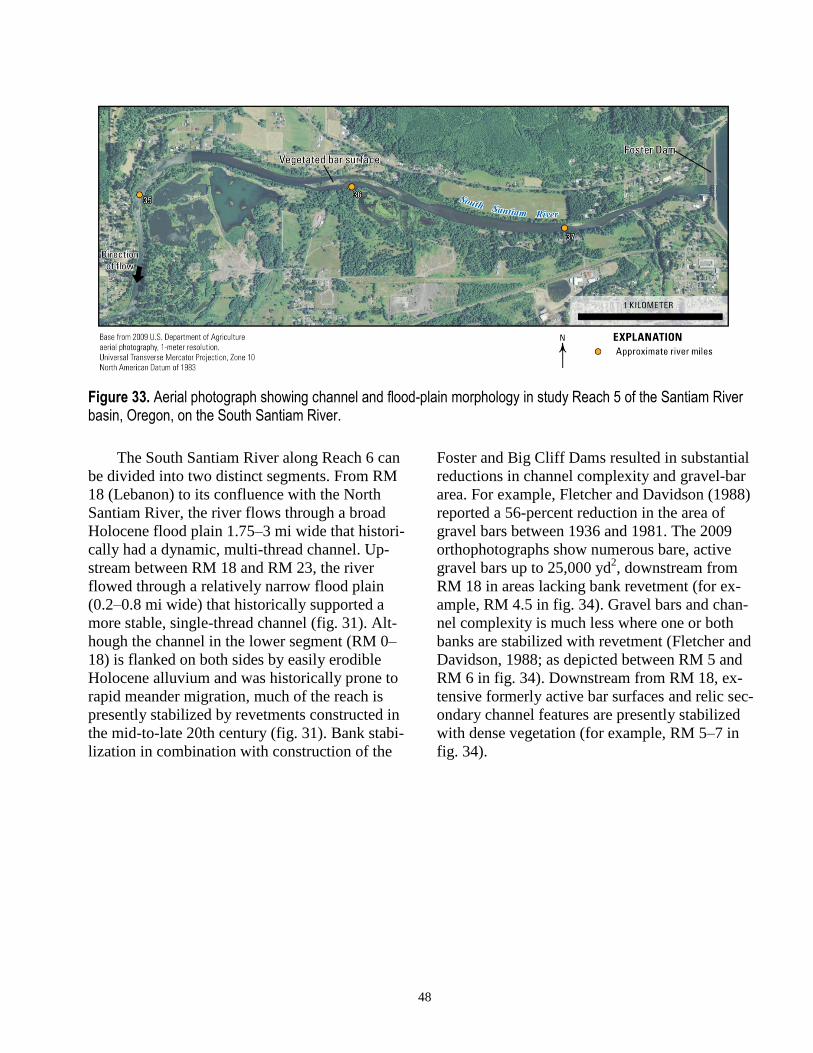
48
Figure 33. Aerial photograph showing channel and flood-plain morphology in study Reach 5 of the Santiam River basin, Oregon, on the South Santiam River.
The South Santiam River along Reach 6 can
be divided into two distinct segments. From RM
18 (Lebanon) to its confluence with the North
Santiam River, the river flows through a broad
Holocene flood plain 1.75–3 mi wide that histori-
cally had a dynamic, multi-thread channel. Up-
stream between RM 18 and RM 23, the river
flowed through a relatively narrow flood plain
(0.2–0.8 mi wide) that historically supported a
more stable, single-thread channel (fig. 31). Alt-
hough the channel in the lower segment (RM 0–
18) is flanked on both sides by easily erodible
Holocene alluvium and was historically prone to
rapid meander migration, much of the reach is
presently stabilized by revetments constructed in
the mid-to-late 20th century (fig. 31). Bank stabi-
lization in combination with construction of the
Foster and Big Cliff Dams resulted in substantial
reductions in channel complexity and gravel-bar
area. For example, Fletcher and Davidson (1988)
reported a 56-percent reduction in the area of
gravel bars between 1936 and 1981. The 2009
orthophotographs show numerous bare, active
gravel bars up to 25,000 yd2, downstream from
RM 18 in areas lacking bank revetment (for ex-
ample, RM 4.5 in fig. 34). Gravel bars and chan-
nel complexity is much less where one or both
banks are stabilized with revetment (Fletcher and
Davidson, 1988; as depicted between RM 5 and
RM 6 in fig. 34). Downstream from RM 18, ex-
tensive formerly active bar surfaces and relic sec-
ondary channel features are presently stabilized
with dense vegetation (for example, RM 5–7 in
fig. 34).
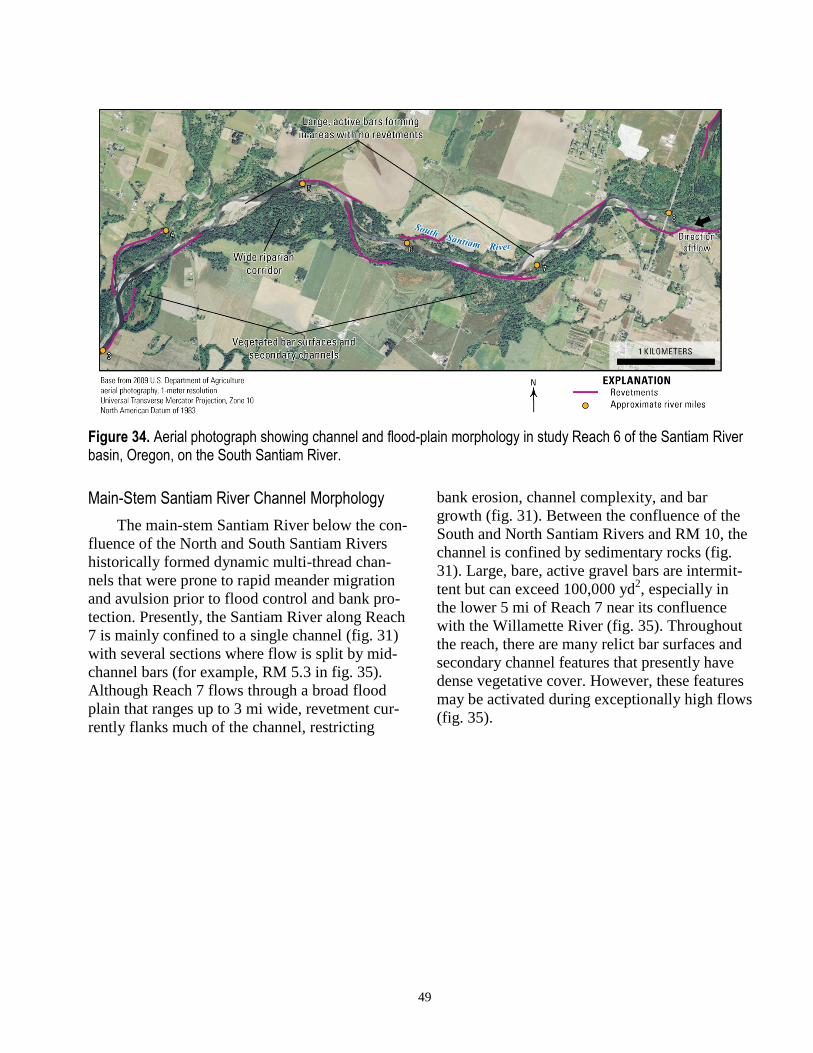
49
Figure 34. Aerial photograph showing channel and flood-plain morphology in study Reach 6 of the Santiam River basin, Oregon, on the South Santiam River.
Main-Stem Santiam River Channel Morphology
The main-stem Santiam River below the con-
fluence of the North and South Santiam Rivers
historically formed dynamic multi-thread chan-
nels that were prone to rapid meander migration
and avulsion prior to flood control and bank pro-
tection. Presently, the Santiam River along Reach
7 is mainly confined to a single channel (fig. 31)
with several sections where flow is split by mid-
channel bars (for example, RM 5.3 in fig. 35).
Although Reach 7 flows through a broad flood
plain that ranges up to 3 mi wide, revetment cur-
rently flanks much of the channel, restricting
bank erosion, channel complexity, and bar
growth (fig. 31). Between the confluence of the
South and North Santiam Rivers and RM 10, the
channel is confined by sedimentary rocks (fig.
31). Large, bare, active gravel bars are intermit-
tent but can exceed 100,000 yd2, especially in
the lower 5 mi of Reach 7 near its confluence
with the Willamette River (fig. 35). Throughout
the reach, there are many relict bar surfaces and
secondary channel features that presently have
dense vegetative cover. However, these features
may be activated during exceptionally high flows
(fig. 35).
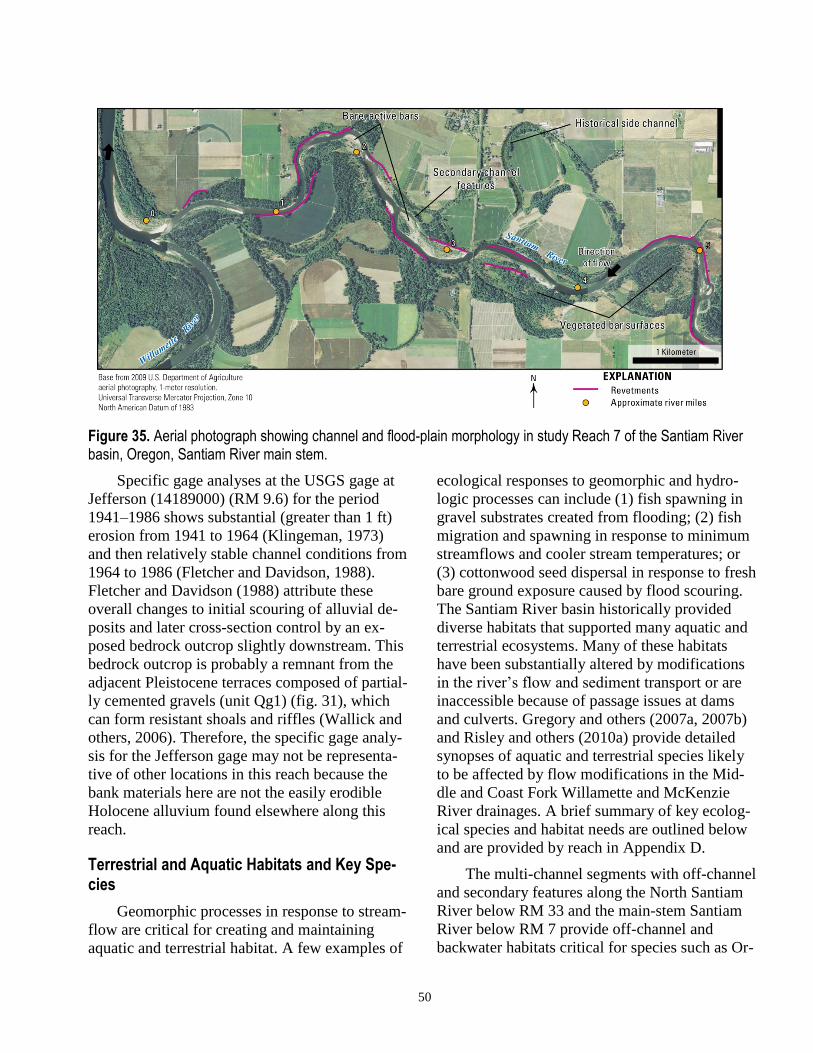
50
Figure 35. Aerial photograph showing channel and flood-plain morphology in study Reach 7 of the Santiam River basin, Oregon, Santiam River main stem.
Specific gage analyses at the USGS gage at
Jefferson (14189000) (RM 9.6) for the period
1941–1986 shows substantial (greater than 1 ft)
erosion from 1941 to 1964 (Klingeman, 1973)
and then relatively stable channel conditions from
1964 to 1986 (Fletcher and Davidson, 1988).
Fletcher and Davidson (1988) attribute these
overall changes to initial scouring of alluvial de-
posits and later cross-section control by an ex-
posed bedrock outcrop slightly downstream. This
bedrock outcrop is probably a remnant from the
adjacent Pleistocene terraces composed of partial-
ly cemented gravels (unit Qg1) (fig. 31), which
can form resistant shoals and riffles (Wallick and
others, 2006). Therefore, the specific gage analy-
sis for the Jefferson gage may not be representa-
tive of other locations in this reach because the
bank materials here are not the easily erodible
Holocene alluvium found elsewhere along this
reach.
Terrestrial and Aquatic Habitats and Key Spe-cies
Geomorphic processes in response to stream-
flow are critical for creating and maintaining
aquatic and terrestrial habitat. A few examples of
ecological responses to geomorphic and hydro-
logic processes can include (1) fish spawning in
gravel substrates created from flooding; (2) fish
migration and spawning in response to minimum
streamflows and cooler stream temperatures; or
(3) cottonwood seed dispersal in response to fresh
bare ground exposure caused by flood scouring.
The Santiam River basin historically provided
diverse habitats that supported many aquatic and
terrestrial ecosystems. Many of these habitats
have been substantially altered by modifications
in the river’s flow and sediment transport or are
inaccessible because of passage issues at dams
and culverts. Gregory and others (2007a, 2007b)
and Risley and others (2010a) provide detailed
synopses of aquatic and terrestrial species likely
to be affected by flow modifications in the Mid-
dle and Coast Fork Willamette and McKenzie
River drainages. A brief summary of key ecolog-
ical species and habitat needs are outlined below
and are provided by reach in Appendix D.
The multi-channel segments with off-channel
and secondary features along the North Santiam
River below RM 33 and the main-stem Santiam
River below RM 7 provide off-channel and
backwater habitats critical for species such as Or-
51
egon chub, red legged frog, and western pond
turtle (Gregory and others, 2007a, 2007b). These
segments also have secondary channel features
and sloughs that provide high-flow refugia and
rearing habitat for native fish, including spring
Chinook and winter steelhead. Although these
features are present on the South Santiam River
below RM 18, they are much less extensive be-
cause of revetments and channel simplification
than on the North Santiam River. Other native
fish species that use the North, South, and main-
stem Santiam Rivers include rainbow trout, cut-
throat trout, northern pike minnow, sand rollers,
shiners, sculpins, and dace (Gregory and others,
2007a, 2007b).
The broad, low-gradient flood plains of the
Santiam River historically contained a complex
mosaic of riparian forests and wetlands, which
has been simplified throughout the study area
since the 1850s. Presently, the riparian forest cor-
ridor is nearly contiguous along lower North San-
tiam River below RM 33, the South Santiam Riv-
er below RM 18, and the main-stem Santiam
River below RM 7. Within these sections, the
forest corridor ranges in width from a narrow
band of trees to more than 0.7 mi (as shown in
figs. 32, 34, and 35) and likely includes tree spe-
cies such as black cottonwood, riparian willows,
and white alder (Gregory and others, 2007a,
2007b). These species are associated with the
more dynamic multi-channel stretches because
they depend on high flows in winter and spring
for seed dispersal, active sediment transport and
deposition to create exposed fine sediment patch-
es for germination, and erosion to remove canopy
cover that otherwise may preclude establishment.
Potential Geomorphic and Ecological Re-sponse to Environmental Flow Releases
No comprehensive study relating streamflow
with specific geomorphic or ecological responses
exists for the Santiam River basin. Hence, the
following section discusses possible effects of
environmental flow releases on physical habitat
and riparian ecosystems based on known rela-
tions between channel processes and flow and
sediment regimes and previous environmental
flow studies in the Willamette River basin.
With a wide active channel, abundance of
gravel bars and secondary channel features, and
limited revetments, the lower North Santiam Riv-
er below RM 33 would likely respond dynamical-
ly to environmental flow releases. Channel and
flood-plain response to high-flow releases (in-
cluding high-flow pulses and small and large
floods) may include meander migration and pos-
sibly avulsions at very high discharges. Bank ero-
sion from meander migration and avulsions
would likely supply coarse bed-material sediment
for deposition downstream, forming gravel bars,
riffles, pools, and spawning habitats. Bank ero-
sion along forested portions of the flood plain
could introduce large wood into the active chan-
nel, providing cover and habitat complexity for
fish, amphibians, and mammals and possible
blockages that support further bar growth and
pool formation. High flows may also support the
maintenance and creation of secondary channel
features; scour stabilizing vegetation from relict
gravel bars depending on flow magnitude; and
assist with seed dispersal, organic matter ex-
change between the river and riparian areas, and
deposition of sediment suitable for seedling ger-
minations.
Reaches lined by revetment or naturally oc-
curring material resistive to erosion may have
more limited responses to flow modifications. For
instance, Reach 6 of the South Santiam below
RM 18 has extensive revetment that limits bank
erosion, recruitment of gravel and large wood
from the flood plain, and creation of new habitats
suitable to riparian vegetation establishment. Be-
cause revetments have also restricted lateral mi-
gration and limited bar growth along the South
Santiam River (Fletcher and Davidson, 1988),
environmental flow releases on the South San-
tiam may not be as effective at increasing bar ar-
ea and spawning habitat as they might be on the
lower North Santiam River, which has fewer re-
vetments. Other areas unlikely to display dynam-
ic channel response to environmental flow releas-
es include the stable semiconsolidated gravel and
52
bedrock dominated segments of the study area
including the North Santiam River (Reaches 1
and 2) above RM 33 and the South Santiam River
above RM 18 (Reaches 4, 5, and 6).
Another important consideration of environ-
mental flow releases is the possibility of channel
incision and bed coarsening in response to high
flows caused by sediment trapping behind the
dams. The dams on the North and South Santiam
Rivers trap sediment from 59 and 47 percent of
these basins, respectively. The beds of down-
stream reaches have likely coarsened in response
to excess transport capacity because dams limit
sediment supply (National Marine Fisheries Ser-
vice, 2008; Fletcher and Davidson, 1988). There-
fore, it is possible that high-flow releases may
further coarsen the bed or trigger bed-level lower-
ing, especially along alluvial segments where
there are limited upstream sources of bed material
from tributaries or bank erosion. Further assess-
ment of the influence of environmental flow re-
leases on bed coarsening and channel lowering
would entail development of a bed-material
budget along with a comprehensive analysis of
historical changes in grain size and bed eleva-
tions.
In addition to modifying physical habitat,
streamflow also affects the spawning, rearing,
and migration behavior of fish species. Discharge
during autumn increased throughout the study
area, which coincides with late summer and early
autumn spawning by spring Chinook and is fol-
lowed by lower than historical flows during the
late winter (table 11). Such flood-control opera-
tions in late winter may lead to dewatering of
salmon redds and could potentially kill incubat-
ing eggs and alevins (Reiser and White, 1983).
Additionally, stream-temperature regimes have
been modified by flow regulations, causing tem-
peratures to be cooler in summer and warmer in
autumn (Rounds, 2010). Changes to the thermal
regime can have a direct impact on salmonid
outmigrations in winter and spawning and incu-
bation in fall (Gregory and others, 2007a, 2007b).
Reach 5 of the South Santiam River between RM
30 and RM 35 may be especially sensitive to such
flow and, probably, stream-temperature fluctua-
tions because spawning of spring Chinook salm-
on is especially heavy in this area (National Ma-
rine Fisheries Service, 2008, section 4.5). Rela-
tions between life history and monthly stream-
flow and stream temperature similar to those de-
veloped for the Middle and Coast Fork
Willamette and McKenzie Rivers (Gregory and
others, 2007a, 2007b; Risley and others, 2010a)
could assist in developing basin-specific envi-
ronmental flow releases for the Santiam River
basin.
Streamflow patterns also influence other
aquatic and riparian species. For example, ex-
treme low-flow periods, which can be exacerbat-
ed by withdrawals, can lower groundwater levels
and threaten the survival of riparian seedlings
such as black cottonwood and white alder (Greg-
ory and others, 2007a, 2007b). In contrast, large
floods may erode young trees on low-lying flood-
plain surfaces, but they can also disperse seeds
and stems and deposit fresh sediment patches at
lower elevations within the active channel, where
new seedlings can germinate, ultimately increas-
ing the diversity and age classes of riparian vege-
tation (Gregory and others, 2007a, 2007b). To
assist in the development of environmental flow
releases that aim to increase the diversity and age
classes of native riparian forests, relations be-
tween streamflow and riparian vegetation could
be created for the Santiam River basin similar to
those developed for the Middle and Coast Fork
Willamette and McKenzie River basins (Gregory
and others, 2007a, 2007b; Risley and others,
2010a).
Future Studies
This study provides a framework and base-
line information for developing environmental
flow guidelines in the Santiam River basin. Cen-
tral to a sound environmental flow program is
establishing robust, quantitative relations between
streamflow, channel and flood-plain processes,
and ecosystem response. These relations can be
quantified by (1) understanding existing channel
53
and flood-plain processes (post-dam, post-
revetment) along lower, alluvial reaches, (2) un-
derstanding relations between environmental
flows and terrestrial and aquatic habitats and spe-
cies, and (3) documenting existing conditions and
those following environmental flow releases of
different magnitudes. Such information would
provide a solid basis for evaluating future hydro-
logic, geomorphic, and ecological changes and
comprehensive adaptive management in the San-
tiam River basin. To address the three objectives
above, it will be necessary to evaluate streamflow
data and analyses, bed-load material transport
rates and sediment budget, channel and flood-
plain morphology, and terrestrial and aquatic re-
sponses to environmental flows.
Streamflow Data and Analysis
Modeling and predicting channel and habitat
response to environmental flow releases requires
streamflow information, particularly for peak
flows, when bed-material transport, bank erosion,
and off-channel habitat creation occurs. Although
there is currently a good network of gages
throughout the Santiam River basin, additional
streamflow and stage monitoring (both continu-
ous and partial-record) are needed in high-
priority, multi-thread reaches to relate geo-
morphic processes (such as flood-plain inunda-
tion and scouring of secondary channels) with
streamflow. Streamflow data can be tied with
ecological information, such as hydrologic con-
nectivity between main-stem and off-channel
habitats during high flows and flow recession, to
better assess the specific impacts of environmen-
tal flow releases on habitat availability to target
species.
In addition to new data collection, one- or
two-dimensional hydraulic modeling can be used
to estimate water-surface elevations during low-
flow conditions in reaches that are affected by
surface-water withdrawals and possible dam op-
erations. This type of modeling can predict habi-
tat loss caused by the dewatering of side channels
and alcoves in alluvial flood plains.
Bed-Material Transport Rates and Sediment Budget
A sediment budget for the Santiam River ba-
sin would help assess the effects of environmen-
tal flow releases on channel erosion and aggrada-
tion, which affect the quality of terrestrial and
aquatic habitats. The budget would focus on es-
timates and (or) measurements of bed-load
transport, which carries gravel and other material
that build and maintain spawning habitats, gravel
bars, and other low-elevation features within the
active channel. By comparing the volumes of
gravel exiting the Santiam River basin to the vol-
ume of gravel delivered to the study area and the
volume released through bank erosion, future
channel change under different flow and sedi-
ment-release scenarios can be evaluated.
Because sediment budgets rely on sediment
transport rates, which are difficult to measure, an
approach for developing a sediment budget might
include several of the following methods to esti-
mate sediment transport:
1. Sediment flux estimates based on bed-
load transport equations (Wallick and oth-
ers, 2010, 2011). Bed-load transport equa-
tions calculate transport capacity, and be-
cause bed-material supply has been sub-
stantially reduced by the Santiam River
basin dams, most downstream reaches are
likely supply limited (meaning the
transport capacity of the river exceeds the
available supply of sediment). Sediment
flux estimates from bed-load transport
equations applied to alluvial reaches will
likely provide an estimate of maximum
plausible transport.
2. Direct measurements of bed-load
transport to verify bed-load transport
equations and to estimate bed-load fluxes.
Ideally, such measurements would be col-
lected near active USGS gages and down-
stream from potentially gravel-rich tribu-
taries to provide accurate estimates of to-
tal bed-material flux into the lower, allu-
vial reaches.
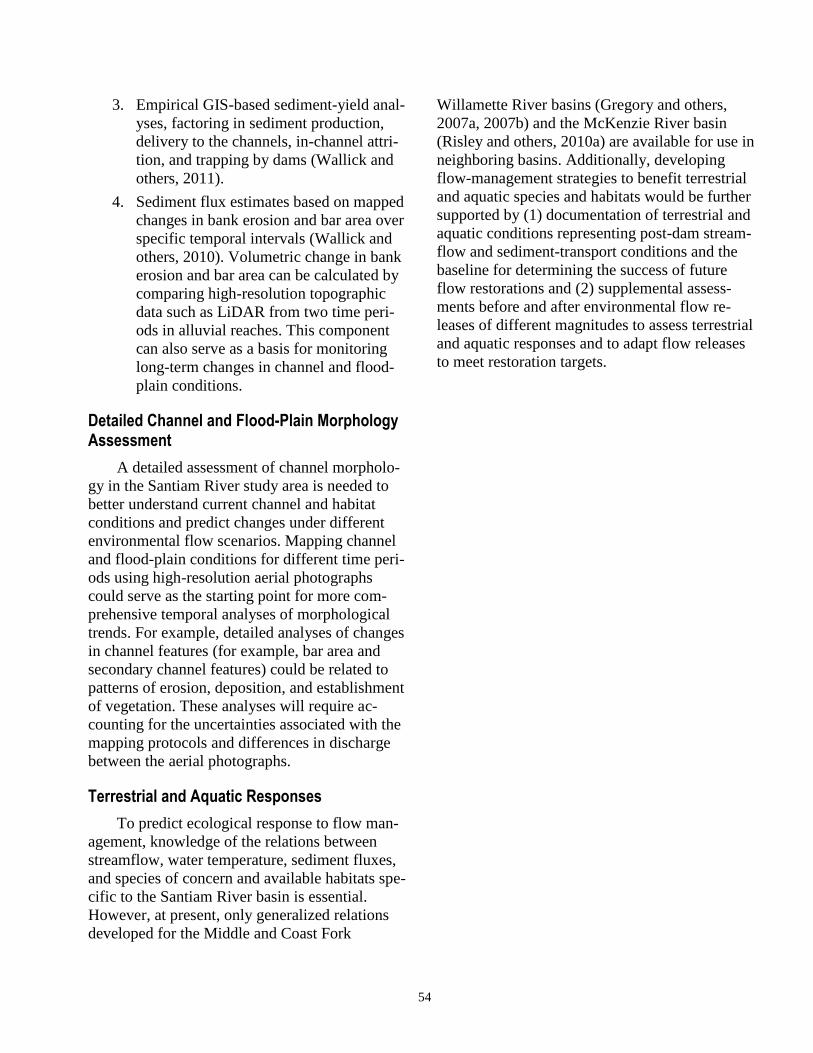
54
3. Empirical GIS-based sediment-yield anal-
yses, factoring in sediment production,
delivery to the channels, in-channel attri-
tion, and trapping by dams (Wallick and
others, 2011).
4. Sediment flux estimates based on mapped
changes in bank erosion and bar area over
specific temporal intervals (Wallick and
others, 2010). Volumetric change in bank
erosion and bar area can be calculated by
comparing high-resolution topographic
data such as LiDAR from two time peri-
ods in alluvial reaches. This component
can also serve as a basis for monitoring
long-term changes in channel and flood-
plain conditions.
Detailed Channel and Flood-Plain Morphology Assessment
A detailed assessment of channel morpholo-
gy in the Santiam River study area is needed to
better understand current channel and habitat
conditions and predict changes under different
environmental flow scenarios. Mapping channel
and flood-plain conditions for different time peri-
ods using high-resolution aerial photographs
could serve as the starting point for more com-
prehensive temporal analyses of morphological
trends. For example, detailed analyses of changes
in channel features (for example, bar area and
secondary channel features) could be related to
patterns of erosion, deposition, and establishment
of vegetation. These analyses will require ac-
counting for the uncertainties associated with the
mapping protocols and differences in discharge
between the aerial photographs.
Terrestrial and Aquatic Responses
To predict ecological response to flow man-
agement, knowledge of the relations between
streamflow, water temperature, sediment fluxes,
and species of concern and available habitats spe-
cific to the Santiam River basin is essential.
However, at present, only generalized relations
developed for the Middle and Coast Fork
Willamette River basins (Gregory and others,
2007a, 2007b) and the McKenzie River basin
(Risley and others, 2010a) are available for use in
neighboring basins. Additionally, developing
flow-management strategies to benefit terrestrial
and aquatic species and habitats would be further
supported by (1) documentation of terrestrial and
aquatic conditions representing post-dam stream-
flow and sediment-transport conditions and the
baseline for determining the success of future
flow restorations and (2) supplemental assess-
ments before and after environmental flow re-
leases of different magnitudes to assess terrestrial
and aquatic responses and to adapt flow releases
to meet restoration targets.
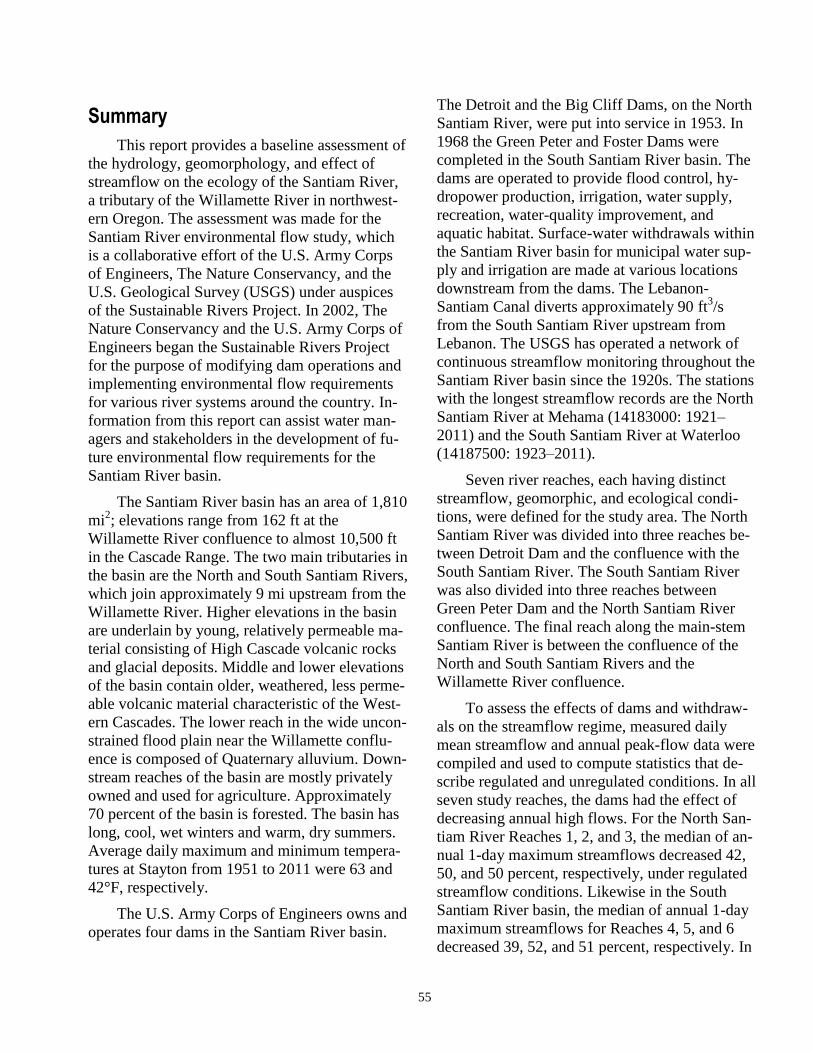
55
Summary
This report provides a baseline assessment of
the hydrology, geomorphology, and effect of
streamflow on the ecology of the Santiam River,
a tributary of the Willamette River in northwest-
ern Oregon. The assessment was made for the
Santiam River environmental flow study, which
is a collaborative effort of the U.S. Army Corps
of Engineers, The Nature Conservancy, and the
U.S. Geological Survey (USGS) under auspices
of the Sustainable Rivers Project. In 2002, The
Nature Conservancy and the U.S. Army Corps of
Engineers began the Sustainable Rivers Project
for the purpose of modifying dam operations and
implementing environmental flow requirements
for various river systems around the country. In-
formation from this report can assist water man-
agers and stakeholders in the development of fu-
ture environmental flow requirements for the
Santiam River basin.
The Santiam River basin has an area of 1,810
mi2; elevations range from 162 ft at the
Willamette River confluence to almost 10,500 ft
in the Cascade Range. The two main tributaries in
the basin are the North and South Santiam Rivers,
which join approximately 9 mi upstream from the
Willamette River. Higher elevations in the basin
are underlain by young, relatively permeable ma-
terial consisting of High Cascade volcanic rocks
and glacial deposits. Middle and lower elevations
of the basin contain older, weathered, less perme-
able volcanic material characteristic of the West-
ern Cascades. The lower reach in the wide uncon-
strained flood plain near the Willamette conflu-
ence is composed of Quaternary alluvium. Down-
stream reaches of the basin are mostly privately
owned and used for agriculture. Approximately
70 percent of the basin is forested. The basin has
long, cool, wet winters and warm, dry summers.
Average daily maximum and minimum tempera-
tures at Stayton from 1951 to 2011 were 63 and
42°F, respectively.
The U.S. Army Corps of Engineers owns and
operates four dams in the Santiam River basin.
The Detroit and the Big Cliff Dams, on the North
Santiam River, were put into service in 1953. In
1968 the Green Peter and Foster Dams were
completed in the South Santiam River basin. The
dams are operated to provide flood control, hy-
dropower production, irrigation, water supply,
recreation, water-quality improvement, and
aquatic habitat. Surface-water withdrawals within
the Santiam River basin for municipal water sup-
ply and irrigation are made at various locations
downstream from the dams. The Lebanon-
Santiam Canal diverts approximately 90 ft3/s
from the South Santiam River upstream from
Lebanon. The USGS has operated a network of
continuous streamflow monitoring throughout the
Santiam River basin since the 1920s. The stations
with the longest streamflow records are the North
Santiam River at Mehama (14183000: 1921–
2011) and the South Santiam River at Waterloo
(14187500: 1923–2011).
Seven river reaches, each having distinct
streamflow, geomorphic, and ecological condi-
tions, were defined for the study area. The North
Santiam River was divided into three reaches be-
tween Detroit Dam and the confluence with the
South Santiam River. The South Santiam River
was also divided into three reaches between
Green Peter Dam and the North Santiam River
confluence. The final reach along the main-stem
Santiam River is between the confluence of the
North and South Santiam Rivers and the
Willamette River confluence.
To assess the effects of dams and withdraw-
als on the streamflow regime, measured daily
mean streamflow and annual peak-flow data were
compiled and used to compute statistics that de-
scribe regulated and unregulated conditions. In all
seven study reaches, the dams had the effect of
decreasing annual high flows. For the North San-
tiam River Reaches 1, 2, and 3, the median of an-
nual 1-day maximum streamflows decreased 42,
50, and 50 percent, respectively, under regulated
streamflow conditions. Likewise in the South
Santiam River basin, the median of annual 1-day
maximum streamflows for Reaches 4, 5, and 6
decreased 39, 52, and 51 percent, respectively. In
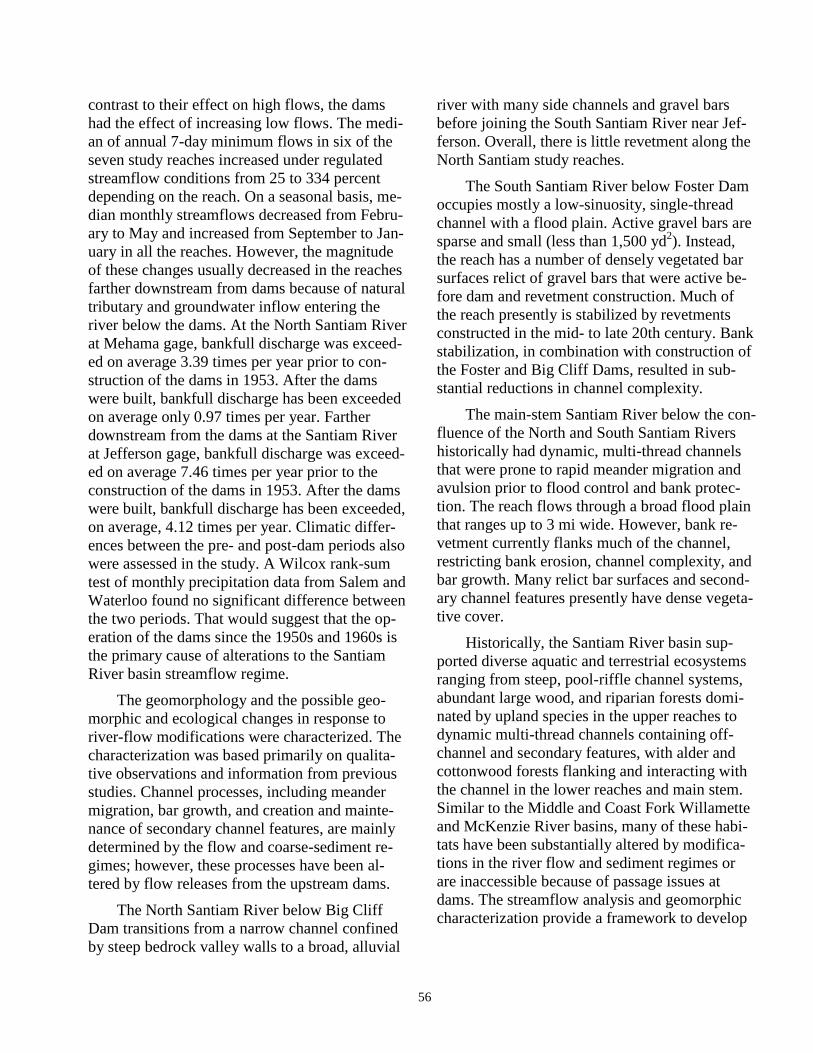
56
contrast to their effect on high flows, the dams
had the effect of increasing low flows. The medi-
an of annual 7-day minimum flows in six of the
seven study reaches increased under regulated
streamflow conditions from 25 to 334 percent
depending on the reach. On a seasonal basis, me-
dian monthly streamflows decreased from Febru-
ary to May and increased from September to Jan-
uary in all the reaches. However, the magnitude
of these changes usually decreased in the reaches
farther downstream from dams because of natural
tributary and groundwater inflow entering the
river below the dams. At the North Santiam River
at Mehama gage, bankfull discharge was exceed-
ed on average 3.39 times per year prior to con-
struction of the dams in 1953. After the dams
were built, bankfull discharge has been exceeded
on average only 0.97 times per year. Farther
downstream from the dams at the Santiam River
at Jefferson gage, bankfull discharge was exceed-
ed on average 7.46 times per year prior to the
construction of the dams in 1953. After the dams
were built, bankfull discharge has been exceeded,
on average, 4.12 times per year. Climatic differ-
ences between the pre- and post-dam periods also
were assessed in the study. A Wilcox rank-sum
test of monthly precipitation data from Salem and
Waterloo found no significant difference between
the two periods. That would suggest that the op-
eration of the dams since the 1950s and 1960s is
the primary cause of alterations to the Santiam
River basin streamflow regime.
The geomorphology and the possible geo-
morphic and ecological changes in response to
river-flow modifications were characterized. The
characterization was based primarily on qualita-
tive observations and information from previous
studies. Channel processes, including meander
migration, bar growth, and creation and mainte-
nance of secondary channel features, are mainly
determined by the flow and coarse-sediment re-
gimes; however, these processes have been al-
tered by flow releases from the upstream dams.
The North Santiam River below Big Cliff
Dam transitions from a narrow channel confined
by steep bedrock valley walls to a broad, alluvial
river with many side channels and gravel bars
before joining the South Santiam River near Jef-
ferson. Overall, there is little revetment along the
North Santiam study reaches.
The South Santiam River below Foster Dam
occupies mostly a low-sinuosity, single-thread
channel with a flood plain. Active gravel bars are
sparse and small (less than 1,500 yd2). Instead,
the reach has a number of densely vegetated bar
surfaces relict of gravel bars that were active be-
fore dam and revetment construction. Much of
the reach presently is stabilized by revetments
constructed in the mid- to late 20th century. Bank
stabilization, in combination with construction of
the Foster and Big Cliff Dams, resulted in sub-
stantial reductions in channel complexity.
The main-stem Santiam River below the con-
fluence of the North and South Santiam Rivers
historically had dynamic, multi-thread channels
that were prone to rapid meander migration and
avulsion prior to flood control and bank protec-
tion. The reach flows through a broad flood plain
that ranges up to 3 mi wide. However, bank re-
vetment currently flanks much of the channel,
restricting bank erosion, channel complexity, and
bar growth. Many relict bar surfaces and second-
ary channel features presently have dense vegeta-
tive cover.
Historically, the Santiam River basin sup-
ported diverse aquatic and terrestrial ecosystems
ranging from steep, pool-riffle channel systems,
abundant large wood, and riparian forests domi-
nated by upland species in the upper reaches to
dynamic multi-thread channels containing off-
channel and secondary features, with alder and
cottonwood forests flanking and interacting with
the channel in the lower reaches and main stem.
Similar to the Middle and Coast Fork Willamette
and McKenzie River basins, many of these habi-
tats have been substantially altered by modifica-
tions in the river flow and sediment regimes or
are inaccessible because of passage issues at
dams. The streamflow analysis and geomorphic
characterization provide a framework to develop

57
environmental flows to restore the historic di-
verse aquatic and terrestrial ecosystems.
Suggestions for future ecological monitoring
and investigations in the Santiam River basin in-
clude additional streamflow data collection and
analysis, computing bed-material transport rates
and a sediment budget, a detailed channel and
flood-plain morphology assessment, and deter-
mining terrestrial and aquatic responses to
streamflow management.
Acknowledgements
The authors thank Christine Budai, Keith
Duffy, Jerry Otto, and Greg Taylor, Portland Dis-
trict, U.S. Army Corps of Engineers; Leslie Bach,
The Nature Conservancy, Portland, Oregon; Mike
McCord and Michael Mattick, Oregon Water Re-
sources Department; and Jay Spillum, U.S. Geo-
logical Survey Oregon Water Science Center for
their assistance in this study.
References Cited
Acreman, M., and Dunbar, M.J., 2004, Defining
environmental flow requirements–A review:
Hydrology and Earth System Sciences, v. 8, no.
5, p. 861–876.
Bragg, H.M., Sobieszczyk, Steven, Uhrich, M.A.,
and Piatt, D.R., 2007, Suspended-sediment
loads and yields in the North Santiam River ba-
sin, Oregon, water years 1999-2004: U.S. Geo-
logical Survey Scientific Investigations Report
2007–5187, 27 p.
Bragg, H.M., and Uhrich, M.A., 2010, Suspend-
ed-sediment budget for the North Santiam Riv-
er basin, Oregon, water years 2005–08: U.S.
Geological Survey Scientific Investigations
Report 2010–5038, 26 p.
Buccola, N.L., and Rounds, S.A., 2011, Simulat-
ing potential structural and operational changes
for Detroit Dam on the North Santiam River,
Oregon—Interim Results: U.S. Geological
Survey Open-File Report 2011–1268, 25 p.
Conlon, T.D., Wozniak, K.C., Woodcock, Doug-
las, Herrera, N.B., Fisher, B.J., Morgan, D.S.,
Lee, K.K., and Hinkle, S.R., 2005, Ground-
water hydrology of the Willamette basin, Ore-
gon: U.S. Geological Survey Scientific Investi-
gations Report 2005–5168, 83 p.
Cooper, R.M., 2002, Determining surface water
availability in Oregon: State of Oregon Water
Resources Department Open-File Report SW
02–002, 157 p.
E and S Environmental Chemistry, Inc., 2002,
North Santiam River watershed assessment:
Corvallis, Oregon, 290 p., accessed July 2,
2012, at
http://www.nsantiamwatershed.org/wp-content
/uploads/2009/09/NSW_Assessment.pdf.
E and S Environmental Chemistry, Inc., and
South Santiam Watershed Council, 2000, South
Santiam watershed assessment: Corvallis, Ore-
gon, 224 p., accessed July 2, 2012, at
http://www.sswc.org/wp-
content/uploads/2008/12/South-Santiam-
Watershed-Assessment-January-2000.pdf.
Fletcher, W.B., and Davidson, L.D., 1988, South
Santiam River Bank Protection Study, Pilot
Project for Willamette River Bank Protection
Study: Portland, Oregon, U.S. Army Corps of
Engineers, 36 p.
Gregory, S., Ashkenas, L., Haggerty, P., Oetter,
D., Wildman, K., Hulse, D., Branscomb, A. and
Van Sickle, J., 2002a, Riparian vegetation, in
Hulse, D., Gregory, S., and Baker, J., eds.,
Willamette River basin atlas: Corvallis, Ore-
gon, Oregon State University Press, p. 40., ac-
cessed July 2, 2012, at
http://www.fsl.orst.edu/pnwerc/wrb/Atlas_web_
compressed/4.Biotic_Systems/4c.riparian_
veg_web.pdf.
Gregory, S., Ashkenas, L., Oetter, D., Minear, P.
and Wildman, K., 2002b, Historical Willamette
River channel change, in Hulse, D., Gregory,
S., and Baker, J., eds., Willamette River basin
atlas: Corvallis, Oregon, Oregon State Univer-
sity Press, p. 18–24., accessed July 2, 2012, at
http://www.fsl.orst.edu/pnwerc/wrb/
Atlas_web_compressed/
3.Water_Resources/3c.historic_chl_web.pdf.
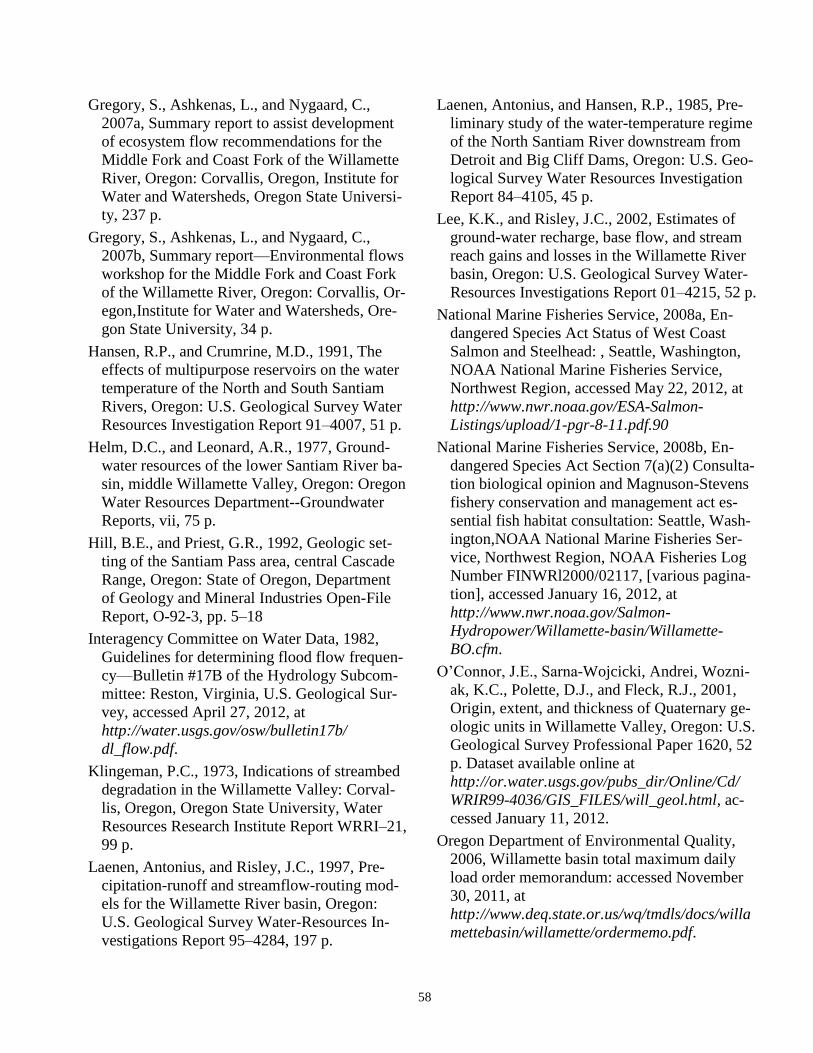
58
Gregory, S., Ashkenas, L., and Nygaard, C.,
2007a, Summary report to assist development
of ecosystem flow recommendations for the
Middle Fork and Coast Fork of the Willamette
River, Oregon: Corvallis, Oregon, Institute for
Water and Watersheds, Oregon State Universi-
ty, 237 p.
Gregory, S., Ashkenas, L., and Nygaard, C.,
2007b, Summary report—Environmental flows
workshop for the Middle Fork and Coast Fork
of the Willamette River, Oregon: Corvallis, Or-
egon,Institute for Water and Watersheds, Ore-
gon State University, 34 p.
Hansen, R.P., and Crumrine, M.D., 1991, The
effects of multipurpose reservoirs on the water
temperature of the North and South Santiam
Rivers, Oregon: U.S. Geological Survey Water
Resources Investigation Report 91–4007, 51 p.
Helm, D.C., and Leonard, A.R., 1977, Ground-
water resources of the lower Santiam River ba-
sin, middle Willamette Valley, Oregon: Oregon
Water Resources Department--Groundwater
Reports, vii, 75 p.
Hill, B.E., and Priest, G.R., 1992, Geologic set-
ting of the Santiam Pass area, central Cascade
Range, Oregon: State of Oregon, Department
of Geology and Mineral Industries Open-File
Report, O-92-3, pp. 5–18
Interagency Committee on Water Data, 1982,
Guidelines for determining flood flow frequen-
cy—Bulletin #17B of the Hydrology Subcom-
mittee: Reston, Virginia, U.S. Geological Sur-
vey, accessed April 27, 2012, at
http://water.usgs.gov/osw/bulletin17b/
dl_flow.pdf.
Klingeman, P.C., 1973, Indications of streambed
degradation in the Willamette Valley: Corval-
lis, Oregon, Oregon State University, Water
Resources Research Institute Report WRRI–21,
99 p.
Laenen, Antonius, and Risley, J.C., 1997, Pre-
cipitation-runoff and streamflow-routing mod-
els for the Willamette River basin, Oregon:
U.S. Geological Survey Water-Resources In-
vestigations Report 95–4284, 197 p.
Laenen, Antonius, and Hansen, R.P., 1985, Pre-
liminary study of the water-temperature regime
of the North Santiam River downstream from
Detroit and Big Cliff Dams, Oregon: U.S. Geo-
logical Survey Water Resources Investigation
Report 84–4105, 45 p.
Lee, K.K., and Risley, J.C., 2002, Estimates of
ground-water recharge, base flow, and stream
reach gains and losses in the Willamette River
basin, Oregon: U.S. Geological Survey Water-
Resources Investigations Report 01–4215, 52 p.
National Marine Fisheries Service, 2008a, En-
dangered Species Act Status of West Coast
Salmon and Steelhead: , Seattle, Washington,
NOAA National Marine Fisheries Service,
Northwest Region, accessed May 22, 2012, at
http://www.nwr.noaa.gov/ESA-Salmon-
Listings/upload/1-pgr-8-11.pdf.90
National Marine Fisheries Service, 2008b, En-
dangered Species Act Section 7(a)(2) Consulta-
tion biological opinion and Magnuson-Stevens
fishery conservation and management act es-
sential fish habitat consultation: Seattle, Wash-
ington,NOAA National Marine Fisheries Ser-
vice, Northwest Region, NOAA Fisheries Log
Number FINWRl2000/02117, [various pagina-
tion], accessed January 16, 2012, at
http://www.nwr.noaa.gov/Salmon-
Hydropower/Willamette-basin/Willamette-
BO.cfm.
O’Connor, J.E., Sarna-Wojcicki, Andrei, Wozni-
ak, K.C., Polette, D.J., and Fleck, R.J., 2001,
Origin, extent, and thickness of Quaternary ge-
ologic units in Willamette Valley, Oregon: U.S.
Geological Survey Professional Paper 1620, 52
p. Dataset available online at
http://or.water.usgs.gov/pubs_dir/Online/Cd/
WRIR99-4036/GIS_FILES/will_geol.html, ac-
cessed January 11, 2012.
Oregon Department of Environmental Quality,
2006, Willamette basin total maximum daily
load order memorandum: accessed November
30, 2011, at
http://www.deq.state.or.us/wq/tmdls/docs/willa
mettebasin/willamette/ordermemo.pdf.

59
Oregon Water Resources Department, 2012, Wa-
ter use reporting database: accessed March 7,
2012, at
http://apps.wrd.state.or.us/apps/wr/wateruse_
report/.
Piatt, D.R., Johnston, M.W., Bragg, H.M.,
Brooks, A.M., Sobieszczyk, Steven, and
Uhrich, M.A., 2011, Water-quality in the North
Santiam River basin, Oregon—Comparison of
water-quality data for water year 2007 with the
preceding period of record: U.S. Geological
Survey Open-File Report 2011–1008, 75 p.
Reiser, D.W., and White, R.G., 1983, Effects of
complete redd dewatering on salmonid egg-
hatching success and development of juveniles:
Transactions of American Fisheries Society, v.
112, p. 532–540.
Richter, B.D., Warner, A.T., Meyer, J.L., and
Lutz, K., 2006, A collaborative and adaptive
process for developing environmental flow rec-
ommendations: River Research and Applica-
tions, v. 22, p. 297–318, DOI: 10.1002/rra.892.
Risley, John, Wallick, J.R., Waite, Ian, and
Stonewall, Adam, 2010a, Development of an
environmental flow framework for the McKen-
zie River basin, Oregon: U.S. Geological Sur-
vey Scientific Investigations Report 2010–
5016, 94 p.
Risley, J.C., Bach, L., and Wallick, J.R., 2010b,
Summary report—Environmental flows work-
shop for the McKenzie River, Oregon: The Na-
ture Conservancy, Portland, Oregon, 40 p.
Rounds, S.A., 2010, Thermal effects of dams in
the Willamette River basin, Oregon: U.S. Geo-
logical Survey Scientific Investigations Report
2010–5153, 64 p.
Sherrod, D., Ingebritsen, S.E., Curless, J.M.,
Keith, T.E., Diaz, N.M., and DeRoo, T.G., and
Hurlocker, S.L., 1996, Water, rocks, and
woods; a field excursion to examine the geolo-
gy, hydrology, and geothermal resources in the
Clackamas, North Santiam, and McKenzie
River drainages, Cascade Range, Oregon: Ore-
gon Geology, v. 58, no. 5, 103 p.
Sobieszczyk, Steven, Uhrich, M.A., and Bragg,
H.M., 2007, Major turbidity events in the North
Santiam River basin, Oregon, water years
1999–2004: U.S. Geological Survey Scientific
Investigations Report 2007–5178, 51 p.
Speers, D.D., and Versteeg, J.D., 1982, Runoff
forecasting for reservoir operations—The past
and the future (Santiam River basin, Detroit
reservoir), Proceedings of the Eastern Snow
Conference, 39th annual meeting, April 19–23,
Reno, Nevada: p. 149–156.
Sullivan, A.B., and Rounds, S.A., 2004, Model-
ing streamflow and water temperature in the
North Santiam and Santiam Rivers, Oregon,
2001–02: U.S. Geological Survey Scientific In-
vestigations Report 2004–5001, 36 p.
Sullivan, A.B., Rounds, S.A., Sobieszczyk, Ste-
ven, and Bragg, H.M., 2007, Modeling hydro-
dynamics, water temperature, and suspended
sediment in Detroit Lake, Oregon: U.S. Geo-
logical Survey Scientific Investigations Report
2007–5008, 40 p.
Tharme, R.E., 2003, A global perspective on en-
vironmental flow assessment: emerging trends
in the development and application of envi-
ronmental flow methodologies for rivers: River
Research and Applications, v. 19, p. 397–441,
DOI: 10.1002/rra.736.
Thayer, T.P., 1936, Geology of the Salem Hills
and the North Santiam River basin, Oregon:
Oregon Department of Geology and Mineral
Industries, Bulletin no. 15, 40 p.
Thayer, T.P., 1936, Structure of the North San-
tiam River section of the Cascade Mountains in
Oregon: The Journal of Geology, v. 44, no. 6,
p. 701–716.
The Nature Conservancy, 2007, Indicators of hy-
drologic alteration—Version 7 User’s manual:
The Nature Conservancy, 75 p., accessed De-
cember 19, 2011, at
http://conserveonline.org/workspaces/iha/docu
ments/download/view.html.
The Nature Conservancy, 2009, The Sustainable
Rivers Project: accessed November 18, 2011, at
60
http://www.nature.org/ourinitiatives/habitats/ri
verslakes/sustainable-rivers-project.xml
Uhrich, M.A., and Bragg, H.M., 2003, Monitor-
ing instream turbidity to estimate continuous
suspended-sediment loads and yields and clay-
water volumes in the Upper North Santiam
River basin, Oregon, 1998–2000: U.S. Geolog-
ical Survey Water Resources Investigation Re-
port 03–4098, 44 p.
U.S. Army Corps of Engineers (USACE), 2007,
Supplemental biological assessment of the ef-
fects of the Willamette River basin flood con-
trol project on species listed under the Endan-
gered Species Act—Submitted to National Ma-
rine Fisheries Service and U.S. Fish and Wild-
life Service, [variously paged]: accessed May
22, 2012, at
http://www.nwp.usace.army.mil/Portals/24/doc
s/environment/biop/Final_Will_Suppl_BA.pdf
U.S. Fish and Wildlife Service (USFWS), 2008,
Final Biological Opinion on the continued op-
eration and maintenance of the Willamette Riv-
er basin Project and effects to Oregon Chub,
Bull Trout, and Bull Trout Critical Habitat des-
ignated under the Endangered Species Act—
Submitted to U.S. Army Corps of Engineers,
Bonneville Power Administration, and Bureau
of Reclamation, [variously paged]: accessed
January 16, 2012, at
http://www.nwr.noaa.gov/Salmon-
Hydropower/Willamette-basin/Willamette-
BO.cfm.
U.S. Geological Survey, 2012, StreamStats: ac-
cessed March 7, 2012, at
http://water.usgs.gov/osw/streamstats
/index.html.
Wallick, J.R., Lancaster, S.T., and Bolte, J.P.,
2006, Determination of bank erodibility for
natural and anthropogenic bank materials using
a model of lateral migration and observed ero-
sion along the Willamette River, Oregon—
USA: River Research and Applications, v. 22,
p. 631–649.
Wallick, J.R., Grant, G.E., Lancaster, S.T., Bolte,
J.P., and Denlinger, R.P., 2007, Patterns and
controls on historical channel change in the
Willamette River, Oregon, in Gupta, A.V., ed.,
Large rivers—Geomorphology and manage-
ment: John Wiley and Sons, p. 491–516.
Wallick, J.R., Anderson, S.W., Cannon, Charles,
and O’Connor, J.E., 2010, Channel change and
bed-material transport in the lower Chetco Riv-
er, Oregon: U.S. Geological Survey Scientific
Investigations Report 2010–5065, 68 p.
Wallick, J.R., O'Connor, J.E., Anderson, Scott,
Keith, Mackenzie, Cannon, Charles, and Ris-
ley, J.C., 2011, Channel change and bed-
material transport in the Umpqua River basin,
Oregon: U.S. Geological Survey Scientific In-
vestigations Report 2011–5041, 112 p., ac-
cessed November 10, 2011, at
http://pubs.usgs.gov/sir/2011/5041/.
Western Regional Climate Center, 2012, Web-
site—Cooperative climatological data summar-
ies: accessed June 14, 2012, at
http://www.wrcc.dri.edu/climatedata/climsum/.
Wolman, M.G., and Miller, J.P., 1960, Magnitude
and frequency of forces in geomorphic pro-
cesses: Journal of Geology, v. 68, no. 1, p. 54–
74.
61
Appendix A. Streamflow Data Time-Series Extension
Microsoft® Excel® files containing the daily mean streamflow data time-series extensions for each
of the seven study reaches can be downloaded from http://pubs.usgs.gov/of/2012/1133/.
In each file, there is a “Read me” worksheet that explains how the streamflow time series for the
reach was extended to cover missing periods. Each file also includes computed unregulated daily-mean
streamflow data time series, provided by the U.S. Army Corps of Engineers, which were used in the
study. The equations used to compute the unregulated daily-mean streamflow time series are provided
in Appendix B.
Appendix B. U.S. Army Corps of Engineers Computed Unregulated Streamflow Data Time Series
This appendix contains methods and equations from U.S. Army Corps of Engineers used to com-
pute six daily mean unregulated streamflow time series for the Santiam River basin (Keith Duffy, U.S.
Army Corps of Engineers, written commun., 2011). One or more of these six time series were used in
each of the seven Excel files described in Appendix A. However, all six time series are shown together
in the worksheet labeled “2. Unregulated flow” in the Flow_extension_reach7.xls Excel file.
1. North Santiam River at Detroit Dam
10/01/1935–09/30/1938
Combined observed flows of:
USGS 14178000 (North Santiam River above Boulder Creek near Detroit, Oregon) and
USGS 14179000 (Breitenbush River above French Creek near Detroit, Oregon)
Plus local inflows computed as:
USGS 14183000 (North Santiam River at Mehama, Oregon)
Minus the sum of:
USGS 14182500 (Little North Santiam River near Mehama, Oregon),
USGS 14178000 (lagged by 6 hours), and
USGS 14179000 (lagged by 6 hours)
Adjusted by a drainage area ratio (DAR) of 0.509
10/01/1938–10/30/1952
Observed flow of:
USGS 14181500 (North Santiam River at Niagara, Oregon)
Adjusted by DAR (0.960)

62
10/01/1952–09/30/1960
Calculated inflow (Modified Flows)
Adjusted by DAR (0.960)
10/01/1960–09/30/2009
Quality controlled Dataquery project inflows
2. Local inflows to North Santiam River at Mehama, Oregon (14183000)
10/01/1935–09/30/1938
Observed flow of:
USGS 14172500 (Little North Santiam River near Mehama, Oregon)
Plus local inflows computed as:
USGS 14183000 (North Santiam River at Mehama, Oregon)
Minus the sum of:
USGS 14182500 (Little North Santiam River near Mehama, Oregon),
USGS 14178000 (lagged by 6 hours), and
USGS 14179000 (lagged by 6 hours)
Adjusted by DAR (0.491)
10/01/1938–09/30/2009
Observed flow of:
USGS 14183000 (North Santiam River at Mehama, Oregon)
Minus routed flow of:
USGS 14181500 (North Santiam River at Niagara, Oregon)
Adjusted by DAR (1.091)
3. Middle Santiam River at Green Peter Dam
10/01/1935–09/30/1947
Observed flow of:
USGS 14186000 (Middle Santiam River near Foster, Oregon)

63
10/01/1947–09/30/1950
Observed flow of:
USGS 14185000 (South Santiam River below Cascadia, Oregon)
Adjusted by regression coefficient (2.022)
10/01/1950–09/30/1966
Observed flow of:
USGS 14186500 (Middle Santiam River at mouth near Foster, Oregon)
Adjusted by DAR (0.959)
10/01/1966–06/21/1967
Combined observed flow of:
USGS 14185800 (Middle Santiam River near Cascadia, Oregon) and
USGS 14185900 (Quartzville Creek near Cascadia, Oregon)
Sum adjusted by regression coefficient (1.245)
06/22/1967–09/30/2009
Calculated inflow (Dataquery)
4. Local inflows to South Santiam River at Foster Dam
10/1/1935–8/22/1968
Observed flow of:
USGS 14185000 (South Santiam River below Cascadia, Oregon)
Adjusted by regression coefficient (1.194)
8/23/1968–9/30/2009
Calculated inflow (Dataquery) minus Green Peter outflow (Dataquery)
5. Local inflows to South Santiam River at Waterloo, Oregon (14187500)
10/01/1935–09/30/1947
Observed flow of:
USGS 14187500 (South Santiam River at Waterloo, Oregon)
64
Minus combined routed flow of:
USGS 14185000 (South Santiam River below Cascadia, Oregon) and
USGS 14186000 (Middle Santiam River near Foster, Oregon)
Adjusted by DAR (0.761)
10/01/1947–09/30/1950
Observed flow of:
USGS 14187500 (South Santiam River at Waterloo, Oregon)
Minus routed flow of:
USGS 14185000 (South Santiam River below Cascadia, Oregon)
Adjusted by DAR (0.318)
10/01/1950–09/30/1966
Observed flow of:
USGS 14187500 (South Santiam River at Waterloo, Oregon)
Minus combined routed flow of:
USGS 14185000 (South Santiam River below Cascadia, Oregon) and
USGS 14186500 (Middle Santiam River at mouth near Foster, Oregon)
Adjusted by DAR (0.829)
10/01/1966–07/31/1973
Observed flow of:
USGS 14187500 (South Santiam River at Waterloo, Oregon)
Minus routed flow of:
USGS 14186700 (South Santiam River at Foster, Oregon)
08/01/1973–09/29/1988
Observed flow of:
USGS 14187500 (South Santiam River at Waterloo, Oregon)
Minus routed flow of:
USGS 14187200 (South Santiam River near Foster, Oregon)
Adjusted by DAR (1.037)
Plus routed flow of:
USGS 14187100 (Wiley Creek at Foster, Oregon)
65
09/30/1988 -09/30/2009
Observed flow of:
USGS 14187500 (South Santiam River at Waterloo, Oregon)
Minus routed flow of:
USGS 14187200 (South Santiam River near Foster, Oregon)
Adjusted by DAR (1.164)
Plus routed flow of:
USGS 14187000 (Wiley Creek near Foster, Oregon)
6. Local inflows to Santiam River at Jefferson, Oregon (14189000)
10/01/1935–09/30/1939
Observed flow of:
USGS 14191000 (Willamette River at Salem, Oregon)
Minus combined routed flows of:
USGS 14187500 (South Santiam River at Waterloo, Oregon),
USGS 14183000 (North Santiam River at Mehama, Oregon), and
USGS 14174000 (Willamette River at Albany, Oregon)
Adjusted by DAR (0.433)
10/01/1939–09/30/2009
Observed flow of:
USGS 14189000 (Santiam River at Jefferson, Oregon)
Minus combined routed flows of:
USGS 14187500 (South Santiam River at Waterloo, Oregon)
USGS 14183000 (North Santiam River at Mehama, Oregon)
66
Appendix C. Indicators of Hydrologic Alteration Results
Microsoft Excel files containing the results of the Indicator of Hydrologic Alteration analysis for
each of the seven study reaches may be downloaded from http://pubs.usgs.gov/of/2012/1133/.
Appendix D. Description of Study Reaches
A Microsoft Excel spreadsheet containing descriptions of the seven study reaches may be accessed
at http://pubs.usgs.gov/of/2012/1133/.

Risley and others—
An
En
viron
men
tal Stream
flow
Assessm
ent fo
r the S
antiam
River B
asin, O
rego
n—
Open-F
ile Report 2012–1133
Related Documents