. I NASA TECHNICAL NOTE NASA TN D-3883 0 (ACCESSION NUMBER) (THRU) v (PAGES) L (NASA CR OR TMX OR AD NUMBER) E _t A N EMPIRICAL EQUATION RELATING FATIGUE LIMIT AND MEAN STRESS by 1. E, Figge Langley Research Center Langley Station, Hampton, Vk NATIONAL AERONAUTICS AND SPACE ADMINISTRATION WASHINGTON, D. c. APRIL 1967

Welcome message from author
This document is posted to help you gain knowledge. Please leave a comment to let me know what you think about it! Share it to your friends and learn new things together.
Transcript
. I
N A S A TECHNICAL NOTE N A S A TN D-3883
0
(ACCESSION NUMBER) (THRU) v
(PAGES)
L (NASA CR O R TMX OR AD NUMBER)
E _t
A N EMPIRICAL EQUATION RELATING FATIGUE LIMIT AND MEAN STRESS
by 1. E, Figge
Langley Research Center Langley Station, Hampton, V k
N A T I O N A L A E R O N A U T I C S A N D SPACE A D M I N I S T R A T I O N W A S H I N G T O N , D. c. APRIL 1967
AN EMPIRICAL EQUATION RELATING
FATIGUE LIMIT AND MEAN STRESS
By I. E. Figge
NASA TN D-3883
Langley Research Center Langley Station, Hampton, Va.
NATIONAL AERONAUTICS AND SPACE ADMINISTRATION
For sale by the Clearinghouse for Federal Scientific and Technical Information Springfield, Virginia 22151 - CFSTI price $3.00
AN EMPIRICAL EQUATION RELATING
FATIGUE LIMIT AND MEAN STRESS
By I. E. Figge Langley Research Center
SUMMARY
An empirical relation has been developed to predict the fatigue limit of axially loaded unnotched specimens as a function of mean stress. Both the ultimate tensile strength and the fatigue limit at zero mean stress are required in the basic equation. An ancillary equation was deve!opx! tn represent the fatigue limit at zero mean s t r e s s as a function of the ultimate tensile strength. Comparisons demonstrating the improveiiierit of the proposed relations over the Gerber and Goodman relations a r e presented for five major material classes: bare aluminum, clad aluminum, low alloy steels, stainless steels and superalloys, and titanium alloys.
The proposed method predicted that it was possible to obtain a fatigue limit equal to the ultimate strength of the material. Various materials tested at approximately the stress levels predicted by the method had not failed after 2.5 X lo6 o r more cycles.
INTRODUCTION
Over the years numerous fatigue tests have been conducted to study the effects of mean stress on the fatigue limit. Nevertheless, designers often find that data at a spe- cific value of mean stress are not available and must be obtained either by conducting additional fatigue tests o r by extrapolating from data at some other value of mean stress. The latter method is obviously more practical; however, it does require a knowledge of the fatigue behavior as a function of mean stress.
Various equations have been proposed to represent the fatigue limit as a function of mean stress; of these the Gerber parabola and the Goodman straight-line relationships are probably the most widely used. (See appendix A and refs. 1 to 3.) However, for some mater ia ls the Gerber equation produces a substantially better fit to the data than the Goodman equation, whereas fo r other materials the converse is true. In some instances, both equations produce essentially the same agreement to the data. A problem arises in that no way is available fo r predetermining the appropriate equation to use for a specific material. Also, neither equation fits the data well at high values of mean stress and the predictions obtained by using the Gerber equation a r e not applicable for

compressive mean s t resses . The fatigue limit obtained with the Gerber or Goodman relationships approaches the ultimate tensile strength (along a parabola or straight line, respectively) as the mean stress approaches the ultimate strength. However, as will be shown, the experimental fatigue limit approaches the ultimate strength at values of mean s t r e s s substantially below the ultimate strength.
In an attempt to overcome these difficulties an empirical equation was developed relating the fatigue limit to the mean stress. This equation is applicable to axially loaded unnotched specimens (sheet and bar) over the entire range of mean stress (compressive ultimate to tensile ultimate) for a wide variety of materials. Application of the equation requires knowledge of the ultimate strength of the material and of the fatigue limit at zero mean stress. Both the Gerber and Goodman relations require the same informa- tion. An ancillary equation was developed to predict the fatigue limit at zero mean stress as a function of the ultimate strength. Sets of constants required in this equation have been obtained for each of five major material classes: bare aluminum, clad aluminum, low alloy steels, stainless steels and superalloys, and titanium alloys.
Comparisons a r e presented which demonstrate the improvement of the proposed relation over the Gerber and the Goodman relations to fit sets of data obtained from the l i terature for a wide variety of materials.
SYMBOLS
The units used for the physical quantities defined in this paper are given both in U.S. Customary Units and in the International System of Units, SI (ref. 4). Appendix B presents factors relating these two systems of units.
A to F constants used in equations
Sa alternating stress, kips per inch' (meganewtons per meter')
sf experimental fatigue limit1 fo r a given mean stress other than zero (maximum stress (algebraic) within cycle), kips per inch' (meganewtons per meter')
Sm mean s t ress , kips per inch2 (meganewtons per meter')
lFor the purpose of this paper, the fatigue limit is defined as the s t r e s s below which failure will not occur in lo6 cycles.
2
. SO
SP
OU
experimental fatigue limit at zero mean s t r e s s (maximum s t r e s s (algebraic) within cycle), kips per inch2 (meganewtons per m e t e r g
predicted fatigue limit for a given mean s t r e s s (maximum stress (algebraic) within cycle), kips per inch2 (meganewtons per meter2)
ultimate tensile strength, kips per inch2 (meganewtons per metera)
BACKGROUND
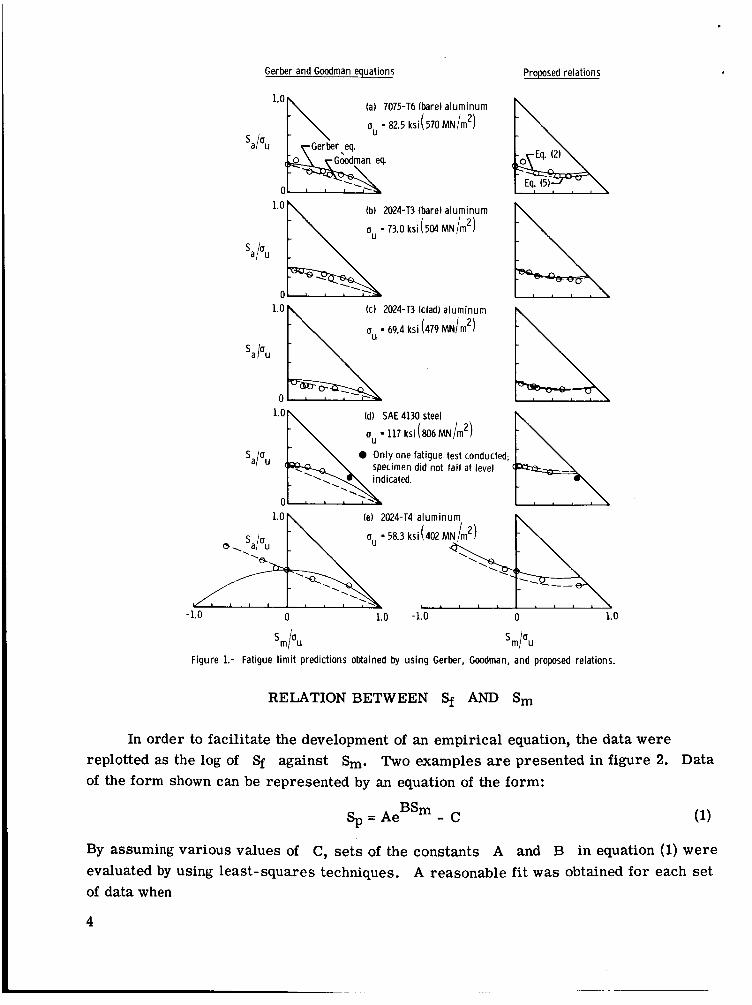
A s noted in the introduction, the Gerber equation is useful for predicting the fatigue limit of some materials whereas the Goodman equation is useful for others. Also, these equations do not adequztidy dsfine the fzQp:e limit ever the entire range of mean stress, particularly in the range where the mean stress approaches the ultimate strength. Examples fo r various materials are presented in figure 1. The same se t s of data are presented in each of two plots: in the left-hand plots the Gerber and Goodman predic- tions are presented and in the right-hand plots the predictions obtained using the pro- posed equations a r e presented. The latter curves are discussed in the section "Agree- ment Between Experimental and Predicted Fatigue Limits."
In figures l(a) and l(b) both the Gerber and the Goodman equations produce essen- tially the same agreement. In figure l(d) the Gerber equation produces a substantially better fit to the data than the Goodman equation, whereas in figures l(c) and l(e) the Goodman equation produces the better fit. The weakness of the Gerber equation to predict the results of .tests conducted at negative mean s t resses is shown in figure l(e).
In figures l(c), l(d), and l(e) the trend of the data is to approach the 450 straight line (representing sf = uu) at values of mean s t ress substantially below the ultimate; this is particularly evident in figure l(d). Special tests were conducted at combinations of Sm and Sa such that sf =: uu. The results of these tests are discussed in the sec- tion "Special Tests."
Based on the foregoing observations, it was apparent that an equation applicable to a wide variety of materials over the entire range of mean s t r e s s would be useful.
3
Gerber and Goodman equations
1.0 (a) 7075-T6 (bare1 aluminum
CI - 82.5 ksi( 570 MN/m2)
Gerber ,ea Goodman ea
(b) 2024-T3 (bare) aluminum
a - 73.0 ksi(504 MN/m2)
1.0
' apu
.-. ( c ) 2024-T3 (clad) aluminum
- 69.4 ksi (479 MN/m2)
Proposed relations
0
Id) SAE 4130 steel
uu - 117 ksi(806MN/m2)
0 Only one fatigue test conducted; specimen did not fail at level indicated. '.
-1.0 0 1.0 -1.0 0 1.0
Figure 1.- Fatigue l imi t predictions obtained by using Gerber, Goodman, and proposed relations.
RELATIONBETWEEN sf AND Sm
In order to facilitate the development of an empirical equation, the data were replotted as the log of sf against Sm. Two examples are presented in figure 2. Data of the form shown can be represented by an equation of the form:
- c BSm Sp = Ae
Eq. (21
By assuming various values of C, sets of the constants A and B in equation (1) were evaluated by using least-squares techniques. A reasonable fit was obtained fo r each set of data when
4

.
As mentioned previously, the fatigue limit approaches the ultimate strength at values of mean stress sub- stantially below the ultimate strength. Substituting a value of the fatigue limit equal to uu in equation (2) and solving for Sm resul ts in the following equation:
Sf I
ksi
A z o , - 0.693 B --
=U
c ou - so
0 2024-T3 (clad) aluminum ou = 69.4 ksi (478 M N m2)
El SAE 4130 steel ou = 117 ksi (807 M N m2)
0
Substituting these values into equation (1) produced the following expression:
0 400
100
For values of S, greater than those calculated by using equation (3), the cal- culated values of Sp from equation (2) are greater than ou. However, since there is no evidence to indicate that such fatigue limits are actually obtainable, it is recom- mended that calculated values of $ greater than uu be set equal to ou.
RELATIONBETWEEN So AND ou
In order to avoid the need for an experimental value of SO in equation (2), an equation was developed to correlate So with ow Plotting the log of Ou - So against ou for each material c lass (aluminum, steel, titanium, etc.) resulted in continuous curves that could be represented by an equation of the same general form as equation (1). In this case,
+ F q J E So = ou - De (4)
Substitution of equation (4) into equation (2) results in the following general equation for the fatigue l imit at any mean s t r e s s
dE + F Sp = oue - De 0.69 3Sm/ou
5
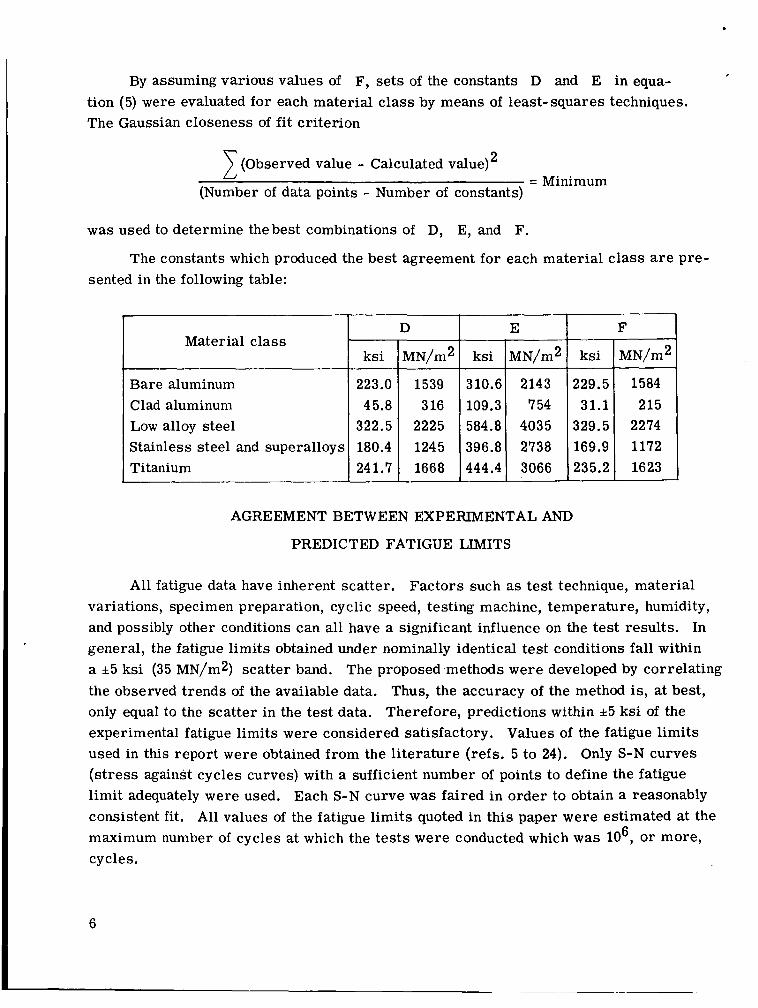
. By assuming various values of F, se t s of the constants D and E in equa-
tion (5) were evaluated for each material c lass by means of least-squares techniques. The Gaussian closeness of fit criterion
2 1 (Observed value - Calculated value) = Minimum
(Number of data points - Number of constants)
was used to determine the best combinations of D, E, and F.
The constants which produced the best agreement for each material c lass a r e pre- sented in the following table:
Material c lass
Bare aluminum Clad aluminum Low alloy steel Stainless steel and superalloys Titanium
D E F I ksi
223.0 45.8
322.5 180.4 241.7
MN/m2
1539 3 16
2225 1245 1668
ksi
229.5 31.1
329.5 169.9 235.2
2274 1172 1623
AGREEMENT BETWEEN EXPERIMENTAL AND
PREDICTED FATIGUE LIMITS
All fatigue data have inherent scatter. Factors such as test technique, material variations, specimen preparation, cyclic speed, testing machine, temperature, humidity, and possibly other conditions can all have a significant influence on the test results. In general, the fatigue limits obtained under nominally identical test conditions fall within a *5 ksi (35 MN/m2) scatter band. The proposed methods were developed by correlating the observed trends of the available data. Thus, the accuracy of the method is, at best, only equal to the scatter in the test data. Therefore, predictions within * 5 ksi of the experimental fatigue limits were considered satisfactory. Values of the fatigue limits used in this report were obtained from the l i terature (refs. 5 to 24). Only S-N curves (stress against cycles curves) with a sufficient number of points to define the fatigue limit adequately were used. Each S-N curve was faired in order to obtain a reasonably consistent fit. All values of the fatigue limits quoted in this paper were estimated at the maximum number of cycles at which the tests were conducted which w a s lo6, or more, cycles.
6
1 To evaluate properly the usefulness of the Gerber, Goodman, or proposed equa- tions requires that data which cover the range of mean s t r e s s from compressive ulti- mate to tensile ultimate be available for a wide variety of materials. condition rarely, if ever, is satisfied. Thus a proper evaluation of the superiority of one equation over the other is impossible with the existing data. However, there a r e limited data available covering a reasonable range of mean s t r e s s which give some evidence of the superiority of the proposed equations. These data are presented in figure 1; the pre- dictions obtained using either equation (2) or equation (5) a r e presented in the right-hand plots. For all five materials the f i t using either equation (2) or equation (5) was quite good over the range of mean s t ress , whereas the Gerber or Goodman predictions (left- hand plots) only f i t the data for some materials and not others.
However, this
Considerably more data were available which were obtained from tests conducted at only one o r several values of mean s t ress . These data are compared with the pre- dicted fatigue limits obtained by using the Gerber, Goodman, and proposed methods for the following three cases:
Case 1: The value of So was adjusted for the Gerber equation, Goodman equa- tion, or equation (2) to obtain the best possible fit for each set of data (a set consisted of two o r more values of the fatigue limit obtained from tests in which the only parameter varied w a s the mean s t ress) .
Case 2: The experimental value of So was used in the Gerber equation, Goodman equation, or equation (2) to calculate the fatigue limits for each set of data in which So was available or could be reasonably extrapolated from existing data. For comparison equation (5) w a s also used to obtain predictions for the same data.
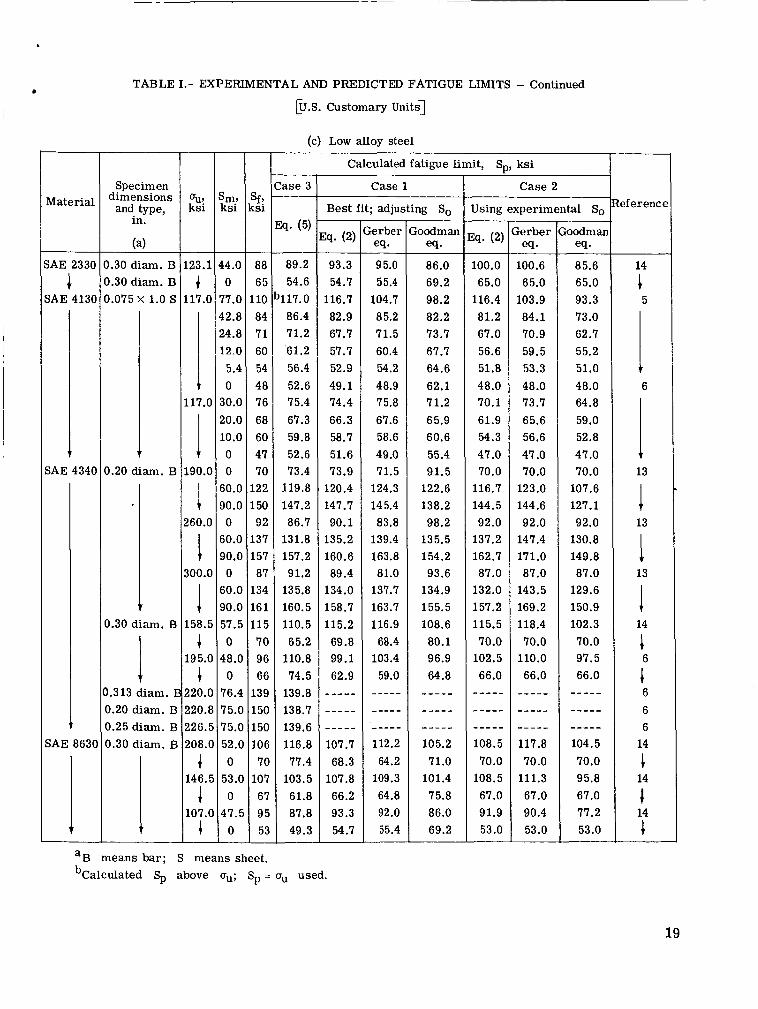
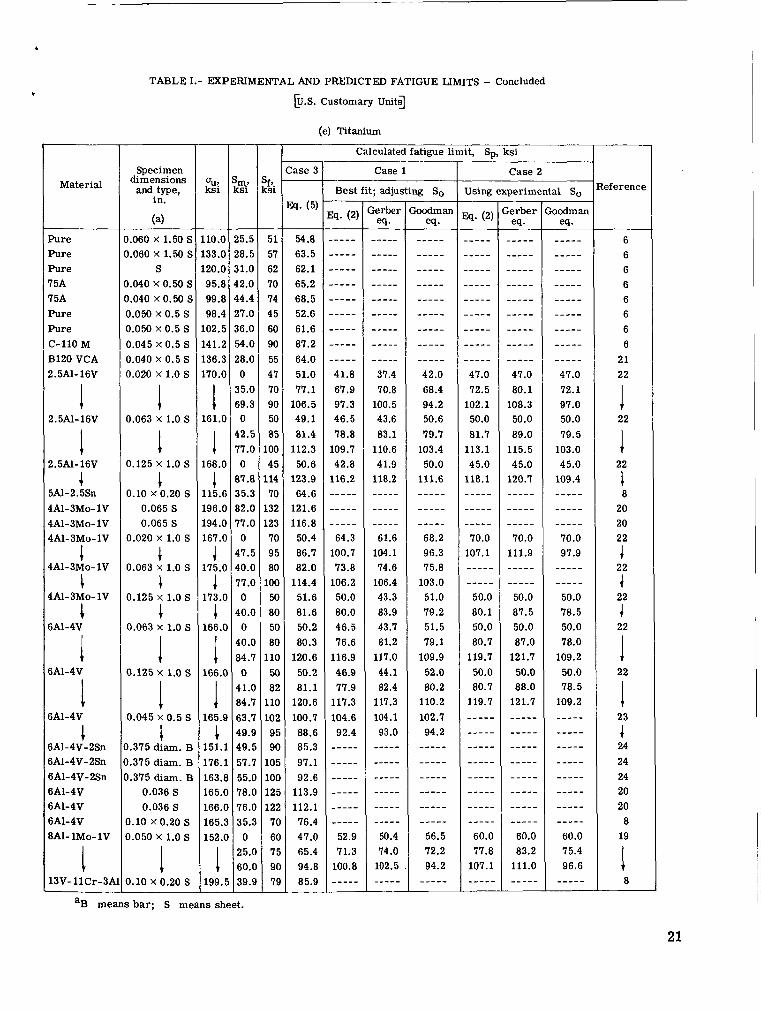
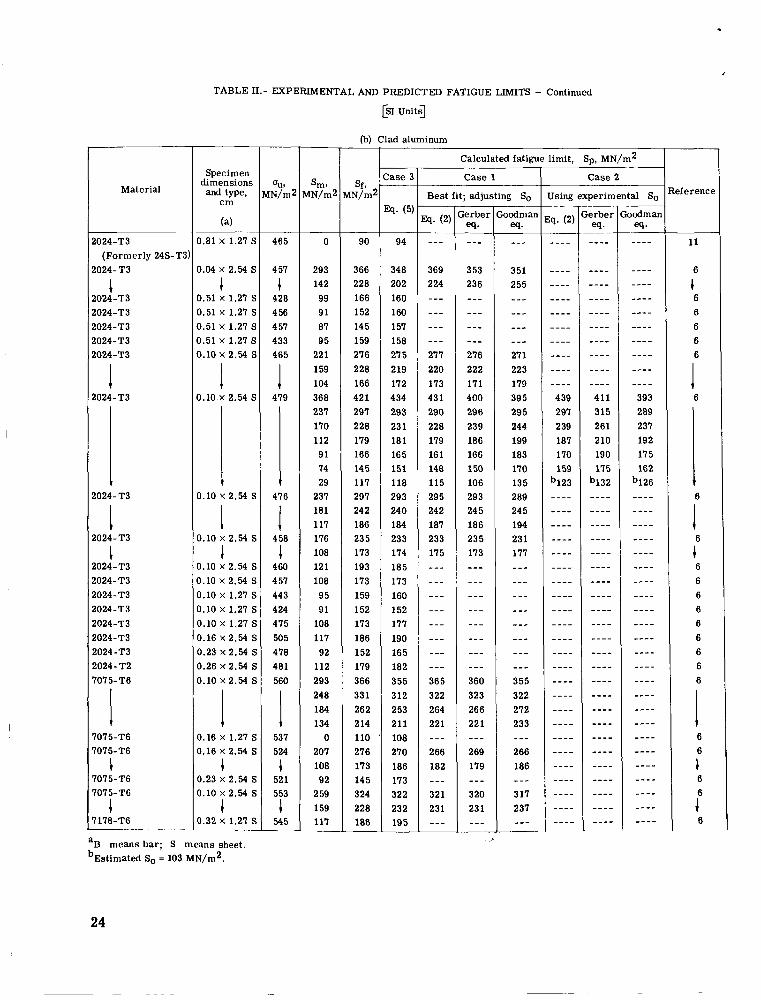
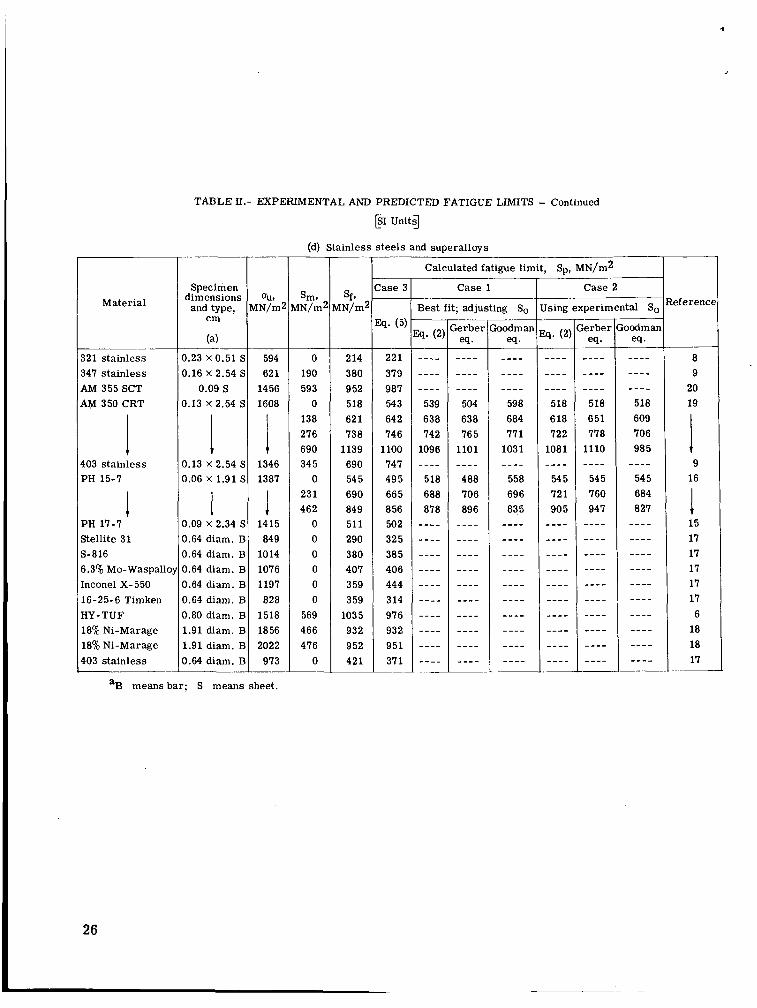
Case 3: The constants D, E, and F (table on page 6) were used in equation (5) to calculate the fatigue limits for all the available data in each material class.
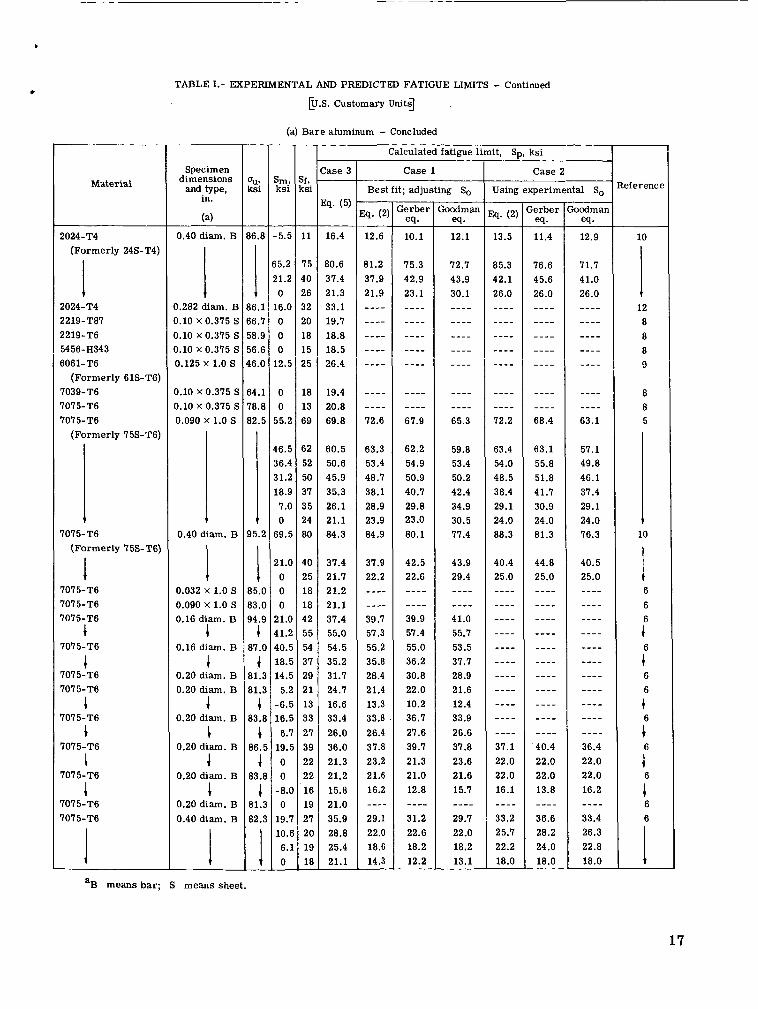
The predicted fatigue limits obtained for each case along with the experimental data are presented in tables I and 11. For convenience, the experimental fatigue limits and the calculated fatigue limits obtained by using equation (5) are presented in figure 3 for each material class. The solid line in the figure represents perfect agreement, and the dashed lines represent the i5-ksi (35 MN/m2) scatter band previously discussed. The zero mean stress data are shown as square symbols. In general, the agreement using equa- tion (5) was within the *5-ksi scatter band.
Comparisons between the various equations of the predicted and experimental fatigue limits from tables I and I1 can become quite tedious. Thus in an attempt to sum- marize the results of tables I and 11, the average of the differences between the predicted and experimental fatigue l imits fo r each material class in cases 1 to 3 a r e presented in
7

sP
Stainless steels
ksi
d io0 6k1 &l ldoo l;o0 l&OMN/m2
Sf Figure 3.- Experimental fatigue limits and predicted fatigue limits using equation (5) for five major material classes.
1
Equation used
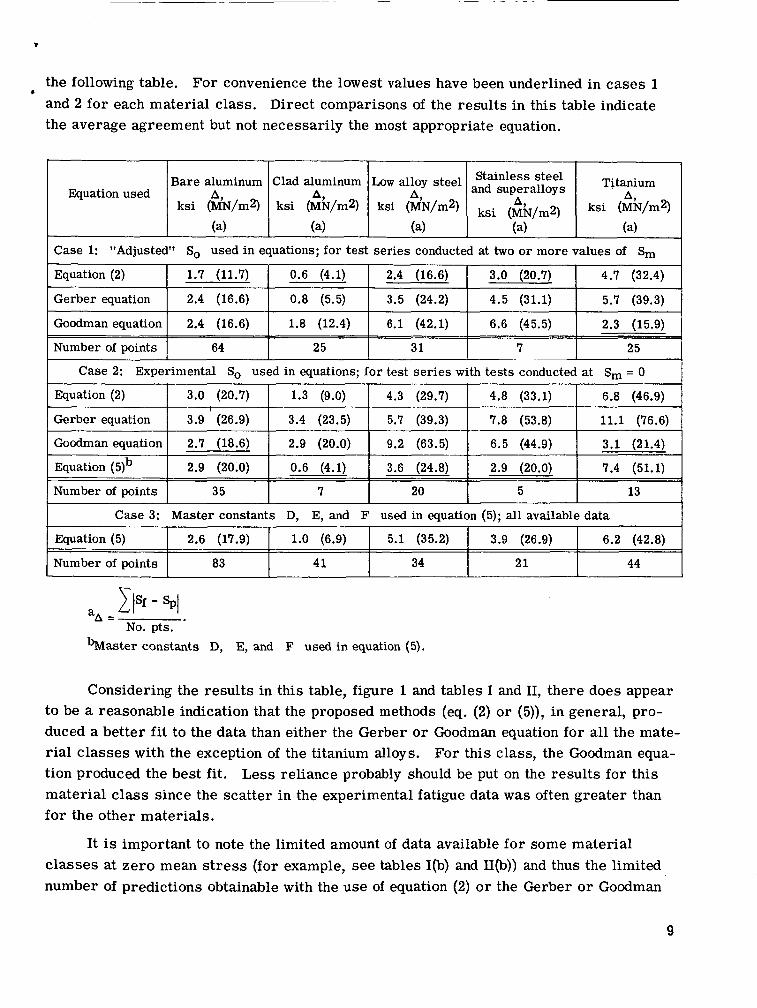
the following table. For convenience the lowest values have been underlined in cases 1 and 2 for each material class. Direct comparisons of the results in t h i s table indicate the average agreement but not necessarily the most appropriate equation.
Bare aluminum Clad aluminum Low alloy s teel and Stainless superalloys steel Tjtanium 4 A, 4 A,
( 4 ( 4 (4 (4 (4 4 ksi (MN/m2) ksi (MN/m2) ksi (MN/m2) ksi (MN/m2) ksi (MN/m2)
Equation (2) 1.7 (11.7) 0.6 (4.1)
Gerber equation 2.4 (16.6) 0.8 (5.5)
2.4 (16.6) 3.0 (20.7) 4.7 (32.4)
3.5 (24.2) 4.5 (31.1) 5.7 (39.3)
Goodman equation
Number of points
Case 3: Master constants D, E, and F used in equation (5); all available data
2.4 (16.6) 1.8 (12.4) 6.1 (42.1) 6.6 (45.5) 2.3 (15.9)
64 25 31 7 25 -~
Equation (2)
Gerber equation
Goodman equation
Equation ( 5)b
Number of points
'A = Zlsf - Y No. pts.
3.0 (20.7) 1.3 (9.0) 4.3 (29.7) 4.8 (33.1) 6.8 (46.9)
3.9 (26.9) 3.4 (23.5) 5.7 (39.3) 7.8 (53.8) 11.1 (76.6)
2.7 (18.6) 2.9 (20.0) 9.2 (63.5) 6.5 (44.9) 3.1 (21.4)
2.9 (20.0) 0.6 (4.1) 3.6 (24.8) 2.9 (20.0) 7.4 (51.1)
35 7 20 5 13
I
has t e r constants D, E, and F used in equation (5).
Equation (5)
Number of points
Considering the results in this table, figure 1 and tables I and 11, there does appear to be a reasonable indication that the proposed methods (eq. (2) or (5)), in general, pro- duced a better f i t to the data than either the Gerber or Goodman equation for all the mate- rial classes with the exception of the titanium alloys. For th is class, the Goodman equa- tion produced the best fit. Less reliance probably should be put on the results for this material class since the scatter in the experimental fatigue data was often greater than for the other materials.
2.6 (17.9) 1.0 (6.9) 5.1 (35.2) 3.9 (26.9) 6.2 (42.8)
83 41 34 21 44
It is important to note the limited amount of data available for some material classes at z e r o mean stress (for example, see tables I(b) and II(b)) and thus the limited number of predictions obtainable with the use of equation (2) or the Gerber or Goodman
9
equations (see last three columns of tables I@) and II(b)). requires knowledge of only % has the decided advantage of being capable of predicting the fatigue limit at any mean s t r e s s with reasonable accuracy without requiring that fatigue tests be conducted.
Thus, equation (5) which ,
It is possible in all three equations (Gerber, Goodman, and eq. (2)) to compute a value of the fatigue limit at any mean s t r e s s if at least one fatigue limit is available. However, in the Gerber and Goodman relations, any inherent e r r o r s in the fatigue limit at a given mean s t r e s s result in proportionately larger e r r o r s when used to compute fatigue limits at lower values of mean s t ress ; conversely, proportionately smaller e r r o r s are obtained when used to compute values at higher mean s t resses .
Thus, in order not to introduce additional e r r o r s in the predictions obtained by using the Gerber or Goodman equation requires that a value of the fatigue limit be avail- able at the lowest value of mean s t r e s s of the range of mean stresses in which predictions a r e to be made. However, such data a r e often not available. Equation (2) offers the feature of being capable of making predictions over the entire range of mean s t r e s s with- out introducing additional e r r o r s regardless of the mean s t r e s s at which the data are available.
SPECIAL TESTS
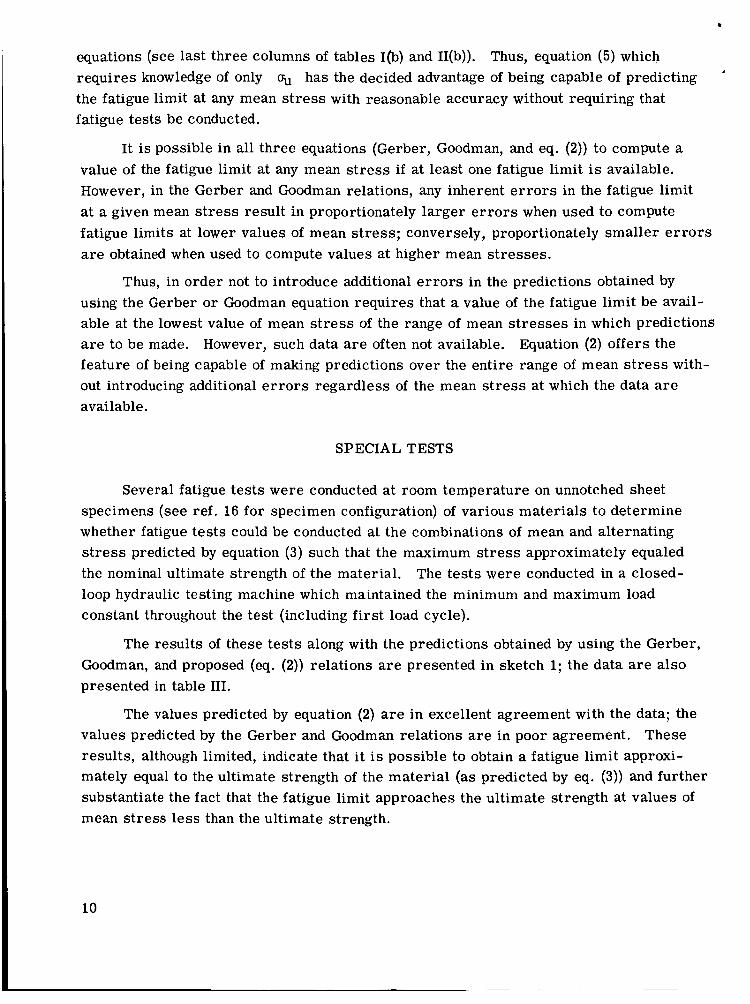
Several fatigue tes ts were conducted at room temperature on unnotched sheet specimens (see ref, 16 for specimen configuration) of various materials to determine whether fatigue tes ts could be conducted at the combinations of mean and alternating stress predicted by equation (3) such that the maximum stress approximately equaled the nominal ultimate strength of the material. The tests were conducted in a closed- loop hydraulic testing machine which maintained the minimum and maximum load constant throughout the test (including first load cycle).
The results of these tes ts along with the predictions obtained by using the Gerber, Goodman, and proposed (eq. (2)) relations are presented in sketch 1; the data are also presented in table 111.
The values predicted by equation (2) are in excellent agreement with the data; the values predicted by the Gerber and Goodman relations are in poor agreement. These results, although limited, indicate that it is possible to obtain a fatigue limit approxi- mately equal to the ultimate strength of the material (as predicted by eq. (3)) and further substantiate the fact that the fatigue limit approaches the ultimate strength at values of mean s t ress less than the ultimate strength.
10
t
2024-T81 (clad) aluminum uu = 64.6 ksi (446 MN/m*)
2618 (clad) aluminum uu = 59.0 ksi (407 MN/m2)
AM 350 (CRT) stainless steel uu = 223.0 ksi (1549 MN/m2)
1.0
0 1.0 0 1.0 0 1 .o
Sketch 1
Run-outs occurring at a maximum stress equal to the nominal ultimate strength can probably be explained by the fact that the values of O-U were obtained from tests con- ducted at low strain rates, whereas the fatigue tests were at comparatively high rates. Ultimate strength tests conducted at the strain rates equal to the rates achieved in fatigue tests probably would have resulted in ultimate strengths higher than those quoted. Thus, in reality the maximum cyclic s t resses were probably below the comparable ultimate strength of the material.
CONCLUDING REMARKS
An empirical method has been developed to represent the fatigue limit of axially loaded specimens as a function of mean s t ress . Predictions made by using this method indicate that reasonably good agreement with test data can be obtained over the entire range of mean stresses for a variety of materials and specimen configurations. In general, the method produces better agreement than the Gerber or Goodman relations.
The proposed method predicted that it was possible to obtain a fatigue limit equal to the ultimate strength of the material. Specimens of various materials tested at approxi- mately the stress levels predicted by the method had not failed after 2.5 X lo6 or more cycles.
Langley Research Center, National Aeronautics and Space Administration,
Langley Station, Hampton, Va., November 18, 1966, 126-14-03-08-23.
11
APPENDIX A
b
,
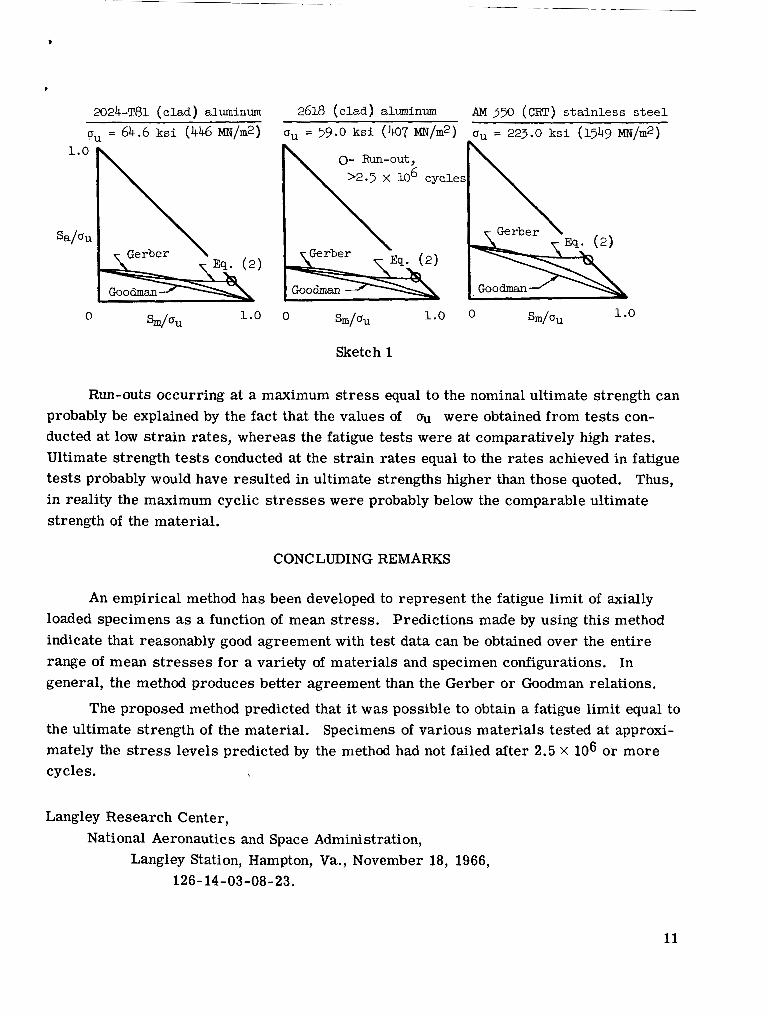
GERBER AND GOODMAN EQUATIONS
The Gerber equation (refs. 1 and 2) is
A graphic representation of this equation is shown in sketch 2:
\ Sa
Gerber (Parabola)
'(JU 0 +(JU
s, Sketch 2
The Goodman equation (refs. 1 and 3) i s :
A graphic representation of this equation is shown in sketch 3:
0
s, Sketch 3
12
APPENDIX B
To convert from U.S. customary units
in. ksi
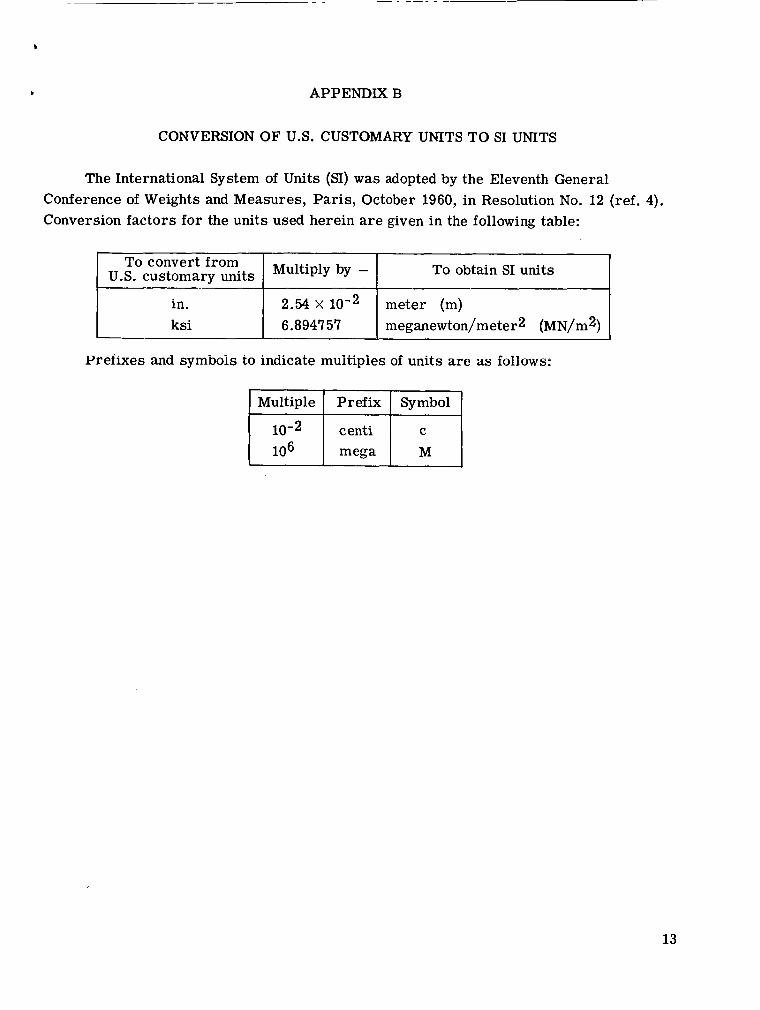
CONVERSION OF U.S. CUSTOMARY UNITS TO SI UNITS
To obtain SI units Multiply by -
2.54 X meter (m) 6.8947 57 meganewton/meter2 (MN/m2)
The International System of Units (SI) was adopted by the Eleventh General Conference of Weights and Measures, Paris, October 1960, in Resolution No. 12 (ref. 4). Conversion factors for the units used herein a r e given in the following table:
Prefixes and symbois to indicate muitipies of units are as hiiows:
Multiple Prefix Symbol
mega
13
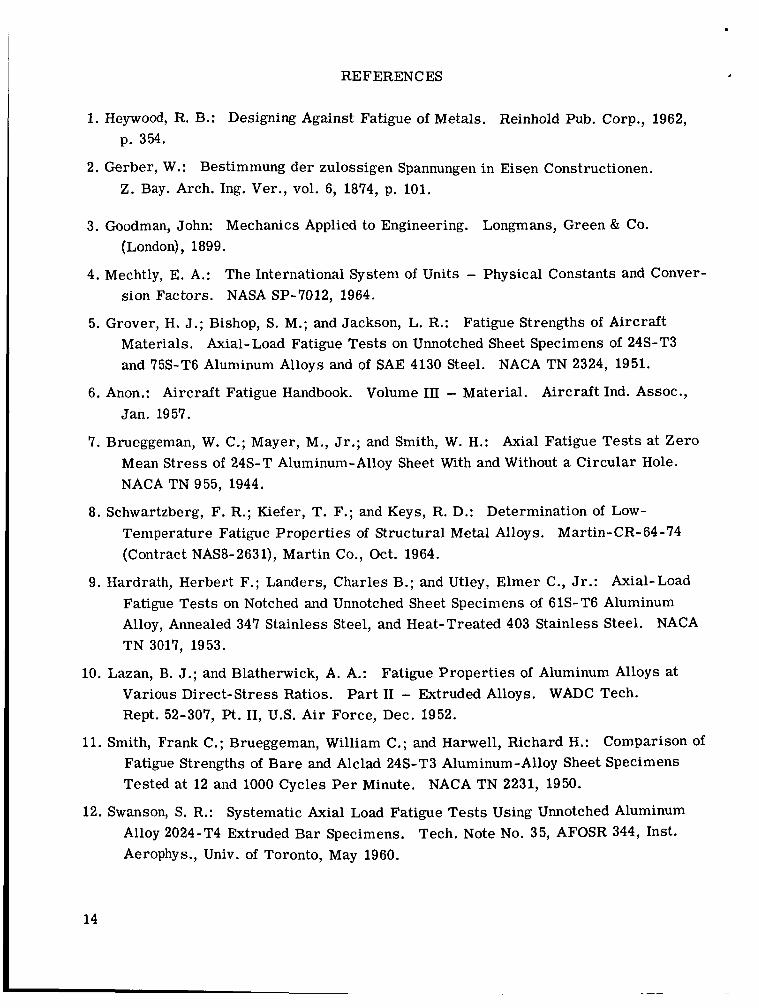
REFERENCES
1. Heywood, R. B.: Designing Against Fatigue of Metals. Reinhold Pub. Corp., 1962, p. 354.
2. Gerber, W.: Bestimmung der zulossigen Spannungen in Eisen Constructionen. Z. Bay. Arch. Ing. Ver., vol. 6, 1874, p. 101.
3. Goodman, John: Mechanics Applied to Engineering. Longmans, Green & Co. (London), 1899.
4. Mechtly, E. A.: The International System of Units - Physical Constants and Conver- sion Factors. NASA SP-7012, 1964.
5. Grover, H. J.; Bishop, S. M.; and Jackson, L. R.: Fatigue Strengths of Aircraft Materials. Axial-Load Fatigue Tests on Unnotched Sheet Specimens of 24S-T3 and 75S-T6 Aluminum Alloys and of SAE 4130 Steel. NACA TN 2324, 1951.
6. Anon.: Aircraft Fatigue Handbook. Volume III - Material. Aircraft Ind. ASSOC., Jan. 1957.
7. Brueggeman, W. C.; Mayer, M., Jr.; and Smith, W. H.: Axial Fatigue Tests at Zero Mean Stress of 24s-T Aluminum-Alloy Sheet With and Without a Circular Hole. NACA TN 9 55, 1944.
8. Schwartzberg, F. R.; Kiefer, T. F.; and Keys, R. D.: Determination of Low- Temperature Fatigue Properties of Structural Metal Alloys. Martin-CR-64-74 (Contract NAS8-2631), Martin Co., Oct. 1964.
9. Hardrath, Herbert F.; Landers, Charles B.; and Utley, Elmer C., Jr.: Axial-Load Fatigue Tests on Notched and Unnotched Sheet Specimens of 61S-T6 Aluminum Alloy, Annealed 347 Stainless Steel, and Heat-Treated 403 Stainless Steel. NACA TN 3017, 1953.
10. Lazan, B. J.; and Blatherwick, A. A.: Fatigue Propert ies of Aluminum Alloys at Various Direct-Stress Ratios. Part I1 - Extruded Alloys. WADC Tech. Rept. 52-307, Pt. 11, U.S. A i r Force, Dec. 1952.
11. Smith, Frank C.; Brueggeman, William C.; and Harwell, Richard H.: Comparison Of
Fatigue Strengths of Bare and Alclad 24S-T3 Aluminum- Alloy Sheet Specimens Tested at 12 and 1000 Cycles Per Minute. NACA TN 2231, 1950.
12. Swanson, S. R.: Systematic Axial Load Fatigue Tests Using Unnotched Aluminum Alloy 2024-T4 Extruded Bar Specimens. Aerophys., Univ. of Toronto, May 1960.
Tech. Note No. 35, AFOSR 344, Inst.
14
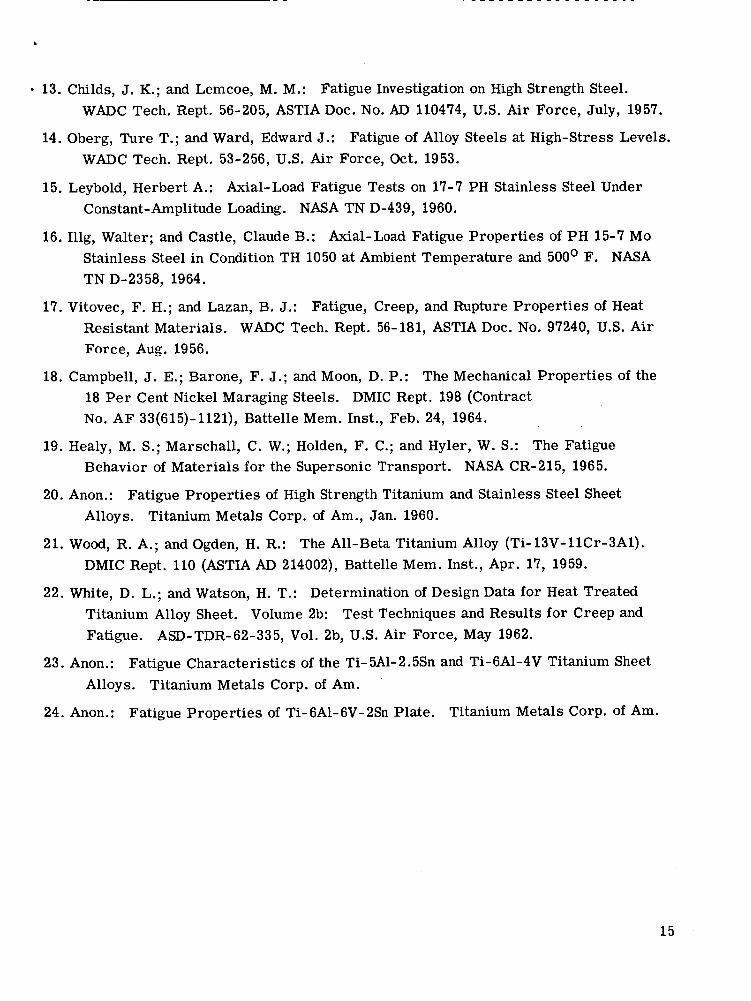
13. Childs, J. K.; and Lemcoe, M. M.: Fatigue Investigation on High Strength Steel. WADC Tech. Rept. 56-205, ASTIA Doc. No. AD 110474, U.S. Air Force, July, 1957.
14. Oberg, Ture T.; and Ward, Edward J.: Fatigue of Alloy Steels at High-Stress Levels. WADC Tech. Rept. 53-256, U.S. Air Force, Oct. 1953.
15. Leybold, Herbert A.: Axial-Load Fatigue Tests on 17-7 PH Stainless Steel Under Constant-Amplitude Loading. NASA TN D-439, 1960.
16. Illg, Walter; and Castle, Claude B.: Axial-Load Fatigue Properties of PH 15-7 Mo Stainless Steel in Condition TH 1050 at Ambient Temperature and 500° F. NASA TN D-2358, 1964.
17. Vitovec, F. H.; and Lazan, B. J.: Fatigue, Creep, and Rupture Properties of Heat Resistant Materials. WADC Tech. Rept. 56-181, ASTIA Doc. No. 97240, U.S. Air Force, Aug. 1956.
18. Campbell, J. E.; Barone, F. J. ; and Moon, D. P.: The Mechanical Properties of the 18 Per Cent Nickel Maraging Steels. DMIC Rept. 198 (Contract No. AF 33(615)-1121), Battelle Mem. Inst., Feb. 24, 1964.
19. Healy, M. S.; Marschall, C. W.; Holden, F. C.; and Hyler, W. S.: The Fatigue Behavior of Materials for the Supersonic Transport. NASA CR-215, 1965.
20. Anon.: Fatigue Properties of High Strength Titanium and Stainless Steel Sheet Alloys. Titanium Metals Corp. of Am., Jan. 1960.
21. Wood, R. A.; and Ogden, H. R.: The All-Beta Titanium Alloy (Ti-13V-llCr-3Al). DMIC Rept. 110 (ASTIA AD 214002), Battelle Mem. Inst., Apr. 17, 1959.
22. White, D. L.; and Watson, H. T.: Determination of Design Data for Heat Treated Titanium Alloy Sheet. Volume 2b: Test Techniques and Results for Creep and Fatigue. ASD-TDR-62-335, Vol. 2b, U S . A i r Force, May 1962.
23. Anon.: Fatigue Characteristics of the Ti- 5Al-2.5Sn and Ti-6A1-4V Titanium Sheet Alloys. Titanium Metals Corp. of Am.
24. Anon.: Fatigue Properties of Ti-6A1-6V-2Sn Plate. Titanium Metals Corp. Of Am.
15

TABLE I.- EXPERIMENTAL AND PREDICTED FATIGUE LIMITS
D.S. Customary u n i t 4
(a) Bare aluminum -
Sm, ksi
- 61.:
22.8 0 0
36.5 8.5 0 0
48.8
42.8 33.6 28.1 17.3 10.5 5.0 0
0 0 0 0
42.7 38.5 30.6 19.4 6.5 0
15.0 0
38.4 15.6 -7.1 0
15.6 38.4 41.2 23.0 37.5 17.5 13.5 13.5 5.0 0 -.
Material
-
21 - 75
42 31 15 50 27 24 18 61
57 48 45 34 30 25 22
21 21 20 20 57 55 49 38 26 20 30 19 -1 13 17 23 33 52 55 46 50 35 27 27 20 17 -
Calculated fatigue limit, SP, ksi - “e 3 -
Es. (5)
__ 77.4
38.3 20.8 20.2 50.6 26.6 20.4 21.1 63.4
56.9 47.8 42.7 33.4 28.0 23.9 20.3
20.2 20.3 20.2 20.2 56.9 52.6 45.0 35.2 25.1 20.2 31.5 20.3 -2.7
8.8 14.0 18.7 30.6 52.4 55.2 38.8 51.6 33.9 30.2 30.1 23.7 20.1 --
Specimen dimensions
in. md,type,
(a)
0.40 diam. B
I 1.10 X 0.375 E 0.40 diam. B
1 1.09 X 0.375 I 0.09 x 1.0 s
Case 1 Case 2 Lef e r enc e Best fit; adjusting So Using experimental So
~
ierber eq. __ 72.1
47.6 27.0 ---- 54.7 29.6 21.4 _ _ _ _ 59.6
55.6 49.1 44.8 35.8 29.7 24.5 ----
- _ _ _ _ _ _ _ ---- ---- 56.6 53.7 47.9 38.9 27.3 ---- 31.7 17.4
-22.8 10.0 20.0 27.6 41.2 54 .O 58.1 43.4 51.0 34.2 _ _ _ _ 28.6 20.6 15.7
~~
- Iq. (2 5q. (2) bodman
eq . 2014-T6
(Formerly 14s-Tf
1
I 2014-T6 2014-T6
2080-T6 2024-T3
(Formerly 24S-T3
81.2
42.2 24.7 _ _ _ _ 52.5 28.6 22.4
63.9 ----
57.9 48.3 43.3 34.0 28.6 24.5 - _ _ _
---- - -_ - - _ _ _ - _ _ _ 58.9 54.6 47.1 37.2 27.1 _ _ _ _ 30.1 18.9 0.2
11.7 16.8 21.6 33.4 55.3 58.7 42.3 51.4 33.6 - - -_ 26.3 19.8 16.3
70.2
51.1 39.8
47.8 28.4 22.5
----
---- 57.9
54.1 48.4 44.9 38.2 33.9 30.5 ----
---- - - -_ - -__ _ _ _ _ 55.1 52.5 47.8 41.0 32.2 _ _ _ _ 30.0 19.0 4.3
17.0 21.8 25.7 34.4 47.2 56.3 44.2 49.6 35.6 ---- 26.7 20.1 16.3
2024-T3 (Formerly 24S-T3
2024-T3 2024-T3 2024-T3 2024-T3 2024-T3
0.032
0.032
0.5 S
0.5 S 0.032 X 0.5 S 0.032 X 0.5 S 0.032 X 0.5 S 0.040 x 1.0 S
t 0.064 X 0.5 S 0.090 x 1.0 s
1.295 diam. B t
2024-T3 2024-T3
1 2024-T4
I 2024-T4 2024-T4 2024-T4
1 2024-T4 2024-T4
1.16 diam. B ).16 diam. B ).16 diam. B
1 8.20 diam. B .20 diam. B
1 1 aB meansbar; S means sheet. bCalculated Sp above 0 ~ ; Sp = uu used, CEstin~ated So = 22 ksi.
16
b
TABLE I.- EXPERIMENTAL AND PREDICTED FATIGUE LIMITS - Continued
@.s. Customary Unit3 .
(a) Bare aluminum - Concluded
Material r -
sm, ksi
- -5.5
15.2 11.2 0
16.0 0 0 0
12.5
0 0
55.2
16.5 36.4 31.2 18.9 7.0 0
69.5
21.0 0 0 0
21.0 41.2 40.5 18.5 14.5
5.2 -6.5 16.5
6.1 19.5 0 0
-8.C 0
19.7 1o.z 6. I 0 -
-
!f,. :s1
- 11
75 10 16 32 10 18 15 15
18 13 59
52 52 50 37 35 24 80
40 25 18 18 42 55 54 37 29 21 13 33 27 39 22 22 16 19 27
19 20
i a -
Calculated fat ime limit. Sn. ksi I
Case 1 I-'
Case 2
Using experimental So
- :ase 3 -
Iq. (5)
- 16.4
80.6 37.4 21.3 33.1 19.7 18.8 18.5 26.4
19.4 20.8 69.8
60.5 50.6 45.9 35.3 26.1 21.1 84.3
37.4 21.7 21.2 21.1 37.4 55.0 54.5 35.2 31.7 24.7 16.6 33.4 26.0 36.0 21.3 21.2 15.8 21.0 35.9 28.8 25.4 21.1 -
Specimen dimensions
and, type, in.
(a)
~~
Best fit; adjusting So eference - ;erber
11.4 eq. -
76.6 45.6 26.0 _ _ _ _ -_-- __ -_ _ _ _ _ _ _ _ _
---- _ -__ 68.4
63.1 55.8 51.8 41.7 30.9 24.0 81.3
44.8 25.0
ocdman eq.
12.9
71.7 41.0 26.0 ---_ ---- ---- - -__ _-__
---- ---- 63.1
57.1 49.8 46.1 37.4 29.1 24.0 76.3
40.5 25.0 ----
2024-T4 (Formerly 24S-T4)
12.6
81.2 37.9 21.9 ---- __-- ---- __-- _---
---- __-- 72.6
63.3 53.4 48.7 38.1 28.9 23.9 84.9
37.9 22.2 ---- _--- 39.7 57.3 55.2 35.8 28.4 21.4 13.3 33.8 26.4 37.8 23.2 21.6 16.2
13.5
85.3 42.1 26.0 _ _ _ _ _ _ _ _ -_-- ---- ----
_ _ _ _ -_-- 72.2
63.4 54 .O
48.5 38.4 29.1 24 .O 88.3
40.4 25.0
2024-T4 2219-T87 2219-T6 5456-H343 6061-T6
(Formerly 61S-T6) 7039-T6 7075-T6 7075-T6
(Formerly 75S-T6)
_ _ _ _
---- ---- 65.3
59.8 53.4 50.2 42.4 34.9 30.5 77.4
43.9 29.4 _ _ _ _ ---- 41.0 55.7 53.5 37.7 28.9 21.6 12.4 33.9 26.6 37.8 23.6 21.6 15.7 -_-_ 29.7 22.0 18.2 13.1
67.9
62.2 54.9 50.9 40.7 29.8 23 .O
80.1
42.5 22.6 ---- _ _ _ _ 39.9 57.4 55.0 36.2 30.8 22.0 10.2 36.7 27.6 39.7 21.3 21.0 12.8 ---- 31.2 22.6 18.2 12.2
7075-T6 (Formerly 75S-T6)
7075-T6 7075-T6 7075-T6
I
I
I + 1
1
7075-T6
7075-T6 7075-T6
7075-T6
7075-T6
7075-T6
7075-T6 7075-T6 29.1
22.0 18.6 14.3 -
aB meansba r ; S meanssheet .
17

TABLE I.- EXPERIMENTAL A m PREDICTED FATIGUE LIMITS - Continued
F.S. Customary unit4
(b) Clad aluminum __
Sm: ksi
-
Zi -
13
53 33 24 22 2 1 23 40 33 24 61 43 33 26 24 21 1: 43 35 27 34 25 28 25 23 22 25 27 22 26 53 48 38 31 16 40 25 21 47 33 27 -
Calculated fatigue limit, So, ks i - 3ase 3 Specimen
dimensions and type,
in.
(a)
Case 1 Case 2 eference Material
Eq. (5) Best fit; adjusting SO Using experimental So
Soodman eq.
2024-T3 (Formerly 24S-T3)
2024-T3
I 2024-T3 2024-T3 2024-T3 2024-T3 2024-T3
i 2024 - T3
0
42.4 20.6 14.4 13.2 12.6 13.8 32.0 23.1 15.0 53.4 34.4 24 .I 16.2 13.2 10.7 4.2
34.4 26.2 16.9 25.5 15.6 17.5 15.6 13.8 13.2 15.6 16.9 13.3 16.2 42.4 36.0 26.6 19.4 0
30.0 15.6 13.3 37.6 23.1 16.9
13.6
50.4 29.3 23.2 23.2 22.7 22.9 39.9 31.7 24.9 62.9 42.5 33.5 26.3 23.9 21.9 17.1 42.5 34.8 26.7 33.7 25.2 26.8 25.1 23.2 22.1 25.7 27.5 23.9 26.4 51.4 45.2 36.7 30.6 15.6 39.2 26.9 25.0 46.7 33.6 28.3
---_
50.9 37.0 ---_ ---- - -__ ---- 39.3 32.3 25.9 57.2 42.7 35.3 28.8 26.5 24.6 19.6 41.9 35.5 28.1 33.5 25.6 ---- _ _ _ _ _ _ _ _ - -__ ---_ _-__ - -__ _ _ _ _ 51.5 46.6 39.4 33.8
38.6 26.9
_ _ _ _
---- 46.0 34.3 ----
67.4
66.2
1 62.1 66.1 66.3 62.8 67.4
I 69.4
v 69.0
1 66.4
1 66.7 66.2 64.2 61.5 68.8 73.2 69.3 69.7 81.2
I 77.8 76.0
I
I
75.5 80.2
79.0
I
aB m e a n s b a r ; S means sheet. bEstimated So = 15 ksi.
18
t
Material
t
1
TABLE I.- EXPERIMENTAL AND PREDICTED FATIGUE LIMITS - Continued
F.S. Customary units]
(c) Low alloy steel
Y c
-
UU? ksi
- 123.1
117.0 +
I I
117.0
19o.c
I I 1
260.0
300.C
158.:
4
I 195.c
220s 220.t 226.1 208.(
c I 4
146.1
107S
-
-
jm, ksi
- L4.0 0
77.0 i2.8 24.8 12.0
5.4 0
30.0
20.0 10.0 0 0
50.0 30.0 0 30.0 90.0 0
60.0 90.0 57.5 0
48.C 0
76.4 75.c 75.c 52.( 0
53s 0
47.: 0 _.
-
sf? cs1
- 88 65
110 84 71 60 54 48 76
68 60 47 70
122 150 92
137 157 87
134 161 115 70 96 66
139 150 150 106 70
107 67 95 53 -
- ase 3 -
9. (5)
- 89.2 54.6
117.0 86.4 71.2 61.2 56.4
52.6 75.4
67.3 59.8 52.6 73.4
119.8 147.2 86.7
131.8 157.2 91.2
135.8 160.5 110.5 65.2
110.8 74.5
139.8 138.7 139.6 116.8 77.4
103.5 61.8 87.8 49.3 -
Calculated fatigue limit, S,, ksi
Case 1
Best fit; adjusting So
zq. (2)
93.3 54.7
116.7 82.9 67.7 57.7 52.9 49.1 74.4
66.3 58.7 51.6 73.9
120.4 147.7 90.1
135.2 160.6 89.4
134.0 158.7 115.2
69.8 99.1 62.9
----- ----- ----- 107.7
68.3 107.8 66.2 93.3 54.7
krber eq.
9 5.0 55.4
104.7 85.2 71.5 60.4 54.2
48.9 75.8 67.6 58.6 49 .O 71.5
124.3 14 5.4 83.8
139.4 163.8 81.0
137.7 163.7 116.9
68.4 103.4
59.0 ----- _---- _---- 112.2
64.2 109.3 64.8 92.0 55.4
86.0 69.2 98.2 82.2 73.7 67.7 64.6 62.1 71.2
65.9 60.6 55.4 91.5
122.6 138.2 98.2
135.5 154.2 93.6
134.9 155.5 108.6
80.1 96.9 64.8
----- ----- ----- 105.2
71.0 101.4 75.8 86.0 69.2
Case 2
Using experimental So
cq. (2)
100.0 65.0
116.4 81.2 67.0 56.6 51.8 48.0 70.1
61.9 54.3 47.0 70.0
116.7 144.5 92.0
137.2 162.7 87.0
132.0 157.2 115.5 70.0
102.5 66.0
----- ----- ----- 108.5 70.0
108.5 67.0 91.9 53.0
kerber eq.
100.6 65.0
103.9 84 .1 70.9 59.5 53.3 48.0 73.7
65.6 56.6 47 .O 70.0
123.0 144.6 92.0
147.4 171.0 87 .O
143.5 169.2 118.4 70.0
110.0 66.0
----- 117.8 70.0
111.3 67.0 90.4 53.0
oodman eq.
85.6 65.0 93.3 73.0 62.7 55.2 51.0 48.0 64.8 59.0 52.8 47 .O 70.0
107.6 127.1 92.0
130.8 149.8 87.0
129.6 150.9 102.3 70.0 97.5 66.0
----- ----- ----- 104.5 70.0 95.8 67.0 77.2 53.0
?f erenc e
14
5 I
.) 6
1 13
1 I 1
13
13
14
I c 6
6 6 6
14
c + +
14
14
aB means bar; S means sheet. bCalculated Sp above uu; Sp = au used.
19
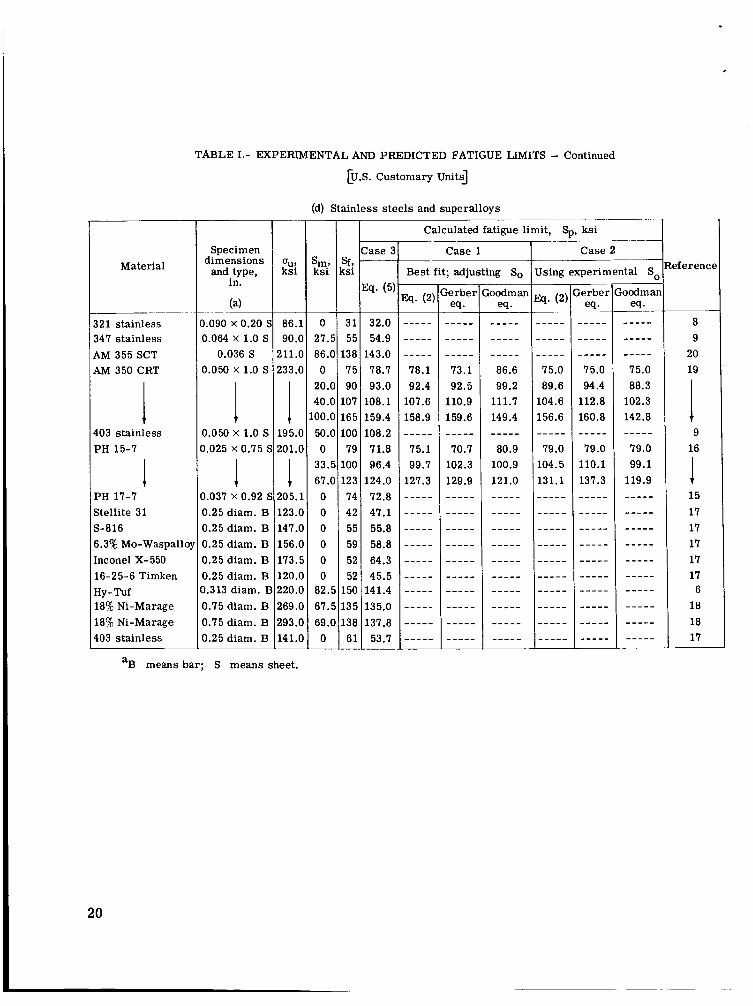
TABLE I . - EXPERIMENTAL AND PREDICTED FATIGUE LIMITS - Continued
[U.S. Cus tomary U n i t 4
(d) S ta in less s t e e l s and supe ra l loys
sf? k s i
31 55
138 75 90
107 165 100
79 100 123 74 42 55 59 52 52
150 135 138
61
Mate r i a l Case 3
Eq. (5)
32.0 54.9
143.0 78.7 93.0
108.1 159.4 108.2 71.8 96.4
124.0 72.8 47.1 55.8 58.8 64.3 45.5
141.4 135.0 137.8
53.7
321 s ta in less 347 s t a in l e s s AM 355 SCT AM 350 CRT
403 s t a in l e s s PH 15-7
P H 17-7 S te l l i t e 31
6.3% Mo-Waspall Inconel X-550 16-25-6 Timken
18% Ni-Marage 18% Ni-Marage 403 s t a i n l e s s
S-816
Hy-Tuf
Specimen d imens ions
and, type, in.
(a)
0.090 X 0.20 I 0.064 X 1.0 S
0.036 S 0.050 X 1.0 S
I 0.050 X 1.0 S 0.025 X 0.75 t
I 0.037 X 0.92 f 0.25 d i am. B 0.25 diam. B 0.25 diam. B 0.25 diam. B 0.25 diam. B 0.313 d i am. E 0.75 d i am. B 0.75 diam. B 0.25 diam. B
OU? k s i
86.1 90.0
211.0 233.0
I 195.0 201.0
1 205.1 123.0 147.0 i56.a
120.0 220.0 269.a 293.a 141.0
173.5
Sm: ksi
0 27.5 86.C 0
20.c 40.C
1OO.C
50.C 0
33.f 67.C 0 0 0 0 0 0
82.: 67.: 69.t 0
Calculated fat igue l imi t , $, k s i
C a s e 1
Bes t f i t ; adjust ing So
C a s e 2
Js ing expe r imen ta l So
cq. (2' i e rber e q .
eference
8 9
20 19
9 16
1 J 1 5 17 17 17 17 17
6 18 18 17
aB means b a r ; S m e a n s sheet.
20
~
Material
Pure Pure Pure 15A 7 5A Pure Pure
8120 VCA E-110 M
2.5A1-16V
1 1
2.5Al-16V
1.5Al-16V + 9Al-2.5Sn LA1-3MO- IV LA1-3MO-IV 1Al- 3Mo- 1V
1 c c
LA1-3MO-lV
LA1-3MO- 1V
jA1-4V
1 L
jAl-4V
jA1-4V
1 jA1-4V-2Sn jA1-4V-2Sn jA1-4V-2Sn jA1-4V 3Al-48 jA1-4V 3A1- 1Mo-lV
1 L3V- 11Cr-3P
TABLE I.- MPEFUMENTAL AND PREDICTED FATIGUE LIMITS - Concluded
F.s. Customary unit3
Specimen dimensions
and, type, in.
(a)
).060 X 1.50 S ).060 X 1.50 S
S 1.040 X 0.50 S 1.040 X 0.50 S 0.050 X 0.5 S 0.050 X 0.5 S 0.045 X 0.5 S 0.040 X 0.5 S 0.020 x 1.0 s
I 1
0.063 X 1.0 S
0.125 X 1.0 S
0.10 x 0.20 s 0.065 S 0.065 S
0.020 x 1.0 s
0.063 x 1.0 s
0.125 x 1.0 S
0.063 x 1.0 s
1
1 + c
I I
0.125 x 1.0 s
0.045 X 0.5 S
c ).375 diam. B 1.375 diam. B 1.375 dim. B
0.036 S 0.036 S
D.10 x 0.20 S 13.050 x 1.0 s
I 0.10 x 0.20 s
110 .o 133.0 120.0 95.8 99.8 98.4
102.5 141.2 136.3 170.0
1 1
161.0
168.0
1 115.6 196.0 194.0 161.0 + 115.0
1 + 173.C
166.C
I I
166.C
165.5
c 151.1 176.1 163.t 165.( 166.( 165.: 152.(
I 199.! -
-
'm LS1
- l5.1 38.: 11.( 12.C 14.4 37.( 16.( 54.( 28.( 0
35.( 39.: 0
12.! 77.( 0
37 .t 35.: B2.( 77.( 0
17.! 10.1 77.1 0
40.1 0
40.1 84 .' 0
41.1 84 .I 63.' 49. 49. 57. 55. 78. 76. 3 5. 0
25. 60. 39. -
-
jf?. is1
- 51 57 62 70 74 45 60 90 55 47 70 90 50 85
LOO 45
114 70
132 123 70 95 80
100 50 80 50 80
110 50 82
110 102 95 90
105 100 125 122
60 75 9c 79
70
-
(e) Titanium
Calculated fatigue limit, SD, ksi - :ase 3
I s . (5)
54.8 63.5 62.1 65.2 68.5 52.6 61.6 87.2 64.0 51.0 77.1
106.5 49.1 81.4
112.3 50.6
123.9 64.6
121.6 116.8 50.4 86.7 82.0
114.4 51.6 81.6 50.2 80.3
120.6 50.2 81.1
120.6 100.7
88.6 85.3 97.1 92.6
113.9 112.1 76.4 47.0 65.4 94.8 85.9 __
-~ Case 1
Best f i t ; adjusting So - Case 2
Using experimental So eference
6 6 6 6 6 6 6 6
21 22
1 1 22
22
8 20 20 22
1
4 4
4
22
22
22
1 1
22
23
24 24 24 20 20
8 19
1
1 8
aB meansbar; S means sheet.
21
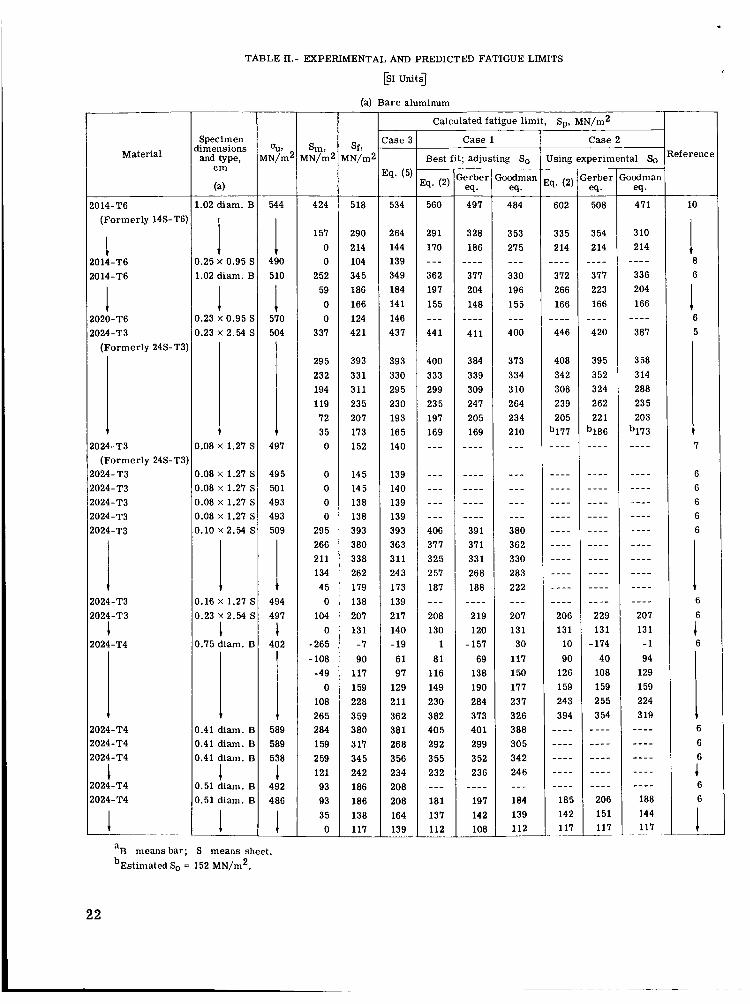
TABLE 11.- EXPERIMENTAL AND PREDICTED FATIGUE LIMITS
@I UNtiJ
(a) Bare aluminum
+
Specimen
and type,
2014-T6 1.02 diam. E!
(Formerly 24S-T3) 2024- T3 2024-T3 2024-T3 2024-T3 2024-T3
I (Formerly 14S-T6)
0.25 X 0.95 E 1
2014-T6
0.08 X 1.27 E 0.08 x 1.27 I 0.08 X 1.27 E 0.08 x 1.27 E 0.10 x 2.54 I
12014-T6 11.02 diam. E
I 1 I I 2020-T6 0.23 X 0.95 E 2024-T3 0.23 x 2.54 I
2024-T4 2024-T4 2024-T4
1 2024-T4 2024-T4
424
157 0 0
252 59 0 0
3 37
295 232 194 119 72 35 0
0 0 0 0
295 266 211 134 45 0
104 0
-265 - 108
-49 0
108 265 284 159 2 59 121 93 93 35 0
~
-
Sf9 bN/m2
- 518
290 2 14 104 34 5 186 166 124 421
393 331 311 23 5 207 173 152
145 14 5 138 138 393 380 338 262 179 138 207 131 -7 90
117 159 228 3 59 380 3 17 34 5 242 186 186 138 117 -
:ase 3 __
Tq. (5)
__ 534
264 144 139 349 184 14 1 146 437
393 330 29 5 230 193 165 140
139 140 139 139 393 363 311 24 3 173 139 217 140 - 19 61 97
129 211 36 2 38 1 268 3 56 234 208 208 164 139 -
Calculated fatigue lim
Case 1
Best fit; adjusting So
:q. (2) - 560
29 1 170 --- 362 197 155 - - _ 44 1
400 333 299 235 197 169 _ _ _
_ _ _ _ _ _ - - - _ _ _ 406 377 325 2 57 187 _ _ _ 208 130
1 81
116 149 230 382 405 292 355 232 _ _ _ 181 137 112 ___
__ erber eq . 497
328 186
- - - - 377 204 148
411
384 339 309 247 205 169
_ _ _ _
_ _ _ _ _ _ _ _ _ _ _ _ _ _ _ _ 39 1 371 331 268 188
2 19 120
-157 69
138 190 284 373 401 299 3 52 236
_ _ _ _
- --- 197 142 108 __
bcdman eq.
484
353 275 _ _ _ 330 196 155 _ _ _ 400
373 334 3 10 264 234 2 10 _ _ _
- - - _ _ _ _ _ _ _ _ _ 380 362 330 283 222 _ _ _ 207 131 30
117 150 177 237 326 388 305 342 24 6 _ _ _ 184 139 112
Sp, MN/m2
Case 2
[sing experimental SO
erber eq.
508 __
3 54 214
__- - 377 223 166
_ _ _ _ 420
395 352 324 262 221
b186 _ _ _ _
_ _ - - 229 131
- 174 40
108 159 255 3 54
_ _ _ -
_ _ - - 206 151 117
'adman eq.
471
3 10 214
_--- 336 204 166
_-- - 387
3 58 3 14 288 23 5 203
b173 _ _ _ _
- -_ - _ _ _ _ _ _ _ _ - ___ _ _ _ _
aB means bar; S means sheet. bEstiniated So = 152 MN/m2.
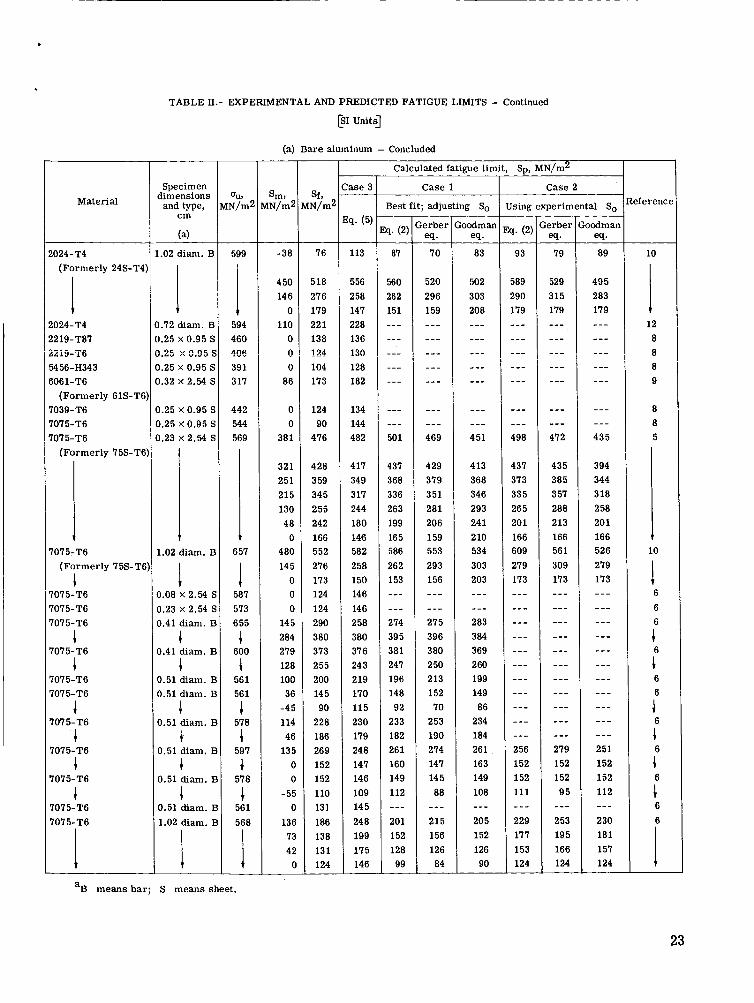
TABLE II.- MPEFUMENTAL AND PREDICTED FATIGUE LIMITS - Continued
@I Unit4
(a) Bare aluminum - Concluded
1 -
Sm, [N/m2
- -38
4 50 146
0 110
0 0 0
86
0 0
381
32 1 251 215 130 48
0 480 14 5
0 0 0
14 5 284 279 128 100 36
-4 5 114 46
135 0 0
-55 0
136 73 42
a
sp, MN/m2
Case 2
Calculated fatigue lim - ase 3 Specimen
dimensions and type,
cm
( 4
Case 1 sf, N/m; Material ?ference Best fit; adjusting So lsing experimental So
9. (5) erber
70 eq. -
520 296 159 --- - _ _ --- _-_ ---
_ _ _ --- 469
429 379 351 281 206 159 553 293 156 _ _ _ - -- 27 5 396 3 80 250 213 152 70
2 53 190 274 147 14 5 88
--- 215 156 126 84 -
mdman eq.
oodman
83
eq.
502 303 208 --- --- --- --- ---
_-- _ _ _ 451
413 368 346 293 24 1 210 534 303 203 --- -_ - 283 384 369 260 199 149 86
234 184 261 163 149 108 --- 205 152 126 90
2024-T4 (Formerly 24S-T4
76
518 276 179 221 138 124
104 173
124 90
476
428 3 59 34 5 255 242 166 552 276 173 124 124 290 380 373 255 200 14 5 90
228 186 269 152 152 110 131 186 138 131 124 __
113
556 258 147 228 136 130 128 182
134 144 482
417 349 317 244 180 146 582 258 150 146 146 258 380 376 243 219 170 115 230 179 248 147 146 109 14 5 248 199 175 146
87
560 262 151 __- _ _ _ __- --- _ _ _
--- __ - 501
437 368 336 263 199 165 586 262 153 --- __- 274 395 381 247 196 148 92
233 182 26 1 160 149 112 --- 201 152 128 99
2024-T4 2219-T87 2219-16
54 56- H343 606 1- T6
(Formerly 61S-T6 7039-T6 7075-T6 7075-T6
(Formerly 75S-T6
7075-T6 (Formerly 75s-TZ
1 7075-T6 7075-T6 7075-T6
1 1
1 + + 1
7075-T6
7075-T6 7075-T6
7075-T6
7075-T6
7075-T6
7075-T6 7075-T6
% m e a n s b a r ; S means sheet.
23
,
t
TABLE 11.- EXPERIMENTAL AND PREDICTED FATIGUE LIMITS - Continued
[SI Unit4
(b) Clad aluminum
Specimen dimensions
cm and type, Material
I 2024-T3 0.81 X 1.27 S
(Formerly 24S-T3) 2024- T3
1 2024-T3 2024-T3 2024 - T3 2024-T3 2024 - T3
1 2024-T3
v 2024-T3
I 1024-T3
1 2024-T3 2024-T3 2024-T3 2024-T3 2024-T3 2024-T3 2024-T3 2024- T2 7075-T6
I 7075-T6 7075-T6
1
1 7075-T6 7075-T6
7178-T6
'B means bar ; S means sheet. bEstirnated So = 103 MN/m2.
0
293 142 99 91 87 95
221 159 104 368 237 170 112 91 74 29
237 181 117 176 108 121 108 95 91
108 117 92
112 293 248 184 134 0
207 108 92
2 59 159 117
. . -
Sf? IN/m2
90
366 228 166 152 145 159 276 228 166 421 297 228 179 166 14 5 117 297 24 2 186 23 5 173 193 173 159 152 173 186 152 179 366 331 262 2 14 110 276 173 145 324 228 186 -
!ase 3
cq. (5:
94
348 202 160 160 157 158 27 5 219 172 434 29 3 23 1 18 1 16 5 151 118 293 24 0 184 233 174 185 173 160 152 177 190 165 182 355 312 253 211 108 270 186 173 322 232 19 5
Calculated fatigue limit, SD, MN/m2
Case 1
Best fit; adjusting So
a. (2) __ _ _ _
369 224 --- _ -_ _ _ _ _ _ _ 277 220 173 431 290 228 179 16 1 148 115 295 242 187 233 175 --- --- --- _ _ _ - __ _ _ _ --- _ _ _ 365 322 264 221
266 182
- _ -
_ _ _ 321 231 ---
erber eq. __ ---
3 53 236 --- --- - - - --- 276 222 171 400 296 239 186 166 150 106 293 24 5 186 235 173 --- _ _ _ _ _ _ - -_ - - _ - _ _ --- --- 360 323 266 221 --- 269 179
320 23 1
---
---
Case 2
Jsing experimental SO !f erence
11
6
6 6 6 6 6
1
1 6
1
la 6
1 6 6 6 6 6 6 6 6
1 6
6
1 6
r" 6
24
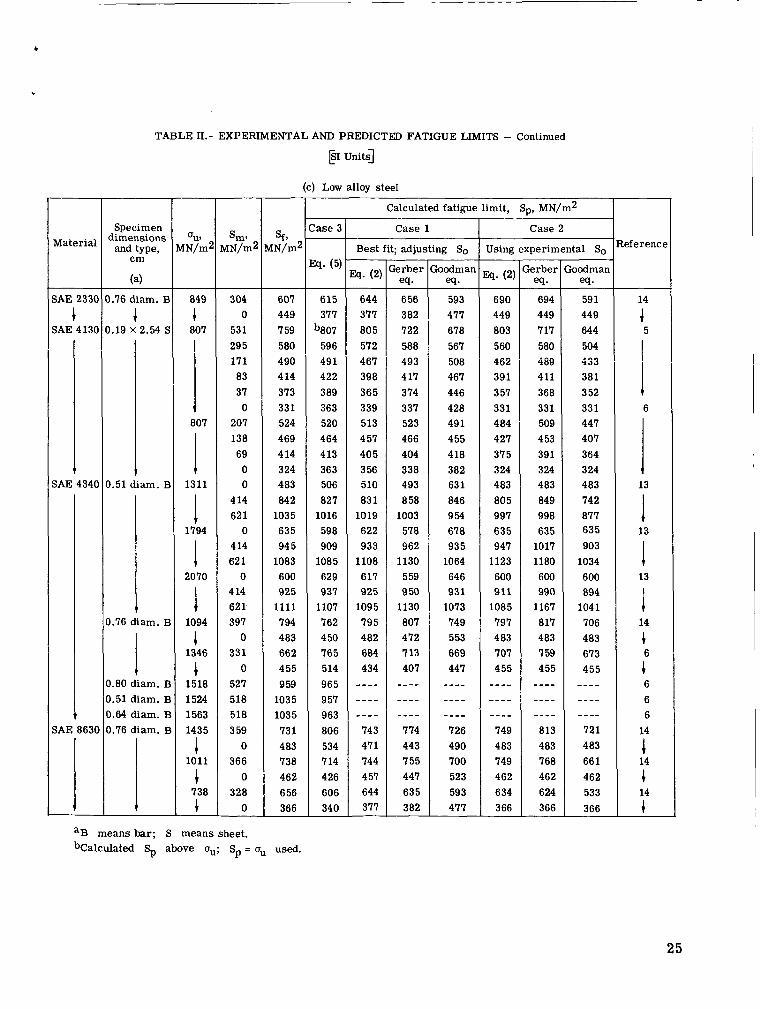
TABLE 11.- EXPERIMENTAL AND PREDICTED FATIGUE LIMITS - Continued
EI Unit4
(c) Low alloy steel
t
1
v t
Sm, VIN/m2
304 0
53 1 29 5 171 83 37
0 207 138 69
0 0
4 14 621
0 4 14 62 1
0 4 14 621 397
0 331
0 527 518 518 3 59
0 366
0 328
0
st, 5N/m2
607 449 7 59 580 490 4 14 373 331 524 469 4 14 3 24 483 84 2
1035 635 94 5
1083 600 925
1111 794 483 662 455 0 59
1035 1035 731 483 738 462 6 56 366
ase 3
Q. (5)
- 615 377
b807 596 491 422 389 363 520 464 413 363 506 a27
1016 598 909
1085 629 937
1107 762 4 50 765 514 965 9 57 963 806 534 7 14 426 606 340
Calculated fatigue limit, So, MN/m2
Case 1
Best fit; adjusting So
@. (2) -
644 377 805 572 467 398 365 339 513 4 57 40 5 3 56 510 83 1
1019 622 933
1108 617 925
109 5 79 5 482 684 434
---- ---- ---- 743 471 744 457 644 377
krber
6 56 382 722 588 493 4 17 374 337 523 466 404 338 493 8 58
1003 578 962
1130 5 59 9 50
1130 807 472 7 13 407
eq.
---- ---- ---- 774 443 755 447 635 382
ioodman eq . 593 477 678 567 508 467 446 428 49 1 455 418 382 63 1 846 954 678 935
1064 646 931
1073 749 5 53 669 447
---- ---- ---- 726 490 700 523 593 477
Case 2
Using experimental SO
cq. (2: -
690 449 803 560 482 39 1 3 57 331 4 84 427 375 3 24 483 805 997 635 947
1123 600 911
1085 797 483 707 455
---- ---- ---- 749 4 83 749 462 634 366
krber eq.
694 449 717 580 489 411 368 331 509 4 53 391 324 483 849 998 635
1017 1180 600 990
1167 817 483 7 59 455
-
---- ---- ---- 813 483 768 462 6 24 366
Ioodman eq.
59 1 449 644 504 433 381 3 52 331 447 407 364 324 483 742 877 635 903
1034 600 894
1041 706 483 673 455
---- ---_ ---- 721 483 66 1 462 533 366
eference
14
5 4
I 1 6
I 13
1 I I
13
13
14
I
1 6
6 6 6
14
14 1 1
1 14
aB means bar; S means sheet. bCalculated Sp above uu; Sp = uu used.
25
26
Specimen dimensions
and type, cm
TABLE 11.- EXPERIMENTAL AND PREDICTED FATIGUE LIMITS - Continued
Ou, MN/m
0.23 X 0.51 S 0.16 X 2.54 S
0.09 S 0.13 X 2.54 S
P I u n i t 4
(d) Stainless s t ee l s and superalloys
594 621
1456 1608
Mater ia l
321 s ta inless 347 s t a in l e s s AM 355 SCT AM 350 CRT
1 403 s ta inless P H 15-7
I PH 17-7 Stellite 31
6.3% Mo-Waspallo Inconel X-550 16-25-6 Timken
18% Ni-Marage 18% Ni-Marage 403 s ta inless
S-816
HY-TUF
1 / I 0.13 X 2.54 S 1346 0.06 X 1.91 S 1387
I I 1 0.09 X 2.34 SI 1415 0.64 diam. BI 849 0.64 diam. B ( 1014 0.64 diam. BI 1076 0.64 diam. B / 1197 0.64 diam. Bl 828 0.80 diam. BI 1518 1.91 &am. BI 1856 1.91 diam. BI 2022 0.64 diam. BI 973
Sm, dN/m
__ 0
190 593
0 138 276 690 34 5
0 231 462 0 0 0 0 0 0
569 466 476 0
% IN/m2
~
2 14 380 9 52 518 621 738
1139 690 54 5 690 849 511 290 380 407 3 59 3 59
1035 932 9 52 421
:ase 3
rs. (5)
~
221 379 987 543 64 2 74 6
1100 74 7 49 5 66 5 8 56 502 325 385 406 444 314 976 932 951 37 1
Calculated fatigue limit, Sp, MN/m2
Case 1
Bes t fit; adjusting So
- Case 2
rsing experimental So
oodmar eq .
ef e rencc
8 9
20 19
9 16
1 1 15 17 17 17 17 17 6
18 18 17

c
, TABLE 11.- EXPERIMENTAL AND PREDICTED FATIGUE LIMITS - Concluded
p1 unit4
(e) Titanium
Material
Pure Pure c- ?I",! B120 VCA 2.5A1- 16V
I ' 2.5A1-16V
I 2.5A1- 16V + 5A1-2.5Sn 4A1-3M0-1V 4A1-3M0-1V 4A1-3Mo-lV
l 1 4A1-3M0- 1V
1 1
4A1-3M0- 1V
6A1-4V
16A1-4!
6A1-4V
1 6A1-4V-2Sn 6A1-4V-2Sn 6A1-4V-2Sn 6A1-4V 6A1-4V 6A1-4V 8A1- 1Mo- 1V
I ' 13V- 11CR-3A
Specimen dimensions
and type, cm
( 4 1.15 X 3.81 S
1.15 X 3.81 S
S 1.10 x 1.27 S 1.10 x 1.27 S 1.13 x 1.27 S 1.13 X 1.27 S !.I1 Y 1.27 s 1.10 X 1.27 S 1.05 x 2.54 S
1 1
1.16 X 2.54 S
1.32 x 2.54 S
I 3.25 X 0.51 S
0.17 s 0.17 s
5.05 X 2.54 S
4 I 1
3.16 X 2.54 S
3.32 x 2.54 s
D.16 X 2.54 S
I 1
D.32 x 2.54 s
0.11 X 1.27 S
0.95 diam. B 0.95 diam. B 0.95 diam. B
0.09 s 0.09 s
0.25 X 0.51 E 0.13 x 2.54 E
I
I 0.25 X 0.51 I
OU, IIN/m2
- 7 59 918 828 66 1 689 679 707 9 74 940
1173
1 I
1111
1159
I 798
1352 1339 1152
1 I +
1208
1194
1145
1 1
1145
1145
4 1043 1215 1130 1139 1145 1141 1049
I 1377 -
176 197 2 14 290 306 186 248 373 193
0 242 478
0 293 531
0 606 244 566 53 1
0 328 276 531
0 328
0 328 584
0 283 5 84 440 344 342 398 380 538 524 244
0 173 4 14 275 -
sf, d N / d
- 352 393 428 483 511 311 4 14 621 380 324 483 621 34 5 587 690 311 787 483 911 849 483 656 552 690 345 552 345 552 7 59 34 5 566 7 59 704 6 56 621 725 690 863 842 483 4 14 518 621 54 5 -
!ase 3
378 438 428 4 50 473 363 425 602 442 3 52 532 735 339 562 77 5 349 855 446 839 806 348 598 566 789 3 56 563 346 5 54 832 346 560 832 695 611 589 670 639 786 773 527 324 451 6 54 593 __
Calculated fatigue limit, S,,, MN/m2
Case 1
Best fit; adjusting So
Case 2
Using experimental So !eference
6 6 6 6 6 6 6 6
21 22
1 1 22
22
8 20 20 22
22
22
22
c
1
1 1
1 1 22
23 1 24 24 24 20 20 8
19
1 8
aB meansbar ; S means sheet.
27

Material
(55) 50 (345)
l3 45 (311)
!024-T81 (Clad)
2 505 000 run-out 12 (83)
169 ooo estimated
failed
4 001 000
iM 350 CR'
UU, ;si (MN/m2)
64.6 (446)
59.0 (407)
223.0 (1549)
TABLE 111.- RESULTS OF SPECIAL FATIGUE TESTS
Predicted by eq. (3)
55 (380)
50 (345)
169 (1168)
Sa, rs i (MN/m2
9.6 (66) ___
9.0 (62)
54.0 (373)
Experimental I "
4 058 170 13 (90) 55 (380) 1 (55) 1 run-out 1 estimated
I I
312 000 70 (483) 175 (1208) 1 47 (324) 1 failed 1 estimated
I 1
28 NASA-Langley, 1967 - 32 L-5169

“The aeronautical and space activities of the United States shall be conducted so as t o contribute . . . to the expansion of human knowl- edge of phenomena in the atmosphere and .pace. The Administration shall provide for the widest practicable and appropriate dissemination of information concerning its activities and the results thereof .”
-NATIONAL AERONAUTICS AND SPACE ACT OF 1958
NASA SCIENTIFIC AND TECHNICAL PUBLICATIONS
TECHNICAL REPORTS: Scientific and technical information considered important, complete, and a lasting contribution to existing knowleclge.
TECHNICAL NOTES: Information less broad in scope but nevertheless of importance as a contribution to existing knowledge.
TECHNICAL MEMORANDUMS: Information receiving limited distribu- tion because of preliminary data, security classification, or other reasons.
CONTRACTOR REPORTS: Scientific and technical information generated under a NASA contract or grant and considered an important contribution to existing knowledge.
TECHNICAL TRANSLATIONS: Information published in a foreign language considered to merit NASA distribution in English.
SPECIAL PUBLICATIONS: Information derived from or of value to NASA activities. Publications include conference proceedings, monographs, data compilations, handbooks, sourcebooks, and special bibliographies.
TECHNOLOGY UTILIZATION PUBLICATIONS: Information on tech- nology used by NASA that may be of particular interest in commercial and ofher non-aerospace applications. Publications include Tech Briefs, Technology Utilization Reports and Notes, and Technology Surveys.
h a i l s on the availability of these publications may be obtained from:
SCIENTIFIC AND TECHNICAL INFORMATION DIVISION
N AT1 0 N A L A E R 0 N A U T I CS A N D SPACE A D M I N I ST R AT IO N
Washington, D.C PO546
Related Documents


![An Empirical Analysis using Private Investments Cross ...€¦ · development of strategic investments [5] . Relating SI to economic performance is something new, especially considering](https://static.cupdf.com/doc/110x72/5f0796597e708231d41dba8f/an-empirical-analysis-using-private-investments-cross-development-of-strategic.jpg)
![Relating Big Data Business and Technical Performance Indicators · business perspective still need further investigation in this area. As discussed in [5], starting from empirical](https://static.cupdf.com/doc/110x72/5e83811aadeebb0e6b67069b/relating-big-data-business-and-technical-performance-indicators-business-perspective.jpg)