An Empirical Analysis of Employee Responses to Bonuses and Penalties Wim A. Van der Stede Department of Accounting London School of Economics and Political Science [email protected] Anne Wu Department of Accounting College of Commerce National Chengchi University [email protected] Steve Yuching Wu School of Business Faculty of Business and Economics University of Hong Kong [email protected] April 12, 2018 We thank seminar participants at the 2016 AAA Management Accounting Section midyear meeting, workshop participants at Darden School of Business, ESSEC Business School, HEC Lausanne, Michigan State University, Tilburg University, Turku School of Economics, and the University of Hong Kong, and particularly Farah Arshad, Clara Chen, Stefan Linder, and Tatiana Sandino for their helpful suggestions and comments on previous drafts. Corresponding author: Wim A. Van der Stede, Department of Accounting, London School of Economics, Houghton Street, London WC2A 2AE, UK, tel. +44 (0)20 7955 6695, [email protected].

Welcome message from author
This document is posted to help you gain knowledge. Please leave a comment to let me know what you think about it! Share it to your friends and learn new things together.
Transcript

An Empirical Analysis of Employee Responses to Bonuses and Penalties
Wim A. Van der Stede
Department of Accounting
London School of Economics and Political Science
Anne Wu
Department of Accounting
College of Commerce
National Chengchi University
Steve Yuching Wu
School of Business
Faculty of Business and Economics
University of Hong Kong
April 12, 2018
We thank seminar participants at the 2016 AAA Management Accounting Section midyear meeting,
workshop participants at Darden School of Business, ESSEC Business School, HEC Lausanne, Michigan
State University, Tilburg University, Turku School of Economics, and the University of Hong Kong, and
particularly Farah Arshad, Clara Chen, Stefan Linder, and Tatiana Sandino for their helpful suggestions
and comments on previous drafts.
Corresponding author: Wim A. Van der Stede, Department of Accounting, London School of Economics,
Houghton Street, London WC2A 2AE, UK, tel. +44 (0)20 7955 6695, [email protected].

- 1 -
An Empirical Analysis of Employee Responses to Bonuses and Penalties
ABSTRACT: We examine how employees respond to bonuses and penalties using a
proprietary data set from an electronic chip manufacturer in China. First, we examine
the relative effects of bonuses and penalties and observe a stronger effect on
subsequent effort and performance for penalties than for bonuses. Second, we find
that the marginal sensitivity of penalties diminishes faster than that of bonuses,
indicating that the marginal effect of a bonus may eventually exceed that of a penalty
when their values are sufficiently large. Third, we find that penalties increase
employee turnover especially for skillful and high-quality workers. Finally, we
extend our analyses to implicit gains/losses and find a negative impact of both
implicit gains/losses, where the effects of implicit losses are stronger. These results
help inform our understanding of the observed limited use of penalties in practice,
their effectiveness and possible unintended consequences, and also how these effects
may extend into implicit incentives.
Keywords: employee compensation, incentives, bonus, penalty, prospect theory
Data Availability: The confidentiality agreement with the company that provided
data for this study precludes the dissemination of detailed data without the
company’s consent.
- 2 -
I. INTRODUCTION
Humans respond to the prospect of reward as well as the fear of punishment. Incentive
contracts in use in most organizations, however, are generally predicated on the motivation
derived from the prospect of rewards. Other than practical considerations (e.g., the inability of
firms to ask employees to “pay the company back” beyond the use of clawbacks in cases of
fraudulently earned bonuses), the reasons why bonus contracts have been more prevalent than
penalty contracts are not well understood. This is surprising given that almost everyone has been
exposed to at least a mix of rewards and punishments when growing up. Of course, in
organizations, a penalty perhaps suffices to be “implicit” by way of “not earning” a reward (such
as missing out on an “expected” bonus or a “hoped-for” promotion). And there is also the
ultimate threat of dismissal.
A small number of prior studies have shed light on this issue by examining the framing
effect of incentive contracts in experimental settings. Luft (1994) finds that employees prefer
incentive contracts described in bonus terms to identical contracts described in penalty terms.
Hannan, Hoffman, and Moser (2005) extend Luft’s finding by showing that employees generally
expend more effort under penalty contracts than they do under equivalent bonus contracts to
avoid “paying” penalties (which as a feature can be more feasibly incorporated in a lab
experiment than in practice). In a field experiment, Hossain and List (2012) also find that
penalty-framed contracts enhance team productivity compared with bonus-framed contracts. That
said, in an incomplete contract setting, Christ, Sedatole, and Towry (2012) find that negatively-
framed penalty contracts reduce trust in the principal, leading to lower effort on tasks not
governed by the contracts as a potential way to settle up.

- 3 -
While these studies rely on prospect theory to develop their hypotheses, the empirical
investigation rarely goes beyond the loss aversion nature of the theory, leaving the other
predictions of prospect theory unexplored. In addition to loss aversion, an important feature of
the value function of prospect theory is that it is concave in the gain position but convex in the
loss position, suggesting that people become less sensitive to gains/losses as their value increases.
The diminishing sensitivity to gains/losses has profound implications for our understanding of
the relative effectiveness of bonuses versus penalties. For example, although prior studies find
that people on average respond positively (i.e., by increasing their effort) to a penalty, the
marginal effect may eventually become curtailed (i.e., people reduce their effort in response to an
increase in the penalty) when a penalty reaches a larger value. Furthermore, if people’s
sensitivity to penalties diminishes faster than their sensitivity to bonuses, the marginal effect of
bonuses may dominate that of penalties beyond a certain threshold. If that is the case, penalties
will not always be more effective in motivating employee effort. Therefore, to design an
effective incentive system, we should not only focus on the average effect of a bonus or penalty,
as has typically been the case in prior studies, but also the marginal effect that varies with the
amount of bonuses/penalties.
The purpose of this study is to investigate the marginal effect of bonuses and penalties in a
field setting. We empirically analyze production output and compensation data of 543 production
line workers in an electronic chip manufacturing plant in China. Unusually, but pertinent to our
investigation, the workers’ compensation scheme is a bonus-malus contract, which includes both
bonus and penalty components. A worker receives a bonus when s/he outperforms the
performance standard, but a penalty when the performance falls below the standard. Given this,
we examine how the bonuses and penalties received during the prior month are associated with
- 4 -
the worker’s current deviation in performance from his or her own average, controlling for
workers’ fixed effects and the impact of other factors.
First, we examine the relative effects of bonuses and penalties; that is, how employees
respond directly to bonuses or penalties by changing their level of effort in the immediate
subsequent period. Prospect theory suggests that penalties provide stronger stimuli to employees
compared with bonuses due to loss aversion. That is, employees are expected to respond more
strongly to penalties compared to bonuses to avoid incurring subsequent additional penalties.
Consistent with our prediction, we observe a stronger link between penalties and subsequent
effort (measured by production quantity and time) and performance (measured by production
quality and efficiency), suggesting that a per-dollar penalty motivates higher levels of effort and
performance than a per-dollar bonus which, as we will see, is consistent with the lab finding by
Hannan et al. (2005) and the field evidence by Hossain and List (2012).
Second, we examine whether employees’ subsequent efforts and performance exhibit a
diminishing sensitivity to bonuses/penalties. Prospect theory maintains that the value function is
concave at gain positions but convex at loss positions. Therefore, the marginal utility/disutility
decreases with the value of the gain/loss. The diminishing sensitivity implies that the magnitude
of an employee’s response to a per-dollar increase in a bonus/penalty also decreases. This
hypothesis is supported by our data, indicating a curvilinear relationship between bonuses/
penalties and subsequent performance. Our findings thus imply that diminishing sensitivity
presents a limit on using monetary bonuses and penalties to motivate employee efforts.
Furthermore, we find that the curvature of a penalty is significantly greater than that of a bonus,
and therefore that the marginal effect of a bonus eventually exceeds that of a penalty when the
values of the bonus and penalty are sufficiently large. This finding may be one of the reasons
why penalty schemes do not dominate bonus schemes in practice. This important feature of

- 5 -
diminishing sensitivity has not yet been examined by prior studies that compare rewards versus
penalties.
Third, we investigate how bonuses and penalties are associated with voluntary employee
turnover. Although penalties stimulate a higher level of effort, studies have found them to lower
employee morale, trigger employee distrust of managers, and result in other dysfunctional
behaviors (Hannan et al. 2005; Christ et al. 2012). Consistent with this line of research, we find
penalties to be associated with a greater probability of voluntary employee turnover. Furthermore,
the link between penalties and voluntary turnover is especially significant for workers who are
capable/skillful to handle complex tasks, and those who obtain high production quality. This
finding suggests that managers should be especially careful about human capital losses in their
organizations when they use penalty schemes.
Finally, we investigate how employees respond to implicit bonuses/penalties that in our
context arise due to factors outside the employees’ control, namely due to changes in
performance standards. Specifically, we first estimate employees’ perceived implicit gain or loss,
measured as the gap between the actual pay received and what it would have been had the
performance standards remained unchanged. Then we examine how employees’ perceived
implicit gain/loss is associated with subsequent effort and performance. Unlike bonuses and
penalties that are clearly tied to the workers’ efforts, implicit gains and losses come from changes
in performance standards (either favorable or unfavorable) and therefore can be expected to have
muted effects owing to uncontrollable factors. Consistent with our expectation, we find implicit
gains and losses to be negatively associated with workers’ subsequent efforts and performance.
Furthermore, in line with prospect theory, the negative impact of implicit losses is significantly
greater than that of implicit gains. This finding reveals the additional costs that management
should consider when adjusting performance standards.
- 6 -
This study makes several contributions to the literature. First, we extend the application of
prospect theory in compensation research. Prior studies have relied on the loss aversion feature of
prospect theory to develop hypotheses for the framing effect of gains versus losses. The other
predictions, however, have been left mostly unexplored in this line of research. In this study, we
not only use loss aversion to develop our prediction of the relative effect of bonuses and penalties,
but also examine whether employees exhibit diminishing sensitivity to bonuses/penalties as
suggested by the concavity/convexity of the value function in the gain/loss positions. Moreover,
we investigate whether the diminishing rate differs significantly between the gain and loss
positions. Diminishing sensitivity is a critical feature of the value function and suggests that, in
addition to the average effect, we should also be attentive to the marginal effect of rewards and
punishments and where they become differentially attenuated.
Second, while most of the findings in prior studies come from lab experiments (Hossain
and List 2012 as an exception), our study adds further and incremental evidence from the field.
An advantage of field research, compared with lab experiments, is the ability to shed light on the
effect sizes of bonuses and penalties. For example, our field setting allows us to examine how the
marginal effect of bonuses/penalties varies with the monetary value of the incentive. It also
allows examining how the probability of employee voluntary turnover changes following the
receipt of bonuses and penalties, which is a result that provides additional evidence on the impact
of bonus/penalty in this area.
Our study also provides insights for practice. First, although negatively-framed incentives
are less widely used, our study shows that employees who receive a penalty perform significantly
better than their own average in the subsequent period and such performance improvement
exceeds that of those who receive an equivalent bonus or a base salary. This is consistent with
the theoretical argument that penalties usually have a stronger effect on human behavior than
- 7 -
rewards. Thus, in line with insights from Hossain and List (2012), we suggest that careful use of
penalty schemes may effectively contribute to productivity and performance. Second, we find
that the marginal effects of bonuses and penalties, however, decrease with their value and that
this is more pronounced for penalties than for bonuses. Therefore, management should consider
moderating its use of bonuses, and especially penalties, and rely on other forms of motivation
when the values of bonuses and especially penalties become larger. Third, management should
also be careful about the potential loss of human capital when using penalty schemes, as
especially valuable employees appear to show a greater propensity to leave the organization after
having received penalties. Fourth, we find that implicit gains and losses, which stem from
changes in performance standards, are negatively associated with subsequent effort and
performance. This can occur when performance standards are adjusted, where during such
periods the incentive plans may not work as effectively as expected due to perceived implicit
gains or losses.
The following section reviews the relevant literature and develops the hypotheses. The
third section explains the research design and variable measurements. The fourth section presents
the core empirical results as well as various robustness checks. The final section concludes and
discusses the study’s limitations and opportunities for future research.
II. LITERATURE AND HYPOTHESES
Effects of Bonuses and Penalties
Economists and psychologists maintain that behavior is shaped by its consequences
(Thorndike 1911; Skinner 1953; Bandura 1977). In a business context, organizations often use
various monetary and non-monetary forms of reward/punishment to influence employee
decisions and behavior (Merchant and Van der Stede 2017). Bonuses, a form of monetary
- 8 -
rewards, are positive reinforcement mechanisms that give employees additional utility and in turn
motivate a greater level of effort. In contrast, monetary penalties are punishment mechanisms
that decrease employee utility and, thus, should curb undesirable behavior such as sloppiness,
inattention, or shirking. Although they come about through different stimuli, both bonuses and
penalties motivate employees to exert a higher level of effort to either increase utility or decrease
disutility, and thus, achieve better performance in the subsequent period.
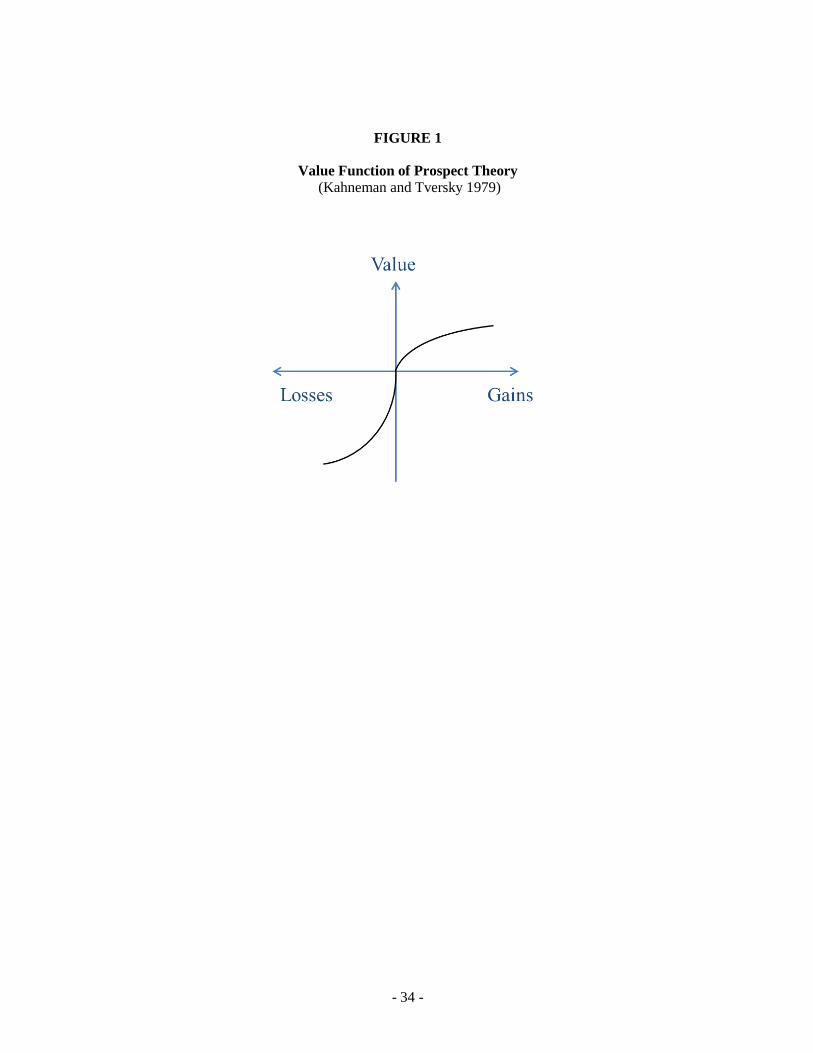
We follow prospect theory to determine the relative strength of the response associated
with a bonus or penalty. Prospect theory indicates that the same amount of bonus and penalty
provides different levels of stimulus to people because individuals value gains differently than
they value losses (Kahneman and Tversky 1979). As shown in Figure 1, the slope of the well-
known prospect theory value function is steeper in the loss position than in the gain position. The
asymmetric slope implies loss aversion.
– Insert Figure 1 –
Loss aversion has profound implications in many domains. In particular, researchers have
used the theory to investigate the framing effect of compensation plan design. Luft (1994) finds
that employees prefer incentive contracts described in bonus terms to identical contracts
described in penalty terms. Hannan et al. (2005) extend Luft’s finding by showing that
employees generally expend more effort under penalty contracts than they do under equivalent
bonus contracts to avoid paying penalties. Similarly, Hossain and List (2012) find that penalty-
framed contracts enhance team productivity compared with bonus-framed contracts.
The asymmetric slope of the value function suggests that $1 of loss creates greater
disutility than the utility created by $1 of gain. If we consider an employee’s base salary as the
reference point, a penalty would provide the employee greater disutility than the utility provided
by an equivalent bonus. Therefore, we expect an employee’s response to be stronger for a penalty

- 9 -
than for a bonus, thus trying harder to avoid a penalty than to gain a bonus, resulting in a higher
level of performance. This suggests the following hypotheses:
H1a: Bonuses/penalties have a positive effect on subsequent performance.
H1b: Ceteris paribus, penalties have a greater positive effect than bonuses on an
employee’s subsequent performance.
Diminishing Sensitivity
In addition to loss aversion, prospect theory suggests that the value function is concave in a
gain position and convex in a loss position (see Figure 1). The curvature of the value function
implies diminishing sensitivities to gains and losses. Any incremental gain or pay above the
reference point results in a progressively smaller improvement in utility, and any incremental
reduction of pay below the reference point results in a progressively smaller reduction in utility.
The diminishing sensitivity to gains and losses has profound implications for practice. One
important implication is that people tend to be risk-averse in a gain position but risk-seeking in a
loss position. In addition to lab evidence (e.g., Kahneman and Tversky 1979; Tversky and
Kahneman 1992; Fennema and Wakker 1997), diminishing sensitivity has also been inferred
from the field. For example, Pope and Schweitzer (2011) find that professional golfers are more
likely to make risk-averse putts when they are in the domain of gains (golfers attempting eagle or
bogey putts) rather than the domain of losses (those attempting par, bogey, or double bogey
putts).
In compensation scheme design, diminishing sensitivity suggests that employees perceive a
smaller amount of marginal change in utility when the value of a bonus/penalty increases, which
implies that the marginal effect of a bonus/penalty on employee performance also decreases. As
such, $1 of an incremental bonus/penalty induces employees to exert less effort when the value

- 10 -
of the bonus/penalty increases. Our second hypothesis tests the diminishing sensitivity of a
bonus/penalty:
H2a: The marginal effect of a bonus/penalty on an employee’s subsequent performance
decreases with the value of the bonus/penalty.
Furthermore, Heath, Larrick, and Wu (1999) propose that diminishing sensitivity across the
value function is demonstrated by how an individual frames the “starting problem”—that is,
when people do not feel as though they are making much progress toward their goals, they find it
difficult to gather the motivation necessary to accomplish the goal. Heath et al.’s (1999)
argument thus suggests that the diminishing sensitivity might be more significant in loss
positions, due to this starting problem, compared to gain positions. In the context of
compensation plan design, employees usually face the starting problem when they receive large
penalties. Large penalties may make employees feel they are too far away from the goals or the
performance standards, and therefore find it difficult to motivate themselves to start the task.
This implies that the decreasing sensitivity in the penalty range may be greater than in the bonus
range, and therefore that the marginal effect of a bonus will eventually exceed that of a penalty
when the values of the bonus and penalty, respectively, are sufficiently large. This leads us to
propose the following further hypothesis related to diminishing sensitivities:
H2b: The marginal effect of a penalty on an employee’s subsequent performance
diminishes faster than the marginal effect of a bonus on an employee’s subsequent
performance.
Employee Turnover
Although we focus on the relationship between bonuses/penalties and subsequent
performance, bonuses and penalties may also influence performance by affecting the internal
cognitive processes of employees and, therefore, their subsequent attitudes and behavior
(Podsakoff, Bommer, Podsakoff, and MacKenzie 2006). In particular, attribution theory indicates
- 11 -
that people are more likely to attribute events to external factors when the events are negative
and to internal factors when they are positive (Morewedge 2009). Therefore, employees who
receive bonuses attribute their good performance to their own ability and/or efforts and thus
perceive the compensation as fair and warranted. In contrast, those who receive penalties are
more likely to attribute their poor performance to external factors and perceive the penalties as
unfair. Consistent with this logic, Hannan et al. (2005) find that people under bonus contracts
perceive a higher level of fairness than those under penalty contracts. Moreover, Christ et al.
(2012) show that penalty contracts engender a greater level of distrust, which in turn leads to
lower efforts expended on tasks that inevitably incomplete contracts omit as a potential way for
the employee to settle up. The perceived unfairness and distrust under the penalty condition is
likely to decrease employee job satisfaction and increase turnover. In contrast, employees who
receive bonuses are likely to be more satisfied and less likely to quit. Formally, we test the
following two hypotheses:
H3a: Employees who receive penalties are more likely to quit their jobs.
H3b: Employees who receive bonuses are less likely to quit their jobs.
Implicit Gains and Losses due to Uncontrollable Factors
For effective incentive system design, bonuses and penalties should be closely tied to
performance to motivate desirable or to discourage undesirable behaviors in employees. When
the link between bonuses/penalties and outcomes is unclear, the incentive system becomes less
effective. Many studies of subjective performance evaluation have documented such a mismatch
between rewards and outcomes. For example, Marchegiani, Reggiani, and Rizzolli (2016) find
that leniency and severity biases, both of which represent mismatches between compensation and
outcomes, lead to deterioration in subsequent performance.
- 12 -
Perceived mismatches between compensation and outcomes, however, can occur even with
objective performance evaluations. This can arise when a change in performance standards (or
another aspect of the incentive scheme) occurs and employees do not fully and/or immediately
incorporate these changes into their outcome expectations. Therefore, an employee who puts an
equal amount of effort into his or her work and believes s/he has done equally well may receive
different amounts of pay during these two periods. Such differences could affect people’s coding
of gains and losses. Indeed, Koszegi and Rabin (2006) show that people’s reference points could
be endogenously determined according to the recently held rational expectation of the outcomes,
and that deviations from this rational expectation are perceived as gains or losses.1 As such,
employees who receive more than they expect will tend to experience an implicit gain, whereas
those who receive less will tend to experience an implicit loss.
However, because implicit gains and losses stem from external factors (changes in
performance standards in our setting), they can be expected to have muted effects due to their
uncontrollability. Moreover, such uncontrollable implicit gains/losses could be harmful to an
organization because they ‘misfire’. Workers who experience implicit losses may perceive the
appraisal system as too harsh (Marchegiani et al. 2016) and condemn it for failing to reward the
committed levels of effort (Blanchard, Chow, and Noreen 1986). For example, in a tournament-
based incentive setting, Cai and Gallani (2018) find that implicit penalties induced by
management’s ex post subjective adjustment to objective performance (and thus uncontrollable
by the evaluatees) are associated with subsequent performance declines. In contrast, those who
1 Several empirical studies have provided evidence that supports the reference-dependent decision in Koszegi
and Rabin’s (2006) model. For example, Crawford and Meng (2011) find that using rational expectation as the
reference point explains the labor supply decisions of New York City cab drivers more precisely than prior models
examining labor supply. Pope and Schweitzer (2011) similarly use the performance data of professional golfers to
test several predictions of prospect theory. Although par is a salient reference point for professional golfers, the
authors find some evidence that golfers may develop expectations of their performance according to the difficulty of
each hole and use these expectations as alternative reference points.
- 13 -
experience implicit gains may perceive (although perhaps not condemn) the appraisal system as
too lenient, and experience having been undeservingly rewarded. Regardless, economics-based
incentive theory predicts that either of these will distort the incentives.
Marchegiani et al. (2016) further show that the severity bias (that fails to reward a
deserving level of effort or that earns less than what was expected), however, is more detrimental
than the leniency bias (that rewards an undeserving level of effort or that earns more than what
was expected) due to the nature of loss aversion as suggested by prospect theory. In other words,
the distorted, negative effects of implicit losses on subsequent performance are expected to be
greater than those of implicit gains. Taken together, this leads us to suggest the following
hypotheses:
H4a: Implicit gains/losses have a negative effect on subsequent performance.
H4b: Ceteris paribus, implicit losses have a greater negative effect than implicit gains on
an employee’s subsequent performance.
III. METHOD
Research Site
The research site is a leading manufacturer of electromagnetic interference components,
including several types of electronic filters and inductors. The main products are widely used in
various types of laptop/desktop computers and consumer electronic products, such as mobile
phones, digital cameras, GPS navigation devices, and LCD TVs. Primary customers include
Siemens, Samsung, HTC, and Foxconn.
The company currently operates three manufacturing plants in China. We base our study on
compensation and performance data collected from production line workers in one of these plants
from February 2008 to April 2010. The sample consists of 543 individual workers. Because the
workers perform discrete tasks of the production process on an individual basis, their
- 14 -
productivity and the quality of their outputs can be directly related to their effort and ability. The
direct link between effort and performance allows us to investigate how the workers respond to
the bonuses or penalties they receive. Each day, supervisors assign tasks to the workers. The task
assignments depend on the daily production schedules, which are primarily determined based on
customer orders, and the supervisors’ consideration of the workers’ past experience and skills.
According to our data, each worker was assigned an average of 3.56 different tasks per month.
Roughly 10% of the workers were assigned to work on more than 10 different tasks per month.
According to our interviews with management, the workers normally did not have the flexibility
to choose their task assignments. Yet, the company does not have specific requirements for how
many units each worker should produce. Therefore, for any group of workers assigned to the
same tasks, hard workers produce more. Moreover, workers do have some discretion to choose
how many hours to work each day, and how many days to work each month.
Each worker’s monthly compensation is the sum of base salary, overtime pay, monthly
bonus or penalty if any, and other allowances. The starting base salary for a production line
worker is RMB900. However, the actual amount of salary received depends on the worker’s
attendance rate (days attended/total working days) in each month. The worker’s overtime pay is
RMB7.76 (RMB10.34) per hour during weekdays (weekend days).
A worker’s bonus and penalty is determined by his or her production efficiency and quality
each month. To note, a worker can receive a bonus and a penalty in the same period if they come
from different aspects of performance (e.g., a bonus for good efficiency and a penalty for poor
quality), but as we will discuss further below (see also fn. 2), we are able to keep bonuses and
penalties separate in our data, thus retaining the most information and allowing more detailed
analyses and investigations.
- 15 -
Efficiency is measured as the difference between the standard and actual amount of hours
worked during production. The company sets a standard time for each product or procedure. The
standard production time for a worker is then calculated by multiplying the actual quantity of
output by the standard time per unit of output. If a worker is efficient, s/he will obtain a favorable
production efficiency variance because the actual time used during production is less than the
standard time. The company pays RMB2.2 for 1 hour of favorable variance and deducts
RMB7.76 (RMB10.34) for 1 hour of unfavorable variance during weekdays (weekend days). For
example, a worker works for 3 hours to produce 20 units of chips. The company expects an
average worker to produce one unit of chips in 12 minutes. The standard production time for the
worker to produce 20 units is 4 hours (20 units × 12 minutes). Thus, the worker has 1 hour of
favorable variance and receives RMB2.2 (RMB2.2 × 1 hour) as a bonus for high efficiency. In
contrast, if the worker spends 5 hours on the task during a weekday (weekend day), RMB7.76
(RMB10.34) is removed from his or her pay as a penalty for poor efficiency.
In addition to the penalty for inefficiency, a worker can also be penalized for poor quality
of output. The quality control department inspects all of the production outputs. A worker is
penalized if the quality of output does not meet the standard. The company tracks each worker’s
production defects and applies a standard rework time to each type of defects. Depending on the
severity of the problem, the standard rework time ranges from a few minutes to 3 hours. The
company then charges RMB4.5 per hour to the worker responsible for the manufacturing defect.
Empirical Models and Variable Measurement
We use the following model (1) to examine the relationship between bonuses/penalties and
subsequent performance.
Performance i,t = α + β1 Bonus i,t-1 + β2 Penalty i,t-1 + β3 Bonus i,t-1 2 + β4 Penalty i,t-1
2
+ Σ β Controls i,t + ε i,t (1)

- 16 -
We use four proxies to measure an individual worker’s effort and performance. Quantity i,t
and Time i,t are two direct measures of a worker’s level of effort after receiving bonuses or
penalties. Quantity i,t is the total amount of products produced and/or tasks performed by worker i
in month t. We expect workers who were motivated by bonuses or penalties received during the
last month to expend more effort at work and thereby produce more units. However, Quantity i,t
may be biased when different tasks are not exactly comparable due to their differing levels of
complexity. Therefore, we use another measure, Time i,t, to capture the total standard production
time required for a worker’s production output. Time i,t is estimated as Σ(Qi,j,t × Tj,t), in which
Qi,j,t is the amount of task j completed by worker i in month t, and Tj,t is the standard time set by
the company to complete one unit of task j. Converting production quantity into time allows us to
compare the productivity of the workers even when they were assigned to work on different tasks.
The two performance variables we study in this paper are Efficiency i,t and Quality i,t. Efficiency i,t
is measured as the difference between the standard production time (i.e., Time i,t) and the actual
amount of hours used during production. A favorable variance indicates that a worker completed
his or her tasks more efficiently than the standards set by the company. While the three
performance measures discussed above (Quantity i,t , Time i,t, and Efficiency i,t) capture
employees’ effort and productivity, we also include each individual employee’s production
quality as the fourth dependent variable. Quality i,t is measured as the number of production
outputs processed by worker i in month t that successfully pass the quality inspection (i.e., free of
defects) per thousand units of his/her production.
The major independent variables in this study are Bonus i,t-1, Penalty i,t-1, and their quadratic
terms. We use the bonuses and penalties received in the previous month (t-1) to determine how

- 17 -
the workers responded to the positive and negative outcomes.2 We include the quadratic terms to
capture the curvilinear relationship as suggested by the diminishing sensitivity of the value
function in H2a and b. We include several control variables in our model. First, we control for
work experience by including a worker’s tenure at the company, Tenure i,t-1, measured in months.
Another control variable for worker experience, Task Experience i,t-1, is the weighted average
cumulative hours of experience for the tasks assigned. Second, the difficulty of tasks assigned to
workers may vary significantly. We therefore include Task Complexity i,t-1, measured as the
weighted average number of hours needed to complete a task, in our models. Third, we include
worker’s age as it may be a proxy for a worker’s job horizon. In addition, we include the worker
fixed effect to control for the potential effect of unobservable, worker-specific, time-invariant
factors.3 In doing so, we examine how the bonuses and penalties received during the prior month
are associated with the worker’s current deviation in performance from his or her own average. A
fixed-effects model is appropriate because it takes away each worker’s average productivity from
the model. Therefore, the coefficients of Bonusi,t-1/Penaltyi,t-1 can be interpreted as the extent to
which RMB1 of bonus or penalty motivated the worker to outperform or underperform his or her
own average performance. We also include the year fixed effect to control for the effects of
environmental factors such as changes in economic conditions. All of the continuous variables
are winsorized at the top and bottom 1%.4 We cluster all standard errors at the worker level.
2 We treat bonuses and penalties separately, instead of aggregating them together and presenting the net
number, for the following reasons. First, theory does not provide clear guidance on whether people respond to the
components of their payoff or the net total pay. As suggested by prospect theory, the impact depends on how people
frame their gain/loss position and the reference point they use. A feature of our setting, however, is that workers’
framing of gains and losses is unlikely to be contaminated because bonuses and penalties are presented as different
items on their pay checks. Second, our empirical analyses (untabulated) show that a penalty’s impact does not differ
significantly when it is provided with a bonus, and vice versa. This finding suggests that, at least in our setting,
people do respond to the bonus and penalty components separately, instead of to the net number only. 3 Therefore, we do not include worker-specific characteristics that do not vary over time (e.g., gender,
education, ability) in the model. 4 Our findings are robust without winsorization.
- 18 -
To test H3, we use a discrete-time survival model to examine how bonuses and penalties
are associated with the probability of employee turnover.5 In model (2), Turnover i,t is a dummy
variable that equals one if worker i voluntarily left the company in month t and zero otherwise:6
P (Turnover i,t) = α + β1 Bonus i,t-1 + β2 Penalty i,t-1 + β3 Bonus i,t-1 2 + β4 Penalty i,t-1
2
+ Σ β Controls i,t + ε i,t (2)
Lastly, our research site provides a good setting to examine how workers respond to
perceived implicit gains and losses. The management of our research site periodically reviews
and updates the standard production time for each product/task. As such we can calculate the
implicit gains/losses part of the total bonuses/penalties. As described earlier, each worker usually
performs several different tasks each month, necessitating some way or some heuristic to track
their production efficiency on the various tasks. When faced with performance standard changes,
workers can only rely on past experience as an “anchor” to form expectations of their
performance outcomes, and then make adjustments to the standard changes. With the expected
outcome as the reference point, the difference between the expected and actual outcome would
be framed as an implicit gain (if favorable) or implicit loss (if unfavorable).
To estimate proxies for implicit gains and losses, we use each worker’s prior outcome as
the anchoring point. However, the difference between a worker’s anchoring point and the actual
outcome could be attributable to either internal, controllable factors (such as changes in his/her
effort level) or external, uncontrollable factors (such as changes in performance standards).
Therefore, one critical step in the process is to estimate the change in worker’s effort level from
one period to another. The company keeps track of workers’ monthly performance based on two
5 Compared to a regular logistic model, a discrete-time survival model reduces potential bias due to censored
data, as we have in our setting. 6 The case company records the reasons why employees quit their jobs. We use this information to differentiate
between voluntary and forced turnover.
- 19 -
different sets of standards: current-period and base-period. Current-period standards are used to
calculate workers’ production efficiency and thus their bonus/penalty in each month. Base-period
standards, on the other hand, allow managers to compare workers’ performance across different
periods because the performance standards are held constant. Using these data, we estimate each
worker’s base-period adjusted production efficiency in the months t-2 and t-1, and then calculate
the difference between the two periods, which reflects the worker’s change in effort level from t-
2 to t-1. We add this change in effort level to the production efficiency in t-2 (i.e., the initial
anchoring point) to get our proxy for worker’s adjusted expectation on production outcome in t-1.
The difference between the expected and actual outcome, which is attributable to changes in
performance standards, then serves as our proxy for Implicit Gain i,t-1 if the variance is favorable,
and Implicit Loss i,t-1 if the variance is unfavorable.7 We include Implicit Gain i,t-1 and Implicit
Lossi,t-1 into model (1) to test H4a and b.
To be clear, consider the following example to illustrate the calculation of implicit gains
and losses. Assume that a worker’s current-period production efficiency in period t-2 and t-1 was
10 (Efficiencyt-2) and 15 (Efficiencyt-1), respectively. Also assume that the company reduced the
performance standard in t-1, and therefore at least part of this worker’s improvement in
production efficiency could be reasonably expected to be attributable to the lower standard (in
this example resulting in a favorable effect). To tease out the portion of the total difference or
variance reasonably attributable to the change in standard, we first calculate what the worker’s
performance would have been had the performance standard not been changed. In this example,
the worker’s “base period” or “re-based” production efficiency in t-1 was 12 (Efficiencybase, t-1).8
The 2 units of efficiency improvement (Efficiencybase, t-1 - Efficiencyt-2) should be reasonably
7 We take the absolute values of the differences, and thus both implicit gain and loss have non-negative values.
8 For simplicity, we use t-2 as the base period in this example.
- 20 -
attributable to the change in worker’s effort. That is, if the worker used t-2 as the anchoring point,
the worker’s adjusted expectation on production outcome in t-1 would be the anchoring point
(Efficiencyt-2) plus the expected change in production due to effort (i.e., Efficiencybase, t-1 -
Efficiencyt-2 = 2 units). The other 3 units account for the difference between the actual
(Efficiencyt-1) and the expected (Efficiencybase, t-1) outcomes, attributable to the change in the
performance standard from t-2 to t-1. We use this variance as the proxy of implicit gain (if
favorable) or implicit loss (if unfavorable).
IV. EMPIRICAL RESULTS
Table 1 reports the descriptive statistics. Our final sample consists of 3,328 worker-month
observations.9 On average, each worker received a bonus of RMB148.202 and a penalty of
RMB50.085 per month. Some workers received a bonus of up to RMB655 or a penalty of up to
RMB474, which is quite significant compared with the average base salary of RMB900. The
distributions of both bonuses and penalties are right-skewed, indicating that not all workers did
receive either a bonus or penalty in a month. The average worker tenure is 6.697 months, which
is low compared with the full sample period (27 months). This is consistent with the prevalent
situation in mainland China that low-skilled factory workers tend to switch jobs frequently by
jumping to other companies.
– Insert Table 1 –
Table 2 shows Pearson and Spearman correlations. The four performance measures are
positively correlated with each other, especially production efficiency, quantity and time, which
are all related to workers’ productivity in that month. The measures of workers’ experience, Task
9 The effective sample is reduced to 2,713 for Quality i,t. The effective sample for Implicit Gain i,t-1 and Implicit
Loss i,t-1 is reduced to 2,676 because of the requirement of two consecutive periods of data (t-2 and t-1) to estimate
the implicit gain and loss.

- 21 -
Experience i,t and Tenure i,t , are also positively correlated with performance. This is consistent
with the intuition that more experienced workers achieve better production outcomes.
– Insert Table 2 –
Effects of Bonuses and Penalties
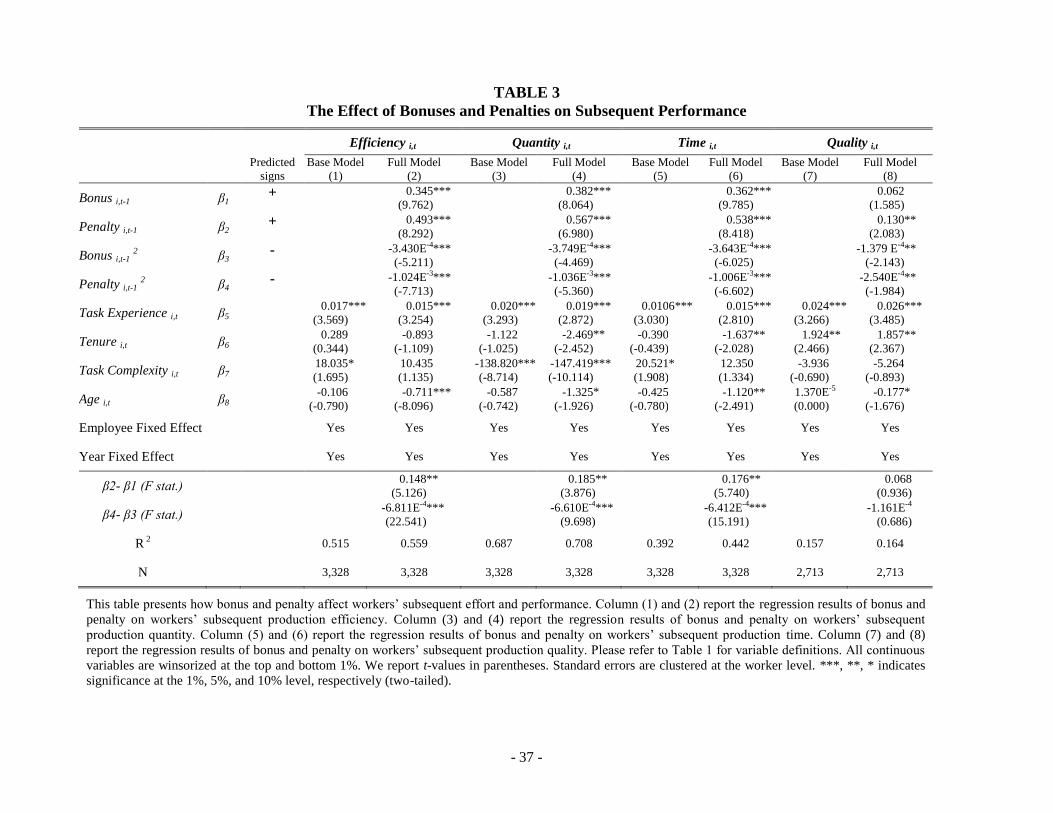
Table 3 shows the regression results for model (1). The first hypothesis predicts that both
bonuses and penalties are positively associated with subsequent performance and that penalties
have a stronger effect than the equivalent amount of bonuses. Table 3 shows the regression
results for several aspects of subsequent performance, including production efficiency, quantity,
time, and quality. For each dependent variable, we present the base model that includes only the
control variables with the employee and year fixed effects, followed by the full model. Columns
(1) and (2) show the results of the base and full regression models for each individual worker’s
production efficiency. We find positive and significant coefficients for Bonus i,t-1 and Penalty i,t-1,
suggesting that both bonuses and penalties motivated workers to achieve better production
efficiency in the subsequent period. Moreover, in line with the predictions of prospect theory, the
coefficient of Penalty i,t-1 (0.493, t = 8.292) is significantly larger (F = 5.126, p < 0.05) than that
of Bonus (0.345, t = 9.762). This is consistent with our theoretical prediction that penalties
stimulate more effort and thus better performance than the equivalent amount of bonuses. This
result is consistent with the findings of Hossain and List (2012) and Hannan et al. (2005).10
Our
findings are also economically significant. Column (2) shows that a RMB1 bonus motivates a
worker to work more efficiently and save 0.345 hours in the next month, and that a RMB1
penalty motivates a worker to save 0.493 hours, thus having nearly half again as much the effect
of the bonus. The case company paid its employees RMB7.76 per hour of overtime work. As
10
It should be noted thought that Hossain and List (2012) find a significant result for team-based workers but
not for individual workers.
- 22 -
such, 0.345 (0.493) of an hour amounts to RMB2.677 (RMB3.826) of savings in overtime pay to
workers.
– Insert Table 3 –
We also examine how bonuses and penalties are associated with an individual worker’s
subsequent production quantity and time, which are more direct proxies of the worker’s effort
level. Columns (3) and (4) show the results for individual worker’s production Quantity i,t. We
find that both bonuses and penalties are positively associated with workers’ production quantity
in the next month. The coefficient of Penalty i,t-1 (0.567, t = 6.980) is significantly larger (F =
3.876, p < 0.05) than that of Bonus i,t-1 (0.382, t = 8.064), suggesting that penalties provide a
stronger incentive than equivalent bonuses in motivating a greater level of effort from the
workers. Using each worker’s standard production Time i,t as the alternative dependent variable in
columns (5) and (6) yields similar results: an RMB1 bonus motivates an average employee to
work an additional 0.362 hour (t = 9.785), and an RMB1 penalty motivates an additional 0.538
hour (t = 8.418) of effort. The magnitude of the effects differs significantly (F = 5.740, p < 0.05).
In addition to productivity, we also examine how bonuses/penalties influence workers’
subsequent production quality. Columns (7) and (8) show the results for individual worker’s
production Quality i,t. We find a positive and significant coefficient on Penalty i,t-1 (0.130, t =
2.083). Monetary penalty incentives thus appear to motivate the workers to improve production
quality: an RMB1 penalty reduces 0.130 unit defects per thousand of production units. However,
we do not obtain a significant coefficient for Bonus i,t-1.
Diminishing Sensitivity
H2a predicts bonuses and penalties to exhibit diminishing sensitivities; that is, workers
become less sensitive to per dollar bonuses/penalties when the value of the bonuses/penalties
increases. This implies that we should observe a curvilinear relationship between bonuses/

- 23 -
penalties and subsequent performance. Because the coefficients of Bonus i,t-1 and Penalty i,t-1 are
both positive, we expect the quadratic terms of Bonus i,t-1 and Penalty i,t-1 to have negative
coefficients. Our findings support the diminishing-sensitivity hypothesis (H2a). According to
Table 3, the quadratic terms of Bonus i,t-1 and Penalty i,t-1 have negative and significant
coefficients. This finding is consistently robust across the four models using the different
performance measures as dependent variables. The implication of this finding is intuitive:
because the marginal value of money decreases, the marginal effect of bonuses and penalties also
decreases. An RMB1 increase in bonus from RMB10 to RMB11 motivates an employee to exert
more effort than an RMB1 increase from RMB100 to RMB101. Therefore, employers must
consider the cost and benefit of giving out additional bonuses when the value is large.
Our results also indicate that the marginal sensitivity of Penalty i,t-1 diminishes faster than
that of Bonus i,t-1 in the models with the various performance measures as dependent variables
except for Quality i,t. Specifically, using the efficiency model as an example, in column (2) we
find that the magnitude of the coefficient on Penalty i,t-12 (-1.024 E
-3, t = -7.713) is significantly
larger (F = 22.541, p < 0.01) than that of Bonus i,t-12 (-3.430 E
-4, t = -5.211), thus supporting H2b.
The difference in bonus and penalty’s quadratic terms is also statistically significant in the
quantity model (F = 9.698, p < 0.01) and time model (F = 15.191, p < 0.01). Based on the
coefficients from column (2) in Table 3, we find that when the value of the bonus/penalty goes
beyond RMB217, the marginal sensitivity of the penalty falls below that of a bonus. In this
company, therefore, an RMB1 bonus may motivate more effort than an RMB1 penalty when the
monetary value of the bonus/penalty exceeds RMB217. At a more extreme level, specifically
around RMB481 in our setting, we find a tipping point in which the marginal effect of penalties
on production efficiency becomes negative. This finding may provide an explanation for why
penalty schemes are not as widespread as bonus schemes in practice.
- 24 -
We also find that task experience is positively associated with production efficiency,
production quantity, and quality. This finding is consistent with the intuition that workers can be
more productive and have better production quality when they are more familiar with the tasks
they perform.
Employee Turnover
Our third hypothesis (H3) tests whether the use of penalties (bonuses) is associated with a
higher (lower) probability of employee turnover. Table 4, Panel A, presents the results from a
discrete-time survival model. As our study involves the estimation of curvilinear relationships in
a logistic model, we follow Osborne’s (2015) suggestion to remove observations that bring
significant noise to the estimation.11 The coefficient of Bonusi,t-1 is negative and significant (-
0.011 E-3
, Wald Chi-square = 31.128), which is consistent with our hypothesis that workers are
less likely to quit their jobs after receiving a bonus. The quadratic term of Bonusi,t-1 is positive
and significant (1.503E-5
, Wald Chi-square = 24.384), suggesting that the marginal impact of
bonus on voluntary turnover probability decreases with its value. Regarding penalties, we find
that the coefficient of Penalty i,t-1 is positive and significant (5.736 E-3
, Wald Chi-square = 4.307),
suggesting that workers are more likely to quit when they have received a penalty. However, the
quadratic term of Penalty i,t-1 is insignificant. In economic terms, one standard deviation of
bonuses reduces the turnover probability for an average worker by 2.828%, while one standard
deviation of penalties increases the turnover probability by 1.660%.12
– Insert Table 4 –
11
Specifically, following Osborne’s (2015) procedure, we excluded observations that change the model’s
Pearson chi-square by 15, which resulted in removing 59 observations. 12
We calculate the economic significance using the results (untabulated) from a model in which we center all
the other independent variables by their means, except for bonus and penalty.
- 25 -
Taken together, our findings indicate that although penalties have a stronger effect on
workers’ subsequent performance, penalties may also prompt higher employee turnover, which
could be costly, although that may depend on who the company loses. Thus, we further explore
the type of workers who are more likely to quit after receiving penalties. The labor economics
literature maintains that a person’s reservation wage and job opportunities are important factors
that determine his or her choice of job and employment contract. Workers with better abilities
usually have higher reservation wages and more outside job opportunities. In contrast, those with
lesser abilities have fewer opportunities and lower reservation wages. When being penalized, a
worker with better ability is more likely to receive a paycheck lower than his or her reservation
wage, since his or her reservation wage is higher than those with poorer abilities. As such, good
workers, when being penalized, are more likely to seek outside job opportunities that can offer
higher pay than the current job.
We empirically examine this question with our data. In Table 4, Panel B, we median-split
the sample into “strong type” and “weak type” workers by two indicators: task complexity and
production quality.13 The assembly line tasks are similar across plants. Skillful workers can easily
transfer their work experience and knowledge to a similar job in another company, and therefore
have more outside opportunities compared to inexperienced workers. As shown in columns (1)
and (2) in Table 4, Panel B, we find that Penalty i,t-1 is significantly associated with higher
probability of voluntary turnover only for workers who are capable to handle complex tasks
(8.351E-3
, Wald Chi-square = 4.217), but is insignificant for workers who can only process
simple tasks. This finding is consistent with the logic that more capable workers are more likely
to quit after being penalized due to higher reservation wages and more outside job opportunities.
13
We use the average production quality in the prior three months and task complexity in the previous month
to median-split our sample into strong type and weak type workers.

- 26 -
Similarly, in columns (3) and (4), we find that Penalty i,t-1 is significantly associated with a higher
probability of voluntary turnover for workers who consistently produce high quality products
(7.679E-3
, Wald Chi-square = 3.945). The coefficient on Penalty i,t-1 is also positive but less
significant at conventional levels (6.224E-3
, Wald Chi-square = 2.917) for workers with poor
production quality. This finding supports our conjecture that “strong type” workers are more
likely to quit when being penalized. In addition, we do not find significant curvilinearity for the
relationship between Penalty i,t-1 and turnover probability, suggesting that the marginal effect of
penalty on turnover does not decrease with value. On the other hand, we find a negative and
significant association between Bonus i,t-1 and employee voluntary turnover, for both strong and
weak type workers. The coefficient on Bonus i,t-12 is positive and significant, suggesting the
retention effect decreases with bonus value.
Taken together, our findings suggest an undesirable selection effect for penalties: penalties
appear to have the propensity to drive employees away, and such effect is stronger for strong
type employees. In contrast, we find that bonuses appear to help retain employees regardless of
their type (i.e., no selection effect for bonuses). These findings may provide additional evidence
in support of the greater use of bonuses observed in practice.
Implicit Gains and Losses
We also empirically test the effects of implicit gains/losses on subsequent performance.
Consistent with our prediction, in Table 5 we find that implicit losses are negatively associated
with all the performance and effort variables in the subsequent period. This finding suggests that
when the performance standards were adjusted upward, workers might have experienced implicit
losses, perceived the incentive system as too harsh and/or unfair, and thus decreased their efforts
by reducing not only their productivity but also production quality. Similarly, we find that
- 27 -
implicit gains are also negatively associated with workers’ effort and performance, except quality,
in the subsequent period, but the magnitude of effect is significantly smaller than that of implicit
losses in all the models, except for the quality model. Our finding is in line with the economic-
based incentive theory’s prediction that workers respond negatively to both implicit bonuses and
penalties due to distortions in the performance evaluation (for any of a number of possible
reasons ranging from imprecision to perceived unfairness).14 The negative response to implicit
losses is significantly stronger than that to implicit gains. These findings support H4a and b.
– Insert Table 5 –
Robustness Tests
We examine the robustness of our findings using the following tests. The first concern is
the confounding effect of past performance. Our major independent variables, the bonus and
penalty in the prior period, may confound with workers’ past performance. Therefore, our results
may capture the serial correlation between current and past performance, instead of the incentive
effect of compensation. To mitigate this possibility, we replace our independent compensation
variables in the model with workers’ production efficiency in the prior period. In these
alternative models, the corresponding relationships for the replacement independent variable
disappear. Nevertheless, past performance may still be an omitted correlated variable as it is
correlated with both past compensation and current performance. An AR(1) model that includes
workers’ past performance in month t-1 as an alternative test of our hypotheses leaves our results
unchanged.
Second, we address the possible concern that our findings may be affected by the
asymmetric bonus/penalty rate; that is, the effect of losses is greater than that of gains because
14
To repeat, the intuition behind this is clear from Blanchard et al. (1986) indicating that an implicit gain mutes
employees’ incentives by reducing effort because the reward was ‘(too) easy’ to earn. Conversely, for an implicit
loss, the reason could be perceived unfairness, but the effect of the incentives being muted is the same.
- 28 -
the penalty rate is greater than the bonus rate. We reckon that this is not the case, however,
because we examine the response on a per-dollar of bonus or penalty basis, instead of on the
basis of the prior period’s performance. That said, we conduct the following robustness test to
further address this issue. Although the penalty rate is higher than the bonus rate, the actual
amount of penalty is bounded by an individual employee’s overtime pay in each month. Labor
law of the People’s Republic of China requires that pay cannot fall below base salary. Therefore
the penalty, if any, can only be deducted from overtime pay and other bonuses. Thus, if
employees do not work much overtime, the imputed penalty rate would be lower than the stated
rate in the contract. For example, if a worker had an unfavorable efficiency variance of 10 hours
but only had RMB20 overtime pay, the penalty for poor efficiency would be RMB20 and thus
the imputed penalty rate was RMB2 per hour. In a robustness test, we exclude observations with
a calculated imputed penalty rate greater than the bonus rate, so that the imputed penalty rate is
equal or even lower than the bonus rate in this reduced sample. Our results still hold in this
reduced sample, suggesting the asymmetric bonus/penalty rate is not a threat to our findings.
Third, an alternative explanation for our findings is that workers may simply respond to the
previous net payment amount, instead of the bonuses and penalties. That is, workers who
received less payment in the previous period would put more effort into work simply to make up
for the lower salaries received earlier. We note, however, that this potential alternative
explanation may accord with the positive association between penalties and performance, but it
does not explain why the marginal sensitivity of performance diminishes with the value of
penalties. More importantly, the alternative explanation contradicts the theoretical prediction
based on prospect theory, as well as our empirical findings, that subsequent effort/performance
also increases with bonuses. If the alternative explanation drove our findings, we should find a
negative association between prior bonuses and current performance because, according to the

- 29 -
alternative, workers who received more money should have less incentive to work hard in the
current period. Instead, we find that bonuses also motivate higher levels of performance in the
subsequent period; just the magnitude of the incentive is weaker compared to penalties as
suggested by prospect theory. Therefore, we believe that this alternative explanation does not
drive our findings.
Fourth, an alternative explanation to our findings about workers turnover is that the penalty
may be a signal that identifies poor performers. This signal may not be significant during the first
few months of employees’ tenure but become more pronounced when workers gain more
experience. We take a closer look at the “strong type” workers and compare the difference
between the turnover vs. non-turnover groups. First, the average production efficiency in the past
three months does not differ significantly between the two groups, suggesting that workers who
left the company after being penalized are not weaker performers compared to those who stayed.
Second, we find the workers who left the company used to work on more complicated products
or tasks, suggesting that they are possibly more capable to perform complex jobs compared to
others. This additional piece of evidence supports our finding that strong type workers are more
likely to leave after being penalized. Relatedly, one may argue that workers would exert less
effort before they quit, thereby leading to our finding of higher turnover probability following
penalties. To rule out this alternative explanation, we examine the change in performance and
effort in the month prior to voluntary employee turnover to see if there is significant reduction in
effort levels. Using the non-turnover sample as the control group, we do not find significant
reduction in effort or performance in the month before voluntary turnover. Therefore, our
findings are unlikely to be driven by the alternative explanation.

- 30 -
V. SUMMARY AND CONCLUSIONS
The use of incentive compensation schemes has attracted a great deal of research attention
recently, although mostly focused on bonuses with less research being devoted to penalties.
Using production-line employee compensation and production output data from an electronic
component manufacturing company in China, we find that an RMB1 penalty motivates a higher
level of effort and performance than an RMB1 bonus. This is consistent with the theoretical
argument that penalties have a stronger effect than bonuses due to humans’ loss aversion
tendency. Second, we examine whether the effect exhibits a diminishing sensitivity to the value
of bonuses/penalties. This hypothesis is supported by our data, showing a curvilinear relationship
between bonuses/penalties and subsequent performance. We also find that the sensitivity of
penalties diminishes faster than that of bonuses. Therefore, the marginal sensitivity of bonuses
eventually becomes greater than that of penalties when their value is large, suggesting that a
penalty scheme does not always dominate a bonus scheme in motivating employees. Third, we
find penalties (bonuses) to be associated with a higher (lower) probability of voluntary employee
turnover, where the effect of penalties on employee turnover is especially significant for skillful
and high quality workers. These findings suggest that managers should be careful about the loss
of especially valuable human capital that results from the use of penalty schemes. Finally, we
find implicit gains and losses to be negatively associated with workers’ subsequent efforts and
performance. This finding reveals the additional costs that management should consider when
adjusting performance standards (or when changing the incentive contract terms).
Our paper not only contributes to the theoretical literature but also offers useful insights for
practitioners. Each of our findings has specific and meaningful implications for incentive
compensation plan design. For example, we show that the effects of bonuses/penalties diminish

- 31 -
with their value, and thus employers should carefully evaluate the tipping point and consider
other types of incentives beyond that point. Moreover, we find employee-perceived implicit
gains and losses to be negatively associated with employees’ subsequent effort and performance.
This often occurs when management updates incentive plans or performance standards and
employees fail to fully adjust to the new plans. Employers should therefore carefully consider the
implications of changing incentive plans, communicate any changes clearly, and try to mitigate
unproductive effects during a transition period.
Our research design is not without limitations, however. First, similar to other field-based
studies, the focus of the current study on one firm may limit the generalizability of its findings.
Our findings may also be affected by differences in the cultures, industries, education levels, and
the skill levels of employees (assembly workers in this instance). It is undoubtedly worthwhile in
future work to examine whether incentive plans that include penalties, explicit or implicit, follow
the same patterns as we find in this study in different contexts or for different types or ranks of
employees. That said, we believe that our findings help inform our understanding of the observed
(limited) use of penalties in practice, their effectiveness (up to a point), and their possible
unintended consequences (such as on undesired turnover or when affected by uncontrollables),
and how these effects may even extend into implicit incentives, such as when employees miss
out on their (expected) bonuses.
- 32 -
REFERENCES
Bandura, A., 1977. Social learning theory. Eaglewood Cliffs, NJ: Prentice-Hall.
Blanchard, G. A., C. W. Chow, and E. Noreen. 1986. Information asymmetry, incentive schemes,
and information biasing: The case of hospital budgeting under rate regulation. The
Accounting Review 61 (1): 1-15.
Cai, W., and S. Gallani. 2018. Subjectivity in tournaments: Implicit rewards and penalties and
subsequent performance. Working Paper. Harvard University.
Christ, M. H., K. L. Sedatole, and K. L. Towry. 2012. Sticks and carrots: The effect of contract
frame on effort in incomplete contracts. The Accounting Review 87 (6): 1913-1938.
Crawford, V. P., and J. Meng. 2011. New York city cab drivers’ labor supply revisited:
Reference-dependent preferences with rational-expectations targets for hours and income.
American Economic Review 101 (5): 1912-1932.
Fennema, H., and P. Wakker. 1997. Original and cumulative prospect theory: A discussion of
empirical differences. Journal of Behavioral Decision Making 10: 53-64.
Hannan, R. L., V. B. Hoffman, and D. V. Moser. 2005. Bonus versus penalty: Does contract
frame affect employee effort? In Experimental Business Research, Volume 2, edited by
Zwick, R. and A. Rapoport, 151-169. Boston, MA: Kluwer.
Heath, C., R. P. Larrick, and G. Wu. 1999. Goals as reference points. Cognitive Psychology 38
(1): 79-109.
Hossain, T., and J. A. List. 2012. The behavioralist visits the factory: Increasing productivity
using simple framing manipulations. Management Science 58 (12): 2151-2167.
Kahneman, D., and A. Tversky. 1979. Prospect theory: An analysis of decision under risk.
Econometrica 47 (2): 263-292.
Koszegi, B., and M. Rabin. 2006. A model of reference-dependent preferences. Quarterly
Journal of Economics 121 (4): 1133-1165.
Luft, J. 1994. Bonus and penalty incentives contract choice by employees. Journal of Accounting
and Economics 18 (2): 181-206.
Marchegiani, L., T. Reggiani, and M. Rizzolli. 2016. Loss-averse agents and lenient supervisors
in performance appraisal. Journal of Economic Behavior & Organization 131: 183-197.
Merchant, K. A., and W. A. Van der Stede. 2017. Management Control Systems: Performance
Measurement, Evaluation, and Incentives. London: Prentice Hall (Fourth Edition).
Morewedge, C. K. 2009. Negativity bias in attribution of external agency. Journal of
Experimental Psychology: General 138 (4): 535-545.
- 33 -
Osborne, J. W. 2015. Best Practice in logistic regression. Thousand Oaks, CA: Sage.
Podsakoff, P. M., W. H. Bommer, N. P. Podsakoff, and S. B. MacKenzie. 2006. Relationships
between Leader reward and punishment behavior and subordinate attitudes, perceptions,
and behaviors: A meta-analytic review of existing and new research. Organizational
Behavior and Human Decision Processes 99 (2): 113-142.
Pope, D. G., and M. E. Schweitzer. 2011. Is Tiger Woods loss averse? Persistent bias in the face
of experience, competition, and high stakes. American Economic Review 101 (1): 129-
157.
Skinner, B. F. 1953. Science and Human Behavior. New York, NY: MacMillan.
Thorndike, E. L. 1911. Animal intelligence. New York, NY: MacMillan.
Tversky, A., and D. Kahneman. 1992. Advances in prospect theory: Cumulative representation
of uncertainty. Journal of Risk and Uncertainty 5 (4): 297-323.
- 34 -
FIGURE 1
Value Function of Prospect Theory
(Kahneman and Tversky 1979)

- 35 -
TABLE 1
Descriptive Statistics
N Mean Std. Dev. Min Median Max
Efficiency I,t 3,328 1.595 102.793 -285.291 10.680 229.044
Quantity I,t 3,328 265.520 173.857 0.1 220.670 687.087
Time I,t 3,328 238.881 104.710 0.05 242.717 428.143
Quality I,t 2,713 992.978 57.763 186.667 998.396 999.979
Bonus I,t-1 3,328 148.202 171.069 0 90 655
Penalty I,t-1 3,328 50.085 72.034 0 29 474
Implicit Gain I,t-1 2,676 26.316 59.456 0 0 319.939
Implicit Loss I,t-1 2,676 19.925 38.466 0 0 222.985
Task Experience I,t 3,328 515.947 460.415 0 358.329 1673.28
Tenure I,t 3,328 6.697 4.598 2 5 20
Task Complexity I,t 3,328 1.069 0.414 0.236 1.102 2.633
Age I,t 3,528 24.081 6.383 16 22 49
This table reports the distributions of the variables in the final sample of our main tests.
Variable definitions:
Efficiency i,t: standard – actual amount of hours used in production
Quantity i,t: the total amount of products/tasks completed (in thousands)
Time i,t: the standard time for the amount of products produced or tasks performed
Quality i,t : the number of products/tasked completed that are free of defects per thousand of productions
Bonus i,t-1: total bonus received in the previous month t-1
Penalty i,t-1: total penalty deducted in the previous month t-1
Implicit Gain i,t-1 : the favorable difference between expected and actual production efficiency in month t-1
Implicit Loss i,t-1 : the unfavorable difference between expected and actual production efficiency in month t-1
Task Experience i,t: the weighted average cumulative hours of experience for the tasks assigned
Tenure i,t: the number of months the employee has been working in this company
Task Complexity i,t: the weighted-average number of standard hours needed to finish a task assigned in month t
Age i,t: the age of the employee in period t

- 36 -
TABLE 2
Correlations
1 2 3 4 5 6 7 8 9 10 11 12
1. Efficiency I,t 0.694 *** 0.834 *** 0.220 *** 0.591 *** 0.115 *** -0.053 *** -0.081 *** 0.482 *** 0.200 *** -0.136 *** 0.165 ***
2. Quantity I,t 0.674 *** 0.764 *** 0.197 *** 0.453 *** 0.225 *** 0.038 ** -0.085 *** 0.334 *** 0.043 ** -0.627 *** 0.043 ***
3. Time I,t 0.856 *** 0.716 *** 0.124 *** 0.457 *** 0.151 *** 0.051 *** -0.157 *** 0.383 *** 0.185 *** -0.075 *** 0.156 ***
4. Quality i,t 0.255 *** 0.140 *** 0.212 *** 0.210 *** -0.145 *** 0.010 -0.032 0.262 *** 0.133 *** -0.101 *** 0.079 ***
5. Bonus i,t-1 0.449 *** 0.478 *** 0.390 *** -0.049 ** 0.072 *** 0.139 *** -0.082 *** 0.555 *** 0.321 *** -0.216 *** 0.236 ***
6. Penalty i,t-1 0.005 0.115 *** 0.037 ** 0.015 -0.026 0.135 *** -0.110 *** 0.036 ** -0.027 -0.179 *** -0.071 ***
7. Implicit Gain i,t-1 -0.289 *** -0.097 *** -0.193 *** -0.007 0.173 *** 0.068 *** -0.835 *** -0.009 0.060 *** -0.033 * 0.017
8. Implicit Loss i,t-1 -0.112 *** -0.033 * -0.140 *** -0.060 *** 0.026 -0.056 *** -0.229 *** -0.025 -0.078 *** -0.042 ** 0.021
9. Task Experience i,t 0.246 *** 0.276 *** 0.241 *** 0.054 *** 0.477 *** -0.052 *** 0.119 *** -0.011 0.567 *** -0.120 *** 0.184 ***
10. Tenure i,t 0.023 0.007 0.084 *** 0.054 *** 0.207 *** - 0.056 *** 0.183 *** -0.038 ** 0.458 *** 0.115 *** 0.217 ***
11. Task Complexity i,t -0.146 *** -0.644 *** -0.078 *** 0.038 ** -0.279 *** -0.109 *** -0.021 -0.059 *** -0.115 *** 0.108 *** 0.092 ***
12. Age i,t 0.090 *** 0.001 0.126 *** -0.003 0.189 *** -0.084 *** 0.081 *** 0.045 ** 0.214 *** 0.284 *** 0.113 ***
This table presents the Pearson and Spearman (below and above the diagonal, respectively) correlation matrix of the main variables.
***, **, and * indicate significance at the 1%, 5%, and 10% level, respectively. Please refer to Table 1 for variable definitions.
- 37 -
TABLE 3
The Effect of Bonuses and Penalties on Subsequent Performance
Efficiency i,t Quantity i,t Time i,t Quality i,t
Predicted
signs
Base Model
(1)
Full Model
(2)
Base Model
(3)
Full Model
(4)
Base Model
(5)
Full Model
(6)
Base Model
(7)
Full Model
(8)
Bonus i,t-1 β1 +
0.345
(9.762)
***
0.382
(8.064)
***
0.362
(9.785)
***
0.062
(1.585)
Penalty i,t-1 β2 +
0.493
(8.292)
***
0.567
(6.980)
***
0.538
(8.418)
***
0.130
(2.083)
**
Bonus i,t-1 2 β3
- -3.430E-4
(-5.211)
***
-3.749E-4
(-4.469)
***
-3.643E-4
(-6.025)
***
-1.379 E-4
(-2.143)
**
Penalty i,t-1 2 β4
- -1.024E-3
(-7.713)
***
-1.036E-3
(-5.360)
***
-1.006E-3
(-6.602)
***
-2.540E-4
(-1.984)
**
Task Experience i,t β5 0.017
(3.569)
***
0.015
(3.254)
***
0.020
(3.293)
***
0.019
(2.872)
***
0.010
(3.030)
6***
0.015
(2.810)
***
0.024
(3.266)
***
0.026
(3.485)
***
Tenure i,t β6 0.289
(0.344)
-0.893
(-1.109)
-1.122
(-1.025)
-2.469
(-2.452)
** -0.390
(-0.439)
-1.637
(-2.028)
**
1.924
(2.466)
**
1.857
(2.367)
**
Task Complexity i,t β7 18.035
(1.695)
*
10.435
(1.135)
-138.820
(-8.714)
***
-147.419
(-10.114)
***
20.521
(1.908)
*
12.350
(1.334)
-3.936
(-0.690)
-5.264
(-0.893)
Age i,t β8 -0.106
(-0.790)
-0.711
(-8.096)
***
-0.587
(-0.742)
-1.325
(-1.926)
* -0.425
(-0.780)
-1.120
(-2.491)
**
1.370E
(0.000)
-5
-0.177
(-1.676)
*
Employee Fixed Effect Yes Yes Yes Yes Yes Yes Yes Yes
Year Fixed Effect Yes Yes Yes Yes Yes Yes Yes Yes
β2- β1 (F stat.) 0.148
(5.126)
**
0.185
(3.876)
**
0.176
(5.740)
**
0.068
(0.936)
β4- β3 (F stat.) -6.811E-4
(22.541)
***
-6.610E-4
(9.698)
***
-6.412E-4
(15.191)
***
-1.161E-4
(0.686)
R 2 0.515 0.559 0.687 0.708 0.392 0.442 0.157 0.164
N 3,328 3,328 3,328 3,328 3,328 3,328 2,713 2,713
This table presents how bonus and penalty affect workers’ subsequent effort and performance. Column (1) and (2) report the regression results of bonus and
penalty on workers’ subsequent production efficiency. Column (3) and (4) report the regression results of bonus and penalty on workers’ subsequent
production quantity. Column (5) and (6) report the regression results of bonus and penalty on workers’ subsequent production time. Column (7) and (8)
report the regression results of bonus and penalty on workers’ subsequent production quality. Please refer to Table 1 for variable definitions. All continuous
variables are winsorized at the top and bottom 1%. We report t-values in parentheses. Standard errors are clustered at the worker level. ***, **, * indicates
significance at the 1%, 5%, and 10% level, respectively (two-tailed).
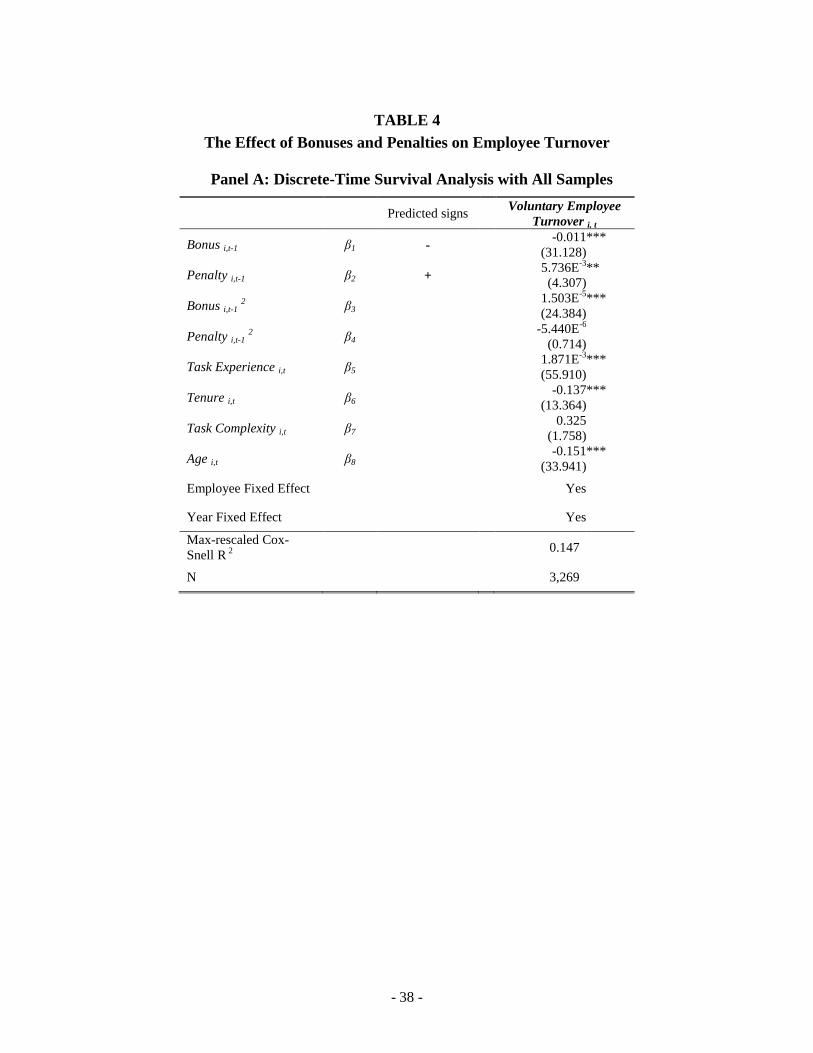
- 38 -
TABLE 4
The Effect of Bonuses and Penalties on Employee Turnover
Panel A: Discrete-Time Survival Analysis with All Samples
Predicted signs Voluntary Employee
Turnover i, t
Bonus i,t-1 β1 - -0.011
(31.128)
***
Penalty i,t-1 β2 + 5.736E
-3
(4.307)
**
Bonus i,t-1 2 β3
1.503E-5
(24.384)
***
Penalty i,t-1 2 β4
-5.440E-6
(0.714)
Task Experience i,t β5 1.871E
-3
(55.910)
***
Tenure i,t β6 -0.137
(13.364)
***
Task Complexity i,t β7 0.325
(1.758)
Age i,t β8 -0.151
(33.941)
***
Employee Fixed Effect
Yes
Year Fixed Effect
Yes
Max-rescaled Cox-
Snell R 2
0.147
N
3,269

- 39 -
TABLE 4 (continued)
Panel B: Discrete-Time Survival Analysis with Sub-samples Median-split by Task
Complexity and Production Quality
Voluntary Employee Turnover i, t
Complexity Production Quality
Pred. signs
Complex Task
Workers
(1)
Simple Tasks
Workers
(2)
High Quality
Workers
(3)
Low Quality
Workers
(4)
Bonus i,t-1 β1 - -0.014
(15.953)
***
-9.172E-3
(15.356)
***
-0.010
(18.788)
***
-0.014
(21.525)
***
Penalty i,t-1 β2 + 8.351E
-3
(4.217)
**
3.758E-3
(0.911)
7.679E-3
(3.945)
**
6.224E-3
(2.917)
*
Bonus i,t-1 2 β3
2.143E-5
(11.332)
*** 1.329E-5
(13.463)
*** 1.398E-5
(14.934)
*** 2.178E-5
(19.784)
***
Penalty i,t-1 2 β4
-8.502E-6
(0.956) -5.487E
-6
(0.235) -6.973E
-6
(0.579)
-7.899E-6
(0.798)
Task Experience i,t β5 2.251E
-3
(30.163)
***
1.715E-3
(22.665)
***
1.906E-3
(28.668)
***
1.603E-3
(16.180)
***
Tenure i,t β6 -0.141
(7.364)
***
-0.140
(5.062)
**
-0.123
(4.639)
**
-0.136
(9.913)
***
Task Complexity i,t β7 0.182
(0.124)
0.594
(0.751)
0.336
(0.698)
0.201
(0.372)
Age i,t β8 -0.147
(16.561)
***
-0.162
(15.637)
***
-0.219
(34.854)
***
-0.089
(6.858)
***
Employee Fixed Effect
Yes Yes Yes Yes
Year Fixed Effect
Yes Yes Yes Yes
Max-rescaled Cox-Snell R 2 0.183 0.130 0.217 0.111
N 1,635 1,634 1,608 1,609
This table presents how bonus and penalty are associated with the probability of employee voluntary turnover in
the subsequent period. Panel A shows the discrete-time survival model results with the full final sample. Panel B
shows the discrete-time survival model results for various sub-samples. Specifically, Panel B Column (1) and (2)
show the results for workers who are capable to handle complex or simple tasks, respectively. We use individual
worker’s weighted average task complexity in the previous month to median-split the sample. Panel B Column
(3) and (4) show the results for workers with high and low production quality, respectively. We use individual
worker’s average production quality in the prior three months to median-split the sample. Please refer to Table 1
for variable definitions. All continuous variables are winsorized at the top and bottom 1%. We report Wald Chi-
square values in parentheses. Standard errors are clustered at the worker level. ***, **, * indicates significance
at the 1%, 5%, and 10% level, respectively (two-tailed).

- 40 -
TABLE 5
The Effect of Implicit Gains and Losses on Subsequent Performance
Predicted
signs Efficiency i,t
(1)
Quantity i,t (2)
Time i,t (3)
Quality i,t (4)
Implicit Gain i,t-1 β1 - -0.509
(-20.921)
***
-0.428
(-12.666)
*** -0.464
(-17.339)
***
-1.796E-3
(-0.130)
Implicit Loss i,t-1 β2 - -0.634
(-11.617)
***
-0.702
(-9.845)
*** -0.721
(-12.620)
***
-0.066
(-2.078)
**
Bonus i,t-1 β3 + 0.306
(8.860)
***
0.323
(6.878)
*** 0.322
(8.629)
*** 3.792E-3
(0.160)
Penalty i,t-1 β4 + 0.478
(8.071)
***
0.515
(6.556)
*** 0.512
(7.833)
*** 0.080
(1.917)
*
Bonus i,t-1 2 β5 -
-2.522E-4
(-4.204)
***
-2.713E-4
(-3.258)
*** -2.811E-4
(-4.769)
*** -3.046E-5
(-0.689)
Penalty i,t-1 2 β6 -
-9.843E-4
(-7.236)
***
-9.203E-4
(-4.717)
*** -9.463E-4
(-5.923)
*** -1.754E-4
(-1.948)
*
Task Experience i,t β7 -1.952E
-3
(-0.399)
-0.011
(-1.509)
-9.701E-3
(-1.621)
3.522E-3
(1.270)
Tenure i,t β8 -2.491
(-3.328)
***
-5.031
(-4.625)
*** -4.247
(-5.060)
*** 0.071
(0.194)
Task Complexity i,t β9 13.780
(1.562)
-141.990
(-8.940)
***
18.039
(1.726)
*
-2.053
(-0.791)
Age i,t β10 0.304
(0.744)
0.386
(0.835)
0.370
(0.802)
5.280E-3
(0.227)
Employee Fixed
Effect Yes Yes Yes Yes
Year Fixed Effect Yes Yes Yes Yes
β 2 – β 1 (F stat.) -0.125
(6.565)
**
-0.274
(21.659)
***
-0.257
(32.155)
***
-0.064
(2.699)
R 2 0.647 0.749 0.523 0.251
N 2,676 2,676 2,676 2,224
This table presents how implicit gains and losses affect workers’ subsequent effort and performance. Column (1)
reports the regression result on production efficiency. Column (2) reports the regression result on production
quantity. Column (3) reports the regression result on standard production time. Column (4) reports the regression
result on production quality. Please refer to Table 1 for all other variable definitions. All continuous variables are
winsorized at the top and bottom 1%. We report t-values in parentheses. Standard errors are clustered at the
worker level. ***, **, * indicates significance at the 1%, 5%, and 10% level, respectively (two-tailed).
Related Documents