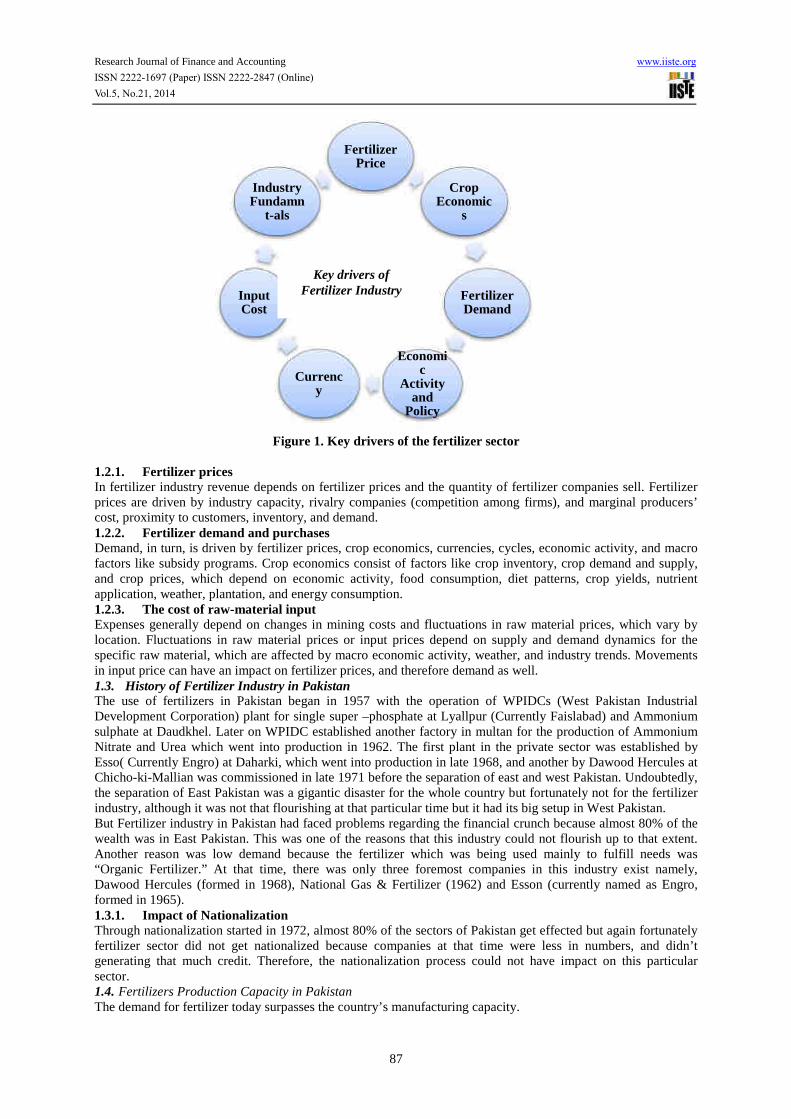
Research Journal of Finance and Accounting www.iiste.org ISSN 2222-1697 (Paper) ISSN 2222-2847 (Online) Vol.5, No.21, 2014 86 An Emperical Study of Financial Performance of Fertilizer Sector of Pakistan Listed on KSE-100: A Comparative Analysis Aisha Masood Department of Commerce, Qarshi University Email: [email protected] Abstract Fertilizer is the main ingredient of the agriculture sector which is the back bone of the Pakistan’s economy. Presently Pakistan contributes approximately 1/3 rd into the agriculture sector. In order to cultivate and promote the agriculture sector of the country, it is crucial for the fertilizer sector to nurture in a profitable manner. The main purpose of the financial analysis is to compare the profitability, expansion of the company and financial soundness of the sector. In this study, the researcher made an effort to explore the financial soundness and performance of the Fertilizer Sector in which 7 companies namely Engro Fertilizer Limited (EFL), Fatima Fertilizer Limited (FFL), Fauji Fertilizer Limited (FFL), Fauji Bin Qasim Limited (FBL), Dawood Hercules Fertilizers Limited (DHFL), Pak Arab Fertilizers Limited (PFL), Agritech Fertilizers Limited (AGL) are listed on Karachi Stock Exchange, KSE (100) for the period of 2010 – 2013, on the basis of setting up affiliation between the items of the financial position and financial performance. In order to build the relationship various types of ratios such as solvency, liquidity, activity, profitability and market ratios are used. The time frame obtained for the study is four years from 2010 – 2013. Keywords: Fertilizer Sector, Ratios, Financial Statements. 1. Introduction Undoubtedly, Agriculture acts as a back born of economic growth and development in Pakistan. It has a fundamental role in the economy. The role of agriculture in economic development has been viewed as an unseen pillar. Agriculture sector acts as a crucial part in any strategy of economic progress, especially for the 61 low income developing countries. The few reasons of low productivity of agriculture sector in developing countries are soil degradation (soil salinity, alkalinity, erosion and soil fertility depletion), depletion of water resources, mismanagement of irrigation system, the distribution of the land in small parts and poor farming practices. With all these, the use of agriculture inputs, particularly of fertilizer is scarce and inadequate and quality of seeds and pesticides are hard to available. 1.1. Fertilizer Fertilizer can be defined as a chemical or natural substance used to make soil or land more fertile. First used by ancient farmers, fertilizer technology developed significantly as the chemical needs of growing plants were discovered. Through fertilizers, farms get enable to produce a sustained high level of production. They are conceivably the extremely important agricultural input, since they are directly responsible for 40-60% of all food productions (Hoyum, 2012) . It is nearly impossible to inflate agricultural growth rates without increasing use of fertilizer (African Union, 2006). Hence, the usage of fertilizer would facilitate farmers to increase productivity or profits and would be able to produce marketable surplus and therefore move out of traditional agriculture towards commercial agriculture and into the main stream of market economy. The major dilemma which is being faced by our farmers is the declining land productivity with reduced crop yields. The main reason of reduced land productivity is poor soil caused by continuous cropping without using sufficient mineral fertilizers and manures. Crop fertilization is the main tool available. Fertilizers are those chemical compounds that helps plant to grow faster and earlier. The procedure of their application is through the soil or through leaves. There are two types of fertilizer, one is organic and the other is inorganic. Both are called "manure". The elements of the Fertilizer that provide vital plant nutrients are Nitrogen(N), Phosphorus(P),Zink(Zn), Boron(B) and Sulphur (S). The function of Nitrogen is that it provides instantly the green impact which the farmer thinks the real impact of any good fertilizer, while Phosphorus plays major role in root growth, energy transfer activities with in the plant and finally in crop yield. To attain the utmost productivity from land it is essential to have a balance in fertilization. It can be explained as for increased crop productivity, the effective use of fertilizers and other inputs are essential. 1.2. Key Divers of the fertilizer sector The key drivers of the fertilizer sector are shown in a figure below: brought to you by CORE View metadata, citation and similar papers at core.ac.uk provided by International Institute for Science, Technology and Education (IISTE): E-Journals

Welcome message from author
This document is posted to help you gain knowledge. Please leave a comment to let me know what you think about it! Share it to your friends and learn new things together.
Transcript
Research Journal of Finance and Accounting www.iiste.org
ISSN 2222-1697 (Paper) ISSN 2222-2847 (Online)
Vol.5, No.21, 2014
86
An Emperical Study of Financial Performance of Fertilizer Sector of Pakistan Listed on KSE-100: A Comparative Analysis
Aisha Masood
Department of Commerce, Qarshi University Email: [email protected]
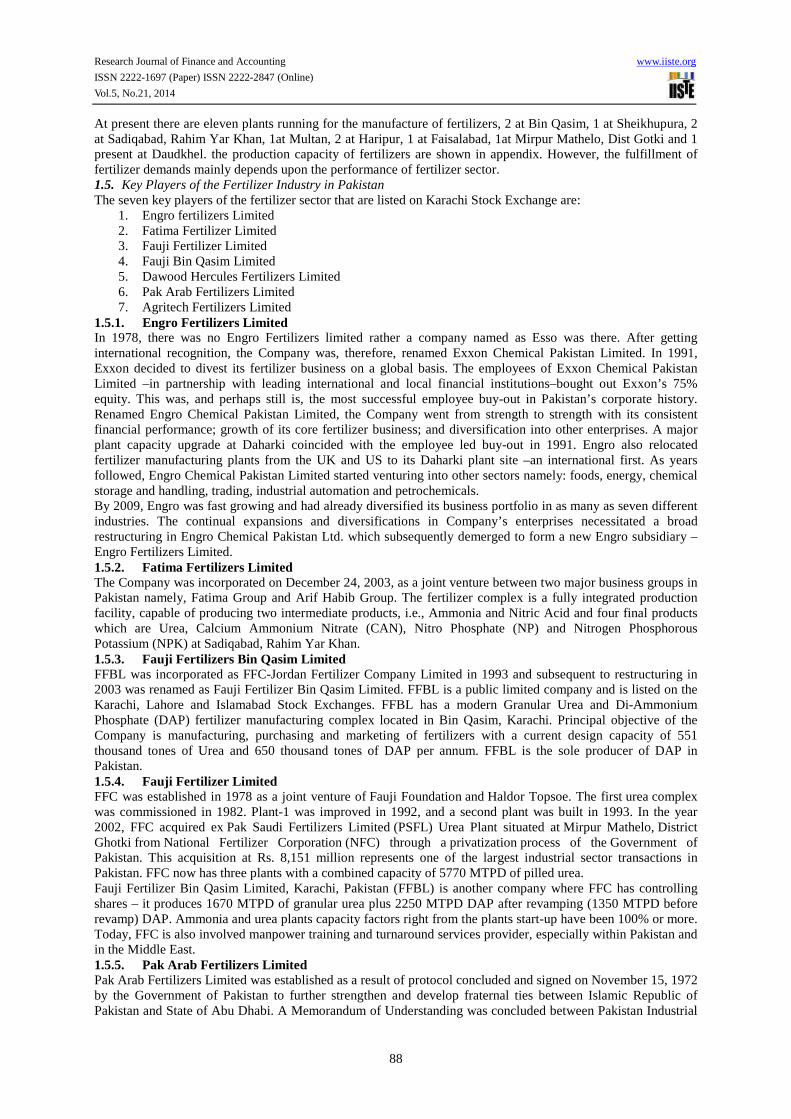
Abstract Fertilizer is the main ingredient of the agriculture sector which is the back bone of the Pakistan’s economy. Presently Pakistan contributes approximately 1/3rd into the agriculture sector. In order to cultivate and promote the agriculture sector of the country, it is crucial for the fertilizer sector to nurture in a profitable manner. The main purpose of the financial analysis is to compare the profitability, expansion of the company and financial soundness of the sector. In this study, the researcher made an effort to explore the financial soundness and performance of the Fertilizer Sector in which 7 companies namely Engro Fertilizer Limited (EFL), Fatima Fertilizer Limited (FFL), Fauji Fertilizer Limited (FFL), Fauji Bin Qasim Limited (FBL), Dawood Hercules Fertilizers Limited (DHFL), Pak Arab Fertilizers Limited (PFL), Agritech Fertilizers Limited (AGL) are listed on Karachi Stock Exchange, KSE (100) for the period of 2010 – 2013, on the basis of setting up affiliation between the items of the financial position and financial performance. In order to build the relationship various types of ratios such as solvency, liquidity, activity, profitability and market ratios are used. The time frame obtained for the study is four years from 2010 – 2013. Keywords: Fertilizer Sector, Ratios, Financial Statements. 1. Introduction Undoubtedly, Agriculture acts as a back born of economic growth and development in Pakistan. It has a fundamental role in the economy. The role of agriculture in economic development has been viewed as an unseen pillar. Agriculture sector acts as a crucial part in any strategy of economic progress, especially for the 61 low income developing countries. The few reasons of low productivity of agriculture sector in developing countries are soil degradation (soil salinity, alkalinity, erosion and soil fertility depletion), depletion of water resources, mismanagement of irrigation system, the distribution of the land in small parts and poor farming practices. With all these, the use of agriculture inputs, particularly of fertilizer is scarce and inadequate and quality of seeds and pesticides are hard to available. 1.1. Fertilizer Fertilizer can be defined as a chemical or natural substance used to make soil or land more fertile. First used by ancient farmers, fertilizer technology developed significantly as the chemical needs of growing plants were discovered. Through fertilizers, farms get enable to produce a sustained high level of production. They are conceivably the extremely important agricultural input, since they are directly responsible for 40-60% of all food productions (Hoyum, 2012) . It is nearly impossible to inflate agricultural growth rates without increasing use of fertilizer (African Union, 2006). Hence, the usage of fertilizer would facilitate farmers to increase productivity or profits and would be able to produce marketable surplus and therefore move out of traditional agriculture towards commercial agriculture and into the main stream of market economy. The major dilemma which is being faced by our farmers is the declining land productivity with reduced crop yields. The main reason of reduced land productivity is poor soil caused by continuous cropping without using sufficient mineral fertilizers and manures. Crop fertilization is the main tool available. Fertilizers are those chemical compounds that helps plant to grow faster and earlier. The procedure of their application is through the soil or through leaves. There are two types of fertilizer, one is organic and the other is inorganic. Both are called "manure". The elements of the Fertilizer that provide vital plant nutrients are Nitrogen(N), Phosphorus(P),Zink(Zn), Boron(B) and Sulphur (S). The function of Nitrogen is that it provides instantly the green impact which the farmer thinks the real impact of any good fertilizer, while Phosphorus plays major role in root growth, energy transfer activities with in the plant and finally in crop yield. To attain the utmost productivity from land it is essential to have a balance in fertilization. It can be explained as for increased crop productivity, the effective use of fertilizers and other inputs are essential. 1.2. Key Divers of the fertilizer sector The key drivers of the fertilizer sector are shown in a figure below:
brought to you by COREView metadata, citation and similar papers at core.ac.uk
provided by International Institute for Science, Technology and Education (IISTE): E-Journals
Research Journal of Finance and Accounting www.iiste.org
ISSN 2222-1697 (Paper) ISSN 2222-2847 (Online)
Vol.5, No.21, 2014
87
Figure 1. Key drivers of the fertilizer sector
1.2.1. Fertilizer prices In fertilizer industry revenue depends on fertilizer prices and the quantity of fertilizer companies sell. Fertilizer prices are driven by industry capacity, rivalry companies (competition among firms), and marginal producers’ cost, proximity to customers, inventory, and demand. 1.2.2. Fertilizer demand and purchases Demand, in turn, is driven by fertilizer prices, crop economics, currencies, cycles, economic activity, and macro factors like subsidy programs. Crop economics consist of factors like crop inventory, crop demand and supply, and crop prices, which depend on economic activity, food consumption, diet patterns, crop yields, nutrient application, weather, plantation, and energy consumption. 1.2.3. The cost of raw-material input Expenses generally depend on changes in mining costs and fluctuations in raw material prices, which vary by location. Fluctuations in raw material prices or input prices depend on supply and demand dynamics for the specific raw material, which are affected by macro economic activity, weather, and industry trends. Movements in input price can have an impact on fertilizer prices, and therefore demand as well. 1.3. History of Fertilizer Industry in Pakistan The use of fertilizers in Pakistan began in 1957 with the operation of WPIDCs (West Pakistan Industrial Development Corporation) plant for single super –phosphate at Lyallpur (Currently Faislabad) and Ammonium sulphate at Daudkhel. Later on WPIDC established another factory in multan for the production of Ammonium Nitrate and Urea which went into production in 1962. The first plant in the private sector was established by Esso( Currently Engro) at Daharki, which went into production in late 1968, and another by Dawood Hercules at Chicho-ki-Mallian was commissioned in late 1971 before the separation of east and west Pakistan. Undoubtedly, the separation of East Pakistan was a gigantic disaster for the whole country but fortunately not for the fertilizer industry, although it was not that flourishing at that particular time but it had its big setup in West Pakistan. But Fertilizer industry in Pakistan had faced problems regarding the financial crunch because almost 80% of the wealth was in East Pakistan. This was one of the reasons that this industry could not flourish up to that extent. Another reason was low demand because the fertilizer which was being used mainly to fulfill needs was “Organic Fertilizer.” At that time, there was only three foremost companies in this industry exist namely, Dawood Hercules (formed in 1968), National Gas & Fertilizer (1962) and Esson (currently named as Engro, formed in 1965). 1.3.1. Impact of Nationalization Through nationalization started in 1972, almost 80% of the sectors of Pakistan get effected but again fortunately fertilizer sector did not get nationalized because companies at that time were less in numbers, and didn’t generating that much credit. Therefore, the nationalization process could not have impact on this particular sector. 1.4. Fertilizers Production Capacity in Pakistan The demand for fertilizer today surpasses the country’s manufacturing capacity.
Fertilizer Price
Crop Economic
s
Fertilizer Demand
Economic
Activity and
Policy
Currency
Input Cost
Industry Fundamn
t-als
Key drivers of Fertilizer Industry
Research Journal of Finance and Accounting www.iiste.org
ISSN 2222-1697 (Paper) ISSN 2222-2847 (Online)
Vol.5, No.21, 2014
88
At present there are eleven plants running for the manufacture of fertilizers, 2 at Bin Qasim, 1 at Sheikhupura, 2 at Sadiqabad, Rahim Yar Khan, 1at Multan, 2 at Haripur, 1 at Faisalabad, 1at Mirpur Mathelo, Dist Gotki and 1 present at Daudkhel. the production capacity of fertilizers are shown in appendix. However, the fulfillment of fertilizer demands mainly depends upon the performance of fertilizer sector. 1.5. Key Players of the Fertilizer Industry in Pakistan The seven key players of the fertilizer sector that are listed on Karachi Stock Exchange are:
1. Engro fertilizers Limited 2. Fatima Fertilizer Limited 3. Fauji Fertilizer Limited 4. Fauji Bin Qasim Limited 5. Dawood Hercules Fertilizers Limited 6. Pak Arab Fertilizers Limited 7. Agritech Fertilizers Limited
1.5.1. Engro Fertilizers Limited In 1978, there was no Engro Fertilizers limited rather a company named as Esso was there. After getting international recognition, the Company was, therefore, renamed Exxon Chemical Pakistan Limited. In 1991, Exxon decided to divest its fertilizer business on a global basis. The employees of Exxon Chemical Pakistan Limited –in partnership with leading international and local financial institutions–bought out Exxon’s 75% equity. This was, and perhaps still is, the most successful employee buy-out in Pakistan’s corporate history. Renamed Engro Chemical Pakistan Limited, the Company went from strength to strength with its consistent financial performance; growth of its core fertilizer business; and diversification into other enterprises. A major plant capacity upgrade at Daharki coincided with the employee led buy-out in 1991. Engro also relocated fertilizer manufacturing plants from the UK and US to its Daharki plant site –an international first. As years followed, Engro Chemical Pakistan Limited started venturing into other sectors namely: foods, energy, chemical storage and handling, trading, industrial automation and petrochemicals. By 2009, Engro was fast growing and had already diversified its business portfolio in as many as seven different industries. The continual expansions and diversifications in Company’s enterprises necessitated a broad restructuring in Engro Chemical Pakistan Ltd. which subsequently demerged to form a new Engro subsidiary –Engro Fertilizers Limited. 1.5.2. Fatima Fertilizers Limited The Company was incorporated on December 24, 2003, as a joint venture between two major business groups in Pakistan namely, Fatima Group and Arif Habib Group. The fertilizer complex is a fully integrated production facility, capable of producing two intermediate products, i.e., Ammonia and Nitric Acid and four final products which are Urea, Calcium Ammonium Nitrate (CAN), Nitro Phosphate (NP) and Nitrogen Phosphorous Potassium (NPK) at Sadiqabad, Rahim Yar Khan. 1.5.3. Fauji Fertilizers Bin Qasim Limited FFBL was incorporated as FFC-Jordan Fertilizer Company Limited in 1993 and subsequent to restructuring in 2003 was renamed as Fauji Fertilizer Bin Qasim Limited. FFBL is a public limited company and is listed on the Karachi, Lahore and Islamabad Stock Exchanges. FFBL has a modern Granular Urea and Di-Ammonium Phosphate (DAP) fertilizer manufacturing complex located in Bin Qasim, Karachi. Principal objective of the Company is manufacturing, purchasing and marketing of fertilizers with a current design capacity of 551 thousand tones of Urea and 650 thousand tones of DAP per annum. FFBL is the sole producer of DAP in Pakistan. 1.5.4. Fauji Fertilizer Limited FFC was established in 1978 as a joint venture of Fauji Foundation and Haldor Topsoe. The first urea complex was commissioned in 1982. Plant-1 was improved in 1992, and a second plant was built in 1993. In the year 2002, FFC acquired ex Pak Saudi Fertilizers Limited (PSFL) Urea Plant situated at Mirpur Mathelo, District Ghotki from National Fertilizer Corporation (NFC) through a privatization process of the Government of Pakistan. This acquisition at Rs. 8,151 million represents one of the largest industrial sector transactions in Pakistan. FFC now has three plants with a combined capacity of 5770 MTPD of pilled urea. Fauji Fertilizer Bin Qasim Limited, Karachi, Pakistan (FFBL) is another company where FFC has controlling shares – it produces 1670 MTPD of granular urea plus 2250 MTPD DAP after revamping (1350 MTPD before revamp) DAP. Ammonia and urea plants capacity factors right from the plants start-up have been 100% or more. Today, FFC is also involved manpower training and turnaround services provider, especially within Pakistan and in the Middle East. 1.5.5. Pak Arab Fertilizers Limited Pak Arab Fertilizers Limited was established as a result of protocol concluded and signed on November 15, 1972 by the Government of Pakistan to further strengthen and develop fraternal ties between Islamic Republic of Pakistan and State of Abu Dhabi. A Memorandum of Understanding was concluded between Pakistan Industrial
Research Journal of Finance and Accounting www.iiste.org
ISSN 2222-1697 (Paper) ISSN 2222-2847 (Online)
Vol.5, No.21, 2014
89
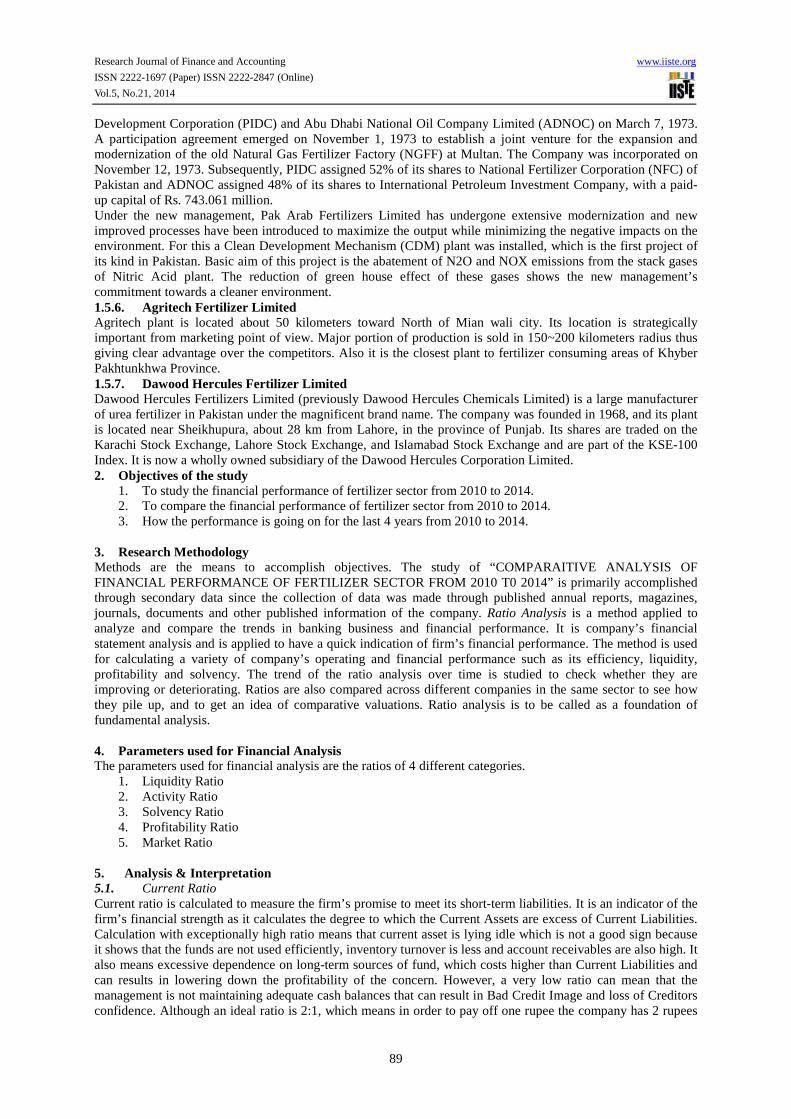
Development Corporation (PIDC) and Abu Dhabi National Oil Company Limited (ADNOC) on March 7, 1973. A participation agreement emerged on November 1, 1973 to establish a joint venture for the expansion and modernization of the old Natural Gas Fertilizer Factory (NGFF) at Multan. The Company was incorporated on November 12, 1973. Subsequently, PIDC assigned 52% of its shares to National Fertilizer Corporation (NFC) of Pakistan and ADNOC assigned 48% of its shares to International Petroleum Investment Company, with a paid-up capital of Rs. 743.061 million. Under the new management, Pak Arab Fertilizers Limited has undergone extensive modernization and new improved processes have been introduced to maximize the output while minimizing the negative impacts on the environment. For this a Clean Development Mechanism (CDM) plant was installed, which is the first project of its kind in Pakistan. Basic aim of this project is the abatement of N2O and NOX emissions from the stack gases of Nitric Acid plant. The reduction of green house effect of these gases shows the new management’s commitment towards a cleaner environment. 1.5.6. Agritech Fertilizer Limited Agritech plant is located about 50 kilometers toward North of Mian wali city. Its location is strategically important from marketing point of view. Major portion of production is sold in 150~200 kilometers radius thus giving clear advantage over the competitors. Also it is the closest plant to fertilizer consuming areas of Khyber Pakhtunkhwa Province. 1.5.7. Dawood Hercules Fertilizer Limited Dawood Hercules Fertilizers Limited (previously Dawood Hercules Chemicals Limited) is a large manufacturer of urea fertilizer in Pakistan under the magnificent brand name. The company was founded in 1968, and its plant is located near Sheikhupura, about 28 km from Lahore, in the province of Punjab. Its shares are traded on the Karachi Stock Exchange, Lahore Stock Exchange, and Islamabad Stock Exchange and are part of the KSE-100 Index. It is now a wholly owned subsidiary of the Dawood Hercules Corporation Limited. 2. Objectives of the study
1. To study the financial performance of fertilizer sector from 2010 to 2014. 2. To compare the financial performance of fertilizer sector from 2010 to 2014. 3. How the performance is going on for the last 4 years from 2010 to 2014.
3. Research Methodology Methods are the means to accomplish objectives. The study of “COMPARAITIVE ANALYSIS OF FINANCIAL PERFORMANCE OF FERTILIZER SECTOR FROM 2010 T0 2014” is primarily accomplished through secondary data since the collection of data was made through published annual reports, magazines, journals, documents and other published information of the company. Ratio Analysis is a method applied to analyze and compare the trends in banking business and financial performance. It is company’s financial statement analysis and is applied to have a quick indication of firm’s financial performance. The method is used for calculating a variety of company’s operating and financial performance such as its efficiency, liquidity, profitability and solvency. The trend of the ratio analysis over time is studied to check whether they are improving or deteriorating. Ratios are also compared across different companies in the same sector to see how they pile up, and to get an idea of comparative valuations. Ratio analysis is to be called as a foundation of fundamental analysis. 4. Parameters used for Financial Analysis The parameters used for financial analysis are the ratios of 4 different categories.
1. Liquidity Ratio 2. Activity Ratio 3. Solvency Ratio 4. Profitability Ratio 5. Market Ratio
5. Analysis & Interpretation 5.1. Current Ratio Current ratio is calculated to measure the firm’s promise to meet its short-term liabilities. It is an indicator of the firm’s financial strength as it calculates the degree to which the Current Assets are excess of Current Liabilities. Calculation with exceptionally high ratio means that current asset is lying idle which is not a good sign because it shows that the funds are not used efficiently, inventory turnover is less and account receivables are also high. It also means excessive dependence on long-term sources of fund, which costs higher than Current Liabilities and can results in lowering down the profitability of the concern. However, a very low ratio can mean that the management is not maintaining adequate cash balances that can result in Bad Credit Image and loss of Creditors confidence. Although an ideal ratio is 2:1, which means in order to pay off one rupee the company has 2 rupees
Research Journal of Finance and Accounting www.iiste.org
ISSN 2222-1697 (Paper) ISSN 2222-2847 (Online)
Vol.5, No.21, 2014
90
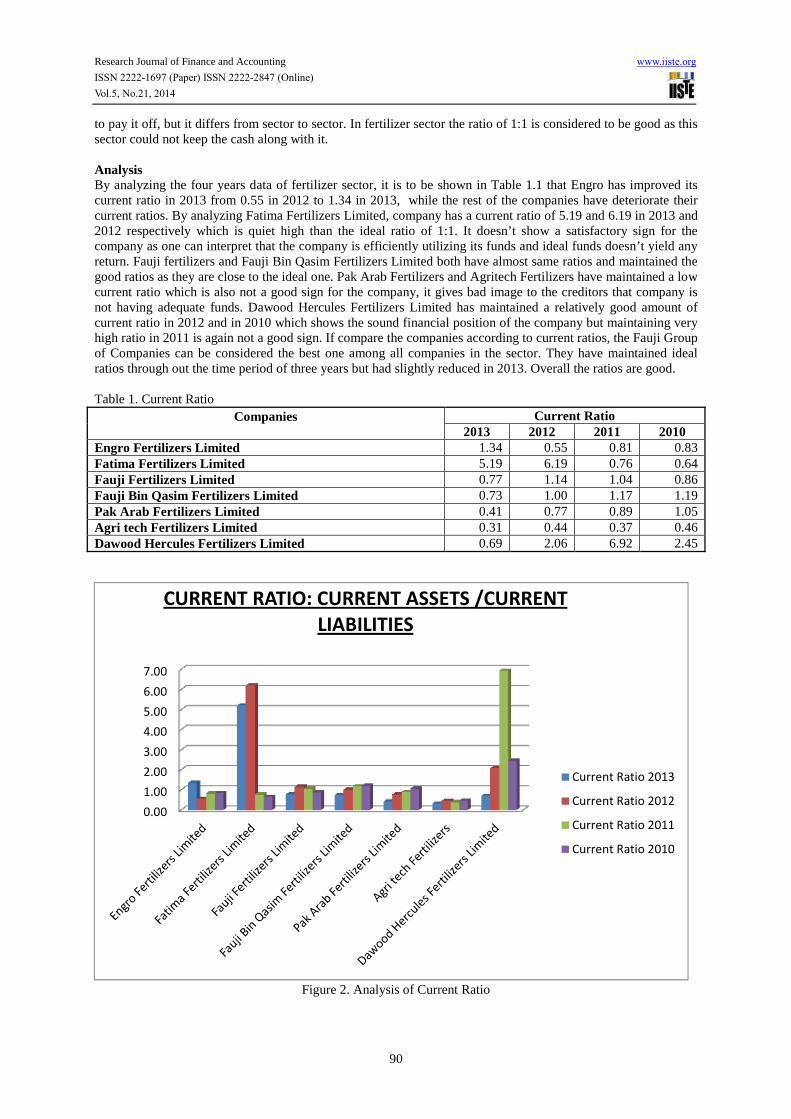
to pay it off, but it differs from sector to sector. In fertilizer sector the ratio of 1:1 is considered to be good as this sector could not keep the cash along with it. Analysis By analyzing the four years data of fertilizer sector, it is to be shown in Table 1.1 that Engro has improved its current ratio in 2013 from 0.55 in 2012 to 1.34 in 2013, while the rest of the companies have deteriorate their current ratios. By analyzing Fatima Fertilizers Limited, company has a current ratio of 5.19 and 6.19 in 2013 and 2012 respectively which is quiet high than the ideal ratio of 1:1. It doesn’t show a satisfactory sign for the company as one can interpret that the company is efficiently utilizing its funds and ideal funds doesn’t yield any return. Fauji fertilizers and Fauji Bin Qasim Fertilizers Limited both have almost same ratios and maintained the good ratios as they are close to the ideal one. Pak Arab Fertilizers and Agritech Fertilizers have maintained a low current ratio which is also not a good sign for the company, it gives bad image to the creditors that company is not having adequate funds. Dawood Hercules Fertilizers Limited has maintained a relatively good amount of current ratio in 2012 and in 2010 which shows the sound financial position of the company but maintaining very high ratio in 2011 is again not a good sign. If compare the companies according to current ratios, the Fauji Group of Companies can be considered the best one among all companies in the sector. They have maintained ideal ratios through out the time period of three years but had slightly reduced in 2013. Overall the ratios are good.
Table 1. Current Ratio
Companies
Current Ratio 2013 2012 2011 2010
Engro Fertilizers Limited 1.34 0.55 0.81 0.83 Fatima Fertilizers Limited 5.19 6.19 0.76 0.64 Fauji Fertilizers Limited 0.77 1.14 1.04 0.86 Fauji Bin Qasim Fertilizers Limited 0.73 1.00 1.17 1.19 Pak Arab Fertilizers Limited 0.41 0.77 0.89 1.05 Agri tech Fertilizers Limited 0.31 0.44 0.37 0.46 Dawood Hercules Fertilizers Limited 0.69 2.06 6.92 2.45
Figure 2. Analysis of Current Ratio
0.00
1.00
2.00
3.00
4.00
5.00
6.00
7.00
CURRENT RATIO: CURRENT ASSETS /CURRENT
LIABILITIES
Current Ratio 2013
Current Ratio 2012
Current Ratio 2011
Current Ratio 2010
Research Journal of Finance and Accounting www.iiste.org
ISSN 2222-1697 (Paper) ISSN 2222-2847 (Online)
Vol.5, No.21, 2014
91
5.2. Quick Ratio: This ratio is also termed as ‘Acid Test Ratio’ or ‘Liquidity ratio’. This ratio is ascertained by comparing the
Liquid Asset to Current Liabilities. A current asset is considered to be liquid if it is convertible into cash without loss of time and value. So, the Quick Ratio looks for the availability or convertibility into cash. Prepaid Expenses and Inventories are not taken as Liquid Asset and are singled out of total current assets. The ideal ratio for the fertilizer company is 1:1. Quick Ratio is considered to be better test of a firm’s liquidity than the Current Ratio.
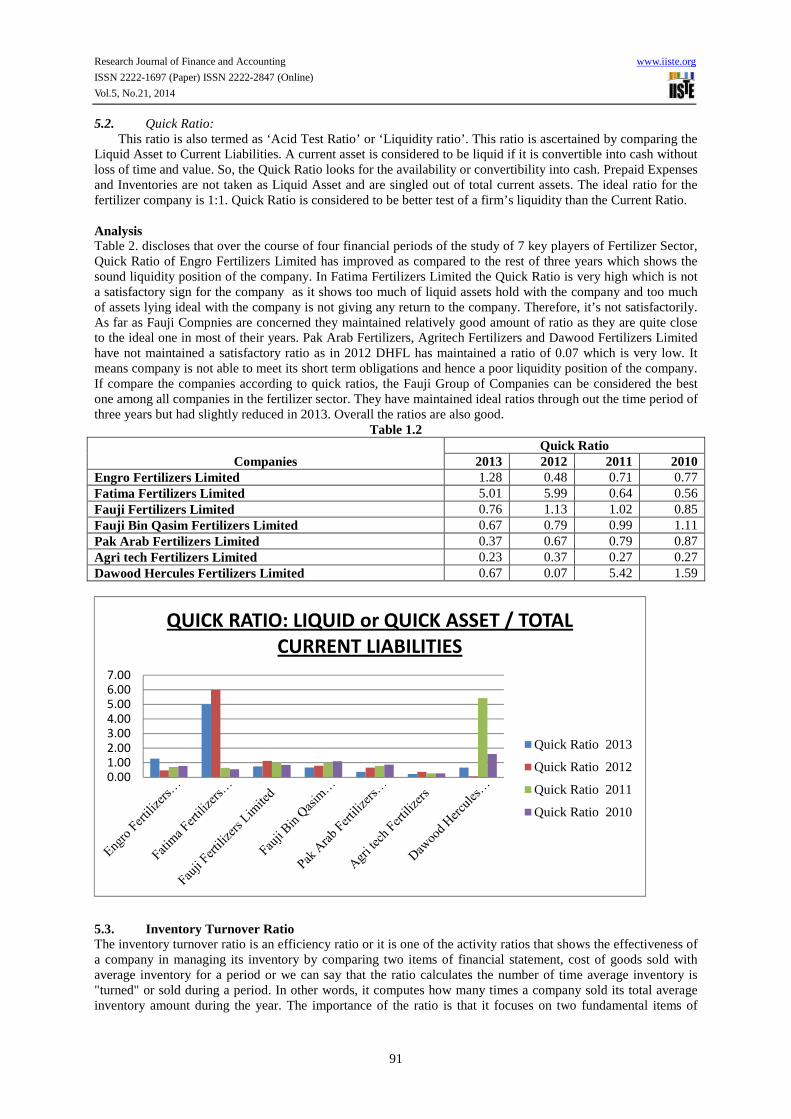
Analysis Table 2. discloses that over the course of four financial periods of the study of 7 key players of Fertilizer Sector, Quick Ratio of Engro Fertilizers Limited has improved as compared to the rest of three years which shows the sound liquidity position of the company. In Fatima Fertilizers Limited the Quick Ratio is very high which is not a satisfactory sign for the company as it shows too much of liquid assets hold with the company and too much of assets lying ideal with the company is not giving any return to the company. Therefore, it’s not satisfactorily. As far as Fauji Compnies are concerned they maintained relatively good amount of ratio as they are quite close to the ideal one in most of their years. Pak Arab Fertilizers, Agritech Fertilizers and Dawood Fertilizers Limited have not maintained a satisfactory ratio as in 2012 DHFL has maintained a ratio of 0.07 which is very low. It means company is not able to meet its short term obligations and hence a poor liquidity position of the company. If compare the companies according to quick ratios, the Fauji Group of Companies can be considered the best one among all companies in the fertilizer sector. They have maintained ideal ratios through out the time period of three years but had slightly reduced in 2013. Overall the ratios are also good.
Table 1.2
Companies Quick Ratio
2013 2012 2011 2010 Engro Fertilizers Limited 1.28 0.48 0.71 0.77 Fatima Fertilizers Limited 5.01 5.99 0.64 0.56 Fauji Fertilizers Limited 0.76 1.13 1.02 0.85 Fauji Bin Qasim Fertilizers Limited 0.67 0.79 0.99 1.11 Pak Arab Fertilizers Limited 0.37 0.67 0.79 0.87 Agri tech Fertilizers Limited 0.23 0.37 0.27 0.27 Dawood Hercules Fertilizers Limited 0.67 0.07 5.42 1.59
5.3. Inventory Turnover Ratio The inventory turnover ratio is an efficiency ratio or it is one of the activity ratios that shows the effectiveness of a company in managing its inventory by comparing two items of financial statement, cost of goods sold with average inventory for a period or we can say that the ratio calculates the number of time average inventory is "turned" or sold during a period. In other words, it computes how many times a company sold its total average inventory amount during the year. The importance of the ratio is that it focuses on two fundamental items of
0.00
1.00
2.00
3.00
4.00
5.00
6.00
7.00
QUICK RATIO: LIQUID or QUICK ASSET / TOTAL
CURRENT LIABILITIES
Quick Ratio 2013
Quick Ratio 2012
Quick Ratio 2011
Quick Ratio 2010
Research Journal of Finance and Accounting www.iiste.org
ISSN 2222-1697 (Paper) ISSN 2222-2847 (Online)
Vol.5, No.21, 2014
92
performance. First one is the purchase of inventory and if larger amounts of inventory are purchased during the year, the company will have to sell greater amounts of inventory to improve its turnover. If sales are not there, both holding and storage costs will be high. Second one is Sales. In order to be effective in turning over the inventory, sales have to be matched with inventory purchases.
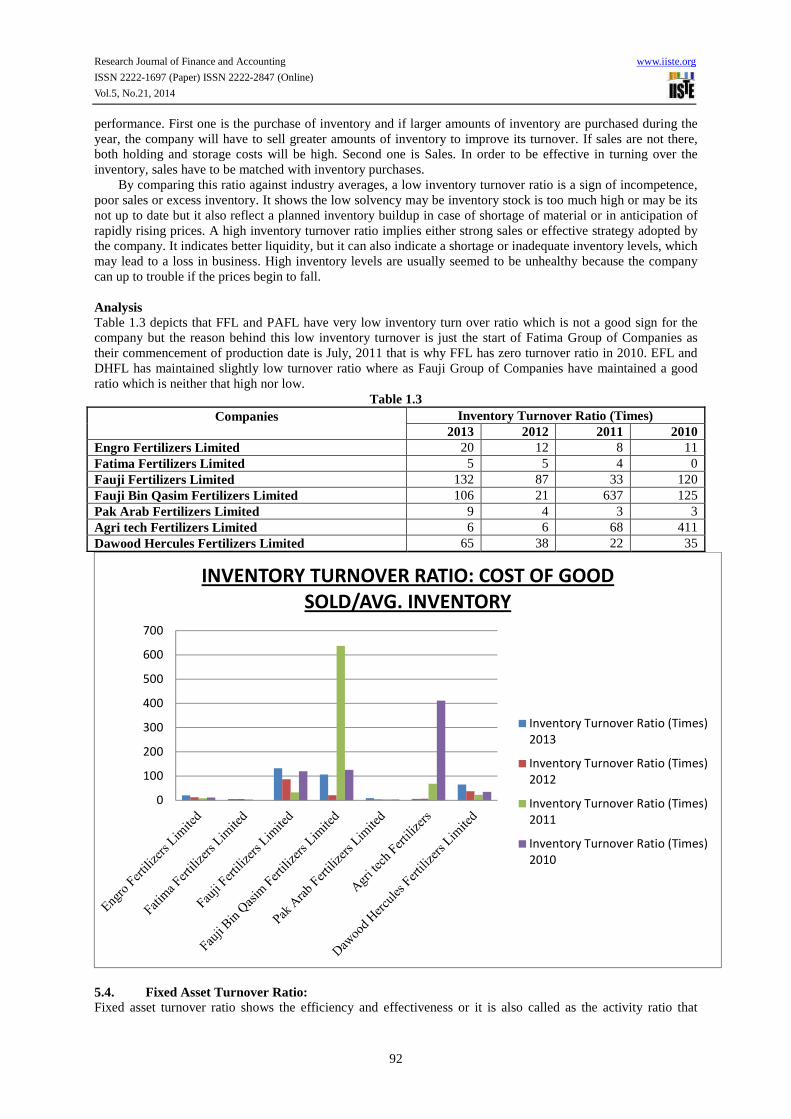
By comparing this ratio against industry averages, a low inventory turnover ratio is a sign of incompetence, poor sales or excess inventory. It shows the low solvency may be inventory stock is too much high or may be its not up to date but it also reflect a planned inventory buildup in case of shortage of material or in anticipation of rapidly rising prices. A high inventory turnover ratio implies either strong sales or effective strategy adopted by the company. It indicates better liquidity, but it can also indicate a shortage or inadequate inventory levels, which may lead to a loss in business. High inventory levels are usually seemed to be unhealthy because the company can up to trouble if the prices begin to fall. Analysis Table 1.3 depicts that FFL and PAFL have very low inventory turn over ratio which is not a good sign for the company but the reason behind this low inventory turnover is just the start of Fatima Group of Companies as their commencement of production date is July, 2011 that is why FFL has zero turnover ratio in 2010. EFL and DHFL has maintained slightly low turnover ratio where as Fauji Group of Companies have maintained a good ratio which is neither that high nor low.
Table 1.3 Companies
Inventory Turnover Ratio (Times)
2013 2012 2011 2010 Engro Fertilizers Limited 20 12 8 11 Fatima Fertilizers Limited 5 5 4 0 Fauji Fertilizers Limited 132 87 33 120 Fauji Bin Qasim Fertilizers Limited 106 21 637 125 Pak Arab Fertilizers Limited 9 4 3 3 Agri tech Fertilizers Limited 6 6 68 411 Dawood Hercules Fertilizers Limited 65 38 22 35
5.4. Fixed Asset Turnover Ratio: Fixed asset turnover ratio shows the efficiency and effectiveness or it is also called as the activity ratio that
0
100
200
300
400
500
600
700
INVENTORY TURNOVER RATIO: COST OF GOOD
SOLD/AVG. INVENTORY
Inventory Turnover Ratio (Times)
2013
Inventory Turnover Ratio (Times)
2012
Inventory Turnover Ratio (Times)
2011
Inventory Turnover Ratio (Times)
2010
Research Journal of Finance and Accounting www.iiste.org
ISSN 2222-1697 (Paper) ISSN 2222-2847 (Online)
Vol.5, No.21, 2014
93
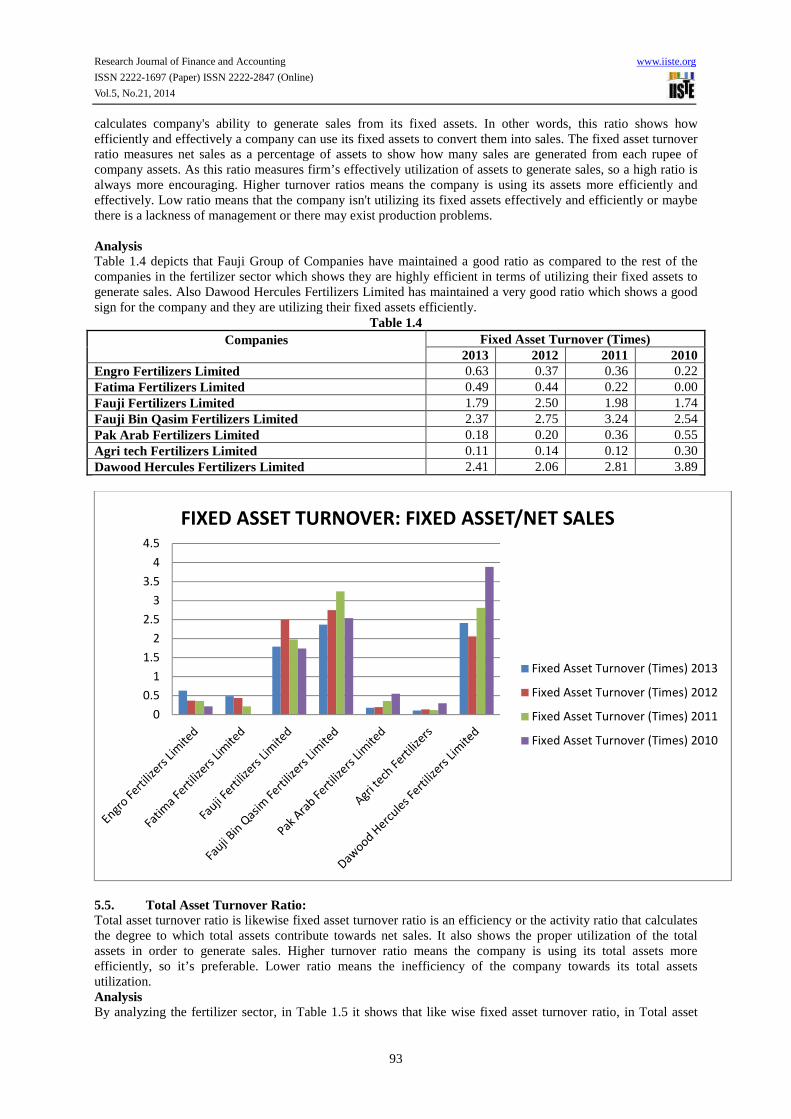
calculates company's ability to generate sales from its fixed assets. In other words, this ratio shows how efficiently and effectively a company can use its fixed assets to convert them into sales. The fixed asset turnover ratio measures net sales as a percentage of assets to show how many sales are generated from each rupee of company assets. As this ratio measures firm’s effectively utilization of assets to generate sales, so a high ratio is always more encouraging. Higher turnover ratios means the company is using its assets more efficiently and effectively. Low ratio means that the company isn't utilizing its fixed assets effectively and efficiently or maybe there is a lackness of management or there may exist production problems. Analysis Table 1.4 depicts that Fauji Group of Companies have maintained a good ratio as compared to the rest of the companies in the fertilizer sector which shows they are highly efficient in terms of utilizing their fixed assets to generate sales. Also Dawood Hercules Fertilizers Limited has maintained a very good ratio which shows a good sign for the company and they are utilizing their fixed assets efficiently.
Table 1.4 Companies
Fixed Asset Turnover (Times)
2013 2012 2011 2010 Engro Fertilizers Limited 0.63 0.37 0.36 0.22 Fatima Fertilizers Limited 0.49 0.44 0.22 0.00 Fauji Fertilizers Limited 1.79 2.50 1.98 1.74 Fauji Bin Qasim Fertilizers Limited 2.37 2.75 3.24 2.54 Pak Arab Fertilizers Limited 0.18 0.20 0.36 0.55 Agri tech Fertilizers Limited 0.11 0.14 0.12 0.30 Dawood Hercules Fertilizers Limited 2.41 2.06 2.81 3.89
5.5. Total Asset Turnover Ratio: Total asset turnover ratio is likewise fixed asset turnover ratio is an efficiency or the activity ratio that calculates the degree to which total assets contribute towards net sales. It also shows the proper utilization of the total assets in order to generate sales. Higher turnover ratio means the company is using its total assets more efficiently, so it’s preferable. Lower ratio means the inefficiency of the company towards its total assets utilization. Analysis By analyzing the fertilizer sector, in Table 1.5 it shows that like wise fixed asset turnover ratio, in Total asset
0
0.5
1
1.5
2
2.5
3
3.5
4
4.5
FIXED ASSET TURNOVER: FIXED ASSET/NET SALES
Fixed Asset Turnover (Times) 2013
Fixed Asset Turnover (Times) 2012
Fixed Asset Turnover (Times) 2011
Fixed Asset Turnover (Times) 2010
Research Journal of Finance and Accounting www.iiste.org
ISSN 2222-1697 (Paper) ISSN 2222-2847 (Online)
Vol.5, No.21, 2014
94
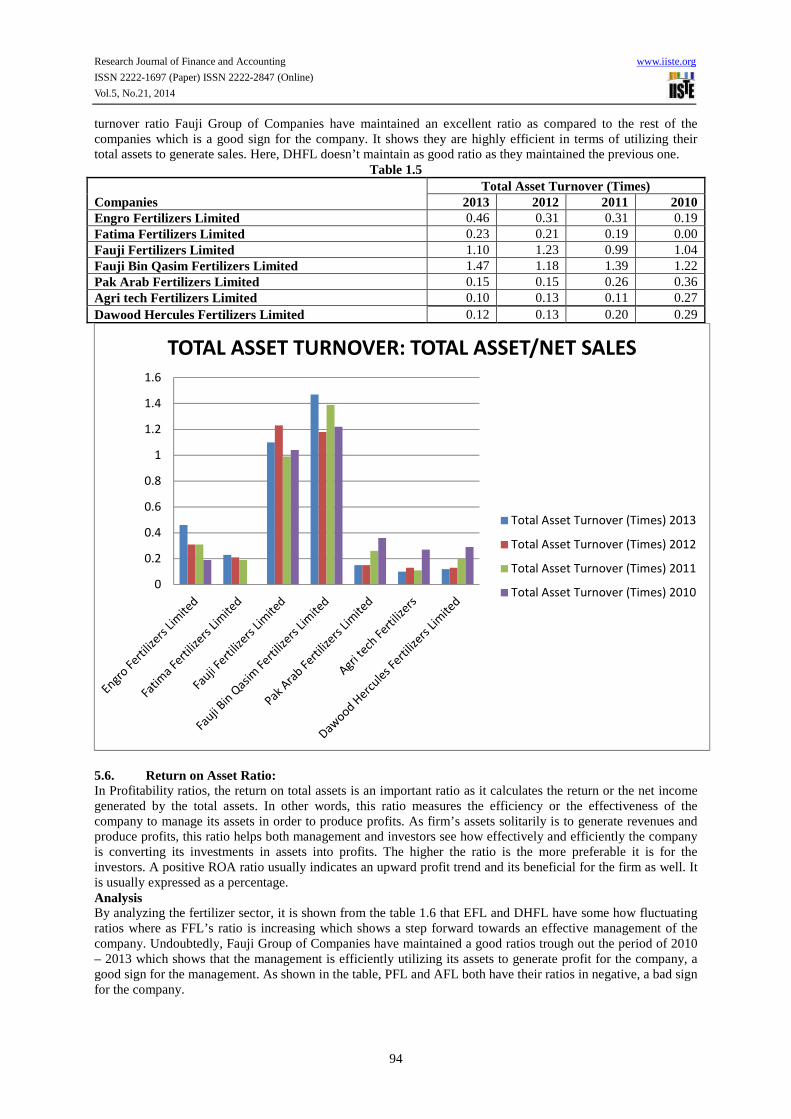
turnover ratio Fauji Group of Companies have maintained an excellent ratio as compared to the rest of the companies which is a good sign for the company. It shows they are highly efficient in terms of utilizing their total assets to generate sales. Here, DHFL doesn’t maintain as good ratio as they maintained the previous one.
Table 1.5
Companies Total Asset Turnover (Times)
2013 2012 2011 2010 Engro Fertilizers Limited 0.46 0.31 0.31 0.19 Fatima Fertilizers Limited 0.23 0.21 0.19 0.00 Fauji Fertilizers Limited 1.10 1.23 0.99 1.04 Fauji Bin Qasim Fertilizers Limited 1.47 1.18 1.39 1.22 Pak Arab Fertilizers Limited 0.15 0.15 0.26 0.36 Agri tech Fertilizers Limited 0.10 0.13 0.11 0.27 Dawood Hercules Fertilizers Limited 0.12 0.13 0.20 0.29
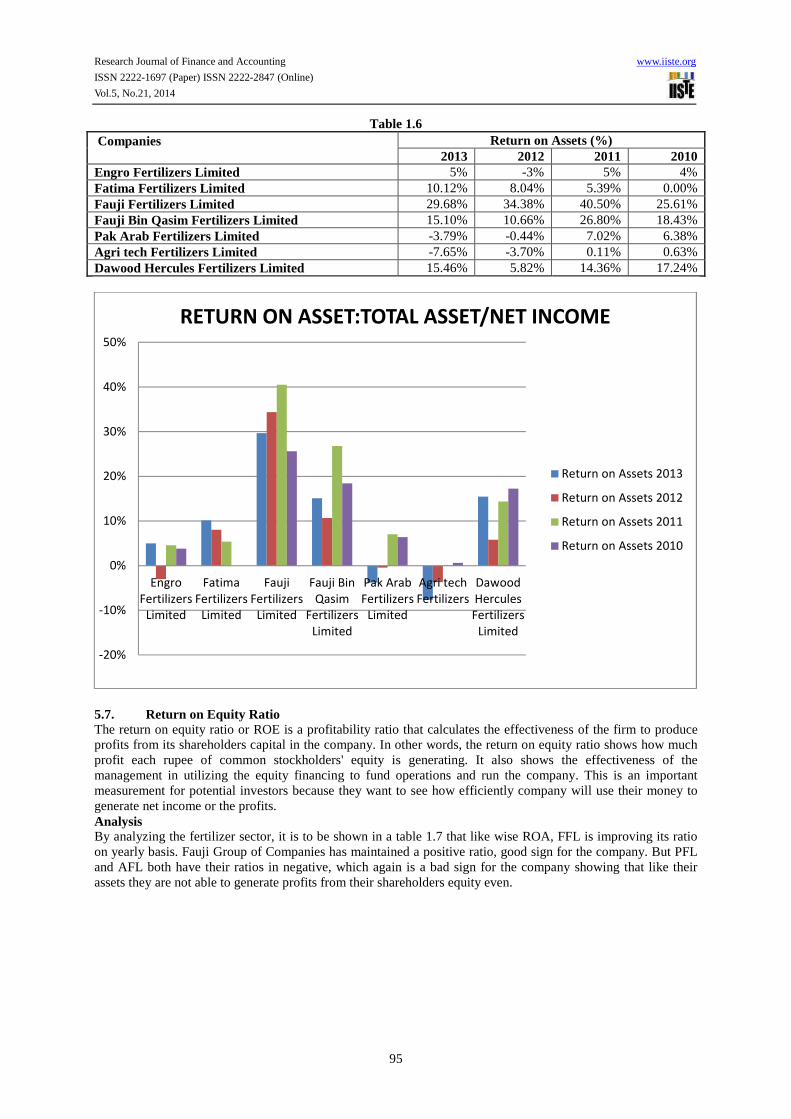
5.6. Return on Asset Ratio: In Profitability ratios, the return on total assets is an important ratio as it calculates the return or the net income generated by the total assets. In other words, this ratio measures the efficiency or the effectiveness of the company to manage its assets in order to produce profits. As firm’s assets solitarily is to generate revenues and produce profits, this ratio helps both management and investors see how effectively and efficiently the company is converting its investments in assets into profits. The higher the ratio is the more preferable it is for the investors. A positive ROA ratio usually indicates an upward profit trend and its beneficial for the firm as well. It is usually expressed as a percentage. Analysis By analyzing the fertilizer sector, it is shown from the table 1.6 that EFL and DHFL have some how fluctuating ratios where as FFL’s ratio is increasing which shows a step forward towards an effective management of the company. Undoubtedly, Fauji Group of Companies have maintained a good ratios trough out the period of 2010 – 2013 which shows that the management is efficiently utilizing its assets to generate profit for the company, a good sign for the management. As shown in the table, PFL and AFL both have their ratios in negative, a bad sign for the company.
0
0.2
0.4
0.6
0.8
1
1.2
1.4
1.6
TOTAL ASSET TURNOVER: TOTAL ASSET/NET SALES
Total Asset Turnover (Times) 2013
Total Asset Turnover (Times) 2012
Total Asset Turnover (Times) 2011
Total Asset Turnover (Times) 2010
Research Journal of Finance and Accounting www.iiste.org
ISSN 2222-1697 (Paper) ISSN 2222-2847 (Online)
Vol.5, No.21, 2014
95
Table 1.6 Companies
Return on Assets (%) 2013 2012 2011 2010
Engro Fertilizers Limited 5% -3% 5% 4% Fatima Fertilizers Limited 10.12% 8.04% 5.39% 0.00% Fauji Fertilizers Limited 29.68% 34.38% 40.50% 25.61% Fauji Bin Qasim Fertilizers Limited 15.10% 10.66% 26.80% 18.43% Pak Arab Fertilizers Limited -3.79% -0.44% 7.02% 6.38% Agri tech Fertilizers Limited -7.65% -3.70% 0.11% 0.63% Dawood Hercules Fertilizers Limited 15.46% 5.82% 14.36% 17.24%
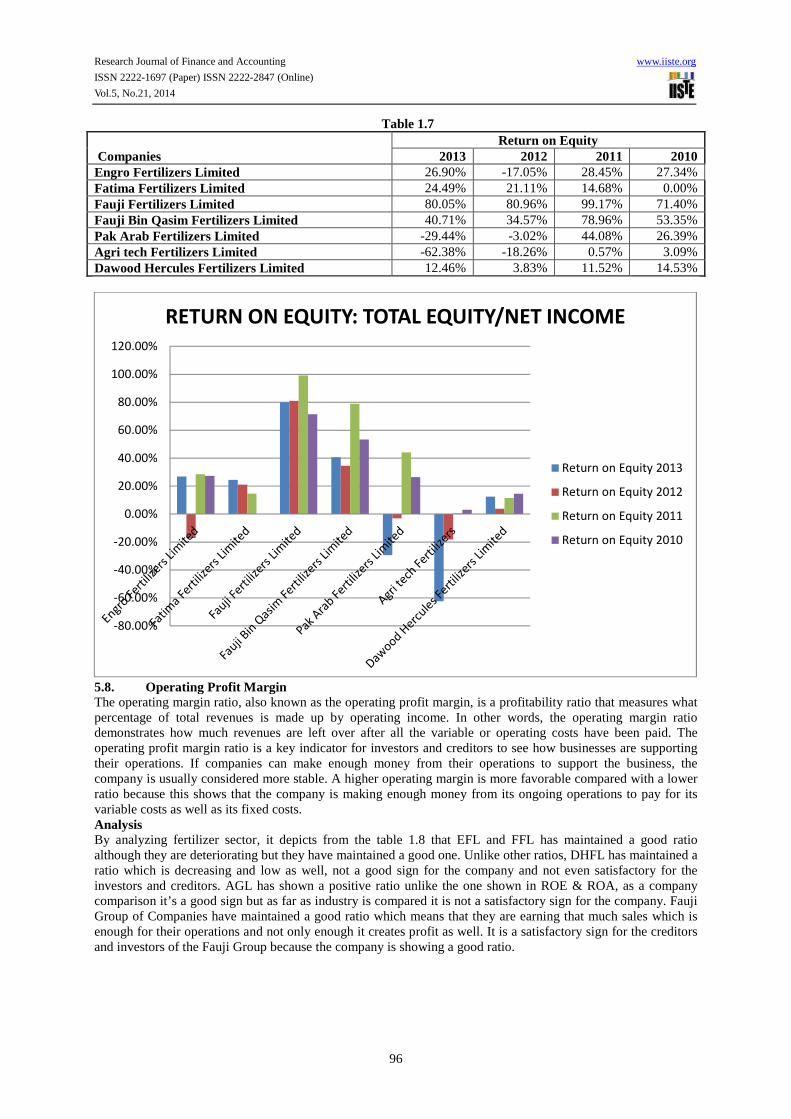
5.7. Return on Equity Ratio The return on equity ratio or ROE is a profitability ratio that calculates the effectiveness of the firm to produce profits from its shareholders capital in the company. In other words, the return on equity ratio shows how much profit each rupee of common stockholders' equity is generating. It also shows the effectiveness of the management in utilizing the equity financing to fund operations and run the company. This is an important measurement for potential investors because they want to see how efficiently company will use their money to generate net income or the profits. Analysis By analyzing the fertilizer sector, it is to be shown in a table 1.7 that like wise ROA, FFL is improving its ratio on yearly basis. Fauji Group of Companies has maintained a positive ratio, good sign for the company. But PFL and AFL both have their ratios in negative, which again is a bad sign for the company showing that like their assets they are not able to generate profits from their shareholders equity even.
-20%
-10%
0%
10%
20%
30%
40%
50%
Engro
Fertilizers
Limited
Fatima
Fertilizers
Limited
Fauji
Fertilizers
Limited
Fauji Bin
Qasim
Fertilizers
Limited
Pak Arab
Fertilizers
Limited
Agri tech
Fertilizers
Dawood
Hercules
Fertilizers
Limited
RETURN ON ASSET:TOTAL ASSET/NET INCOME
Return on Assets 2013
Return on Assets 2012
Return on Assets 2011
Return on Assets 2010
Research Journal of Finance and Accounting www.iiste.org
ISSN 2222-1697 (Paper) ISSN 2222-2847 (Online)
Vol.5, No.21, 2014
96
Table 1.7 Companies
Return on Equity 2013 2012 2011 2010
Engro Fertilizers Limited 26.90% -17.05% 28.45% 27.34% Fatima Fertilizers Limited 24.49% 21.11% 14.68% 0.00% Fauji Fertilizers Limited 80.05% 80.96% 99.17% 71.40% Fauji Bin Qasim Fertilizers Limited 40.71% 34.57% 78.96% 53.35% Pak Arab Fertilizers Limited -29.44% -3.02% 44.08% 26.39% Agri tech Fertilizers Limited -62.38% -18.26% 0.57% 3.09% Dawood Hercules Fertilizers Limited 12.46% 3.83% 11.52% 14.53%
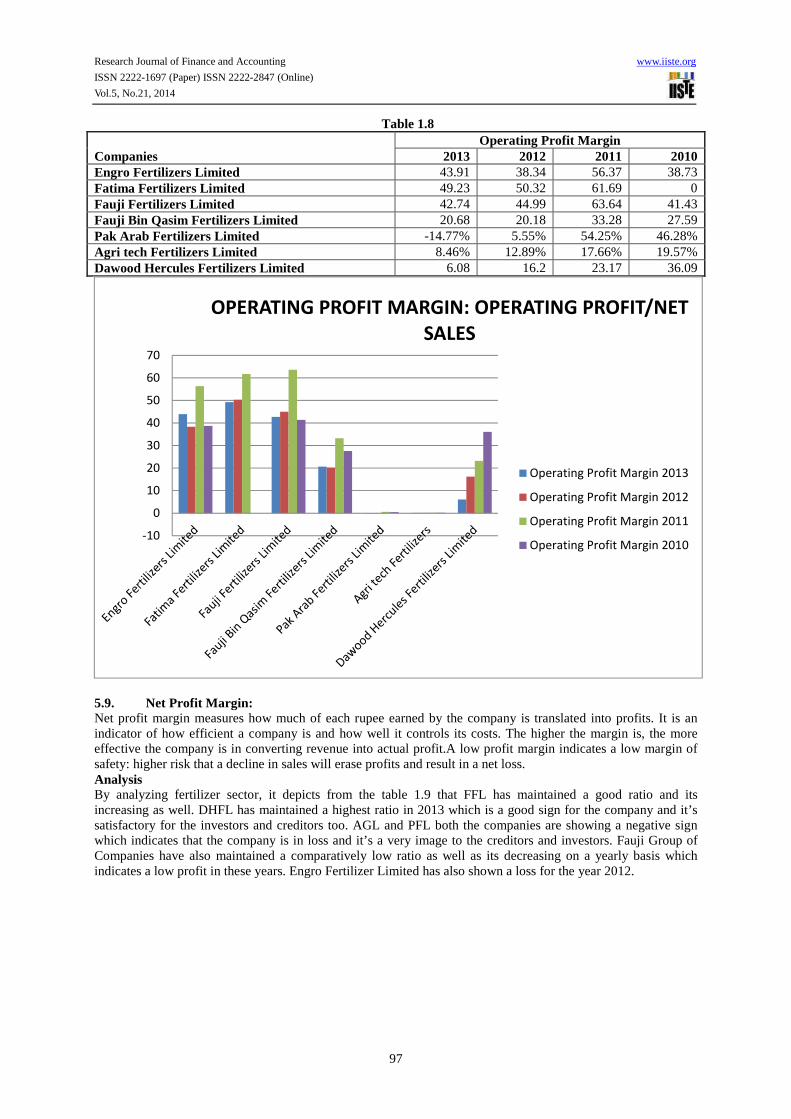
5.8. Operating Profit Margin The operating margin ratio, also known as the operating profit margin, is a profitability ratio that measures what percentage of total revenues is made up by operating income. In other words, the operating margin ratio demonstrates how much revenues are left over after all the variable or operating costs have been paid. The operating profit margin ratio is a key indicator for investors and creditors to see how businesses are supporting their operations. If companies can make enough money from their operations to support the business, the company is usually considered more stable. A higher operating margin is more favorable compared with a lower ratio because this shows that the company is making enough money from its ongoing operations to pay for its variable costs as well as its fixed costs. Analysis By analyzing fertilizer sector, it depicts from the table 1.8 that EFL and FFL has maintained a good ratio although they are deteriorating but they have maintained a good one. Unlike other ratios, DHFL has maintained a ratio which is decreasing and low as well, not a good sign for the company and not even satisfactory for the investors and creditors. AGL has shown a positive ratio unlike the one shown in ROE & ROA, as a company comparison it’s a good sign but as far as industry is compared it is not a satisfactory sign for the company. Fauji Group of Companies have maintained a good ratio which means that they are earning that much sales which is enough for their operations and not only enough it creates profit as well. It is a satisfactory sign for the creditors and investors of the Fauji Group because the company is showing a good ratio.
-80.00%
-60.00%
-40.00%
-20.00%
0.00%
20.00%
40.00%
60.00%
80.00%
100.00%
120.00%
RETURN ON EQUITY: TOTAL EQUITY/NET INCOME
Return on Equity 2013
Return on Equity 2012
Return on Equity 2011
Return on Equity 2010
Research Journal of Finance and Accounting www.iiste.org
ISSN 2222-1697 (Paper) ISSN 2222-2847 (Online)
Vol.5, No.21, 2014
97
Table 1.8
Companies Operating Profit Margin
2013 2012 2011 2010 Engro Fertilizers Limited 43.91 38.34 56.37 38.73 Fatima Fertilizers Limited 49.23 50.32 61.69 0 Fauji Fertilizers Limited 42.74 44.99 63.64 41.43 Fauji Bin Qasim Fertilizers Limited 20.68 20.18 33.28 27.59 Pak Arab Fertilizers Limited -14.77% 5.55% 54.25% 46.28% Agri tech Fertilizers Limited 8.46% 12.89% 17.66% 19.57% Dawood Hercules Fertilizers Limited 6.08 16.2 23.17 36.09
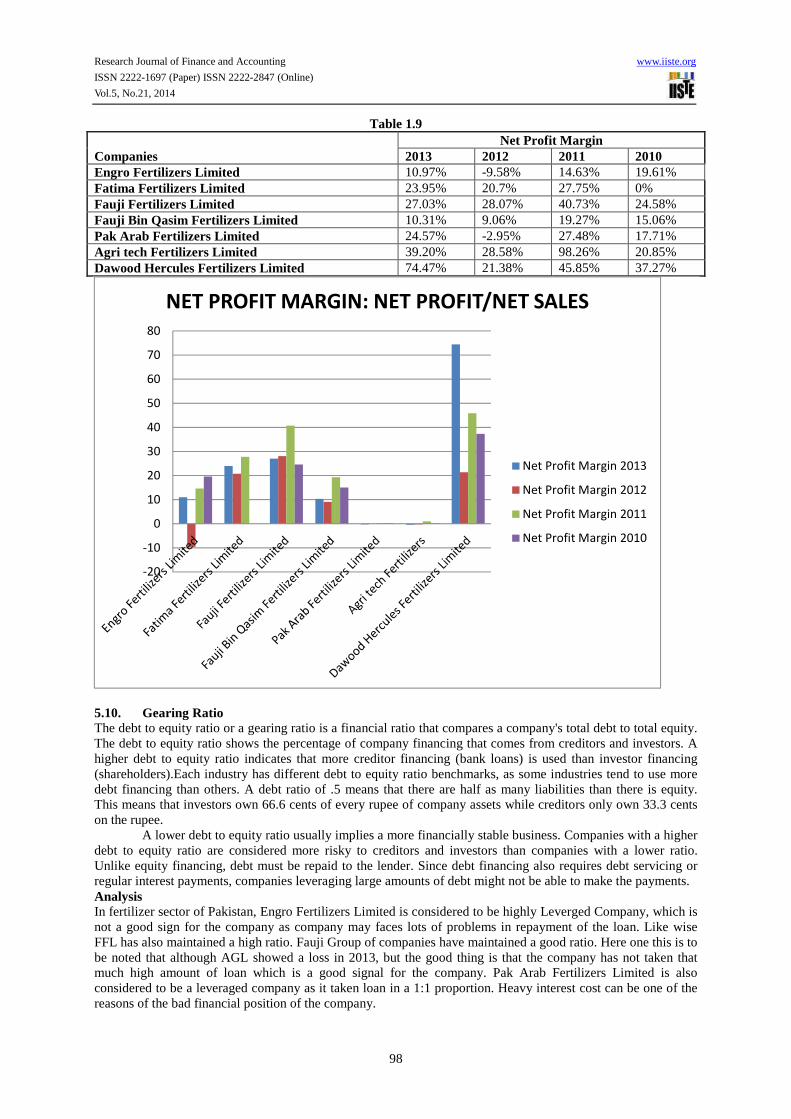
5.9. Net Profit Margin: Net profit margin measures how much of each rupee earned by the company is translated into profits. It is an indicator of how efficient a company is and how well it controls its costs. The higher the margin is, the more effective the company is in converting revenue into actual profit.A low profit margin indicates a low margin of safety: higher risk that a decline in sales will erase profits and result in a net loss. Analysis By analyzing fertilizer sector, it depicts from the table 1.9 that FFL has maintained a good ratio and its increasing as well. DHFL has maintained a highest ratio in 2013 which is a good sign for the company and it’s satisfactory for the investors and creditors too. AGL and PFL both the companies are showing a negative sign which indicates that the company is in loss and it’s a very image to the creditors and investors. Fauji Group of Companies have also maintained a comparatively low ratio as well as its decreasing on a yearly basis which indicates a low profit in these years. Engro Fertilizer Limited has also shown a loss for the year 2012.
-10
0
10
20
30
40
50
60
70
OPERATING PROFIT MARGIN: OPERATING PROFIT/NET
SALES
Operating Profit Margin 2013
Operating Profit Margin 2012
Operating Profit Margin 2011
Operating Profit Margin 2010
Research Journal of Finance and Accounting www.iiste.org
ISSN 2222-1697 (Paper) ISSN 2222-2847 (Online)
Vol.5, No.21, 2014
98
Table 1.9
Companies Net Profit Margin
2013 2012 2011 2010 Engro Fertilizers Limited 10.97% -9.58% 14.63% 19.61% Fatima Fertilizers Limited 23.95% 20.7% 27.75% 0% Fauji Fertilizers Limited 27.03% 28.07% 40.73% 24.58% Fauji Bin Qasim Fertilizers Limited 10.31% 9.06% 19.27% 15.06% Pak Arab Fertilizers Limited 24.57% -2.95% 27.48% 17.71% Agri tech Fertilizers Limited 39.20% 28.58% 98.26% 20.85% Dawood Hercules Fertilizers Limited 74.47% 21.38% 45.85% 37.27%
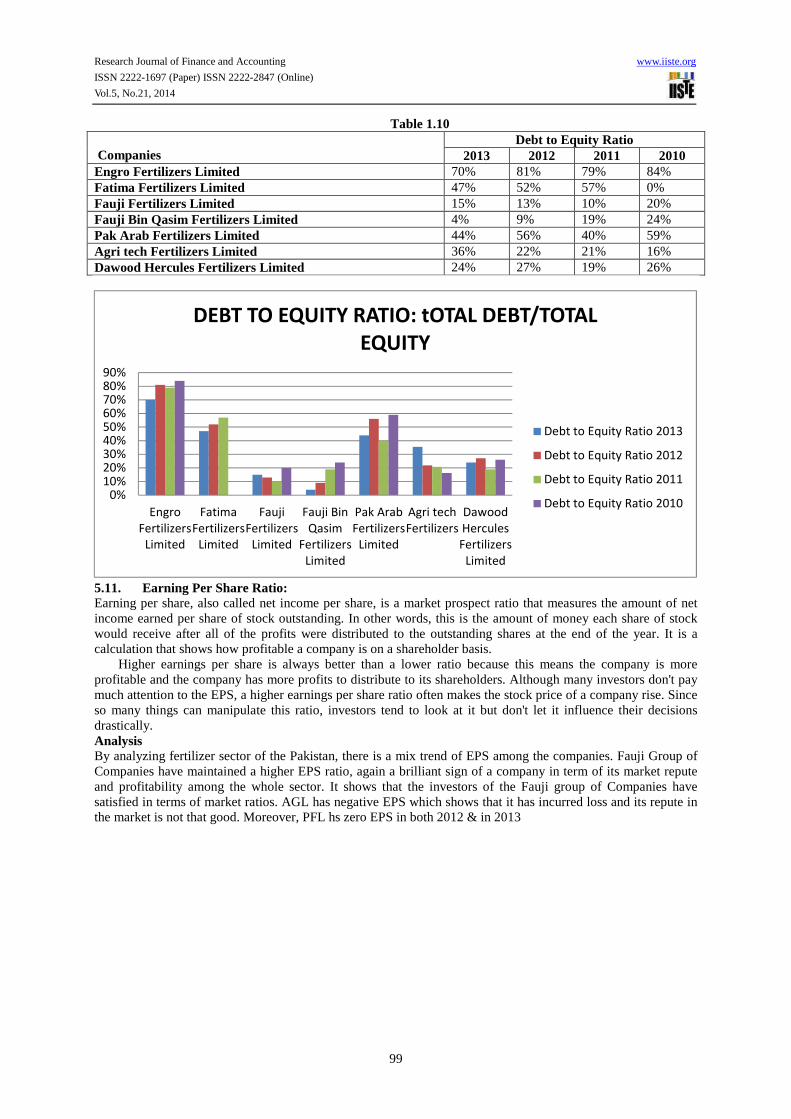
5.10. Gearing Ratio The debt to equity ratio or a gearing ratio is a financial ratio that compares a company's total debt to total equity. The debt to equity ratio shows the percentage of company financing that comes from creditors and investors. A higher debt to equity ratio indicates that more creditor financing (bank loans) is used than investor financing (shareholders).Each industry has different debt to equity ratio benchmarks, as some industries tend to use more debt financing than others. A debt ratio of .5 means that there are half as many liabilities than there is equity. This means that investors own 66.6 cents of every rupee of company assets while creditors only own 33.3 cents on the rupee.
A lower debt to equity ratio usually implies a more financially stable business. Companies with a higher debt to equity ratio are considered more risky to creditors and investors than companies with a lower ratio. Unlike equity financing, debt must be repaid to the lender. Since debt financing also requires debt servicing or regular interest payments, companies leveraging large amounts of debt might not be able to make the payments. Analysis In fertilizer sector of Pakistan, Engro Fertilizers Limited is considered to be highly Leverged Company, which is not a good sign for the company as company may faces lots of problems in repayment of the loan. Like wise FFL has also maintained a high ratio. Fauji Group of companies have maintained a good ratio. Here one this is to be noted that although AGL showed a loss in 2013, but the good thing is that the company has not taken that much high amount of loan which is a good signal for the company. Pak Arab Fertilizers Limited is also considered to be a leveraged company as it taken loan in a 1:1 proportion. Heavy interest cost can be one of the reasons of the bad financial position of the company.
-20
-10
0
10
20
30
40
50
60
70
80
NET PROFIT MARGIN: NET PROFIT/NET SALES
Net Profit Margin 2013
Net Profit Margin 2012
Net Profit Margin 2011
Net Profit Margin 2010
Research Journal of Finance and Accounting www.iiste.org
ISSN 2222-1697 (Paper) ISSN 2222-2847 (Online)
Vol.5, No.21, 2014
99
Table 1.10 Companies
Debt to Equity Ratio 2013 2012 2011 2010
Engro Fertilizers Limited 70% 81% 79% 84% Fatima Fertilizers Limited 47% 52% 57% 0% Fauji Fertilizers Limited 15% 13% 10% 20% Fauji Bin Qasim Fertilizers Limited 4% 9% 19% 24% Pak Arab Fertilizers Limited 44% 56% 40% 59% Agri tech Fertilizers Limited 36% 22% 21% 16% Dawood Hercules Fertilizers Limited 24% 27% 19% 26%
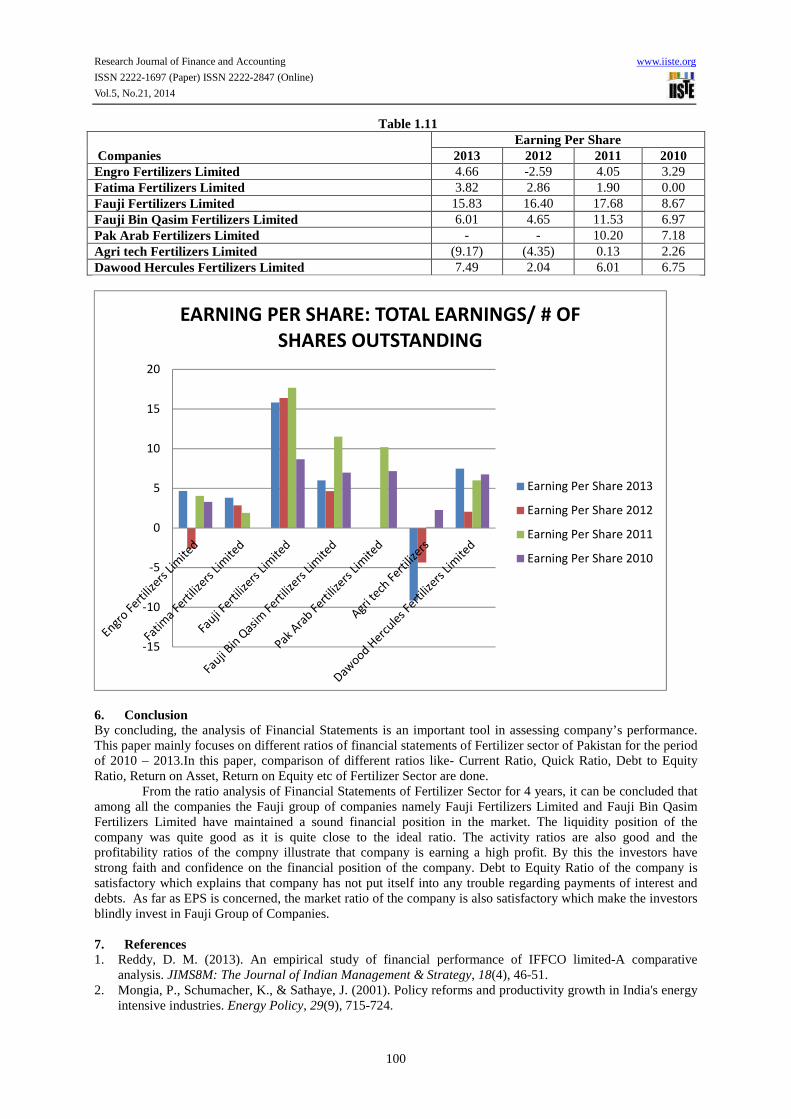
5.11. Earning Per Share Ratio: Earning per share, also called net income per share, is a market prospect ratio that measures the amount of net income earned per share of stock outstanding. In other words, this is the amount of money each share of stock would receive after all of the profits were distributed to the outstanding shares at the end of the year. It is a calculation that shows how profitable a company is on a shareholder basis.
Higher earnings per share is always better than a lower ratio because this means the company is more profitable and the company has more profits to distribute to its shareholders. Although many investors don't pay much attention to the EPS, a higher earnings per share ratio often makes the stock price of a company rise. Since so many things can manipulate this ratio, investors tend to look at it but don't let it influence their decisions drastically. Analysis By analyzing fertilizer sector of the Pakistan, there is a mix trend of EPS among the companies. Fauji Group of Companies have maintained a higher EPS ratio, again a brilliant sign of a company in term of its market repute and profitability among the whole sector. It shows that the investors of the Fauji group of Companies have satisfied in terms of market ratios. AGL has negative EPS which shows that it has incurred loss and its repute in the market is not that good. Moreover, PFL hs zero EPS in both 2012 & in 2013
0%10%20%30%40%50%60%70%80%90%
Engro
Fertilizers
Limited
Fatima
Fertilizers
Limited
Fauji
Fertilizers
Limited
Fauji Bin
Qasim
Fertilizers
Limited
Pak Arab
Fertilizers
Limited
Agri tech
Fertilizers
Dawood
Hercules
Fertilizers
Limited
DEBT TO EQUITY RATIO: tOTAL DEBT/TOTAL
EQUITY
Debt to Equity Ratio 2013
Debt to Equity Ratio 2012
Debt to Equity Ratio 2011
Debt to Equity Ratio 2010
Research Journal of Finance and Accounting www.iiste.org
ISSN 2222-1697 (Paper) ISSN 2222-2847 (Online)
Vol.5, No.21, 2014
100
Table 1.11
Companies Earning Per Share
2013 2012 2011 2010 Engro Fertilizers Limited 4.66 -2.59 4.05 3.29 Fatima Fertilizers Limited 3.82 2.86 1.90 0.00 Fauji Fertilizers Limited 15.83 16.40 17.68 8.67 Fauji Bin Qasim Fertilizers Limited 6.01 4.65 11.53 6.97 Pak Arab Fertilizers Limited - - 10.20 7.18 Agri tech Fertilizers Limited (9.17) (4.35) 0.13 2.26 Dawood Hercules Fertilizers Limited 7.49 2.04 6.01 6.75
6. Conclusion By concluding, the analysis of Financial Statements is an important tool in assessing company’s performance. This paper mainly focuses on different ratios of financial statements of Fertilizer sector of Pakistan for the period of 2010 – 2013.In this paper, comparison of different ratios like- Current Ratio, Quick Ratio, Debt to Equity Ratio, Return on Asset, Return on Equity etc of Fertilizer Sector are done.
From the ratio analysis of Financial Statements of Fertilizer Sector for 4 years, it can be concluded that among all the companies the Fauji group of companies namely Fauji Fertilizers Limited and Fauji Bin Qasim Fertilizers Limited have maintained a sound financial position in the market. The liquidity position of the company was quite good as it is quite close to the ideal ratio. The activity ratios are also good and the profitability ratios of the compny illustrate that company is earning a high profit. By this the investors have strong faith and confidence on the financial position of the company. Debt to Equity Ratio of the company is satisfactory which explains that company has not put itself into any trouble regarding payments of interest and debts. As far as EPS is concerned, the market ratio of the company is also satisfactory which make the investors blindly invest in Fauji Group of Companies.
7. References 1. Reddy, D. M. (2013). An empirical study of financial performance of IFFCO limited-A comparative
analysis. JIMS8M: The Journal of Indian Management & Strategy, 18(4), 46-51. 2. Mongia, P., Schumacher, K., & Sathaye, J. (2001). Policy reforms and productivity growth in India's energy
intensive industries. Energy Policy, 29(9), 715-724.
-15
-10
-5
0
5
10
15
20
EARNING PER SHARE: TOTAL EARNINGS/ # OF
SHARES OUTSTANDING
Earning Per Share 2013
Earning Per Share 2012
Earning Per Share 2011
Earning Per Share 2010
Research Journal of Finance and Accounting www.iiste.org
ISSN 2222-1697 (Paper) ISSN 2222-2847 (Online)
Vol.5, No.21, 2014
101
3. Khan, H. G. A., & Ahmad, A. (2010). Impact of rising prices of fertilizers on crops production in Pakistan. Global Journal of Management And Business Research, 10(9).
4. Byerlee, D., & Siddiq, A. (1994). Has the Green Revolution been sustained? The quantitative impact of the seed-fertilizer revolution in Pakistan revisited.World Development, 22(9), 1345-1361.
5. Spate, O. H. K., & Learmonth, A. T. A. (1972). India and Pakistan: land, people and economy. India and Pakistan: land, people and economy.
6. Hernandez, M., & Torero, M. (2011). Fertilizer market situation: market structure, consumption and trade patterns, and pricing behavior. IFPRI Discussion Paper 1058, IFPRI, Washington.
7. Hoyum, R. (2012) Nepal Fertilizer and Nutrient Assessment - Summary report: Nepal, Economic, Agriculture, and Trade Activity. Washington, D.C.: USAID (p.9)
8. African Union (2006). Abuja Declaration on Fertilizer for an African Green Revolution. Abuja Nigeria: African Union.
9. The World Bank Africa Finance and Private Sector Development Department & Africa Region Sustainable Development Department (2013) Growing Africa: Unlocking the Potential of Agribusiness. Washington, D.C.: The World Bank (p.72)
10. http://marketrealist.com/2013/10/fertilizer-industry-overview-must-know-fertilizer-types/comments 11. The Nation (Monday, December 13, 2004). Dawood Hercules Chemicals Limited. 12. The Nation, Monday, December 13, 2004 - Dawood Hercules Chemicals Limited 13. Goliath - Dawood Hercules Chemicals Limited 14. Pakistan Economist - Fertilizer Industry's Solid Performance 15. Reuters - Demerger of Dawood Hercules Chemicals Limited 16. Business Recorder - DAWOOD HERCULES CHEMICALS LIMITED - Analysis of Financial Statements 17. http://www.investopedia.com 18. http://pakistan-stocks.blogspot.com/2013/07/ffc-fauji-fertilizer-co-ltd-ratios_30.html 19. www. engrofertilizers.com/ 20. www. pafl.com.pk/ 21. www.fatima-group.com/ 22. www.fatima-group.com/pakarabfertilizers/financialresults/ 23. www.ffc.com.pk/ 24. www.ffbl.com/ 25. www.dawoodhercules.com/
The IISTE is a pioneer in the Open-Access hosting service and academic event
management. The aim of the firm is Accelerating Global Knowledge Sharing.
More information about the firm can be found on the homepage:
http://www.iiste.org
CALL FOR JOURNAL PAPERS
There are more than 30 peer-reviewed academic journals hosted under the hosting
platform.
Prospective authors of journals can find the submission instruction on the
following page: http://www.iiste.org/journals/ All the journals articles are available
online to the readers all over the world without financial, legal, or technical barriers
other than those inseparable from gaining access to the internet itself. Paper version
of the journals is also available upon request of readers and authors.
MORE RESOURCES
Book publication information: http://www.iiste.org/book/
IISTE Knowledge Sharing Partners
EBSCO, Index Copernicus, Ulrich's Periodicals Directory, JournalTOCS, PKP Open
Archives Harvester, Bielefeld Academic Search Engine, Elektronische
Zeitschriftenbibliothek EZB, Open J-Gate, OCLC WorldCat, Universe Digtial
Library , NewJour, Google Scholar
Related Documents