buildings Article An Efficient Reliability-Based Approach for Evaluating Safe Scaled Distance of Steel Columns under Dynamic Blast Loads Mohammad Momeni 1,2 , Chiara Bedon 3, * , Mohammad Ali Hadianfard 1 and Abdolhossein Baghlani 1 Citation: Momeni, M.; Bedon, C.; Hadianfard, M.A.; Baghlani, A. An Efficient Reliability-Based Approach for Evaluating Safe Scaled Distance of Steel Columns under Dynamic Blast Loads. Buildings 2021, 11, 606. https://doi.org/10.3390/ buildings11120606 Academic Editor: Paulo Santos Received: 21 October 2021 Accepted: 29 November 2021 Published: 2 December 2021 Publisher’s Note: MDPI stays neutral with regard to jurisdictional claims in published maps and institutional affil- iations. Copyright: © 2021 by the authors. Licensee MDPI, Basel, Switzerland. This article is an open access article distributed under the terms and conditions of the Creative Commons Attribution (CC BY) license (https:// creativecommons.org/licenses/by/ 4.0/). 1 Department of Civil and Environmental Engineering, Shiraz University of Technology, Shiraz 7155713876, Iran; [email protected] (M.M.); [email protected] (M.A.H.); [email protected] (A.B.) 2 Department of Civil Engineering, Shahrekord Branch, Islamic Azad University, Shahrekord 8813733395, Iran 3 Department of Engineering and Architecture, University of Trieste, 34127 Trieste, Italy * Correspondence: [email protected] Abstract: Damage to building load-bearing members (especially columns) under explosions and impact are critical issues for structures, given that they may cause a progressive collapse and remarkably increase the number of potential victims. One of the best ways to deal with this issue is to provide values of safe protective distance (SPD) for the structural members to verify, so that the amount of damage (probability of exceedance low damage) cannot exceed a specified target. Such an approach takes the form of the so-called safe scaled distance (SSD), which can be calculated for general structural members but requires dedicated and expensive studies. This paper presents an improved calculation method, based on structural reliability analysis, to evaluate the minimum SSD for steel columns under dynamic blast loads. An explicit finite element (FE) approach is used with the Monte Carlo simulation (MCS) method to obtain the SSD, as a result of damage probability. The uncertainties associated with blast and material properties are considered using statistical distributions. A parametric study is thus carried out to obtain curves of probability of low damage for a range of H-shaped steel columns with different size and boundaries. Finally, SSD values are detected and used as an extensive databank to propose a practical empirical formulation for evaluating the SSD of blast loaded steel columns with good level of accuracy and high calculation efficiency. Keywords: safe protective distance; safe scaled distance; steel beam-column; dynamic blast load; reliability analysis; Monte Carlo simulation 1. Introduction Crowded buildings such as schools, shopping venues, stadiums, transportation in- frastructure and public locations are well-known attractive targets for terrorist attacks. The disruption of such places has irreversible consequences, including severe casualties and fatalities and negative impact on society [1]. There is a need to identify areas that may be potentially at risk and to take preventive measures to improve their safety and security. In this regard, securing the perimeter of structures or buildings using landscaping or barrier methods is one of the valid risk reduction options recommended in the litera- ture for protecting buildings against terrorist attacks, including vehicle-borne improvised explosive devices [2]. These secure barriers must be installed at the minimum required stand-off distance from a structure, in order to minimize the damage probability of primary structural elements and consequently the risk of progressive collapse. In order to design a blast-resistant building, the design engineer first has to determine blast loads on the build- ing and its structural components. To determine the characteristics and intensity of blast loading, the parameters for explosive charge weight (W) and stand-off distance (R) must be necessarily known. There are several formulas and graphs that can be used to determine blast load parameters, as a function of the scaled distance parameter (Z). The Z parameter, also known as R/W 1/3 [3], indicates that two charges with similar geometry, ambient Buildings 2021, 11, 606. https://doi.org/10.3390/buildings11120606 https://www.mdpi.com/journal/buildings

Welcome message from author
This document is posted to help you gain knowledge. Please leave a comment to let me know what you think about it! Share it to your friends and learn new things together.
Transcript
buildings
Article
An Efficient Reliability-Based Approach for Evaluating SafeScaled Distance of Steel Columns under Dynamic Blast Loads
Mohammad Momeni 1,2 , Chiara Bedon 3,* , Mohammad Ali Hadianfard 1 and Abdolhossein Baghlani 1
�����������������
Citation: Momeni, M.; Bedon, C.;
Hadianfard, M.A.; Baghlani, A. An
Efficient Reliability-Based Approach
for Evaluating Safe Scaled Distance of
Steel Columns under Dynamic Blast
Loads. Buildings 2021, 11, 606.
https://doi.org/10.3390/
buildings11120606
Academic Editor: Paulo Santos
Received: 21 October 2021
Accepted: 29 November 2021
Published: 2 December 2021
Publisher’s Note: MDPI stays neutral
with regard to jurisdictional claims in
published maps and institutional affil-
iations.
Copyright: © 2021 by the authors.
Licensee MDPI, Basel, Switzerland.
This article is an open access article
distributed under the terms and
conditions of the Creative Commons
Attribution (CC BY) license (https://
creativecommons.org/licenses/by/
4.0/).
1 Department of Civil and Environmental Engineering, Shiraz University of Technology,Shiraz 7155713876, Iran; [email protected] (M.M.); [email protected] (M.A.H.);[email protected] (A.B.)
2 Department of Civil Engineering, Shahrekord Branch, Islamic Azad University, Shahrekord 8813733395, Iran3 Department of Engineering and Architecture, University of Trieste, 34127 Trieste, Italy* Correspondence: [email protected]
Abstract: Damage to building load-bearing members (especially columns) under explosions andimpact are critical issues for structures, given that they may cause a progressive collapse andremarkably increase the number of potential victims. One of the best ways to deal with this issueis to provide values of safe protective distance (SPD) for the structural members to verify, so thatthe amount of damage (probability of exceedance low damage) cannot exceed a specified target.Such an approach takes the form of the so-called safe scaled distance (SSD), which can be calculatedfor general structural members but requires dedicated and expensive studies. This paper presentsan improved calculation method, based on structural reliability analysis, to evaluate the minimumSSD for steel columns under dynamic blast loads. An explicit finite element (FE) approach is usedwith the Monte Carlo simulation (MCS) method to obtain the SSD, as a result of damage probability.The uncertainties associated with blast and material properties are considered using statisticaldistributions. A parametric study is thus carried out to obtain curves of probability of low damage fora range of H-shaped steel columns with different size and boundaries. Finally, SSD values are detectedand used as an extensive databank to propose a practical empirical formulation for evaluating theSSD of blast loaded steel columns with good level of accuracy and high calculation efficiency.
Keywords: safe protective distance; safe scaled distance; steel beam-column; dynamic blast load;reliability analysis; Monte Carlo simulation
1. Introduction
Crowded buildings such as schools, shopping venues, stadiums, transportation in-frastructure and public locations are well-known attractive targets for terrorist attacks.The disruption of such places has irreversible consequences, including severe casualtiesand fatalities and negative impact on society [1]. There is a need to identify areas thatmay be potentially at risk and to take preventive measures to improve their safety andsecurity. In this regard, securing the perimeter of structures or buildings using landscapingor barrier methods is one of the valid risk reduction options recommended in the litera-ture for protecting buildings against terrorist attacks, including vehicle-borne improvisedexplosive devices [2]. These secure barriers must be installed at the minimum requiredstand-off distance from a structure, in order to minimize the damage probability of primarystructural elements and consequently the risk of progressive collapse. In order to design ablast-resistant building, the design engineer first has to determine blast loads on the build-ing and its structural components. To determine the characteristics and intensity of blastloading, the parameters for explosive charge weight (W) and stand-off distance (R) must benecessarily known. There are several formulas and graphs that can be used to determineblast load parameters, as a function of the scaled distance parameter (Z). The Z parameter,also known as R/W1/3 [3], indicates that two charges with similar geometry, ambient
Buildings 2021, 11, 606. https://doi.org/10.3390/buildings11120606 https://www.mdpi.com/journal/buildings
Buildings 2021, 11, 606 2 of 26
conditions, explosive composition, but different size (weight) will produce self-similarblast waves as far as their distances R = Z ×W1/3 are identical. A much more completediscussion on features and applicability of the scaling law is given in [4]. In [5], the scaleddistance parameter is used to assess the safety and resistance of structures under air blastloads. As an example, for un-strengthened buildings, an SSD of 4.46 m/kg1/3 is specifiedfrom suffering a damage of “approaching to destruction” [5,6]. The SSD parameter, in thiscontext, represents a guide to determine the explosive weight that can be used at a givendistance, without exceeding the safe limit states of the structure (allowable support rotationvalues or damage index, for low damage). It should be noted that the SSD parameter isderived so that probability of failure is lower than an acceptance criterion. The probabilityof failure, as explained later in Section 3, is a function of capacity and demand called statefunction. In some cases, the state function can be expressed mathematically, but in mostcases it does not have an explicit mathematical closed-form and must be defined by othermethods such as FE analysis. When the state function is defined in mathematical form, itis possible to calculate the SSD parameter directly, otherwise an iteration-based methodshould be used to meet the acceptance criterion (Section 4). The SSD values presented instandards and regulations are usually obtained from blast tests on simple structural modelsand the effects of structural configuration or material properties are usually disregarded.As such, guidelines can be used for a quick safety assessment of structures, but do notprovide clear damage scenarios [6]. Some studies have been performed to also investigatethe SPD and SSD of structural elements under blast loads.
The blast performance assessment of structural systems is one of the critical issues forresearch. Accordingly, the need of empirical but accurate tolls in support of design opti-mization is an ongoing challenge. Among others, Byfield and Paramasivam [7] developedan iterative method to establish the minimum SSD of Reinforced Concrete (RC) columnsfor a given charge weight, column geometry and material. The iterative process must be re-peated until the strength of the column is equal to the dynamic force in it. Thomas et al. [8]implemented MCS method for the reliability analysis of circular RC columns subjected tosequential vehicular impact and blast. Given that the stand-off distance has marked effectson reliability predictions, minimum SPD values have been proposed for selected configura-tions. Hadianfard and Malekpour [9] evaluated safe explosion distances of a steel columnwith IPBv220 and length of 3.6 m under different blast scenarios by utilizing the SingleDegree of Freedom (SDOF) and FE methods via MCS method. Zhai et al. [10] investigatedthe blast effects on reticulated domes, proposing a method to determine the SSD basedon the intersections of W-R charts and Pressure–Impulse (P–I) curves. Wu and Hao [6,11]numerically derived the SSD for masonry infilled RC frame structures. The presented SSDvalues for different damage levels (RC frame collapse, side wall collapse, front wall col-lapse and excessive damage) were compared with the corresponding estimates by the USDoD [5] and ASCE [12] technical documents. A simple approximate method was proposedby Dorofeev for unconfined hydrogen explosions in three hypothetical obstructed areaswith different congestion levels. Based on [13], a number of different safety distance rela-tionships were stipulated depending upon the receptor under consideration, comprisingstorage distances, process building distances and public building and traffic distances.
To provide a robust background and comprehensive feedback for civil engineeringapplications, experimental and theoretical investigations on the effects of blast loads onsteel structural members have been also reported in [14–17]. Bao and Li [18] focused onthe residual axial capacity of square RC columns, while the study in [19] was dedicatedto H-section steel columns. A number of numerical investigations used equivalent SDOFsystems and FE for primary members [16,20–32]. Besides, the uncertainty of input variablesfor blast load parameters and material properties (but also geometrical parameters andFE modelling errors [33]) can severely affect the predicted structural response. As such,probabilistic methods are preferred to support a more holistic risk-based approach [34–37].Several studies have been focused on the reliability analysis of selected structures, suchas RC buildings [38,39], steel structures [40], RC slabs [36,41], RC columns [35,42–44], RC
Buildings 2021, 11, 606 3 of 26
wall panels [33,45], RC beams [46], composite walls [47], masonry walls [48], profiled wallstructures [49], clamped aluminum plate [50] and steel columns [51,52], by consideringthe uncertainties of input variables related to material properties and blast load parame-ters. Stewart et al. explored the reliability analysis of structures under blast [33,35,43,44]and supported the definition of a general framework for quantitative probabilistic riskassessment of structures subjected to blast [53–56]. Most of those studies have been de-veloped based on MCS method along with SDOF, Multi Degree of Freedom (MDOF) andfull 3D FE models. In [52], a methodology based on structural reliability analysis usingMCS and explicit FE modelling (shell element formulation) was proposed for determiningthe damage probability of H-shape steel columns (IPBv 200 section) under various blastscenarios. It was shown that the time required in a probabilistic analysis for iterations of1000 and 300 can be expected to be about 100 and 30 h. Such a run time may be acceptablefor a single reliability analysis, but it is not suitable for SSD calculations that require atrial-and-error process with several reliability analyses. In this regard, a parametric analysiswas performed in [57] to capture the effect of several FE modelling techniques (based onsolid, shell or beam elements), blast intensity (medium and high levels) and supports(pinned or fixed ends), on damage evaluation assessment. It was proved that the beamformulations can offer good results for the calculation of the residual axial capacity of blastloaded steel columns, with high computational efficiency.
As mentioned above, recommending the minimum SSD is of high practical interest,especially for the design of structures in congested urban areas. Once SSD is known, thecorresponding SPD can be easily calculated as a function of SSD and W. Although the blastdynamic behavior of structures has been largely investigated, the SSD of axially preloadedcolumns has been rarely considered and, to date, no comprehensive studies have beenconducted. In this regard, this paper represents an effort toward the definition of a reliableand efficient methodology based on reliability analysis along with explicit FE approach(using beam element formulation) to determine the SPD and SSD for blast loaded steelcolumns. The proposed strategy, as shown, can be extended to different structural members(or assemblies) under the effect of a given explosion. In more detail, reliability analysesare carried out to obtain the curves of probability of low damage for a set of H-shapesteel columns with different cross sections (IPB180 to IPB500), lengths (2.8, 3.2, 3.6 and4.0 m) and boundary conditions (pinned or fixed ends), under different explosive chargeweights. Afterward, using the obtained curves of probability of low damage, the SSDare extracted for the selected configurations, to present a correlation between SSD andseveral input parameters (such as the explosive charge weight and the initial axial capacityof a given column) and derive some useful empirical formulas for practical design. Anillustrative calculation example is finally discussed, in order to highlight the applicabilityof the proposed equations for calculating SSD and SPD of steel columns under blast loads.
2. FE Numerical Analysis and Failure Assessment2.1. Steel Columns
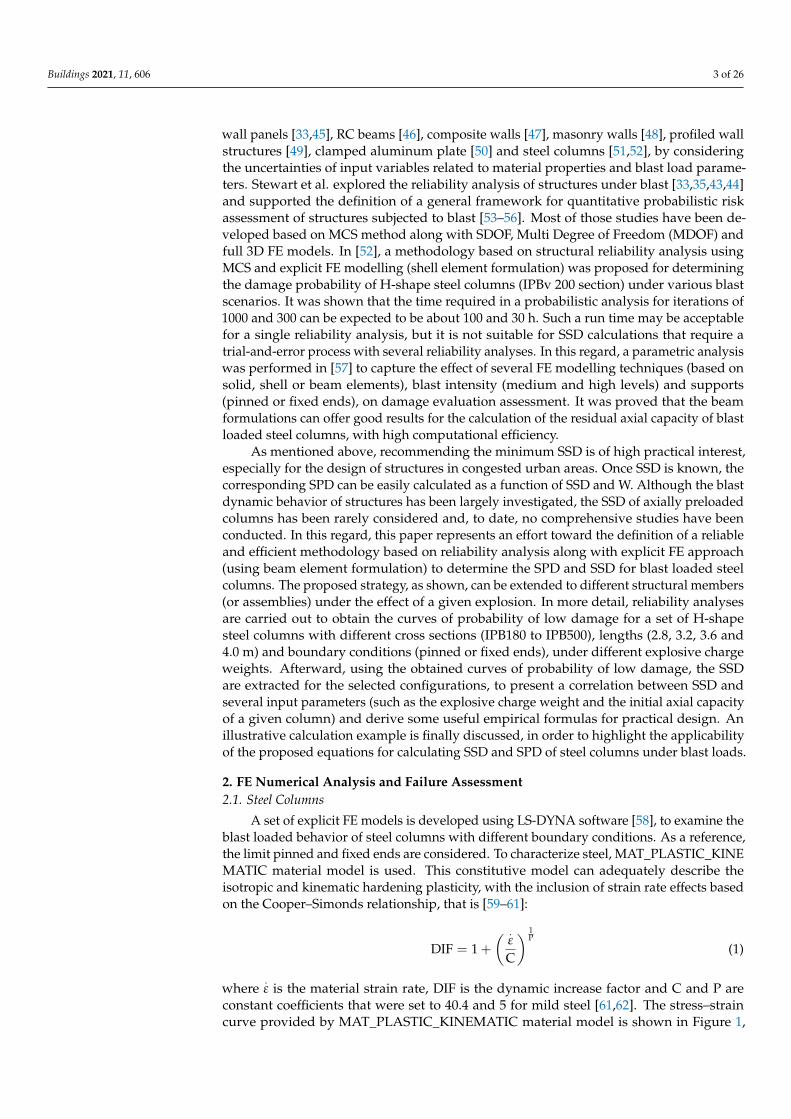
A set of explicit FE models is developed using LS-DYNA software [58], to examine theblast loaded behavior of steel columns with different boundary conditions. As a reference,the limit pinned and fixed ends are considered. To characterize steel, MAT_PLASTIC_KINEMATIC material model is used. This constitutive model can adequately describe theisotropic and kinematic hardening plasticity, with the inclusion of strain rate effects basedon the Cooper–Simonds relationship, that is [59–61]:
DIF = 1 +( .
ε
C
) 1P
(1)
where.ε is the material strain rate, DIF is the dynamic increase factor and C and P are
constant coefficients that were set to 40.4 and 5 for mild steel [61,62]. The stress–straincurve provided by MAT_PLASTIC_KINEMATIC material model is shown in Figure 1,
Buildings 2021, 11, 606 4 of 26
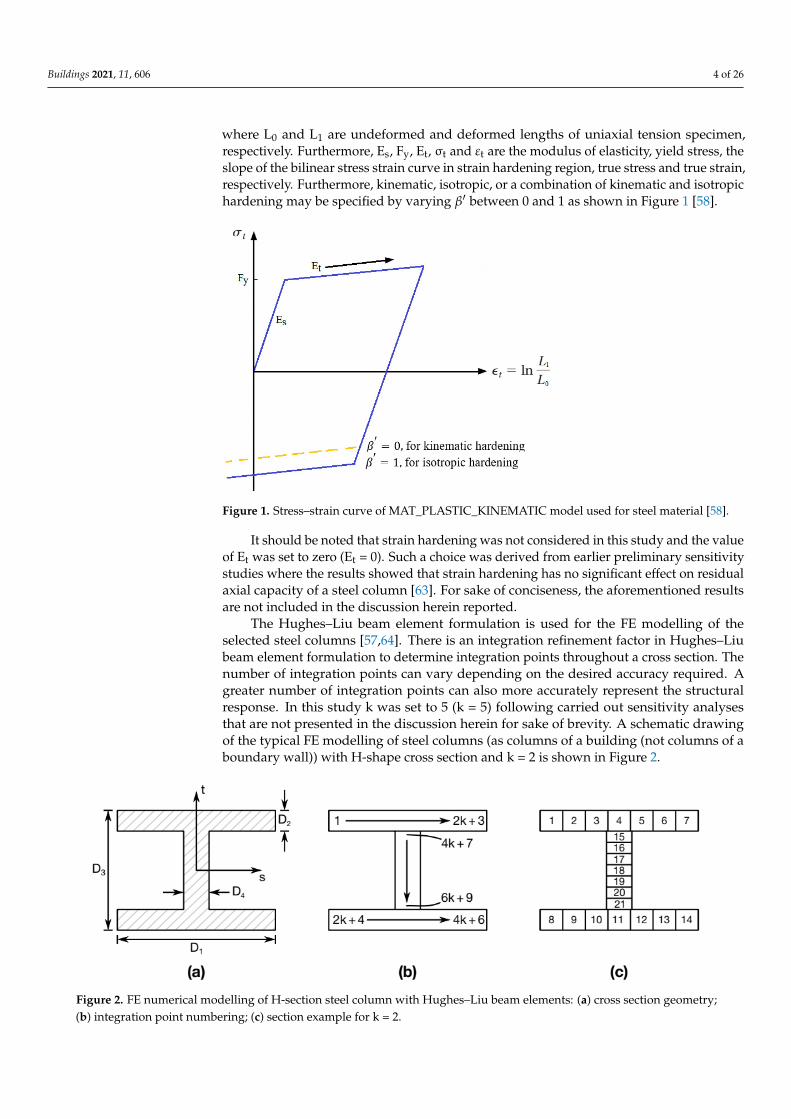
where L0 and L1 are undeformed and deformed lengths of uniaxial tension specimen,respectively. Furthermore, Es, Fy, Et, σt and εt are the modulus of elasticity, yield stress, theslope of the bilinear stress strain curve in strain hardening region, true stress and true strain,respectively. Furthermore, kinematic, isotropic, or a combination of kinematic and isotropichardening may be specified by varying β′ between 0 and 1 as shown in Figure 1 [58].
Buildings 2021, 11, x FOR PEER REVIEW 4 of 29
1P
DIF 1C
ε= +
(1)
where ε is the material strain rate, DIF is the dynamic increase factor and C and P are constant coefficients that were set to 40.4 and 5 for mild steel [61,62]. The stress–strain curve provided by MAT_PLASTIC_KINEMATIC material model is shown in Figure 1, where L0 and L1 are undeformed and deformed lengths of uniaxial tension specimen, re-spectively. Furthermore, Es, Fy, Et, σt and ɛt are the modulus of elasticity, yield stress, the slope of the bilinear stress strain curve in strain hardening region, true stress and true strain, respectively. Furthermore, kinematic, isotropic, or a combination of kinematic and isotropic hardening may be specified by varying ′β between 0 and 1 as shown in Figure 1 [58].
Figure 1. Stress–strain curve of MAT_PLASTIC_KINEMATIC model used for steel material [58].
It should be noted that strain hardening was not considered in this study and the value of Et was set to zero (Et = 0). Such a choice was derived from earlier preliminary sensitivity studies where the results showed that strain hardening has no significant effect on residual axial capacity of a steel column [63]. For sake of conciseness, the aforemen-tioned results are not included in the discussion herein reported.
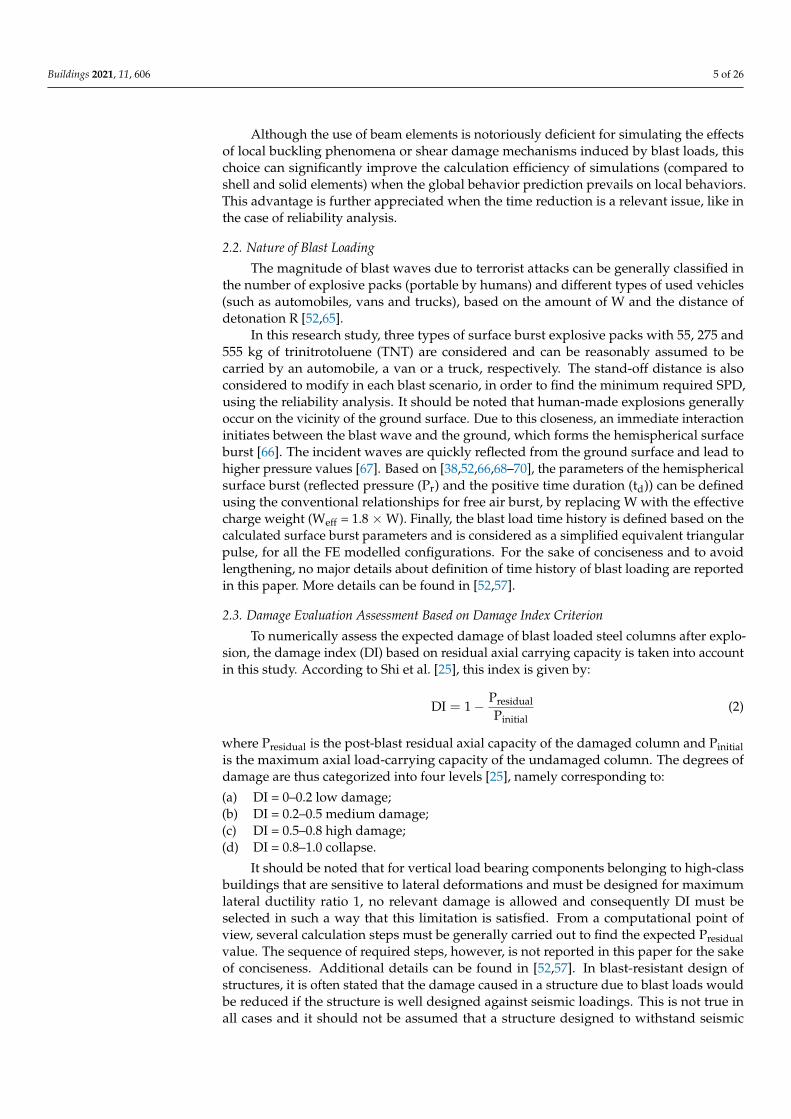
The Hughes–Liu beam element formulation is used for the FE modelling of the se-lected steel columns [57,64]. There is an integration refinement factor in Hughes–Liu beam element formulation to determine integration points throughout a cross section. The num-ber of integration points can vary depending on the desired accuracy required. A greater number of integration points can also more accurately represent the structural response. In this study k was set to 5 (k = 5) following carried out sensitivity analyses that are not presented in the discussion herein for sake of brevity. A schematic drawing of the typical FE modelling of steel columns (as columns of a building (not columns of a boundary wall)) with H-shape cross section and k = 2 is shown in Figure 2.
Figure 1. Stress–strain curve of MAT_PLASTIC_KINEMATIC model used for steel material [58].
It should be noted that strain hardening was not considered in this study and the valueof Et was set to zero (Et = 0). Such a choice was derived from earlier preliminary sensitivitystudies where the results showed that strain hardening has no significant effect on residualaxial capacity of a steel column [63]. For sake of conciseness, the aforementioned resultsare not included in the discussion herein reported.
The Hughes–Liu beam element formulation is used for the FE modelling of theselected steel columns [57,64]. There is an integration refinement factor in Hughes–Liubeam element formulation to determine integration points throughout a cross section. Thenumber of integration points can vary depending on the desired accuracy required. Agreater number of integration points can also more accurately represent the structuralresponse. In this study k was set to 5 (k = 5) following carried out sensitivity analysesthat are not presented in the discussion herein for sake of brevity. A schematic drawingof the typical FE modelling of steel columns (as columns of a building (not columns of aboundary wall)) with H-shape cross section and k = 2 is shown in Figure 2.
Buildings 2021, 11, x FOR PEER REVIEW 5 of 29
Figure 2. FE numerical modelling of H-section steel column with Hughes–Liu beam elements: (a) cross section geometry; (b) integration point numbering; (c) section example for k = 2.
Although the use of beam elements is notoriously deficient for simulating the effects of local buckling phenomena or shear damage mechanisms induced by blast loads, this choice can significantly improve the calculation efficiency of simulations (compared to shell and solid elements) when the global behavior prediction prevails on local behaviors. This advantage is further appreciated when the time reduction is a relevant issue, like in the case of reliability analysis.
2.2. Nature of Blast Loading The magnitude of blast waves due to terrorist attacks can be generally classified in
the number of explosive packs (portable by humans) and different types of used vehicles (such as automobiles, vans and trucks), based on the amount of W and the distance of detonation R [52,65].
In this research study, three types of surface burst explosive packs with 55, 275 and 555 kg of trinitrotoluene (TNT) are considered and can be reasonably assumed to be car-ried by an automobile, a van or a truck, respectively. The stand-off distance is also con-sidered to modify in each blast scenario, in order to find the minimum required SPD, us-ing the reliability analysis. It should be noted that human-made explosions generally oc-cur on the vicinity of the ground surface. Due to this closeness, an immediate interaction initiates between the blast wave and the ground, which forms the hemispherical surface burst [66]. The incident waves are quickly reflected from the ground surface and lead to higher pressure values [67]. Based on [38,52,66,68-70], the parameters of the hemispherical surface burst (reflected pressure (Pr) and the positive time duration (td)) can be defined using the conventional relationships for free air burst, by replacing W with the effective charge weight (Weff = 1.8 × W). Finally, the blast load time history is defined based on the calculated surface burst parameters and is considered as a simplified equivalent triangu-lar pulse, for all the FE modelled configurations. For the sake of conciseness and to avoid lengthening, no major details about definition of time history of blast loading are reported in this paper. More details can be found in [52,57].
2.3. Damage Evaluation Assessment Based on Damage Index Criterion To numerically assess the expected damage of blast loaded steel columns after explo-
sion, the damage index (DI) based on residual axial carrying capacity is taken into account in this study. According to Shi et al. [25], this index is given by:
= − residual
initial
PDI 1
P (2)
Figure 2. FE numerical modelling of H-section steel column with Hughes–Liu beam elements: (a) cross section geometry;(b) integration point numbering; (c) section example for k = 2.
Buildings 2021, 11, 606 5 of 26
Although the use of beam elements is notoriously deficient for simulating the effectsof local buckling phenomena or shear damage mechanisms induced by blast loads, thischoice can significantly improve the calculation efficiency of simulations (compared toshell and solid elements) when the global behavior prediction prevails on local behaviors.This advantage is further appreciated when the time reduction is a relevant issue, like inthe case of reliability analysis.
2.2. Nature of Blast Loading
The magnitude of blast waves due to terrorist attacks can be generally classified inthe number of explosive packs (portable by humans) and different types of used vehicles(such as automobiles, vans and trucks), based on the amount of W and the distance ofdetonation R [52,65].
In this research study, three types of surface burst explosive packs with 55, 275 and555 kg of trinitrotoluene (TNT) are considered and can be reasonably assumed to becarried by an automobile, a van or a truck, respectively. The stand-off distance is alsoconsidered to modify in each blast scenario, in order to find the minimum required SPD,using the reliability analysis. It should be noted that human-made explosions generallyoccur on the vicinity of the ground surface. Due to this closeness, an immediate interactioninitiates between the blast wave and the ground, which forms the hemispherical surfaceburst [66]. The incident waves are quickly reflected from the ground surface and lead tohigher pressure values [67]. Based on [38,52,66,68–70], the parameters of the hemisphericalsurface burst (reflected pressure (Pr) and the positive time duration (td)) can be definedusing the conventional relationships for free air burst, by replacing W with the effectivecharge weight (Weff = 1.8 ×W). Finally, the blast load time history is defined based on thecalculated surface burst parameters and is considered as a simplified equivalent triangularpulse, for all the FE modelled configurations. For the sake of conciseness and to avoidlengthening, no major details about definition of time history of blast loading are reportedin this paper. More details can be found in [52,57].
2.3. Damage Evaluation Assessment Based on Damage Index Criterion
To numerically assess the expected damage of blast loaded steel columns after explo-sion, the damage index (DI) based on residual axial carrying capacity is taken into accountin this study. According to Shi et al. [25], this index is given by:
DI = 1− PresidualPinitial
(2)
where Presidual is the post-blast residual axial capacity of the damaged column and Pinitialis the maximum axial load-carrying capacity of the undamaged column. The degrees ofdamage are thus categorized into four levels [25], namely corresponding to:
(a) DI = 0–0.2 low damage;(b) DI = 0.2–0.5 medium damage;(c) DI = 0.5–0.8 high damage;(d) DI = 0.8–1.0 collapse.
It should be noted that for vertical load bearing components belonging to high-classbuildings that are sensitive to lateral deformations and must be designed for maximumlateral ductility ratio 1, no relevant damage is allowed and consequently DI must beselected in such a way that this limitation is satisfied. From a computational point ofview, several calculation steps must be generally carried out to find the expected Presidualvalue. The sequence of required steps, however, is not reported in this paper for the sakeof conciseness. Additional details can be found in [52,57]. In blast-resistant design ofstructures, it is often stated that the damage caused in a structure due to blast loads wouldbe reduced if the structure is well designed against seismic loadings. This is not true inall cases and it should not be assumed that a structure designed to withstand seismic
Buildings 2021, 11, 606 6 of 26
loads is sufficient to resist the prescribed blast loading or prevent subsequent progressivecollapse. Despite the similarities between seismic and blast loadings, the global response ofbuildings subjected to blast loading is not usually critical. In the other words, for a structurethat is affected by an explosion, only its critical members (i.e., closer to detonation) areindividually assessed and designed by means of different methods (SDOF and FE models)and damage criteria (support rotation and damage index), while for building structuresunder the effects of earthquake loadings, the global deformations (inter-story drifts) mustbe evaluated based on the desired performance level (life safety) as the most importantresponse parameter [71,72]. In the design of structures under seismic and blast loading,the desirable features of design—that is, the provision for ductility in member responseand increasing the ability to redistribute extreme loads to lesser-loaded elements—must besatisfied.
3. Random Variables and Reliability Analysis Using MCS3.1. Random Variables
The variability of blast loading parameters is one of the key variables of the problemexplored herein. A number of documents [34,36,73] have reported constant coefficient ofvariation (COV) values for the variability of blast loads at various scaled distances. On theother hand, the observed statistics obtained from blast tests and empirical formulationsconfirm the basic variability. To overcome this major limit, additional studies were per-formed in [35,37,73]. Among others, the proposals by Hao et al. [35] and Netherton andStewart [37] are of general application and thus often used in the reliability analysis ofblast loaded structures. Although the cited strategies are different, the shared feature is theblast load variability, which is expressed in terms of Z. Furthermore, the same strategiesare validated for a wide range of scaled distance values (0.24 m/kg1/3 ≤ Z ≤ 40 m/kg1/3
in [35] and 0.59 m/kg1/3 ≤ Z ≤ 40 m/kg1/3 in [37]). As a final result of the formulationsprovided in [35] and [37], for a blast scenario (with specified charge weight and stand-offdistance) the mean, standard deviation (σ) and COV of wave parameters can be estimatedas a function of Z. In this paper, Pr and td are selected as random variables for blast loading.It is also assumed that the uncertainties are defined based on [35], that is:
log Pr(mean) = 3.651− 3.018× log Z + 0.1967× (log Z)2 + 0.8873× (log Z)3
−0.3795× (log Z)4 (3)
logσPr = 3.03− 3.533× log Z + 0.4534× (log Z)2 + 0.3248× (log Z)3
+0.07896× (log Z)4 (4)
log COVPr = −0.6239− 0.5726× log Z + 0.3203× (log Z)2 − 0.3538× (log Z)3
+0.2973× (log Z)4 (5)
log(td(mean)
w1/3 ) = −0.00307 + 1.2186× log Z− 0.5207× (log Z)2 − 0.2835× (log Z)3
+0.2132× (log Z)4 (6)
logσtd/w1/3 = −0.8433 + 1.0982× log Z− 0.8127× (log Z)2 + 0.4214× (log Z)3
−0.1046× (log Z)4 (7)
log COV(td/w1/3) = −0.8411− 0.1186× log Z− 0.2868× (log Z)2 + 0.6955× (log Z)3
−0.3141× (log Z)4 (8)
Equations (3)–(8), in more detail, represent the statistical characteristics (mean, σ and COV)of the Pr and td variables, as a function of Z, in the range of 0.24 m/kg1/3 ≤ Z≤ 40 m/kg1/3.It should be noted that the log in these equations is the logarithm to the base 10. Asreported in [35], the proposed formulas are valid only for an open field explosion and largeenough flat reflection surface. For a complex explosion scenario, such as an explosion in acomplex city environment, more significant variations are expected because of blast waveinteractions with surrounding structures.
Buildings 2021, 11, 606 7 of 26
It should be noted that td is the positive time duration of an idealized triangular blastloading history with sufficient accuracy instead an exponentially decayed loading historyof a real explosion. The assumption of using triangular pressure-time history for blastloading originates from past research studies, such as [35,37,38,42,43,55,74–79]. There, thevariation of the waveform coefficient for the positive pressure phase has been generallydisregarded for the reliability analysis, due to lack of information. This issue dependson blast load databanks that have been used to propose analytical formulas to calculatethe variation of blast load parameters as functions of scaled-distance. Among others, theparameter corresponding to the waveform coefficient has been considered probabilisticin [48,73], but the intended scaled distance was set between 1.62 and 2.78 m/kg1/3, and anexplicit relation was not presented for the calculation of statistical properties (i.e., mean andstandard deviation) of the waveform coefficient based on scaled distance. Although thelinear assumption of blast load imposes some unwanted approximation in the problem [35],such an assumption might cause an error up to 10% for the final results. In this paper,following former dedicated research [35,37,38,42,43,55,74–79], a linear function is thus usedto define the input blast.
Normal probability density function (PDF) is used for all input random parametersincluding loading parameters (Pr and td) and steel material properties (Fy and Es), seeTable 1 [35,42,80–82].
Table 1. Statistical properties of input random variables.
Random Variable Mean σ COV PDF
Pr Equation (3) Equation (4) Equation (5) Normaltd Equation (6) Equation (7) Equation (8) NormalFy 240 × 1.15 MPa 16.56 MPa 0.06 NormalEs 210 GPa 8.40 GPa 0.04 Normal
3.2. MCS Method
The MCS method is a well-known technique for estimating statistical properties ofstructural systems under stochastic uncertainties of input parameters [83,84] and is used inthis paper to carry out the reliability analyses. MCS is one of the simplest and relativelymost accurate methods which provides a feasible way to determine the reliability index,where the limit state function is more complicated. Most of the literature studies onthe reliability of structures under blast loading have been performed using MCS. Theprobability of failure based on MCS equals to Pf = Nf/N, where N is the number of totalsimulations and Nf is the number of trials for which limit state function, g(X) = r–q, fallsin the failure region or has negative value. In the definition of the state function, X is thevector of input random variables, r is the capacity or resistance, q is the demand or loading.The probability of failure can also be written as follows:
Pf = P[g(X) ≤ 0] =∫
g(X)≤0fX(X)dX =
∑Ni=1 IF(Xi)
N(9)
where fX(X) is the joint probability density function and IF is the failure indicator whichequals 1 if g(X) ≤ 0 and 0 if g(X) > 0.
The accuracy and precision of MCS in damage estimation directly depends on the Nvalue. The higher the N value, the more precise the MCS. On the other hand, by increasingthe number of simulations, the computational effort is also increased, which is the maindisadvantage of the MCS method. In this regard, there are many procedures in the literatureto find the minimum number of iterations required for MCS for a certain level of accuracy.The equation proposed by Broding et al. [85] is taken into account in this paper:
N >− ln(1−CL)
Pf(10)
Buildings 2021, 11, 606 8 of 26
where N is the minimum number of required random samples, Pf is the probability offailure and CL is the confidence level. In this paper, the value N = 300 is taken intoaccount for reliability analyses, which corresponds to 95% confidence (CL = 0.95) and 0.99reliability (Pf = 0.01).
4. Methodology of Calculating SSD Using Reliability4.1. SSD Definition
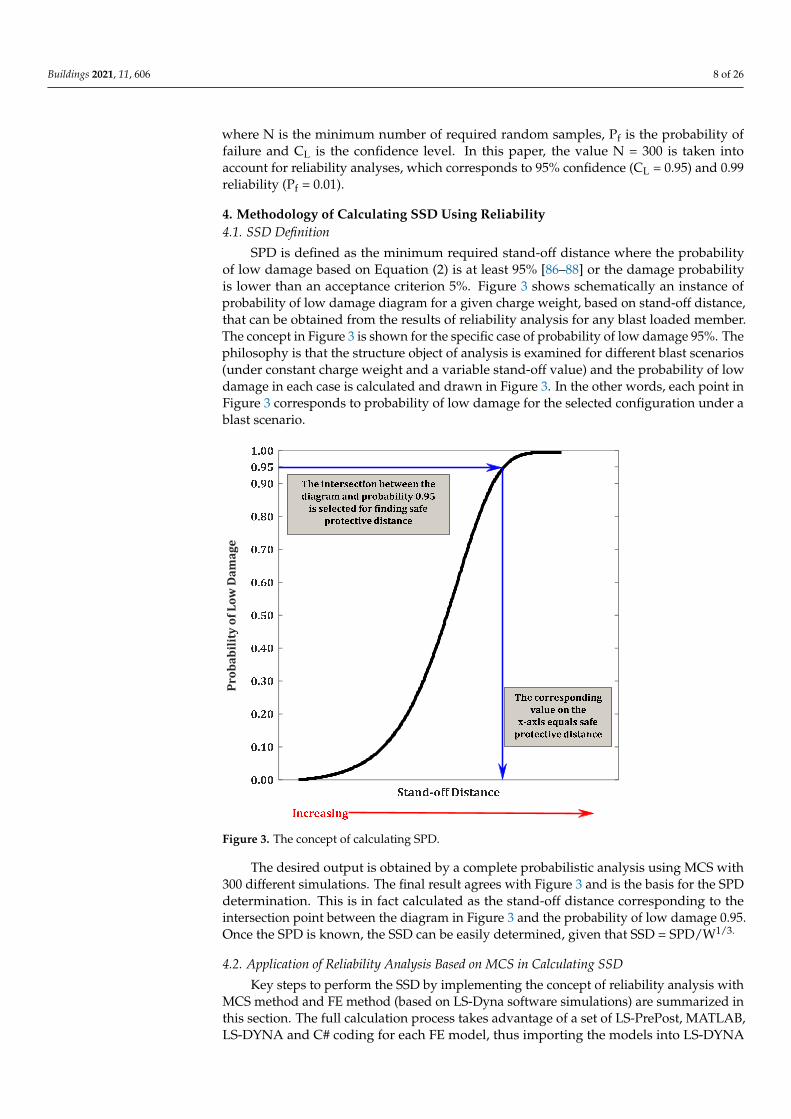
SPD is defined as the minimum required stand-off distance where the probabilityof low damage based on Equation (2) is at least 95% [86–88] or the damage probabilityis lower than an acceptance criterion 5%. Figure 3 shows schematically an instance ofprobability of low damage diagram for a given charge weight, based on stand-off distance,that can be obtained from the results of reliability analysis for any blast loaded member.The concept in Figure 3 is shown for the specific case of probability of low damage 95%. Thephilosophy is that the structure object of analysis is examined for different blast scenarios(under constant charge weight and a variable stand-off value) and the probability of lowdamage in each case is calculated and drawn in Figure 3. In the other words, each point inFigure 3 corresponds to probability of low damage for the selected configuration under ablast scenario.
Buildings 2021, 11, x FOR PEER REVIEW 9 of 29
Figure 3. The concept of calculating SPD.
4.2. Application of Reliability Analysis Based on MCS in Calculating SSD Key steps to perform the SSD by implementing the concept of reliability analysis with
MCS method and FE method (based on LS-Dyna software simulations) are summarized in this section. The full calculation process takes advantage of a set of LS-PrePost, MATLAB, LS-DYNA and C# coding for each FE model, thus importing the models into LS-DYNA and extracting and post-processing the results of interest. As shown in Figure 4, the general procedure can be basically described as follows: 1. Definition of boundary conditions, section properties and length for the examined
steel column. 2. Generation of the initial LS-DYNA model (input file) for the considered steel column.
At this stage, hypothetical (average) values are used for input random parameters. The same values are then updated in the following calculation steps, based on the real values of generated samples, for each random parameter. The aim of step 2 is only to create a .k file format for the column that will be object of the probabilistic analysis.
3. Selection of a blast scenario, by defining corresponding values for charge weight and stand-off distance.
4. Calculation of the mean values and standard deviations for the input random varia-bles. In this paper, the attention is focused on blast load parameters (Pr and td) and material properties (Fy and Es), according to Table 1.
5. Choice of appropriate probability density functions for the selected input random variables.
6. Generation of random variables (MATLAB code) according to the selected PDF (step 5).
7. Update of the initially generated LS-DYNA model (input file, see step 2), for the num-ber of generated random variables (step 6), using MATLAB.
8. Analysis of all the FE models (by automatically running LS-Dyna software with C# coding) and extracting all the damage indices (MATLAB).
9. Derivation of histogram, PDF and Cumulative Distribution Function (CDF) for the calculated DI (from step 8).
10. Calculation of the probability of low damage, or P[DI ≤ 0.2].
ProbabilityofLow
Dam
age
Figure 3. The concept of calculating SPD.
The desired output is obtained by a complete probabilistic analysis using MCS with300 different simulations. The final result agrees with Figure 3 and is the basis for the SPDdetermination. This is in fact calculated as the stand-off distance corresponding to theintersection point between the diagram in Figure 3 and the probability of low damage 0.95.Once the SPD is known, the SSD can be easily determined, given that SSD = SPD/W1/3.
4.2. Application of Reliability Analysis Based on MCS in Calculating SSD
Key steps to perform the SSD by implementing the concept of reliability analysis withMCS method and FE method (based on LS-Dyna software simulations) are summarized inthis section. The full calculation process takes advantage of a set of LS-PrePost, MATLAB,LS-DYNA and C# coding for each FE model, thus importing the models into LS-DYNA
Buildings 2021, 11, 606 9 of 26
and extracting and post-processing the results of interest. As shown in Figure 4, the generalprocedure can be basically described as follows:
1. Definition of boundary conditions, section properties and length for the examinedsteel column.
2. Generation of the initial LS-DYNA model (input file) for the considered steel column.At this stage, hypothetical (average) values are used for input random parameters.The same values are then updated in the following calculation steps, based on the realvalues of generated samples, for each random parameter. The aim of step 2 is only tocreate a .k file format for the column that will be object of the probabilistic analysis.
3. Selection of a blast scenario, by defining corresponding values for charge weight andstand-off distance.
4. Calculation of the mean values and standard deviations for the input random vari-ables. In this paper, the attention is focused on blast load parameters (Pr and td) andmaterial properties (Fy and Es), according to Table 1.
5. Choice of appropriate probability density functions for the selected input randomvariables.
6. Generation of random variables (MATLAB code) according to the selected PDF(step 5).
7. Update of the initially generated LS-DYNA model (input file, see step 2), for thenumber of generated random variables (step 6), using MATLAB.
8. Analysis of all the FE models (by automatically running LS-Dyna software with C#coding) and extracting all the damage indices (MATLAB).
9. Derivation of histogram, PDF and Cumulative Distribution Function (CDF) for thecalculated DI (from step 8).
10. Calculation of the probability of low damage, or P[DI ≤ 0.2].11. And in conclusion, a double check must be necessarily carried out, given that:
(a) If the probability of low damage from step 10 is approximately 95%, the selectedstand-off distance (step 3) coincides with SPD and consequently the requiredSSD can be calculated.
(b) Otherwise, if the probability of low damage is less or more than 95%, the selectedstand-off distance (step 3) must be increased or decreased, respectively. Thefull algorithm must be thus repeated (from step 3), until the probability of lowdamage reaches 95%.
4.3. Verification of Reliability Analysis Based on MCS Using Beam Element Formulation
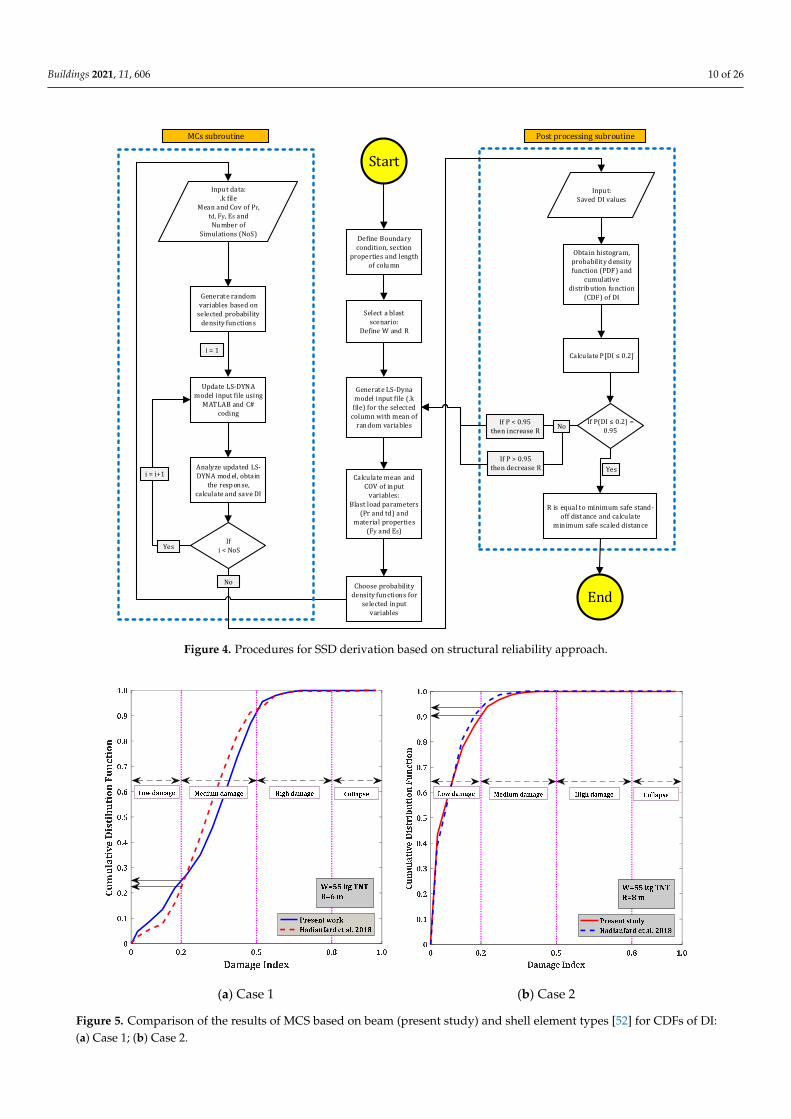
In order to verify the current MCS results based on beam element formulation, majoroutcomes from the reliability analyses presented in [52] are compared in this study. Inmore detail, the numerical results of two loading cases (Case 1 and Case 2) are considered,as obtained for a steel column with section type IPBv200, nominal length of 3.6 m andpinned ends. The column from [52] is made of ST37 steel, with density of 7850 kg/m3.Yield strength, elastic modulus, Poisson’s ratio and failure strain are set equal to 240 MPa,210 GPa, 0.3 and 0.2 respectively. In Case 1, the column is subjected to W = 55 kg of TNTand R = 6 m. In Case 2, the explosive charge weight and the stand-off distance are setto 55 kg and 8 m. For both configurations, the number of simulations is set to 300. Thecomparison of past [52] and current numerical results is shown in Figure 5a,b, for Cases 1and 2, respectively, in terms of CDFs for DI.
Buildings 2021, 11, 606 10 of 26
Buildings 2021, 11, x FOR PEER REVIEW 10 of 29
11. And in conclusion, a double check must be necessarily carried out, given that: (a) If the probability of low damage from step 10 is approximately 95%, the selected
stand-off distance (step 3) coincides with SPD and consequently the required SSD can be calculated.
(b) Otherwise, if the probability of low damage is less or more than 95%, the se-lected stand-off distance (step 3) must be increased or decreased, respectively. The full algorithm must be thus repeated (from step 3), until the probability of low damage reaches 95%.
Define Boundary condition, section properties and lengthof colu mnSelect a blast scenario: Define W and R
Generate LS-Dyna model input file (.k file) for the selected column with mean of random variables
Calcu late mean and COV of in put variables:Blast load parameters (Pr and td) and material properties (Fy and Es)
Inpu t data:.k fileMean and Cov of Pr, td, Fy, Es andNu mber of Simulations (NoS)
Generate random variables based on selected probability density fun ction s
Update LS-DYNA model input file using MATLAB and C# coding
Choose probability density functions for selected in put variables
Analyze updated LS-DYNA mod el, obtain the resp onse, calculate and save DI
i = 1
If i < NoS
i = i+1
MCs subroutine
Yes
Inpu t:Saved DI values
Obtain histogram, probability d ensity function (PDF) and cumulative distrib ution fu nction (CDF) of DI
Calcu late P[DI ≤ 0.2]
If P(DI ≤ 0.2) = 0.95If P > 0.95then decrease RIf P < 0.95then increase R
R is equal to minimum safe stand-off distance and calcu late minimum safe scaled distance
Post processing subroutineStart
EndNo
YesNo
Figure 4. Procedures for SSD derivation based on structural reliability approach.
4.3. Verification of Reliability Analysis Based on MCS Using Beam Element Formulation In order to verify the current MCS results based on beam element formulation, major
outcomes from the reliability analyses presented in [52] are compared in this study. In more detail, the numerical results of two loading cases (Case 1 and Case 2) are considered, as obtained for a steel column with section type IPBv200, nominal length of 3.6 m and pinned ends. The column from [52] is made of ST37 steel, with density of 7850 kg/m3. Yield strength, elastic modulus, Poisson’s ratio and failure strain are set equal to 240 MPa, 210 GPa, 0.3 and 0.2 respectively. In Case 1, the column is subjected to W = 55 kg of TNT and R = 6 m. In Case 2, the explosive charge weight and the stand-off distance are set to 55 kg
Figure 4. Procedures for SSD derivation based on structural reliability approach.
Buildings 2021, 11, x FOR PEER REVIEW 11 of 29
and 8 m. For both configurations, the number of simulations is set to 300. The comparison of past [52] and current numerical results is shown in Figure 5a,b, for Cases 1 and 2, re-spectively, in terms of CDFs for DI.
(a) Case 1 (b) Case 2
Figure 5. Comparison of the results of MCS based on beam (present study) and shell element types [52] for CDFs of DI: (a) Case 1; (b) Case 2.
Based on Figure 5a,b, it can be clearly noticed that there is a rather close correlation between the collected results, even in the presence of different accuracy levels for the FE models in use (beam and shell elements, respectively). For Case 1, according to Figure 5a, the probabilities of low damage (DI < 0.2) are found to be 0.25 (present study) and 0.22 [52], with a scatter of 12%. In Case 2, see Figure 5b, the probabilities of low damage (DI < 0.2) are calculated at 0.90 (present study) and 0.93 [52], respectively, with a 3.22% scatter that further confirms the good agreement between the compared MCS results. In order to better clarify the performance of beam elements in probabilistic analysis, the required analysis durations for reliability analyses of the so-called Case 1 with beam and shell ele-ment types are thus presented in this paper. For beam elements, the typical required time was approximately 0.90 h for 300 MCS iterations. For shell elements [52], the required time was in the order of 30 h for the same number of iterations (that is, 33.33 times higher), which shows that implementing beam elements speeds up the procedure, especially in finding SPD and SSD values which need many separate reliability analyses.
4.4. Selected Columns Given the potential of beam element formulation, a set of H-section steel columns
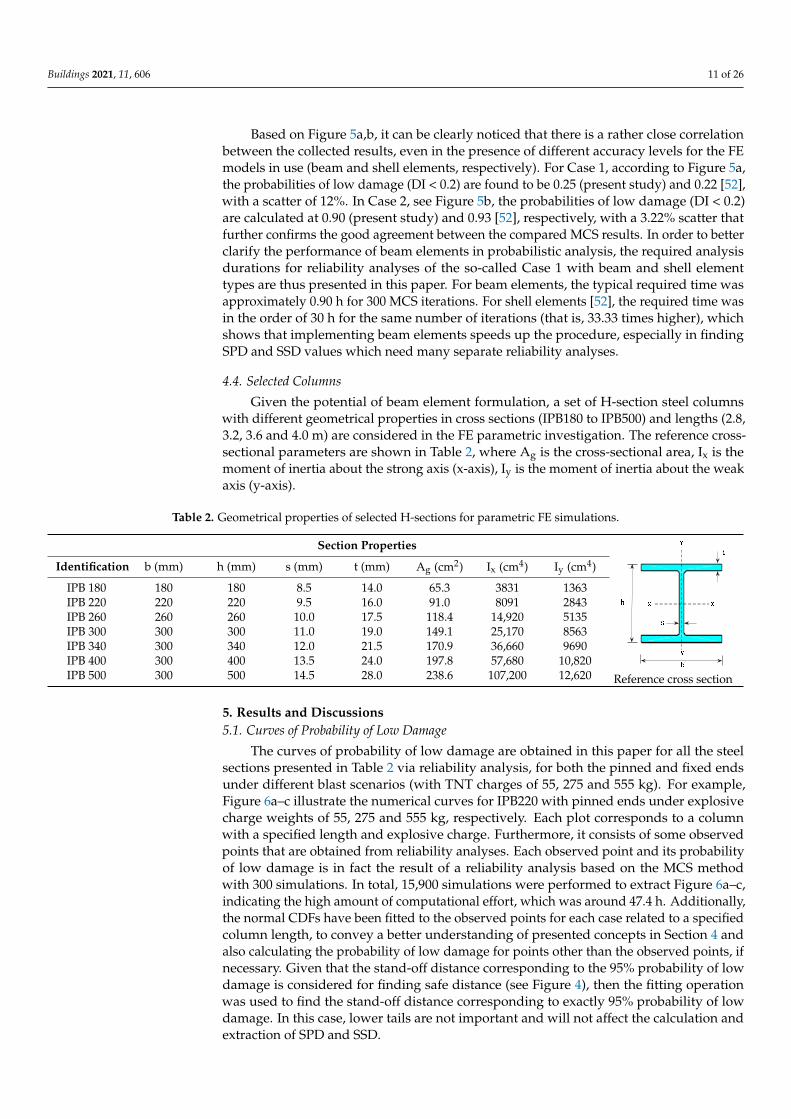
with different geometrical properties in cross sections (IPB180 to IPB500) and lengths (2.8, 3.2, 3.6 and 4.0 m) are considered in the FE parametric investigation. The reference cross-sectional parameters are shown in Table 2, where Ag is the cross-sectional area, Ix is the moment of inertia about the strong axis (x-axis), Iy is the moment of inertia about the weak axis (y-axis).
Figure 5. Comparison of the results of MCS based on beam (present study) and shell element types [52] for CDFs of DI:(a) Case 1; (b) Case 2.
Buildings 2021, 11, 606 11 of 26
Based on Figure 5a,b, it can be clearly noticed that there is a rather close correlationbetween the collected results, even in the presence of different accuracy levels for the FEmodels in use (beam and shell elements, respectively). For Case 1, according to Figure 5a,the probabilities of low damage (DI < 0.2) are found to be 0.25 (present study) and 0.22 [52],with a scatter of 12%. In Case 2, see Figure 5b, the probabilities of low damage (DI < 0.2)are calculated at 0.90 (present study) and 0.93 [52], respectively, with a 3.22% scatter thatfurther confirms the good agreement between the compared MCS results. In order to betterclarify the performance of beam elements in probabilistic analysis, the required analysisdurations for reliability analyses of the so-called Case 1 with beam and shell elementtypes are thus presented in this paper. For beam elements, the typical required time wasapproximately 0.90 h for 300 MCS iterations. For shell elements [52], the required time wasin the order of 30 h for the same number of iterations (that is, 33.33 times higher), whichshows that implementing beam elements speeds up the procedure, especially in findingSPD and SSD values which need many separate reliability analyses.
4.4. Selected Columns
Given the potential of beam element formulation, a set of H-section steel columnswith different geometrical properties in cross sections (IPB180 to IPB500) and lengths (2.8,3.2, 3.6 and 4.0 m) are considered in the FE parametric investigation. The reference cross-sectional parameters are shown in Table 2, where Ag is the cross-sectional area, Ix is themoment of inertia about the strong axis (x-axis), Iy is the moment of inertia about the weakaxis (y-axis).
Table 2. Geometrical properties of selected H-sections for parametric FE simulations.
Section Properties
Buildings 2021, 11, x FOR PEER REVIEW 12 of 29
Table 2. Geometrical properties of selected H-sections for parametric FE simulations.
. Section Properties
Reference cross section
Identification b (mm) h (mm) s (mm) t (mm) Ag (cm2) Ix (cm4) Iy (cm4)
IPB 180 180 180 8.5 14.0 65.3 3831 1363
IPB 220 220 220 9.5 16.0 91.0 8091 2843
IPB 260 260 260 10.0 17.5 118.4 14920 5135
IPB 300 300 300 11.0 19.0 149.1 25170 8563
IPB 340 300 340 12.0 21.5 170.9 36660 9690
IPB 400 300 400 13.5 24.0 197.8 57680 10820
IPB 500 300 500 14.5 28.0 238.6 107200 12620
5. Results and Discussions 5.1. Curves of Probability of Low Damage
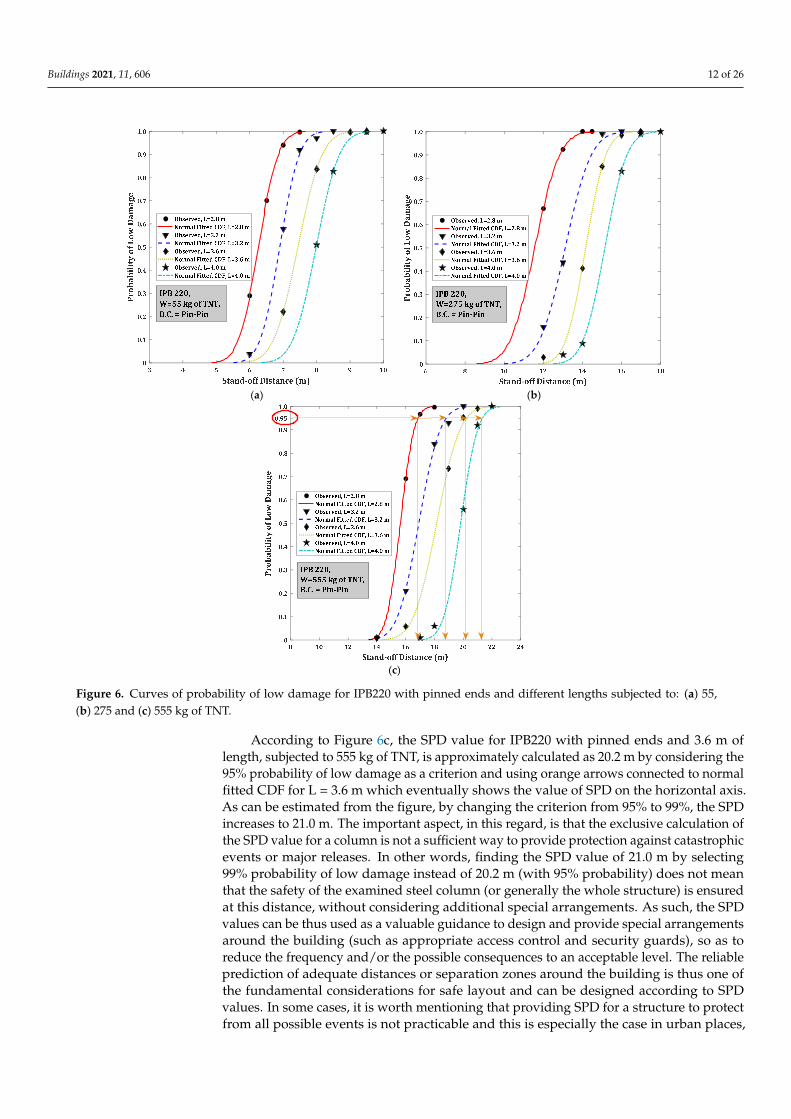
The curves of probability of low damage are obtained in this paper for all the steel sections presented in Table 2 via reliability analysis, for both the pinned and fixed ends under different blast scenarios (with TNT charges of 55, 275 and 555 kg). For example, Figure 6a–c illustrate the numerical curves for IPB220 with pinned ends under explosive charge weights of 55, 275 and 555 kg, respectively. Each plot corresponds to a column with a specified length and explosive charge. Furthermore, it consists of some observed points that are obtained from reliability analyses. Each observed point and its probability of low damage is in fact the result of a reliability analysis based on the MCS method with 300 simulations. In total, 15,900 simulations were performed to extract Figures 6a–c, indicat-ing the high amount of computational effort, which was around 47.4 h. Additionally, the normal CDFs have been fitted to the observed points for each case related to a specified column length, to convey a better understanding of presented concepts in Section 4 and also calculating the probability of low damage for points other than the observed points, if necessary. Given that the stand-off distance corresponding to the 95% probability of low damage is considered for finding safe distance (see Figure 4), then the fitting operation was used to find the stand-off distance corresponding to exactly 95% probability of low damage. In this case, lower tails are not important and will not affect the calculation and extraction of SPD and SSD.
Reference cross section
Identification b (mm) h (mm) s (mm) t (mm) Ag (cm2) Ix (cm4) Iy (cm4)
IPB 180 180 180 8.5 14.0 65.3 3831 1363IPB 220 220 220 9.5 16.0 91.0 8091 2843IPB 260 260 260 10.0 17.5 118.4 14,920 5135IPB 300 300 300 11.0 19.0 149.1 25,170 8563IPB 340 300 340 12.0 21.5 170.9 36,660 9690IPB 400 300 400 13.5 24.0 197.8 57,680 10,820IPB 500 300 500 14.5 28.0 238.6 107,200 12,620
5. Results and Discussions5.1. Curves of Probability of Low Damage
The curves of probability of low damage are obtained in this paper for all the steelsections presented in Table 2 via reliability analysis, for both the pinned and fixed endsunder different blast scenarios (with TNT charges of 55, 275 and 555 kg). For example,Figure 6a–c illustrate the numerical curves for IPB220 with pinned ends under explosivecharge weights of 55, 275 and 555 kg, respectively. Each plot corresponds to a columnwith a specified length and explosive charge. Furthermore, it consists of some observedpoints that are obtained from reliability analyses. Each observed point and its probabilityof low damage is in fact the result of a reliability analysis based on the MCS methodwith 300 simulations. In total, 15,900 simulations were performed to extract Figure 6a–c,indicating the high amount of computational effort, which was around 47.4 h. Additionally,the normal CDFs have been fitted to the observed points for each case related to a specifiedcolumn length, to convey a better understanding of presented concepts in Section 4 andalso calculating the probability of low damage for points other than the observed points, ifnecessary. Given that the stand-off distance corresponding to the 95% probability of lowdamage is considered for finding safe distance (see Figure 4), then the fitting operationwas used to find the stand-off distance corresponding to exactly 95% probability of lowdamage. In this case, lower tails are not important and will not affect the calculation andextraction of SPD and SSD.
Buildings 2021, 11, 606 12 of 26Buildings 2021, 11, x FOR PEER REVIEW 13 of 29
(a) (b)
(c)
Figure 6. Curves of probability of low damage for IPB220 with pinned ends and different lengths subjected to: (a) 55, (b) 275 and (c) 555 kg of TNT.
According to Figure 6c, the SPD value for IPB220 with pinned ends and 3.6 m of length, subjected to 555 kg of TNT, is approximately calculated as 20.2 m by considering the 95% probability of low damage as a criterion and using orange arrows connected to normal fitted CDF for L = 3.6 m which eventually shows the value of SPD on the horizontal axis. As can be estimated from the figure, by changing the criterion from 95% to 99%, the SPD increases to 21.0 m. The important aspect, in this regard, is that the exclusive calcu-lation of the SPD value for a column is not a sufficient way to provide protection against catastrophic events or major releases. In other words, finding the SPD value of 21.0 m by selecting 99% probability of low damage instead of 20.2 m (with 95% probability) does not mean that the safety of the examined steel column (or generally the whole structure) is ensured at this distance, without considering additional special arrangements. As such, the SPD values can be thus used as a valuable guidance to design and provide special
Figure 6. Curves of probability of low damage for IPB220 with pinned ends and different lengths subjected to: (a) 55,(b) 275 and (c) 555 kg of TNT.
According to Figure 6c, the SPD value for IPB220 with pinned ends and 3.6 m oflength, subjected to 555 kg of TNT, is approximately calculated as 20.2 m by considering the95% probability of low damage as a criterion and using orange arrows connected to normalfitted CDF for L = 3.6 m which eventually shows the value of SPD on the horizontal axis.As can be estimated from the figure, by changing the criterion from 95% to 99%, the SPDincreases to 21.0 m. The important aspect, in this regard, is that the exclusive calculation ofthe SPD value for a column is not a sufficient way to provide protection against catastrophicevents or major releases. In other words, finding the SPD value of 21.0 m by selecting99% probability of low damage instead of 20.2 m (with 95% probability) does not meanthat the safety of the examined steel column (or generally the whole structure) is ensuredat this distance, without considering additional special arrangements. As such, the SPDvalues can be thus used as a valuable guidance to design and provide special arrangementsaround the building (such as appropriate access control and security guards), so as toreduce the frequency and/or the possible consequences to an acceptable level. The reliableprediction of adequate distances or separation zones around the building is thus one ofthe fundamental considerations for safe layout and can be designed according to SPDvalues. In some cases, it is worth mentioning that providing SPD for a structure to protectfrom all possible events is not practicable and this is especially the case in urban places,
Buildings 2021, 11, 606 13 of 26
due to the lack of sufficient space between buildings and access roads. The assessment ofthe frequency of the expected event and its potential consequences is thus necessary tounderstand which risks can be reasonably mitigated by an SPD. For cases in which theobtained SPD value is too large, of course, additional mitigating or prevention measuresshould be considered. In a nutshell, the 95% criterion is internationally recognized torepresent a rational choice for finding practical SPD that causes no serious damage forthe structure (if special arrangements are provided) and the designer’s judgment alongwith SPD values should lead to better decisions for ensuring safety of the structure undersuch events.
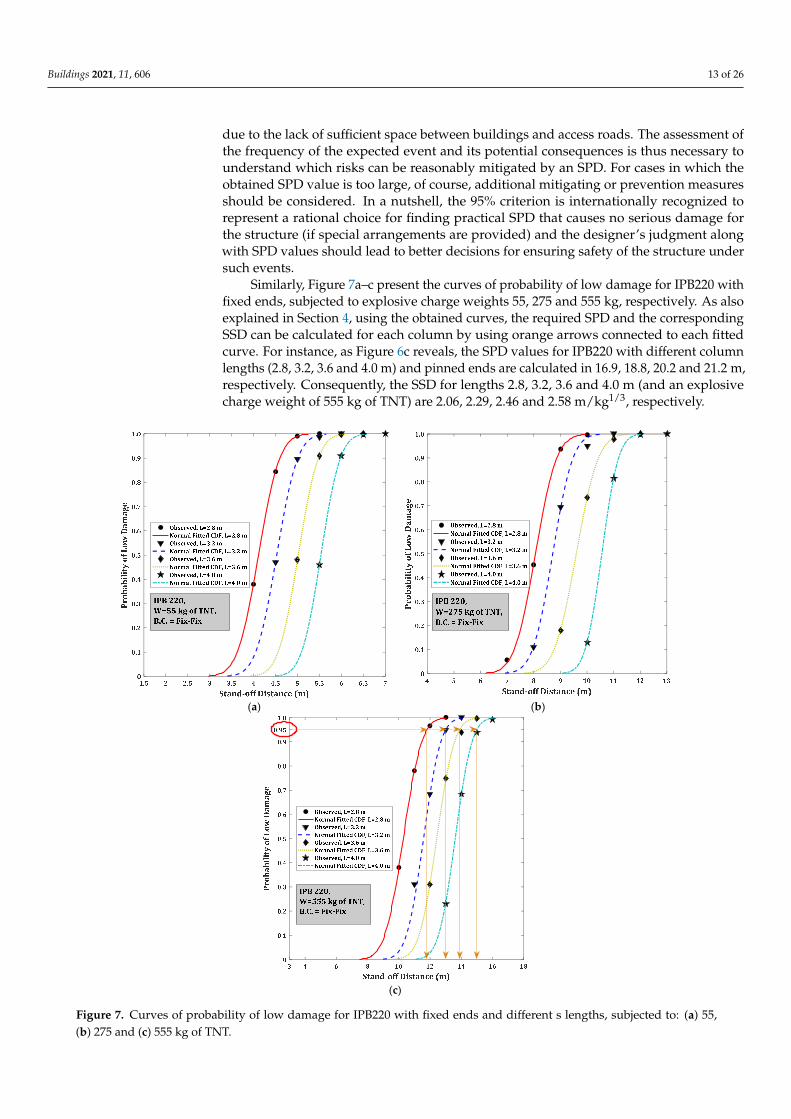
Similarly, Figure 7a–c present the curves of probability of low damage for IPB220 withfixed ends, subjected to explosive charge weights 55, 275 and 555 kg, respectively. As alsoexplained in Section 4, using the obtained curves, the required SPD and the correspondingSSD can be calculated for each column by using orange arrows connected to each fittedcurve. For instance, as Figure 6c reveals, the SPD values for IPB220 with different columnlengths (2.8, 3.2, 3.6 and 4.0 m) and pinned ends are calculated in 16.9, 18.8, 20.2 and 21.2 m,respectively. Consequently, the SSD for lengths 2.8, 3.2, 3.6 and 4.0 m (and an explosivecharge weight of 555 kg of TNT) are 2.06, 2.29, 2.46 and 2.58 m/kg1/3, respectively.
Buildings 2021, 11, x FOR PEER REVIEW 15 of 29
(a) (b)
(c)
Figure 7. Curves of probability of low damage for IPB220 with fixed ends and different s lengths, subjected to: (a) 55, (b) 275 and (c) 555 kg of TNT
It should be noted that the variability of stand-off distance is highly dependent on the position of the explosive, given that the location of a terrorist device is not a certain parameter. When the target is known, the minimum stand-off distance from a facility (building, bridge, etc.) is obtained from the knowledge of the site (roads, parking, etc.), the access control (security gates, bollards, etc.) and the perimeter security [78]. Generally, for a critical building that may represent a target for terrorist attacks with variable and portable explosive weights (i.e., by human and different vehicles), the minimum stand-off distance can be easily found using the proposed strategy. Such a minimum stand-off dis-tance can be thus used to provide appropriate access control and security guards around the building, thus ensuring that the risk of damage for the structural members in the first stage and the progressive collapse can be reduced.
Figure 7. Curves of probability of low damage for IPB220 with fixed ends and different s lengths, subjected to: (a) 55,(b) 275 and (c) 555 kg of TNT.
Buildings 2021, 11, 606 14 of 26
As shown, when increasing the column length, the SSD also increases. The reasonis that the longer the column length (and thus slenderness), the more it is exposed topremature buckling which reduces the overall residual axial load capacity and furtherresults in more severe damage and thus higher SPD value. In the case of fixed ends,according to Figure 7c, the SPD values are obtained in 11.8, 13.0, 13.9 and 15.0 m, whichcorrespond to SSD values of 1.44, 1.58, 1.69 and 1.83 m/kg1/3 for 555 kg of TNT and columnlengths of 2.8, 3.2, 3.6 and 4.0 m, respectively. As evidenced, by changing the supportcondition from pinned to fixed ends, the calculated SSD decreases. The actual boundarycondition has thus a significant effect on the final performances and results. Moreover,considering the fact that the end conditions for real columns are neither fully pinned norfixed, it is preferable for designers to take into account an actual value between the twolimit conditions of perfectly pinned or fixed column models, which ultimately leads tochoosing an SPD in between [89].
It should be noted that the variability of stand-off distance is highly dependent onthe position of the explosive, given that the location of a terrorist device is not a certainparameter. When the target is known, the minimum stand-off distance from a facility(building, bridge, etc.) is obtained from the knowledge of the site (roads, parking, etc.), theaccess control (security gates, bollards, etc.) and the perimeter security [78]. Generally, for acritical building that may represent a target for terrorist attacks with variable and portableexplosive weights (i.e., by human and different vehicles), the minimum stand-off distancecan be easily found using the proposed strategy. Such a minimum stand-off distance can bethus used to provide appropriate access control and security guards around the building,thus ensuring that the risk of damage for the structural members in the first stage and theprogressive collapse can be reduced.
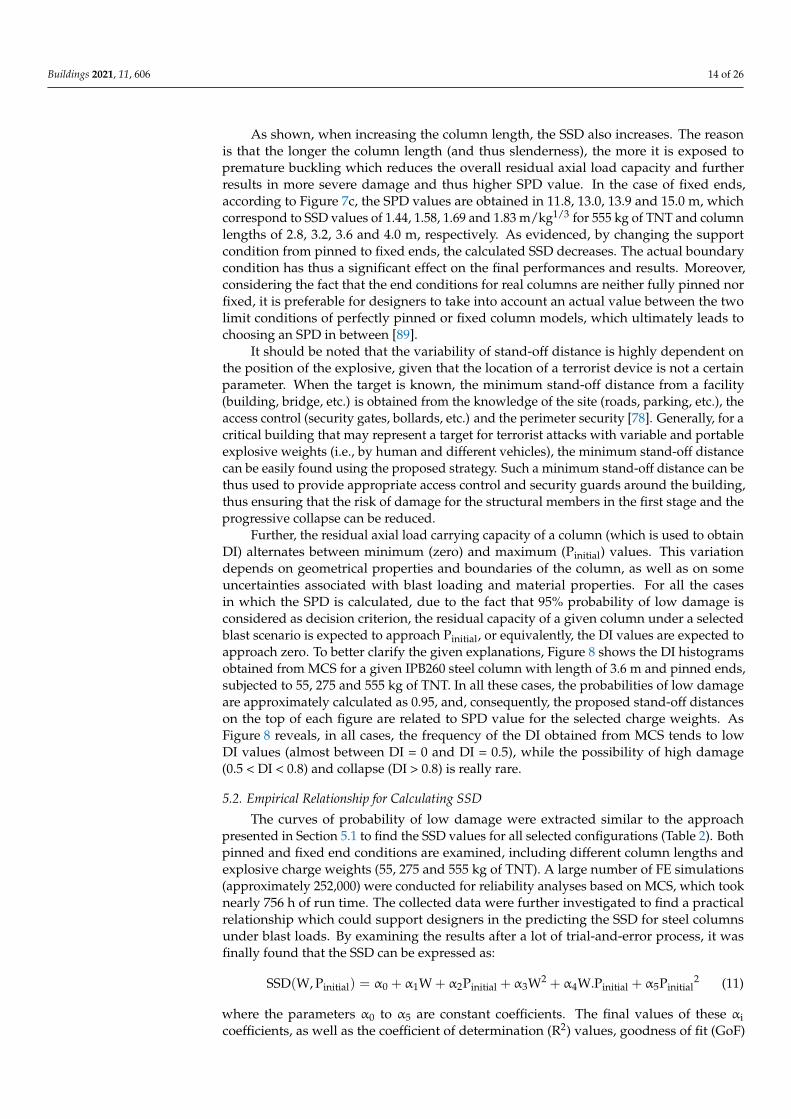
Further, the residual axial load carrying capacity of a column (which is used to obtainDI) alternates between minimum (zero) and maximum (Pinitial) values. This variationdepends on geometrical properties and boundaries of the column, as well as on someuncertainties associated with blast loading and material properties. For all the casesin which the SPD is calculated, due to the fact that 95% probability of low damage isconsidered as decision criterion, the residual capacity of a given column under a selectedblast scenario is expected to approach Pinitial, or equivalently, the DI values are expected toapproach zero. To better clarify the given explanations, Figure 8 shows the DI histogramsobtained from MCS for a given IPB260 steel column with length of 3.6 m and pinned ends,subjected to 55, 275 and 555 kg of TNT. In all these cases, the probabilities of low damageare approximately calculated as 0.95, and, consequently, the proposed stand-off distanceson the top of each figure are related to SPD value for the selected charge weights. AsFigure 8 reveals, in all cases, the frequency of the DI obtained from MCS tends to lowDI values (almost between DI = 0 and DI = 0.5), while the possibility of high damage(0.5 < DI < 0.8) and collapse (DI > 0.8) is really rare.
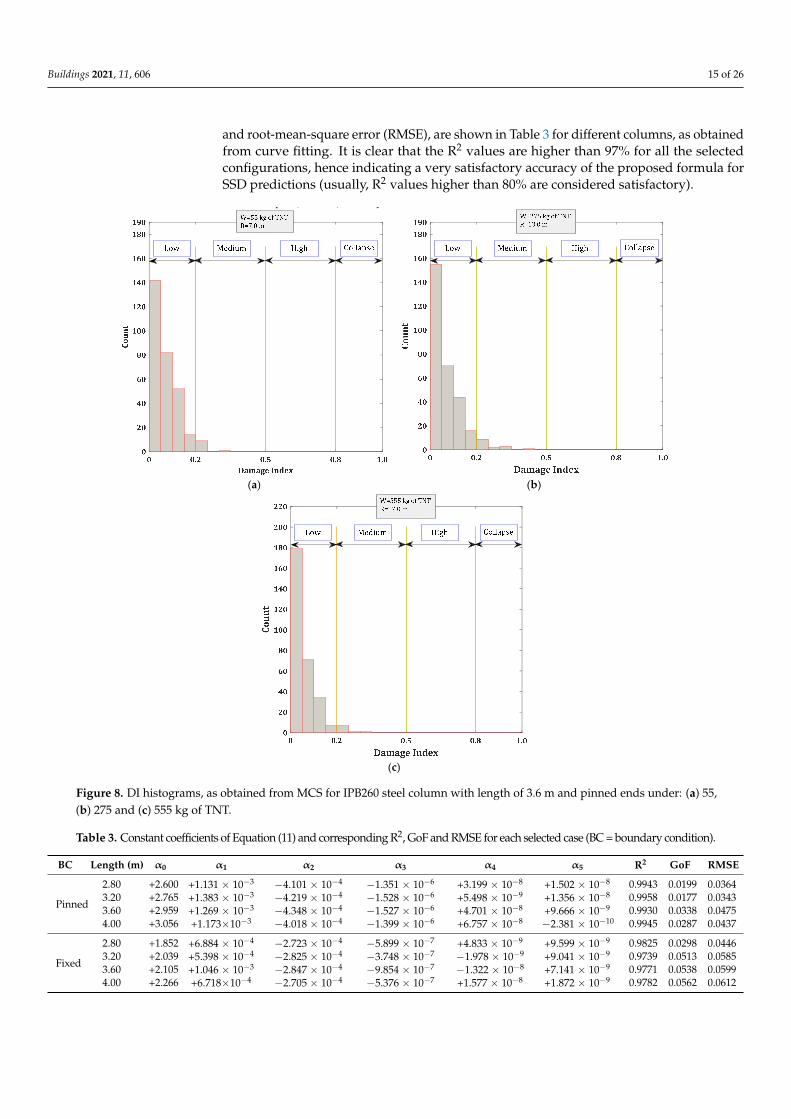
5.2. Empirical Relationship for Calculating SSD
The curves of probability of low damage were extracted similar to the approachpresented in Section 5.1 to find the SSD values for all selected configurations (Table 2). Bothpinned and fixed end conditions are examined, including different column lengths andexplosive charge weights (55, 275 and 555 kg of TNT). A large number of FE simulations(approximately 252,000) were conducted for reliability analyses based on MCS, which tooknearly 756 h of run time. The collected data were further investigated to find a practicalrelationship which could support designers in the predicting the SSD for steel columnsunder blast loads. By examining the results after a lot of trial-and-error process, it wasfinally found that the SSD can be expressed as:
SSD(W, Pinitial) = α0 + α1W + α2Pinitial + α3W2 + α4W.Pinitial + α5Pinitial2 (11)
where the parameters α0 to α5 are constant coefficients. The final values of these αicoefficients, as well as the coefficient of determination (R2) values, goodness of fit (GoF)
Buildings 2021, 11, 606 15 of 26
and root-mean-square error (RMSE), are shown in Table 3 for different columns, as obtainedfrom curve fitting. It is clear that the R2 values are higher than 97% for all the selectedconfigurations, hence indicating a very satisfactory accuracy of the proposed formula forSSD predictions (usually, R2 values higher than 80% are considered satisfactory).
Buildings 2021, 11, x FOR PEER REVIEW 16 of 29
Further, the residual axial load carrying capacity of a column (which is used to obtain DI) alternates between minimum (zero) and maximum (Pinitial) values. This variation de-pends on geometrical properties and boundaries of the column, as well as on some uncer-tainties associated with blast loading and material properties. For all the cases in which the SPD is calculated, due to the fact that 95% probability of low damage is considered as decision criterion, the residual capacity of a given column under a selected blast scenario is expected to approach Pinitial, or equivalently, the DI values are expected to approach zero. To better clarify the given explanations, Figure 8 shows the DI histograms obtained from MCS for a given IPB260 steel column with length of 3.6 m and pinned ends, subjected to 55, 275 and 555 kg of TNT. In all these cases, the probabilities of low damage are ap-proximately calculated as 0.95, and, consequently, the proposed stand-off distances on the top of each figure are related to SPD value for the selected charge weights. As Figure 8 reveals, in all cases, the frequency of the DI obtained from MCS tends to low DI values (almost between DI = 0 and DI = 0.5), while the possibility of high damage (0.5 < DI < 0.8) and collapse (DI > 0.8) is really rare.
(a) (b)
(c)
Figure 8. DI histograms, as obtained from MCS for IPB260 steel column with length of 3.6 m and pinned ends under: (a) 55,(b) 275 and (c) 555 kg of TNT.
Table 3. Constant coefficients of Equation (11) and corresponding R2, GoF and RMSE for each selected case (BC = boundary condition).
BC Length (m) α0 α1 α2 α3 α4 α5 R2 GoF RMSE
Pinned
2.80 +2.600 +1.131 × 10⁻³ −4.101 × 10⁻⁴ −1.351 × 10⁻⁶ +3.199 × 10⁻⁸ +1.502 × 10⁻⁸ 0.9943 0.0199 0.03643.20 +2.765 +1.383 × 10⁻³ −4.219 × 10⁻⁴ −1.528 × 10⁻⁶ +5.498 × 10⁻⁹ +1.356 × 10⁻⁸ 0.9958 0.0177 0.03433.60 +2.959 +1.269 × 10⁻³ −4.348 × 10⁻⁴ −1.527 × 10⁻⁶ +4.701 × 10⁻⁸ +9.666 × 10⁻⁹ 0.9930 0.0338 0.04754.00 +3.056 +1.173×10⁻³ −4.018 × 10⁻⁴ −1.399 × 10⁻⁶ +6.757 × 10⁻⁸ −2.381 × 10⁻¹⁰ 0.9945 0.0287 0.0437
Fixed
2.80 +1.852 +6.884 × 10⁻⁴ −2.723 × 10⁻⁴ −5.899 × 10⁻⁷ +4.833 × 10⁻⁹ +9.599 × 10⁻⁹ 0.9825 0.0298 0.04463.20 +2.039 +5.398 × 10⁻⁴ −2.825 × 10⁻⁴ −3.748 × 10⁻⁷ −1.978 × 10⁻⁹ +9.041 × 10⁻⁹ 0.9739 0.0513 0.05853.60 +2.105 +1.046 × 10⁻³ −2.847 × 10⁻⁴ −9.854 × 10⁻⁷ −1.322 × 10⁻⁸ +7.141 × 10⁻⁹ 0.9771 0.0538 0.05994.00 +2.266 +6.718×10⁻⁴ −2.705 × 10⁻⁴ −5.376 × 10⁻⁷ +1.577 × 10⁻⁸ +1.872 × 10⁻⁹ 0.9782 0.0562 0.0612
Buildings 2021, 11, 606 16 of 26
There are two conventional ways to calculate Pinitial: one based on FE modelling andanother based on the empirical relationships that are presented in several regulations.In this study, the second method is used, which is easier to apply, is efficient and canbe extended to each column, without the need of any complex calculation. The finalresult is that, even disregarding sophisticated FE methods, the Pinitial prediction can beused in Equation (11) and it can be consequently assessed (for a specific explosive chargeweight) whether the column is in a safe condition or not. According to the regulations,in more detail, Pinitial for members under compression without slender elements canbe calculated as:
Pinitial = Fcr ×Ag(keLrg
)max≤ 4.71
√EsFy
→ Fcr =
[0.658
FyFe
]Fy(
keLrg
)max
> 4.71√
EsFy
→ Fcr = 0.877 Fe
(12)
where Fcr is the critical stress due to flexural buckling and L, rg and ke are, respectively, thecolumn length, the radius of gyration and the effective length factor. For a column withpinned ends or fixed ends, it is assumed ke = 1 or ke = 0.5, respectively. Finally, Fe is theelastic buckling stress which can be calculated as:
Fe =π2Es(keLrg
)2 (13)
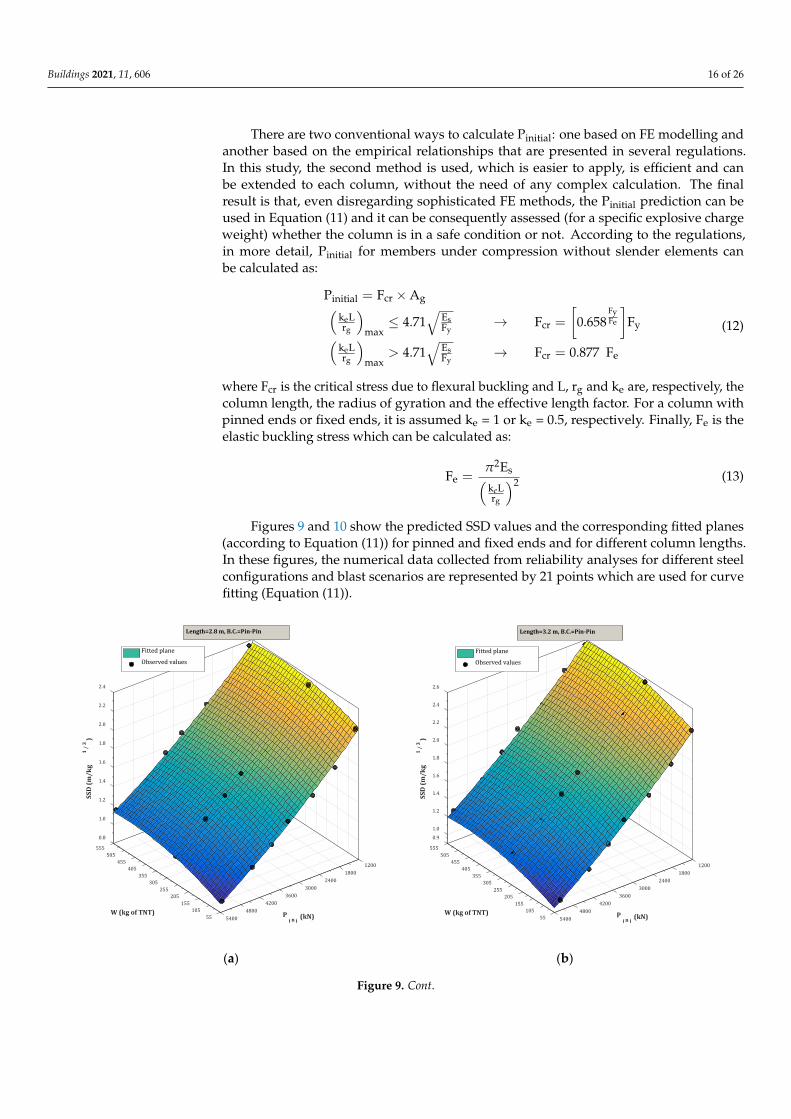
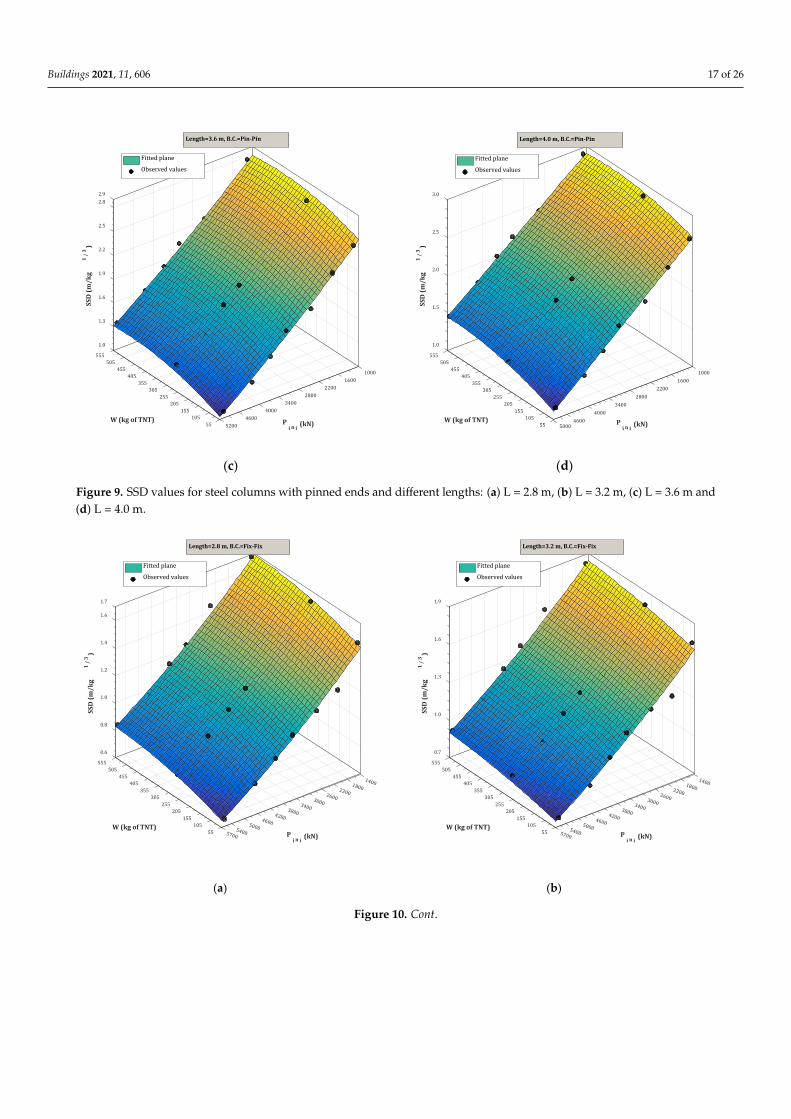
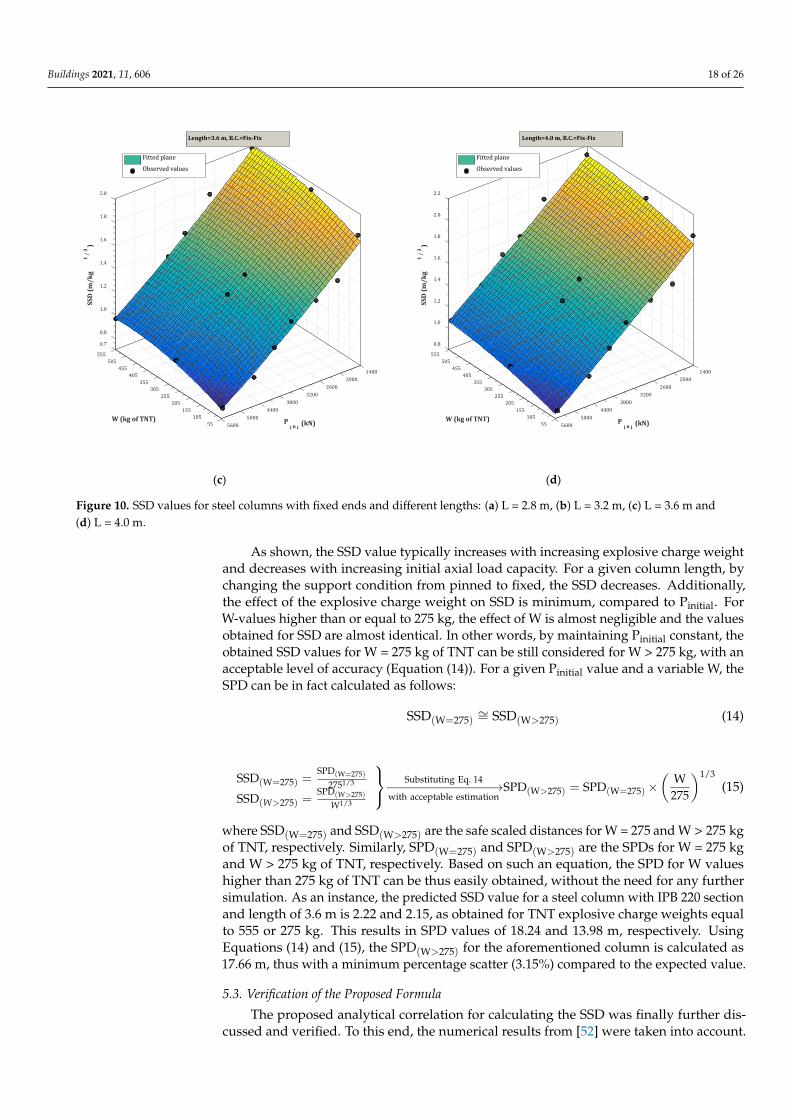
Figures 9 and 10 show the predicted SSD values and the corresponding fitted planes(according to Equation (11)) for pinned and fixed ends and for different column lengths.In these figures, the numerical data collected from reliability analyses for different steelconfigurations and blast scenarios are represented by 21 points which are used for curvefitting (Equation (11)).
Buildings 2021, 11, x FOR PEER REVIEW 18 of 29
y
e
initial cr g
F
Fe scr y
g ymax
e scr e
g ymax
P F A
k L E? .71 牋牋牋牋牋牋 牋牋牋 F 0.6
r F
k L E? .71 牋牋牋牋牋牋 牋牋牋 F 0.87
r F
= ×
≤ → =
> → =
(12)
where Fcr is the critical stress due to flexural buckling and L, rg and ke are, respectively, the column length, the radius of gyration and the effective length factor. For a column with pinned ends or fixed ends, it is assumed ke = 1 or ke = 0.5, respectively. Finally, Fe is the elastic buckling stress which can be calculated as:
2s
e 2
e
g
EF =
k Lr
π
(13)
Figures 9 and 10 show the predicted SSD values and the corresponding fitted planes (according to Equation (11)) for pinned and fixed ends and for different column lengths. In these figures, the numerical data collected from reliability analyses for different steel configurations and blast scenarios are represented by 21 points which are used for curve fitting (Equation (11)).
(a) (b)
0.8
555
1.0
1.2
505
1.4
455 1200
1.6
405
SSD
(m/k
g1
/3
)
1800
1.8
355
Length=2.8 m, B.C.=Pin-Pin
2.0
W (kg of TNT)
2400305
2.2
3000
Pi n i
(kN)
255
2.4
36002054200155
105 480055 5400
Fitted plane
Observed values
0.91.0
555
1.2
505
1.4
455
1.6
1200
1.8
405
SSD
(m/k
g1
/3
)
1800
2.0
355
Length=3.2 m, B.C.=Pin-Pin
W (kg of TNT)
2400
2.2
305
2.4
3000
Pi n i
(kN)
255
2.6
36002054200155
105 480055 5400
Fitted plane
Observed values
Figure 9. Cont.
Buildings 2021, 11, 606 17 of 26Buildings 2021, 11, x FOR PEER REVIEW 19 of 29
(c) (d)
Figure 9. SSD values for steel columns with pinned ends and different lengths: (a) L = 2.8 m, (b) L = 3.2 m, (c) L = 3.6 m and (d) L = 4.0 m
(a) (b)
1.0
555
1.3
505
1.6
455 1000
1.9
405
SSD
(m/k
g1
/3
)
1600
2.2
355
Length=3.6 m, B.C.=Pin-Pin
W (kg of TNT)
2200
2.5
3052800
Pi n i
(kN)
255
2.82.9
34002054000155
105 460055 5200
Fitted plane
Observed values
1.0
555
1.5
505455 1000
2.0
405
SSD
(m/k
g1
/3
)
1600355
Length=4.0 m, B.C.=Pin-Pin
2.5
W (kg of TNT)
2200305
Pi n i
(kN)
2800255
3.0
205 3400155 4000
105 460055 5000
Fitted plane
Observed values
0.6
555
0.8
505
1.0
455 1400405
1.2
1800
SSD
(m/k
g1
/3
)
2200355
1.4
Length=2.8 m, B.C.=Fix-Fix
2600
W (kg of TNT)
305 3000
1.6
Pi n i
(kN)
255 3400
1.7
3800205 4200155 46005000105540055 5700
Fitted plane
Observed values
0.7
555
1.0
505455 1400
1.3
405 1800
SSD
(m/k
g1
/3
)
2200355
Length=3.2 m, B.C.=Fix-Fix
1.6
2600
W (kg of TNT)
305 3000
Pi n i
(kN)
255 3400
1.9
3800205 4200155 46005000105540055 5700
Fitted plane
Observed values
Figure 9. SSD values for steel columns with pinned ends and different lengths: (a) L = 2.8 m, (b) L = 3.2 m, (c) L = 3.6 m and(d) L = 4.0 m.
Buildings 2021, 11, x FOR PEER REVIEW 19 of 29
(c) (d)
Figure 9. SSD values for steel columns with pinned ends and different lengths: (a) L = 2.8 m, (b) L = 3.2 m, (c) L = 3.6 m and (d) L = 4.0 m
(a) (b)
1.0
555
1.3
505
1.6
455 1000
1.9
405
SSD
(m/k
g1
/3
)
1600
2.2
355
Length=3.6 m, B.C.=Pin-Pin
W (kg of TNT)
2200
2.5
3052800
Pi n i
(kN)
255
2.82.9
34002054000155
105 460055 5200
Fitted plane
Observed values
1.0
555
1.5
505455 1000
2.0
405
SSD
(m/k
g1
/3
)
1600355
Length=4.0 m, B.C.=Pin-Pin
2.5
W (kg of TNT)
2200305
Pi n i
(kN)
2800255
3.0
205 3400155 4000
105 460055 5000
Fitted plane
Observed values
0.6
555
0.8
505
1.0
455 1400405
1.2
1800
SSD
(m/k
g1
/3
)
2200355
1.4
Length=2.8 m, B.C.=Fix-Fix
2600
W (kg of TNT)
305 3000
1.6
Pi n i
(kN)
255 3400
1.7
3800205 4200155 46005000105540055 5700
Fitted plane
Observed values
0.7
555
1.0
505455 1400
1.3
405 1800
SSD
(m/k
g1
/3
)
2200355
Length=3.2 m, B.C.=Fix-Fix
1.6
2600
W (kg of TNT)
305 3000
Pi n i
(kN)
255 3400
1.9
3800205 4200155 46005000105540055 5700
Fitted plane
Observed values
Figure 10. Cont.
Buildings 2021, 11, 606 18 of 26Buildings 2021, 11, x FOR PEER REVIEW 20 of 29
(c) (d)
Figure 10. SSD values for steel columns with fixed ends and different lengths: (a) L = 2.8 m, (b) L = 3.2 m, (c) L = 3.6 m and (d) L = 4.0 m
As shown, the SSD value typically increases with increasing explosive charge weight and decreases with increasing initial axial load capacity. For a given column length, by changing the support condition from pinned to fixed, the SSD decreases. Additionally, the effect of the explosive charge weight on SSD is minimum, compared to Pinitial. For W-values higher than or equal to 275 kg, the effect of W is almost negligible and the values obtained for SSD are almost identical. In other words, by maintaining Pinitial constant, the obtained SSD values for W = 275 kg of TNT can be still considered for W > 275 kg, with an acceptable level of accuracy (Equation (14)). For a given Pinitial value and a variable W, the SPD can be in fact calculated as follows:
( ) ( )W 275 W 275SSD SSD= >≅ (14)
( )( )
( )( )
( ) ( )
=
=
> =>
>
= → = ×
=
Substituting Eq. 14with acceptable estimation
W 2751/ 3
W 275 1/ 3
W 275 W 275W 275
W 275 1/ 3
SPDSSD W275 SPD SPD
SPD 275SSD
W
(15)
where W 275SSD and W 275SSD
are the safe scaled distances for W = 275 and W > 275 kg
of TNT, respectively. Similarly, W 275SPD and W 275SPD
are the SPDs for W = 275 kg
and W > 275 kg of TNT, respectively. Based on such an equation, the SPD for W values higher than 275 kg of TNT can be thus easily obtained, without the need for any further simulation. As an instance, the predicted SSD value for a steel column with IPB 220 section and length of 3.6 m is 2.22 and 2.15, as obtained for TNT explosive charge weights equal to 555 or 275 kg. This results in SPD values of 18.24 and 13.98 m, respectively. Using Equa-tions (14) and (15), the W 275SPD
for the aforementioned column is calculated as 17.66 m,
thus with a minimum percentage scatter (3.15%) compared to the expected value.
0.7
0.8
555
1.0
505
1.2
455 1400405
1.4
SSD
(m/k
g1
/3
)
2000355
1.6
Length=3.6 m, B.C.=Fix-Fix
W (kg of TNT)
2600305
1.8
3200
Pi n i
(kN)
255
2.0
38002054400155
105 500055 5600
Fitted plane
Observed values
0.8
555
1.0
505
1.2
455
1.4
1400405
1.6
SSD
(m/k
g1
/3
)
2000355
1.8
Length=4.0 m, B.C.=Fix-Fix
W (kg of TNT)
2600305
2.0
3200
Pi n i
(kN)
255
2.2
38002054400155
105 500055 5600
Fitted plane
Observed values
Figure 10. SSD values for steel columns with fixed ends and different lengths: (a) L = 2.8 m, (b) L = 3.2 m, (c) L = 3.6 m and(d) L = 4.0 m.
As shown, the SSD value typically increases with increasing explosive charge weightand decreases with increasing initial axial load capacity. For a given column length, bychanging the support condition from pinned to fixed, the SSD decreases. Additionally,the effect of the explosive charge weight on SSD is minimum, compared to Pinitial. ForW-values higher than or equal to 275 kg, the effect of W is almost negligible and the valuesobtained for SSD are almost identical. In other words, by maintaining Pinitial constant, theobtained SSD values for W = 275 kg of TNT can be still considered for W > 275 kg, with anacceptable level of accuracy (Equation (14)). For a given Pinitial value and a variable W, theSPD can be in fact calculated as follows:
SSD(W=275)∼= SSD(W>275) (14)
SSD(W=275) =SPD(W=275)
2751/3
SSD(W>275) =SPD(W>275)
W1/3
Substituting Eq. 14−−−−−−−−−−−−−−→with acceptable estimation
SPD(W>275) = SPD(W=275)×(
W275
)1/3(15)
where SSD(W=275) and SSD(W>275) are the safe scaled distances for W = 275 and W > 275 kgof TNT, respectively. Similarly, SPD(W=275) and SPD(W>275) are the SPDs for W = 275 kgand W > 275 kg of TNT, respectively. Based on such an equation, the SPD for W valueshigher than 275 kg of TNT can be thus easily obtained, without the need for any furthersimulation. As an instance, the predicted SSD value for a steel column with IPB 220 sectionand length of 3.6 m is 2.22 and 2.15, as obtained for TNT explosive charge weights equalto 555 or 275 kg. This results in SPD values of 18.24 and 13.98 m, respectively. UsingEquations (14) and (15), the SPD(W>275) for the aforementioned column is calculated as17.66 m, thus with a minimum percentage scatter (3.15%) compared to the expected value.
5.3. Verification of the Proposed Formula
The proposed analytical correlation for calculating the SSD was finally further dis-cussed and verified. To this end, the numerical results from [52] were taken into account.
Buildings 2021, 11, 606 19 of 26
For a pinned steel column with IPBv200 cross section (ST37 steel) and a total lengthof 3.6 m, subjected to different charge weights (55, 275 and 555 kg of TNT), the SPD valuesin [52] were predicted to be 8, 15 and 19 m, thus resulting in SSD values of 2.10, 2.30 and2.31 m/kg1/3, respectively. The input steel yield stress, density, elastic modulus and Pois-son’s ratio were set to 240 MPa, 7850 kg/m3, 210 GPa and 0.3, respectively. Furthermore,the geometrical characteristics of the resisting section (i.e., b, h, s and t, see Table 2), wereset to 206, 220, 15 and 25 mm, respectively. It should be noted that the IPBv200 cross sectionis different from the intended steel sections presented in Table 2.
In order to analytically predict the SSD value based on Equation (11), the initialaxial capacity of the column must first be calculated. Based on Equations (12) and (13),such a value can be estimated as 2518 kN. Consequently, by using Equation (14) and theconstant coefficients presented in Table 2 (pinned ends and column length of 3.6 m), thecorresponding SSD are easily calculated for selected explosive charges. The related valuesof SSD and SPD from Equations (14) and (15), together with those obtained from theprevious study [52], are thus compared in Table 4. As shown, the percentage scatter ∆ isalso calculated for each case, giving evidence of the accuracy of the proposed method.
Table 4. Verification results of the proposed formula, with respect to previous study [52].
W (kg of TNT)SSD Value (m/kg1/3) SPD (m)
Hadianfard et al. [52] Present Study ∆ (%) Hadianfard et al. [52] Present Study ∆ (%)
55 2.10 1.99 5.24 8 7.57 5.37275 2.30 2.18 5.21 15 14.17 5.53555 2.31 2.21 4.33 19 18.16 4.42
As Table 4 reveals, there is in fact a rather close correlation between the current pro-posed formula for the SSD calculation and the past numerical study reported in [52]. SSDvalues obtained by Equation (11) were equal to 1.99, 2.18 and 2.21 m/kg1/3, respectively,for explosive charge weights of 55, 275 and 555 kg, and thus corresponding to a negligiblescatter (5.24%, 5.21% and 4.33%) compared to the SSD values from [52].
6. Calculation Examples
In conclusion, to emphasize the applicability and usefulness of the proposed relation-ship, some calculation examples are presented. The objective of these examples is to findthe SPD and SSD of:
(i) A steel column with IPB 240 cross section and L = 3.4 m (Section 1), and(ii) A box shape steel column with L = 3.6 m and given geometrical properties in Table 5
(Section 2).
Table 5. Sectional properties of selected box section steel column for calculation examples.
Section Properties
Buildings 2021, 11, x FOR PEER REVIEW 21 of 29
5.3. Verification of the Proposed Formula The proposed analytical correlation for calculating the SSD was finally further dis-
cussed and verified. To this end, the numerical results from [52] were taken into account. For a pinned steel column with IPBv200 cross section (ST37 steel) and a total length of 3.6 m, subjected to different charge weights (55, 275 and 555 kg of TNT), the SPD values in [52] were predicted to be 8, 15 and 19 m, thus resulting in SSD values of 2.10, 2.30 and 2.31 m/kg1/3, respectively. The input steel yield stress, density, elastic modulus and Poisson’s ratio were set to 240 MPa, 7850 kg/m3, 210 GPa and 0.3, respectively. Furthermore, the geometrical characteristics of the resisting section (i.e., b, h, s and t, see Table 2), were set to 206, 220, 15 and 25 mm, respectively. It should be noted that the IPBv200 cross section is different from the intended steel sections presented in Table 2.
In order to analytically predict the SSD value based on Equation (11), the initial axial capacity of the column must first be calculated. Based on Equations (12) and (13), such a value can be estimated as 2518 kN. Consequently, by using Equation (14) and the constant coefficients presented in Table 2 (pinned ends and column length of 3.6 m), the corre-sponding SSD are easily calculated for selected explosive charges. The related values of SSD and SPD from Equations (14) and (15), together with those obtained from the previ-ous study [52], are thus compared in Table 4. As shown, the percentage scatter Δ is also calculated for each case, giving evidence of the accuracy of the proposed method.
Table 4. Verification results of the proposed formula, with respect to previous study [52].
W (kg of TNT))1/3SSD Value (m/kg SPD (m)
Hadianfard et al. [52] Present Study ∆ (%) Hadianfard et al. [52] Present Study ∆ (%) 55 2.10 1.99 5.24 8 7.57 5.37
275 2.30 2.18 5.21 15 14.17 5.53 555 2.31 2.21 4.33 19 18.16 4.42
As Table 4 reveals, there is in fact a rather close correlation between the current pro-posed formula for the SSD calculation and the past numerical study reported in [52]. SSD values obtained by Equation (11) were equal to 1.99, 2.18 and 2.21 m/kg1/3, respectively, for explosive charge weights of 55, 275 and 555 kg, and thus corresponding to a negligible scatter (5.24%, 5.21% and 4.33%) compared to the SSD values from [52].
6. Calculation Examples In conclusion, to emphasize the applicability and usefulness of the proposed rela-
tionship, some calculation examples are presented. The objective of these examples is to find the SPD and SSD of: (i). A steel column with IPB 240 cross section and L = 3.4 m (Section 1), and
(ii). A box shape steel column with L = 3.6 m and given geometrical properties in Table 5 (Section 2).
Table 5. Sectional properties of selected box section steel column for calculation examples.
Properties Section
section cross Reference
Identification (mm) b (mm) h (mm) f w(mm) )2(cm A )4(cm xI )4(cm yI
BOX 300 300 19.6 6.2 149.9 24986 15799
Section 1 differs from the intended columns presented in Table 2. Its length of 3.4 m,
in particular, is further modified and differs with considered lengths (i.e., 2.8, 3.2, 3.6 and
Identification b (mm) h (mm) f (mm) w(mm) A (cm2) Ix (cm4) Iy (cm4)
BOX 300 300 19.6 6.2 149.9 24,986 15,799
Section 1 differs from the intended columns presented in Table 2. Its length of 3.4 m,in particular, is further modified and differs with considered lengths (i.e., 2.8, 3.2, 3.6and 4.0 m) in the reliability analyses, in order to create a databank for the relationshipproposal. Section 2 is selected from [57], in which its sectional properties about bendingaxis is the same as for a IPB300 steel column, while its cross-sectional shape is totallydifferent. Again, the material yield stress, density, elastic modulus and Poisson’s ratioare set equal to 240 MPa, 7850 kg/m3, 210 GPa and 0.3, respectively. Finally, Section 1is subjected to six different explosive charge weights (55, 200, 275, 350, 555 and 1000 kg
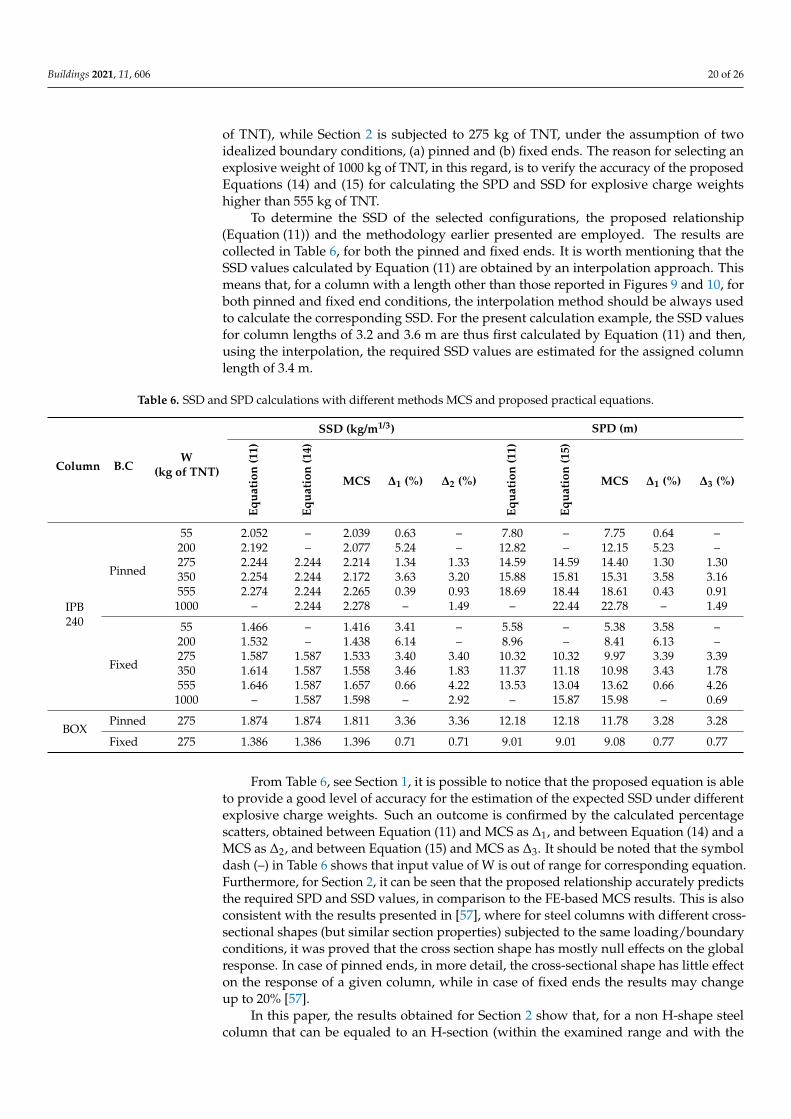
Buildings 2021, 11, 606 20 of 26
of TNT), while Section 2 is subjected to 275 kg of TNT, under the assumption of twoidealized boundary conditions, (a) pinned and (b) fixed ends. The reason for selecting anexplosive weight of 1000 kg of TNT, in this regard, is to verify the accuracy of the proposedEquations (14) and (15) for calculating the SPD and SSD for explosive charge weightshigher than 555 kg of TNT.
To determine the SSD of the selected configurations, the proposed relationship(Equation (11)) and the methodology earlier presented are employed. The results arecollected in Table 6, for both the pinned and fixed ends. It is worth mentioning that theSSD values calculated by Equation (11) are obtained by an interpolation approach. Thismeans that, for a column with a length other than those reported in Figures 9 and 10, forboth pinned and fixed end conditions, the interpolation method should be always usedto calculate the corresponding SSD. For the present calculation example, the SSD valuesfor column lengths of 3.2 and 3.6 m are thus first calculated by Equation (11) and then,using the interpolation, the required SSD values are estimated for the assigned columnlength of 3.4 m.
Table 6. SSD and SPD calculations with different methods MCS and proposed practical equations.
Column B.CW
(kg of TNT)
SSD (kg/m1/3) SPD (m)
Equa
tion
(11)
Equa
tion
(14)
MCS ∆1 (%) ∆2 (%)
Equa
tion
(11)
Equa
tion
(15)
MCS ∆1 (%) ∆3 (%)
IPB240
Pinned
55 2.052 – 2.039 0.63 – 7.80 – 7.75 0.64 –200 2.192 – 2.077 5.24 – 12.82 – 12.15 5.23 –275 2.244 2.244 2.214 1.34 1.33 14.59 14.59 14.40 1.30 1.30350 2.254 2.244 2.172 3.63 3.20 15.88 15.81 15.31 3.58 3.16555 2.274 2.244 2.265 0.39 0.93 18.69 18.44 18.61 0.43 0.91
1000 – 2.244 2.278 – 1.49 – 22.44 22.78 – 1.49
Fixed
55 1.466 – 1.416 3.41 – 5.58 – 5.38 3.58 –200 1.532 – 1.438 6.14 – 8.96 – 8.41 6.13 –275 1.587 1.587 1.533 3.40 3.40 10.32 10.32 9.97 3.39 3.39350 1.614 1.587 1.558 3.46 1.83 11.37 11.18 10.98 3.43 1.78555 1.646 1.587 1.657 0.66 4.22 13.53 13.04 13.62 0.66 4.26
1000 – 1.587 1.598 – 2.92 – 15.87 15.98 – 0.69
BOXPinned 275 1.874 1.874 1.811 3.36 3.36 12.18 12.18 11.78 3.28 3.28
Fixed 275 1.386 1.386 1.396 0.71 0.71 9.01 9.01 9.08 0.77 0.77
From Table 6, see Section 1, it is possible to notice that the proposed equation is ableto provide a good level of accuracy for the estimation of the expected SSD under differentexplosive charge weights. Such an outcome is confirmed by the calculated percentagescatters, obtained between Equation (11) and MCS as ∆1, and between Equation (14) and aMCS as ∆2, and between Equation (15) and MCS as ∆3. It should be noted that the symboldash (–) in Table 6 shows that input value of W is out of range for corresponding equation.Furthermore, for Section 2, it can be seen that the proposed relationship accurately predictsthe required SPD and SSD values, in comparison to the FE-based MCS results. This is alsoconsistent with the results presented in [57], where for steel columns with different cross-sectional shapes (but similar section properties) subjected to the same loading/boundaryconditions, it was proved that the cross section shape has mostly null effects on the globalresponse. In case of pinned ends, in more detail, the cross-sectional shape has little effecton the response of a given column, while in case of fixed ends the results may changeup to 20% [57].
In this paper, the results obtained for Section 2 show that, for a non H-shape steelcolumn that can be equaled to an H-section (within the examined range and with the
Buildings 2021, 11, 606 21 of 26
same loading/boundary conditions), the proposed formula can be used with accuracyto determine the SPD and SSD parameters. It should be kept in mind, however, that theproposed relationship is generally based on interpolation within the range of the intendedcolumns. In general, it is hence recognized that the use of the proposed formula for othersteel columns can provide a preliminary estimation of the required SPD and SSD values,but the accuracy of these results should be examined through engineering judgment andfurther investigations.
It is also clear, in this regard, that considering the high computational cost of therigorous approach (almost 0.9 h for 300 simulations, and almost 4.5 h for each curve ofprobability of low damage, consisting of 5 points), the proposed approximate relationshipscan be efficiently used to obtain practical and reliable estimates.
The illustrative calculation examples, in conclusion, proved that the proposed for-mula is capable of properly interpolating the available data, and thus finding the SSD ofvarious types of columns, which may differ in length and/or cross-sectional properties.Furthermore, such a relationship could be further extended to find the SSD of blast loadedsteel columns with semi-fixed boundary conditions. Recently, a research study was infact reported in [89] to investigate the effect of semi-fixed supports on the response offlexural members under impact loads. The equivalent SDOF system was used and thetransformation factors including load, mass, stiffness and ultimate resistance factors wereobtained for different fixity values in the elastic, elastic–plastic and plastic regions. It wasthus shown that the semi-fixed condition can severely affect the blast response of a givencolumn, compared to the two ideal assumptions of fully pinned and fully fixed supportconditions. Accordingly, it is recognized that the current research outcomes—based on theSSD results for two perfectly pinned and fixed conditions—can support the designer withtheir engineering judgment in the choice of the SSD value (in between two limit supportconditions) which is closest to the real boundary condition.
7. Conclusions
Safe scaled distance (SSD) is of practical interest, especially for design purposes ofstructural elements or assemblies, in order to minimize the damage probability and conse-quently the risk of progressive collapse against terrorist attacks in congested urban areas.In this paper, an improved methodology based on reliability analysis and implementing thebeam element formulation was presented for calculating the SSD and the safe protectivedistance (SPD) for steel beam columns subjected to blast loads. To obtain the probability oflow damage, the Monte Carlo simulation (MCS) method was used, so as to account for theuncertainties of blast loading parameters and material properties. The proposed methodol-ogy was extended to steel columns with different cross sections (IPB180 to IPB500), lengths(2.8, 3.2, 3.6 and 4.0 m) and boundary conditions (pinned or fixed ends). The collected datawere thus further investigated to find a practical relationship to predict the SSD of steelcolumns under blast loads. From the comparative discussion, the following conclusionswere obtained:
• The results showed that the improved methodology, based on the beam elementformulation, has good efficiency and accuracy in predicting the damage probabil-ity of blast loaded steel columns and further remarkably reduces the run time ofprobabilistic analyses.
• A practical relationship was proposed and verified against numerical studies in theliterature, to relate the SSD of blast loaded steel columns to the initial axial capacityand explosive charge weight.
• The proposed equation has a very good agreement with FE results based on MCS,which indicates its very high level of accuracy in predicting the SSD and thus itsefficiency in obtaining practical and reliable estimates.
• The results showed that for both pinned and fixed end conditions, by increasing theinitial axial carrying capacity of a given column and the amount of explosive chargeweight, the SSD decreases and increases, respectively. The variation of the explosive

Buildings 2021, 11, 606 22 of 26
charge weight, however, has minimum effects on the calculated SSD, compared tovariations in the initial axial capacity of the column.
• The discussed results proved that upon changing the support condition from pinnedto fixed ends, the corresponding SSD decreases significantly. This indicates that theactual boundary condition has substantial effects on the SSD and the designer shouldconsequently select an SSD value between two perfectly pinned and fixed models toaccount for real support conditions.
• For explosive charge weights (W) higher than or equal to 275 kg of TNT, by keepingconstant the initial axial capacity, the effects of W variations on SSD are almost negligi-ble. In a nutshell, the SSD obtained for W = 275 kg of TNT can be rationally taken intoaccount, with an acceptable level of accuracy, for W values higher than 275 kg of TNT(SSD(W=275)
∼= SSD(W>275)).• Similarly, the SPD of a given steel column subjected to explosive charge weights
higher than or equal to 275 kg of TNT can be easily obtained by calculating the SPDfor W = 275 kg of TNT using the proposed equation.
Author Contributions: Conceptualization, M.M., C.B., M.A.H. and A.B.; methodology, M.M., C.B.,M.A.H. and A.B.; software, M.M., C.B., M.A.H. and A.B.; validation, M.M., C.B., M.A.H. and A.B.;formal analysis, M.M., C.B., M.A.H. and A.B.; investigation, M.M., C.B., M.A.H. and A.B.; writing—original draft preparation, M.M., C.B., M.A.H. and A.B.; writing—review and editing, M.M., C.B.,M.A.H. and A.B.; visualization, M.M., C.B., M.A.H. and A.B.; supervision, C.B., M.A.H. and A.B. Allauthors have read and agreed to the published version of the manuscript.
Funding: This research received no external funding.
Institutional Review Board Statement: Not applicable.
Informed Consent Statement: Not applicable.
Data Availability Statement: Supporting data will be made available upon request.
Acknowledgments: The authors wish to acknowledge and express their special thanks to SinaMalekpour and Fateme Hajari from Department of Civil and Environmental Engineering, ShirazUniversity of Technology, Shiraz, Iran.
Conflicts of Interest: The authors declare no conflict of interest.
Abbreviations
MCS Monte Carlo SimulationSPD Safe Protective DistanceSSD Safe Scaled DistanceFE Finite ElementRC Reinforced ConcreteSDOF Single Degree of FreedomMDOF Multi Degree of FreedomDIF Dynamic Increase FactorDI Damage IndexGoF Goodness of FitRMSE Root-Mean-Square ErrorR2 Coefficient of determinationPDF Probability Density FunctionCDF Cumulative Distribution FunctionCOV Coefficient of VariationTNT TrinitrotolueneBC Boundary ConditionW Explosive charge weightWeff Effective charge weightR Stand-off distance

Buildings 2021, 11, 606 23 of 26
Z Scaled distanceC and P Constant coefficients of Cooper-Simonds relationshipk Integration refinement factorσ Standard deviationεt True stressεt True strain.ε Strain rateL1 Deformed length of uniaxial tension memberL0 Undeformed length of uniaxial tension memberPr Reflected pressurePr(mean) Mean value of reflected pressureσPr Standard deviation of reflected pressureCOVpr Coefficient of variation of reflected pressuretd Positive time durationtd(mean) Mean value of positive time durationσtd Standard deviation of positive time durationCOVtd Coefficient of variation of positive time durationPresidual Post-blast residual axial capacity of the damaged columnPinitial Maximum axial load-carrying capacity of the undamaged columnFy Yield stressEs Modulus of elasticityEt Slope of the bilinear stress strain curve in strain hardening regionPf Probability of failureNf Number of trials for which limit state function falls in the failure regionN Number of total simulationsX Vector of input random variablesg(X) Limit state functionr Capacityq Demandfx(X) Joint probability density functionIF Failure indicatorCL Confidence levelIx Moment of inertia about the strong axisIy Moment of inertia about the weak axisα0 to α5 Constant coefficientsFcr Critical stress due to flexural buckling of members without slender elementsAg Total cross-sectional areaL Column lengthrg Radius of gyrationke Effective length factorFe Elastic buckling stress∆, ∆1, ∆2 and ∆3 Percentage scatters
References1. Soft Targets and Crowded Places Security Plan Overview; U.S. Department of Homeland Security: Washington, DC, USA, 2018. Avail-
able online: https://www.cisa.gov/sites/default/files/publications/DHS-Soft-Target-Crowded-Place-Security-Plan-Overview-052018-508_0.pdf (accessed on 25 November 2021).
2. Hinman, E. Primer for design of commercial buildings to mitigate terrorist attacks. FEMA 2003, 427, 40–41.3. Command, U.A.M. Engineering Design Handbook: Explosions in Air Part One; AD/A-003 817 (AMC Pamphlet AMCP 706-181);
AMC Pamphlet: Alexandria, VA, USA, 1974.4. Baker, W.E.; Westine, P.S.; Dodge, F.T. Similarity Methods in Engineering Dynamics: Theory and Practice of Scale Modeling; Hayden
Book Co.: Indianapolis, IN, USA, 1973; Available online: https://www.elsevier.com/books/similarity-methods-in-engineering-dynamics/westine/978-0-444-88156-4 (accessed on 25 November 2021).
5. U.S. DoD. Ammunition and Explosives Safety Standards; U.S. DoD: Washington, DC, USA, 2004.6. Wu, C.; Hao, H. Safe scaled distance for masonry infilled RC frame structures subjected to airblast loads. J. Perform. Constr. Facil.
2007, 21, 422–431. [CrossRef]7. Byfield, M.; Paramasivam, S. Estimating safe scaled distances for columns subjected to blast. Eng. Comput. Mech. 2014, 167, 23–29.
[CrossRef]
Buildings 2021, 11, 606 24 of 26
8. Thomas, R.; Steel, K.; Sorensen, A.D. Reliability analysis of circular reinforced concrete columns subject to sequential vehicularimpact and blast loading. Eng. Struct. 2018, 168, 838–851. [CrossRef]
9. Hadianfard, M.A.; Malekpour, S. Evaluation of explosion safe distance of steel column via structural reliability analysis. ADST J.2017, 8, 349–359.
10. Zhai, X.; Wang, Y.; Sun, Z. Damage model and damage assessment for single-layer reticulated domes under exterior blast load.Mech. Based Des. Struct. Mach. 2019, 47, 319–338. [CrossRef]
11. Hao, H.; Wu, C. Numerical simulation of damage of low-rise RC frame structures with infilled masonry walls to explosive loads.Aust. J. Struct. Eng. 2006, 7, 13–22. [CrossRef]
12. Bounds, W.L. Design of Blast-Resistant Buildings in Petrochemical Facilities; ASCE Publications: Reston, VA, USA, 2010.13. Jarrett, D. Derivation of the British explosives safety distances. Ann. N. Y. Acad. Sci. 1968, 152, 18–35. [CrossRef]14. Magallanes, J.M.; Martinez, R.; Koenig, J.W. Experimental Results of the AISC Full-Scale Column Blast Test; The American Institute of
Steel Construction: Chicago, IL, USA, 2006.15. Nassr, A.A.; Razaqpur, A.G.; Tait, M.J.; Campidelli, M.; Foo, S. Dynamic response of steel columns subjected to blast loading.
J. Struct. Eng. 2013, 140, 04014036. [CrossRef]16. Nassr, A.A.; Razaqpur, A.G.; Tait, M.J.; Campidelli, M.; Foo, S. Strength and stability of steel beam columns under blast load. Int.
J. Impact Eng. 2013, 55, 34–48. [CrossRef]17. Nassr, A.A.; Razaqpur, A.G.; Tait, M.J.; Campidelli, M.; Foo, S. Single and multi degree of freedom analysis of steel beams under
blast loading. Nucl. Eng. Des. 2012, 242, 63–77. [CrossRef]18. Bao, X.; Li, B. Residual strength of blast damaged reinforced concrete columns. Int. J. Impact Eng. 2010, 37, 295–308. [CrossRef]19. Momeni, M.; Hadianfard, M.A.; Bedon, C.; Baghlani, A. Damage evaluation of H-section steel columns under impulsive blast
loads via gene expression programming. Eng. Struct. 2020, 219, 110909. [CrossRef]20. Rong, H.-C.; Li, B. Probabilistic response evaluation for RC flexural members subjected to blast loadings. Struct. Saf. 2007,
29, 146–163. [CrossRef]21. Yokoyama, T. Limits to Deflected Shape Assumptions of the SDOF Methodology for Analyzing Structural Components Subject to
Blast Loading. J. Perform. Constr. Facil. 2014, 29, B4014008. [CrossRef]22. Crawford, J.E.; Magallanes, J.M. The effects of modeling choices on the response of structural components to blast effects. Int. J.
Prot. Struct. 2011, 2, 231–266. [CrossRef]23. Al-Thairy, H. A modified single degree of freedom method for the analysis of building steel columns subjected to explosion
induced blast load. Int. J. Impact Eng. 2016, 94, 120–133. [CrossRef]24. Lee, K.; Kim, T.; Kim, J. Local response of W-shaped steel columns under blast loading. Struct. Eng. Mech. 2009, 31, 25–38.
[CrossRef]25. Shi, Y.; Hao, H.; Li, Z.-X. Numerical derivation of pressure–impulse diagrams for prediction of RC column damage to blast loads.
Int. J. Impact Eng. 2008, 35, 1213–1227. [CrossRef]26. Hadianfard, M.A.; Farahani, A. On the effect of steel columns cross sectional properties on the behaviours when subjected to
blast loading. Struct. Eng. Mech. 2012, 44, 449–463. [CrossRef]27. Hadianfard, M.A.; Nemati, A.; Johari, A. Investigation of Steel Column Behavior with Different Cross Section under Blast Loading.
Modares Civ. Eng. J. 2016, 16, 265–278.28. Ibrahim, Y.E.; Nabil, M. Assessment of structural response of an existing structure under blast load using finite element analysis.
Alex. Eng. J. 2019, 58, 1327–1338. [CrossRef]29. Amadio, C.; Bedon, C. Blast analysis of laminated glass curtain walls equipped by viscoelastic dissipative devices. Buildings 2012,
2, 359–383. [CrossRef]30. Momeni, M.; Bedon, C. Uncertainty Assessment for the Buckling Analysis of Glass Columns with Random Parameters. Int. J.
Struct. Glass Adv. Mater. Res. 2020, 4, 254–275. [CrossRef]31. Figuli, L.; Cekerevac, D.; Bedon, C.; Leitner, B. Numerical analysis of the blast wave propagation due to various explosive charges.
Adv. Civ. Eng. 2020, 2020, 8871412. [CrossRef]32. Goel, M.D.; Thimmesh, T.; Shirbhate, P.; Bedon, C. Enhanced Single-Degree-of-Freedom Analysis of Thin Elastic Plates Subjected
to Blast Loading Using an Energy-Based Approach. Adv. Civ. Eng. 2020, 2020, 8825072. [CrossRef]33. Shi, Y.; Stewart, M.G. Damage and risk assessment for reinforced concrete wall panels subjected to explosive blast loading. Int. J.
Impact Eng. 2015, 85, 5–19. [CrossRef]34. Bogosian, D.; Ferritto, J.; Shi, Y. Measuring Uncertainty and Conservatism in Simplified Blast Models; Karagozian And Case Glendale:
Glendale, CA, USA, 2002.35. Hao, H.; Stewart, M.G.; Li, Z.-X.; Shi, Y. RC column failure probabilities to blast loads. Int. J. Prot. Struct. 2010, 1, 571–591.
[CrossRef]36. Low, H.Y.; Hao, H. Reliability analysis of reinforced concrete slabs under explosive loading. Struct. Saf. 2001, 23, 157–178.
[CrossRef]37. Netherton, M.D.; Stewart, M.G. Blast load variability and accuracy of blast load prediction models. Int. J. Prot. Struct. 2010,
1, 543–570. [CrossRef]38. Kelliher, D.; Sutton-Swaby, K. Stochastic representation of blast load damage in a reinforced concrete building. Struct. Saf. 2012,
34, 407–417. [CrossRef]
Buildings 2021, 11, 606 25 of 26
39. Olmati, P.; Sagaseta, J.; Cormie, D.; Jones, A. Simplified reliability analysis of punching in reinforced concrete flat slab buildingsunder accidental actions. Eng. Struct. 2017, 130, 83–98. [CrossRef]
40. Ding, Y.; Song, X.; Zhu, H.-T. Probabilistic progressive collapse analysis of steel frame structures against blast loads. Eng. Struct.2017, 147, 679–691. [CrossRef]
41. Low, H.Y.; Hao, H. Reliability analysis of direct shear and flexural failure modes of RC slabs under explosive loading. Eng. Struct.2002, 24, 189–198. [CrossRef]
42. Hao, H.; Li, Z.-X.; Shi, Y. Reliability analysis of RC columns and frame with FRP strengthening subjected to explosiveloads. J. Perform. Constr. Facil. 2015, 30, 04015017. [CrossRef]
43. Shi, Y.; Stewart, M.G. Spatial reliability analysis of explosive blast load damage to reinforced concrete columns. Struct. Saf. 2015,53, 13–25. [CrossRef]
44. Stewart, M.G. Reliability-based load factors for airblast and structural reliability of reinforced concrete columns for protectivestructures. Struct. Infrastruct. Eng. 2019, 15, 634–646. [CrossRef]
45. Olmati, P.; Petrini, F.; Gkoumas, K. Fragility analysis for the Performance-Based Design of cladding wall panels subjected to blastload. Eng. Struct. 2014, 78, 112–120. [CrossRef]
46. Stochino, F. RC beams under blast load: Reliability and sensitivity analysis. Eng. Fail. Anal. 2016, 66, 544–565. [CrossRef]47. Hussein, A.; Mahmoud, H.; Heyliger, P. Probabilistic analysis of a simple composite blast protection wall system. Eng. Struct.
2020, 203, 109836. [CrossRef]48. Campidelli, M.; El-Dakhakhni, W.; Tait, M.; Mekky, W. Blast design-basis threat uncertainty and its effects on probabilistic risk
assessment. ASCE-ASME J. Risk Uncertain. Eng. Syst. Part A Civ. Eng. 2015, 1, 04015012. [CrossRef]49. Hedayati, M.H.; Sriramula, S.; Neilson, R.D. Reliability of Profiled Blast Wall Structures. In Numerical Methods for Reliability and
Safety Assessment; Springer: Berlin/Heidelberg, Germany, 2015; pp. 387–405.50. Borenstein, E.; Benaroya, H. Sensitivity analysis of blast loading parameters and their trends as uncertainty increases. J. Sound
Vib. 2009, 321, 762–785. [CrossRef]51. Momeni, M.; Hadianfard, M.A.; Baghlani, A. Implementation of Weighted Uniform SimulationMethod in Failure Probability
Analysisof Steel Columns under Blast Load. In Proceedings of the 11th International Congress on Civil Engineering, Universityof Tehran, Tehran, Iran, 8–10 May 2018.
52. Hadianfard, M.A.; Malekpour, S.; Momeni, M. Reliability analysis of H-section steel columns under blast loading. Struct. Saf.2018, 75, 45–56. [CrossRef]
53. Thöns, S.; Stewart, M.G. On decision optimality of terrorism risk mitigation measures for iconic bridges. Reliab. Eng. Syst. Saf.2019, 188, 574–583. [CrossRef]
54. Stewart, M.G.; Netherton, M.D. A Probabilistic Risk-Acceptance Model for Assessing Blast and Fragmentation Safety Hazards.Reliab. Eng. Syst. Saf. 2019, 191, 106492. [CrossRef]
55. Stewart, M.G.; Netherton, M.D. Security risks and probabilistic risk assessment of glazing subject to explosive blast loading.Reliab. Eng. Syst. Saf. 2008, 93, 627–638. [CrossRef]
56. Netherton, M.D.; Stewart, M.G. Risk-based blast-load modelling: Techniques, models and benefits. Int. J. Prot. Struct. 2016,7, 430–451. [CrossRef]
57. Momeni, M.; Hadianfard, M.A.; Bedon, C.; Baghlani, A. Numerical damage evaluation assessment of blast loaded steel columnswith similar section properties. Structures 2019, 20, 189–203. [CrossRef]
58. Hallquist, J.O. LS-DYNA Theory Manual. Livermore Softw. Technol. Corp. 2006, 3, 25–31.59. Hallquist, J. LS-Dyna Theory Manual, March 2006; Livermore Software Technology Corporation (LSTC): Livermore, CA, USA, 2012.60. LSTC. Keyword User’s Manual Volume II; Livermore Software Technology Corporation (LSTC): Livermore, CA, USA, 2007.61. Cowper, G.R.; Symonds, P.S.; United States Office of Naval Research; Brown University Division of Applied Mathematics.
Strain-Hardening and Strain-Rate Effects in the Impact Loading of Cantilever Beams; Brown University: Providence, RI, USA, 1957.62. Jones, N. Structural Impact; Cambridge University Press: Cambridge, UK, 2011.63. Momeni, M. Damage Evaluation of Steel Beam-Columns Subjected to Impulsive Loads Using Reliability Approach. Ph.D. Thesis,
Shiraz University of Technology, Shiraz, Iran, 2021. (In Persian)64. Rackauskaite, E.; Kotsovinos, P.; Rein, G. Model parameter sensitivity and benchmarking of the explicit dynamic solver of
LS-DYNA for structural analysis in case of fire. Fire Saf. J. 2017, 90, 123–138. [CrossRef]65. FEMA 426: Reference Manual to Mitigate Potential Terrorist Attacks against Buildings—Buildings and Infrastructure Protection Series;
U.S. Department of Homeland Security: Washington, DC, USA, 2003.66. Karlos, V.; Solomos, G. Calculation of Blast Loads for Application to Structural Components; European Commission’s science and
knowledge service, Joint Research Centre: Ispra, Italy, 2013.67. U.S. DoD. Structures to Resist the Effects of Accidental Explosions; UFC 3-340-02; U.S. DoD: Washington, DC, USA, 2008.68. Beshara, F. Modelling of blast loading on aboveground structures—I. General phenomenology and external blast. Comput. Struct.
1994, 51, 585–596. [CrossRef]69. Suppressive Shields Structural Design and Analysis Handbook; US Army Corps of Engineers, Huntsville Division: Huntsville, AL,
USA, 1977; HNDM-1110-1-2.70. Krauthammer, T. Blast Effects and Related Threats; Pennsylvania State University: State College, PA, USA, 1999.

Buildings 2021, 11, 606 26 of 26
71. Ruggieri, S.; Porco, F.; Uva, G.; Vamvatsikos, D. Two frugal options to assess class fragility and seismic safety for low-rise. Bull.Earthq. Eng. 2021, 19, 1415–1439. [CrossRef]
72. Miranda, E.; Reyes, C.J. Approximate lateral drift demands in multistory buildings with nonuniform stiffness. J. Struct. Eng.2002, 128, 840–849. [CrossRef]
73. Campidelli, M.; Tait, M.; El-Dakhakhni, W.; Mekky, W. Inference of blast wavefront parameter uncertainty for probabilistic riskassessment. J. Struct. Eng. 2015, 141, 04015062. [CrossRef]
74. Asprone, D.; Jalayer, F.; Prota, A.; Manfredi, G. Proposal of a probabilistic model for multi-hazard risk assessment of structures inseismic zones subjected to blast for the limit state of collapse. Struct. Saf. 2010, 32, 25–34. [CrossRef]
75. Netherton, M.D.; Stewart, M.G. The effects of explosive blast load variability on safety hazard and damage risks for monolithicwindow glazing. Int. J. Impact Eng. 2009, 36, 1346–1354. [CrossRef]
76. Olmati, P.; Vamvatsikos, D.; Stewart, M.G. Safety factor for structural elements subjected to impulsive blast loads. Int. J. ImpactEng. 2017, 106, 249–258. [CrossRef]
77. Stewart, M.; Netherton, M.; Shi, Y.; Grant, M.; Mueller, J. Probabilistic terrorism risk assessment and risk acceptability forinfrastructure protection. Aust. J. Struct. Eng. 2012, 13, 1–17. [CrossRef]
78. Stewart, M.G. Reliability-based load factor design model for explosive blast loading. Struct. Saf. 2018, 71, 13–23. [CrossRef]79. Stewart, M.G.; Mueller, J. Terror, Security, and Money: Balancing the Risks, Benefits, and Costs of Critical Infrastructure Protection.
In Proceedings of the Reliability Engineering Computing REC 2012, Brno, Czech Republic, June 2012; pp. 513–533.80. Bartlett, F.; Dexter, R.; Graeser, M.; Jelinek, J.; Schmidt, B.; Galambos, T. Updating Standard Shape Material Properties Database
for Design and Reliability (k-Area 4); Technical Report for American Institute of Steel Construction; American Institute of SteelConstruction: Chicago, IL, USA, 2001.
81. Hadianfard, M.; Razani, R. Effects of semi-rigid behavior of connections in the reliability of steel frames. Struct. Saf. 2003,25, 123–138. [CrossRef]
82. Thai, H.-T.; Uy, B.; Kang, W.-H.; Hicks, S. System reliability evaluation of steel frames with semi-rigid connections. J. Constr. SteelRes. 2016, 121, 29–39. [CrossRef]
83. Rubinstein, R. Simulation and the Monte Carlo Method; John Wiley&Sons: New York, NY, USA, 1981.84. Melchers, R.E.; Beck, A.T. Structural Reliability: Analysis and Prediction; John Wiley & Sons Ltd.: Chichester, UK, 2018.85. Broding, W.; Diederich, F.; Parker, P. Structural optimization and design based on a reliability design criterion. J. Spacecr. Rocket.
1964, 1, 56–61. [CrossRef]86. Lees, F. Lees’ Loss Prevention in the Process Industries: Explosion; Butterworth-Heinemann: Oxford, UK, 2012.87. UNEP Industry and Environment Programme Activity Centre. Paris, FR. Hazard Identification and Evaluation in a Local Community;
UNEP Industry and Environment Programme Activity Centre: Paris, France, 1992; Volume 12.88. Center for Chemical Process Safety. Guidelines for Chemical Process Quantitative Risk Analysis; Center for Chemical Process Safety
of the American Institute of Chemical: New York, NY, USA, 2000.89. Hadianfard, M.A.; Shekari, M. An Equivalent Single-Degree-of-Freedom System to Estimate Nonlinear Response of Semi-fixed
Flexural Members Under Impact Load. Iran. J. Sci. Technol. Trans. Civ. Eng. 2019, 43, 343–355. [CrossRef]
Related Documents