An Efficient Design Space Exploration Methodology for Multiprocessor SoC Architectures based on Response Surface Methods Gianluca Palermo, Cristina Silvano, Vittorio Zaccaria Politecnico di Milano Dipartimento di Elettronica e Informazione Via Ponzio 34/5, 20133 Milano - Italy E-mail: {gpalermo.silvano.zaccaria}@elet.polimi.it Abstract-Multi-Processor System on-Chip (MPSoC) architec- tures are currently designed by using a platform-based approach. In this approach, a wide range of platform parameters must be tuned to find the best trade-offs in terms of the selected figures of merit (such as energy, delay and area). This optimization phase is called Design Space Exploration (DSE) and it generally consists of a Multi-Objective Optimization (MOO) problem. The design space for an MPSoC architecture is too large to be evaluated comprehensively. So far, several heuristic techniques have been proposed to address the MOO problem for MPSoC, but they are characterized by low efficiency to identify the Pareto front. In this paper, an efficient DSE methodology is proposed leveraging traditional Design of Experiments (DoE) and Response Surface Modeling (RSM) techniques. In particular, the DoE phase generates an initial plan of experiments used to create a coarse view of the target design space; a set of RSM techniques are then used to refine the exploration. This process is iteratively repeated until the target criterion (e.g. number of simulations) is satisfied. A set of experimental results are reported to trade-off accuracy and efficiency of the proposed techniques with actual workloads l • I. INTRODUCTION In the recent years, Multi-Processor Systems-on-Chip (MP- SoC) and Chip-Multi-Processors (CMPs) have become the de facto standard for embedded and general-purpose architec- tures. The platform-based design methodology [1] represents the winning paradigm to design optimized architectures and meeting time-to-market constraints. In this context, parametric System on-Chip (SoC) simulation models are built and eval- uated to accurately tune the architecture to meet the target application requirements in terms of performance, battery lifetime and area. This tuning phase is called Design Space Ex- ploration (DSE) and it generally consists of a multi-objective optimization problem. The problem is generally solved by ex- ploring a large design space consisting of several parameters at system and micro-architectural levels. So far, several heuristic techniques have been proposed to address this problem, but they are characterized by low efficiency to identify the Pareto front. Evolutionary or sensitivity based algorithms are among the most notable, state-of-the art techniques. In this paper, we propose an iterative design space ex- ploration methodology exploiting traditional Design of Ex- lThis work was supported in part by the EC under grant MULTICUBE FP7-216693 978-1-4244-1985-2/08/$25.00 ©2008 IEEE periments (DoE) and Response Surface Modeling (RSM) techniques. First, the DoE phase generates an initial plan of experiments used to create a coarse view of the target design space; then a set of RSM techniques are used to refine the exploration. This process is iteratively repeated until a target criterion (e.g. number of simulations) is satisfied. The proposed methodology is highly flexible because, in principle, any combination of DoE and RSM techniques can be used. However, from the analysis of the experimental results carried out in the paper with actual workloads, two guiding strategies (low-end and high-end) have been identified. From one side, the low-end strategy combines a DoE generated randomly to a linear regression model to obtain a less accurate but very efficient exploration. From the other side, the high- end strategy combines more sophisticated DoE and RSM techniques to obtain accuracy/efficiency trade-offs. To the best of our knowledge, although there have already been some applications of DoEs and RSM techniques to the field of performance analysis and optimization, the work proposed in this paper represents the first in-depth, compre- hensive application of DoE and RSM techniques to the field of multi-objective design space exploration for on-chip multi- processors. The paper is organized as follows. Section II discusses the state of the art related to design space exploration while Section III introduces a formalization of the problem of the design space exploration. Section IV introduces the design space exploration methodology proposed in this paper, while Section V reports the experimental results derived from the application of the proposed methodology on a general-purpose multiprocessor platform. II. STATE OF THE ART Several methods have been recently proposed in literature to reduce the design space exploration complexity by using traditional statistic techniques and advanced exploration algo- rithms. The proposed techniques can be partitioned mainly in two categories: heuristics for architectural exploration and methods for the system performance estimation and optimiza- tion. Among the most recent heuristics for power/performance architectural exploration we can find [2]-[4]. In [2], the 150

Welcome message from author
This document is posted to help you gain knowledge. Please leave a comment to let me know what you think about it! Share it to your friends and learn new things together.
Transcript
An Efficient Design Space ExplorationMethodology for Multiprocessor SoC Architectures
based on Response Surface MethodsGianluca Palermo, Cristina Silvano, Vittorio Zaccaria
Politecnico di MilanoDipartimento di Elettronica e Informazione
Via Ponzio 34/5, 20133 Milano - ItalyE-mail: {gpalermo.silvano.zaccaria}@elet.polimi.it
Abstract-Multi-Processor System on-Chip (MPSoC) architectures are currently designed by using a platform-based approach.In this approach, a wide range of platform parameters must betuned to find the best trade-offs in terms of the selected figuresof merit (such as energy, delay and area). This optimizationphase is called Design Space Exploration (DSE) and it generallyconsists of a Multi-Objective Optimization (MOO) problem. Thedesign space for an MPSoC architecture is too large to beevaluated comprehensively. So far, several heuristic techniqueshave been proposed to address the MOO problem for MPSoC,but they are characterized by low efficiency to identify the Paretofront. In this paper, an efficient DSE methodology is proposedleveraging traditional Design of Experiments (DoE) and ResponseSurface Modeling (RSM) techniques. In particular, the DoE phasegenerates an initial plan of experiments used to create a coarseview of the target design space; a set of RSM techniques arethen used to refine the exploration. This process is iterativelyrepeated until the target criterion (e.g. number of simulations) issatisfied. A set of experimental results are reported to trade-offaccuracy and efficiency of the proposed techniques with actualworkloads l
•
I. INTRODUCTION
In the recent years, Multi-Processor Systems-on-Chip (MPSoC) and Chip-Multi-Processors (CMPs) have become the defacto standard for embedded and general-purpose architectures. The platform-based design methodology [1] representsthe winning paradigm to design optimized architectures andmeeting time-to-market constraints. In this context, parametricSystem on-Chip (SoC) simulation models are built and evaluated to accurately tune the architecture to meet the targetapplication requirements in terms of performance, batterylifetime and area. This tuning phase is called Design Space Exploration (DSE) and it generally consists of a multi-objectiveoptimization problem. The problem is generally solved by exploring a large design space consisting of several parameters atsystem and micro-architectural levels. So far, several heuristictechniques have been proposed to address this problem, butthey are characterized by low efficiency to identify the Paretofront. Evolutionary or sensitivity based algorithms are amongthe most notable, state-of-the art techniques.
In this paper, we propose an iterative design space exploration methodology exploiting traditional Design of Ex-
lThis work was supported in part by the EC under grant MULTICUBEFP7-216693
978-1-4244-1985-2/08/$25.00 ©2008 IEEE
periments (DoE) and Response Surface Modeling (RSM)techniques. First, the DoE phase generates an initial plan ofexperiments used to create a coarse view of the target designspace; then a set of RSM techniques are used to refine theexploration. This process is iteratively repeated until a targetcriterion (e.g. number of simulations) is satisfied.
The proposed methodology is highly flexible because, inprinciple, any combination of DoE and RSM techniques canbe used. However, from the analysis of the experimental resultscarried out in the paper with actual workloads, two guidingstrategies (low-end and high-end) have been identified. Fromone side, the low-end strategy combines a DoE generatedrandomly to a linear regression model to obtain a less accuratebut very efficient exploration. From the other side, the highend strategy combines more sophisticated DoE and RSMtechniques to obtain accuracy/efficiency trade-offs.
To the best of our knowledge, although there have alreadybeen some applications of DoEs and RSM techniques tothe field of performance analysis and optimization, the workproposed in this paper represents the first in-depth, comprehensive application of DoE and RSM techniques to the fieldof multi-objective design space exploration for on-chip multiprocessors.
The paper is organized as follows. Section II discussesthe state of the art related to design space exploration whileSection III introduces a formalization of the problem of thedesign space exploration. Section IV introduces the designspace exploration methodology proposed in this paper, whileSection V reports the experimental results derived from theapplication of the proposed methodology on a general-purposemultiprocessor platform.
II. STATE OF THE ART
Several methods have been recently proposed in literatureto reduce the design space exploration complexity by usingtraditional statistic techniques and advanced exploration algorithms. The proposed techniques can be partitioned mainlyin two categories: heuristics for architectural exploration andmethods for the system performance estimation and optimization.
Among the most recent heuristics for power/performancearchitectural exploration we can find [2]-[4]. In [2], the
150
authors compare the Pareto Simulated Annealing, the ParetoReactive Taboo Search and Random Search exploration toidentify energy-performance trade-offs for a parametric superscalar architecture running a set of multimedia kernels. In [3],a combined Genetic-Fuzzy system approach is proposed. Thetechnique is applied to a highly parametrized SoC platformbased on a VLIW processor in order to optimize both powerdissipation and execution time. The technique is based on aStrength Pareto Evolutionary Algorithm coupled with fuzzysystem rules in order to speedup the evaluation of the systemconfigurations In [4], domain knowledge about the platformarchitecture has been used in the kernel of a design spaceexploration engine. The exploration problem is converted toa Markov Decision Process (MDP) problem whose solutioncorresponds to the sequence of optimal transformations to beapplied to the platform. The requirement of domain knowledgeis the main difference with respect to the previous proposalsin [2], [3]
State-of-the-art, system performance optimization has beenpresented in [5]-[8]. A common trend among those methodsis the combined use of response surface modeling and designof experiments methodologies.
In [5], a Radial Basis Function has been used to estimatethe performance of a superscalar architecture; the approach iscritically combined with an initial training sample set that isrepresentative of the whole design space, in order to obtaina good estimation accuracy. The authors propose to use avariant of the Latin Hypercube method in order to derive anoptimal, initial set. In [6], [7] linear regression has been usedfor the performance prediction and assessment. The authorsanalyze the main effects and the interaction effects amongthe processor architectural parameters. In both cases, randomsampling has been used to derive an initial set of points totrain the linear model. A different approach is proposed in[8], where the authors tackle performance prediction by usingan Artificial Neural Network paradigm to estimate the systemperformance of a Chip-Multiprocessor.
In [9], [10] a Plackett-Burman design of experiments isapplied to the system architecture to identify the key inputparameters. The exploration is then reduced by exploiting thisinformation. The approach shown in [9] is directed towardsthe optimization of an FPGA, soft-core-based design, whilein [10] the target problem is more oriented to a single, superscalar processor micro-architecture.
The present work represents a step forward towards theutilization of design of experiments and response surfacemethodologies to an efficient performance and power optimization of multi-processor architectures.
III. DESIGN SPACE EXPLORATION
The IP reuse and platform-reconfigurability approaches areconverging into a new design paradigm [1], which is stronglyinfluencing today's automatic system synthesis. In this context, a virtual microprocessor-based architecture can be easilyextended and customized for a target application, enablinga quick, low-risk deployment. More specifically, pre-verifiedcomponents belonging to a specific library are instantiated and
sized to meet specific constraints on the target applicationdomain. However, the space of configurations (or "designspace") can be very large.
The optimization problem involves the minimization (maximization) of multiple objectives (such as latency, energy, area,etc.) making the definition of optimality not unique. In fact, asystem which is the best from the performance point of view,can be the worst in terms of power consumption and viceversa. To address the DSE problem, we present the theory ofMulti-Objective Optimization (MOO) [11].
A discrete multi-objective design space optimization problem includes a set of n parameters, called design variables, aset of m objective functions, and a set of k constraints.
The optimization goal consists of minimizing (or maximizing) a target function, i.e.:
min y == f(x) == (11 (x), 12 (x), ... ,1m (x) ) (I )xEX
subject to the constraints:
where:
where x is the design vector, y is the objective vector, X is asubset of No (denoted as design space) and Y is the projectionof the design space, by the objective functions I~ into a spaceof dimension m, Rm, called objective space.
The set of all the admissible solutions of an optimizationproblem is called feasible region. Formally, the feasible set~2 is defined as the set of design vectors x satisfying theconstraints e(x):
n == {x E X I e(x) :::; O)}
The image of the feasible set n in the objective space isdenoted as W == f(n).
In single-objective optimization, the feasible set is totallyordered according to the objective function I. When severalobjectives are involved, the situation changes and the feasibleset is partially ordered. To compare two solutions f and § wepresent the concept of dominance. If 1-+ is no worse for allobjectives than § and better than for at least one objective, wesay that f dominates § or f -< §.
Formally, f -< § iff:
Ii:S 9i,Vi == 1, ... ,m andIi < 9i for at least one i
Dominance in the objective space can be extended to theparameter space that is a -< b iff f( a) -< f( b) .
We define the set X p of solutions not dominated by anyother solution as the Pareto-optimal set while the corresponding set Yp == f(Xp ) is called the Pareto-optimal front. ThePareto-optimal set is the actual solution of the multi-objectiveoptimization problem.
151
(3)
(4)
A. Assessing the goodness of an approximate Pareto front
When proposing heuristic strategies for finding Paretopoints, the issue of comparing Pareto fronts performancearises. In literature, many performance metrics have been usedfor evaluating the quality of the Pareto fronts with respect toreference Pareto fronts [12]-[14]. We present here the AverageDistance from Reference Set and the Coverage function.
1) Average Distance from Reference Set (ADRS): TheADRS metric is used to measure the distance between areference Pareto-optimal front R and another approximatedfront A:
ADRS(R,A):= I~I _L (~i;t{d(xna)}) (2)x".ER
where
d( ~ ~) - {o fj(a) - fj(xr)}xr,a - ,max, ~J=l, ... ,m fj (x r )
and m is the number of objective functions. ADRS is usually anormalized function which is measured in terms of percentage.The higher the ADRS, the worst is the approximated ParetoA.
2) Coverage: The coverage metric is used to measure thepercentage of an approximated Pareto front A which is coveredby the reference Pareto front R [15].
C(R A) :== I{a E A; 3xr E R : x r -< a}1, IAI
The value C (R, A) == 1 means that all the design vectors inA are dominated by the design vectors of R. As opposite,C (R, A) == 0 represents the situation when none of the pointsin A are dominated by the set R.
IV. A DESIGN SPACE EXPLORATION METHODOLOGY
In this paper, we propose a multi-objective optimizationstrategy leveraging Design of Experiments (DoE) and Response Surface Modeling (RSM) techniques.
With the term Design of Experiments (DoE) [16] we identify the design of an information-gathering experimentationplan where a set of tunable parameters can vary. Often thedesigner is interested in the effects of some parameters manipulation (also called the' treatment') on the system response.Design of experiments is a discipline that has very broadapplication across all the natural and social sciences andencompasses a set of techniques whose main goal is thescreening and analysis of the system behavior with a smallnumber of experiments. Each DoE technique differs in termsof the layout which specifies how to select the design pointsin the design space.
Response surface modeling methodology explores the relationships between several design parameters and one or moreresponse variables. The main idea of RSM is to use a set ofexperiments generated by DoE in order to obtain a responsemodel. A typical flow for using RSM involves a trainingphase, in which known data (or training set) is used to tunethe RSM configuration, and a prediction phase in which theRSM is used to predict unknown system response.
In this paper, regression and interpolation methods areused to build our response surface models. Regression is amethod that models the relationship between a dependentresponse function and some independent variables in orderto describe, with the lowest error possible, both the knownand unknown data. Interpolation is the process of assigningvalues to unknown points by using values from a small set ofknown points. Differently from regression, interpolation doesnot produce any error on the known data.
In the following, we will indicate as actual measurementa measurement performed by experimenting with the actualsimulation model of the system, while with the term estimatedmeasurement we will indicate a measurement based on aresponse surface model.
Let us define a design space 8 as a set of tuples Si.Each tuple Si == (ai, J.1i) is composed of an instance of thearchitecture parameters ai and the associated system metricsJ.1i. Metrics J.1i can be either derived from actual measurementsrni or estimated measurements rh i . The symbol 8 indicatesa design space compoAsed of tuples corresponding to actualmeasurements while S represents a design space of tuplescorresponding to estimated measurements. We use the symbolP to represent a reduced design space corresponding to thePareto front (P == Pareto(S)).
The proposed DSE methodology consists of the followingsteps:
1) Apply a DoE technique to pick up the set of configurations 8 0 generating the plan of experiments to be run.This step provides an initial coarse view at iteration 0of the target design space.
2) Run the experiments to obtain the actual measurementscorresponding to the set of initial configurations 80 .
3) Compute the Pareto front associated with the initialdesign space So: Po == Pareto(So).
4) Apply a response surface technique to the Pareto frontPo. T~e response surface model generates the designspace 81 composed of a set of estimated measurements2•
5) Compute the Pareto front PI == Pareto(Sl).6) Run the experiments to derive the actual measurements
on the architectural configurations contained in Pl. Theresult is the design space Pl.
7) If PI covers Po (C(PI, Po)) by a percentage greater thanoand the stopping criterion is not met, restart from step4, where now Po f- Pl. The stopping criterion is themaximum number of actual measurements to be done.
The described strategy is not combined with a specific DoEbut any DoE plan can be used, as it will be shown in SectionIV-A. Concerning the response surface model, we target bothinterpolation and regression.
The proposed method assumes that the chosen RSM technique can infer the trends of the Pareto configurations in theentire design space. We try to avoid the use of the entireconfiguration space So to infer S1 in order to skip overfitting problems which would deteriorate the estimate S1. The
2Potentially, 81 could be as large as the entire design space, however asampling technique could be applied if it is not practically feasible to managesuch a large space.
152
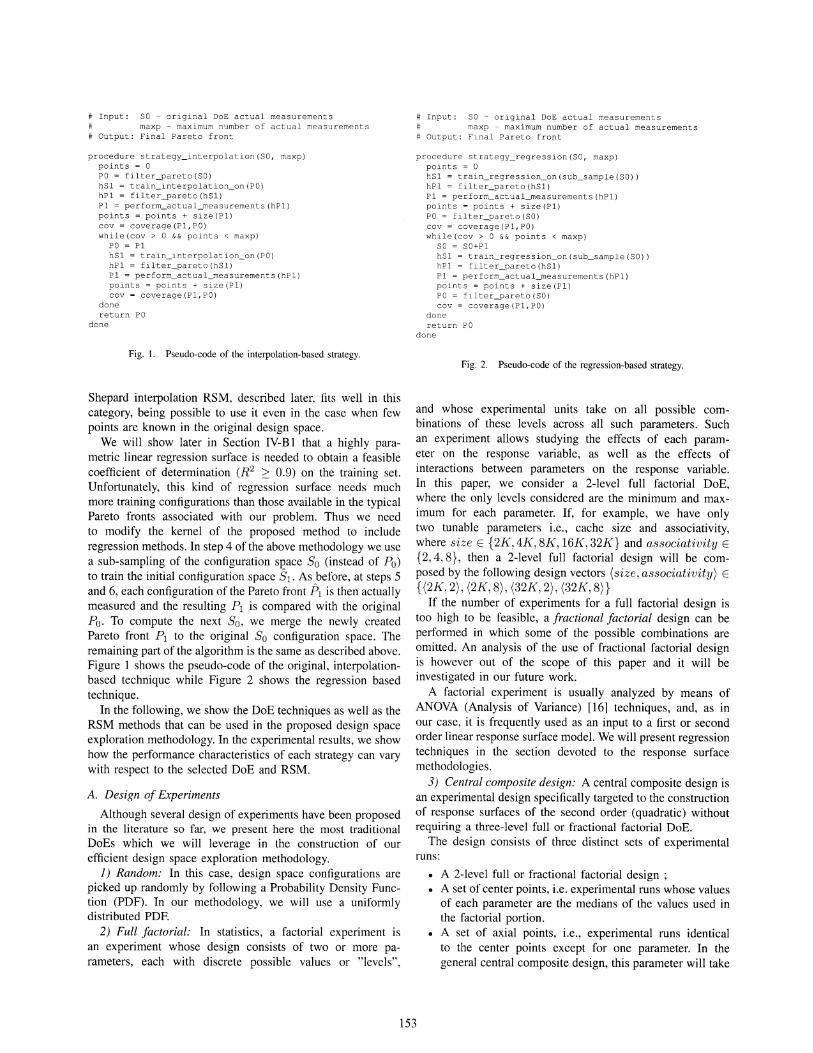
Input: SO - original DoE actual measurementsmaxp - maximum number of actual measurements
Output: Final Pareto front
procedure strategy_interpolation (SO, maxp)points = 0PO = filter-pareto(SO)hSl = train_interpolation_on(PO)hPl = filter_pareto (hSl)Pl = perform_actual_measurements(hPl)points = points + size(Pl)cov = coverage(Pl,PO)while(cov > 0 && points < maxp)
PO = PlhSl = train_interpolation_on(PO)hPl = filter_pareto (hSl)Pl = perform_actual_measurements(hPl)points = points + size(Pl)cov = coverage(Pl,PO)
donereturn PO
done
Fig. 1. Pseudo-code of the interpolation-based strategy.
Shepard interpolation RSM, described later, fits well in thiscategory, being possible to use it even in the case when fewpoints are known in the original design space.
We will show later in Section IV-B 1 that a highly parametric linear regression surface is needed to obtain a feasiblecoefficient of determination (R2 2: 0.9) on the training set.Unfortunately, this kind of regression surface needs muchmore training configurations than those available in the typicalPareto fronts associated with our problem. Thus we needto modify the kernel of the proposed method to includeregression methods. In step 4 of the above methodology we usea sub-sampling of the configuration space So (instead of Po)to train the initial configuration space SI. As before, at steps 5and 6, each configuration of the Pareto front PI is then actuallymeasured and the resulting PI is compared with the originalPo. To compute the next So, we merge the newly createdPareto front PI to the original So configuration space. Theremaining part of the algorithm is the same as described above.Figure 1 shows the pseudo-code of the original, interpolationbased technique while Figure 2 shows the regression basedtechnique.
In the following, we show the DoE techniques as well as theRSM methods that can be used in the proposed design spaceexploration methodology. In the experimental results, we showhow the performance characteristics of each strategy can varywith respect to the selected DoE and RSM.
A. Design of Experiments
Although several design of experiments have been proposedin the literature so far, we present here the most traditionalDoEs which we will leverage in the construction of ourefficient design space exploration methodology.
1) Random: In this case, design space configurations arepicked up randomly by following a Probability Density Function (PDF). In our methodology, we will use a uniformlydistributed PDF.
2) Full factorial: In statistics, a factorial experiment isan experiment whose design consists of two or more parameters, each with discrete possible values or "levels",
Input: SO - original DoE actual measurementsmaxp - maximum number of actual measurements
Output: Final Pareto front
procedure strategy_regression (SO, maxp)points = 0hSl = train_regression_on(sub_sample(SO))hPl = filter_pareto (hSl)Pl = perform_actual_measurements(hPl)points = points + size(Pl)PO = filter-pareto(SO)cov = coverage(Pl,PO)while (cov > 0 && points < maxp)
SO = SO+PlhSl = train_regression_on(sub_sample(SO))hPl = filter-pareto(hSl)Pl = perform_actual_measurements(hPl)points = points + size(Pl)PO = filter-pareto(SO)cov = coverage(Pl,PO)
donereturn PO
done
Fig. 2. Pseudo-code of the regression-based strategy.
and whose experimental units take on all possible combinations of these levels across all such parameters. Suchan experiment allows studying the effects of each parameter on the response variable, as well as the effects ofinteractions between parameters on the response variable.In this paper, we consider a 2-level full factorial DoE,where the only levels considered are the minimum and maximum for each parameter. If, for example, we have onlytwo tunable parameters i.e., cache size and associativity,where size E {2K, 4K, 8K, 16K, 32K} and associativity E
{2, 4, 8}, then a 2-level full factorial design will be composed by the following design vectors (size, associativity) E
{(2K,2), (2K,8), (32K,2), (32K,8)}If the number of experiments for a full factorial design is
too high to be feasible, a fractional factorial design can beperformed in which some of the possible combinations areomitted. An analysis of the use of fractional factorial designis however out of the scope of this paper and it will beinvestigated in our future work.
A factorial experiment is usually analyzed by means ofANOVA (Analysis of Variance) [16] techniques, and, as inour case, it is frequently used as an input to a first or secondorder linear response surface model. We will present regressiontechniques in the section devoted to the response surfacemethodologies.
3) Central composite design: A central composite design isan experimental design specifically targeted to the constructionof response surfaces of the second order (quadratic) withoutrequiring a three-level full or fractional factorial DoE.
The design consists of three distinct sets of experimentalruns:
• A 2-level full or fractional factorial design ;• A set of center points, i.e. experimental runs whose values
of each parameter are the medians of the values used inthe factorial portion.
• A set of axial points, i.e., experimental runs identicalto the center points except for one parameter. In thegeneral central composite design, this parameter will take
153
on values both below and above the median of the twolevels. In this paper, we will use a face centered centralcomposite design where the remaining parameter assumesthe upper and lower bounds of the parameter range.
Considering the previous example (cache size and associativity), a face centered central composite design will be composedof the following design vectors:
Coefficient of determination
0,8 +-----W ---t_,-
0,7-
0,6-
0::°,5-
0,4-
{(2](,2), (2](,8), (32](,2), (32](,8),(8](,4), (2](,4), (32](,4), (8](,2), (8](,8)}
(5)0,3-
O,2f--
where
{(8](,4), (2](,4), (32](,4), (8](,2), (8](,8)} (6)
is the total sum of squares of observations Yi and averageobservations y, and
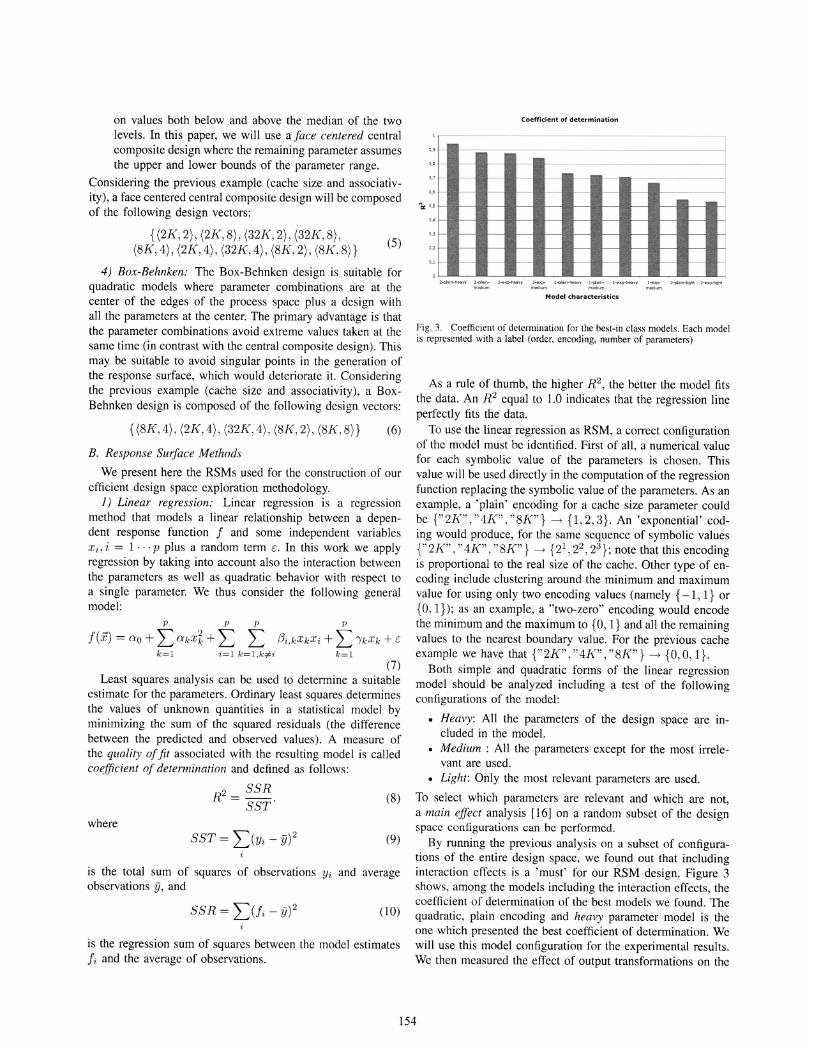
As a rule of thumb, the higher R2, the better the model fits
the data. An R2 equal to 1.0 indicates that the regression lineperfectly fits the data.
To use the linear regression as RSM, a correct configurationof the model must be identified. First of all, a numerical valuefor each symbolic value of the parameters is chosen. Thisvalue will be used directly in the computation of the regressionfunction replacing the symbolic value of the parameters. As anexample, a 'plain' encoding for a cache size parameter couldbe {" 2](" , "4](" , "8]("} ---t {I, 2, 3}. An 'exponential' coding would produce, for the same sequence of symbolic values{" 2](" , "4](" , "8]("} ---t {21 , 22 , 23 }; note that this encodingis proportional to the real size of the cache. Other type of encoding include clustering around the minimum and maximumvalue for using only two encoding values (namely {-I, I} or{a, I}); as an example, a "two-zero" encoding would encodethe minimum and the maximum to {O, I} and all the remainingvalues to the nearest boundary value. For the previous cacheexample we have that {" 2]("," 4](" ," 8]("} ---t {O, 0,1}.
Both simple and quadratic forms of the linear regressionmodel should be analyzed including a test of the followingconfigurations of the model:
• Heavy: All the parameters of the design space are included in the model.
• Medium : All the parameters except for the most irrelevant are used.
• Light: Only the most relevant parameters are used.
To select which parameters are relevant and which are not,a main effect analysis [16] on a random subset of the designspace configurations can be performed.
By running the previous analysis on a subset of configurations of the entire design space, we found out that includinginteraction effects is a 'must' for our RSM design. Figure 3shows, among the models including the interaction effects, thecoefficient of determination of the best models we found. Thequadratic, plain encoding and heavy parameter model is theone which presented the best coefficient of determination. Wewill use this model configuration for the experimental results.We then measured the effect of output transformations on the
O,lf--
Model characteristics
2-plaln-heavy 2-plain- 2-exp-heavy 2-exp- l-plain-heavy l-plain- l-exp-heavy l-exp- 2-plaln-light 2-exp-lightmedium medium medium medium
Fig. 3. Coefficient of determination for the best-in class models. Each modelis represented with a label (order, encoding, number of parameters)
(8)
(9)
(10)
p p p p
f(x) == ao +L akx~ +L L f3i,k x k x i +L rkXk + ck=1 i=1 k=1,k#i k=1
(7)Least squares analysis can be used to determine a suitable
estimate for the parameters. Ordinary least squares determinesthe values of unknown quantities in a statistical model byminimizing the sum of the squared residuals (the differencebetween the predicted and observed values). A measure ofthe quality of fit associated with the resulting model is calledcoefficient of deternzination and defined as follows:
R 2 == SSRSST'
B. Response Surface Methods
We present here the RSMs used for the construction of ourefficient design space exploration methodology.
J) Linear regression: Linear regression is a regressionmethod that models a linear relationship between a dependent response function f and some independent variablesXi, i == 1··· p plus a random term c. In this work we applyregression by taking into account also the interaction betweenthe parameters as well as quadratic behavior with respect toa single parameter. We thus consider the following generalmodel:
is the regression sum of squares between the model estimatesfi and the average of observations.
4) Box-Behnken: The Box-Behnken design is suitable forquadratic models where parameter combinations are at thecenter of the edges of the process space plus a design withall the parameters at the center. The primary advantage is thatthe parameter combinations avoid extreme values taken at thesame time (in contrast with the central composite design). Thismay be suitable to avoid singular points in the generation ofthe response surface, which would deteriorate it. Consideringthe previous example (cache size and associativity), a BoxBehnken design is composed of the following design vectors:
154
"pre=l""pre=O.5"'pre=log""pre=-l"
12
Power
oL-_---l..-__..l..---_--i.-__...l..--_------'-__~_ _____'
~ ~ ~ ~ 1~
num_samples
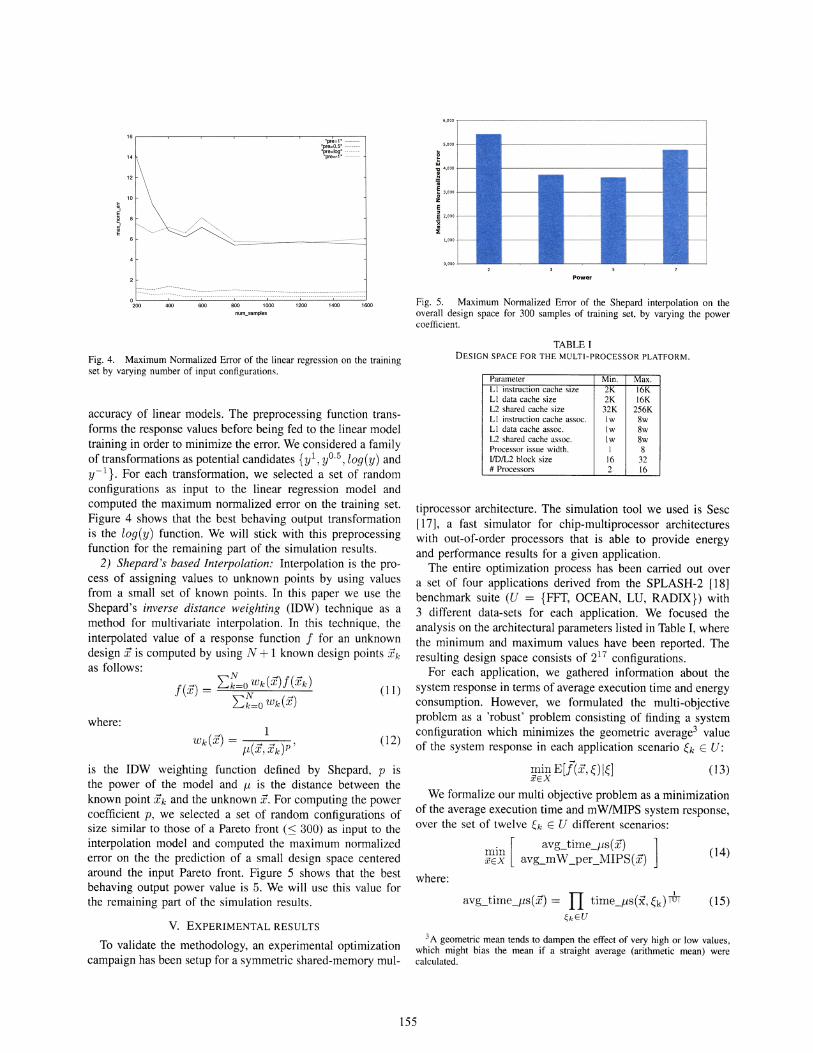
Fig. 5. Maximum Normalized Error of the Shepard interpolation on theoverall design space for 300 samples of training set, by varying the powercoefficient.
(12)
where:
(14)
(13)
Parameter Min. Max.L1 instruction cache size 2K 16KL1 data cache size 2K 16KL2 shared cache size 32K 256KLl instruction cache assoc. lw 8wLl data cache assoc. lw 8wL2 shared cache assoc. lw 8wProcessor issue width. 1 8I/D1L2 block size 16 32# Processors 2 16
3A geometric mean tends to dampen the effect of very high or low values,which might bias the mean if a straight average (arithmetic mean) werecalculated.
TABLE IDESIGN SPACE FOR THE MULTI-PROCESSOR PLATFORM.
avg_time_f-Ls(x) == IT tirne_f-Ls(x, ~k) I~I (15)f"kEU
tiprocessor architecture. The simulation tool we used is Sesc[17], a fast simulator for chip-multiprocessor architectureswith out-of-order processors that is able to provide energyand performance results for a given application.
The entire optimization process has been carried out overa set of four applications derived from the SPLASH-2 [18]benchmark suite (U == {FFT, OCEAN, LU, RADIX}) with3 different data-sets for each application. We focused theanalysis on the architectural parameters listed in Table I, wherethe minimum and maximum values have been reported. Theresulting design space consists of 217 configurations.
For each application, we gathered information about thesystem response in terms of average execution time and energyconsumption. However, we formulated the multi-objectiveproblem as a 'robust' problem consisting of finding a systemconfiguration which minimizes the geometric average3 valueof the system response in each application scenario ~k E U:
We formalize our multi objective problem as a minimizationof the average execution time and mWIMIPS system response,over the set of twelve ~k E U different scenarios:. l avg_time_IIs(x) ]nnn -+
xEX avg_mW_per_MIPS (x)
(11 )
where:
V. EXPERIMENTAL RESULTS
To validate the methodology, an experimental optimizationcampaign has been setup for a symmetric shared-memory mul-
-+ 1W k (x) = (~~ )p'
/1 X,Xk
is the IDW weighting function defined by Shepard, p isthe power of the model and f-L is the distance between theknown point Xk and the unknown X. For computing the powercoefficient p, we selected a set of random configurations ofsize similar to those of a Pareto front (::; 300) as input to theinterpolation model and computed the maximum normalizederror on the the prediction of a small design space centeredaround the input Pareto front. Figure 5 shows that the bestbehaving output power value is 5. We will use this value forthe remaining part of the simulation results.
Fig. 4. Maximum Normalized Error of the linear regression on the trainingset by varying number of input configurations.
accuracy of linear models. The preprocessing function transforms the response values before being fed to the linear modeltraining in order to minimize the error. We considered a familyof transformations as potential candidates {y1, yO.5, log(y) andy -1 }. For each transformation, we selected a set of randomconfigurations as input to the linear regression model andcomputed the maximum normalized error on the training set.Figure 4 shows that the best behaving output transformationis the log(y) function. We will stick with this preprocessingfunction for the remaining part of the simulation results.
2) Shepard's based Interpolation: Interpolation is the process of assigning values to unknown points by using valuesfrom a small set of known points. In this paper we use theShepard's inverse distance weighting (IDW) technique as amethod for multivariate interpolation. In this technique, theinterpolated value of a response function f for an unknowndesign x is computed by using N +1 known design points xk
as follows:
155
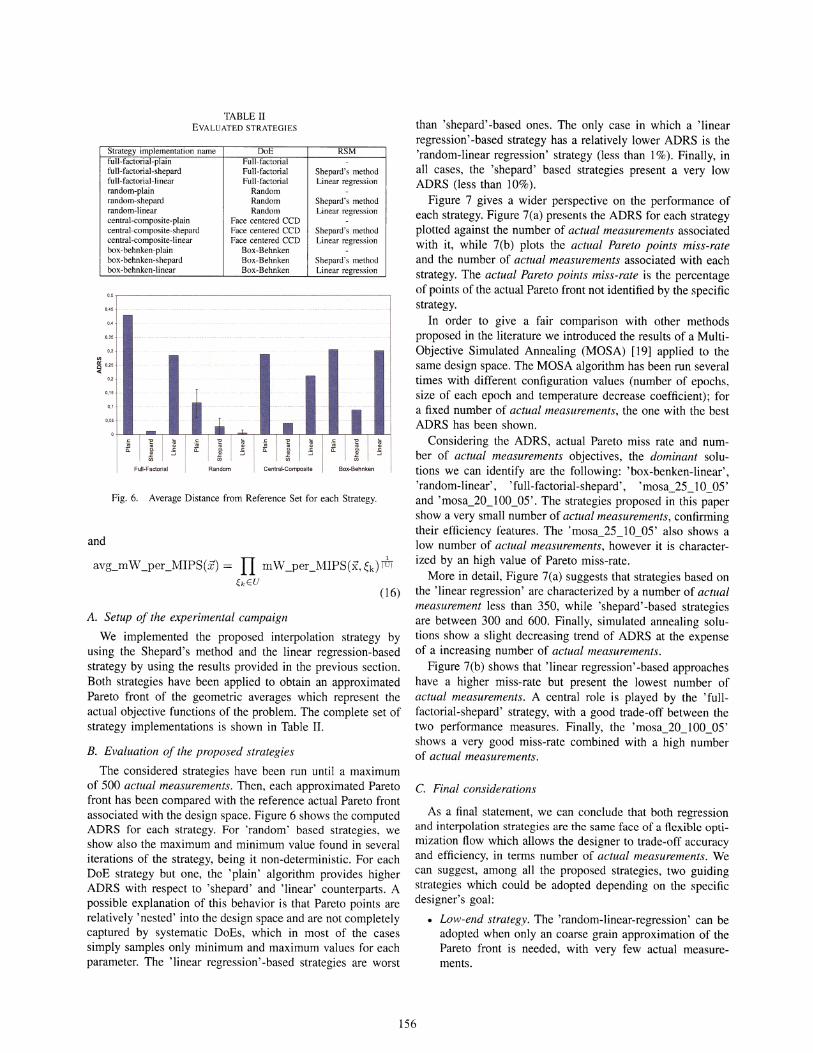
TABLE IIEVALUATED STRATEGIES
Strategy implementation name DoE RSMfull-factorial-plain Full-factorialfull-factorial-shepard Full-factorial Shepard's methodfull-factorial-linear Full-factorial Linear regressionrandom-plain Randomrandom-shepard Random Shepard's methodrandom-linear Random Linear regressioncentral-composite-plain Face centered CCDcentral-composite-shepard Face centered CCD Shepard's methodcentral-composite-linear Face centered CCD Linear regressionbox-behnken-plain Box-Behnkenbox-behnken-shepard Box-Behnken Shepard's methodbox-behnken-linear Box-Behnken Linear regression
II)
~ 0,25
<0,2
0,15
Fig. 6. Average Distance from Reference Set for each Strategy.
and
avg_illW_per_MIPS (x) == II illW_per_MIPS (x, ~k) 11~1E,kEU
(16)
A. Setup of the experimental campaign
We implemented the proposed interpolation strategy byusing the Shepard's method and the linear regression-basedstrategy by using the results provided in the previous section.Both strategies have been applied to obtain an approximatedPareto front of the geometric averages which represent theactual objective functions of the problem. The complete set ofstrategy implementations is shown in Table II.
B. Evaluation of the proposed strategies
The considered strategies have been run until a maximumof 500 actual measurements. Then, each approximated Paretofront has been compared with the reference actual Pareto frontassociated with the design space. Figure 6 shows the computedADRS for each strategy. For 'random' based strategies, weshow also the maximum and minimum value found in severaliterations of the strategy, being it non-deterministic. For eachDoE strategy but one, the 'plain' algorithm provides higherADRS with respect to 'shepard' and 'linear' counterparts. Apossible explanation of this behavior is that Pareto points arerelatively 'nested' into the design space and are not completelycaptured by systematic DoEs, which in most of the casessimply samples only minimum and maximum values for eachparameter. The 'linear regression' -based strategies are worst
than 'shepard' -based ones. The only case in which a 'linearregression' -based strategy has a relatively lower ADRS is the'random-linear regression' strategy (less than 1%). Finally, inall cases, the 'shepard' based strategies present a very lowADRS (less than 10%).
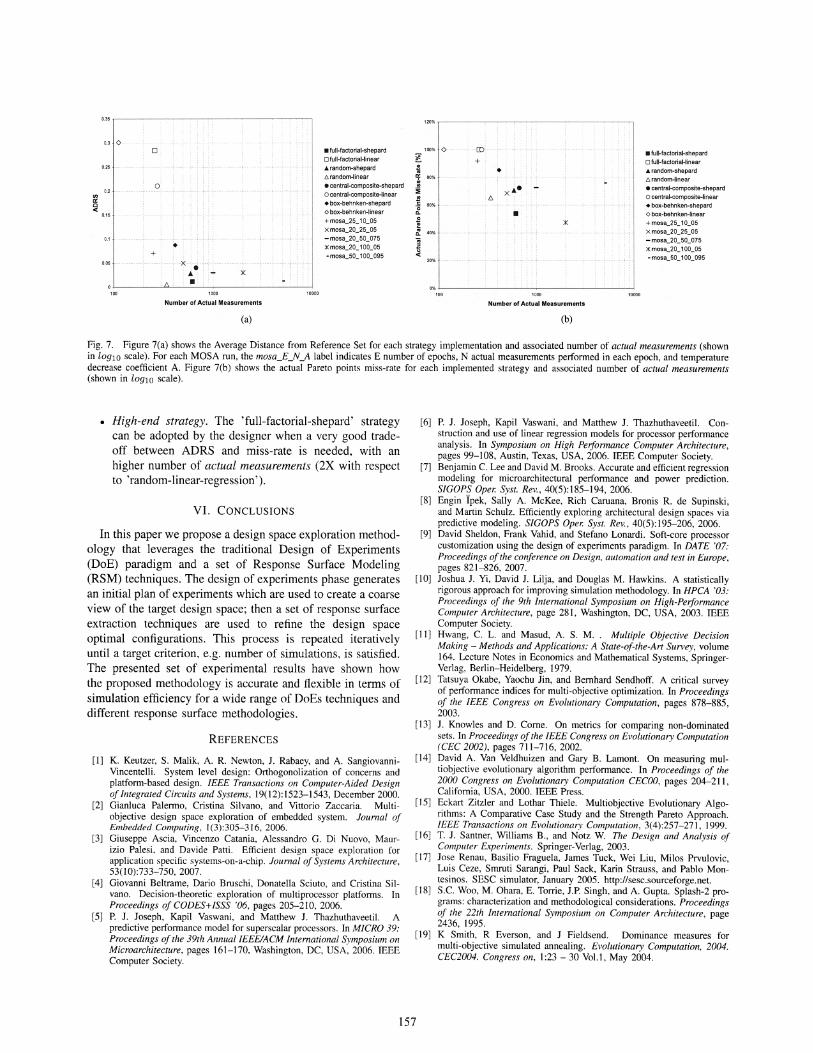
Figure 7 gives a wider perspective on the performance ofeach strategy. Figure 7(a) presents the ADRS for each strategyplotted against the number of actual measurements associatedwith it, while 7(b) plots the actual Pareto points miss-rateand the number of actual measurements associated with eachstrategy. The actual Pareto points miss-rate is the percentageof points of the actual Pareto front not identified by the specificstrategy.
In order to give a fair comparison with other methodsproposed in the literature we introduced the results of a MultiObjective Simulated Annealing (MOSA) [19] applied to thesame design space. The MOSA algorithm has been run severaltimes with different configuration values (number of epochs,size of each epoch and temperature decrease coefficient); fora fixed number of actual measurements, the one with the bestADRS has been shown.
Considering the ADRS, actual Pareto miss rate and number of actual measurements objectives, the dominant solutions we can identify are the following: 'box-benken-linear','random-linear', 'full-factorial-shepard', 'mosa_25_10_05'and 'mosa_20_100_05'. The strategies proposed in this papershow a very small number of actual measurements, confirmingtheir efficiency features. The 'mosa_25_10_05' also shows alow number of actual measurements, however it is characterized by an high value of Pareto miss-rate.
More in detail, Figure 7(a) suggests that strategies based onthe 'linear regression' are characterized by a number of actualmeasurement less than 350, while 'shepard' -based strategiesare between 300 and 600. Finally, simulated annealing solutions show a slight decreasing trend of ADRS at the expenseof a increasing number of actual measurements.
Figure 7(b) shows that 'linear regression' -based approacheshave a higher miss-rate but present the lowest number ofactual measurements. A central role is played by the 'fullfactorial-shepard' strategy, with a good trade-off between thetwo performance measures. Finally, the 'mosa_20_100_05'shows a very good miss-rate combined with a high numberof actual measurements.
C. Final considerations
As a final statement, we can conclude that both regressionand interpolation strategies are the same face of a flexible optimization flow which allows the designer to trade-off accuracyand efficiency, in terms number of actual measurements. Wecan suggest, among all the proposed strategies, two guidingstrategies which could be adopted depending on the specificdesigner's goal:
• Low-end strategy. The 'random-linear-regression' can beadopted when only an coarse grain approximation of thePareto front is needed, with very few actual measurements.
156
Number of Actual Measurements
(a)
• full-factorial-shepardo full-factorial-linear
... random-shepard
£:::, random-linear
• central-composite-shepardo central-composite-linear
• box-behnken-shepardo box-behnken-linear
+ mosa_25_10_05
x mosa_20_25_05
- mosa_20_50_075
::K mosa_20_100_05
- mosa_50_100_095
CD
+•
...X
•
0% +-----------,-----------i100
Number of Actual Measurements
(b)
• full-factorial-shepardo full-factorial-linear
... random-shepard
£:::, random-linear
• central-composite-shepardo central-composite-linear
• box-behnken-shepardo box-behnken-linear
+ mosa_25_10_05
X mosa_20_25_05
- mosa_20_50_075
::K mosa_20_100_05
- mosa_50_1 00_095
~ig. 7. Figure 7(a) shows the Average Distance from Reference Set for each strategy implementation and associated number of actual measurements (shownIn log10 scale). ~or each ~OSA run, the mosa_E_N_A label indicates E number of epochs, N actual measurements performed in each epoch, and temperaturedecrease coefficIent A. FIgure 7(b) shows the actual Pareto points miss-rate for each implemented strategy and associated number of actual measurements(shown in log10 scale).
• High-end strategy. The 'full-factorial-shepard' strategycan be adopted by the designer when a very good tradeoff between ADRS and miss-rate is needed, with anhigher number of actual measurements (2X with respectto 'random-linear-regression').
VI. CONCLUSIONS
In this paper we propose a design space exploration methodology that leverages the traditional Design of Experiments(DoE) paradigm and a set of Response Surface Modeling(RSM) techniques. The design of experiments phase generatesan initial plan of experiments which are used to create a coarseview of the target design space; then a set of response surfaceextraction techniques are used to refine the design spaceoptimal configurations. This process is repeated iterativelyuntil a target criterion, e.g. number of simulations, is satisfied.The presented set of experimental results have shown howthe proposed methodology is accurate and flexible in terms ofsimulation efficiency for a wide range of DoEs techniques anddifferent response surface methodologies.
REFERENCES
[1] K. Keutzer, S. Malik, A. R. Newton, 1. Rabaey, and A. SangiovanniVincentelli. System level design: Orthogonolization of concerns andplatform-based design. IEEE Transactions on Computer-Aided Designof Integrated Circuits and Systems, 19(12):1523-1543, December 2000.
[2] Gianluca Palermo, Cristina Silvano, and Vittorio Zaccaria. Multiobjective design space exploration of embedded system. Jounwl ofEmbedded Computing, 1(3):305-316, 2006.
[3] Giuseppe Ascia, Vincenzo Catania, Alessandro G. Di Nuovo, Maurizio Palesi, and Davide Patti. Efficient design space exploration forapplication specific systems-on-a-chip. Journal of Systems Architecture,53(10):733-750, 2007.
[4] Giovanni Be1trame, Dario Bruschi, Donatella Sciuto, and Cristina Silvano. Decision-theoretic exploration of multiprocessor platforms. InProceedings of CODES+ISSS '06, pages 205-210, 2006.
[5] P. 1. Joseph, Kapil Vaswani, and Matthew J. Thazhuthaveetil. Apredictive performance model for superscalar processors. In MICRO 39:Proceedings of the 39th Annual IEEE/ACM International Symposium onMicroarchitecture, pages 161-170, Washington, DC, USA, 2006. IEEEComputer Society.
[6] P. 1. Joseph, Kapil Vaswani, and Matthew J. Thazhuthaveetil. Construction and use of linear regression models for processor performanceanalysis. In Symposium on High Peifonnance Computer Architecture,pages 99-108, Austin, Texas, USA, 2006. IEEE Computer Society.
[7] Benjamin C. Lee and David M. Brooks. Accurate and efficient regressionmodeling for microarchitectural performance and power prediction.SIGOPS Oper. Syst. Rev., 40(5):185-194,2006.
[8] Engin Ipek, Sally A. McKee, Rich Caruana, Bronis R. de Supinski,and Martin Schulz. Efficiently exploring architectural design spaces viapredictive modeling. SIGOPS Oper. Syst. Rev., 40(5):195-206, 2006.
[9] David Sheldon, Frank Vahid, and Stefano Lonardi. Soft-core processorcustomization using the design of experiments paradigm. In DATE '07:Proceedings of the conference on Design, automation and test in Europe,pages 821-826, 2007.
[10] Joshua 1. Yi, David 1. Lilja, and Douglas M. Hawkins. A statisticallyrigorous approach for improving simulation methodology. In HPCA '03:Proceedings of the 9th International Symposium on High-PeiformanceComputer Architecture, page 281, Washington, DC, USA, 2003. IEEEComputer Society.
[11] Hwang, C. L. and Masud, A. S. M.. Multiple Objective DecisionMaking - Methods and Applications: A State-of-the-Art Survey, volume164. Lecture Notes in Economics and Mathematical Systems, SpringerVerlag, Berlin-Heidelberg, 1979.
[12] Tatsuya Okabe, Yaochu Jin, and Bernhard Sendhoff. A critical surveyof performance indices for multi-objective optimization. In Proceedingsof the IEEE Congress on Evolutionary Computation, pages 878-885,2003.
[13] J. Knowles and D. Come. On metrics for comparing non-dominatedsets. In Proceedings of the IEEE Congress on Evolutionary Computation(CEC 2002), pages 711-716,2002.
[14] David A. Van Veldhuizen and Gary B. Lamont. On measuring multiobjective evolutionary algorithm performance. In Proceedings of the2000 Congress on Evolutionary Computation CECOO, pages 204-21 1,California, USA, 2000. IEEE Press.
[15] Eckart Zitzler and Lothar Thiele. Multiobjective Evolutionary Algorithms: A Comparative Case Study and the Strength Pareto Approach.IEEE Transactions on Evolutionary Computation, 3(4):257-271, 1999.
[16] T. J. Santner, Williams B., and Notz W. The Design and Analysis ofComputer Experiments. Springer-Verlag, 2003.
[17] Jose Renau, Basilio Fraguela, James Tuck, Wei Liu, Milos Prvulovic,Luis Ceze, Smruti Sarangi, Paul Sack, Karin Strauss, and Pablo Montesinos. SESC simulator, January 2005. http://sesc.sourceforge.net.
[18] S.C. Woo, M. Ohara, E. Torrie, 1.p. Singh, and A. Gupta. Splash-2 programs: characterization and methodological considerations. Proceedingsof the 22th International Symposium on Computer Architecture, page2436, 1995.
[19] K Smith, R Everson, and J Fieldsend. Dominance measures formulti-objective simulated annealing. Evolutionary Computation, 2004.CEC2004. Congress on, 1:23 - 30 Vol. 1, May 2004.
157
Related Documents


