3 An Ecotoxicological Approach to Evaluate the Environmental Quality of Inland Waters M. Guida 4 , O. De Castro 1 , S. Leva 4 , L. Copia 4 , G.D’Acunzi 3 , F. Landi 3 , M. Inglese 2 and R.A. Nastro 5 1 Department of Biological Sciences-University “FedericoII” of Naples, 2 Laboratory of Environmental and Food Analyses Studies “Inglese & co. ltd”, 3 Salerno District Administration Bureau, 4 Department of Structural and Functional Biology,University “Federico II”of Naples, 5 Department of Sciences for the Environment, University Parthenope of Naples, Italy 1. Introduction Water is traditionally considered a renewable resource as the quantity theoretically available depends essentially on meteoric water contributions. Modern theories consider river ecosystem as a central element of the environment but, actually, water ecosystems are more and more polluted because of agricultural and industrial activities. In Italy, where there is a widespread urbanization, most part of river ecosystems are exposed to a severe risk of damage, with consequent loss of biodiversity. The institution of national and regional parks makes possible the preservation of significant natural value areas. In 1974, the UNESCO established a “World Network of Biosphere Reserves” (WNBR) aimed to preserve areas, where there is a close relation between man and nature, through environmental preservation and sustainable development (UNESCO,2010). Nevertheless, a constant monitoring along the whole watercourse (from spring to mouth) is needed as, even in a protected area, human activities could cause, directly or indirectly, damages to valuable ecosystems. 1.1 The ecotoxicology In recent years, ecotoxicology started a new approach to the environmental analysis as it covers: • chemistry, i.e. the fate of chemicals in the environment • environmental toxicology, dealing with the evaluation of toxic effects of a pollutant at different levels of biological integration • ecology, which provides indications on regulation of both structure and function of ecosystems and, at the same time, on interactions between biotic and abiotic components (De Castro et al., 2007). Ecotoxicology is based on the use of bio-indicators belonging to different levels of an ecosystem trophyc chain. Mathematical models are also used to foresee the environmental www.intechopen.com

Welcome message from author
This document is posted to help you gain knowledge. Please leave a comment to let me know what you think about it! Share it to your friends and learn new things together.
Transcript
3
An Ecotoxicological Approach to Evaluate the Environmental Quality of Inland Waters
M. Guida4, O. De Castro1, S. Leva4, L. Copia4, G.D’Acunzi3, F. Landi3, M. Inglese2 and R.A. Nastro5
1Department of Biological Sciences-University “FedericoII” of Naples, 2Laboratory of Environmental and Food Analyses Studies “Inglese & co. ltd”,
3Salerno District Administration Bureau, 4Department of Structural and Functional Biology,University “Federico II”of Naples,
5Department of Sciences for the Environment, University Parthenope of Naples, Italy
1. Introduction
Water is traditionally considered a renewable resource as the quantity theoretically available
depends essentially on meteoric water contributions. Modern theories consider river
ecosystem as a central element of the environment but, actually, water ecosystems are more
and more polluted because of agricultural and industrial activities. In Italy, where there is a
widespread urbanization, most part of river ecosystems are exposed to a severe risk of
damage, with consequent loss of biodiversity. The institution of national and regional parks
makes possible the preservation of significant natural value areas. In 1974, the UNESCO
established a “World Network of Biosphere Reserves” (WNBR) aimed to preserve areas,
where there is a close relation between man and nature, through environmental preservation
and sustainable development (UNESCO,2010). Nevertheless, a constant monitoring along the
whole watercourse (from spring to mouth) is needed as, even in a protected area, human
activities could cause, directly or indirectly, damages to valuable ecosystems.
1.1 The ecotoxicology
In recent years, ecotoxicology started a new approach to the environmental analysis as it covers:
• chemistry, i.e. the fate of chemicals in the environment
• environmental toxicology, dealing with the evaluation of toxic effects of a pollutant at
different levels of biological integration
• ecology, which provides indications on regulation of both structure and function of
ecosystems and, at the same time, on interactions between biotic and abiotic
components (De Castro et al., 2007).
Ecotoxicology is based on the use of bio-indicators belonging to different levels of an
ecosystem trophyc chain. Mathematical models are also used to foresee the environmental
www.intechopen.com

Ecological Water Quality – Water Treatment and Reuse
46
fate of chemicals and their effects on exposed organisms (man included) and ecosystems.
An organism can be considered a” bio-indicator” when, in presence of pollutants, shows
detectable variations from its natural state. Well defined responses to different
concentrations of pollutants are also needed. Moreover, a good bio-indicator should be
sensitive to pollutants and have a wide distribution in the investigated environment, low
mobility, long life cycle and genetic uniformity. Actually, Daphnia magna, Lepidium
sativum, Cucumis sativus, Sorghum saccharatum, Pseudokirchneriella subcapitata, Vibrio fischeri
are widely used to evaluate water and soil quality as well as the toxicity of chemicals,
wastes, pharmaceutical products which have to be processed in a wastewater plant or
directly dumped in the environment. The main symptoms or endpoints of an
ecotoxicological test could be:
• change in community structure;
• morphological changes;
• change in vitality;
• damage to genes.
Actually, a contemporary utilization of different bio-indicators in order to evaluate the
ecotoxicity of a matrix (wastewater, contaminated soil, pharmaceutical by-products, etc.) let
the researchers able to gain useful data about the possible toxic effects on an ecosystem
(Guida et al., 2006). In the next lines, informations about biology of some test-organisms
adopted in ecotoxicological analyses and about the main indices and parameters used in the
evaluation of a river ecosystem quality are resumed.
1.1.1 Daphnia magna
Daphnia magna is a freshwater crustacean belonging to the class Brachiopoda, order
Cladocera, phylum Arthropoda. It has a small size (not more than 5 mm in length) with an
oval body compressed laterally. It is dorsally characterized by a welded bivalve structure
(called “carapace”), which encloses the entire animal except for the head. Its body has a
single compound eye, sessile, strongly pigmented; a small ocellus and two pairs of
antennae. One pair of antennae is greedy and very developed, having essentially a
swimming function. The transparency of carapace allows an observer to notice some
internal organs: heart, located dorsally in the post-cephalic region, middle intestine (clearly
visible when it contains food) and ovaries, that are located laterally. At a temperature of
20°C, the life cycle of D. magna is 60-100 days. Under favourable environmental conditions,
the population is exclusively composed of female animals, with a parthenogenetic
reproduction. This species is very sensitive to many pollutants able to cause variations to
aquatic ecosystem, since it is considered the “perfect” bioindicator and test-organisms in
ecotoxicological essays (Guida et al.,2004).
1.1.2 Vibrio fisheri
Vibrio fischeri is a rod-shaped Proteobacterium, gram negative, characterized by polar
flagella. It is widespread in marine environments, living as symbiotic of various marine
animals, such as the bobtail squid. V. fischeri is most often found as a symbiont of Euprymna
scolopes, a small shallow water squid found on the shores of Hawaii.
www.intechopen.com
An Ecotoxicological Approach to Evaluate the Environmental Quality of Inland Waters
47
Fig. 1. A female individual of Daphnia magna: internal and external anatomy. (FAO, 1996)
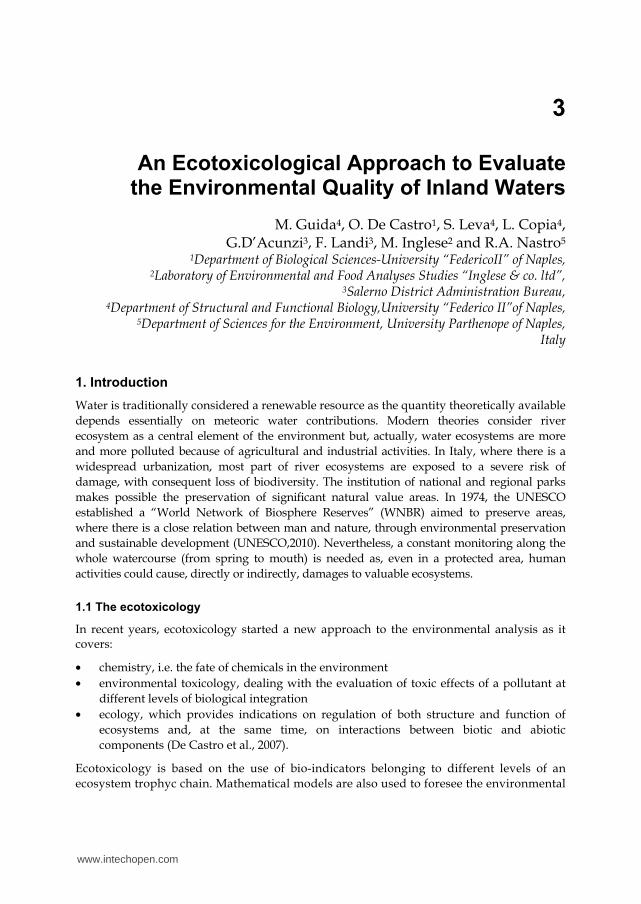
Fig. 2. The bioluminescence of Vibrio fisheri (1000X). Image taken by E. Nelson and L. Sycuro (http://microbewiki.kenyon.edu; last accessed: September 2011).
The bioluminescent bacterium Vibrio fischeri and juveniles of Euprymna scolopes specifically
recognize and respond
to each other during the formation of a persistent colonization
within
the host's nascent light-emitting organ. The biolumiscence depends on metabolic activity of
bacteria so, damaged microrganisms less in biolumiscence. This feature has been used to
study toxicity in marine samples.
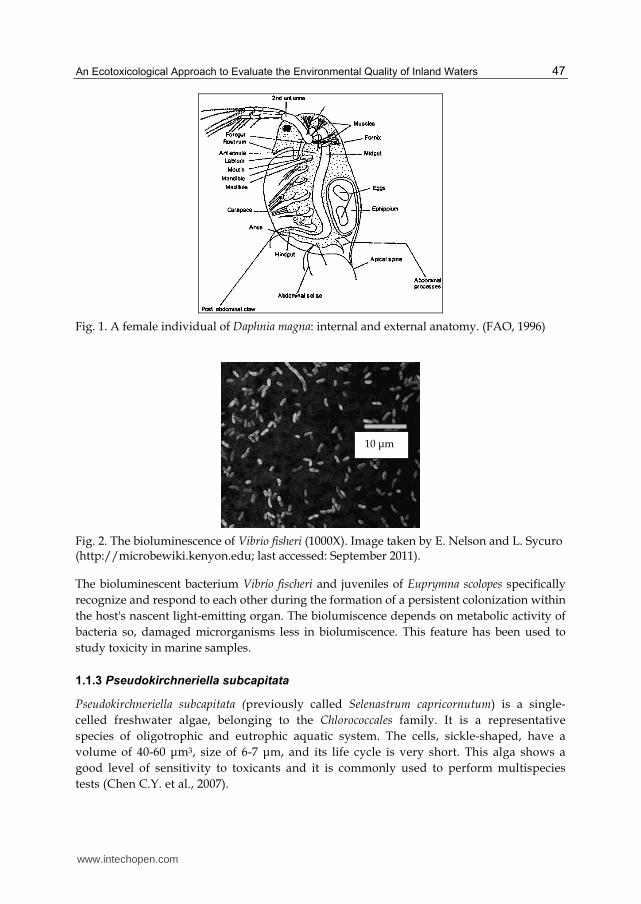
1.1.3 Pseudokirchneriella subcapitata
Pseudokirchneriella subcapitata (previously called Selenastrum capricornutum) is a single-
celled freshwater algae, belonging to the Chlorococcales family. It is a representative
species of oligotrophic and eutrophic aquatic system. The cells, sickle-shaped, have a
volume of 40-60 μm3, size of 6-7 μm, and its life cycle is very short. This alga shows a
good level of sensitivity to toxicants and it is commonly used to perform multispecies
tests (Chen C.Y. et al., 2007).
10 μm
www.intechopen.com
Ecological Water Quality – Water Treatment and Reuse
48
Fig. 3. Image at light microscope of P.subcapitata (1000x). (http://www.shigen.nig.ac.jp; last accessed: September 2011)
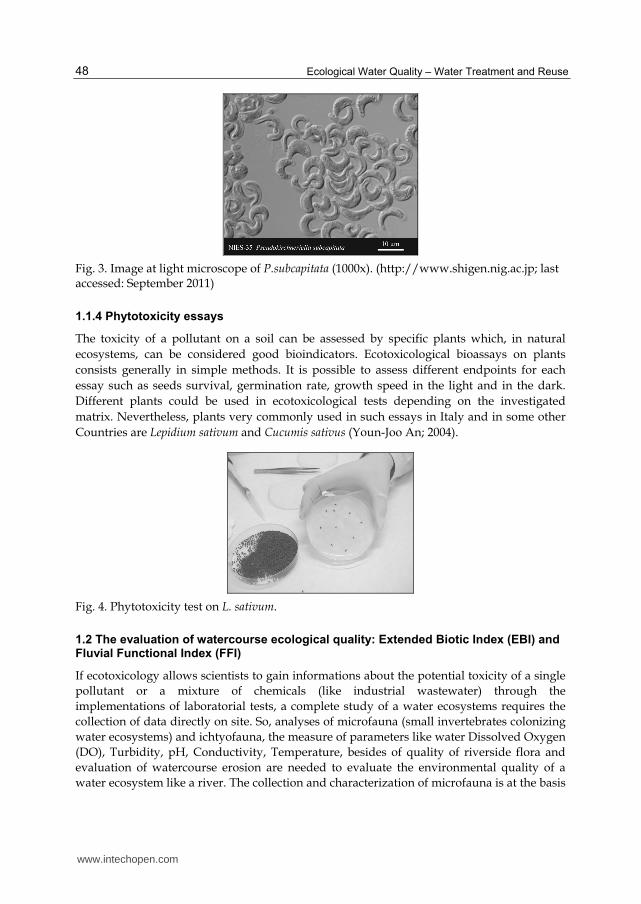
1.1.4 Phytotoxicity essays
The toxicity of a pollutant on a soil can be assessed by specific plants which, in natural
ecosystems, can be considered good bioindicators. Ecotoxicological bioassays on plants
consists generally in simple methods. It is possible to assess different endpoints for each
essay such as seeds survival, germination rate, growth speed in the light and in the dark.
Different plants could be used in ecotoxicological tests depending on the investigated
matrix. Nevertheless, plants very commonly used in such essays in Italy and in some other
Countries are Lepidium sativum and Cucumis sativus (Youn-Joo An; 2004).
Fig. 4. Phytotoxicity test on L. sativum.
1.2 The evaluation of watercourse ecological quality: Extended Biotic Index (EBI) and Fluvial Functional Index (FFI)
If ecotoxicology allows scientists to gain informations about the potential toxicity of a single
pollutant or a mixture of chemicals (like industrial wastewater) through the
implementations of laboratorial tests, a complete study of a water ecosystems requires the
collection of data directly on site. So, analyses of microfauna (small invertebrates colonizing
water ecosystems) and ichtyofauna, the measure of parameters like water Dissolved Oxygen
(DO), Turbidity, pH, Conductivity, Temperature, besides of quality of riverside flora and
evaluation of watercourse erosion are needed to evaluate the environmental quality of a
water ecosystem like a river. The collection and characterization of microfauna is at the basis
www.intechopen.com

An Ecotoxicological Approach to Evaluate the Environmental Quality of Inland Waters
49
of the Extended Biotic index (EBI), whose value is used to classify the quality of freshwater
courses in Italy (Ghetti P., 1997). Further biotic indices based on the quali-quantitative
analysis of invertebrates community are also used with the same aim (Kalyoncu H. and
Zeybek M., 2011). Once calculated the EBI value (ranging from 0 to 12), a class of
environmental quality is attributed to each stream or river or part of it. There are 5 classes
available, corresponding to a well defined colour (Table 1). Colours are used to report the
classification of environmental quality on a map of the watercourse. Like EBI, Fluvial
Functioning Index (FFI) values correspond to well defined quality classes (Negri P.et al.,
2011). Recently, National Environmental Protection Agency of Italy suggested FFI for a
correct evaluation of the health of river ecosystems (APAT, 2007). It must be underlined that
FFI categories are as recommended by Water Framework Directive 2000/60 (Negri P. et al.,
2011).
Classes E.B.I. (Values)
Outcome Colour
Class I 10-11-12…
Watercourse not significantly polluted or not polluted at all
Blue
Class II 8-9 Watercourse moderately polluted or altered Green
Class III 6-7 Watercourse polluted or altered Yellow
Class IV 4-5 Watercourse highly polluted or altered Brown
Class V 1-2-3 Watercourse extraordinarily polluted of altered Red
Table 1. Classes of environmental quality corresponding to EBI values.
The above mentioned indices are based on a simply concept: a watercourse is a dynamic
system, formed by different habitats which continuously follow each other from the source
down to the mouth and which interconnect with the surrounding terrestrial ecosystems. It is
important to notice how, along the course of a river, the environmental conditions (like
morphological, hydrodynamic, physical and chemical parameters) change and, with respect
to these, the biological populations vary too. That’s why the state of a river ecosystem must
be evaluated along the whole course in pre-determinate stations. The study of the whole
territory crossed by the river and the identification of possible critical situation is of a great
importance as it could affect heavily the results of a monitoring activity. The hydro-geologic
conformation of the river is also important as it could affect the accessibility to sampling
stations. So, an adequate preliminary study, a good experience in the choice of sampling
sites, besides of a suitable equipment, are necessary.
1.3 Other indices
According to EU Regulation 2000/60/CE published on 10/23/2000 (the Water Framework
Directive), the quality of a watercourse has to be evaluated through both Ecological and
Chemical States indices. From the elaboration of these indices, the Ecological State of
Watercourse (ESW Index) could be calculated. Another index widely used is the Evaluation
of Macro-descriptors Pollution Level (EMPL) which is calculated from the following
parameters: Chemical Oxygen Demand (COD), Biochemical Oxygen Demand at 5 days
(BOD5), NO3-, NH4+,Total Phosphorous, Escherichia coli, Oxygen saturation rate.
www.intechopen.com
Ecological Water Quality – Water Treatment and Reuse
50
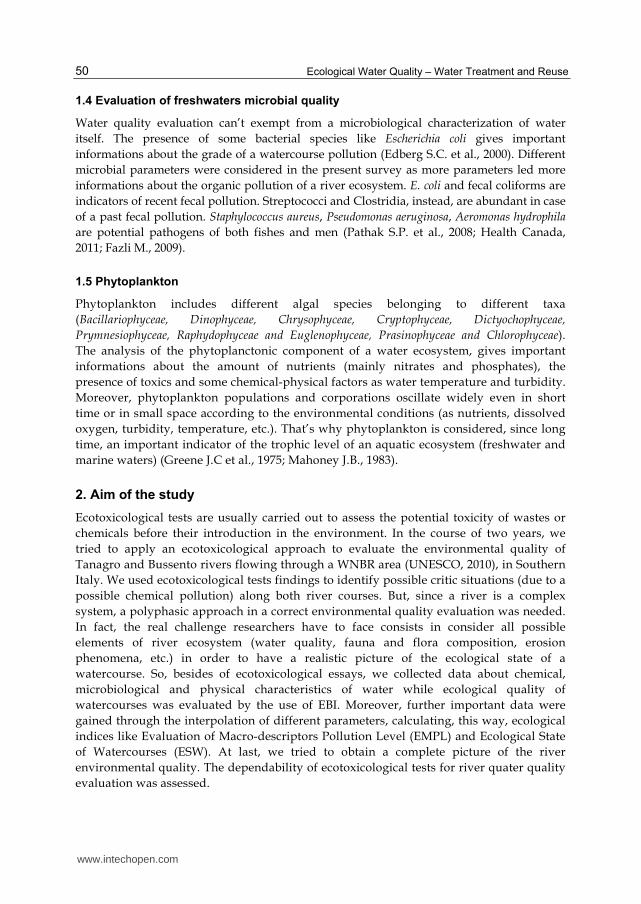
1.4 Evaluation of freshwaters microbial quality
Water quality evaluation can’t exempt from a microbiological characterization of water
itself. The presence of some bacterial species like Escherichia coli gives important
informations about the grade of a watercourse pollution (Edberg S.C. et al., 2000). Different
microbial parameters were considered in the present survey as more parameters led more
informations about the organic pollution of a river ecosystem. E. coli and fecal coliforms are
indicators of recent fecal pollution. Streptococci and Clostridia, instead, are abundant in case
of a past fecal pollution. Staphylococcus aureus, Pseudomonas aeruginosa, Aeromonas hydrophila
are potential pathogens of both fishes and men (Pathak S.P. et al., 2008; Health Canada,
2011; Fazli M., 2009).
1.5 Phytoplankton
Phytoplankton includes different algal species belonging to different taxa
(Bacillariophyceae, Dinophyceae, Chrysophyceae, Cryptophyceae, Dictyochophyceae,
Prymnesiophyceae, Raphydophyceae and Euglenophyceae, Prasinophyceae and Chlorophyceae).
The analysis of the phytoplanctonic component of a water ecosystem, gives important
informations about the amount of nutrients (mainly nitrates and phosphates), the
presence of toxics and some chemical-physical factors as water temperature and turbidity.
Moreover, phytoplankton populations and corporations oscillate widely even in short
time or in small space according to the environmental conditions (as nutrients, dissolved
oxygen, turbidity, temperature, etc.). That’s why phytoplankton is considered, since long
time, an important indicator of the trophic level of an aquatic ecosystem (freshwater and
marine waters) (Greene J.C et al., 1975; Mahoney J.B., 1983).
2. Aim of the study
Ecotoxicological tests are usually carried out to assess the potential toxicity of wastes or
chemicals before their introduction in the environment. In the course of two years, we
tried to apply an ecotoxicological approach to evaluate the environmental quality of
Tanagro and Bussento rivers flowing through a WNBR area (UNESCO, 2010), in Southern
Italy. We used ecotoxicological tests findings to identify possible critic situations (due to a
possible chemical pollution) along both river courses. But, since a river is a complex
system, a polyphasic approach in a correct environmental quality evaluation was needed.
In fact, the real challenge researchers have to face consists in consider all possible
elements of river ecosystem (water quality, fauna and flora composition, erosion
phenomena, etc.) in order to have a realistic picture of the ecological state of a
watercourse. So, besides of ecotoxicological essays, we collected data about chemical,
microbiological and physical characteristics of water while ecological quality of
watercourses was evaluated by the use of EBI. Moreover, further important data were
gained through the interpolation of different parameters, calculating, this way, ecological
indices like Evaluation of Macro-descriptors Pollution Level (EMPL) and Ecological State
of Watercourses (ESW). At last, we tried to obtain a complete picture of the river
environmental quality. The dependability of ecotoxicological tests for river quater quality
evaluation was assessed.
www.intechopen.com

An Ecotoxicological Approach to Evaluate the Environmental Quality of Inland Waters
51
3. Material and methods
Standardized procedures were applied in sampling procedures and water analyses. A
complete list of all parameters measured and indices calculated is reported in Table 2. The
choice of sampling sites was carried out according to EU Regulation 2000/60/CE
recommendations, taking in account the introduction of waste waters through spillways .
On the whole, 14 sampling points (stations) were chosen for each river. Collected data were
stored in a database and georefentiated by an ArcGis software (data not shown). Frequency
of sampling and analytic procedures are reported in Table 3.
Chemical parameters Microbiological parameters Ecological and Ecotoxicological
parameters
Temperature (°C) Aerobic Colony Count at
22°C Daphnia magna acute toxicity essay
Dissolved Oxygen (DO)
Aerobic Colony Count at 37°C
Pseudokirchneriella subcapitata acute toxicity test
Ph Total Coliforms Phytotoxicity test
Specific Conductivity (SC)
Fecal Coliforms Inihibition test on algeae
NH4+ Escherichia coli Fitoplankton
NO 2- Streptococci Extended Biotic Index (EBI)
NO3- Clostridia Fluvial Functional Index (FFI)
PO4- Staphylococci
BOD5 Stafilococcus aureus
COD Pseudomonas aeruginosa
Aeromonas hydrophila
Table 2. Complete list of analyses carried out on each water sample analyzed.
Biological Parameters Sampling frequency
Chemical-physical parameters Sampling frequency
Ecotoxicological essays 5 times/year Water temperature 5 times/year
Microbiological analyses
5 times/year Dissolved Oxygen 5 times/year
Fitoplancton 3 times/year Salinity 5 times/year
EBI 2 times/year pH 5 times/year
FFI 1 time/year Nutrients (NO3-,NO2-) 5Times/year
Table 3. Frequency of sampling for each parameter in each station.
www.intechopen.com

Ecological Water Quality – Water Treatment and Reuse
52
3.1 Chemical analyses
The chemical analyses were carried out according to Standard Methods (2006).
3.2 Microbiological analyses
All microbiological analyses were carried out according to ISO methods.
3.3 Phytoplankton
The EN 15204:2006 and the EN ISO 5667-1 and EN ISO 5667-3 were applied during this survey.
3.4 Daphnia magna – Acute bioassay
Daphnia magna acute toxicity test were carried out according to ISO 6341:1999. According to this method, ten newborns no older than 24 hours must be exposed to a sample. The newborns of D. magna are transferred in each container filled with 50 ml of sample: this operation must be carried out paying attention to don’t damage the daphnides. Moreover, they must not be fed during all test procedure. After 24 hours, the number of immobile crustaceans (or of the ones showing at least a change in their usual way of swimming ) is calculated. If the essay is carried out considering different sample concentrations, it is possible to calculate the EC50 , which gives, for a well defined toxic, the concentration value inhibiting the 50% of test organisms.
3.5 Vibrio fisheri – Acute bioassay
APAT IRSA-CNR 2003 n. 8030 is the method chosen to carry out acute toxic bioassays with V. fischeri. The method gives an evaluation of acute toxicity of freshwater and marine samples through the evaluation of V. fischeri, strain NRRL-B-11177 bioluminescence inhibition. Luminescence can be measured after 5, 15 and 30 minutes of exposition to a sample by the use of a luminometer. Sample toxicity is measured as EC50, which represents the sample concentration in correspondence of which there is a decrease of 50% of the light emitted by bacteria. V. fisheri toxicity test demonstrated a good correlation with tests carried out on other aquatic organisms like D. magna, Artemia salina, Chlorella sp., Tetrahymena pyriformis (Kaiser K.L., 1998). Its reliability for the evaluation of soil and colourful samples had been also demonstrated (Lappalainen J. et al., 2001).
3.6 Chronic bioassay
ISO 8692:2004 is the method applied for Pseudokirchneriella subcapitata bioessay. The bioassay analyzes the toxic effect of a sample by measuring the inhibition of algal growth. Selected cultures are exposed during their exponential phase of growth, at well defined concentrations of a sample for 72 hours. After the exposition to the sample, algae density is measured reading absorbance of the culture at 663 nm.
3.7 Phytotoxicity
Phytotoxicity test assesses the potential toxicity of a sample measuring the inhibition of germination and /or root elongation of seeds under controlled conditions. Negative controls
www.intechopen.com

An Ecotoxicological Approach to Evaluate the Environmental Quality of Inland Waters
53
are prepared. Seeds of two dicotyledons (L. sativum and C. sativus) and a monocotyledon (S. saccharatum) are exposed to a water sample and incubated in the dark at 25 ± 2 °C for 72 hours. Then, germinated seeds are counted and root length measured using a calibre. The effect on both germination and radical elongation is expressed as percentage germination index (GI%) (UNICHIM 1651:2003). Such tests are widely used to assess the ecotoxicological effects of soils and waters contaminated with organic molecules and/or heavy metals (An Y. et al., 2004).
4. Results
4.1 Ecotoxicological results
Ecotoxicological tests didn't show any important inhibitory effect resulting in a good quality of both river waters. So, D. magna didn’t suffer any significant toxic effect: the percentage of immobility didn’t ever overcome, on the average, the 20% of individuals. Sampling sites number 7 and 13 of Tanagro river showed a modest effect on P.subcapitata (an increase in cell reproduction rate of about 10% on average). As to L. sativum, C. sativus and S. saccharatum no toxic effects were detected in both river samples. In some cases, especially for L. sativum and S. saccharatum some kind of bio-stimulation was observed (Fig.5 and 6). The results of phytotoxicity tests didn't show any important inhibition of seeds germination or
Fig. 5. Bussento river phytotoxicity tests on L. sativum, S. saccharatum, C. Sativus.
Fig. 6. Tanagro river phytoxicity tests findings. C.sativus showed some inhibition effects at station 1 and 14 while S.saccharatum was stimulated mainly in stations 1 and 4.
www.intechopen.com

Ecological Water Quality – Water Treatment and Reuse
54
root elongation on the most part of the samples, even if C. sativus showed a less growth
rate than the other two plants. This could be explained on the base of different physiology
of the species used in the test. All samples were tested also on V. fisheri and they never
showed any inhibitory effect on bacteria. It is important to notice that, in no case and for
no test organism, it was possible to calculate EC50 value because of the really low samples
toxicity.
4.2 Chemical parameters and EMPL
In all stations, COD values were, on the average, always less than 20 mgO2/mL, while BOD5
never overcome 10 mgO2/mL in Bussento river (Fig.7). As to Tanagro river, an increase of
COD and BOD5 was detected at station number 3, whose values overcame 20 mgO2/L for
COD and 10 mgO2/L for BOD5 (Fig.8). Moreover, chemical analyses showed some
significant variations of nitrogenous compounds (as NO3-), not only among the stations but
Fig. 7. BOD5 and COD values in Bussento river. Average values and standard error are reported.
Fig. 8. Tanagro river: COD and BOD5 average values and standard errors.
www.intechopen.com

An Ecotoxicological Approach to Evaluate the Environmental Quality of Inland Waters
55
even for a single sampling site in the course of the time, causing an increase in variability
(Fig. 9 and 10). So, the greatest variations were detected in correspondence of the stations
number 6 and 7 of Bussento river and 3 and 4 for Tanagro ones. Nevertheless, as E. coli
concentration never overcame the 5000 CFU/100mL limit, the increase of nitrates could be
due to agricultural rather than to wastewater intakes. Both rivers, in fact, flow through a not
highly urbanized land characterized by an agriculture-based economy.
If NO2- values were low in all samples, NH4+ concentration showed some different values
between the two watercourses, as shown in figures 9 and 10. On the average, NH4+ was
higher in Tanagro rather than in Bussento water. In any case, NH4+ concentration decreased
from station number 10 till the river month. A similar tendency was detected for PO42-,
suggesting an agricultural origin of both nutrients.
Fig. 9. Nitrogenous compounds concentrations in Bussento water samples. In the graphic, average values and standard errors are reported.
Fig. 10. Nitrogenous compounds concentrations (average ± standard error) along Tanagro river course.
www.intechopen.com

Ecological Water Quality – Water Treatment and Reuse
56
No water acidification was detected in both rivers as pH values showed little variation and,
in any case, they ranged between 7.5-8.5 values. The results of chemical analyses, together
with E. coli concentrations, carried out on both rivers were compared to values shown in
table 4, in order to calculate the EMPL index for both watercourses. From collected data, all
stations were classified as belonging to the 2nd and 3rd levels, showing a moderate pollution.
Furthermore, Tanagro river showed a better water quality than Bussento one as 73% of
collected samples belonged to level 2 versus a 53% of Bussento ones. On the whole, 66% of
all samples belonged to level 2.
Parameters Level 1 Level 2 Level 3 Level 4 Level 5
100-DO (% sat.) ≤|10| ≤|20| ≤|30| ≤|50| ≥|50|
BOD5 (O2/mg/L) <2.5 ≤4 ≤8 ≤15 >15
COD (O2/mg/L) <5 ≤10 ≤15 ≤25 >25
NH4+ (N mg/L) <0.03 ≤0.1 ≤0.5 ≤1.5 >1.5
NO3- (N mg/L) <0.30 ≤1.5 ≤5 ≤10 >10
Total-P (P mg/L) <0.07 ≤0.15 ≤0.30 ≤0.6 >0.6
Escherichia coli (CFU/mL) <100 ≤1000 ≤5000 ≤20000 >20000
Score referable to each parameter (75° percentile of the
sampling period) 80 40 20 10 5
Evaluation of Macro-descriptors Pollution Level
480-560 240-475 120-235 60-115 <60
Table 4. Reference values of EMPL index.
Fig. 11. PO42- and NH4+ concentrations in Bussento waters.
www.intechopen.com

An Ecotoxicological Approach to Evaluate the Environmental Quality of Inland Waters
57
Fig. 12. PO42- and NH4+ values along Tanagro river stations.
4.3 Extended biotic index
The analysis of macro-invertebrates population were carried out two times a year (on
summer and on winter) in correspondence of the same stations used to take samples for
chemical-physical and microbiological analyses. Temperature, DO, pH and water
conductivity were measured contemporaneously as they affect macro-invertebrates
distribution heavily and a correct EBI evaluation can not exempt from a determination of the
above mentioned parameters. Even if it is possible to notice a similar trend in the EBI
variation along both watercourses (from spring to mouth), the second sampling campaign
(on summer) showed lower values than the first one (carried out on winter). Apart from few
sites showing a real deterioration of river ecosystem (especially in Tanagro river), EBI
average values didn’t change significantly during the sampling activity. Most part of the
collected samples were classified as belonging to the second class (corresponding to
moderate pollution) or to the third one (altered ecosystem).
4.4 The Ecological State of Watercourses (ESW)
The EBI values together with EMBL ones were used to gain another index, the Ecologic State
of Watercourses (ESW) (Table 5). Our results showed, on the whole, a good or sufficient
ecological quality. Only 36% of Bussento river sampling sites reached the 2nd ESW class of
quality, suggesting a certain vulnerability of the freshwater ecosystem itself
As the remaining sites resulted just in a 3rd class. Tanagro river was characterized by a better
environmental state as 46% of stations were classified as belonging to a 2nd class.
Nevertheless, our results shed light on a critical environmental state regarding the station 3
of Tanagro river (4th class of quality). Even if most part of ESW values were determined by
both EBI and EMBL values, it is interesting to notice how, in some cases, ESW values were
affected in most part by the EBI values rather than EMBL ones as reported in Table 6.
www.intechopen.com
Ecological Water Quality – Water Treatment and Reuse
58
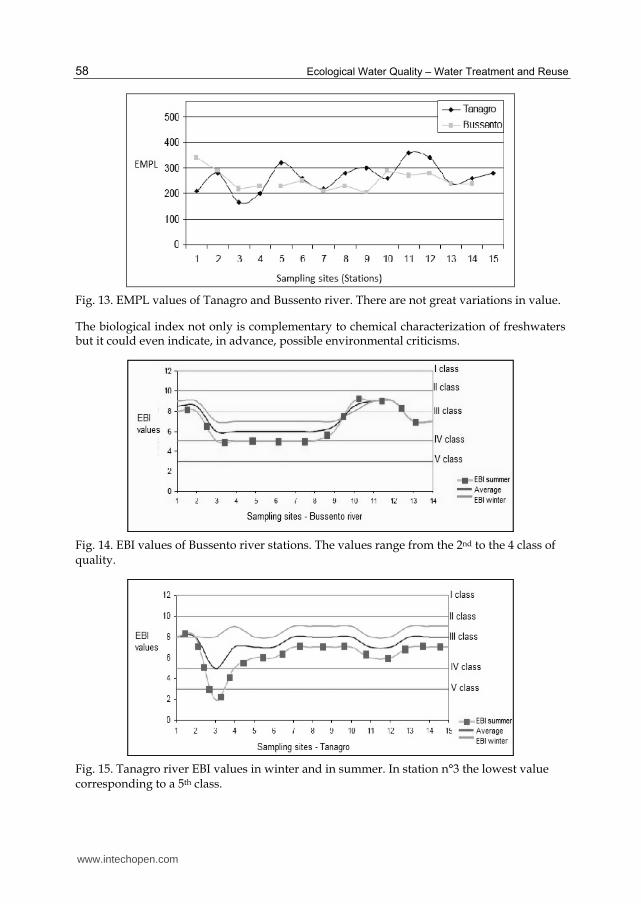
Fig. 13. EMPL values of Tanagro and Bussento river. There are not great variations in value.
The biological index not only is complementary to chemical characterization of freshwaters but it could even indicate, in advance, possible environmental criticisms.
Fig. 14. EBI values of Bussento river stations. The values range from the 2nd to the 4 class of quality.
Fig. 15. Tanagro river EBI values in winter and in summer. In station n°3 the lowest value corresponding to a 5th class.
www.intechopen.com

An Ecotoxicological Approach to Evaluate the Environmental Quality of Inland Waters
59
ESW Class I Class II Class III Class IV Class V
EBI
EMBL
≥10
480-560
8-9
240-475
6-7
120-235
4-5
60-115
1,2,3
<60
Overcome High Good Sufficient Poor Very Poor
Conventional
colour Blu Green Yellow Orange Poor
Table 5. ESW class of quality and the correspondent EBI and EMBL values are reported.
Fig. 16. ESW values: environmental quality reached the worst value just in station number 3 of Tanagro river.
EMBL+EBI EMBL EBI
Tanagro 54% 13% 33%
Bussento 79% 21% 0%
Table 6. Percentage of samples whose ESW value was affected by EMBL+EBI or by just
EMBL or EBI values.
FFI was applied in order to consider both hydro-morphological and biological factors in the
evaluation of river courses environmental quality. Our findings, compared to some
reference values, showed an environmental quality ranging from good-moderate to high
(Table 7). The 57% of Tanagro river course fell into the high and good categories while
Bussento river just 35%.
www.intechopen.com
Ecological Water Quality – Water Treatment and Reuse
60
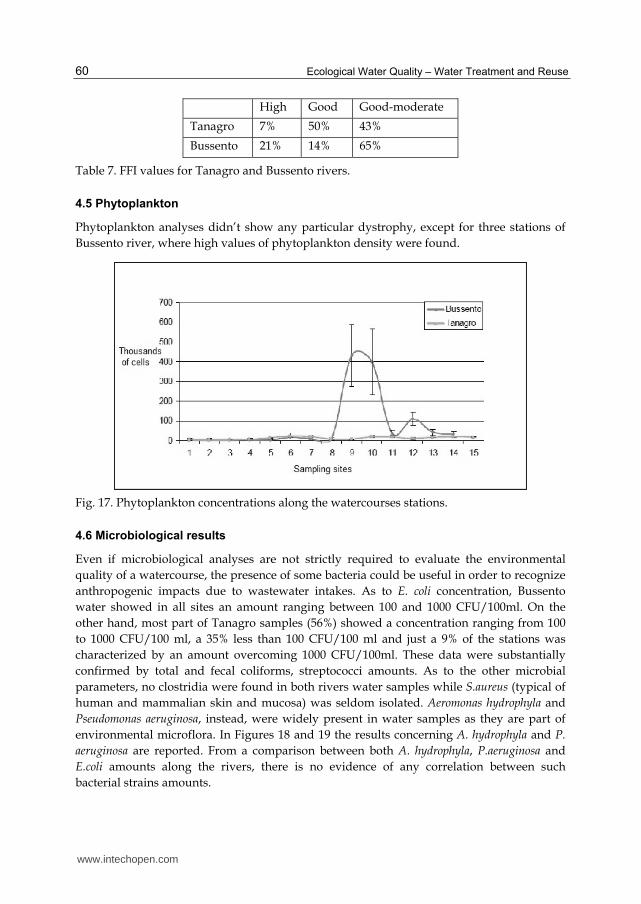
High Good Good-moderate
Tanagro 7% 50% 43%
Bussento 21% 14% 65%
Table 7. FFI values for Tanagro and Bussento rivers.
4.5 Phytoplankton
Phytoplankton analyses didn’t show any particular dystrophy, except for three stations of
Bussento river, where high values of phytoplankton density were found.
Fig. 17. Phytoplankton concentrations along the watercourses stations.
4.6 Microbiological results
Even if microbiological analyses are not strictly required to evaluate the environmental
quality of a watercourse, the presence of some bacteria could be useful in order to recognize
anthropogenic impacts due to wastewater intakes. As to E. coli concentration, Bussento
water showed in all sites an amount ranging between 100 and 1000 CFU/100ml. On the
other hand, most part of Tanagro samples (56%) showed a concentration ranging from 100
to 1000 CFU/100 ml, a 35% less than 100 CFU/100 ml and just a 9% of the stations was
characterized by an amount overcoming 1000 CFU/100ml. These data were substantially
confirmed by total and fecal coliforms, streptococci amounts. As to the other microbial
parameters, no clostridia were found in both rivers water samples while S.aureus (typical of
human and mammalian skin and mucosa) was seldom isolated. Aeromonas hydrophyla and
Pseudomonas aeruginosa, instead, were widely present in water samples as they are part of
environmental microflora. In Figures 18 and 19 the results concerning A. hydrophyla and P.
aeruginosa are reported. From a comparison between both A. hydrophyla, P.aeruginosa and
E.coli amounts along the rivers, there is no evidence of any correlation between such
bacterial strains amounts.
www.intechopen.com

An Ecotoxicological Approach to Evaluate the Environmental Quality of Inland Waters
61
Fig. 18. Bussento river: microbiological values overcame the 100 CFU/100mL values except for streptococci in the last four stations.
Fig. 19. E.coli, fecal coliforms and streptococci in Tanagro river waters. Stations 7 and 13 showed some high values.
Fig. 20. P. aeruginosa and A. hydrophila concentrations in Bussento waters.
www.intechopen.com

Ecological Water Quality – Water Treatment and Reuse
62
5. Conclusions
The environmental quality of both rivers resulted, on the whole, in a good or, at least, a
sufficient quality, comparable, at least, to the upper course of Sele river flowing in the same
area (Rizzo D. et al., 2009). These data are important as in a so highly urbanized district like
the Campania one, most part of watercourses are heavily polluted and compromised by
human activities. Sarno river, for example, is one of the most polluted river in Europe
(Arienzo M. et al.,2000; De Pippo T. et al.,2006) and it flows in a high anthropized area. In
this context of environmental degradation, the protection of high naturalistic value areas is a
must and our data confirmed the efficacy of natural reserves and of a sustainable
development policy. Under a strictly technical point of view, a polyphasic approach
provides detailed informations about environmental quality of a river ecosystem.
Nevertheless, it must be underlined that some experience in data analyses and competence
in different fields are needed in order to give a right interpretation of findings yelded by so
different analyses. In fact, it has to be noticed, for example, that phytotoxicity tests outcomes
weren’t fully overlapping with other ecotoxicological tests and of some difficult
interpretation. While the D.magna and P.subcapitata tests gave no evidence of any significant
toxic effect of water samples, L.sativum, C.sativus, S.saccharatum showed a modest inhibition
of germination after 5 days (between 22% and 30% of seeds for each species didn’t
germinate) in correspondence to the station number 3 of Tanagro river, in accordance to the
EBI, ESW, EMPL whose values were corresponding to a poor or sufficient environmental
quality. It is clear that ecotoxicological tests are not enough to evaluate the environmental
quality of a complex ecosystem like a river but they showed to be a useful tool in the
evaluation of river environmental quality.
6. Acknowledgments
We thank Dr. Daniela Santafede for her contribution to the elaboration of chemical and
microbiological data.
7. References
An Y. , Kim Y., Kwon T., Jeong S. (2004) Combined effect of copper, cadmium, and lead
upon Cucumis sativus growth and bioaccumulation. Science of The Total
Environment Volume 326, Issues 1-3, pp. 85-93 .
APAT (2007). Indice di Funzionalità Fluviale – Nuova versione del metodo revisionata ed
aggiornata. http://info.apat.it/pubblicazioni
Arienzo M., Adamo P., Bianco M.R., Violante P. (2000). Impact of Land Use and Urban
Runoff on the Contamination of the Sarno River Basin in Southwestern Italy.
Water, Air, & Soil Pollution Volume 131, Numbers 1-4, 349-366
Autorità di Bacino Regionale Friuli Venezia Giulia (ABR.FVG). River Continuum Concept.
http://www.abr.fvg.it/studies/ecologia-acque/water-ecology/river-continuum-
concept Visited on January 2012.
Chen CY, Ko CW, Lee PI.(2007). Toxicity of substituted anilines to Pseudokirchneriella
subcapitata and quantitative structure-activity relationship analysis for polar
narcotics. Environ Toxicol Chem. Jun;26(6):1158-64.
www.intechopen.com
An Ecotoxicological Approach to Evaluate the Environmental Quality of Inland Waters
63
De Castro O., Gianguzzi L., Colombo P., De Luca P., Marino G., Guida M.: (2007) Multivariate Analysis of Sites Using Water Invertebrates and Land use as Indicators of the Quality of Biotopes of Mediterranean Relic Plant (Petagnaea gussonei, Apiaceae) Environmental Bioindicators, 2, pp. 161 – 171.
De Pippo T., Donadio C., Guida M., Petrosino C. (2006). The case of Sarno River (Southern Italy): effects of geomorphology on the environmental impacts. Environ Sci Pollut Res Int. 2006 May;13(3):184-91.
Directive 2000/60/EC of the European Parliament and of the Council establishing a framework for the Community action in the field of water policy". Official Journal (OJ L 327). December 2000.
Edberg SC, Rice EW, Karlin RJ, Allen MJ. (2000). Escherichia coli: the best biological drinking water indicator for public health protection. Symp Ser Soc Appl Microbiol. 2000;(29):106S-116S.
FAO (1996). Manual on the Production and Use of Live Food for Aquaculture. FAO Fisheries Technical Paper 361, pp. 283-288.
Fazli M., Bjarnsholt T., Kirketerp-Møller K., Jørgensen B., Schou Andersen A., Krogfelt K.A., Givskov M., and Tolker-Nielsen T.(2009) Nonrandom Distribution of Pseudomonas aeruginosa and Staphylococcus aureus in Chronic Wounds. J Clin Microbiol.47(12): 4084–4089.
Ghetti PF (1997). Application Manual: Extended Biotic Index – Macroinvertebates in quality control of running water environments, in Italian [I Macroinvertebrati nel controllo della qualita di ambienti di acque correnti. Indise Biotico Esteso (I.B.E). Manuale di applicazione. Provincia Autonoma di Trento]. Trento Italy, 222 pp.
Greene J.C., Miller W.E., Shiroyama T. and Maloney T.E.(1975). Utilization of algal assays to assess the effects of municipal, industrial, and agricultural wastewater effluents upon phytoplankton production in the Snake River system. Water, Air, & Soil Pollution Volume 4, Numbers 3-4, 415-434.
Guida M., Mattei M., Melluso G., Pagano G., Meriç S.(2004) Daphnia magna and Selenastrum capricornutum in evaluating the toxicity of alum and polymer used in coagulation-flocculation" Fresenius Environmental Bulletin; vol 13- N° 11b 1244-7.
Guida M., Melluso G., Mattei M., Inglese M., Pagano G., Belgiorno V., Meriç S. (2006): A multi-battery lethal and sub-lethal toxicity investigation on organo-pesticides. 18-22 September Istanbul- Turkey. IWA DipCon 10th International Specialised Conference on Diffuse Pollution and Sustainable Basin Management.
Health Canada. Environmental and Workplace Health: Bacterial Waterborne Pathogens - Current and Emerging Organisms of Concern. www.hc-sc.gc.ca (visited on September 2011).
Kaiser K.L. (1998). Correlations of Vibrio fischeri bacteria test data with bioassay data for other organisms. Environ Health Perspect. 106 (Suppl 2): 583–591.
Kalyoncu H. and Zeybek M. (2011) An application of different biotic and diversity indices for assessing water quality: A case study in the Rivers Çukurca and Isparta (Turkey).African Journal of Agricultural Research Vol. 6(1), pp. 19-27.
Lappalainen J., Juvonen R., Nurmi J., Karp M. (2001) Automated color correction method for Vibrio fischeri toxicity test. Comparison of standard and kinetic assays Chemosphere Volume 45, Issues 4-5, Pages 635-64.
www.intechopen.com

Ecological Water Quality – Water Treatment and Reuse
64
Mahoney J. B. (1983) Algal assay of relative abundance of phytoplankton nutrients in northeast United States coastal and shelf waters.
Negri P., Siligardi M.,Fuganti A.,Francescon M., Monauni C.,Pozzi S. The use of the Functioning Fluvial Index for river management.
evis.sggw.waw.pl/wethydro/contents/.../107-115_PaoloNegri_e.pdf (visited on September 2011).
Pathak S.P. , Bhattacherjee J.W., Kalra N., Chandra S. (2008). Seasonal distribution of Aeromonas hydrophila in river water and isolation from river fish. Journal of Appl. Microbiol. Vol. 65 Issue 4, pp. 347 – 352.
Rizzo D., Gentile A., Sica M, Caracciolo L.,Mautone M.,Rastrelli L.,Saviello G. Caratterizzazione Qualitativa e Tipizzazione del Fiume Sele Individuazione e definizione del Corpo Idrico di Riferimento Sito-Specifico. Atti del Convegno Funzionalità fluviale:strumento di gestione e pianificazione. Trento, 19-20 November 2009.
Youn-Joo An (2004) Soil ecotoxicity assessment using cadmium sensitive plants. Environmental Pollution Volume 127, Issue 1, Pages 21-26.
UNESCO – MAB Secretariat (2010). World Network of Biosphere Reserves. http://www.unesco.org/mab/doc/brs/BRList2010.pdf visited on January 2012.
www.intechopen.com
Ecological Water Quality - Water Treatment and ReuseEdited by Dr. Voudouris
ISBN 978-953-51-0508-4Hard cover, 496 pagesPublisher InTechPublished online 16, May, 2012Published in print edition May, 2012
InTech EuropeUniversity Campus STeP Ri Slavka Krautzeka 83/A 51000 Rijeka, Croatia Phone: +385 (51) 770 447 Fax: +385 (51) 686 166www.intechopen.com
InTech ChinaUnit 405, Office Block, Hotel Equatorial Shanghai No.65, Yan An Road (West), Shanghai, 200040, China
Phone: +86-21-62489820 Fax: +86-21-62489821
This book attempts to cover various issues of water quality in the fields of Hydroecology and Hydrobiology andpresent various Water Treatment Technologies. Sustainable choices of water use that prevent water qualityproblems aiming at the protection of available water resources and the enhancement of the aquaticecosystems should be our main target.
How to referenceIn order to correctly reference this scholarly work, feel free to copy and paste the following:
M. Guida, O. De Castro, S. Leva, L. Copia, G.D'Acunzi, F. Landi, M. Inglese and R.A. Nastro (2012). AnEcotoxicological Approach to Evaluate the Environmental Quality of Inland Waters, Ecological Water Quality -Water Treatment and Reuse, Dr. Voudouris (Ed.), ISBN: 978-953-51-0508-4, InTech, Available from:http://www.intechopen.com/books/ecological-water-quality-water-treatment-and-reuse/an-ecotoxicological-approach-to-evaluate-the-environmental-quality-of-inland-waters
Related Documents