An Economic Forecast Tampa, FL September 1 st , 2015

An Economic Forecast Tampa, FL September 1 st, 2015.
Dec 29, 2015
Welcome message from author
This document is posted to help you gain knowledge. Please leave a comment to let me know what you think about it! Share it to your friends and learn new things together.
Transcript

An Economic Forecast
Tampa, FLSeptember 1st, 2015

The Rules of the Game Matter
They change the way the players play the game.
They can change the outcome of the game itself.
Freeze tag

The Rules of the Game Matter
• Federal Regulation and Aggregate Economic Growth
by John W. Dawson and John J. Seater
• Journal of Economic Growth (2013) 18:137-177
Examined Economic Growth and Productivity 1949-2005


The Rules of the Game Matter
• Results:
• Regulations have reduced real GDP growth an average of 2% per year.
• Real GDP in 2005 would have been $53.9 trillion instead of the $15.1 trillion

The Rules of the Game Matter
• Results:
• Productivity is impacted by regulatory growth
• The conundrum of declining productivity in the 1970’s attributable to a doubling in the number of pages of regulation.

The Rules of the Game Matter
• 2013 CFR 175,000
• Dodd-Frank law 2,300 pages
– 22,296 pages of rules so far– Another 13,000 on the way
• Affordable Care Act

The Rules of the Game Matter
• Dan Gallagher, Commissioner of the SEC:
• “And really, to me, Bob, the burden isn’t necessarily as much as the regulations that came from Dodd-Frank. Some of them are just completely nonsensical. I mean, nothing to do with the financial crisis, aren’t really germane to the function of the SEC and that’s what happens when you get a runaway piece of legislation.”

18171615141312111009080706050403020100
150.0
145.0
140.0
135.0
130.0
125.0
Total Nonfarm Payroll Employment(Millions)
Total Nonfarm Employment

U.S. Forecast Payroll jobs to reach potential

18171615141312111009080706050403020100
10.0
9.0
8.0
7.0
6.0
5.0
4.0
3.0
Civilian Unemployment Rate(%)
Unemployment Rate

2015Q1
2015Q2
2015Q3
2015 2016 2017 2018
GDP% Change, Annual
Rate0.6 2.9 1.9 2.2 2.6 2.7 2.5
Consumer Price Index% Change, Annual
Rate-0.9 -3.1 -0.7 -0.3 2.1 2.4 2.6
Consumer Sentiment 95.5 94.2 92.2 94.1 92.6 92.3 92.6
Consumption% Change, Annual
Rate2.5 2.9 2.4 3.0 3.0 2.7 2.6
U.S. Forecast

Global Factors - Oil
The Arithmetic of Lower Oil Prices:
Each $1 decrease in the price of a barrel of oil will:
Decrease price of gallon of gas 2.5 cents Push consumer gasoline bills down $3
billion Lower the CPI 0.03% Raise real disposable income 0.25%

Global Factors - Oil The Economics of lower Oil
Prices:
Each permanent $10 decrease in the price of a barrel of oil will:
Raise forecast real GDP growth 0.2% in 1st year,
0.5% in the 2nd
Raise forecast of payroll employment 110,000 in 1st year and 390,000 in 2nd
Psychic Impact
Domestic production impacts?

Greece and the Euro
All the Greek bailouts, haircut & the election are stays of execution and not pardons
Euro still facing greatest threat since inception
Two (long-run) possible outcomes for the Euro zone
Global Factors - Eurozone

Is the Chinese economy a pagoda of cards?
Economy slowing
Stock market plunge
Desperate attempts to stop the decline
Depreciation of the Yuan
Global Factors - China

IMF revised down 2015 world growth outlook: 3.3%
2016: 3.8%
Brazil – worst recession in 25 years
Latin America/Caribbean sub 2% outlook
Canadian recession 1st half 2015
Stronger U.S. Dollar
Global Factors - ROW
U.S. Forecast
Will the Bankruptcy of Sky Mall Put an End to Sky Mall™ Policies?
Sky Mall™ Policy:
An Expensive Policy that Fails to Achieve its Desired Outcome

U.S. Forecast

U.S. Forecast

U.S. Forecast

U.S. Forecast

U.S. Forecast

U.S. Forecast
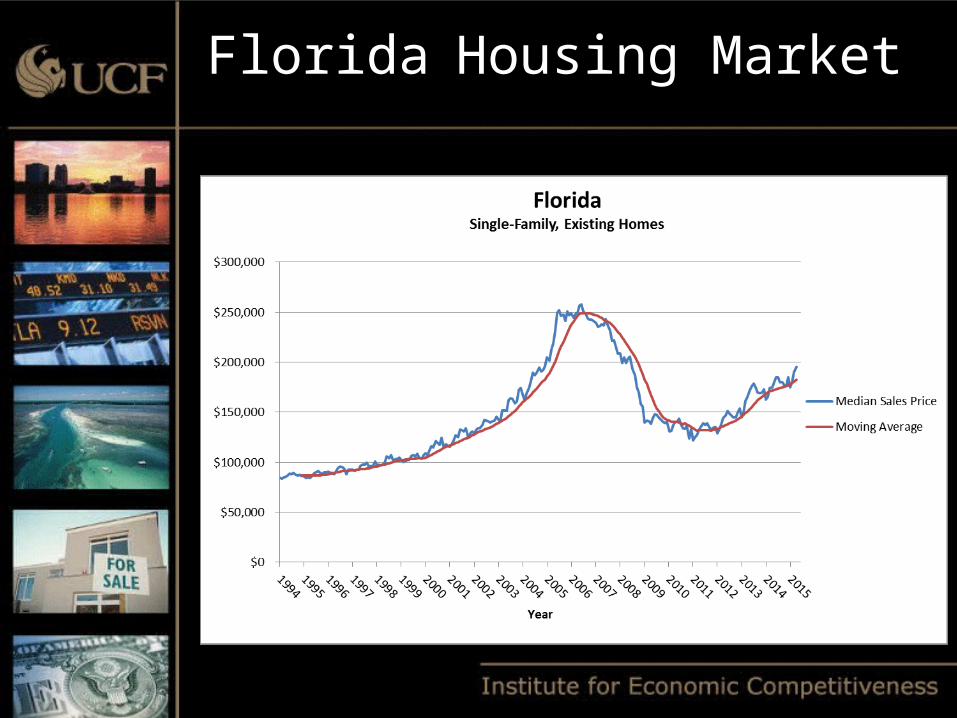
Florida Housing Market
Housing market recovery continues
Double-digit price appreciation has returned
Investors chasing shrinking pool of distressed properties
Housing finance still an issue

Housing MarketHousing Finance
Mortgage availability slowly improving
Mortgages have been restricted byDodd FrankCapital StandardsUnderwriting StandardsLimited Private SecuritizationDemise of Mortgage Brokering

U.S. Forecast

Florida Housing Market
Florida Housing Market
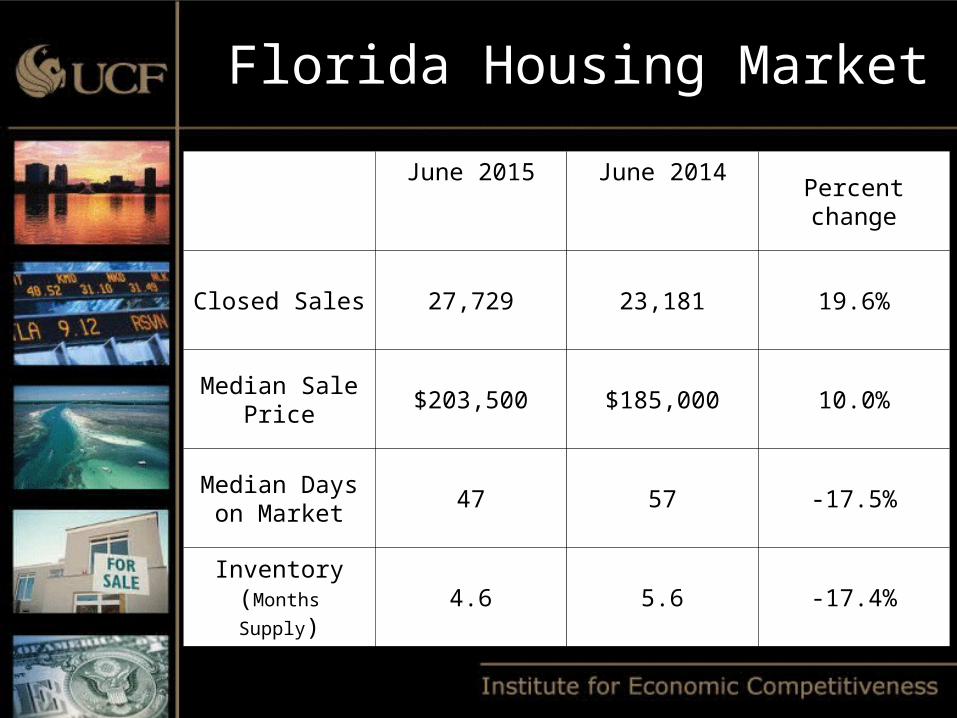
June 2015 June 2014Percent change
Closed Sales 27,729 23,181 19.6%
Median Sale Price
$203,500 $185,000 10.0%
Median Days on Market
47 57 -17.5%
Inventory(Months Supply)
4.6 5.6 -17.4%
Florida Housing Market

Florida Forecast
181716151413121110090807060504030201
300.0
250.0
200.0
150.0
100.0
50.0
0.0
8%
7%
6%
5%
4%
3%
Florida Housing Starts(thousands)
Total Private Housing Starts30 year Mortgage Rates
Florida Forecast
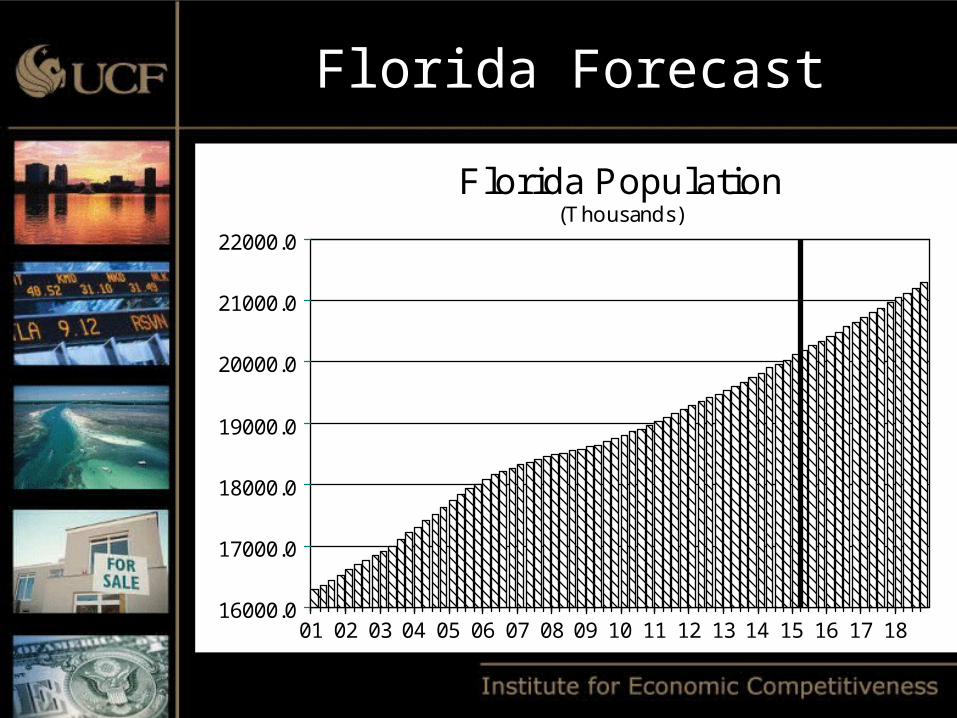
181716151413121110090807060504030201
22000.0
21000.0
20000.0
19000.0
18000.0
17000.0
16000.0
Florida Population(Thousands)

Florida Forecast
181716151413121110090807060504030201
14.0%
12.0%
10.0%
8.0%
6.0%
4.0%
2.0%
Florida & U.S. Unemployment Rate(%)
FL Unemployment RateU.S. Unemployment Rate
Florida Forecast
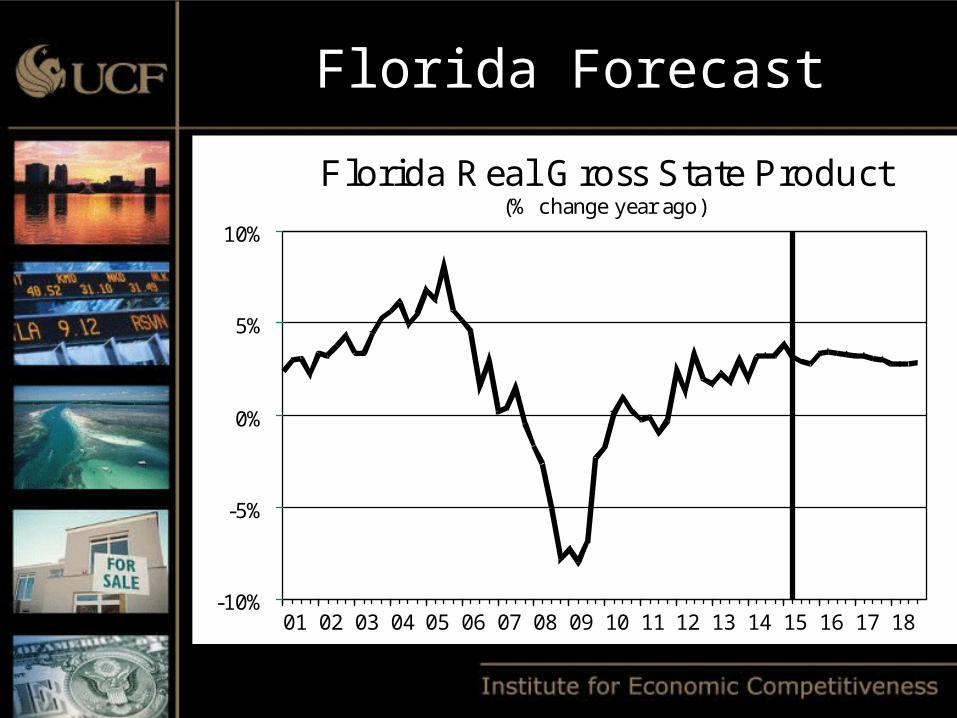
181716151413121110090807060504030201
10%
5%
0%
-5%
-10%
Florida Real Gross State Product(% change year ago)

Florida Forecast
181716151413121110090807060504030201
8600.0
8400.0
8200.0
8000.0
7800.0
7600.0
7400.0
7200.0
7000.0
Florida Employment(Thousands)
Wage & Salary Employment
Florida Forecast
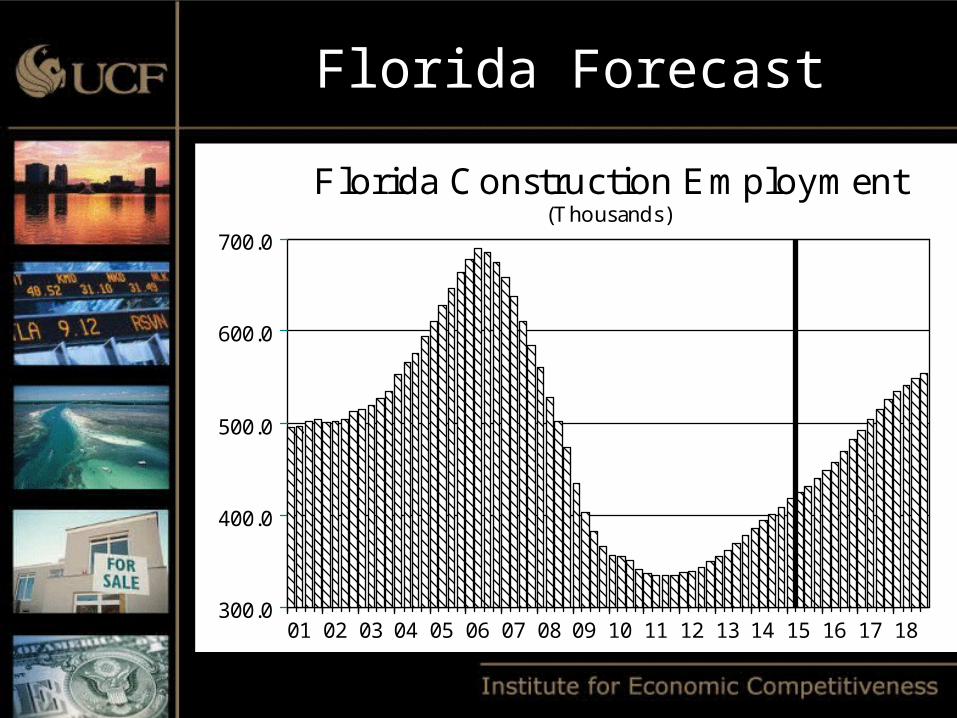
181716151413121110090807060504030201
700.0
600.0
500.0
400.0
300.0
Florida Construction Employment(Thousands)

Florida Forecast
181716151413121110090807060504030201
1400.0
1300.0
1200.0
1100.0
1000.0
900.0
Florida Professional & Business Services Employment
(Thousands)

Florida Forecast
181716151413121110090807060504030201
1200.0
1100.0
1000.0
900.0
800.0
Florida Leisure & Hospitality Employment
(Thousands)

2015-2018 Averages;Q2 2015 Forecast
Florida
Sector% Average Annual
Growth
Construction 7.9
Professional & Business Services 4.1
Trade, Transportation & Utilities 3.4
Education-Health Services 2.2
Leisure & Hospitality 1.9
State & Local Government 0.9
Information 0.7
Financial 0.5Manufacturing 0.4Federal Government -0.7
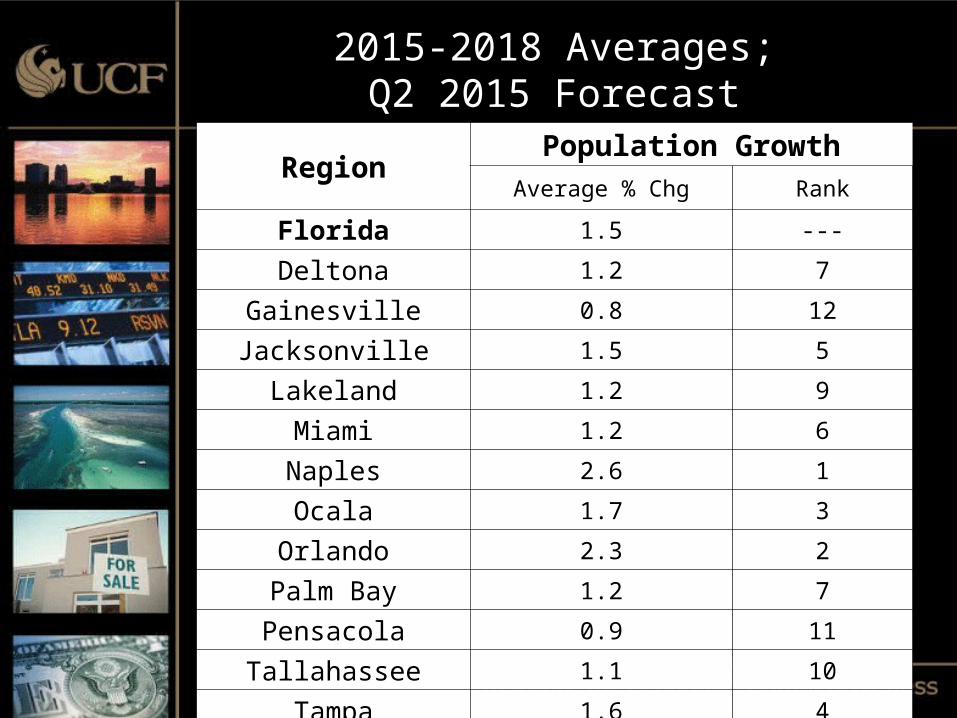
RegionPopulation Growth
Average % Chg Rank
Florida 1.5 ---
Deltona 1.2 7
Gainesville 0.8 12
Jacksonville 1.5 5
Lakeland 1.2 9
Miami 1.2 6
Naples 2.6 1
Ocala 1.7 3
Orlando 2.3 2
Palm Bay 1.2 7
Pensacola 0.9 11
Tallahassee 1.1 10
Tampa 1.6 4
2015-2018 Averages;Q2 2015 Forecast

RegionEmployment Growth
Average % Chg Rank
Florida 2.2 ---
Deltona 2.0 6
Gainesville 1.4 12
Jacksonville 1.8 9
Lakeland 1.8 8
Miami 2.0 5
Naples 3.3 1
Ocala 2.5 3
Orlando 3.0 2
Palm Bay 2.3 4
Pensacola 1.4 11
Tallahassee 1.5 10
Tampa 2.0 7
2015-2018 Averages;Q2 2015 Forecast

2015-2018 Averages;Q2 2015 Forecast
Orlando
Sector% Average Annual
Growth
Construction 7.9
Professional & Business Services 4.7
Trade, Transportation & Utilities 3.4
Leisure & Hospitality 2.6
Education-Health Services 2.6
Financial 1.2
Manufacturing 1.0
Information 1.0State & Local Government 0.4Federal Government -0.4

Sean M. SnaithSean M. Snaith, Ph.D.
Director Director
Institute for Economic CompetitivenessInstitute for Economic Competitiveness
(407) 823-1453(407) 823-1453
[email protected]@SeanSnaith.com
WWW.IEC.UCF.EDUWWW.IEC.UCF.EDU
www.facebook.com/seansnaith www.facebook.com/seansnaith
Twitter: @seansnaithTwitter: @seansnaith
Thank you
Related Documents


