Invested in Our Community An Economic and Fiscal Impact Study of the University of California, San Francisco October 2016

Welcome message from author
This document is posted to help you gain knowledge. Please leave a comment to let me know what you think about it! Share it to your friends and learn new things together.
Transcript

Invested in Our Community
An Economic and Fiscal Impact Study of the
University of California, San Francisco
October 2016

Report
A Study of the Economic and Fiscal Impact of the University of California, San Francisco Prepared for:
Prepared by: Economic & Planning Systems, Inc. October 2016 EPS #151113

Table of Contents
1. INTRODUCTION ...................................................................................................... 1
Study Overview ...................................................................................................... 1 UCSF Background and Mission .................................................................................. 2 Report Organization ................................................................................................ 5
2. STUDY FINDINGS ................................................................................................... 6
3. BACKGROUND AND OVERVIEW OF UCSF ...................................................................... 12
UCSF Background and Mission ................................................................................ 12 UCSF Facilities and Locations .................................................................................. 13 UCSF Employees, Students and Trainees .................................................................. 15 UCSF Budget and Program Overview ....................................................................... 15
4. PRIMARY ECONOMIC IMPACTS ................................................................................... 20
Overview of Input/Output Modeling ......................................................................... 21 Primary Economic Impact Analysis and Results.......................................................... 23 UCSF Income Distribution Impacts .......................................................................... 31
5. SECONDARY ECONOMIC IMPACTS ............................................................................... 33
UCSF Innovation and Technology Leadership ............................................................ 33 UCSF Firm Creation and Workforce Development ....................................................... 41 UCSF Uncompensated and Charity Care ................................................................... 46 Other UCSF Public Involvement and Partnerships ....................................................... 47
6. FISCAL IMPACT METHODOLOGY AND BUDGET OVERVIEW ................................................... 50
Overview of Fiscal Impact Analysis .......................................................................... 50 Overview of San Francisco Budget ........................................................................... 51 Fiscal Impact Methodology ..................................................................................... 57
7. GENERAL FUND FISCAL IMPACT CALCULATIONS .............................................................. 65
General Fund Revenue Analysis............................................................................... 65 General Fund Expenditures Analysis ........................................................................ 74 General Fund Net Impact ....................................................................................... 81
8. OTHER UCSF FISCAL CONTRIBUTIONS ........................................................................ 82
CFD No. 6 Mission Bay South Public Improvements .................................................... 83 CFD No. 5 Mission Bay Maintenance District .............................................................. 83 Other Parks and Open Space Contributions ............................................................... 86
APPENDIX A: Supporting Tables
List of Tables
Table 1 Summary of UCSF Students/Residents, and Personnel, and Physical Space, 2015 ..... 3
Table 2 UCSF Direct Economic Activities ........................................................................ 6
Table 3 Comparison of Primary Economic Impact Results, 2009 and 2015 .......................... 8
Table 4 Comparison of Fiscal Impact Results, 2009 and 2015 ......................................... 10
Table 5 UCSF Student Enrollment by Program, 2015 ..................................................... 15
Table 6 UCSF Revenues, FY 2014-15 ........................................................................... 16
Table 7 UCSF Expenses, FY 2014-15 ........................................................................... 16
Table 8 Departments and Organized Research Units by School ........................................ 18
Table 9 City of San Francisco Economic Impacts from UCSF Operations, 2015 ................... 24
Table 10 Nine-County Bay Area Economic Impacts from UCSF Operations, 2015 ................. 24
Table 11 Impacts of Average Annual Construction Expenditures in San Francisco, 2015 ........ 25
Table 12 Impacts of Average Annual Construction Expenditures in Bay Area, 2015 .............. 26
Table 13 Summary of City of San Francisco Impacts from Student Expenditures, 2015......... 27
Table 14 Nine-County Bay Area Impacts from Student Expenditures, 2015 ......................... 28
Table 15 City of San Francisco Impacts from Retiree Expenditures, 2015 ........................... 29
Table 16 Nine-County Bay Area Impacts from Retiree Expenditures, 2015 .......................... 30
Table 17 UCSF Wage Distribution, 2015 ........................................................................ 31
Table 18 R&D Expenditures by Top Performing Universities .............................................. 35
Table 19 UCSF R&D Spending as a Percentage of Total R&D Across all Sectors (San Francisco and Nine-County Bay Area) ....................................................... 36
Table 20 National Institutes of Health Funding Recipients ................................................. 37
Table 21 Biomedical and Health Sciences Citations by Top Universities............................... 38
Table 22 UCSF Patents, Licenses and Royalties ............................................................... 40
Table 23 UCSF “Spin-Off” Firm Sample .......................................................................... 42
Table 24 Market Indicators for San Francisco Life Sciences Sector ..................................... 43
Table 25 Location of UCSF Alumni in the Bay Area .......................................................... 45
Table 26 UCSF Charity Care Contributions ..................................................................... 47
Table 27 Overview of San Francisco Budget, FY 2014-15 Major Revenue Sources ................ 51
List of Tables (continued)
Table 28 Overview of San Francisco Budget, FY 2014-15 Major Uses ................................. 52
Table 29 Assessed Property Value in San Francisco by Property Type ................................. 55
Table 30 UCSF Population, Employment, and Visitor Estimates ......................................... 60
Table 31 San Francisco Population, Employment, and Visitor Estimates .............................. 61
Table 32 Summary of Resident Equivalents .................................................................... 63
Table 33 San Francisco General Fund Revenues: UCSF’s Impact ....................................... 66
Table 34 Payroll Tax Estimate, FY 2014-15 .................................................................... 67
Table 35 UCSF Sales and Use Tax: From Direct Expenditures and Onsite Sales ................... 69
Table 36 UCSF Sales and Use Tax: From Population Expenditures ..................................... 70
Table 37 UCSF Hotel Tax Revenue Estimate ................................................................... 71
Table 38 UCSF Parking Tax Estimate ............................................................................. 73
Table 39 San Francisco General Fund Costs; UCSF’s Impact ............................................. 75
Table 40 UCSF’s Impact on Fire Costs (General Fund) ..................................................... 76
Table 41 UCSF’s Impact of Police and other Public Protection Costs (Excluding Fire) ............. 78
Table 42 UCSF’s Impact on MTA Costs (General Fund) ..................................................... 79
Table 43 UCSF Net Fiscal Impact Summary .................................................................... 81
Table 44 Areas of UCSF Mission Bay Campus Subject to CFD Payments.............................. 82
Table 45 CFD No. 6 Tax Rate for FY 2014-15 .................................................................. 83
Table 46 UCSF Park Maintenance Fee Contribution to CFD No. 5 for FY 2014-15 .................. 84
Table 47 Summary of UCSF One-Time and Ongoing Contributions to Support Growth in Mission Bay ............................................................................................... 85
Table 48 UCSF Contributions to Esprit Park and the Green Parking Fund ............................ 86
List of Figures
Figure 1 Diagram of UCSF Economic and Fiscal Impact Study ............................................. 1
Figure 2 Employers by Number of Employees in San Francisco, 2015 .................................. 4
Figure 3 Top Employers by Number of Employees in the Bay Area, 2015 ............................. 4
Figure 4 Illustration of UCSF’s Primary Economic Impacts .................................................. 7
Figure 5 UCSF Locations in San Francisco ...................................................................... 14
Figure 6 Income Distribution Comparison, 2015 ............................................................. 32
Figure 7 The Technology Licensing Economic Value Pipeline ............................................. 39
Figure 8 Public-Private Innovation Support Programs at Mission Bay ................................. 44
Figure 9 San Francisco Budget by Use of Revenue, FY 2014-15; $8.58 Billion Total ............. 53
Figure 10 General Fund – Sources of Revenue FY 2014-15; $3.8 Billion Total ....................... 54
Figure 11 General Fund – Uses of Funds FY 2014-15; Total $3.3 Billion Total ....................... 56

Economic & Planning Systems, Inc. 1 P:\151000s\151113UCSF_FisEcon\Report\FINAL_UCSF Fiscal_Econ_Final Report_100316.docx
1. INTRODUCTION
St udy Over v iew
The University of California, San Francisco (UCSF) has retained Economic & Planning Systems, Inc. (EPS) to assess the variety of fiscal and economic effects that UCSF has within the City and County of San Francisco and broader nine-county Bay Area region. UCSF previously sponsored similar studies on this topic, including a fiscal and economic impact report in 2010 that was also prepared by EPS. This analysis updates and expands upon prior analyses to reflect new UCSF programming information and economic conditions.
In order to gain a complete understanding of how UCSF’s ongoing operations impact San Francisco and the greater Bay Area, EPS has evaluated three discrete economic categories relevant to UCSF, as described below and illustrated in Figure 1.
Figure 1 Diagram of UCSF Economic and Fiscal Impact Study
x Primary Economic Impacts: The primary economic impact of a university and/or research institution derives from its local and regional spending and the spending of its employees and students. Specifically, UCSF and its employees and students purchase goods and services in the local economy, which, in turn, create a “ripple” effect throughout the economy as local businesses expand and hire new workers and generate successive rounds of spending. These primary economic impacts can be quantified using input/output (I/O) analysis based on economic multipliers that quantify “direct”, “indirect” and “induced” effects on local and regional output and employment.1
1 “Direct” impacts refer to the economic effects of total UCSF direct employment and spending. “Indirect” impacts represent economic effects on industries that supply UCSF. “Induced” impacts represent economic effects on all local industries as a result of the new personal spending by employees in the direct and indirect categories generated by UCSF.
UCSF Economic and Fiscal Impact Analysis October 2016
Economic & Planning Systems, Inc. 2 P:\151000s\151113UCSF_FisEcon\Report\FINAL_UCSF Fiscal_Econ_Final Report_100316.docx
x Secondary Economic Impacts: The secondary economic impacts of a university and/or research institution stem from its role in enhancing the overall competitiveness of a region by providing specialized research, a highly educated workforce, and a variety of other community benefits and services. For example, by hiring and training highly skilled individuals and investing in specialized research activities, UCSF helps support a business environment conducive to economic innovation and diversification, especially in the life sciences sector. Likewise, UCSF provides free or below cost health care services to Bay Area residents, improving quality of life. Although these secondary economic impacts are generally more difficult to quantify in terms of variables such as jobs or output, a variety of “proxy” measures can be utilized. Examples include patent, royalty and licensing activity, workforce training and employment, firm creation through UCSF inventions, the entrepreneurial activity of its faculty, and the market value of charity care.
x Fiscal Impacts: Universities and/or research institutions rely on the public services and facilities of the jurisdictions in which they reside but also generate local tax revenues to help pay for them. UCSF’s net fiscal impact is the difference between the City and County of San Francisco (hereafter “City”) General Fund costs associated with providing necessary public services and facilities (e.g., public safety, recreation services, etc.) and the General Fund revenues generated by UCSF facilities, students, and employees. Although UCSF facilities are exempt from property tax, its students, employees, and visitors generate a variety of other tax revenues including, sales, hotel, parking, and business license taxes.
UCSF Background and M iss io n
Founded in 1864 in San Francisco, UCSF is the only branch of the 10-campus University of California system that is exclusively dedicated to health sciences and graduate level education. Its primary missions are in four categories: education, patient care, research, and public service. Unlike other UC campuses, UCSF does not offer undergraduate programs, but instead focuses on professional training in four professional schools in dentistry, medicine, nursing, and pharmacy. UCSF also offers graduate student programs with degrees in behavioral, biological, biomedical, nursing, pharmaceutical, and social sciences.
In addition to these schools and programs, UCSF provides health care services and operates inpatient and outpatient medical centers and clinics throughout the city and the Bay Area. The UCSF Health system includes UCSF Medical Center and UCSF Benioff Children’s Hospitals, with locations in San Francisco and Oakland. It also includes the UCSF Langley Porter Psychiatric Hospital and Clinics, among other entities. UCSF Medical Center consists of inpatient facilities at Parnassus Heights and Mount Zion, and UCSF Medical Center at Mission Bay, a complex with three specialty hospitals for women, children and cancer patients, and outpatient clinics throughout the City.
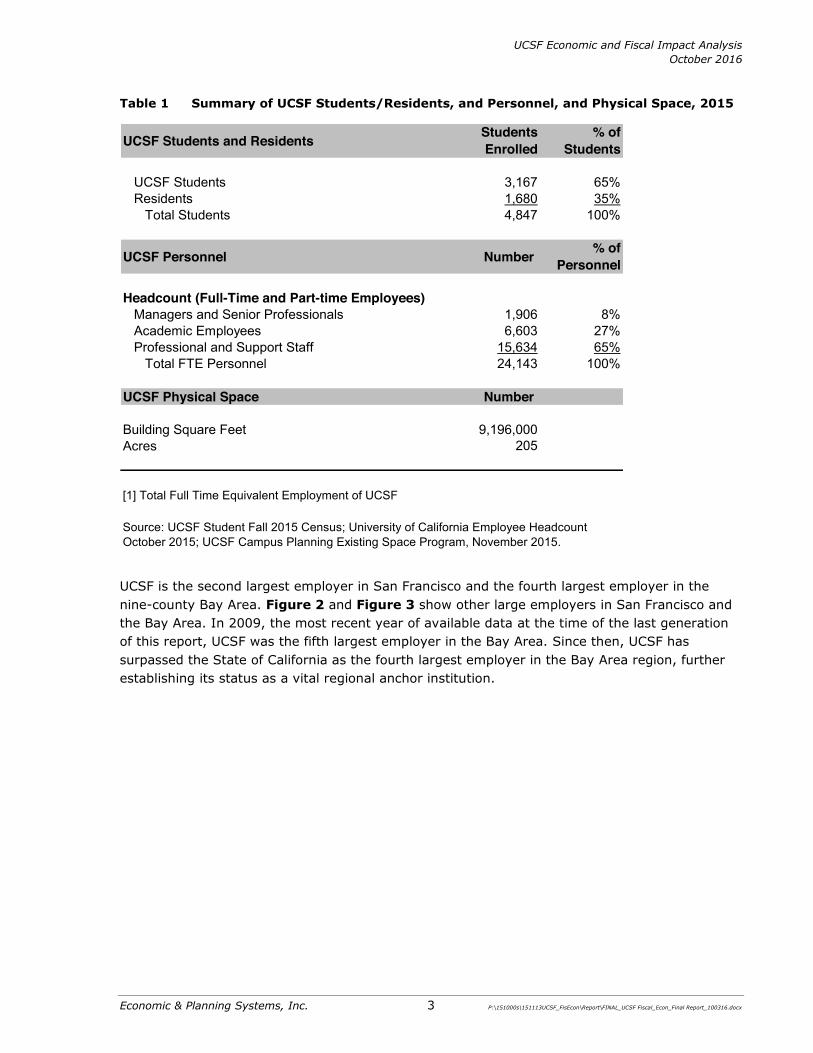
While subsequent chapters provide further detail, Table 1 provides a general overview of UCSF’s current student and employee population.
UCSF Economic and Fiscal Impact Analysis October 2016
Economic & Planning Systems, Inc. 3 P:\151000s\151113UCSF_FisEcon\Report\FINAL_UCSF Fiscal_Econ_Final Report_100316.docx
Table 1 Summary of UCSF Students/Residents, and Personnel, and Physical Space, 2015
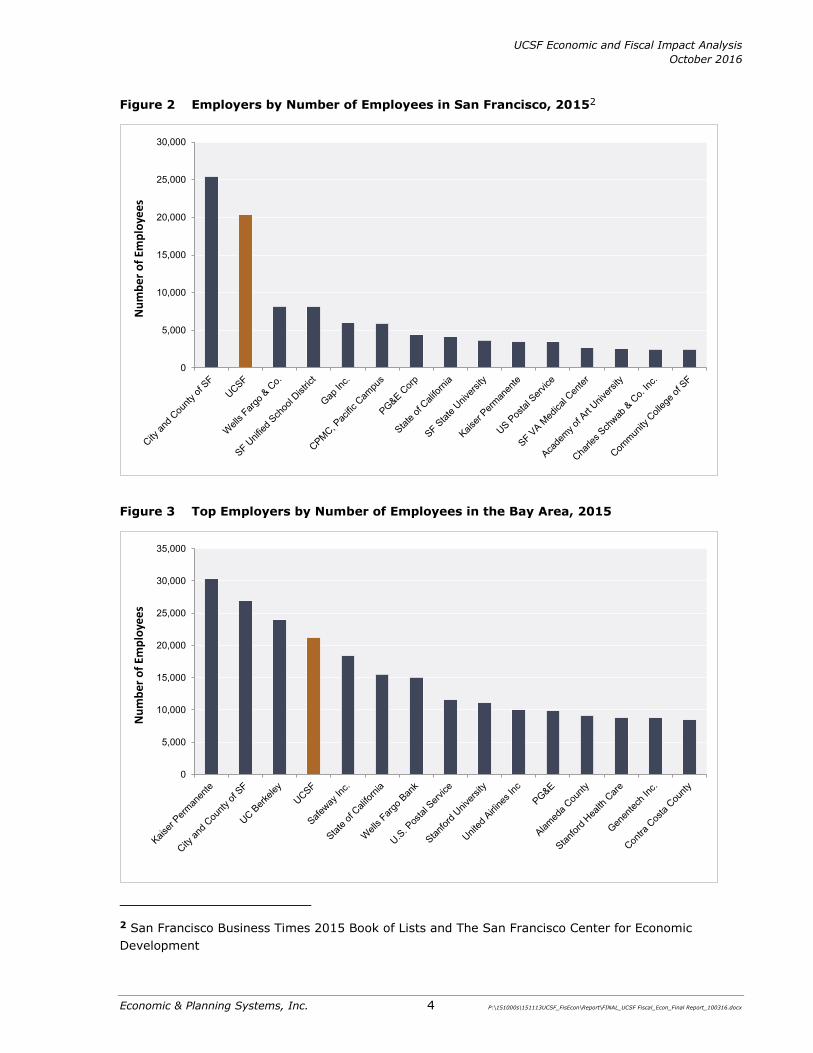
UCSF is the second largest employer in San Francisco and the fourth largest employer in the nine-county Bay Area. Figure 2 and Figure 3 show other large employers in San Francisco and the Bay Area. In 2009, the most recent year of available data at the time of the last generation of this report, UCSF was the fifth largest employer in the Bay Area. Since then, UCSF has surpassed the State of California as the fourth largest employer in the Bay Area region, further establishing its status as a vital regional anchor institution.
UCSF Students and Residents Students Enrolled
% of Students
UCSF Students 3,167 65%Residents 1,680 35%
Total Students 4,847 100%
UCSF Personnel Number % of Personnel
Headcount (Full-Time and Part-time Employees)Managers and Senior Professionals 1,906 8%Academic Employees 6,603 27%Professional and Support Staff 15,634 65%
Total FTE Personnel 24,143 100%
UCSF Physical Space Number
Building Square Feet 9,196,000Acres 205
[1] Total Full Time Equivalent Employment of UCSF
Source: UCSF Student Fall 2015 Census; University of California Employee Headcount October 2015; UCSF Campus Planning Existing Space Program, November 2015.
UCSF Economic and Fiscal Impact Analysis October 2016
Economic & Planning Systems, Inc. 4 P:\151000s\151113UCSF_FisEcon\Report\FINAL_UCSF Fiscal_Econ_Final Report_100316.docx
Figure 2 Employers by Number of Employees in San Francisco, 20152
Figure 3 Top Employers by Number of Employees in the Bay Area, 2015
2 San Francisco Business Times 2015 Book of Lists and The San Francisco Center for Economic Development
0
5,000
10,000
15,000
20,000
25,000
30,000N
um
ber
of
Emp
loye
es
0
5,000
10,000
15,000
20,000
25,000
30,000
35,000
Nu
mb
er o
f Em
plo
yees
UCSF Economic and Fiscal Impact Analysis October 2016
Economic & Planning Systems, Inc. 5 P:\151000s\151113UCSF_FisEcon\Report\FINAL_UCSF Fiscal_Econ_Final Report_100316.docx
Repor t Or gan iz a t io n
This report includes eight chapters that describe the methodology and results as well as Appendix A that provides supplemental data.
x Chapter 1 provides an introduction to the analyses contained in this report.
x Chapter 2 provides a summary of the key findings of the study.
x Chapter 3 provides an overview of UCSF, its people and ongoing operations.
x Chapter 4 describes the analysis of UCSF’s primary economic impacts.
x Chapter 5 provides the description and results of the secondary economic impact analysis.
x Chapter 6 contains the key assumptions and methodology for evaluating UCSF’s fiscal impact on the City’s General Fund.
x Chapter 7 quantifies UCSF’s fiscal impact on the City’s General Fund.
x Chapter 8 summarizes UCSF’s impact on other City special funds.
Economic & Planning Systems, Inc. 6 P:\151000s\151113UCSF_FisEcon\Report\FINAL_UCSF Fiscal_Econ_Final Report_100316.docx
2. STUDY FINDINGS
The findings from this study are summarized below with the key results compared against those from the EPS 2010 study.
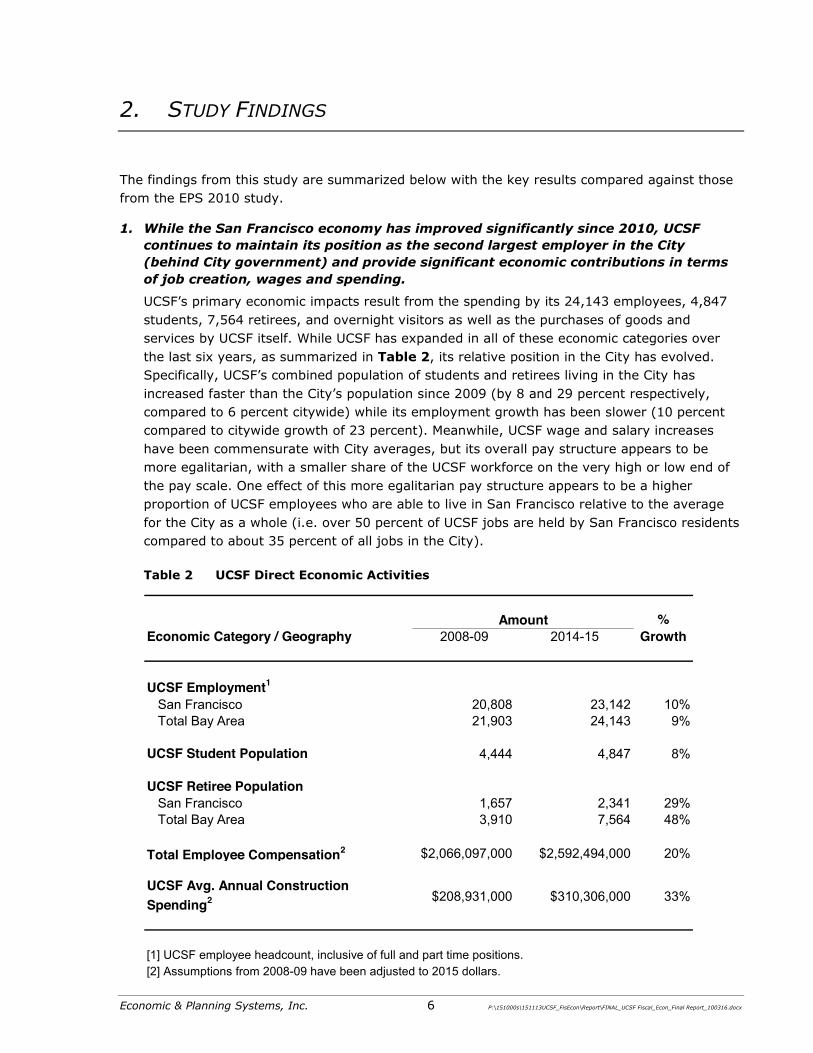
1. While the San Francisco economy has improved significantly since 2010, UCSF continues to maintain its position as the second largest employer in the City (behind City government) and provide significant economic contributions in terms of job creation, wages and spending.
UCSF’s primary economic impacts result from the spending by its 24,143 employees, 4,847 students, 7,564 retirees, and overnight visitors as well as the purchases of goods and services by UCSF itself. While UCSF has expanded in all of these economic categories over the last six years, as summarized in Table 2, its relative position in the City has evolved. Specifically, UCSF’s combined population of students and retirees living in the City has increased faster than the City’s population since 2009 (by 8 and 29 percent respectively, compared to 6 percent citywide) while its employment growth has been slower (10 percent compared to citywide growth of 23 percent). Meanwhile, UCSF wage and salary increases have been commensurate with City averages, but its overall pay structure appears to be more egalitarian, with a smaller share of the UCSF workforce on the very high or low end of the pay scale. One effect of this more egalitarian pay structure appears to be a higher proportion of UCSF employees who are able to live in San Francisco relative to the average for the City as a whole (i.e. over 50 percent of UCSF jobs are held by San Francisco residents compared to about 35 percent of all jobs in the City).
Table 2 UCSF Direct Economic Activities
Economic Category / Geography 2008-09 2014-15
UCSF Employment1
San Francisco 20,808 23,142 10%Total Bay Area 21,903 24,143 9%
UCSF Student Population 4,444 4,847 8%
UCSF Retiree Population San Francisco 1,657 2,341 29%Total Bay Area 3,910 7,564 48%
Total Employee Compensation2 $2,066,097,000 $2,592,494,000 20%
UCSF Avg. Annual Construction Spending2 $208,931,000 $310,306,000 33%
[1] UCSF employee headcount, inclusive of full and part time positions.[2] Assumptions from 2008-09 have been adjusted to 2015 dollars.
% Growth
Amount

UCSF Economic and Fiscal Impact Analysis October 2016
Economic & Planning Systems, Inc. 7 P:\151000s\151113UCSF_FisEcon\Report\FINAL_UCSF Fiscal_Econ_Final Report_100316.docx
2. UCSF’s direct economic activities have a substantial ripple effect throughout San Francisco and the broader Bay Area economy in the form of increased jobs, output, and employee compensation in a variety of industries that supply goods and services to UCSF and its affiliated population.
The spending by UCSF and its students, employees, and retirees has “indirect” and “induced” economic impacts as illustrated in Figure 4 and summarized in Table 3. The combined impact of these economic activities, referred to as UCSF’s primary economic impacts, are estimated to have resulted in 36,200 jobs, $3.6 billion in employee compensation, and $6.5 billion in industry output in San Francisco in FY 2014-15 (similar calculations are provided at the nine-county Bay Area3). By way of comparison, UCSF’s primary economic impact represents 5.4 percent of San Francisco’s total employment, an amount roughly equivalent to the entire financial services industry in the City. At both the City and regional scale, UCSF’s primary economic impacts surpass those estimated by EPS in 2010.
Figure 4 Illustration of UCSF’s Primary Economic Impacts
3 The nine-county Bay Area refers to the counties, which ring San Francisco Bay and are members of the Association of Bay Area Governments (ABAG), a regional organization. The nine counties are San Francisco, Marin, Sonoma, Napa, Solano, Contra Costa, Alameda, Santa Clara, and San Mateo counties.
UCSF Faculty and Staff
UCSF purchases of goods and services
Direct Impact + + =
UCSF Operations and Capital Investment
UCSF Students + Retirees
Household expenditures by UCSF employees, Suppliers' employees, students, and retirees
Indirect Impact
Induced Impact
Primary Economic Impacts

UCSF Economic and Fiscal Impact Analysis October 2016
Economic & Planning Systems, Inc. 8 P:\151000s\151113UCSF_FisEcon\Report\FINAL_UCSF Fiscal_Econ_Final Report_100316.docx
Table 3 Comparison of Primary Economic Impact Results, 2009 and 2015
3. Other metrics suggest that UCSF’s economic impacts are much higher than those which can be directly translated into jobs and spending and include the benefits from innovation and technology leadership, support for firm creation and workforce training, and the provision of free or below-cost health care services, particularly to disadvantaged and under-served populations.
This analysis has identified the following three discrete but highly interrelated categories that are most applicable to UCSF’s secondary economic impacts:
1. Innovation and Technology Leadership: As a premier research and medical institution, UCSF is directly responsible for numerous innovations and scientific discoveries with practical applications in a variety of fields. Most notably, UCSF research continues to advance a wide range of life science-related sectors, such as biotechnology and medical equipment that provide economic benefits to producers and consumers in the form of new and improved products for services for health and related fields.
2. UCSF Firm Creation and Workforce Development: Both anecdotal information and more academic research suggests that UCSF, similar to other major research and medical institutions, is directly linked to the creation of Research and Development (R&D)-related “start-ups” or “spin-off” firms as well as clusters of ancillary and support-related businesses and services (e.g., private doctor offices or medical supply firms). In addition, UCSF is actively engaged in a variety of workforce development activities that expand beyond the training of graduate students and includes outreach to the broader community, including special programs that target women (e.g. Women's Health Internship Program), people with disabilities (e.g. sponsorship of Toolworks program), unemployed San Francisco residents (e.g., the EXCEL [Excellence through Community Engagement and Learning] program) and local construction workers (e.g., Community Construction Outreach Program).
Nominal $s 2015 $s 1 Nominal Real 1
San Francisco ImpactsEmployment2 32,100 32,100 36,100 13% 13%Employee Compensation $2,196,000,000 $2,530,467,000 $3,617,327,000 65% 43%Industry Output $4,666,000,000 $5,376,666,000 $6,546,937,000 40% 22%
Nine County Bay Area ImpactsEmployment2 36,200 36,200 42,700 18% 18%Employee Compensation $2,855,100,000 $3,289,953,000 $4,194,725,000 47% 28%Industry Output $6,192,400,000 $7,135,548,000 $8,855,846,000 43% 24%
[2] Includes all direct, indirect, and induced employment from UCSF operations, capital spending, student spending, and retiree spending. Employment figures are rounded to the nearest hundred.
Item 2009 Results
2015 Results % Growth
[1] EPS adjusted the actual 2009 dollar amounts upward by the annual inflation rate (i.e. general increase in prices) experienced between the two report periods based on data from the Consumer Price Index (CPI) for San Francisco.

UCSF Economic and Fiscal Impact Analysis October 2016
Economic & Planning Systems, Inc. 9 P:\151000s\151113UCSF_FisEcon\Report\FINAL_UCSF Fiscal_Econ_Final Report_100316.docx
3. UCSF Uncompensated and Charity Health Care: As a major health care provider in the San Francisco Bay Area, UCSF offers access to services to many individuals and families who may not necessarily have the means to pay for the full price of care on their own, or whose medical or dental plans may not cover the full cost of various treatments and health care service. In addition, UCSF sponsors a variety of other health-related programs in the local community, including cancer screening, science and health educational outreach to students in local schools, and support for a variety of non-profit health entities and activities.
Specific metrics related to UCSF:
x UCSF has consistently ranked in the top five in total R&D expenditures nationwide, behind John Hopkins University, University of Michigan, Ann Arbor, University of Washington, Seattle, and University of Wisconsin, Madison. It is first in total R&D spending in life sciences over the last five years. Perhaps even more notable, available data suggests that UCSF is one of the single most prominent R&D institutions in the San Francisco Bay Area in terms of total spending. Specifically, EPS estimates that UCSF accounts for about 19 percent of the total R&D spending in San Francisco and 4 percent in the nine-county Bay Area.
x UCSF has consistently ranked as one of the top five recipients of funding from the National Institutes of Health (NIH), while its individual professional schools often rank number one. For example, in both 2014 and 2015, UCSF ranked second in overall funding behind Johns Hopkins University. UCSF’s four schools topped the nation in NIH funding in 2014 and 2015.
x A recent study by the Bay Area Council Economic Institute indicates that UCSF has given rise to more than 185 life sciences companies between 1968 and mid-2015.4 Of these, approximately 98 are still active with about 83 percent of these in life sciences fields. Several of these have produced further offshoots, giving rise to a next generation of descendants of UCSF start-ups.
x UCSF graduates from its professional schools and graduate programs also serve as an important resource for the health, biotechnology, and related sectors. UCSF Alumni Association data suggest that students exhibit high propensity to remain in California, and especially the Bay Area after graduation. Specifically, more than 20,000 UCSF graduates have remained in the Bay Area, 40 percent of whom live in San Francisco.
x Through operations at its medical centers, UCSF provided about $129 million in average annual uncompensated health care (the difference between the actual cost of health care and the amount received) and charity care (UCSF voluntary provision of subsidized health care) between 2013 and 2015.
4. From a fiscal perspective, UCSF continues to have a positive effect on the City of San Francisco General Fund budget, an impact that has increased in real terms (adjusting for inflation) since 2009.
UCSF generates an estimated $8.2 million in revenues and $7.3 million in costs to the City’s General Fund, resulting in a positive net fiscal impact of approximately $928,000 annually, a surplus that represents a roughly 14 percent increase in real terms (to account for the impact of inflation) from the amount estimated in the EPS 2010 study. This positive net benefit
4 See ”Entrepreneurs, Startups, and Innovation at the University of California” by the Bay Area Council Economic Institute, August 2016.
UCSF Economic and Fiscal Impact Analysis October 2016
Economic & Planning Systems, Inc. 10 P:\151000s\151113UCSF_FisEcon\Report\FINAL_UCSF Fiscal_Econ_Final Report_100316.docx
represents about 12 percent of the City General Fund costs attributable to UCSF. However, it represents less than 1 percent of the total San Francisco General Fund budget.
While UCSF, as a member of the University of California system, is exempt from property taxes and a variety of other local taxes, the University generates a significant amount of sales and use taxes for San Francisco—both from its own purchases and the purchases of students and employees during the school/workday—as well as hotel, payroll and parking taxes.5 The largest cost items attributed to UCSF are for the Municipal Transportation Agency (which runs the Municipal Railway, Muni). See Table 4 for summary of results.
Table 4 Comparison of Fiscal Impact Results, 2009 and 2015
5 While UCSF is exempt from paying payroll taxes for its employees, its substantial capital outlays have supported a significant amount of construction labor and the payroll tax from those projects are attributed to UCSF. In addition, while the University’s parking garages are not subject to the City’s parking tax, a portion of UCSF’s employees and students pay this tax when parking in non-UCSF parking facilities as part of their UCSF commute.
ItemNominal $s Real $s 1 Nominal Real 1
RevenuesSales and Use Tax $1,512,000 $1,742,000 $2,812,000 86% 71%Intergovernmental2 $820,000 $945,000 $1,521,000 85% 70%Hotel Tax $1,012,000 $1,166,000 $1,569,000 55% 40%Business Taxes3 $904,000 $1,042,000 $1,213,000 34% 19%Fines, Licenses, Permits (Incldg Parking) $641,000 $739,000 $1,122,000 75% 60%Property Taxes $0 $0 $0Total Revenues $4,889,000 5,634,000 $8,237,000 68% 53%
CostsFire $900,000 $1,037,000 $1,239,000 38% 22%Police and Other Public Protection $668,000 $770,000 $1,270,000 90% 75%Pub. Works, Transp, & Cmmrc.4 $1,294,000 $1,491,000 $2,534,000 96% 81%Human Welfare and Neigh. Dev. $393,000 $453,000 $479,000 22% 7%General City Responsibilities $622,000 $717,000 $1,300,000 109% 94%Culture and Recreation $156,000 $180,000 $229,000 47% 31%General Admin. and Finance $136,000 $157,000 $258,000 90% 74%Community Health $0 $0 $0Total Costs $4,169,000 $4,804,000 $7,309,000 75% 60%
Net Fiscal Impact $720,000 $830,000 $928,000 29% 14%
[1] Adjusted to account for inflation.
[3] Includes Payroll Taxes for the construction industry related to UCSF average annual capital expenditures.[4] Includes the San Francisco Municipal Transportation Agency (e.g. MUNI).
[2] Includes Federal, State, and Other Government Transfers
2009 Results 2015 Results % Change

UCSF Economic and Fiscal Impact Analysis October 2016
Economic & Planning Systems, Inc. 11 P:\151000s\151113UCSF_FisEcon\Report\FINAL_UCSF Fiscal_Econ_Final Report_100316.docx
In addition to a net fiscal positive contribution to the City of San Francisco’s General Fund, UCSF has provided or has committed to make payments to support public improvements and ongoing maintenance in the Mission Bay neighborhood. These commitments are consistent with UCSF’s agreements with the San Francisco Redevelopment Agency and the master developer of Mission Bay. More information on UCSF’s continued commitment to improvements to Mission Bay is provided in Chapter 8 of this report.
Economic & Planning Systems, Inc. 12 P:\151000s\151113UCSF_FisEcon\Report\FINAL_UCSF Fiscal_Econ_Final Report_100316.docx
3. BACKGROUND AND OVERVIEW OF UCSF
This chapter provides a background of UCSF and its mission as a public university, research institution, and health care provider. Additionally this chapter presents an overview of UCSF’s programs, facilities, employees, and students. This information provides a basis for evaluating UCSF’s economic and fiscal impacts in subsequent chapters.
UCSF Background and M iss io n
Founded in 1864 in San Francisco, UCSF is the only branch of the 10-campus University of California system that is exclusively dedicated to health sciences and graduate level education. Its primary missions are in four categories: education, patient care, research, and public service. Unlike other UC campuses, UCSF does not offer undergraduate programs, but instead focuses on professional training in four professional schools in dentistry, medicine, nursing, and pharmacy. UCSF also offers graduate student programs with degrees in behavioral, biological, biomedical, nursing, pharmaceutical, and social sciences.
In addition to these schools and programs, UCSF provides health care services and operates inpatient and outpatient medical centers and clinics throughout the City and the Bay Area. The UCSF Health system includes UCSF Medical Center, UCSF Benioff Children’s Hospitals, Langley Porter Psychiatric Hospital and Clinics, among other entities. UCSF Medical Center consists of inpatient facilities at Parnassus Heights and Mount Zion, UCSF Medical Center at Mission Bay, which comprises three new specialty hospitals for women, children and cancer patients, and outpatient clinics throughout San Francisco and the region.
As an academic medical center and graduate health sciences campus, UCSF has a broad and specialized set of responsibilities that differ from community hospitals whose primary mission is patient care. UCSF’s mission is broadly focused on educating and training the next generation of health care professionals and health scientists, advancing biomedical science and technology, translating scientific discoveries into improved patient therapy and care, and providing high-quality, evidence-based patient care. According to the University Strategic Plan, UCSF works toward its mission to “advance health worldwide through innovative health sciences education, discovery and patient care” by pursuing the following goals:6
x Provide unparalleled care to our patients x Improve health worldwide through innovative science x Attract and support the most talented and diverse trainees in the health sciences x Be the workplace of choice for diverse, top-tier talent x Create a financially sustainable enterprise-wide business model
6 From the University of California, San Francisco Strategic Plan 2014-2015
UCSF Economic and Fiscal Impact Analysis October 2016
Economic & Planning Systems, Inc. 13 P:\151000s\151113UCSF_FisEcon\Report\FINAL_UCSF Fiscal_Econ_Final Report_100316.docx
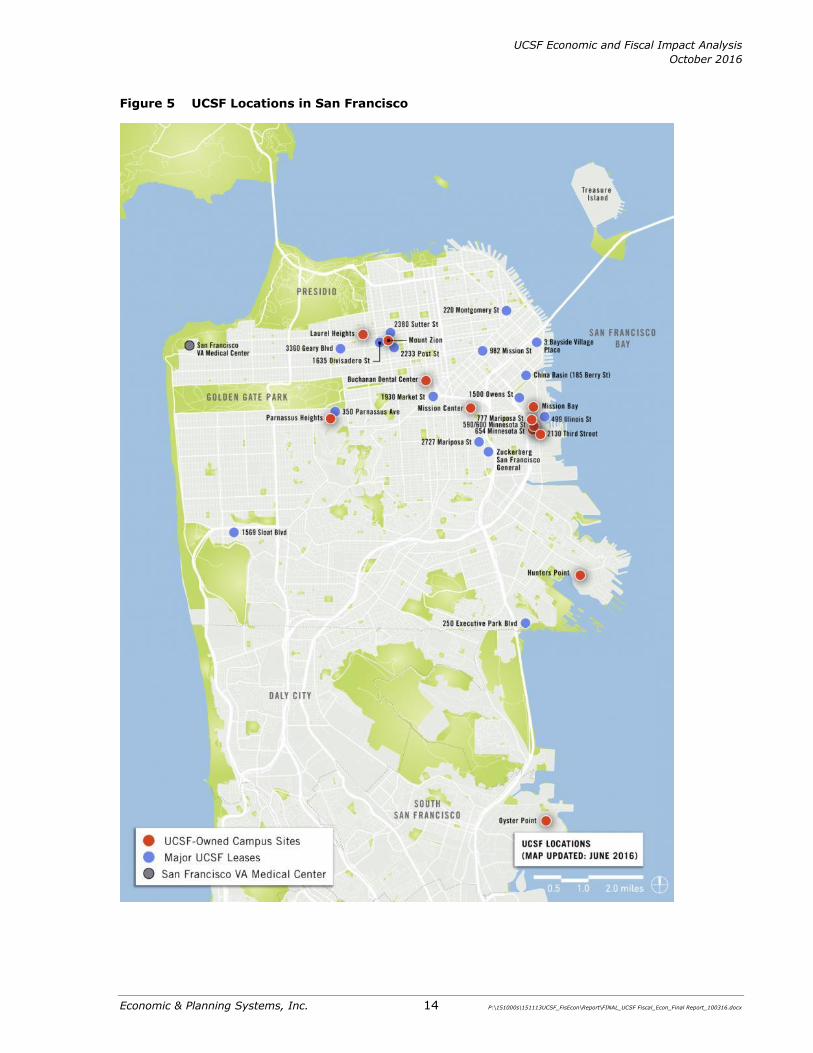
UCSF Fac i l i t i es and Lo ca t ions
Largely situated within the City of San Francisco, UCSF facilities occupy nearly 10 million square feet of building space and cover roughly 200 acres of land.7 The University has campuses at three major locations: Parnassus Heights, Mission Bay, and Mount Zion. In addition to these campus locations, UCSF operates in a number of other sites in the City as illustrated in Figure 5. UCSF facilities include its hospitals and clinics, instruction space, conference centers, office space, and more than 900 beds within 667 housing units. In addition to the locations illustrated in Figure 5, UCSF operates satellite facilities in other cities in California, such as UCSF Benioff Children’s Hospital Oakland and the Fresno Medical Education and Research Program.
7 61 of UCSF’s 205 acres are dedicated to the Mount Sutro Open Space Reserve, UCSF Campus Planning, Facts and Figures, July 2016; UCSF Long Range Development Plan, 2014.
UCSF Economic and Fiscal Impact Analysis October 2016
Economic & Planning Systems, Inc. 14 P:\151000s\151113UCSF_FisEcon\Report\FINAL_UCSF Fiscal_Econ_Final Report_100316.docx
Figure 5 UCSF Locations in San Francisco
UCSF Economic and Fiscal Impact Analysis October 2016
Economic & Planning Systems, Inc. 15 P:\151000s\151113UCSF_FisEcon\Report\FINAL_UCSF Fiscal_Econ_Final Report_100316.docx
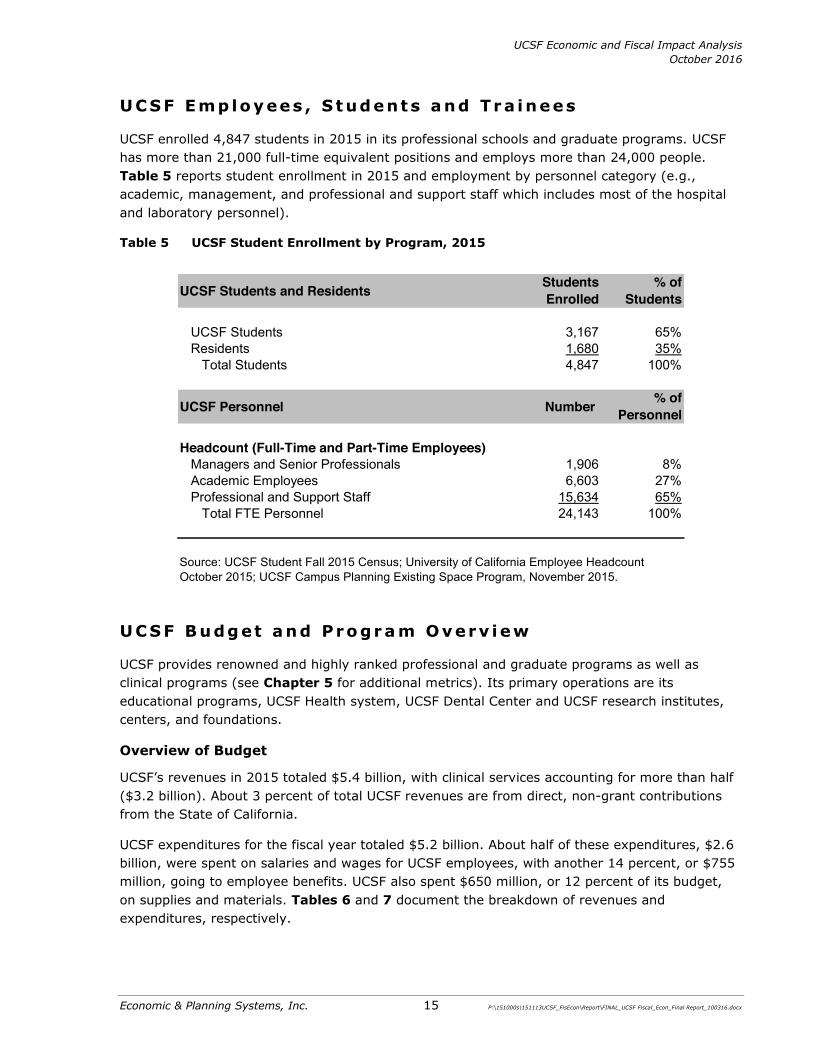
UCSF Emp lo yees , S t udent s a nd Tr a inees
UCSF enrolled 4,847 students in 2015 in its professional schools and graduate programs. UCSF has more than 21,000 full-time equivalent positions and employs more than 24,000 people. Table 5 reports student enrollment in 2015 and employment by personnel category (e.g., academic, management, and professional and support staff which includes most of the hospital and laboratory personnel).
Table 5 UCSF Student Enrollment by Program, 2015
UCSF Budget and Pro gr a m Overv iew
UCSF provides renowned and highly ranked professional and graduate programs as well as clinical programs (see Chapter 5 for additional metrics). Its primary operations are its educational programs, UCSF Health system, UCSF Dental Center and UCSF research institutes, centers, and foundations.
Overview of Budget
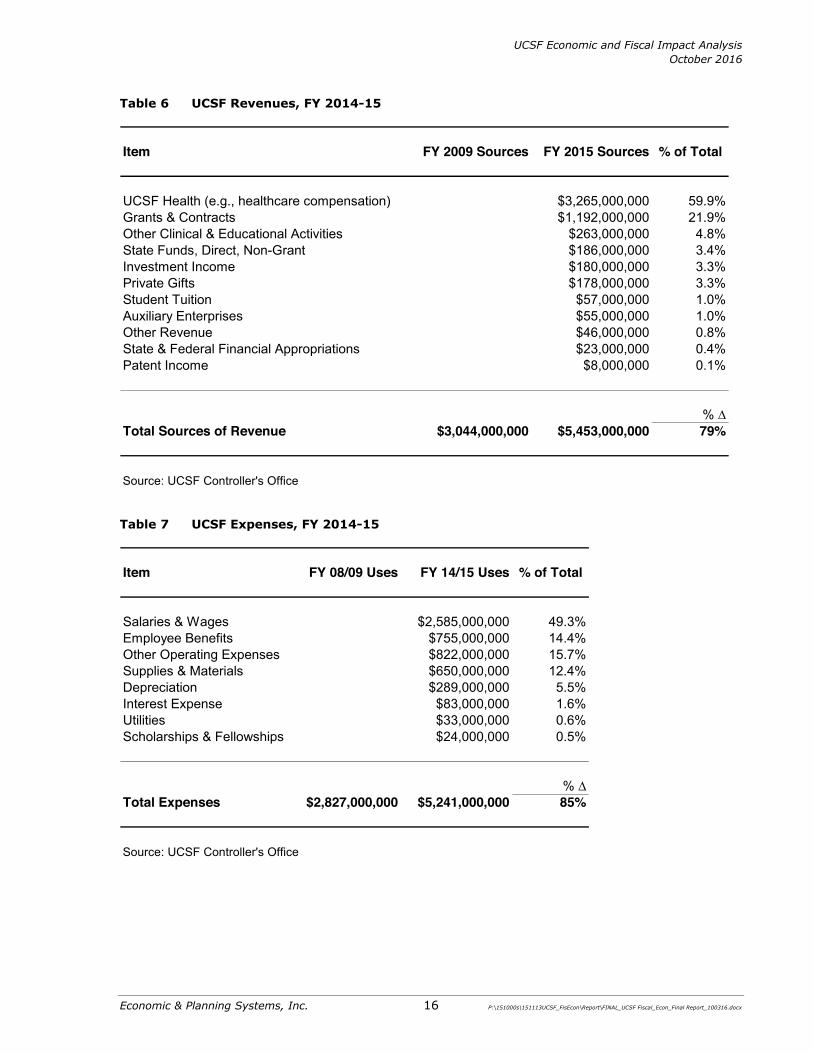
UCSF’s revenues in 2015 totaled $5.4 billion, with clinical services accounting for more than half ($3.2 billion). About 3 percent of total UCSF revenues are from direct, non-grant contributions from the State of California.
UCSF expenditures for the fiscal year totaled $5.2 billion. About half of these expenditures, $2.6 billion, were spent on salaries and wages for UCSF employees, with another 14 percent, or $755 million, going to employee benefits. UCSF also spent $650 million, or 12 percent of its budget, on supplies and materials. Tables 6 and 7 document the breakdown of revenues and expenditures, respectively.
UCSF Students and Residents Students Enrolled
% of Students
UCSF Students 3,167 65%Residents 1,680 35%
Total Students 4,847 100%
UCSF Personnel Number % of Personnel
Headcount (Full-Time and Part-Time Employees)Managers and Senior Professionals 1,906 8%Academic Employees 6,603 27%Professional and Support Staff 15,634 65%
Total FTE Personnel 24,143 100%
Source: UCSF Student Fall 2015 Census; University of California Employee Headcount October 2015; UCSF Campus Planning Existing Space Program, November 2015.
UCSF Economic and Fiscal Impact Analysis October 2016
Economic & Planning Systems, Inc. 16 P:\151000s\151113UCSF_FisEcon\Report\FINAL_UCSF Fiscal_Econ_Final Report_100316.docx
Table 6 UCSF Revenues, FY 2014-15
Table 7 UCSF Expenses, FY 2014-15
Item FY 2009 Sources FY 2015 Sources % of Total
UCSF Health (e.g., healthcare compensation) $3,265,000,000 59.9%Grants & Contracts $1,192,000,000 21.9%Other Clinical & Educational Activities $263,000,000 4.8%State Funds, Direct, Non-Grant $186,000,000 3.4%Investment Income $180,000,000 3.3%Private Gifts $178,000,000 3.3%Student Tuition $57,000,000 1.0%Auxiliary Enterprises $55,000,000 1.0%Other Revenue $46,000,000 0.8%State & Federal Financial Appropriations $23,000,000 0.4%Patent Income $8,000,000 0.1%
% ∆Total Sources of Revenue $3,044,000,000 $5,453,000,000 79%
Source: UCSF Controller's Office
Item FY 08/09 Uses FY 14/15 Uses % of Total
Salaries & Wages $2,585,000,000 49.3%Employee Benefits $755,000,000 14.4%Other Operating Expenses $822,000,000 15.7%Supplies & Materials $650,000,000 12.4%Depreciation $289,000,000 5.5%Interest Expense $83,000,000 1.6%Utilities $33,000,000 0.6%Scholarships & Fellowships $24,000,000 0.5%
% ∆Total Expenses $2,827,000,000 $5,241,000,000 85%
Source: UCSF Controller's Office

UCSF Economic and Fiscal Impact Analysis October 2016
Economic & Planning Systems, Inc. 17 P:\151000s\151113UCSF_FisEcon\Report\FINAL_UCSF Fiscal_Econ_Final Report_100316.docx
Educational Programs
UCSF’s four professional schools and the Graduate Division offer clinical, professional, and research-based graduate-level education programs. These programs consistently rank among the best in the nation and the world with highly competitive admissions attracting some of the most talented students in the country. School departments and organized research units are listed in Table 8 and briefly described below.
x School of Dentistry: The School of Dentistry offers professional education through a four-year Doctor of Dental Surgery (DDS) program, a two-year international dentist DDS program, a Master of Science program in Dental Hygiene, Master’s and PhD degrees in Oral and Craniofacial Sciences (in coordination with the Graduate Division), and 12 postgraduate/residency programs.
x School of Medicine: The School of Medicine is the largest of UCSF’s schools, with departments and programs in three main categories: basic biomedical science, clinical science, and social and population science. It offers the Doctor of Medicine (MD) professional degree, the Doctor of Physical Therapy (DPT) professional degree, graduate academic degrees (MS and PhD) in coordination with the Graduate Division, and residency programs in medical specialties.
x School of Nursing: The School of Nursing offers Master’s and PhD degrees in nursing, Master (MS) in Healthcare Administration and Interprofessional Leadership, and a PhD degree in sociology, in coordination with the Graduate Division, preparing students for positions in nursing clinical practice, administration, health policy, leadership, teaching and research. The school provides opportunities for post-graduate (specialized clinical programs), post-doctoral scholars (research), other visiting research scholars, and international clinical, teaching, or research scholars.
x School of Pharmacy: The School of Pharmacy focuses on improving health through precise therapeutics-medicines, medical devices, and diagnostic tests. Toward this end, the school advances 1) therapeutics-related research in the basic, translational, clinical, and health policy sciences; 2) pharmacy patient care; and 3) graduate-level professional and science education. The school offers two combined degrees (PharmD/MSCR and PharmD/PhD), co-directs an MS degree program in translational medicine, and administers five interdisciplinary PhD degree graduate programs (bioengineering, bioinformatics, biophysics, chemistry and chemical biology, and pharmaceutical sciences and pharmacogenomics) in coordination with the Graduate Division. Its postdoctoral agenda includes a Pharmacy Residency Program presented in partnership with UCSF Medical Center. The School of Pharmacy also offers curricula for seasoned professionals in the industry, regulatory agencies, academia, and health care.
x The Graduate Division: The Graduate Division supports and oversees students in 31 graduate academic degree programs and offers certificates, offering 11 Master’s degrees (MS, MA, MAS, MTM), 20 Doctoral degrees (PhD and DPT) and two certificate programs. Nearly all of UCSF’s graduate programs are interdisciplinary, with many faculty members having appointments across departments and schools. The Graduate Division functions as the institutional home for graduate education and postdoctoral scholarship at UCSF. It serves as the primary advocate for graduate students and postdoctoral scholars.

UCSF Economic and Fiscal Impact Analysis October 2016
Economic & Planning Systems, Inc. 18 P:\151000s\151113UCSF_FisEcon\Report\FINAL_UCSF Fiscal_Econ_Final Report_100316.docx
Table 8 Departments and Organized Research Units by School
Departments Organized Reserch Units1 / Interdisciplinary Centers
SCHOOL OF DENTISTRYCell & Tissue BiologyOral & Maxillofacial SurgeryOrofacial SciencesPreventive & Restorative Dental Sciences
SCHOOL OF MEDICINEAnatomy Cancer Research InstituteAnesthesia & Perioperative Care Cardiovascular Research InstituteAnthropology, History & Social Medicine Center for Reproductive SciencesBiochemistry & Biophysics Diabetes CenterBioengineering & Therapeutic Sciences GW Hooper FoundationCellular & Molecular Pharmacology Human Genetics
Dermatology Philip R. Lee Institute for Health Policy Studies
Emergency Medicine Institute for Neurodegenerative DiseasesFamily & Community Medicine Institute for Global HealthLaboratory MedicineMedicineMicrobiology & Immunology AIDS Research InstituteNeurological Surgery Center for Health and CommunityNeurology Clinical & Translational Science Institute
Obstetrics, Gynecology & Reproductive Sciences Developmental and Stem Cell Biology Program
Ophthalmology Osher Center for Integrative MedicineOrthopaedic Surgery Sandler Asthma Basic Research CenterOtolaryngology Sandler Program for Asthma Research
Pathology Wheeler Center for the Neurobiology of Addiction
PediatricsPhysical Therapy & Rehabilitation ServicesPhysiologyPsychiatryRadiation OncologyRadiology and Biomedical ImagingSurgeryUrology
SCHOOL OF NURSINGCommunity Health Systems Institute for Health and AgingFamily Health Care NursingPhysiological NursingSocial & Behavioral Sciences
SCHOOL OF PHARMACYBioengineering and Therapeutic Sciences Molecular Design InstituteClinical PharmacyPharmaceutical Chemistry
OTHER ORGANIZED RESEARCH UNITS Proctor Foundation
Source: UCSF 2014 Long Range Development Plan (LRDP)
[1] An Organized Research Unit (ORU) is a formal academic agency with a separate budget and administration, offically established by the Regents, consisting of an interdepartmental group of faculty, students, and staff engaged in research.
UCSF Economic and Fiscal Impact Analysis October 2016
Economic & Planning Systems, Inc. 19 P:\151000s\151113UCSF_FisEcon\Report\FINAL_UCSF Fiscal_Econ_Final Report_100316.docx
Clinical Enterprise
The clinical enterprise consists of UCSF Health, which includes UCSF Medical Center (the hospitals plus all clinics and physician practices operated by the medical center and the School of Medicine), UCSF Benioff Children’s Hospitals in San Francisco and Oakland, and the Langley Porter Psychiatric Hospital and Clinics, among other entities. The medical center consists of inpatient facilities at Parnassus Heights and Mount Zion, three new specialty hospitals at Mission Bay (the UCSF Benioff Children’s Hospital, the UCSF Betty Irene Moore Women’s Hospital and the UCSF Bakar Cancer Hospital), and outpatient clinics at those and numerous other locations throughout the City.
UCSF Benioff Children’s Hospital entered into an affiliation agreement in January 2014 with Children's Hospital and Research Center Oakland (CHRCO), expanding UCSF’s pediatric network in the Bay Area and establishing UCSF Benioff Children’s Hospital Oakland.
Operated by the School of Dentistry, the UCSF Dental Center provides comprehensive oral health care for adults and children — from general dentistry to advanced dental specialties. The school provides dental care at the Faculty Group Practice at Parnassus Heights and the Buchanan Dental Center on Buchanan Street in San Francisco.
UCSF has longstanding affiliations with Zuckerberg San Francisco General Hospital (ZSFG), operated by the City and County of San Francisco, and San Francisco Veterans Affairs Medical Center (SFVAMC), operated by the U.S. Department of Veterans Affairs. At both sites, UCSF faculty provides patient care and conduct professional teaching and research programs.
UCSF also is affiliated with research entities, such as the J. David Gladstone Institutes, and operates the UCSF Fresno Center for Medical Education and Research in California’s San Joaquin Valley, which provides training for physicians and other health professionals.
Research
UCSF’s internationally recognized research enterprise conducts basic research in biology, biochemistry, and other disciplines related to health and disease; carries out translational research studies in epidemiology, behavioral, and social sciences; studies health care policies; and provides training in each of these fields. Faculty members are acclaimed for their excellence, achievements, and leadership in health sciences, with honors that include five Nobel Prizes, five MacArthur Fellowships, and numerous National Academy of Sciences and Institute of Medicine memberships. Additional metrics related to UCSF’s research activities and accomplishments are provided in Chapter 5.

Economic & Planning Systems, Inc. 20 P:\151000s\151113UCSF_FisEcon\Report\FINAL_UCSF Fiscal_Econ_Final Report_100316.docx
4. PRIMARY ECONOMIC IMPACTS
This chapter evaluates UCSF’s primary economic impacts in both the City of San Francisco and the nine-county Bay Area (Study Area). Primary economic impacts represent those that can be directly linked to spending by the University, its students and employees (including retirees) and that can be readily translated into quantifiable economic metrics, such as jobs, spending in the local and regional economy, and employee compensation. Specifically, this primary economic impact analysis quantifies the level of output (i.e., value of goods and services), together with employment and employee compensation within San Francisco and nine-county Bay Area that is directly attributable to UCSF. This economic activity is derived from the following discrete UCSF-related activities:
1. UCSF’s annual operating expenditures — This includes annual spending on existing programs and facility maintenance, including
salaries of existing faculty and staff.
2. UCSF’s annual construction expenditures — This includes the average amount that UCSF spends per year to develop or improve its
capital facilities (e.g., buildings and related infrastructure).
3. Spending by UCSF students — This includes the spending by students currently enrolled in UCSF programs (spending by
UCSF faculty and staff are captured in #1 above).
4. Spending by UCSF retirees — This includes the impact of UCSF retirement benefits paid to eligible UCSF retirees who
currently reside in the Study Area. The local spending of these retirees is directly attributable to UCSF since it is based entirely on UCSF payments (the analysis excludes retiree spending attributable to income from other sources).
It is important to note that this primary economic impact analysis only focuses on economic activities that originate from UCSF and, therefore, exclude a number of spending categories that UCSF contributes to, albeit less directly. For example, the primary economic impact analysis excludes the spending by UCSF visitors or by UCSF alumni (unless their spending is based on UCSF income or other payments).8 This is because the spending of visitors and alumni is generally based on income derived from sources other than UCSF (e.g., their employer or personal savings).
8 The fiscal impact analysis described in subsequent chapters does account for the tax revenues generated by visitor spending. Unlike the economic analysis, a fiscal analysis focuses on the tax implications of spending attributable to UCSF regardless of whether UCSF is the origin or primary source for the income that enables this spending.
UCSF Economic and Fiscal Impact Analysis October 2016
Economic & Planning Systems, Inc. 21 P:\151000s\151113UCSF_FisEcon\Report\FINAL_UCSF Fiscal_Econ_Final Report_100316.docx
Overv iew o f Input /Out put Mode l ing
This analysis utilizes an Input/Output (I/O) modeling framework to quantify UCSF’s contribution to regional output, jobs, and employee compensation. The I/O modeling framework is premised on the concept that industries in a particular geographic area are interdependent and, thus, the total contribution of any one establishment’s activity is larger than its individual (direct) output and/or employment. Consequently, an establishment’s economic activity has a “multiplier” effect that generates successive rounds of spending and output in other economic sectors within a particular region. It is also worth noting that because UCSF is largely funded through a variety of state and federal sources, the economic impacts quantified herein have historically been relatively stable when compared to entities that are subject to the private sector business cycle.
Industries in a geographic region are interdependent in the sense that they purchase output from and supply input to other industries. For example, consider the implications of a health care expenditure. Hospitals purchase goods from producers, which in turn purchase raw materials from suppliers. Thus, an increase/decrease in the demand for health care provisions will stimulate an increase/decrease in output and employment in the interdependent secondary industries.
This regional economic analysis relies on IMPLAN (Impact Analysis for Planning) software, an I/O model that draws upon extensive data collected by the Minnesota IMPLAN Group (MIG) from several state and federal sources, including the U.S. Bureau of Economic Analysis, U.S. Bureau of Labor Statistics (BLS), and the U.S. Census Bureau. The model is widely used for estimating economic impacts across a wide array of industries and economic settings.
Regional economic impact analysis and I/O models in particular provide a means to estimate total regional effects stemming from a particular industry. Specifically, I/O models produce quantitative estimates of the magnitude of regional economic activity resulting from some initial activity (e.g., university or hospital operations). I/O models rely on economic “multipliers” that mathematically represent the relationship between the initial change in one sector of the economy and the effect of that change on economic output, income, or employment in other local industries. These economic data provide a quantitative estimate of the magnitude of shifts in jobs and revenues within the regional economy.
Interpretation of Model Results
Economic impacts using an I/O model are based on an initial change in output or employment in some sector. The model then translates the initial change into changes in demand for output from other interdependent sectors, corresponding changes in demand for inputs to those sectors, and so on. These effects are commonly described as direct, indirect or induced, and are generally defined as follows:
x The direct effect represents the change in output attributable to a change in demand associated with a new local expenditure or investment. For example, the total revenue generated by a new hospital facility would represent the direct impact on the San Francisco economy.
x The indirect effect results from industry-to-industry transactions required to satisfy the direct effect. This effect is a measure of the change in the output of suppliers linked to the industry that is directly affected. For example, the operation of the UCSF Medical Center at Mission
UCSF Economic and Fiscal Impact Analysis October 2016
Economic & Planning Systems, Inc. 22 P:\151000s\151113UCSF_FisEcon\Report\FINAL_UCSF Fiscal_Econ_Final Report_100316.docx
Bay has caused an increase in purchases of food, laundry service, biomedical supplies, and other goods from San Francisco suppliers.
x The induced effect consists of impacts from employee spending in the regional economy. Specifically, the employees of directly and indirectly affected businesses generate this effect by purchasing goods and services in the regional economy. For example, employees of UCSF who use their compensation to spend money on goods and services in the San Francisco County economy.
The total impact is the sum of the direct, indirect, and induced effects. The total effect measures the impact of an activity as it “ripples” throughout the regional economy. In the subsequent section, we report the regional economic effects described above in three categories:
1. Employment represents the estimated number of direct, indirect, and induced jobs in the Study Area economy resulting from UCSF-related activity.
2. Output represents the estimated level of direct, indirect, and induced output or “final sales” attributable to UCSF-related activity.
3. Employee compensation represents the estimated amount of direct, indirect, and induced labor income resulting from the jobs evaluated in #1 above.
Caveats to Input/Output Modeling
Several important caveats are relevant to the interpretation of IMPLAN model estimates. First, IMPLAN relies upon I/O relationships derived from 2014 data (latest available from IMPLAN). Thus, our analysis assumes that this characterization of the San Francisco and Bay Area economies is a reasonable approximation of current conditions. To the extent that significant structural changes have occurred within the local and regional economies since 2014, our results may not account for such changes. While the magnitude and direction of any such change is unknown, it is not expected to be significant since the two-year time lag corresponds to the same business cycle.
Second, the I/O methodology assumes that UCSF’s demand for goods and services results in a corresponding net increase in supply and, therefore, employment. This implies that key industry suppliers have the capacity to meet total demand rather than shift output from one set of consumers or products to another. This assumption may not hold in areas with tight labor or capital markets, since companies may find it difficult to obtain these inputs or other resources necessary to expand production. In these cases, accommodating an establishment’s demand for labor and other inputs may come at the expense of other establishments in the same or related sectors and/or may need to be satisfied by increased imports from outside the Study Area (i.e., increased imports). This phenomenon is often referred to as “crowding out” since the sector being stimulated tends to “crowd out” other sectors which can reduce the net economic gain.
In the case of UCSF, it is difficult to speculate what industries might be “crowded out,” or might have emerged in the absence of UCSF. Although UCSF may compete for inputs with other sectors in the local economy, it also undoubtedly supplies inputs needed by a number of sectors to grow and remain competitive. Most notably, UCSF provides trained labor as well as technological innovation that is relied upon by many companies in the health care and biotechnology

UCSF Economic and Fiscal Impact Analysis October 2016
Economic & Planning Systems, Inc. 23 P:\151000s\151113UCSF_FisEcon\Report\FINAL_UCSF Fiscal_Econ_Final Report_100316.docx
industries. It also provides health care, housing, and other amenities and services as documented further in subsequent sections of this report.
Pr imary Eco no mic I mpac t A na lys i s and Resu l t s
This section summarizes the key assumptions and results from applying an I/O analysis to UCSF related economic activity. The four discrete areas of economic activity are described separately below.
UCSF Operations
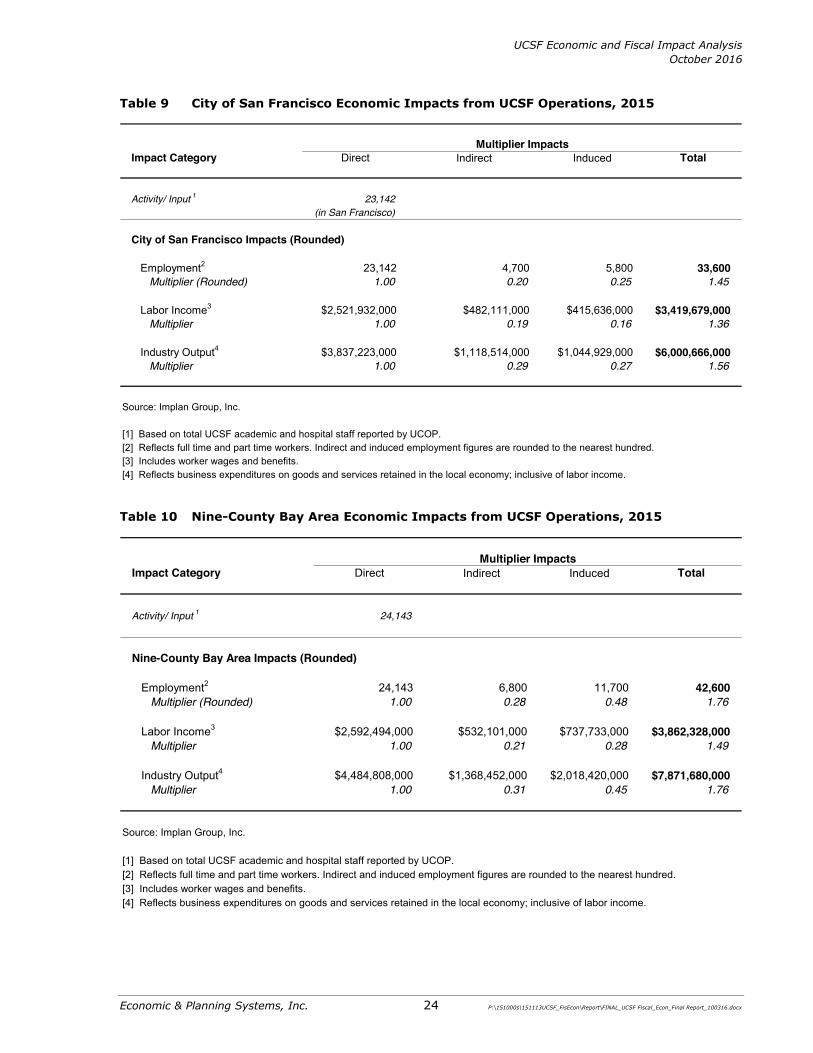
EPS has evaluated the economic impact of UCSF’s operations based on data on its existing number of employees. Specifically, EPS used IMPLAN software to generate multipliers for the amount of indirect and induced jobs, output, and employee income created by every UCSF direct job.9 The results from this calculation are summarized in Table 9 for San Francisco and in Table 10 for the nine-county Bay Area.
UCSF data on its direct jobs served as the primary data for this analysis. Specifically, UCSF directly employs approximately 24,143 workers in the nine-county Bay Area, of whom 23,142 work in the City of San Francisco.10 As shown in Table 9, a total employment multiplier of 1.45 suggests that UCSF’s 23,142 direct jobs in San Francisco create about 4,700 indirect and 5,700 induced jobs, for a total primary economic impact of approximately 33,600 jobs. The total annual output and employee compensation resulting from this activity is estimated at $6 billion and $3.4 billion, respectively.
9 This analysis relies on multipliers from the private “hospitals” and “universities” sectors. Although UCSF is a public institution, industry sectors representing private hospitals and private universities are used to compute indirect and induces economic impacts as these sectors were considered to best reflect the actual expenditure patterns associated with UCSF operations.
10 Proportion of jobs in San Francisco is tied to proportion of UCSF building square footage located in San Francisco. This methodology assumes that employment density is approximately even throughout UCSF facilities.
UCSF Economic and Fiscal Impact Analysis October 2016
Economic & Planning Systems, Inc. 24 P:\151000s\151113UCSF_FisEcon\Report\FINAL_UCSF Fiscal_Econ_Final Report_100316.docx
Table 9 City of San Francisco Economic Impacts from UCSF Operations, 2015
Table 10 Nine-County Bay Area Economic Impacts from UCSF Operations, 2015
Impact Category Direct Indirect Induced Total
Activity/ Input 1 23,142 (in San Francisco)
City of San Francisco Impacts (Rounded)
Employment2 23,142 4,700 5,800 33,600Multiplier (Rounded) 1.00 0.20 0.25 1.45
Labor Income3 $2,521,932,000 $482,111,000 $415,636,000 $3,419,679,000 Multiplier 1.00 0.19 0.16 1.36
Industry Output4 $3,837,223,000 $1,118,514,000 $1,044,929,000 $6,000,666,000 Multiplier 1.00 0.29 0.27 1.56
Source: Implan Group, Inc.
[1] Based on total UCSF academic and hospital staff reported by UCOP. [2] Reflects full time and part time workers. Indirect and induced employment figures are rounded to the nearest hundred.[3] Includes worker wages and benefits.
Multiplier Impacts
[4] Reflects business expenditures on goods and services retained in the local economy; inclusive of labor income.
Impact Category Direct Indirect Induced Total
Activity/ Input 1 24,143
Nine-County Bay Area Impacts (Rounded)
Employment2 24,143 6,800 11,700 42,600Multiplier (Rounded) 1.00 0.28 0.48 1.76
Labor Income3 $2,592,494,000 $532,101,000 $737,733,000 $3,862,328,000 Multiplier 1.00 0.21 0.28 1.49
Industry Output4 $4,484,808,000 $1,368,452,000 $2,018,420,000 $7,871,680,000 Multiplier 1.00 0.31 0.45 1.76
Source: Implan Group, Inc.
[1] Based on total UCSF academic and hospital staff reported by UCOP. [2] Reflects full time and part time workers. Indirect and induced employment figures are rounded to the nearest hundred.[3] Includes worker wages and benefits.
Multiplier Impacts
[4] Reflects business expenditures on goods and services retained in the local economy; inclusive of labor income.
UCSF Economic and Fiscal Impact Analysis October 2016
Economic & Planning Systems, Inc. 25 P:\151000s\151113UCSF_FisEcon\Report\FINAL_UCSF Fiscal_Econ_Final Report_100316.docx
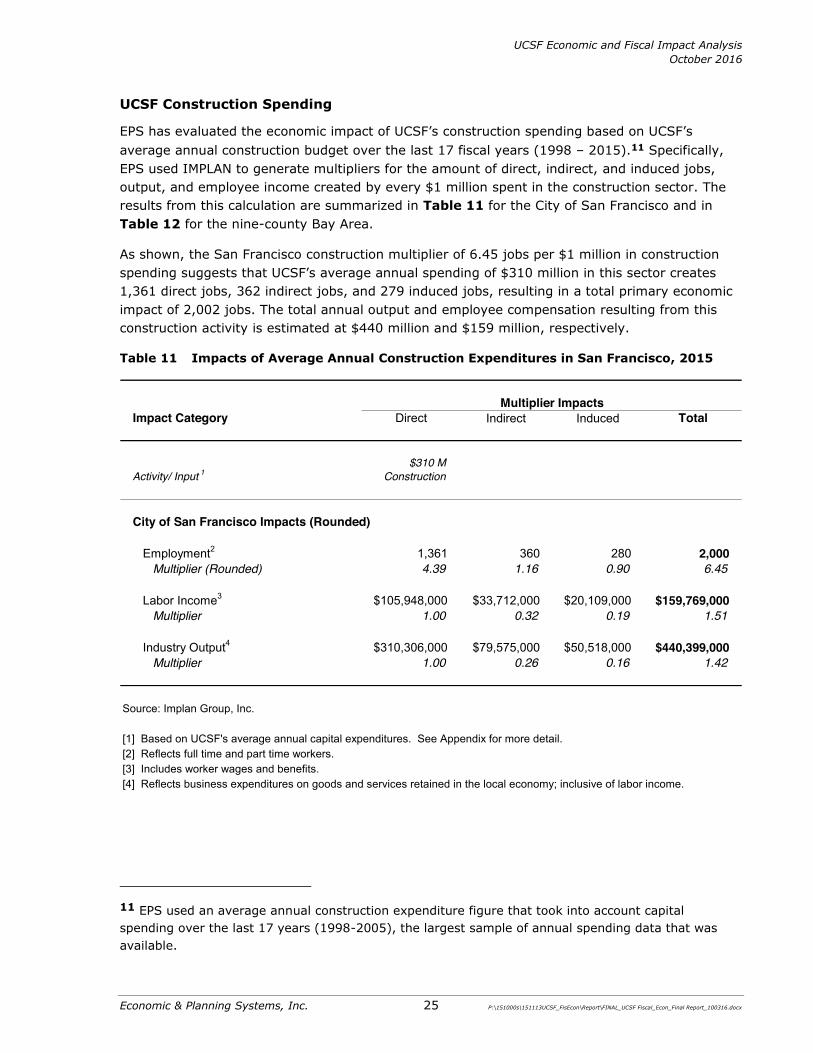
UCSF Construction Spending
EPS has evaluated the economic impact of UCSF’s construction spending based on UCSF’s average annual construction budget over the last 17 fiscal years (1998 – 2015).11 Specifically, EPS used IMPLAN to generate multipliers for the amount of direct, indirect, and induced jobs, output, and employee income created by every $1 million spent in the construction sector. The results from this calculation are summarized in Table 11 for the City of San Francisco and in Table 12 for the nine-county Bay Area.
As shown, the San Francisco construction multiplier of 6.45 jobs per $1 million in construction spending suggests that UCSF’s average annual spending of $310 million in this sector creates 1,361 direct jobs, 362 indirect jobs, and 279 induced jobs, resulting in a total primary economic impact of 2,002 jobs. The total annual output and employee compensation resulting from this construction activity is estimated at $440 million and $159 million, respectively.
Table 11 Impacts of Average Annual Construction Expenditures in San Francisco, 2015
11 EPS used an average annual construction expenditure figure that took into account capital spending over the last 17 years (1998-2005), the largest sample of annual spending data that was available.
Impact Category Direct Indirect Induced Total
Activity/ Input 1$310 M
Construction
City of San Francisco Impacts (Rounded)
Employment2 1,361 360 280 2,000Multiplier (Rounded) 4.39 1.16 0.90 6.45
Labor Income3 $105,948,000 $33,712,000 $20,109,000 $159,769,000 Multiplier 1.00 0.32 0.19 1.51
Industry Output4 $310,306,000 $79,575,000 $50,518,000 $440,399,000 Multiplier 1.00 0.26 0.16 1.42
Source: Implan Group, Inc.
[1] Based on UCSF's average annual capital expenditures. See Appendix for more detail. [2] Reflects full time and part time workers.[3] Includes worker wages and benefits.[4] Reflects business expenditures on goods and services retained in the local economy; inclusive of labor income.
Multiplier Impacts

UCSF Economic and Fiscal Impact Analysis October 2016
Economic & Planning Systems, Inc. 26 P:\151000s\151113UCSF_FisEcon\Report\FINAL_UCSF Fiscal_Econ_Final Report_100316.docx
Table 12 Impacts of Average Annual Construction Expenditures in Bay Area, 2015
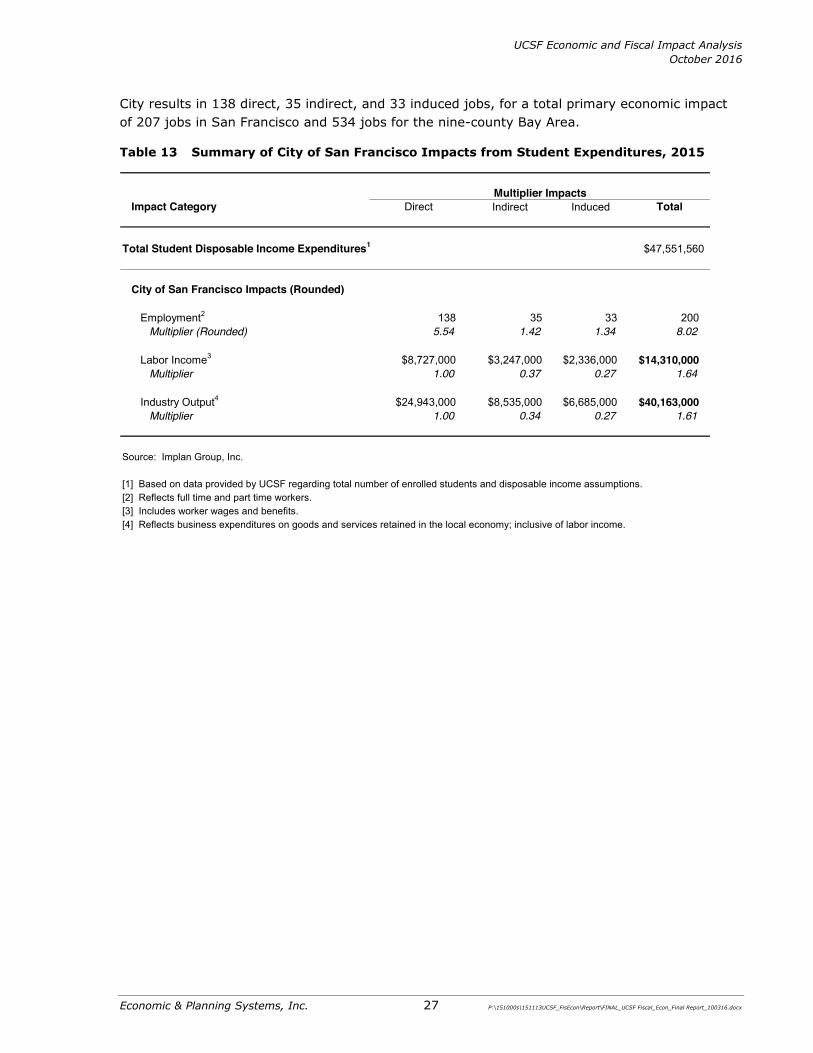
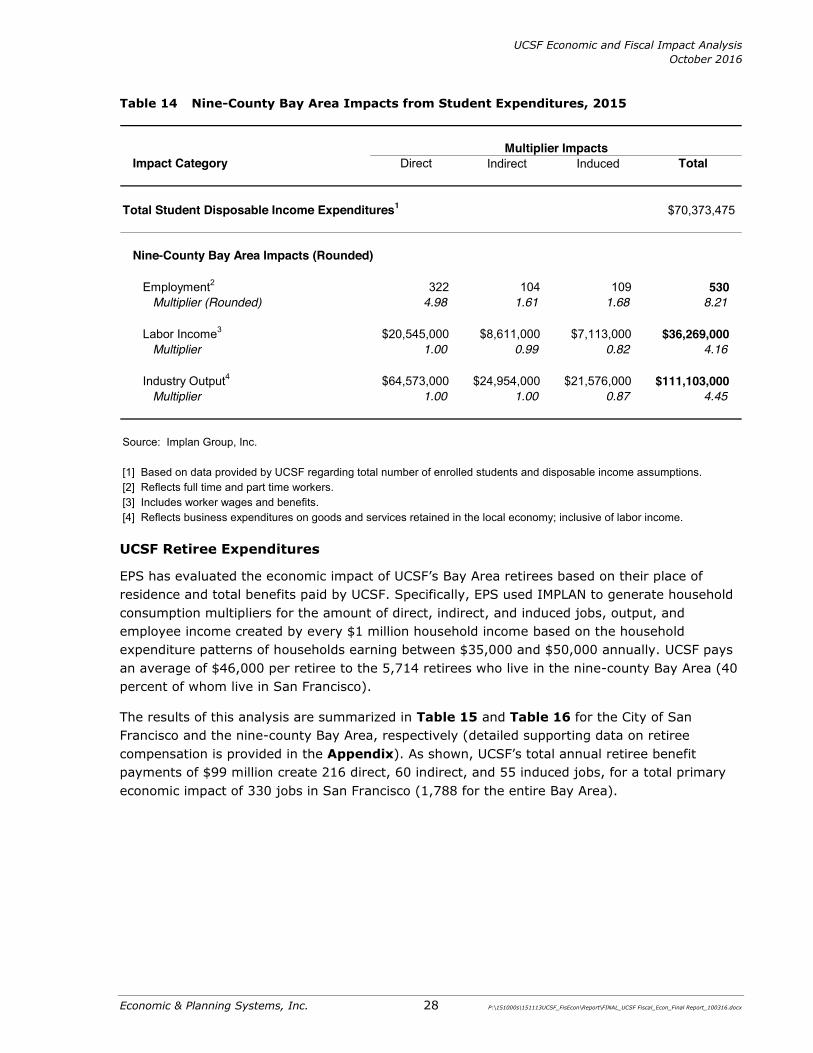
UCSF Student Expenditures
EPS has evaluated the economic impact of UCSF’s students based on annual enrollment levels, place of residence, and estimated average student household income. For students who live in San Francisco, EPS used IMPLAN to generate household consumption multipliers for the amount of direct, indirect, and induced jobs, output, and employee income created by every $1 million in household income for households earning between $15,000 and $25,000 annually. For students who live outside San Francisco (i.e., impacts in San Francisco from UCSF students who live elsewhere), EPS estimated the percentage of retail expenditures likely to be captured locally.12 EPS then calculated the direct, indirect, and induced impact in the retail sector resulting from the estimated UCSF student retail spending in San Francisco.
The results of this analysis are summarized in Table 13 and Table 14 for the City of San Francisco and the nine-county Bay Area, respectively. As shown, the combined effect of San Francisco-based UCSF students, with an estimated total household income of $35 million, and the $12 million in retail spending in San Francisco by those students who reside outside of the
12 Average student household income is estimated to be $21,000, for nine-month programs. Student expenditures on UCSF fees and tuitions are excluded as these impacts are accounted for under UCSF operations. Additionally, EPS assumed that non-San Francisco residents spend about 45 percent of their income on retail and approximately 40 percent of this retail spending is captured in the City.
Impact Category Direct Indirect Induced Total
Activity/ Input 1$310 M
Construction
Nine-County Bay Area Impacts (Rounded)
Employment2 1,416 540 540 2,500Multiplier (Rounded) 4.56 1.74 1.74 8.06
Labor Income3 $101,809,000 $41,568,000 $33,898,000 $177,275,000 Multiplier 1.00 0.39 0.32 1.74
Industry Output4 $310,306,000 $115,601,000 $92,700,000 $518,607,000 Multiplier 1.00 0.37 0.30 1.67
Source: Implan Group, Inc.
[1] Based on UCSF's average annual capital expenditures. See Appendix for more detail. [2] Reflects full time and part time workers.[3] Includes worker wages and benefits.[4] Reflects business expenditures on goods and services retained in the local economy; inclusive of labor income.
Multiplier Impacts
UCSF Economic and Fiscal Impact Analysis October 2016
Economic & Planning Systems, Inc. 27 P:\151000s\151113UCSF_FisEcon\Report\FINAL_UCSF Fiscal_Econ_Final Report_100316.docx
City results in 138 direct, 35 indirect, and 33 induced jobs, for a total primary economic impact of 207 jobs in San Francisco and 534 jobs for the nine-county Bay Area.
Table 13 Summary of City of San Francisco Impacts from Student Expenditures, 2015
Impact Category Direct Indirect Induced Total
Total Student Disposable Income Expenditures1 $47,551,560
City of San Francisco Impacts (Rounded)
Employment2 138 35 33 200Multiplier (Rounded) 5.54 1.42 1.34 8.02
Labor Income3 $8,727,000 $3,247,000 $2,336,000 $14,310,000 Multiplier 1.00 0.37 0.27 1.64
Industry Output4 $24,943,000 $8,535,000 $6,685,000 $40,163,000 Multiplier 1.00 0.34 0.27 1.61
Source: Implan Group, Inc.
[1] Based on data provided by UCSF regarding total number of enrolled students and disposable income assumptions. [2] Reflects full time and part time workers.[3] Includes worker wages and benefits.[4] Reflects business expenditures on goods and services retained in the local economy; inclusive of labor income.
Multiplier Impacts
UCSF Economic and Fiscal Impact Analysis October 2016
Economic & Planning Systems, Inc. 28 P:\151000s\151113UCSF_FisEcon\Report\FINAL_UCSF Fiscal_Econ_Final Report_100316.docx
Table 14 Nine-County Bay Area Impacts from Student Expenditures, 2015
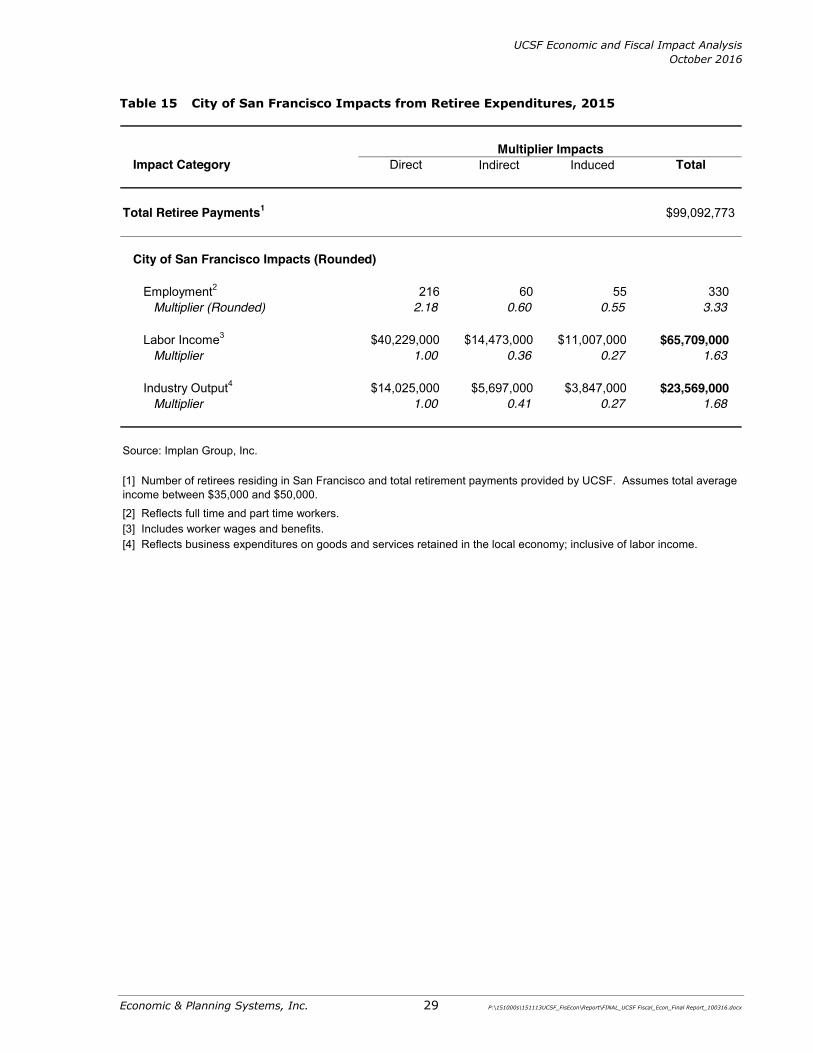
UCSF Retiree Expenditures
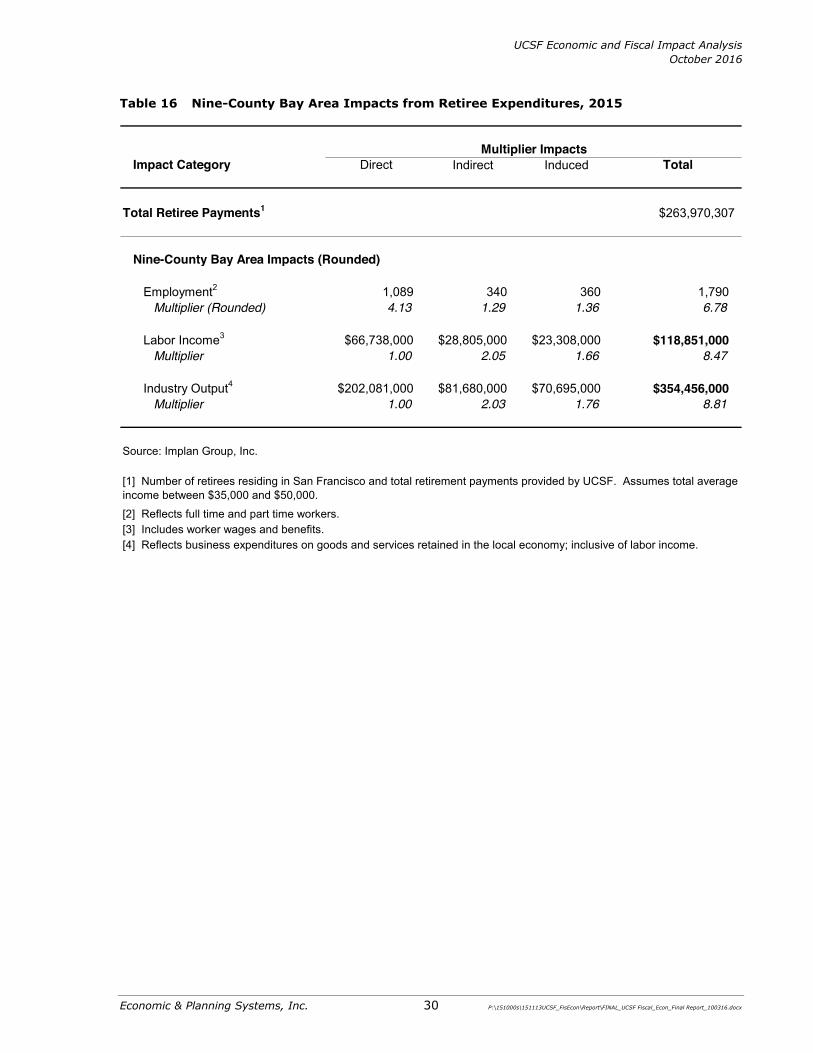
EPS has evaluated the economic impact of UCSF’s Bay Area retirees based on their place of residence and total benefits paid by UCSF. Specifically, EPS used IMPLAN to generate household consumption multipliers for the amount of direct, indirect, and induced jobs, output, and employee income created by every $1 million household income based on the household expenditure patterns of households earning between $35,000 and $50,000 annually. UCSF pays an average of $46,000 per retiree to the 5,714 retirees who live in the nine-county Bay Area (40 percent of whom live in San Francisco).
The results of this analysis are summarized in Table 15 and Table 16 for the City of San Francisco and the nine-county Bay Area, respectively (detailed supporting data on retiree compensation is provided in the Appendix). As shown, UCSF’s total annual retiree benefit payments of $99 million create 216 direct, 60 indirect, and 55 induced jobs, for a total primary economic impact of 330 jobs in San Francisco (1,788 for the entire Bay Area).
Impact Category Direct Indirect Induced Total
Total Student Disposable Income Expenditures1 $70,373,475
Nine-County Bay Area Impacts (Rounded)
Employment2 322 104 109 530Multiplier (Rounded) 4.98 1.61 1.68 8.21
Labor Income3 $20,545,000 $8,611,000 $7,113,000 $36,269,000 Multiplier 1.00 0.99 0.82 4.16
Industry Output4 $64,573,000 $24,954,000 $21,576,000 $111,103,000 Multiplier 1.00 1.00 0.87 4.45
Source: Implan Group, Inc.
[1] Based on data provided by UCSF regarding total number of enrolled students and disposable income assumptions. [2] Reflects full time and part time workers.[3] Includes worker wages and benefits.[4] Reflects business expenditures on goods and services retained in the local economy; inclusive of labor income.
Multiplier Impacts
UCSF Economic and Fiscal Impact Analysis October 2016
Economic & Planning Systems, Inc. 29 P:\151000s\151113UCSF_FisEcon\Report\FINAL_UCSF Fiscal_Econ_Final Report_100316.docx
Table 15 City of San Francisco Impacts from Retiree Expenditures, 2015
Impact Category Direct Indirect Induced Total
Total Retiree Payments1 $99,092,773
City of San Francisco Impacts (Rounded)
Employment2 216 60 55 330Multiplier (Rounded) 2.18 0.60 0.55 3.33
Labor Income3 $40,229,000 $14,473,000 $11,007,000 $65,709,000 Multiplier 1.00 0.36 0.27 1.63
Industry Output4 $14,025,000 $5,697,000 $3,847,000 $23,569,000 Multiplier 1.00 0.41 0.27 1.68
Source: Implan Group, Inc.
[2] Reflects full time and part time workers.[3] Includes worker wages and benefits.[4] Reflects business expenditures on goods and services retained in the local economy; inclusive of labor income.
Multiplier Impacts
[1] Number of retirees residing in San Francisco and total retirement payments provided by UCSF. Assumes total average income between $35,000 and $50,000.
UCSF Economic and Fiscal Impact Analysis October 2016
Economic & Planning Systems, Inc. 30 P:\151000s\151113UCSF_FisEcon\Report\FINAL_UCSF Fiscal_Econ_Final Report_100316.docx
Table 16 Nine-County Bay Area Impacts from Retiree Expenditures, 2015
Impact Category Direct Indirect Induced Total
Total Retiree Payments1 $263,970,307
Nine-County Bay Area Impacts (Rounded)
Employment2 1,089 340 360 1,790Multiplier (Rounded) 4.13 1.29 1.36 6.78
Labor Income3 $66,738,000 $28,805,000 $23,308,000 $118,851,000 Multiplier 1.00 2.05 1.66 8.47
Industry Output4 $202,081,000 $81,680,000 $70,695,000 $354,456,000 Multiplier 1.00 2.03 1.76 8.81
Source: Implan Group, Inc.
[2] Reflects full time and part time workers.[3] Includes worker wages and benefits.[4] Reflects business expenditures on goods and services retained in the local economy; inclusive of labor income.
Multiplier Impacts
[1] Number of retirees residing in San Francisco and total retirement payments provided by UCSF. Assumes total average income between $35,000 and $50,000.
UCSF Economic and Fiscal Impact Analysis October 2016
Economic & Planning Systems, Inc. 31 P:\151000s\151113UCSF_FisEcon\Report\FINAL_UCSF Fiscal_Econ_Final Report_100316.docx
UCSF I nco me D i s t r ibu t io n Impact s
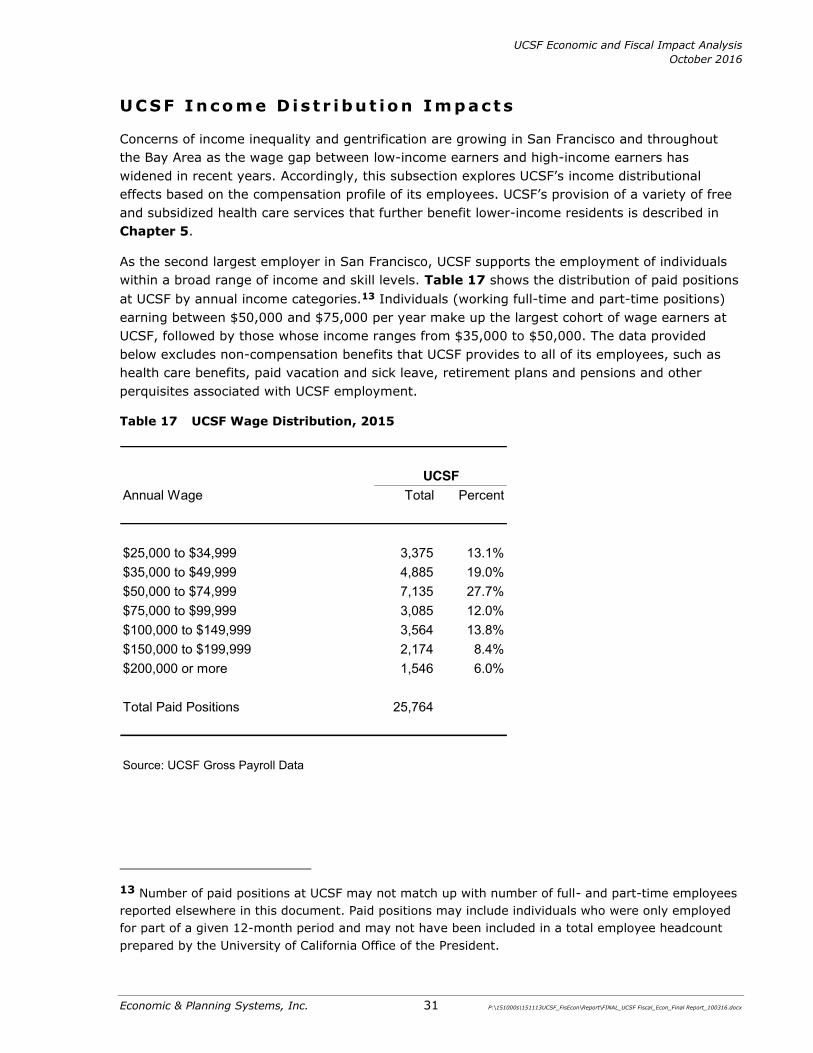
Concerns of income inequality and gentrification are growing in San Francisco and throughout the Bay Area as the wage gap between low-income earners and high-income earners has widened in recent years. Accordingly, this subsection explores UCSF’s income distributional effects based on the compensation profile of its employees. UCSF’s provision of a variety of free and subsidized health care services that further benefit lower-income residents is described in Chapter 5.
As the second largest employer in San Francisco, UCSF supports the employment of individuals within a broad range of income and skill levels. Table 17 shows the distribution of paid positions at UCSF by annual income categories.13 Individuals (working full-time and part-time positions) earning between $50,000 and $75,000 per year make up the largest cohort of wage earners at UCSF, followed by those whose income ranges from $35,000 to $50,000. The data provided below excludes non-compensation benefits that UCSF provides to all of its employees, such as health care benefits, paid vacation and sick leave, retirement plans and pensions and other perquisites associated with UCSF employment.
Table 17 UCSF Wage Distribution, 2015
13 Number of paid positions at UCSF may not match up with number of full- and part-time employees reported elsewhere in this document. Paid positions may include individuals who were only employed for part of a given 12-month period and may not have been included in a total employee headcount prepared by the University of California Office of the President.
Annual Wage Total Percent
$25,000 to $34,999 3,375 13.1%$35,000 to $49,999 4,885 19.0%$50,000 to $74,999 7,135 27.7%$75,000 to $99,999 3,085 12.0%$100,000 to $149,999 3,564 13.8%$150,000 to $199,999 2,174 8.4%$200,000 or more 1,546 6.0%
Total Paid Positions 25,764
Source: UCSF Gross Payroll Data
UCSF

UCSF Economic and Fiscal Impact Analysis October 2016
Economic & Planning Systems, Inc. 32 P:\151000s\151113UCSF_FisEcon\Report\FINAL_UCSF Fiscal_Econ_Final Report_100316.docx
UCSF’s wage and salary distribution can be compared against citywide trends using UCSF payroll data and median wage by occupation data from the State of California’s Employment Development Department (EDD). The EDD publishes county-level data on number of jobs in a given occupation as well as median wage for that occupation. Figure 6 displays the proportion of individuals in three major income tiers at UCSF and within the City as a whole. As shown, the largest cohort, approximately 37 percent of income earners at UCSF fall within the middle range of $50,000 to $100,000. Meanwhile, this same income group represents the smallest cohort of income earners citywide (28 percent). Overall, citywide income distribution is concentrated more at the bottom and the top of the income spectrum. In contrast, UCSF has the highest proportion of employees falling within the middle tier of incomes.
In addition to more egalitarian compensation levels, UCSF employees have a much higher propensity to live in the City rather than commute in from other Bay Area communities. Specifically, approximately 51 percent of UCSF employees live in San Francisco compared to about 35 percent of jobs in the City as a whole held by local residents.14 This would suggest that UCSF provides relatively stable and sustainable jobs with pay levels that are more likely to allow its employees to live in San Francisco relative to the average for the City as a whole.
Figure 6 Income Distribution Comparison, 2015
14 Citywide estimate are based on U.S. Census LED-LEHD OnTheMap data. UCSF results are based on UCSF payroll data.
0%
5%
10%
15%
20%
25%
30%
35%
40%
45%
$25,000-$50,000 $50,000-$100,000 $100,000 or more
Pe
rce
nt
of
Emp
loye
es
Major Income Tiers
UCSF San Francisco

Economic & Planning Systems, Inc. 33 P:\151000s\151113UCSF_FisEcon\Report\FINAL_UCSF Fiscal_Econ_Final Report_100316.docx
5. SECONDARY ECONOMIC IMPACTS
This chapter evaluates UCSF’s secondary economic impacts in both the City of San Francisco and the nine-county Bay Area. Secondary economic impacts, although generally more qualitative, intangible, and complex than the primary economic impacts evaluated in Chapter 4, are nonetheless real and can be significant. This chapter identifies and describes the secondary economic impacts applicable to UCSF.
As a prominent national research institution, UCSF continues to provide substantial contributions to the fields of life sciences and biotechnology. Not only do these contributions improve health and quality of life around the world, they also support innovation, job creation, and economic development in a variety of sectors and locations. Additionally, UCSF contributes back to San Francisco and the Bay Area in ways that private entities typically do not. These community contributions come in the form of uncompensated and charity health care, ongoing educational programs for local residents, and participation in a variety of community programs and initiatives, often in partnership with non-profit organizations and the public sector.
UCSF I nnovat io n and Techno logy L eader sh ip
Throughout its 152-year history, UCSF and its faculty have contributed to major breakthroughs in health sciences research and patient care that have ultimately been adopted for use across the nation and around the world. In addition, these breakthroughs have contributed to the growth of the innovation economy in both San Francisco and the Bay Area, particularly in biotechnology and life sciences sectors. Some of UCSF’s more notable achievements include the following:15
x In the 1950s, John Clements, MD, discovered that lungs produce a secretion called surfactant that is necessary for normal breathing. His invention of an artificial surfactant is credited with halving the mortality rate of newborns in nations where surfactant is widely available.
x In the early 1970s, UCSF investigator Herbert Boyer, PhD, co-created recombinant DNA technology which launched the modern biotechnology industry.
x In the 1970s and 80s, J. Michael Bishop, MD, and Harold Varmus, MD, discovered that some normal genes—when altered or misexpressed—have the capacity to cause cancer. The two shared the 1989 Nobel Prize in Physiology or Medicine for their discovery.
x In 1981, Gail Martin, PhD, co-discovered embryonic stem cells thereby launching a scientific field with a tremendous potential to cure diseases.
x In 1981, Michael Harrison, MD, widely regarded as the “father of fetal surgery,” performed the first successful human fetal surgery and then established the UCSF Fetal Treatment Center. Harrison developed and tested techniques for fetal intervention, performed fetal surgeries for congenital diaphragmatic hernia as well as other fetal anomalies, and initiated the first clinical trials sponsored by the National Institutes of Health for fetal surgery.
15 All achievements cited are from UCSF’s publication Meeting the Challenges of Global Health.
UCSF Economic and Fiscal Impact Analysis October 2016
Economic & Planning Systems, Inc. 34 P:\151000s\151113UCSF_FisEcon\Report\FINAL_UCSF Fiscal_Econ_Final Report_100316.docx
x In 1982, Stanley Prusiner, MD, discovered prions—infectious agents linked to a number of neurodegenerative diseases, including “mad cow” disease in animals and Creutzfeldt-Jakob Disease in humans—which earned him the 1997 Nobel Prize in Physiology or Medicine. The research has informed scientists’ understanding of Alzheimer’s, Parkinson’s and other neurodegenerative diseases.
x In the early 1980s, Jay Levy, MD, was among the first to identify HIV as the cause of AIDS.
x In 1985, Elizabeth Blackburn, PhD, co-discovered the enzyme telomerase and showed how telomeres and telomerase protect chromosomes and play a key role in cell aging. She won the Nobel Prize in 2009 in Physiology or Medicine for her work.
x In 2006, Shinya Yamanaka, MD, PhD, a senior investigator at the UCSF-affiliated Gladstone Institutes and a UCSF anatomy professor, discovered that he could induce adult skin cells in mice to become like embryonic stem cells. He called them induced pluripotent stem cells, or iPS cells. In 2007, Yamanaka announced that he had done the same with human adult skin cells. He won the 2012 Nobel Prize in Physiology and Medicine for his discovery.
As noted earlier, although impressive, the actual economic impact of the accomplishments described above, and many others, are difficult to quantify in economic terms. Nevertheless, a variety of measures are commonly used to assess the scale and effectiveness of a research institution’s Research & Development (R&D) activity and programs. These include the level of R&D spending, including grant awards from the National Institutes of Health, scientific citations, the number of inventions and patents derived from this research, and the monetary value from the licensing of patents by end users. UCSF’s performance in each of these areas is described further below.
Research & Development Expenditures
UCSF continues to rank highly among colleges, universities, and other research institutions in the United States in total R&D spending, particularly in the field of life sciences. As shown in Table 18, UCSF has consistently ranked in the top five in total R&D expenditures nationwide, behind Johns Hopkins University, University of Michigan, University of Washington, and the University of Wisconsin, in total R&D spending.16
16 R&D expenditures are generally distinguished from academic spending. R&D expenditures are identified as such and expended for activities organized to produce research outcomes. These activities are either commissioned by an agency external to the institution or are separately budgeted by an organizational unit within the institution.

UCSF Economic and Fiscal Impact Analysis October 2016
Economic & Planning Systems, Inc. 35 P:\151000s\151113UCSF_FisEcon\Report\FINAL_UCSF Fiscal_Econ_Final Report_100316.docx
Table 18 R&D Expenditures by Top Performing Universities17
Perhaps even more notably, available data suggests that UCSF is one of the most prominent R&D institutions in the Bay Area in terms of total spending (e.g., R&D spending by academic, nonprofit, or private sector entities). Specifically, EPS estimates that UCSF accounts for almost 19 percent of the total R&D spending in San Francisco and approximately 4 percent in the nine-county Bay Area (includes all sectors of the economy), as shown in Table 19. The estimates below do not adequately capture all local or regional R&D spending, as this activity occurs through a variety of mechanisms and formats that are difficult to track. However, UCSF’s relative share, based on available data, further reinforces its prominent contribution to the Bay Area’s innovation economy.
17 This table does not include results from 2015, as that data from the National Science Foundation was not yet available for the complete calendar year.
2010 2011 2012 2013 2014
R&D Expenditures by top 5 Universities (all fields)Johns Hopkins University $2,004,482,000 $2,145,308,000 $2,106,185,000 $2,168,568,000 $2,242,478,000University of Michigan, Ann Arbor $1,184,445,000 $1,279,123,000 $1,322,711,000 $1,375,117,000 $1,349,262,000University of Washington, Seattle $1,022,740,000 $1,148,533,000 $1,109,008,000 $1,192,513,000 $1,176,340,000University of Wisconsin, Madison $1,029,295,000 $1,111,642,000 $1,169,779,000 $1,123,501,000 $1,108,564,000University of California, San Francisco $935,509,000 $995,226,000 $1,032,673,000 $1,042,841,000 $1,084,031,000
All Universities and Colleges $61,253,743,000 $65,276,179,000 $65,729,338,000 $67,014,807,000 $67,154,642,000
Source: National Science Foundation, Economic & Planning Systems, Inc.
YearItem

UCSF Economic and Fiscal Impact Analysis October 2016
Economic & Planning Systems, Inc. 36 P:\151000s\151113UCSF_FisEcon\Report\FINAL_UCSF Fiscal_Econ_Final Report_100316.docx
Table 19 UCSF R&D Spending as a Percentage of Total R&D Across all Sectors (San Francisco and Nine-County Bay Area)
National Institutes of Health Funding Recipients
Another measure of the effectiveness of UCSF’s research programs in the life sciences field is the University’s success in receiving competitive grants from the National Institutes of Health (NIH), the primary government agency responsible for biomedical and health-related research. NIH funding is extremely competitive and is generally awarded to researchers and programs involved in efforts to advance scientific knowledge and to discover findings and applications in the biomedical field. As shown in Table 20, UCSF consistently ranks among the nation’s top five recipients of NIH funding.
Formula Assumption San Francisco Nine-County Bay Area
AssumptionsState of California GDP1 a $2,317,510,720,000State of California Total R&D Expenditures1 b $84,393,086,000Statewide R&D Expenditures as a % of GDP c = b / a 3.6%
Gross Regional Product1 d $130,427,432,000 $674,877,628,000Estimated R&D Expenditures (Excluding Academic) e = c * d $4,749,567,000 $24,575,941,000Academic R&D Expenditures2 f $1,084,031,000 $2,787,621,000Total R&D Expenditures g = e + f $5,833,598,000 $27,363,562,000UCSF R&D as % of Total R&D in Geography h = f / g 18.6% 4.4%
[1] Local, Regional, and Statewide GDP/GRP estimates provided by IMPLAN[2] National Scientific Foundation Data. Nine-County Bay Area includes R&D spending by Stanford University and UC Berkeley
Item
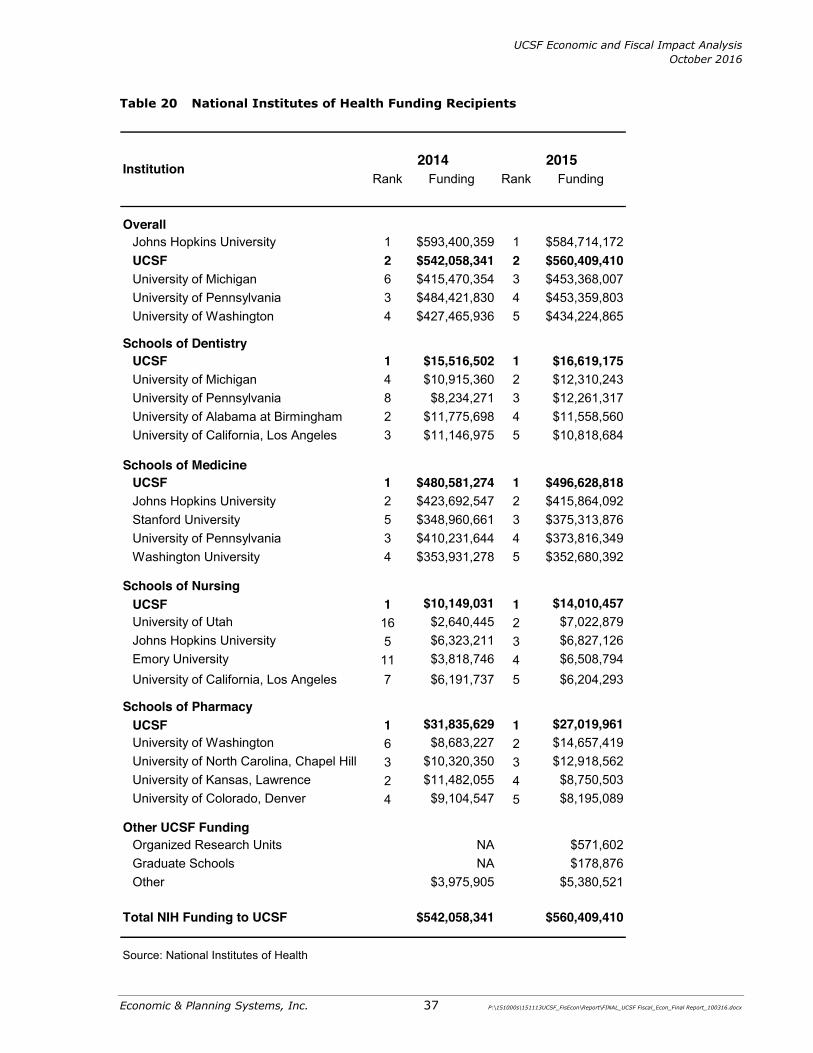
UCSF Economic and Fiscal Impact Analysis October 2016
Economic & Planning Systems, Inc. 37 P:\151000s\151113UCSF_FisEcon\Report\FINAL_UCSF Fiscal_Econ_Final Report_100316.docx
Table 20 National Institutes of Health Funding Recipients
Rank Funding Rank Funding
OverallJohns Hopkins University 1 $593,400,359 1 $584,714,172 UCSF 2 $542,058,341 2 $560,409,410 University of Michigan 6 $415,470,354 3 $453,368,007 University of Pennsylvania 3 $484,421,830 4 $453,359,803 University of Washington 4 $427,465,936 5 $434,224,865
Schools of DentistryUCSF 1 $15,516,502 1 $16,619,175 University of Michigan 4 $10,915,360 2 $12,310,243 University of Pennsylvania 8 $8,234,271 3 $12,261,317 University of Alabama at Birmingham 2 $11,775,698 4 $11,558,560 University of California, Los Angeles 3 $11,146,975 5 $10,818,684
Schools of MedicineUCSF 1 $480,581,274 1 $496,628,818 Johns Hopkins University 2 $423,692,547 2 $415,864,092 Stanford University 5 $348,960,661 3 $375,313,876 University of Pennsylvania 3 $410,231,644 4 $373,816,349 Washington University 4 $353,931,278 5 $352,680,392
Schools of NursingUCSF 1 $10,149,031 1 $14,010,457 University of Utah 16 $2,640,445 2 $7,022,879 Johns Hopkins University 5 $6,323,211 3 $6,827,126 Emory University 11 $3,818,746 4 $6,508,794 University of California, Los Angeles 7 $6,191,737 5 $6,204,293
Schools of PharmacyUCSF 1 $31,835,629 1 $27,019,961 University of Washington 6 $8,683,227 2 $14,657,419 University of North Carolina, Chapel Hill 3 $10,320,350 3 $12,918,562 University of Kansas, Lawrence 2 $11,482,055 4 $8,750,503 University of Colorado, Denver 4 $9,104,547 5 $8,195,089
Other UCSF FundingOrganized Research Units NA $571,602 Graduate Schools NA $178,876 Other $3,975,905 $5,380,521
Total NIH Funding to UCSF $542,058,341 $560,409,410
Source: National Institutes of Health
20152014Institution

UCSF Economic and Fiscal Impact Analysis October 2016
Economic & Planning Systems, Inc. 38 P:\151000s\151113UCSF_FisEcon\Report\FINAL_UCSF Fiscal_Econ_Final Report_100316.docx
Scientific Citations
Researchers often seek to publish the results of their work in the world’s peer-reviewed scientific journals, and this article-level data is often used here to assess an institution’s research output. Scientific citations are often considered the first phase of the commercialization pipeline since it is a good indicator of the relevance of a research effort, as judged by colleagues in the field. The world’s leading biomedical universities measured by papers and citations are listed below in Table 21.
Table 21 Biomedical and Health Sciences Citations by Top Universities
Institution Number of Citations
Harvard University 22,427University of Toronto 12,520Johns Hopkins 11,404University of Michigan 9,380University of California, San Francisco 9,133University of Pittsburgh 8,694University of Pennsylvania 8,573University of California, Los Angeles 4,258University of Washington, Seattle 7,768Univesity of Texas Health Science Center, Houston 7,600
Source: CWTS Leiden Ranking 2015

UCSF Economic and Fiscal Impact Analysis October 2016
Economic & Planning Systems, Inc. 39 P:\151000s\151113UCSF_FisEcon\Report\FINAL_UCSF Fiscal_Econ_Final Report_100316.docx
UCSF Patents, Licenses, and Royalties
Inventions and patents represent another indication of the level of innovation by a particular institution in a given field. A patent for an invention is the grant of a property right to the inventor, issued by the U.S. Patent and Trademark Office (inventions can have several patents associated with them, each conferring a proprietary right to a useful application). Meanwhile, licensing agreements and royalties are contracts and fee income that indicate the level of third-party interest in a portfolio of patents and inventions. Figure 7 illustrates how inventions, patents, and licensing can play a critical role in converting UCSF’s research into products and services in the commercial marketplace.
Figure 7 The Technology Licensing Economic Value Pipeline*
* Adapted from the August 2016 Bay Area Council Economic Institute report, “Entrepreneurs, Startups, and Innovation at the University of California,” p. 5.
Inventions are created at UCSF.
Inventions are patented.
Patents are licensed for use in new company formation.
New companies generate income by commercializing products created from
licensed technology.
UCSF shares in income generated through patent royalty and fee
income.

UCSF Economic and Fiscal Impact Analysis October 2016
Economic & Planning Systems, Inc. 40 P:\151000s\151113UCSF_FisEcon\Report\FINAL_UCSF Fiscal_Econ_Final Report_100316.docx
Table 22 compares patent and licensing data of UCSF to the 10-campus University of California (UC) system. UCSF accounts for approximately 15 percent of total active inventions, 17 percent of the total active patents, and 20 percent of the royalty income within the UC system.
Table 22 UCSF Patents, Licenses and Royalties
Item UCSF
InventionsInventions Disclosed 181 1,769 10%Total Active Inventions 1,763 11,963 15%
PatentsTotal Patents Issued 2014 141 1,175 12%Total Active Patents 1,490 8,799 17%
LicensingOptions Issued 2014 23 198 12%Total Active Options 11 148 7%Utility Licenses 42 Total Active Utility Options 386 1,702 23%
Royalty & Fee Income $23,385,000 $118,243,000 20%
Source: UCOP Technology Commercialization Report
UC System UCSF as % of UC

UCSF Economic and Fiscal Impact Analysis October 2016
Economic & Planning Systems, Inc. 41 P:\151000s\151113UCSF_FisEcon\Report\FINAL_UCSF Fiscal_Econ_Final Report_100316.docx
UCSF F i r m Cr ea t io n and Wo rk for ce Deve lopm ent
As a public university, research institution, and medical center, UCSF is responsible for recruiting, training, and retaining professionals and academics alike. Many UCSF faculty, graduates and former employees go on to make further contributions to their respective fields as employees, entrepreneurs, and private practice physicians. In addition, the UCSF R&D activity documented above continues to attract and support related private sector investment in the biotech and life sciences fields, particularly in San Francisco’s Mission Bay neighborhood.
The following five inter-related categories of UCSF economic contributions are discussed below: (1) UCSF firm spin-offs and start-ups, (2) UCSF support of the San Francisco “innovation ecosystem” (3) private employment by UCSF faculty, (4) employment of UCSF alumni, and (5) workforce development.
UCSF “Spin-Off” and Firm Creation
Reporting of individual linkages of specific life sciences firms to UCSF employees, graduates, patents, and incubators is common in trade and financial journals. However, a comprehensive analysis of the number of firms that have been created by UCSF faculty is complicated by the difficulty in tracking all firms that may have a relationship to UCSF. The genesis of a new firm is a complex and multi-dimensional process involving a variety of factors and causes. Start-ups and spin-offs flourish or fail and continuously change via corporate merger, acquisition, division, and restructuring. In addition, a former UCSF faculty member who leaves his or her post and later plays a major role in an entrepreneurial venture is not required to report this activity back to UCSF, unless proprietary UCSF technology is being used.
A recent study by the Bay Area Council Economic Institute indicates that UCSF has spawned more than 185 life sciences companies between 1968 and mid-2015.18 Of these, approximately 98 remain active, with about 83 percent in life sciences fields. Several of these companies have produced further offshoots, creating later generations of descendants of UCSF start-ups. A selective family tree of UCSF’s biotech descendants is shown in Table 23.
18 See ”Entrepreneurs, Startups, and Innovation at the University of California” by the Bay Area Council Economic Institute, August, 2016.
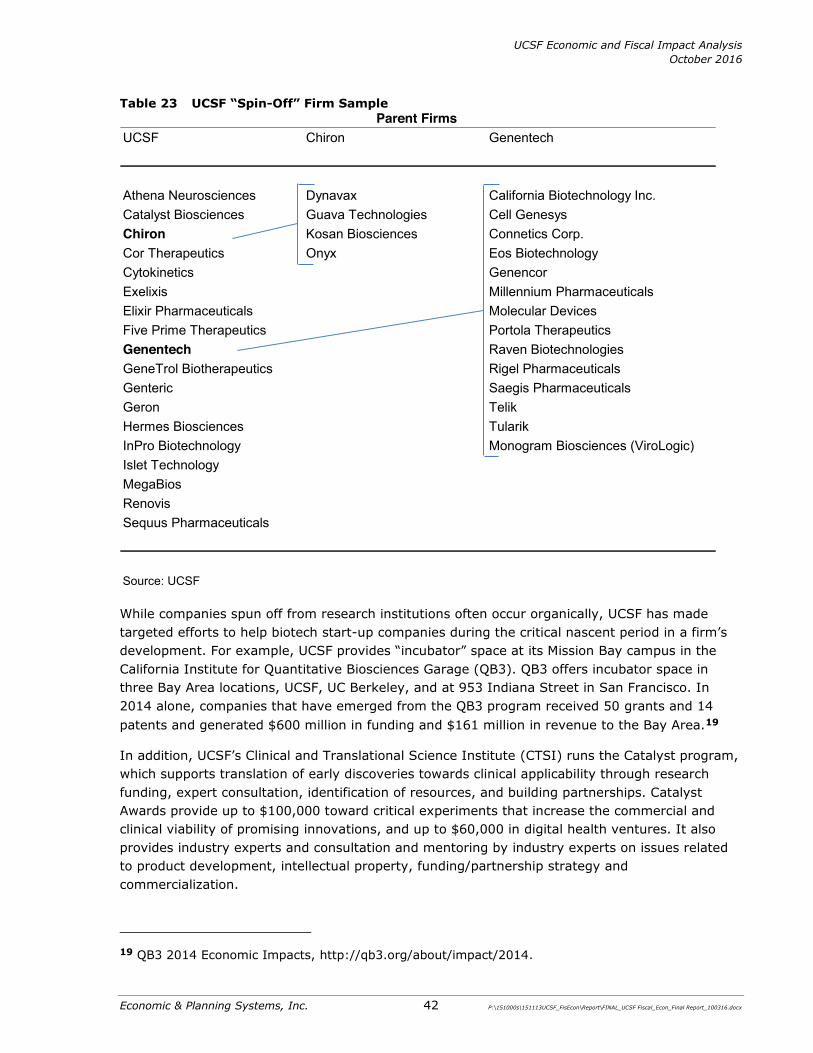
UCSF Economic and Fiscal Impact Analysis October 2016
Economic & Planning Systems, Inc. 42 P:\151000s\151113UCSF_FisEcon\Report\FINAL_UCSF Fiscal_Econ_Final Report_100316.docx
Table 23 UCSF “Spin-Off” Firm Sample
While companies spun off from research institutions often occur organically, UCSF has made targeted efforts to help biotech start-up companies during the critical nascent period in a firm’s development. For example, UCSF provides “incubator” space at its Mission Bay campus in the California Institute for Quantitative Biosciences Garage (QB3). QB3 offers incubator space in three Bay Area locations, UCSF, UC Berkeley, and at 953 Indiana Street in San Francisco. In 2014 alone, companies that have emerged from the QB3 program received 50 grants and 14 patents and generated $600 million in funding and $161 million in revenue to the Bay Area.19
In addition, UCSF’s Clinical and Translational Science Institute (CTSI) runs the Catalyst program, which supports translation of early discoveries towards clinical applicability through research funding, expert consultation, identification of resources, and building partnerships. Catalyst Awards provide up to $100,000 toward critical experiments that increase the commercial and clinical viability of promising innovations, and up to $60,000 in digital health ventures. It also provides industry experts and consultation and mentoring by industry experts on issues related to product development, intellectual property, funding/partnership strategy and commercialization.
19 QB3 2014 Economic Impacts, http://qb3.org/about/impact/2014.
UCSF Chiron Genentech
Athena Neurosciences Dynavax California Biotechnology Inc.Catalyst Biosciences Guava Technologies Cell GenesysChiron Kosan Biosciences Connetics Corp.Cor Therapeutics Onyx Eos BiotechnologyCytokinetics Genencor Exelixis Millennium Pharmaceuticals Elixir Pharmaceuticals Molecular DevicesFive Prime Therapeutics Portola TherapeuticsGenentech Raven Biotechnologies GeneTrol Biotherapeutics Rigel Pharmaceuticals Genteric Saegis Pharmaceuticals Geron TelikHermes Biosciences TularikInPro Biotechnology Monogram Biosciences (ViroLogic)Islet Technology MegaBiosRenovis Sequus Pharmaceuticals
Source: UCSF
Parent Firms

UCSF Economic and Fiscal Impact Analysis October 2016
Economic & Planning Systems, Inc. 43 P:\151000s\151113UCSF_FisEcon\Report\FINAL_UCSF Fiscal_Econ_Final Report_100316.docx
Other Contributions to the San Francisco Innovation Ecosystem
UCSF’s economic impact is manifested not only by the number of start-ups that are directly founded by University faculty or from licensed technology, but also by its contribution to an innovation ecosystem that attracts private sector investment. The EPS 2010 UCSF Economic and Fiscal Impact Report documented the important role that UCSF, and the Mission Bay campus in particular, has played in the growth of San Francisco’s biotechnology sector. Among other things, the 2010 report noted how San Francisco’s share of the Bay Area’s biotechnology space (and by extension employment) has steadily risen with the build out of the UCSF Mission Bay campus.
Since publication of the 2010 EPS report, the number of life sciences-related jobs, firms, payroll, and building space in San Francisco has continued to grow, as illustrated in Table 24. By way of example, according to the Employment Development Department (EDD), the City gained more than 1,100 jobs in “Research and Development in Biotechnology,” one of many fields in the life sciences sector, over the last five years, an increase of more than three fold. The number of firms and average salary in this sector also increase substantially. Meanwhile, the Mission Bay neighborhood added about 770,000 square feet of privately developed office and R&D space during this same period, an increase of about 9 percent.
Table 24 Market Indicators for San Francisco Life Sciences Sector
Item 2010 2015 1 % ∆
Biotech Jobs2 333 1,448 334.8%
Biotech Firms2 23 89 287.0%
Average Salary2 $9,744 $13,464 38.2%
Mission Bay Office / R&D Sq. Ft.3 8,681,321 9,450,760 8.9%
Source: California Employment Development Department (EDD); CoStar; EPS
[2] Reflects average monthly values for the "Research and Development in Biotechnology" category (NAICS Code 541711).
[1] Employment data based on the latest published data from the third quarter of 2015; Space data based on CoStar data, September 2016.
[3] UCSF building square footage is not included in the table.
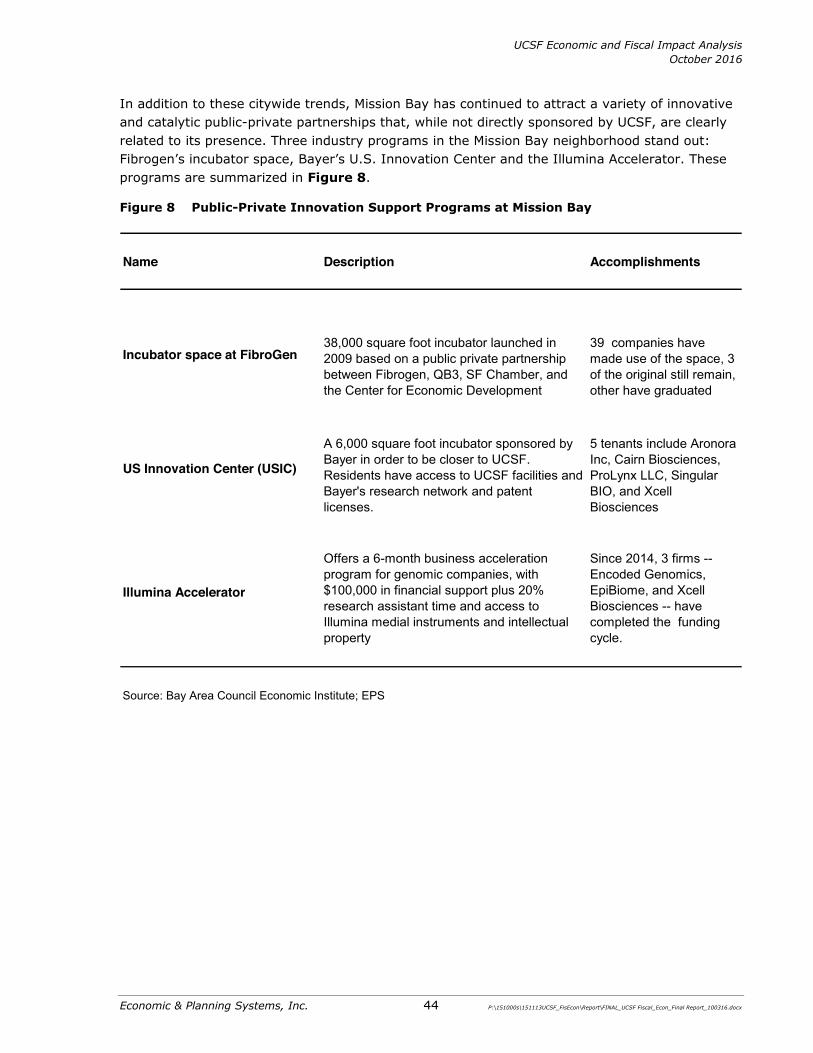
UCSF Economic and Fiscal Impact Analysis October 2016
Economic & Planning Systems, Inc. 44 P:\151000s\151113UCSF_FisEcon\Report\FINAL_UCSF Fiscal_Econ_Final Report_100316.docx
In addition to these citywide trends, Mission Bay has continued to attract a variety of innovative and catalytic public-private partnerships that, while not directly sponsored by UCSF, are clearly related to its presence. Three industry programs in the Mission Bay neighborhood stand out: Fibrogen’s incubator space, Bayer’s U.S. Innovation Center and the Illumina Accelerator. These programs are summarized in Figure 8.
Figure 8 Public-Private Innovation Support Programs at Mission Bay
Name Description Accomplishments
Incubator space at FibroGen38,000 square foot incubator launched in 2009 based on a public private partnership between Fibrogen, QB3, SF Chamber, and the Center for Economic Development
39 companies have made use of the space, 3 of the original still remain, other have graduated
US Innovation Center (USIC)
A 6,000 square foot incubator sponsored by Bayer in order to be closer to UCSF. Residents have access to UCSF facilities and Bayer's research network and patent licenses.
5 tenants include Aronora Inc, Cairn Biosciences, ProLynx LLC, Singular BIO, and Xcell Biosciences
Illumina Accelerator
Offers a 6-month business acceleration program for genomic companies, with $100,000 in financial support plus 20% research assistant time and access to Illumina medial instruments and intellectual property
Since 2014, 3 firms -- Encoded Genomics, EpiBiome, and Xcell Biosciences -- have completed the funding cycle.
Source: Bay Area Council Economic Institute; EPS

UCSF Economic and Fiscal Impact Analysis October 2016
Economic & Planning Systems, Inc. 45 P:\151000s\151113UCSF_FisEcon\Report\FINAL_UCSF Fiscal_Econ_Final Report_100316.docx
Local and Regional Contributions by UCSF Alumni Location
Graduates of the UCSF professional schools and graduate programs serve as an important input and resource to the life sciences and related sectors of the local and regional economies. Data from UCSF Development and Alumni Relations suggests that UCSF alumni exhibit a high propensity to remain in California, the Bay Area and San Francisco. As shown in Table 25, San Francisco is home to approximately 8,500 UCSF graduates, more than 40 percent of total number of UCSF graduates residing in the Bay Area.
Table 25 Location of UCSF Alumni in the Bay Area
Additional Workforce Training
In addition to training UCSF graduates for future employment in the Bay Area and beyond, UCSF offers several programs designed to help prepare community residents for work and provide job opportunities. The most prominent of these are described below.
x Excellence through Community Engagement & Learning (EXCEL) - The UCSF EXCEL program is a work-based learning program that uses both classroom and paid on-the-job training to prepare participants for career path jobs in the health care sector. EXCEL is a clerical/administrative training program, which aims to develop the potential workforce in UCSF’s surrounding communities and provide San Francisco residents with access to UCSF employment opportunities. Since 2010, the program has had 162 graduates.
x Women in the workforce - The UCSF Women's Health Internship Program has matched more than 300 interns to women's health professionals and projects throughout the Bay Area since 1996. Through the program, interns gain hands-on work experience in women's health.
x People with disabilities in the workforce - Toolworks, a Bay Area nonprofit dedicated to improving the lives of people with disabilities, began a partnership with UCSF Medical Center in 2009. UCSF Medical Center departments support Toolworks’ interns with on-the-job training.
x Local construction hiring - UCSF maintains a voluntary local construction-hiring goal that aims to promote employment opportunities for qualified San Francisco resident trade workers on UCSF construction projects. In 2011, the first year of the program, the goal was
County Count Share
Alameda 3,203 16%Contra Costa 3,320 16%Marin 1,780 9%San Francisco 8,500 41%San Mateo 2,394 12%Santa Clara 1,416 7%
Total 20,613
Source: UCSF Alumni Relations

UCSF Economic and Fiscal Impact Analysis October 2016
Economic & Planning Systems, Inc. 46 P:\151000s\151113UCSF_FisEcon\Report\FINAL_UCSF Fiscal_Econ_Final Report_100316.docx
20 percent, to be followed either by a 5 percent increase each subsequent year or to remain inline with the goals outlined by the City of San Francisco's established ordinance. Building projects that have been a part of this program are:
— Clinical Sciences Building is on the Parnassus Heights campus and is currently being seismically retrofitted with a target completion date of 2019. This project began in the fall of 2014 with a target local hiring goal of 30 percent of the construction hours performed by San Francisco residents.
— Mission Hall Global Health and Clinical Sciences Building, on UCSF’s Mission Bay campus, is home to global health researchers, scientists, clinicians and students. In 2013, San Francisco residents performed 30,005 of the total 121,860 construction hours, a 25 percent local hire percentage. In 2014, San Francisco residents performed 30,250 of the total 216,173 construction hours, bringing the local hire rate over the life of the project to 18 percent when construction was completed in September 2014.
— UCSF Medical Center at Mission Bay is the University’s new state-of-the-art hospital complex, with three hospitals, outpatient clinic building and an energy center. From March 2011 through December 2014, UCSF met its voluntary local hire goal of 20 percent, as San Francisco residents performed 590,227 of the project’s total 2,976,136 construction hours.
— Mission Bay Hospital Parking Garage at 1835 Owens Street provides above ground parking to patients and visitors of UCSF Medical Center at Mission Bay. For this project, completed in the fall of 2012, UCSF exceeded its voluntary local hire goal of 20 percent, as San Francisco residents performed a total of 12,786 of the total 48,805 construction hours, a local hire rate of 27 percent.
UCSF Uncom pensa t ed and Char i t y Car e
As a major medical provider in the San Francisco Bay Area, UCSF offers health care access to many individuals and families who may not necessarily have the means to pay for the full price of care, or whose medical plans may not cover the full cost of various treatments and health care services. UCSF provides this access through two primary mechanisms, uncompensated care and charity care.
Uncompensated care results from the shortfall between payments received that are less than the cost of caring for patients covered by government-sponsored health insurance. UCSF carries this burden and considers it a community benefit, which it defines as “a planned, managed, organized, and measured approach to meeting documentable community needs intended to improve access to care, health status and quality of life.”20
While similar to uncompensated care, charity care is an upfront program in which UCSF discounts the price it charges for health care services to families and individuals who meet eligibility requirements. In order to be eligible for charity care, a patient must first complete an application and provide supporting income documentation. As shown in Table 26, through operations at UCSF Medical Centers, UCSF provided uncompensated care valued at $86 million in 2013, $114 million in 2014, and $86 million in 2015. In addition, charity care costs reported at UCSF Medical 20 UCSF Health
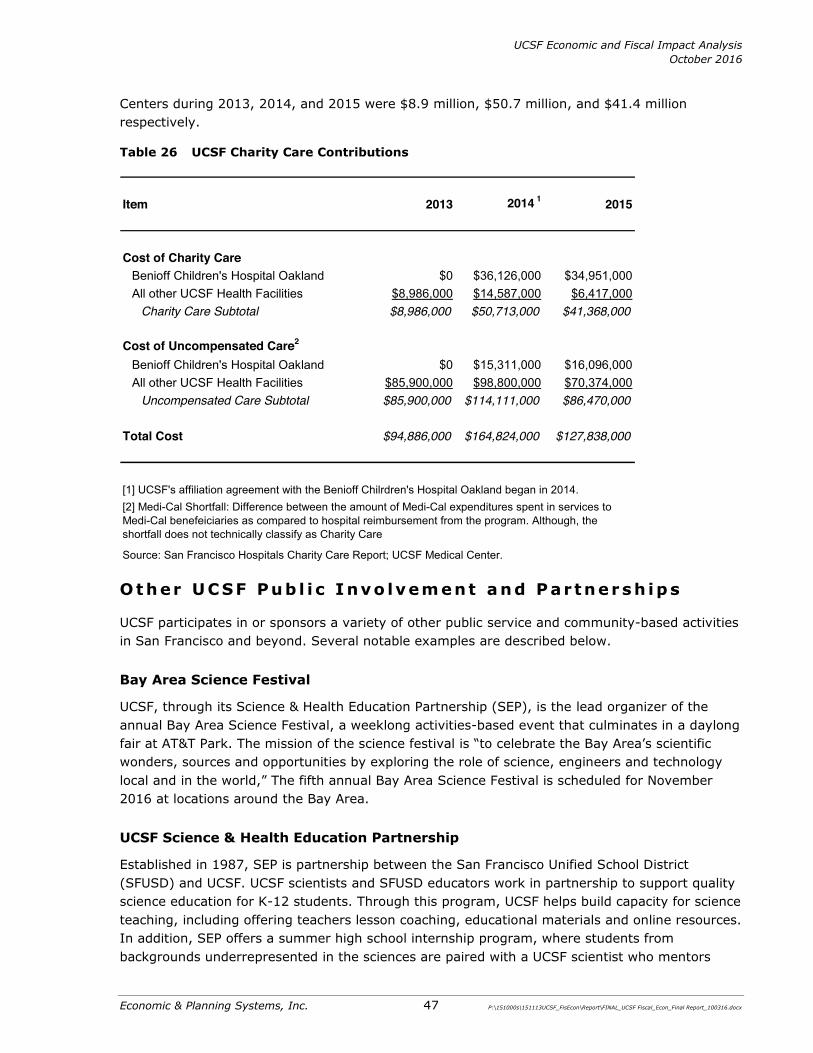
UCSF Economic and Fiscal Impact Analysis October 2016
Economic & Planning Systems, Inc. 47 P:\151000s\151113UCSF_FisEcon\Report\FINAL_UCSF Fiscal_Econ_Final Report_100316.docx
Centers during 2013, 2014, and 2015 were $8.9 million, $50.7 million, and $41.4 million respectively.
Table 26 UCSF Charity Care Contributions
Ot her UCSF Pub l i c I nvo lvement and Par tner sh ips
UCSF participates in or sponsors a variety of other public service and community-based activities in San Francisco and beyond. Several notable examples are described below.
Bay Area Science Festival
UCSF, through its Science & Health Education Partnership (SEP), is the lead organizer of the annual Bay Area Science Festival, a weeklong activities-based event that culminates in a daylong fair at AT&T Park. The mission of the science festival is “to celebrate the Bay Area’s scientific wonders, sources and opportunities by exploring the role of science, engineers and technology local and in the world,” The fifth annual Bay Area Science Festival is scheduled for November 2016 at locations around the Bay Area.
UCSF Science & Health Education Partnership
Established in 1987, SEP is partnership between the San Francisco Unified School District (SFUSD) and UCSF. UCSF scientists and SFUSD educators work in partnership to support quality science education for K-12 students. Through this program, UCSF helps build capacity for science teaching, including offering teachers lesson coaching, educational materials and online resources. In addition, SEP offers a summer high school internship program, where students from backgrounds underrepresented in the sciences are paired with a UCSF scientist who mentors
Item 2013 2014 1 2015
Cost of Charity CareBenioff Children's Hospital Oakland $0 $36,126,000 $34,951,000All other UCSF Health Facilities $8,986,000 $14,587,000 $6,417,000
Charity Care Subtotal $8,986,000 $50,713,000 $41,368,000
Cost of Uncompensated Care2
Benioff Children's Hospital Oakland $0 $15,311,000 $16,096,000All other UCSF Health Facilities $85,900,000 $98,800,000 $70,374,000
Uncompensated Care Subtotal $85,900,000 $114,111,000 $86,470,000
Total Cost $94,886,000 $164,824,000 $127,838,000
Source: San Francisco Hospitals Charity Care Report; UCSF Medical Center.
[1] UCSF's affiliation agreement with the Benioff Chilrdren's Hospital Oakland began in 2014.[2] Medi-Cal Shortfall: Difference between the amount of Medi-Cal expenditures spent in services to Medi-Cal benefeiciaries as compared to hospital reimbursement from the program. Although, the shortfall does not technically classify as Charity Care

UCSF Economic and Fiscal Impact Analysis October 2016
Economic & Planning Systems, Inc. 48 P:\151000s\151113UCSF_FisEcon\Report\FINAL_UCSF Fiscal_Econ_Final Report_100316.docx
them to conduct biomedical research. UCSF’s SEP program involves more than 250 scientist volunteers from the University who work with teachers and students in 90 percent of SFUSD schools.21
Center for Community Engagement
UCSF’s Clinical and Translational Science Institute (CTSI) administers the Center for Community Engagement (CCE), which coordinates the many existing partnerships between UCSF-affiliated individuals and groups and community-based and public organizations.
A council consisting of 12 UCSF and 12 community representatives ensures the CCE achieves its mission to build collaborative relationships between UCSF and the community, to promote civic engagement, to foster community health and wellbeing, and to enhance the environment for education, research, employment and patient care at UCSF.
Each year, the CCE joins many other government and community organizations in developing a Community Health Needs Assessment (CHNA), which takes a comprehensive look at the health of San Francisco residents by presenting data on demographics, socioeconomic characteristics, quality of life, behavioral factors, and built environment, morbidity and mortality, and other determinants of health status.
UCSF’s community partners in these endeavors include:
x Advancing Justice of the Asian Law Caucus x African American Art and Cultural Center x Asociación Mayab x CARECEN x Filipino American Development Foundation x Instituto Familiar de la Raza x Larkin Street Youth x LGBT Center x Native American Health Center x On Lok 30th Street Senior Center x Swords to Plowshares x Transitions Clinic
Other Community Programs
UCSF offers many other programs to help members of its community manage their health. It offers and supports care and other services for special populations, such as people with specific diseases such as cancer, diabetes, and HIV/AIDS; camps and other programs for children; support groups and efforts to assist with people’s psychosocial health; work on issues of race and ethnicity, alcohol and tobacco, violence, nutrition, and exercise, all of which have hands-on and policy components.
21 UCSF Science and Health Education Partnership

UCSF Economic and Fiscal Impact Analysis October 2016
Economic & Planning Systems, Inc. 49 P:\151000s\151113UCSF_FisEcon\Report\FINAL_UCSF Fiscal_Econ_Final Report_100316.docx
Some other specific examples of UCSF’s work in the community include:
x Cancer screenings. The UCSF Department of Dermatology hosts free skin cancer screenings each year at locations around San Francisco. As part of national Oral, Head and Neck Cancer Awareness Week, UCSF Medical Center participates in an annual free head and neck cancer screening. A partnership between UCSF and the health technology company Counsyl provides free genetic cancer screenings to every Bay Area woman who wants these services as part of an effort to combat the rising number of breast cancer diagnoses.
x Skilled Nursing Home Support Program. UCSF Medical Center directs and pays for temporary skilled nursing, assisted living, home health, dialysis, attendant care, and inpatient residential hospice services for patients without financial resources, to help patients with their continued recovery upon discharge. UCSF also supports indigent patients and their families’ needs through meal vouchers, taxi vouchers, transportation and lodging assistance.
x Clinic by the Bay. UCSF Medical Center provides free ancillary services to this private nonprofit clinic run by Volunteers in Medicine, which is dedicated to building a network of sustainable free primary health care clinics for the uninsured.
x The Children’s Health Hut (CHH). This volunteer organization is comprised of UCSF’s dental, medical, nursing, pharmacy and physical therapy students who are committed to improving the health of children. CHH brings interactive health screenings and educational programs to convenient neighborhood locations.
x Give Kids a Smile Day. Faculty and students from the UCSF School of Dentistry serve the San Francisco community with prophylaxis, polish, fluoride varnish, and sealants on children’s teeth to prevent future cavities.
x UCSF Child Health Equity Collective (CHEC). CHEC addresses child health inequities through research, policy, education, clinical programs, and community engagement.
x UCSF Asian Health Center. Located at Mount Zion, this center provides free educational programs regarding cardiovascular disease and stroke, the leading causes of death among Asian-American men and women, as well as a bilingual (English/Cantonese) health education program.

Economic & Planning Systems, Inc. 50 P:\151000s\151113UCSF_FisEcon\Report\FINAL_UCSF Fiscal_Econ_Final Report_100316.docx
6. FISCAL IMPACT METHODOLOGY AND BUDGET OVERVIEW
This chapter provides an overview of the methodology and data sources used to evaluate UCSF’s fiscal impact. This includes an overview of the City of San Francisco’s General Fund budget and description of our general methodology.
Overv iew o f F i s ca l Impact A na lys i s
A fiscal impact analysis compares the tax revenues received by a city or county from a defined activity or land use with the cost of providing public services to this activity or land use. Since local governments are required to balance their General Fund budgets over time, the combined fiscal impact of all land uses and population groups in a city may be assumed to be neutral (i.e., the revenues generated equal the cost to serve the population). In reality, however, most population and land use types have attributes that push this balance to either the positive or negative side of the ledger. For example, churches and nonprofits are exempt from paying property tax (as a policy matter because of their provision of desirable public services) but can nevertheless create public service costs that may not be offset by the other tax revenues they generate.22 As another example, tourists, who typically make high, taxable expenditures (on hotel rooms, souvenirs, restaurant meals, etc.), generally provide a net fiscal benefit to cities since they do not place an equivalent demand on local public services.
As part of the University of California system, UCSF is exempt from paying a number of significant local government taxes, including property taxes, assessments, and other special taxes. UCSF’s activities and associated population (e.g., employees, students, and visitors) do generate a significant level of other local taxes such as sales tax, hotel tax and parking tax.23 This fiscal impact analysis aims to determine whether these local revenues attributed to UCSF are sufficient to cover its demands on the City and County’s public services.
Focus on San Francisco’s General Fund Budget
The fiscal impact analysis examines cost and revenue impacts reasonably attributed to UCSF on San Francisco’s General Fund budget. The General Fund is the primary operating budget used by the City to fund basic services and programs. While San Francisco’s total budget was $8.58 billion in fiscal year 2014-15, the General Fund was only $3.9 billion. Most of the other fund categories have dedicated revenue sources and operate on a cost recovery basis. This analysis focuses on fiscal year 2014-2015 because it is the most recent year for which complete data on UCSF’s population and operations is available.
22 Another example is longtime homeowners who pay low property taxes due to Proposition 13, relative to their property’s value if sold on the open market.
23 While UCSF is exempt from paying parking tax, their students, employees, and visitors are subject to parking tax when utilizing non-UCSF parking facilities.
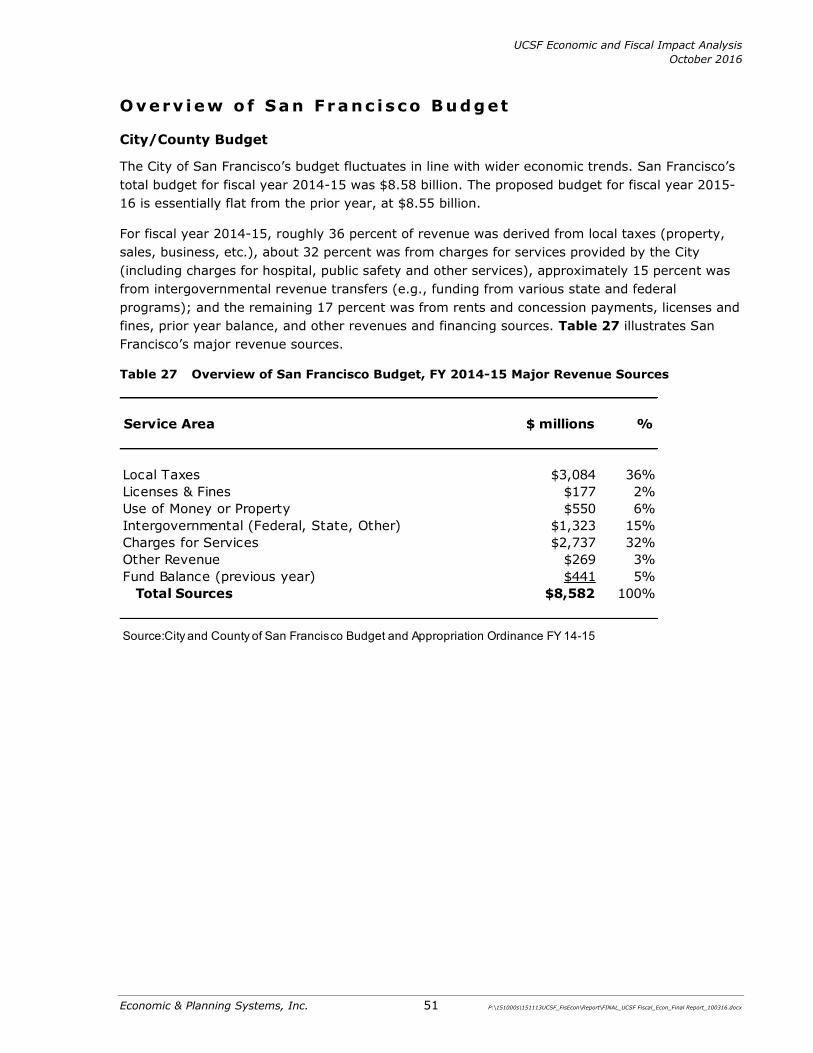
UCSF Economic and Fiscal Impact Analysis October 2016
Economic & Planning Systems, Inc. 51 P:\151000s\151113UCSF_FisEcon\Report\FINAL_UCSF Fiscal_Econ_Final Report_100316.docx
Overv iew o f San Fr anc i sco Budget
City/County Budget
The City of San Francisco’s budget fluctuates in line with wider economic trends. San Francisco’s total budget for fiscal year 2014-15 was $8.58 billion. The proposed budget for fiscal year 2015-16 is essentially flat from the prior year, at $8.55 billion.
For fiscal year 2014-15, roughly 36 percent of revenue was derived from local taxes (property, sales, business, etc.), about 32 percent was from charges for services provided by the City (including charges for hospital, public safety and other services), approximately 15 percent was from intergovernmental revenue transfers (e.g., funding from various state and federal programs); and the remaining 17 percent was from rents and concession payments, licenses and fines, prior year balance, and other revenues and financing sources. Table 27 illustrates San Francisco’s major revenue sources.
Table 27 Overview of San Francisco Budget, FY 2014-15 Major Revenue Sources
Service Area $ millions %
Local Taxes $3,084 36%Licenses & Fines $177 2%Use of Money or Property $550 6%Intergovernmental (Federal, State, Other) $1,323 15%Charges for Services $2,737 32%Other Revenue $269 3%Fund Balance (previous year) $441 5%
Total Sources $8,582 100%
Source:City and County of San Francisco Budget and Appropriation Ordinance FY 14-15
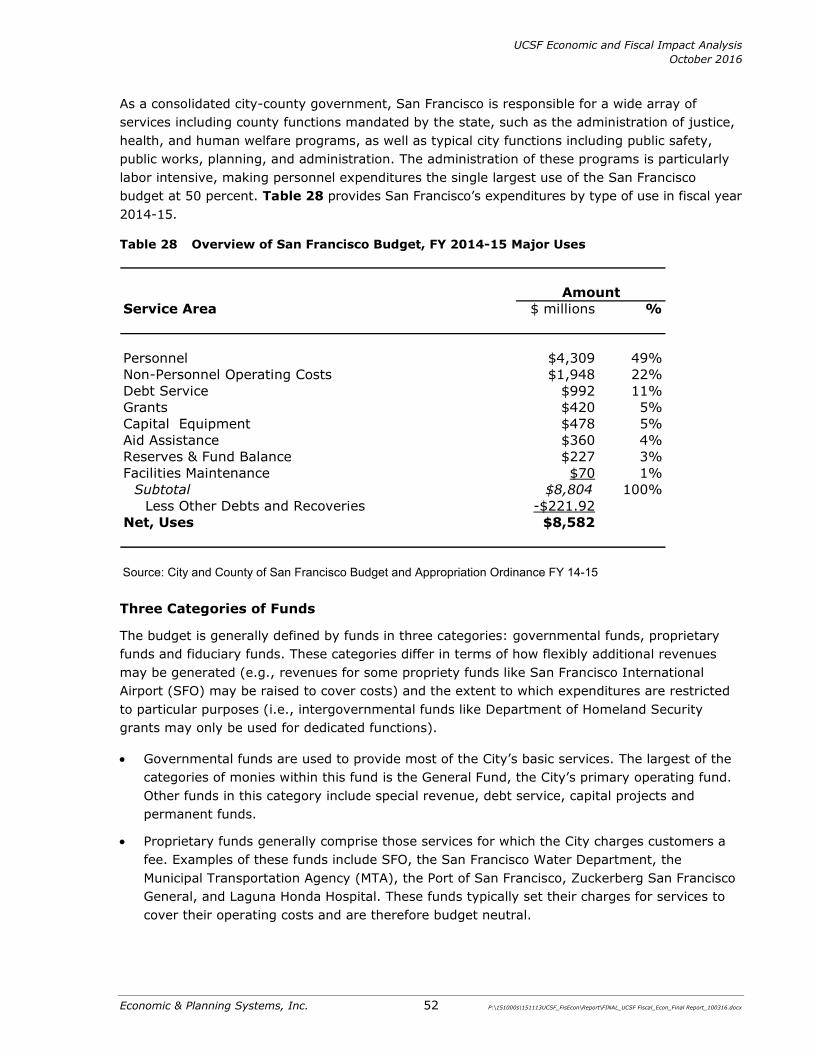
UCSF Economic and Fiscal Impact Analysis October 2016
Economic & Planning Systems, Inc. 52 P:\151000s\151113UCSF_FisEcon\Report\FINAL_UCSF Fiscal_Econ_Final Report_100316.docx
As a consolidated city-county government, San Francisco is responsible for a wide array of services including county functions mandated by the state, such as the administration of justice, health, and human welfare programs, as well as typical city functions including public safety, public works, planning, and administration. The administration of these programs is particularly labor intensive, making personnel expenditures the single largest use of the San Francisco budget at 50 percent. Table 28 provides San Francisco’s expenditures by type of use in fiscal year 2014-15.
Table 28 Overview of San Francisco Budget, FY 2014-15 Major Uses
Three Categories of Funds
The budget is generally defined by funds in three categories: governmental funds, proprietary funds and fiduciary funds. These categories differ in terms of how flexibly additional revenues may be generated (e.g., revenues for some propriety funds like San Francisco International Airport (SFO) may be raised to cover costs) and the extent to which expenditures are restricted to particular purposes (i.e., intergovernmental funds like Department of Homeland Security grants may only be used for dedicated functions).
x Governmental funds are used to provide most of the City’s basic services. The largest of the categories of monies within this fund is the General Fund, the City’s primary operating fund. Other funds in this category include special revenue, debt service, capital projects and permanent funds.
x Proprietary funds generally comprise those services for which the City charges customers a fee. Examples of these funds include SFO, the San Francisco Water Department, the Municipal Transportation Agency (MTA), the Port of San Francisco, Zuckerberg San Francisco General, and Laguna Honda Hospital. These funds typically set their charges for services to cover their operating costs and are therefore budget neutral.
Service Area $ millions %
Personnel $4,309 49%Non-Personnel Operating Costs $1,948 22%Debt Service $992 11%Grants $420 5%Capital Equipment $478 5%Aid Assistance $360 4%Reserves & Fund Balance $227 3%Facilities Maintenance $70 1%
Subtotal $8,804 100%Less Other Debts and Recoveries -$221.92
Net, Uses $8,582
Source: City and County of San Francisco Budget and Appropriation Ordinance FY 14-15
Amount
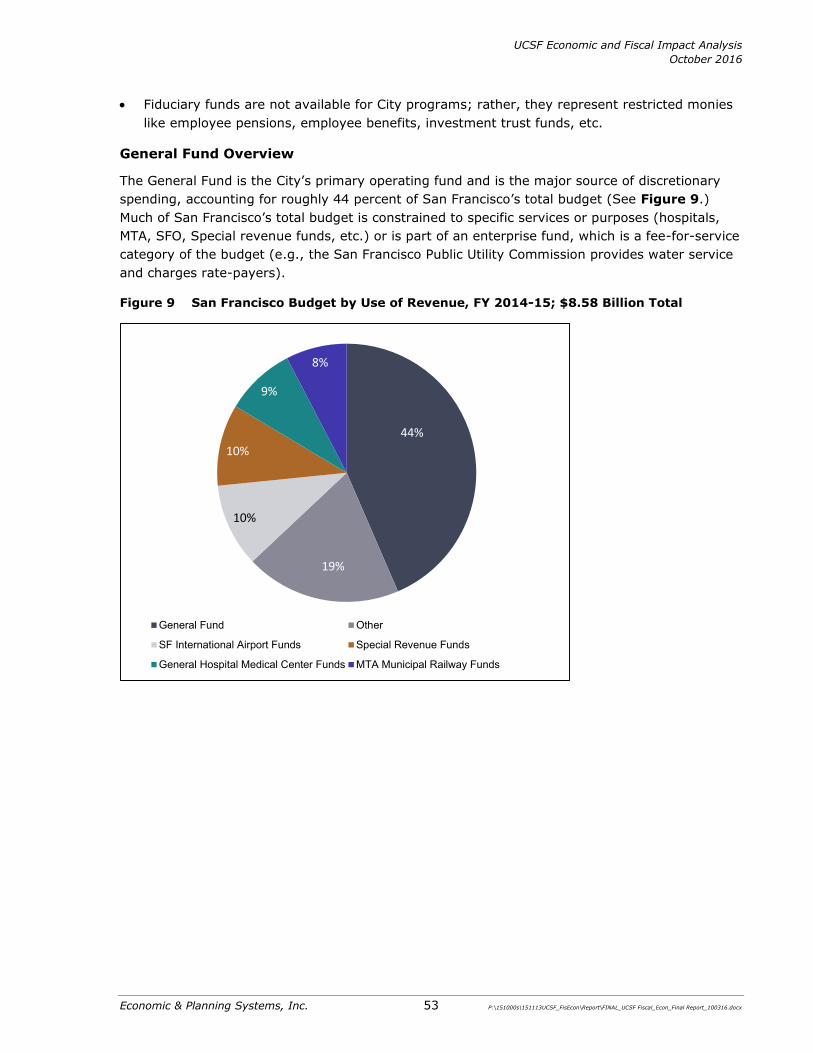
UCSF Economic and Fiscal Impact Analysis October 2016
Economic & Planning Systems, Inc. 53 P:\151000s\151113UCSF_FisEcon\Report\FINAL_UCSF Fiscal_Econ_Final Report_100316.docx
x Fiduciary funds are not available for City programs; rather, they represent restricted monies like employee pensions, employee benefits, investment trust funds, etc.
General Fund Overview
The General Fund is the City’s primary operating fund and is the major source of discretionary spending, accounting for roughly 44 percent of San Francisco’s total budget (See Figure 9.) Much of San Francisco’s total budget is constrained to specific services or purposes (hospitals, MTA, SFO, Special revenue funds, etc.) or is part of an enterprise fund, which is a fee-for-service category of the budget (e.g., the San Francisco Public Utility Commission provides water service and charges rate-payers).
Figure 9 San Francisco Budget by Use of Revenue, FY 2014-15; $8.58 Billion Total
44%
19%
10%
10%
9%
8%
General Fund Other
SF International Airport Funds Special Revenue Funds
General Hospital Medical Center Funds MTA Municipal Railway Funds

UCSF Economic and Fiscal Impact Analysis October 2016
Economic & Planning Systems, Inc. 54 P:\151000s\151113UCSF_FisEcon\Report\FINAL_UCSF Fiscal_Econ_Final Report_100316.docx
In terms of revenue, property taxes are one of the primary sources of revenue for the General Fund. Specifically, property taxes make up nearly 30 percent of all General Fund revenue annually. Other local taxes (included hotel room tax, property transfer tax, and sales tax) contribute a substantial amount of revenue to the City’s General Fund as well, making up more than 20 percent of annual General Fund revenue. Figure 10 illustrates the composition of General Fund revenues by major sources.
Figure 10 General Fund – Sources of Revenue FY 2014-15; $3.8 Billion Total
29%
21%15%
13%
13%
9%
Property Taxes Other Local Taxes
Intergovernmental Revenues-State Business Taxes
Other Expenditure Recovery
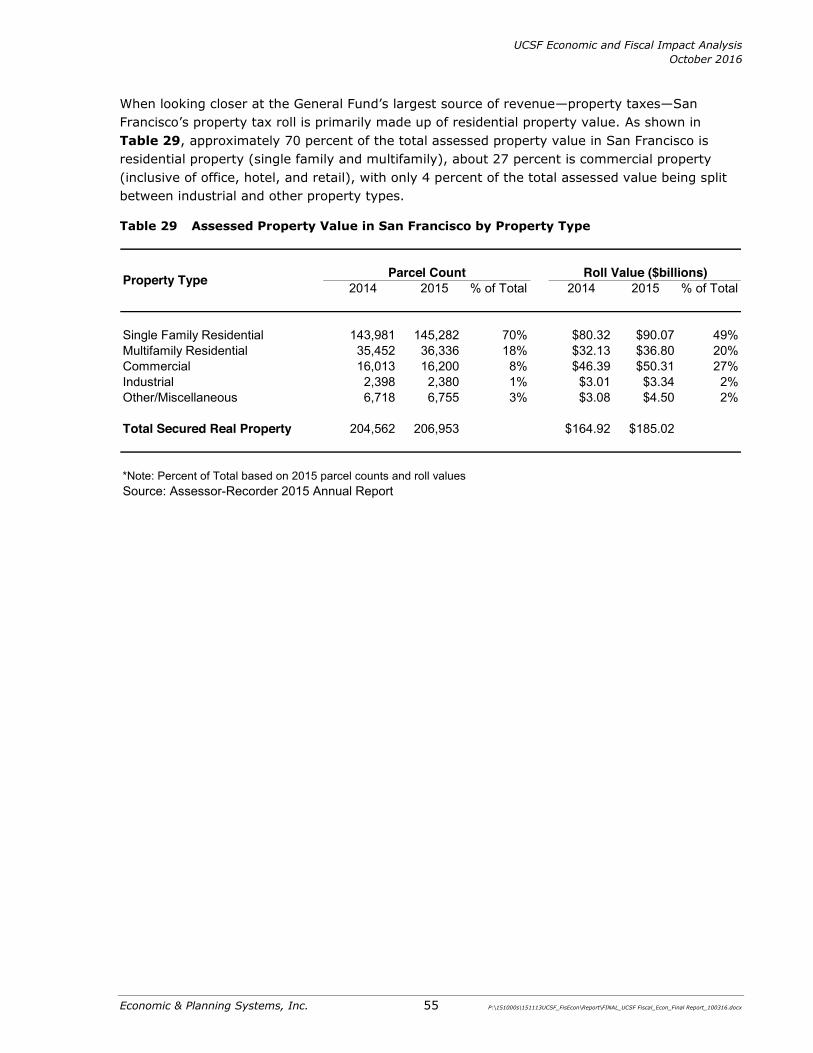
UCSF Economic and Fiscal Impact Analysis October 2016
Economic & Planning Systems, Inc. 55 P:\151000s\151113UCSF_FisEcon\Report\FINAL_UCSF Fiscal_Econ_Final Report_100316.docx
When looking closer at the General Fund’s largest source of revenue—property taxes—San Francisco’s property tax roll is primarily made up of residential property value. As shown in Table 29, approximately 70 percent of the total assessed property value in San Francisco is residential property (single family and multifamily), about 27 percent is commercial property (inclusive of office, hotel, and retail), with only 4 percent of the total assessed value being split between industrial and other property types.
Table 29 Assessed Property Value in San Francisco by Property Type
2014 2015 % of Total 2014 2015 % of Total
Single Family Residential 143,981 145,282 70% $80.32 $90.07 49%Multifamily Residential 35,452 36,336 18% $32.13 $36.80 20%Commercial 16,013 16,200 8% $46.39 $50.31 27%Industrial 2,398 2,380 1% $3.01 $3.34 2%Other/Miscellaneous 6,718 6,755 3% $3.08 $4.50 2%
Total Secured Real Property 204,562 206,953 $164.92 $185.02
*Note: Percent of Total based on 2015 parcel counts and roll valuesSource: Assessor-Recorder 2015 Annual Report
Property Type Parcel Count Roll Value ($billions)
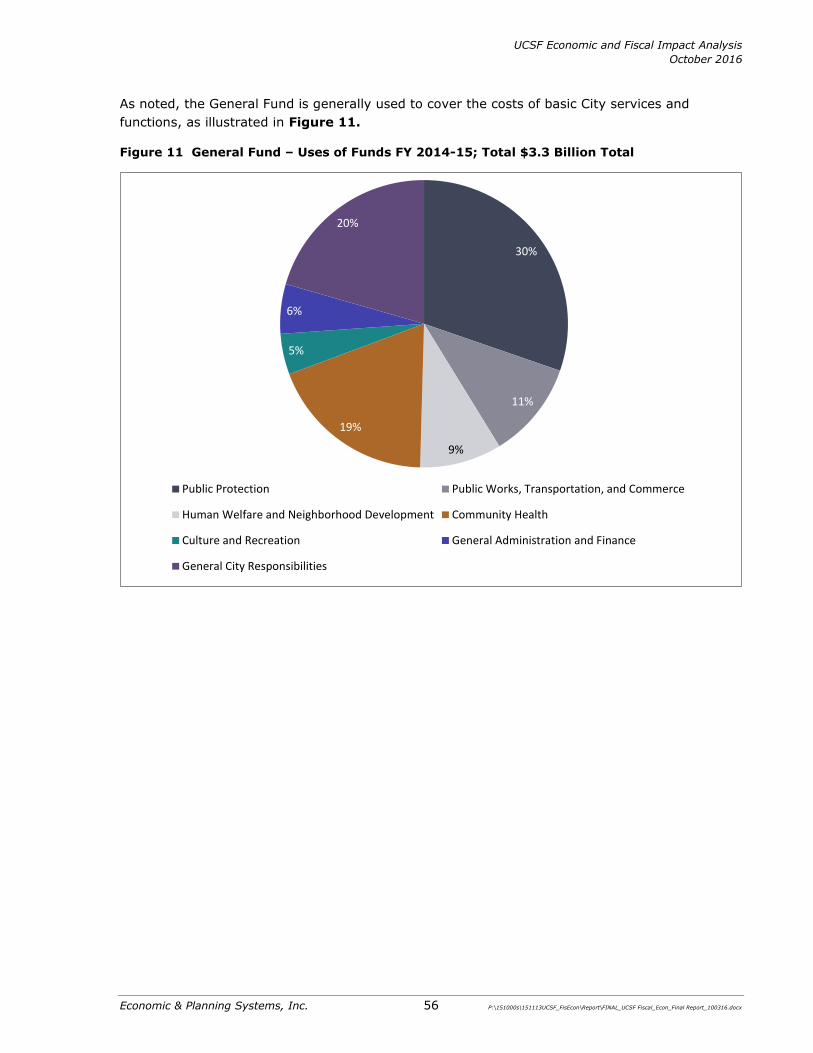
UCSF Economic and Fiscal Impact Analysis October 2016
Economic & Planning Systems, Inc. 56 P:\151000s\151113UCSF_FisEcon\Report\FINAL_UCSF Fiscal_Econ_Final Report_100316.docx
As noted, the General Fund is generally used to cover the costs of basic City services and functions, as illustrated in Figure 11.
Figure 11 General Fund – Uses of Funds FY 2014-15; Total $3.3 Billion Total
30%
11%
9%
19%
5%
6%
20%
Public Protection Public Works, Transportation, and Commerce
Human Welfare and Neighborhood Development Community Health
Culture and Recreation General Administration and Finance
General City Responsibilities

UCSF Economic and Fiscal Impact Analysis October 2016
Economic & Planning Systems, Inc. 57 P:\151000s\151113UCSF_FisEcon\Report\FINAL_UCSF Fiscal_Econ_Final Report_100316.docx
F i sca l Impact Met ho do lo gy
As noted, at the broadest level, all municipal revenues and costs balance out and thus all activity and land uses in a city taken as a whole are revenue-neutral. However, a fiscal analysis is premised on the notion that different land uses and activities have differential impacts on the City’s budget. In trying to determine the unique impacts of UCSF on the City’s General Fund budget, this analysis categorizes and evaluates each General Fund budget item based on one of the following basic techniques, as summarized below:
1. Case Study: For some costs and revenues, specific information is available on UCSF’s generation of revenues or demand for public services (e.g., Muni, police, fire, etc.). In these instances, a case study method is used to estimate UCSF’s budgetary impact. A case study method is appropriate when sufficient data is available to directly link UCSF’s population and operations with a particular budget item.
2. Population-Based: For many cost and revenue items, unique data is not available on usage or generation. For these items, a per-population basis is used to estimate revenues and costs. As an initial step in the per-population allocation method, various population types are defined (e.g., residents, employees, visitors, and students, as described further below), and compared against one another in terms of their likely services demands and revenue impacts. For example, UCSF’s employees are assumed to be comparable to San Francisco employees in terms of their budget impacts.
3. Negligible Impact: UCSF’s impact on a limited number of cost and revenue items is estimated to be negligible. For example, UCSF is not subject to property taxes therefore the University’s impact on property tax-related revenues (property tax, property transfer tax, state revenues to the City which are dependent on increases in assessed property value, etc.) is negligible. In addition, because of the unique attributes of UCSF’s population and operations, its impacts on some departmental costs are estimated to be negligible.
Treatment of UCSF’s Population Groups
UCSF has a variety of population categories including students, employees, and visitors to the campus and medical centers. These categories of UCSF-affiliated people may be further subdivided into San Francisco residents and nonresidents and on-campus residents (living on UCSF-owned property) and off-campus residents.
The fiscal impact analysis focuses on each of these population groups during their affiliation with UCSF. This means that, to the extent possible, only the “UCSF-related” impact of the various population-types (students, employees and visitors) is included in the fiscal impact analysis. For example, the fiscal impacts of a nurse at UCSF during the workday— purchasing a prepared lunch, riding Muni to work, using the public streets, etc. —are accounted for in the study. Impacts not closely associated with UCSF operations are excluded; for example, property taxes paid by UCSF off-campus residents or services consumed by UCSF personnel in their private lives are considered to be revenue neutral as UCSF-San Francisco residents pay taxes and local fees just like other residents.
UCSF Economic and Fiscal Impact Analysis October 2016
Economic & Planning Systems, Inc. 58 P:\151000s\151113UCSF_FisEcon\Report\FINAL_UCSF Fiscal_Econ_Final Report_100316.docx
This approach is premised on the idea that UCSF affiliates’ “off campus” life is revenue-neutral for the City. As an example, many UCSF employees are San Francisco residents and generate property tax, sales tax and costs for police, etc., like any other San Francisco resident. Alternatively, UCSF employees who are non-city residents return to their home jurisdiction and generate costs and revenues there. The fiscal impact associated with these employees represented by their “non-UCSF” life is not under evaluation.
The one partial exception to this methodology is the treatment of UCSF on-campus residents. Because these residents do not generate property taxes for San Francisco, they cannot be treated like typical San Francisco residents. Because of their special status, the full range of their cost and revenue generation is included in the fiscal impact analysis.
Relative Size of UCSF Population Groups
In order to estimate UCSF’s generation of revenues and the need for public services, the size of UCSF-related population groups must be measured and compared with San Francisco’s total population. The various UCSF population groups are described below:
x UCSF Employees. UCSF has 24,143 employees on payroll and employs about 23,000 people in San Francisco (the difference accounts for the small number of employees working outside of San Francisco).
x UCSF Students. In 2015, UCSF had 4,847 enrolled students. Almost 30 percent of those students were in the School of Medicine, while the remainder of students are spread among the dentistry, nursing, and pharmacy schools, and other graduate programs. UCSF has 935 beds within 667 on-campus housing units with 1,496 people residing in the units (including students, faculty, and their roommates or family members).
x UCSF Visitors. UCSF also has a significant number of people with a loose connection to the medical centers and campus including patients, prospective students, and other visitors. Rather than attempting to quantify every visit to the campus and the hospitals, only visitors who spend a significant amount of time in San Francisco (e.g., overnight) and those whose presence in San Francisco is directly attributable to UCSF (e.g., those attending a conference, or visiting patients in a UCSF hospital) are counted. The analysis also excludes the more than 1 million annual outpatient visitors to UCSF, since their General Fund impact is likely negligible, with costs and revenues that are likely to be off-setting. This method will capture those visitors with the greatest impact because they stay at least one day in the City and those visitors who can reasonably be assumed to be in San Francisco because of UCSF.24
24 This is contrasted with people who are in San Francisco for other reasons and are using UCSF hospitals or school facilities simply because it is one of their options in the City. For example, community groups sometimes use UCSF facilities for meetings; while they are “visitors” to the UCSF campus, they are only associated with UCSF for a short period of time and would likely have held their meeting elsewhere in San Francisco regardless of whether UCSF is located in the City.
UCSF Economic and Fiscal Impact Analysis October 2016
Economic & Planning Systems, Inc. 59 P:\151000s\151113UCSF_FisEcon\Report\FINAL_UCSF Fiscal_Econ_Final Report_100316.docx
Overnight conference attendees accounted for approximately 95,000 hotel-room nights.25 UCSF admitted 27,908 inpatients to its hospitals in 2014 and they stayed a total of 177,445 nights (an average length of stay of 6.4 nights). Based on the number of inpatient-days in the hospitals and the residence of the inpatient, an estimate has been made regarding the number of days spent in San Francisco by UCSF hospital inpatients. Both conference attendees and visitors to hospital inpatients are counted as part of the total UCSF-related population.
The UCSF population estimates are aimed at determining the proportion of San Francisco’s service population that is represented by UCSF. Thus, the total number of San Francisco residents, employees, and visitors must be accounted for and compared with these counts for UCSF. Table 30 provides an estimation of UCSF’s major population groups, while Table 31 provides similar estimates for the City and County of San Francisco.
x Total San Francisco Population. According to California Department of Finance, the City of San Francisco had 845,602 residents in 2015.
x Total San Francisco Employment. Based on estimates from the California EDD, 668,867 jobs were located in San Francisco in 2015. Roughly 35 percent of those jobs are held by San Francisco residents. This leaves about 437,247 jobs held by non-San Francisco residents.
25 Based on the most recent available data and estimates of conference attendees and assumptions on the percentage of attendees who traveled from out-of-town and their length of stay.

UCSF Economic and Fiscal Impact Analysis October 2016
Economic & Planning Systems, Inc. 60 P:\151000s\151113UCSF_FisEcon\Report\FINAL_UCSF Fiscal_Econ_Final Report_100316.docx
Table 30 UCSF Population, Employment, and Visitor Estimates
Category Total
Employees 1
San FranciscoFull-Time 16,086Part-Time 8,057
Total, Headcount 24,143% of Jobs located in San Francisco 95.9%
Total, 23,142By Category
Academic (Includes Doctors) 6,603Non-Academic1 17,540
Total, Headcount 24,143Students 2
By SchoolDentistry 507Medicine 1,408Nursing 542Pharmacy 672Other Graduate Programs 38Residency Programs 1,680
Total Students 4,847Students and Employees Residing On-Campus 2
By Location of Residence, On-Campus/Off-CampusNumber of on-campus beds 935Number of on-campus beds occupied 934
Number of students living on-campus 959Number of faculty/employees living on-campus 40All others living on-campus (roommates, spouses, children, etc.) 497Total on-campus population 1,496
UCSF Out-of-Town VisitorsConference Attendees 3
Total conference attendees 103,862 Attendees from out-of-town (20%) 20,772 Average Length of Stay 4.6
Total Hotel-Nights 95,553Visitors to Hospital Patients 4
UCSF Hospital Inpatients 27,900Total Days Spent in Hospital 177,400Estimated Proportion of Days that Visitors Came to Hospital 75%
Total Visitor-Days 133,050Estimated Proportion of Days in Hotel 5%
Estimated number of Hotel-Nights (visitors to hospital inpatients) 6,653
[1] Includes all management positions as well as support staff[2] All counts from UCSF Office of the Registrar
[4] Hospital visitor data is detailed further in the Fiscal Analysis section of this report. Sources: UCSF Campus Planning; Economic & Planning Systems, Inc.
[3] Conference attendee information provided by UCSF Campus Life Services
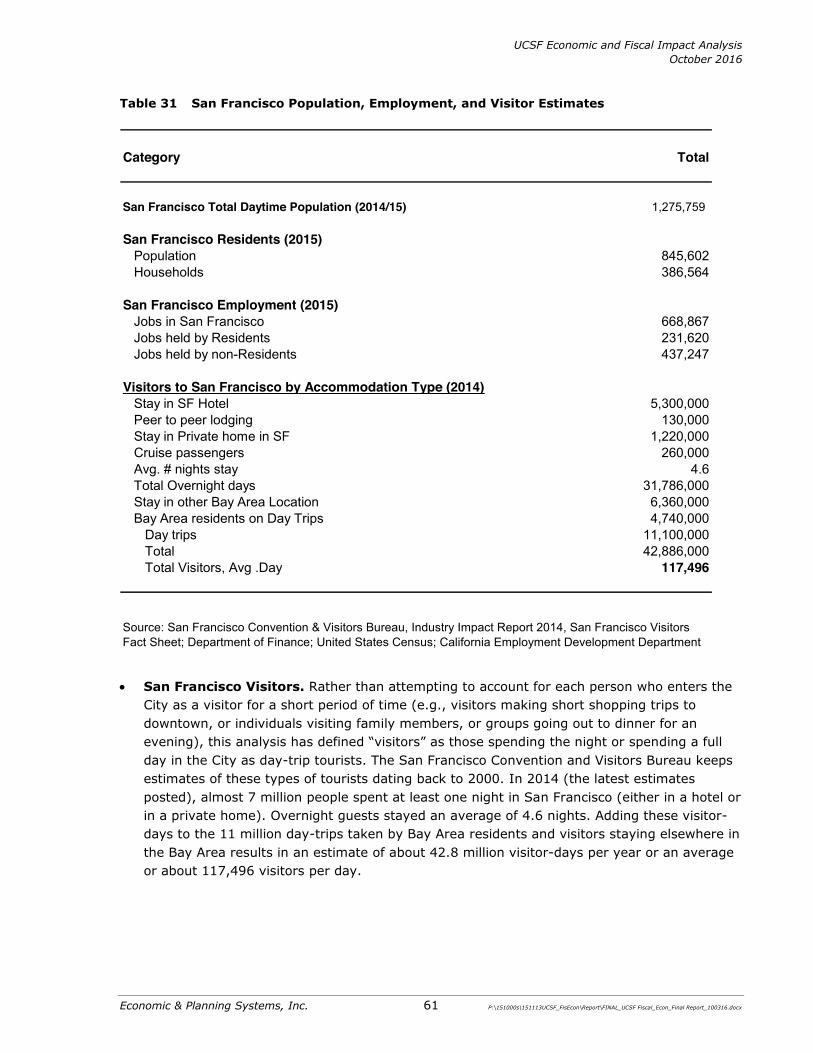
UCSF Economic and Fiscal Impact Analysis October 2016
Economic & Planning Systems, Inc. 61 P:\151000s\151113UCSF_FisEcon\Report\FINAL_UCSF Fiscal_Econ_Final Report_100316.docx
Table 31 San Francisco Population, Employment, and Visitor Estimates
x San Francisco Visitors. Rather than attempting to account for each person who enters the City as a visitor for a short period of time (e.g., visitors making short shopping trips to downtown, or individuals visiting family members, or groups going out to dinner for an evening), this analysis has defined “visitors” as those spending the night or spending a full day in the City as day-trip tourists. The San Francisco Convention and Visitors Bureau keeps estimates of these types of tourists dating back to 2000. In 2014 (the latest estimates posted), almost 7 million people spent at least one night in San Francisco (either in a hotel or in a private home). Overnight guests stayed an average of 4.6 nights. Adding these visitor-days to the 11 million day-trips taken by Bay Area residents and visitors staying elsewhere in the Bay Area results in an estimate of about 42.8 million visitor-days per year or an average or about 117,496 visitors per day.
Category Total
San Francisco Total Daytime Population (2014/15) 1,275,759
San Francisco Residents (2015)Population 845,602Households 386,564
San Francisco Employment (2015)Jobs in San Francisco 668,867Jobs held by Residents 231,620Jobs held by non-Residents 437,247
Visitors to San Francisco by Accommodation Type (2014)Stay in SF Hotel 5,300,000Peer to peer lodging 130,000Stay in Private home in SF 1,220,000Cruise passengers 260,000Avg. # nights stay 4.6Total Overnight days 31,786,000Stay in other Bay Area Location 6,360,000Bay Area residents on Day Trips 4,740,000
Day trips 11,100,000Total 42,886,000Total Visitors, Avg .Day 117,496
Source: San Francisco Convention & Visitors Bureau, Industry Impact Report 2014, San Francisco Visitors Fact Sheet; Department of Finance; United States Census; California Employment Development Department

UCSF Economic and Fiscal Impact Analysis October 2016
Economic & Planning Systems, Inc. 62 P:\151000s\151113UCSF_FisEcon\Report\FINAL_UCSF Fiscal_Econ_Final Report_100316.docx
Resident Equivalent Factors
All of the various population types described above—employees, students, residents, and visitors—have different characteristics in terms of their demand for public services and generation of revenues. These differences are mostly attributable to the amount of time spent in San Francisco. In order to place the counts of the population types into a unit type that can be easily compared, all population types are compared with a typical San Francisco resident, referred to as a Resident Equivalent.
Table 32 shows the various population groups and a factor that weights the population according to its likely impact relative to a Resident Equivalent. As shown, a San Francisco resident is assumed to be the baseline for comparison purposes and is therefore assigned a Resident Equivalent weight of 1.00. In order to avoid double counting, San Francisco residents who hold San Francisco jobs are excluded from the City’s job count to estimate only nonresidents working in the city. Nonresident employees are weighted at 0.50 of a Resident Equivalent as an approximation of the number of waking hours typically spent at work. Since daily visitors either spend the night in the City or are in town for most of the waking hours of a day, they are assumed to be equal to Resident Equivalents (normalized for 365 days per year). Weighting the counts of each of these population groups and adding them together results in a total of 1.1 million Resident Equivalents in San Francisco.
Also shown in Table 32 are UCSF’s population groups and relative weightings. Because the full range of fiscal impacts will be estimated for on-campus UCSF residents,26 UCSF on-campus residents are weighted as one Resident Equivalent. To avoid double counting, these on-campus residents are deducted from either the student or UCSF jobs population categories. UCSF employees and UCSF students are weighted as 0.50 Resident Equivalents because roughly half of their waking hours are estimated to be spent working or in school. The other half are estimated to be spent on non-UCSF-related activities and are thus excluded from the fiscal impact analysis. There are roughly 520 overnight visitors (conference attendees and visitors to UCSF hospital inpatients) associated with UCSF on an average daily basis. This population group is assigned a weight of 1.00 Resident Equivalent.
26 The full range of impacts is evaluated for on-campus residents because they reside on tax-exempt property and because both their work/student time and personal-home time is associated with UCSF.

UCSF Economic and Fiscal Impact Analysis October 2016
Economic & Planning Systems, Inc. 63 P:\151000s\151113UCSF_FisEcon\Report\FINAL_UCSF Fiscal_Econ_Final Report_100316.docx
Table 32 Summary of Resident Equivalents
Item NumberResident
Equivalent Weighting Factor
Resident Equivalents
Resident Equivalent ItemsSan FranciscoResidents 845,602 1.00 845,602Non-Resident Employees 437,247 0.50 218,624Daily Visitors 117,496 1.00 117,496
Total 1,837,592 1,181,721
UCSFResidents 1,496 1.00 1,496
SF Jobs 24,143 0.50 12,072(less) Faculty counted in "Residents" -40 0.50 -20Net Jobs 24,103 0.50 12,052
Students 4,847 0.50 2,424(less) students counted in "Residents" -1,456 0.50 -728Net Students 3,391 0.50 1,696
VisitorsConference Attendees, Prospective Students (Days) 285 1.00 285Visitors to Hospital Patients 237 1.00 237Total Visitors 521 521
Total 29,511 15,764
Key Factors Used in General Fund Budget AllocationUCSF as % of San Francisco's:
"Service Population" 1.33%"Residential Population 0.18%
Resident Equivalent Calculation
Sources: California Department of Finance; United States Census Bureau, UCSF Campus Planning; EPS
UCSF Economic and Fiscal Impact Analysis October 2016
Economic & Planning Systems, Inc. 64 P:\151000s\151113UCSF_FisEcon\Report\FINAL_UCSF Fiscal_Econ_Final Report_100316.docx
Having these various population groups totaled in identical terms (Residential Equivalents) allows for a comparison between UCSF’s related population and San Francisco’s population. Depending on whether a General Fund cost or revenue is generated by the residential population or the full-service population (residents, employees, and visitors), the appropriate proportion that UCSF represents may be applied. The key comparisons made in the table are as follows:
x UCSF as a Proportion of San Francisco’s Service Population. Including students, employees, and visitors and comparing these groups with similar San Francisco population groups, UCSF’s Resident Equivalent population totals 15,764, equal to about 1.3 percent of San Francisco’s total Resident Equivalents.27
x UCSF as a Proportion of San Francisco’s Residential Population. Some public services and revenues are almost wholly demanded by or generated by the residential population. For example, cable television taxes and services like Sheriff, District Attorney, Public Defender, and others represent revenues and costs tied to the residential population.28 To estimate these kinds of items, the UCSF on-campus residential population is compared with San Francisco’s total residential population. UCSF’s on-campus residents make up about 0.2 percent of San Francisco residents.
27 In rare cases, San Francisco’s entire service population generates revenues or public service costs, but only UCSF’s residential population (i.e. residing in UCSF housing) is subject to the revenue generations. These circumstances (e.g., telephone taxes) are referenced as appropriate in Chapter 7.
28 These are County functions directed by officials elected by San Francisco residents.

Economic & Planning Systems, Inc. 65 P:\151000s\151113UCSF_FisEcon\Report\FINAL_UCSF Fiscal_Econ_Final Report_100316.docx
7. GENERAL FUND FISCAL IMPACT CALCULATIONS
This chapter describes the calculations and results from an analysis of UCSF’s fiscal impact on the City’s General Fund based on the methodology and approach described in Chapter 6.
Gener a l Fund Revenue A na lys i s
As described earlier, San Francisco’s General Fund revenues are made up of property taxes, sales tax, business tax, hotel taxes, variety of user taxes, intergovernmental transfers, and other sources. Table 33 reports General Fund revenues by source for FY 2014-15, the recommended allocation method used to apportion these revenues to UCSF, and the resulting impact on General Fund revenues attributed to UCSF. The revenues are segmented into major groupings and are detailed in the subsequent sections.
Property Taxes
Because UCSF is exempt from property taxes, it does not directly generate property tax revenues. Consequently, this analysis assumes no direct impact on this budget item.
Business Taxes
Of the three business taxes levied in the City of San Francisco, UCSF activities are either exempt or negligible to two of them (Business Registration Tax and Gross Receipts Tax). The only business tax materially impacted by UCSF is the Payroll Tax. While UCSF is exempt from payroll taxes on its employees, contractors are not. Probably the most significant UCSF impact on this revenue category results from UCSF capital improvement projects.29 To put it simply, if UCSF did not spend money on construction projects, people would not have those jobs and contractors would not make payroll tax payments to the City of San Francisco.
29 While other professional service contractors located in San Francisco are also subject to payroll taxes, detailed data on the amount and firm location associated with these expenditures is not available.

UCSF Economic and Fiscal Impact Analysis October 2016
Economic & Planning Systems, Inc. 66 P:\151000s\151113UCSF_FisEcon\Report\FINAL_UCSF Fiscal_Econ_Final Report_100316.docx
Table 33 San Francisco General Fund Revenues: UCSF’s Impact
2014 -15General Fund
($millions)
Property Tax Property Tax $939.4 Not Estimated $0Property Tax AB1290 Redev. Pass Through $15.2 Not Estimated $0Property Tax In Lieu of Vehicle License Fee $196.5 Not Estimated $0Property Tax in Lieu of Sales and Use Tax Not Estimated $0Other Property Taxes1 Not Estimated $0Supplemental Current and Prior Year Not Estimated $0
Total: Property Taxes $1,232.9 $0Business Taxes
Payroll Tax $436.4 Case Study $1,213,000Business Registration Tax $35.6 Negligible Impact $0Gross Receipts Tax (Prop E)2 $100.4 Not Estimated $0
Total: Business Taxes $572.4 $1,213,000Other Local Taxes
Sales and Use Tax $136.1 Case Study $2,812,000Hotel Room Tax $318.4 Case Study $1,569,000Gas Electric Steam Users Tax $38.2 Negligible Impact $0Telephone Users Tax $49.3 ServPop: UCSF Resid Only $62,386Water Users Tax $4.3 Negligible Impact $0Parking Tax $84.9 Case Study $956,000Property Transfer Tax $235.0 Negligible Impact $0Stadium Admission Tax $1.3 Negligible Impact $0Access Line Tax - Current $43.1 Not Estimated $0
Total: Other Local Taxes $910.4 $5,399,000Licenses, Permits, and Franchises
All Licenses, Permits, and Franchises $27.1 Residential Capita $48,000Total: Licenses, Permits, and Franchises $27.1 $48,000
FinesTraffic Fines $3.7 Service Population $49,000All Other $0.5 Service Population $7,000
Total: Fines Forfeitures, and Penalties $4.2 $56,000
Interest and Investment Income $6.9 Negligible Impact $0Rents and Concessions $22.7 Negligible Impact $0Intergovernmental Transfers - State 3 $624.4 Residential Capita $1,105,000Intergovernmental Transfers - Federal 3 $234.9 Residential Capita $416,000Intergovernmental Revenues - Other 3 $2.6 Residential Capita $5,000Charges for Service4 $209.8 Included Elsewhere $0Other Revenue $49.7 Negligible Impact $0
Total: General Fund Revenues $3,898.1 $8,237,000
General Fund Revenue Items Allocation MethodNet Resources
Attributed to UCSF
Source: SF Open Book, City and County of San Francisco, General Fund Revenue FY 2014/15 [1] Other property tax revenue includes: prior year property taxes, property tax penalties, SB 813 - 5% Administration Cost, and unallocated general property taxes
[2] Includes Administrative Office Tax (Prop E) as well.
[4] Rather than trying to estimate charges for services, these revenues are excluded from the departmental costs of the General Fund expenditure table.
[3] Transfers from other State and Federal governmental departments. Includes Public Assistance Administration and Prop 172 Public Safety Funds as well as other intergovernmental transfers.

UCSF Economic and Fiscal Impact Analysis October 2016
Economic & Planning Systems, Inc. 67 P:\151000s\151113UCSF_FisEcon\Report\FINAL_UCSF Fiscal_Econ_Final Report_100316.docx
Table 34 provides an estimate of fiscal year 2014-15 payroll taxes attributable to UCSF’s capital program. To avoid overestimating this variable expenditure, UCSF’s average annual capital budget of $310 million is used to evaluate the payroll tax impact. UCSF estimates it will spend 40 percent of the total budget on labor for the projects. Small firms under the payroll threshold are exempt from the payroll tax. Accounting for these deductions and applying the 1.16 percent payroll tax rate, UCSF construction projects generated an estimated $1.2 million in payroll taxes for San Francisco’s General Fund in fiscal year 2014-2015.
Table 34 Payroll Tax Estimate, FY 2014-15
Item Formula Total
Capital Expenditures1 a $310,306,000
Soft Costs at 35% of total 2 b = a * 35% $108,607,000.00Payroll, assuming 65% of soft costs go to payroll 3 c = b * 65 $70,595,000Deduct Proportion of Firms Outside San Francisco, Exempt from Tax, assuming 50% 4 d = c * -50% ($35,298,000)Soft Costs Net Payroll Subject to Tax e = c + d $35,297,000
Hard Costs at 65% of total f = a * 65% $201,698,900.00Payroll, assuming 40% of soft costs go to payroll 5 g = f * 40% $80,680,000
Total Payroll from Capital Expenditures h = g + e $115,977,000
Deduct Proportion Exempt from Tax, assuming 10% of payroll i = h * -10% ($11,597,700)Net Payroll Subject to Tax j = h + i $104,379,000San Francisco Payroll Tax k 1.16%
Total Payroll Tax Supported by Capital Expenditures in SF l = j * k $1,213,000
[1] Based on review of UCSF's annual capital expenditures.[2] Estimated based on EPS's experience reviewing development pro formas. [3] Soft costs typically go to professional service firms. The majority of these types of firms' costs are labor.
[5] The percentage of hard construction costs that go to labor versus materials and supplies will vary by project type, location, whether prevailing wage is used, etc. The estimate used here is based on factors provided in the IMPLAN model. The model is described in the Economic Impact chapter. All of the payroll for hard construction cost is expected to be subject to San Francisco's payroll tax (except for very small firms).
[4] Half of the spending is assumed to be awarded within the City because San Francisco has a high number of these types of firms.
Source: UCSF; IMPLAN; Economic & Planning Systems
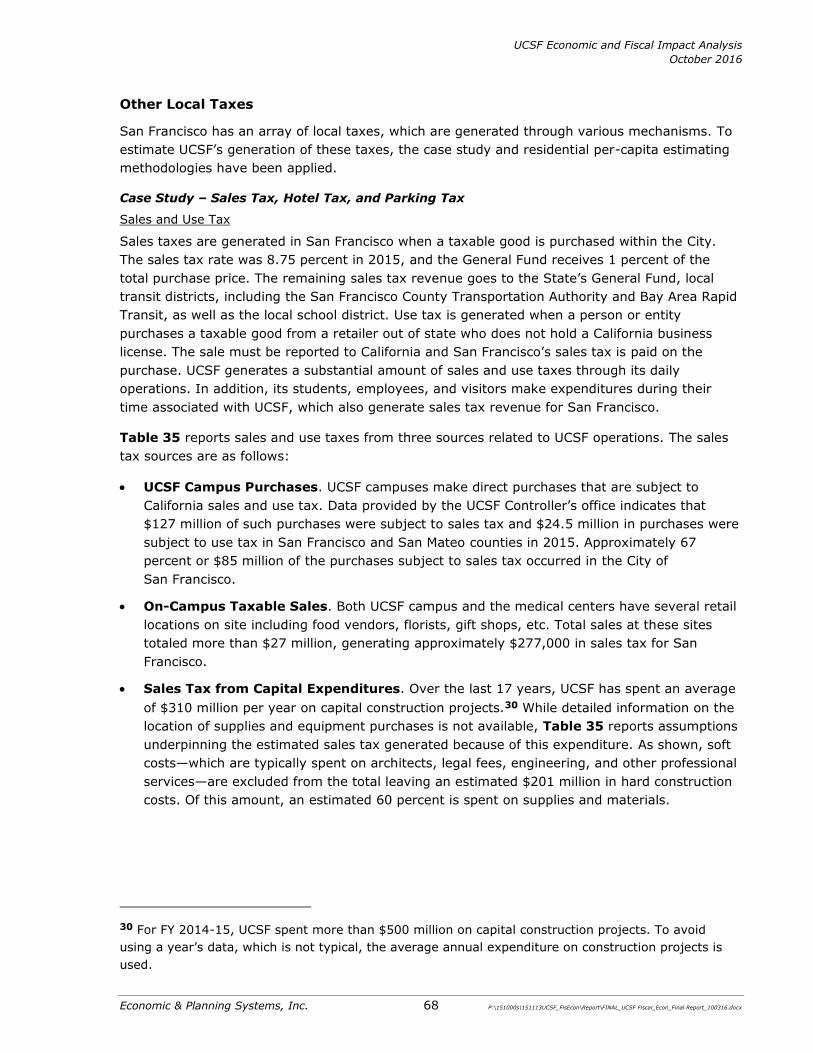
UCSF Economic and Fiscal Impact Analysis October 2016
Economic & Planning Systems, Inc. 68 P:\151000s\151113UCSF_FisEcon\Report\FINAL_UCSF Fiscal_Econ_Final Report_100316.docx
Other Local Taxes
San Francisco has an array of local taxes, which are generated through various mechanisms. To estimate UCSF’s generation of these taxes, the case study and residential per-capita estimating methodologies have been applied.
Case Study – Sales Tax, Hotel Tax, and Parking Tax
Sales and Use Tax
Sales taxes are generated in San Francisco when a taxable good is purchased within the City. The sales tax rate was 8.75 percent in 2015, and the General Fund receives 1 percent of the total purchase price. The remaining sales tax revenue goes to the State’s General Fund, local transit districts, including the San Francisco County Transportation Authority and Bay Area Rapid Transit, as well as the local school district. Use tax is generated when a person or entity purchases a taxable good from a retailer out of state who does not hold a California business license. The sale must be reported to California and San Francisco’s sales tax is paid on the purchase. UCSF generates a substantial amount of sales and use taxes through its daily operations. In addition, its students, employees, and visitors make expenditures during their time associated with UCSF, which also generate sales tax revenue for San Francisco.
Table 35 reports sales and use taxes from three sources related to UCSF operations. The sales tax sources are as follows:
x UCSF Campus Purchases. UCSF campuses make direct purchases that are subject to California sales and use tax. Data provided by the UCSF Controller’s office indicates that $127 million of such purchases were subject to sales tax and $24.5 million in purchases were subject to use tax in San Francisco and San Mateo counties in 2015. Approximately 67 percent or $85 million of the purchases subject to sales tax occurred in the City of San Francisco.
x On-Campus Taxable Sales. Both UCSF campus and the medical centers have several retail locations on site including food vendors, florists, gift shops, etc. Total sales at these sites totaled more than $27 million, generating approximately $277,000 in sales tax for San Francisco.
x Sales Tax from Capital Expenditures. Over the last 17 years, UCSF has spent an average of $310 million per year on capital construction projects.30 While detailed information on the location of supplies and equipment purchases is not available, Table 35 reports assumptions underpinning the estimated sales tax generated because of this expenditure. As shown, soft costs—which are typically spent on architects, legal fees, engineering, and other professional services—are excluded from the total leaving an estimated $201 million in hard construction costs. Of this amount, an estimated 60 percent is spent on supplies and materials.
30 For FY 2014-15, UCSF spent more than $500 million on capital construction projects. To avoid using a year’s data, which is not typical, the average annual expenditure on construction projects is used.
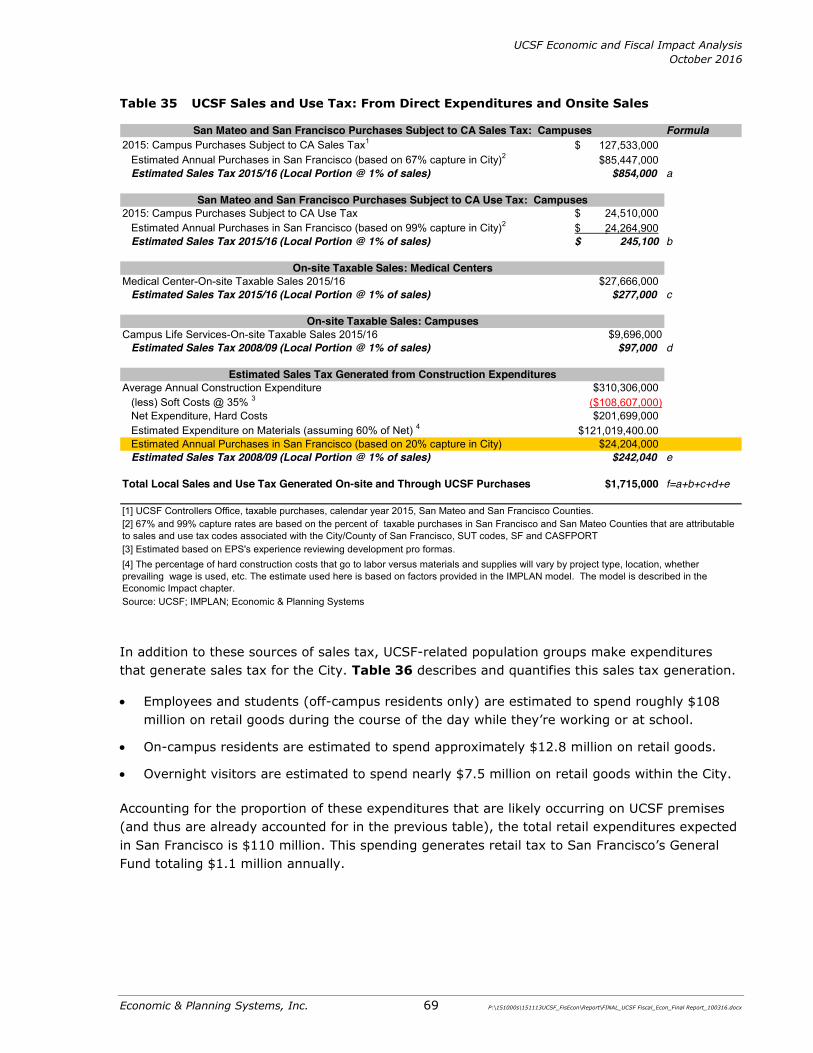
UCSF Economic and Fiscal Impact Analysis October 2016
Economic & Planning Systems, Inc. 69 P:\151000s\151113UCSF_FisEcon\Report\FINAL_UCSF Fiscal_Econ_Final Report_100316.docx
Table 35 UCSF Sales and Use Tax: From Direct Expenditures and Onsite Sales
In addition to these sources of sales tax, UCSF-related population groups make expenditures that generate sales tax for the City. Table 36 describes and quantifies this sales tax generation.
x Employees and students (off-campus residents only) are estimated to spend roughly $108 million on retail goods during the course of the day while they’re working or at school.
x On-campus residents are estimated to spend approximately $12.8 million on retail goods.
x Overnight visitors are estimated to spend nearly $7.5 million on retail goods within the City.
Accounting for the proportion of these expenditures that are likely occurring on UCSF premises (and thus are already accounted for in the previous table), the total retail expenditures expected in San Francisco is $110 million. This spending generates retail tax to San Francisco’s General Fund totaling $1.1 million annually.
Formula2015: Campus Purchases Subject to CA Sales Tax1 127,533,000$
Estimated Annual Purchases in San Francisco (based on 67% capture in City)2 $85,447,000Estimated Sales Tax 2015/16 (Local Portion @ 1% of sales) $854,000 a
2015: Campus Purchases Subject to CA Use Tax 24,510,000$ Estimated Annual Purchases in San Francisco (based on 99% capture in City)2 24,264,900$ Estimated Sales Tax 2015/16 (Local Portion @ 1% of sales) 245,100$ b
Medical Center-On-site Taxable Sales 2015/16 $27,666,000Estimated Sales Tax 2015/16 (Local Portion @ 1% of sales) $277,000 c
Campus Life Services-On-site Taxable Sales 2015/16 $9,696,000Estimated Sales Tax 2008/09 (Local Portion @ 1% of sales) $97,000 d
Average Annual Construction Expenditure $310,306,000(less) Soft Costs @ 35% 3 ($108,607,000)Net Expenditure, Hard Costs $201,699,000Estimated Expenditure on Materials (assuming 60% of Net) 4 $121,019,400.00Estimated Annual Purchases in San Francisco (based on 20% capture in City) $24,204,000Estimated Sales Tax 2008/09 (Local Portion @ 1% of sales) $242,040 e
Total Local Sales and Use Tax Generated On-site and Through UCSF Purchases $1,715,000 f=a+b+c+d+e
[3] Estimated based on EPS's experience reviewing development pro formas.
Source: UCSF; IMPLAN; Economic & Planning Systems
Estimated Sales Tax Generated from Construction Expenditures
[1] UCSF Controllers Office, taxable purchases, calendar year 2015, San Mateo and San Francisco Counties.
[4] The percentage of hard construction costs that go to labor versus materials and supplies will vary by project type, location, whether prevailing wage is used, etc. The estimate used here is based on factors provided in the IMPLAN model. The model is described in the Economic Impact chapter.
San Mateo and San Francisco Purchases Subject to CA Sales Tax: Campuses
On-site Taxable Sales: Medical Centers
On-site Taxable Sales: Campuses
San Mateo and San Francisco Purchases Subject to CA Use Tax: Campuses
[2] 67% and 99% capture rates are based on the percent of taxable purchases in San Francisco and San Mateo Counties that are attributable to sales and use tax codes associated with the City/County of San Francisco, SUT codes, SF and CASFPORT

UCSF Economic and Fiscal Impact Analysis October 2016
Economic & Planning Systems, Inc. 70 P:\151000s\151113UCSF_FisEcon\Report\FINAL_UCSF Fiscal_Econ_Final Report_100316.docx
Table 36 UCSF Sales and Use Tax: From Population Expenditures
Item Total
SALES TAX GENERATED FROM EMPLOYEES AND STUDENTS (Off-Campus student-residents only)Employees Number of Full-Time Employees 16,086Employee Exp. per Day 1 $25.00 per day
Annual Retail Generated by FT Employees 235 workdays/ year $94,505,000
Number of Part-Time Employees 8,057Employee Exp. per Day 1 $12.50 per day
Annual Retail Generated by Project PT Employees 118 workdays/ year $11,834,000Students (Off-Campus Residents)Number of Students 3,888Employee Exp. per Day 1 $12.50 per day
Annual Retail Generated by Students (off-campus residents only) 200 days at school/ year $9,720,000
Annual Retail Sales Generated by Employees + Off-Campus Students (daytime only)(less) Capture of Sales by On-Campus vendors $116,059,000Less Sales Counted in Accounting of UCSF's On-site Sales 2 -$9,696,000San Francisco Capture Rate 3 85% of sales $106,363,000
Subtotal: Annual Retail Sales Generated by Employees + Off-Campus Students $90,410,000
SALES TAX GENERATED FROM UCSF ON-CAMPUS RESIDENTSHouseholds (occupied units) 934
Typical Rent (1-2 bedroom at UCSF) 4 $1,663 per unit/month $20,000Average HH Income 33% of income on rent $60,600Average HH Taxable Retail Exp. 5 30% $18,200% of Expenditures Captured in San Francisco (per household) 75% $13,700Total Household Expenditure on Retail in San Francisco $12,796,000
Less Sales Counted in Accounting of UCSF's On-site Sales -$969,600Subtotal: Annual Retail Sales Generated by On-Campus Households $11,826,400
VISITOR RETAIL EXPENDITURESConference Attendees and Visitors to Hospital Patients-Days in SF 6 190,362 per year
Taxable Expenditure per Day 7 $58 per day $11,041,000(less) Capture of Sales by On-Campus and Medical Center vendors -$2,766,600San Francisco Capture Rate 90% of sales $7,447,000
Outpatient Visitors 1,149,883 per yearTaxable Expenditure per Outpatient Visitor $10 avg. per visitor $11,499,000(less) Outpatients that are San Francisco Residents 547,945 per year -$5,479,000Subtotal: Outpatient Visitor Spending $6,020,000
Subtotal: Visitor Retail Expenditures $13,467,000
Total Taxable Retail Sales Estimated to be Captured in San Francisco $109,683,000Total Annual Sales Tax 1% $1,097,000
[4] UCSF Housing Status Report May 31, 2016.[5] Estimated from the U.S. Bureau of Labor Statistics data on household expenditure patterns.
[7] Based on EPS Research from 2009, escalated to 2015 dollars.
Source: International Council of Shopping Centers - Office Worker Retail Spending Patterns Survey; UCSF Campus Life Services; Bureau of Labor Statistics; EPS
Assumptions
[2] The majority of all sales generated at on-campus retail outlets is expected to be due to employee and student expenditures and is therefore deducted from this calculation to avoid double-counting of student/employee expenditure.
[1] ICSC Research in 2012, inflated to 2015 dollars.
[6] See Table 38 for detail on the number of days UCSF-related visitors are expected to spend in San Francisco each year.
[3] A large proportion of spending made during the work or school day are expected to be captured in San Francisco's jurisdiction. This is due to the availability of retail outlets in the City (i.e., no need to travel outside the City to procure retail goods) and due to limited time workers likely have to shop during the day, limiting travel-distances to shop.

UCSF Economic and Fiscal Impact Analysis October 2016
Economic & Planning Systems, Inc. 71 P:\151000s\151113UCSF_FisEcon\Report\FINAL_UCSF Fiscal_Econ_Final Report_100316.docx
Hotel Tax
Hotel taxes are levied on hotel rooms in San Francisco equal to 15.5 percent of the room rate. UCSF generates hotel taxes by attracting two key types of visitors to the City: conference attendees and visitors to hospital inpatients. In part because of its specialized health care services and reputation, UCSF hospitals handle a significant number of hospital patients from outside San Francisco and California. In 2014, UCSF medical centers admitted about 28,000 inpatients and those patients spent almost 180,000 days in the hospital. Approximately 27 percent of these inpatients reported a home address outside of the Bay Area. Using this information and assumptions on proportion of inpatient days with a visitor as well as average length of stay, EPS was able to estimate total visitor nights resulting from UCSF’s hospital operations. Additionally, data provided on UCSF conference attendance coupled with estimates of out-of-town conference attendees allowed EPS to estimate total number of hotel nights resulting from conferences at UCSF.
Also estimated is the number of out-of-town attendees to UCSF conferences. Estimates indicate that out-of-town attendees to UCSF conferences spent roughly 62,000 nights in San Francisco. After making adjustments for some attendees staying in private homes, other lodging arrangements, or outside the City, the estimated number of hotel-room nights from conferences totals nearly 50,000.
Table 37 UCSF Hotel Tax Revenue Estimate
Item Total
Visitors to Hospital PatientsSan
Francisco Other Bay Area Other CaliforniaOutside
CaliforniaNumber of Cases (Inpatients) [1] 10,434 10,024 7,450 27,900Days [1] 52,332 63,740 61,373 0 177,400Average Length of Stay [1] 5.02 6.36 8.24 6.03 6.36Proportion of Days with Visitors [2] 75% 50% 25% 20% 86,500Proportion of Visitor-Nights in Hotel [2] 5% 5% 60% 80% 2
Visitor-Days in Hotel 1,962 1,593 9,206 0 12,800
Conference Attendees
Total Attendees Out-of-Town Attendees
Length of Stay
103,862 20,772 3Total Nights Spent in SF for Conference [3] 62,300Visitor-Nights in Hotel assuming 80% of nights spent in hotel in San Francisco [4] 49,800
Hospital Visitors + Conference VisitorsTotal Room-Nights 62,600 Daily Hotel Room Revenue $231 / room / night [5] $14,461,000
TOT Rate of 15.5% of room revenues $2,241,000
% of Hotel Tax to General Fund (70%) $1,569,000$672,300
[3] Data for conference atendees provided by UCSF
Inpatients' Home Address
Assumptions/ Factors
Calculation of Hotel Tax
[2] Proportions of the number of days inpatients receive visitors and the number of days visitors may spend in a hotel are estimated by EPS based on the inpatients residential location.
[1] Data for inpatients provided by UCSF
[4] EPS assumption, assumes a portion of attendees may stay in town with friends or family. [5] Based on San Francisco Travel Association Fact Sheet, 2014 figureSource: UCSF; 2003 Fiscal and Economic Impact Analysis of UCSF; San Francisco Conventions and Visitors Bureau
*Note: This methodology does not capture faculty visiting from other UC Campuses or other visitor categoires that are not shown within this table, thus this reflects a conservative assumption of TOT revenue.

UCSF Economic and Fiscal Impact Analysis October 2016
Economic & Planning Systems, Inc. 72 P:\151000s\151113UCSF_FisEcon\Report\FINAL_UCSF Fiscal_Econ_Final Report_100316.docx
Parking Tax
San Francisco charges a 25 percent parking tax on parking revenue from off-street parking spaces, of which 60 percent of the collected revenue is directed into the City’s General Fund. UCSF’s population contributes to this tax during the course of their UCSF-related activities as people park their cars in non-UCSF garages and facilities during the work/school day. In addition to commuters, UCSF on-campus residents generate parking taxes when parking in San Francisco parking facilities for other activities.
Table 38 illustrates calculations for estimating parking tax. The proportion of commute trips and the location of commuter parking are derived from UCSF’s 2015 Transportation Survey of employees and students. As shown, only those commute trips in which individuals drove alone and parked in non-UCSF parking facilities are counted in the calculation (UCSF parking facilities are not subject to the tax). Commuters of this type are estimated to spend roughly $4.8 million per year for off-street parking. A similar calculation is shown for UCSF’s on-campus population. These individuals are estimated to use a non-UCSF parking facility once per week. Taken together, commuters and on-campus residents pay $6.3 million for off-street parking in San Francisco per year, generating roughly $956,000 in parking tax for San Francisco’s General Fund.
Telephone Users Tax
San Francisco’s service population generates telephone taxes by using these services and paying a tax for that usage. State entities and hospitals are among the various exemptions noted for this tax; therefore, UCSF does not generate this revenue. However, cell phone users are not exempt; thus UCSF’s residential population will generate revenues under this tax for the City. In this calculation, the proportion of the telephone tax revenue attributable to UCSF is UCSF’s residential population divided by the City’s full service population.
UCSF Economic and Fiscal Impact Analysis October 2016
Economic & Planning Systems, Inc. 73 P:\151000s\151113UCSF_FisEcon\Report\FINAL_UCSF Fiscal_Econ_Final Report_100316.docx
Table 38 UCSF Parking Tax Estimate
Other General Fund Revenue Sources
UCSF is exempt from, or has a negligible impact on, several other local tax accounts, including the water users’ tax and gas/steam/electric users’ tax. All other General Fund revenue sources are expected to be generated by UCSF on either a Service Population basis (notably, traffic fines for moving vehicle violations) or on a Residential per Capita basis.
A particular noteworthy revenue source in this category includes “Inter-governmental Transfers.” This includes General Fund revenues received from the state, and to a lesser extent federal or regional agencies, which are allocated on a formulaic basis that is generally proportional to local population (i.e. per capita). Prominent examples include Proposition 172 Public Safety funds and various aid programs such as food stamps (administered by the state). Consequently, UCSF’s contribution to this revenue source is based on the number of residents accommodated in UCSF housing.
Item Total
UCSF Commuters1
UCSF Employees and Students (Off-Campus Residents) 27,989Number of Days per Week Commuted 4.45Estimated Weeks per Year 47One-Way Commute Trips per Year 5,854,000% of Commute Trips: Drive Alone 32%% Parking at Non-UCSF Facility 13%Parking Days/Year at Non-UCSF Facility 241,000Avg. Daily Parking Rate2 $20
Parking Paid per Year (Commute) $4,820,000
UCSF Residential Population 1
On-Campus Population 1,496Assumed Days per Week Driving & Parking at Non-UCSF Facility 1Parking Days/Year at Non-UCSF Facility 77,792Avg. Daily Parking Rate2 $20
Parking Paid per Year (Residential Pop) $1,556,000
Total Parking Payments per Year $6,376,000Parking Tax Rate 25%Portion of Tax to General Fund 3 60%
Parking Tax to General Fund $956,000
[3] 40 percent of parking tax revenue is directed to San Francisco MTA.Sources: UCSF Transportation Survey (2015); SF Park; EPS
[1] All information related to mode of transit and the number of days commuting and parking in a non-UCSF facility are derived from UCSF's Transportation Survey (2015).[2] Avg. daily parking rate is a conservative assumption. According to data from SF Park average daily parking rates in San Francisco are above $27.00. This includes high priced areas such as San Francisco downtown.
UCSF Economic and Fiscal Impact Analysis October 2016
Economic & Planning Systems, Inc. 74 P:\151000s\151113UCSF_FisEcon\Report\FINAL_UCSF Fiscal_Econ_Final Report_100316.docx
Gener a l Fund Expend i t ur es A na lys i s
UCSF personnel and operations generate demands on public services across the spectrum of San Francisco’s departments. EPS has estimated the share of San Francisco’s General Fund expenditures by major service area (e.g., Public Safety, Public Works, Human Welfare) that are attributable to UCSF. Table 39 summarizes these costs and indicates the calculation method for each expenditure item. A case study has been performed to estimate the costs for fire, police, and MTA departments.

UCSF Economic and Fiscal Impact Analysis October 2016
Economic & Planning Systems, Inc. 75 P:\151000s\151113UCSF_FisEcon\Report\FINAL_UCSF Fiscal_Econ_Final Report_100316.docx
Table 39 San Francisco General Fund Costs; UCSF’s Impact
2014-15 (less) Charges Net 2014-15 Allocation Net CostsSan Francisco General Fund Expenditures - General Fund for Service General Fund Method Attributed toBy Major Service Area UCSF
($ millions) ($ millions) ($ millions) ($s)
Public ProtectionAdult Probation $16.8 $0.4 $16.4 Residential Capita $29,000Superior Court $32.0 $0.0 $32.0 Case Study $25,000District Attorney $42.3 $0.3 $42.0 Case Study $34,000Emergency Management $50.1 $0.5 $49.6 Service Population $662,000Fire $221.9 $48.3 $173.6 Case Study $1,239,000Juvenile Probation $31.7 $0.0 $31.6 Residential Capita $56,000Public Defender $30.0 $0.0 $30.0 Case Study $24,000Police $411.1 $5.9 $405.2 Case Study $321,000Sheriff $150.4 $1.4 $149.1 Case Study $119,000
Total: Public Protection $986.3 $56.8 $929.5 $2,509,000Public Works, Transportation, and Commerce
General Services Agency - Public Works $88.0 $14.4 $73.6 Service Population $982,000Economic & Workforce Development $20.1 $0.2 $19.9 Residential Capita $35,000Municipal Transportation Agency $247.9 $0.0 $247.9 Case Study $1,517,000
Total: Public Works $355.9 $14.6 $341.4 $2,534,000Human Welfare and Neighborhood Development
Children and Families CommissionChildren, Youth and Their Families $29.8 Residential Capita $53,000Human Services Agency $234.4 $1.3 $233.1 Residential Capita $412,000Human Rights $2.1 $0.0 $2.1 Residential Capita $4,000County Education Office $0.1 $0.0 $0.1 Residential Capita $205Department of the Status of Women $5.6 $0.0 $5.6 Residential Capita $10,000
Total: Human Welfare & Neighborhood Dev. $299.6 $1.3 $298.2 $479,000Community Health
Public Health $614.1 $62.7 $551.5 Negligible Impact $0Total: Public Health $614.1 $62.7 $551.5 $0
Culture and RecreationAsian Art Museum $8.8 $0.0 $8.8 Residential Capita $16,000Arts Commission $7.9 $0.8 $7.1 Residential Capita $12,000Fine Arts Museum $14.6 $0.0 $14.6 Residential Capita $26,000Public Library $61.6 Residential Capita $109,000Law Library $61.6 $0.0 $1.5 Residential Capita $3,000Recreation and Park $1.5 $19.3 $30.9 Residential Capita $55,000Academy of Sciences $50.2 $0.0 $4.5 Residential Capita $8,045
Total: Culture and Recreation $149.1 $20.1 $129.0 $229,000General Administration and Finance
General Services Agency-City Admin. $51.7 $3.5 $48.2 Residential Capita $85,000Assessor/Recorder $17.9 $2.8 $15.1 Residential Capita $27,000Board of Supervisors $13.0 $0.3 $12.7 Residential Capita $22,000City Attorney $10.6 $0.0 $10.6 Residential Capita $19,000Controller $12.0 $0.4 $11.6 Residential Capita $21,000City Planning $2.4 $31.7 $0.0 Residential Capita $0Civil Service Commission $0.8 $0.0 $0.8 Residential Capita $1,431Ethics $4.5 $0.0 $4.5 Residential Capita $8,000Human Resources $12.1 $0.0 $12.1 Residential Capita $21,000Health Service SystemRetirement SystemMayor $13.2 $0.0 $13.2 Residential Capita $23,000Elections $15.5 $0.1 $15.4 Residential Capita $27,000General Services Agency-Technology $2.4 $0.0 $2.4 Residential Capita $4,000Treasurer/ Tax Collector $25.6 $3.9 $21.7 Negligible Impact $0
Total: General Administration and Finance $181.6 $43.9 $137.7 $258,000SUBTOTAL $2,586.6 $199.3 $2,387.3 $6,009,000UCSF's % of Net General Fund Costs 0.01%
General City ResponsibilitiesTotal: General City Responsibilities 1 $668.6 $9.6 $659.1 0.2% based on GF % $1,300,000
Total: General Fund Uses $3,255.2 $208.8 $3,046.4 $7,309,000
[1] This departmental designation accounts for expenditures that are citywide including items like: payment of legal claims, retiree subsidies, and city employee health services administration. Because this is a citywide cost, UCSF is attributed its portion of costs based on the proportion of all General Fund costs attributed to it.
Source: City and County of San Francisco Annual Budget, General Fund Expenditures FY 2014/15; SF Open Book,
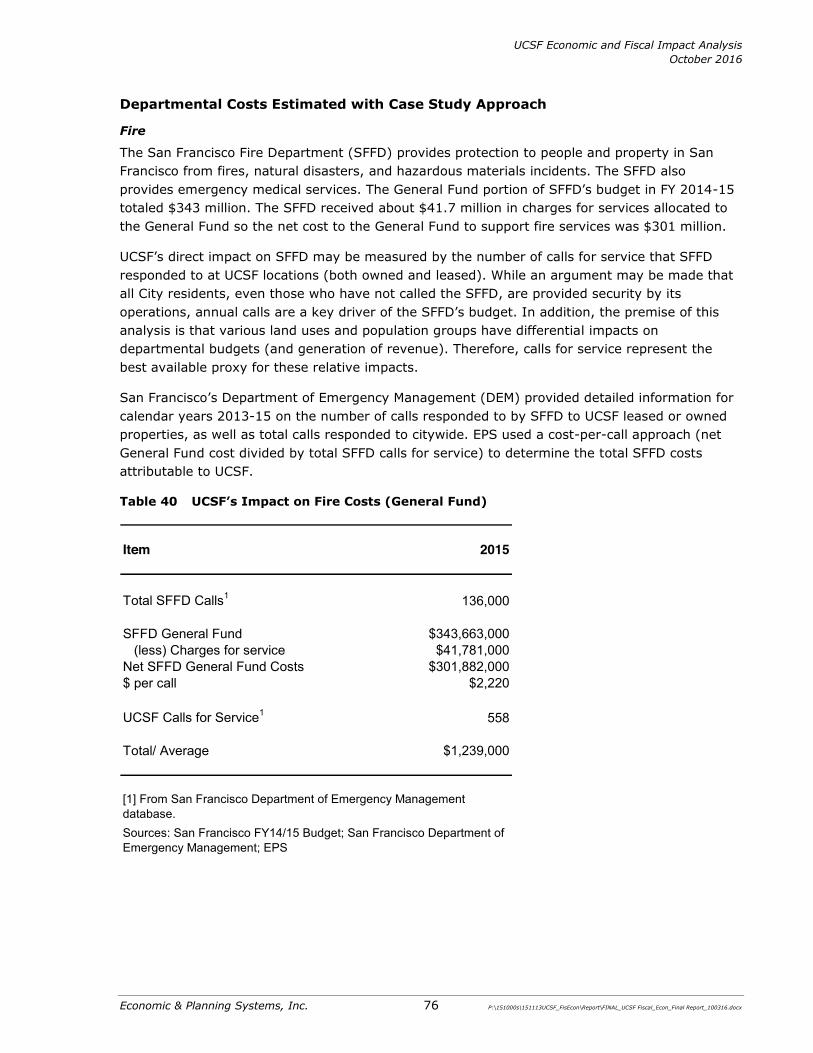
UCSF Economic and Fiscal Impact Analysis October 2016
Economic & Planning Systems, Inc. 76 P:\151000s\151113UCSF_FisEcon\Report\FINAL_UCSF Fiscal_Econ_Final Report_100316.docx
Departmental Costs Estimated with Case Study Approach
Fire
The San Francisco Fire Department (SFFD) provides protection to people and property in San Francisco from fires, natural disasters, and hazardous materials incidents. The SFFD also provides emergency medical services. The General Fund portion of SFFD’s budget in FY 2014-15 totaled $343 million. The SFFD received about $41.7 million in charges for services allocated to the General Fund so the net cost to the General Fund to support fire services was $301 million.
UCSF’s direct impact on SFFD may be measured by the number of calls for service that SFFD responded to at UCSF locations (both owned and leased). While an argument may be made that all City residents, even those who have not called the SFFD, are provided security by its operations, annual calls are a key driver of the SFFD’s budget. In addition, the premise of this analysis is that various land uses and population groups have differential impacts on departmental budgets (and generation of revenue). Therefore, calls for service represent the best available proxy for these relative impacts.
San Francisco’s Department of Emergency Management (DEM) provided detailed information for calendar years 2013-15 on the number of calls responded to by SFFD to UCSF leased or owned properties, as well as total calls responded to citywide. EPS used a cost-per-call approach (net General Fund cost divided by total SFFD calls for service) to determine the total SFFD costs attributable to UCSF.
Table 40 UCSF’s Impact on Fire Costs (General Fund)
Item 2015
Total SFFD Calls1 136,000
SFFD General Fund $343,663,000(less) Charges for service $41,781,000
Net SFFD General Fund Costs $301,882,000$ per call $2,220
UCSF Calls for Service1 558
Total/ Average $1,239,000
[1] From San Francisco Department of Emergency Management database. Sources: San Francisco FY14/15 Budget; San Francisco Department of Emergency Management; EPS
UCSF Economic and Fiscal Impact Analysis October 2016
Economic & Planning Systems, Inc. 77 P:\151000s\151113UCSF_FisEcon\Report\FINAL_UCSF Fiscal_Econ_Final Report_100316.docx
Police
The University of California Police Department (UCPD), provides primary patrol, investigation, crime prevention, emergency management, homeland security, and related law enforcement duties for the UCSF campus. While UCPD has law enforcement jurisdiction on-campus, the San Francisco Police Department (SFPD) responds to calls to non-campus, UCSF locations (e.g., leased space) and may occasionally respond to calls on-campus under a mutual aid agreement with UCPD. Likewise, UCPD occasionally responds to calls for service in public areas and other locations outside of its immediate jurisdiction. To determine UCSF’s annual burden to the SFPD’s General Fund costs, a cost per call methodology was used.
Table 41 provides documentation of SFPD and UCPD calls for services. As shown, SFPD responded to roughly 1 million calls for service in 2015, resulting in a net cost to the General Fund of about $400 per call. According to data provided by the DEM, SFPD responded to calls at UCSF addresses approximately 1,974 times in 2015. Conversely, UCPD responded to approximately 1,565 calls for service off-campus, areas that would normally be patrolled by SFPD. Thus, overall there are roughly 3,500 calls for service near UCSF facilities responded to by both departments. This analysis assumes that about two-thirds, or approximately 67 percent of these calls (2,400) can be attributable to UCSF-related activities and populations (e.g., students, employees and visitors). Given that UCPD responds to about 1,600 calls, SFPD responds to about 800 “net” calls for service, after crediting UCPD’s response to off-campus areas. This results in an estimated annual cost of about $321,000 for SFPD to serve UCSF locations.
Other Public Protection Departments
Although the UCPD is responsible for patrolling UCSF properties and investigating all crimes occurring therein, the City remains responsible for a number of public protection functions, including services provided by the District Attorney, Public Defender, Superior Court, and the Sheriff’s Department. Consequently, the City may still incur costs as a result of criminal activity occurring on UCSF property. These costs are estimated based on the proportion of UCSF calls-for-service relative to total citywide calls for service. Specifically, the City’s budgets for these departments are multiplied by the proportion of UCSF-related costs to determine the net amount attributable to UCSF.
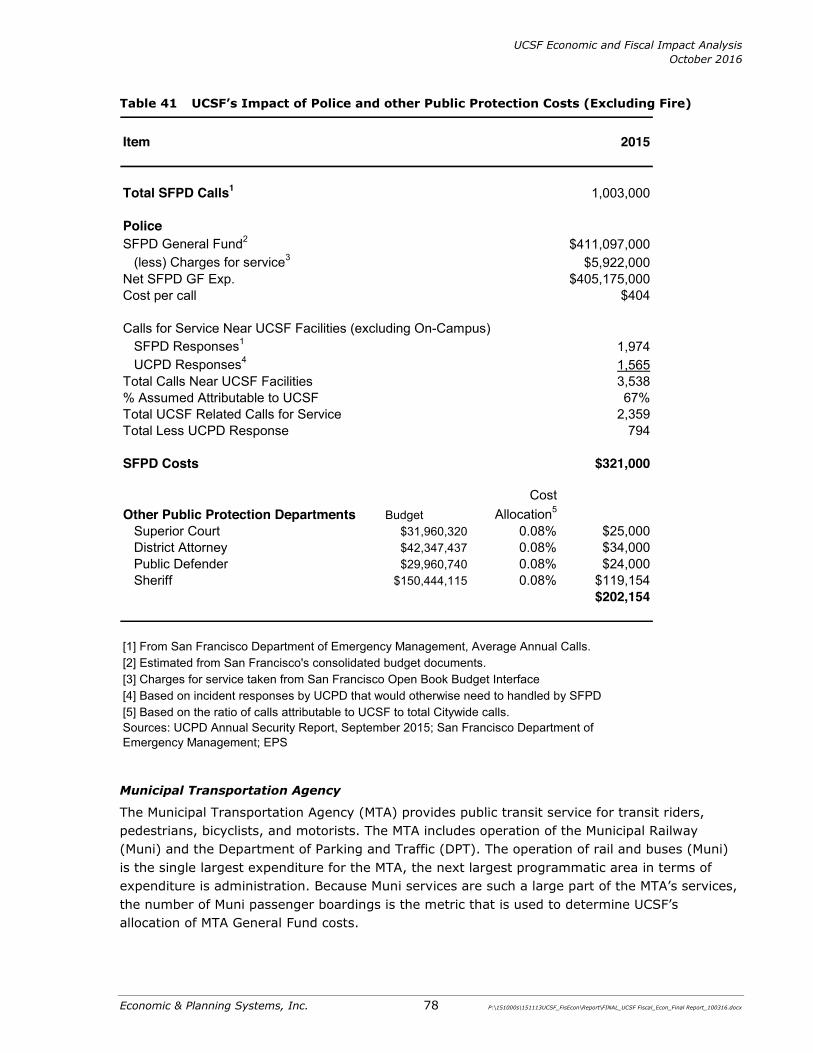
UCSF Economic and Fiscal Impact Analysis October 2016
Economic & Planning Systems, Inc. 78 P:\151000s\151113UCSF_FisEcon\Report\FINAL_UCSF Fiscal_Econ_Final Report_100316.docx
Table 41 UCSF’s Impact of Police and other Public Protection Costs (Excluding Fire)
Municipal Transportation Agency
The Municipal Transportation Agency (MTA) provides public transit service for transit riders, pedestrians, bicyclists, and motorists. The MTA includes operation of the Municipal Railway (Muni) and the Department of Parking and Traffic (DPT). The operation of rail and buses (Muni) is the single largest expenditure for the MTA, the next largest programmatic area in terms of expenditure is administration. Because Muni services are such a large part of the MTA’s services, the number of Muni passenger boardings is the metric that is used to determine UCSF’s allocation of MTA General Fund costs.
Item 2015
Total SFPD Calls1 1,003,000
PoliceSFPD General Fund2 $411,097,000
(less) Charges for service3 $5,922,000Net SFPD GF Exp. $405,175,000Cost per call $404
Calls for Service Near UCSF Facilities (excluding On-Campus)SFPD Responses1 1,974UCPD Responses4 1,565
Total Calls Near UCSF Facilities 3,538% Assumed Attributable to UCSF 67%Total UCSF Related Calls for Service 2,359Total Less UCPD Response 794
SFPD Costs $321,000
Other Public Protection Departments BudgetCost
Allocation5
Superior Court $31,960,320 0.08% $25,000District Attorney $42,347,437 0.08% $34,000Public Defender $29,960,740 0.08% $24,000Sheriff $150,444,115 0.08% $119,154
$202,154
[1] From San Francisco Department of Emergency Management, Average Annual Calls.[2] Estimated from San Francisco's consolidated budget documents. [3] Charges for service taken from San Francisco Open Book Budget Interface[4] Based on incident responses by UCPD that would otherwise need to handled by SFPD[5] Based on the ratio of calls attributable to UCSF to total Citywide calls.Sources: UCPD Annual Security Report, September 2015; San Francisco Department of Emergency Management; EPS
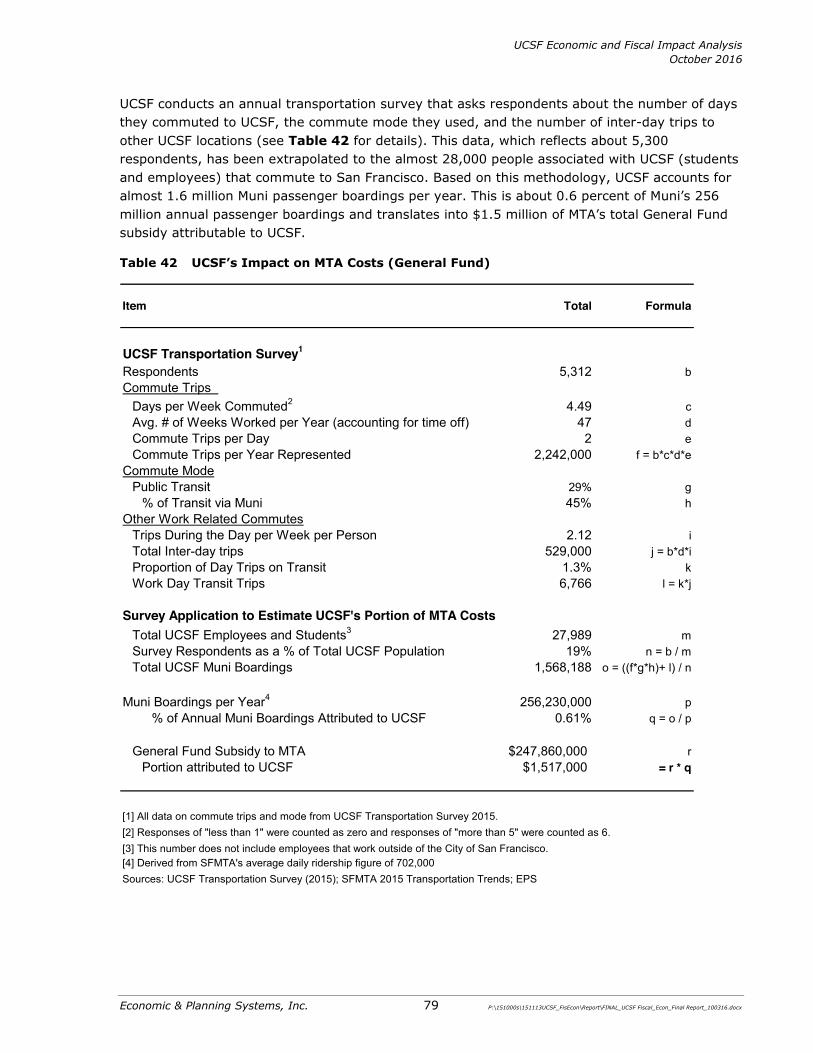
UCSF Economic and Fiscal Impact Analysis October 2016
Economic & Planning Systems, Inc. 79 P:\151000s\151113UCSF_FisEcon\Report\FINAL_UCSF Fiscal_Econ_Final Report_100316.docx
UCSF conducts an annual transportation survey that asks respondents about the number of days they commuted to UCSF, the commute mode they used, and the number of inter-day trips to other UCSF locations (see Table 42 for details). This data, which reflects about 5,300 respondents, has been extrapolated to the almost 28,000 people associated with UCSF (students and employees) that commute to San Francisco. Based on this methodology, UCSF accounts for almost 1.6 million Muni passenger boardings per year. This is about 0.6 percent of Muni’s 256 million annual passenger boardings and translates into $1.5 million of MTA’s total General Fund subsidy attributable to UCSF.
Table 42 UCSF’s Impact on MTA Costs (General Fund)
Item Total Formula
UCSF Transportation Survey1
Respondents 5,312 bCommute Trips
Days per Week Commuted2 4.49 cAvg. # of Weeks Worked per Year (accounting for time off) 47 dCommute Trips per Day 2 eCommute Trips per Year Represented 2,242,000 f = b*c*d*e
Commute ModePublic Transit 29% g
% of Transit via Muni 45% hOther Work Related Commutes
Trips During the Day per Week per Person 2.12 iTotal Inter-day trips 529,000 j = b*d*iProportion of Day Trips on Transit 1.3% kWork Day Transit Trips 6,766 l = k*j
Survey Application to Estimate UCSF's Portion of MTA CostsTotal UCSF Employees and Students3 27,989 mSurvey Respondents as a % of Total UCSF Population 19% n = b / mTotal UCSF Muni Boardings 1,568,188 o = ((f*g*h)+ l) / n
Muni Boardings per Year4 256,230,000 p% of Annual Muni Boardings Attributed to UCSF 0.61% q = o / p
General Fund Subsidy to MTA $247,860,000 rPortion attributed to UCSF $1,517,000 = r * q
[1] All data on commute trips and mode from UCSF Transportation Survey 2015. [2] Responses of "less than 1" were counted as zero and responses of "more than 5" were counted as 6.[3] This number does not include employees that work outside of the City of San Francisco.
Sources: UCSF Transportation Survey (2015); SFMTA 2015 Transportation Trends; EPS[4] Derived from SFMTA's average daily ridership figure of 702,000

UCSF Economic and Fiscal Impact Analysis October 2016
Economic & Planning Systems, Inc. 80 P:\151000s\151113UCSF_FisEcon\Report\FINAL_UCSF Fiscal_Econ_Final Report_100316.docx
Departmental Costs Estimated with Population-Based Approach
Service Population Basis
In this fiscal impact analysis, the only two budget items assigned a service-population-based approach are the Department of Public Works (DPW) and the Department of Emergency Management (DEM). The DPW cleans and maintains public roadways and public buildings in San Francisco while the DEM is responsible for dispatch and other public safety activities that generally serve both residents and employees. Residents, students, employees, and visitors all create demands on these services and an individual group’s relative impact on the City’s provision of these services cannot reasonably be evaluated. Therefore, UCSF’s proportion of San Francisco’s total Service Population is used to estimate its impact on these departments.
Residential per Capita Basis
Almost all other departments supported by the City’s General Fund have been evaluated to be primarily impacted by UCSF on-campus residential population, the only population for which the full range of costs and revenues are evaluated.31 These costs are allocated on a residential per-capita basis because these are largely functions directed by officials elected by county-residents (e.g., Board of Supervisors, Mayor, Assessor, etc.).
Negligible Impact Methodology
UCSF is estimated to have a negligible impact on the Community Health service area and the Treasurer/Tax Collector’s General Fund budget.
Community Health
San Francisco provides Community Health services that protect and promote the health of the community. UCSF provides health insurance coverage for its employees and students. In addition, UCSF serves the community with free or low-cost health services.
Given that UCSF provides insurance coverage for its affiliated-population and provides an array of community health programs, its impact on the General Fund costs are estimated to be negligible and is likely to be positive, with its community programs diverting clients who may otherwise have sought to use scarce City and County health services.
Treasurer/Tax Collector
UCSF’s largely tax-exempt status means that its impact on General Fund costs to run this department are estimated to be negligible.
General City Responsibilities
A variety of citywide costs fall under the budget designation of General City Responsibilities. This designation totaled $668 million in General Fund costs in FY 2014-15. This cost item is largely made up of subsidies to City retiree benefits. Because these costs are citywide in nature, the allocation of the general costs to UCSF is based on the estimated impact of UCSF on all other City departments. As shown in Table 39, total costs of all other departments attributed to UCSF totals to $6 million. This is roughly 0.2 percent of all General Fund expenditures. Therefore, UCSF’s portion of the General City Responsibility General Fund expenditure is $1.3 million.
31 The “full-range” of costs and revenues is defined as costs and revenues generated both as part of a person’s UCSF affiliation and as a part of a person’s private life.
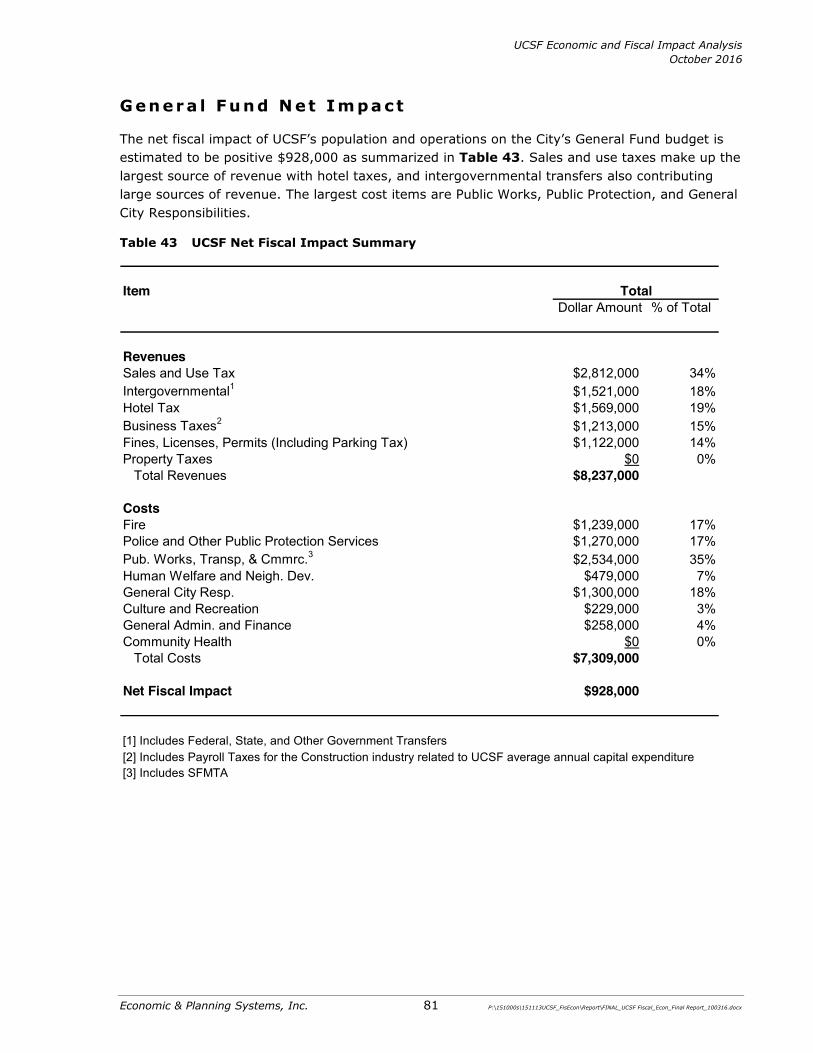
UCSF Economic and Fiscal Impact Analysis October 2016
Economic & Planning Systems, Inc. 81 P:\151000s\151113UCSF_FisEcon\Report\FINAL_UCSF Fiscal_Econ_Final Report_100316.docx
Gener a l Fund N et Impa ct
The net fiscal impact of UCSF’s population and operations on the City’s General Fund budget is estimated to be positive $928,000 as summarized in Table 43. Sales and use taxes make up the largest source of revenue with hotel taxes, and intergovernmental transfers also contributing large sources of revenue. The largest cost items are Public Works, Public Protection, and General City Responsibilities.
Table 43 UCSF Net Fiscal Impact Summary
ItemDollar Amount % of Total
RevenuesSales and Use Tax $2,812,000 34%Intergovernmental1 $1,521,000 18%Hotel Tax $1,569,000 19%Business Taxes2 $1,213,000 15%Fines, Licenses, Permits (Including Parking Tax) $1,122,000 14%Property Taxes $0 0%
Total Revenues $8,237,000
CostsFire $1,239,000 17%Police and Other Public Protection Services $1,270,000 17%Pub. Works, Transp, & Cmmrc.3 $2,534,000 35%Human Welfare and Neigh. Dev. $479,000 7%General City Resp. $1,300,000 18%Culture and Recreation $229,000 3%General Admin. and Finance $258,000 4%Community Health $0 0%
Total Costs $7,309,000
Net Fiscal Impact $928,000
[3] Includes SFMTA[2] Includes Payroll Taxes for the Construction industry related to UCSF average annual capital expenditure
Total
[1] Includes Federal, State, and Other Government Transfers

Economic & Planning Systems, Inc. 82 P:\151000s\151113UCSF_FisEcon\Report\FINAL_UCSF Fiscal_Econ_Final Report_100316.docx
8. OTHER UCSF FISCAL CONTRIBUTIONS
This chapter of the report summarizes UCSF’s one-time and ongoing contributions to support growth in San Francisco’s Mission Bay neighborhood. Mission Bay was historically divided into two redevelopment areas, managed by the San Francisco Redevelopment Agency (SFRA) that worked to advance the goals of affordable housing development and revitalization in Mission Bay. It is worth noting that since completion of the EPS 2010 UCSF Fiscal and Economic Impact Report, the State of California has abolished redevelopment agencies. While the SFRA has been dissolved, UCSF continues to contribute to public infrastructure and open space maintenance in Mission Bay through two Community Facility Districts (CFDs): CFD No. 6, which funds capital infrastructure improvements, and CFD No. 5, which funds ongoing maintenance of parks and open space. Each is described separately below. Due to the way in which UCSF’s Mission Bay campus was acquired in increments over time, certain areas of the campus are subject to the CFDs, as described in Table 44.
Table 44 Areas of UCSF Mission Bay Campus Subject to CFD Payments
Campus Area CFD No. 5 Open Space Maintenance CFD No. 6 Infrastructure Bond
North Campus (Blocks 14-25)
Not subject to CFD No. 5, but UC entered into Park Maintenance Fee Agreement to contribute to open space maintenance in Mission Bay at the same CFD No.5 rates as other property owners.
Not subject to CFD No. 6, but infrastructure fee negotiated with Master Developer.
South Campus (Blocks 36-39 and Block X-3)
Infrastructure fee negotiated with Master Developer.
Blocks 36-39 Subject to CFD fee Subject to CFD feeBlocks X-3 and WYL Not subject to CFD fee Not subject to CFD fee
East Campus (Blocks 33-34) Subject to CFD feeSubject to CFD fee and infrastructure fee was negotiated with Master Developer
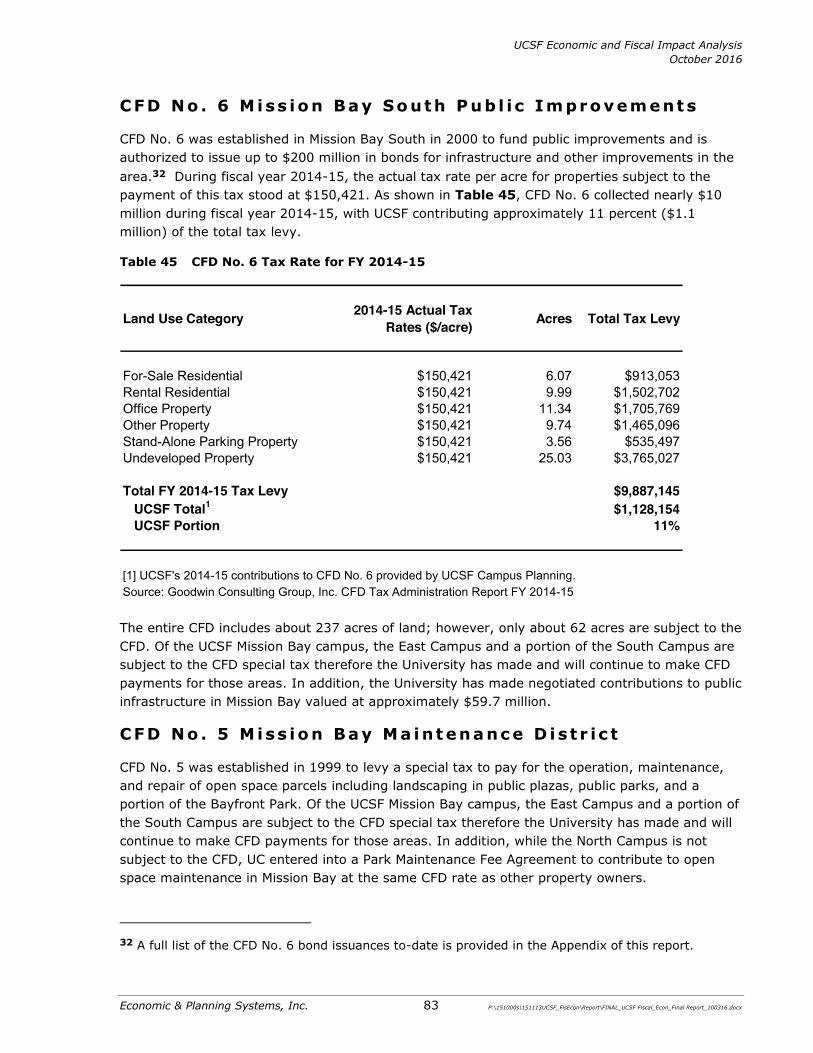
UCSF Economic and Fiscal Impact Analysis October 2016
Economic & Planning Systems, Inc. 83 P:\151000s\151113UCSF_FisEcon\Report\FINAL_UCSF Fiscal_Econ_Final Report_100316.docx
CFD No . 6 M iss io n Bay So uth Pub l i c Impro vement s
CFD No. 6 was established in Mission Bay South in 2000 to fund public improvements and is authorized to issue up to $200 million in bonds for infrastructure and other improvements in the area.32 During fiscal year 2014-15, the actual tax rate per acre for properties subject to the payment of this tax stood at $150,421. As shown in Table 45, CFD No. 6 collected nearly $10 million during fiscal year 2014-15, with UCSF contributing approximately 11 percent ($1.1 million) of the total tax levy.
Table 45 CFD No. 6 Tax Rate for FY 2014-15
The entire CFD includes about 237 acres of land; however, only about 62 acres are subject to the CFD. Of the UCSF Mission Bay campus, the East Campus and a portion of the South Campus are subject to the CFD special tax therefore the University has made and will continue to make CFD payments for those areas. In addition, the University has made negotiated contributions to public infrastructure in Mission Bay valued at approximately $59.7 million.
CFD No . 5 M iss io n Bay Ma int enance D i s t r i c t
CFD No. 5 was established in 1999 to levy a special tax to pay for the operation, maintenance, and repair of open space parcels including landscaping in public plazas, public parks, and a portion of the Bayfront Park. Of the UCSF Mission Bay campus, the East Campus and a portion of the South Campus are subject to the CFD special tax therefore the University has made and will continue to make CFD payments for those areas. In addition, while the North Campus is not subject to the CFD, UC entered into a Park Maintenance Fee Agreement to contribute to open space maintenance in Mission Bay at the same CFD rate as other property owners.
32 A full list of the CFD No. 6 bond issuances to-date is provided in the Appendix of this report.
Land Use Category 2014-15 Actual Tax Rates ($/acre) Acres Total Tax Levy
For-Sale Residential $150,421 6.07 $913,053Rental Residential $150,421 9.99 $1,502,702Office Property $150,421 11.34 $1,705,769Other Property $150,421 9.74 $1,465,096Stand-Alone Parking Property $150,421 3.56 $535,497Undeveloped Property $150,421 25.03 $3,765,027
Total FY 2014-15 Tax Levy $9,887,145UCSF Total1 $1,128,154UCSF Portion 11%
[1] UCSF's 2014-15 contributions to CFD No. 6 provided by UCSF Campus Planning.Source: Goodwin Consulting Group, Inc. CFD Tax Administration Report FY 2014-15
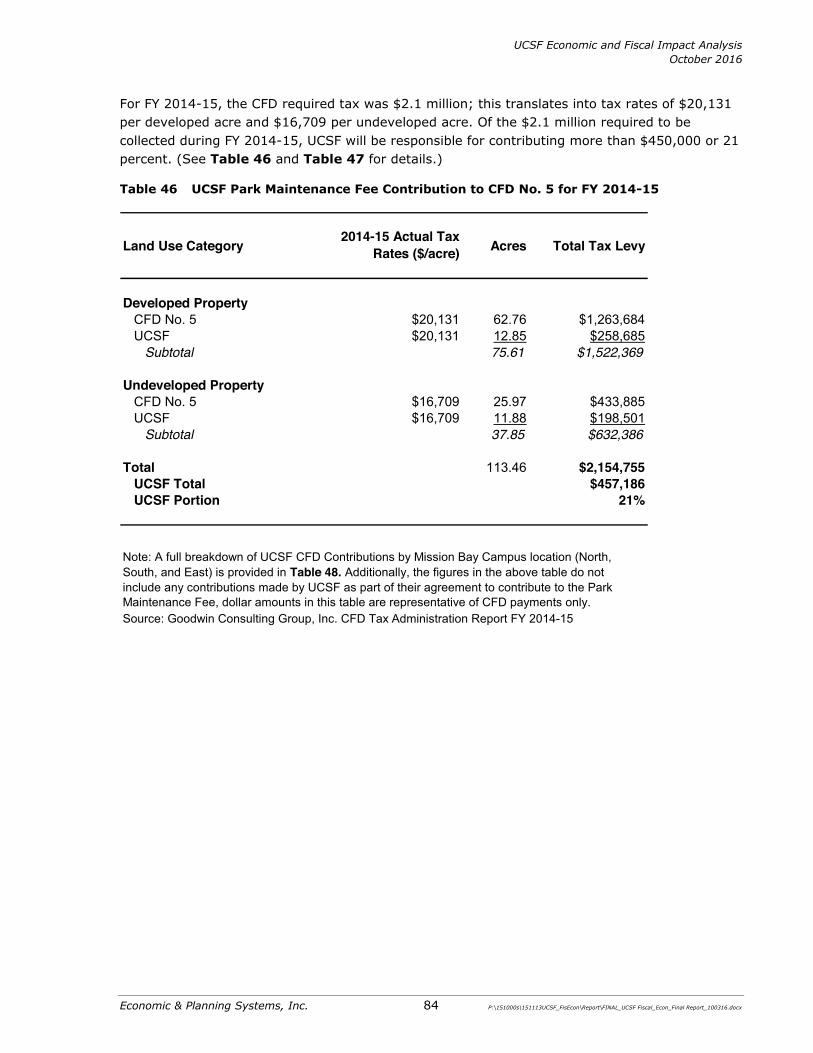
UCSF Economic and Fiscal Impact Analysis October 2016
Economic & Planning Systems, Inc. 84 P:\151000s\151113UCSF_FisEcon\Report\FINAL_UCSF Fiscal_Econ_Final Report_100316.docx
For FY 2014-15, the CFD required tax was $2.1 million; this translates into tax rates of $20,131 per developed acre and $16,709 per undeveloped acre. Of the $2.1 million required to be collected during FY 2014-15, UCSF will be responsible for contributing more than $450,000 or 21 percent. (See Table 46 and Table 47 for details.)
Table 46 UCSF Park Maintenance Fee Contribution to CFD No. 5 for FY 2014-15
Land Use Category 2014-15 Actual Tax Rates ($/acre) Acres Total Tax Levy
Developed Property CFD No. 5 $20,131 62.76 $1,263,684UCSF $20,131 12.85 $258,685
Subtotal 75.61 $1,522,369
Undeveloped Property CFD No. 5 $16,709 25.97 $433,885UCSF $16,709 11.88 $198,501
Subtotal 37.85 $632,386
Total 113.46 $2,154,755UCSF Total $457,186UCSF Portion 21%
Source: Goodwin Consulting Group, Inc. CFD Tax Administration Report FY 2014-15
Note: A full breakdown of UCSF CFD Contributions by Mission Bay Campus location (North, South, and East) is provided in Table 48. Additionally, the figures in the above table do not include any contributions made by UCSF as part of their agreement to contribute to the Park Maintenance Fee, dollar amounts in this table are representative of CFD payments only.
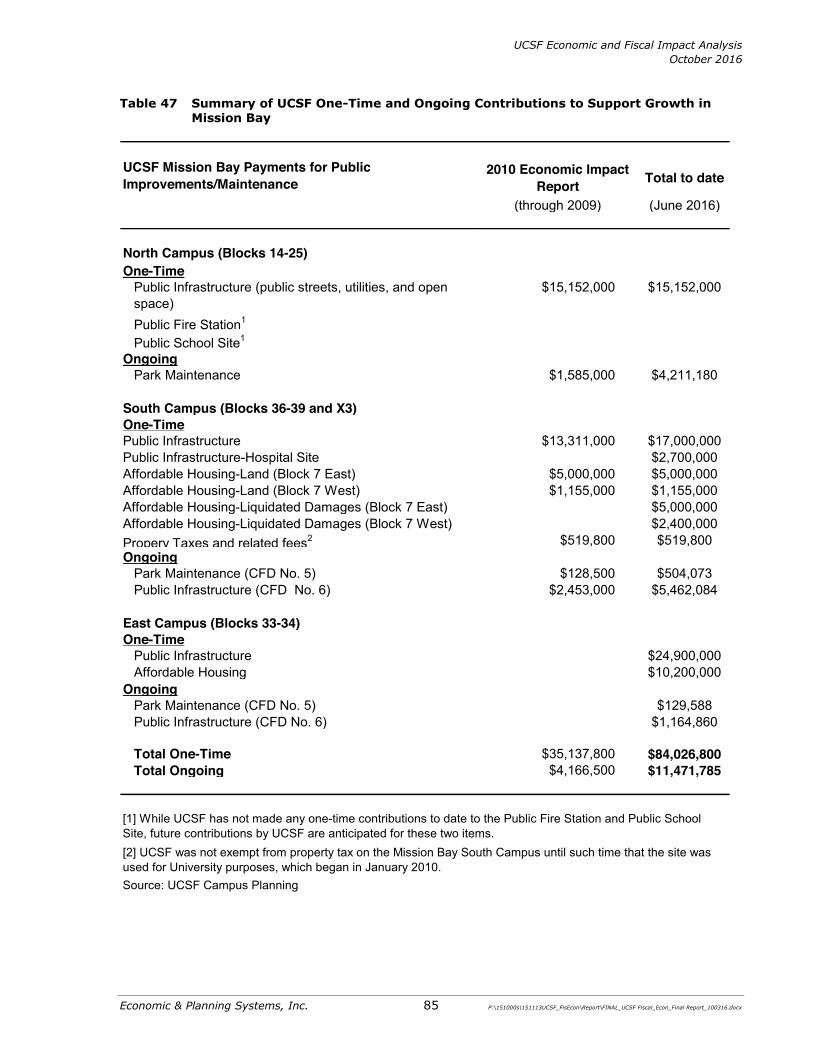
UCSF Economic and Fiscal Impact Analysis October 2016
Economic & Planning Systems, Inc. 85 P:\151000s\151113UCSF_FisEcon\Report\FINAL_UCSF Fiscal_Econ_Final Report_100316.docx
Table 47 Summary of UCSF One-Time and Ongoing Contributions to Support Growth in Mission Bay
UCSF Mission Bay Payments for Public Improvements/Maintenance
2010 Economic Impact Report Total to date
(through 2009) (June 2016)
North Campus (Blocks 14-25)One-Time
Public Infrastructure (public streets, utilities, and open space)
$15,152,000 $15,152,000
Public Fire Station1
Public School Site1
OngoingPark Maintenance $1,585,000 $4,211,180
South Campus (Blocks 36-39 and X3)One-TimePublic Infrastructure $13,311,000 $17,000,000Public Infrastructure-Hospital Site $2,700,000Affordable Housing-Land (Block 7 East) $5,000,000 $5,000,000Affordable Housing-Land (Block 7 West) $1,155,000 $1,155,000Affordable Housing-Liquidated Damages (Block 7 East) $5,000,000Affordable Housing-Liquidated Damages (Block 7 West) $2,400,000Propery Taxes and related fees2 $519,800 $519,800Ongoing
Park Maintenance (CFD No. 5) $128,500 $504,073Public Infrastructure (CFD No. 6) $2,453,000 $5,462,084
East Campus (Blocks 33-34)One-Time
Public Infrastructure $24,900,000Affordable Housing $10,200,000
OngoingPark Maintenance (CFD No. 5) $129,588Public Infrastructure (CFD No. 6) $1,164,860
Total One-Time $35,137,800 $84,026,800Total Ongoing $4,166,500 $11,471,785
Source: UCSF Campus Planning
[1] While UCSF has not made any one-time contributions to date to the Public Fire Station and Public School Site, future contributions by UCSF are anticipated for these two items. [2] UCSF was not exempt from property tax on the Mission Bay South Campus until such time that the site was used for University purposes, which began in January 2010.

UCSF Economic and Fiscal Impact Analysis October 2016
Economic & Planning Systems, Inc. 86 P:\151000s\151113UCSF_FisEcon\Report\FINAL_UCSF Fiscal_Econ_Final Report_100316.docx
Ot her Par ks and Open Space Co nt r ibut ions
In addition to the payments described above, UCSF has made other voluntary contributions to parks and open space within the vicinity of Mission Bay. These contributions, which are largely generated through the Green Parking Fund, have gone on to fund waterfront, greenway, open space, and community garden improvements. Table 48 below summarizes the magnitude and timing of these contributions.
Table 48 UCSF Contributions to Esprit Park and the Green Parking Fund
RECIPIENT AMOUNT YEAR(S)
Esprit Park $50,000 2007
Green Parking FundGreen Trust Central Waterfront $21,125 2007
Green Trust Central Waterfront $18,000 2008Green Trust Central Waterfront $19,335 2009
Green Trust Subtotal $58,460
Blue Greenway (SF Parks Trust) $12,635 2010
Blue Greenway (SF Parks Trust) $20,505 2011
Blue Greenway (SF Parks Trust) $32,615 2012Blue Greenway Subtotal $65,755
Green Trust & Blue Greenway Subtotal $124,215
Pennsylvania Gardens $13,035 2013
NoMAD Gardens $9,327 2014
Starr King Open Space $4,652 2015 split
Connecticut Friendship Gardens $4,652 2015 split
Green Parking Fund Subtotal $214,341
Source: UCSF Campus Planning

APPENDIX:
Supporting Tables

UCSF Economic and Fiscal Impact Analysis October 2016
Economic & Planning Systems, Inc. A-1 P:\151000s\151113UCSF_FisEcon\Report\FINAL_UCSF Fiscal_Econ_Final Report_100316.docx
Table A1 Distribution of UCSF Employees
Item Total Academic Hospital Total Academic Hospital
SMG & MSP 1,827 838.56 988.42 1,906 875 1,031
Academic Staff Academic Administrators 86 39.60 46.67 90 41 49 Regular Teaching Faculty - Ladder Ranks 461 211.62 249.44 481 221 260 Regular Teaching Faculty - Acting Ranks 2 0.88 1.04 2 1 1 Lecturers 1 0.44 0.52 1 0 1 Other Teaching Faculty 2,245 1,030.38 1,214.52 2,342 1,075 1,267 Student Assistants 1,945 892.68 1,052.20 2,029 931 1,098 Research 1,558 714.93 842.70 1,625 746 879 Librarian 9 3.96 4.67 9 4 5 Cooperative Extension University Extension Other Academic Personnel 23 10.56 12.45 24 11 13
Subtotal 6,329 2,905.04 3,424.19 6,603 3,031 3,572
Professional and Support StaffClerical 1,933 887.40 1,045.98 2,017 926 1,091 Communications-Arts & Graphics 80 36.52 43.04 83 38 45 Architecture, Engineering 68 31.24 36.82 71 33 38 Fiscal, Mgmt & Staff 3,246 1,489.70 1,755.92 3,386 1,554 1,832 Food & Linen 408 187.42 220.92 426 196 230 Health Care 7,460 3,424.19 4,036.12 7,783 3,572 4,211 Maintenance, Fabrication, & Operations 540 247.70 291.96 563 258 305 Protective Services 168 76.99 90.75 175 80 95 Sciences, Laboratory 839 384.96 453.76 875 402 473 Student Services 232 106.47 125.50 242 111 131 Other Other-Unknown 12 5.72 6.74 13 6 7
Subtotal 14,986 6,878.31 8,107.51 15,634 7,176 8,458
Total 23,142 10,621.91 12,520.12 24,143 11,081 13,062
Source: UCOP, Statistical Summary and Data on UC Students, Faculty, and Staff. October 2015.
San Francisco Nine-county Bay Area
[1] Class Title Outline (CTO) also referred to as Occupation Sub-Classification (OSC) used to group academic positions on the basis of teaching and academic function or program consideration

UCSF Economic and Fiscal Impact Analysis October 2016
Economic & Planning Systems, Inc. A-2 P:\151000s\151113UCSF_FisEcon\Report\FINAL_UCSF Fiscal_Econ_Final Report_100316.docx
Table A2 Annual Capital Expenditures
FY Mission Bay Other Location Total (Real Dollars)
Total (Nominal 2016 dollars)
98-99 $6,546,000 $69,979 $6,615,979 $10,071,62999-00 $29,989,000 $37,854,000 $67,843,000 $98,865,54800-01 $69,402,000 $37,754,000 $107,156,000 $148,178,86001-02 $132,747,000 $66,777,000 $199,524,000 $271,476,69602-03 $134,770,000 $87,224,000 $221,994,000 $296,820,89803-04 $138,052,000 $103,073,000 $241,125,000 $318,508,17404-05 $146,547,000 $71,248,000 $217,795,000 $282,155,73305-06 $63,700,000 $65,460,000 $129,160,000 $162,129,14006-07 $53,583,000 $86,420,000 $140,003,000 $170,169,53507-08 $121,629,000 $128,487,000 $250,116,000 $294,839,27908-09 $168,719,000 $154,915,000 $323,634,000 $378,735,21409-10 $409,789,000 $473,078,05210-11 $361,876,000 $407,166,70611-12 $444,421,000 $486,980,82512-13 $440,186,000 $471,763,23713-14 $504,108,000 $525,343,81314-15 $471,571,000 $478,917,070
Average $266,877,469 $310,305,906
Source: Data provided by UCSF Staff, UCSF General Ledger, Budget & Resource Management Division.

UCSF Economic and Fiscal Impact Analysis October 2016
Economic & Planning Systems, Inc. A-3 P:\151000s\151113UCSF_FisEcon\Report\FINAL_UCSF Fiscal_Econ_Final Report_100316.docx
Table A3 UCSF Retiree Compensation
Table A4 CFD No. 6 Bond Issuances To-Date
GeographyTotal
Compensation1Excluding Lump
Sum Cashouts Headcount
Alameda County $27,592,647 $24,431,322 621Contra Costa County $20,029,640 $17,672,635 497Marin County $54,672,168 $52,528,788 842Napa County $4,221,731 $4,012,128 140San Mateo $46,793,988 $40,437,128 996Santa Clara County $3,060,798 $2,998,130 90SF County $99,092,773 $92,767,491 2,312Solana County $2,193,294 $1,516,970 47Sonoma County $6,313,268 $6,200,905 169Total Bay Area $263,970,307 $242,565,497 5,714
[1] Includes lump sum cashouts as well as benefit payments Source: UCRP Benefits Paid for FY 2014-15
Item Value
Bond IssuancesSeries 2005 A & B $20,868,939Series 2013 A, B, & C $123,011,256
Total Bond Issuances $143,880,195
Source: Goodwin Consulting Group, Inc. CFD Tax Administration Report FY 2014-15

For more information, go to ucsf.edu/economic-impact
Related Documents