An Economic Analysis of Striped Bass, Steelhead, Chinook Salmon, Black Bass, Halibut, and Sturgeon Fishing in a 31 County Area of Northern California Prepared for California Department of Fish and Wildlife By The Program for Applied Research and Evaluation Office of Research and Sponsored Programs California State University, Chico Chico, California 95929-0201 April 2013

Welcome message from author
This document is posted to help you gain knowledge. Please leave a comment to let me know what you think about it! Share it to your friends and learn new things together.
Transcript
An Economic Analysis of Striped Bass, Steelhead, Chinook Salmon, Black Bass, Halibut, and Sturgeon Fishing
in a 31 County Area of Northern California
Prepared for
California Department of Fish and Wildlife
By
The Program for Applied Research and Evaluation Office of Research and Sponsored Programs
California State University, Chico Chico, California 95929-0201
April 2013

ii
iii
Table of Contents
Abstract . . . . . . . . . . . . . . . . . . . . . . . . . . . . . . . . . . . . . . . . . . . . . . . . . . . . . . iv Introduction and Methodology . . . . . . . . . . . . . . . . . . . . . . . . . . . . . . . . . . . 1 Literature Review . . . . . . . . . . . . . . . . . . . . . . . . . . . . . . . . . . . . . . . . . . . . . . 11 DFG Key Informant Interviews Report . . . . . . . . . . . . . . . . . . . . . . . . . . . . . 40 Angler Focus Group Report . . . . . . . . . . . . . . . . . . . . . . . . . . . . . . . . . . . . . 49 Equipment Sales, Marina Operators & Guides Focus Group Report . . . . 98 Summary of Findings from the Retailer Survey. . . . . . . . . . . . . . . . . . . . . . 156 Summary of Findings from the Angler Survey. . . . . . . . . . . . . . . . . . . . . . . 192 Estimated Expenditures of Bay Delta Complex Anglers. . . . . . . . . . . . . . . 230 Results of the CVM Analysis for Three Fish Species Found in the Bay Delta Complex. . . . . . . . . . . . . . . . . . . . . . . . . . . . . . . . 250 Economic Impact Analysis . . . . . . . . . . . . . . . . . . . . . . . . . . . . . . . . . . . . . . 258 Forecast of Fishing License Sales . . . . . . . . . . . . . . . . . . . . . . . . . . . . . . . . 272
iv
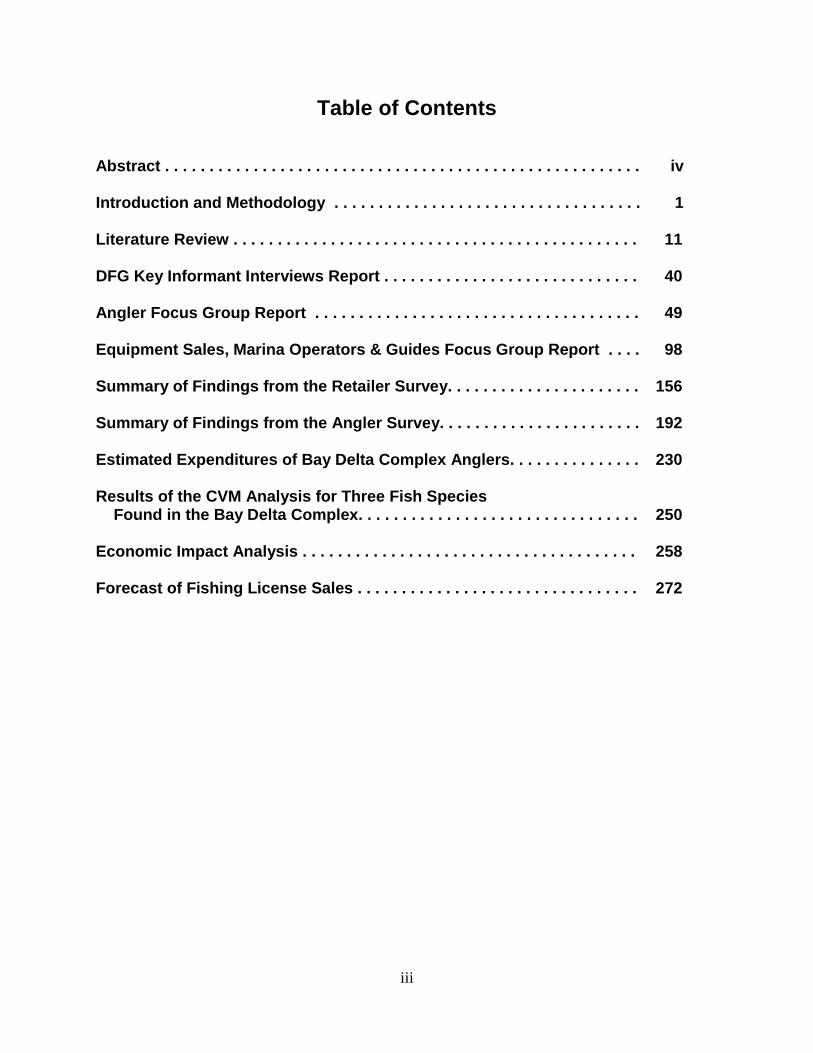
Abstract
The Program for Applied Research and Evaluation (ARE) at California State University, Chico conducted an economic analysis of the impact of fishing for Striped Bass, Steelhead, Black Bass, Halibut, Sturgeon and Chinook Salmon in a 31 county area that includes the Sacramento and San Joaquin River systems as well as the Bay Delta in northern California. This study was conducted for the California Department of Fish and Game (DFG). A literature review, key informant interviews with DFG staff, and a series of focus groups with anglers, fishing guides, and businesses that directly depend on fishing were conducted to develop questionnaires designed to collect economic impact data through telephone and mail surveys with owners and managers of fishing-related businesses (suppliers) and with anglers (consumers) who fish for one or more of the six species that were the focus of this study. A total of 1,780 anglers who said they had fished the Bay Delta at least one of the three years prior to this study completed the telephone survey. These anglers averaged fishing in the Bay Delta 28 days in 2007 and 26 days in 2008. Based on the expenditure data provided by the 500 anglers who responded to the expenditures mail survey and calculations of the weighted average spending per day, per angler expenditures totaled $146.91 per day. As a result of these direct expenditures and their subsequent multiplier effect, anglers create about 6,600 jobs, almost $270 million in labor income, $49 million in taxes, and almost $500 million in output income in the 31 county area.
1
INTRODUCTION AND METHODOLOGY
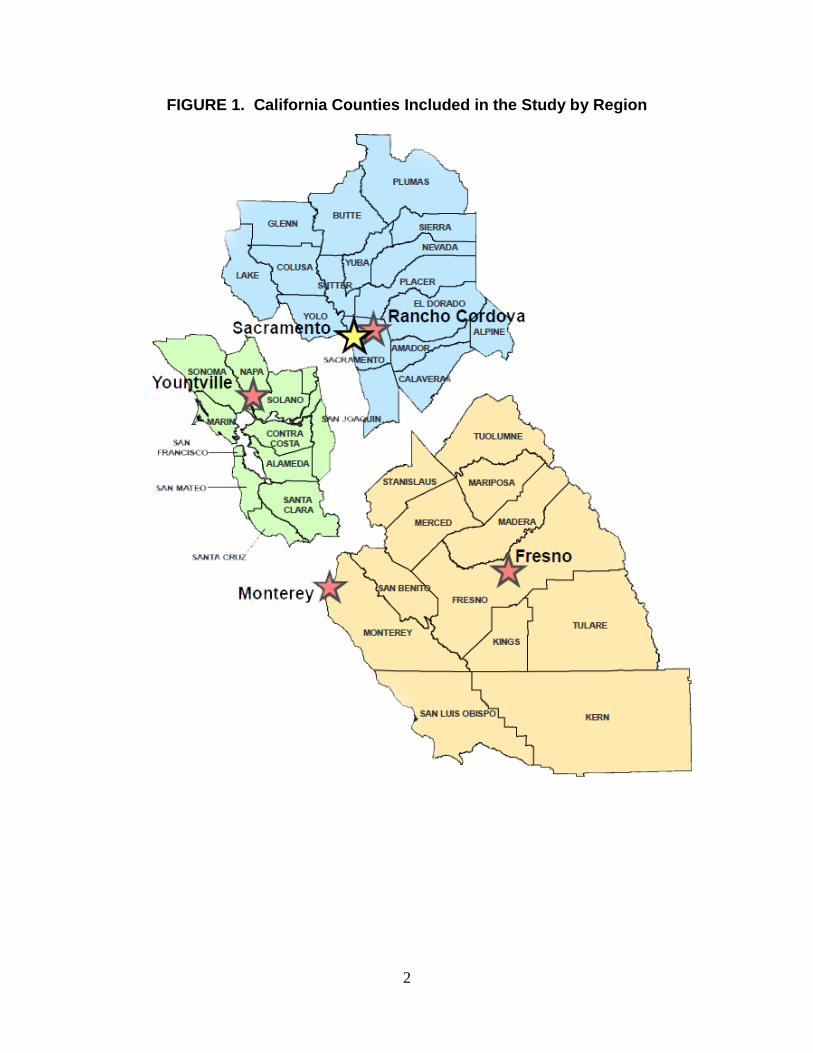
The Program for Applied Research and Evaluation (ARE) at California State University, Chico conducted an economic analysis of the impact of fishing for Striped Bass, Steelhead, Black Bass, Halibut, Sturgeon and Chinook Salmon in the Sacramento and San Joaquin River systems including the Bay Delta for the California Department of Fish and Game (DFG). More specifically, this research focused on three regions in the northern part of California: (1) the San Francisco Bay and its ocean environment including the areas just north of the entrance to the Bay and just south of the entrance to the Bay; (2) the Sacramento River watershed; and (3) the San Joaquin River watershed (see Figure 1). The study areas were broken down into counties for the purpose of the economic analysis, and then re-aggregated to estimate the regional effects of the economic factors studied. ARE included the following 31 California counties in this study:
Alameda Mariposa Solano Amador Merced Sonoma Butte Napa Stanislaus Calaveras Nevada Sutter Colusa Placer Tehama Contra Costa Plumas Trinity El Dorado Sacramento Tuolumne Glenn San Francisco Yolo Lake San Joaquin Yuba Madera San Mateo Marin Shasta
The study was segmented into five phases: (1) literature review and preparation; (2) survey development and implementation; (3) economic impact analysis; (4) forecast of fishing licenses and expenditures; and, (5) report preparation and formal presentation. In all of this work, from the literature review to the final presentations, ARE consulted with personnel designated by the DFG project manager about such topics as the literature review, focus groups and survey development, questionnaire design, data collection, economic impact analyses and statistical modeling. The following is a summary of each phase of the study. Each report produced for the five phases is included as an individual section in this report.
2
FIGURE 1. California Counties Included in the Study by Region
3
Phase One: Literature Review and Preparation In the three months following the contract initiation, ARE completed a literature review on the six species of fish that were the focus of this study. More specifically, literature on the topic of striped bass, steelhead and Chinook salmon within the study regions noted above and in other regions of the United States were reviewed and summarized. Particular attention was given to literature concerning angler behavior as well as economic impacts. ARE used 1983 as the starting date for the literature review in order to ensure complete coverage of literature published since the completion of the last study (Administrative Report No. 85-03). The literature reviewed all of the analytical work completed and published on California’s Striped Bass, Steelhead, Black Bass, Halibut, Sturgeon and Chinook Salmon up through the inception of the literature review process. The approach of the literature review was to organize and summarize the information on two dimensions: 1) the quality of the work being reported and 2) the conclusions from the work being reviewed. These procedures were designed to ensure that DFG gains a summary of the most relevant research that will help to inform the agency about critical policy issues related to maintenance of the fisheries and what is known regarding the impact of policy changes on the supply of the six species of fish. Hence, it was expected that this review would yield important information for the subsequent economic analysis as well as important information for the policy stakeholders in their future deliberations regarding fisheries policies. DFG has a good understanding of the available fisheries information other than economics. Therefore, this review more heavily focused on the economics and angler-behavior literature. Key informant interviews were also conducted with key DFG staff to obtain an overview of the analytical work and policy implications. In addition to the literature review, ARE planned and developed several surveys designed to collect information on spending behaviors and supply behaviors of the stakeholders in the population of licensed Striped Bass, Steelhead, Black Bass, Halibut, Sturgeon, and Chinook Salmon anglers. This entailed contacting representative lists of anglers, designing sampling frames for focus group participants and surveys, contacting potential focus group participants, preparing focus group questions and protocols, and designing draft survey questionnaires.
Phase Two: Survey Development and Implementation
The second phase of the project consisted of focus groups as well as mail and telephone surveys designed to collect data from anglers, guides, and retailers. This phase included (1) focus groups with fishing industry suppliers including guides and retailers; (2) focus groups with anglers; (3) surveys of suppliers of angling products and services; and (4) surveys of anglers.
4
FOCUS GROUPS Based on the findings from the literature review, ARE planned and conducted six focus groups consisting of 12 to 15 persons in each to develop points of discussion about the policies and problems of fishing, and to further develop and test survey questions. ARE, in close consultation with DFG, developed the focus group discussion topics and questions. A total of four focus groups with anglers who fish in the rivers and ocean from each of the three regions were conducted: (1) the San Francisco Bay and its ocean environment including the areas just north of the entrance to the Bay and just south of the entrance to the Bay; (2) the rivers flowing northward of Hetch-Hetchy into the Delta; and (3) the rivers flowing southward into the Delta area from Shasta Dam. In addition, two focus groups with suppliers (retailers, guides, marina operators, and other relevant stakeholder groups in the sports fishing industry from the study areas) were completed. Each focus group session was approximately three hours in length with a 15 minute break about halfway through the session. Incentives were offered to attract participants – food and refreshments together with a $50.00 per participant honorarium. Each of the six focus groups were conducted by Dr. Ruth Guzley, an experienced focus group facilitator, and recorded by two trained focus group recorders. SURVEYS Utilizing the findings from the literature review from phase one and the findings from the six focus groups, ARE consulted with DFG to construct a set of questionnaires that were utilized for the telephone and mail surveys. Two sets of questionnaires were developed and utilized: (1) questionnaires designed to obtain information from suppliers and (2) questionnaires designed to collect information from anglers. Survey of Fish and Game Policymakers (Key Informant Interviews) ARE completed key informant interviews with individuals in high-level resource agency and stakeholder organizations who help make or guide policy decisions by DFG. ARE consulted the DFG project manager to (1) determine who should be interviewed and (2) develop the key informant survey instrument. The purpose of these key informant interviews was to determine which issues policy makers consider to be most important at the time of the interviews, and to assess their attitudes regarding these issues. These were in-depth telephone interviews conducted by Dr. Frederica Shockley, one of the principal investigators for the study. Survey of Suppliers (Retailers, Marina Operators and Guides) ARE conducted a survey of suppliers of fishing goods and services to determine the amounts of expenditures they make for purchases outside the counties in the study area (i.e., economic leakages). A sampling frame for suppliers was developed by ARE
5
through (1) utilizing the list of licensed fishing guides published by the DFG, and (2) searching Yellow Pages and online listings of retailers, marinas, and other suppliers in the study regions. The list was compiled in Microsoft Excel and double checked to eliminate duplicate listings. ARE contacted and attempted to census all of the suppliers in the study regions and successfully completed interviews with a total of 250 suppliers in the 31counties. An initial telephone contact was attempted with each supplier prior to the survey through up to seven call attempts for each contact. The name of the contact person for the survey (owner or manager) was verified during this initial contact, and the preferred method of completing the survey (telephone or mail) was noted. If the contact person preferred to complete the survey by telephone, a date and time for the interview was set during the initial telephone contact. Up to seven (7) callbacks were made to attempt to complete the telephone surveys with the retailers who agreed to participate. Suppliers who said they preferred a mail questionnaire during the initial telephone contact were asked to provide their current mailing address and were informed of the expected date for mailing of the questionnaire. Follow-up telephone calls were made to each mail survey recipient seven to ten days after the initial mailing to verify they had received the questionnaire. Up to six additional telephone calls and follow-up mailings were made to each mail survey participant to encourage completion and return of the mail questionnaires, thus maximizing response rate for the survey. Surveys of Anglers
In 2004 when the initial study proposal was submitted to DFG, the proposed sampling frame for the surveys of anglers was to be the DFG list of anglers who had most recently purchased the licenses, stamps, and cards necessary to legally fish for Striped Bass, Steelhead, Black Bass, Halibut, Sturgeon and Chinook Salmon. However, DFG procedures for licensing changed after submission of the initial proposal and this licensing information was no longer available for assembly of a complete sampling frame in 2009. The principal investigators for the project investigated alternative sampling frames for anglers. The best sampling frame that was available at the time of the survey consisted of a compiled list of California residents who had expressed interest in angling in multiple statewide random digit dial (RDD) household surveys which was available through Survey Sampling International (SSI) of Shelton, Connecticut, the world's largest telephone sampling organization. Though the sampling frame may not have been as complete and targeted as a list of licensed anglers, it was the best quality sampling frame available at the time of the study. The sampling frame obtained from SSI required that ARE call through more than 27,000 telephone numbers to identify whether a person or persons in each household that was reached had fished for one or more of the six fish species in any of the three study areas. Those who said they had fished for one or more of the species were asked if they could be called back to conduct a telephone interview (survey) regarding their angling. Those who agreed to participate were asked their name and the best times to call back for the telephone interview.
6
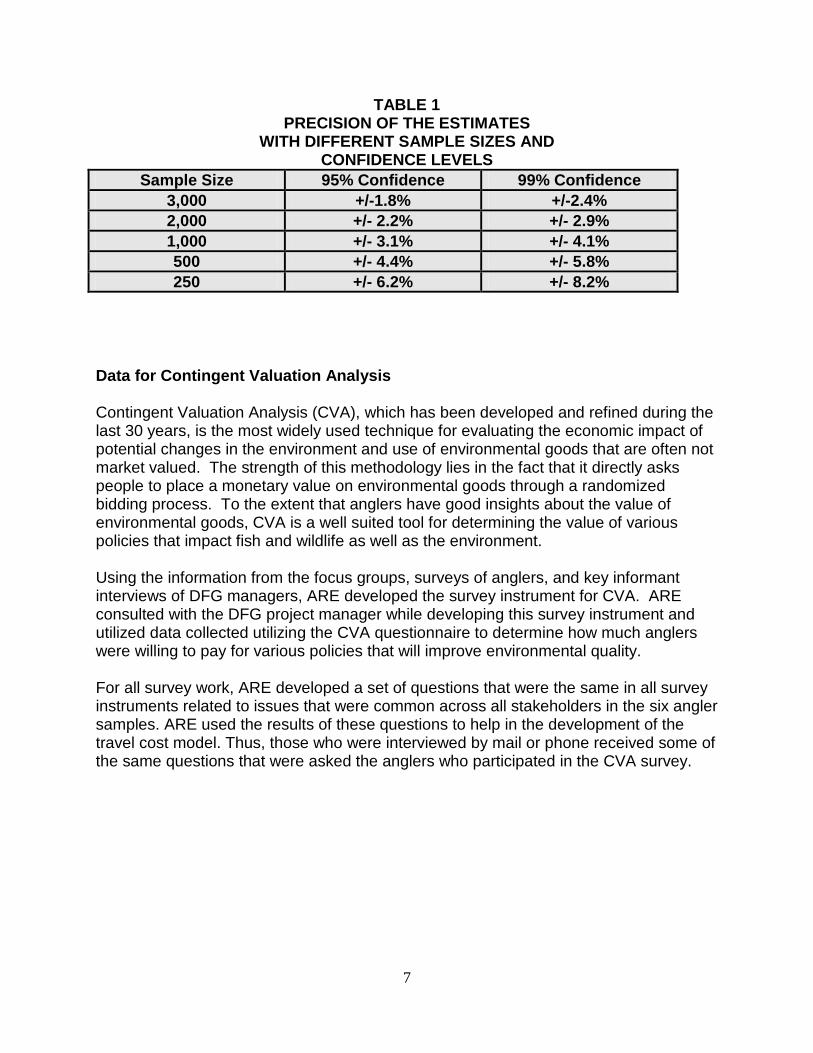
The overall target sample size for anglers was 3,000 completed interviews which was split into six groups of randomly selected anglers identified from the final sampling frame developed through the telephone screening discussed above. The sample was split into the following: (1) 500 salmon anglers who were surveyed regarding their frequency of angling for salmon, locations, success rates, expenditures, and opinions regarding regulations/policies, and demographics; (2) 500 striped bass anglers who were surveyed regarding their frequency of angling for striped bass, locations, success rates, expenditures, and opinions regarding regulations/policies, and demographics; (3) 500 steelhead anglers who were surveyed regarding their frequency of angling for steelhead, locations, success rates, expenditures, and opinions regarding regulations/policies and demographics; (4) 500 salmon anglers who were surveyed regarding their willingness to pay for salmon fishing opportunities utilizing the Contingent Valuation Analysis (CVA), together with questions that were comparable with the first group of salmon anglers (demographics, frequency of fishing, locations, and success rates); (5) 500 steelhead anglers who were surveyed regarding their willingness to pay for steelhead fishing opportunities using the Contingent Valuation Analysis (CVA), together with questions that were comparable with the first group of steelhead anglers (demographics, frequency of fishing, locations, and success rates); and, (6) 500 striped bass anglers who were surveyed regarding their willingness to pay for striped bass fishing opportunities utilizing the CVA, together with questions that are comparable with the first group of striped bass anglers (demographics, frequency of fishing, locations, and success rates). The first three groups were surveyed by telephone, while the second three groups who received the CVA questionnaire were initially contacted by telephone to determine their willingness to participate in the survey and to verify their current mailing address. The CVA groups were then mailed an information packet and called back by telephone to complete the survey. Up to seven telephone calls were attempted to reach each angler included in each of the six sub-samples and complete an interview. Table 1 shows the precision of the estimates for different sample sizes. It should be noted that estimates are more precise when larger samples are utilized. When the analyst uses smaller sub-samples in survey data, there is a loss of precision as shown in Table 1. The following is an example of the application of sampling error from Table 1. If one assumes a reader is interested in 95% confidence that the study sample represents the study population from which the sample was drawn and has obtained 500 responses on a group of anglers who express 50% support for a policy, the reader can be 95% sure the level of support for the policy among all anglers in the population group is between 45.6% and 54.4%.
7
TABLE 1 PRECISION OF THE ESTIMATES
WITH DIFFERENT SAMPLE SIZES AND CONFIDENCE LEVELS
Sample Size 95% Confidence 99% Confidence 3,000 +/-1.8% +/-2.4% 2,000 +/- 2.2% +/- 2.9% 1,000 +/- 3.1% +/- 4.1% 500 +/- 4.4% +/- 5.8% 250 +/- 6.2% +/- 8.2%
Data for Contingent Valuation Analysis Contingent Valuation Analysis (CVA), which has been developed and refined during the last 30 years, is the most widely used technique for evaluating the economic impact of potential changes in the environment and use of environmental goods that are often not market valued. The strength of this methodology lies in the fact that it directly asks people to place a monetary value on environmental goods through a randomized bidding process. To the extent that anglers have good insights about the value of environmental goods, CVA is a well suited tool for determining the value of various policies that impact fish and wildlife as well as the environment. Using the information from the focus groups, surveys of anglers, and key informant interviews of DFG managers, ARE developed the survey instrument for CVA. ARE consulted with the DFG project manager while developing this survey instrument and utilized data collected utilizing the CVA questionnaire to determine how much anglers were willing to pay for various policies that will improve environmental quality. For all survey work, ARE developed a set of questions that were the same in all survey instruments related to issues that were common across all stakeholders in the six angler samples. ARE used the results of these questions to help in the development of the travel cost model. Thus, those who were interviewed by mail or phone received some of the same questions that were asked the anglers who participated in the CVA survey.
8
Phase Three: Data Analysis ARE analyzed the data in the form of: 1) a standard set of tabulations for each of the questions across each of the surveys; 2) a set of analytical reports that illustrated spending behavior by specific categories on an annual basis; and, 3) a full report on the total amount of data collected which was integrated with the literature review. Sophisticated methods of analysis included factor analysis, logit (logistic regression) models, and other forms of data analysis were utilized. These methods are described in each section of this report. Economic Impact Analyses ARE utilized the data from Phase Two to run IMPLAN for estimating the impacts of the four different policy or regulatory alternatives in Phase Three. These alternatives were generated from a two-dimensional policy matrix that combined choices for the management of the resource and trends in licensee behavior and/or presence of fish in the environment. These combinations were derived from information about likely and potential future policies or regulations and trends in the supply of the fisheries resources. ARE utilized the travel cost model (TCM) to estimate the spending behaviors and retail sales estimates for the economic impacts on local economies by the retailers. In addition, ARE utilized county and city sales tax trends to estimate the patterns of change in spending in the specific sectors that ARE used to analyze the impacts. These policy matrices consist of information derived from interviews with Fish and Game Commission members, policy staff and others relevant to the development of policies and regulations for fishing in California. In order to measure the use value of the activity of fishing, ARE used a model that is frequently found in the literature on fishing, the travel cost model (TCM). ARE expected to develop this model with the following independent variables: age, income, location by zip code, frequencies of fishing in a year, length of experience fishing, expenditures related to the activities of fishing broken down by categories and amounts of expenditures, locations of expenditures, substitutability of the experience in other recreational activities, club memberships and other variables as ARE worked through the developments in the first phase of the project. However, average travel distances by anglers were too short to utilize in calculating economic impacts based on the TCM. However, the data collected through the interviews were utilized in calculating the IMPLAN estimates, since it served as the expenditure data for the input/output parts of the analyses.
ARE used the survey data that ARE collected in 2008-2009 to measure the economic impact of the striped bass, steelhead and the Chinook salmon in the counties of the three regions described in Phase 1. ARE only measured the impact sport fishing for Chinook salmon, Striped Bass, Steelhead, Black Bass, Halibut, Sturgeon. ARE
9
measured the impacts of all expenditures related to these activities made in the 31 county study area. ARE utilized IMPLAN to measure the economic impacts on jobs, income, and output. IMPLAN is an input-output model developed by the U. S. Department of Agriculture, Office of Emergency Services and the University of Minnesota, Department of Agricultural and Applied Economics. Input-output models are unique in that they are the only method of analysis that permits the researcher to determine the impact of a change in one industry on all other industries in the region. With the use of such models, it is possible to trace the impact of an initial (or primary) change in net expenditures through other industries in the economy to determine the ultimate change in industrial output, income and jobs within the region. IMPLAN generates estimates of other primary changes as well as secondary and tertiary changes. Primary impacts in an economy are the initial changes in spending for such items as fishing guides and boats. The primary changes in spending are like a snowball that someone starts rolling at the top of a hill. As the snowball rolls down the hill, it grows larger; as the primary effects ripple through the economy, output changes. Secondary impacts are caused by the primary changes in spending. They result when expanding or contracting businesses vary the purchase of supplies and services from other firms, causing production and jobs to change. For example, when a boat retailer sells more boats, the retailer may increase the expenditures for inputs such as electricity from the local utilities and workers from the local area. These changes cause the snowball to grow as it "rolls down the hill". Tertiary impacts result when workers' and property owners' spending varies in response to primary and secondary impacts. For example, retail workers hired to sell more boats may buy more medical services. The result will be increased production and more jobs in medical facilities. Thus, tertiary changes, as well as secondary changes, cause the snowball to grow as it rolls down the hill. ARE utilized IMPLAN to show changes in the number of jobs and the amount of income created in each existing industry when sport fishing changes as described above. IMPLAN contains the data that allows the researcher to estimate the average amount of inputs purchased from other industries for each one dollar increase in the new firm’s production. IMPLAN also contains the data needed to estimate the resulting change in consumer expenditures that will be generated when workers spend their additional income. Thus, ARE used IMPLAN to produce estimates of this “ripple effect.” More specifically, ARE measured the impacts of four changes to angling regulations or catchability. These change scenarios were developed in consultation with focus groups and the DFG project manager. ARE ignored impacts of people who fished without a license. ARE projected the economic impact on jobs, income, and output over a 5-year period the three sub-regions.
10
ARE utilized IMPLAN to analyze the impacts of recreational fishing for Striped Bass, Chinook Salmon, Steelhead, Halibut, Sturgeon, and Black Bass. ARE ran these four impacts for each of the three regions: (1) the San Francisco Bay and its ocean environment, including the areas just north of the entrance to the Bay and just south of the entrance to the Bay; (2) the Sacramento River watershed; and (3) the San Joaquin River watershed. This required 12 separate runs of IMPLAN, and using each run, ARE produced a table that shows the impacts on jobs, output, and income by industry in the region and a table that shows the impact on tax revenue within each region.
Phase Four: Forecast of Fishing Licenses and Expenditures
During Phase Four, ARE forecasted the number of fishing licenses that people will purchase at the current license fee and the amounts they will spend on fishing by using the exogenous variables to the fishing industry such as population change, inflation, personal disposable income in the state, and forecasted sales taxes by sector. All of this data came from the quarterly and annual forecasts of the Anderson School at U.C.L.A. and from the Board of Equalization, State of California. The Anderson School data was used to drive the equations that ARE utilized to forecast this information into the next five years using the extant data in the DFG and BoE. In addition, the data from the BoE was used to forecast revenue and tax yields in each of the areas being studied. All this data and analysis produced a report on the expected growth of fishing licenses and related expenditures into the next five years. In the following pages, individual sections are utilized to report findings from each of the four phases of this study. Appropriate supporting appendices are included at the end of each section.
11
LITERATURE REVIEW
A major objective of this study was to determine the economic impact of fishing in the study area and to determine angler’s preferences for various management scenarios of difference fish species. According to King and Mazzotta (2000), there are five objectives for measuring this impact. The first is to justify and decide how to allocate public spending on conservation, preservation, or restoration initiatives. The second is to consider the public’s values, and encourage public participation and support for environmental initiatives. The third is to compare the benefits of different projects or programs. The fourth is to prioritize conservation or restoration projects and the fifth is to maximize the environmental benefits per dollar spent. There are many methods that economists and other researchers have used to determine the economic impacts of a particular activity and/or the value individuals would put on different policy choices regarding ecosystem management. These methods include Market Price Methods, the Productivity Method, Contingent Valuation Methods, Contingent Choice Methods, the Travel Cost Method, and Input/Output models (King & Mazzotta, 2000). In the Productivity Model, value is assigned to products or services related to an ecosystem that result in commercially marketed goods. The method has been used by managers to determine the estimated value of different management actions (King & Mazzotta, 2000). For example, the method was used in the Peconic Estuary to put an economic value on various management actions that were being considered to stop the degradation of the estuary wetlands. Various scenarios were proposed involving changes in the amount of wetlands that would be protected. Respondents were told of the possible costs and benefits of each scenario in terms of the impact it would have on fish and bird production. The results helped managers understand the value stakeholders placed on the salt marshes and what stakeholders felt were the best levels of productivity of crabs, scallops, birds and hunting fowl (Opaluch, Grigalunas, Diamantides, Mazzotta, & Johnston, 1999). The most popular method that has been developed to measure respondents’ reactions to various proposed management scenarios is called the Contingent Valuation Model (CVM). This method asks respondents to state their willingness to pay for various scenarios that will affect the resources the respondents are using. It is considered a “stated preference model” since it is based on hypothetical situations and not actual behavior (King & Mazzotta, 2000). This method has been used widely by federal and state agencies to solicit public input into the decision making process (Barrens, Ganderton, & Silva, 1996.; J Loomis, 1995; J. Loomis & Feldman, 1995; Sorg & Loomis, 1986). The CVM was used by the Federal Energy Regulatory Commission to determine how much visitors to the falls would be willing to pay for increased overflow levels. The survey instrument included pictures of the falls at four different flow levels and a series
12
of valuation questions. The survey was mailed to a sample of previous visitors to the site. The key survey questions asked how much individuals would pay to visit the falls with each of the four flow levels depicted in the photos, and how many times they would visit each year at the four different flow levels. Results showed optimum flow levels. (J. Loomis & Feldman, 1995) The CVM has been used by federal and state agencies to help make policy decisions related to fish populations (J. Loomis, 1996; J. Loomis & Feldman, 1995)}. In the Four Corners region, resource managers created scenarios for local resident’s willingness to pay additional taxes to support critical habitat for nine species of fish that were listed as threatened or endangered. Money would pay for fish passageways, as well as bypass releases of water from dams to imitate natural water flows needed by fish. A contingent valuation survey was used to estimate the economic value for preserving the critical habitat. A sample of 800 households in the Four Corners Region was given 14 different amounts of additional taxes. Results showed the amount raised through taxes for a proposed special fund would far exceed the costs of doing what was necessary to provide the needed habitat (Barrens, et al., 1996.). Another example of CVM being used to help with management decisions regarding fish populations was a study to determine if residents in Washington would support the removal of dams that were blocking salmon migration routes. This policy change was proposed after additional fish species were being added to the Endangered Species list. The first two dams to receive a formal environmental impact analysis for removal were the Elwha and Glines dams on the Elwha River on the Olympic Peninsula in Washington. Neither has a fish ladder and both block migration of fish to spawning grounds in Olympic National Park. Although the cost to remove the dams was high, estimated at $100-125 million, it was estimated the removal of the dams would more than triple salmon populations on the Elwha River. CVM was used in the survey to determine if residents would be willing to pay enough to cover the costs of removing the dams. The results indicated that the willingness to pay far exceeded the cost of removing the dams (J. Loomis, 1996). Stoll and Ditton (2006) used the CVM method to estimate the net economic value (consumer’s surplus) of the bluefin tuna recreational fishing experience. The net value of this experience was the difference between the gross benefits received (total economic value) and the expenditures incurred to utilize the resource. CVM was used because competitive markets for bluefin tuna experiences in the study area were nonexistent. Two types of modeling were done: 1) an individual scenarios model, and 2) a pooled scenarios model. The responses to the scenarios were pooled into a common data set. Inferential techniques, such as travel costs, were judged inappropriate due to the unique nature of this experience, the possibility that trips were multipurpose, and the authors wanted to get information about alternative management scenarios not currently in use. Based on the results, the authors were able to conclude that different segments of anglers varied in their willingness to pay for less restrictive harvest scenarios.
13
A study by Loomis and King (1994) compared surveys of willingness to pay using either telephone or mail as methods for data collection. The primary objective of the study was to determine the extent to which there were mode effects in the two methods of data collection on several study items, including the use of the CVM. Mail non-response and item non-responses were higher, rejecting the null hypothesis on these issues, and finding that the mailed data collection forms were significantly higher in non-response. Sample frame had differences too. There were no differences in attitudes. However, the mail survey produced a higher salience level that might translate into differences in willingness to pay estimates. There were differences in recreation participation rates between the two survey methods. Mail surveys seemed to generate a larger and significant difference in the rate compared to telephone interviewing. The researchers found that two of the four tests on WTP were significantly different among the demographic, attitude and recreation activity measures. One conclusion of the authors was that a combination of mail and telephone modes of data collection might be beneficial. A variation of the CVM is called the contingent choice method. This method is also used to estimate economic values for virtually any ecosystem or environmental service. Respondents are asked to make tradeoffs among sets of ecosystem or environmental services or characteristics. Individuals are not directly asked for their willingness to pay for something as this is inferred from tradeoffs that include cost as an attribute (King & Mazzotta, 2000).
Another technique is the Travel Cost Method, which has been used since the 1950s. This technique estimates economic values associated with ecosystems or sites that are used for recreation. The method assumes that the value of a site is reflected in how much people are willing to pay to travel to visit the site. (King & Mazzotta, 2000).
Input/output models are also important tools that have been developed to estimate the total impact spending has in a particular area. Hushak, Morse and Arapku (Hushak, Morse, & Arapku, 1986) conducted a study using Input/Output models to determine the economic impact of fishing in Northern Ohio. The authors surveyed marine services and suppliers, charter boat suppliers and boat and bait dealers. Although the response rate was rather low, the authors concluded the model was adequate to determine the economic impact. Loomis (1996) combined CVM with IMPLAN, a more powerful input/output model then the version used by Hushak, et. al. (1986) to provide more accurate estimates of fishing impacts in a study he conducted in Wyoming and Idaho. Face-to-face surveys were used to collect data from a sample of 787 respondents in 11 areas in the state. The author estimated that a 100% increase in catch and 25% increase in size of the fish would yield significant changes in jobs and incomes for the region being studied. Loomis concluded that these were valuable tools used together.
14
Angler Behavior and Attitudes Towards Managing Fish Populations
Another objective of the literature review was to look at previous studies dealing with angler behavior and attitudes towards various fish management policies. A review of the literature found 11 representative studies that will be discussed here. Researchers have segmented angler behavior by sex (Schroeder et al., 2006), race (Hunt & Ditton, 2001), willingness to pay (Stoll & Ditton, 2006), consumptive behavior (Kyle, Norman, Jodice, Graefe, & Marsinko, 2007), angler specialization (Oh, Ditton, Anderson, Scott, & Stoll, 2005) and preferences (Oh & Ditton, 2006). Researchers have also looked at how anglers feel about different management policies, including catch and release (Cooke, Danylchuk, Danylchuk, Suski, & Goldberg, 2006; Cooke & Schramm, 2007; Hunt & Ditton, 2001), harvest restrictions (Oh & Ditton, 2006), and proposed regulations and policy changes (Ready, Epp, & Delavan, 2005; Schroeder, et al., 2006). These studies have focused on a wide variety of fishing groups, including those fishing for a specific population, e.g. red drum anglers in Texas (Oh & Ditton, 2006) or Blue Fin anglers off the coast of North Carolina (Stoll & Ditton, 2006). Several of the studies used fishing licenses databases as their sampling frame (Alberini, Zanatta, & Rosata, 2005; Hunt, Floyd, & Ditton, 2007; Oh & Ditton, 2006; Schroeder, et al., 2006). Other samples came from a local promotion agency (Kyle, et al., 2007), and a sample of individuals returning from charter and private boat fishing (Stoll & Ditton, 2006). One study was based on historical records (Ready, et al., 2005) and one of the studies used a meta-analysis of 21 previous studies (Cooke, et al., 2006). A number of the results have relevance for this study. For example, attitudes towards actual and proposed regulations and management policies appear to be related to the demographics, fishing consumption, and motivations of the anglers. As discussed earlier, Stoll (2006) wanted to understand anglers willingness-to-pay above the actual boat costs to support a policy that favored catch and release or a policy that prohibited the sale of what was caught. Although the angling success was very high among the anglers in his sample (nearly 90% of the anglers were on a boat that brought in at least one bluefin Tuna), anglers were divided into what were termed harvest-oriented anglers and non harvest-oriented anglers. Not surprising, the more harvest-oriented anglers supported the less restrictive policy scenarios. Schroeder (2006) focused on potential differences between men and women in terms of their motivations, ethics, involvement levels in fishing, and fishing behavior and whether these differences resulted in gender differences in attitudes towards fishing regulations. The results indicated men reported higher involvement with fishing, men rated developing skills and catching trophy fish as more important than women, and women rated catching fish for food higher than men. Men were more likely to agree with the ethics relating to catch and release programs. In terms of regulations, men were more likely to favor catch and release programs, additional fees for catching more fish, and to be in support of lower bag limits.
15
Ready (2005) looked at whether there was a difference between stated behavior and revealed behavior in predicting anglers purchases of licenses under a policy that would result in a 28% decrease in stocking trout. Two procedures were used to gather data. The first used an econometric analysis of historical license sales (revealed behavior). The second method was a telephone survey of trout anglers (stated behavior). The econometric analysis showed no relationship between stocking levels and angler participation. However, in the telephone survey, 11.5% of current trout anglers stated that the reduction in stocking would lead them to stop fishing for trout, including 3.2% who would stop fishing altogether. At all three levels of stock reduction, the anglers indicated it would not affect their enjoyment levels. The econometric model predicted that there would be an increase of 1.2% in license sales in 2002. Actual license sales in 2002 were 4.5% lower than in the previous year. The results indicated that stated behavior did a better job in predicting overall license sales and that anglers had a tendency to overstate their tendency to stop buying trout stamps, which goes against the assumption that past behavior is the best predictor of future behavior. However, the authors concluded that both methods have some utility in projecting changes in license sales. Two studies focusing on different anglers in Texas (Oh & Ditton, 2006; Oh, et al., 2005) found that levels of specialization had an impact on anglers’ views of regulations. In a study of red drum anglers (Oh & Ditton, 2006), the objective was to determine if there were differences among anglers segmented by their levels of specialization in terms of their preferences for management harvest restrictions. Using a stated preference choice modeling system, the researchers found that highly specialized anglers were more likely to prefer more restrictive regulations and less willing to relax the rules and regulations to assure that the resources and the experience remained available. Similar results were found among anglers at the Sam Rayburn Reservoir (Oh, et al., 2005). Three levels of specialization were created (casual, intermediate and advanced) based on their fishing preferences. The results once again showed that more specialized anglers were more likely to support conservation and sustainability measures. Although Hunt, Floyd and Ditton (Hunt, et al., 2007) were not looking specifically at attitudes towards policies and regulations, they did find that there were differences between African-American anglers and Anglo anglers in terms of their attitudes towards fishing. The results indicate that African-American anglers were more interested in catching larger numbers of fish and retaining the fish than did their Anglo angler counterparts. Although not asked directly as to what kind of policies they would favor, it would appear that African-American anglers would not be in favor of catch and release programs or policies aimed at restricting the levels of fish that could be harvested. Differences were also found between Hispanic and white anglers in a study by Hunt and Ditton (2001). Their objectives were to determine if 1) discrepancies occur between Hispanic and Anglo anglers and how service provision and development of educational programs could target Hispanic population segments; 2) Hispanic-Americans who have negotiated many of the structural and interpersonal constraints of participating in recreational fishing (as evident by their purchase of a fishing license) exhibited different
16
behavior from Anglo licensed anglers on five constructs related to the perceived benefits of recreational fishing; and, 3) differences found persisted after controlling for income levels, access to resources, and age. The results indicated that whites placed significantly greater importance on escaping individual stressors as a perceived benefit of recreational fishing. Whites placed significantly greater importance on benefits associated with being in a natural environment. There was no significant differences between the two on the interacting with fish construct. Hispanic-Americans did not place significantly greater importance on perceived benefits associated with interacting with fish. As predicted, Anglos placed significantly greater importance on escaping individual stressors and participating in a natural environment. Contrary to what was expected, Hispanics placed greater importance on achievement. In the study by Kyle et al. (2007), the objective was to segment anglers in South Carolina based on consumption orientation profiles. They found four profiles, the two largest were called the “Lots of Fish” segment and the second was designated the “Nothin” segment. The first segment represented about a third of the sample and was characterized by the desire to catch lots of fish, high motivation levels (except the social dimension), high involvement levels, and high levels of experience. The “Nothin” segment was characterized by their lack of concern for catching and consuming fish. Social interaction was the highest priority for this segment and they were most attached to the fishing area covered in the study and this group was the most likely to return to the area. Cooke and Schramm (2007) reviewed 21 presentations at a conference in Alaska on catch and release programs. They found that level of specialization has an impact on behavior relating to catch-and-release practices. For example, some anglers developed unhooking mats to hold large fish for being photographed. The symposium found that type of fishing, for example active versus passive fishing, has different impacts even when the same artificial baits were used. In some cases, conflict was found between anglers favoring and those opposed to catch-and-release programs. They concluded that due to variations in both fish and fishing techniques, it is difficult to make simple catch-and-release guidelines that would apply to different species and environments. For example, procedures to reduce stress and mortality of released fish will not work if too complicated or anglers are not willing to follow these procedures. While the previous study focused on one conference on catch and release programs, Cooke et al (2006) reviewed the previous research on this subject. The authors’ objective was to better understand whether catch-and-release angling could be compatible with Marine Protected Areas. The authors based their case study on the premise that fishing of any kind, including recreational fishing, has the potential to affect fish, fisheries, and aquatic environments negatively. They emphasized that the positive consequences of catch-and-release angling should also be considered, especially as it pertains to the economic viability and public acceptance of the Marine Protected Area. Their findings suggest that for Marine Protected Areas to be successful, they require community support. The authors recommended that educating anglers on proper fish handling and fostering an understanding of the importance of Marine Protected Areas to
17
fisheries conservation should be the first step in reducing the negative impacts of recreational fisheries. They also suggested that education should extend beyond those fishing in or near protected areas because Marine Protected Areas on their own are not sufficient for marine conservation. Albertini et al., (2005), based on their critique of other studies, which relied have estimated the impact of proposed policy changes by asking individuals to predict future demand based on hypothetical scenarios and then comparing this with actual demand under actual conditions, decided to use an approach that combined actual behavior with the CVM. Anglers were asked questions about hypothetical situations where prices and catch rates were changed based on their actual behavior. They found that the vast majority of respondents felt that pollution negatively influenced catch rates. The amount of fish caught was significantly associated with the number of fishing trips taken by participants. The results allowed the researchers to improve on their ability to improve the efficiency of their estimate of the trip demand function.
Striped Bass
Research has focused on many elements relating to black bass. Authors have looked at the impacts of PCBs on striped bass (Barnthouse, 2003), the impacts between striped bass rebuilding programs and other anadromous fish species (Grout, 2006), mercury levels in sport fish (J. A. Davis, Greenfield, B. K., Ichikawa, G., Stephenson, M., 2008), the impacts of catch and release programs (Millard, 2003), angler conflicts with fisheries management (Churchill, 2002), factors that constrain the growth of hybrid striped bass (Blackwell, 1998; Colt, 1984; Halbrendt), the relationship between environmental quality and fish occurrence (Coutant, 1987; Freyrer, 2007), methods to reduce the mortality of fish caught in trawls and seines (Dunning, 1989), and the economic impact of striped bass (Schorr, 1995). Barnthouse et al. (2003) evaluated impacts of polychlorinated biphenyls (PCBs) on striped bass reproduction. The New York State Department of Environmental Conservation (NYSDEC) has monitored concentrations of PCBs in adult striped bass regularly since 1976. The Hudson River utility industry and NYSDEC have monitored the abundance of young striped bass for most of this same period. The utility monitoring program includes river-wide sampling of striped bass eggs, larvae, and juveniles; data have been collected annually since 1974. Concentrations of PCBs in striped bass eggs would provide the most direct measures of toxicologically relevant exposures. However, because PCB levels in fish muscle tissue are correlated with levels in eggs, PCB concentrations measured in adult female striped bass muscle are appropriate surrogates for analyzing exposure trends over time. Because the purpose of this analysis was to evaluate impacts of PCBs on striped bass reproduction, the authors focused on data relating to spawning-aged female fish caught during spring (April-June) between the George Washington Bridge (river mile 11, the southernmost sampling location in the river) and Poughkeepsie (river mile 76, near the principal spawning grounds for striped bass). Results showed that, contrary to predictions derived from
18
previous studies, no noticeable changes in population parameters that may have been affected by PCBs occurred in the Hudson River striped bass population. Grout (2006) examined the interactions between striped bass rebuilding programs and other anadromous fish species in the East Coast of the USA. The study objective was to find a correlation between recovering striped bass populations and decreasing populations of other anadromous fish species such as Atlantic salmon. The decline in Atlantic salmon abundance occurred at the same time as the increase in striped bass abundance along the East Coast. With empirical evidence of striped bass predation on Atlantic salmon smolts, a statistical comparison of striped bass abundance with adult salmon returns from selected rivers in New England was conducted to determine if a correlation existed between the two trends. The author found that the correlation existed and the evidence suggested that the nearly tenfold increase in the coast-wide striped bass abundance had a negative effect on Atlantic salmon conservation and restoration efforts. Davis et al. (2008) focused on measuring the current levels of Hg in sport fish in the Sacramento-San Joaquin delta region in California. In 1999 and 2000, the “CALFED Mercury Project” was initiated to determine the magnitude and extent of the mercury (Hg) problem in the Delta. This project was started by the CALFED Bay-Delta Program, which is in charge of managing aquatic natural resources for the region. This project included a systematic and comprehensive evaluation of Hg contamination in sport fish from the Delta region. The objectives of this study were: 1. determine whether Hg occurs in sport fish at concentrations of potential human health concern in order to provide information needed to update consumption advisories; 2. establish present Hg concentrations in sport fish as a basis for assessing long-term trends; 3. evaluate spatial patterns in Hg accumulation at high trophic levels; and, 4. evaluate important factors influencing Hg concentrations such as fish age and size. Fish sampling focused on four primary target species: largemouth bass, white catfish, striped bass, and Sacramento pikeminnow. Sampling locations were selected to include known fishing areas and to provide broad geographic coverage. Fish were collected from 26 locations in the Delta region in September and October 1999 and 22 locations in September and October of 2000. The frequent incidence of fish tissue exceeding safe consumption guidelines, as well as evidence that low income and minority women consume local sport fish (Silver et al., 2007), suggest that mercury accumulation in sport fish in the Delta region is a human health concern. As a result of these findings and other recent studies, the State of California developed site-specific fish consumption advisories for the Delta and some surrounding tributaries. The objectives of the study by Millard et al. (2003) were to: (1) estimate the mortality associated with catch and release practices that commonly occur in the spring recreational striped bass fishery in the Hudson River; and, (2) assess the influence of selected variables on hooking mortality rates (playing and handling time, hook location, degree of bleeding, and fish length). Striped bass were caught with live bait on spinning gear, primarily via casting or drifting near the mouth of Catskill Creek and the Rip Van Winkle Bridge, at Catskill, New York. Volunteer recreational anglers were recruited on
19
the river between 11 and 14 May 1999 to provide angled fish and ensure that tackle and angling techniques were consistent with normal practice for the striped bass recreational fishery. After each striped bass was netted by the angler, the fish was transferred to a biologist’s boat where a uniquely numbered Floy T-bar anchor tag was inserted below the anterior portion of the dorsal fin; then fish were transported in aerated live wells to floating net pens anchored in the river. Bait type, degree of bleeding (bleeding profusely, slight bleeding, no bleeding), and location of hook (anterior to or posterior to gills) were recorded for each fish. Average playing time for angled striped bass was just over 5 minutes, with only 4 of the 47 treatment fish requiring more than 10 minutes to land. Control fish were captured by pulsed DC electric fishing. Control fish were transported and placed in the holding pens similar to treatment fish. Each holding pen contained an equal number of angled fish and control fish, with generally no more than 10 fish placed in each pen. Fish were held in pens for 5 days, after which time all fish were removed, measured, and recorded as being treatment or control, and alive or dead. The results suggest that mortality of fish released from catch and release fishing practices in the Hudson River may be a significant component of total mortality of striped bass and should be considered in any management of the fishery. The spring fishery targets relatively large spawning adults and these larger fish may have more difficulty recovering from the physiological stresses of capture and handling than smaller individuals. Results suggest that hooking mortality should be considered in future stock assessments of striped bass, provided information exists on the magnitude of the recreational fishery, particularly the rate of catch and release in the recreational fishery. Preliminary assessments of effort and associated catch and release rates should be conducted before this element of population mortality can be appropriately incorporated into stock assessments and subsequent management decisions. Churchill et al. (2002) chronicled the attempts by the Tennessee Wildlife Resources Agency (TWRA) and various angler groups to resolve a controversy surrounding the Norris Reservoir striped bass fishery. Striped bass were first stocked in Tennessee in 1964 in order to introduce a predator that could successfully control gizzard shad. Most Tennessee Wildlife Resources Agency fishery biologists and many anglers believed that the striped bass stocking program was an overwhelming success in Tennessee; however some anglers expressed concern over the stocking program in Norris Reservoir, believing that the decline of some native sport fish was due to the striped bass stocking programs at Norris. There was speculation that predation by striped bass on native sport fish was heavy and some anglers felt the state's emphasis on stocking striped bass came at the cost of maintaining stocks of native sport fish species. Many anglers thought striped bass predation on other sport fish species and direct competition for prey fish was the reason for the poor fishing. TWRA biologists disagreed with this position, stating that predation by striped bass on sport fishes was insignificant and the reasons for declining populations of bass and crappie were due to increasing fishing pressure and changes in trophic state. Conflicts between striped bass anglers and those opposed to the Norris striped bass program became commonplace and led to polarization in the local fishing community with both sides of the issue unwilling to compromise their respective demands. The authors described the inability of the agency
20
to justify its fishery management objectives for Norris Reservoir, resulting in loss of credibility among certain user groups. They also described how some Norris Reservoir stakeholders protested the perceived one-sided decisions by TWRA, leading to polarization of the local fishing community. Resolution of the conflict was only achieved after the agency incorporated a balanced advisory committee approach to fishery decision making. The authors conclude that the study and characterization of angler demographics and desires should be a regular, integral part of state fisheries management programs. Halbrendt et al. (1994) focused on identifying economic factors that potentially constrain the growth of the emerging hybrid striped bass (HSB) aquaculture industry. Specifically, the authors addressed the question of which production inputs and support services were essential to an aquaculture enterprise yet were not currently economically feasible given the current technologies and financial resources. The authors wanted to identify these items to help producers and policy makers remove economic barriers to the continued growth of the HSB aquaculture industry. A survey was conducted that was designed to get experts’ opinions on 32 essential production input and support services vital to the growth of four aquaculture industries. However, this study focused on HSB aquaculture rather than catfish, trout, and tilapia aquaculture because HSB was seen as an emerging industry. The targeted survey group was made up of aquaculture producers, academics, state and federal administrators and industry analysts from the U.S. Seventy-four people who were familiar with HSB culture ultimately agreed to participate in the survey. Of the 74 surveys mailed, 61 were returned. This study found that inputs specific to HSB production were more economically constraining than inputs currently used for other aquacultural enterprises. This study indicated that future aquacultural research efforts should emphasize economic, technological and regulatory factors. The objectives of the study conducted by Blackwell et al. were to (1) document whether salmon smolts contributed to the diet of striped bass in the tailrace of the Essex Dam on the Merrimack River in Lawrence, MA, (2) to identify evidence of injury to smolts prior to predation, (3) to determine the origin of smolts consumed by striped bass, and (4) to assess the contribution of smolts to the striped bass diet relative to other prey collected. This pilot study was done at the Essex Dam, the lowermost dam on the Merrimack River. Striped bass were captured by angling in the tailrace of Essex Dam using artificial lures that resembled smolts in color or shape. Scale samples, fork length in centimeters (cm), mass in kilograms (kg), and date of capture were recorded for each striped bass caught. Prey remains were collected from striped bass by gastric lavage by using a bilge pump. Prey remains were stored on ice when they arrived at the laboratory and were later identified using a reference collection of fish remains. Though there was no observed evidence of prior injury to smolts, internal injury and decreased predator avoidance behavior resulting from dam passage cannot be ruled out. Though the collected sample of striped bass was probably not representative of the entire population, this study provides the first evidence of striped bass predation on Atlantic salmon smolts during their river migration.
21
Colt (1984) looked at the relationship between dissolved-gas concentrations in the Sacramento-San Joaquin Delta to the health of fish in this region. Gas super-saturation was measured with an ES-2 “Weiss Saturometer” that was immersed into the water, pumped every 5 minutes and then read after 30 minutes. Dissolved gas concentrations were monitored in the Sacramento, American, Feather and San Joaquin rivers between June 13, 1981 and August 25, 1982. Dissolved-gas levels are reported in terms of ΔP, which is the differential pressure between total dissolved-gas pressure and the local barometric pressure. Observed levels of ΔP were low compared to the Columbia and Snake rivers and U.S. water quality criteria; however, levels were ominously high considering that a ΔP of 42 is high enough to cause larval mortality in striped bass. Observed levels of gas super-saturation might have been due to a few natural and human causes; rapid heating of water can produce gas super-saturation, and this could account for some of the higher levels observed in spring. Air trapped in water by falls and rapids also accounts for some of the levels of dissolved gas. Dissolved gas is more concentrated near the surface of the water, which is a critical space for larval striped bass that require time near the surface when they first fill their swim bladder. It has been well-documented that power plants on the U.S. East Coast attract fish into warm waste water that is full of dissolved gases. Because larval striped bass are extremely sensitive to high levels of dissolved gases, the two power plants located in the Delta may pose a serious risk to the fishery. Freyer et al. (2007) quantified fish-EQ relationships in the San Francisco Estuary using long-term data (1967-2004) regarding fish and water quality during the months of September-December. Their objectives were to develop models relating fish occurrence to EQ, to examine temporal and spatial trends in EQ, and to determine whether the water quality variables that define EQ can also be connected to abundance of fish. The authors analyzed long-term data from a fall mid-water trawl survey (FMWT) that was conducted by the California Department of Fish and Game. Sampling has been done every year since 1967 except for the two years of 1974 and 1979. The FMWT collects a 10-12 minute tow sample at 100 sites four times during the months of September-December for each year. For each tow, temperature, specific conductance and Secchi depth were measured, providing a 36-year range of environmental and fish data. To develop a model that relates fish occurrence to EQ, the authors used generalized additive models (GAMs) to describe these relationships. The GAM analyses created predicted occurrence probabilities for each species in the sample and the authors used these probabilities as an indicator of habitat suitability over time (EQ). Also, the authors tested the ability of water quality variables that composed EQ to predict abundance of delta smelt. The GAM analysis results were consistent with information about the life history of each species. Steepest declines in EQ occurred in the western, eastern, and southern regions, suggesting that the lower Sacramento River has had the least long-term habitat changes. The results suggested that water quality was an important factor in the decline of the fishery, especially over the last two decades. Overall, this study showed that ecological knowledge gained from long-term monitoring data can be a valuable tool to understand changes in aquatic ecosystems.
22
Coutant (1987) focused on the relationship between reduced summer habitat and the reproductive success of striped bass in Tennessee. Data used in this article came from the 1979-1984 production records of the Eagle Bend Fish Hatchery of the Tennessee Wildlife Resources Agency, where striped bass from three reservoirs had been spawned artificially since 1978 to generate larvae and juveniles for restocking. The analysis showed that sample sizes were unequal for the three reservoirs, but were adequate for statistical analyses of most data. Females from the Cherokee Reservoir had a smaller average size than females from the other two stocks, and males were also smaller than those from other stocks. Despite carefully selecting for the healthiest brood fish, Cherokee females consistently had a lower percentage of successful spawning than did fish from the other stocks, except for after the “good” Cherokee years (1980 and 1984). Almost 1/3 of Cherokee females failed to spawn after poor summers, but all spawned after the good years. Early embryo survival for Cherokee fish was significantly less than that of the other two stocks. Comparisons between the three reservoirs with different temperature and dissolved oxygen conditions, and between good and bad summers for habitat, seem to support the hypothesis that reduced summer habitat also reduces reproductive ability in the striped bass of Cherokee Reservoir. Dunning et al. (1989) describe the results of their efforts to reduce the mortality of striped bass captured in trawls and seines by altering certain handling procedures. The original handling procedure was used from April through June in 1984. A 12 meter high-rise otter trawl, a Jackson seine, and a Kosalt plaice seine were used for fishing in the Hudson River. The trawl was fished against the current for 10 minutes per tow. The two seines were fished interchangeably from a boat by the fly dragging technique. At the end of a tow or haul, the codend of the gear was lifted entirely out of the water to relocate the catch into tanks on the deck of the fishing vessel. River water was pumped continuously through the tanks and striped bass were held there until they were processed. Fish of 300 mm total length or more were double-tagged with an anchor tag and an internal anchor tag. From November 1985 through March 1986, a 9 meter high-rise otter trawl and a 12 meter trawl were used for fishing, and from March-May 1986, a Jackson 280 seine and a Kosalt plaice seine were used for fishing. Trawls were fished against the current for 10 minutes per tow. The difference in methods is that the codend of the gear was not lifted out of the water as with the original handling procedure. Instead the codend was moved into a partially submerged tank positioned next to the sampling vessel. The codend was opened and fish were set loose into the tank before it was lifted out of the water. From December 1986 through May 1987 a 9 meter trawl and a 12 meter trawl were used for fishing in the same manner as in 1985-86. For these experiments, striped bass of at least 200 mm total length were marked with an internal anchor tag. Water temperature at the depth of sampling was measured immediately after each tow or haul during all years. Total length of fish and any immediate mortality was documented. The interactions between water temperature, fish length, and immediate mortality for each gear type and handling procedure was examined by a three-way contingency test of the number of fish alive and dead after capture and handling. The immediate mortality for each gear type and handling procedure was determined by dividing the number of striped bass that died by the total number
23
captured. The results indicated that a great many striped bass in the Hudson River can be captured in seines and trawls at temperatures up to 14°C without immediate mortality of the fish exceeding 1.2%. Though the original handling procedure was tested up to 16°C and the modified handling procedure was tested up to 14°C, immediate mortality was lowest when the modified handling procedure was used for all combinations of temperature and length tested. These results suggest that the modified handling procedure is less stressful than the original one. Schorr et al. (1995) looked at the regional economic impact of the Lake Texoma sport fishery, and what part of that impact came from the striped bass fishery. From December 1989 to November 1990 the Oklahoma Department of Wildlife Conservation (ODWC) and the Texas Parks and Wildlife Department (TPWD) interviewed 1,030 anglers on Lake Texoma. Interviewers used a random roving creel survey to gather data to produce an estimate of mean angler hours per day and total angler hours per year for 1990. Then from January-December 1990, mail and telephone surveys were conducted by University of Oklahoma Biological Station personnel to collect information on anglers fishing activities and trip expenditures. Through a random process, self-addressed postage paid cards were distributed among anglers at six access points around Lake Texoma, with a total of 193 cards returned. Similar information from previous surveys on this subject indicated that $25.64 million was a good estimate of angler expenses. Similarity between the findings may be related to similar water levels and fishing pressures during 1989-90. Non-regional striped bass anglers had the greatest effect on the Lake Texoma economy as described by this study. Regional as well as non-regional anglers spent more per hour fishing for striped bass than for other fishes; this indicates that without the striped bass fishery, anglers might have gone elsewhere for fishing opportunities, which would negatively impact local economies. This study estimated approximately $25 million was generated by angler expenditures.
Black Bass Research has focused on many elements relating to black bass. Authors have looked at predation issues (Tabor, 2007), growing black bass on farms (Cotton, 2003), impacts of tournament fishing (Hanson, Cooke, Suski, & Phillipp, 2007; Hartley & Moring, 1993; Hunter, 2008; Siepker, Ostrand, Cooke, Philipp, & Wahl, 2007; Wilde, 1998 ), and improving communication between anglers and fisheries managers, (Green, 1995). Most of the research focused on the impacts that tournament fishing had on black bass. Siepker et al. (2007) focused on peer-reviewed literature regarding the effects of catch-and-release fishing. The authors wanted to see if certain practices are less harmful to fish populations. Variables examined included using additives such as ice, clove oil and oxygen versus lake water. Studies of the time it takes to measure fish caught in tournaments and the distance from catch and release locations were also reviewed to note any impacts on fish populations, such as nest abandonment and spread of viral infection. Based on their results, they concluded that more research was needed on whether live well additives help fish survival during tournaments. The authors indicate it
24
may be better to provide continual aeration of a live well, rather than to use on-board compressed oxygen. Hanson et al. (2007) looked at whether black bass caught and released under conditions similar to tournaments will abandon their nests more often or take a longer amount of time to return to their nests. In their study, snorkelers located small and largemouth bass near their nests in lakes in eastern Ontario. Fish were caught and marked. Some fish were caught, then released and the time to return to their nests was measured. Other fish were caught, but most of their eggs or offspring were removed. In some tests, the fish were exposed to air for two minutes to see if this affected their return time to the nests. Another test they conducted simulated tournament fishing by exposing the fish to air, holding them in a live well for one hour and then releasing them further away from their nests. They concluded that limiting fishing during times of reproduction can increase the fish population. If fishing were allowed at this time, barbless hooks and minimizing exposure to air and quick release would lessen damage to the fish population. Hunter et al. (2008) looked at how far fish move when they are caught in one part of the lake and released at a popular tournament release location, versus fish that are caught and released in one location. The authors also looked at how far and how fast the fish vacate the tournament release location. The authors set up thirty-nine bass with radio transmitters in the spring 2005 and tracked for one year. Twenty of the fish were taken to a tournament release site at Lake Martin in Alabama. The other fish were given transmitters and left where they were found. The researchers tracked the daily movement and cumulative movement of the fish. Based on their findings, the authors concluded that because fish moved less during fall and winter months, having more than one release site during cool months would help avoid concentration of the fish population. Wilde (1998) did a literature review to determine the average rates of pre-release, post-release and total mortality from tournament bass fishing in order to determine change in mortality rates since the 1970s. He looked at data from 130 tournaments over three decades. Based on his findings, Wilde recommends better handling conditions and awarding points to anglers who keep their fish in good condition. He felt that studies of initial and delayed mortality are necessary to determine whether these organizations do, in fact, have a low overall rate of mortality or are successful only in postponing mortality until after weigh-in and release. He felt tournament mortality might be improved by better live well conditions and handling, hooks that are designed to not be swallowed as deeply, reducing the number of tournaments in warm conditions, earlier weigh-ins and release, and capturing and photographing rather than waiting to weigh fish. Hartley and Moring (1993) looked at whether continuous aeration of live wells during bass tournaments provides more dissolved oxygen for fish than timed aeration or manual aeration based on bass behavior. Live wells in bass boats were monitored during three tournaments. All boats had dual live wells, one left free of fish and the other used as a control. The live well circulation systems were aerated replacement types
25
rather than aerated recirculation types. An inlet pipe drew water from just below the lake surface. When the circulation system was activated, both live wells were continuously flushed with fresh lake water. Dissolved oxygen and temperature were recorded every 15 min throughout the day in live wells and outside the boat with a calibrated Yellow Springs Instrument Model 57 meter. As each fish was caught, the time was recorded. Comparisons were made of conditions in each pair of aerated live wells. The use of continuous circulation in live wells maintained considerably higher oxygen levels. The authors stated that manually activated or timed aeration units might not provide sufficient oxygen to avoid additional fish mortality. Although continuous aeration may mean procedural adjustments for tournament or recreational anglers, manually activated units or even timed units are inadequate. Cotton et al. (2003) were interested in testing the proposition that growing better fish on farms might decrease the exploitation of wild stock of black sea bass. They experimented with growing black sea bass at different temperatures and salinity. Brood stock was captured off the coast of Virginia, and later hormone-induced spawning took place. Fingerlings were bought from a fishery in South Carolina for the experiment. Based on their results, the authors concluded that juvenile black sea bass grow best at 25° C and either 20 or 30% salinity. However, these conclusions, based on other studies, may indicate that the age of the sea bass might need to be considered. Tabor et al. (2007) looked at predation by smallmouth and largemouth bass on federally listed Chinook salmon and other anadromous salmonids in the Lake Washington system. Bass were caught by electrofishing along a 4.6-km stretch of shoreline every three weeks from February to June 1995 through 1997 in Lake Washington. In the Lake Washington Ship Canal, a stratified sampling design was used for samples every 7-14 days from April to July in 1999. The stomachs of 783 smallmouth bass and 310 largemouth bass were genetically analyzed for salmonid remains. All fishing was at night. Three size classes of bass were chosen for comparison on diets. Based on their results, the authors concluded that under current conditions, predation by smallmouth bass and largemouth bass has a minor impact on Chinook salmon and other salmonid populations in the Lake Washington system. Smallmouth bass were attributed with most of the predation, and mostly on subyearling Coho, Chinook and Sockeye salmon. Researchers were also surprised to find so many Sockeye and Coho salmon subyearlings were eaten, which suggests that subyearling populations of this fish are greater than had been thought. Green et al. (1995) summarized the findings from 29 presentations about biology and management of black bass given at a workshop of the American Fisheries Society Northeastern Division in 1993. The goal of the workshop was to find ways to improve the biology and ethics of fisheries management, as well as to improve communication between anglers and fisheries managers. Speakers at the panel noted that anglers could be confused as to what the limits are and upset if they do not understand the reason for them. Using newspaper writers and tackle shop owners would be useful. Participants at the workshop decided to form a black bass management task force in the Northeastern Division.
26
Steelhead Research has focused on many elements relating to Steelhead. Authors have looked at the impact of treated wastewater on the steelhead population (Spina, 2005), the distribution of steelhead in tributaries of the Sacramento-San Joaquin River system (Zimmerman, 2009), the impact of different water temperatures on steel head in Northern California pools (Nielsen, 1994), the growth and survival of steelhead in estuaries in California (Hayes, 2008), the effects of catch and release programs (Nelson, 2005), whether segregating wild steelhead from hatchery broodstock is effective (Dauer, 2009) and the impact of a dam and other factors on the migration process of juvenile steelhead (Plumb, 2006). Spina et al. looked at San Luis Obispo Creek, which is dry or very low much of the year, to determine the effects of the release of treated wastewater on the steelhead population. The authors looked at fish size in various stages of growth during different times of the year. This was a 3-year study of steelhead in a south-central California stream that is watered in dry months mainly by city treated water discharge. Researchers looked at downstream migrations including parr and smolts, timing and length of migrations, whether migration was linked to environmental factors, and the number of juvenile steelhead in the lower stream during summer and early fall, and determined the relationship between the number of steelhead and pool characteristics. The authors conclude that treated wastewater in the lower main stem maintains habitat for juvenile steelhead, even when there are no natural sources of water and that large, deep pools in the lower main stem probably help steelhead survival, especially larger juveniles. The authors feel that if wastewater is diverted for other uses, such as irrigation, this could harm steelhead and those fishery managers may want to decide when it is best to release wastewater. It looks like factors other than discharge are influencing migration. That felt that further study is needed to see if temperature and amount of daylight affect smolt migration. Human activities that could disrupt fish migration should be scheduled for summer or early fall. Zimmerman et al. focused on the distribution of the endangered steelhead in tributaries of the Sacramento-San Joaquin River system, their life history and biology, and whether resident fish and rainbow trout were genetically isolated from steelhead in these waterways. Otolith composition (calcium vs. strontium) was used to determine maternal origins and migratory histories of rainbow trout. Fish were collected from seven Central Valley rivers, mainly spawning and rearing areas, between 2001 and 2007. Sampling was done primarily during the months of October through May by beach seining, rotary screw traps, electrofishing, carcass surveys, and hook and line fishing. Fish were measured for length and the otoliths were removed and stored. The authors found steelhead progeny in all Central Valley streams studied. The proportion of steelhead offspring varied depending on location. The authors felt this might be because steelhead in the Sacramento River are mostly 2-year-old smolt and it is likely there are fewer older steelhead progeny due to emigration. Otoliths from juvenile rainbow trout in the San Joaquin River at Mossdale were thought to be steelhead smolts due to their coloration, but turned out to be from both steelhead and rainbow trout maternal origin.
27
Although this suggested rainbow trout could produce smolts in the Central Valley, there were too few fish to see the contribution of progeny of rainbow trout females to the emigration of smolts. Nielsen et al. focused on whether physical factors in a stream or river could help create cool water holding areas for fish, and whether fish would differ in their use of these pools, perhaps by age. The authors looked at Redwood Creek, Rancheria Creek and the Middle Fork Eel River in Northern California. The streams have different dynamics, such as an unstable gravel bed stream, heavy gravel flow, and water flowing through bedrock with deep pools. The physical formation of these layered-temperature pools was assessed. Age patterns of fish were also compared in areas with higher temperature. The authors concluded that although a previous study observed woody debris could halt water mixing, they felt this would only be the case if the debris were sufficient to be impervious, or if other factors slowed water mixing. The authors felt that ravel bars that create backwater areas were excellent for halting the mixture of water and that large, deep pools that discharge very little water are equally as effective. Hayes et al. (2008) monitored the growth and life history of juvenile steelhead on the upper watershed and estuary of Scott Creek, a typical Central California coastal stream. They felt this research was needed since they found little research on the use of coastal estuaries by southern salmonids and the potential effects on their growth and survival rate. For environmental measures, flows were measured downstream from major tributaries with a portable flowmeter and estimated at high flow. Hourly water temperatures were taken upstream at the estuary using IB-Cod loggers and later Onset Tidbits in the upper watersheds and YSI 600 XLM data loggers in the estuary. Up to 20 age-0 fish were sampled for fork length and weight at each site in the upper watershed to see if fish stayed in the sample site. A total of 200 fish between 25 and 65 mm were injected with dye. Fish larger than 65 mm were given an implanted tag and scale samples were taken. Tags were also implanted in fish downstream and at the estuary. Fish age was sampled using seine, hook, line, electrofishing and hoop net in different time ranges from 2002-2006. Results of growth in fish in upstream habitat showed upstream habitats were not very productive. The majority of fish migrated downstream after their first winter. Presumably, this was because of low nutrients and low flow. The authors felt these findings were confusing because the growth was slowest when temperatures were near optimum, and that low flows could have caused low surface area and less food for fish. They found that growth rates in the estuary were much higher, probably due to warmer temperatures and higher amounts of food, particularly when the lagoon was intact. They also found that growth rates were higher in years when there were fewer fish in the estuary. There were more fish in years when the lagoon formed earlier. Many fish used the estuary for growth for a few weeks and then left the estuary in years when the lagoon was formed later in the season. Nelson et al. (2005) looked at the catch and release mandates and the practice of supplying hatchery-reared fish which is commonly used where wild steelhead numbers are low. Their research objectives included determining whether the catch and release program were effective and whether the fish survived long enough to spawn,
28
determining the impact of multiple catches and releases, Adult steelhead were angled and radio-tagged near the mouth of the Vedder-Chilliwack River, British Columbia, in 1999 and 2000. Their movements were then monitored to determine the rate of survival to spawning as well as distribution in holding sites, spawning sites and spawning times. Radiotelemetry was used to determine the distribution of wild and hatchery origin winter steelhead spawners that were recreationally fished. Survival of wild and hatchery fish were measured from the time of capture by anglers shortly after river entry to the time of post-spawning emigration. Distributions of pre-spawning holding sites and the timing of distribution of spawning for wild and hatchery fish were compared. Survival rates were also compared to rate how well catch-and-release affected wild spawning numbers. The authors concluded that the proportion of unharvested fish that survived to spawn did not differ between wild and hatchery-raised. Dauer et al. (2009) focused on whether hatchery fish were being killed at the first migration. This study used data from Forks Creek Hatchery in Washington State from 1996 to 2003. Because steelhead can reproduce more than once, fish that return to spawn were marked with a spawn check on their scales. If they spawned again, their scales would show it. If the fish were segregated, some of the wild fish would spawn again, but not the hatchery fish because hatchery fish should be caught and killed on first spawn. In this study, the proportion of hatchery to wild fish at the spawning ground was compared to recommended proportions. For each year of the study, repeat-spawning hatchery fish were found even though all hatchery adults should have been killed at their first migration. While hatcheries try to segregate hatchery steelhead from wild fish, the authors feel that unless changes are made to improve the capture rates of hatchery fish, the mix of the gene pool and ecological interactions of hatchery fish with wild fish will remain high. Plumb et al. (2006) used radiotelemetry to examine the travel rate, travel time, and upriver movement patterns of juvenile steelhead as they migrated through Lower Granite Reservoir and Dam on the Snake River in Washington. The authors divided the reservoir into six reaches based on the locations of six detection sites. Each detection site was solar powered and consisted of one or two directional aerial antennas connected to a data-logging receiver. Receivers were programmed to scan the waters for eight frequencies at three seconds each in a 24 second scan cycle. Juvenile steelhead were caught, tagged with coded radio transmitters, and released from April to May. About 10-20 each of wild and hatchery fish were released on a daily basis during these months. Travel times were recorded as fish passed from one detection site to another along the river. The authors analyzed the rate at which fish traveled upstream and compared this to water velocity to determine whether travel rate and time are affected by water velocity. The authors also compared migration behavior between hatchery and wild steelhead. The authors determined that the presence of the dam, water velocity, and rearing type are key factors that affect the downstream migration of juvenile steelhead. Hatchery steelhead showed greater delays in migration than wild fish, which could lead to differences in survival between the rearing types. Results suggest that survival could be improved by producing hatchery fish that perform
29
similarly to wild fish, increasing velocities in the reservoir, and providing passage alternatives that more easily move fish through dams.
Halibut
Research has focused on many elements relating to halibut. Authors have looked at the contribution of potential nursery habitats to producing healthy adult halibut (Fodrie, 2006), whether water temperature and recent feeding history impact feeding motivation and associated behavioral patterns (Stoner, 2006), the optimal stocking densities are for California halibut (Merino, 2007), the measurement of flows of fisheries commodities through economies worldwide (Marsden, 2005), the procedures used in managing the recreational halibut fishery (Williams, 2000), the impact of different capture methods and warmer temperatures on halibut mortality (M. W. Davis, Olla, B. L., 2001), and estimating halibut discard mortality rates (Trumble, 2000) Fodrie et al. (2006focused on discovering what exactly constitutes high-value and critical habitat for juvenile fish. In this study, the authors first evaluated the availability of potential nursery habitats for the California halibut along the San Diego County, California, coastline. Second, they examined the distribution of young (0-group) halibut in relation to key physical features measured within each nursery habitat type. Third, they used juvenile distribution survey data from San Diego County's near shore habitats to estimate the total number of juvenile halibut occupying each nursery habitat type. This generated a first approximation for the expected contribution of potential nursery habitats in producing healthy young fish that advance to adult stocks. The survey and mapping results indicated that all coastal habitat types demonstrated the potential to contribute significantly to the successful rearing of California halibut. The authors concluded that all nursery habitat types demonstrated the potential to contribute significantly to stock fitness, and in general shallow and better-protected habitats were highly utilized nurseries for 0-group halibut and deserved special attention in management for conservation efforts. Stoner et al. (2006) tested whether feeding motivation and associated behavioral patterns in Pacific halibut were related to water temperature and recent feeding history. Pacific halibut were individually tested for activity and feeding motivation under variable conditions of temperature and feeding history. Ten replicate feeding series were conducted in each temperature with the treatments interspersed systematically throughout six identical tanks and two experimental periods (January through June in 2004 and 2005) using independent groups of Pacific halibut. The results pointed to the huge potential impact of temperature on Pacific halibut catchability in longline surveys. Halibut populations could be significantly underestimated in a cold season or cold year and in deep-water environments where temperatures are low. The authors make the following specific recommendations for stock assessments: first, survey gear should be equipped with electronic temperature recorders. Second, corrections for variation in fish catchability due to factors including temperature, light, body size and fish density need to be developed and applied to standardize catch rates entering into stock assessments.
30
Merino et al. (2007) set out to establish the optimal stocking densities for California halibut. A study was carried out to test the impact of three stocking densities –100, 200, and 300% percent coverage area (PCA) – on fish performance. Stocking densities were tested in triplicate in small, experimental tanks attached to the California Halibut Recirculating Hatchery. The stocking density experiment lasted 10 weeks. For this study, 171 days post hatch (dph) weaned California halibut grown at the UC Davis California Halibut Recirculating Hatchery were used. The results indicated that California halibut could be grown in shallow rectangular tanks and raceways at a relatively high stocking density without significantly compromising survivability. The results indicated that, of the densities tested, the optimal one is somewhere between 100% and 200% PCA. Therefore, tanks with California halibut juveniles should be split when the stocking density reaches a maximum target PCA to reduce the BFA and prevent a significant reduction in SGR. Marsden et al. (2005) set out to estimate flows of Pacific halibut through the Canadian economy using landings and customs data, and examine how these flows have changed over time. They also wanted to assess how commodity flows were related to policy and management initiatives. The conceptual model of flows of fisheries products through an economy they developed was basically a mass-balance approach. The model included flows of products into and out of different parts of the economy, while properly accounting for circular flows such as those for bait and aquaculture feed. The authors presented data on the flows of Pacific halibut into (landings and imports) and out of (exports) the Canadian economy in terms of quantity and value from 1950 to 2001. The authors conclude that mapping fish flows will be a powerful tool for addressing important questions about how international trade in fish and fish products may affect sustainable fisheries management and policy. Williams and Blood (2003 review the procedures used in managing the recreational halibut fishery and discuss the effectiveness of various measures. The authors also review the Catch Sharing Plan (CSP) and its decision-making process. The authors provide an historical account of the management strategies used to regulate the Pacific halibut fishery. The authors also discuss the division of the fishery by recreational, subsistence, commercial use and the allocation of stock from different jurisdictional areas, and the advantages and difficulties of the catch-sharing plan are discussed. The authors conclude that a successful management plan will depend greatly on cooperation between managers and charter operators. The authors also anticipate that the future will see increasing pressure on managers to allow more opportunities to harvest halibut. Management and fishermen alike may need to look for innovative new ways to maximize the harvest of available fish. The purpose of the study by Davis and Olia (2001) was to determine, under laboratory conditions, the degree that stress and eventual mortality were induced in halibut by capture with hooking or net towing followed by exposure to air. The study also focused on the role that warmer temperatures play in increasing the incidence of delayed mortality due to capture stressors. A total of 72 non-reproductive fish were held at a
31
density of 12 fish per tank for as long as six months before experimentation. Pacific halibut were observed for as long as 60 days after experimental treatment to assess the potential for delayed mortality. The combined effect on mortality in halibut of being hooked for a 24-hour period or towed for four hours, then exposure to either the same or warmer temperature water, then exposure to air, was measured for this experiment. For the hooking experiment, fish were transferred by dip net from a holding tank to a rectangular tank filled with flow-through seawater. Fish were then restrained in a foam-lined box and hooked through the upper jaw onto commercial longline gear. Fish were held for 24 hours in darkness, then placed in the holding box, unhooked and then transferred to a circular tank with seawater that was either 5° or 16°C and held there for 30 minutes. After this, fish were exposed to 15 minutes of air. For the towing experiment, fish were transferred by dip net into a tank with two nets suspended at the ends of two rotating arms. Nets were towed for four hours at a speed, which halibut could not swim. After being towed the fish were then exposed to either 5° or 16°C water for 30 minutes followed by 15 minutes in air. Previous studies of delayed mortality in halibut have only observed fish for two to ten days. The results of this study clearly indicate that longer observation times should be used to ensure realistic results. The authors advise caution when comparing results of laboratory experiments with field studies; while the experiments were designed to simulate conditions found in the field, some of the stressors encountered by fish would necessarily be different. The purpose of study by Trumble et al. (2000 was to come up with a better way to estimate Pacific halibut discard mortality rates (DMRs) by using available data. The authors proposed that more objective categories of specific injury types could be studied and used to predict these rates, rather than having observers collecting subjective information. Data from two previously conducted studies were used and re-classified in order to create a better way to estimate the incidence and causes of bycatch mortality. The new system of classification proposed by the authors should, in general, lower the estimated discard mortality rates for Pacific halibut fisheries compared to the original classification system. The proposed changes in DMR estimations for halibut fisheries will decrease the likelihood that fisheries will have to close early because of bycatch rates before the total allowable catch is harvested. Additionally, more accurate measures of bycatch rates will allow the North Pacific Marine Fisheries Council to lower the bycatch mortality limit for halibut without changing the actual bycatch mortality. The International Pacific Halibut Commission has recommended using the lower rates of bycatch mortality to allow an increase in the total allowable catch for the Pacific halibut fishery.
Chinook Salmon Research has focused on many elements relating to Chinook salmon. Authors have looked at survival of salmon smolt in rivers with and without dams (Welch, 2008), increasing the accuracy of genetic stock identification (Anderson, 2008), comparing biological and economic tradeoffs, testing for competition between pink salmon and Chinook salmon (Ruggerone, 2004), the impact of the 1998 El Niño and 1999 La Niña
32
(Macfarlane, 2005) and alternative management strategies to help threatened salmon populations recover (Wilson, 2003). Welch et al. (2008) focused on comparing salmon smolt survival in rivers with and without dams. The authors examined one phase of the lifecycle of Columbia River and Fraser River salmon stocks by comparing the freshwater survival of freely migrating salmon smolts down the extensively dammed Snake-Columbia River system with that of the same species migrating down the Thompson-Fraser River system which lacks dams. The authors used Pacific Ocean Shelf Tracking (POST) to measure the survival numbers of Chinook salmon and Steelhead along the undammed Fraser River system in spring 2004–2006 by surgically implanting the fish with individually identifiable acoustic tags and detecting the subsequent arrival of each surviving fish at the Fraser River mouth and then in the ocean. For the Columbia River system, the authors compared the survival of two species of salmonid smolts in these rivers using acoustic and Passive Integrated Transponder (PIT) tags to measure survival from the upper reaches to the river mouth. The authors conclude the dams might not be a negative influence on survival of migrating salmon smolts. One explanation they give is that the salmon smolts have learned how to survive with the existence of dams. On the other hand, they indicate there could be other factors that influence the survival of migrating salmon smolts in those two river systems. The main purpose of the study by Anderson et al. (2008) was to promote a new advanced method for predicting the accuracy of genetic stock identification (GSI). The conventional method for predicting the accuracy of genetic stock identification involves repeatedly simulating mixtures by re-sampling from the baseline, simulating new baselines by re-sampling from the baseline, and analyzing the simulated mixtures with the simulated baselines. The disadvantage of the conventional method is that it overestimates the predicted accuracy of GSI. Therefore, the authors developed a new method based on leave-one-out cross validation. After extensive analyses, the results demonstrated that the conventional simulation methods, PB-R and PB-NR, invariably provide a biased, overly optimistic prediction of the accuracy achievable with genetic stock identification. The results also showed that the new method would provide essentially unbiased estimates of GSI accuracy. The three versions of this new method (CV-ML, CV-SL, and CV-GC) are all based on the leave-one-out, cross-validation procedure. Halsing and Moore (2008) constructed an integrated assessment model to analyze biological and economic trade-offs in the recovery of Snake River spring- and summer-run Chinook salmon, which was listed as threatened under the Endangered Species Act (ESA) in 1992. The authors merged three frameworks: a salmon-passage model to predict migration and survival of smolts; an age-structured matrix model to predict long-term population growth rates of salmon stocks; and, a cost-effectiveness analysis to determine a set of least-cost management alternatives for achieving particular population growth rates. First, the authors applied the Columbia River Salmon Passage (CRiSP) model to quantify the effects of in-river salmon management measures on second-year survival rates of juvenile salmon. Then, they used these results to adjust
33
survival-rate parameters of the second model, an age-structured matrix model to predict long-term population growth rates of salmon stocks. This research integrated biological and economic methods to develop a cost-effectiveness tool for assessing management alternatives for Chinook salmon. This tool is very powerful in its ability to eliminate alternatives from the cost-effective set, and it makes transparent the trade-offs between biological benefits and economic costs of alternatives. Furthermore, using the cases of delayed differential mortality (λ) and the cost of harvest restrictions, the research illustrates how to incorporate biological or economic uncertainty through sensitivity analysis. Linking biology and economics could provide a valuable approach to science-based policy and management. Ruggerone and Goetz (2004) tested for competition between pink salmon and Chinook salmon originating from rivers in the Puget Sound area. The reason that inspired this study was that during 1984–1997, juvenile Chinook salmon released during even-numbered years experienced 59% lower survival rates than those released during odd-numbered years. Following a 2-year life cycle, many juvenile pink salmon enter Puget Sound in even-numbered years, whereas few migrate during odd-numbered years. In contrast, Chinook salmon released into coastal streams, where few pink salmon occur, did not exhibit an alternating-year pattern of survival. The researchers compared release-to-recovery survival rates of sub yearling Chinook salmon originating from 10 Puget Sound hatcheries and three Fraser River/lower mainland British Columbia hatcheries. Survival of Chinook salmon was estimated from the release and recovery of hatchery fish receiving implanted coded wire tags (CWTs). Also, in order to reconstruct survival of odd- versus even-year-release cohorts at age 2, virtual population analysis (VPA) was used to identify mortality associated with delayed maturation. The key finding of this study was that survival rates of sub yearling Chinook salmon in Puget Sound and the lower mainland of British Columbia alternated between even- and odd-numbered years during the 25-year period of investigation. During 1984–1997, survival of Chinook salmon was significantly less during even- versus odd-numbered years, whereas during 1972–1983, survival tended to be greater during even-numbered years. The authors attribute the transition in salmon survival rate to the 1982–1983 El Niño events. After the 1982–1983 El Niño, low survival of Chinook salmon during even-numbered years was related to increased competition with juvenile pink salmon. Competition was great during this period because pink salmon abundance was high and oceanographic conditions had led to low annual prey availability. Macfarlane et al. compared growth in sub yearling Chinook salmon during the 1998 El Niño and 1999 La Niña in the Gulf of the Farallones, a region of the continental shelf off central California seaward of the Golden Gate and the southernmost ocean entry point for the species in North America. The emphasis of this article was not the large-scale effects on ecosystems of El Niño and La Niña, but rather the importance of local oceanographic conditions to growth and other physiological and ecological processes. The authors trawled for juvenile Chinook salmon at the Golden Gate and in the Gulf of the Farallones during the summer and fall of 1998 and 1999. Then, juvenile salmon were examined, measured, and dissected in the laboratory. Fork length and total body weight were recorded. Precision of age and increment width data was determined by
34
estimating the coefficient of variation (CV). Differences between years or locations for means of size, age, otolith increment widths, oceanographic variables, and plankton volumes were evaluated by two-tailed t-tests The results showed greater growth of juvenile Chinook salmon during the 1998 El Niño than in the 1999 La Niña. The authors felt that the differences were due to a combination of factors, like the elevated temperatures within the species thermal tolerance, sufficient food to fuel the increased anabolic potential of warmer water, and conditions favorable to greater growth. The biotic and physical ocean conditions were more favorable to juvenile salmon growth and development in the 1998 El Niño than the 1999 La Niña, which is proven by the changes in condition and lipid dynamics between fish exiting the San Francisco Estuary and those in the Gulf of the Farallones. The results of this study suggest that physiological processes may be influenced more by local oceanographic conditions operating on spatial scales smaller than ocean basins. Wilson (2003) explored the alternative management actions that may help threatened Snake River Chinook salmon recover. The author approached this question from two different perspectives - habitat restoration efforts aimed at increasing egg-to-smolt survival rate, and dam breaching intended to improve smolt-to-spawner survival. The author performed analyses on seven index stocks of stream type Snake River Chinook salmon. These stocks were all within the Snake River spring-summer Chinook ESU (evolutionarily significant unit). The seven index stocks were from four sub basins and occupied a wide range of tributary habitat conditions from wilderness to areas of heavy use. Results of the numerical experiments suggested that dam breaching was more likely to increase population growth rates than habitat restoration, except for the most optimistic assumption about the efficacy of transportation. There was no reduction in egg-to-smolt survival, which indicated that neither habitat deterioration nor hatchery impacts caused the stocks to decline. The large decrease in smolt-to-adult survival rate from the historical period, when there were fewer dams, was consistent with the assumption that increased stress from transportation and passage through additional dams on the Snake River imposed a negative impact on the survival rate of juvenile Chinook salmon.
35
Literature Cited
Alberini, A., Zanatta, V., & Rosata, P. (2005). Combining actual and contingent behavior to estimate thevalue of sports fishing in the Lagoon of Venice. Ecological Economics, 61, 530-541.
Anderson, E. C., Waples, R. S., & Kalinowski, S. T. (2008). An improved method for predicting the accuracy of genetic stock identification. Canadian Journal of Fisheries and Aquatic Sciences, 65, 1475-1486.
Barnthouse, L. W., Glaser, D., Young, J. (2003). Effects of historic PCB exposures on the reproductive success of the Hudson River striped bass population. Environmental Science & Technology. Environmental Science & Technology, 37. doi: 10.1021/es025876f
Barrens, R., Ganderton, P., & Silva, C. (1996.). Valuing the Protection of Minimum Instream Flows in New Mexico,. Journal of Agricultural and Resource Economics, 21(2), 294-309.
Blackwell, B. F., Juanes, F. (1998). Predation on Atlantic salmon smolts by striped bass after dam passage. North American Journal of Fisheries Management, 18. doi: 10.1577/1548-8675(1998)018<0936:POASSB>2.0.CO;2
Churchill, T. N., Bettoli, P. W., Peterson, D. C., Reeves, W. C., Hodge, B. (2002). Angler conflicts in fisheries management: a case study of the striped bass controversy at Norris reservoir, Tennessee. Fisheries 27. doi: 10.1577/1548-8446(2002)027<0010:ACIFM>2.0.CO;2.
Colt, J. (1984). Seasonal changes in dissolved-gas supersaturation in the Sacramento River and possible effects on striped bass. Transactions of the American Fisheries Society, 113. doi: 10.1577/1548-8659(1984)113<655:SCIDSI>2.0.CO;2
Cooke, S. J., Danylchuk, A. J., Danylchuk, S. E., Suski, C. D., & Goldberg, T. L. (2006). Is Catch-and-release Recreational Angling Compatible with No-take Marine Protected Areas? Ocean & Coastal Management 49(5-6), 342-354.
Cooke, S. J., & Schramm, H. L. (2007). Catch-and-release science and its application to conservation and management of recreational fisheries. Fisheries Management and Ecology, 14, 73-79.
Cotton, C. F., Walker, R.L., Recicar, T.C. (2003). Effects of temperature and salinity on growth of juvenile black sea bass, with implications for aquaculture. North American Journal of Aquaculture, 65. doi: 10.1577/C02-037
Coutant, C. C. (1987). Poor reproductive success of striped bass from a reservoir with reduced summer habitat. Transactions of the American Fisheries Society, 116. doi: 10.1577/1548-8659(1987)116<154:PRSOSB>2.0.CO;2.
Dauer, M. B., Seamons, T.R., Hauser, L., Quinn, T.P., Naish, K.A. (2009). Estimating the Ratio of Hatchery-Produced to Wild Adult Steelhead on the Spawning Grounds using Scale Pattern Analyses. Transactions of the American Fisheries Society, 138, 15-22. doi: 10.1577/T08-032.1
Davis, J. A., Greenfield, B. K., Ichikawa, G., Stephenson, M. (2008). Mercury in sport fish from the Sacramento-San Joaquin delta region, California, USA. Science of the Total Environment, 39. doi: 10.1016/j.scitotenv.2007.10.050
Davis, M. W., Olla, B. L. (2001). Stress and delayed mortality induced in pacific halibut by exposure to hooking, net towing, elevated seawater temperature and air:
36
implications for management of bycatch. North American Journal of Fisheries Management, 21. doi: 10.1577/1548-8675(2001)021<0725:SADMII>2.0.CO;2
Dunning, D. J., Ross, Q. E., Mattson, M. T., Geoghegan, P., Waldman, J. R. (1989). Reducing mortality of striped bass captured in seines and trawls. North American Journal of Fisheries Management, 9. doi: 10.1577/1548-8675(1989)009<0171:RMOSBC>2.3.CO;2
Fodrie, F. J., Guillermo, M. (2006). Availability, usage and expected contribution of potential nursery habitats for the California halibut. Estuarine Coastal & Shelf Science. doi: 10.1016/j.ecss.2006.01.017
Freyrer, F., Nobriga, M. L., Sommer, T. R. (2007). Multidecadal trends for three declining fish species: habitat patterns and mechanisms in the San Francisco Estuary, California, USA. Canadian Journal of Fisheries & Aquatic Sciences, 64 Retrieved from http://iep.water.ca.gov/ AES/FeyrerNobrigaSommer2007.pdf.
Green, D. M., Schramm, H.L., McKeown, P.E., Green, D.M. (1995). SPECIAL SECTION: Managing black bass in northern waters: summary of the workshop. North American Journal of Fisheries Management, 15. doi: 10.1577/1548-8675(1995)015<0671:MBBINW>2.3.CO;2.
Grout, D. E. (2006). Interactions between striped bass (Morone saxatilis) rebuilding programmes and the conservation of Atlantic salmon (Salmo salar) and other anadromous fish species in the USA. ICES Journal of Marine Science, 63. doi: 10.1016/j.icesjms.2006.03.021
Halbrendt, C. K., Aull-Hyde, R., Dunkers, D. A. (1994). Expert opinions on critical production factors for sustained growth of the hybrid striped bass industry. Transactions of the American Fisheries Society, 123. doi: 10.1577/1548-8659(1994)123<0094:EOOCPF>2.3.CO;2
Hanson, K. C., Cooke, S. J., Suski, C. D., & Phillipp, D. P. (2007). Effects of different angling practices on post-releasebehaviour of nest-guarding male black bass, Micropterusspp. Fisheries Management and Ecology(14), 141-148.
Hartley, R. A., & Moring, J. R. (1993). SHORT COMMUNICATION: Observations of black bass (Centrarchidae) confined during angling tournaments: a cautionary note concerning dissolved oxygen. Aquaculture and Fisheries Management, Aquaculture and Fisheries Management(24). doi: 10.1111/j.1365-2109.1993.tb00632.x.
Hayes, S. A., Bond, M.H., Hanson, C.V., Freund, E.V, Smith J.J., Anderson, E.C., Ammann, A.J., MacFarlane, B. (2008). Steelhead growth in a small Central California Watershed: upstream and estuarine rearing patterns. Transactions of the American Fisheries Society, 137, 114–128. doi: 10.1577/T07-043.1
Hunt, K. M., & Ditton, R. B. (2001). Benefits of Recreational Fishing to Hispanic-American and Anglo Anglers. Human Dimensions of Wildlife 6(3), 153-172.
Hunt, K. M., Floyd, M. F., & Ditton, R. B. (2007). African-American and Anglo Anglers' Attitudes Toward the Catch-Related Aspects of Fishing. Human Dimensions of Wildlife 12(4), 227-239.
Hunter, R. W., Maceina, M.J. (2008). Dispersal of tournament-displaced largemouth bass and spotted bass in Lake Martin, Alabama. North American Journal of Fisheries Management. North American Journal of Fisheries Management, 28. doi: 10.1577/M07-082.1
37
Hushak, L. J., Morse, G., & Arapku, K. (1986). Regional impacts of fishery allocation to sport and commericial interests: a case study of Ohio's portion of Lake Erie. North American Journal of Fisheries Management, 6(472-480). doi: 10.1577/1548-8659(1986)6<472:RIOFAT>2.0.CO;2.
King, D. M., & Mazzotta, M. J. (2000). Ecosystem Valuation. (11/2/10). Retrieved from http://www.ecosystemvaluation.org/ doi:11/2/10
Kyle, G., Norman, W., Jodice, L., Graefe, A., & Marsinko, A. (2007). Segmenting anglers using their consumptive orientation profiles. Human Dimensions of Wildlife, 12(2), 115-132.
Loomis, J. (1995). Public Trust Doctrine Produces Water for Mono Lake: The State of California's Water Resources Control Board Decision #1631. Journal of Soil and Water Conservation(May-June ), 270.271.
Loomis, J. (1996). Measuring the Benefits of Removing Dams and Restoring the Elwha River: Results of a Contingent Valuation Survey. Water Resources Research, 32(2), 441-447.
Loomis, J., & Feldman, M. (1995). An Economic Approach to Giving "Equal Consideration" to Environmental Values in FERC Hydropower Relicensing. Rivers, 5(2), 96-108.
Loomis, J., & King, M. (1994). Comparison of mail and telephone-mail contingent valuation surveys. Journal of Environmental Management, 41, 309-324.
Loomis, J., & White, D. S. (1996). Economic values of increasingly rare and endangered fish. Fisheries Economics, 2(11). doi: doi 10.1577/1548-8446(1996 021<0006:EVOIRA>2.0.CO;2.
Macfarlane, R. B., Ralston, S., Royer, C., & Norton, E. C. (2005). Juvenile Chinook salmon growth on the central California coast during the 1998 El Niño and 1999 La Niña. Fisheries Oceanography, 14(5), 321-332.
Marsden, D. A., Sumalia, R. U. (2005). Tracking flows of fisheries products: the case of Pacific halibut in the Canadian economy. Fisheries Research, 73. doi: 10.1016/j.fishres.2004.12.007
Merino, G. E., Piedrahita, R. H., Conklin, D. E. (2007). The effect of fish stocking density on the growth of California halibut (Paralichthys californicus) juveniles. Aquaculture, 265. doi: 10.1016/j.aquaculture.2007.01.028
Millard, M. J., Welsh, S.A., Fletcher, J.W., Mohler, J., Kahnle, A., Hattala, K. (2003). Mortality associated with catch and release of striped bass in the Hudson River. Fisheries Management & Ecology, 10. doi: 10.1046/j.1365-2400.2003.00363.x
Nelson, T. C., Roseneau, M.L., Johnston, N.T. (2005). Behavior and survival of wild and hatchery-origin winter steelhead spawners caught and released in a recreational fishery. North American Journal of Fisheries Management, 25, 931-943. doi: 10.1577/M04-192.1
Nielsen, J. L., Lisle, T.E., Ozaki, V. (1994). Thermally stratified pools and their use by steelhead in Northern California Streams. Transactions of the American Fisheries Society, 3, 613-626. doi: 10.1577/1548-8659
Oh, C., & Ditton, R. (2006). Using Recreation Specialization to Understand Multi-Attribute Management PReferences. Leisure Sciences 28(4), 369-384.
38
Oh, C., Ditton, R. B., Anderson, D. K., Scott, D., & Stoll, J. R. (2005). Understanding differences in nonmarket valuation by angler specialization level. Leisure Sciences, 27, 263-277.
Opaluch, J. J., Grigalunas, T., Diamantides, D., Mazzotta, M., & Johnston, R. (1999). Recreational and Resource Economic Values for the Peconic Estuary System, Prepared for Peconic Estuary Program, Suffolk County Department of Health Services, Riverhead, NY by Economic Analysis, Inc.
Plumb, J. M., Perry, R. W., Adams, N. S., Rondorf, D. W. (2006). The effects of river impoundment and hatchery rearing on the migration behavior of juvenile steelhead in the lower snake river. North American Journal of Fisheries Management, 26. doi: 10.1577/M04-177.1
Ready, R., Epp, D., & Delavan, W. (2005). A Comparison of Revealed, Stated, and ActualBehavior in Response to a Change in Fishing Quality. Human Dimensions of Wildlife, 10, 39-52.
Ruggerone, G. T., Goetz, F. A. . (2004). Survival of Puget Sound Chinook salmon (Oncorhynchus tshawytscha) in response to climate-induced competition with pink salmon (Oncorhynchus gorbuscha). Canadian Journal of Fisheries and Aquatic Sciences, 61, 1756-1770.
Schorr, M. S., Sah, J., Schreiner, D. F., Meador, M. R., Hill, L. G. (1995). Regional economic impact of the Lake Texoma (Oklahoma-Texas) striped bass fishery. Fisheries, 20. doi: 10.1577/1548-8446(1995)020<0014:REIOTL>2.0.CO;2
Schroeder, S. A., Fulton, D. C., Currie, L., Goeman, T., Fulton, D. C., Currie, L. (2006). He Said, She Said: Gender and Angling Specialization, Motivations, Ethics, and Behaviors. Human Dimensions of Wildlife 11(5), 301-315.
Siepker, M. J., Ostrand, K. G., Cooke, S. J., Philipp, D. P., & Wahl, D. H. (2007). A review of the effects of catch-and-release angling on black bass, Micropterus spp.: implications for conservation and management of populations. Fisheries Management and Ecology, 14. doi: 10.1111/j.1365-2400.2007.00529.x.
Sorg, C. F., & Loomis, J. B. (1986). Economic value of Idaho sport fisheries with an update on valuation techniques. North American Journal of Fisheries Management, 6, 494-503. doi: 10.1577/1548-8659(1986)6<494:EVOISF>2.0.CO;2
Spina, A. P., Allen, M.A., Clarke, M. (2005). Downstream migration, rearing abundance, and pool habitat associations of juvenile steelhead in the lower main stem of a south-central California stream. North American Journal of Fisheries Management, 25. doi: 10.1577/M04-105.1
Stoll, J. R., & Ditton, R. B. (2006). Understanding Anglers' Willingness to Pay Under Alternative Management Regimes. Human Dimensions of Wildlife 11(1), 27-42.
Stoner, A. W., Ottmar, M. L., Hurst, T. P. (2006). Temperature affects activity and feeding motivation in Pacific halibut: implications for bait-dependent fishing. Fisheries Research, 81. doi: 10.1016/j.fishres.2006.07.005
Tabor, R. A., Footen, B.A., Fresh, K.L., Celedonia, M.T., Mejia, F.,Low, D.L., Park, L. (2007). Smallmouth bass and largemouth bass predation on juvenile Chinook salmon and other salmonids in the Lake Washington Basin. North American Journal of Fisheries Management. doi: 10.1577/M05-221.1
39
Trumble, R. J., Kaimmer, S. M., Williams, G. H. (2000). Estimation of discard mortality rates for Pacific halibut bycatch in groundfish longline fisheries. North American Journal of Fisheries Management, 20. doi: 10.1577/1548-8675(2000)020<0931:EODMRF>2.0.CO;2
Welch, D. W., Rechisky, E. L., Melnychuk, M. C., Porter, A. D., Walters, C. J., Clements, S., et al. (2008). Survival of migrating salmon smolts in large rivers with and without dams. PLoS Biology, 6(10), 2101-2108.
Wilde, G. R. (1998). Tournament-associated mortality in black bass. Fisheries Management and Ecology, 23. doi: 10.1577/1548-8446(1998)023<0012:TMIBB>2.0.CO;2
Williams, G. H., Blood, C. L. (2000). Active and passive management of the recreational fishery for Pacific halibut. North American Journal of Fisheries Management, 23. doi: 10.1577/M01-233AM
Wilson, P. H. (2003). Using population projection matrices to evaluate recovery strategies for Snake River spring and summer Chinook salmon. Conservation Biology, 17(3), 782-794.
Zimmerman, C. E., Edward, G.W., Perry, K. (2009). Maternal origin and migratory history of steelhead and rainbow trout captured in rivers of the Central Valley, California. Transactions of the American Fisheries Society, 138, 280-291. doi: 10.1577/T08-044.1
40
DFG KEY INFORMANT INTERVIEWS REPORT
By Frederica Shockley, Ph.D.
This section of the report presents the questions and summarizes the responses to telephone interviews with sixteen key informants who were staff with the California Department of Fish and Game. These interviews were conducted between February 15 and March 26, 2010 by Applied Research and Evaluation at California State University, Chico. These interviews are one part the study, An Economic Analysis of Striped Bass, Steelhead, Chinook Salmon, Black Bass, Halibut, and Sturgeon Fishing in California, which began in February of 2009 with funding from the California Department of Fish and Game (DFG). Key informant questions addressed the following:
• Position titles within DFG • Species for which respondents have some responsibility • Opinions regarding possible changes and reasons for changes in the populations
of species for which they have responsibility • Opinions regarding possible substitution of species that anglers are seeking • Opinions regarding possible impacts of the recession on angling behavior • Opinions regarding possible impacts of water management issues on fish
populations and angling behavior • Opinions regarding the impacts of fish hatchery programs on angling as well as
the possible need for habitat improvement programs • Opinions regarding DFG regulations and enforcement
Q1. What is the title of your position? The sixteen respondents gave the following titles for their positions at DFG.
• Associate Biologist (2) • Associate Fisheries Biologist (1) • Enforcement (1) • Environmental Program Manager 1 (2) • Fisheries Program Manager (1) • License and Revenue (1) • Senior Environmental Scientist (2) • Senior Fisheries Biologist (2) • Senior Hatchery Manager (1) • Senior Supervising Biologist (1) • Staff Environmental Scientist (1) • Supervising Biologist (1)
41
Q2. For which of the following species of fish do you currently have some type of responsibility?
Respondents indicated they had some responsibility for each of the following species: • Salmon 11 • Steelhead 11 • Halibut 2 • Sturgeon 7 • Black bass 9 • Striped bass 9
Q3. To the best of your knowledge about changes during the past 3 years, has
there been an increase, a decrease, or no change in the populations of the fish species for which you have responsibilities? Please explain.
Almost all respondents said that there had been a decrease in some or all of the species which they attributed to a variety of causes. "Generally there has been a decrease in all the species noted," according to one. However, several said there had not been any change in black bass. One respondent said, "Salmon, steelhead and sturgeon decreased, but there has been no change in bass. The catastrophic decrease is due to poor ocean conditions." Another respondent said that the decrease was "just normal variability." All who mentioned salmon and steelhead said there had been a decrease. One respondent said that, "There has been a severe decline in all four runs, primarily due to a change in ocean conditions, since all runs have been affected in a similar way. There has been no change in river survival, but ocean survival is very poor due to decrease in food supply for young fish in the ocean." Another said that, "We don’t know much about sturgeon, but they seem to be increasing among a subset that are 46 to 66 inches long. For the next five years, this subset will increase. Black bass will not change from the current supply of the past three years. In fact, it is likely to decrease over the next five years. Striped bass have declined steeply in the past five years, and they will continue declining." Q4. To the best of your knowledge, have total expenditures by sports anglers
subject to the Bay Delta Sport Fishing Enhancement Stamp (BDSFES) increased, decreased, or remained the same during the past 3 years? What are the major factors that have resulted in these changes?
Most respondents said they thought expenditures likely decreased during the past three years, primarily due to reduced angling opportunities, particularly for those targeting salmon and steelhead. Some also mentioned the recession as a factor causing a decrease in expenditures. One said that, "Expenditures generally decreased, probably due to loss of fishing opportunities, a reduction in the number of places that are "free" to fish, and the increased price of licenses." Q5. To the best of your knowledge, have some anglers substituted another sport
or another activity in place of fishing? Please explain.
42
About a third of the respondents said that they did not know if anglers had substituted another sport or another species. Most of the remaining respondents said they thought some anglers who target salmon are substituting another fish, and some anglers are fishing less due to reduced opportunities and/or the recession. One respondent said that, "Other activities are not replacing fishing; people have less time to enjoy the outdoors due to the economy. Everyone is trying to keep their jobs. Since they are not bringing in as much money, they cannot pay the fees to fish." Another said that, "They are fishing less and working more hours because of the economy." One noted that, "They substituted other species, but they have not totally given up fishing." Another said that, "They did not substitute other sports, but some have shifted species from salmon to steelhead, sturgeon or stripers. Even guide services shifted from salmon to other species."
Impacts of the Economic Recession
Q6. What kinds of changes, if any, in angler behavior have you noticed since the recession began? Generally, respondents noted that it is difficult to separate the impact of the recession from the impact of the decline in fish populations. As one respondent explained, "The decline in salmon runs happened at the same time as the recession, making it difficult to separate the two." Four respondents noted that anglers were staying closer to home, taking fewer trips, and spending less on boats. One noted that, "More fish locally, generally shorter trips, without paying guides. No extended weekends, no hotels. They call before buying licenses to make sure it is worth the effort if there have been changes in regulations." Four respondents said that anglers are fishing less. One explained that, "Activity dropped off due to the increased costs of licenses and bait. Some buy licenses, but not stamps. They cannot afford the stamps so they take their chances." One respondent said that, "I noticed that boat dealerships are going out of business." Another added that, "The numbers of boats for sale has gone down. Now they are refurbishing. Used boats are more popular; anglers are keeping their boats longer." Q7. To the best of your knowledge, has there been an increase, decrease, or no
change in fishing for subsistence since the recession began? Please explain. Four respondents said there had been an increase in subsistence fishing since the recession began. One said that, "There has been an increase, but I am not sure it was due to the recession. I have been trying to encourage harvest for 17 years. I hear that there has been an increase in harvest this year. Maybe it is more due to the economy than due to my efforts to educate." Other respondents thought there had been no change in subsistence fishing. One stated that, "I'd guess not much of a change. It's not really cheap to fish. I spend over $10,000 per year fishing." Q8. To the best of your knowledge, has there been an increase, decrease, or no
change in the use of fishing guides since the recession began? Please explain.
Generally, respondents said there has been a decrease in the use of fishing guides due to the recession and/or the elimination of salmon seasons. One said that, "There has
43
been a decrease based upon my personal communication with guides. State workers don't make as much and it has a ripple effect. Several guides said that business was down." Some said that most of the guides are used for salmon fishing, and one said that, "There has been a decrease because the majority of guides are for salmon." Another said, "I suspect there has been a decrease on the Sacramento River because of the salmon decline and lack of fall-run angling."
Water Management Issues
Q9. What impacts do water releases and their timing have on the populations of species in specific locations of the fish species for which you have responsibilities?
Generally, respondents noted that timing, flow, temperature and the quality of water greatly affect fish populations. One respondent stated that, "Fluctuations in flow affect volume, velocity and temperature. Salt water encroachment from the Bay also has a negative impact on fish populations. It impacts spawning when lower water leaves the nests above the water. It impacts migrating species when there is not enough flow." Another stated that, "There are huge impacts, particularly due to temperature management. We have to manage temperature closely to maintain fish." Another said that, "A lot of fishermen fish in canals where there is less water and fewer fishing opportunities. Many are subsistence fishermen who fish in ditches for striped and black bass." Q10. Are there problems in water management around the San Joaquin, the
Sacramento and the Bay Delta? All sixteen respondents said "yes," there are problems in water management. Q10a. If yes, please describe the major problems? "It's a big sucking sound!" declared one respondent who explained that, "It is from the reverse flows in the southern delta in the socialized, subsidized water management system for lawns, which are a higher priority than fish and wildlife." One respondent pointed out the problems that salmon face. "For salmon, the problem is mainly the San Joaquin; flows are low and exports are low. Chinook salmon try to swim out, but flows are too low. On the Sacramento side, fish get into the pumps when they open the delta cross channel gates." One respondent explained the problem that hatchery fish face. "The Central Valley hatcheries release fish and they are lost to water diversions. All steelhead and trout raised at hatcheries are clipped which helps hatcheries indentify returning fish. Up to 70% of Mokelumne steelhead are lost to pumps; only 30% return to spawn. We cannot identify hatcheries, except Mokelumne, which have a special mark. We try to get a 1% to 2% return rate. If we get back 4,000, we have to release 400,000. Some hatcheries get only a 1/4% return rate. They are consistently low because of the delta water diversions and Delta Cross Chanel gate closures. Coastal streams are low on steelhead. We truck salmon to help them survive."
44
Another respondent pointed out the problems due to salt water intrusion. "During low rain, we get salt water intrusion into the Sacramento. We are shipping too much water out of the Delta." Another explained that, "Quality has a big impact on the quantity and the quality of fish. Mixing zones between salt and fresh water impact nurseries of a lot of species." Q11. if yes, please explain how those problems affect species management? One respondent summarized the species management problems by stating that, "The timing of releases is often not high enough during spawning. There are water temperature issues. The water is managed more for rafting than for fish; fish are the last consideration. During peak flows, juvenile fish have to spend more time because there is not enough water. They are more vulnerable to predation and pumping. If flows are not strong enough, adults can get confused. They may wait for the right temperatures. Eggs may die if the water is too warm. Warm water also creates parasites and bacterial issues. Juveniles have a difficult time getting out of the delta and may not get past the Golden Gate; they are more vulnerable to additional predation. Flows affect the success of spawning and hatching.” Another respondent said that, "There are negative influences because there is less water and it is slower flowing. This allows predation, and it reduces the survival for migrating and spawning fish." One said that, "On tributaries to the Sacramento [River], the problem is basically ag diversions. The timing and the temperature of the water are all key impacts to salmon and steelhead." Q11a. If species management has benefited from these water management
efforts, how has it benefited? Generally, respondents did not see any benefits from water management. However, one respondent noted that, "In a drought year, with no water management, conditions would be even worse. Reservoirs regulate the flow in months we need it." Another respondent said that, "The reduction of diversions and pumps benefits some species, such as the smelt." Another stated that, "Specific managements have benefited specific species, such as the delta smelt." One respondent said that, "Black bass benefited because of controlled flows, but native species are definitely harmed." Q11b. If species management has been impeded or harmed by these water
management efforts, please describe how? Generally, respondents agreed that species management has been harmed by water
management. One respondent said that, "The extra water left in the Delta has not increased water quality. Other places dried up. The Bay is so toxic, it doesn't help to leave water in. Other fish are reduced due to lack of water outside the Delta." Another respondent said, "With regard to the storage of water at Folsom Dam ... it is a small reservoir, but it is nearest the Delta and when water quality is required, Folsom is the source of the releases, and this affects the American River." One simply stated that, "There is never enough water for cold water species."
45
Fish Hatcheries and Habitat Improvement
Q12. To the best of your knowledge, how do hatchery-raised fish affect angling? All respondents indicated that hatchery fish increase angling opportunities, and only one reported a negative impact. One respondent stated, "State-wide, they provide a tremendous opportunity to enjoy fishing and harvesting. Without hatchery fish, commercial, sports, and tribal fishing would be lost." One said that, "Salmon hatcheries support a major part of sports and commercial harvest inland and in the ocean. Fishing would be much more limited than now without hatcheries." Another said that, "They provide angling opportunities that would not exist and they increase positive angling experiences. Hatcheries definitely have a place." One respondent reported a negative impact: "They provide more fishing opportunities, but that can hide degradation, and they have a negative impact on wild stocks." Q13. What kinds of habitat improvement programs would be needed to restore
the supply of wild fish species needed to support current angling demand? Generally, respondents said that fish need more ladders to get over dams, less polluted water, more gravel in the streams, better flow, and better temperature control. Eight mentioned dams as a problem for fish. One respondent stated that, "The biggest issue is access; we built dams without fish ladders. Only 23 miles of the American River are accessible. Fish are forced to spawn where they never did before. Even with lots of ladders, warm water would still be a problem. It is difficult to do anything positive for steelhead with dams and no ladders." One respondent said that, "We could not really do enough habitat improvement to equal what we produce from hatcheries because we have so many major dams ... not enough habitat left below the dams." Another added, "We need fish passage and screening over dams. We need water rights, particularly in major agricultural areas. We also need restoration of stream habitat, particularly where it's affected by timber harvest." Another respondent stated that, "We need to stop polluting the Bay. The Bay is a toxic cesspool. Improved water quality in the Delta will bring wild fish back. Not so much an export problem, but more a pollution problem. Quality is more important than quantity. We need treatment facilities for runoff. Rivers are polluted and then there is more pollution when it gets to the Bay." Q14. How important is it for fisheries managers to discuss with anglers why
certain practices will improve habitat conditions and/or fish populations? All except one respondent agreed on the need for fisheries managers to discuss practices with anglers. One respondent said that, "It is very important. Our clientele want transparency; they want to know how their tax money is spent." Another explained, "It is very important. A lot of big salmon habitat improvement projects came from state bond acts. Without public support, they never would have passed. Anglers need to understand what they are supporting/voting on." One respondent said that, "It is very important, but not done often enough. A lot of problems between anglers and fishery managers are due to fishery managers not explaining the background or why we do the practices. At Feather River Hatchery, we
46
need to take fish throughout the run. We take eggs early in the season and then we discard eggs if we get enough later in the run. It's hedging our bets." One respondent pointed out the constraints due to cutbacks: "Public outreach is a major concern for the department [DFG], but it is particularly difficult due to cutbacks and furloughs. We need a dedicated outreach person in each region. We need to get the message to anglers." Another respondent pointed out that, "Educated anglers can sometimes change their practices if they see a reason. For example, handling fish in catch and release has been improved. Leave it out too long and it dies." Only one respondent said that discussions with anglers are not important: "It is not very important with anglers, but it is with the general public. Anglers are such a small percent of the population, they don't drive policy. The anglers are not creating water quality problems. Regulations don't drive fish populations; they are not a strong hammer. We need to get the message out to the general public."
CDFG Regulations and Enforcement
Q15. In your opinion, are current law enforcement efforts sufficient to prevent most poaching? Why/why not?
Generally, respondents agreed that warden efforts are good, but there are not enough wardens to prevent most poaching. One respondent stated, "The enforcement staff is too thin. They are incredible people doing an almost impossible job. There are only a handful of game wardens for a state as populous as California." Another explained that, "There is a lack of enforcement in the field. There are only 300 'boots in field' at the warden level." Another said that, "The state does not have enough enforcement to prevent poaching. There are not enough wardens. There were almost 1500 square miles per warden at one time." Q16. In your opinion, how much impact does poaching have on the populations
of the fish species for which you have responsibilities? Most respondents said that poaching has a major impact on sturgeon and to a lesser extent on salmon. One respondent stated that, "On long-lived fish, such as sturgeon, poachers have a big impact by removing larger fish. It takes a long time to get to spawning stage. Some salmon runs are affected, but not as much as sturgeon." One respondent explained that, "It varies by species; there is a large impact on sturgeon, a long lived fish, that yields caviar. Poaching sturgeon increased in recent years." Another said, "It is a huge issue for populations that have had a big decrease in populations. Sturgeon, especially, have dwindled. Taking one fish can reduce the potential for offspring." Some pointed out that illegal commercial behavior was especially a problem. "Commercial poaching is very significant. Cumulatively, angler pressure and violations have significant impacts. Commercial poachers have bigger impact than sports anglers; they take the roe from sturgeon that could have produced thousands of fish." One respondent pointed out the problem that poaching imposes on hatcheries. "Poaching during normal years doesn't impact meeting our goals, but the last two years,
47
returns were so low, poaching badly impacts our ability to meet our goals. There are about 5,000 eggs/fish." Some respondents did not think that poaching is an important issue. One stated that, "Poaching is minor compared to water and habitat problems." Another said that, "On a population level, it is almost insignificant." Q17. Are current fines for poaching too high, too low or about right for minimizing
poaching? Please explain. A dozen of the respondents said that fines were too low. One respondent stated simply that, "They don’t even come close to the level we need to keep poaching under control." Another said that, "They are too low to be an economic deterrent." Another added that, "Penalties are not severe enough to prevent repeat offenders. They probably get away with poaching for years without being caught." Some respondents pointed out that poaching was especially a problem in illegal commercial enterprises. "They are way too low because we see so much repeat offending. We need to increase fines until penalties become a deterrent. Poaching for sturgeon can be so lucrative; they can make tens of thousands of dollars. Poaching is most lucrative for sturgeon in my area. Poaching is an illegal commercial enterprise." Another stated that, "For certain types of poaching, there are a lot of repeat offenders. They make a lot of money selling sturgeon caviar; it is usually a group of people." "Fines are about right for run of the mill poaching, but too low for the ones that are sold illegally, e.g. surgeon and salmon. " Some also mentioned the court's failure to take poaching seriously. "Fish and Game cases are often given to a relatively new DA [District Attorney] who is not very knowledgeable about our issues. We have to educate them about the long-run impacts of violating regulations. They need to understand the long-run cost of taking a 60 year old female sturgeon with thousands of eggs. After we educate, they move on. We need to increase fines and have uniform prosecution around the state. Prosecution depends upon how seriously the court takes it." One respondent blamed the low fines for the court's failure to prosecute. "The DA and judges don't take poaching seriously, partially because fines are too low. You are more likely to get off with a fishing violation than speeding. Abalone poaching gets fines up north. Courts don't view it as seriously when someone takes extra fish." One said that the fines were sufficient, but the courts fail to prosecute. "Fines are sufficient, but courts need to prosecute. They don't like to prosecute someone trying to feed themselves. They feel like it is a waste of time." Q18. What are the main types of angler behavior that contribute to environmental
problems? Littering was the most frequently mentioned environmental problem with five respondents stating that what anglers leave behind is a problem. One respondent stated flatly, "Anglers are slobs." Another explained, "Some have a lack of respect for resources. They leave trash on the bank and in the water. They cause degradation with their vehicles. They chop trees for fire. They cause erosion when they drive down the levy."
48
Three respondents said that motor boats leaking into rivers is a problem. "Old motor boats leak oil and gas," according to one. Another pointed out that, "Motors are less polluting now than before." A couple of respondents said that anglers kill roe when they wade in the rivers. One said that, "Steelhead anglers wade rivers and may be unaware that they are killing salmon eggs." One respondent said that, "The release of live bait, such as golden shiners and the spread of aquatic species, such as New Zealand mud snails is a problem." He added that, "There is a general disregard for the eco system by many anglers." Four respondents either said that anglers do not have much impact on the environment or that they lead the effort to clean it up. One respondent said that, "I don't see much waste. They keep undersize fish, but that doesn't hurt much. Society, not angler behavior, contributes to water problems. Anglers want to keep the environment. Anglers are the good guys; they are more apt to report people dumping. They are part of the solution, not the problem." Q19. Does DFG adjust the price of licenses in order to manage fishing? (If YES)
Please explain. One respondent explained that, "DFG adjusts licenses according to Fish and Game Code 713, based upon an implicit price deflator that adjusts for cost of goods and services." Generally, the other respondents said that they did not know or that the licenses increase to cover the rising costs of managing the fish. Q20. To the best of your knowledge, do anglers have difficulty purchasing
licenses and stamps over the web? What is the typical amount of time required for an angler to make a purchase on the web?
Four of the respondents said that they were unaware that DFG has a web site for purchase of licenses. The others generally said that they had heard positive reports from anglers about use of the web with the exception of some older anglers who are not familiar with using the Internet. One stated that, "We have a new system that started last May. It takes less than five minutes. It has a customer satisfaction rating over 96%." Another said that, "I am glad they are doing it; people asked for ages. I have heard no comments that it is difficult. Most anglers I know buy at sporting goods stores." A couple mentioned that the main problems will be for the retailers who lose a chance to sell fishing supplies to anglers who buy on the web. One stated that, "It is a good system so it is not a problem; retailers have a problem perhaps."
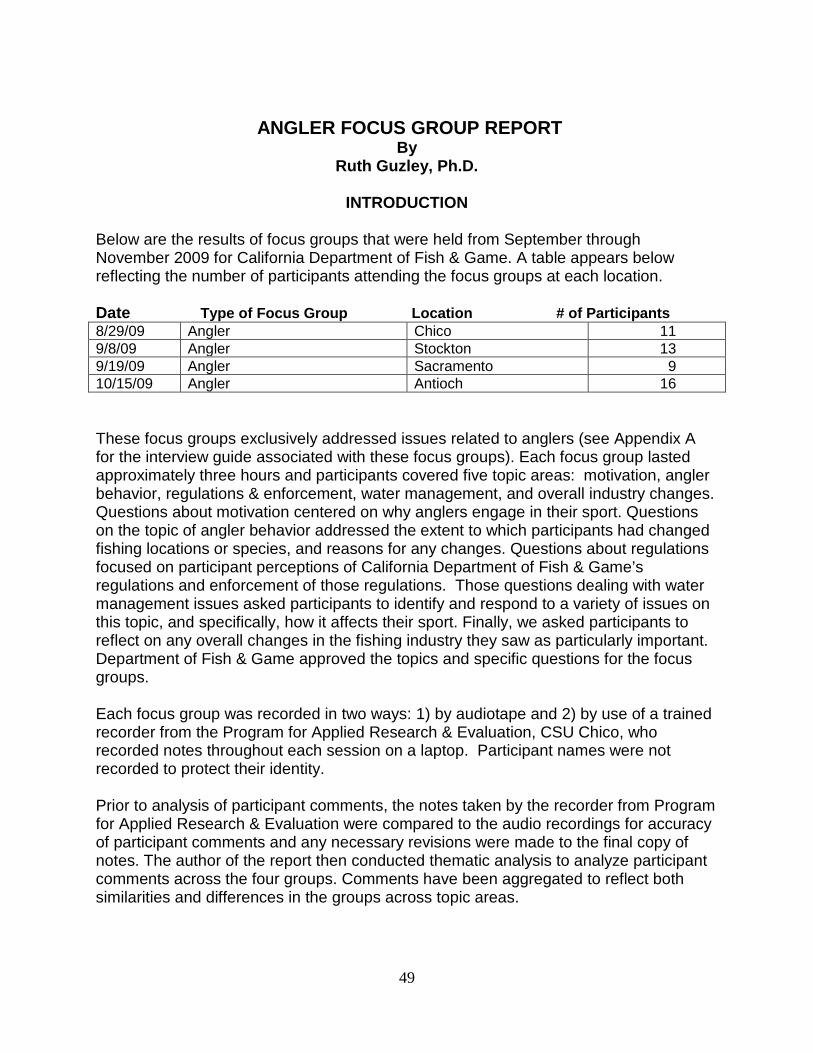
49
ANGLER FOCUS GROUP REPORT
By Ruth Guzley, Ph.D.
INTRODUCTION
Below are the results of focus groups that were held from September through November 2009 for California Department of Fish & Game. A table appears below reflecting the number of participants attending the focus groups at each location. Date Type of Focus Group Location # of Participants 8/29/09 Angler Chico 11 9/8/09 Angler Stockton 13 9/19/09 Angler Sacramento 9 10/15/09 Angler Antioch 16 These focus groups exclusively addressed issues related to anglers (see Appendix A for the interview guide associated with these focus groups). Each focus group lasted approximately three hours and participants covered five topic areas: motivation, angler behavior, regulations & enforcement, water management, and overall industry changes. Questions about motivation centered on why anglers engage in their sport. Questions on the topic of angler behavior addressed the extent to which participants had changed fishing locations or species, and reasons for any changes. Questions about regulations focused on participant perceptions of California Department of Fish & Game’s regulations and enforcement of those regulations. Those questions dealing with water management issues asked participants to identify and respond to a variety of issues on this topic, and specifically, how it affects their sport. Finally, we asked participants to reflect on any overall changes in the fishing industry they saw as particularly important. Department of Fish & Game approved the topics and specific questions for the focus groups. Each focus group was recorded in two ways: 1) by audiotape and 2) by use of a trained recorder from the Program for Applied Research & Evaluation, CSU Chico, who recorded notes throughout each session on a laptop. Participant names were not recorded to protect their identity. Prior to analysis of participant comments, the notes taken by the recorder from Program for Applied Research & Evaluation were compared to the audio recordings for accuracy of participant comments and any necessary revisions were made to the final copy of notes. The author of the report then conducted thematic analysis to analyze participant comments across the four groups. Comments have been aggregated to reflect both similarities and differences in the groups across topic areas.
50
At the beginning of each topic area, a brief explanation of themes associated with that topic area appears. Also included with each theme are representative comments from participants.
MOTIVATION We began the angler focus groups by asking participants about their motivation to fish. Our goal in doing so was to gain a sense of the value of the sport to them and how that value might influence their responses across questions in the focus groups. The motivations participants expressed speak to a way of life that has history and significant value to them. Across the four angler groups, there was a high degree of consistency in why participants fish. Their responses represented five distinct themes: 1) family/heritage; 2) stress reduction; 3) thrill of the sport/competition; 4) camaraderie; and 5) enjoyment of nature. Most often, these motivations co-existed, though it was not uncommon for one to be predominant. Family/Heritage When asked about their motivation for fishing, participants across the four focus groups mentioned most often the theme of fishing as a family activity, one that was often generational. As a family activity it was also viewed as an important opportunity to teach life lessons to children.
I also like the family atmosphere—a great way to bond with the kids. Healthy activity. It’s a good way to raise a family, gives a good family activity, family value. An activity that can be done together as a family. Teach about outdoors.
Education for young people on how to do something other than sitting in front of the TV; getting them educated about the outdoors. It teaches kids to organize and get stuff all ready to go. There’s no going back once you’re out there. It teaches them to think about what they are going to need. Yes, it’s a generational thing that carries on.
I fished with my grandfather as a young girl, but haven’t done so for a long while. It brings back lots of nice memories of childhood – recaptures enjoyment I had early in life with my grandfather. I’m now spending time with a commercial fisherman so I’m getting back in to it. I haven’t fished for all these years but didn’t realize what I missed—out in the boat with my grandfather sitting in the middle of the Sacramento River and talking about what is going on.
51
We had gone to a junior fishing tournament – there were a lot of kids in the derby – 30 of them – probably children of the fishermen. Maybe it’s in the family. If you don’t have that in your lifestyle, how would you know to do that, and you don’t fish. In certain cultures, fishing is still very important. I work in an inner city school as a teacher. Kids from Southeast Asian backgrounds do fish regularly with their families. Higher income kids do not have those opportunities for a variety of reasons. They are involved in sports or other activities—there are a lot of reasons why they do not fish. It’s a small percentage of kids.
Stress Reduction Responses in this theme, the second most often mentioned, addressed fishing as a haven to escape the pressures of work (though not always work itself), to reduce stress, or simply to slow the pace of life.
Work avoidance.
It’s another place to work – a quiet environment – an alternative place to do work. Potential for something unexpected on the end of the line. I’m out there reading my books. We have general b.s. and complaint sessions with other people who are out fishing—figure out all the problems in the organization at work and talk about how screwed up everyone else is. I fly fish, and I vent my frustration by whipping my rod in the casting motion.
I don’t know how you put this in proper terminology. You think about getting up at 4:30 in the morning and getting out there before the sun even comes up over the mountains. You go out for coffee and hot donuts and run into other people who are also fishing who want to chat. By the time you’re on the water, the birds are doing their thing. When I go fishing, it completely changes my focus. Quiet—that’s value you can’t quantify. My wife used to wonder why I liked to go fishing, and now she goes so she knows. It’s just so peaceful out there, so quiet—nothing bothers you.
Thrill of the Sport/Competition In this third theme, it was not just competing against others for the best catch that motivated participants to fish, but also the thrill of the sport and sense of personal accomplishment in meeting the challenge of the sport.
52
Competition – the enjoyment of competing. Even competing against friends. I also think there’s a huge amount of ego involved. There are some who want to catch the biggest fish—the competition, ego, bragging rights. You post pictures of fish you’ve caught to show others. People brag about their catches. One thing, and these guys will probably not admit it, but we probably read everything we can get our hands on about the life cycle and lifestyle and so forth of every fish we catch. So that’s a part of it too—that intrigue—and I don’t even know how to word it. What color do I use? What about water temperature? The chase—the intrigue of the chase—so we can be more successful (not that we are). We do a tremendous amount or research, every one of us. Water temperature. Weather. All these things come into play. We do the research. What’s the water color? What color is the best to use during what part of the day? A lot of scientific intrigue… The thrill of catching a fish. It’s exciting to hook it, play it, then finally land it. It never goes away. Personal challenge. It’s like running to me.
Camaraderie Participant comments indicated that it was not just competing against friends that motivated them to fish. Instead, for some participants fishing presented an opportunity to spend time with friends enjoying their companionship, or even teach them about the sport.
Yeah, fishing is my personality. People that I hang with, we all fish, hunt, do outdoor activities. I spend time with people with similar interests. What I mean by that is that guys go out and do something together. The fishing is not as important as the bonding. Mine [motivation] is for treating people to a day on the river, looking at wildlife and enjoying a relaxing trip for the day.
Teaching people to learn or enjoy the sport.
Enjoyment of Nature While not a motivation mentioned as often for fishing as the previously described themes, the enjoyment and wonder of nature nonetheless were expressed adamantly by many participants.
53
The unexpected – you never know quite what you’re going to get. You see river otters, salmon, other wildlife you don’t expect to see. You’re taking people out, and you don’t ever know what you’re going to see. It’s a cool place to go. Nature and the actual fishing itself.
I like going not only for the resources and the wildlife, but I like to watch and feed osprey and eagles and other wildlife. Mother Nature at her finest—I consider the Bay Delta as my Sistine Chapel. There’s never the same sunrise and sunset out there, and to me, that’s part of the trip. If you get a nice fish, that’s a bonus. I’m very observant out there. Sometimes I fish just to get close to nature, close to God
In summary, participants in these four focus groups reported fishing for a variety of reasons. It provides them the opportunity to spend valuable time with family and friends, to reduce the stress of work, to enjoy the challenge of the sport, and to obtain some peace and quiet in the beauty of nature. Regardless of participants’ motivation for fishing, they often spoke of how much they missed it when they had been away from it for a while. When unable to fish they became cranky, irritable, and experienced health problems (e.g., increase in blood pressure, depression). One participant summed it up in this way:
My trawling motor has been broken for two weeks and I’m a wreck waiting for parts. I’m going nuts. I’m a wreck!
ANGLER BEHAVIOR
In this topic area, participants were asked to discuss the extent to which they have changed locations of their fishing in the past year, the species for which they usually fish, and the effects of the recession on these behaviors. Changes in Location Most respondents indicated they had changed fishing locations during the past year. For the majority the change was to another location within the state.
I changed with the flow of lakes – Oroville’s down, Shasta’s down. I started going different places . . . I go to Redding and Clear Lake, Bullet’s Bat, but still in Northern California.
I stand pat – I was born and raised here, and I fish the river. If one species is thinning out, you learn how to go for another one. You keep going. I haven’t quit.
For us, we’ve stayed close to home because of gas prices. Last year we went to the Delta primarily. This year we’ve gone primarily to the American River.
54
We are not getting as many fish in this part of the Delta, and so you move and go up to Sacramento. Definitely – I do more salt water. I’m still in California– further upriver, though, where fresher water is located.
I took up fly fishing, and started to go back up in the mountains for trout. I need my fishing, and it doesn’t necessarily have to be here. I could sit out here all day and all week and not catch anything. You used to be able to catch hundreds of fish over a weekend. Things have slowed down, so you find other places to go and go there instead, but you keep going farther and farther. You fish there for a year or six months, and then it dies off. You just keep going…
Some participants reported they chose to go out of state to fish for a variety of reasons, but doing so did not necessarily replace fishing in state; rather, it was sometimes in addition to in-state fishing. In addition, they were not always content with the out-of-state choices available.
I gave up fishing in CA pretty much. It’s gone down so much – the fishing quality has gone down so much. The last 4-5 years I’ve fished in Nevada – the East Walker River has some wonderful fishing. It’s regulated. You can count on it. It’s embarrassing actually – my friends in Nevada like to remind me that we pay more for day licenses there, but you always find fish. And we actually have fish in our state. You have to work to find fish in Nevada. Back to your original question, I write for a web online service – there are a number of people are leaving the state to fish for salmon. Even with economy down, they are leaving the state for that species and other species and going other places for albacore, etc. such as Mexico. One of largest fishing clubs in state has a lodge in British Columbia, where they can still fish for salmon. I’m going to Klamath fishing. It’s a period of time for me when I used to be able to salmon fish in the Feather River. By the middle of September, salmon … we were catching more black ones… There were more spawned out fish, so I’ve been going to the Klamath River for almost 50 years. That part hasn’t changed. The local fishing has changed. I do more steelhead now.
I went out of State. When I was a teenager, I fished 100-120 days a year in the Delta. Back then, you could actually swim in the water then. I wouldn’t eat a fish out of the Delta now, and I wouldn’t swim in the Delta. I don’t fish in the Delta anymore. I fish where the water is clean – Oregon, Washington, Belize, Costa Rica. When I fish in California, I usually go to the Alpine Lakes or the Yuba River or Feather River.
55
I’m to the point that I have to book a trip out of state to Mexico or Alaska. I love fishing, but we have to use barbless hooks. If you go to Klamath, you have to buy a report card to fish. You have to pay $10 for a salmon stamp and then $10 for steelhead. It’s not affordable here. By the time we get to fish on the Sacramento, they’ll be skanky fish.
Change of Species When participants were asked whether they had changed species in the past year, their responses varied somewhat. The majority of responses that we received to this question indicate that anglers do not feel they have the luxury of a favorite species any longer. While salmon were mentioned more often than any other species as a “favorite,” the common theme was that they must take whatever is available if they want to continue to fish.
Species we’re after is all of them – they are all downhill. When one species starts to decline, and you’re not successful, and/or the regulations start compressing your success, what you do then is move to the next species – almost a food chain thing. Then you start working on the next species and learning how to catch that one. Then that one gets depleted and so you move on to the next one. Ocean fishing was for salmon. Then that was dire, and now they fish for bottom fish. Now they control fishing for the bottom fish. Then you go fish for stripers. Then you move to the next species. We all do that. We would like to be able to think we specialize in one species, but that doesn’t happen. It’s not allowed to happen because of the conditions. Lot of things affect regular species – not just one. Sport fishing doesn’t decimate a species down to the point of endangerment. Once you stop catching as many, you move on to trying to catch something else. You’re not the one taking it down to almost nothing. Salmon problem we have - 5 years ago we had great salmon fishing in the Feather River, and then suddenly there are none. Something else has to have happened. You have to change species, sure. Time of the year as well as environment conditions/regulations affect what you do.
Some participants were quite specific about species they prefer when salmon are not available.
Dedicated anglers will continue to fish – they will just shift emphasis to a different species. Those who used to fish for salmon are now fishing for halibut. I had a few back problems so I haven’t been out as much, but with the lack of salmon, I’m going trout fishing instead. I would not have fished for trout if there were salmon. I’ve been up there three times now. I would not have fished trout if
56
there were salmon. The whole situation has increased fishing in Redding and decreased it here. When they can’t fish for salmon, they fish for stripers. Yes. Lots of people are fishing for stripers. All those up the river for salmon are now in the Delta looking for stripers. They might not get big ones or limits, but they will catch fish. I used to fish at certain times of the year for certain kinds of fish—that kept the pressure off one species—but now I’m focusing on two species—halibut and striped bass. That’s it. If the steelhead are hitting, I go after them. If halibut is hitting, I’ll go there. Sturgeon if they are running, I’ll go get some sturgeon. It depends on how far out they are and how far you have to go to get them.
Changing species is not to be taken lightly as it may come at considerable cost, a point clearly noted by one participant.
When you change species, you have to change an awful lot of your equipment also, and that is quite expensive. Lines, poles, lures, about everything you use is different. Suddenly decide you’re not to be boat fishing but wade fishing instead. Wading equipment is @ $200, so anytime you change species, it’s another group of equipment that has to be purchased.
Only a few participants indicated that the frequency of their fishing trips had changed in direct relation to the availability of their favorite species. For example:
Before the closure of the season (salmon), I was out there 35-50 times a season. I started mid-November.
I haven’t changed locations, but I probably changed the amount of fishing I do it’s decreased because of changes in seasons. Our season started in mid-July and ended in mid-December. If we weren’t here, every one of us would be out fishing. Unless we change species, and fish for something else now, I mean, we cannot fish for salmon…we have to fish for something else. Frequency has definitely changed.
Effects of the Recession When participants were asked whether the recession had impacted their fishing behavior or related purchases, a noticeable number across the four focus groups indicated they had not experienced negative effects from the recession. Some reported actually spending more on their sport while others were spending about the same. The
57
underlying theme for these participants was that the recession alone would not be sufficient to negatively impact their fishing behavior.
Recession? Yes—I fish more! I’m fishing more because of the recession—my truck gets 7mpg. If I’m going to be putting $50-$100 of gas in that vehicle, I’m going to get my value out of that trip, so I take longer trips to make sure I get my money’s worth, partially because of the cost involved. I’m spending more –I’m cocky and kind of secure in my job. Nobody else does what I do, so I just buy more. When everybody else is buying less, I’m the contrarian. I buy more. What’s happening now is that there’s an increase in the number of people now because 2/3 of fishing hours are spent on piers or the shore. That number has gone up because if you’re not working, it’s an inexpensive pastime to fish from a pier. It’s good for families.
It hasn’t changed it for me. Fishing is not a hobby – it’s a disease. All my money I make . . . 100 pounds of plastic boat bait. I keep buying it. Hey, I’m not the richest guy in the world, but if I see something that tickles my fancy, it’s in my boat. My stimulus check went right to the local shop. I got the stimulus money and went down and bought a rod and reel. I said, “Here’s my stimulus money. I need a rod and reel.”
The majority of participants, however, noted that the recession has significantly influenced their fishing behaviors. The rising cost of gas and a variety of fees—coupled in some cases with declining income—has curtailed noticeably their ability to engage in the sport they highly value.
Costs involved are a huge factor. I mean, if it’s $100 to take boat out, you’re not going to do it three times a month. You’re not going to do it as often.
The economy has changed – I don’t fish as much as I used to due to gas prices. Gas has increased along with fees for launching boats. Fees have increased substantially. Gas to Clear Lake was $30 – now it’s $100. The park in Oroville has gone from $8-$13 to launch a boat. Rather than spend that launching fee, I spend it on gas to go somewhere where fishing is better and no launching fees.
58
I’m cutting down on trawling, maximizing spots and deciding where I’m going to go. I’m doing more plotting and mapping rather than just blind going places. But it doesn’t stop me from going – I’m going about the same. But the reason I don’t do more is gas and fees prevent me from doing what I used to do. Costs are going out of sight. A four-day tournament next month will probably cost me $1,000 or more by the time I’m finished.
For me, it has been like the economy, and I have my own little business, and it’s really down a lot, so I can’t go out as much as I would like to or have been able to, so my fishing is more limited now. I go out in the Delta and the Bay occasionally. I live in Brentwood, so mostly over in Frank’s Tract or out here in the Sacramento River, local. [From a guide] Two years ago I had six boats. Now I only have two and one I want to sell. People don’t go because of the expense. I haven’t raised prices for six years.
Those who are feeling the effects of the recession make it a habit of cutting back on costs and searching for deals when they need to make a purchase related to fishing.
I have switched over where I shop. I buy more of whatever and spend more, but my dollars are going further. I feel bad for my local shop, but I go online. I’ll buy 40 rods at a time because I build rods as a hobby. I’ll buy 20 reels at a time and get an awesome price on it. You do that online. I feel bad for the local guy. I shop at the local shop and buy a reel once in a while and try to maintain them, but their sales are definitely down. I took a $20,000 a year pay cut about two months ago, and I do not fish as much this year as I did last year. I will cut down. I might not buy that brand new rod, but I won’t stop fishing. You’re going to go fishing even if you have to fix your old rod and not buy new ones or use this year’s model rather than next year’s model, but you’re still going to do it. The economy is not going to be the issue with the true angler.
Most of our fishing stuff comes from the Internet from Cabella’s – we order all our stuff there.
In summary, anglers have made changes in their behavior over the past year. They have reluctantly adapted to the reduction in species by changing the species for which they fish and by changing fishing locations. The majority has done so in-state but some have sought out-of-state locations. The recession has impacted the majority of them in terms of how they fish (e.g., length of trip) and the amount of purchases they make related to their sport. It has not stopped them from fishing, however. A few have defied
59
the recession by actually fishing more and spending more (or at least no less) on the sport.
REGULATION & ENFORCEMENT
This topic area focused on participant perceptions of California Department of Fish & Game regulations (e.g., size limits, catch-and-release regulations) and their enforcement. Following water management, this topic area received the second highest level of comment by anglers and generated lively discussion.
Regulation Participant comments regarding regulation centered on the necessity of regulation, catch-and-release regulations, clarity of regulations, and trust in California Department of Fish & Game’s ability to regulate well. Necessity of Regulation There was general agreement among participants that regulations were necessary; however, they also expressed concern with being overregulated.
Most fishermen/hunters are the best environmental people around. If you leave me alone, you don’t have to tell me to release fish. I know what to do and what’s right. You can’t manage animals—you have to manage the killing and the environment. It’s a human that does the damage. You have to manage humans. To fish nowadays, you have to go through that regulation book. You have to check out what areas you can fish. It’s not fun for people who are fishing. We don’t want to have to worry about all of that. Just give us our slot limit; [i.e.] “You can catch 10 rock cod (doesn’t matter whether they are black or blue or whatever) or 2 bass (18”).” That’s all we want to know. We do not want regulations to take over.
Catch & Release Along with the broader concerns expressed above about being over-regulated, participants also address a number of more specific issues related to particular regulations as well as the way they are presented to anglers. Catch-and release regulations received a significant amount of attention across all four focus groups. However, participants differed in their evaluations of catch-and-release regulations, with some favoring it as a supply control mechanism and others expressing it does more harm than good.
60
I prefer catch and release. I would not like to keep any fish. So I have no problem with take limits. So okay, they say you can’t keep any stripers. I don’t care. A lot of us now catch and release, because fish are not there, just to be a part of it. 90% of my fish are released. The people I bring out release. We used to bring home the fish to feed your family and share with everybody and have a cookout. Now most people I fish with – almost everything gets released back in. There’s just not a lot in there. Start with Oroville - you can catch and release up to 12 inches and over 15 inches. Oroville has lots of problems- not enough bait – the fish are staying around 13-14 inches, chasing bait all day, and not growing. The fish don’t have cover. In order to put in Manzanita so fry can get away from predators…too much regulation prevents helping the lake. Shasta is a federal lake - allows helping the lake – you can take Manzanita up and put it down – Shasta is a better lake. Should take size limit off so you can thin out the fish population. If you want to put a 3-limit fish, I don’t care. If you want to build a lake up, it’s not working.
There’s a program for keeping all planted fish – what’s been happening is that we don’t catch all the planted fish so they go back and spawn, and their offspring are now native. No longer planted fish. More and more native fish that cannot produce enough planted fish to catch. The rest have to be released.
We kill a lot of fish – stripers under 18” have to be returned. Most of them are hair lipped. You yank hooks out. They are bleeding. Same thing with salmon. Why wear salmon out fishing it and it’s not going to survive and you can’t keep it? Rivers supply the ocean with salmon. In the ocean, we will catch salmon in nets and in bunches. When salmon reach fresh water, their esophagus actually seals up, and they no longer eat. They come up (especially in spring run) and hole up in summer- come up in February-March and stay until September when they spawn. When you catch and release, they will use up some of the energy required to spawn in September, and they don’t have the energy to do it and will die. They aren’t going to spawn successfully. We’ll see hook marks in mouth 9 times out of 10. I sent Fish & Game lots of pictures. It might make a difference. They’ve been unable to spawn.
Part of that is – right now, we’re opening salmon season for a short time in mid-November, and you can keep one fish for the day. Being fishermen, they will keep one fish, but they will continue to fish and catch and release. What’s going to happen is that the death rate of those catch and release fish is going to be very high. So people will say well, they’re going to die anyway… True – they will
61
die anyway – but catching and releasing will not allow the life cycle to be completed – no spawning will happen. You raise the mortality rate significantly. It depends on species too – you’re talking salmon – but you can’t compare salmon to bass. You can catch a bass 4-5 times, and it won’t affect him unless you hook him in the gill or right on the tongue. I’ve caught a fish who should have had a zipper on him – he had punch marks all over him. Salmon are more delicate. Trout, bass, stripers – because it comes back to the species and the circumstance.
Clarity of Regulations Mentioned most frequently of all comments about regulations was participants’ perception that clarity was sorely lacking in them. The regulations are seen as confusing, so complex they are difficult if not impossible to navigate, and create a significant amount of frustration for anglers. Only one angler across all four focus groups expressed having no difficulty interpreting regulations.
You have to have a Ph.D. to understand some of the regulations. I wish the regulations were written in English so I can understand where it is legal to fish. You go somewhere unfamiliar, and you don’t know the landmarks cited in the regulations. People who buy licenses are law-abiding citizens, but the regulations are not clear. They list points that are unfamiliar to anglers – i.e., it’s legal to fish between this bridge and that road. Each river has different regulations. On one side of bridge, you can catch one fish; on other side you can catch two legally. Unless you grew up there… It’s so confusing when you read the regulations because you read the regs, and it says clearly, you need an 18 inch leader. Elsewhere in the books, it will say well, in these waters, you don’t need that, size of the hook, whether you have a single or a triple... A one ounce weight or something else…Some regulations will be conflicted. It gets really confusing when you put it all together. If you were looking at something geographically, here’s a picture of the map, and here are the rules and regulations that go with that area, that would make so much more sense. You turn the page and here’s another region. Here are the waters in California, and here are the rules that apply to those waters. That would make so much more sense. You just go to one chapter for the area you’re in. One thing came up that I was almost cited for, and thank goodness I talked to the warden. This buddy is telling me about Yolo Causeway – you can go catch salmon. There are tons of salmon there going up. So I get down there, and there’s a sign saying no fishing from this point up. It’s a fish ladder, whatever. Yet you can fish down below. You go and look and ask the game warden, and they say sure, but just don’t fish for salmon. This is on Snodgrass Slough or
62
some slough somewhere. I go there’s no sign, there’s no way for me to know. There is nothing on the map, and you have no clue what this river way is. And they will tell you they will cite you. I went through six pages of the book looking for regulations for a certain area, and I never got the right information. Every time I thought I got to the answer, I got referred to section so and so, paragraph so and so.…
Trust in CDFG Ability to Regulate Well In all of the focus groups the discussion of regulations evolved to concerns participants had about the ability of California Department of Fish & Game to exercise sound judgment in regulating. They expressed an overall lack of trust in Department of Fish & Game to regulate well.
Fish & Game hasn’t done a very good job. We don’t trust the regulations. But then that’s the best thing we have to work with. I didn’t go to the meeting about the closing of sturgeon season –I have a good friend who did go, and he asked Fish & Game how many fish were caught, and they did not know. What do you expect? On your sturgeon card – they ask where and when you caught fish. We need more information on the card. These people will make the decision about closing down the season down or not. They are going to do it in San Francisco rather than here, where you fish. None of the Fish & Game people there fished. Six game wardens were there. No game wardens fished much. How can you make a law about something you know absolutely nothing about? If you’re going to do that, you should know something about what you’re making laws about. Sturgeon for instance—Fish & Game didn’t know they had passenger books. They used to have a quarterly count of how many fish were caught, but they never used the information. I looked at it every quarter because I wanted to see how other people were fishing. They don’t ask for the information from us—they go to some guy in a suit and tie. On the MLPA, there were 54 members were on one committee – the first day, we all agreed on the first day that we supported the idea as long as we used the best science. The best science will help improve the fishery. Scientists don’t always agree on what should happen. At every meeting, a different scientist came in and said this was happening or that was happening, but nobody really knows what is going on in the Delta. Fish & Game had a dual responsibility to take care of fish and game and regulate commercial fishing. Every year, big books were kept on all the commercial fish that were caught - commercial fishing – that’s income for the state. The recreational side is ignored. The MLPA’s dealt with the rock fishing populations collapsing in the 80’s and 90’s. The MLPA’s want to
63
take it out of hands of Fish &Game. We don’t think they do a very good job. There are lots of draconian regulations that were instituted in the 80’s and most of the rock fishing came back. A comment on the salmon closure – I think it was idiotic. When season’s longer, on any weekend, a guy might go fishing or not. Now you put the season down to two months, and everyone—we’ve got to get down to the river and get a salmon—everyone has to go at the same time. 40-50-60 boats in one place at one time causes much more damage in that small timeframe. Nothing does as much damage as that many people on the river at one time. If Fish & Game had left the season longer, spurts of fish would go through and it would not be as affected. Why they chopped it down to two months . . . that was stupid. I personally don’t let Fish & Game check anything or touch any of my fish anymore. I believe the guy who asks me if he can check it – he believes he’s doing the right thing. But the data he receives is in one of these trash cans. But that guy’s got a job, and I believe he means it when he asks to check my fish. I tell them no now. They ask me why, and I tell them they have been checking my fish for thirty years, and for thirty years, it has gotten worse. The Fish and Game guy thinks he means it, but it’s not his fault.
In each of the four groups there was mention that Department of Fish & Game regulations are fraught with red tape and politics.
I’m a flat fisherman – one of my main lures is the sardine wrap. It’s impossible to snag salmon with a floating lure. Yet because so many people are snagging, they say no hooks over this. So now, I have to file all the barbs off. It’s just a pain. It’s just too much crap. If it is not a snagging lure to begin with, then why should I have to take off the barbs? It’s a pain. We’re not breaking the law. We’re not breaking the law. We’re going out there to catch some fish. Fish & Game is red taping us to death with all the damned report cards and all the filing of the hooks. Even if you get one off, it gets off. Then you think, is it really worth it? They have clamped the rules down so hard on sturgeon, you’re lucky to find a keeper in your lifetime. When I was a kid, I caught them and the limit was 36 inches. I caught five in one day. I got a 34, 34, 35, we can stretch this one half an inch, can’t we? Nope. All of them had to go back in the water. Next time they jumped it up to 40 inches. Caught a 36, 37. Had to let them go. Then you catch them five feet long. Too big – got the let them go. So I mean, it’s got to be more for the fun of it. They’ve made it so damned hard to catch a keeper. Fish & Game keeps changing rules for how hard it is to get keepers. It has to be an excuse to get out of the house and have some fun and go fishing.
64
If you want to be an angler and want to go out and have a good time and relax with your family, you’re going to go out and do it at any cost. But when you have to worry about am I on the right side of the bridge or the left side of the bridge, that’s it. Things like that – it ain’t worth it. Just go to the fish pond and pay my $5 and I don’t even need a license. It’s not the economy – for a true angler? I don’t believe the economy has one thing to do with it. Some of why we go to different places is because of the regulations that they put on the normal species we would fish for. The drives us to go different places – they drive us to the mountains and to Nevada, Mexico, Alaska. It’s all about money –there’s too much money is involved. All this stuff we’re talking about is about money…and water. They haven’t spent a lot of the funds. But what’s happening is that they keep on passing more and more regulations on take, methods of take, size limits, and we have to pay for this. We are paying more to fish. We have less fish to catch. There is a tremendous fishery from San Luis on down to Southern California that has been created by Delta water. The fishermen down there, they benefit from the fisheries created by our water, but do not have to buy the stamp [Bay Delta Enhancement Stamp]. And they have lots and lots of fish. Some of those areas, I believe there are no limits on striped bass. No size limit on striped bass. They suck the fish right out of the Delta and kill them in the pumps, and the ones that survive, these guys get to fish for them, and they don’t have to pay to enhance the Bay Delta like we do. So we have fewer fish to catch, less water to fish in, and more money to pay.
Enforcement Enforcement was in some ways more important to many of the participants than was regulation, both because enforcement was seen as a bigger problem facing anglers and because they did not perceive that enforcement was currently effective. The following quotes are indicative of these views:
I don’t think the problem is with the restrictiveness of the regulations as much as the lack of enforcement of the poaching and the confusion about the regulations.
Fish & Game should quit trying to make more rules because they can’t enforce the ones they have. If they enforced the rules they have now, it would do justice to the fisheries. There’s no enforcement of any of these rules.
Discussion of enforcement issues centered predominantly on two concerns: 1) whether all anglers were treated equally, and 2) the extent to which enforcement occurs, with
65
particular attention to the role of wardens and larger systemic problems with enforcement. Equal Enforcement On the issue of equal enforcement there was some disagreement, with some anglers believing everyone was treated the same and others believing enforcement was more lenient (or nonexistent) for certain groups.
If you’re breaking the law, you’re still going to get a ticket. Regulations are applied to everyone. It’s like anything else - a friend of a friend may get a little slack. Chances are when you come across 10-15 guys standing out there, 3-4 of them will not have licenses. And the fish are in one pile instead of separated by limits for each individual. I’ve seen the fish out in the park – just taking a pickup load of catfish out of there. It doesn’t hurt the lake, but still . . . when the car starts hitting the fenders, it’s too many fish. I bet you my paycheck for this month that I could find someone on the river fishing for salmon right now. I could go to the Sacramento River and find someone fishing for salmon using salmon gear. I might find someone with salmon in their boat or in their ice chest. Regulation is fair, but enforcement doesn’t catch people willing to poach and/or break the regulations.
By far the most significant concern with regard to equal enforcement of regulations was that of culture. While some participants did not see culture as an issue in enforcement, the majority of participants were convinced that an individual’s culture influenced whether enforcement occurred, thus perpetuating poaching. Some participants acknowledged that with cultural differences in how fishing is viewed, there was a strong need for education about Department of Fish & Game regulations and the purpose of regulation.
One Fish & Game person might feel differently and might be a racist- you don’t know. He might ask one person for a license and not another who is white. In Butte Creek, I saw Hmongs spear fishing in Butte Creek – enforcement caught them. Cars are parked at 6 a.m. and at 8 p.m. You know they aren’t out there sunbathing. The Hmongs and stuff like that – they will get hammered. The reason is they don’t follow the law. They don’t stop at 5 bass.
66
Racial profiling goes on because as a group, they made a complaint to Fish &Game, so wardens don’t ask them. They claimed the wardens were harassing the Russians.
There are 24-hour shifts of Orientals who are taking all these fish to feed their families getting limits for the kids and themselves. They take over the campground. It takes it away from all the others who want to camp. It’s an enforcement issue. The truth is that you can see from my tone that I’m a little upset or disgruntled about certain things. When I go down to the American – that used to be my river of choice ok—now they’ve got certain ethnic groups out teaching their 6-7-8 year old kids how to snag fish while Daddy’s on the top of the mountain watching out for the game wardens. The parents are up on the bank serving as lookouts. They take, take, take and give nothing back. And the game wardens can’t do it because they don’t have enough game wardens to do it. So they just gave them the river – go poach. It’s ruining it. Do you think I want to fish down there when I see all the snagging going on? Hell, no, so I gave up. I go to the Sacramento. Now they shut down the Sacramento. You think I want to drive up there and be bumper-to-bumper in boats and can’t even fish? No! So now I’ll go to Alaska. So there’s a lot of frustration with the laws and regulations, the way they enforce it. My license cost me like $50. I mean how much was it this year? It’s like they take, take, take, and what do we get back? You almost want to say, screw it, I’ll go down to Winco and buy me some salmon from Alaska. It’s a hell of a lot cheaper than launching my boat and paying for my license and going the river and seeing all the snaggers breaking the law while the game wardens don’t do nothing (sic) about it. But I do agree about the racial profiling thing. I’m sort of bigoted. I’m an immigrant here. So I have this gut instinct, that “Hey man, it’s a fish, I should keep it.” I had to learn to let them go and to conserve the resource. I can’t do that with my dad. You can take him out of China. You can’t take China out of him. My dad can’t understand – he just doesn’t want to waste fish – he does eat it - but at some point, you have to follow the regulations. The thing is, I don’t take them as often. It’s just a matter of education. You hang out with other people who poach and you don’t think it’s a big deal. I think it’s a cultural thing – this is how it was done in their homeland. They don’t’ see anything wrong. It’s an education issue. They need to be educated. Sure, you’re getting a bunch today, but what about your kids tomorrow?
67
Wardens and Enforcement Participants across the four groups acknowledged the difficulty wardens have in enforcement of Department of Fish & Game regulations. Primary among this discussion was the recognition that not only are there too few wardens, but they are doing double duty trying to enforce regulations outside the boundaries of angling. Participants also expressed the recognition that wardens in California are limited in their enforcement capabilities.
Fish &Game is trying to make the rules stiffer and stricter, but there is no way they can do it with the amount of men they have. We have 250 wardens for entire state – 2500 miles apiece. We’ve got a lack of game wardens – I fish 3 days a week every week of the year. I’ve been stopped two times since I got my boat three years ago. Last time it was because of a bad taillight in the middle of the night. The game warden actually asked for regulations and paperwork. I see them out there in Delta more in hunting season. They are doing a great service and are brave souls to be out there. There just aren’t enough of them. The game wardens in this state are also mandated to enforce all these environmental laws. They have to spend a lot of time dealing with that when no, they should be dealing with people who are breaking the laws on fishing. A good example is off of Truxel, there are some sloughs out there. The farmers cut down some of the riparian area next to the slough. He mowed it next to the slough. The game warden was going out to cite the farmer instead of being out at the river monitoring there. In my mind, I’m going, “It’s the farmer. There’s got to be another organization…You need to be down at the mouth of the river…” It’s so disheartening to see the resource getting raped. And Fish & Game is prevented from doing anything. They can’t control the water. Fish & Game tries to enforce regulations. They can’t get more wardens in the field. We’ve got fewer wardens since the 50’s with more population. They are overwhelmed. They are the first to admit they are overwhelmed. They want more wardens. We can’t get wardens in the field, so it’s disheartening to see. Poachers and all these immigrants are raping the industry. We know they are poaching, but we can’t do anything about it. I’m going to Alaska to see fishing the way it should be. Wardens up there are empowered to make changes – they can close out the season in 24 hours on certain streams – and they will do it. They care so much about the resource. In California, Fish &Game’s hands are tied - they can’t do anything – without approval of the Fish & Game Commission. It’s just ridiculous. I’ve fished my entire life here, but I haven’t bought a license in 2-3 years. This year I bought one, but it’s disheartening to see all the changes taking place. You
68
go to Alaska and recapture the thrill of actually seeing wildlife the way it should be. In California, it’s just so disheartening to see that.
There was concern among participants that some wardens may avoid enforcement in some cases either because it is easier to do so or for fear of being punished by Department of Fish & Game.
Individuals doing the job have a pretty laid back job for what they are doing. I mean, they have free roam to go do what they want to do. Now if they want to enforce it, they can. But if not, they are going to take the easy route—look the other way. See, that’s the problem—the enforcement part. You can increase the number of wardens, but it’s not going to do any good. They will go out and stop us. We’re out there proactively fishing and catching and releasing, but they won’t even go after poachers. But if they do in their defense, if they do . . . we had a game warden here several years ago who used to go after poachers; they muffled him and shipped him out. I know game wardens have been disciplined for enforcing the rules on certain people, on certain groups.
Discussion in a few of the groups went beyond issues of current enforcement to the need for more efficiency in enforcement; spending time on the most important aspects of enforcement and thinking proactively about better ways to do their jobs.
I think they need to be using their time more wisely. Every time I get across one, they’ll go through every compartment in my boat. Knowing ahead of time because they have watched you the whole day, so they know there is nothing on the boat. They know you don’t have any extra fish, or no fish tied up. And they spend 20 minutes to a half hour when they could be going out where they know people are taking fish and poaching. They stay away from that area. It’s more paperwork. I know and they know they are constrained, but if you know abalone poachers really like super low tides twice a month, and if you see a bunch of Asian groups with rice sacks going out to the coast with big vans in the middle of the night up in the north central coast or down in Pescadero, you know what they are doing. I’ve been there at daytime tides, and you get these vans coming in. And I call, and fortunately Verizon has set up a cell tower there so I can get through, and you know what they’re doing. I approach them, but you don’t know - I’m 1 versus 14, I might get my rear end kicked, so you don’t know what is going to happen. But my point is they could be much more efficient. They are not learning quickly enough. They need to monitor message boards, what’s hot, they need to get on those and find out where hot bite is and go there. These guys broadcast messages, and it’s like “Yo. The hot bite is over . . . wherever . . . Pacifica.” If
69
you’ve got 2000 guys out there, if you are poaching, you are poaching. If you’re picking up salmon, they are poaching, but they are not efficient because it takes them maybe a couple of months to get onboard. If some guy parks out near Oyster Park or up in the north part of the Peninsula here and is watching the sturgeon run, and when those herring come in, when they start laying eggs in the shallows, he’s out there with night vision. But he’s catching on. I’d like to see more wardens be proactive and think like a poacher. So when these guys are dragging out that 7 or 8-footer, or 9-footer, and they are packing it up in the back of the truck, doing a tailgate party with the sturgeon, he can be there. But I mean, it is not happening as often. The poachers know they are short handed. Wardens can figure out what the best nights are for crime and be out there. It’s not hard to figure it out. Go to certain sites…at least for saltwater.
Larger Systemic Problems with Enforcement Participants across the four groups noted that even when wardens are doing their best to enforce Department of Fish & Game regulations, their efforts might be thwarted by the legal system.
If I go to court on a traffic violation, and you’ll see whoever has a fishing violation, and the judge will be so lenient. The Judge says, “It’s your heritage to fish for any species.” He’ll let these guys go scot-free. They’ll fill up a 5-gallon bucket with baby stripers. They don’t care about size, numbers, nothing, and they will be blatantly over fishing and ignoring the rules. The warden will catch them and the judge won’t do anything. This is mainly in Sacramento County – the judges are very lenient. Yolo County is a lot stricter. Unless the judge has a background in wildlife and in enforcing game violations, it’s just considered a petty crime. The judges look at it as a waste of their time. They will look at it and just dismiss it. I’m sure that’s the most frustrating thing for the wardens. Fish &Game needs to educate judges. Educated judges change policy. Domestic violence used to be treated as a minor offense. The district attorney’s office and law enforcement went in and educated judges about the problem and how they needed to deal with it, and they took it more seriously. A lot of counties do that with their judges –Shasta, Yolo. Here in Sacramento, judges do not take violations seriously. We need to pass a new law that game wardens can treat poaching as a felony and can give it stricter time. What has happened in the past is that certain ethnic groups have raped and raped and gotten caught and caught. It’s just a joke. They have had to put a little teeth in the law, but even so, it’s just beginning to be looked at. For instance, they had the Russian guys - had them in a chop shop with sturgeon caviar. They had all the restaurants they were selling it to. These guys are walking away with a big smile on their face. It doesn’t matter. They are getting $10K for a sturgeon for the roe and they throw the meat away, but they get a $1K fine. It’s a joke.
70
While not a predominant topic in the four groups, some participants did voice concern about the lack of regulation on commercial fishing, and its eventual impact on sport fishing.
Rules on us don’t apply to commercial fishermen. Sports fishermen are not the problem. Rod and reel guys, we’re not the problem. We’re the little guys. We don’t have the tackle manufacturers. We should have the boat manufacturers because we keep them alive. Commercial guys are changing the eco-system, raping the bottom of the ocean. They’re changing the ecosystem. We’re out here with our rods and reels. There’s really…as much poaching is going on, snagging big salmon, stuff like that, I don’t think it’s nothing (sic) compared to commercial guys.
I just heard on the station last week – it was on - –they were talking about water shipments and diversions. They found out they have foreign trawlers 10 miles outside of the Farallon Islands in the Bay just raping. That’s where all the salmon are going. The Chinese and Japanese - they are catching blue fin tuna and putting it in 40 degree below 0 and they’re trying to make this thing go extinct because they are selling it for $1,000 a pound. Unless we make the other countries clean up their…, we’re not going to be able to do anything about it. I heard they have the trawlers just right out here. They’re not doing nothing (sic) about it.
In summary, participants identified both regulation and enforcement as significant Department of Fish & Game problems. They noted that while regulations are necessary, the current regulations need rethinking and revision to be both understandable and practical. Education in regulations and their purpose may be an important step to reducing poaching among immigrant groups who hold different perceptions of fishing as a sport. Enforcement occurs sporadically at best and even then not always in ways that are applied equally across cultures. Wardens are in short supply and doing double duty. While they might use more efficient methods to ensure enforcement, participants also acknowledged that wardens’ efforts are often hampered by the legal system.
WATER MANAGEMENT Water management was by far the liveliest of the discussions across each of the four angler focus groups. It was an issue about which participants uniformly expressed passionate beliefs and opinions. They reported doing considerable research on the topic over a long period of time. It was a hot button for them, at least partially because of the intrinsic value angling has for them. Results of the discussion of water management are divided here into two major sections with several subheadings: 1) temperature and water quality concerns; and 2) water diversion concerns.
71
Temperature and Water Quality Concerns
Water Temperature We first addressed participants’ knowledge of specific water management issues such as water temperature and its relationship to cfs, concerns over pumping, and quality of water issues. When asked about water temperature as it relates to water releases from dams, and the impact of water temperature on livelihood of species, participants appeared well informed.
When you do release water – it’s timing – from the top or bottom – depends on the time of year. Release from the bottom, where it’s cold water. The salmon need cold. The river runs colder. If you release from top – from the turbines – it’s warmer water. It will change the entire river. You can be catching fish and the next day, nothing.
The Delta fish – too much water is released from the bottom of Shasta Dam that is extremely cold with too little nutrients. Almost too clean for what goes into the Delta. The Delta needs better nutrients. They are releasing from the bottom of Shasta Dam. The water is very cold and lacking nutrients – they had complaints about the number of fish going downriver. The timing is different. The creatures weren’t there to provide nutrients. The fish weren’t feeding. That’s one of the problems. Or if they create power while they are releasing the water, which also heats the water. Releases from the hydroelectric grids affect temperature. When they release water to make power they have to release water over and above that to keep the temperature down. I know another example of temperature being a factor for fish – on the Feather River, and there are proposals to put thermal curtains in Lake Almanor to divert the cold water into the river channel. That will drop water temperatures in the rivers by a couple of degrees. It is a big issue. Comanche had a problem with fish because of the lack of oxygen when they release at the bottom of the dam. They had to put in an aerator in the dam down there because they were killing a lot of fish in the Mokolumne.
The temperature of water was seen as inseparable from cfs, a point made by several participants.
72
Temperature of water – it keeps fish below or brings them up. At salmon season, you raise the water level thousands of feet per second, and that affects everything in the river. Plus it brings in moss off the banks, and the moss is catching lures, etc. You’re catching on the moss. It’s a fight the whole time – they do it on purpose.
Water temperatures are not being kept good. When you don’t keep up the cubic feet per second, the fry die because the water temperature rises. The same as in the American River where you have dropping and raising levels. Water levels where the ponds out to the side of the river get hot, and the fish die. Water levels keep rising, and the water gets hot. In smaller creeks, when you don’t keep up the cfs, the creeks get shallow and the sun heats up the water.
We work on a project up in the Bear River where we fought and fought to keep the cfs up at a certain level to keep the temperature down so the trout could survive.
Some participants expressed concern about the willingness of Department of Fish & Game to follow state laws that regulate water flow, thereby endangering species. One participant in particular framed the issue in this way:
There are specific state laws to protect, and Fish & Game has been empowered to use those laws exactly like the Department of Water Resources, exactly like the State Water Board who is supposed to be the policeman for resources, but they do not use those laws. Very seldom will they enforce laws when they can say they are going to crank up the pumps by another 2000 cfs, and say they will come out with it and there are no other biological opinions and that’s all it is, and say there is no harm by increasing the flow of water. Law is a under CESA that they should be using, along with (California Environmental Species Act – CESA) – which can be used to say no, you are not going to do that because of endangerment to the species. They can say no. But they take mitigation – what do you mitigate? Under the Bay Delta Conservation Plan, and it’s out right now, what is being offered to us is 15 new wardens for jumping the water and to increase the powers-that-be and they will hire more members for BD. They were actually covered under the four pumps agreement, going back to the Central Valley Project for mitigation, which they did away with.
Water Quality Concerns—Pollutants The quality of water in the Bay Delta and lakes was mentioned consistently across the four focus groups. While the majority saw it as a significant concern on a more general level, particularly as it related to the quality of fish they caught and ate, others took a more casual approach. That is, they acknowledged water quality was questionable but seemed content to live with the effects or to let someone else address the issue. Finally,
73
a small number of participants called attention to improvement in previous concerns about water quality.
There’s still plenty of pollution in the Bay – and still warnings and restrictions on how much should be eaten. It’s still a problem.
When you go to a boat ramp – you see the signs that say there’s a danger in eating too much fish from the Delta. That’s a concern of mine. You see it in area lakes, too. It’s not just the Delta, but also some lakes. Some of these lakes are more notorious because of their high pollution levels.
I would not fish in the San Joaquin system, but yes to the Sacramento system. There’s still good water . . . we are out every day fishing.
I eat the fish, but they say the water is not polluted. It is. Sure you eat fish from the river. It’s pollution but they say it is not. I have concerns about water quality – I have concerns but where I fish and the species I fish for. The species I fish for have been introduced, and they are survivors. I don’t see salmon swimming around where I fish. In the fishing aspect, it’s not a problem. Fish taste fine and I’m not dead yet. Water quality – sure it concerns me. Quantity is huge. I’m not a water expert, and I don’t think many people are here. There’s way more to it than I even want to think about. I’ll let other people discuss it.
Pollution is still there, but not as bad as it was. I do fish counting in the San Francisco Bay – a few times a year – and travel down that way to play golf. Driving down 80 past Emeryville when the tide was out, 40-50 years ago, you had to have the windows rolled up because of stench. Now you drive down there, and people are playing on the beach – kids, dogs, etc.- and all around the Bay. It has been cleaned up, and the oyster beds have come back. Baitfish and anchovies are back in the Bay. The halibut fishing wasn’t and now is because the water in the Bay is better and cleaner. It’s possible to do good if they would do it in terms of stopping this pollution. A lot of pollution in the Bay was industrial. Limiting in this county is a lot more difficult.
In every focus group the discussion of water quality quickly shifted from a more general level to specific concerns about pollution. Municipalities were mentioned as one source of the pollution.
Limiting municipalities would make the quality better.
74
Release of municipality waste – 400,000 gallons a day - in Stockton, the water coming out is supposed to be clean, but much has high ammonia content which is not regulated or prioritized. Doesn’t sound right.
Also ammonia from sewage plants. And sewage, too. Ammonia is a byproduct from sewage plants. You have three different kinds of treatments essentially at sewer plants, primary, secondary and tertiary, and the fourth one, the highest level you can go, but the problem is that most of the communities cannot afford to go through those, and that causes the change. All the plants themselves, about the best you can do with current technology. There’s pollution in the river – by the tons, they are dumping it in, but you can’t do anything about it. I showed game wardens and showed them where something was coming out - a sewage pipe from Corning emptying into the river. I called Sacramento and Redding and Corning. Narrowed it down to the woman running the sewer in Corning and took her out on the river to show her. She and the other people suggested I leave it alone.
They are getting ready for our sewage treatment plan to put in 48 inch pipe that will dump treated affluent into Sacramento River right below Chico Creek. They have been doing that for years with a smaller pipe. Now they are getting ready to put in a huge pipe. I won’t even wash a coffee cup from river water. We complained about 20 years ago about all the foam coming down river from septic tanks – plants are starting to recognize human waste – I had water tested from Monarch Labs, and our drinking water had 2m/something of human waste. If you get a fish, don’t fillet it and wash it off.
Most discussion of water quality centered on the issue of chemical pollution caused in large part by agriculture according to the participants.
Mercury poisoning and other contamination is a problem.
There are toxic levels of pollution at several locations – Rough & Ready Island – it’s the island hyperbolic to the Delta or vice versa
PCBs and mercury – everything – DDT still – everything is in the system. And the fish are affected. Nitrogen is coming off of fields from fertilizer into the Colusa Drain. In the spring it burns your eyes.
Farmers dumped 124M gallons of raw ammonia into the Sacramento River. There’s contamination in the water – 5 different heavy metals. I think you’ve got all the rice farmers and the other farmers that flood the lands, and they’ve got all
75
the fertilizers, insecticides, pesticides, herbicides. Then after they flood the lands, they pump the water back into… like the San Joaquin River, and the other rivers up there, and then the rivers run back into the Delta. Now you’ve got all these poisons in the water. They are weed spraying, too. It’s the type of chemical they are currently using. It used to be a different chemical. This one is more for the orithroids [participant did not know the correct spelling for the chemical], which is a. much more negative effect on fisheries in the food chain within the water itself than the other chemicals that we had used previously. The tradeoff was the other type of systemic chemicals they were using got into the human food chain possibly so they moved over to the orithroids, which is less likely. You are changing the river because you have all this fertile stuff. You have weeds when you’ve never had weeds before. All the fertilizer going into the river… The two primary chemicals are boron and selenium. Boron is coming from the San Joaquin Valley south as well as a lot of the nitrates. We tried to put a cap on that, but the dairies, at one point because of subsidies, we have more dairies than ever. And more cattle.
Water Quality Concerns—Salt Water Intrusion Salt-water intrusion was mentioned predominantly in the Sacramento, Stockton, and Antioch focus groups as an area of concern. In some cases it was linked to agriculture. In these cases, participants also tended to acknowledge that the intrusion of salt water was as much a problem for farmers as it was for anglers.
The biggest issue in the Delta is the pumps – the biggest issue is they have been anchored, and when the reverse pumps come on, you can’t keep an anchor on the bottom. That’s a fact. As that happens, salt water is intruding into farmlands. It’s not just an issue of fish. This water issue is…the people down south are trying to propose it’s between fish and agriculture. We lost a $5B salmon industry because of the loss of the runs up the Delta, but we’re also losing farmland as we speak because crops can’t be grown because the water is so salty you can’t irrigate with it. We have friends who have been catching flounder above the Rio Vista Bridge. As far as I know, flounder is a salt-water fish.
Agricultural pumps – for last 28 years, I’ve worked in a shop where we deal one-on-one with farmers. Trust me, you should hear their complaints about water quality and how many times it has to be tested going in and out of these fields. More and more fields are drip irrigations. You don’t even see the drip – it’s all underground. All you see with water now are rice fields. Rice fields are tested on a daily basis going back out into the rivers. If it’s too high, they will shut it off. Ag pumping is not like it was in the past. They are really, really monitored. It’s
76
costing these farmers a bloody fortune, which in a way is good. It’s good for all of us and it helps the quality of the river, but as far as Ag pumping, I think that is probably the least part of the problem. Most of the problem is the transfer to Southern California. If you had farmers here from the Delta here along the Sacramento and San Joaquin River, they would be telling you the same thing in terms of this water issue. They are fighting the salt-water intrusion. I talked to an almond farmer in Oakley. He sold his orchard because the productivity of the orchard dropped 50% when the salinity level increased.
In the above quotes, there is the suggestion that diversion of water to Southern California via the peripheral canal is a contributing factor to salt water intrusion, a point that is discussed later in this report. Regardless of the causes of salt-water intrusion, its effects were disturbing to participants, both environmentally and politically.
Is salt the biggest problem with water quality in this area? Not water quality, but the salinity hurts fishermen. The more water they export the higher it goes. The higher salinity level – it hurts us. We’re getting Leopard sharks are up here – past Pittsburg. When we see that, there’s something wrong. You used to be able to catch bullheads in the Bay…in Suisun Bay. They were out there all year round. All the small fish that used to be there are not there anymore. We’re getting saltier fish – there are bat rays in the Suisun. You think you’ve got a big sturgeon in the middle of the night, and you’re pulling up a 100-pound bat ray. Leopard sharks, bat rays, they are all the way up. It’s only going to get saltier and saltier. They are the Department of Water Resources. Their report says that salinity can go all the way up to Walnut Grove, and it will be just fine. If you look at the history of salinity in the Delta, you can start with Montezuma Slough. Back in the 70’s, they started constructing what is known as a salinity control gate on the east end of Montezuma Slough so salt water would not intrude as harshly into Montezuma Slough because salinity was killing the riparian habitat. On the bridge right here – on the other side is Sherman Island – it was one of the most productive asparagus farms in the Delta. Who owns the bulk of Sherman Island now? It’s now owned by Department of Water Resources because farmers could no longer grow asparagus in profitable amounts because of the salinity in the soil. They were suing Department of Water Resources when the finally came up with a deal where DWR bought most of that island. When you go across that island now, all you see is feed crops - feed corn, alfalfa and cattle graze. Now it no longer supports produce. Then the position of the guy from the Department of Water Resources is that historically, this estuary was saltwater. Their goal is to make it more salty. They
77
will flat tell you they want to build the Peripheral Canal to take away the water so it will get saltier. They will tell you that’s the way it is supposed to be. And it’s going to save the Delta. They say it is dying now because there is too much fresh water. They need to make it saltier.
Water Quality Concerns—Lack of Adequate Flushing Participants discussed that water quality is also affected by the lack of flushing that used to occur naturally but is now absent because of limited water. Along with the inability of waterways to refresh themselves without flushing, an additional consequence is invasive plants.
The water that would be coming in and flushing…it’s being transported down. And the more they transport, the more saltwater has to push in and fill the void. On a healthy river or stream, you get two flushing actions a day on the tides. When there is no flushing, pollutants come down and just settle. When the flumes come down, they just settle. I’m a homeowner in Lake Village Wetlands – we used to have 11 wells - our own water system and wells, but because the farmers on the east side of Delta overdraft routinely– The San Joaquin River doesn’t slow. There’s no flushing action on San Joaquin River – the salt content of water at Channel Head in Stockton has gone up by times three this year. As a homeowner, we had to close our 11 wells this year because we were pumping salt in the City of Stockton. We now have to buy our water through Stockton. Unfortunately, that salt is now getting to the east side of town. How long until the City is out of water? You can’t overdraft forever.
Do you know what the X2 factor is? They try to maintain the X2 factor at Roleround Island [unable to decipher exact name of location] at Pittsburg and you will see on incoming and outgoing tides, you will see tides come up and go down, but because they time the releases with the pumping, and how much will have to come down here to hold it at Roleround Island, that’s all it’s doing . It’s going up and down. Our West Delta used to be the aquatic nursery of life on the west coast, because the tidal flushing and the mixing of the salt water and the flushing of the silt out of the Delta. The food chain was abundant. Salmon schools now - that are naturally spawned – 80% of them get sucked down to the pumps and killed. The 20% that make it to West Delta, normally that’s an area where the salmon would fatten up on the organisms for the trip across the Bay out to the ocean, they are leaving the Delta trying to get to the ocean weighing less than when they got to the Delta. One issue is the water. The old type of algae has been replaced by blue algae, which is more toxic than other algae. There’s some new kind of coped that is all spiky, and the baby fish don’t like it so they don’t feed. They think the coped was
78
brought in on one of the ships from Asia, so that’s one of the causes. All these different things, and it’s really all those things. Then there’s ammonia going into the Delta from Sacramento. A lot of invasive plants - weeds, grass, seaweed, no flush so it just kind of stagnates and grows more and more. Somebody was talking about trawling – I don’t trawl too much because you get hung up in the weeds. Water quality would automatically go up if the water flow went up to where it was 30 years ago. If you had the water moving constantly in a decent flow, heavy algae blooms would not be possible. Salt would be less. Then the cycle starts all over again. We have less water flow. That’s automatically going to screw up the water quality.
Remember as a kid growing up, my dad would take us out trawling sometimes for stripers and sometimes for striped bass. The water hyacinth would be there at certain times of year and then it would be gone – it would die off on its own. It was just a cycle, just like the seaweed in the ocean. There were times when you trawled closer to shore because you wouldn’t get tangled up, you wouldn’t have all this stuff. Now it seems this stuff is around all year round and it never goes away. It’s thicker and thicker. It doesn’t die off. It doesn’t get pushed out. You’re talking about Eight Mile Slough out by Stockton? It doesn’t disappear. It doesn’t go through its cycle anymore. Thirty years ago, I used to go out and look for weed patches for fish. We would run all over the Delta because we knew where two weed patches were. Now you try to find a spot that doesn’t have a weed.
In summary, participants appeared well versed in their understanding of water temperature and its relationship to water flow. Their discussion of water quality addressed an overall concern with this issue, and in particular they mentioned concerns with pollutants from municipalities and agriculture. In addition, they identified salt water intrusion and a lack of adequate flushing as major quality-of-water concerns. The two latter concerns were mentioned in association with concerns about water diversion to Southern California, a topic that is addressed next.
Water Diversion Concerns Water diversion was a significant concern for participants in all focus groups and received more of their attention in the broader water management topic area than any other subtopic. Their concerns about water diversion were also related to some evidence they reported of wasting water. There was urgency in the responses of some participants for the need to solve the problem of dwindling water resources and increasing demand.
79
If we used water a lot better, there would be a lot more for fish and wildlife. Federally subsidized water is a big killer. A farmer is allotted, say 2200 acre-feet of water. Say a farmer only uses a portion of his allotment, say only about 1100 acre-feet of it. What does he do? He either uses it, or the amount will be reduced the next year. He just direct flows it onto his property with a 60% evaporation rate. We convinced all the small farmers in this area that percolation and drip systems are the best way to irrigate crops, and you save a lot of water doing that. Water quality depends on how much and what is being used – cities in the central part of this area don’t have water mains, Sacramento doesn’t have mains. They use 4 times as much as a city that size typically uses, so there are no controls of usage. The water has to come from somewhere. Stockton has no water meters either. They are just starting to try to correct that problem. It’s an awful waste of water – our water. And the flip side of what he is saying is that they are growing cotton down there, and that takes too much water. Chemicals seep out to Kesterson Dam with Dioxin and other chemicals. They have to grow that anywhere. They are flooding fields that were never meant for farmland so it doesn’t go in the ground They shouldn’t actually be farming most of that land that they are taking the water for in the first place. They are going to hide behind the striped bass and say, “Oh, it’s the striped bass”…so they get their water when they shouldn’t even be farming there in the first place.
I don’t believe the numbers that Department of Water Resources is talking about in Northern California. You drive up to Northern California, and you’re like, “Dang, last year there weren’t that many wineries. Where are all these wineries getting their water? They must be sucking out an extra 2-3 million acre-feet. In theory, the flow for pumping, adding the extra 2000 cfs, it might cause suction a few hundred more meters out from the pump mouth. Those little fishies are going to die– it’s the black hole. But beyond that, it shouldn’t take out any more. Why is it impacting even further? Somebody is taking it out upstream. I want to know, and if there’s a way we can impact how we assess the water upstream. Who is taking it out? How are they metering the removal of water upstream? And it took me hours of studying to figure out the water contracts and how are they transporting water between districts? And I’ve figured out that there is nobody metering this.
There’s a big cry for more water storage - more dams and more lakes. I look at the whole picture and that demand is because of Southern California. There’s a war of water going on right now. They need more water. We can’t give them more water because all our fish are dying and everything is going to hell in a hand basket anyway. We have not built water storage facilities in over 30 years. We’re growing, growing, growing. We need water, electricity, storage. We need certain things to keep growing and survive as a State, but we can’t take it from one source or another source. People are ignorant if they can’t look and see that we need more water storage, more water capacity. I think I’m controversial and
80
some people will hate me for saying this. Honestly I think there is room for both arguments on the water problem. We don’t need to give them the Peripheral Canal, but we need to explore other options so we don’t drain the American and Sacramento Rivers to meet water supply demands in Southern California. And that is in very much demand.
And it’s not even Southern California. It’s East Bay Mud. Take East Bay Mud (EBMUD). It’s the Bay Area. All of you people who look down there in the Pocket area, down by Freeport, that’s what those are going to do. They are going to take water from there and go over to the canal and pump it down to the Bay Area. They are going to build a new reservoir because they are worried about water quality. They’ve got one down there are going to fill and then they are building another. EBMUD is worried about water quality. They didn’t want to build it there. They wanted to build a canal behind The Rusty Duck (a Sacramento area restaurant). That was East Bay MUD’s original proposal. And the City went, “No.” They fought them on it, and then Sacramento compromised on it. They are going to dig up downtown and pipe it all the way across downtown – The Folsom South Canal. A lot of people don’t know that the Delta was at one time comprised of the two largest rivers in California – The Sacramento and the San Joaquin. The San Joaquin, back in the 1940’s got dammed up with Friant Dam, and it’s just this very first year, within the last month, The Bureau of Reclamation is allowing 250 cfs of water on a fluctuating scale out of Friant Dam to the San Joaquin. They are letting water back into the San Joaquin now. Up until just recently, below the Friant Dam, the San Joaquin River was dry for 60 miles. All that water used to come through the Delta. There was a definite tidal change. The flushing action created the Delta. And now 60% of the water that is supposed to go through the Delta is being exported. So that only leaves 40% and it takes more. What this Delta needs is water. Fish need habitat, and that habitat is blocked. Where do we cut it off? Shall we let the people down South not have any water? Shall we not have agriculture grow anything? Shall we not have fisheries? How do we reach some stabilization?
Aside from the general concern about water diversion and waste, participants expressed two specific concerns with regard to this issue: 1) an inevitable environmental catastrophe in Northern California, and 2) perceived disregard from politicians for the effect of their water diversion decisions on the environmental health Northern California. Inevitable Environmental Catastrophe Several participants expressed concern that diverting water will lead to environment catastrophe. The lack of water was perceived to be directly connected to community
81
and individual livelihood, as well as to a way of life that has long been a part of Northern California but that will not be available to future generations.
If you transport water from one place to another, the place that receives it flourishes; the place that sends it dies. That is history. You can see that history. You can see every place where water has been shipped, and you can see that history. Those of us who are seeing this transpire are predicting this is what is going to happen to the Delta. If they don’t stop pumping… You have to realize that all the money that would be spent building a Peripheral Canal – all the pork that would be in it and all the people wearing suits would get rich. Fish & Game, water management, they all have their hands in there. Look at all the money that would generate. And what time would it take? Would it take two years? Would it take 40? All that time it would be working would be money in rain barrel for all close enough to get it. The terrible thing is that it all comes down to dollars and cents. We’re going to lose our fisheries. We’re going to lose our water. They are not going to quit now. Farmers not using the water are selling it. The State that could use the water is pushing it out into the sea. Striped bass don’t belong here, and neither do any of us because we’re not American Indians. That doesn’t matter. When they want it, they just want committees to study, study, study. He [person sitting next to him] loses his clientele. I lose my clientele. I have no more reason to fish. There’s nothing left for my grandkids. You’re told to put back a fish. Put it back? Put it back for who? In ten years, there will only be a mud hole. Another part is that I’ve been told by several people and I’ve heard testimony about that water that between state and federal government, they have contracted out 240 million acre feet of water annually south of the pumps. The runoff deemed to be excess is estimated at 29M acre-feet. Now how Fish &Game can continue to stay neutral is beyond me, aside from the political aspects of it. No way will fish species survive that kind of pumping.
We have a report from a Fish & Game fishery biologist who says that this year was the lowest year for younger fish that he has netted in his career, and he has been doing this for quite some time. And so again all of the science and all of the data shows that water exports are causing severe damage to the Delta, and it is being completely ignored. That science is of no value to the politicians. Fishermen are observers, so we can see what’s going on. We can take those observations and find out when flows at the pumps jump from 4600 cfs to 6800 cfs, At 4800 feet you are in trouble primarily because of the methodology of pumping. They pump all at once at night, which creates a super suction and takes your whole food chain out. Then you get secret agreements and kick that up to 6800 cfs and then wonder why all the fish from one whole eco-system disappear within a three-year period. Some of the fish have a life cycle of 1 year, 2 years, 4 years. Then you are mixing all of those waters from all the various
82
ecosystems into one location, using it first on the farmland picking up chemicals, then shifting it out back into the water system and so those fish that are dependent on the native streams that they are from are getting all these mixed signals so they are winding up in dead end sloughs within the Delta on the Sacramento side and South San Joaquin. It is criminal. It doesn’t take rocket science. And to have the arrogance of certain scientists on the BDCP (Bay Delta Conservation Plan) program who sit there on the science committee... For the first time, we have at least 2-3 scientists from Davis are studying various species and saying it’s not necessarily one species vs. another, and yet you turn around have a statistician from Long Beach calling himself a scientist and making determinations on our fisheries. He has never been into the Delta, and he’s telling those who live here they can no longer have what they used to have. You have to make a choice. All the species are going to be in trouble unless we start managing water to not only grow food and make electricity – in addition to growing fish – we’re not going to get over this hump. 90% of the habitat can’t be reached. Hatcheries don’t work.
Why doesn’t Fish & Game stand up to these people and tell these water people they can’t do this? They know what is going on, but they are killing everything in the river and not doing anything about it.
Political Disregard Where voices became the loudest throughout the focus group discussions was when participants talked about politicians’ arrogance and disregard for their Northern California angler constituency in water diversion decisions. Participants believed that politicians would ignore any evidence that did not support water diversion agendas.
Water plans are suggested, and they got the full support of the governor and legislators. They basically want to put a canal up there with Arnold’s name on it, and that will be his legacy. They are building legacies, and they want to do it by moving water down to the South. Saving a few fish isn’t going to stop that program.
They have committed 8 times the amount of water the river gets to other entities How is that possible?
I can answer that. Because the Governor appoints all the Board of Directors of Water Resources, every member of the Fish & Game Commission, and the Director of Fish &Game. If the Director of Fish & Game (Koch)—you never hear from him, do you?—if he were to stand up once and say something about the Peripheral Canal is going to kill the Delta, he would be fired the next day. It’s politics as usual.
83
I sent that suggestion to the Governor and Department of Water Resources. They just want to divert from the Delta. They don’t want ideas. It’s a political issue. If there were mutual responsibility, they would capture that water that goes down that cement river in the winter. Getting back to the science thing - or lack of – ten years ago, a NASA biologist – he was the senior biologist - did a study on the effects of pumps on striped bass. His study was very critical of the pumps. He laid most of the decline of the fishery on the pumps. That study was immediately put in a drawer, and he was ordered to do another study that was more favorable to the pumps, which he did. So it causes me to think that whoever pays the scientist wants to get certain answers. They don’t pay any attention to science, ma’am. Science is not a factor here. If it doesn’t support moving water south, then the science is no good. There are 30 million people in Southern California. The reality is that people in Southern California have the votes that are going to count. Their interests are going to count. Whatever their interests are—whether we like it or not—it’s the reality.
In summary, the frustration level in all four focus groups peaked during the discussion of water diversion. Overall, participants were very concerned about water diversion from Northern California, both in the form of the waste of water and the diversion of it to Southern California. In particular they expressed a sense of being helpless to stop the denigration of a natural environment that had been home to sport fishing throughout their lives. In addition, they were angry, and to some degree hopeless, that they would ever be able to get through to the politicians who they perceive are knowingly creating this condition.
ADVOCACY EFFORTS/CONCERNS We originally designed questions to ask participants about overall changes in the fishing industry at the end of the focus group discussion. Their responses returned to concerns over water management and in each group inevitably reached a point of discussing what participants are doing to cope with their frustrations over this issue; an issue they see as critical to the future of their sport but as importantly, critical to the future of Northern California. These discussions were centered on various aspects of advocacy that fit into three themes: 1) actions participants are taking to advocate for change; 2) the need to unite to strengthen advocacy efforts; and 3) the challenges they’ve identified in taking action.
Actions Taken to Advocate for Change Participants mentioned three things they are doing to advocate for change: 1) staying informed and informing others of their concerns; 2) attempting to work with Department of Fish & Game and other agencies; and 3) attempting to work with legislators.
84
Staying Informed and Informing Others With regard to the first of these actions, participants reported they attempt to stay informed on issues critical to them and to inform other anglers through the network of organizations to which the belong. Most report belonging to more than one organization. As one participant put it, “We care so we are part of these organizations.” Organizations mentioned included the following: California Outdoor Heritage Alliance California Striped Bass Association CalTrout Coast Side Fishing Club Restore the Delta Friends of Butte Creek Friends of Lower Calaveras River Friends of the River Water for Fish These organizations use a variety of methods to provide information to members and the public such as mailers and list serves.
Save the Delta. We advocate and organize letter-writing campaigns. The way I see it, and I do participate in those, but the way I see it, we’re really small. We’re way down on the totem pole. We’re the toenails at the bottom of the totem pole. So much more influence on the water rights. Mark Twain said whiskeys for drinking and water’s for fighting over. It goes back to the history of this nation, this State, the West. We see it in the water diversion plans. You see it in the Panama Canal size proposal that’s out there today. And it has the full support and backing of the Governor and the Legislature. I‘ve worked with Coast Side Fishing Club –I get information from them – that organization started in the Half Moon Bay area. Some people in the club have list serves. We put information on site for everyone to see. I don’t have that capability, but there are people in the club who do. It’s more you just put something up on a site and people can look at it.
Some of the organizations have the capability to invite guest speakers. From participant comments, it appears guest speakers are invited because of their expertise in matters important to members (e.g., water management). In some cases, however, speakers are invited because members feel they need to be educated about member concerns.
UC Davis has given us some help, but science is only good if it means moving water south. There has been support from other university groups.
85
The West Delta Chapter of The California Striped Bass Association does have speakers. Late last year, Tina Swanson from The Bay Institute spoke. At our last meeting, we had a gentleman named Tom Lindemoot, who is a retired scientist, and after he retired from private industry, he taught science at Freedom High School in Oakley. He goes out on his own. He is limited to a kayak and the instruments he has on hand at the high school. He has been studying what has been happening in the shallower areas of Big Break. He feels a lot of the problems in this particular area have to do with too many nitrates on the bottom. Oxygen levels are so high in the water during the day that aquatic life can’t live. And then when the sun goes down, he says the oxygen level drops to below the point that anything can live. He had a couple of pictures of fish that were dead, that were floating on the surface. And he thinks he doesn’t find much of that because the predators move in and feed on them. They are more mobile, and they can get out to better habitat. But yeah, we do have speakers and fishing guides and all sorts of people. We invite guest speakers – they are coming to the association to learn about issues and we have to teach them. We’re teaching them more.
All groups reported a wide use of the Internet to gain information related to their advocacy efforts. Sometimes they searched the websites of other fishing clubs/organizations, but there was also mention of favorite sites, and of individuals who regularly searched for Internet information of interest to organization members and made it available to them through technology.
There’s another organization that is putting together a significant program to combat this – it’s called Restore the Delta –and if you go to their website, you will see that their objective is to make sure the Delta is available for recreation and agriculture and the water is usable and potable. It’s an organization that at least a couple of us will donate our honorarium [from the focus group]to them. Fishsniffer.com is one of the better resources in what is going on day-to-day in Sacramento
The Internet is one way, but [names deleted] are fountains of information and that’s how I personally stay informed. These guys spend a lot of their own private personal time researching this stuff and talking to people in the know and bringing it back to the striped bass club and putting it out on the Internet and through e-mails and stuff. It’s a wonder… I get stuff from [name deleted] a lot. He gets it from Coast Side. Now certain foundations are helping us out to restore the Delta. Restorethedelta.org gives us updates and some ammunition. We saw something last week on You Tube. It’s a strong counterpoint to Department of Water Resources.
86
A few other means of gaining valuable information were reported but participants indicated they were too costly or questionable in terms of the return on investment.
The Water Education Foundation has received a lot of information and has invited them to go on tours to various ecosystems and various water locations, but the cost is high. I’m all for education and learning as much as I can. That’s one reason I go to a lot of the resource meetings, but they turn around and want 400-600 dollars, and you take volunteers from organizations… We just don’t have that kind of money for 3-day trips. On the bad side of this, as I took a class through the San Joaquin County Office of Education on Save the Delta. The first day of the class was a bus trip, a tour of the Delta, and about 40 teachers get on the bus, and the gentleman who gets on as is the tour guide is from Department of Water Resources. He sat there and spent the whole day explaining how their plan was going to save the Delta. And what killed me is that there are 40 college graduate teachers on this bus, and no one questioned it. Finally, I got sick of it and I started calling him on his science. Of course, he couldn’t answer it because it was all hogwash and didn’t fly. Finally, he got mad and said he wasn’t taking any more questions from me.
Attempting to Work with Department of Fish & Game/Other Agencies Participants across the four focus groups reported that they had tried to work with Department of Fish & Game and other state agencies to resolve their concerns. Unfortunately, these attempts have been less than satisfying. The first of these quotes is indicative of the overall feeling of participants voiced of being treated with a lack of respect by the Department.
I want to make a comment about the advocacy – a lot of us are involved in advocacy to some point. One comment I want to make is that while we’re trying to advocate for our sports and preservation and conservation of species, there seems to be an attitude within the powers-that-be that fishermen are actually responsible for the demise of the fish. My comments are based on my calculations – not that I’m a fishery biologist – but I eat rocket science for breakfast (I do really complicated physics) - but it’s actually something outside, something external that is causing the demise of the fishery, not the fishermen. We’re representing a fraction of the percentage of the total take. We have 40 million Humboldt Squid that have moved up from South America over the last two decades and are eating billions of pounds of fish. And they don’t regard the size of the slot limits out there. So they are depleting everything. The salmon studies – it’s not salmon getting out to the ocean; it’s something in the ocean that is taking them. If you have 200 extra Orcas that have bred over the last few years - guess what – they eat 69 million pounds of salmon. I was up at Capilano River at the mouth of the river in Vancouver and they had a pod of these guys come in. They decimated the early April Chinook run in Alaska. That’s it – it’s gone for the year. And they are mammals. They come back every year. So just doing base
87
calculations, we presented my findings at Fish & Game and FDC. So they come back with size…”No, you are not a fishery biologist.” I’m a Ph.D. too. Let’s show some mutual respect. My ties to Canada are stronger than yours. I know about transport because I see it. It really ticks me off that they don’t respect us. We presented in Sac, though. You spend all this time advocating and my solution? I got a house up in Vancouver. The run’s right next to my house, and I just was out with my kids and we get our slot. We have one rod and five people. We just take turns. Every three casts, we got one. I’m tired. There is something else going on – we want fisheries guys to figure it out, use some extra IQ, figure it out and stop the hemorrhaging, but don’t blame us. We’re conservative. We’re catching and releasing. We’re trying to advocate and do conservation. We are out trying to get the little baby salmon down the river and protect them and get them out so the stripers don’t kick them out.
We had game warden at Coast Side who used to give us a lot of information on Fish & Game. He would take the information and post it online. If you had a question, you could give it to him, and he would be right there to answer it. He got muzzled. He did write a letter to the task force about the NPA process. I’ve read the letter at the science meeting, and that was the last thing I’ve ever seen that was written by him. You see that at other agencies. You meet with people like from NOAA or Fish & Game about various subjects, and they listen to you and say “Great idea, great idea” but they have their own agenda they are going to follow. That’s the frustrating part—they think they have a better idea. The field biologists [at Department of Fish & Game] are generally trustworthy. I’ve never had a problem with them, but they are muffled. They work for a State agency. Trying to deal with Fish & Game and all the misinformation. It’s the first time in 10 years that I’ve decided to come to a meeting like this. I got tired of going to Sacramento, going up and down the state to the Warm Water Fishery Board and things of that nature – nothing was getting done.
Attempting to Work with Legislators State Senator Lois Wolk was mentioned in three out of the four focus groups as being a strong advocate for anglers. Participant comments about advocacy, however, indicated that she is the only legislator perceived as committed to representing their concerns. Overall, their other experiences with legislators have left them frustrated.
We have gone to the legislature and try to find a sympathetic ear, and sometimes that works and sometimes it doesn’t.
88
If I can give you an example of the frustration, I was involved in an NPA process along the Central Coast. I was a stakeholder with several other recreational anglers. It became clear that the agenda had been set before the process had started. And they pretty much did anything they—this was the State, our State—they did everything possible they could do to have what they perceived was the proper goal. They made record time. They appointed a Fish & Game Commissioner whose agenda was well known before it was even thought about. It was very discouraging. We were used as showcases. I’m trying to think of the term that’s used. It is transparency. It’s the transparency thing. We go down to the Capitol and had 250 people on the steps of the Capitol two and a half months ago– we were down there talking to some legislators but in reality– in the end we talked to a couple of them and they said it’s really not helping much, but trying to get the voice out. Give the Delta a Voice—we were down there.
The problem is these people in power in Sacramento right now. What has happened when you have five Delta counties with almost five million people that would be most affected by these water projects . . . and they appoint a 14-member board to determine the water issue in California, and Darrell Steinberg—who is out of Sacramento, which is one of the five counties—is the only Delta representative. Not one Delta legislator was included in that group. Lois Wolk has been the biggest advocate for the Delta, and she wasn’t included because he (Steinberg) was trying to get a consensus vote to get a water bill passed. What kind of representation is that for five million people when they are entirely excluded from things that are going to affect the Delta, their water supply, their groundwater, their agriculture, their tourism, their fisheries? We have a voice. We have one legislator who is really on our side - Senator Lois Wolk. She was elected as a representative from a large constituency along the San Joaquin River Delta. There was just a commission of seven people established to study the “alternatives.” The perfect place for her was the Fish & Game Commission to study the problem, but she was purposely left off the commission. They isolated her. She was purposely left off so there was no representation from our area. How are we represented? We elected that lady for the very reason that she speaks up for the Delta, and they purposely left her off and isolated her. I love fishing. It’s a lifelong passion. I see a lot of problems, and I’ve gotten involved in hearings and Senate meetings and spoke up for different causes, but sometimes it just feels as if you’re wasting your time because you don’t want to just sit there and complain – you want to see if you can be part of the solution, but just doesn’t seem like you’re getting anywhere. You’re fighting an uphill battle.
89
I’ve gone to a couple of hearings in past two years especially about the salmon runs, and there’s pretty good attendance from Southern California and the Delta/Sacramento/Stockton area. But the meetings are in Sacramento. There’s no effort to get input from Northern California. Maybe they don’t LIKE Northern California.
It’s really frustrating when you are fighting to defend the fisheries and the fishermen and the needs of the fisheries themselves, and you associate with so many different groups and organizations, and then do lobbying with legislators who obviously get all of their information from their staff, who don’t have the faintest idea except what some lobbyist who is paid to feed them that information [has told them]. And so it is very frustrating.
Unification Needed to Strengthen Advocacy Efforts In all of the focus groups participants acknowledged that they need to find more effective ways for their voices to be heard. One solution to that problem is uniting—forming coalitions and alliances with similar organizations. This movement toward unifying efforts was described by one participant as a “paradigm shift” for anglers and it is still in infancy as can be seen by these participant comments.
What’s good about coming together in groups like this, we started to ally fishermen. They are largely fly fishermen and whatnot, but the groups are beginning. The leadership in the groups is now getting support from Southern California, and we have been working Long Beach for three years at the various shows. We have a lot of coalitions. We have a lot of small coalitions. Things are changing somewhat, but I hope it’s not too late. We have allies in the agricultural community in the Sacramento and San Joaquin areas.
Some participants were clear that the unification efforts must sometimes include organizations that in the past would not been considered good partners. In current times, however, finding common interests upon which to build alliances is viewed as essential to gaining power, power that is necessary for successful advocacy.
You can’t just be fishermen anymore. It’s not just one organization. We have to co-opt with those groups that perhaps we don’t always agree with, but they may have the science and the political will or background in order to give us the direct information. It almost has to be by the courts because politically, fishermen have little to fight with. There are 35 million people in California today. They need water. We can’t fight that. But when you look at who has been successful in fighting in the past
90
25 years, it’s environmental groups who go to Court to protect a salamander. So they are able to get stuff done. That’s what’s going to have to happen with these striped bass issues. We have to make alliances. This is changing to a large degree. I mean, a long time ago, how much in common did I have with Coast Side? I lived on the salmon coming through the Delta. That’s common ground there. I’m finding the same thing with Friends of the River. These various groups are from cold water fisheries along a lot of the different rivers, and we have more and more in common, so we’re putting those things aside, and one, no two or three big common groups are handling the battles in the courts for us. CSPA largely through Bill Jennings and Michael Jackson are the attorneys. We’ve won a few very important suits. Fortunately, somewhere there is a common ground. Like Restore the Delta—I saw that gave agriculture, commerce, ethnic groups, church affiliations. We’ve got the Diocese, as well as fishermen. The intent is to make the Delta a fishable, swimmable, farmable area in 2010 – that’s our goal. And drinkable too. I’m kind of involved with the NRDC (National Resources Defense Council). They have a $70M budget each year. There is not a fishing group in America that can provide that. They’re involved and have a hand in everything in California. On one issue, for instance the MLPA (Marine Life Protection Act), I hated them. They were the opposition. They were who we were against. Now we’re involved in another issue with salmon of late, and there’s a guy sitting next to me from NRDC. He’s on our side. We have to realize that one day, they may be against you, but the next day, we may be on the same side. Just generally, you can’t draw a black and white picture of this.
At least one participant noted that these newfound partners must be viewed with caution as they may not always be reliable.
We have foundations like Resource Legacy Foundation, and they are one of NRDC’s (National Resources Defense Council) major funders. We had a board member on Restore the Delta who was from NRDC. We no longer have that board member. She moved to Albuquerque, New Mexico and we never replaced her. The organization was strongly opposed to the Peripheral Canal until the National Resource Legacy Foundation said, “You know that $60M we give you every year? It’s liable to go away.” So all of a sudden they are for the Peripheral Canal.
Participants acknowledged that forming alliances among groups that have traditionally been at odds is not necessarily easy. As concerning to them, however, is the fact that even when the organizations are similar in nature, they have their own agendas that sometimes get in the way of committing to united advocacy efforts. They report some success in meeting these challenges.
91
The reason I came today, is that my main concern is that I’ve reached out to almost all these organizations –I know some of the people, and I’ve distributed information for Water for Fish. But unfortunately, they want to project that the whole problem is sending the water south. That’s not the only problem. We’ve got pollution, we’ve got all the things we’re talking about here. They don’t want to hear about that. All they want to do is concentrate on the water, okay. We need to get everyone together to work on the same playing field. You know, Save our Bay, Citizens for a Better Life, you’ve got all these different things, but they’re not all on the same playing field. Then something would be getting done.
Now with this current crisis we’ve having with the water diversion, you’re seeing more and more small groups are coming together and forming coalitions. There is a little more work between the groups. That’s one thing going for us. It’s kind of like the cat in the back yard. All the birds on the power line sit still for a cat. Once the cat leaves, the birds start to bicker with each other. One of points I have found is that in trying to do conservation and trying to help my particular small little fishing area, I ran into another group of fishermen. We have the warm water fishermen, we have the cold water fishermen, we have salt water fishermen, we have the fresh water, and each one of them have their own advocacy group and they are doing something specific to protect their species or their habitat. And it may conflict with what I need in my particular area. I attend meetings where they were talking about one thing, and our group was talking about another thing. All of a sudden, it goes to “Well forget the whole thing.” You realize the politics of it. And then you get some conservation group in the middle between it, and they kill both of you. It’s hard to form a coalition, but everyone who is involved in trying to save this estuary, they do it on their own time and own dime. There are no big donors to help us fight our fight. Any squawk we put up is because people are volunteering their own time and money. Did you hear about the Million Boat Float that happened up on the Sacramento back in August? That started right here out of this yacht club. One of our members and myself did it.
We can’t get groups together – if we went up there in mass, we would probably have enough. It’s organization and getting the people.
Challenges to Advocacy Participants identified key factors that hamper the success of their advocacy efforts. These factors included such things as difficulty in knowing how to persuade non-anglers of the severity of the problems they face, a lack of money to get their message out, and difficulty finding sufficient to devote to advocacy.
People have to regulate what they know. It’s hard to convince someone in a type of a job or a type of an office environment or type of the hustle and bustle where
92
both people work that they should care about striped bass or sturgeon. They could care less. They have their families to worry about. Oh, look at me. I got a big fish. It’s not important to them. But the problem is we’re a minority and don’t have the resources to get our message out. So the average person, even in this area, thinks the information from Department of Water Resources is the answer; they believe it because they don’t really know. They listen to it and they see a commercial on TV for it, and they say, “Oh, yeah, that’s a great idea.” It’s so hard for us to get our message out because we are a minority, and we don’t have the millions of dollars the Central Valley has. We can’t do anything without it costing money. We paid Michael Jackson $50K so far – and we have to pay him another $50,000 - to fight a lawsuit that Fish & Game got sued on. We have to pay that bill. We can’t pay that bill. Big water companies - they can find the money. We can’t do anything about it. We’ve been doing this for over 30 years. We’re disgusted. This guy here starts an organization, but we don’t have clout and don’t have money. It takes money. I don’t know what’s going to happen. We’ll never see the end of the Peripheral Canal anyway. But will our grandkids - they are not going to be able to understand what we did for a living. Going back and seeing what my family did. Our family fished for a living – they will not understand that. As volunteers in various groups around the State, we’re trying to make some changes or have some stuff going in our favor. As volunteer it’s just that we have 8-hr a day jobs. We’re not getting paid for our time. But by golly, you call anybody at the State, the City, the County, and at 4 p.m. –they don’t answer their phone. They’re off the clock. They don’t have to talk to you. If you have enough retired people- and that’s not going to happen - to start calling and pressuring these people, it would work. You get after 4 o’clock, you’re not going to get an answer from anybody except what time happy hour starts. I’m sorry, but that’s where it’s at.
A point that was mentioned often as a challenge to success of advocacy efforts was a general dislike of politics that was identified by many participants as somewhat inherent in them. These participants were adamant about wanting problems fixed but did not want to engage in advocacy efforts. Others had developed a dislike of politics through disappointment and frustration caused by too little return on their advocacy efforts in the past.
As fisherman and outdoorsmen, we’re the get-her--done kind of people. Lots of folks I hang out with don’t have the patience for politics. To see this stuff through [water diversion to Southern CA], do we have someone to talk to? We kind of hope someone else will do it for us. And I think that’s a big problem with me and some of the people like me. We want to yell, “Just Do It.” It doesn’t work. It’s tough for those who don’t have much patience. Do we have people to talk to? I
93
don’t think I’m politically organized enough to keep up on some of that stuff. We have very little ability to talk to people. It’s tough for us. We just go, “Build the canal – I’ll fish in it.”
Some of the big problem I see is that people don’t want to get involved in the politics as fishermen. You have Coast Side and some of the other places I belong to, and there are some with political specialists, but you don’t get a lot of people buying into it because they think that politics is a load of crap. And it is. And it burns people out like (series of names). Mostly we’re fishermen who like to fish; we enjoy our individuality and we like our freedom. They keep shoving crap down our throats. It’s water mismanagement; it’s regulations for this and that. People get frustrated and eventually give up.
In summary, participants reported that significant concerns over water management issues in particular have driven them to engage in advocacy in a variety of ways. They are doing their best to stay informed on issues through their fishing organizations. They are usually members of more than one organization and receive and increasing amount of information via technology (e.g., list serves, websites), and from guest speakers. They have attempted to address their concerns with Department of Fish & Game and other agencies, as well as with state legislators, but the results have left them frustrated and angry as they are often disregarded. While still in the initial stages, they are beginning to build alliances among their fishing organizations and with other advocacy groups. They do not yet feel completely comfortable with these arrangements but believe they are a necessity if they are to gain more political capital. They face additional challenges of learning how to garner support from the public for their cause and how to fund their advocacy efforts.
CONCLUSION
Fishing is much more than just a sport to the participants of these focus groups—it represents a way of life that has meaning and value. Its worth has developed over a long period of time (sometimes generations) and for most goes beyond the level of “bragging rights” for who has caught the biggest fish. They could not talk about fishing without discussing it being a good way to spend time with family and friends, to reduce or cope with the stresses of everyday life, and to simply enjoy nature. There was both laughter and nostalgia in each focus group as participants recalled their motivations for fishing. It is perhaps because fishing is a way of life to them that they are so disturbed by the significant conditions that are impacting this sport. Overall they reported an unwillingness to give up fishing, even the face of a recession, although it has been necessary for them to change locations, adapt to declining availability of species, and in many cases to cut back on what they have traditionally spent to fish.
94
Looking across the participant comments in these focus groups, three strong messages stand out: 1) dissatisfaction with Department of Fish & Game Regulation and Enforcement; 2) significant and growing concern for water management; and 3) the need for increased advocacy efforts by anglers. Dissatisfaction with Department of Fish & Game Regulation and Enforcement The first message is that participants in these focus groups were unhappy with regulation and enforcement of fishing by Department of Fish & Game for a variety of reasons. Regulations are perceived to be ill conceived (in some cases doing more damage than good), fraught with red tape, and poorly written. More important to these participants than the regulations themselves, however, was both a serious lack of enforcement of them and a growing concern over unequal enforcement (i.e., some cultural groups not being held accountable for poaching). Despite having great empathy for wardens (who they described as being understaffed, overworked, and doing double duty in policing venues other than fishing, these participants expressed little faith in Department of Fish & Game’s ability to regulate well. There appears to be a disconnect between anglers and Department of Fish & Game, expressed in anglers’ perception that they have no representation at decision-making levels of Department of Fish & Game. They respect certain employees of Department of Fish & Game (e.g., biologists, wardens) but in general distrust the Department and the commitment of those in power to protect their interests (which they see as public interests), or to even sincerely hear their concerns. This distrust extends to the legal system, judges in particular, whom they argue have contributed to the problem of poaching with weak legal sanctions. Significant and Growing Concern for Water Management The second message was that water management is poor at best and perhaps the leading cause of what these participants described as an environmental catastrophe in Northern California and the collapse of their sport. They recognized the complexity of the problem and possible solutions, and pondered in our discussions where the answers lie with regard to meeting the increased demand for water from agriculture and from Southern California. Two participants described their understanding of the complexity in these ways:
There was an interesting article in the Fresno Bee yesterday about how some of the big farms or one of the big farms had just sold their water rights to a City down in the desert area. They are going to quit farming. They have rights to the water – as California grows, there are over 35 million now, who is going to pay the most for that water? Cities or farmers? We’ve gotten ourselves into this situation, allowing these water contracts and allowing them to sell those contracts to other places. Who is more willing to pay for water? A developer building 4000
95
new homes or the farmer in the Valley. More of that water will end up going south. Our whole system is so screwed up on this water bill thing. More dams means less water for fish. If we start putting in more dams, it’s going to be less water to support fisheries; 95% of their habitat is behind dams. To make more dams is a Catch 22 situation. We will provide for more people, but will not help fisheries. When they put in Shasta, they were supposed to put in a fish ladder to help salmon. They did not do it. We don’t have that. Talk about fishing industry taking it in the shorts. Salmon is an indicative species because they are sensitive. If we wipe them out, other species will follow. Just the rotting carcasses of the salmon make everything else possible…
The politics guiding water management decisions were abhorrent to participants. They blamed politicians for the destruction of the fish population that results from dwindling and mismanaged water resources; from pumping, lack of adequate flushing, and intrusion of salt water. The blame results from what participants expressed as legislators’ blatant disregard of the consequences of their political decisions surrounding water management and a perceived arrogance that they can do so without accountability to the people who live in Northern California. They point to examples of the unwillingness of legislators to address tough questions about water management as evidence of this disregard and arrogance. For example:
I’ve asked it for 30 years and we don’t get an answer. They don’t know how much water it takes to sustain the Delta. They are willing to commit eight times the water that comes in to the Delta. What the hell kind of insanity is that?
Participants saw dealing with water management as a rush against time to stop the damage being done to sport fishing. Time and again we heard in the focus groups that problems of water management were not new but that the effects of those problems were becoming more visible and dire. There was genuine concern that if something is not done soon to stop this tide, it may be too late. What made this possibility all the more unacceptable to participants was the thought that it would have happened because of political greed. As one participant noted:
When you’re out of water, you’re out. Writing a check will make no difference. Oroville and Shasta are down. If we don’t get rain, like we didn’t get it for the last 3-4 years, there will be a lot of fish dying and a lot of fighting over that water. First couple of years are going to be rough, but you’re going to have to save water somewhere. Oroville/Shasta/Whiskeytown are the only dams pumping it in, and they are all low.
Need for Increased Advocacy Efforts by Anglers The third message addressed the need for increased advocacy efforts by anglers. The participants of these focus groups were quick to point out that they have long engaged in advocacy for their sport but it has been in ways that were not always visible at a
96
public level or publicized. As was noted earlier in the report, many participants are in some way involved with teaching youth about fishing. They view this education as critical, particularly because they do not see them getting the education anywhere else. Participants described educating a future generation of anglers as one essential mechanism to keep the sport alive. As one participant put it:
The biggest problem is the lack of education. If we’re ever going to get young people involved, we’ve got to be educated on some level. There are no classes about fish populations. Hunters have classes they have to take. They don’t teach that for fishing. We need to be educated. We’re contributing to the problem. We’re all byproducts of what we do that nobody pays the consequences for.
A participant at one of the focus groups described the kind of commitment to saving fishing that is indicative of anglers, but that is often not publicized.
I was lucky enough to be part of this, and perhaps some others in the room were, too. About two years ago Prospect Island flooded, and they had a lot of stripers trapped in there. They repaired a levee break and trapped these stripes, and there was a call on the angling community to rescue these stripers. It was a real privilege to be there and to be part of that. It was a grass roots effort where everybody came together and worked over three days to rescue thousands and thousands of fish. It may a huge difference. That’s where we can make a difference. In situations like that, the government was hogtied. Government representatives could stand there and observe, but could not participate. It was only us down there in the trenches. We were physically grabbing the fish in our arms, putting them in a tube, and releasing them back in the river. It was really incredible to see. So there are ways we can make a difference.
It became clear in these focus group discussions—particularly the discussions of water management—that participants realized advocacy must become a stronger priority for them and they must get more sophisticated in their advocacy efforts. This shift was uncomfortable for a few participants who confided they hate politics and just want someone else to fix the problems they face. For most, however, there was a recognition that if they are to save the sport they hold dear, they must: 1) develop strong ties between fishing organizations and unite in their advocacy efforts; and 2) build alliances with groups that may have traditionally been perceived as “at odds” with anglers to gain more power at the state level. Currently, the participants describe being in the infancy stages of sophisticated advocacy and they face a number of challenges (both internal and external) in meeting the two goals above. However, if they can accomplish them, it appears they could gain at least some measure of the political clout they desire as well as increased publicity for their cause. A final note of observation is offered. Obviously all of the three messages above are interconnected. Perhaps as importantly, the participant comments in this study indicated that currently they trust only other anglers in trying to solve the problems outlined here,
97
and even that trust has some limitations. Their experiences have reduced their faith in Department of Fish & Game, in other related government agencies, and in state legislators (with the exception of Senator Lois Wolk). While they understand the need to build alliances with other advocacy groups, they are still somewhat leery of doing so and they lack vital resources to advocate successfully on their own. To make progress in combating the problems they identified in these focus group discussions, however, they will need to find and develop trusting relationships across government departments, agencies, and legislative bodies. Following their attempts to do so may tell us much about the future of sport fishing.
98
EQUIPMENT SALES, MARINA OPERATORS & GUIDES
FOCUS GROUP REPORT By
Dr. Ruth Guzley, Ph.D.
INTRODUCTION
Below are the results of focus groups that were held from September through November 2009 for California Department of Fish & Game. A table appears below reflecting the number of participants attending the focus groups at each location. Date Type of Focus Group Location # of Participants 9/9/09 Sales/Marina/Guides Sacramento 11 10/14/09 Sales/Marina/Guides Antioch 8 These focus groups exclusively addressed issues related to individuals involved with equipment sales associated with angling, marina operators, and guides (see Appendix A for the interview guide associated with these focus groups). Each focus group lasted approximately three hours and participants covered six topic areas: 1) angler behavior, 2) federal government subsidies, 3) water management, 4) species management, 5) California Department of Fish & Game (CDFG) regulations, and 6) the impact of the recession. Questions about angler behavior centered on any changes observed in angler behavior that related the fishing industry as a whole (e.g., increase/decrease in sales of fishing licenses). Questions on the topic of federal government subsidies for commercial salmon fishermen addressed how these individuals had coped during the ban on salmon fishing. Questions about water management asked participants to identify and respond to a variety of issues on this topic, and specifically how it affects the sport. The questions addressing species management centered on those things that affect the supply of fish and on hatcheries. The fifth topic area of CDFG regulations asked for participant opinions related to allowable catch and whether regulations were applied equally. The final topic asked how the recession had impacted participants’ businesses, commercial fishing, and sport fishing in general. A final question asked participants about how advocacy efforts are supported through fishing organizations. Each focus group was recorded in two ways: 1) by audiotape and 2) by use of a trained recorder from the Program for Applied Research & Evaluation, CSU Chico, who recorded notes throughout each session on a laptop. Participant names were not recorded to protect their identity and identifying information has been removed from participant comments to protect their identity. Prior to analysis of participant comments, the notes taken by the recorder from Program for Applied Research & Evaluation were compared to the audio recordings for accuracy of participant comments and any necessary revisions were made to the final copy of notes. The author of the report then conducted thematic analysis to analyze participant
99
comments across the two groups. Comments have been aggregated to reflect both similarities and differences in the groups across topic areas. At the beginning of each topic area, a brief explanation of themes associated with that topic area appears. Also included with each theme are representative comments from participants. Topic areas may appear in the report in an order different from that showing on the interview guide because the participants introduced a topic earlier than planned in conjunction with discussion of another topic.
ANGLER BEHAVIORS The questions addressing participants observations of angler behaviors centered primarily on three areas: sales of fishing licenses, species decline, and government subsidies for salmon fishing. Also included in this topic area was a discussion of hatchery fish substitute for wild fish.
Fishing Licenses We began these focus groups by asking participants about fishing licenses. In particular we asked their perceptions of whether sales of fishing licenses had increased or decreased and how they explained the change (if any) in sales of licenses. An additional area that emerged from this discussion was the politics associated with the license. Increase/Decrease in License Sales Participants disagreed somewhat about whether sales of fishing licenses had increased or decreased. While none of the participants mentioned an increase in license sales there were those who believed sales had at least remained steady. Their explanation for this condition was generally tied to the perceived likelihood that anglers could be counted on to purchase licenses or to a changing angler population that allowed previous sales levels to be at least maintained if not increased. These sentiments are captured well in the following quotes.
I’d say it’s about the same really– anglers are likely to buy licenses, but they ask about the kind of license they should buy.
I’d say that the old timers are getting away from fishing because it’s so terrible, so regulated, so fed up with it. There’s an influx of new people, but people leaving are being replaced by a few others. The money probably stays the same.
The majority of participants in these two focus groups, however, indicated license sales had decreased. Some tended to guess at the decrease while others reached a conclusion about the decline based on some kind of record keeping.
Probably it’s decreased by three quarters of a million.
100
If you’re a guide, they have to show you a license before you can take them out. I know that through my political activity – the license sales are decreasing annually and severely. We do track fishing licenses. Sales have definitely decreased.
These participants commented that the quality of fishing has had a direct impact on license sales. Specifically, as the quality of fishing has decreased in California so have license sales. In both focus groups, participants indicated that CDFG could do a better job of researching why license sales are decreasing. As one participant noted:
In 32 years of selling fishing licenses I’ve never once had a Fish &Game representative call me and ask what they needed to do to sell more licenses. They don’t ever do that. They should take care of their customer base and their revenues. They don’t care.
Influences on Sales of Fishing Licenses While the quality of fishing was mentioned as one influence on the overall perception that license sales had decreased, it was not the only influence mentioned. Two other influences were addressed: 1) the cost of the license, and 2) the ease with which the license can be obtained. Cost of the License. Participants indicated the continually rising cost of the license was also an important factor, particularly when coupled with a decline in the quality of fishing and a struggling economy.
We’ve lost the business because of the cost [of the license]. Other reasons contribute, but it’s mostly the cost.
Over 5 years, 5% per year increases in sales prices.
There is a significant difference in licenses sold – we sold 3,600 fishing licenses in the early 80’s at roughly $8-$9 per license. Last year, we sold 1,600. The dollar amount is almost the same because of the increase in the cost per license but we’re selling a lot less licenses.
Price is going up. Fishing goes down. Slots are going down.
Quality/economy/price of license –all are issues for most. The economy –people aren’t going to go out and spend money on access to the best fish. People have lost interest in it. It’s $47.50 for a base license with a delta stamp now.
101
Participants also indicated that particular populations are most affected by the cost of the fishing license.
Price of a license is a bigger issue for lower income families. We used to see a lot of single parents come in, typically a woman with a teenage son, and they would pay $20 for licenses, some bait and go fishing. Of course $20 got you more back then, but now they would need $100 to be legal. That’s a lot of money.
They have to think about it if they are going to spend $50 for the license for a kid and his brother to go fishing. The price might nix the whole thing.
Ease of Obtaining the License. There was overall agreement among participants that buying a fishing license needed to be easier in California. All participants had knowledge of ways licenses are purchased in other states that were preferable to those used in California. They were in favor of adopting these other methods, particularly in conjunction with lowering the price of the license.
At every gas station, you should be able to just walk up and slide your driver’s license, and pay to get a fishing license. California is the last state in the union to get automated licenses machines. It’s not easy to get a license at the spur of the moment here. When you renew your driver’s license, get a fishing license at the same time. When I talk to Fish & Game, they tell me they are trying to do it, but it’s been going on for 8 years, and it’s always next year.
In other states they have the automated license machines. If it were easier for people to buy licenses I think they would sell more. And if they tried lowering the price for a while, put it back to $20 they might sell a lot more licenses. There’s talk about going to someplace like Long’s to get a license. For us in the business, we don’t have that in the business because it requires a separate [phone] line. You can get your license online. It makes it easier. Stores promote a lot of stamps they might not need. If you could go into McDonald’s and swipe your driver’s license and get a fishing license for $20, you might get more sales.
While participants were enthusiastic about the adoption of easier mechanisms by which fishing licenses could be purchased, they were quick to add that they saw some problems ahead with such a change, for both small businesses and anglers.
When they do go to this supposed DMV license . . . every bait shop and every small business isn’t going to handle it – no way. They will not get a separate
102
phone line and a separate bank account. They are not going to set up 30 inches of their counter space for their machine to go in there. It isn’t worth it. They will not sell them. So right off the bat, when this does happen, the only place you’re going to buy a license . . . retailers won’t sell them because they can’t deal with the paperwork. They will stop selling equipment. You’ll have to be Big 5 or you’ll have to be Walmart. Are all of these people going to keep buying fishing licenses? [in response to participant above] People will quit fishing.
According to the participants in these two focus groups, there are several problems they currently experience associated with helping their customers buy licenses, problems that range from the overall cost of offering the service to technical problems when ordering the licenses online.
If I sell a $40 license, which is way more than I want to pay, I make $1 on it. It doesn’t even pay half the time it takes my employees to fill out all the paperwork to get the licenses, let alone the forms I have to fill out, let alone all the time I’m on the phone or mailing them out to get the licenses and putting the money up front because I can’t afford to put a $10,000 bond to put it on COD. For someone who sells these things day in and day out, the first thing is you can’t even get them. It takes you forever to order them. You can’t call them. You have to mail it in. You can get a license through the website –it’s ridiculous. I had customers call—going on a last minute trip and weren’t going to be able to get licenses. The bait shop at my marina was out of [licenses] one day, so I told them, okay, I can get you a license through the website. It took me literally four hours to get three licenses from the website, and my wife (who knows a lot more about computers than I do) told me that they don’t have enough server capacity to take the requests. It wasn’t really confusing, but the problem was that you’d be halfway into it, you hit next to go to the next page, and then you would get error messages. “The server is too busy at this point – try again later.” They [CDFG online license location] don’t answer their phone. It’s “Leave a Message. We’ll get back to you.” I know that earlier in the year, they literally ran out of one-day licenses. You probably had the same thing.
103
Politics & the License Participants in both focus groups expressed some degree of frustration that licensing fees are not being used appropriately; i.e., not being channeled back into areas associated with the sport.
Another issue I’ve heard of for years is that Fish &Game gets a bunch of money from license fees, and the government turns a little switch and runs those funds into the general fund because they need it and they end up using that money for something else. It happened this year, $30M this year was taken out of license fees. Department of Fish & Game spends their—our—license fees on all tree hugger type things instead of taking care of our fish, and producing fish in our hatcheries. That money is supposed to go towards taking care of fish and what’s happening is they’re taking our money and instead of studying fish, they use it to study why a pelican gets pregnant or something instead of concentrating on taking care of our fish. Our money doesn’t get spent for that. The funds are all going to things that are not related. There needs to be a different department for tree huggers and they can pay their license money in and do their tree hugger thing, and Fish & Game money needs to be spent on fishing and hunting, not on tree hugging activities.
One of the concerns is that 1/3 of fishing license money must be spent on stock trout. That was the legislation passed by Cogdill a few years ago. That’s a huge percentage of the license fees right there just to grow fish for the subsistence fishermen. People who fish for stock trout are pretty lazy fishermen generally. I would like to see the money spent much more wisely. If you take a look at other Western states manage their trout fisheries and do a much better job of managing the hatcheries than we do and they are all destination fisheries. People drive to Colorado, Utah, New Mexico, Wyoming to trout fish. I don’t know anyone who drives from New Mexico to California to trout fish.
Particular mention was made of the misuse of funds associated with enhancement stamps.
There is an ever-growing frustration level on sportsman’s part. Our money is supposed to be designated for certain areas, but our bureaucratic system funnels it out. The striper enhancement stamp doesn’t do what it’s supposed to do. It has an impact because it’s much more acceptable to buy a fishing license if they knew the money was going into the fishery.
What did they do with that (Delta Bay Enhancement fund) money? Stamp money is collected in a pot and is not being used for fishing. Some people never buy a fishing license because it never gets used for what it should be.
104
I mean one of the things that I found totally ridiculous was—you may know all the history of this—but there was the Striped Bass Stamp before there was the Bay Delta Stamp. The Striped Bass Stamp was discontinued when they started the Bay Delta Stamp. The idea that they sold it to you or the propaganda that came with it was they could help more fisheries than just striped bass. There was money left over in the striped bass fund that is now being nipped on every year for “administrative costs.” But Fish & Game decided they needed a stealth boat, and Fish and Game bought the first game warden radar-proof stealth boat. I’d would like to know if any of you guys has ever seen a poacher who had a radar unit on his boat? No – he has got the cheapest, dumpiest little boat he can have out there because he knows if he gets caught, it’s going to get confiscated. He’s got about a $1,000 row boat that is a hazard to navigation than it is anything else. But they needed a stealth boat? And it sits because they don’t have the staff to even operate it.
In summary, though there was some disagreement among participants, the majority believe that the sale of fishing licenses has declined in California over the past five years. They attribute this decrease to a corresponding decrease in the quality of fishing and struggling economy, to the increasing cost of the license, and to the difficulties (for both angler and business owners) associated with purchasing a license. They also believe that the funds generated from fishing licenses are being used inappropriately.
Species Decline and Angler Behavior Participants transitioned from the discussion of fishing licenses to the decline of certain species of fish. Before discussing their specific knowledge about the decline in species, a few participants tried to make sense on a broad level of how the decline has occurred.
When you were talking about the loss of licenses – how there are less people –we all know there is a decline in the fishery. Could it be that since there is such a decline in fishermen, that we’re seeing a decline in the fishery? Because you know, if you have more people in one pond, no? You know what I’m saying? In years past, when you went to Freeport Bridge, where I’m from, there would be 100 boats across the bridge, right, so more fish are going to be caught. Now you go out there, and there are 2-3 boats, so they are not covering as much water, not as many fish are being caught, not as many fish are being reported. Not as many people are out there, so fewer fish are being caught. Some people claim the population has been reduced by over fishing, but when you think about the 60’s, at Freeport Bridge, if you went across the Rio Vista Bridge on the derby weekend, you would literally sight 500 boats out there. As far as the eye could see, up and down Rio Vista Bay, there were people fishing out there. Prior to that, in the 30’s, striped bass were part of the commercial fishery, and yet the species flourished. They took millions of pounds of stripers out of the Bay every year and yet the species flourished. Sport fishing has not been the problem or the cause of the reduction in the striper stock.
105
Species decline was discussed predominantly in terms of the decline of salmon fishing. Participants also commented on the economic impact of this loss and how it has created an associated pressure on guides to perform well in finding fish. Decline in Salmon Fishing Most participants argued that the decline in fishing was a direct result of the loss of salmon fishing. Their clients who preferred salmon in some cases had gone out of California to continue salmon fishing.
I mean, the salmon by itself – it’s such a dramatic decrease, and some people only fish for salmon and it’s all they want. If that goes away, they will not buy a license.
Lots of anglers that I used to service have gone off to the Klamath or other places like Oregon or Washington. I’ve lost them as clients.
The participants indicated that the loss of salmon fishing had significant impact on the local economy.
Salmon was very important as a money generator.
That was a big crusher, man. It affected boat sales and everything.
A lot of these guys are river-based. We’re ocean-based. We have lots of customers who quit fishing because they were big salmon fishermen, and they sold the boat.
As a guide, that was our biggest audience – salmon fishermen. I see a lot of people not spending the dollars that they used to spend hunting for salmon because to go fishing for lesser species than salmon, anglers are not willing to spend the same kind of money for what they consider lesser fish. The average salmon fishermen would outspend the average bass or striper fisherman 5 to 1. A lot of it had to do with the loss of salmon, but a lot of boats are out of business. But a lot of it has to do with lack of people. I know of at least three big party boats – one out of Berkeley, maybe one out of Emeryville – A lot of them in the City who had a lot of salmon charters. They are an old story now.
A significant number of participants indicated that many of their customers were staying in California to fish but had switched, often with their encouragement, to other species
106
such as trout, bass and halibut. Some expressed concern that because of the increased attention on these species, their decline would follow that of salmon.
Anglers are switching to other species such as trout and striped bass.
Lots switched to fishing for the largemouth, smallmouth and striped bass.
Especially being a salmon fishermen up north, all those guys had to come down to the Delta because there is no salmon fishing. The guys that were salmon fishing out in the ocean are now out halibut fishing instead. Those types of people have had to move. A large percentage of salmon fishing was done by boat. A lot of guys can’t use the boat for salmon so they now use the boat for stripers or trout or something else.
There was an explosion of black bass fishing– the bass boats have really multiplied, but this year there’s a major drop in boats out there. Nobody knows what happened, but bass fishing in the Delta this year just died. I’m trying to point people into fishing for other types of fish, which is a little bit successful. The only thing we can do is encourage anglers to fish for other species such as stripers, trout, or kokanee. You know, what happens is you go out and fish for something else. Stripers on the Bay got pounded this year because of no salmon. Halibut and stripers will do the same as salmon because they are hammering on them so bad because the salmon aren’t there.
The bait shop owners were quick to add that the loss of fish extended not just to salmon but to bait as well.
You can tell right off the bat, you guys are in the fishing market. We’re in the bait market. The bait is not there either. You know how many weeks we were without bait? We went weeks without bait this summer because we can’t find it. It’s not there.
Because of conditions in the delta, many species that feed other fish have been lost. There’s no food out there for the fish. It’s a huge issue in the Delta and Bay. Food fish have disappeared. They go away due to water conditions, but people are also out there netting them. There are no anchovies because of ocean conditions. El Nino is blamed for that
107
decline. In the Delta, all these species of bait fish have disappeared because of water issues. The water is pumped down canals and harvested. There is no decline in demand, but there is a decline in the species’ ability to reproduce.
Anchovies, grass shrimp, herring - gone. They stopped the herring now.
Economic Impact Beyond the impact that loss of salmon fishing had on the economy, participants in the focus groups acknowledge that an overall decline in the economy has also been evident in angler behaviors, particularly in boat sales.
You take the working class people they, can’t afford that boat anymore. They can’t afford them. You have to be high end to have a boat today. I have fished on the Bay with my own boat since the early 80’s – in the last 3-4 years, there have probably been a third of the private boats out there that used to be out there. Where I noticed the change was about five-six years ago when gasoline went over $2 a gallon for the first time. You saw the decrease. Boats use a lot of gas. They are not like a car. They use a lot of gas. People who sell family boats are dropping like flies.
Pressure on Guides to “Perform” The guides in particular argued that because of the decrease in salmon fishing and associated shift in attention to other species (which may or may not be plentiful), there is significant pressure on them to “perform” in terms of finding good fishing for clients.
Clients don’t usually make requests about where to go – we take them where we think we have the best shot at catching fish. We make decisions about where to go. We’re always looking for places.
We’re looking…we’re looking… Most of the people get it, they don’t have too much of a problem. True fishermen don’t complain. They know what the facts are. They know what it is. But if you take a new guy out that you want to come back again, he is the guy you teach to catch the fish for, and if doesn’t catch, he’s not going to come back—the new guy – because he doesn’t understand the situation.
You have a guy who has been successful in the past and all of a sudden, he is not catching fish anymore and so he wants to go out and find out why he is doing wrong and why it’s so hard to catch fish now. He never had to worry about getting skills to catch fish before.
108
So you lose because there are no fish out there. If you go out and catch fish, you tell him how to go home and cook the fish, he goes home with a real positive attitude. He’s happy. Those kids had a good time, it was good for them. So they’re going to come back. But if you’re sitting there all day long not catching a fish, this kid is getting a little nervous, you know, saying I don’t want to fish anymore, why am I out here? And it’s a bad experience for both him and his kids. And the odds are, he’s not coming back.
Their efforts are sometimes hampered by reports to the public that fishing conditions are bad. Alternatively, reports of good fishing were seen as positive because they kept interest in the sport alive.
It affects behavior dramatically. Because that’s all they hear - about how bad the fishing is. The first question out of their mouths is, “How’s the fishing?” “Have you been catching them?” Number one, they want the big trophy striper or the big trophy sturgeon, and when you get out there and you go, “That’s a good fish...” Another thing is the newspaper putting out constant areas where fish are being caught all the time, it creates a frenzy. And people want to go. It may be on my boat or somebody else’s boat, but overall, this advertising that the bass are biting really good, so they book and they catch a fish. Maybe they book next week and they stop biting. There were times years back when they were biting all of the time. It generates a lot of interest in the people.
Most Frequent Angler Complaints These focus group participants acknowledged that they hear frequent complaints from anglers, most often about the lack of fish but also about the cost of everything. However, they also agreed that if fish were available, cost would not be an issue for most anglers.
Everything has doubled –equipment, etc. People are not going to spend twice the money for a shot at half the fish and $4 a gallon for gas to go out and fish.
If fish were out there, they would spend. Fishermen will fish and spend money but without having fish, they won’t spend money. I firmly believe that it’s not going to be high prices that will be the demise of this business; it will be lack of fish. People will be willing to pay the price to go fishing if they think they are going to catch. Once they are convinced they are not going to catch fish, you can’t make it cheap enough for them to go. When I was a kid, everyone could catch fish. There was lots of game and fish, so you didn’t need to be an expert. Today, you have to be one of the better fishermen or go with one of these really good guides if you want to catch a fish. The average person just doesn’t go out and catch fish. You have to go farther
109
and farther out to catch fish. Perfect timing is required. It has to be the right time of year. You have to have a boat to get where the fish are.
In summary, the decline in salmon was foremost in participants’ minds as it represented a significant loss of income to them. They noted that many of their customers were opting to stay in California to fish and hence had switched from salmon to other species (e.g. trout, bass, halibut), often at their urging. The switch in focus to other species had created additional pressure on the guides to perform (i.e., find good fishing) and concern that these species too would be in danger of decline. Participants agreed that as long as fish were available, anglers would spend the money to fish, even with an increase in cost.
Government Subsidies for Salmon Fishing When asked if they were aware of businesses dependent on commercial salmon fishing—those that receive government subsidies—participants indicated commercial salmon fishermen come in more than one type.
There are probably two kinds of commercial fishermen – one with a good job in Sacramento and the boat/trailer is parked on the beach. That person already has a decent job, but is able to go to the beach and do some part time salmon fishing and guiding. They aren’t really hurt financially so much as emotionally. Then there are serious people with bigger boats for whom fishing is their whole life – those people probably are the ones who got hurt worst. They have gigantic boats and no way to make money. I have other employment elsewhere and did the commercial fishing on the side.
When asked what they knew about the activities of salmon fishermen given that there was no season, they responded that they had either left the state to continue fishing for salmon or had switched species. There was some concern about this latter group because of the possible impact they could have on decline of other species.
They have quit or left. Lots left California and went to Oregon, Washington, or Alaska where they could make a living. Some left families behind and went to Alaska. The season up there is five weeks for one species and then five weeks for another. The seasons are short there. The fishermen don’t make much because of the short seasons. They can’t go out and do anything so they don’t spend any money while up there, just work. Their families are here. It stays light all the time, so the individual wears himself out.
110
Many are concentrating on other species – stripers, halibut, trout, kokanee sturgeon I don’t know, but with salmon boats might want to get into a different part of this, but salmon boats are getting a lot of money from the government for the loss of fishing for salmon. Now you have all those boats fishing halibut. It puts the impact on halibut. And Fish & Game hasn’t stepped up and done anything about the limit for halibut, so they are getting hammered. At one time the limit was 5. It’s 3 now. You take a species you are beating up real bad, so what happens when there are less of those? It’s going to impact everybody again. Because you see, there are no fish. And it’s like the farmers are paid to not grow crops and if I had a big boat and could be paid to not fish and then fish for something else, I would do it. But by rights it shouldn’t be that way… Those guys should have been shut down so they didn’t beat up that species. So they still got paid. They didn’t have to.
In summary, commercial salmon fishermen who were eligible for government subsidies were described by participants as either leaving the state in search of salmon, or remaining here and switching their focus to other species. The latter group created concern among participants in that they might contribute to the decline of these species.
Hatchery Fish Given the decline of wild salmon in particular, and participants’ efforts to encourage clients to switch to other species, they were asked to what extent hatchery fish have been a reasonable substitute for wild fish. They first noted some differences between hatchery fish and wild fish, which centered on behavior (where there was some disagreement among participants), susceptibility to disease, and impact on wild fish.
Hatchery fish don’t fight as much – generally. Hatchery fish don’t have the genetic diversity of natural fish. Remember when they were raising stripers? They released all these stripers, and I really believe these hatchery-raised fish learned to live in very, very close schools. So when you guys were talking about these monster runs in the Bay in the fall when the fish came through around World Series Time? –I just wonder if some of those were those schooly stripers. They came in mass because they were so used to living in such close quarters. Those runs go back well before the hatchery stripers. The biggest consideration is that hatchery fish are basically clones – with the exact same DNA. If some disease hits, or a weakness, you take out 90% of the
111
species. It’s a moot point right now. There’s such a decline in everything. Anything will be a help. Genetically, hatchery fish are supposed to have a diminishing effect on the quality of wild fish.
A number of participants noted the need for hatchery fish as well as the inability of their clients to distinguish hatchery from wild fish.
It was only 10-30 years ago that there were so many fish in the Feather River that it created a problem because everyone went there. There were thousands of salmon and a lot of steelhead and it’s all because we were able to produce a lot of hatchery fish. I don’t really think there is such a thing as a wild fish on the Feather River anymore because they have intermixed the hatchery and wild fish to the point that there is no such thing. Before the federal government made us cut back on the hatchery program we had awesome salmon fishing. Now we can’t produce very many hatchery fish because they want naturally spawned fish, which is a joke. They won’t even take care of the river, and there are no spawning grounds left, so we need hatchery fish, we don’t have a choice. It’s either get rid of the dams or have hatchery fish. We’ll never get rid of the dams. Customers don’t care if the fish is wild or a hatchery fish. It’s not that they don’t care, 90% don’t have a clue.
Despite the perceived need for hatchery fish, participants acknowledged that due to state budgetary problems, the hatcheries are not meeting the demand for them.
Budget related – very little budget left for game wardens or hatcheries. We used to run hatcheries for months to try to spread the fish out. Now they are open a week or two, and they run them through. They’re shutting off the access points to the American River because then they don’t have to have toilets or watch people. They’ve experienced problems with theft and break-ins. Hatcheries haven’t increased the population of fish. Same amount of fish are planted. But 10 times more people should be 10 times more fish planted.
In summary, participants agreed there is a need for hatchery fish though they expressed some concerns about their genetic makeup and associated vulnerability. They argued that currently the hatcheries are not keeping up with the demand for fish primarily due to budgetary constraints.
112
PERCEPTIONS OF DEPARTMENT OF FISH & GAME Participants were asked about their perceptions of Department of Fish & Game in two particular areas: regulations and enforcement of those regulations. What also surfaced in this discussion was a belief that the Department has contributed to the decline of fishing in the state.
Regulations The discussion of regulations addressed catch & release, size limits, and enforcement issues. Catch and Release The catch and release regulations did not seem a particularly important issue for these focus group participants, and resulted in limited discussion.
Fish & Game has totally messed up the bottom fishing industry too. You’ve got fish you can’t catch because there aren’t enough of them, and then that’s all you catch, and you have to release them. And they die anyway. [Catch & release exists] mostly to wild trout in streams, native fish, places where you can drive right up to fishing spots. They are trying to keep that down. Maybe Wild steelhead is another issue. Most fish in the rivers are hatchery fish.
Size Limits Participants in both focus groups agreed that size limits needed to be revisited by CDFG. In most cases they argued the size limits were too conservative. However, they also acknowledged that in some cases limits should be conservative to protect females.
Freshwater – warm water species – unusual – lot of those limits are too conservative. They are stunting the populations in the smaller fish. Some regulations are antiquated in terms of catch limits and size limits compared to what the fisheries can sustain. They don’t allow an appropriate amount of take. The hatcheries produce as many as 100,000 kokanee in one run, and out of that only maybe 20,000 fish are taken. In some areas fishermen are allowed only 5 fish per day limit. It could afford to increase to 10-15 per day. One of the things that puzzled me is the limit is 18 inches per fish – but striped bass don’t come to maturity until the male is 19 inches and female is 23, so we’re harvesting our fish before they are even mature. There’s an argument that by harvesting the young fish that we’re actually better off because a lot of people are catching their smaller fish; they are catching their two 20-inchers and going home for the day, and perhaps that allows larger fish to remain in the system. They caught their limit for the day, and that’s that. I would like to see better
113
management, at least for striped bass. It doesn’t make sense to be harvesting fish that are not even spawning yet. But then again, I go back to the whole idea that it’s the environment, so the harvest is probably not as important as I sometimes think about it being. I started fishing when the limit was 5 at 12 inches. Then 3 at 16. Then 2 at 18. And when it was 5, I mean in the 60’s or before then, there were just some massive fish around. It gets back to environment. This couple was shark fishing and got the leopards. I think they ought to drop the limits on that. They have it at 3 plus they commercialized leopard sharks. I think that’s wrong. We should drop the limit to maybe 2 and maybe protect some of the sexes – the females. We haven’t done it. Once you take the female out, it’s over. We push our people to release the females. All females. Maybe keep one fish, two fish, and that’s it. They don’t look at that. It’s an issue. And then, again, we talked about the halibut too.
We noticed in both focus groups, as is indicated in this last quote (and in the focus groups with angler participants), there was a strong inclination to self-regulate. This was due at least in part to the perception that CDFG was not doing an adequate job in regulating limits.
Back to what you said earlier – no one cares more about fish than the people who fish. And I don’t think the anglers would even object to a reduced catch…
No, you wouldn’t. Especially last summer lots of party boat skippers were saying we needed to change this and…yeah, we need to regulate ourselves. There was a cute cliché saying I heard on the radio more often this summer than I have ever heard it before – “Limit your catch, don’t catch your limit.” That is what we need to do.
At least a few participants felt that catch limits may not be necessary because of hatchery production. That sentiment is captured well in the following quote.
The original reason for the limits going down many years ago was because the native species were being over fished. In order to avoid that they cut limits down because people couldn’t tell difference between salmon, etc. A lot of us go out and burn $200 a day in expenses to go fish and we are only allowed five fish. With the hatcheries with their abilities and funding – there is no reason to limit any of those fish.
In summary. While catch and release regulations received minimal attention, the regulation that appeared most important to these participants was size limit, which they expressed should be revisited by species and particular conditions. Self-regulation with regard to size was viewed as important.
114
Enforcement of Regulations Participants indicated that enforcement of regulations is fraught with problems. The judicial system does not give a priority to crimes associated with poaching. When poachers are caught the punishments are not sufficient to deter repeat offenses. In addition, the CDFG (and particular wardens) are perceived as promoting the lack of enforcement. Judicial System Inattention Participants commented that the judicial system does not provide sufficient attention to poaching and that the degree to which it is prosecuted depends on the judge. One participant noted that CDFG had on one occasion discouraged members of an angler club from trying to speak in court about the need to take poaching seriously.
There is limited space for fishing [in the judicial system]. It depends on court and judge. Judges are not taking this seriously. Their attitude is, “Get out of here.” It’s not serious, so they don’t prosecute. You go to the county where the violation was committed. It depends on how the judge feels. He might be a poacher himself. They don’t have any interest in fish and wildlife and don’t tend to take it seriously. There was a big striped bass ring on the Sacramento River about a year ago that resulted in 49 arrests – everybody from the guys in the boats taking the fish to the guys in the trucks transporting to the guy selling, the restaurants, everyone. All through the whole chain, 49 arrests and 3 got jail time out of it. Our club was trying to get hold of Fish & Game and the DA because we wanted to make an appearance at the Court to try to influence the judge to understand the gravity of the situation – but we were told by Fish & Game that they did not want us to be there because it would appear that they were prejudiced against a certain community – because most of these were Asians that were arrested. I asked them, ”Which community is that? The poaching community?” I don’t care what color a poacher is. The effect he’s having on the fishery is the same despite what color the hand is that pulls the fish out. It makes no difference to me.
Strictness of the Law Even when poachers are prosecuted, the penalties are insufficient to deter repeat offenses.
Laws are not strict enough and not enough appropriate penalty.
115
$1,000 fine when sturgeon worth $10,000 is taken. They say “please fine me and let me get back out there fishing.” The Russians have been relying on the fact that they don’t read English so they get away with breaking law. There is no profitability or ability to track these people. If you get caught doing something in Oregon, they can just run your driver’s license. Cops are Fish & Game in Oregon. They can do both.
Plus the people that are being arrested, the Courts don’t appreciate the gravity of the situation. Sentences that some of these guys get are ridiculous. It’s a slap on the wrist. In last 1.5 years, there have been three major arrests of out and out poaching rings and out of 100 guys who were arrested out of the three different operations, about 6-7 of them actually got jail time. Everyone else gets a fine and told not to do it again. What’s frustrating with the poachers is they arrest them, they confiscate all of the equipment, and the next time you see the guy in the water – he has a better boat and better equipment.
Lack of Enforcement by Department of Fish & Game There was general agreement among the members of these focus groups that CDFG is not doing a sufficient job in enforcing their regulations. This lack of enforcement includes but is not limited to poaching.
Why aren’t they out there busting and fining people on poaching? I’ve called in live and reported people to that hotline they have, giving boat numbers and descriptions, and telling them names. I saw them land 20 salmon. Nobody will come. I’m on a first name basis with two of the Fish & Game wardens right here in Pittsburg. There’s a lot of poaching going on. A lot. Poachers come in during the night and they fish all night, and we know who most of them are, and some of them get caught, but the wardens don’t have the time or resources to come in. We’ve have also made phone calls, and they have gone right to their houses and busted them right at their house, but Fish & Game doesn’t have the people or time to do it. There are other regulations that are flat not enforced –DFG has a lot of regulations regarding water releases and things like that or 5937, which is a requirement that a dam operator has to release enough water to keep the fish population in healthy condition. If any warden went up and cited a dam for violation of 5937, I think you would be looking for a new job the next day.
116
Or someone from a sewage treatment plant, if he turned them in and you did research – you call Fish & Game. You need to come out because we’ve got a problem over here. They are not going to do anything.
Wardens & Enforcement CDFG, and particularly wardens, are seen as contributing to the problems of enforcement. Participants viewed them as focusing on enforcement of issues peripheral to CDFG or alternatively on insignificant issues. There was some recognition that supervisors may play a role in encouraging a particular enforcement philosophy.
I started asking wardens what they were looking for. It amazed me; at Scotty’s boat landing on the Sac they were looking for people dumping garbage in the river, people dumping sewage. Those are the things he was looking for? It had nothing to do with fish. This one particular warden is going out on marijuana busts rather than fishing violations. He is supposedly looking for wildlife violations while he’s out there. Instead, they are using our money to enforce DEA violations. More wardens are being used for that all the time. I’ve had wardens stop us and they see our commercial license and my commercial log. I have never had a warden ask to see the fish we’ve got. I was in the Bay this summer, and I think part of what it is that it’s easier to cite a commercial fishermen or fisherman for some type of piddly widdly violation and get their money from that than to go through and fight where they should be fighting with the poachers and the violators, etc. I had a guy who took my driver’s license from Fish & Game because he didn’t like that I personally stowed US7E. One of the problems with the wardens is that wardens are managed by the regional manager instead of as a law enforcement body. If you have a regional manager who is really interested in enforcement, he’s going to manage his employees effectively. If you have someone who doesn’t believe in enforcement, he’s going to use his wardens as messengers carrying paper back and forth between offices.
In Defense of Fish & Game/Wardens Though participants were quick to point out the shortcomings of CDFG enforcement, they also acknowledged to some degree that the lack of enforcement is tied to budgetary constraints.
There’s no budget – it’s not their fault. There’s no budget to make anything happen.
117
Even with enforcing the laws that they have, despite the fact that they don’t enforce environmental laws – the game warden staff traditionally was 270 wardens for the entire State, which is still not enough, but right now they are maintaining it at around 150 now. So it’s almost half of what they used to say they needed. There’s a hiring freeze. They had supposedly fifteen wardens working they way through their academy, but how long will they stick around once they see what they have gotten themselves into? A lot of times, the wardens can’t even patrol because they don’t have a fuel allotment for that month. They can’t buy much fuel for the boat or their car. They get limited on how many miles they can go.
In summary, according to these participants the enforcement of CDFG regulations is limited for a variety of reasons. First, the judicial system (and particularly) judges do not take poaching seriously. Thus, even when poachers are prosecuted their fines are not sufficient to deter repeat offenses. It is unlikely that anyone from the CDFG will investigate reports of poaching although wardens often attend to insignificant issues or issues peripheral to CDFG. Participants recognized that budgetary constraints limit the ability of wardens to effectively carry out their job.
Role of Fish & Game in Decline of Fishing The majority of participants felt strongly that the CDFG had contributed in a variety of ways to the decline of fishing, such as being reactive rather than proactive, having a propensity for quick fixes resulting in less than adequate analysis of the problem, and not accepting responsibility or accountability for their actions. They also realized, however, that politics has much to do with the effectiveness of the Department. Reactive, Not Proactive Mentioned most often was a propensity of the CDFG to be reactive rather than proactive when addressing the decline in fish. Being reactive was characterized by being too slow to respond to the problem, not making good use of existing data, and by exercising poor planning.
One of the basic problems at Fish & Game is they are reactive; they are, not proactive. They wait until there is a problem. It takes them a year to realize there is a problem, and then another year to study it and another year to decide on what to do about it. By the time they are going to actually get down to offering up to the Fish & Game Commission additional fees or regulations, it’s always too late.
. . . by the time [changes] are enacted, they are 3-4 years behind the curve. They [Department of Fish & Game]are not an advocate for fishing. They advocate controlling the very people who pay their salaries. To me, why I think
118
it’s the biggest failure in Fish & Game and what they don’t realize is that if there are no fish, there is no reason for a Fish & Game to exist. That’s the direction we are heading. Even the wardens don’t get that through their heads. If there are no fish and game to manage, there is no reason to have a Fish & Game.
It goes back to politics – unfortunately Fish & Game has their hands tied. When they came out with the emergency slot limit on the sturgeon, you know they said there was a 10-inch slot limit because there so many sturgeon left in the entire system. We had the Fish & Game and a lot of the commission out on my boat –and they looked at us point blank and said that they can’t do anything about it. The impact on that is like with stripers and halibut and everything else – it’s a dollar late and too short. They are not reacting to what we’re having to deal with - for instance, the change in salinity levels where the fish are holding and having to acclimate between fresh water and salt water. They are still doing a lot of their skill testing off old patterns. People are getting subsidies – the pressure on halibut has definitely increased. Frankly, I fished halibut all summer long. Several others do. Summer 07 was the best we have had in last 10 years. How bad is next year going to be to make up for the good year? And the 08 season wasn’t bad. What it shows me is that the halibut fishery is pretty strong. It’s sustaining itself, but for how long with this kind of pressure? That’s where Fish & Game needs to step in quickly – not four years from now. But now. I always look at what’s the simple solution? The simple solution is they look at the report forms we have to fill out every day that we are out there. From those report forms, you can add up how many people are out there every day fishing halibut. And if it looks like a bigger number than three years ago which I’m sure it is, they could then say, “ OK, the pressure has increased, so we need to decrease the catch take, the limits.” And we don’t need to do a one-year study. We can just look at the information they are already given here and make a conclusion. I don’t know why they don’t do that. I understand a lot of the decisions they make are political, but they are bucking some lobbyist from Bakersfield or some water district’s lobbyist, but this has nothing to do with that. They could make that decision, but they don’t. That’s what I mean - they are reactive. They are not proactive.
A Propensity for Quick Fixes Perhaps in conjunction with their perception of CDFG as reactive rather than proactive in solving problems, several participants expressed that the department has a propensity for quick fixes rather than fully addressing the problem. The implication existed that less than adequate problem analysis is the norm.
Fish & Game’s solution to fixing a problem is to stop fishing rather than fixing the problem. They thought they had a problem with bottom fishing and stopped it. They are trying to stop sturgeon fishing. Instead of doing something about the
119
problem, they just stop people from fishing. They don’t want to do it the way it should be done, it’s just a simple solution to fix the problem. They are traditional in their approach to things like that. Once they decide a fishery is having a problem, the first thing they do is they tighten up sport fishing regulations. Sport fishing is not the problem. I’m not saying it’s always environmental. Some rock fish depletion problems are from over commercial fishing. Their answer is, “Well, we tightened up sport fishing regulations and we tightened up commercial.” What you call tightening on commercial fishing was just maintaining the status quo. And the status quo caused the problem. Traditionally, every year, commercial fishing was allowed to take a little bit more, a little bit more, a little bit more. So now you’re to the point where that little bit more is causing a reduction in overall species. So do they think of taking it back? No. But they will keep it at that point, which is still causing the problem. I have had for a long time the image of Fish & Game being that of the boy with his finger in the dike trying to stop the hole in the dike while the dike is totally collapsing over here. They have their finger in the hole, which is sport fishing, while the environment and over commercial fishing is causing the dike to collapse.
Salmon versus Stripers. The most frequently cited example of poor analysis by CDFG mentioned by participants was that of the controversy over the impact of striped bass on salmon. Participants were adamant that the conclusion reached by CDFG that striped bass were destroying the salmon population was poorly supported by evidence.
The classic is when they blamed it on the stripers. That was the coup de gras right there. We crashed the salmon so let’s go after the stripers. Stripers and salmon co-existed for 100 years. Now it is a problem.
There’s a commercial cannery in Portland for salmon and stripers. Those species have always co-existed since the 1800s. There are studies that have been financed by Department of Water Resources. They would like to find a scapegoat. The easiest target is non-native species, which is the striped bass. What’s ironic is, and I think some of you guys were there, at the hearing … There was a bill in Sacramento to deregulate striped bass for that very reason. There was a Ph.D. for the Department of Water Resources who said that the only reason striped bass didn’t impact salmon in 130 years is that it took them that long to eat the fish. And this was a Ph.D. saying this…(laughter)
And the three or four yes votes for it were all from water districts and the 160 against it were all anglers.
120
Accountability and Responsibility Participants were frustrated by the unwillingness of CDFG to take responsibility for fixing the existing problems in the industry and by the extent to which they are being held accountable for their actions that have contributed to the decline of fishing.
It’s exactly what (person’s name) just said. That’s the biggest issue with Fish & Game– they wait until there’s a total collapse and then they screw you out.
They point fingers at each other. They don’t do anything about it – but they point fingers. The thing that kills me about the salmon – it was so strong and it was going so good. On go the pumps, the thing crashes so fast. There is no accountability, there’s no response, there’s no rush to get it back. It was like, sorry… There’s a lot of money involved. They didn’t want to look that way, though, see? Fish & Game is still looking on the ocean for a solution. Even right to the conference they had when they announced the fact that salmon was going to be closed again this year, in the announcement, they said, “Due to problems with conditions on the ocean…salmon season will be closed.” They are looking 120 miles too far west. And that’s political. Because the guys like (F&G employee) who know what’s going on are not allowed to present this.
Politics of Fish & Game As part of their assessment that the CDFG has contributed to the decline of fishing, participants argued that the Department was tightly controlled by the Governor’s office, a control that led to poor spending decisions.
Everybody realizes that Fish & Game is totally understaffed, and any money that can be siphoned off for the will of the Governor will be siphoned off. Their morale is at an all time low. I had some guys on my boat from Fish & Game last weekend. He was saying that on a Friday at 12, the office is empty.
If they wouldn’t just siphon the money right off the…I mean, in a perfect world, everybody would just say, “Look, let the anglers give the money, support the fishery- use the money for enforcement – if there were some level of balance and eco-system is in the whole thing, it would make sense. But it isn’t that way. Fish & Game is the stepchild of the state. Fish &Game is spending all their money on everything but game wardens and fish.
121
Wardens – the problem is with their salaries – the average warden will work for Fish & Game for about four years and then jump to a municipal police department…
And make double what they were making. They’ve got their POST certificate. A highway patrolman makes double what a warden does. It’s far less dangerous than being a game warden.
In addition, the politics surrounding CDFG have led to the exclusion of relevant parties (i.e., legislators supportive of anglers, anglers, guides, marina operators, equipment sales) from decision making that effects the industry.
Lois Wolk – was elected a state senator – but she’s not on the Delta bill committee.
So much of that bureaucratic stuff that goes on. I could give you 5-6 examples of people who were pro-angler/pro-fishing, but then Fish & Game…they are not re-confirmed or forced out so they can bring in one of their little cronies. The last Director of the Department of Fish & Game (Seth Gordon) professional was at the Department in the late 60’s. He did a lot of hunting himself. He did a good job. It was still an appointed position, but it has been quite a few years since there was an avid fisherman/hunter in charge of the department. Our whole Fish and Game Commission is an appointed commission, and now the governor has appointed more tree huggers than fishermen to the commission.
In summary, CDFG was viewed by these participants as direct contributors to the decline of fishing. The Department was described frequently as being reactive rather than proactive. As a result, CDFG employees were seen as engaged in creating quick fixes for problems, fixes that were not based in adequate or accurate research. Participants voiced frustration with the unwillingness of CDFG to accept either responsibility or accountability for their actions. The politics surrounding CDFG were seen by participants as contributing to the ineffectiveness of the Department, and thus to the decline of fishing.
WATER MANAGEMENT Water management was perhaps the most lively of the topic discussions and addressed primarily timing and temperature of water releases from the dams, water quality concerns, and the politics of water management.
122
Timing and Temperature Participants in these two focus groups expressed clearly that fish survival is dependent on timing of water released from dams and temperature of water released. They described the two issues as interrelated. Timing of releases The timing of water releases was described by participants as critical, inseparable from temperature concerns, and not always governed by what is best for fish survival.
Timing on the water releases is always causing problems with fish. Releases are not regulated with temperatures. That will have an effect. I think for years when we did have salmon in the river you always seemed to have a normal rainfall year. It hasn’t been that way in the last few years. There are good flows on The American River in spring and summer. When you got to Fall, Sept-Oct they cut the flows back and you had a warm river. Fishermen have such low priority when water releases are considered.
Some other entity is controlling the water releases and has nothing to do with what's best for the fish. It’s more about what’s best for farming.
Temperature & Releases from Dams Participants discussed the temperature of the water released from dams as being critical for the survival of fish. They expressed concerns temperature being ignored when water was released for agricultural purposes.
Temperature of the water will affect salmon more than striped bass and sturgeon. Before the dams, all the water coming down was snow runoff, which is very cold water, very good water coming down the rivers. Now we have hot water coming down. Don’t know about rim dams anymore, but we had to fight hard to get Lake Comanche to release at a temperature proper for the fish. Shasta and Oroville I don’t know about – those would be the major three. On Shasta, they put a device on the dam to allow them to take off water at certain elevations. With that they could control the water temperature in the river for salmon. Commercial fishermen for salmon have lobbyists whereas we don’t do that. Economy-wise the salmon gets more clout. They adjust that temperature in the
123
Sacramento River by Redding/Red Bluff so the salmon hatcheries have a maximum health and growth rate. The byproduct of that was also good trout and steelhead fishing, and that’s great. Then a couple of years ago, they put same device on Folsom. The problem is that they supposedly have the same shutter system, but they never leave any water in the reservoir so the shutter doesn’t ever get used. They release water from the top. It’s warmer water, which is terrible for the fish. They do that for the farmers – rice farmers in the Feather River, Sacramento River, and American River. Hot water coming down the river is very hard on the fish. Salmon and stripers don’t like it. That’s not what is normal for those species. One of the problems that is occurring is that we have continuing drought years. If you look at the rainfall for the last 100 years, it has become less and less and less. If the agriculture releases continue from Shasta and Oroville, those lakes will go to minimum pool relatively early in the year. If that is the case, they will become giant heat sinks. The water will not be cold enough to release for salmon spawning. They would actually have to put chilling on the hatcheries for salmon – they are estimating as early as 10 years from now. That all has to do with global warming. We don’t know.
In summary, participants described both timing and temperature of water releases as being critical to the survival of fish and as intertwined. They also argued that while salmon lobbyist were able to ensure the temperature of releases, without the salmon other species do not get the same attention and are negatively impacted.
Water Quality Uniformly, participants expressed concern about the quality of water in the Delta. Yes, I am concerned about the quality of the water.
The Delta is over. The fishery is over. The Delta is over. Even good years are going to be bad. The quality of water in the Delta has decreased. Water quality is not as great, and the amount of fish we’re catching are smaller. There are not as many big fish. A 15-pound striper a good quality fish. There are not as many females either, which means reproduction is an issue.
As the discussion evolved, they identified specific problems with water quality that fit predominantly into three categories: pollution, salt-water intrusion, and the associated lack of flushing action.
124
Pollution The majority of pollution mentioned was derived from agricultural sources (e.g., herbicides and pesticides); however, participants also addressed other sources such as plastics and natural pollution from mines.
Did you know that DDT is still coming down the Sacramento from the rice fields?
The waterways went crazy with agricultural spraying in the spring – they were really hitting the water hyacinth. I watched them spray everything on the shore – the hyacinth, the tules, anything that was on the shores except rocks – and we think they may have killed off a lot of the fry with that herbicide combination. A lot of that early spring fry that you usually see – at the end of May you usually see them just jumping on the water at dusk – but they weren’t there this year.
The Sacramento drainage quality of water has been an issue. Herbicides and pesticides from all the farming affects the quality of water, and it’s not good. Mercury is getting to be worse. In areas around Folsom, fertilizers are used for lawns, etc. and those chemicals are going down drainages and releasing some kind of bacteria that carries mercury above the lake level. It affects the perception of fishermen – they are worried about contamination from mercury poisoning. High mercury levels are commonplace in lakes around here. Also in the Delta and San Francisco Bay. One of the guys at UC Davis named Dr. David Ostrich did a study of stripers in the bay, and he found that there was maternal transfer of toxins to the eggs. His study was about halfway through . . . plastics was #1 and agricultural runoff was #2 . . . that about 97% of striper eggs spawning in the Bay and Sacramento River system were deformed at the time they were spawned. The fish that were the best developed were fish that lived upstream in the American and Tuolumne and that did not migrate down to the Bay. Those fish had much healthier young than those living in the Bay. There is an awful lot of pollution in California. There is some natural pollution too from mines in the area.
No Flushing Participants argued that while pollution existed in the past, it was diluted by the flushing action of freshwater flow. That flow has been seriously decreased by the pumps. In addition, the flushing that is generated by the pumps has a scouring effect, removing the food source for fish.
Pollutants become more of a concern when you have less of a water flow.
125
They aren’t getting flushed out or betting diluted. You sort of have a Catch-22 here in that farmers are restricted more and more in what herbicides they can use. They are using less and less toxic herbicides, but there is even less of a flow, so even though the toxins that are hitting the water are not as toxic as they were 20 years ago, they are not being diluted any.
Too much siphoning, not enough coming down. It’s not cleaning out. Last year I went sturgeon fishing – there was not enough fresh water flow or flow at all. That’s pushing in the sediment. It’s not clearing out the system. There is anywhere from 6-8 inches difference in sediment on the bottom. It means the water is stagnant. I saw more dead fish floating in the system than in the previous 10 years combined. The system is not getting flushed out. Some of what you see in the papers is a result of the National Marine Life Fisheries study that showed that less than 9% of salmon hatch ever make it to the west side of the Delta. They die in the river because of lack of flow down the river. The ones that survive that get sucked into the west end of the Delta and can’t get out. They have nothing there to live on. The same condition is affecting far more than just salmon. You’re just seeing the results on salmon first. It’s more obvious on salmon because they have such a short life cycle, but it also affects striped bass and eventually you’ll see the results in sturgeon. And the problem is that if miraculously were to fix the problem, perfect world tomorrow they decide that yeah, we’re not going to do this anymore, salmon can rebound the fastest. It will take stripers and sturgeon longer yet to rebound. What’s affecting the young of the year [salmon fry] in rivers and the Delta is the fact that they have no food– the plankton and zoo plankton is not there for them to feed on. They are stuck in the desert for them. They can’t get out against the flows to get out of the Delta and there’s nothing there for them to eat so they die off. That same effect is happening to like the Delta smelt which is a native bait fish to the Delta, that is dying off as well because of that. It’s like flushing a toilet. Your best toilet flush is the one that scours everything clean. Well, that flow of water into the pumps is scouring the Delta clean, which is not what you want for the fish species. Everything starts at the bottom of the river and comes up and when that bottom of the river has been scoured clean, there is nothing there for them to feed on.
Saltwater Intrusion According to participants, the lack of a natural flushing action has created a situation whereby salt water intrudes into freshwater areas. As one participant described it: “Salt
126
percolates out of the ground, and when you pump a lot of water down south, the ocean comes in because the water that should be pushing it out is being sent south.” Participants described the effect of salt-water intrusion in various ways but most of their comments related to the impact on striped bass fishing.
See how you can put this together with the Delta – I’ve been fishing the Bay a long time, and when salmon come in they would acclimate at California City. Now in the last five years, they have been acclimating through Benicia.
You talk about an economic impact…I’ve been in this business for 18 years. The traditional flow of business is that my peak time is from Memorial Day to Labor Day. When we had good striped bass runs that would go through to the middle of late part of October. Then business would drop, and it would be the hardcore people who waited for this six weeks to fish type guys. That hasn’t happened the last 3 years. The reason is the saltwater intrusion.
We lost our bass bite at California City the last 3 years. It is all pushed up toward Rodeo now. For years, the area I work in (basically the North Bay), the striped bass bite was so consistent it was called a World Series bite. It always happened around World Series time. You would go out as recent as 3-5 years ago and have bumper striped bass fishing. What has changed in 3-5 years? They ramped up pumping in the Delta through the summer. The first taste of fresh water as they come up is not in the North Bay – it’s up here. People who have been fishing Pittsburg, Concord, etc. have caught bass like we should be, but that affects business. This year, I have very few bookings from people through October who specifically want to go for striped bass. They are all looking for guides up this way. Striped bass are probably one of the most…what is the correct word… social or schooling kind of fish. The school will work together for the common good. A school of salmon would not do that, whether they are wild or hatchery. It’s just not the way they go at it. Striped bass bite in the North Bay is all a relationship to the first taste of fresh water as they come through from the salt water they have been in all summer and start moving up to the Delta. They school up to acclimate the feed and then move on once they have gotten acclimated to the fresh water. It’s still happening, but it’s just happening further east. The barriers are all the way up past the fleet.
I caught a Dungeness Crab at the fleet. The salt content is almost double what it’s supposed to be allowed, and they have been pumping all summer.
127
Of particular concern to some participants was the planned South Delta Improvement Project that from their understanding is intended to flush the Delta. They were suspicious, however, that the real reason for the project was to keep salt water out of the pumps associated with the Peripheral Canal plan.
As part of the Peripheral Canal plan, and in fact, it’s the part they have already started in to – it’s called the South Delta Improvement Project – they intend to build gates on two of the main accesses, and they claim it is so the river water from the San Joaquin River will flow through the Delta to flush the Delta. The river that I crossed last weekend that was dry. And this is the water that is going to flush the Delta? The real reason for the gates and locks is to keep salt water from working its way into the pumps. When and if these gates are built, which is becoming more when that if, all the Delta marinas that are like on Bethel Island, they are now going to be isolated from the main river. If you have a boat in the Bethel Island Marina, the only access to the San Joaquin River that you’re going to have is going to be on Dutch Slough. If you try to go down Falls River, if you go down Old River, there will be a permanent lock. The only way you get over it is you would have to entrust your boat to them to either trailer or lift it over and they haven’t decided which to do. It’s an Army Corps of Engineers project. There are two other gates planned, too. Yes, four gates are planned. These are the first two. Yet in California law, there are laws that say they can’t build locks on waterways, so one law is being ignored. Where is Fish & Game on this? Once again, I will say they are not advocate for fishing.
In summary, participants agreed that the quality of water in the Delta has significantly decreased. Pollution from herbicides and pesticides associated with agriculture were cited as causes along with plastics and natural pollution from mines. The quality of water was also described as being affected by the lack of flushing action created by the pumps and resulting salt water intrusion.
Politics And Water Management There was the widespread belief among participants in these two focus groups that water management was situated squarely in politics. They expressed both anger and frustration with evidence of water management that ignored the fishing industry. One participant in particular captured this sentiment well:
It affects us. It affects the economy of the Delta. I took a lady from the LA Times out on my boat and we drove around Bethel Island. It’s really funny, but I’d see people sitting on docks and they’re fishing and doing nothing. They are sitting there watching their rods. We’d pull up and talk to them. They would start talking to her about houses that aren’t sold, businesses that have closed down, bait
128
shops that have closed, boats that can’t be sold. So it’s a lot more than a bait shop or party boat or a boat sale.
Participants voiced three primary concerns with regard to water management: 1) extensive water use by agriculture; 2) ground water reduction; and 3) a lack of faith in those who currently make water management decisions. Agricultural Water Use Agriculture was seen as one of the primary problems associated with poor water management for two reasons. First, participants perceived that there are virtually no limits on the amount of water that is available for agricultural purposes. Second, and perhaps more importantly, they perceived farmers/growers behave unethically and get away with it. Ethical violations came in three forms: growing water intensive crops (e.g., rice); growing perennial rather than annual crops (a violation of water usage contracts); and selling water rights for a profit.
When you hear the amount of the cubic feet per second being pumped at the pumps, it doesn’t include all the agricultural water that was already taken out of the rivers before they ever flowed into the delta. And the Glenn/Colusa County Rice Grower’s Association, they have contracts that date back to the early 1900s that don’t limit them on water they can take. Those agreements are inviolate. Here they are growing rice, the most water intensive crop in the world in what is basically a desert. I sat through a meeting 20 years ago with a lawyer from the Glenn/Colusa Rice Growers’ Association who very proudly said, “We have contracts that allow us to pump every last drop of water out of Sacramento River.”
Water has been promised 8.5 times the amount we have available. Water in the State operates on a hierarchical system. Those adjacent to water sources have the right to the water first - before anyone else. Then after that, it goes on an historical basis. You get your water rights and then the people at the very bottom of the line are the people in the West Delta or East San Joaquin – that would be Kings County, Kern County, Westlands Water District. They were told they would get water only on wet years. However, they found it a lot more profitable to plant perennial crops. So they plant fruit trees, grape vines and almond trees… The Westland Irrigation District, in their Annual Report (and this is all public information)—even though they are the bottom of the line, and under federal court orders right now,[and] they are getting less of an allotment than they have been getting previously—they still don’t even use all the water they get to grow. They sell off their water rights, and the farmers who make up the Westlands Irrigation District actually make more money by selling off water than they do by growing crops. They are not farmers. They are growing perennial crops, which under their agreements with the water is illegal – they are only supposed to grow
129
annual crops. But if there is a year where they can’t get the water supply that they have been getting, they are not losing anything. They are only not planting that year. But they have ignored that. You drive down Interstate 5, and what do you see? You see nuts trees, you see grapes, you don’t see row crops. And this is the water that…I was impressed when I was driving back over the weekend, Where Hwy.152 crosses the San Joaquin River – the San Joaquin River is dry - dry as a bone – but the water canal next to it is full. So these are the kinds of thing…And like he says, the publicity campaign is trying to make this out to be oh, the poor unemployed farm workers, the farmer workers are unemployed because we aren’t getting water. Farm workers have the highest employment rate in the State. And that’s from the State’s own labor board. Westlands has a public relations firm. They give them millions of dollars, and they get really good press. One of their-Resnick- a guy by the name of Resnick – who has a corporation that owns a farm – recently sold his water at a $77M profit – for one water sale. He’s getting $5,500 per acre foot from someone in Imperial County.
Groundwater Reduction A second concern about water management was that groundwater from the north was being diverted to Southern California via the pumps. While not a topic that was familiar to many participants, it generated significant interest among participants in the group in which it was mentioned. It was introduced in this way
One of the things that’s also scary is that we have no groundwater regulations in the State. Some of the water districts both south and north of the pumps have wanted and so far lawsuits have held them up, actually pump water from the ground and into the rivers and actually shop it down south through the pumps, using the rivers as a conveyance and then running it through the pumps. Butte County tried to do that, but we got that to stop. Groundwater usage is so great now that in the west San Joaquin Valley, the valley floor has dropped six feet. They are actually worried about the two canals because they are afraid the canals will crack and collapse. They are going to change the flow of the canals because the Valley floor is dropping.
Water Management Decision Makers To some degree participants felt powerless to change water management issues they see as negatively impacting the fishing industry. They described themselves as having “no voice” in these issues. It is their perception that “politics” (and in particular, the governor) decide how water will be used and those politics place Southern California’s needs above those of the Delta. They expressed some concern that it may already be too late for the fishing industry to recover.
130
When Schwartzenegger was elected, he appointed – and of course the Assembly has to approve it or disapprove it, so it’s basically an appointment – he appointed Brian Roderic, who was actually a Fish & Game professional. For the first couple of years of his term, he had Fish & Game moving in the right direction. Then this lawsuit came through the federal courts that was going to restrict the pumping – the lawsuit was that the Department of Water Resources never had proper permits to operate the pumps right from the very beginning, and until they could get those permits, they were going to be restricted on the amount of water they could pump. Schwartzenegger looked at Roderick and said, “Issue the permit.” Roderick said he couldn’t do that without a study – “legally I cannot do that until we actually study the effects of the pumps on the fishery,” which actually had never been done. Schwartzenegger basically said sign or you’re out. And he was out. Now the director of Fish & Game used to be the head accountant. He’s a guy who will take orders from Schwartzenegger. This is the problem at Fish & Game in a nutshell.
The Governor has worked himself to the point where he can basically appoint Fish & Game commissioners. They have their own agenda. They understand full well what they are doing. A friend of mine years ago in the Deukmejian administration was one of five that was a possible candidate to be a director of Fish & Game. He went to a meeting where they were going to interview five prospects. He said he knew everyone around the table, they all shook his hand. The first question he was asked was, “What do you think about the Peripheral Canal?” He turned around and walked out of the room. That’s the problem; whoever is in charge of the water system is stacking the deck. The Trinity River flows into the Sacramento. All this water is sent to the Delta and then they take it and export it to Southern California for agriculture. It’s not the best thing for what we have here with salmon and other fish species. Southern California has the biggest voting base, so they have the voting power to decide what happens to the water. The biggest water district in the world is in Southern California. They have all the power, whatever they say is what happens.
It’s going to take a complete loss of the system to say “no more water, it’s done”
Along with their lack of faith in the Governor to make sound about water management, these participants expressed little faith in CDFG to make a stand are their behalf, partially because the Governor appoints the Director of Fish & Game.
The director of Fish &Game has to be an elected official, not appointed. Otherwise, you’re going to get a yes man in that position every time. That’s what’s happening right now.
131
Fish & Game has laws that they could enforce. What’s the difference between guy who catches a dozen striped bass and kills ten more than he’s supposed to than a Department that builds a gate on a spawning stream and kills thousands and thousands of fish? They are both poachers as far as I’m concerned. And the laws are there to protect the fish but Fish & Game won’t enforce them because higher-up levels in the Department of Fish & Game are run by politics and not legalities and biology, and they told, “Don’t enforce.” Guys like - (Fish & Game employee) he is one of those guys who are caught in middle. He knows what the problems are. (Name) was at a meeting three years ago that involved sturgeon regulation changes. I asked (F&G employee) point blank, “I have a question for you. How do the pumps affect sturgeon?” His answer to me was, “I can’t say how the pumps affect sturgeon at all.” He didn’t say they don’t affect sturgeon. He said, “I can’t say that they have any effect.” And that’s the problem. You’ve got politicians managing biologists. Department of Fish & Game should be commercial organization, not a government appointed organization. It’s a puppet right now. They should be encouraging more fishing and taking care of the environment and getting more fish. If you’re a senior biologist at Fish & Game and you—let’s take this study for example [the focus group study]—and the whole thing is done and tremendous findings are done and if they were implemented, they would really change the way of fishing in California. If it had anything to do with changing the water pattern in the State or if it affected revenues for the general fund, it’s going in the drawer. No one is ever going to see it.
In summary, participants expressed concerns that water management decisions are being driven by politics rather than a genuine concern for preserving the resources of the state. According to participants, agriculture is granted significant leeway in water usage, to the point where farmers/growers are perceived to be abusing their privilege by growing inappropriate crops or selling water rights while the Delta suffers. The need for water in Southern California is impacting groundwater in Northern California. Finally, participants described water management decision makers as limiting (and in some cases, silencing) the voices of those trying to save the fishing industry. The governor and CDFG are seen as complicit in making decisions that continue to have a negative impact on the fishing industry.
IMPACT OF RECESSION ON EQUIPMENT SALES, MARINA OPERATORS, AND GUIDES
Earlier in this report is a discussion of how the recession has impacted angler behavior from the perception of these focus group participants. We also wanted to know, however, how the participants themselves had been impacted by the recession. Guides,
132
those who sell fishing equipment, and marina operators have been effected, but to differing degrees. Recession Impact on Guides For most of the guides in the group, the recession generally had some impact on their business, though not described as significant. This condition was partially because people were staying in state to fish or represented a population somewhat unaffected by the recession (i.e., retirees on fixed incomes).
People are staying local instead of traveling out of state and country.
Actually in my business, the recession has more people fishing, but spending less money. They are not buying high end – just spending the bare minimum. The business stayed pretty good for us. But we specialize in six people.
No decline in my business – but my business is a little different. I’m dealing with fly fishermen primarily. Most of them are retired, most of them are relatively well off. They have the money. It’s getting to be more of a thing. And those to me tend to be older people. And you see a lot more people on fixed incomes, too. I see a lot more retired people and working class people. They know they are going to have retirement. You have the retired type guys who are more like regular customers. Guys who might come out every 2 weeks are now coming out every 3 weeks.
For other guides, the impact of the recession was more substantial. A few guides indicated they had made some adjustments in their business during the recession to maintain income.
Generally in a recession, we do quite well, but we’re not doing very well now because of a lack of fish and water. We’re pretty busy usually, but not now.
Normally it slows down a little this time of year, but this time it has not started up again. Maybe in October when the bass fishing starts up. I can’t support myself and my family without salmon. My entire winter’s income normally comes from salmon from September 15 through October 31. I normally don’t have to work much after that through March, but that has changed in the last 6 years. The work has been declining, and definitely since they closed salmon season. In the last 4 years it started to really become a problem because the number of people fishing is declining. No fewer fish seen – just fewer fishermen.
133
Our salmon season and all ocean stuff starts in February and goes through the summer. Even guys who fish offshore, before these guys would be going on 2-3 long range trips a year. Now it’s down to 1. And they are going to put all their nickels into that one trip. Offshore fishing is very expensive - $1,000 for one trip. People are not spending that now. When these guys are paying, these trips are $5,000 and up. Both of us here run smaller 6-pack boats but I know a number of guys are down to just doing weekends. They are not trying to make their whole living off of it. They are now just doing a weekend kind of thing. I’m working on weekends, but not much on weekdays. Now we do tours.
A few of these guides described a downturn in business that was specifically linked to corporate clients.
Guide service down because it’s a luxury. We used to have corporate groups or companies that would go out before – that’s not happening. What has happened is that you take a group and you used to have a corporation chartering the boat. He’s going to get all these first timers and these guys don’t make that much money, so he’s going to supply the beer and the lunch and buy the whole boat. But corporate’s not around anymore. Now he’s not booking the boat anymore. That’s what’s happened with all the landings and all the guys with big boats. Now what they’ve done is they’ve come down on their prices so they can draw in more off the street, like onesies, twosies, and basically trying to bring in smaller groups. And we talked about why some of the boats aren’t running anymore? That’s why. On the bigger boat level, but as far as our business, you know, we’ve started running 6- packs the last couple of years. Our business was down last year. It’s starting to come up a little bit this year.
Guides who had not experienced a significant impact on their business as a result of the recession offered a variety of explanations that went beyond having a particular type of clientele (e.g., retirees on fixed incomes). These explanations included appealing to clientele who had been laid off in the recession or were just being conservative in their spending. This clientele were perhaps drawn to fishing because it was relatively inexpensive.
It’s relatively cheap for entertainment – you can go out 4-5 hours for $20 and might get a meal out of it. I’ve only been in business a couple of years. It’s entertainment and cheap for the money. For your money, you’re going to go a lot farther.
134
The guides indicated that a good portion of their business now comes from private boaters who have been effected by the recession. When considering the cost of gas and bait as well as the time invested in figuring out where the fish are located, it is more cost effective for them to hire guides than to take their own boats out.
We’re getting private boaters on the boat. They want to go out fishing. It’s cheaper for them to go on my boat. It’s way cheaper. A guy can go out three times a season with me and then not own a boat. It saves a lot of money. One of my neighbors who is a customer wanted to buy a boat, and his wife came over and asked me to help her talk him out of it. She did the math. She could buy 300 trips with me. By the time he bought the boat and paid insurance, registration, fuel, and maintenance, he could go out with me a lot. You don’t have to wash it. It’s expensive – food, fuel, launching fees, insurance… It could cost $500 a day for one. They don’t have to clean it up or tow it back. They are going to follow us around anyway. People have fewer opportunities. The world is moving at a faster pace. A lot of these guys will go out by themselves and they haven’t gone fishing all year. They have no clue where the fish are at. They will go out and have a miserable day. If I go out with (name), we’re going to catch some fish that day so they know that if you guy out with a guide, he’s trying really hard. You hope he knows where the fish are at. And they are probably going to have a much better day because I don’t know where to go. It’s a much better day than if they had gone by themselves.
Recession Impact on Equipment Sales/Marina Operators Individuals who are in equipment sales or operate marinas reported being hit harder by the recession than the guides. Purchases, particularly those for nonessential items, have decreased as have service requests. One of the biggest challenges for participants associated with equipment sales was competing with companies who sell online.
Business is down terribly.
135
They don’t give up the sport – they just can’t afford to do it the way they did before. They are not even buying rods and reels – they use what they have. They repair and not replace. They do whatever it takes. Fiberglass/oil for motors and freight went up and never went back down. Everything doubled. Sales tax is a disadvantage too. People can shop out of state online and don’t have to pay the tax. When times are good, they don’t have time, but they buy high end stuff. I don’t have things in my shop that are necessities. They are toys. There’s nothing that people have to have. I’m 60% down in business. Boat sales are probably down by 90%. I sold 1 boat in 1.5 year instead of several in the same time before. Service department- we’re normally booked 6 weeks out, now I’m never more than a week out. Lots of people are not using their stuff. Lots of regulars are coming in every other year. People are trying to do things themselves. Major online wholesalers are selling stuff below prices they paid for it. In California, it’s hardest to do business – all the rules, regulations, fees. Cannot compete with online stuff. The recession is killing me. To rig up the average boat for salmon fishing costs $60,000. The majority of boats I was caring for were worth a minimum of $30,000. Now I’m seeing boats that shouldn’t have been allowed on the water. People are sitting on boats because of their terrible mileage. Lots of boats came up for sale cheap. Boat sales aren’t producing revenues. The average installation five years ago cost $3,000. It’s now averaging $300-$400 – the bare minimum. People are keeping everything. When boats need repair, they say, “If you can’t finish in an hour, don’t do it.” They set maximum amounts for work to be done –“ I can spend $200 and then stop the work.” It’s absurd. Guys are going 60-70 miles offshore. Saltwater is a friend to nothing. If they go out one time and something breaks, they don’t go anymore. They can’t afford to fix it. A customer went out and dumped 142 gallons of diesel for two fish. These guys will go, but they will not spend. 3-4 years ago when money was good and the windows were right they would go every week. I had a customer tell me “I want to go this week, the weather window is coming, but I can’t go.”
In summary, most of the guides who attended these focus groups had experienced a change in their business as a result of the recession. A few had experience a significant downturn in business. The former group explained their good fortune on providing enjoyable but cheap entertainment, entertainment that was being enjoyed not just by retirees and individuals who had been laid off, but also by individuals who owned
136
their own boats but now found it too expensive to operate. Those participants in equipment sales and marina operation reported being hit harder by the recession.
ADVOCACY The final question area for these focus groups dealt with advocacy; in particular what organizations participants were a part of, or knew about, that advocated for them with regard to your concerns about the sports fishing industry. The discussion that evolved clustered into four areas: 1) how participants learned about problems associated with the fishing industry; 2) advocacy efforts; 3) challenges they face internally and externally in advocating for the fishing industry; and 4) lack of promotion for sport fishing.
Sources of Information About Fishing Industry Problems Participants reported that they keep informed about fishing industry problems primarily through electronic and media sources, and well as through independent experts, Department of Fish & Game meetings, and fishing organizations. Fishing organizations also were identified as educating the public about the problems facing the fishing industry. Electronic and Media Sources The most common electronic and media sources used to keep informed were email, the Internet, Fish Sniffer magazine, Sep Hendrickson’s show.
We get a lot of e-mail and get a lot off the net. Dan Bacher is someone many of us have contact with – he does Fish Sniffer magazine. We mostly find out what’s going on by listening to Sep Hendrickson’s show.
Independent Experts/Department of Fish & Game Participants also depended on contacts with experts such as independent biologists, Fish & Game personnel, and Fish & Game meetings for information about problems affecting the fishing industry. They were not altogether happy with the Fish & Game meetings, arguing that rarely were their comments and concerns welcome in these meetings.
We all have contact with all kinds of people some who work for independent biologists/fish and game people. We’ve been absorbed in this for years. There’s a normal flow of chitchat with the agencies.
137
I would like a forum with Fish &Game where they actually listened. I believe the meetings are less and less advertised so fewer people will show up. When you have something to say, you are cut off rather abruptly.
Fishing Organizations as Source and Provider of Information There was agreement among participants that the fishing organizations of which they are members not only kept members informed about the problems facing the fishing industry but also made it a practice to inform the public about these problems.
We have guys in our club[Striped Bass Society] that are very active. One of our goals is to educate the general public about the truth about what is going on with water. We have monthly meetings. There are seven chapters throughout the state, and we are very active. We try to keep everyone informed. There are a number of organizations that do just that: The California Sport Fishing Protection Alliance, the Restore the Delta organization – and that’s a very good organization. There’s Keep America Fishing. There are a lot of grass roots organizations are endeavoring to educate people about this. We network with these organizations.
In summary, these participants rely on electronic and media sources, independent experts, contacts within CDFG, and fishing organizations in which they are a member to keep abreast of problems facing the fishing industry.
Advocacy Efforts Participants were proud of their efforts thus far to advocate on behalf of the fishing industry, despite some political roadblocks. They provided a few examples of their successful efforts.
That’s why we’re out there. That’s why we go to the Capitol and fight the Peripheral Canal. It sure wasn’t a million people, but we got on the 5 o’clock news and it got publicized. That’s why I’m here. We know we can’t do a whole bunch, but at least we can get it out there. Earlier this year, a bill was offered by Kern County to legislators to deregulate striped bass. The word got out basically through the Internet that this bill was coming up, and we needed to write letters. Every single one of the clubs I’ve mentioned put out an alert to their members. This is happening. You need to send e-mails. You need to write letters. The majority of guys in our club wrote letters and had list of committee members who were going to hear this bill. For one of the first times, it was effective. They had already gutted the bill before it even went into the committee hearing – they had taken out all of the deregulation
138
stuff about striped bass because of the overwhelming response. They had a Committee room full of people against the deregulation. But on that room, I used to work at the State Capitol, and the room they put that hearing in was the smallest committee room available – the room held 70. They have committee rooms that sit 1000 people. They don’t want people there. Three years ago, when they were talking about closing the salmon season, there was a letter writing campaign, and the salmon season for what it was worth stayed open for another two years. I don’t know what good it was because there were very few fish to be caught. It wasn’t just rammed down your throat. We can have an effect. We have lots of people who are willing to write letters and send e-mails. The opposition has a few people with lots of money. So you’re fighting numbers against the money game. It goes on from there. The Peripheral Canal is the latest one of this. I send 2,000 e-mails a week and update our website daily (California Sportsfishing Protection Alliance). What I’ve found over a number of years, and I have been involved in the politics of fishing, is that handwritten letter to a politician made a lot more difference to a politician than an e-mail. Staffers will see an e-mail and go, “Aaah.” Emails and the net have their uses. When it comes to influencing politicians, yeah, we sent a lot of letters. Letters are better than e-mail. Those are the times you see the results.
Challenges in Advocating for the Fishing Industry
These participants were committed to advocating for the fishing industry. As one participant put it, “We’re still here and not going away.” However, they also acknowledged there are multiple challenges in maintaining momentum for advocacy. Some of these challenges were internal to the organizations of which they are a part, while others were external to the fishing organizations themselves. Perhaps their biggest challenge, however, was fighting the disheartening nature of politics they encounter as they advocate. Internal Challenges There were three internal challenges to advocacy efforts identified by these participants: 1) a general lack of power associated with the fishing organizations of which they are members; power to effect change; 2) a need for strong leadership to guide advocacy efforts; and 3) a need for strong collaborations among fishing organizations and with outside organizations to create a more powerful voice of advocacy.
139
Lack Power. A common theme in the discussion of challenges participants faced in advocating for change in the fishing industry was one of their lack of power. They indicated they do not have any organizations powerful enough to sustain successful advocacy on their behalf. Creating that power was seen as critical to creating a stronger voice to save something that is dear to them.
We don’t have enough voice – we need more power. We don’t have an organization that has any power, and that is the problem. You have to have power and get everyone together. We’re not being squeaky enough. We’ve got to find a way to have a voice. We’ve got to get groups together for a louder voice.
We have lots of little organizations and small groups, but none have the power to do anything. That’s one of our problems. It’s all very telling that all of us are members of various clubs because we have to be. We all realize that the thing we love is at risk. If we don’t band together in some way, shape or form, we are done. We are going down without a fight.
Lack of Leadership. Associated with the need for more power was the need for leadership to bring the various organizations together; leaders who could bring a common focus to their cause and unite them in action.
Personalities interfere. People have to let it happen. If we had a good leader, we would have success.
Everyone involved in fishing needs to donate to one fund and pay one good lobbyist. That’s the problem; we need someone to take charge. Nobody is volunteering. There is a way to do this, it’s just someone needs to step up. We need a leader. Nobody has stepped forward to take charge. We’ve got to find a way to have a voice. Why can’t we get together with these clubs to have a voice? Everybody has their own agenda. It could happen but people have to let it happen. If we had a good leader I think it would come together.
Lack of Collaborations/Networks. Leadership was seen as being necessary but not sufficient to unite their various organizations, however. Participants also described the need to form networks and collaborations that would inevitably give them a stronger voice to advocate for changes in the fishing industry. A few participants acknowledged that collaborations had been tried in the past but had not lasted.
140
We lack a network, and that is our fault. We have no way to connect all entities involved. Tree huggers do get one little credit – they did help us get an injunction against the water people to stop the water when the salmon smolts came down in 08-09. They did help us with that. We’re going to have to align with them more to get things done. They have power – we don’t. We need to find some common ground on this water issue. We could commonly go for the health of the eco-system. The whole problem is the eco-system – they are ruining it down there. United Anglers tried to unite groups, but went by the wayside after @ 10-15 years.
While members supported the need for collaborations, they also voiced concerns about problems that accompany them. These problems that included an inability of some organizations to connect with a common focus, infighting, distrust among fishing organizations and distrust of organizations external to them that might be potential collaborators.
We have guys do this too – they don’t like this guy, so I’m not going to work with him – lots of infighting amongst the clubs. There’s a group interested in trout fishing, and they don’t care about the Delta and vice versa. Organizations only last for about 10 years. You’re trying to pull all these different factions in together. We’ve been trying to get these groups together. Fish & Game could be standing there saying, “We’re going to unite you guys.” But Fish & Game doesn’t help. They are not advocates for fishing. We’re trying to do some of that with CSPA (California Sports Fishing Protection Alliance) – they are trying to do some of that, but you still have some of that kindergarten stuff with people working for same cause, but you get factions, and powers-that-be, the politicians love it because if you don’t have a united front, they don’t listen to you.
For a long time, the [California United Fisheries] – one of the largest kokanee-only salmon organizations, funded and tried to get people to come together, but everyone had their own little thing. We tried to figure out a way to try to bring people together. We were trying to become one cohesive group and bring all small groups together, but that’s not working. Distrust in the state is so high. Everything we used to do with Fish & Game – we donated $30-$40-$50K a year and had no problem. Each year the rules changed, and now Department of Fish & Game can’t take the money anymore. It could be a conflict.
141
Other organizations starting picking at it (DFG) and watched it decline for past 18 years. It’s kind of amazing how all of us want the same thing, but we all have to have our way with no cooperation. There have been some big time sellouts [in potential collaborators]. The Nature Conservancy – already has land in the Delta and I’m sure they would love to see the Delta islands flooded. If islands are flooded, they are no longer of use to anyone. The State would not want them. Who would the State want to give the land to? The Nature Conservancy. The farmer will sign over the deed to the State because he doesn’t want to pay taxes on land that is flooded. I think some groups look at the Delta as a land grab. Then you get someone like the NRDC (National Resources Defense Council), another national organization… Both of these organizations have backed the Peripheral Canal. They are backing the Delta Bill right now. These organizations get most of their funding through grants. A lot of it is funding through agricultural associations. The NRDC is looking after its pocketbook so it’s going to back the canal as well.
External Challenges Participants mentioned two primary external challenges to their advocacy efforts on behalf of the fishing industry. One was a lack of political representation and the second was a lack of promotion for sport fishing. Lack of Political Representation. There was significant discussion throughout the focus groups about the difficulty participants saw in garnering support from politicians to solve problems facing the fishing industry. That discussion was particularly pronounced as they discussed the challenges they face in advocating for change. The lack of political representation they perceive occurs from a lack of access to politicians, and from the political maneuvering that keeps representatives favorable to their causes off committees central to the interests of the fishing industry.
Jarrett Huffman is Chairman of the Wildlife Committee in the Assembly – if you send him an e-mail, you get an automatic response back that he only accepts e-mails from people in his district. You have to go to a site to fill out a form to send him anything. You have to have a zip code within his area before he will accept your e-mail. That would be great if that was his only responsibility. If he’s Chairman of a Committee, he should be responsive to the entire constituency of the State of California. But that’s not the way it works.
Hendrickson, Sep and Marilyn –are very vocal advocates for sport fishing – on a California sports radio show. She was appointed by Schwartzenegger to the Fishing Commission and starting voting the way we would like her to vote. But because she hadn’t been appointed appropriately somehow some little thing got her replaced with a tree hugger environmentalist. She spoke for us very well. She was there very short term – and the powers did something very
142
embarrassing to me. They told her they could not put her on the Fish &Game Commission, but instead put her in two minor little things to keep her out of the way (State Fair Commission and CWA’s commission). The political game playing is pretty scary. I don’t know the name of the present person on the Fish &Game Commission, but from they are from Southern California and Greenpeace/Sierra Club backed. Tree huggers. How many people on commission? We have five commissioners – we need to have 1 fishermen, 1 retailer, 1 guide, 1 farmer, 1 commercial fisherman, in order to have some variety of people. Whose fault is that? The Governor. He controls it. He’s confused about what Fish &Game is about. There are idiots at the Capitol. I go to a lot of Fish &Game Commission meetings – when we had commissioners who were oriented to fishing and hunting, it was easier to get things done and changed in the way we felt it should be done. We had a voice then, we don’t have a voice now. What’s the point of even going if they won’t listen to us now?
Lack of Promotion for Fishing. The participants in these focus groups argued that the lack of political representation for the fishing industry was linked to a lack of promotion for sports fishing.
I don’t want to get into it, but it’s a political thing. I think it’s a political thing. So you don’t want to educate people on fishing because it’s a political thing. The more people who get involved in fishing, the more they want to protect it, the more they want to do something about it. So they are going to fight other political aspects of it that don’t want that to happen. This has always been a big problem with California – too few of the population hunt and fish, its less than 10% – there are 40 million people in the state. The lifestyles in other parts of the country are different, particularly southern states. One out of four people in Louisiana have licenses. In Colorado, they close schools down for a week at the beginning of elk season. Fishing is not being promoted by newspapers or television. You go to some of the other states back east, and it’s promoted with billboards, etc. We don’t promote it here.
This lack of promotion was noted by participants as particularly problematic when it came to youth, because without the support of youth, sport fishing was considered doomed. They noted it was critical to promote sport fishing to youth and to provide them with accurate information about the sport.

143
We need education and getting more people involved. Education by some form of advertisement or news media or something because that’s what we need. When we’re gone, who is going to carry the torch? We’ve got to have the youth. If they carry the torch, then they will take care of the environment too. But if we don’t bring them up, how can they take care of the environment? There’s nothing else for us to do. Otherwise, they will just destroy it.
We try to educate and teach them, and most of my customers are already anglers who want to improve their angling skills. So their kids are on the boat fishing. That’s the only hope that customers who go out with the guides are the ones who will keep on fishing. Hopefully, they bring their kids, have a good time, show the kids a good time, because we’re going to have to start building that army from within and keep the tradition going.
You have a lot of single parent families and the heads of families are mostly female, and they don’t take the kids fishing. Fewer females fish than males.
A lot of people seem to think the fish are not safe to eat. You do hear a lot about that. That affects the younger generation coming in that would be fishing more. They hear fish aren’t safe to eat, so they are not likely to go out and catch them, which again is not accurate information.
Disheartening Nature of Politics Participants acknowledged that one of the biggest challenges they face is being disheartened by politics; the politics that are involved in advocating for change in water management in particular. They want to believe that change is possible and they do believe that the changes for which they advocate are good for the eco-system, not just good for sport fishing. Yet the money, power, and misrepresentation against which they are battling are a constant source of frustration and anger.
Everyone involved has such a level of frustration in the way things are. You expect a little more level of fairness and a little less corruption. A little more of what you think the United States should be. Huge amounts of money are involved. The amount of money involved is unbelievable. The State doesn’t make money on fishermen. When they build a house, they make money for it in taxes. That’s the way they look at it – that’s the difference. You build a house, they get money for it. From us, they are not going to get that much. As far as taxes coming back, that’s the way they look at it. Department of Water Resources is supposed to be a regulator, but in fact they are friends with all the water districts. How many of you guys know anyone from DWR? If you were a water district guy, you’d be eating lunch with them. On a
144
regular basis. So who are you going to allocate the water to? Someone who buys you lunch on a regular basis or you and me? It’s a lot of negative publicity that is out there right now. There was an article out of Washington about people in California are sacrificing food for fish –it’s such a sensitive subject and has a negative connotation. We’ve got other interests of the kids too. And then you get this guy Hannity on Fox News, and he’s down in Fresno/ Bakersfield, and he’s trying to make this a people (food) vs. fish issue, which it isn’t. They make it sound like any drop of water going through the Delta into the Bay is a wasted drop of water. Who is he for? Well, he’s in the pocket of agriculture. When you have demonstrations in Sacramento, we’re drawing off people who have jobs and who have to take a day off work to go and fight for something…For a lot of them it’s their recreation on the weekend. The ones that will go and do this are looking at it as much more than that. We are fighting water and big agriculture that pays their workers to come to Sacramento and demonstrate by the busloads. The Governor had a demonstration in San Luis about four months ago where paid demonstrators that were farm workers and Schwartrzenegger is leading a chant of “Turn on those pumps.” He formed a Latino coalition. He was a founder of the Latino Coalition. But actually the unionized farm workers, the members of United Farm Workers’ Union – they are against the Peripheral Canal. Again there are a few at the top who are making billions off of this at the expense of a whole eco-system and the rest of us.
In summary, participants face a variety of challenges as they engage in advocacy to save the fishing industry. Internal challenges include an overall lack of power and resulting lack of voice to enact change in the industry. Participants also cited that leadership is seriously lacking and is necessary to pull all organizations together and to unite them in action. Also needed, however, are networks and collaborations that strengthen advocacy efforts. External challenges include a lack of political representation as well as a lack of large-scale promotion for fishing that will attract younger generations. Their support is seen as essential in the continuance of sport fishing. Perhaps the biggest challenge identified by these participants is one of becoming disheartened by the politics they must face as they engage in advocacy for their sport.
CONCLUSION Fishing is much more than just a sport to the participants of these focus groups—it represents a way of life that has meaning and value. Its worth has developed over a long period of time (sometimes generations) and for most goes beyond the level of “bragging rights” for who has caught the biggest fish. They could not talk about fishing without discussing it being a good way to spend time with family and friends, to reduce or cope with the stresses of everyday life, and to simply enjoy nature. There was both
145
laughter and nostalgia in each focus group as participants recalled their motivations for fishing. It is perhaps because fishing is a way of life to them that they are so disturbed by the significant conditions that are impacting this sport. Overall they reported an unwillingness to give up fishing, even the face of a recession, although it has been necessary for them to change locations, adapt to declining availability of species, and in many cases to cut back on what they have traditionally spent to fish. Looking across the participant comments in these focus groups, three strong messages stand out: 1) dissatisfaction with Department of Fish & Game Regulation and Enforcement; 2) significant and growing concern for water management; and 3) the need for increased advocacy efforts by anglers. Dissatisfaction with Department of Fish & Game Regulation and Enforcement The first message is that participants in these focus groups were unhappy with regulation and enforcement of fishing by Department of Fish & Game for a variety of reasons. Regulations are perceived to be ill conceived (in some cases doing more damage than good), fraught with red tape, and poorly written. More important to these participants than the regulations themselves, however, was both a serious lack of enforcement of them and a growing concern over unequal enforcement (i.e., some cultural groups not being held accountable for poaching). Despite having great empathy for wardens (who they described as being understaffed, overworked, and doing double duty in policing venues other than fishing, these participants expressed little faith in Department of Fish & Game’s ability to regulate well. There appears to be a disconnect between anglers and Department of Fish & Game, expressed in anglers’ perception that they have no representation at decision-making levels of Department of Fish & Game. They respect certain employees of Department of Fish & Game (e.g., biologists, wardens) but in general distrust the Department and the commitment of those in power to protect their interests (which they see as public interests), or to even sincerely hear their concerns. This distrust extends to the legal system, judges in particular, whom they argue have contributed to the problem of poaching with weak legal sanctions. Significant and Growing Concern for Water Management The second message was that water management is poor at best and perhaps the leading cause of what these participants described as an environmental catastrophe in Northern California and the collapse of their sport. They recognized the complexity of the problem and possible solutions, and pondered in our discussions where the answers lie with regard to meeting the increased demand for water from agriculture and from Southern California. Two participants described their understanding of the complexity in these ways:
146
There was an interesting article in the Fresno Bee yesterday about how some of the big farms or one of the big farms had just sold their water rights to a City down in the desert area. They are going to quit farming. They have rights to the water – as California grows, there are over 35 million now, who is going to pay the most for that water? Cities or farmers? We’ve gotten ourselves into this situation, allowing these water contracts and allowing them to sell those contracts to other places. Who is more willing to pay for water? A developer building 4000 new homes or the farmer in the Valley. More of that water will end up going south. Our whole system is so screwed up on this water bill thing. More dams means less water for fish. If we start putting in more dams, it’s going to be less water to support fisheries; 95% of their habitat is behind dams. To make more dams is a Catch 22 situation. We will provide for more people, but will not help fisheries. When they put in Shasta, they were supposed to put in a fish ladder to help salmon. They did not do it. We don’t have that. Talk about fishing industry taking it in the shorts. Salmon is an indicative species because they are sensitive. If we wipe them out, other species will follow. Just the rotting carcasses of the salmon make everything else possible…
The politics guiding water management decisions were abhorrent to participants. They blamed politicians for the destruction of the fish population that results from dwindling and mismanaged water resources; from pumping, lack of adequate flushing, and intrusion of salt water. The blame results from what participants expressed as legislators’ blatant disregard of the consequences of their political decisions surrounding water management and a perceived arrogance that they can do so without accountability to the people who live in Northern California. They point to examples of the unwillingness of legislators to address tough questions about water management as evidence of this disregard and arrogance. For example:
I’ve asked it for 30 years and we don’t get an answer. They don’t know how much water it takes to sustain the Delta. They are willing to commit eight times the water that comes in to the Delta. What the hell kind of insanity is that?
Participants saw dealing with water management as a rush against time to stop the damage being done to sport fishing. Time and again we heard in the focus groups that problems of water management were not new but that the effects of those problems were becoming more visible and dire. There was genuine concern that if something is not done soon to stop this tide, it may be too late. What made this possibility all the more unacceptable to participants was the thought that it would have happened because of political greed. As one participant noted:
When you’re out of water, you’re out. Writing a check will make no difference. Oroville and Shasta are down. If we don’t get rain, like we didn’t get it for the last 3-4 years, there will be a lot of fish dying and a lot of fighting over that water.
147
First couple of years are going to be rough, but you’re going to have to save water somewhere. Oroville/Shasta/Whiskeytown are the only dams pumping it in, and they are all low.
Need for Increased Advocacy Efforts by Anglers The third message addressed the need for increased advocacy efforts by anglers. The participants of these focus groups were quick to point out that they have long engaged in advocacy for their sport but it has been in ways that were not always visible at a public level or publicized. As was noted earlier in the report, many participants are in some way involved with teaching youth about fishing. They view this education as critical, particularly because they do not see them getting the education anywhere else. Participants described educating a future generation of anglers as one essential mechanism to keep the sport alive. As one participant put it:
The biggest problem is the lack of education. If we’re ever going to get young people involved, we’ve got to be educated on some level. There are no classes about fish populations. Hunters have classes they have to take. They don’t teach that for fishing. We need to be educated. We’re contributing to the problem. We’re all byproducts of what we do that nobody pays the consequences for.
A participant at one of the focus groups described the kind of commitment to saving fishing that is indicative of anglers, but that is often not publicized.
I was lucky enough to be part of this, and perhaps some others in the room were, too. About two years ago Prospect Island flooded, and they had a lot of stripers trapped in there. They repaired a levee break and trapped these stripes, and there was a call on the angling community to rescue these stripers. It was a real privilege to be there and to be part of that. It was a grass roots effort where everybody came together and worked over three days to rescue thousands and thousands of fish. It may a huge difference. That’s where we can make a difference. In situations like that, the government was hogtied. Government representatives could stand there and observe, but could not participate. It was only us down there in the trenches. We were physically grabbing the fish in our arms, putting them in a tube, and releasing them back in the river. It was really incredible to see. So there are ways we can make a difference.
It became clear in these focus group discussions—particularly the discussions of water management—that participants realized advocacy must become a stronger priority for them and they must get more sophisticated in their advocacy efforts. This shift was uncomfortable for a few participants who confided they hate politics and just want someone else to fix the problems they face. For most, however, there was a recognition that if they are to save the sport they hold dear, they must: 1) develop strong ties between fishing organizations and unite in their advocacy efforts; and 2) build alliances with groups that may have traditionally been perceived as “at odds” with anglers to gain
148
more power at the state level. Currently, the participants describe being in the infancy stages of sophisticated advocacy and they face a number of challenges (both internal and external) in meeting the two goals above. However, if they can accomplish them, it appears they could gain at least some measure of the political clout they desire as well as increased publicity for their cause. A final note of observation is offered. Obviously all of the three messages above are interconnected. Perhaps as importantly, the participant comments in this study indicated that currently they trust only other anglers in trying to solve the problems outlined here, and even that trust has some limitations. Their experiences have reduced their faith in Department of Fish & Game, in other related government agencies, and in state legislators (with the exception of Senator Lois Wolk). While they understand the need to build alliances with other advocacy groups, they are still somewhat leery of doing so and they lack vital resources to advocate successfully on their own. To make progress in combating the problems they identified in these focus group discussions, however, they will need to find and develop trusting relationships across government departments, agencies, and legislative bodies. Following their attempts to do so may tell us much about the future of sport fishing.
149
APPENDIX A CDFG FOCUS GROUP QUESTIONS
EQUIPMENT SALES, MARINA OPERATORS & GUIDE INDUSTRIES Introduction Welcome to the focus group and thanks so much for taking time out of your busy schedule to be with us this afternoon/ evening. My name is Ruth Guzley and I am a Professor at California State University, Chico. My associate, Joleen Barnhill (who will be recording your comments this afternoon/evening), works for the Research & Sponsored Programs at the University, and ___________( who checked you in this evening), works for The Program for Applied Research and Evaluation at CSU Chico. The Program for Applied Research and Evaluation at California State University, Chico—at the request of the California Department of Fish and Game—is conducting an economic analysis of the impact of fishing for striped bass, steelhead, black bass, halibut, sturgeon and Chinook salmon in the Sacramento and San Joaquin River systems including the Bay Delta. This research focuses on three regions in the northern part of California:
1. The San Francisco Bay and its ocean environment including the areas just north and south of the entrance to the Bay
2. The Sacramento River watershed, and 3. The San Joaquin River watershed
This study area includes thirty-one counties in northern and central California. The study includes:
1. A review of literature on fishing and specifically fishing in the study area 2. Survey development and implementation 3. Economic impact analysis
This focus group is part of the survey development phase of this project. The information that you provide us will be used to develop and refine relevant questions that will be asked of 3,000 anglers in the study region. Before we get started I’d like to explain a little about how the focus group will work and some other operational details. Given the number of people we have here this afternoon/evening it will be very helpful if you speak one at a time so that Jolene can record your comments. She is not recording your names—it is just the comments we care about. We are also tape recording the session as a backup to the notes that Jolene takes. The tapes are for our use only in ensuring we get all of your comments down. They will not be shared with anyone else. Do we have your permission to tape the session? You will receive your honorarium for participating today at the end of the focus group session.
150
Please feel free to get up at any time during the discussion to get more food or something to drink, to use the restrooms, or just to stretch. We’ve furnished you with note pads and pens so that you can make notes to yourself during the discussion. The restrooms are located _______________________. I’ll give you a short break halfway through and we are scheduled to end the discussion at _______________ . OK, let’s begin. I have questions for you in six areas this afternoon/evening:
1. Angler Behavior 2. Federal Government Subsidies 3. Water Management 4. Species Management 5. CDFG Regulations 6. Impact of Recession
I’ll let you know when we are moving to a new area of questions and when we are on the final section. Do you have any questions about the procedures before we begin? Angler Behaviors We would like to begin by asking whether you have noticed any changes in angler behaviors in a number of fishing related areas. How familiar are you with the sales of fishing licenses in California? That is, do you follow whether they have increased/decreased?
If you do follow this information, tell us if the sale of fishing licenses in California has increased or decreased over the past five years.
Are fishing license sales in your area similar to those in California? Please explain.
What explanation can you offer for the increase/decrease in the sale of fishing licenses? (e.g., fewer young people angling)
What, if anything, are you hearing from your customers about this topic?
Has there been an increase or decrease in fishing for subsistence in recent times?
What leads you to believe this is true? Have you heard this from our customers? Read about it? To what extent has fishing for subsistence effected anglers?
151
Briefly discuss what you know about the decline of certain fish species in California.
To what extent do you think this decline has influenced the following angler behaviors (if you have specific examples, please provide them):
o Preferences for species or types of fishing
o Changes in their fishing location (California or somewhere else?)
o Expenditures for fishing
o Substituting another sport or another activity for fishing
What complaints, if any, do you hear from anglers about the sport?
To what extent have their complaints influenced increases/decreases in your business—either directly or indirectly?
Aside from talking with anglers personally, what other ways do you keep informed about problems anglers face in sport fishing? Federal Government Subsidies As you may know, commercial salmon fishermen receive government subsidies during the ban on salmon fishing. What contact have you had, if any, with commercial salmon fishermen during the ban on salmon fishing?
If you have had contact with them, are you aware of whether they are:
o Fishing for different species?
o Fishing outside California?
o Working at non-fishing jobs?
o Unemployed?
Have the commercial salmon fishermen with whom you have had contact indicated whether they have moved?
If so, was it to another location in California? Outside California? Businesses dependent upon commercial salmon fishing also receive government subsidies. Considering these subsidies and the subsidies that the commercial fishermen receive, what do you know about any economic impacts on these businesses? For example,
152
Have these businesses expanded or contracted due to the subsidies? Have they changed their product mix? Have they gone out of business? Have they moved their business to another location? Another state? Water Management There are a variety of water management issues we would like to discuss with you. You may be more familiar with some than with others but please share with us whatever you know about these issues. The first of these issues is water releases in the Bay Delta as well as the San Joaquin River, the Sacramento River, and their tributaries. What impacts do water releases and their timing have on the supply of fish?
What are the effects of water releases on flow and temperature? How do timing and volume of water releases impact survivability of migratory fish (i.e., salmon and steelhead)?
What are the problems in water management around the two tributaries (San Joaquin and Sacramento) and the Bay Delta?
What modifications or changes in these watersheds have caused problems for the six species of fish of interest in this study (i.e. striped bass, steelhead, black bass, halibut, sturgeon, and Chinook salmon)?
What is the size and scope of commercial fishing in these three areas? In particular we would like to know about commercial fishing in the waters around the intersection of the Pacific Ocean and the bay delta.
How has the current water management in the Bay Delta affected the survival of any of these six species of fish? How confident are you in the quality of water in these areas? To the best of your knowledge, how has the water quality in the Bay Delta affected fishing and fish populations?
How does this quality impact:
The quality of fish caught to be consumed?
153
Survival of fish in early stages of life?
The overall supply of fish?
To what extent have anglers had adequate voice in water management issues in the Bay Delta? Suppliers? Guides? Marina owners/operators?
To whom do you voice your concerns about water management issues? To what extent have your concerns been taken seriously? What other water management concerns do you have that may not have been discussed yet today? Species Management We are interested in several aspects of species management. Let’s begin by discussing a variety of things that affect the supply of fish.
How does competition among species affect the supply of fish? How does fish plating affect the supply of fish?
How do hatchery fish affect the supply of fish? How does genetic integrity affect the supply of fish?
To what extent have water management efforts influenced the supply of striped bass? If species management has benefited from these efforts, how has it benefited?
If the striped bass were de-listed, what would be the impact on the supply of fish? What action is necessary to improve habitat management to restore the supply of natural fish species? Have fish hatcheries helped or hindered your efforts to encourage fishing?
How do they impact angler behavior?
Is the quality of fishing diminished because of the release of hatchery fish?
154
CDFG Regulations The California Department of Fish & Game has a variety of regulations related to allowable catch. For example, they govern size limits, stocking policies, and catch & release policies.
What is your opinion about the extent to which regulations on size limits have impacted the supply of fish?
Stocking policies? Catch & release policies? Are CDFG regulations applied equally to all commercial fishermen and anglers? Explain any unequal treatment you believe exists. What is the impact of this unequal treatment on the supply of fish? Recession Impact In this final area of questions we want to address the recession and any impact it has had on your business, and on commercial as well as sport fishing in general. Let’s begin with a few questions about the impact on your business. To what extent has the recession had an impact on your business?
If it has impacted your business, please explain how. To what extent have you experienced a change in your gross receipts (revenue) from fishing-related expenses during the last five years? If you have experienced a change in your gross receipts, has the change in revenue been significant? Please explain. How has the recession increased or decreased your sales of equipment, guide services, or launchings?
What actions have you taken to cope with the recession?
For example, have you changed product lines or service hours? Increased or decreased your prices (by approximately what percentage)? Increased or decreased your employees (by approximately what percentage)?
155
Other changes?
How has the recession affected commercial fishing in general?
For example, to what extent has it influenced: The species of fish that commercial fisherman target?
The locations where commercial fishermen fish (e.g., are they fishing closer to home)?
The amount that commercial fishermen spend on gear and supplies?
The length or frequency of fishing trip by commercial fishermen?
Now I am going to ask you the same questions, but as they relate to anglers. How has the recession affected sport fishing in general?
For example, to what extent has it influenced: The species of fish that anglers target?
The locations where anglers fish (e.g., are they fishing closer to home)?
The amount that anglers spend on gear and supplies?
The length or frequency of fishing trip by anglers?
And one final question for this evening: What organizations are you a part of, or know about, that advocate for you with regard to your concerns about the sports fishing industry? Concluding Remarks This marks the conclusion of the questions we had for you today. Thank you all very much for attending. The information you have provided will be very instrumental in helping us prepare surveys for a wider audience.
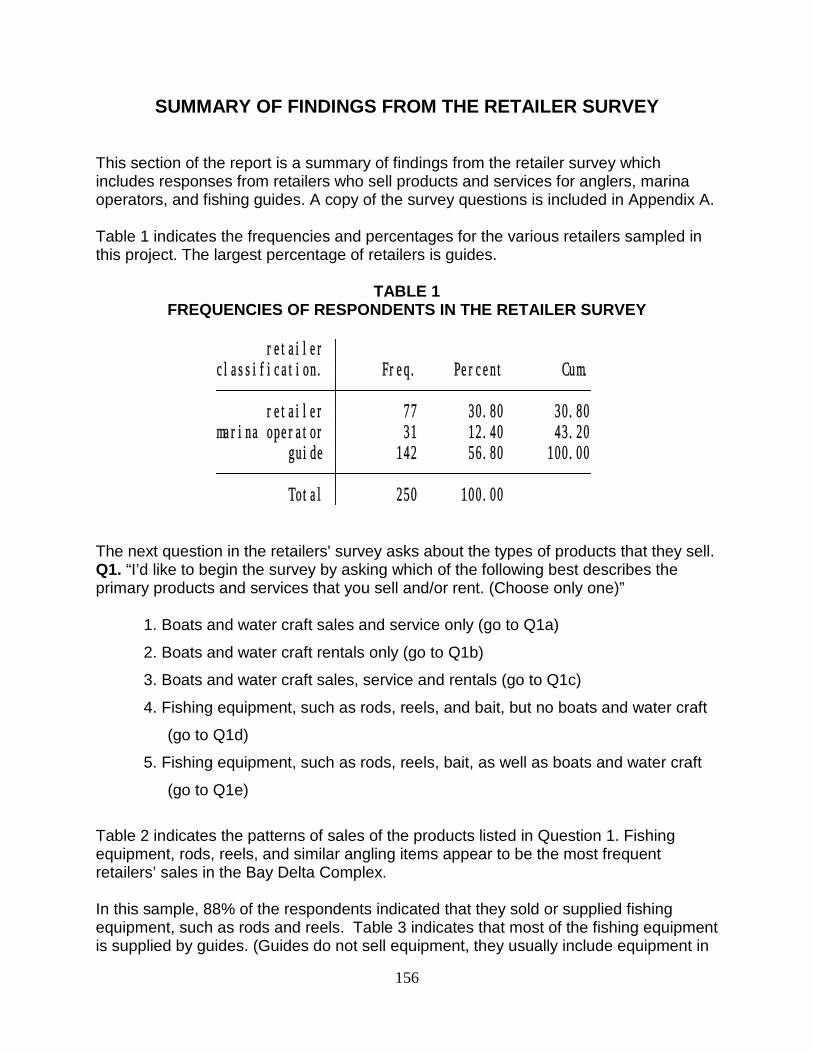
156
SUMMARY OF FINDINGS FROM THE RETAILER SURVEY This section of the report is a summary of findings from the retailer survey which includes responses from retailers who sell products and services for anglers, marina operators, and fishing guides. A copy of the survey questions is included in Appendix A. Table 1 indicates the frequencies and percentages for the various retailers sampled in this project. The largest percentage of retailers is guides.
TABLE 1 FREQUENCIES OF RESPONDENTS IN THE RETAILER SURVEY
Total 250 100.00 guide 142 56.80 100.00marina operator 31 12.40 43.20 retailer 77 30.80 30.80 classification. Freq. Percent Cum. retailer
The next question in the retailers' survey asks about the types of products that they sell. Q1. “I’d like to begin the survey by asking which of the following best describes the primary products and services that you sell and/or rent. (Choose only one)”
1. Boats and water craft sales and service only (go to Q1a)
2. Boats and water craft rentals only (go to Q1b)
3. Boats and water craft sales, service and rentals (go to Q1c)
4. Fishing equipment, such as rods, reels, and bait, but no boats and water craft
(go to Q1d)
5. Fishing equipment, such as rods, reels, bait, as well as boats and water craft
(go to Q1e)
Table 2 indicates the patterns of sales of the products listed in Question 1. Fishing equipment, rods, reels, and similar angling items appear to be the most frequent retailers’ sales in the Bay Delta Complex. In this sample, 88% of the respondents indicated that they sold or supplied fishing equipment, such as rods and reels. Table 3 indicates that most of the fishing equipment is supplied by guides. (Guides do not sell equipment, they usually include equipment in
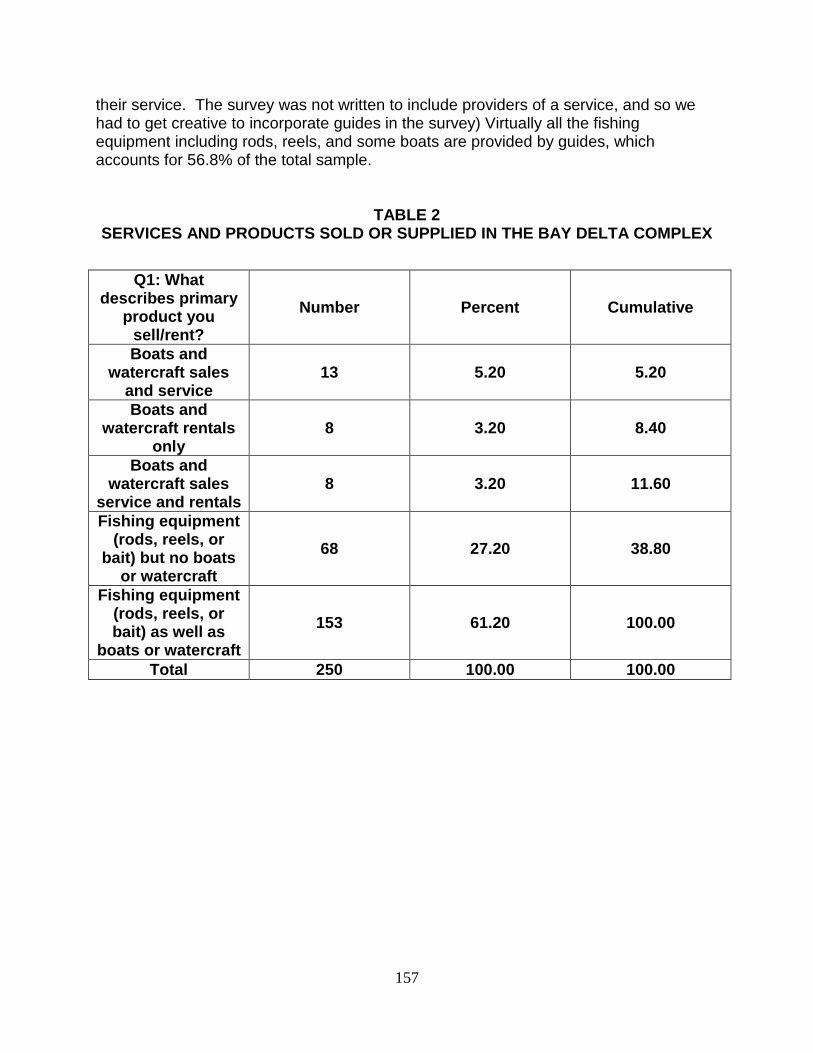
157
their service. The survey was not written to include providers of a service, and so we had to get creative to incorporate guides in the survey) Virtually all the fishing equipment including rods, reels, and some boats are provided by guides, which accounts for 56.8% of the total sample.
TABLE 2 SERVICES AND PRODUCTS SOLD OR SUPPLIED IN THE BAY DELTA COMPLEX
Q1: What describes primary
product you sell/rent?
Number Percent Cumulative
Boats and watercraft sales
and service 13 5.20 5.20
Boats and watercraft rentals
only 8 3.20 8.40
Boats and watercraft sales
service and rentals 8 3.20 11.60
Fishing equipment (rods, reels, or
bait) but no boats or watercraft
68 27.20 38.80
Fishing equipment (rods, reels, or bait) as well as
boats or watercraft 153 61.20 100.00
Total 250 100.00 100.00
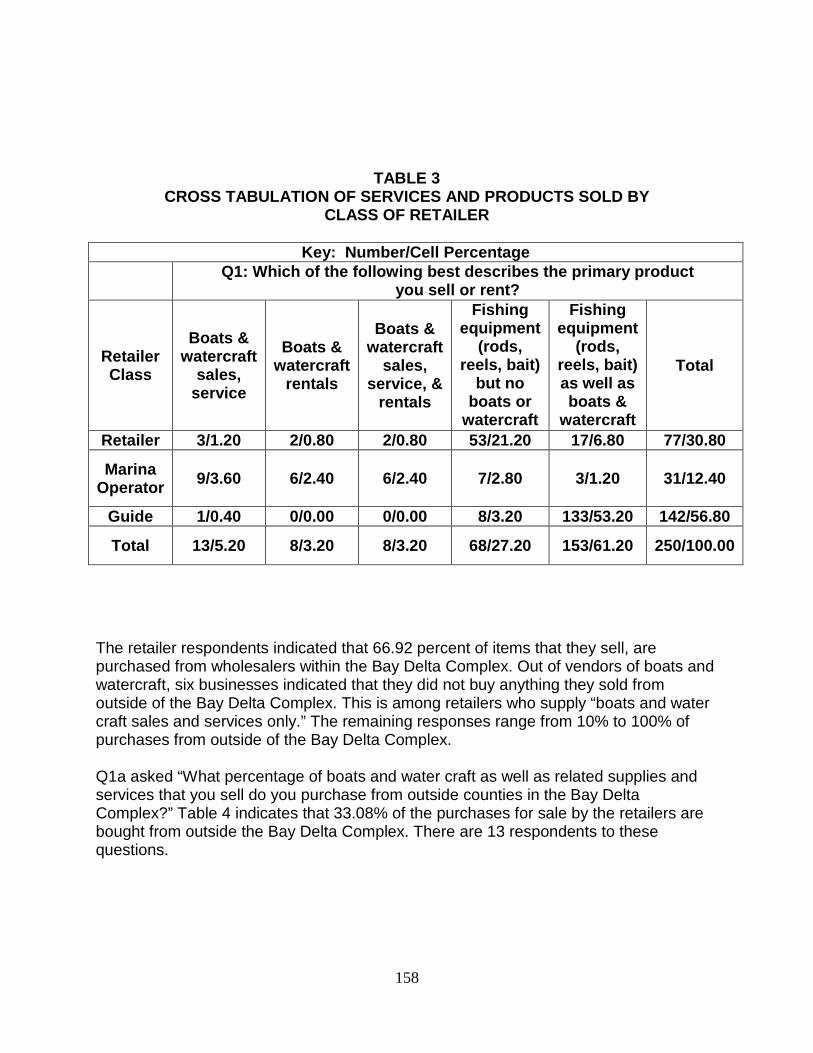
158
TABLE 3 CROSS TABULATION OF SERVICES AND PRODUCTS SOLD BY
CLASS OF RETAILER
Key: Number/Cell Percentage Q1: Which of the following best describes the primary product
you sell or rent?
Retailer Class
Boats & watercraft
sales, service
Boats & watercraft
rentals
Boats & watercraft
sales, service, &
rentals
Fishing equipment
(rods, reels, bait)
but no boats or
watercraft
Fishing equipment
(rods, reels, bait) as well as boats &
watercraft
Total
Retailer 3/1.20 2/0.80 2/0.80 53/21.20 17/6.80 77/30.80
Marina Operator 9/3.60 6/2.40 6/2.40 7/2.80 3/1.20 31/12.40
Guide 1/0.40 0/0.00 0/0.00 8/3.20 133/53.20 142/56.80
Total 13/5.20 8/3.20 8/3.20 68/27.20 153/61.20 250/100.00
The retailer respondents indicated that 66.92 percent of items that they sell, are purchased from wholesalers within the Bay Delta Complex. Out of vendors of boats and watercraft, six businesses indicated that they did not buy anything they sold from outside of the Bay Delta Complex. This is among retailers who supply “boats and water craft sales and services only.” The remaining responses range from 10% to 100% of purchases from outside of the Bay Delta Complex. Q1a asked “What percentage of boats and water craft as well as related supplies and services that you sell do you purchase from outside counties in the Bay Delta Complex?” Table 4 indicates that 33.08% of the purchases for sale by the retailers are bought from outside the Bay Delta Complex. There are 13 respondents to these questions.
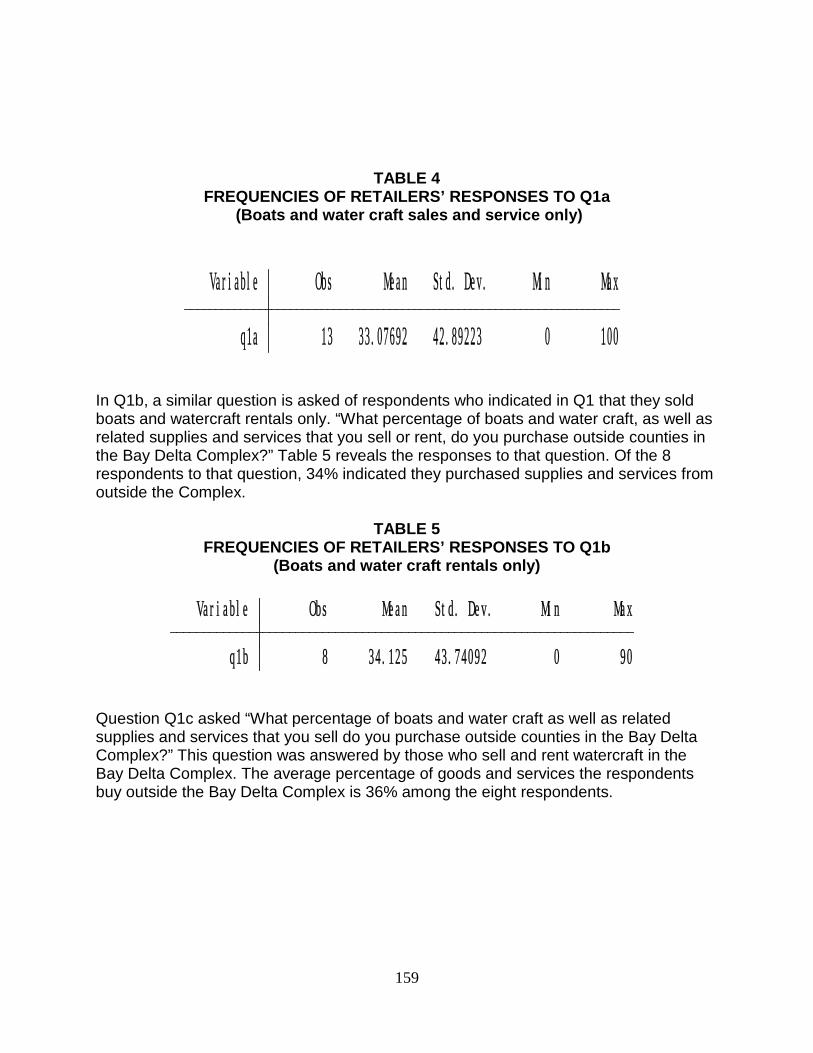
159
TABLE 4 FREQUENCIES OF RETAILERS’ RESPONSES TO Q1a
(Boats and water craft sales and service only)
q1a 13 33.07692 42.89223 0 100 Variable Obs Mean Std. Dev. Min Max
In Q1b, a similar question is asked of respondents who indicated in Q1 that they sold boats and watercraft rentals only. “What percentage of boats and water craft, as well as related supplies and services that you sell or rent, do you purchase outside counties in the Bay Delta Complex?” Table 5 reveals the responses to that question. Of the 8 respondents to that question, 34% indicated they purchased supplies and services from outside the Complex.
TABLE 5 FREQUENCIES OF RETAILERS’ RESPONSES TO Q1b
(Boats and water craft rentals only)
q1b 8 34.125 43.74092 0 90 Variable Obs Mean Std. Dev. Min Max
Question Q1c asked “What percentage of boats and water craft as well as related supplies and services that you sell do you purchase outside counties in the Bay Delta Complex?” This question was answered by those who sell and rent watercraft in the Bay Delta Complex. The average percentage of goods and services the respondents buy outside the Bay Delta Complex is 36% among the eight respondents.
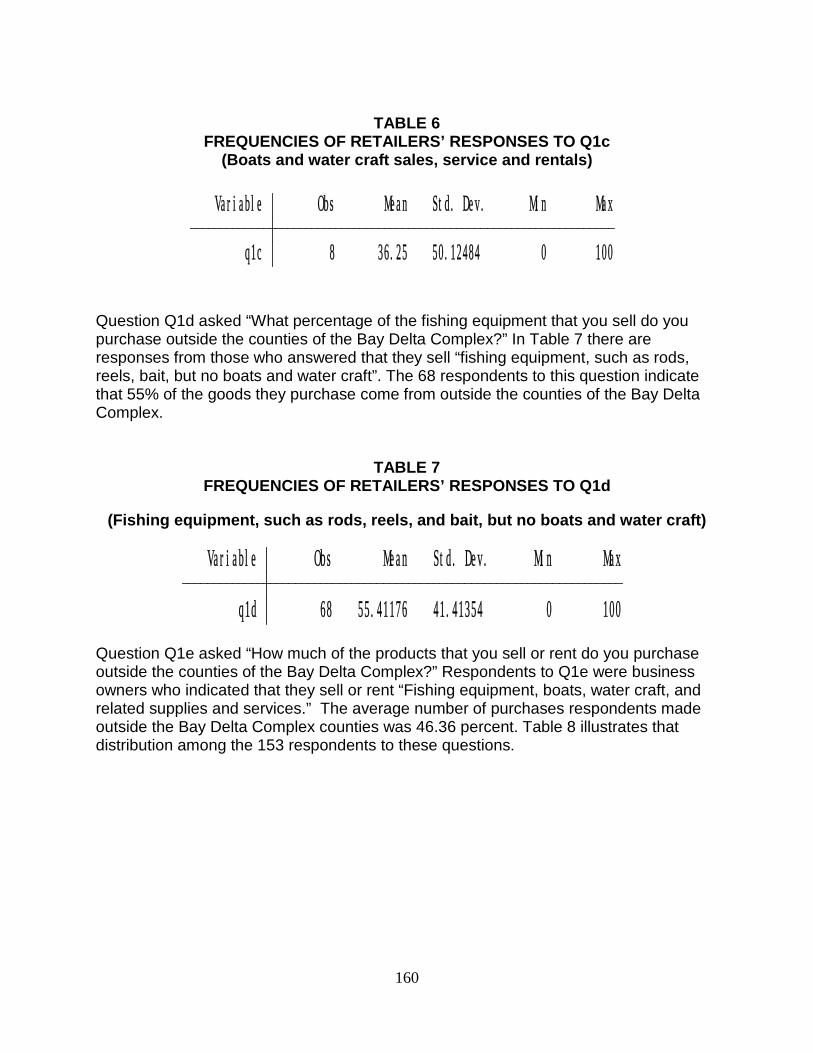
160
TABLE 6
FREQUENCIES OF RETAILERS’ RESPONSES TO Q1c (Boats and water craft sales, service and rentals)
q1c 8 36.25 50.12484 0 100 Variable Obs Mean Std. Dev. Min Max
Question Q1d asked “What percentage of the fishing equipment that you sell do you purchase outside the counties of the Bay Delta Complex?” In Table 7 there are responses from those who answered that they sell “fishing equipment, such as rods, reels, bait, but no boats and water craft”. The 68 respondents to this question indicate that 55% of the goods they purchase come from outside the counties of the Bay Delta Complex.
TABLE 7 FREQUENCIES OF RETAILERS’ RESPONSES TO Q1d
(Fishing equipment, such as rods, reels, and bait, but no boats and water craft)
q1d 68 55.41176 41.41354 0 100 Variable Obs Mean Std. Dev. Min Max
Question Q1e asked “How much of the products that you sell or rent do you purchase outside the counties of the Bay Delta Complex?” Respondents to Q1e were business owners who indicated that they sell or rent “Fishing equipment, boats, water craft, and related supplies and services.” The average number of purchases respondents made outside the Bay Delta Complex counties was 46.36 percent. Table 8 illustrates that distribution among the 153 respondents to these questions.
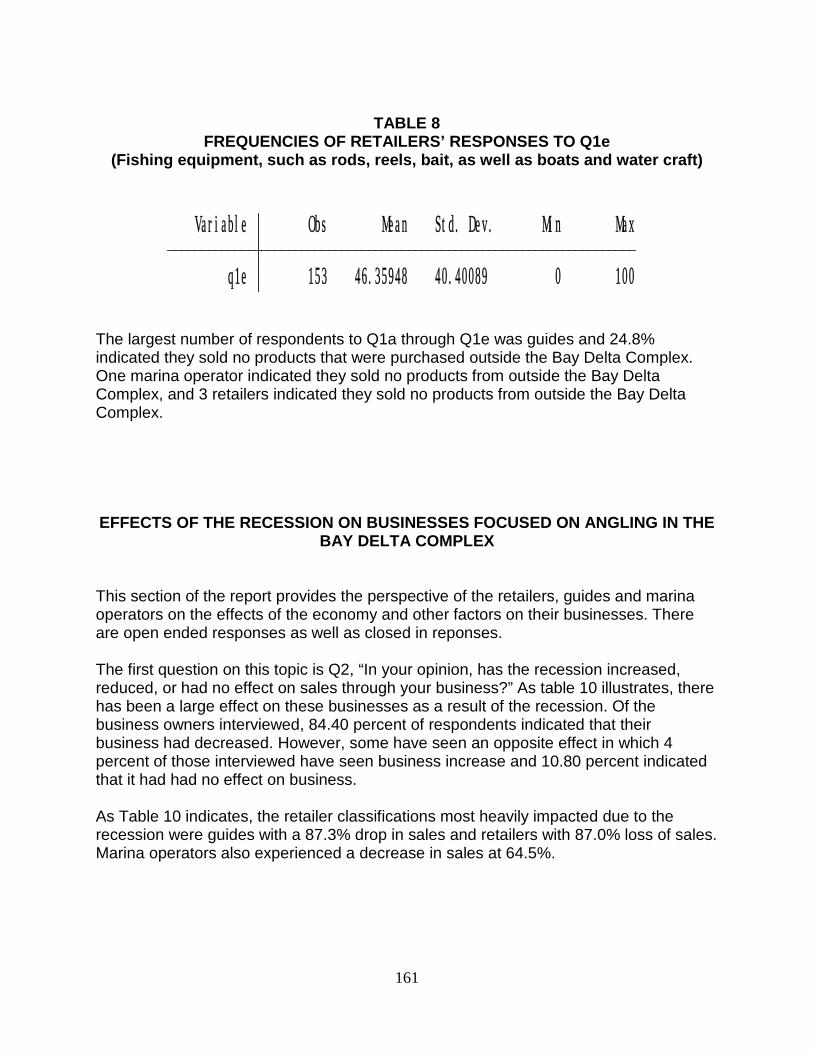
161
TABLE 8
FREQUENCIES OF RETAILERS’ RESPONSES TO Q1e (Fishing equipment, such as rods, reels, bait, as well as boats and water craft)
q1e 153 46.35948 40.40089 0 100 Variable Obs Mean Std. Dev. Min Max
The largest number of respondents to Q1a through Q1e was guides and 24.8% indicated they sold no products that were purchased outside the Bay Delta Complex. One marina operator indicated they sold no products from outside the Bay Delta Complex, and 3 retailers indicated they sold no products from outside the Bay Delta Complex.
EFFECTS OF THE RECESSION ON BUSINESSES FOCUSED ON ANGLING IN THE BAY DELTA COMPLEX
This section of the report provides the perspective of the retailers, guides and marina operators on the effects of the economy and other factors on their businesses. There are open ended responses as well as closed in reponses. The first question on this topic is Q2, “In your opinion, has the recession increased, reduced, or had no effect on sales through your business?” As table 10 illustrates, there has been a large effect on these businesses as a result of the recession. Of the business owners interviewed, 84.40 percent of respondents indicated that their business had decreased. However, some have seen an opposite effect in which 4 percent of those interviewed have seen business increase and 10.80 percent indicated that it had had no effect on business. As Table 10 indicates, the retailer classifications most heavily impacted due to the recession were guides with a 87.3% drop in sales and retailers with 87.0% loss of sales. Marina operators also experienced a decrease in sales at 64.5%.
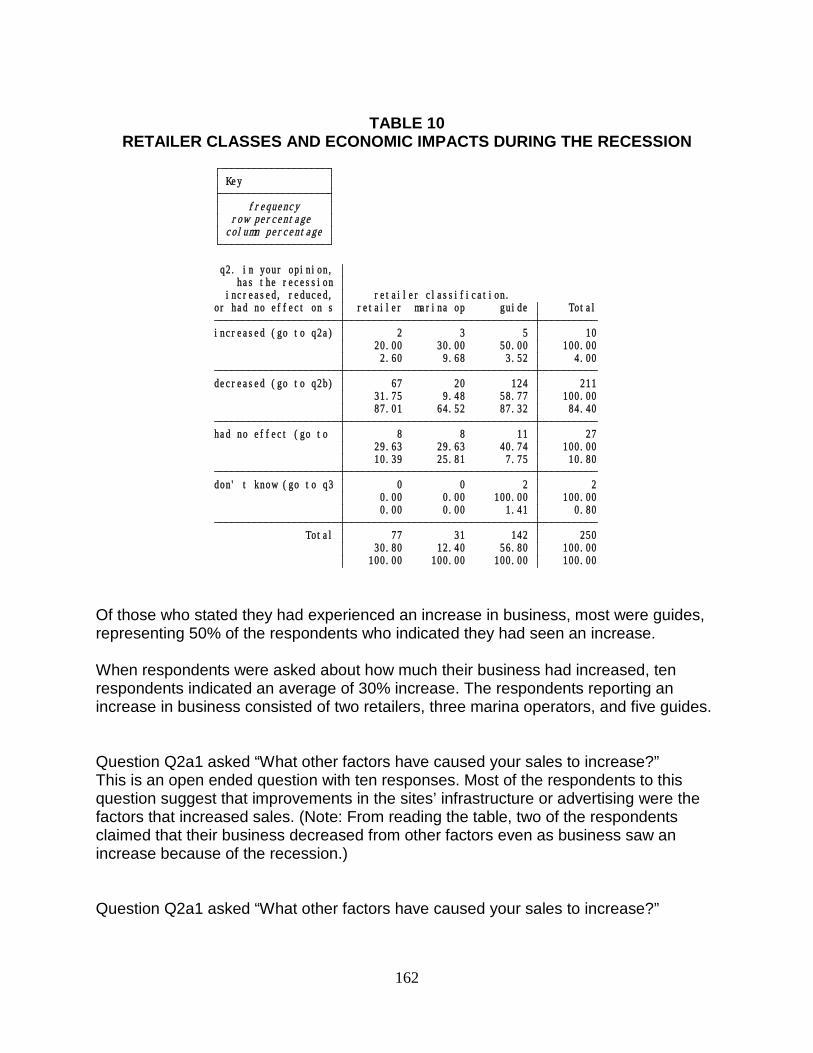
162
TABLE 10
RETAILER CLASSES AND ECONOMIC IMPACTS DURING THE RECESSION
100.00 100.00 100.00 100.00 30.80 12.40 56.80 100.00 Total 77 31 142 250 0.00 0.00 1.41 0.80 0.00 0.00 100.00 100.00 don' t know (go to q3 0 0 2 2 10.39 25.81 7.75 10.80 29.63 29.63 40.74 100.00 had no effect (go to 8 8 11 27 87.01 64.52 87.32 84.40 31.75 9.48 58.77 100.00 decreased (go to q2b) 67 20 124 211 2.60 9.68 3.52 4.00 20.00 30.00 50.00 100.00 increased (go to q2a) 2 3 5 10 or had no effect on s retailer marina op guide Total increased, reduced, retailer classification. has the recession q2. in your opinion,
column percentage row percentage frequency Key
Of those who stated they had experienced an increase in business, most were guides, representing 50% of the respondents who indicated they had seen an increase. When respondents were asked about how much their business had increased, ten respondents indicated an average of 30% increase. The respondents reporting an increase in business consisted of two retailers, three marina operators, and five guides. Question Q2a1 asked “What other factors have caused your sales to increase?” This is an open ended question with ten responses. Most of the respondents to this question suggest that improvements in the sites’ infrastructure or advertising were the factors that increased sales. (Note: From reading the table, two of the respondents claimed that their business decreased from other factors even as business saw an increase because of the recession.) Question Q2a1 asked “What other factors have caused your sales to increase?”
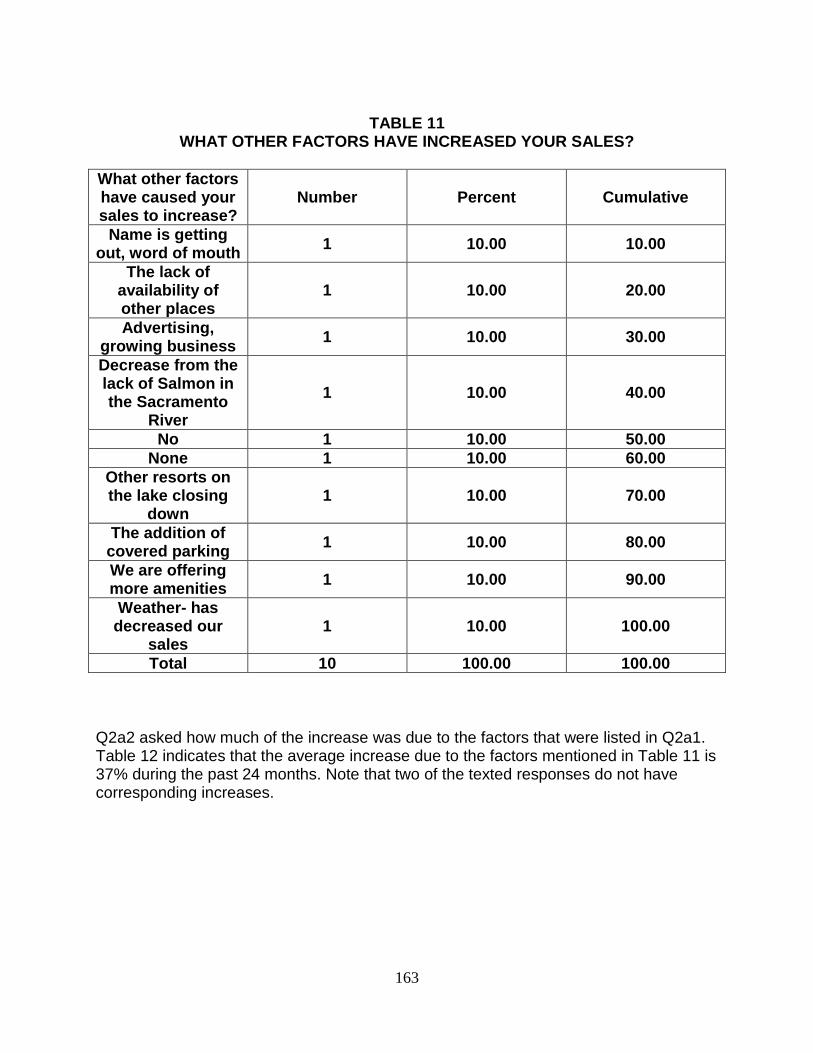
163
TABLE 11
WHAT OTHER FACTORS HAVE INCREASED YOUR SALES? What other factors have caused your sales to increase?
Number Percent Cumulative
Name is getting out, word of mouth 1 10.00 10.00
The lack of availability of other places
1 10.00 20.00
Advertising, growing business 1 10.00 30.00
Decrease from the lack of Salmon in the Sacramento
River 1 10.00 40.00
No 1 10.00 50.00 None 1 10.00 60.00
Other resorts on the lake closing
down 1 10.00 70.00
The addition of covered parking 1 10.00 80.00
We are offering more amenities 1 10.00 90.00
Weather- has decreased our
sales 1 10.00 100.00
Total 10 100.00 100.00 Q2a2 asked how much of the increase was due to the factors that were listed in Q2a1. Table 12 indicates that the average increase due to the factors mentioned in Table 11 is 37% during the past 24 months. Note that two of the texted responses do not have corresponding increases.
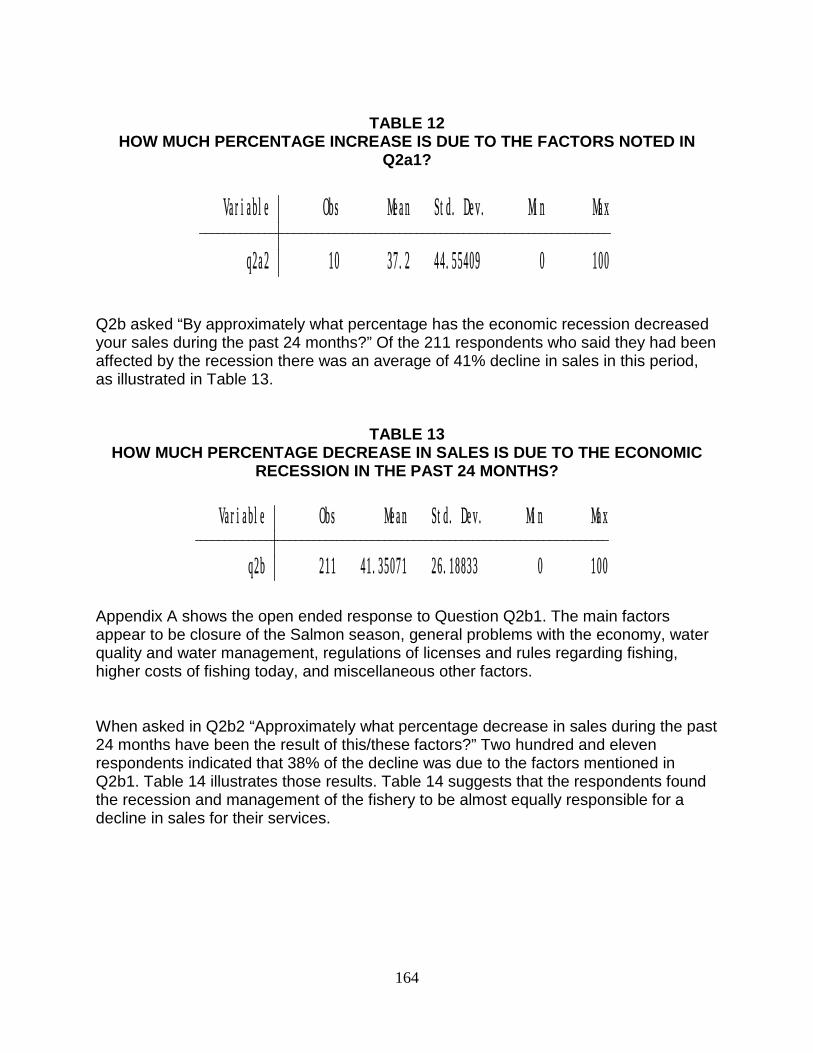
164
TABLE 12
HOW MUCH PERCENTAGE INCREASE IS DUE TO THE FACTORS NOTED IN Q2a1?
q2a2 10 37.2 44.55409 0 100 Variable Obs Mean Std. Dev. Min Max
Q2b asked “By approximately what percentage has the economic recession decreased your sales during the past 24 months?” Of the 211 respondents who said they had been affected by the recession there was an average of 41% decline in sales in this period, as illustrated in Table 13.
TABLE 13 HOW MUCH PERCENTAGE DECREASE IN SALES IS DUE TO THE ECONOMIC
RECESSION IN THE PAST 24 MONTHS?
q2b 211 41.35071 26.18833 0 100 Variable Obs Mean Std. Dev. Min Max
Appendix A shows the open ended response to Question Q2b1. The main factors appear to be closure of the Salmon season, general problems with the economy, water quality and water management, regulations of licenses and rules regarding fishing, higher costs of fishing today, and miscellaneous other factors.
When asked in Q2b2 “Approximately what percentage decrease in sales during the past 24 months have been the result of this/these factors?” Two hundred and eleven respondents indicated that 38% of the decline was due to the factors mentioned in Q2b1. Table 14 illustrates those results. Table 14 suggests that the respondents found the recession and management of the fishery to be almost equally responsible for a decline in sales for their services.
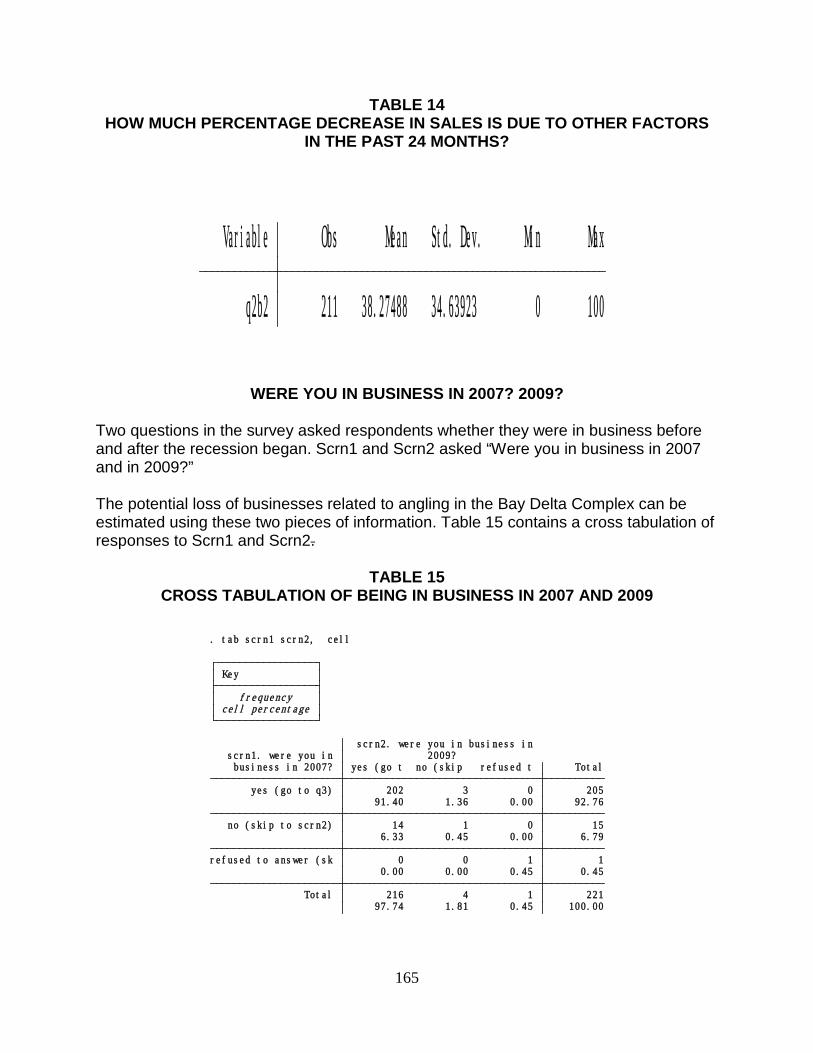
165
TABLE 14 HOW MUCH PERCENTAGE DECREASE IN SALES IS DUE TO OTHER FACTORS
IN THE PAST 24 MONTHS?
q2b2 211 38.27488 34.63923 0 100 Variable Obs Mean Std. Dev. Min Max
WERE YOU IN BUSINESS IN 2007? 2009?
Two questions in the survey asked respondents whether they were in business before and after the recession began. Scrn1 and Scrn2 asked “Were you in business in 2007 and in 2009?” The potential loss of businesses related to angling in the Bay Delta Complex can be estimated using these two pieces of information. Table 15 contains a cross tabulation of responses to Scrn1 and Scrn2.
TABLE 15 CROSS TABULATION OF BEING IN BUSINESS IN 2007 AND 2009
97.74 1.81 0.45 100.00 Total 216 4 1 221 0.00 0.00 0.45 0.45 refused to answer (sk 0 0 1 1 6.33 0.45 0.00 6.79 no (skip to scrn2) 14 1 0 15 91.40 1.36 0.00 92.76 yes (go to q3) 202 3 0 205 business in 2007? yes (go t no (skip refused t Total scrn1. were you in 2009? scrn2. were you in business in
cell percentage frequency Key
. tab scrn1 scrn2, cell
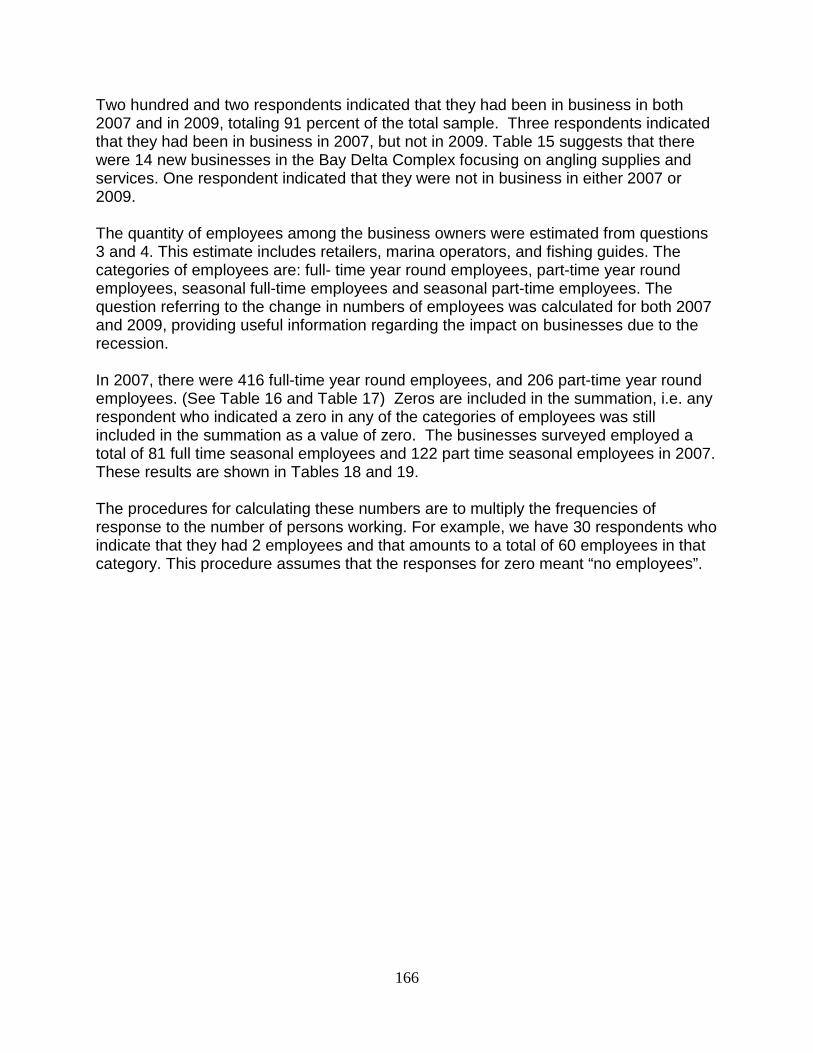
166
Two hundred and two respondents indicated that they had been in business in both 2007 and in 2009, totaling 91 percent of the total sample. Three respondents indicated that they had been in business in 2007, but not in 2009. Table 15 suggests that there were 14 new businesses in the Bay Delta Complex focusing on angling supplies and services. One respondent indicated that they were not in business in either 2007 or 2009. The quantity of employees among the business owners were estimated from questions 3 and 4. This estimate includes retailers, marina operators, and fishing guides. The categories of employees are: full- time year round employees, part-time year round employees, seasonal full-time employees and seasonal part-time employees. The question referring to the change in numbers of employees was calculated for both 2007 and 2009, providing useful information regarding the impact on businesses due to the recession. In 2007, there were 416 full-time year round employees, and 206 part-time year round employees. (See Table 16 and Table 17) Zeros are included in the summation, i.e. any respondent who indicated a zero in any of the categories of employees was still included in the summation as a value of zero. The businesses surveyed employed a total of 81 full time seasonal employees and 122 part time seasonal employees in 2007. These results are shown in Tables 18 and 19. The procedures for calculating these numbers are to multiply the frequencies of response to the number of persons working. For example, we have 30 respondents who indicate that they had 2 employees and that amounts to a total of 60 employees in that category. This procedure assumes that the responses for zero meant “no employees”.
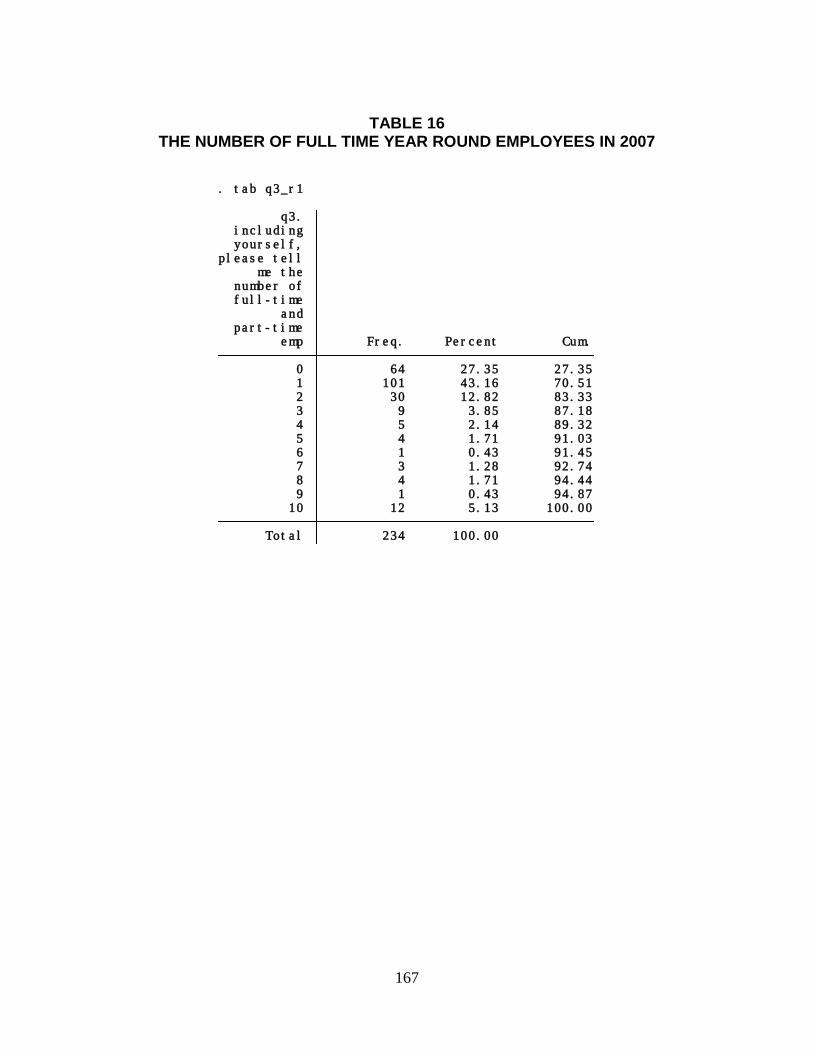
167
TABLE 16
THE NUMBER OF FULL TIME YEAR ROUND EMPLOYEES IN 2007
Total 234 100.00 10 12 5.13 100.00 9 1 0.43 94.87 8 4 1.71 94.44 7 3 1.28 92.74 6 1 0.43 91.45 5 4 1.71 91.03 4 5 2.14 89.32 3 9 3.85 87.18 2 30 12.82 83.33 1 101 43.16 70.51 0 64 27.35 27.35 emp Freq. Percent Cum. part-time and full-time number of me the please tell yourself, including q3.
. tab q3_r1
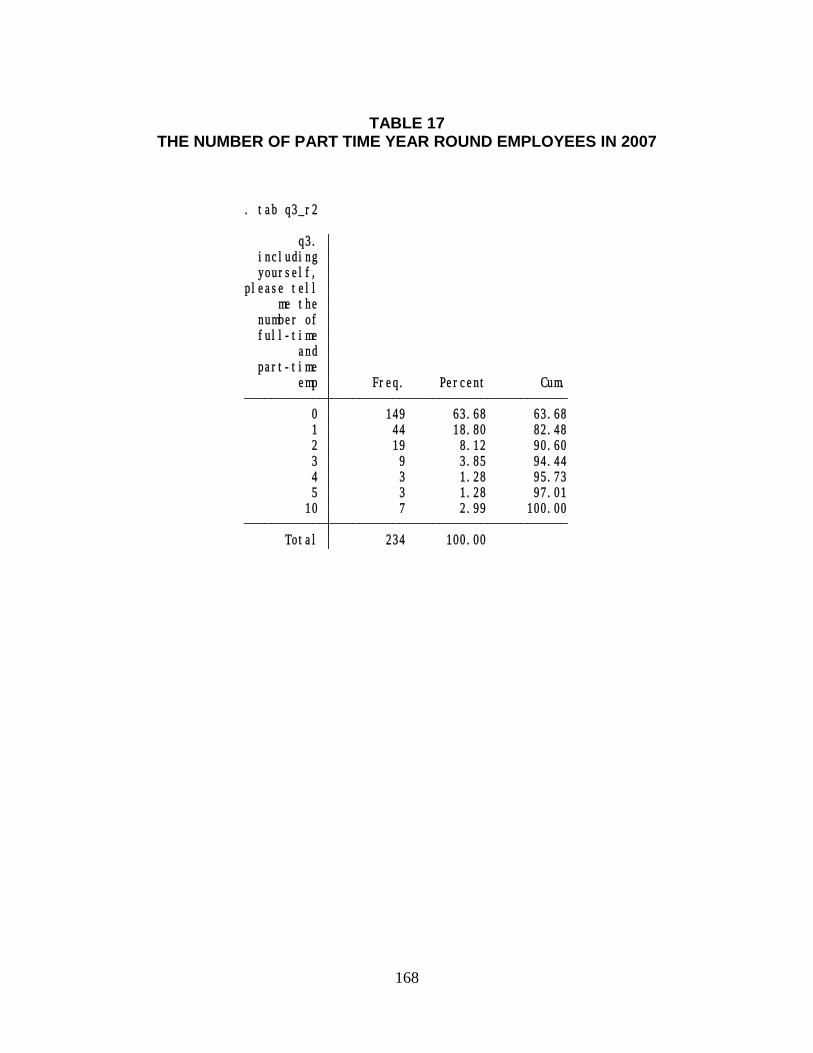
168
TABLE 17
THE NUMBER OF PART TIME YEAR ROUND EMPLOYEES IN 2007
Total 234 100.00 10 7 2.99 100.00 5 3 1.28 97.01 4 3 1.28 95.73 3 9 3.85 94.44 2 19 8.12 90.60 1 44 18.80 82.48 0 149 63.68 63.68 emp Freq. Percent Cum. part-time and full-time number of me the please tell yourself, including q3.
. tab q3_r2
169
TABLE 18
THE NUMBER OF SEASONAL FULL TIME EMPLOYEES IN 2007
Total 234 100.00 10 3 1.28 100.00 9 1 0.43 98.72 8 1 0.43 98.29 3 2 0.85 97.86 2 5 2.14 97.01 1 18 7.69 94.87 0 204 87.18 87.18 emp Freq. Percent Cum. part-time and full-time number of me the please tell yourself, including q3.
. tab q3_r3
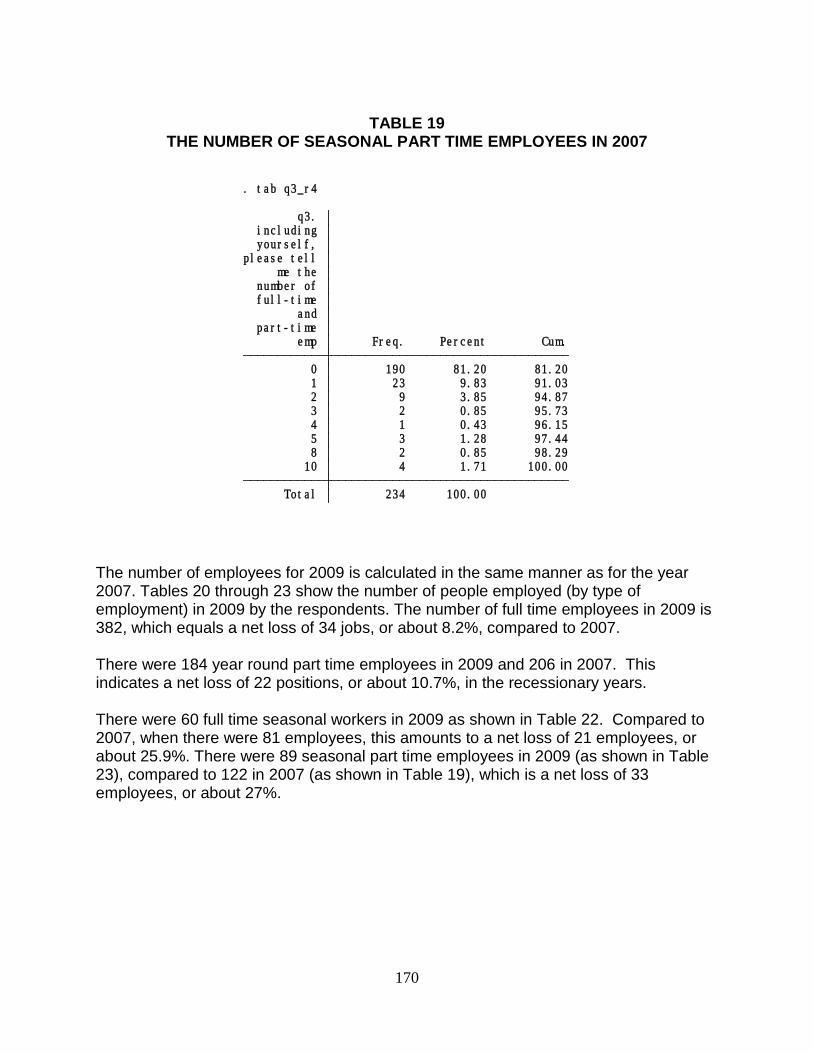
170
TABLE 19
THE NUMBER OF SEASONAL PART TIME EMPLOYEES IN 2007
Total 234 100.00 10 4 1.71 100.00 8 2 0.85 98.29 5 3 1.28 97.44 4 1 0.43 96.15 3 2 0.85 95.73 2 9 3.85 94.87 1 23 9.83 91.03 0 190 81.20 81.20 emp Freq. Percent Cum. part-time and full-time number of me the please tell yourself, including q3.
. tab q3_r4
The number of employees for 2009 is calculated in the same manner as for the year 2007. Tables 20 through 23 show the number of people employed (by type of employment) in 2009 by the respondents. The number of full time employees in 2009 is 382, which equals a net loss of 34 jobs, or about 8.2%, compared to 2007. There were 184 year round part time employees in 2009 and 206 in 2007. This indicates a net loss of 22 positions, or about 10.7%, in the recessionary years. There were 60 full time seasonal workers in 2009 as shown in Table 22. Compared to 2007, when there were 81 employees, this amounts to a net loss of 21 employees, or about 25.9%. There were 89 seasonal part time employees in 2009 (as shown in Table 23), compared to 122 in 2007 (as shown in Table 19), which is a net loss of 33 employees, or about 27%.
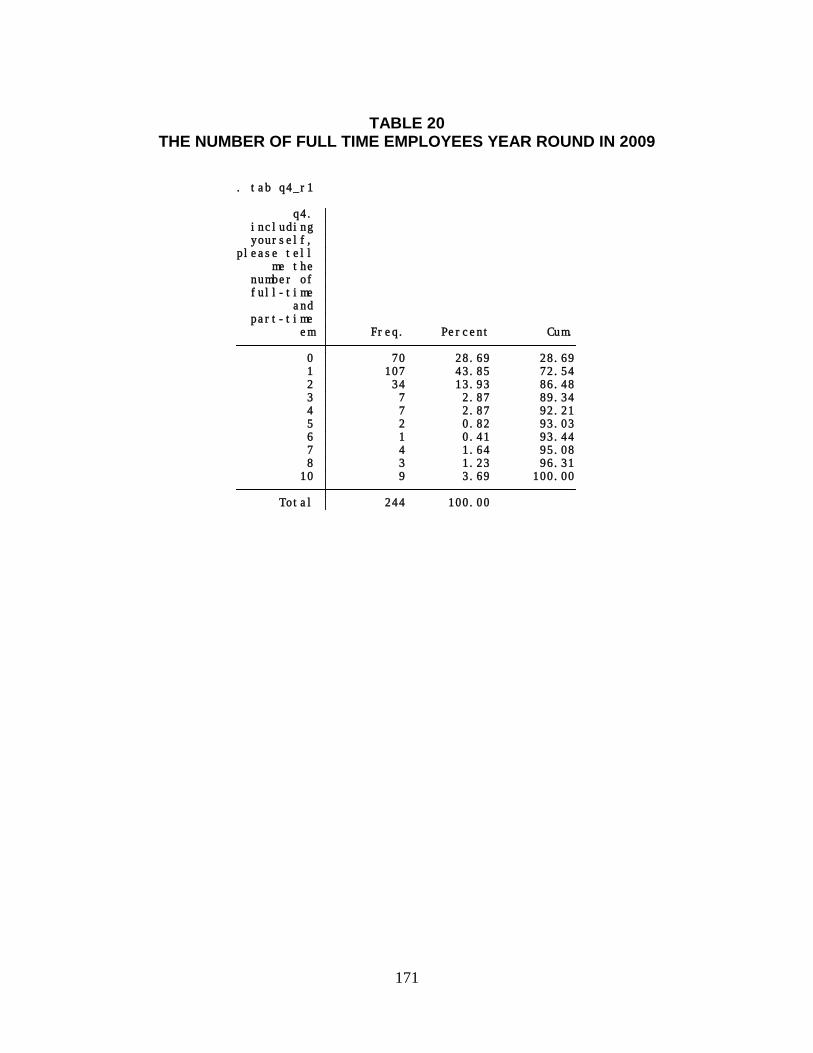
171
TABLE 20
THE NUMBER OF FULL TIME EMPLOYEES YEAR ROUND IN 2009
Total 244 100.00 10 9 3.69 100.00 8 3 1.23 96.31 7 4 1.64 95.08 6 1 0.41 93.44 5 2 0.82 93.03 4 7 2.87 92.21 3 7 2.87 89.34 2 34 13.93 86.48 1 107 43.85 72.54 0 70 28.69 28.69 em Freq. Percent Cum. part-time and full-time number of me the please tell yourself, including q4.
. tab q4_r1
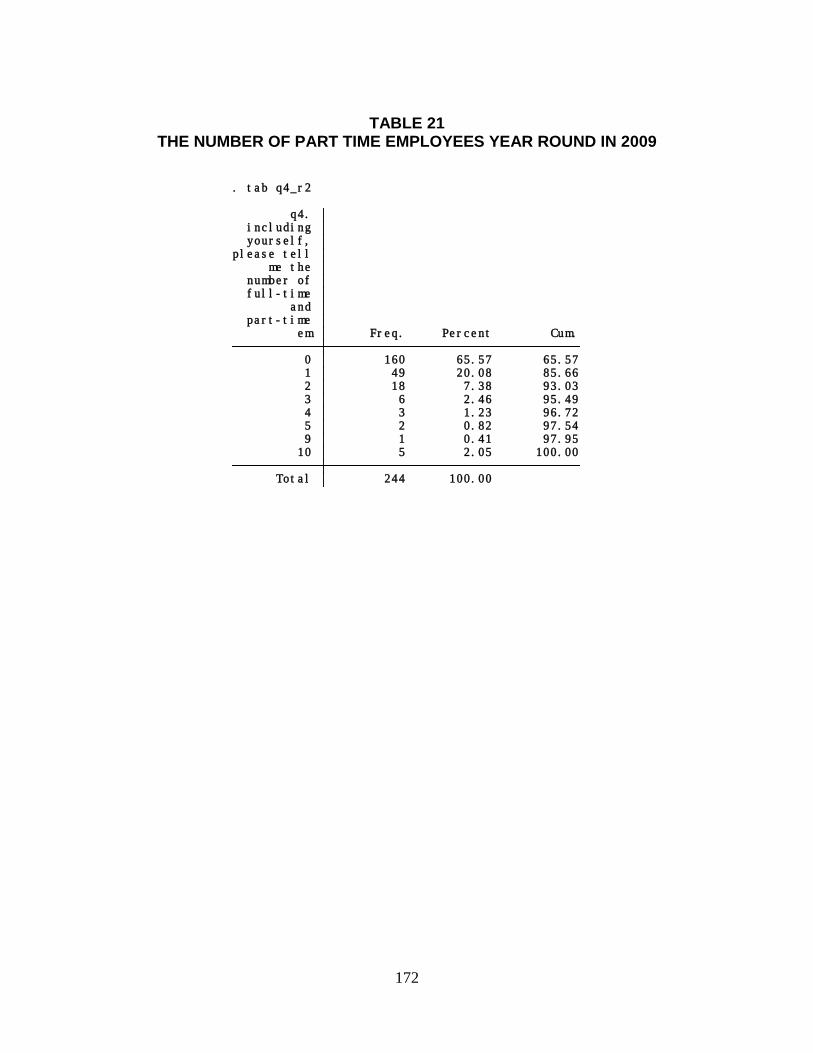
172
TABLE 21
THE NUMBER OF PART TIME EMPLOYEES YEAR ROUND IN 2009
Total 244 100.00 10 5 2.05 100.00 9 1 0.41 97.95 5 2 0.82 97.54 4 3 1.23 96.72 3 6 2.46 95.49 2 18 7.38 93.03 1 49 20.08 85.66 0 160 65.57 65.57 em Freq. Percent Cum. part-time and full-time number of me the please tell yourself, including q4.
. tab q4_r2
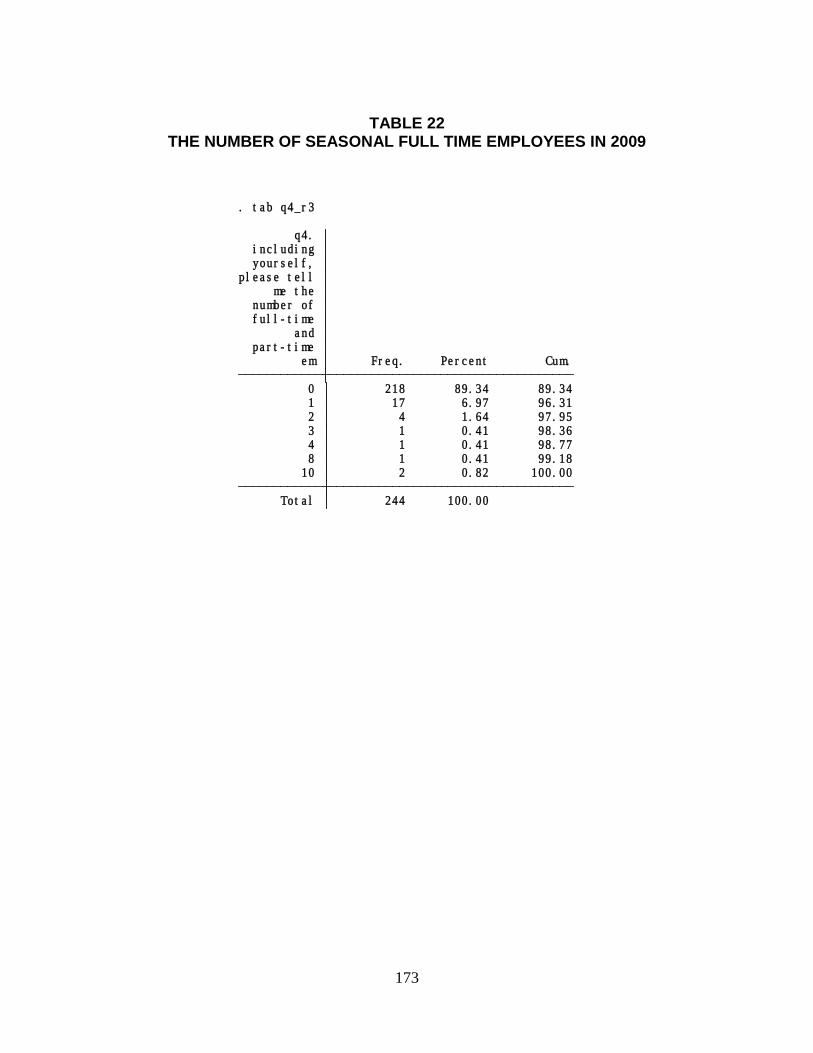
173
TABLE 22
THE NUMBER OF SEASONAL FULL TIME EMPLOYEES IN 2009
Total 244 100.00 10 2 0.82 100.00 8 1 0.41 99.18 4 1 0.41 98.77 3 1 0.41 98.36 2 4 1.64 97.95 1 17 6.97 96.31 0 218 89.34 89.34 em Freq. Percent Cum. part-time and full-time number of me the please tell yourself, including q4.
. tab q4_r3
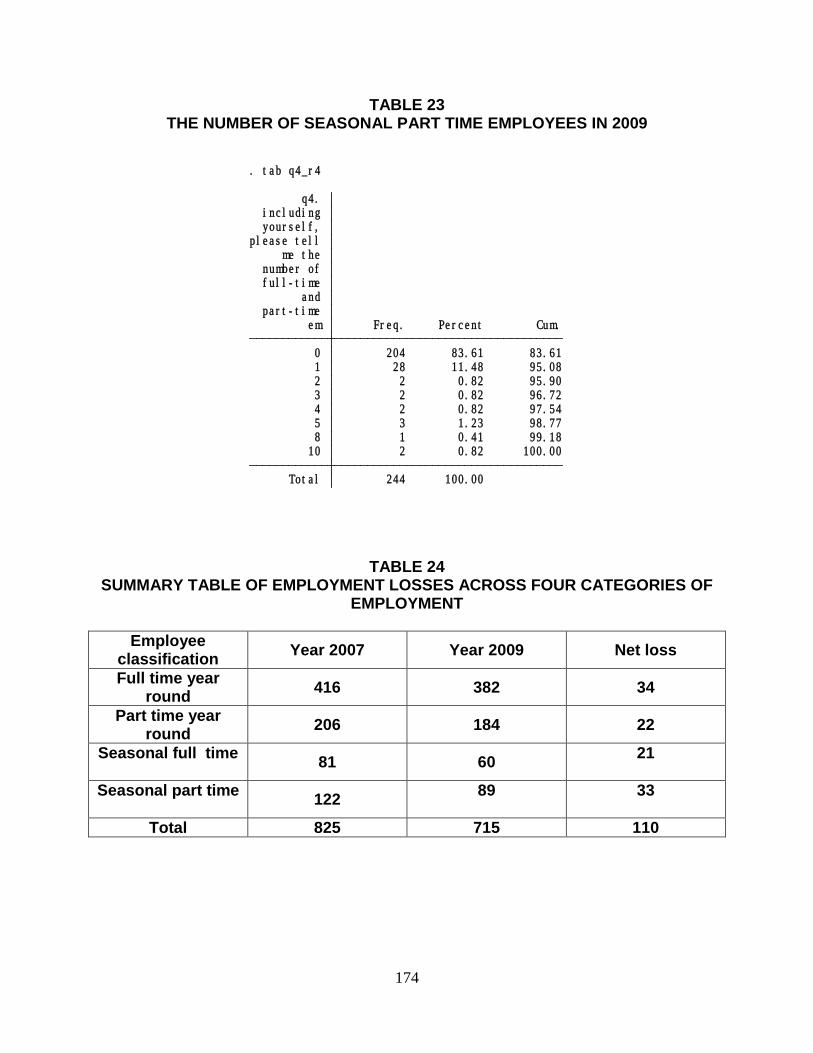
174
TABLE 23 THE NUMBER OF SEASONAL PART TIME EMPLOYEES IN 2009
Total 244 100.00 10 2 0.82 100.00 8 1 0.41 99.18 5 3 1.23 98.77 4 2 0.82 97.54 3 2 0.82 96.72 2 2 0.82 95.90 1 28 11.48 95.08 0 204 83.61 83.61 em Freq. Percent Cum. part-time and full-time number of me the please tell yourself, including q4.
. tab q4_r4
TABLE 24 SUMMARY TABLE OF EMPLOYMENT LOSSES ACROSS FOUR CATEGORIES OF
EMPLOYMENT
Employee classification Year 2007 Year 2009 Net loss
Full time year round 416 382 34
Part time year round 206 184 22
Seasonal full time 81 60 21
Seasonal part time 122 89
33
Total 825 715 110
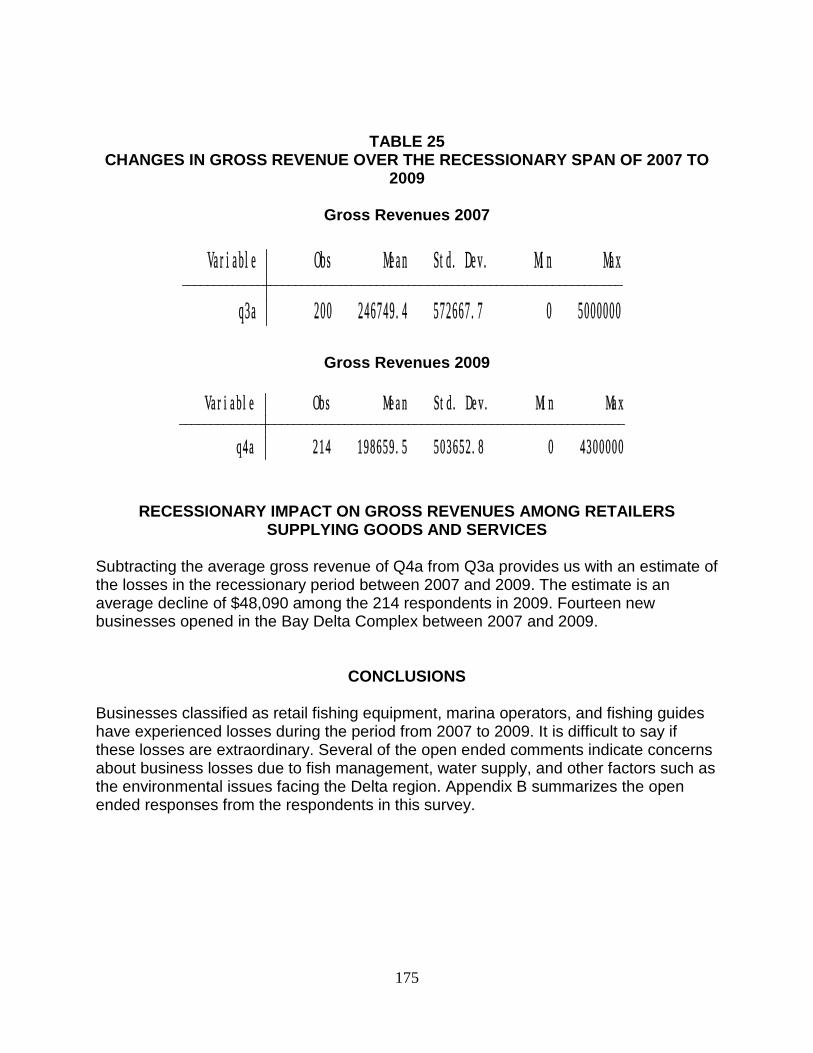
175
TABLE 25 CHANGES IN GROSS REVENUE OVER THE RECESSIONARY SPAN OF 2007 TO
2009
Gross Revenues 2007
q3a 200 246749.4 572667.7 0 5000000 Variable Obs Mean Std. Dev. Min Max
Gross Revenues 2009
q4a 214 198659.5 503652.8 0 4300000 Variable Obs Mean Std. Dev. Min Max
RECESSIONARY IMPACT ON GROSS REVENUES AMONG RETAILERS SUPPLYING GOODS AND SERVICES
Subtracting the average gross revenue of Q4a from Q3a provides us with an estimate of the losses in the recessionary period between 2007 and 2009. The estimate is an average decline of $48,090 among the 214 respondents in 2009. Fourteen new businesses opened in the Bay Delta Complex between 2007 and 2009.
CONCLUSIONS Businesses classified as retail fishing equipment, marina operators, and fishing guides have experienced losses during the period from 2007 to 2009. It is difficult to say if these losses are extraordinary. Several of the open ended comments indicate concerns about business losses due to fish management, water supply, and other factors such as the environmental issues facing the Delta region. Appendix B summarizes the open ended responses from the respondents in this survey.
176
APPENDIX A CDFG Survey of Retailers
Hello my name is _____________________and I’m calling from California State University, Chico regarding a research project funded by the State of California, Department of Fish and Game. We are estimating the economic impact of sports fishing in the Bay Delta Complex, which includes the Bay Delta, the San Joaquin River, the north and south parts of the San Francisco Estuary, San Pablo Bay, and the Sacramento River. We need to determine how expenditures for fishing supplies, equipment, and services that you sell affect the economy and how the recession has impacted your business. We spoke with Mr./Ms. __________________________ and he/she agreed to let us interview on this date and time. May I speak with that person? 1 Yes skip to Q1 2 No continue and read introduction 8 Don’t know continue and read introduction 9 refused continue and read introduction If the person does not want to respond, read to him/her the following:
We really need your views and would like to ask you a few questions about your business activities. Your answers will remain anonymous and will be combined with responses from other anglers to be reported as averages. The responses you give are very important to ensure a scientific study of the economic impact of sport fishing in California. Did you receive the form and the map that we sent on _______ to assist you in the reporting? Do you have that form and map with you now?
177
Q1. I'd like to begin the survey by asking which of the following best describes the primary products and services that you sell and/or rent? (Choose only one.)
1. Boats and water craft sales and service only (go to Q1a)
2. Boats and water craft rentals only (go to Q1b)
3. Boats and water craft sales, service and rentals (go to Q1c)
4. Fishing equipment, such as rods, reels, and bait, but no boats and water craft
(go to Q1d)
5. Fishing equipment, such as rods, reels, bait, as well as boats and water craft
(go to Q1e)
Q1a. What percentage of boats and water craft as well as related supplies and services
that you sell do you purchase outside counties in the Bay Delta Complex?
__________%
Q1b. What percentage of boats and water craft as well as related supplies and services
that you sell do you purchase outside counties in the Bay Delta Complex?
__________%
Q1c. What percentage of boats and water craft as well as related supplies and services
that you sell do you purchase outside counties in the Bay Delta Complex?
__________%
Q1d. What percentage of the fishing equipment that you sell do you purchase outside
the counties in the Bay Delta Complex? __________%
Q1e. What percentage of fishing equipment, boats, water craft, and related supplies and
services do you purchase outside the counties in the Bay Delta Complex?
__________%
Q2. In your opinion, has the recession increased, reduced, or had no effect on sales through your business?
1. Increased (go to Q2a) 2. Decreased (skip to Q2b) 3. Had no effect (go to Q3) 4. Don’ t know (go to Q3) 5. Refused to answer (go to Q3)
178
Q2a. By approximately what percentage has the economic recession increased your sales during the past 24 months?
___________ % Q2a1. What other factors have caused your sales to increase? Q2a2. Approximately what percentage of sales increase during the past 24 months has
been the result of this/these factors? _____________% (skip to Scrn1) Q2b. By approximately what percentage has the economic recession decreased your
sales during the past 24 months? ___________ %
Q2b1. What other factors have caused your sales to decrease? Q2b2. Approximately what percentage decrease in sales during the past 24 months
have been the result of this/these factors? _____________% (skip to Scrn1) Scrn1. Were you in business in 2007? 1. Yes (go to Q3) 2. No (skip to Scrn2) 3. Refused to answer (skip to Scrn2) Q3. Including yourself, please tell me the number of full-time and part-time employees
you had in 2007? A full-time employee works 35 hours per week or more, and a part-time employee works less than 35 hours per week.
Employee Classification Number of Employees
Full-time year-round Part time year-round Seasonal full-time Seasonal part-time Q3a. How much were your total gross sales in 2007? $ ________________________ Scrn2. Were you in business in 2009? 1. Yes (go to Q4) 2. No (skip to Finish) 3. Refused to answer (skip to Finish)
179
Q4. Including yourself, please tell me the number of full-time and part-time employees you had in 2009?
Employee Classification Number of Employees
Full-time year-round Part time year round Seasonal full-time Seasonal part-time Q4a. How much were your total gross sales in 2009? $ ________________________ Finish. Thank you for your help and have a nice day/evening.
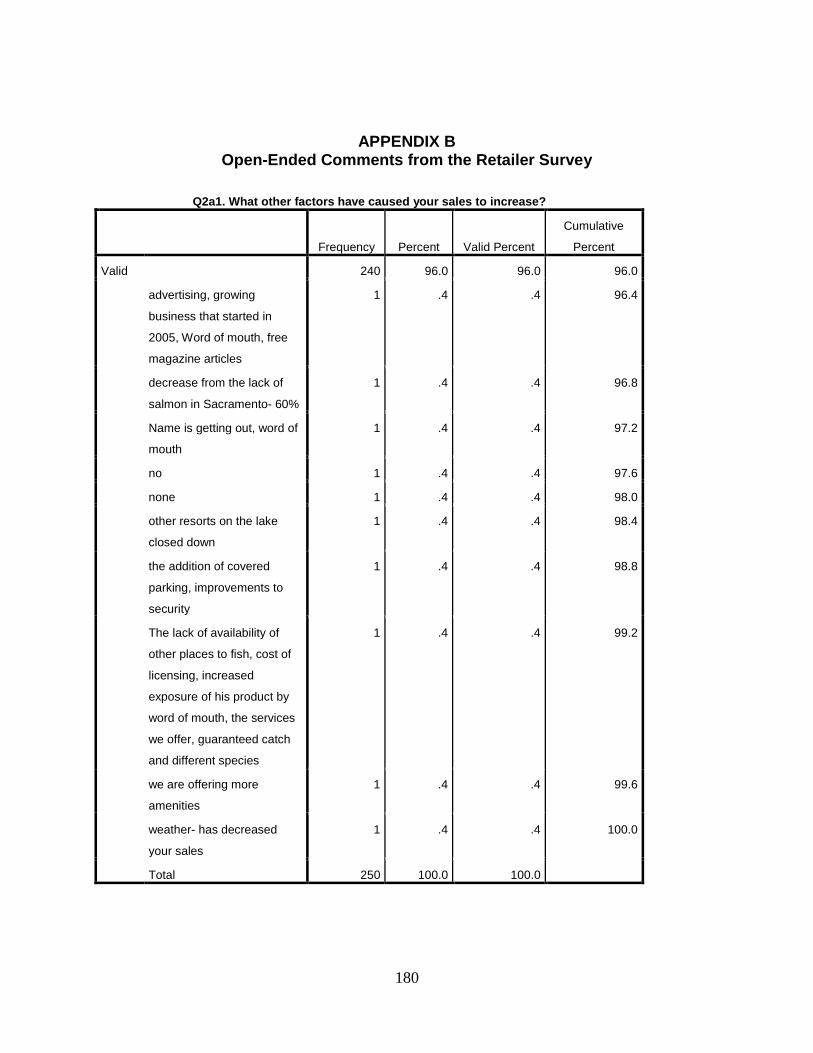
180
APPENDIX B Open-Ended Comments from the Retailer Survey
Q2a1. What other factors have caused your sales to increase?
Frequency Percent Valid Percent
Cumulative
Percent
Valid 240 96.0 96.0 96.0
advertising, growing
business that started in
2005, Word of mouth, free
magazine articles
1 .4 .4 96.4
decrease from the lack of
salmon in Sacramento- 60%
1 .4 .4 96.8
Name is getting out, word of
mouth
1 .4 .4 97.2
no 1 .4 .4 97.6
none 1 .4 .4 98.0
other resorts on the lake
closed down
1 .4 .4 98.4
the addition of covered
parking, improvements to
security
1 .4 .4 98.8
The lack of availability of
other places to fish, cost of
licensing, increased
exposure of his product by
word of mouth, the services
we offer, guaranteed catch
and different species
1 .4 .4 99.2
we are offering more
amenities
1 .4 .4 99.6
weather- has decreased
your sales
1 .4 .4 100.0
Total 250 100.0 100.0
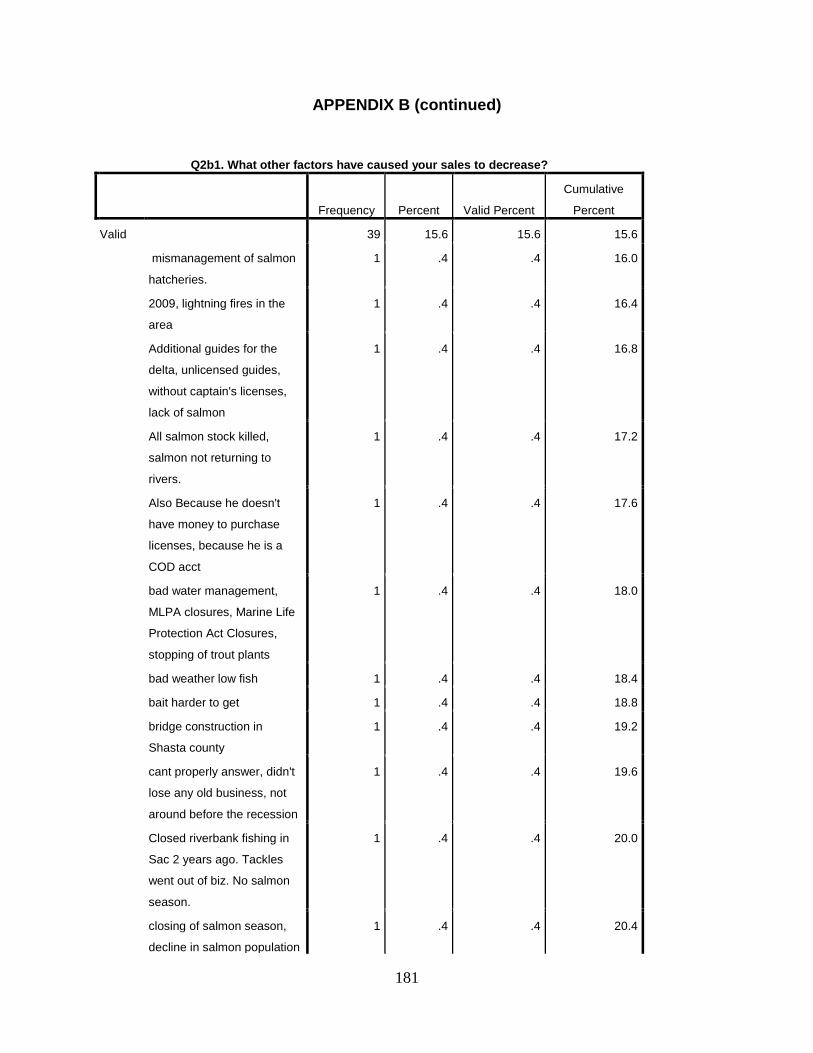
181
APPENDIX B (continued)
Q2b1. What other factors have caused your sales to decrease?
Frequency Percent Valid Percent
Cumulative
Percent
Valid 39 15.6 15.6 15.6
mismanagement of salmon
hatcheries.
1 .4 .4 16.0
2009, lightning fires in the
area
1 .4 .4 16.4
Additional guides for the
delta, unlicensed guides,
without captain's licenses,
lack of salmon
1 .4 .4 16.8
All salmon stock killed,
salmon not returning to
rivers.
1 .4 .4 17.2
Also Because he doesn't
have money to purchase
licenses, because he is a
COD acct
1 .4 .4 17.6
bad water management,
MLPA closures, Marine Life
Protection Act Closures,
stopping of trout plants
1 .4 .4 18.0
bad weather low fish 1 .4 .4 18.4
bait harder to get 1 .4 .4 18.8
bridge construction in
Shasta county
1 .4 .4 19.2
cant properly answer, didn't
lose any old business, not
around before the recession
1 .4 .4 19.6
Closed riverbank fishing in
Sac 2 years ago. Tackles
went out of biz. No salmon
season.
1 .4 .4 20.0
closing of salmon season,
decline in salmon population
1 .4 .4 20.4
182
closure of salmon 1 .4 .4 20.8
Closure of salmon on the
Sac
1 .4 .4 21.2
closure of salmon season 1 .4 .4 21.6
Closure of salmon season,
decline of the fishery.
1 .4 .4 22.0
closure of salmon season,
increase in cost of fishing
license fees, day use fees.
1 .4 .4 22.4
closure of salmon season;
personal health
1 .4 .4 22.8
closure of the salmon
season over last few years,
poor condition of the delta
due to pumping more water
south, higher salinity
because less fresh water in
the delta
1 .4 .4 23.2
competition with used
market via internet, larger
box stores
1 .4 .4 23.6
confusing and complicated
regulation changes,
declining fisheries, reduced
access, this year weather
patterns
1 .4 .4 24.0
cost of fuel 1 .4 .4 24.4
Cost of gasoline, lower fish
runs from ocean, Salmon
way down and stripers too
1 .4 .4 24.8
costs of licenses, fuel costs,
etc
1 .4 .4 25.2
customer base, older senior
citizens passing away.
Crack down on illegal
immigrants.
1 .4 .4 25.6
Customers are not around
anymore
1 .4 .4 26.0
183
decline of salmon fishing;
water going south, rock cod
closures on the coast,
1 .4 .4 26.4
declining fish populations 1 .4 .4 26.8
decrease half due to
recession and water quality
and decline in fishery quality
1 .4 .4 27.2
decrease in fishing quality-
invasive weed Eurasian
milfoil invading Fall River.
Reduces hatches, insects.
1 .4 .4 27.6
decrease in striped bass and
salmon populations, and
decrease in access to
salmon fishing-because of
closure of season
1 .4 .4 28.0
DFG stopping of the
stocking of the Streams,
poor fisheries management
1 .4 .4 28.4
drought 1 .4 .4 28.8
Drought in 2008, water too
hot. Dams built along the
river have really hurt the
fishes' ability to move
upstream, pollution, poorer
water conditions. We are not
considering
conservationism. Fish and
Game needs to
communicate, needs to
interact with more o
1 .4 .4 29.2
drought. 1 .4 .4 29.6
facing more competition,
now that more tackle shops
are offering online services
1 .4 .4 30.0
fewer people in the water,
lower volume, smaller profit
margins
1 .4 .4 30.4
fewer quantity of fish in bay 1 .4 .4 30.8
184
fires 1 .4 .4 31.2
Fires in 2008. 1 .4 .4 31.6
Fish and Game regulations 1 .4 .4 32.0
Fisheries population-
decrease in salmon,
steelhead, bass. Water
shipped south.
1 .4 .4 32.4
fishing closures-seasons 1 .4 .4 32.8
Fishing conditions mostly 1 .4 .4 33.2
fishing not as good as it
used to be. And it is more
expensive to go fishing
1 .4 .4 33.6
fishing not as good as used
to be, water misuse, water
going to southern California
1 .4 .4 34.0
fishing seasons salmon and
sturgeon
1 .4 .4 34.4
fluctuation in steelhead
population
1 .4 .4 34.8
Gas prices going up, food
inflation
1 .4 .4 35.2
Health care; weather, 1 .4 .4 35.6
Illegal guides/ non permitted
guides, shops from bay
sending people from their
area up into his rivers
1 .4 .4 36.0
increase in cost of licensing
and cost of products
1 .4 .4 36.4
just economy 1 .4 .4 36.8
just recession 1 .4 .4 37.2
just the economy 1 .4 .4 37.6
Lack of a fishing season for
Salmon
1 .4 .4 38.0
lack of a salmon run 1 .4 .4 38.4
Lack of a salmon season 1 .4 .4 38.8
Lack of a salmon season the
last two years
1 .4 .4 39.2
185
lack of fish 3 1.2 1.2 40.4
lack of fish in feather river
(steel head), irregular flows
(shad)
1 .4 .4 40.8
lack of fish in fisheries 1 .4 .4 41.2
lack of fish in fisheries. low
salmon
1 .4 .4 41.6
lack of fish in rivers, poor
river conditions
1 .4 .4 42.0
lack of fish, and no salmon
any more
1 .4 .4 42.4
lack of fish, bad water,
salmon season closure
1 .4 .4 42.8
lack of fish, closing of
salmon fishing
1 .4 .4 43.2
lack of fish, salmon closures,
sending water south
1 .4 .4 43.6
lack of salmon 1 .4 .4 44.0
lack of salmon fishing 1 .4 .4 44.4
lack of salmon in the
Sacramento
1 .4 .4 44.8
lack of salmon returns and
closures. Lack of spendable
income of past clients
1 .4 .4 45.2
lack of salmon season 1 .4 .4 45.6
Lake Berryessa: government
prohibited use of lake, where
his business thrived.
1 .4 .4 46.0
Less people are fishing 1 .4 .4 46.4
limitation on Salmon season 1 .4 .4 46.8
Loss of fish (specifically
salmon)
1 .4 .4 47.2
Loss of the salmon in the
river
1 .4 .4 47.6
loss of tournaments, and not
nearly as many anglers
fishing the tournaments
1 .4 .4 48.0
186
Lost business because of
the water issue, cost of
licenses and no fish.
Usually the economy helps
our business but mot in this
case
1 .4 .4 48.4
lost three launching pads
due to low water.
1 .4 .4 48.8
Low fish counts; little to no
seasons to fish for salmon;
increased fishing
regulations, higher cost for
catch/harvest cards; false
facts from local media.
1 .4 .4 49.2
Low fish populations,
salmon season closure or
shorter season. That
compounds with economic.
1 .4 .4 49.6
Low water conditions in
lakes, less/poorer ramp
access in Lake Oroville, fires
one year keeping people
away. Gasoline prices going
up over $4/ gallon. School
year starting in August, took
3 weeks away from his
booking schedule.
1 .4 .4 50.0
MANAGEMENT OF FISH IN
DELTA.
1 .4 .4 50.4
mismanagement of water,
salmon and the water being
shipped south.
1 .4 .4 50.8
more focused on his regular
day job
1 .4 .4 51.2
More guides out there on the
water with want to be
guides. The salmon season
has affected my business
and the price of gas.
1 .4 .4 51.6
187
moving away from it, new
job full time as Biologist for
forest service
1 .4 .4 52.0
new generation, younger
population expressing other
interests.
1 .4 .4 52.4
no 11 4.4 4.4 56.8
NO 1 .4 .4 57.2
No fish, 90 % of business is
usually salmon.
1 .4 .4 57.6
no salmon 1 .4 .4 58.0
NO salmon 1 .4 .4 58.4
no salmon and public
perception of fishing
regulations- confusion over
regulation, area closures
1 .4 .4 58.8
No salmon fishing 1 .4 .4 59.2
no Salmon season 1 .4 .4 59.6
no salmon season in fall 1 .4 .4 60.0
none 27 10.8 10.8 70.8
NONE 1 .4 .4 71.2
none at all 1 .4 .4 71.6
none besides recession and
housing market
1 .4 .4 72.0
none, good weather and all 1 .4 .4 72.4
none, recession hit his
largest clients, travel
expenses became too large
for his clients, and clients
are cutting costs
1 .4 .4 72.8
nope 1 .4 .4 73.2
Oil spill in bay, Alameda Bay
had an oil spill as well
1 .4 .4 73.6
People are out of work. DFG
regulation are tougher and
people are discouraged
1 .4 .4 74.0
188
people don't want to spend
money. closure of king
salmon species on our rivers
due to insufficient return.
1 .4 .4 74.4
people not wanting to spend
money, running on inventory
1 .4 .4 74.8
poor fish runs, 1 .4 .4 75.2
poor fishing 1 .4 .4 75.6
poor fishing, salmon and
steel runs are poor due to
regulations
1 .4 .4 76.0
possibility that him not
handling marketing as well
hurt sales a bit
1 .4 .4 76.4
problems with engine 1 .4 .4 76.8
Quality of fishing in delta 1 .4 .4 77.2
quantity of fish in the greater
Delta Region.
1 .4 .4 77.6
reduction of salmon
population
1 .4 .4 78.0
regulations from the DFG,
(shortened season) closure
of the salmon, availability of
the fish. sport fishing not
hurting fish populations, it's
the commercial fishing.
1 .4 .4 78.4
renewal of salmon season 1 .4 .4 78.8
Salmon closure 2008-2009 1 .4 .4 79.2
salmon closure and crisis 1 .4 .4 79.6
salmon closures 5 2.0 2.0 81.6
Salmon closures and small
salmon population on the
Sacramento
1 .4 .4 82.0
salmon closures, licenses
are expensive, water is an
issue
1 .4 .4 82.4
189
salmon closures, Sturgeon
regulations, and just the
economy, delta change in
the water supply
1 .4 .4 82.8
salmon fishing 1 .4 .4 83.2
salmon fishing restrictions 2 .8 .8 84.0
salmon fishing, gasoline
prices
1 .4 .4 84.4
Salmon regulations 1 .4 .4 84.8
Salmon Relief money went
out to charter vessels from
the DFG
1 .4 .4 85.2
salmon restrictions 1 .4 .4 85.6
salmon restrictions and
closures
1 .4 .4 86.0
Salmon Run 1 .4 .4 86.4
Salmon run getting
shutdown
1 .4 .4 86.8
salmon season 1 .4 .4 87.2
Salmon season changes. 1 .4 .4 87.6
salmon season closed, 1 .4 .4 88.0
salmon season closure 1 .4 .4 88.4
salmon season closure, low
water levels, no stocking
program
1 .4 .4 88.8
salmon season closure, no
smolt in river caused lack of
season
1 .4 .4 89.2
salmon season closures 1 .4 .4 89.6
salmon season shutdown, 1 .4 .4 90.0
Salmon season stoppage,
and fish population
1 .4 .4 90.4
season cuts, lack of fish 1 .4 .4 90.8
Shutdown of the salmon
along Sac
1 .4 .4 91.2
190
state and federal closures of
fishing areas, lawsuits
challenging DFG stocking,
eco-disasters, loss of
consumer confidence.
1 .4 .4 91.6
the closure of salmon
season
1 .4 .4 92.0
The economic, weather, and
the Shasta Lake traffic
1 .4 .4 92.4
The Federal closure of the
Salmon has really
decreased my business. I
am mainly a salmon guide.
1 .4 .4 92.8
The overall fishing
conditions have reduced my
business. The water is a
huge factor.
1 .4 .4 93.2
too many guides, out of area
guides are coming into these
areas. Salmon season gets
over populated with guides
and take the clients.
1 .4 .4 93.6
unclear restrictions on sport
fishing in certain areas,
people not spending money
on fishing guides, doing
other things for recreation
1 .4 .4 94.0
Water export, water quality. 1 .4 .4 94.4
water going south is
affecting business more than
the recession, loss of
interest from fishermen, not
as many fish in delta, lower
catch numbers
1 .4 .4 94.8
Water going south, striped
bass planting.
1 .4 .4 95.2
water levels in Lake Oroville 1 .4 .4 95.6
water management, hurting
salmon runs.
1 .4 .4 96.0
191
water quality, pollution due
to agriculture and cattle
ranching, inability of Fish
and Game to enforce water
quality laws
1 .4 .4 96.4
weather 2 .8 .8 97.2
weather sustainability
inconsistent weather
1 .4 .4 97.6
Weather, high water. 1 .4 .4 98.0
weather, seasons being
hotter less people wanting to
sit out and fish
1 .4 .4 98.4
weather, short season
because of bad weather in
May June
1 .4 .4 98.8
Weather, water quality, fish
population decline
1 .4 .4 99.2
weather, wet winter and late
spring,
1 .4 .4 99.6
Yeah the closing of the
salmon season
1 .4 .4 100.0
Total 250 100.0 100.0
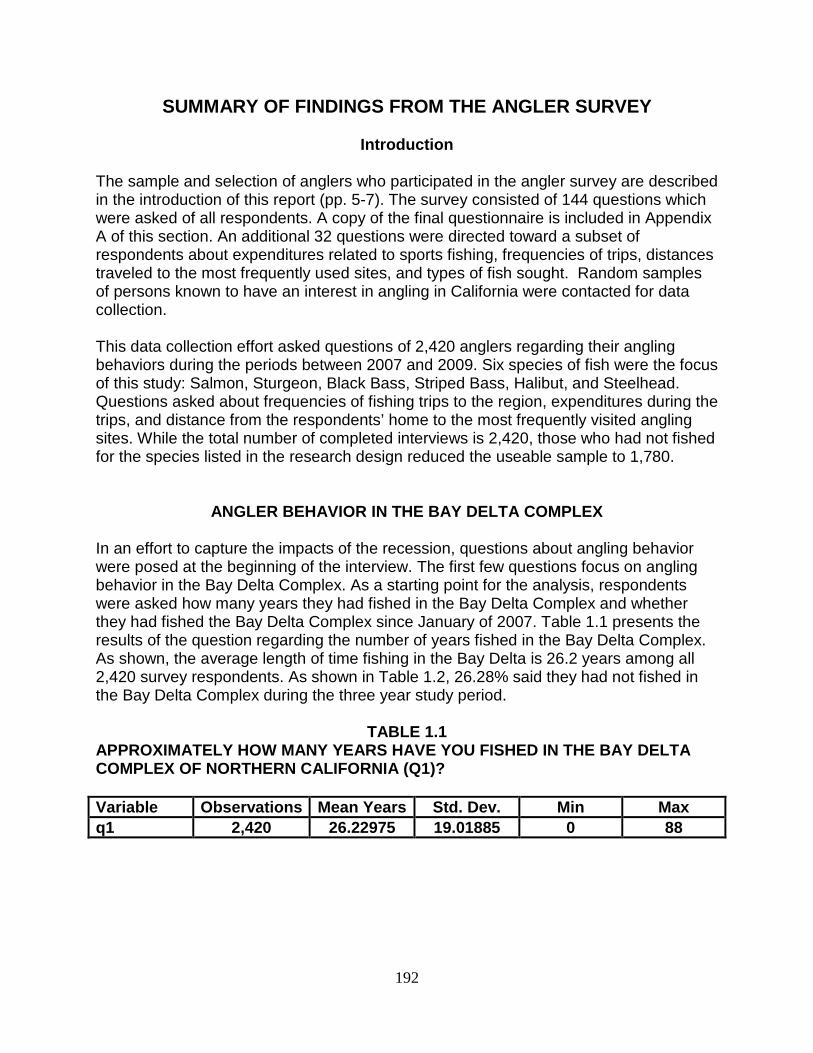
192
SUMMARY OF FINDINGS FROM THE ANGLER SURVEY
Introduction The sample and selection of anglers who participated in the angler survey are described in the introduction of this report (pp. 5-7). The survey consisted of 144 questions which were asked of all respondents. A copy of the final questionnaire is included in Appendix A of this section. An additional 32 questions were directed toward a subset of respondents about expenditures related to sports fishing, frequencies of trips, distances traveled to the most frequently used sites, and types of fish sought. Random samples of persons known to have an interest in angling in California were contacted for data collection. This data collection effort asked questions of 2,420 anglers regarding their angling behaviors during the periods between 2007 and 2009. Six species of fish were the focus of this study: Salmon, Sturgeon, Black Bass, Striped Bass, Halibut, and Steelhead. Questions asked about frequencies of fishing trips to the region, expenditures during the trips, and distance from the respondents’ home to the most frequently visited angling sites. While the total number of completed interviews is 2,420, those who had not fished for the species listed in the research design reduced the useable sample to 1,780.
ANGLER BEHAVIOR IN THE BAY DELTA COMPLEX In an effort to capture the impacts of the recession, questions about angling behavior were posed at the beginning of the interview. The first few questions focus on angling behavior in the Bay Delta Complex. As a starting point for the analysis, respondents were asked how many years they had fished in the Bay Delta Complex and whether they had fished the Bay Delta Complex since January of 2007. Table 1.1 presents the results of the question regarding the number of years fished in the Bay Delta Complex. As shown, the average length of time fishing in the Bay Delta is 26.2 years among all 2,420 survey respondents. As shown in Table 1.2, 26.28% said they had not fished in the Bay Delta Complex during the three year study period.
TABLE 1.1 APPROXIMATELY HOW MANY YEARS HAVE YOU FISHED IN THE BAY DELTA COMPLEX OF NORTHERN CALIFORNIA (Q1)? Variable Observations Mean Years Std. Dev. Min Max q1 2,420 26.22975 19.01885 0 88
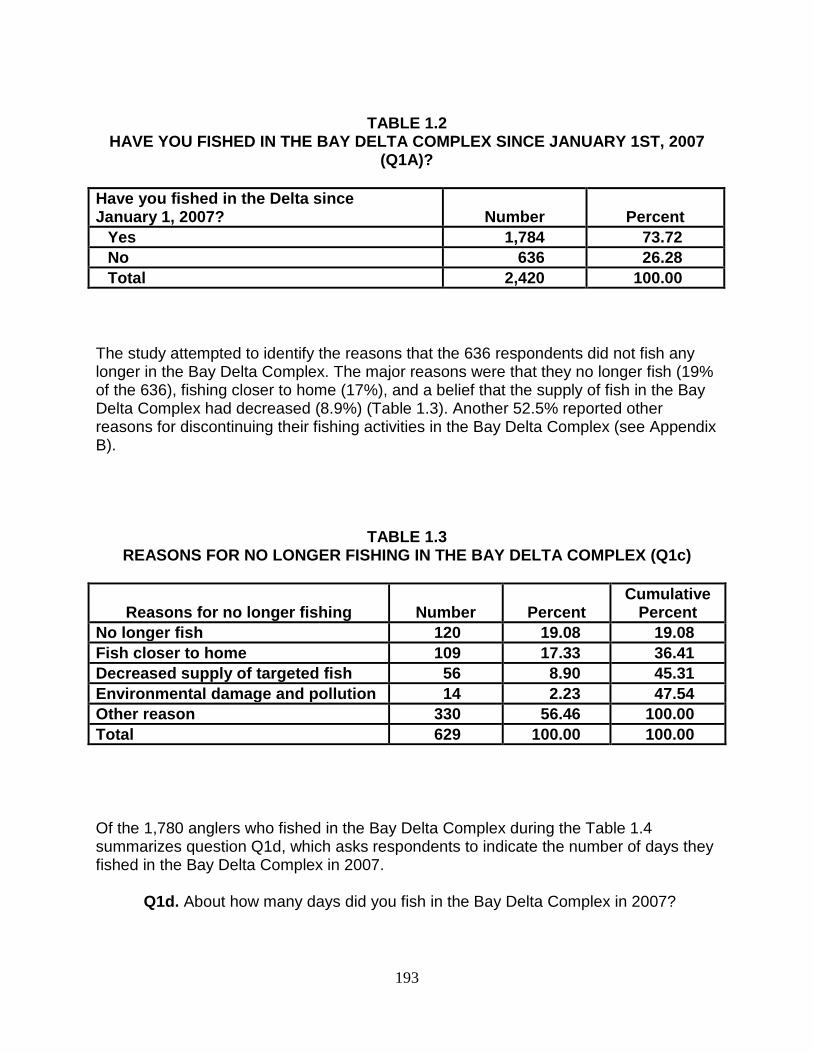
193
TABLE 1.2
HAVE YOU FISHED IN THE BAY DELTA COMPLEX SINCE JANUARY 1ST, 2007 (Q1A)?
Have you fished in the Delta since January 1, 2007?
Number
Percent
Yes 1,784 73.72 No 636 26.28 Total 2,420 100.00
The study attempted to identify the reasons that the 636 respondents did not fish any longer in the Bay Delta Complex. The major reasons were that they no longer fish (19% of the 636), fishing closer to home (17%), and a belief that the supply of fish in the Bay Delta Complex had decreased (8.9%) (Table 1.3). Another 52.5% reported other reasons for discontinuing their fishing activities in the Bay Delta Complex (see Appendix B).
TABLE 1.3 REASONS FOR NO LONGER FISHING IN THE BAY DELTA COMPLEX (Q1c)
Reasons for no longer fishing
Number
Percent Cumulative
Percent No longer fish 120 19.08 19.08 Fish closer to home 109 17.33 36.41 Decreased supply of targeted fish 56 8.90 45.31 Environmental damage and pollution 14 2.23 47.54 Other reason 330 56.46 100.00 Total 629 100.00 100.00
Of the 1,780 anglers who fished in the Bay Delta Complex during the Table 1.4 summarizes question Q1d, which asks respondents to indicate the number of days they fished in the Bay Delta Complex in 2007. Q1d. About how many days did you fish in the Bay Delta Complex in 2007?
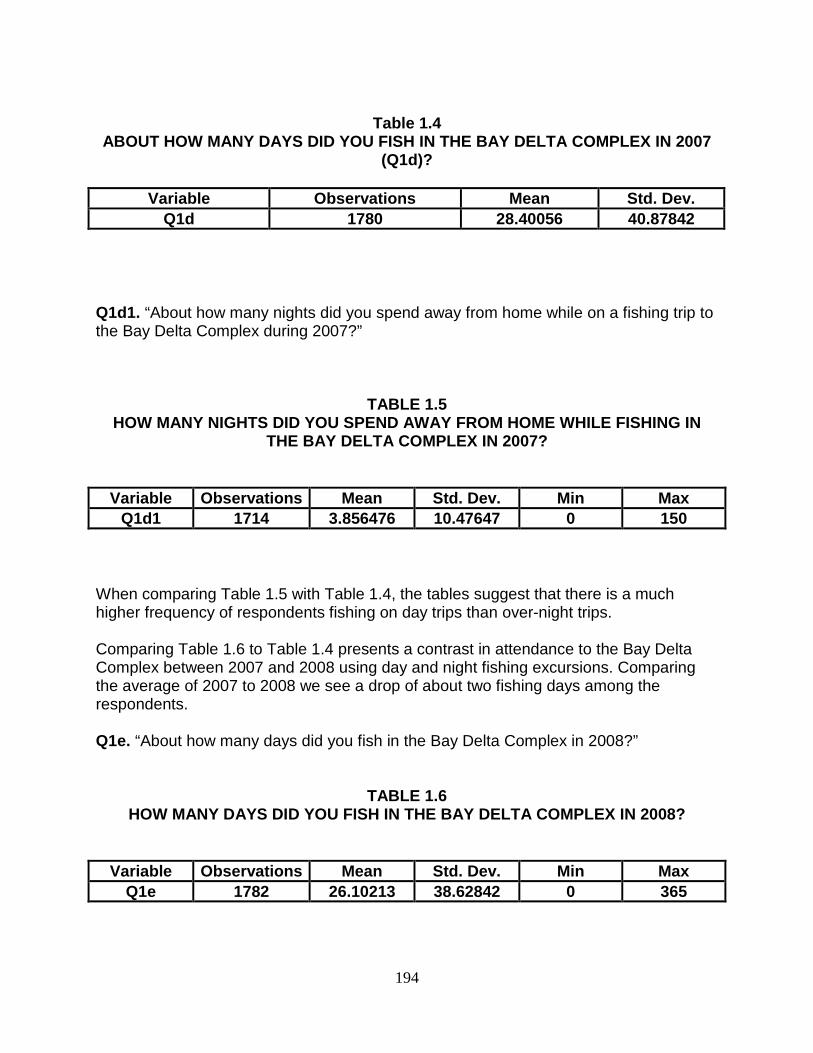
194
Table 1.4
ABOUT HOW MANY DAYS DID YOU FISH IN THE BAY DELTA COMPLEX IN 2007 (Q1d)?
Variable Observations Mean Std. Dev.
Q1d 1780 28.40056 40.87842
Q1d1. “About how many nights did you spend away from home while on a fishing trip to the Bay Delta Complex during 2007?”
TABLE 1.5 HOW MANY NIGHTS DID YOU SPEND AWAY FROM HOME WHILE FISHING IN
THE BAY DELTA COMPLEX IN 2007?
Variable Observations Mean Std. Dev. Min Max Q1d1 1714 3.856476 10.47647 0 150
When comparing Table 1.5 with Table 1.4, the tables suggest that there is a much higher frequency of respondents fishing on day trips than over-night trips. Comparing Table 1.6 to Table 1.4 presents a contrast in attendance to the Bay Delta Complex between 2007 and 2008 using day and night fishing excursions. Comparing the average of 2007 to 2008 we see a drop of about two fishing days among the respondents. Q1e. “About how many days did you fish in the Bay Delta Complex in 2008?”
TABLE 1.6 HOW MANY DAYS DID YOU FISH IN THE BAY DELTA COMPLEX IN 2008?
Variable Observations Mean Std. Dev. Min Max Q1e 1782 26.10213 38.62842 0 365
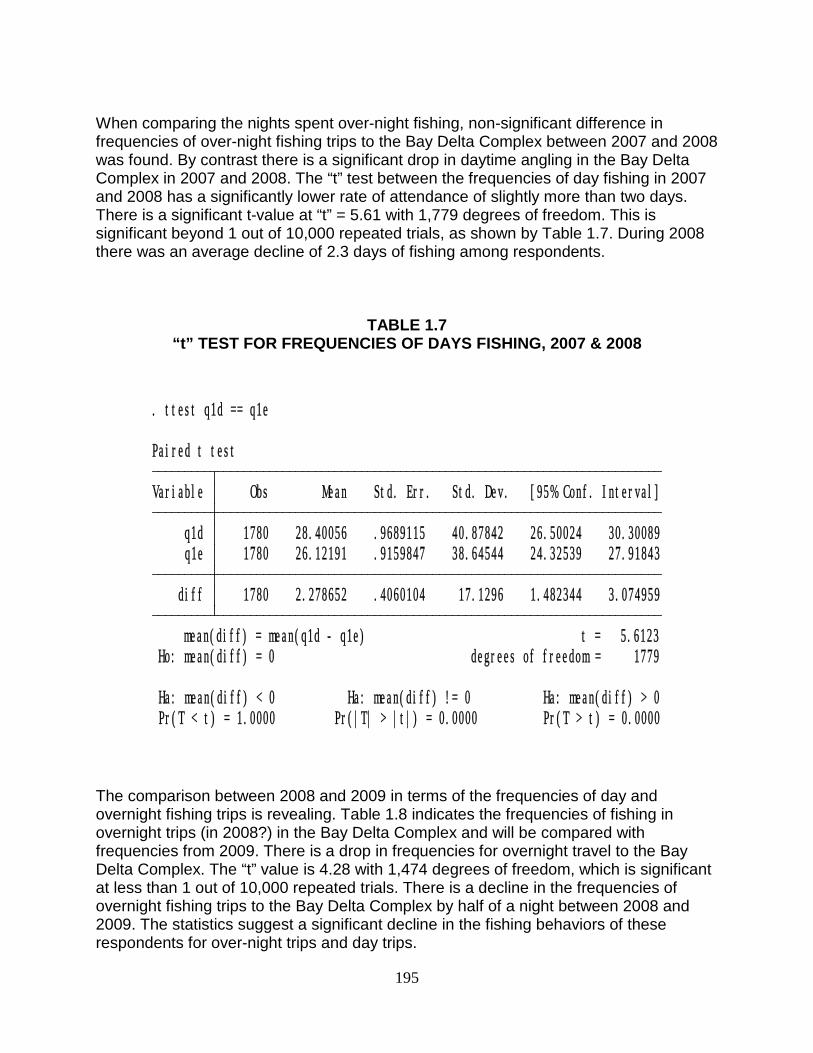
195
When comparing the nights spent over-night fishing, non-significant difference in frequencies of over-night fishing trips to the Bay Delta Complex between 2007 and 2008 was found. By contrast there is a significant drop in daytime angling in the Bay Delta Complex in 2007 and 2008. The “t” test between the frequencies of day fishing in 2007 and 2008 has a significantly lower rate of attendance of slightly more than two days. There is a significant t-value at “t” = 5.61 with 1,779 degrees of freedom. This is significant beyond 1 out of 10,000 repeated trials, as shown by Table 1.7. During 2008 there was an average decline of 2.3 days of fishing among respondents.
TABLE 1.7 “t” TEST FOR FREQUENCIES OF DAYS FISHING, 2007 & 2008
Pr(T < t) = 1.0000 Pr(|T| > |t|) = 0.0000 Pr(T > t) = 0.0000 Ha: mean(diff) < 0 Ha: mean(diff) != 0 Ha: mean(diff) > 0
Ho: mean(diff) = 0 degrees of freedom = 1779 mean(diff) = mean(q1d - q1e) t = 5.6123 diff 1780 2.278652 .4060104 17.1296 1.482344 3.074959 q1e 1780 26.12191 .9159847 38.64544 24.32539 27.91843 q1d 1780 28.40056 .9689115 40.87842 26.50024 30.30089 Variable Obs Mean Std. Err. Std. Dev. [95% Conf. Interval] Paired t test
. ttest q1d == q1e
The comparison between 2008 and 2009 in terms of the frequencies of day and overnight fishing trips is revealing. Table 1.8 indicates the frequencies of fishing in overnight trips (in 2008?) in the Bay Delta Complex and will be compared with frequencies from 2009. There is a drop in frequencies for overnight travel to the Bay Delta Complex. The “t” value is 4.28 with 1,474 degrees of freedom, which is significant at less than 1 out of 10,000 repeated trials. There is a decline in the frequencies of overnight fishing trips to the Bay Delta Complex by half of a night between 2008 and 2009. The statistics suggest a significant decline in the fishing behaviors of these respondents for over-night trips and day trips.
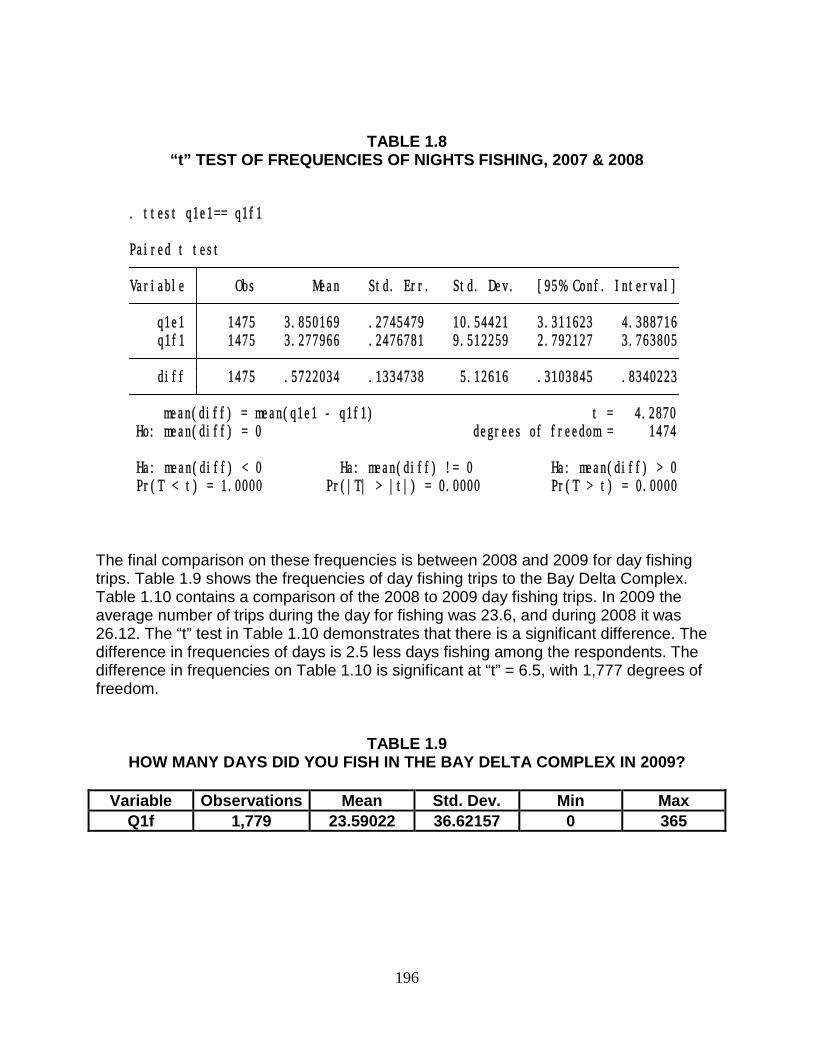
196
TABLE 1.8 “t” TEST OF FREQUENCIES OF NIGHTS FISHING, 2007 & 2008
Pr(T < t) = 1.0000 Pr(|T| > |t|) = 0.0000 Pr(T > t) = 0.0000 Ha: mean(diff) < 0 Ha: mean(diff) != 0 Ha: mean(diff) > 0
Ho: mean(diff) = 0 degrees of freedom = 1474 mean(diff) = mean(q1e1 - q1f1) t = 4.2870 diff 1475 .5722034 .1334738 5.12616 .3103845 .8340223 q1f1 1475 3.277966 .2476781 9.512259 2.792127 3.763805 q1e1 1475 3.850169 .2745479 10.54421 3.311623 4.388716 Variable Obs Mean Std. Err. Std. Dev. [95% Conf. Interval] Paired t test
. ttest q1e1== q1f1
The final comparison on these frequencies is between 2008 and 2009 for day fishing trips. Table 1.9 shows the frequencies of day fishing trips to the Bay Delta Complex. Table 1.10 contains a comparison of the 2008 to 2009 day fishing trips. In 2009 the average number of trips during the day for fishing was 23.6, and during 2008 it was 26.12. The “t” test in Table 1.10 demonstrates that there is a significant difference. The difference in frequencies of days is 2.5 less days fishing among the respondents. The difference in frequencies on Table 1.10 is significant at “t” = 6.5, with 1,777 degrees of freedom.
TABLE 1.9 HOW MANY DAYS DID YOU FISH IN THE BAY DELTA COMPLEX IN 2009?
Variable Observations Mean Std. Dev. Min Max
Q1f 1,779 23.59022 36.62157 0 365
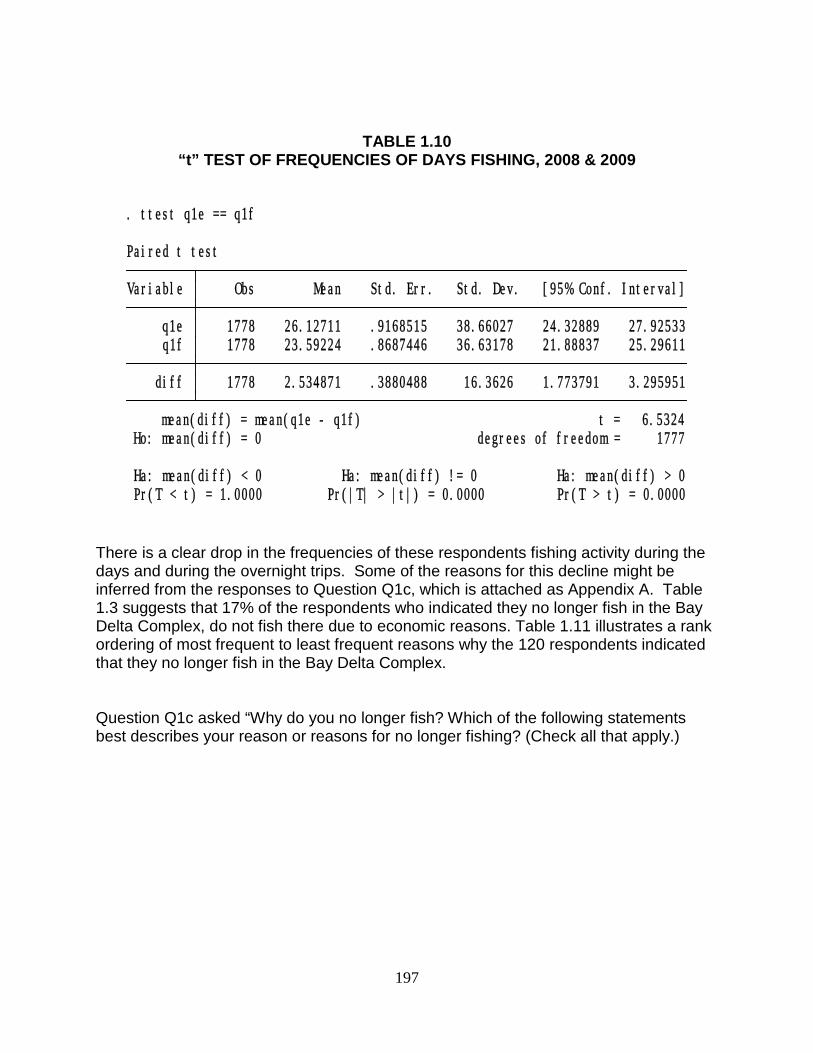
197
TABLE 1.10 “t” TEST OF FREQUENCIES OF DAYS FISHING, 2008 & 2009
Pr(T < t) = 1.0000 Pr(|T| > |t|) = 0.0000 Pr(T > t) = 0.0000 Ha: mean(diff) < 0 Ha: mean(diff) != 0 Ha: mean(diff) > 0
Ho: mean(diff) = 0 degrees of freedom = 1777 mean(diff) = mean(q1e - q1f) t = 6.5324 diff 1778 2.534871 .3880488 16.3626 1.773791 3.295951 q1f 1778 23.59224 .8687446 36.63178 21.88837 25.29611 q1e 1778 26.12711 .9168515 38.66027 24.32889 27.92533 Variable Obs Mean Std. Err. Std. Dev. [95% Conf. Interval] Paired t test
. ttest q1e == q1f
There is a clear drop in the frequencies of these respondents fishing activity during the days and during the overnight trips. Some of the reasons for this decline might be inferred from the responses to Question Q1c, which is attached as Appendix A. Table 1.3 suggests that 17% of the respondents who indicated they no longer fish in the Bay Delta Complex, do not fish there due to economic reasons. Table 1.11 illustrates a rank ordering of most frequent to least frequent reasons why the 120 respondents indicated that they no longer fish in the Bay Delta Complex. Question Q1c asked “Why do you no longer fish? Which of the following statements best describes your reason or reasons for no longer fishing? (Check all that apply.)
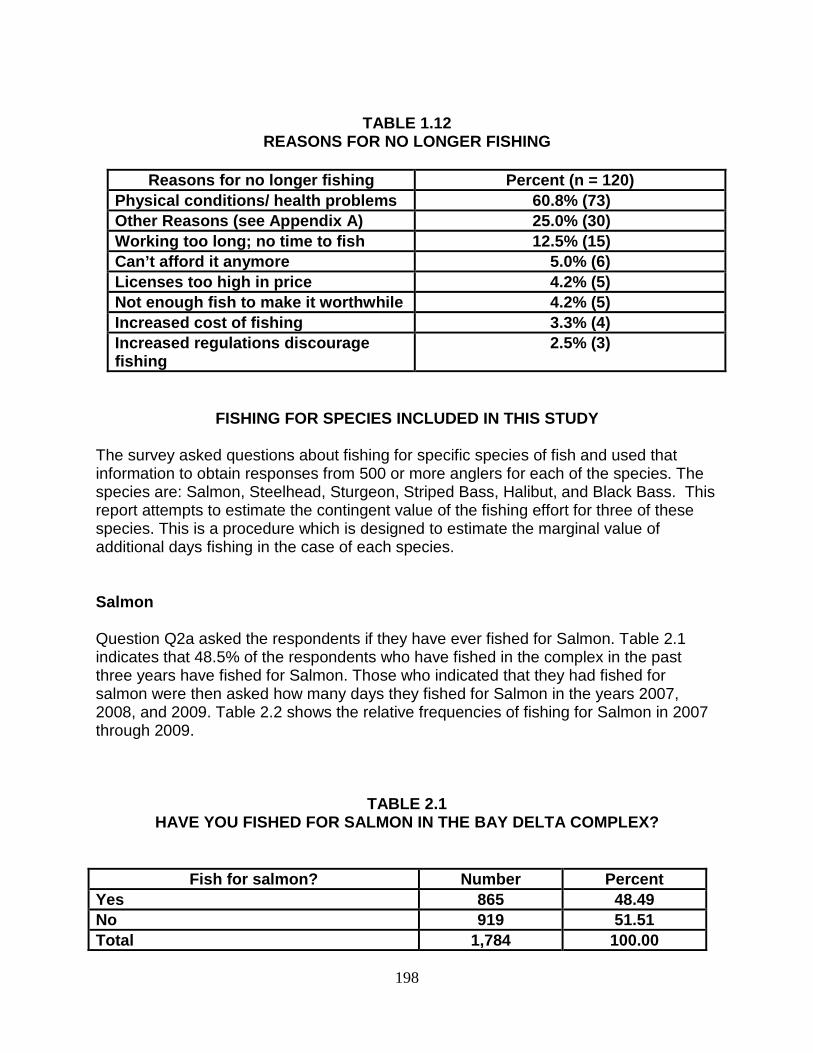
198
TABLE 1.12
REASONS FOR NO LONGER FISHING
Reasons for no longer fishing Percent (n = 120) Physical conditions/ health problems 60.8% (73) Other Reasons (see Appendix A) 25.0% (30) Working too long; no time to fish 12.5% (15) Can’t afford it anymore 5.0% (6) Licenses too high in price 4.2% (5) Not enough fish to make it worthwhile 4.2% (5) Increased cost of fishing 3.3% (4) Increased regulations discourage fishing
2.5% (3)
FISHING FOR SPECIES INCLUDED IN THIS STUDY
The survey asked questions about fishing for specific species of fish and used that information to obtain responses from 500 or more anglers for each of the species. The species are: Salmon, Steelhead, Sturgeon, Striped Bass, Halibut, and Black Bass. This report attempts to estimate the contingent value of the fishing effort for three of these species. This is a procedure which is designed to estimate the marginal value of additional days fishing in the case of each species. Salmon Question Q2a asked the respondents if they have ever fished for Salmon. Table 2.1 indicates that 48.5% of the respondents who have fished in the complex in the past three years have fished for Salmon. Those who indicated that they had fished for salmon were then asked how many days they fished for Salmon in the years 2007, 2008, and 2009. Table 2.2 shows the relative frequencies of fishing for Salmon in 2007 through 2009.
TABLE 2.1 HAVE YOU FISHED FOR SALMON IN THE BAY DELTA COMPLEX?
Fish for salmon? Number Percent Yes 865 48.49 No 919 51.51 Total 1,784 100.00
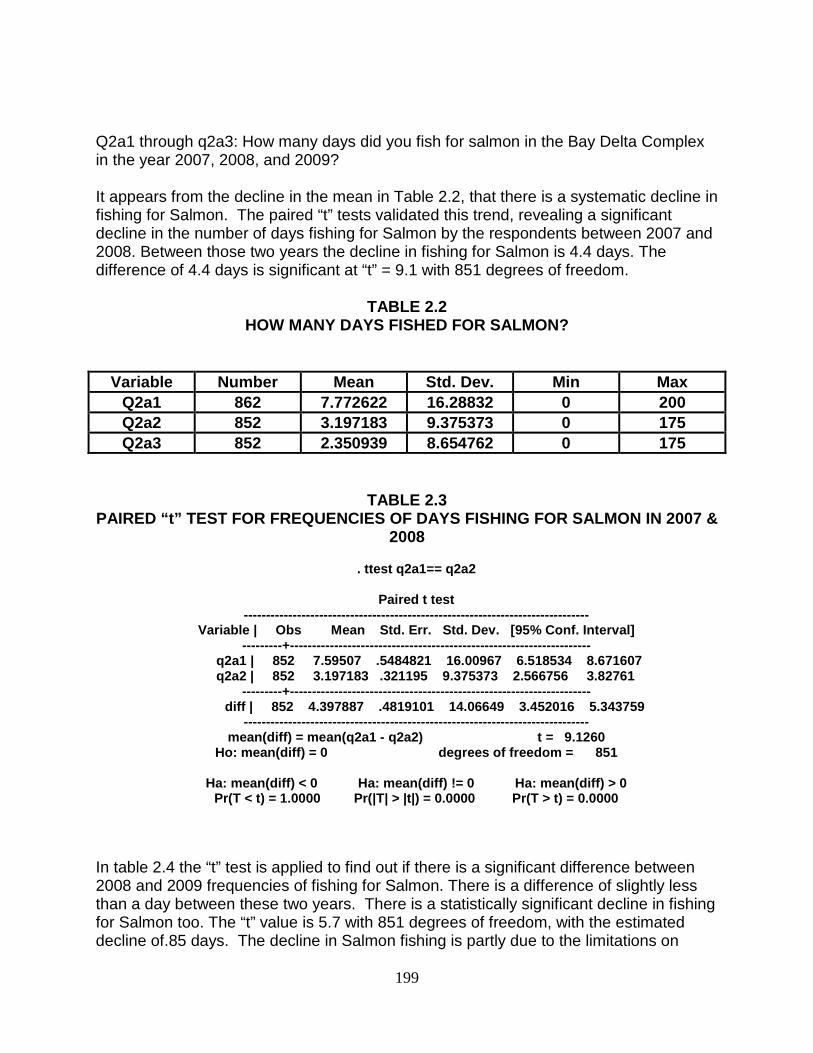
199
Q2a1 through q2a3: How many days did you fish for salmon in the Bay Delta Complex in the year 2007, 2008, and 2009? It appears from the decline in the mean in Table 2.2, that there is a systematic decline in fishing for Salmon. The paired “t” tests validated this trend, revealing a significant decline in the number of days fishing for Salmon by the respondents between 2007 and 2008. Between those two years the decline in fishing for Salmon is 4.4 days. The difference of 4.4 days is significant at “t” = 9.1 with 851 degrees of freedom.
TABLE 2.2 HOW MANY DAYS FISHED FOR SALMON?
Variable Number Mean Std. Dev. Min Max Q2a1 862 7.772622 16.28832 0 200 Q2a2 852 3.197183 9.375373 0 175 Q2a3 852 2.350939 8.654762 0 175
TABLE 2.3 PAIRED “t” TEST FOR FREQUENCIES OF DAYS FISHING FOR SALMON IN 2007 &
2008
. ttest q2a1== q2a2
Paired t test ------------------------------------------------------------------------------
Variable | Obs Mean Std. Err. Std. Dev. [95% Conf. Interval] ---------+--------------------------------------------------------------------
q2a1 | 852 7.59507 .5484821 16.00967 6.518534 8.671607 q2a2 | 852 3.197183 .321195 9.375373 2.566756 3.82761
---------+-------------------------------------------------------------------- diff | 852 4.397887 .4819101 14.06649 3.452016 5.343759
------------------------------------------------------------------------------ mean(diff) = mean(q2a1 - q2a2) t = 9.1260
Ho: mean(diff) = 0 degrees of freedom = 851
Ha: mean(diff) < 0 Ha: mean(diff) != 0 Ha: mean(diff) > 0 Pr(T < t) = 1.0000 Pr(|T| > |t|) = 0.0000 Pr(T > t) = 0.0000
In table 2.4 the “t” test is applied to find out if there is a significant difference between 2008 and 2009 frequencies of fishing for Salmon. There is a difference of slightly less than a day between these two years. There is a statistically significant decline in fishing for Salmon too. The “t” value is 5.7 with 851 degrees of freedom, with the estimated decline of.85 days. The decline in Salmon fishing is partly due to the limitations on
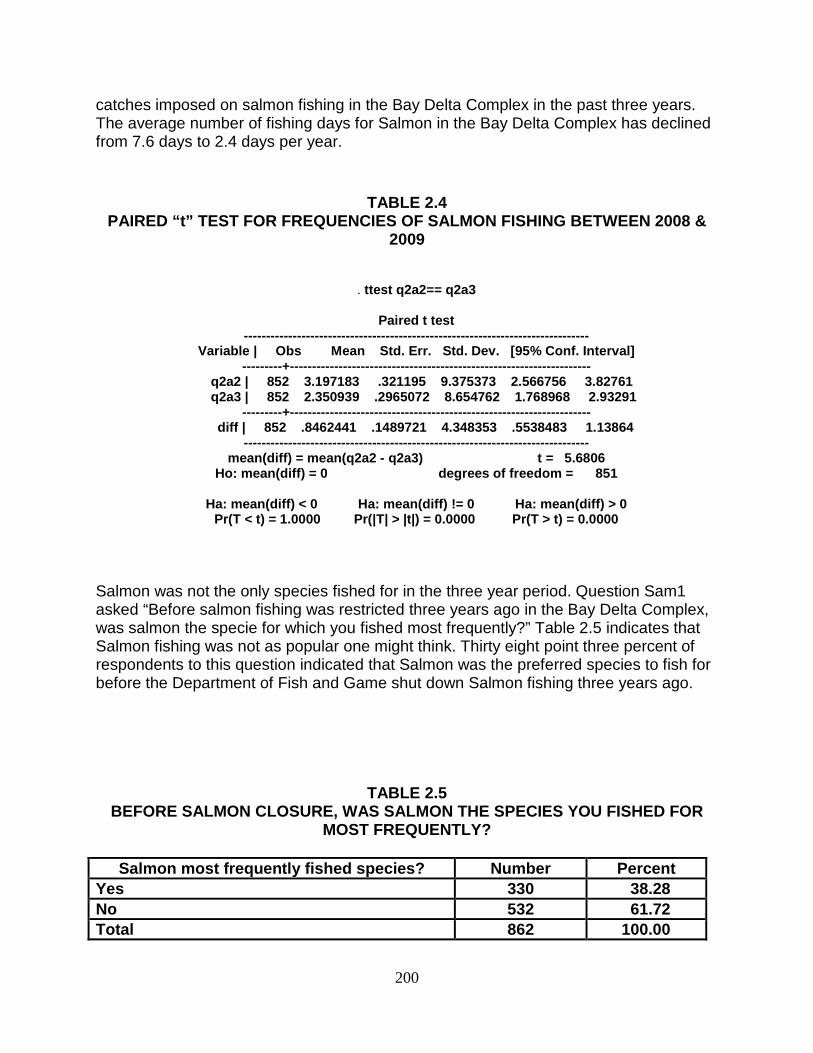
200
catches imposed on salmon fishing in the Bay Delta Complex in the past three years. The average number of fishing days for Salmon in the Bay Delta Complex has declined from 7.6 days to 2.4 days per year.
TABLE 2.4 PAIRED “t” TEST FOR FREQUENCIES OF SALMON FISHING BETWEEN 2008 &
2009
. ttest q2a2== q2a3
Paired t test ------------------------------------------------------------------------------
Variable | Obs Mean Std. Err. Std. Dev. [95% Conf. Interval] ---------+--------------------------------------------------------------------
q2a2 | 852 3.197183 .321195 9.375373 2.566756 3.82761 q2a3 | 852 2.350939 .2965072 8.654762 1.768968 2.93291
---------+-------------------------------------------------------------------- diff | 852 .8462441 .1489721 4.348353 .5538483 1.13864
------------------------------------------------------------------------------ mean(diff) = mean(q2a2 - q2a3) t = 5.6806
Ho: mean(diff) = 0 degrees of freedom = 851
Ha: mean(diff) < 0 Ha: mean(diff) != 0 Ha: mean(diff) > 0 Pr(T < t) = 1.0000 Pr(|T| > |t|) = 0.0000 Pr(T > t) = 0.0000
Salmon was not the only species fished for in the three year period. Question Sam1 asked “Before salmon fishing was restricted three years ago in the Bay Delta Complex, was salmon the specie for which you fished most frequently?” Table 2.5 indicates that Salmon fishing was not as popular one might think. Thirty eight point three percent of respondents to this question indicated that Salmon was the preferred species to fish for before the Department of Fish and Game shut down Salmon fishing three years ago.
TABLE 2.5 BEFORE SALMON CLOSURE, WAS SALMON THE SPECIES YOU FISHED FOR
MOST FREQUENTLY?
Salmon most frequently fished species? Number Percent Yes 330 38.28 No 532 61.72 Total 862 100.00
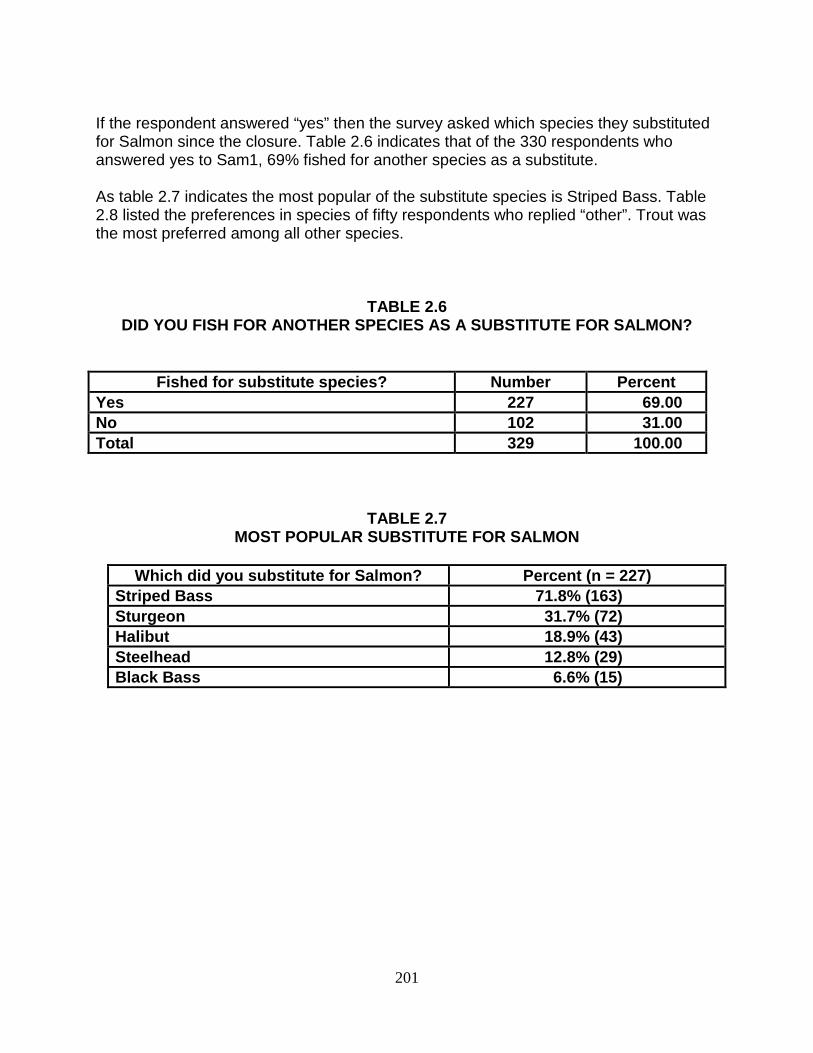
201
If the respondent answered “yes” then the survey asked which species they substituted for Salmon since the closure. Table 2.6 indicates that of the 330 respondents who answered yes to Sam1, 69% fished for another species as a substitute. As table 2.7 indicates the most popular of the substitute species is Striped Bass. Table 2.8 listed the preferences in species of fifty respondents who replied “other”. Trout was the most preferred among all other species.
TABLE 2.6 DID YOU FISH FOR ANOTHER SPECIES AS A SUBSTITUTE FOR SALMON?
Fished for substitute species? Number Percent Yes 227 69.00 No 102 31.00 Total 329 100.00
TABLE 2.7 MOST POPULAR SUBSTITUTE FOR SALMON
Which did you substitute for Salmon? Percent (n = 227)
Striped Bass 71.8% (163) Sturgeon 31.7% (72) Halibut 18.9% (43) Steelhead 12.8% (29) Black Bass 6.6% (15)
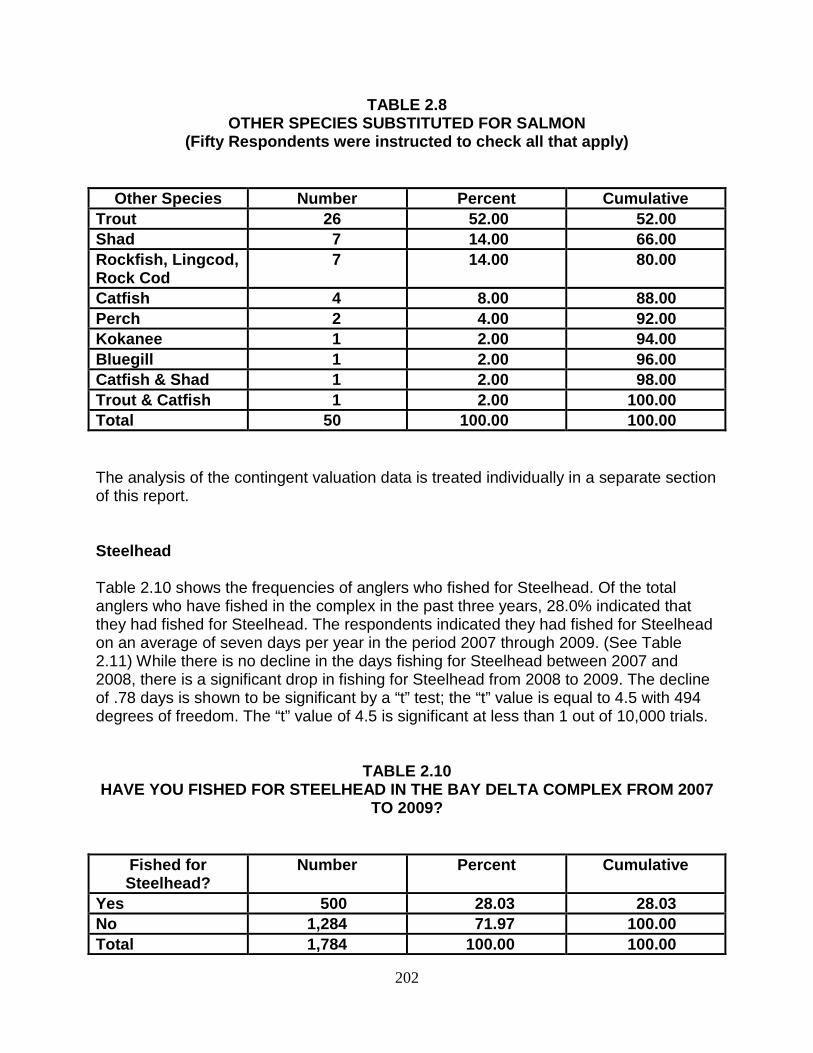
202
TABLE 2.8 OTHER SPECIES SUBSTITUTED FOR SALMON
(Fifty Respondents were instructed to check all that apply)
Other Species Number Percent Cumulative Trout 26 52.00 52.00 Shad 7 14.00 66.00 Rockfish, Lingcod, Rock Cod
7 14.00 80.00
Catfish 4 8.00 88.00 Perch 2 4.00 92.00 Kokanee 1 2.00 94.00 Bluegill 1 2.00 96.00 Catfish & Shad 1 2.00 98.00 Trout & Catfish 1 2.00 100.00 Total 50 100.00 100.00 The analysis of the contingent valuation data is treated individually in a separate section of this report. Steelhead Table 2.10 shows the frequencies of anglers who fished for Steelhead. Of the total anglers who have fished in the complex in the past three years, 28.0% indicated that they had fished for Steelhead. The respondents indicated they had fished for Steelhead on an average of seven days per year in the period 2007 through 2009. (See Table 2.11) While there is no decline in the days fishing for Steelhead between 2007 and 2008, there is a significant drop in fishing for Steelhead from 2008 to 2009. The decline of .78 days is shown to be significant by a “t” test; the “t” value is equal to 4.5 with 494 degrees of freedom. The “t” value of 4.5 is significant at less than 1 out of 10,000 trials.
TABLE 2.10 HAVE YOU FISHED FOR STEELHEAD IN THE BAY DELTA COMPLEX FROM 2007
TO 2009?
Fished for Steelhead?
Number Percent Cumulative
Yes 500 28.03 28.03 No 1,284 71.97 100.00 Total 1,784 100.00 100.00
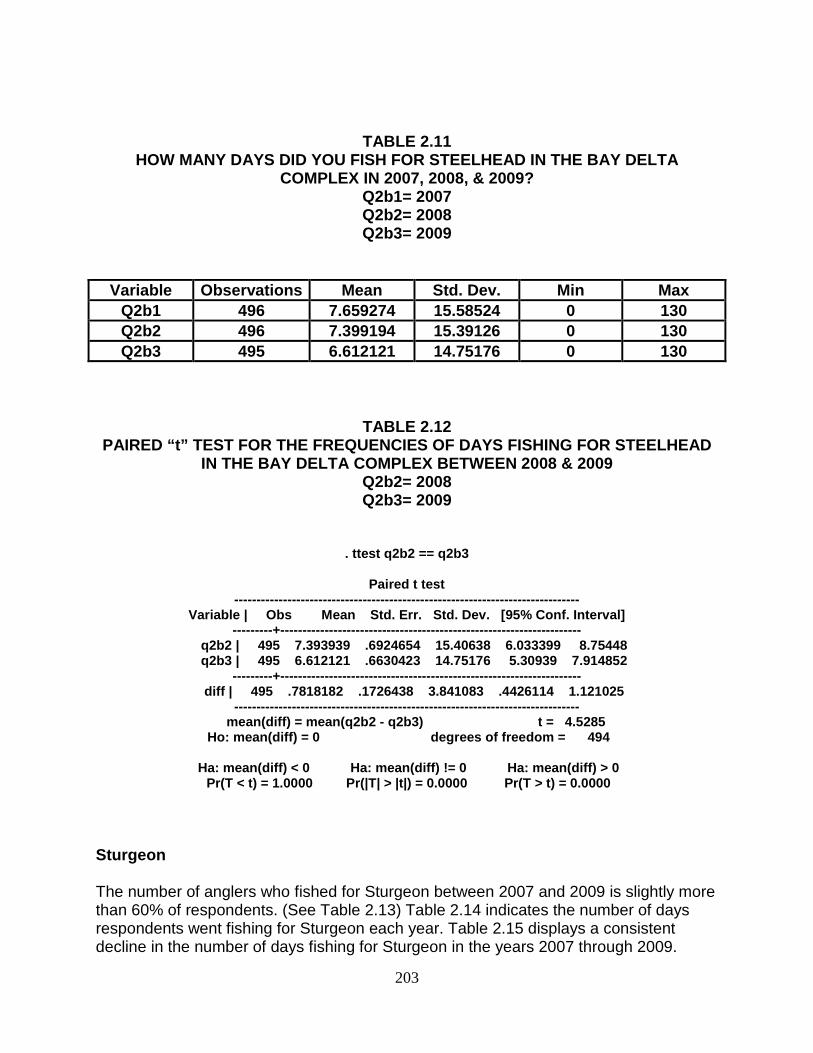
203
TABLE 2.11 HOW MANY DAYS DID YOU FISH FOR STEELHEAD IN THE BAY DELTA
COMPLEX IN 2007, 2008, & 2009? Q2b1= 2007 Q2b2= 2008 Q2b3= 2009
Variable Observations Mean Std. Dev. Min Max Q2b1 496 7.659274 15.58524 0 130 Q2b2 496 7.399194 15.39126 0 130 Q2b3 495 6.612121 14.75176 0 130
TABLE 2.12 PAIRED “t” TEST FOR THE FREQUENCIES OF DAYS FISHING FOR STEELHEAD
IN THE BAY DELTA COMPLEX BETWEEN 2008 & 2009 Q2b2= 2008 Q2b3= 2009
. ttest q2b2 == q2b3
Paired t test ------------------------------------------------------------------------------
Variable | Obs Mean Std. Err. Std. Dev. [95% Conf. Interval] ---------+--------------------------------------------------------------------
q2b2 | 495 7.393939 .6924654 15.40638 6.033399 8.75448 q2b3 | 495 6.612121 .6630423 14.75176 5.30939 7.914852
---------+-------------------------------------------------------------------- diff | 495 .7818182 .1726438 3.841083 .4426114 1.121025
------------------------------------------------------------------------------ mean(diff) = mean(q2b2 - q2b3) t = 4.5285
Ho: mean(diff) = 0 degrees of freedom = 494
Ha: mean(diff) < 0 Ha: mean(diff) != 0 Ha: mean(diff) > 0 Pr(T < t) = 1.0000 Pr(|T| > |t|) = 0.0000 Pr(T > t) = 0.0000
Sturgeon The number of anglers who fished for Sturgeon between 2007 and 2009 is slightly more than 60% of respondents. (See Table 2.13) Table 2.14 indicates the number of days respondents went fishing for Sturgeon each year. Table 2.15 displays a consistent decline in the number of days fishing for Sturgeon in the years 2007 through 2009.
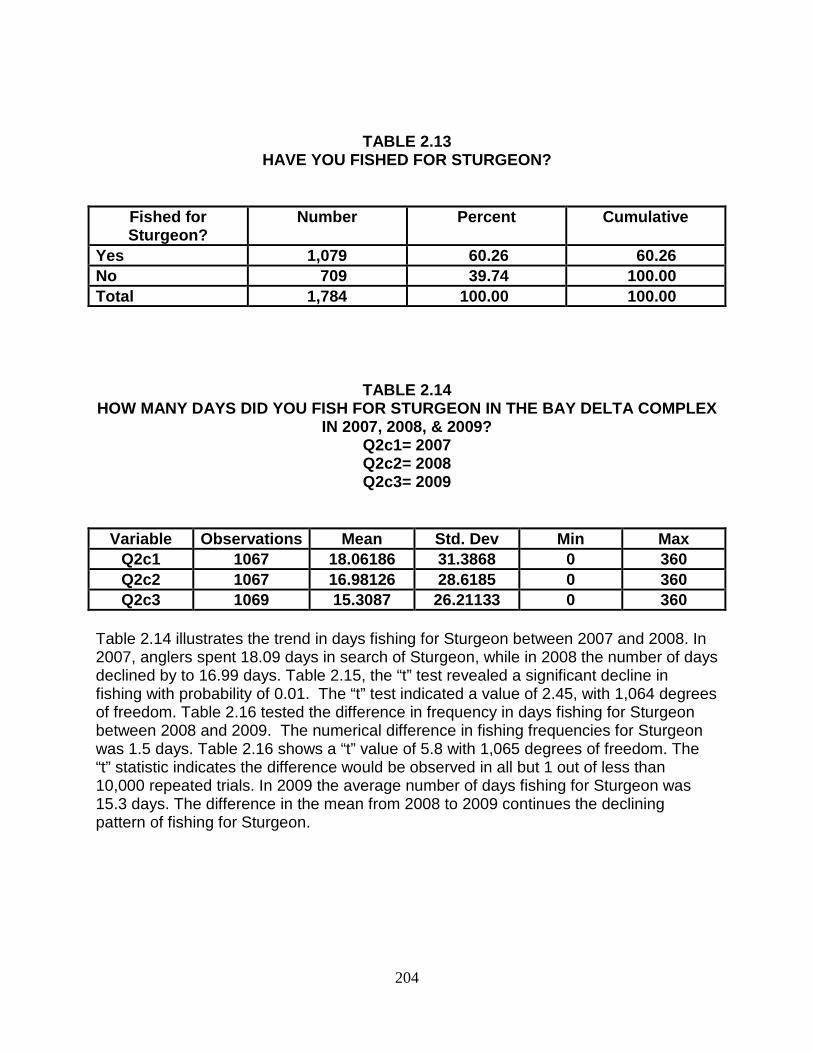
204
TABLE 2.13 HAVE YOU FISHED FOR STURGEON?
Fished for Sturgeon?
Number Percent Cumulative
Yes 1,079 60.26 60.26 No 709 39.74 100.00 Total 1,784 100.00 100.00
TABLE 2.14 HOW MANY DAYS DID YOU FISH FOR STURGEON IN THE BAY DELTA COMPLEX
IN 2007, 2008, & 2009? Q2c1= 2007 Q2c2= 2008 Q2c3= 2009
Variable Observations Mean Std. Dev Min Max Q2c1 1067 18.06186 31.3868 0 360 Q2c2 1067 16.98126 28.6185 0 360 Q2c3 1069 15.3087 26.21133 0 360
Table 2.14 illustrates the trend in days fishing for Sturgeon between 2007 and 2008. In 2007, anglers spent 18.09 days in search of Sturgeon, while in 2008 the number of days declined by to 16.99 days. Table 2.15, the “t” test revealed a significant decline in fishing with probability of 0.01. The “t” test indicated a value of 2.45, with 1,064 degrees of freedom. Table 2.16 tested the difference in frequency in days fishing for Sturgeon between 2008 and 2009. The numerical difference in fishing frequencies for Sturgeon was 1.5 days. Table 2.16 shows a “t” value of 5.8 with 1,065 degrees of freedom. The “t” statistic indicates the difference would be observed in all but 1 out of less than 10,000 repeated trials. In 2009 the average number of days fishing for Sturgeon was 15.3 days. The difference in the mean from 2008 to 2009 continues the declining pattern of fishing for Sturgeon.
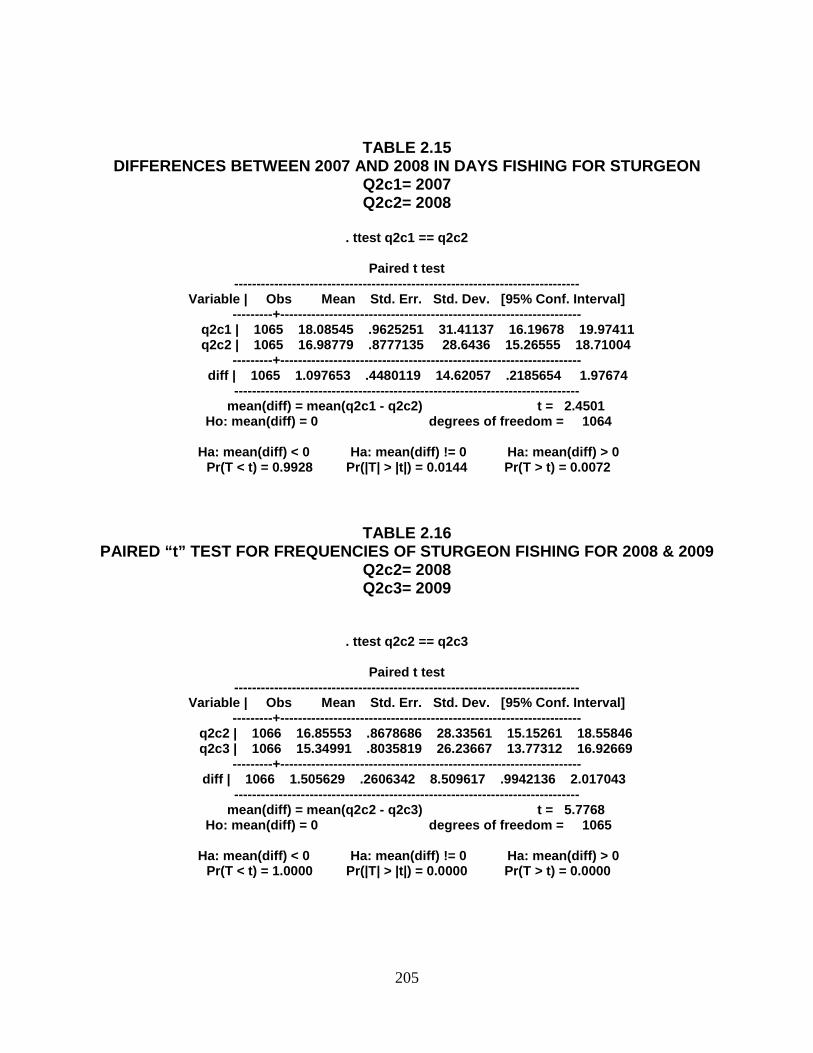
205
TABLE 2.15 DIFFERENCES BETWEEN 2007 AND 2008 IN DAYS FISHING FOR STURGEON
Q2c1= 2007 Q2c2= 2008
. ttest q2c1 == q2c2
Paired t test
------------------------------------------------------------------------------ Variable | Obs Mean Std. Err. Std. Dev. [95% Conf. Interval]
---------+-------------------------------------------------------------------- q2c1 | 1065 18.08545 .9625251 31.41137 16.19678 19.97411 q2c2 | 1065 16.98779 .8777135 28.6436 15.26555 18.71004
---------+-------------------------------------------------------------------- diff | 1065 1.097653 .4480119 14.62057 .2185654 1.97674
------------------------------------------------------------------------------ mean(diff) = mean(q2c1 - q2c2) t = 2.4501
Ho: mean(diff) = 0 degrees of freedom = 1064
Ha: mean(diff) < 0 Ha: mean(diff) != 0 Ha: mean(diff) > 0 Pr(T < t) = 0.9928 Pr(|T| > |t|) = 0.0144 Pr(T > t) = 0.0072
TABLE 2.16 PAIRED “t” TEST FOR FREQUENCIES OF STURGEON FISHING FOR 2008 & 2009
Q2c2= 2008 Q2c3= 2009
. ttest q2c2 == q2c3
Paired t test ------------------------------------------------------------------------------
Variable | Obs Mean Std. Err. Std. Dev. [95% Conf. Interval] ---------+--------------------------------------------------------------------
q2c2 | 1066 16.85553 .8678686 28.33561 15.15261 18.55846 q2c3 | 1066 15.34991 .8035819 26.23667 13.77312 16.92669
---------+-------------------------------------------------------------------- diff | 1066 1.505629 .2606342 8.509617 .9942136 2.017043
------------------------------------------------------------------------------ mean(diff) = mean(q2c2 - q2c3) t = 5.7768
Ho: mean(diff) = 0 degrees of freedom = 1065
Ha: mean(diff) < 0 Ha: mean(diff) != 0 Ha: mean(diff) > 0 Pr(T < t) = 1.0000 Pr(|T| > |t|) = 0.0000 Pr(T > t) = 0.0000
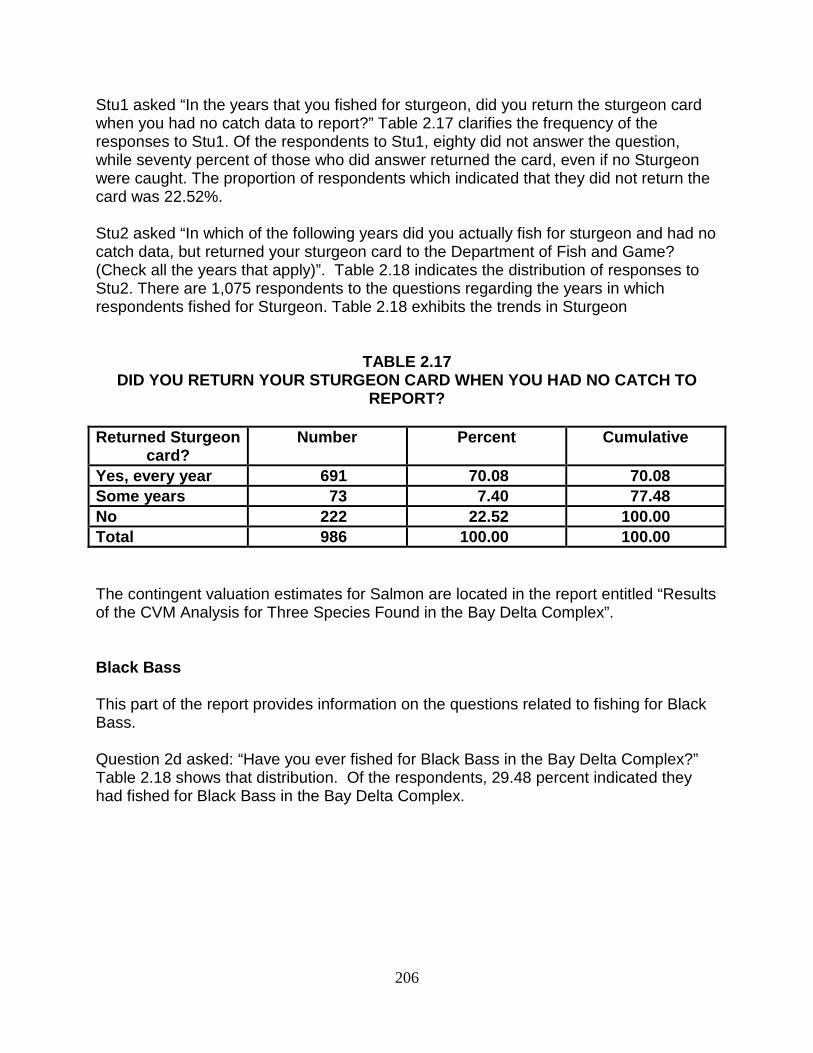
206
Stu1 asked “In the years that you fished for sturgeon, did you return the sturgeon card when you had no catch data to report?” Table 2.17 clarifies the frequency of the responses to Stu1. Of the respondents to Stu1, eighty did not answer the question, while seventy percent of those who did answer returned the card, even if no Sturgeon were caught. The proportion of respondents which indicated that they did not return the card was 22.52%. Stu2 asked “In which of the following years did you actually fish for sturgeon and had no catch data, but returned your sturgeon card to the Department of Fish and Game? (Check all the years that apply)”. Table 2.18 indicates the distribution of responses to Stu2. There are 1,075 respondents to the questions regarding the years in which respondents fished for Sturgeon. Table 2.18 exhibits the trends in Sturgeon
TABLE 2.17 DID YOU RETURN YOUR STURGEON CARD WHEN YOU HAD NO CATCH TO
REPORT?
Returned Sturgeon card?
Number Percent Cumulative
Yes, every year 691 70.08 70.08 Some years 73 7.40 77.48 No 222 22.52 100.00 Total 986 100.00 100.00
The contingent valuation estimates for Salmon are located in the report entitled “Results of the CVM Analysis for Three Species Found in the Bay Delta Complex”. Black Bass This part of the report provides information on the questions related to fishing for Black Bass. Question 2d asked: “Have you ever fished for Black Bass in the Bay Delta Complex?” Table 2.18 shows that distribution. Of the respondents, 29.48 percent indicated they had fished for Black Bass in the Bay Delta Complex.
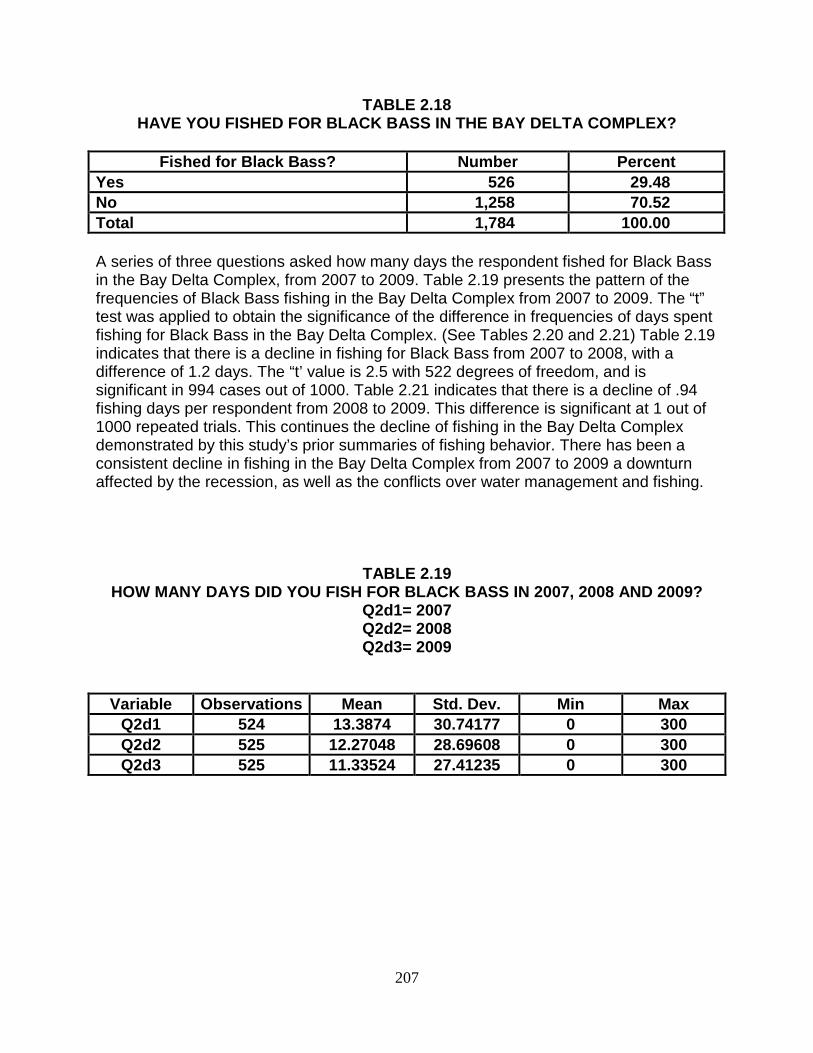
207
TABLE 2.18 HAVE YOU FISHED FOR BLACK BASS IN THE BAY DELTA COMPLEX?
Fished for Black Bass? Number Percent
Yes 526 29.48 No 1,258 70.52 Total 1,784 100.00 A series of three questions asked how many days the respondent fished for Black Bass in the Bay Delta Complex, from 2007 to 2009. Table 2.19 presents the pattern of the frequencies of Black Bass fishing in the Bay Delta Complex from 2007 to 2009. The “t” test was applied to obtain the significance of the difference in frequencies of days spent fishing for Black Bass in the Bay Delta Complex. (See Tables 2.20 and 2.21) Table 2.19 indicates that there is a decline in fishing for Black Bass from 2007 to 2008, with a difference of 1.2 days. The “t’ value is 2.5 with 522 degrees of freedom, and is significant in 994 cases out of 1000. Table 2.21 indicates that there is a decline of .94 fishing days per respondent from 2008 to 2009. This difference is significant at 1 out of 1000 repeated trials. This continues the decline of fishing in the Bay Delta Complex demonstrated by this study’s prior summaries of fishing behavior. There has been a consistent decline in fishing in the Bay Delta Complex from 2007 to 2009 a downturn affected by the recession, as well as the conflicts over water management and fishing.
TABLE 2.19
HOW MANY DAYS DID YOU FISH FOR BLACK BASS IN 2007, 2008 AND 2009? Q2d1= 2007 Q2d2= 2008 Q2d3= 2009
Variable Observations Mean Std. Dev. Min Max Q2d1 524 13.3874 30.74177 0 300 Q2d2 525 12.27048 28.69608 0 300 Q2d3 525 11.33524 27.41235 0 300
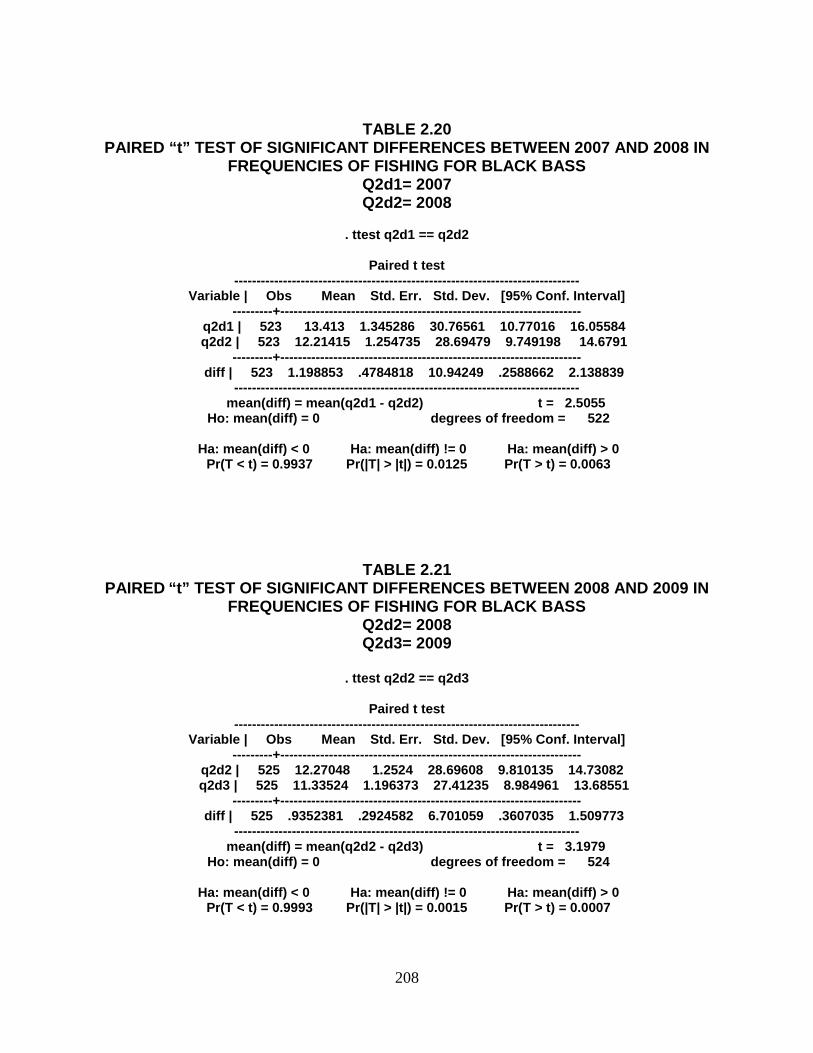
208
TABLE 2.20
PAIRED “t” TEST OF SIGNIFICANT DIFFERENCES BETWEEN 2007 AND 2008 IN FREQUENCIES OF FISHING FOR BLACK BASS
Q2d1= 2007 Q2d2= 2008
. ttest q2d1 == q2d2
Paired t test
------------------------------------------------------------------------------ Variable | Obs Mean Std. Err. Std. Dev. [95% Conf. Interval]
---------+-------------------------------------------------------------------- q2d1 | 523 13.413 1.345286 30.76561 10.77016 16.05584 q2d2 | 523 12.21415 1.254735 28.69479 9.749198 14.6791
---------+-------------------------------------------------------------------- diff | 523 1.198853 .4784818 10.94249 .2588662 2.138839
------------------------------------------------------------------------------ mean(diff) = mean(q2d1 - q2d2) t = 2.5055
Ho: mean(diff) = 0 degrees of freedom = 522
Ha: mean(diff) < 0 Ha: mean(diff) != 0 Ha: mean(diff) > 0 Pr(T < t) = 0.9937 Pr(|T| > |t|) = 0.0125 Pr(T > t) = 0.0063
TABLE 2.21 PAIRED “t” TEST OF SIGNIFICANT DIFFERENCES BETWEEN 2008 AND 2009 IN
FREQUENCIES OF FISHING FOR BLACK BASS Q2d2= 2008 Q2d3= 2009
. ttest q2d2 == q2d3
Paired t test
------------------------------------------------------------------------------ Variable | Obs Mean Std. Err. Std. Dev. [95% Conf. Interval]
---------+-------------------------------------------------------------------- q2d2 | 525 12.27048 1.2524 28.69608 9.810135 14.73082
q2d3 | 525 11.33524 1.196373 27.41235 8.984961 13.68551 ---------+--------------------------------------------------------------------
diff | 525 .9352381 .2924582 6.701059 .3607035 1.509773 ------------------------------------------------------------------------------
mean(diff) = mean(q2d2 - q2d3) t = 3.1979 Ho: mean(diff) = 0 degrees of freedom = 524
Ha: mean(diff) < 0 Ha: mean(diff) != 0 Ha: mean(diff) > 0
Pr(T < t) = 0.9993 Pr(|T| > |t|) = 0.0015 Pr(T > t) = 0.0007
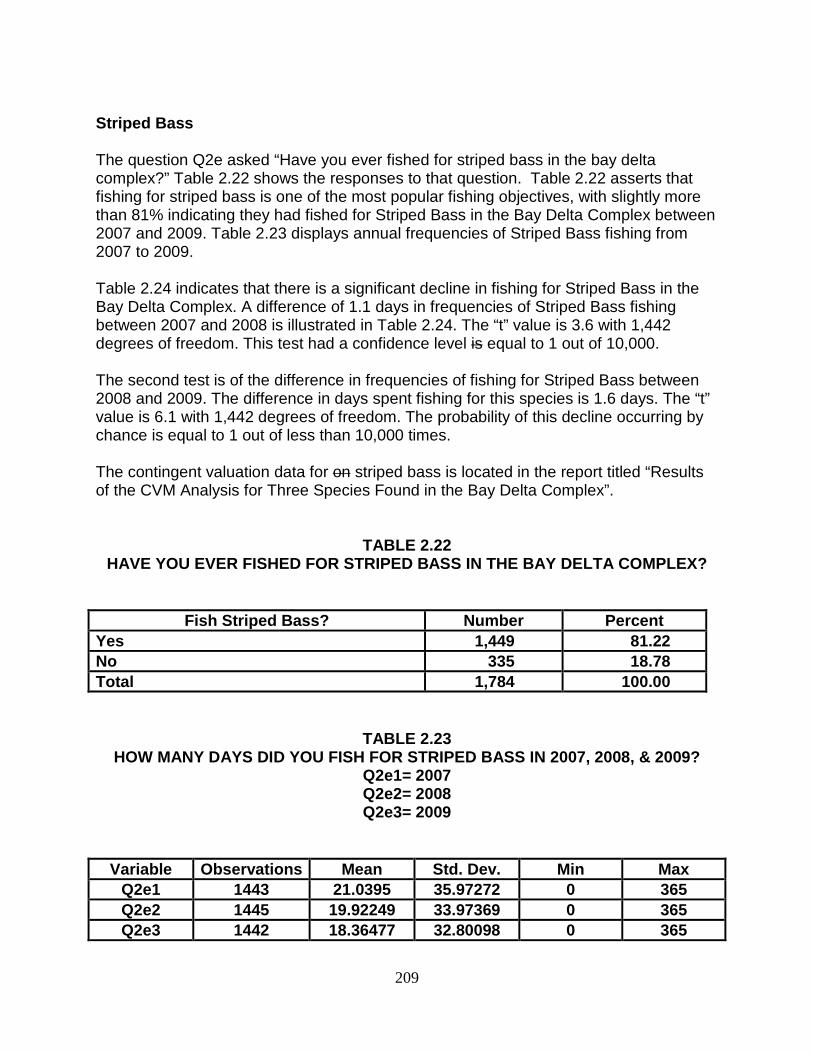
209
Striped Bass The question Q2e asked “Have you ever fished for striped bass in the bay delta complex?” Table 2.22 shows the responses to that question. Table 2.22 asserts that fishing for striped bass is one of the most popular fishing objectives, with slightly more than 81% indicating they had fished for Striped Bass in the Bay Delta Complex between 2007 and 2009. Table 2.23 displays annual frequencies of Striped Bass fishing from 2007 to 2009. Table 2.24 indicates that there is a significant decline in fishing for Striped Bass in the Bay Delta Complex. A difference of 1.1 days in frequencies of Striped Bass fishing between 2007 and 2008 is illustrated in Table 2.24. The “t” value is 3.6 with 1,442 degrees of freedom. This test had a confidence level is equal to 1 out of 10,000. The second test is of the difference in frequencies of fishing for Striped Bass between 2008 and 2009. The difference in days spent fishing for this species is 1.6 days. The “t” value is 6.1 with 1,442 degrees of freedom. The probability of this decline occurring by chance is equal to 1 out of less than 10,000 times. The contingent valuation data for on striped bass is located in the report titled “Results of the CVM Analysis for Three Species Found in the Bay Delta Complex”.
TABLE 2.22 HAVE YOU EVER FISHED FOR STRIPED BASS IN THE BAY DELTA COMPLEX?
Fish Striped Bass? Number Percent Yes 1,449 81.22 No 335 18.78 Total 1,784 100.00
TABLE 2.23 HOW MANY DAYS DID YOU FISH FOR STRIPED BASS IN 2007, 2008, & 2009?
Q2e1= 2007 Q2e2= 2008 Q2e3= 2009
Variable Observations Mean Std. Dev. Min Max Q2e1 1443 21.0395 35.97272 0 365 Q2e2 1445 19.92249 33.97369 0 365 Q2e3 1442 18.36477 32.80098 0 365
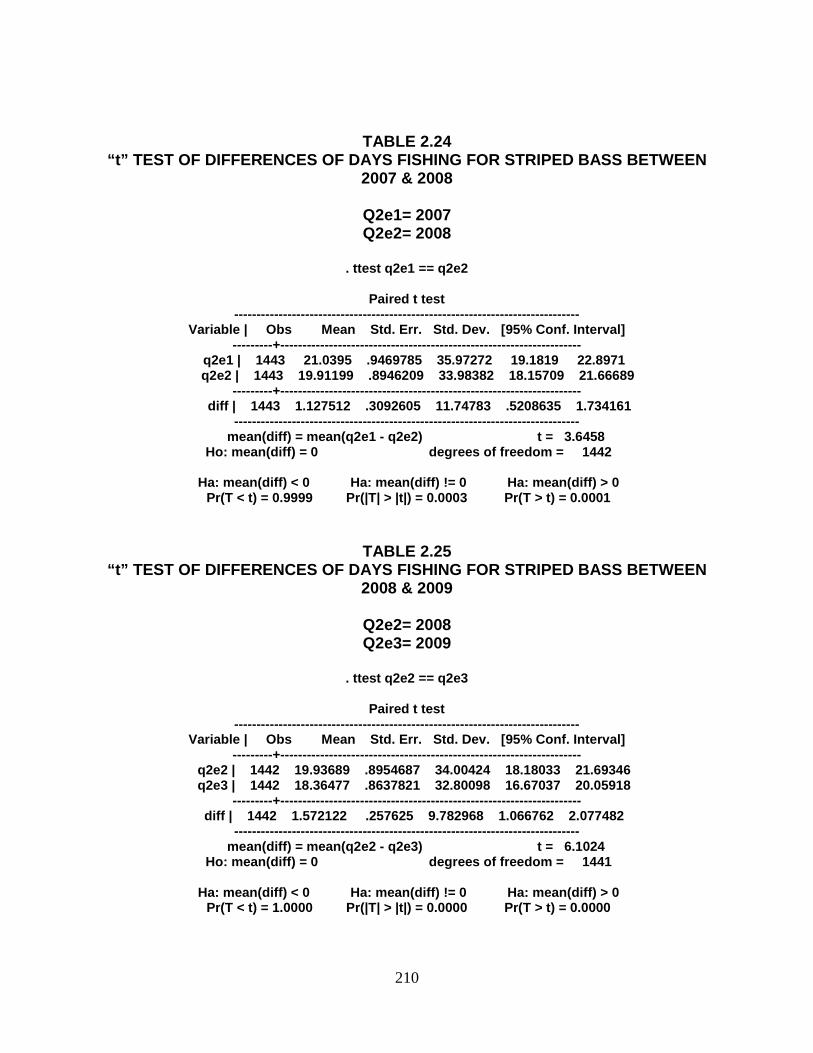
210
TABLE 2.24 “t” TEST OF DIFFERENCES OF DAYS FISHING FOR STRIPED BASS BETWEEN
2007 & 2008
Q2e1= 2007 Q2e2= 2008
. ttest q2e1 == q2e2
Paired t test
------------------------------------------------------------------------------ Variable | Obs Mean Std. Err. Std. Dev. [95% Conf. Interval]
---------+-------------------------------------------------------------------- q2e1 | 1443 21.0395 .9469785 35.97272 19.1819 22.8971
q2e2 | 1443 19.91199 .8946209 33.98382 18.15709 21.66689 ---------+--------------------------------------------------------------------
diff | 1443 1.127512 .3092605 11.74783 .5208635 1.734161 ------------------------------------------------------------------------------
mean(diff) = mean(q2e1 - q2e2) t = 3.6458 Ho: mean(diff) = 0 degrees of freedom = 1442
Ha: mean(diff) < 0 Ha: mean(diff) != 0 Ha: mean(diff) > 0
Pr(T < t) = 0.9999 Pr(|T| > |t|) = 0.0003 Pr(T > t) = 0.0001
TABLE 2.25 “t” TEST OF DIFFERENCES OF DAYS FISHING FOR STRIPED BASS BETWEEN
2008 & 2009
Q2e2= 2008 Q2e3= 2009
. ttest q2e2 == q2e3
Paired t test
------------------------------------------------------------------------------ Variable | Obs Mean Std. Err. Std. Dev. [95% Conf. Interval]
---------+-------------------------------------------------------------------- q2e2 | 1442 19.93689 .8954687 34.00424 18.18033 21.69346 q2e3 | 1442 18.36477 .8637821 32.80098 16.67037 20.05918
---------+-------------------------------------------------------------------- diff | 1442 1.572122 .257625 9.782968 1.066762 2.077482
------------------------------------------------------------------------------ mean(diff) = mean(q2e2 - q2e3) t = 6.1024
Ho: mean(diff) = 0 degrees of freedom = 1441
Ha: mean(diff) < 0 Ha: mean(diff) != 0 Ha: mean(diff) > 0 Pr(T < t) = 1.0000 Pr(|T| > |t|) = 0.0000 Pr(T > t) = 0.0000
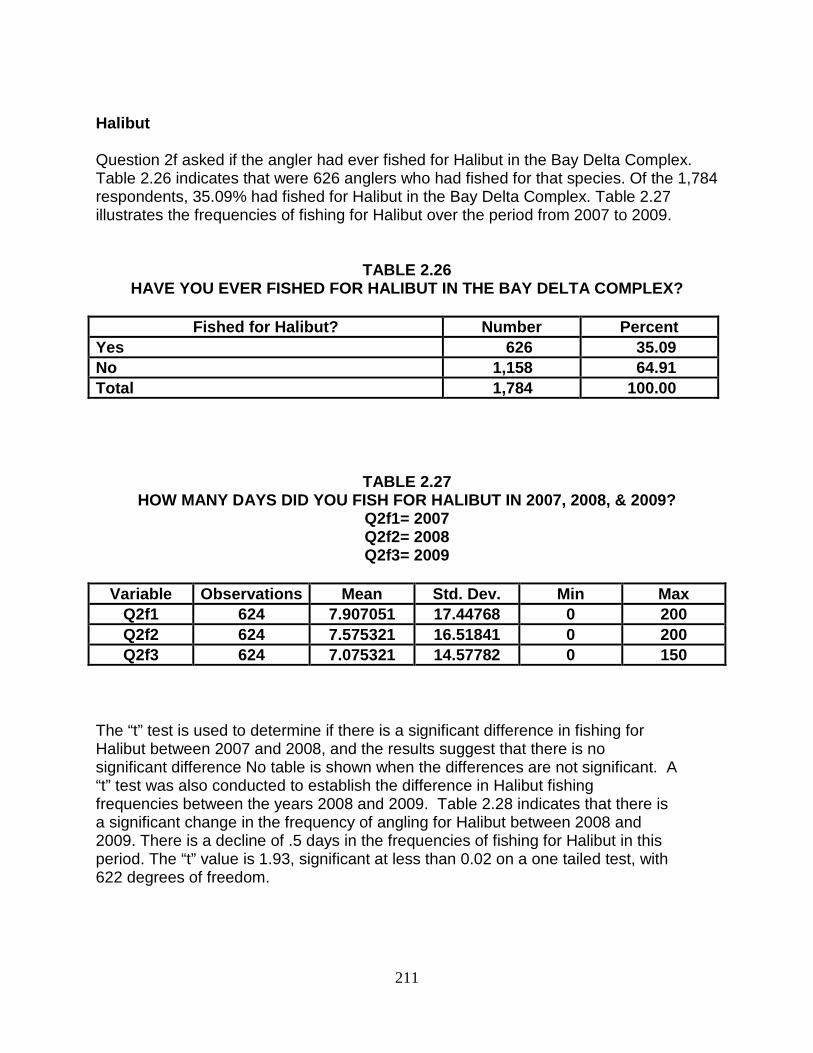
211
Halibut Question 2f asked if the angler had ever fished for Halibut in the Bay Delta Complex. Table 2.26 indicates that were 626 anglers who had fished for that species. Of the 1,784 respondents, 35.09% had fished for Halibut in the Bay Delta Complex. Table 2.27 illustrates the frequencies of fishing for Halibut over the period from 2007 to 2009.
TABLE 2.26 HAVE YOU EVER FISHED FOR HALIBUT IN THE BAY DELTA COMPLEX?
Fished for Halibut? Number Percent
Yes 626 35.09 No 1,158 64.91 Total 1,784 100.00
TABLE 2.27 HOW MANY DAYS DID YOU FISH FOR HALIBUT IN 2007, 2008, & 2009?
Q2f1= 2007 Q2f2= 2008 Q2f3= 2009
Variable Observations Mean Std. Dev. Min Max
Q2f1 624 7.907051 17.44768 0 200 Q2f2 624 7.575321 16.51841 0 200 Q2f3 624 7.075321 14.57782 0 150
The “t” test is used to determine if there is a significant difference in fishing for Halibut between 2007 and 2008, and the results suggest that there is no significant difference No table is shown when the differences are not significant. A “t” test was also conducted to establish the difference in Halibut fishing frequencies between the years 2008 and 2009. Table 2.28 indicates that there is a significant change in the frequency of angling for Halibut between 2008 and 2009. There is a decline of .5 days in the frequencies of fishing for Halibut in this period. The “t” value is 1.93, significant at less than 0.02 on a one tailed test, with 622 degrees of freedom.
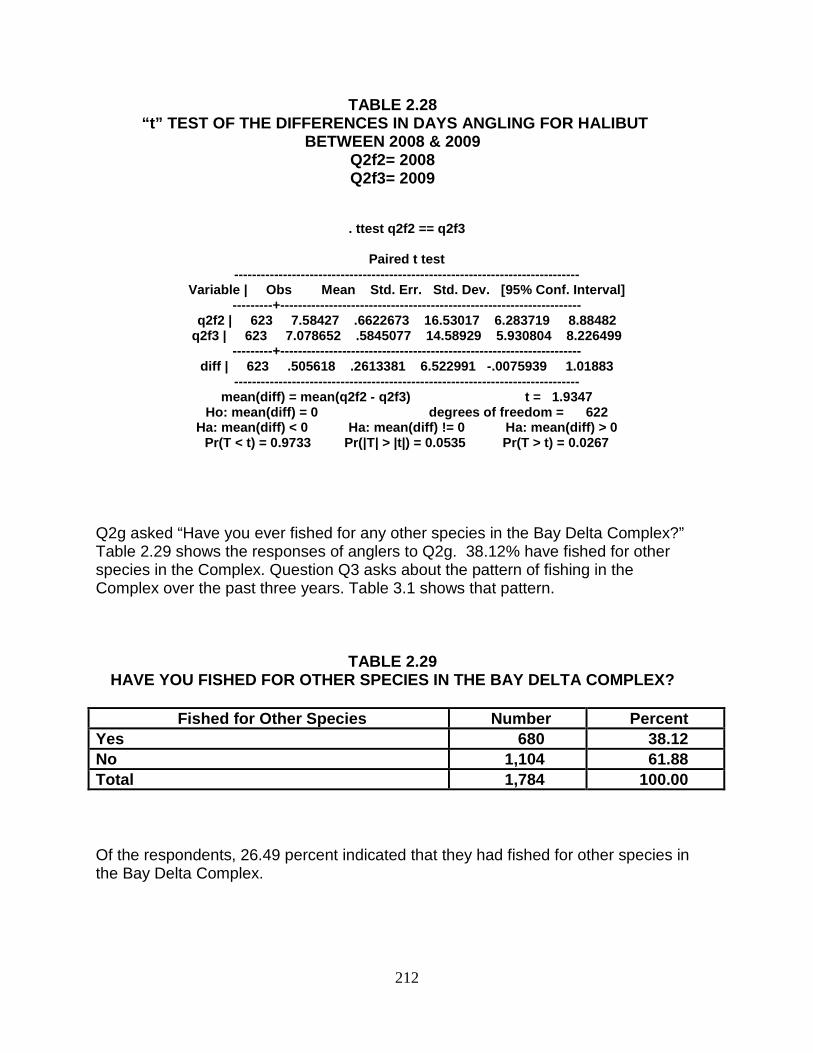
212
TABLE 2.28 “t” TEST OF THE DIFFERENCES IN DAYS ANGLING FOR HALIBUT
BETWEEN 2008 & 2009 Q2f2= 2008 Q2f3= 2009
. ttest q2f2 == q2f3
Paired t test ------------------------------------------------------------------------------
Variable | Obs Mean Std. Err. Std. Dev. [95% Conf. Interval] ---------+--------------------------------------------------------------------
q2f2 | 623 7.58427 .6622673 16.53017 6.283719 8.88482 q2f3 | 623 7.078652 .5845077 14.58929 5.930804 8.226499
---------+-------------------------------------------------------------------- diff | 623 .505618 .2613381 6.522991 -.0075939 1.01883
------------------------------------------------------------------------------ mean(diff) = mean(q2f2 - q2f3) t = 1.9347
Ho: mean(diff) = 0 degrees of freedom = 622 Ha: mean(diff) < 0 Ha: mean(diff) != 0 Ha: mean(diff) > 0
Pr(T < t) = 0.9733 Pr(|T| > |t|) = 0.0535 Pr(T > t) = 0.0267
Q2g asked “Have you ever fished for any other species in the Bay Delta Complex?” Table 2.29 shows the responses of anglers to Q2g. 38.12% have fished for other species in the Complex. Question Q3 asks about the pattern of fishing in the Complex over the past three years. Table 3.1 shows that pattern.
TABLE 2.29 HAVE YOU FISHED FOR OTHER SPECIES IN THE BAY DELTA COMPLEX?
Fished for Other Species Number Percent
Yes 680 38.12 No 1,104 61.88 Total 1,784 100.00
Of the respondents, 26.49 percent indicated that they had fished for other species in the Bay Delta Complex.
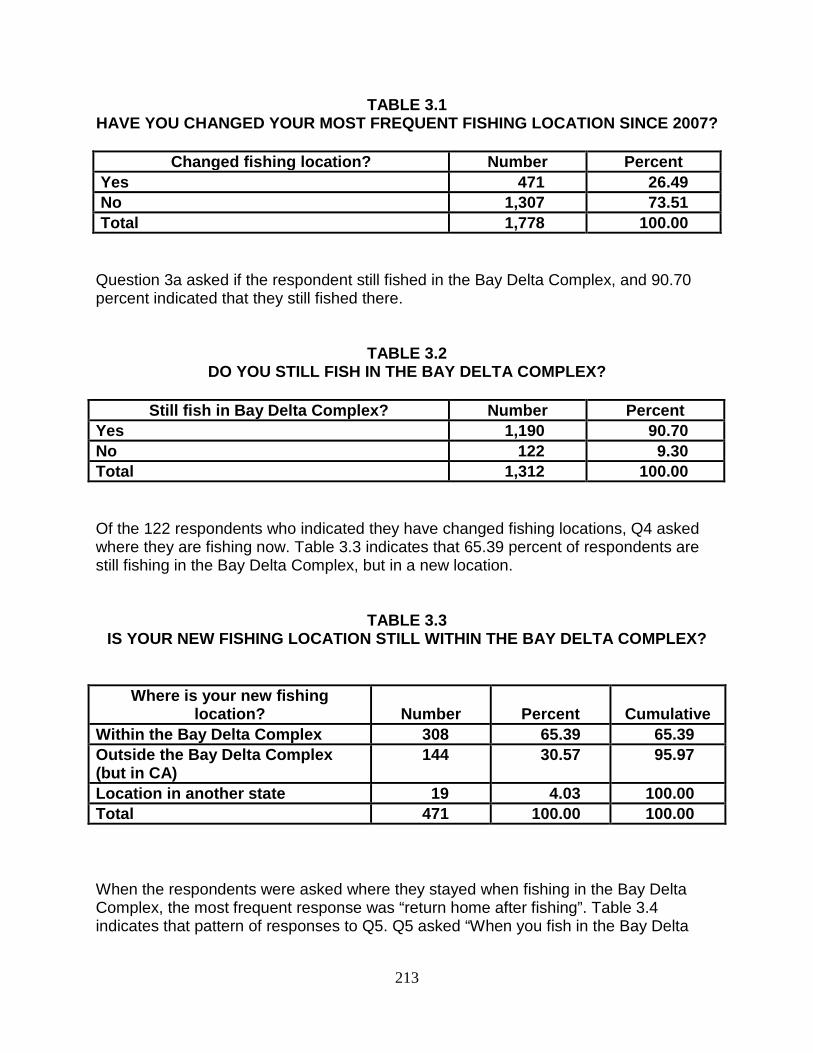
213
TABLE 3.1 HAVE YOU CHANGED YOUR MOST FREQUENT FISHING LOCATION SINCE 2007?
Changed fishing location? Number Percent
Yes 471 26.49 No 1,307 73.51 Total 1,778 100.00
Question 3a asked if the respondent still fished in the Bay Delta Complex, and 90.70 percent indicated that they still fished there.
TABLE 3.2 DO YOU STILL FISH IN THE BAY DELTA COMPLEX?
Still fish in Bay Delta Complex? Number Percent
Yes 1,190 90.70 No 122 9.30 Total 1,312 100.00
Of the 122 respondents who indicated they have changed fishing locations, Q4 asked where they are fishing now. Table 3.3 indicates that 65.39 percent of respondents are still fishing in the Bay Delta Complex, but in a new location.
TABLE 3.3 IS YOUR NEW FISHING LOCATION STILL WITHIN THE BAY DELTA COMPLEX?
Where is your new fishing location?
Number
Percent
Cumulative
Within the Bay Delta Complex 308 65.39 65.39 Outside the Bay Delta Complex (but in CA)
144 30.57 95.97
Location in another state 19 4.03 100.00 Total 471 100.00 100.00
When the respondents were asked where they stayed when fishing in the Bay Delta Complex, the most frequent response was “return home after fishing”. Table 3.4 indicates that pattern of responses to Q5. Q5 asked “When you fish in the Bay Delta
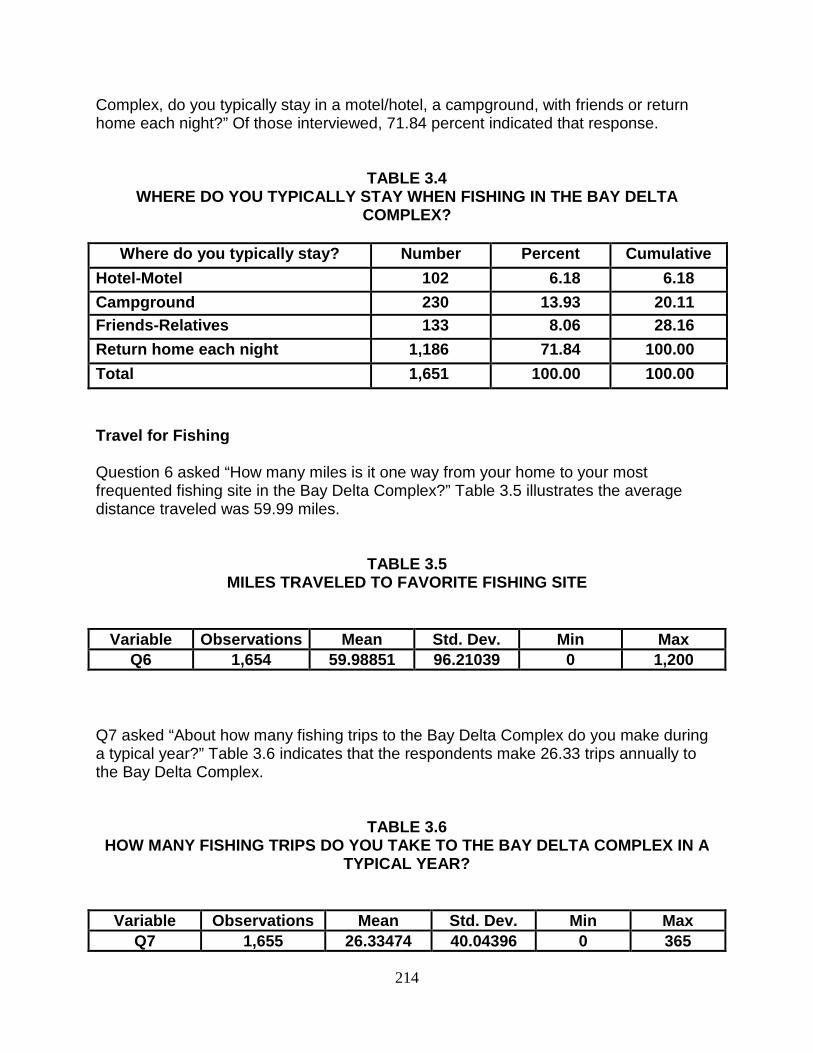
214
Complex, do you typically stay in a motel/hotel, a campground, with friends or return home each night?” Of those interviewed, 71.84 percent indicated that response.
TABLE 3.4
WHERE DO YOU TYPICALLY STAY WHEN FISHING IN THE BAY DELTA COMPLEX?
Where do you typically stay? Number Percent Cumulative
Hotel-Motel 102 6.18 6.18 Campground 230 13.93 20.11 Friends-Relatives 133 8.06 28.16 Return home each night 1,186 71.84 100.00 Total 1,651 100.00 100.00 Travel for Fishing Question 6 asked “How many miles is it one way from your home to your most frequented fishing site in the Bay Delta Complex?” Table 3.5 illustrates the average distance traveled was 59.99 miles.
TABLE 3.5 MILES TRAVELED TO FAVORITE FISHING SITE
Variable Observations Mean Std. Dev. Min Max Q6 1,654 59.98851 96.21039 0 1,200
Q7 asked “About how many fishing trips to the Bay Delta Complex do you make during a typical year?” Table 3.6 indicates that the respondents make 26.33 trips annually to the Bay Delta Complex.
TABLE 3.6 HOW MANY FISHING TRIPS DO YOU TAKE TO THE BAY DELTA COMPLEX IN A
TYPICAL YEAR?
Variable Observations Mean Std. Dev. Min Max Q7 1,655 26.33474 40.04396 0 365
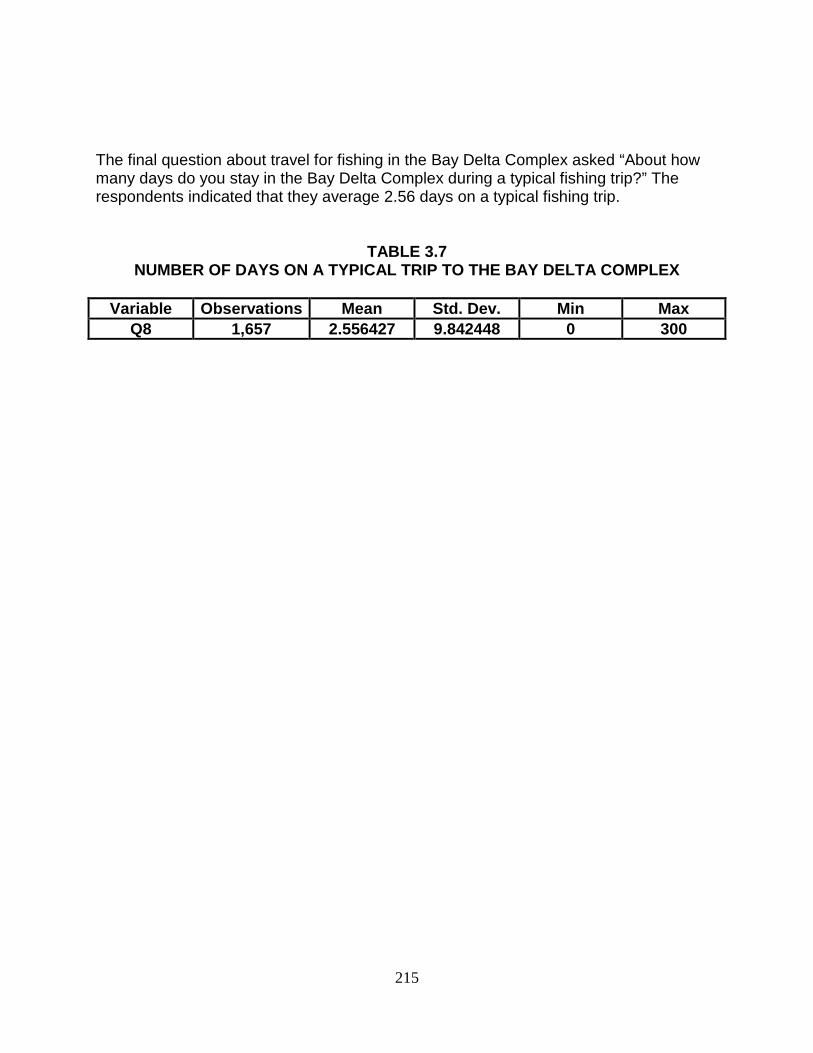
215
The final question about travel for fishing in the Bay Delta Complex asked “About how many days do you stay in the Bay Delta Complex during a typical fishing trip?” The respondents indicated that they average 2.56 days on a typical fishing trip.
TABLE 3.7 NUMBER OF DAYS ON A TYPICAL TRIP TO THE BAY DELTA COMPLEX
Variable Observations Mean Std. Dev. Min Max
Q8 1,657 2.556427 9.842448 0 300
216
APPENDIX A
California Department of Fish and Game Angler Survey
User Name ________ Password _________ Caseid. (Enter respondent’s telephone number) __________________ Intro1. Hello my name is _____________________and I'm calling regarding a research project funded by the California Department of Fish and Game. Can you hear me ok? The purpose of the study is to help the Department understand the economic impact of sport fishing in the Bay Delta Complex of Northern California, which includes the Bay Delta, the San Joaquin River, the north and south parts of the San Francisco Estuary, San Pablo Bay, and the Sacramento River. May I speak with ________________?
1 Yes (This is the correct person.)(Skip to Intro3) 2 Yes (Correct person comes to the phone.) (Go to Intro2) 3 No (Person is not available at this time.) (Go to Callback1) 4 No (No such person at this number.) (Skip to Last2) 5 Refused to answer (Go to Probe1)
Callback1. What would be a good day and time to call back for a short interview? (skip to Last2) Intro2. My name is _____________________and I'm calling regarding a research project funded by the California Department of Fish and Game. Can you hear me ok? The purpose of the study is to help the Department understand the economic impact of sport fishing in the Bay Delta Complex of Northern California, which includes the Bay Delta, the San Joaquin River, the north and south parts of the San Francisco Estuary, San Pablo Bay, and the Sacramento River. Let's start by verifying the species for which you currently fish or for which you have fished during the past three years in the Bay Delta Complex.
1 Yes, now is a good time (skip to Q1) 2 No, now is not a good time (go to Callback2) 3 Refused to answer (Go to Probe1)
217
Intro3. As you may recall, we spoke with you a few weeks ago about participating in the angler survey that will assist with the economic evaluation of the fisheries in the Bay Delta Complex of Northern California, which includes the Bay Delta, the San Joaquin River, the north and south parts of the San Francisco Estuary, San Pablo Bay, and the Sacramento River. I'd like to begin by verifying the species for which you currently fish or for which you have fished in the Bay Delta complex during the past three years.
1 Yes (Go to Q1) 2 No, now is not a good time (go to Callback2) 3 Refused to answer (Go to Probe1)
Callback2. What would be a good day and time to call you back for a short interview? _____________________ Probe1. We really need your views and would like to ask you a few questions about your fishing activities. Your answers will remain anonymous and will be combined with responses from other anglers to be reported as averages. The responses you give are very important to ensure a scientific study of the economic impact of sport fishing in California.
1 Yes (Go to Q1) 2 No, now is not a good time (Go to Callback2) 3 Refused to answer (Skip to Last2)
Q1. Approximately how many years have you fished in the Bay Delta Complex of Northern California? (If less than one, enter 1.) _____________ Q1a. Have you fished in the Bay Delta Complex since January 1st, 2007?
1 Yes (skip to Q1d) 2 No (Go to Q1b) 3 Don’t Remember (skip to Last) 4 Refused to answer (Go to Last2)
218
Q1b. Why do you no longer fish in the Bay Delta Complex? I will read some responses that other anglers have given.
1. I no longer fish anywhere (Go to Q1c) 2. Due to economic conditions, I fish closer to home (Skip to Dem1) 3. Decrease in supply of targeted fish in Bay Delta Complex (Skip to Dem1) 4. Environmental damage and pollution in the Bay Delta Complex (Skip to Dem1) 5. Other reason (specify) (Skip to Dem1) 6. Don’t know (Skip to Dem1) 7. Refused to answer (skip to Dem1)
Q1c. Why do you no longer fish? Which of the following statements best describes your reason or reasons for no longer fishing? (Check all that apply.)
1. Physical conditions due to health and/or aging make it difficult to fish (skip to Dem1) 2. I work long hours leaving insufficient time for fishing (skip to Dem1) 3. Increased regulations discourage me from fishing (skip to Dem1) 4. I can no longer afford to fish (skip to Dem1) 5. There are not enough fish to make fishing worthwhile (skip to Dem1) 6. Increases in the cost of fishing licenses (skip to Dem1) 7. Increased overall cost for fishing (skip to Dem1) 8. Other reason (specify) (skip to Dem1) 9. Don’t know (skip to Dem1) 10. Refused to answer (skip to Dem1)
Q1d. About how many days did you fish in the Bay Delta Complex in 2007? _______________ Q1d1. About how many nights did you spend away from home while on a fishing trip to the Bay Delta Complex during 2007? _______________ Q1e. About how many days did you fish in the Bay Delta Complex in 2008? _______________
219
Q1e1. Approximately how many nights did you spend away from home while on a fishing trip to the Bay Delta Complex during 2008? _______________ Q1f. And, about how many days did you fish in the Bay Delta Complex in 2009? _______________ Q1f1. About how many nights did you spend away from home while on a fishing trip to the Bay Delta Complex during 2009? _______________ Please tell me if you have ever fished for each of the following species in the Bay Delta Complex. Q2a. Salmon? 1. Yes (Go to Q2a1) 2. No (skip to Q2b) How many days did you fish for salmon in the Bay Delta Complex in: Q2a1. 2007? _________ Q2a2. What about 2008? _________ Q2a3. And, how many days did you fish for salmon in the Bay Delta in 2009? _________ Sam1. Before salmon fishing was restricted three years ago in the Bay Delta Complex, was salmon the specie for which you fished most frequently?
1. Yes (Go to Sam2) 2. No (skip to CVM1) 3. Don’t know (skip to CVM1) 4. Refused to answer (skip to CVM1)
220
Sam2. With the restrictions on salmon fishing during the past three years, did you fish for any other species as a substitute or in place of salmon?
1. Yes (Go to Sam3) 2. No (skip to CVM1) 3. Don’t know (skip to CVM1) 4. Refused to answer (skip to CVM1)
Sam3. Which of the following species did you substitute for salmon? (Check all that apply.)
1. Steelhead 2. Sturgeon 3. Black Bass 4. Striped Bass 5. Halibut 6. Other (specify)
CVM1. The current catch limit on Chinook Salmon is two fish in waters where Chinook Salmon fishing is permitted. If the Chinook Salmon fishery could be managed so that the catch limit could be increased to three fish, about how many additional days would you spend fishing for Chinook Salmon in the Bay Delta Complex each year? __________ CVM1a. Many of the waters in the Bay Delta Complex are currently closed to Chinook Salmon fishing. The current season for those waters that are open to Chinook fishing is October 9th through October 30th. If Chinook Salmon could be managed so that the season could be increased by 15 days, about how many days per year would you spend fishing for Chinook Salmon in the Bay Delta Complex? __________ Q2b. Have you ever fished for Steelhead in the Bay Delta Complex?
1. Yes (Go to Q2b1) 2. No (skip to Q2c)
How many days did you fish for Steelhead in the Bay Delta Complex in: Q2b1. 2007? __________ Q2b2. What about 2008? __________
221
Q2b3. And, how many days did you fish for Steelhead in the Bay Delta Complex during 2009? __________ Q2c. Have you ever fished for Sturgeon in the Bay Delta Complex?
1. Yes (go to Q2c1) 2. No (skip to Q2d)
How many days did you fish for Sturgeon in the Bay Delta Complex in: Q2c1. 2007? __________ Q2c2. How about in 2008? __________ Q2c3. And, how many days in 2009? __________ Stur1. In the years that you fished for sturgeon, did you return your sturgeon card when you had no catch data to report?
1. Yes, every year that I fished 2. Yes, some of the years that I fished 3. No 4. Don’t know 5. Refused to answer
Stur2. In which of the following years did you actually fish for Sturgeon and had no catch data, but returned your sturgeon card to the Department of Fish and Game? (Check all the years that apply.)
1. 2007 2. 2008 3. 2009 4. None of these 5. Don’t recall 6. Refused to answer
222
The following questions relate to fishing for White Sturgeon in the Bay Delta Complex. CVM2. The size limit for white sturgeon is 46 to 66 inches long and the bag limit is currently 3 fish per year. Downstream of their Sacramento River spawning grounds, the fishing season for white sturgeon is year-round. If the white sturgeon fishery could be managed so that the downstream season is February through October with the same size limit of 46 to 66 inches, and the bag limit is increased to 6 fish per year, about how many additional days would you fish for white sturgeon in the Bay Delta Complex each year? __________ CVM2a. The size limit for white sturgeon is 46-66 inches and the bag limit is currently 3 fish year. If the white sturgeon fishery could be managed so that the size limit is changed to 36 to 66 inches and the bag limit remains at 3 fish per year, about how many additional days would you fish for white sturgeon in the Bay Delta Complex each year? __________ Q2d. Have you ever fished for Black Bass in the Bay Delta Complex?
1. Yes (Go to Q2d1) 2. No (skip to Q2e)
Q2d1. How many days did you fish for Black Bass in the Bay Delta complex in 2007? __________ Q2d2. What about in 2008? __________ Q2d3. And, how many days did you fish for Black Bass in the Bay Delta in 2009? __________ Q2e. Have you ever fished for striped bass in the Bay Delta Complex?
1. Yes (go to Q2e1) 2. No (Skip to Q2f)
Q2e1. About how many days did you fish for Striped Bass in the Bay Delta Complex during 2007?
223
__________ Q2e2. About how many days did you fish for Striped Bass in 2008? __________ Q2e3. And, about how many days did you fish for Striped Bass in the Bay Delta Complex in 2009? __________ The following questions relate to fishing for striped bass in the Bay Delta Complex. CVM3. Striped bass have declined such that on average it now takes about 100 hours of fishing to catch 8 fish greater than 18 inches long. If the striped bass fishery in the Bay Delta Complex could be managed so that 15 fish greater than 18 inches long could be caught in 100 hours, about how many additional days would you fish for striped bass in the Bay Delta Complex each year? CVM3a. Only about 1 percent of striped bass are longer than 32 inches. If the striped bass fishery in the Bay Delta Complex could be managed so that 12 percent of the striped bass would be greater than 32 inches long, about how many additional days would you fish for striped bass in the Bay Delta Complex each year? Q2f. Have you ever fished for Halibut in the Bay Delta Complex?
1. Yes (go to Q2f1) 2. No(skip to Q2g)
Q2f1. About how many days did you fish for Halibut in the Bay Delta Complex during 2007? __________ Q2f2. About how many days did you fish for Halibut in the Bay Delta in 2008? __________ Q2f3. And, about how many days did you fish for Halibut in the Bay Delta Complex in 2009? __________
224
Q2g. Have you ever fished for any other species in the Bay Delta Complex?
1. Yes 2. No
Q3. During the past three years (2007 through 2009), have you changed the location where you most frequently fish?
1. Yes (go to Q4) 2. No (skip to Q3a) 3. Don’t know (skip to Q3a) 4. Refused to answer (skip to Q3a)
Q3a. Do you still fish in the Bay Delta Complex?
1. Yes 2. No 3. Don’t know 4. Refused to answer
Q4. Was this change in fishing location (choose only one):
1. Within the Bay Delta Complex 2. Outside the Bay Delta Complex, but in California 3. To a location in another state 4. Refused to answer
Q5. When you fish in the Bay Delta Complex, do you typically stay in a hotel/motel, a campground, with friends and relatives or return to your home each night?
1. Hotel/Motel 2. Campground 3. Friends and/or relatives 4. Return home each night 5. Don’t know 6. Refused to answer
Q6. About how many miles is it one way from your home to your most frequented fishing site in the Bay Delta Complex? ___________ Q7. About how many fishing trips to the Bay Delta Complex do you make during a typical year? __________
225
Q8. About how many days do you stay in the Bay Delta complex during a typical fishing trip? __________ Q9. We are attempting to estimate expenditures made by anglers in the Bay Delta Complex during their fishing trips. In order to do this, we need to mail you a list of expenditure categories and a map of the Bay Delta Complex. We will ask you to estimate your expenditures in each category, then we will call you back to ask your expenditure information. Would you be willing to help us with this short follow-up survey?
1. Yes (go to Q9a) 2. No (skip to Dem1)
Q9a. What is the best telephone number for us to call to collect your expenditure information? ___________________________ Interviewers Note: Please enter the telephone number in this format: 530-545-1234. Q9b. To what name and address should we mail the expenditure form and Bay Delta Complex map? Q9c. What is the best day and time for us to call you to collect your expenditure estimates? These last few questions are for classification purposes only. Your answers will remain anonymous and will be combined with those of other survey respondents to be reported as averages. Dem1. In what county do you currently live? __________ Interviewers Note: Use the list provided to correctly spell the name of each county. Be sure to use upper and lower case letters in the spelling. Dem2. In what year were you born? ________
226
Dem3. What is the zip code for your residence where you leave to go fishing? ________ Dem4. Please tell me which one of the following categories best describes your current employment status?
1. Employed full time 2. Employed part-time 3. Currently unemployed and searching for work 4. Disabled 5. Retired 6. Homemaker not working outside the home 7. Full time student not working 8. Other 9. Don’t know 10. Refused to answer
Dem5. With which of the following racial or ethnic categories do you most closely identify? (Check more than one if the respondent selects multiples.)
1. African American 2. Asian American 3. Hispanic/Latino 4. Native American 5. White 6. Other (specify) 7. Don’t know 8. Refused to answer
Dem6. Which of the following best describes the highest level of formal education you have completed?
1. Less than a high school education 2. High school graduate 3. Some college, trade or business school 4. Community college graduate with an AA 5. 4 year college graduate 6. Graduate or professional degree 7. Don’t know 8. Refused to answer
227
Dem7. Finally, I'd like an approximate idea of the total amount of annual income in your household -- that is the total income before taxes are paid of all related persons age 15 and older living there. Please stop me when I read the appropriate category.
1. Less than $15,000 2. $15,000 to $39,999 3. $40,000 to $99,999 4. $100,000 or more 5. Don’t know 6. Refused to answer
Last. Thank you very much for your help with the survey. The information that you provided will help us estimate the economic contribution of the Bay Delta Complex fisheries to the California economy. Have a nice day/evening. Last2. Thank you for your help. Have a nice day/evening. Dem8. INTERVIEWER -- Code the gender of the respondent.
1. Male 2. Female 3. Unsure
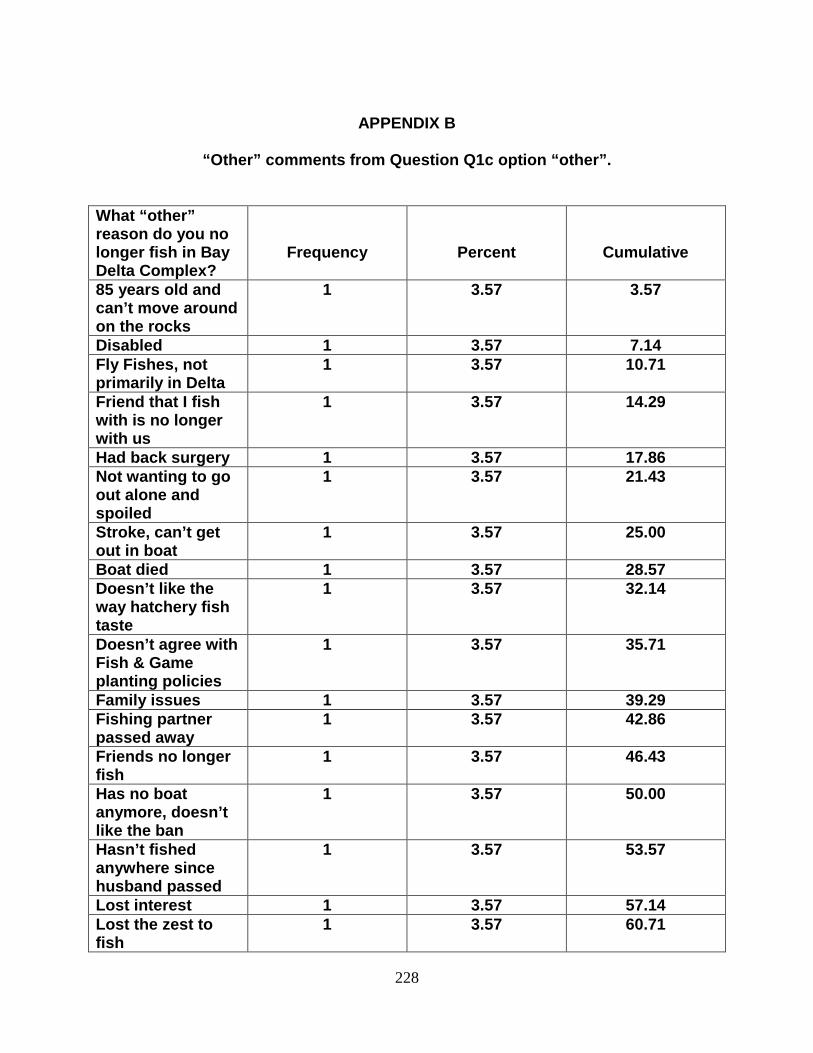
228
APPENDIX B
“Other” comments from Question Q1c option “other”.
What “other” reason do you no longer fish in Bay Delta Complex?
Frequency
Percent
Cumulative
85 years old and can’t move around on the rocks
1 3.57 3.57
Disabled 1 3.57 7.14 Fly Fishes, not primarily in Delta
1 3.57 10.71
Friend that I fish with is no longer with us
1 3.57 14.29
Had back surgery 1 3.57 17.86 Not wanting to go out alone and spoiled
1 3.57 21.43
Stroke, can’t get out in boat
1 3.57 25.00
Boat died 1 3.57 28.57 Doesn’t like the way hatchery fish taste
1 3.57 32.14
Doesn’t agree with Fish & Game planting policies
1 3.57 35.71
Family issues 1 3.57 39.29 Fishing partner passed away
1 3.57 42.86
Friends no longer fish
1 3.57 46.43
Has no boat anymore, doesn’t like the ban
1 3.57 50.00
Hasn’t fished anywhere since husband passed
1 3.57 53.57
Lost interest 1 3.57 57.14 Lost the zest to fish
1 3.57 60.71
229
No boat 2 7.14 67.86 No boyfriend 1 3.57 71.43 Prefers waters of High lakes and American
1 3.57 75.00
Sold boat 1 3.57 78.57 Stroke, doesn’t fish anymore
1 3.57 82.14
Too far away 1 3.57 85.71 Used to catch a lot of Stripers
1 3.57 89.29
Wife has cancer 1 3.57 92.86 Wife is ill 1 3.57 96.43 Wife just died 1 3.57 100.00 Total 28 100.00 100.00
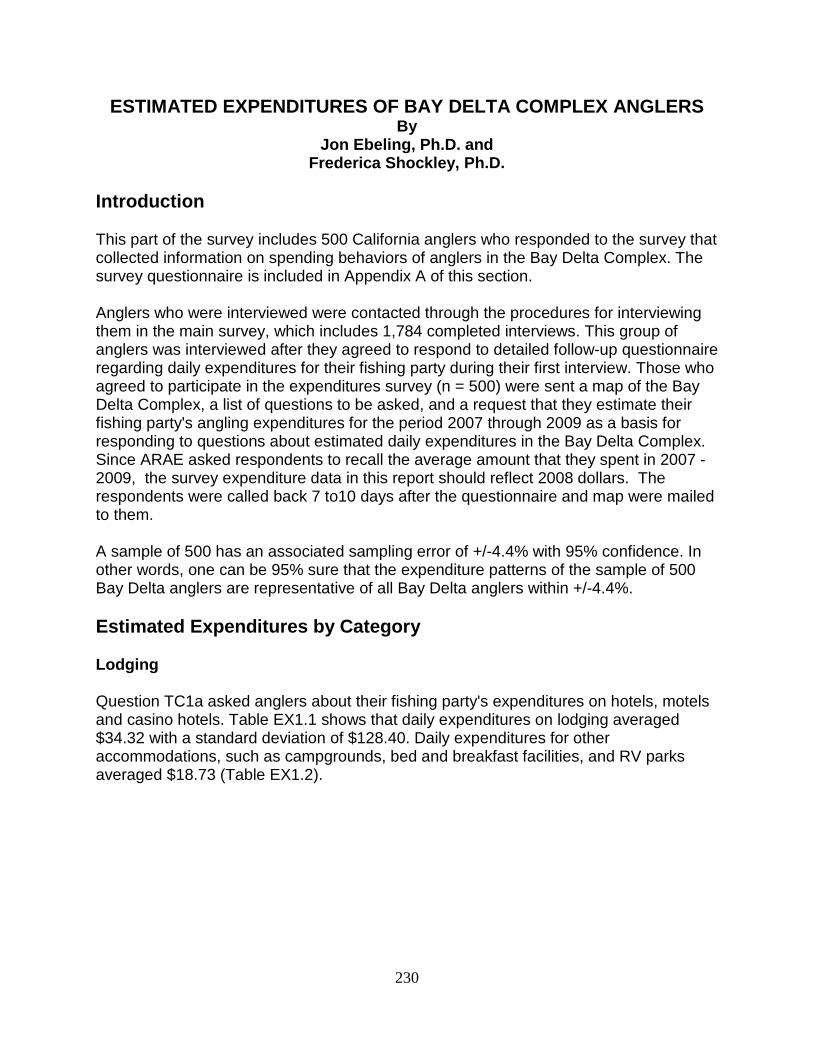
230
ESTIMATED EXPENDITURES OF BAY DELTA COMPLEX ANGLERS By
Jon Ebeling, Ph.D. and Frederica Shockley, Ph.D.
Introduction This part of the survey includes 500 California anglers who responded to the survey that collected information on spending behaviors of anglers in the Bay Delta Complex. The survey questionnaire is included in Appendix A of this section. Anglers who were interviewed were contacted through the procedures for interviewing them in the main survey, which includes 1,784 completed interviews. This group of anglers was interviewed after they agreed to respond to detailed follow-up questionnaire regarding daily expenditures for their fishing party during their first interview. Those who agreed to participate in the expenditures survey (n = 500) were sent a map of the Bay Delta Complex, a list of questions to be asked, and a request that they estimate their fishing party's angling expenditures for the period 2007 through 2009 as a basis for responding to questions about estimated daily expenditures in the Bay Delta Complex. Since ARAE asked respondents to recall the average amount that they spent in 2007 - 2009, the survey expenditure data in this report should reflect 2008 dollars. The respondents were called back 7 to10 days after the questionnaire and map were mailed to them. A sample of 500 has an associated sampling error of +/-4.4% with 95% confidence. In other words, one can be 95% sure that the expenditure patterns of the sample of 500 Bay Delta anglers are representative of all Bay Delta anglers within +/-4.4%. Estimated Expenditures by Category Lodging Question TC1a asked anglers about their fishing party's expenditures on hotels, motels and casino hotels. Table EX1.1 shows that daily expenditures on lodging averaged $34.32 with a standard deviation of $128.40. Daily expenditures for other accommodations, such as campgrounds, bed and breakfast facilities, and RV parks averaged $18.73 (Table EX1.2).
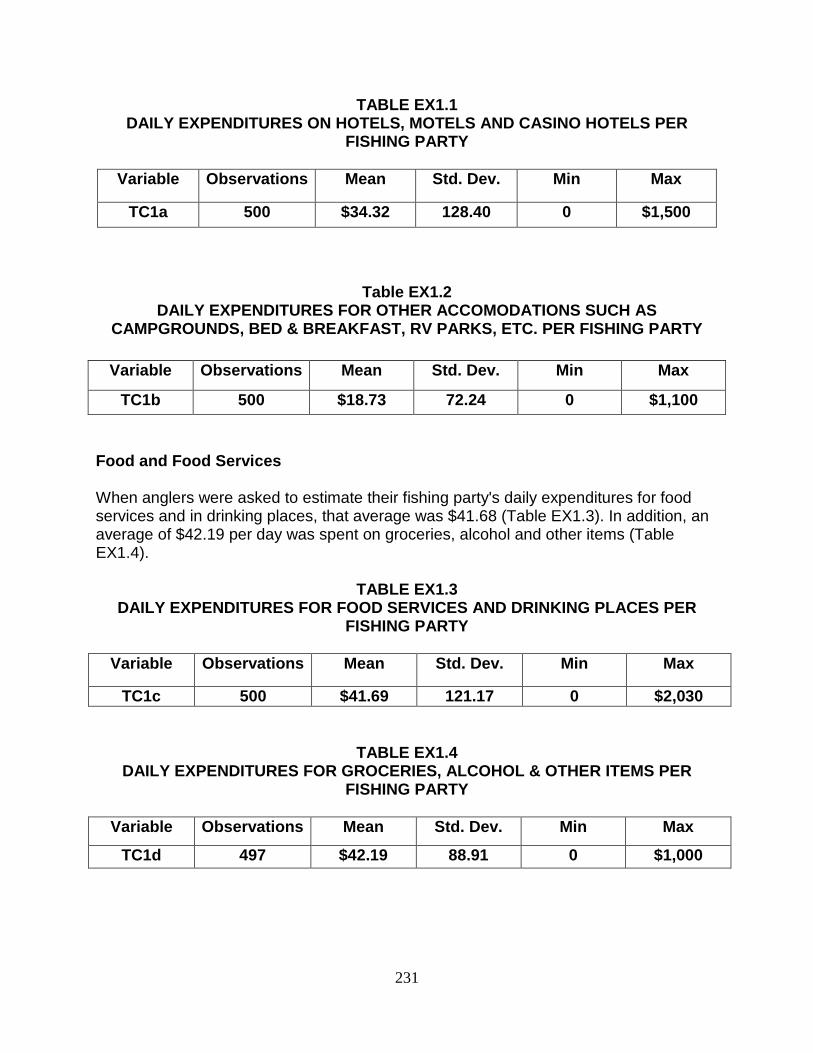
231
TABLE EX1.1 DAILY EXPENDITURES ON HOTELS, MOTELS AND CASINO HOTELS PER
FISHING PARTY
Variable Observations Mean Std. Dev. Min Max
TC1a 500 $34.32 128.40 0 $1,500
Table EX1.2 DAILY EXPENDITURES FOR OTHER ACCOMODATIONS SUCH AS
CAMPGROUNDS, BED & BREAKFAST, RV PARKS, ETC. PER FISHING PARTY
Food and Food Services When anglers were asked to estimate their fishing party's daily expenditures for food services and in drinking places, that average was $41.68 (Table EX1.3). In addition, an average of $42.19 per day was spent on groceries, alcohol and other items (Table EX1.4).
TABLE EX1.3
DAILY EXPENDITURES FOR FOOD SERVICES AND DRINKING PLACES PER FISHING PARTY
Variable Observations Mean Std. Dev. Min Max
TC1c 500 $41.69 121.17 0 $2,030
TABLE EX1.4 DAILY EXPENDITURES FOR GROCERIES, ALCOHOL & OTHER ITEMS PER
FISHING PARTY
Variable Observations Mean Std. Dev. Min Max
TC1d 497 $42.19 88.91 0 $1,000
Variable Observations Mean Std. Dev. Min Max
TC1b 500 $18.73 72.24 0 $1,100
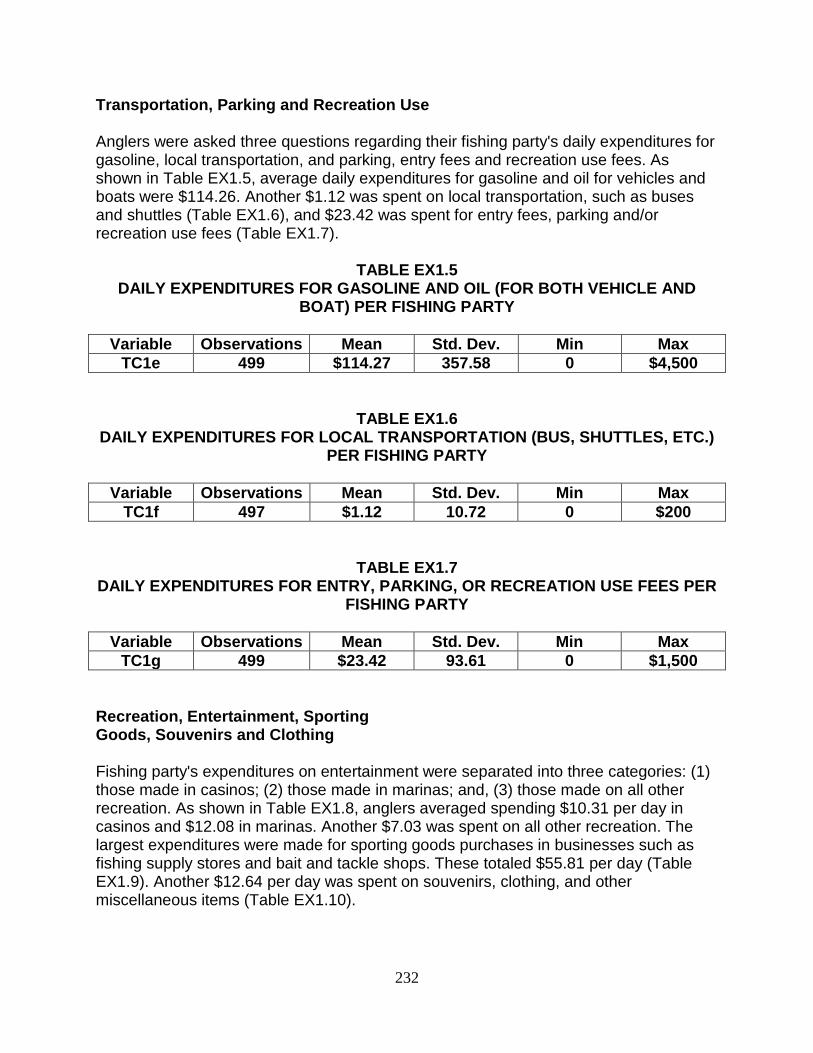
232
Transportation, Parking and Recreation Use Anglers were asked three questions regarding their fishing party's daily expenditures for gasoline, local transportation, and parking, entry fees and recreation use fees. As shown in Table EX1.5, average daily expenditures for gasoline and oil for vehicles and boats were $114.26. Another $1.12 was spent on local transportation, such as buses and shuttles (Table EX1.6), and $23.42 was spent for entry fees, parking and/or recreation use fees (Table EX1.7).
TABLE EX1.5 DAILY EXPENDITURES FOR GASOLINE AND OIL (FOR BOTH VEHICLE AND
BOAT) PER FISHING PARTY
Variable Observations Mean Std. Dev. Min Max TC1e 499 $114.27 357.58 0 $4,500
TABLE EX1.6 DAILY EXPENDITURES FOR LOCAL TRANSPORTATION (BUS, SHUTTLES, ETC.)
PER FISHING PARTY
Variable Observations Mean Std. Dev. Min Max TC1f 497 $1.12 10.72 0 $200
TABLE EX1.7 DAILY EXPENDITURES FOR ENTRY, PARKING, OR RECREATION USE FEES PER
FISHING PARTY
Variable Observations Mean Std. Dev. Min Max TC1g 499 $23.42 93.61 0 $1,500
Recreation, Entertainment, Sporting Goods, Souvenirs and Clothing
Fishing party's expenditures on entertainment were separated into three categories: (1) those made in casinos; (2) those made in marinas; and, (3) those made on all other recreation. As shown in Table EX1.8, anglers averaged spending $10.31 per day in casinos and $12.08 in marinas. Another $7.03 was spent on all other recreation. The largest expenditures were made for sporting goods purchases in businesses such as fishing supply stores and bait and tackle shops. These totaled $55.81 per day (Table EX1.9). Another $12.64 per day was spent on souvenirs, clothing, and other miscellaneous items (Table EX1.10).
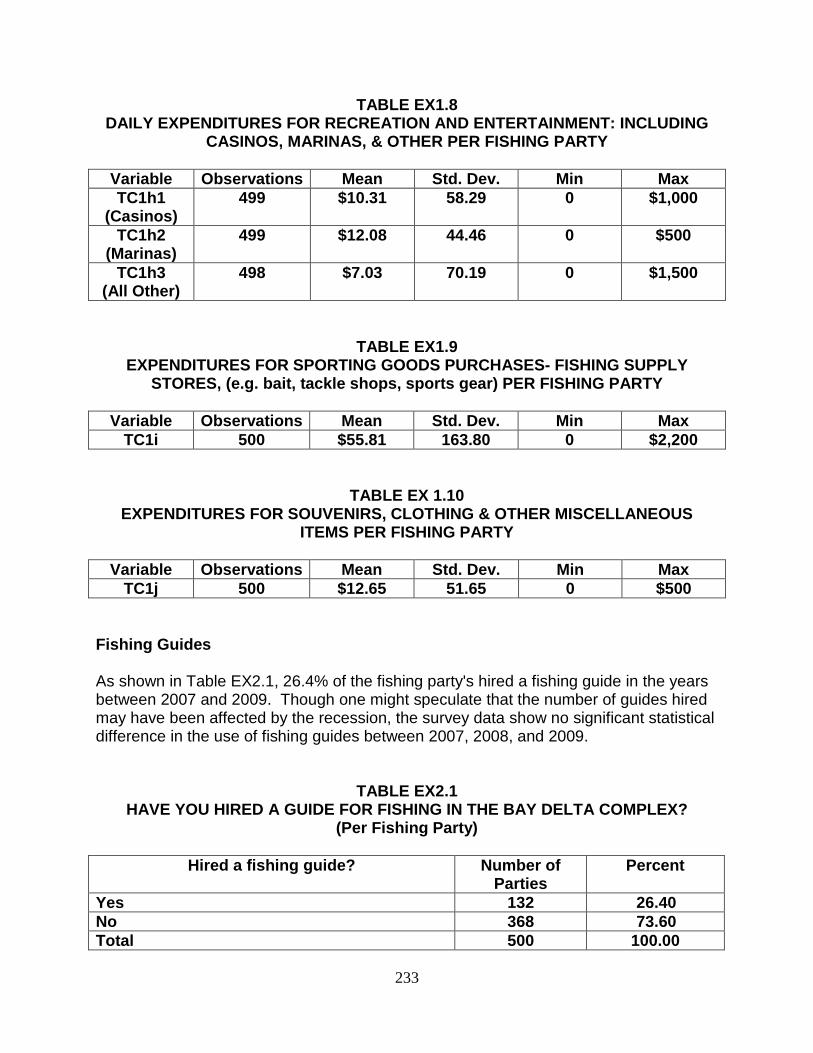
233
TABLE EX1.8 DAILY EXPENDITURES FOR RECREATION AND ENTERTAINMENT: INCLUDING
CASINOS, MARINAS, & OTHER PER FISHING PARTY
Variable Observations Mean Std. Dev. Min Max TC1h1
(Casinos) 499 $10.31 58.29 0 $1,000
TC1h2 (Marinas)
499 $12.08 44.46 0 $500
TC1h3 (All Other)
498 $7.03 70.19 0 $1,500
TABLE EX1.9 EXPENDITURES FOR SPORTING GOODS PURCHASES- FISHING SUPPLY
STORES, (e.g. bait, tackle shops, sports gear) PER FISHING PARTY
Variable Observations Mean Std. Dev. Min Max TC1i 500 $55.81 163.80 0 $2,200
TABLE EX 1.10 EXPENDITURES FOR SOUVENIRS, CLOTHING & OTHER MISCELLANEOUS
ITEMS PER FISHING PARTY
Variable Observations Mean Std. Dev. Min Max TC1j 500 $12.65 51.65 0 $500
Fishing Guides As shown in Table EX2.1, 26.4% of the fishing party's hired a fishing guide in the years between 2007 and 2009. Though one might speculate that the number of guides hired may have been affected by the recession, the survey data show no significant statistical difference in the use of fishing guides between 2007, 2008, and 2009.
TABLE EX2.1 HAVE YOU HIRED A GUIDE FOR FISHING IN THE BAY DELTA COMPLEX?
(Per Fishing Party)
Hired a fishing guide? Number of Parties
Percent
Yes 132 26.40 No 368 73.60 Total 500 100.00
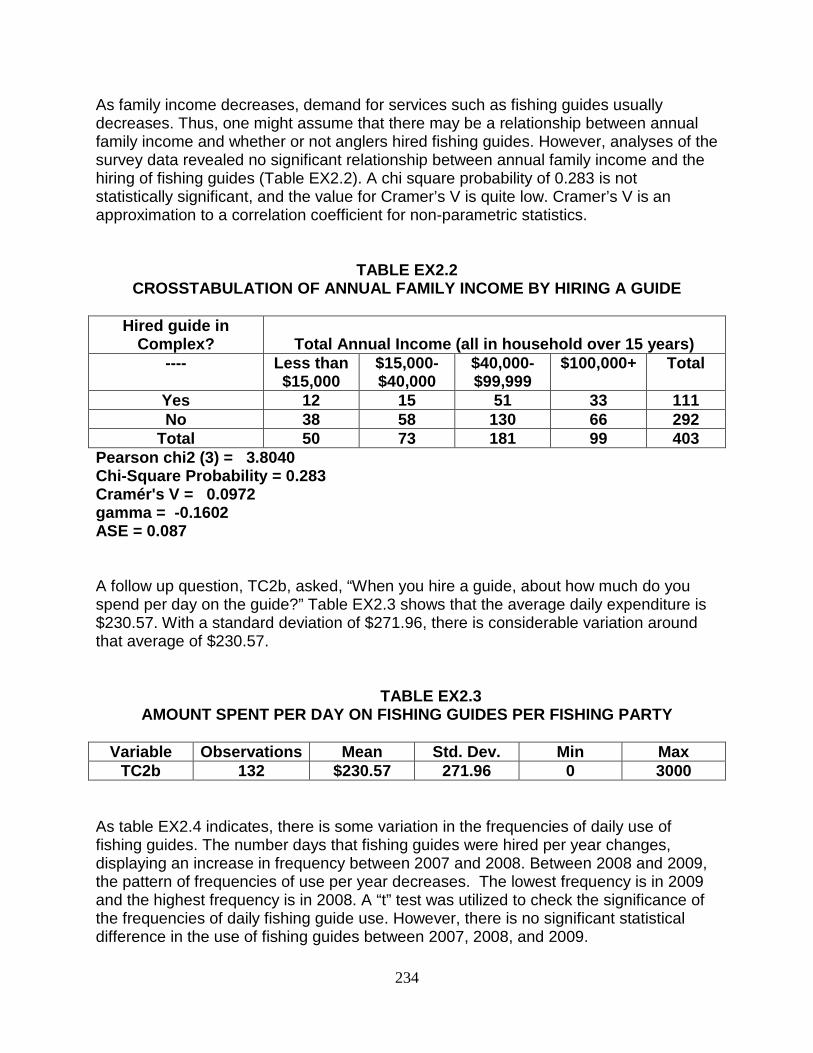
234
As family income decreases, demand for services such as fishing guides usually decreases. Thus, one might assume that there may be a relationship between annual family income and whether or not anglers hired fishing guides. However, analyses of the survey data revealed no significant relationship between annual family income and the hiring of fishing guides (Table EX2.2). A chi square probability of 0.283 is not statistically significant, and the value for Cramer’s V is quite low. Cramer’s V is an approximation to a correlation coefficient for non-parametric statistics.
TABLE EX2.2 CROSSTABULATION OF ANNUAL FAMILY INCOME BY HIRING A GUIDE
Hired guide in
Complex?
Total Annual Income (all in household over 15 years) ---- Less than
$15,000 $15,000-$40,000
$40,000-$99,999
$100,000+ Total
Yes 12 15 51 33 111 No 38 58 130 66 292
Total 50 73 181 99 403 Pearson chi2 (3) = 3.8040 Chi-Square Probability = 0.283 Cramér's V = 0.0972 gamma = -0.1602 ASE = 0.087
A follow up question, TC2b, asked, “When you hire a guide, about how much do you spend per day on the guide?” Table EX2.3 shows that the average daily expenditure is $230.57. With a standard deviation of $271.96, there is considerable variation around that average of $230.57.
TABLE EX2.3 AMOUNT SPENT PER DAY ON FISHING GUIDES PER FISHING PARTY
Variable Observations Mean Std. Dev. Min Max
TC2b 132 $230.57 271.96 0 3000
As table EX2.4 indicates, there is some variation in the frequencies of daily use of fishing guides. The number days that fishing guides were hired per year changes, displaying an increase in frequency between 2007 and 2008. Between 2008 and 2009, the pattern of frequencies of use per year decreases. The lowest frequency is in 2009 and the highest frequency is in 2008. A “t” test was utilized to check the significance of the frequencies of daily fishing guide use. However, there is no significant statistical difference in the use of fishing guides between 2007, 2008, and 2009.
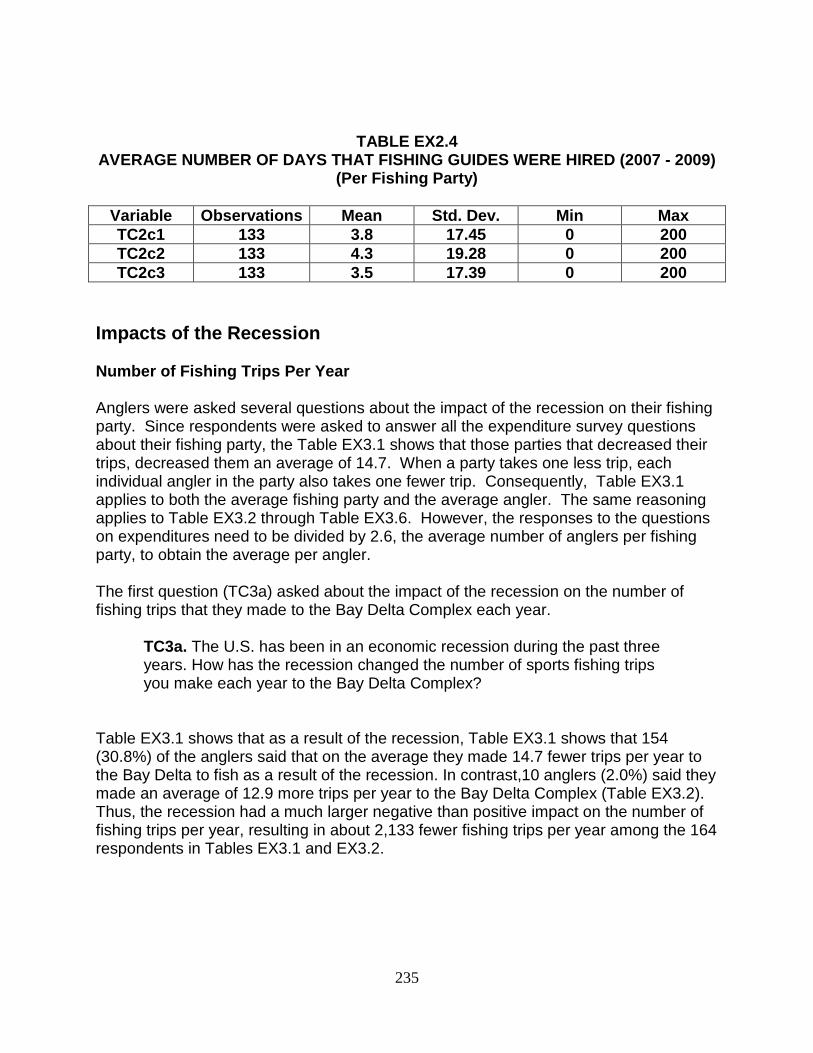
235
TABLE EX2.4 AVERAGE NUMBER OF DAYS THAT FISHING GUIDES WERE HIRED (2007 - 2009)
(Per Fishing Party)
Variable Observations Mean Std. Dev. Min Max TC2c1 133 3.8 17.45 0 200 TC2c2 133 4.3 19.28 0 200 TC2c3 133 3.5 17.39 0 200
Impacts of the Recession Number of Fishing Trips Per Year Anglers were asked several questions about the impact of the recession on their fishing party. Since respondents were asked to answer all the expenditure survey questions about their fishing party, the Table EX3.1 shows that those parties that decreased their trips, decreased them an average of 14.7. When a party takes one less trip, each individual angler in the party also takes one fewer trip. Consequently, Table EX3.1 applies to both the average fishing party and the average angler. The same reasoning applies to Table EX3.2 through Table EX3.6. However, the responses to the questions on expenditures need to be divided by 2.6, the average number of anglers per fishing party, to obtain the average per angler. The first question (TC3a) asked about the impact of the recession on the number of fishing trips that they made to the Bay Delta Complex each year.
TC3a. The U.S. has been in an economic recession during the past three years. How has the recession changed the number of sports fishing trips you make each year to the Bay Delta Complex?
Table EX3.1 shows that as a result of the recession, Table EX3.1 shows that 154 (30.8%) of the anglers said that on the average they made 14.7 fewer trips per year to the Bay Delta to fish as a result of the recession. In contrast,10 anglers (2.0%) said they made an average of 12.9 more trips per year to the Bay Delta Complex (Table EX3.2). Thus, the recession had a much larger negative than positive impact on the number of fishing trips per year, resulting in about 2,133 fewer fishing trips per year among the 164 respondents in Tables EX3.1 and EX3.2.
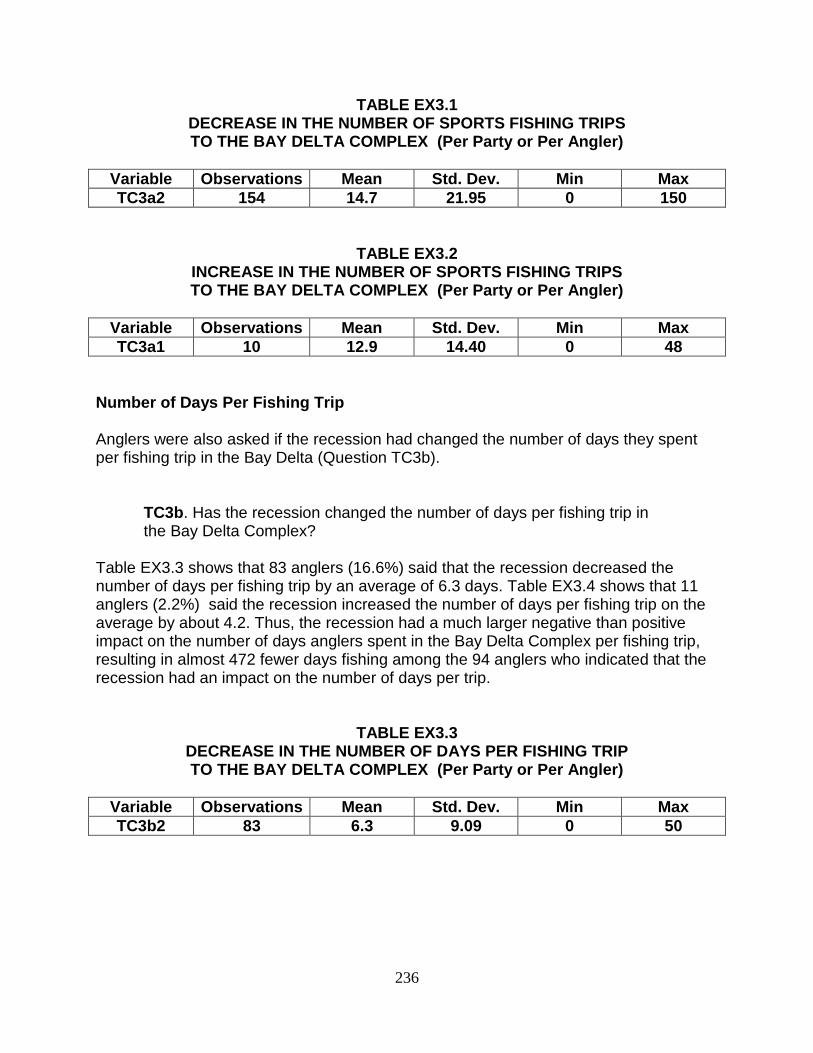
236
TABLE EX3.1 DECREASE IN THE NUMBER OF SPORTS FISHING TRIPS TO THE BAY DELTA COMPLEX (Per Party or Per Angler)
Variable Observations Mean Std. Dev. Min Max TC3a2 154 14.7 21.95 0 150
TABLE EX3.2 INCREASE IN THE NUMBER OF SPORTS FISHING TRIPS TO THE BAY DELTA COMPLEX (Per Party or Per Angler)
Variable Observations Mean Std. Dev. Min Max TC3a1 10 12.9 14.40 0 48
Number of Days Per Fishing Trip Anglers were also asked if the recession had changed the number of days they spent per fishing trip in the Bay Delta (Question TC3b).
TC3b. Has the recession changed the number of days per fishing trip in the Bay Delta Complex?
Table EX3.3 shows that 83 anglers (16.6%) said that the recession decreased the number of days per fishing trip by an average of 6.3 days. Table EX3.4 shows that 11 anglers (2.2%) said the recession increased the number of days per fishing trip on the average by about 4.2. Thus, the recession had a much larger negative than positive impact on the number of days anglers spent in the Bay Delta Complex per fishing trip, resulting in almost 472 fewer days fishing among the 94 anglers who indicated that the recession had an impact on the number of days per trip.
TABLE EX3.3 DECREASE IN THE NUMBER OF DAYS PER FISHING TRIP TO THE BAY DELTA COMPLEX (Per Party or Per Angler)
Variable Observations Mean Std. Dev. Min Max TC3b2 83 6.3 9.09 0 50
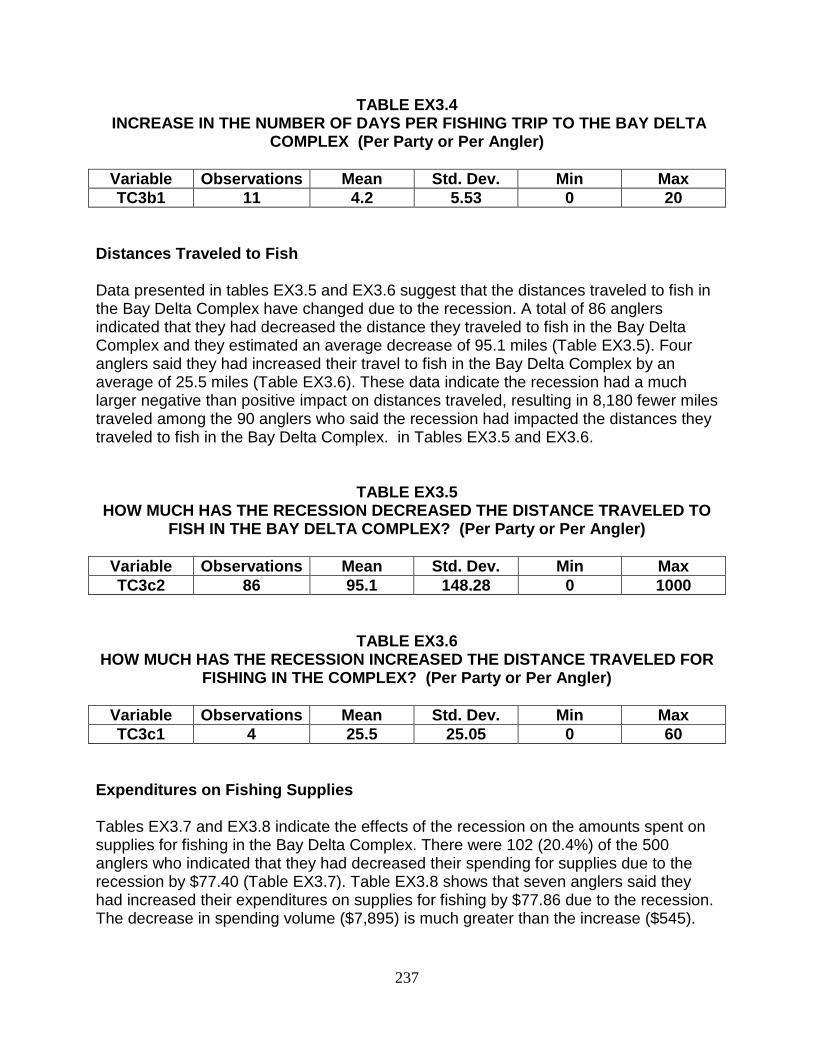
237
TABLE EX3.4 INCREASE IN THE NUMBER OF DAYS PER FISHING TRIP TO THE BAY DELTA
COMPLEX (Per Party or Per Angler)
Variable Observations Mean Std. Dev. Min Max TC3b1 11 4.2 5.53 0 20
Distances Traveled to Fish Data presented in tables EX3.5 and EX3.6 suggest that the distances traveled to fish in the Bay Delta Complex have changed due to the recession. A total of 86 anglers indicated that they had decreased the distance they traveled to fish in the Bay Delta Complex and they estimated an average decrease of 95.1 miles (Table EX3.5). Four anglers said they had increased their travel to fish in the Bay Delta Complex by an average of 25.5 miles (Table EX3.6). These data indicate the recession had a much larger negative than positive impact on distances traveled, resulting in 8,180 fewer miles traveled among the 90 anglers who said the recession had impacted the distances they traveled to fish in the Bay Delta Complex. in Tables EX3.5 and EX3.6.
TABLE EX3.5 HOW MUCH HAS THE RECESSION DECREASED THE DISTANCE TRAVELED TO
FISH IN THE BAY DELTA COMPLEX? (Per Party or Per Angler)
Variable Observations Mean Std. Dev. Min Max TC3c2 86 95.1 148.28 0 1000
TABLE EX3.6 HOW MUCH HAS THE RECESSION INCREASED THE DISTANCE TRAVELED FOR
FISHING IN THE COMPLEX? (Per Party or Per Angler)
Variable Observations Mean Std. Dev. Min Max TC3c1 4 25.5 25.05 0 60
Expenditures on Fishing Supplies Tables EX3.7 and EX3.8 indicate the effects of the recession on the amounts spent on supplies for fishing in the Bay Delta Complex. There were 102 (20.4%) of the 500 anglers who indicated that they had decreased their spending for supplies due to the recession by $77.40 (Table EX3.7). Table EX3.8 shows that seven anglers said they had increased their expenditures on supplies for fishing by $77.86 due to the recession. The decrease in spending volume ($7,895) is much greater than the increase ($545).
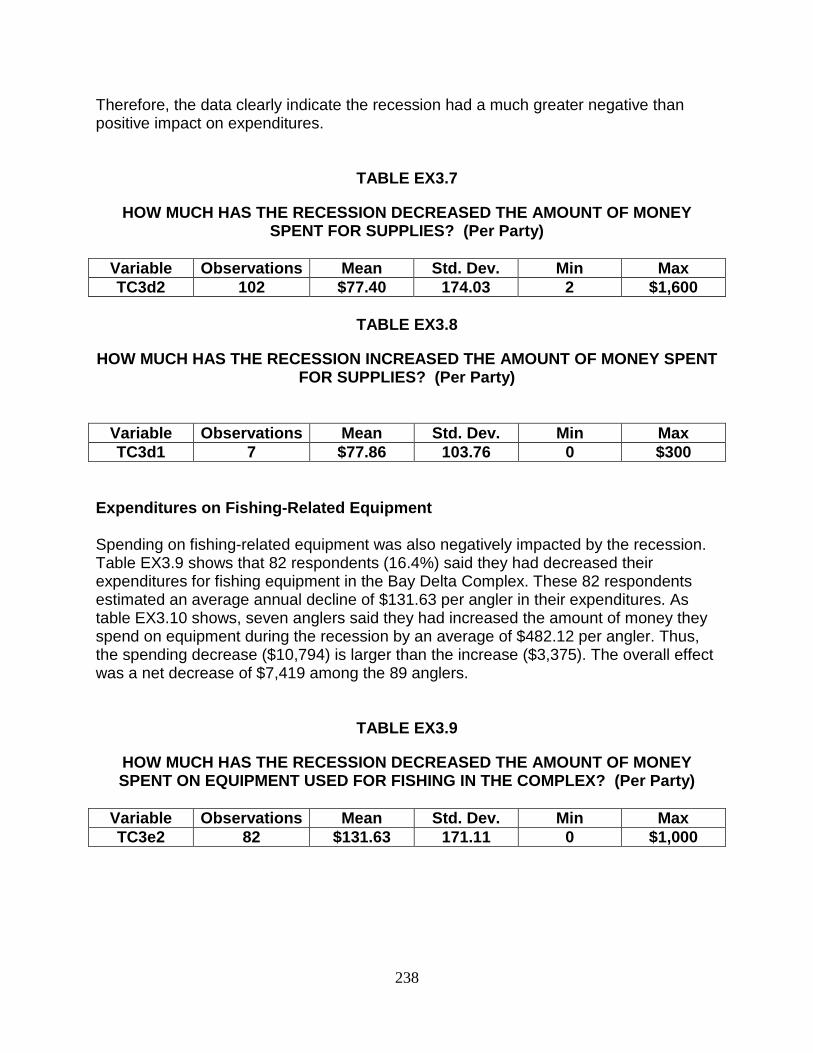
238
Therefore, the data clearly indicate the recession had a much greater negative than positive impact on expenditures.
TABLE EX3.7
HOW MUCH HAS THE RECESSION DECREASED THE AMOUNT OF MONEY SPENT FOR SUPPLIES? (Per Party)
Variable Observations Mean Std. Dev. Min Max TC3d2 102 $77.40 174.03 2 $1,600
TABLE EX3.8
HOW MUCH HAS THE RECESSION INCREASED THE AMOUNT OF MONEY SPENT FOR SUPPLIES? (Per Party)
Variable Observations Mean Std. Dev. Min Max TC3d1 7 $77.86 103.76 0 $300
Expenditures on Fishing-Related Equipment Spending on fishing-related equipment was also negatively impacted by the recession. Table EX3.9 shows that 82 respondents (16.4%) said they had decreased their expenditures for fishing equipment in the Bay Delta Complex. These 82 respondents estimated an average annual decline of $131.63 per angler in their expenditures. As table EX3.10 shows, seven anglers said they had increased the amount of money they spend on equipment during the recession by an average of $482.12 per angler. Thus, the spending decrease ($10,794) is larger than the increase ($3,375). The overall effect was a net decrease of $7,419 among the 89 anglers.
TABLE EX3.9
HOW MUCH HAS THE RECESSION DECREASED THE AMOUNT OF MONEY SPENT ON EQUIPMENT USED FOR FISHING IN THE COMPLEX? (Per Party)
Variable Observations Mean Std. Dev. Min Max TC3e2 82 $131.63 171.11 0 $1,000
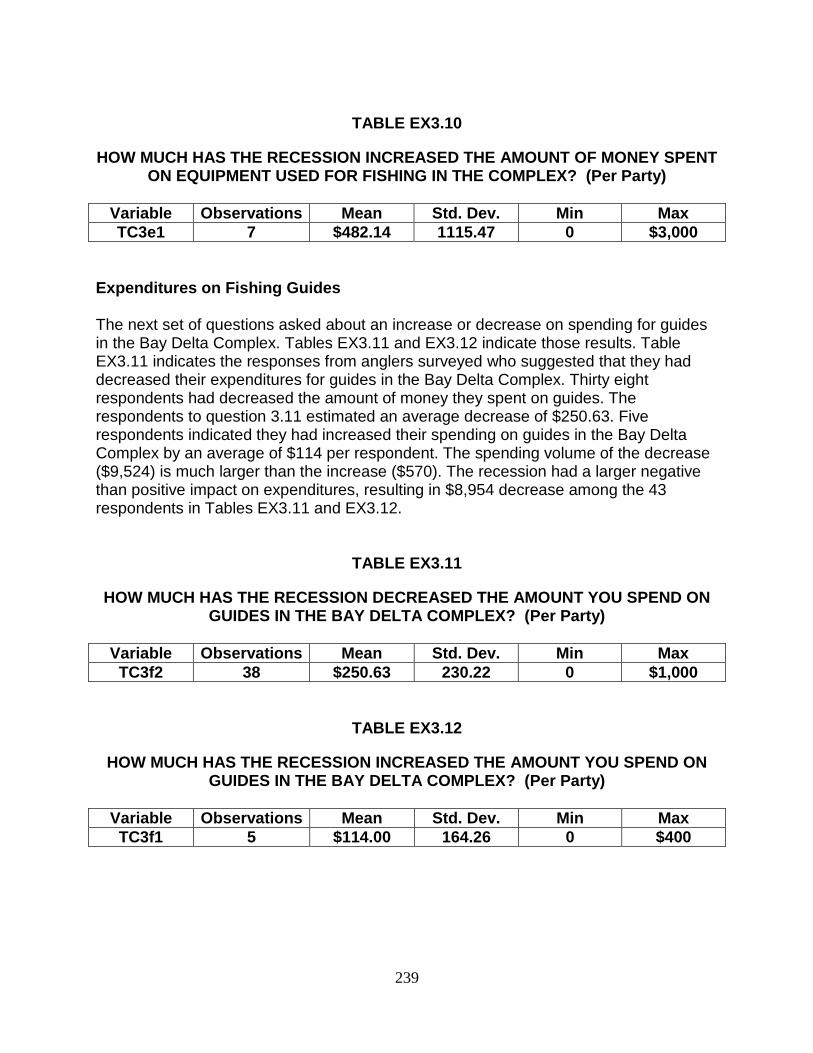
239
TABLE EX3.10
HOW MUCH HAS THE RECESSION INCREASED THE AMOUNT OF MONEY SPENT ON EQUIPMENT USED FOR FISHING IN THE COMPLEX? (Per Party)
Variable Observations Mean Std. Dev. Min Max TC3e1 7 $482.14 1115.47 0 $3,000
Expenditures on Fishing Guides The next set of questions asked about an increase or decrease on spending for guides in the Bay Delta Complex. Tables EX3.11 and EX3.12 indicate those results. Table EX3.11 indicates the responses from anglers surveyed who suggested that they had decreased their expenditures for guides in the Bay Delta Complex. Thirty eight respondents had decreased the amount of money they spent on guides. The respondents to question 3.11 estimated an average decrease of $250.63. Five respondents indicated they had increased their spending on guides in the Bay Delta Complex by an average of $114 per respondent. The spending volume of the decrease ($9,524) is much larger than the increase ($570). The recession had a larger negative than positive impact on expenditures, resulting in $8,954 decrease among the 43 respondents in Tables EX3.11 and EX3.12.
TABLE EX3.11
HOW MUCH HAS THE RECESSION DECREASED THE AMOUNT YOU SPEND ON GUIDES IN THE BAY DELTA COMPLEX? (Per Party)
Variable Observations Mean Std. Dev. Min Max
TC3f2 38 $250.63 230.22 0 $1,000
TABLE EX3.12
HOW MUCH HAS THE RECESSION INCREASED THE AMOUNT YOU SPEND ON GUIDES IN THE BAY DELTA COMPLEX? (Per Party)
Variable Observations Mean Std. Dev. Min Max TC3f1 5 $114.00 164.26 0 $400
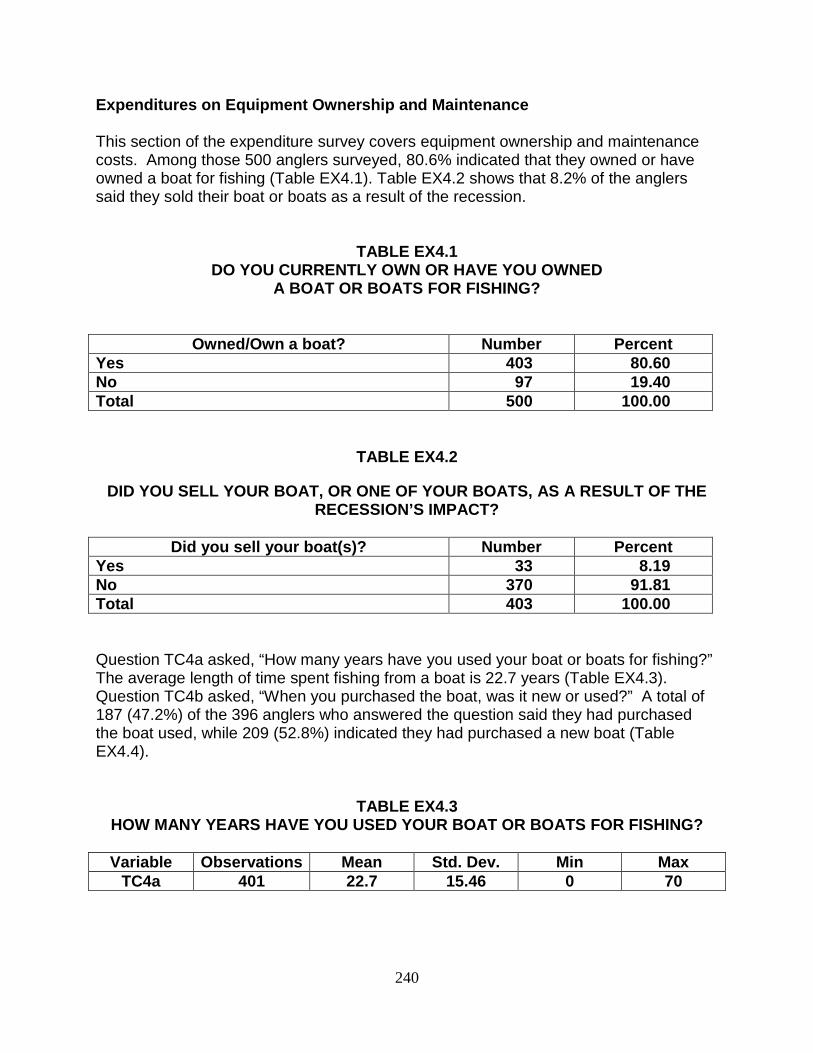
240
Expenditures on Equipment Ownership and Maintenance This section of the expenditure survey covers equipment ownership and maintenance costs. Among those 500 anglers surveyed, 80.6% indicated that they owned or have owned a boat for fishing (Table EX4.1). Table EX4.2 shows that 8.2% of the anglers said they sold their boat or boats as a result of the recession.
TABLE EX4.1
DO YOU CURRENTLY OWN OR HAVE YOU OWNED A BOAT OR BOATS FOR FISHING?
Owned/Own a boat? Number Percent Yes 403 80.60 No 97 19.40 Total 500 100.00
TABLE EX4.2
DID YOU SELL YOUR BOAT, OR ONE OF YOUR BOATS, AS A RESULT OF THE RECESSION’S IMPACT?
Did you sell your boat(s)? Number Percent
Yes 33 8.19 No 370 91.81 Total 403 100.00 Question TC4a asked, “How many years have you used your boat or boats for fishing?” The average length of time spent fishing from a boat is 22.7 years (Table EX4.3). Question TC4b asked, “When you purchased the boat, was it new or used?” A total of 187 (47.2%) of the 396 anglers who answered the question said they had purchased the boat used, while 209 (52.8%) indicated they had purchased a new boat (Table EX4.4).
TABLE EX4.3 HOW MANY YEARS HAVE YOU USED YOUR BOAT OR BOATS FOR FISHING?
Variable Observations Mean Std. Dev. Min Max
TC4a 401 22.7 15.46 0 70
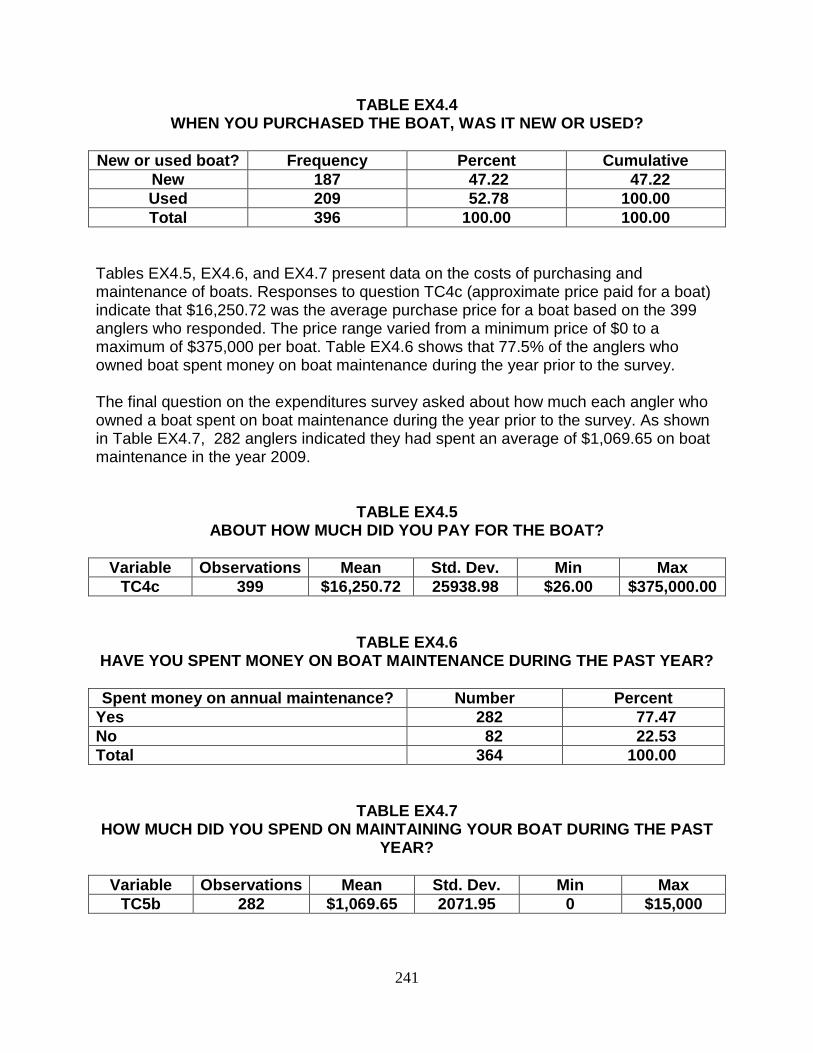
241
TABLE EX4.4 WHEN YOU PURCHASED THE BOAT, WAS IT NEW OR USED?
New or used boat? Frequency Percent Cumulative
New 187 47.22 47.22 Used 209 52.78 100.00 Total 396 100.00 100.00
Tables EX4.5, EX4.6, and EX4.7 present data on the costs of purchasing and maintenance of boats. Responses to question TC4c (approximate price paid for a boat) indicate that $16,250.72 was the average purchase price for a boat based on the 399 anglers who responded. The price range varied from a minimum price of $0 to a maximum of $375,000 per boat. Table EX4.6 shows that 77.5% of the anglers who owned boat spent money on boat maintenance during the year prior to the survey. The final question on the expenditures survey asked about how much each angler who owned a boat spent on boat maintenance during the year prior to the survey. As shown in Table EX4.7, 282 anglers indicated they had spent an average of $1,069.65 on boat maintenance in the year 2009.
TABLE EX4.5 ABOUT HOW MUCH DID YOU PAY FOR THE BOAT?
Variable Observations Mean Std. Dev. Min Max
TC4c 399 $16,250.72 25938.98 $26.00 $375,000.00
TABLE EX4.6 HAVE YOU SPENT MONEY ON BOAT MAINTENANCE DURING THE PAST YEAR? Spent money on annual maintenance? Number Percent
Yes 282 77.47 No 82 22.53 Total 364 100.00
TABLE EX4.7 HOW MUCH DID YOU SPEND ON MAINTAINING YOUR BOAT DURING THE PAST
YEAR?
Variable Observations Mean Std. Dev. Min Max TC5b 282 $1,069.65 2071.95 0 $15,000
242
SUMMARY OF DAILY EXPENDITURES
Table C1.1 summarizes the weighted expenditures per day derived from the expenditure data reported above for fishing parties. It is based on the expenditure data provided by the 500 anglers who responded to the expenditures survey as well as the calculations of the weighted average spending per day. As shown in this table, each Bay Delta fishing party spent an average of $381.97 per day of fishing and the average party size was 2.6 anglers. Based on this, the average per angler expenditure is $146.91 per day. ARE assumed that each Bay Delta angler spent the same as the average respondent in ARAE's expenditure survey.
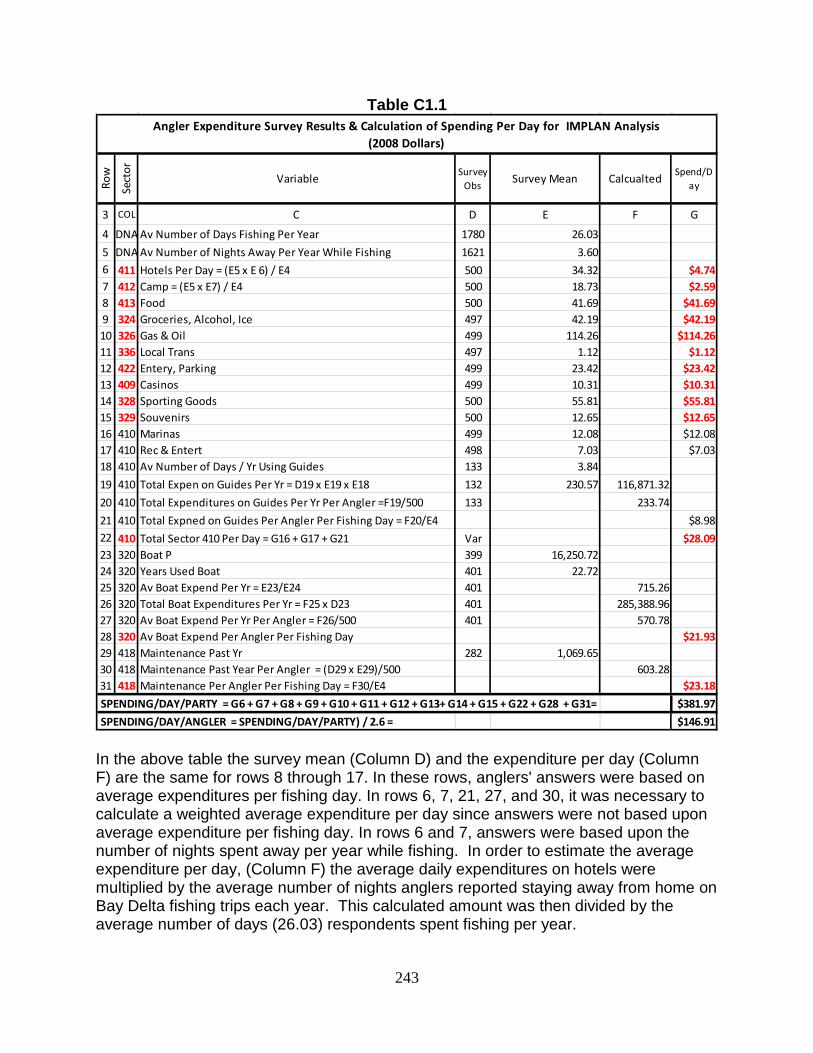
243
Table C1.1 Angler Expenditure Survey Results & Calculation of Spending Per Day for IMPLAN Analysis
(2008 Dollars)
Row
Sect
or
Variable Survey Obs Survey Mean Calcualted Spend/D
ay
3 COL C D E F G
4 DNA Av Number of Days Fishing Per Year 1780 26.035 DNA Av Number of Nights Away Per Year While Fishing 1621 3.606 411 Hotels Per Day = (E5 x E 6) / E4 500 34.32 $4.747 412 Camp = (E5 x E7) / E4 500 18.73 $2.598 413 Food 500 41.69 $41.699 324 Groceries, Alcohol, Ice 497 42.19 $42.1910 326 Gas & Oil 499 114.26 $114.2611 336 Local Trans 497 1.12 $1.1212 422 Entery, Parking 499 23.42 $23.4213 409 Casinos 499 10.31 $10.3114 328 Sporting Goods 500 55.81 $55.8115 329 Souvenirs 500 12.65 $12.6516 410 Marinas 499 12.08 $12.0817 410 Rec & Entert 498 7.03 $7.0318 410 Av Number of Days / Yr Using Guides 133 3.8419 410 Total Expen on Guides Per Yr = D19 x E19 x E18 132 230.57 116,871.3220 410 Total Expenditures on Guides Per Yr Per Angler =F19/500 133 233.7421 410 Total Expned on Guides Per Angler Per Fishing Day = F20/E4 $8.9822 410 Total Sector 410 Per Day = G16 + G17 + G21 Var $28.0923 320 Boat P 399 16,250.7224 320 Years Used Boat 401 22.7225 320 Av Boat Expend Per Yr = E23/E24 401 715.2626 320 Total Boat Expenditures Per Yr = F25 x D23 401 285,388.9627 320 Av Boat Expend Per Yr Per Angler = F26/500 401 570.7828 320 Av Boat Expend Per Angler Per Fishing Day $21.9329 418 Maintenance Past Yr 282 1,069.6530 418 Maintenance Past Year Per Angler = (D29 x E29)/500 603.2831 418 Maintenance Per Angler Per Fishing Day = F30/E4 $23.18 SPENDING/DAY/PARTY = G6 + G7 + G8 + G9 + G10 + G11 + G12 + G13+ G14 + G15 + G22 + G28 + G31= $381.97 SPENDING/DAY/ANGLER = SPENDING/DAY/PARTY) / 2.6 = $146.91
In the above table the survey mean (Column D) and the expenditure per day (Column F) are the same for rows 8 through 17. In these rows, anglers' answers were based on average expenditures per fishing day. In rows 6, 7, 21, 27, and 30, it was necessary to calculate a weighted average expenditure per day since answers were not based upon average expenditure per fishing day. In rows 6 and 7, answers were based upon the number of nights spent away per year while fishing. In order to estimate the average expenditure per day, (Column F) the average daily expenditures on hotels were multiplied by the average number of nights anglers reported staying away from home on Bay Delta fishing trips each year. This calculated amount was then divided by the average number of days (26.03) respondents spent fishing per year.
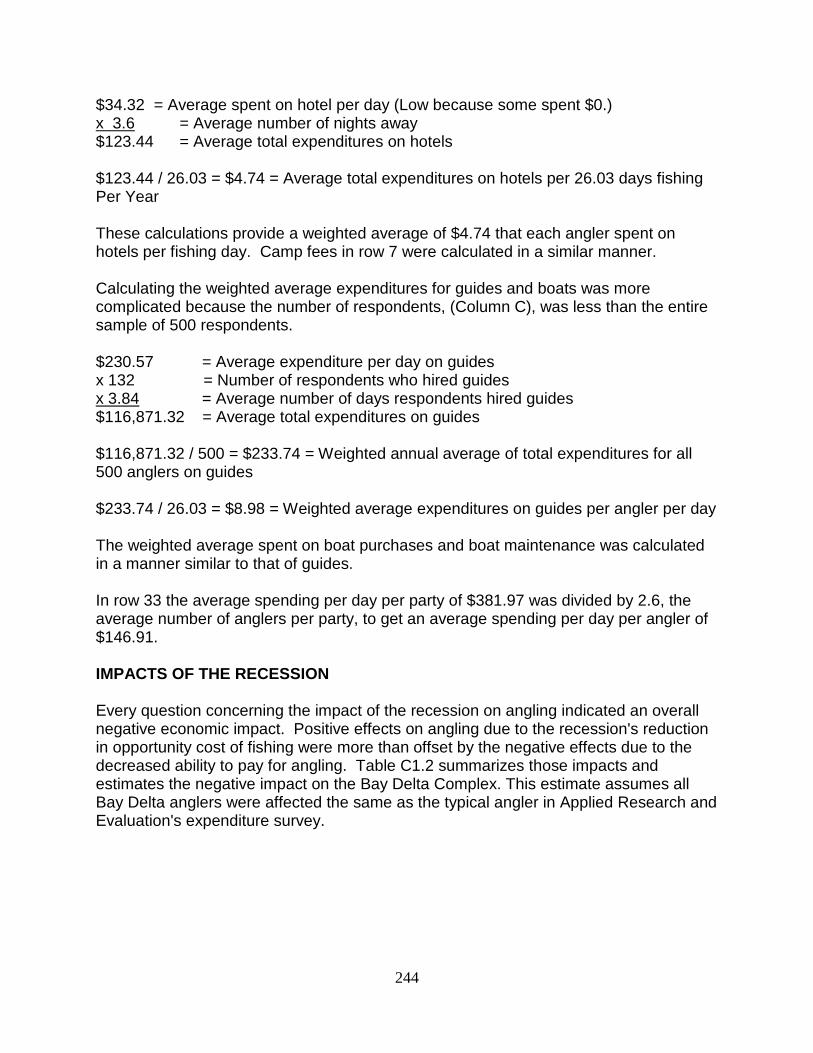
244
$34.32 = Average spent on hotel per day (Low because some spent $0.) x 3.6 = Average number of nights away $123.44 = Average total expenditures on hotels $123.44 / 26.03 = $4.74 = Average total expenditures on hotels per 26.03 days fishing Per Year These calculations provide a weighted average of $4.74 that each angler spent on hotels per fishing day. Camp fees in row 7 were calculated in a similar manner. Calculating the weighted average expenditures for guides and boats was more complicated because the number of respondents, (Column C), was less than the entire sample of 500 respondents. $230.57 = Average expenditure per day on guides x 132 = Number of respondents who hired guides x 3.84 = Average number of days respondents hired guides $116,871.32 = Average total expenditures on guides $116,871.32 / 500 = $233.74 = Weighted annual average of total expenditures for all 500 anglers on guides $233.74 / 26.03 = $8.98 = Weighted average expenditures on guides per angler per day The weighted average spent on boat purchases and boat maintenance was calculated in a manner similar to that of guides. In row 33 the average spending per day per party of $381.97 was divided by 2.6, the average number of anglers per party, to get an average spending per day per angler of $146.91. IMPACTS OF THE RECESSION Every question concerning the impact of the recession on angling indicated an overall negative economic impact. Positive effects on angling due to the recession's reduction in opportunity cost of fishing were more than offset by the negative effects due to the decreased ability to pay for angling. Table C1.2 summarizes those impacts and estimates the negative impact on the Bay Delta Complex. This estimate assumes all Bay Delta anglers were affected the same as the typical angler in Applied Research and Evaluation's expenditure survey.
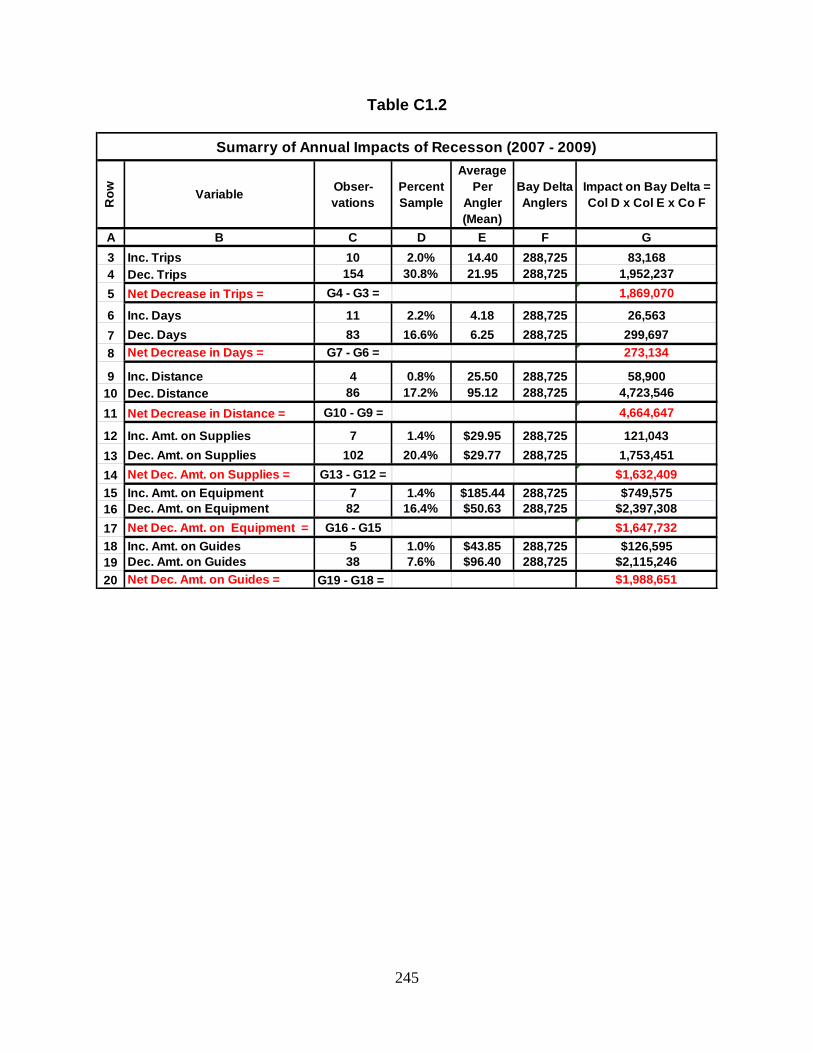
245
Table C1.2
Sumarry of Annual Impacts of Recesson (2007 - 2009)
Row Variable Obser-
vationsPercent Sample
Average Per
Angler (Mean)
Bay Delta Anglers
Impact on Bay Delta = Col D x Col E x Co F
A B C D E F G3 Inc. Trips 10 2.0% 14.40 288,725 83,1684 Dec. Trips 154 30.8% 21.95 288,725 1,952,2375 Net Decrease in Trips = G4 - G3 = 1,869,070
6 Inc. Days 11 2.2% 4.18 288,725 26,5637 Dec. Days 83 16.6% 6.25 288,725 299,6978 Net Decrease in Days = G7 - G6 = 273,134
9 Inc. Distance 4 0.8% 25.50 288,725 58,90010 Dec. Distance 86 17.2% 95.12 288,725 4,723,54611 Net Decrease in Distance = G10 - G9 = 4,664,647
12 Inc. Amt. on Supplies 7 1.4% $29.95 288,725 121,04313 Dec. Amt. on Supplies 102 20.4% $29.77 288,725 1,753,45114 Net Dec. Amt. on Supplies = G13 - G12 = $1,632,40915 Inc. Amt. on Equipment 7 1.4% $185.44 288,725 $749,57516 Dec. Amt. on Equipment 82 16.4% $50.63 288,725 $2,397,30817 Net Dec. Amt. on Equipment = G16 - G15 $1,647,73218 Inc. Amt. on Guides 5 1.0% $43.85 288,725 $126,59519 Dec. Amt. on Guides 38 7.6% $96.40 288,725 $2,115,24620 Net Dec. Amt. on Guides = G19 - G18 = $1,988,651
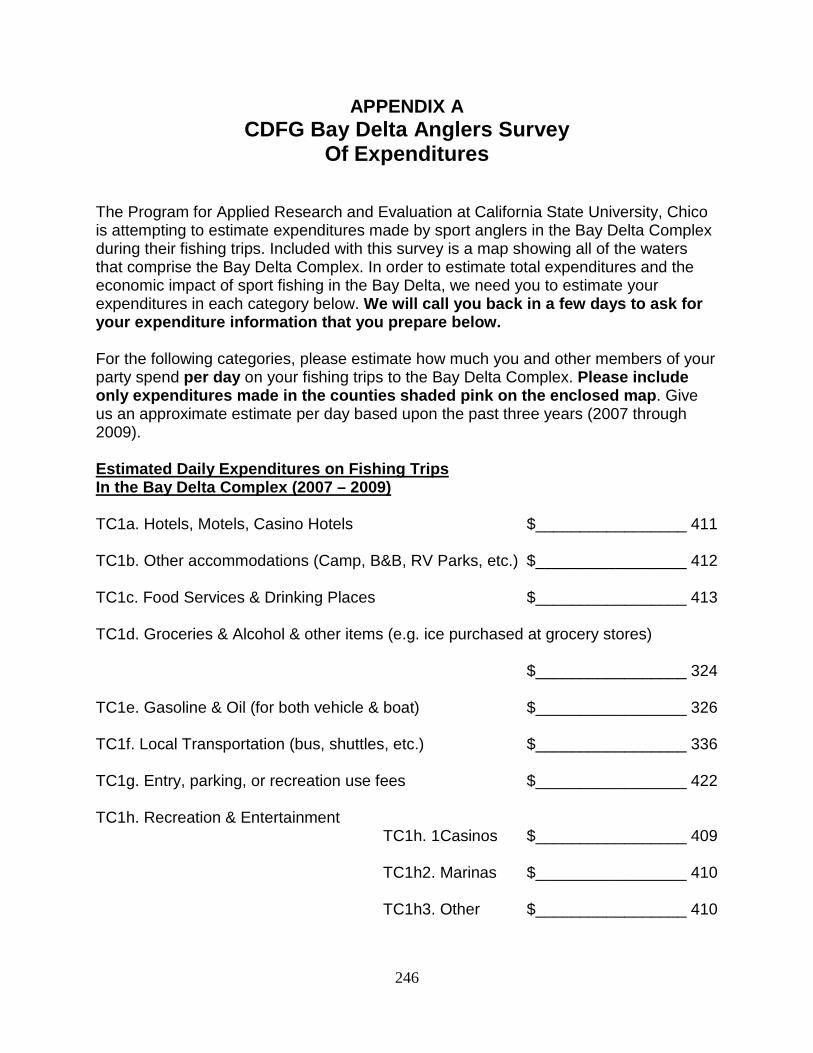
246
APPENDIX A CDFG Bay Delta Anglers Survey
Of Expenditures The Program for Applied Research and Evaluation at California State University, Chico is attempting to estimate expenditures made by sport anglers in the Bay Delta Complex during their fishing trips. Included with this survey is a map showing all of the waters that comprise the Bay Delta Complex. In order to estimate total expenditures and the economic impact of sport fishing in the Bay Delta, we need you to estimate your expenditures in each category below. We will call you back in a few days to ask for your expenditure information that you prepare below. For the following categories, please estimate how much you and other members of your party spend per day on your fishing trips to the Bay Delta Complex. Please include only expenditures made in the counties shaded pink on the enclosed map. Give us an approximate estimate per day based upon the past three years (2007 through 2009). Estimated Daily Expenditures on Fishing Trips In the Bay Delta Complex (2007 – 2009) TC1a. Hotels, Motels, Casino Hotels $_________________ 411 TC1b. Other accommodations (Camp, B&B, RV Parks, etc.) $_________________ 412 TC1c. Food Services & Drinking Places $_________________ 413 TC1d. Groceries & Alcohol & other items (e.g. ice purchased at grocery stores) $_________________ 324 TC1e. Gasoline & Oil (for both vehicle & boat) $_________________ 326 TC1f. Local Transportation (bus, shuttles, etc.) $_________________ 336 TC1g. Entry, parking, or recreation use fees $_________________ 422 TC1h. Recreation & Entertainment TC1h. 1Casinos $_________________ 409
TC1h2. Marinas $_________________ 410
TC1h3. Other $_________________ 410
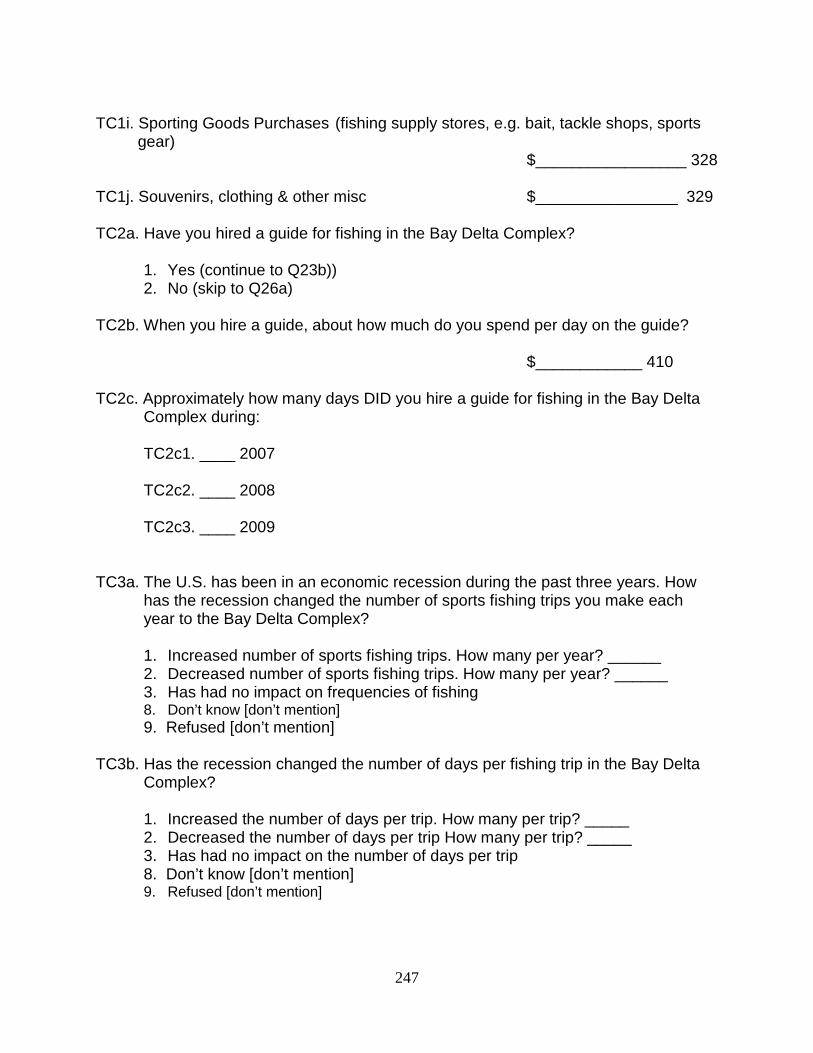
247
TC1i. Sporting Goods Purchases (fishing supply stores, e.g. bait, tackle shops, sports
gear) $_________________ 328
TC1j. Souvenirs, clothing & other misc $________________ 329 TC2a. Have you hired a guide for fishing in the Bay Delta Complex?
1. Yes (continue to Q23b)) 2. No (skip to Q26a)
TC2b. When you hire a guide, about how much do you spend per day on the guide? $____________ 410 TC2c. Approximately how many days DID you hire a guide for fishing in the Bay Delta
Complex during:
TC2c1. ____ 2007 TC2c2. ____ 2008 TC2c3. ____ 2009
TC3a. The U.S. has been in an economic recession during the past three years. How
has the recession changed the number of sports fishing trips you make each year to the Bay Delta Complex?
1. Increased number of sports fishing trips. How many per year? ______ 2. Decreased number of sports fishing trips. How many per year? ______ 3. Has had no impact on frequencies of fishing 8. Don’t know [don’t mention]
9. Refused [don’t mention] TC3b. Has the recession changed the number of days per fishing trip in the Bay Delta
Complex?
1. Increased the number of days per trip. How many per trip? _____ 2. Decreased the number of days per trip How many per trip? _____ 3. Has had no impact on the number of days per trip 8. Don’t know [don’t mention] 9. Refused [don’t mention]
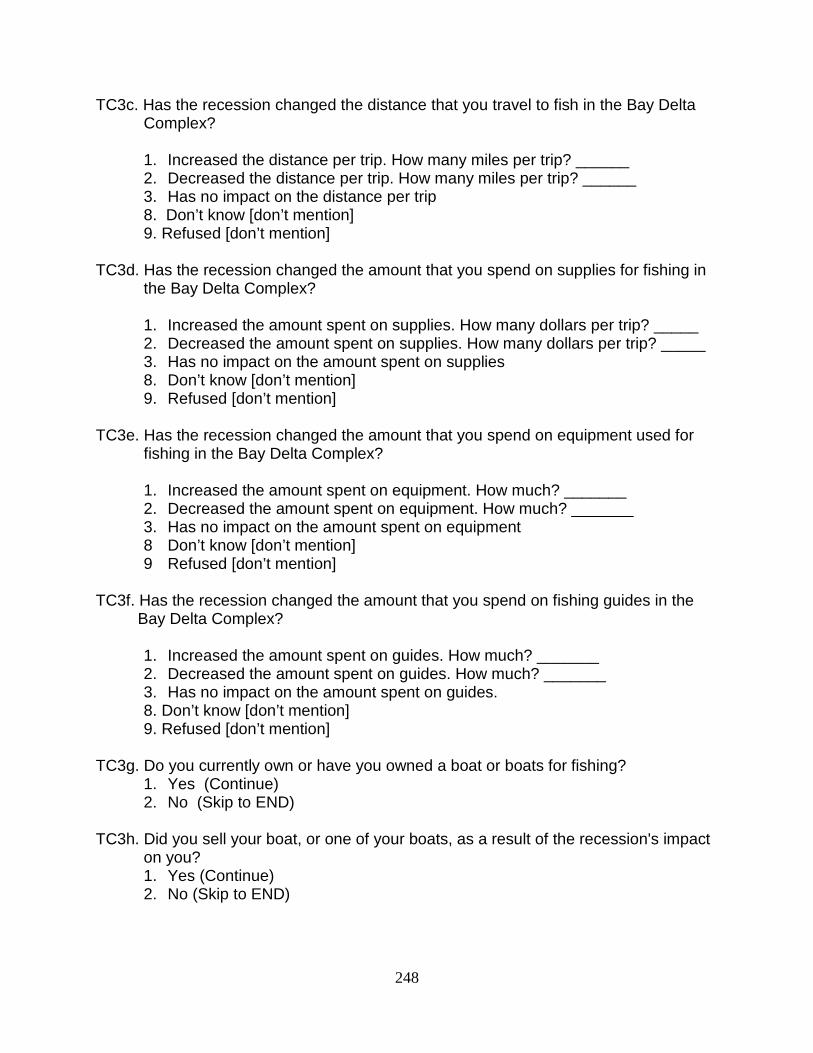
248
TC3c. Has the recession changed the distance that you travel to fish in the Bay Delta Complex?
1. Increased the distance per trip. How many miles per trip? ______ 2. Decreased the distance per trip. How many miles per trip? ______ 3. Has no impact on the distance per trip 8. Don’t know [don’t mention] 9. Refused [don’t mention]
TC3d. Has the recession changed the amount that you spend on supplies for fishing in
the Bay Delta Complex?
1. Increased the amount spent on supplies. How many dollars per trip? _____ 2. Decreased the amount spent on supplies. How many dollars per trip? _____ 3. Has no impact on the amount spent on supplies 8. Don’t know [don’t mention] 9. Refused [don’t mention]
TC3e. Has the recession changed the amount that you spend on equipment used for
fishing in the Bay Delta Complex?
1. Increased the amount spent on equipment. How much? _______ 2. Decreased the amount spent on equipment. How much? _______ 3. Has no impact on the amount spent on equipment 8 Don’t know [don’t mention] 9 Refused [don’t mention]
TC3f. Has the recession changed the amount that you spend on fishing guides in the
Bay Delta Complex?
1. Increased the amount spent on guides. How much? _______ 2. Decreased the amount spent on guides. How much? _______ 3. Has no impact on the amount spent on guides. 8. Don’t know [don’t mention] 9. Refused [don’t mention]
TC3g. Do you currently own or have you owned a boat or boats for fishing?
1. Yes (Continue) 2. No (Skip to END)
TC3h. Did you sell your boat, or one of your boats, as a result of the recession's impact
on you? 1. Yes (Continue) 2. No (Skip to END)
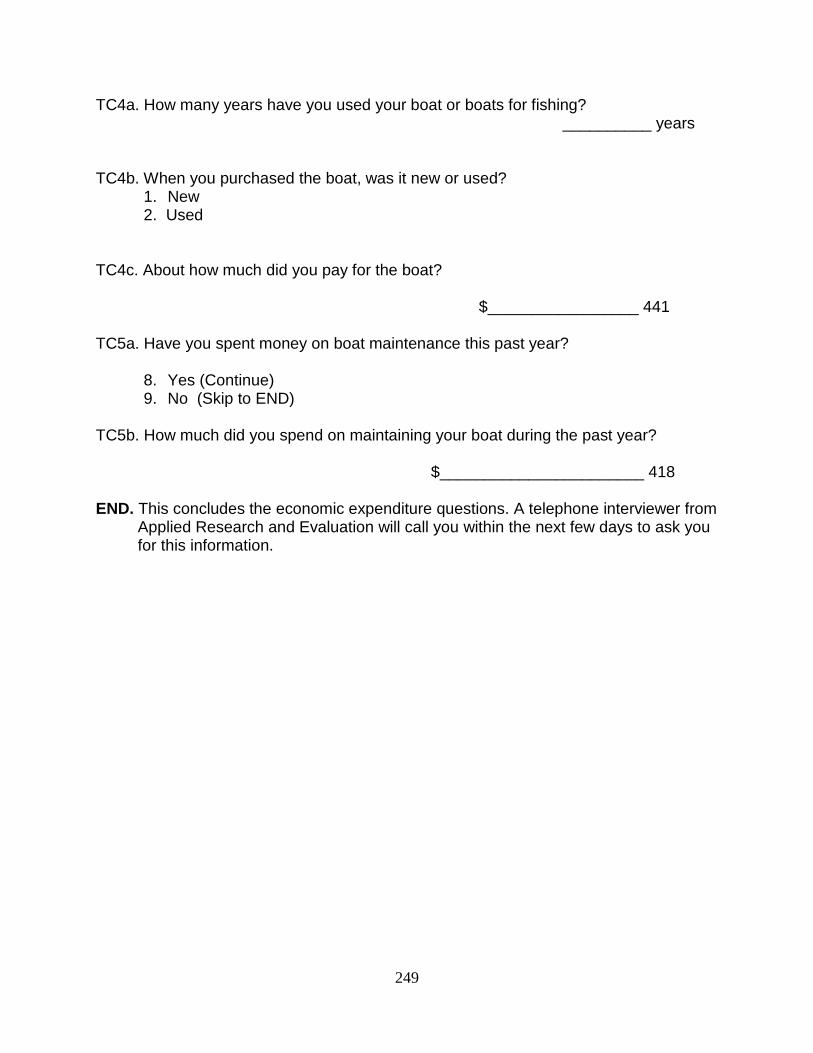
249
TC4a. How many years have you used your boat or boats for fishing? __________ years
TC4b. When you purchased the boat, was it new or used?
1. New 2. Used TC4c. About how much did you pay for the boat? $_________________ 441 TC5a. Have you spent money on boat maintenance this past year?
8. Yes (Continue) 9. No (Skip to END)
TC5b. How much did you spend on maintaining your boat during the past year? $_______________________ 418 END. This concludes the economic expenditure questions. A telephone interviewer from
Applied Research and Evaluation will call you within the next few days to ask you for this information.
250
RESULTS OF THE CVM ANALYSIS FOR THREE FISH SPECIES FOUND IN THE BAY DELTA COMPLEX
By JON EBELING, Ph.D.
FREDERICA SHOCKLEY, Ph.D. The contingent valuation method (CVM) is designed to estimate the value that individuals place on a good or service that is not sold in a market, such as an improvement in the quality of water for fish. It is "contingent" because people are asked how much they are willing and able to pay, contingent upon a specific, hypothetical outcome. Instead of asking anglers how much they were willing to pay for an improvement, Applied Research and Evaluation (ARE) asked them how many more days they would fish if the improvement described in the CVM scenario was made. ARE then multiplied the number of extra days by the number of Bay Delta anglers to obtain the added value of the improvement for all anglers.
Limitations of CVM
The reader should be aware of the limitations of CVM analysis:
• Some anglers may overstate their willingness to fish extra days because they want to encourage DFG to make the changes.
• Results may be biased because the anglers who do not respond have a different
willingness to fish extra days than the anglers who do respond.
• Anglers may overstate their willingness to fish because they think that it is the "right answer."
• Anglers may overstate their willingness to fish because they fail to take into
consideration the amount of leisure time they have available.
Salmon CVM
The first two improvement scenarios and CVM questions related to the contingent valuation of salmon fishing were:
CVM1. The current catch limit on Chinook Salmon is two fish in waters where Chinook Salmon fishing is permitted. If the Chinook Salmon fishery could be managed so that the catch limit could be increased to three fish,
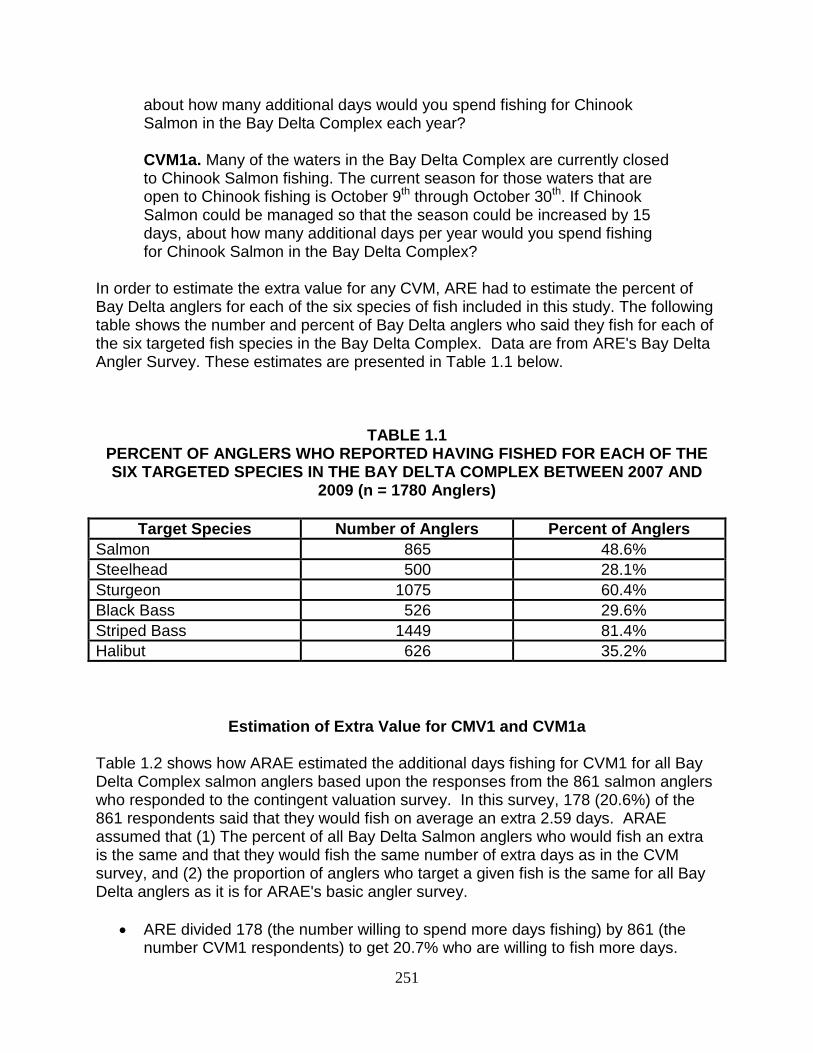
251
about how many additional days would you spend fishing for Chinook Salmon in the Bay Delta Complex each year?
CVM1a. Many of the waters in the Bay Delta Complex are currently closed to Chinook Salmon fishing. The current season for those waters that are open to Chinook fishing is October 9th through October 30th. If Chinook Salmon could be managed so that the season could be increased by 15 days, about how many additional days per year would you spend fishing for Chinook Salmon in the Bay Delta Complex?
In order to estimate the extra value for any CVM, ARE had to estimate the percent of Bay Delta anglers for each of the six species of fish included in this study. The following table shows the number and percent of Bay Delta anglers who said they fish for each of the six targeted fish species in the Bay Delta Complex. Data are from ARE's Bay Delta Angler Survey. These estimates are presented in Table 1.1 below.
TABLE 1.1 PERCENT OF ANGLERS WHO REPORTED HAVING FISHED FOR EACH OF THE SIX TARGETED SPECIES IN THE BAY DELTA COMPLEX BETWEEN 2007 AND
2009 (n = 1780 Anglers)
Target Species Number of Anglers Percent of Anglers Salmon 865 48.6% Steelhead 500 28.1% Sturgeon 1075 60.4% Black Bass 526 29.6% Striped Bass 1449 81.4% Halibut 626 35.2%
Estimation of Extra Value for CMV1 and CVM1a
Table 1.2 shows how ARAE estimated the additional days fishing for CVM1 for all Bay Delta Complex salmon anglers based upon the responses from the 861 salmon anglers who responded to the contingent valuation survey. In this survey, 178 (20.6%) of the 861 respondents said that they would fish on average an extra 2.59 days. ARAE assumed that (1) The percent of all Bay Delta Salmon anglers who would fish an extra is the same and that they would fish the same number of extra days as in the CVM survey, and (2) the proportion of anglers who target a given fish is the same for all Bay Delta anglers as it is for ARAE's basic angler survey.
• ARE divided 178 (the number willing to spend more days fishing) by 861 (the number CVM1 respondents) to get 20.7% who are willing to fish more days.
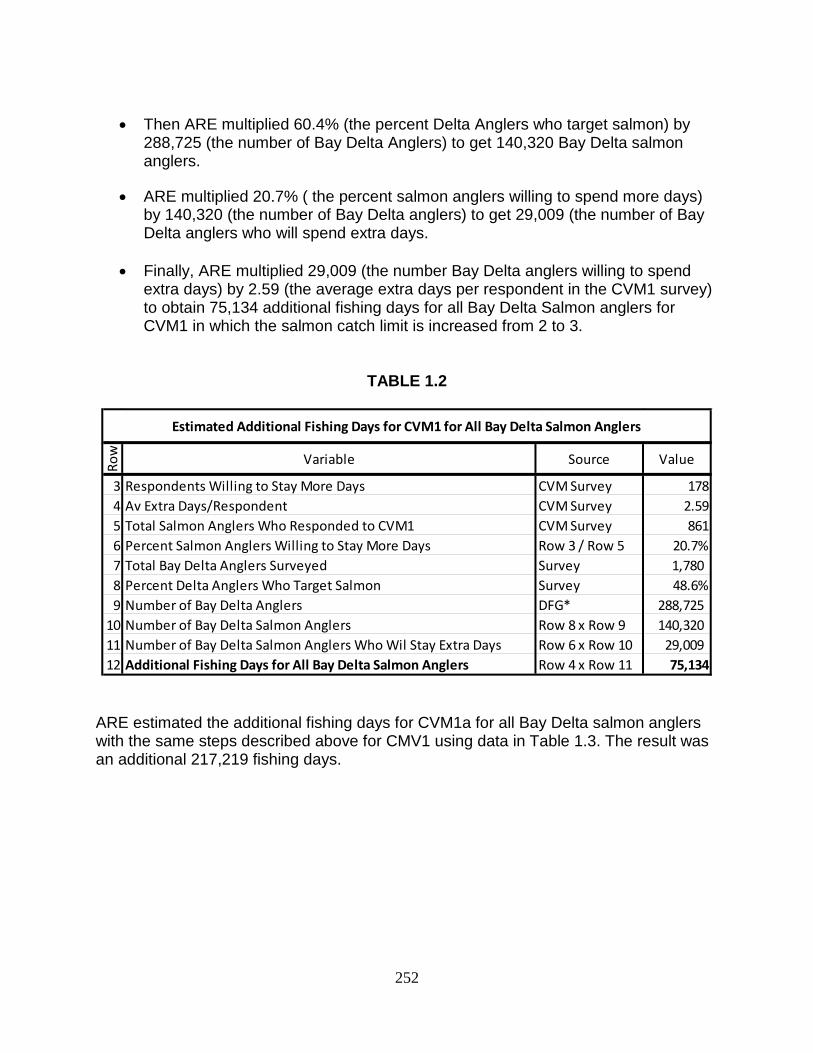
252
• Then ARE multiplied 60.4% (the percent Delta Anglers who target salmon) by
288,725 (the number of Bay Delta Anglers) to get 140,320 Bay Delta salmon anglers.
• ARE multiplied 20.7% ( the percent salmon anglers willing to spend more days) by 140,320 (the number of Bay Delta anglers) to get 29,009 (the number of Bay Delta anglers who will spend extra days.
• Finally, ARE multiplied 29,009 (the number Bay Delta anglers willing to spend
extra days) by 2.59 (the average extra days per respondent in the CVM1 survey) to obtain 75,134 additional fishing days for all Bay Delta Salmon anglers for CVM1 in which the salmon catch limit is increased from 2 to 3.
TABLE 1.2
Estimated Additional Fishing Days for CVM1 for All Bay Delta Salmon Anglers
Row Variable Source Value
3 Respondents Willing to Stay More Days CVM Survey 1784 Av Extra Days/Respondent CVM Survey 2.595 Total Salmon Anglers Who Responded to CVM1 CVM Survey 8616 Percent Salmon Anglers Willing to Stay More Days Row 3 / Row 5 20.7%7 Total Bay Delta Anglers Surveyed Survey 1,780 8 Percent Delta Anglers Who Target Salmon Survey 48.6%9 Number of Bay Delta Anglers DFG* 288,725
10 Number of Bay Delta Salmon Anglers Row 8 x Row 9 140,320 11 Number of Bay Delta Salmon Anglers Who Wil Stay Extra Days Row 6 x Row 10 29,009 12 Additional Fishing Days for All Bay Delta Salmon Anglers Row 4 x Row 11 75,134
ARE estimated the additional fishing days for CVM1a for all Bay Delta salmon anglers with the same steps described above for CMV1 using data in Table 1.3. The result was an additional 217,219 fishing days.
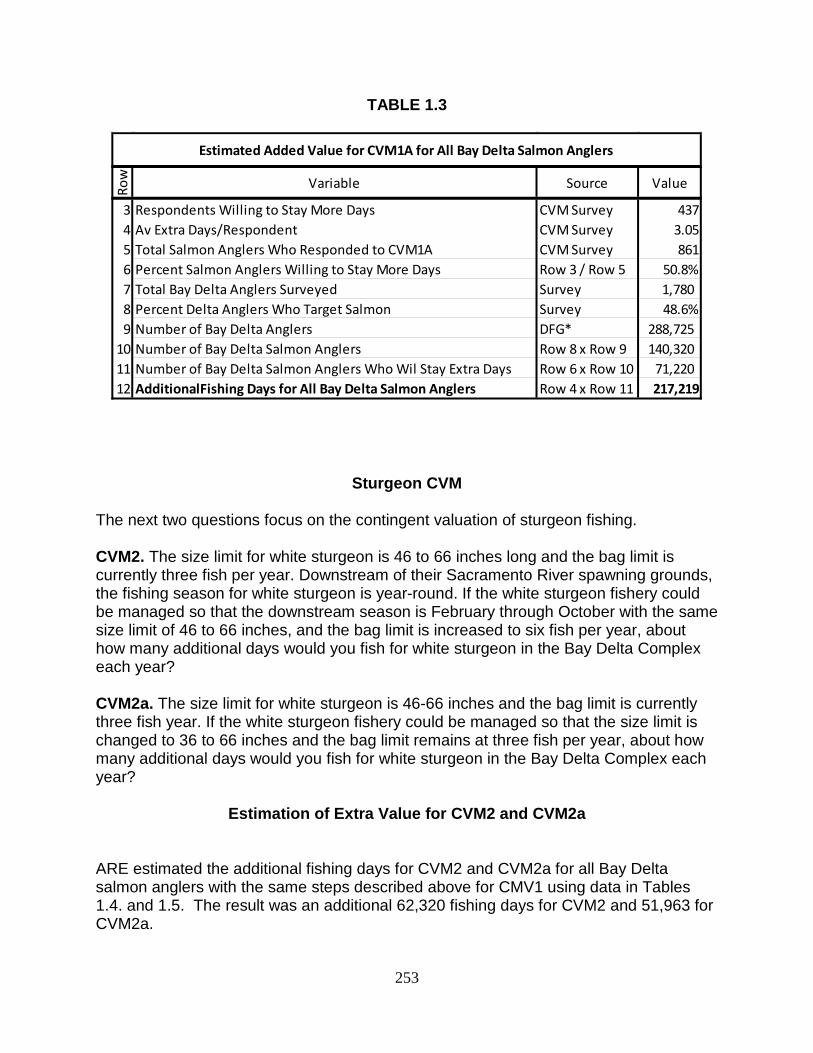
253
TABLE 1.3
Estimated Added Value for CVM1A for All Bay Delta Salmon Anglers
Row Variable Source Value
3 Respondents Willing to Stay More Days CVM Survey 4374 Av Extra Days/Respondent CVM Survey 3.055 Total Salmon Anglers Who Responded to CVM1A CVM Survey 8616 Percent Salmon Anglers Willing to Stay More Days Row 3 / Row 5 50.8%7 Total Bay Delta Anglers Surveyed Survey 1,780 8 Percent Delta Anglers Who Target Salmon Survey 48.6%9 Number of Bay Delta Anglers DFG* 288,725
10 Number of Bay Delta Salmon Anglers Row 8 x Row 9 140,320 11 Number of Bay Delta Salmon Anglers Who Wil Stay Extra Days Row 6 x Row 10 71,220 12 AdditionalFishing Days for All Bay Delta Salmon Anglers Row 4 x Row 11 217,219
Sturgeon CVM The next two questions focus on the contingent valuation of sturgeon fishing. CVM2. The size limit for white sturgeon is 46 to 66 inches long and the bag limit is currently three fish per year. Downstream of their Sacramento River spawning grounds, the fishing season for white sturgeon is year-round. If the white sturgeon fishery could be managed so that the downstream season is February through October with the same size limit of 46 to 66 inches, and the bag limit is increased to six fish per year, about how many additional days would you fish for white sturgeon in the Bay Delta Complex each year? CVM2a. The size limit for white sturgeon is 46-66 inches and the bag limit is currently three fish year. If the white sturgeon fishery could be managed so that the size limit is changed to 36 to 66 inches and the bag limit remains at three fish per year, about how many additional days would you fish for white sturgeon in the Bay Delta Complex each year?
Estimation of Extra Value for CVM2 and CVM2a ARE estimated the additional fishing days for CVM2 and CVM2a for all Bay Delta salmon anglers with the same steps described above for CMV1 using data in Tables 1.4. and 1.5. The result was an additional 62,320 fishing days for CVM2 and 51,963 for CVM2a.
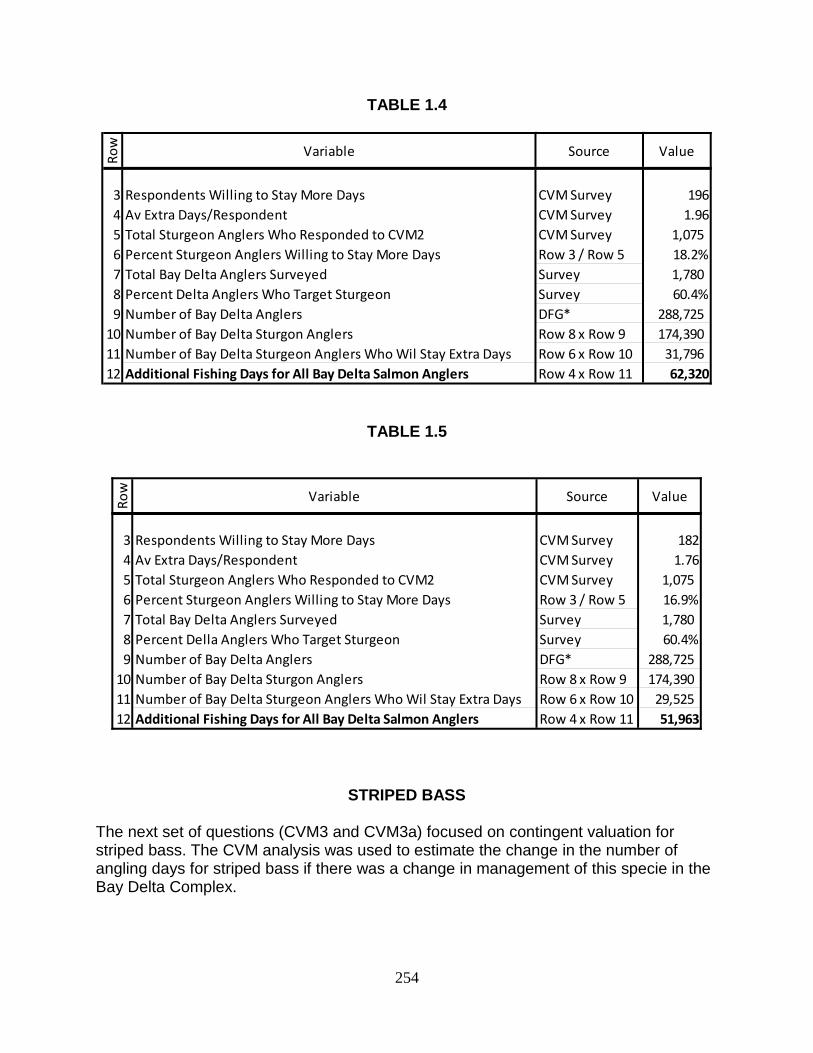
254
TABLE 1.4
Row Variable Source Value
3 Respondents Willing to Stay More Days CVM Survey 1964 Av Extra Days/Respondent CVM Survey 1.965 Total Sturgeon Anglers Who Responded to CVM2 CVM Survey 1,075 6 Percent Sturgeon Anglers Willing to Stay More Days Row 3 / Row 5 18.2%7 Total Bay Delta Anglers Surveyed Survey 1,780 8 Percent Delta Anglers Who Target Sturgeon Survey 60.4%9 Number of Bay Delta Anglers DFG* 288,725
10 Number of Bay Delta Sturgon Anglers Row 8 x Row 9 174,390 11 Number of Bay Delta Sturgeon Anglers Who Wil Stay Extra Days Row 6 x Row 10 31,796 12 Additional Fishing Days for All Bay Delta Salmon Anglers Row 4 x Row 11 62,320
TABLE 1.5
Row Variable Source Value
3 Respondents Willing to Stay More Days CVM Survey 1824 Av Extra Days/Respondent CVM Survey 1.765 Total Sturgeon Anglers Who Responded to CVM2 CVM Survey 1,075 6 Percent Sturgeon Anglers Willing to Stay More Days Row 3 / Row 5 16.9%7 Total Bay Delta Anglers Surveyed Survey 1,780 8 Percent Della Anglers Who Target Sturgeon Survey 60.4%9 Number of Bay Delta Anglers DFG* 288,725
10 Number of Bay Delta Sturgon Anglers Row 8 x Row 9 174,390 11 Number of Bay Delta Sturgeon Anglers Who Wil Stay Extra Days Row 6 x Row 10 29,525 12 Additional Fishing Days for All Bay Delta Salmon Anglers Row 4 x Row 11 51,963
STRIPED BASS
The next set of questions (CVM3 and CVM3a) focused on contingent valuation for striped bass. The CVM analysis was used to estimate the change in the number of angling days for striped bass if there was a change in management of this specie in the Bay Delta Complex.
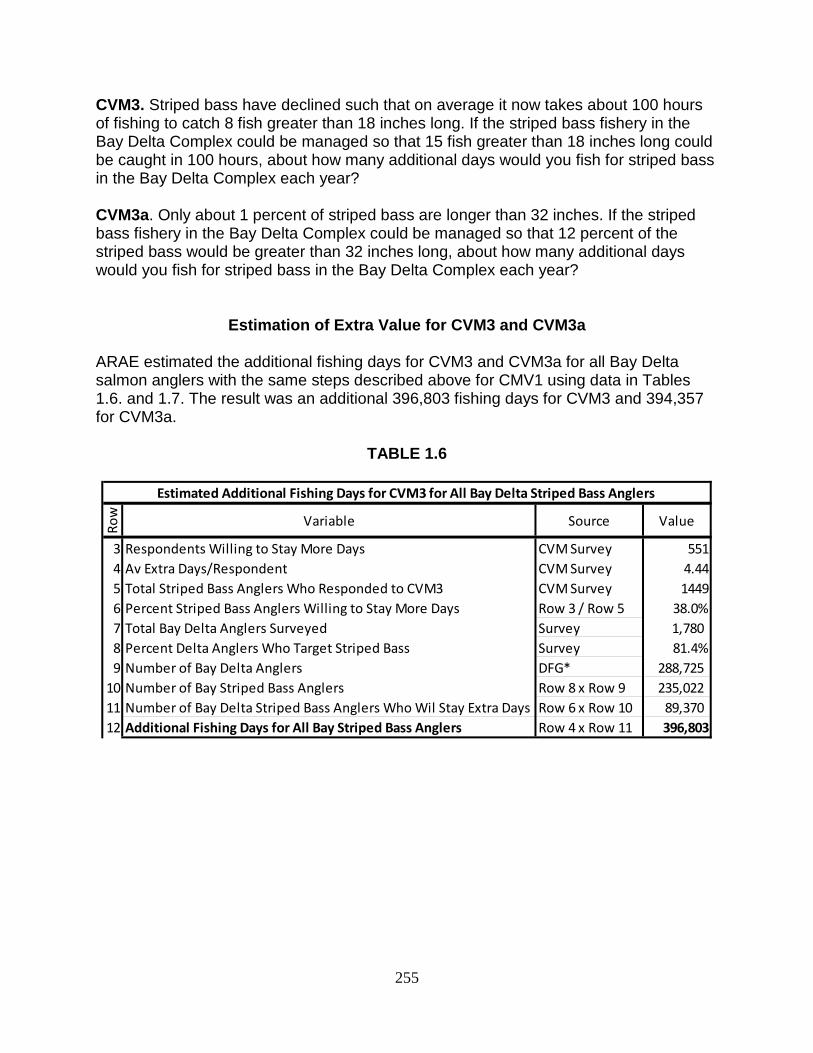
255
CVM3. Striped bass have declined such that on average it now takes about 100 hours of fishing to catch 8 fish greater than 18 inches long. If the striped bass fishery in the Bay Delta Complex could be managed so that 15 fish greater than 18 inches long could be caught in 100 hours, about how many additional days would you fish for striped bass in the Bay Delta Complex each year? CVM3a. Only about 1 percent of striped bass are longer than 32 inches. If the striped bass fishery in the Bay Delta Complex could be managed so that 12 percent of the striped bass would be greater than 32 inches long, about how many additional days would you fish for striped bass in the Bay Delta Complex each year?
Estimation of Extra Value for CVM3 and CVM3a ARAE estimated the additional fishing days for CVM3 and CVM3a for all Bay Delta salmon anglers with the same steps described above for CMV1 using data in Tables 1.6. and 1.7. The result was an additional 396,803 fishing days for CVM3 and 394,357 for CVM3a.
TABLE 1.6
Estimated Additional Fishing Days for CVM3 for All Bay Delta Striped Bass Anglers
Row Variable Source Value
3 Respondents Willing to Stay More Days CVM Survey 5514 Av Extra Days/Respondent CVM Survey 4.445 Total Striped Bass Anglers Who Responded to CVM3 CVM Survey 14496 Percent Striped Bass Anglers Willing to Stay More Days Row 3 / Row 5 38.0%7 Total Bay Delta Anglers Surveyed Survey 1,780 8 Percent Delta Anglers Who Target Striped Bass Survey 81.4%9 Number of Bay Delta Anglers DFG* 288,725
10 Number of Bay Striped Bass Anglers Row 8 x Row 9 235,022 11 Number of Bay Delta Striped Bass Anglers Who Wil Stay Extra Days Row 6 x Row 10 89,370 12 Additional Fishing Days for All Bay Striped Bass Anglers Row 4 x Row 11 396,803
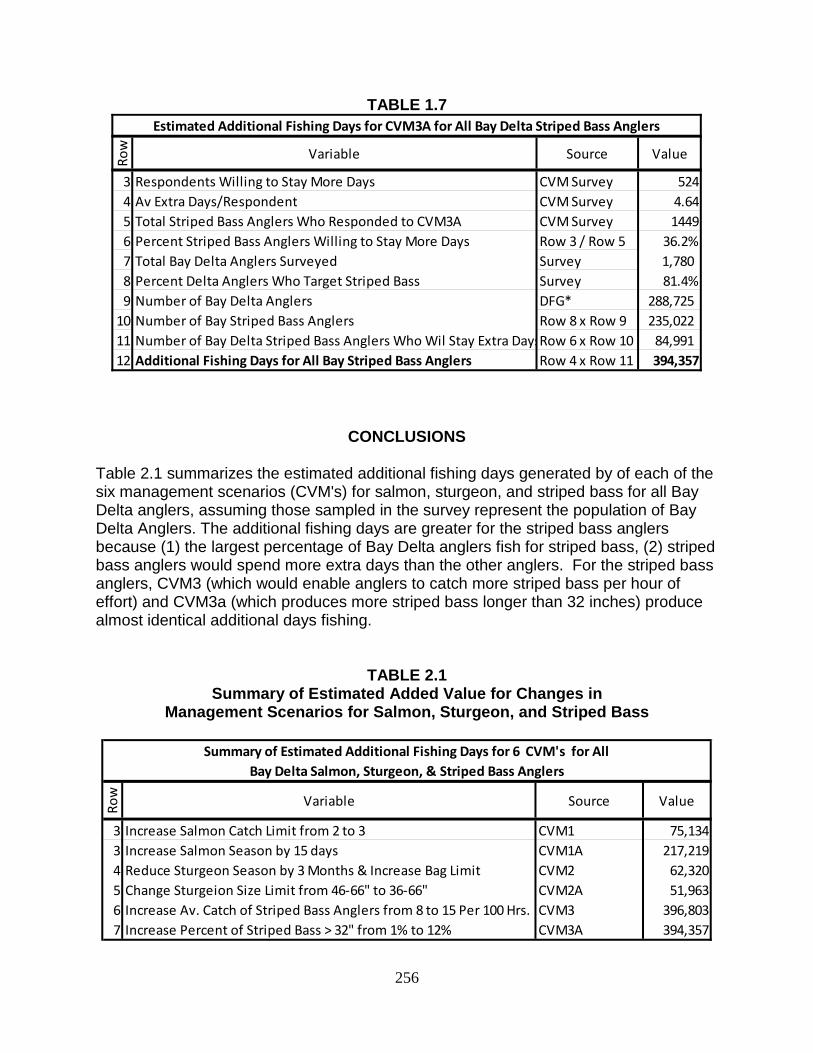
256
TABLE 1.7 Estimated Additional Fishing Days for CVM3A for All Bay Delta Striped Bass Anglers
Row Variable Source Value
3 Respondents Willing to Stay More Days CVM Survey 5244 Av Extra Days/Respondent CVM Survey 4.645 Total Striped Bass Anglers Who Responded to CVM3A CVM Survey 14496 Percent Striped Bass Anglers Willing to Stay More Days Row 3 / Row 5 36.2%7 Total Bay Delta Anglers Surveyed Survey 1,780 8 Percent Delta Anglers Who Target Striped Bass Survey 81.4%9 Number of Bay Delta Anglers DFG* 288,725
10 Number of Bay Striped Bass Anglers Row 8 x Row 9 235,022 11 Number of Bay Delta Striped Bass Anglers Who Wil Stay Extra DaysRow 6 x Row 10 84,991 12 Additional Fishing Days for All Bay Striped Bass Anglers Row 4 x Row 11 394,357
CONCLUSIONS
Table 2.1 summarizes the estimated additional fishing days generated by of each of the six management scenarios (CVM's) for salmon, sturgeon, and striped bass for all Bay Delta anglers, assuming those sampled in the survey represent the population of Bay Delta Anglers. The additional fishing days are greater for the striped bass anglers because (1) the largest percentage of Bay Delta anglers fish for striped bass, (2) striped bass anglers would spend more extra days than the other anglers. For the striped bass anglers, CVM3 (which would enable anglers to catch more striped bass per hour of effort) and CVM3a (which produces more striped bass longer than 32 inches) produce almost identical additional days fishing.
TABLE 2.1
Summary of Estimated Added Value for Changes in Management Scenarios for Salmon, Sturgeon, and Striped Bass
Summary of Estimated Additional Fishing Days for 6 CVM's for All
Bay Delta Salmon, Sturgeon, & Striped Bass Anglers
Row Variable Source Value
3 Increase Salmon Catch Limit from 2 to 3 CVM1 75,1343 Increase Salmon Season by 15 days CVM1A 217,2194 Reduce Sturgeon Season by 3 Months & Increase Bag Limit CVM2 62,3205 Change Sturgeion Size Limit from 46-66" to 36-66" CVM2A 51,9636 Increase Av. Catch of Striped Bass Anglers from 8 to 15 Per 100 Hrs. CVM3 396,8037 Increase Percent of Striped Bass > 32" from 1% to 12% CVM3A 394,357
257
The second highest additional fishing days would go to the salmon anglers. CVM1a, (which increases the salmon season by 15 days) is much more popular than CVM1 (which increases the catch limit from 2 to 3 salmon). The least beneficial management changes (CVM's) are those for sturgeon anglers. A smaller percentage of sturgeon anglers were willing to fish extra days in response to the benefits of the management changes, and those who did were willing to add fewer than two days of fishing effort per year on the average.
258
ECONOMIC IMPACT ANALYSIS
By Jon Ebeling, Ph.D.
and Frederica Shockley, Ph.D.
Introduction In 2009 Bay Delta Complex anglers created more than 6,600 jobs, almost $270 million labor income, and almost $.5 billion output in the 31 counties in the Bay Delta Complex. In this report, note that jobs can be either full-time or part-time since the model used, IMPLAN, does not produce full-time equivalent counts. All dollar amounts in this report that are produced by IMPLAN are 2010 values. About 1.2 million Californians 16 and older are fresh-water anglers and they spend an average of $119 per day while fishing an average of 12 days per year according to the 2006 National Survey of Fishing, Hunting, and Wildlife-Associated Recreation. In the survey that Applied Research and Evaluation (ARE) conducted about 74% of anglers fished in the Bay Delta Complex in the last 3 years and each fishing party spent an average of $9,943 per year while fishing an average of 26 days per year. Since each fishing party had an average of 2.6 persons, the average angler expenditure was $3,753 per year, or about $147 per day. Note that ARE conducted this survey in 2010 and asked respondents to recall the average amount that they spent in 2007 - 2009. Consequently, the survey expenditure data should reflect 2008 dollars. The Program for Applied Research and Evaluation at California State University, Chico conducted an economic analysis of the impact of fishing for Striped Bass, Steelhead, Black Bass, Halibut, Sturgeon and Chinook Salmon in the Sacramento and San Joaquin River systems (Bay Delta Complex) for the California Department of Fish and Game (DFG). This research focused on three regions in the northern part of California: (1) the San Francisco Bay and its ocean environment including the areas just north of the entrance to the Bay and just south of the entrance to the Bay; (2) the Sacramento River watershed; and (3) the San Joaquin River watershed. The study areas were broken down into counties for the purpose of the economic analysis, and then re-aggregated to estimate the regional effects of the economic factors being studied here. This study examined the economic effects of anglers’ spending on 31 northern California counties listed on page 1 of this report.
Angler Expenditure Survey Results and IMPLAN Sectors
ARE used the data from Phase Two to run IMPLAN for estimating the impacts on jobs, income, and output. IMPLAN is an input-output model developed by the U. S. Department of Agriculture, Office of Emergency Services and the University of
259
Minnesota, Department of Agricultural and Applied Economics. Input-output models are unique in that they are the only method of analysis that permits the user to determine the impact of a change in one industry on all other industries in the region. With the use of such models, it is possible to trace the impact of an initial (or primary) change in net expenditures through other industries in the economy to determine the ultimate change in industrial output, income and jobs within the region. IMPLAN generates estimates of other primary changes as well as secondary and tertiary changes. Primary impacts in an economy are the initial changes in spending for such items as fishing guides and boats. The primary changes in spending are like a snowball that someone starts rolling at the top of a hill. As the snowball rolls down the hill, it grows larger; as the primary effects ripple through the economy, industrial output changes. Secondary impacts are caused by the primary changes in spending. They result when expanding or contracting businesses vary the purchase of supplies and services from other firms, causing production and jobs to change. For example, when a boat retailer sells more boats, the retailer may increase the expenditures for inputs such as electricity from the local utilities and workers from the local area. These changes cause the snowball to grow as it rolls down the hill. Tertiary impacts result when workers and property owners spending varies in response to primary and secondary impacts. For example, retail workers hired to sell more boats may buy more medical services. The result will be increased production and more jobs in medical facilities. Thus, tertiary changes, as well as secondary changes, cause the snowball to grow as it rolls down the hill.
Estimation of the Number of Anglers in the 3 Regions
ARE used data from DFG as shown in the following table to estimate the number of Bay Delta anglers. Because respondents to the angler expenditure survey were asked to give estimated average expenditures for the last 3 years (2007 - 2009), ARE used the average number of Bay Delta enhancements purchased for the same period. The average was 288,725, as shown in the following table.
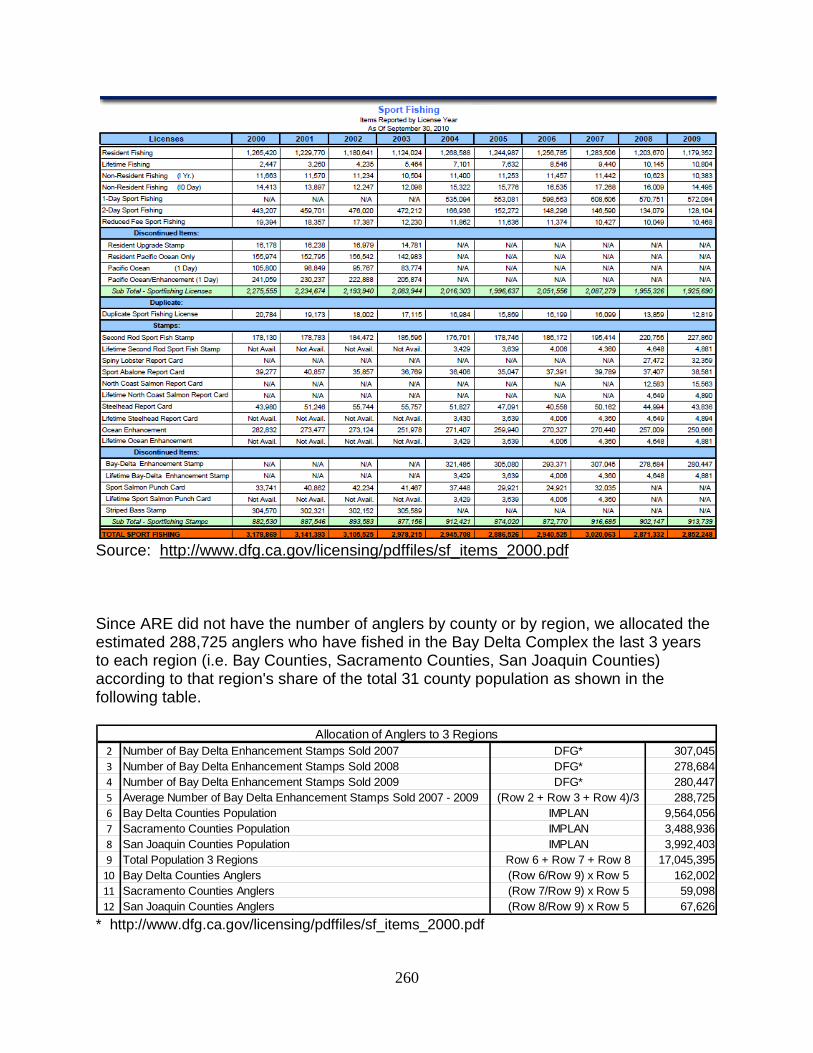
260
Source: http://www.dfg.ca.gov/licensing/pdffiles/sf_items_2000.pdf Since ARE did not have the number of anglers by county or by region, we allocated the estimated 288,725 anglers who have fished in the Bay Delta Complex the last 3 years to each region (i.e. Bay Counties, Sacramento Counties, San Joaquin Counties) according to that region's share of the total 31 county population as shown in the following table.
Allocation of Anglers to 3 Regions2 Number of Bay Delta Enhancement Stamps Sold 2007 DFG* 307,0453 Number of Bay Delta Enhancement Stamps Sold 2008 DFG* 278,6844 Number of Bay Delta Enhancement Stamps Sold 2009 DFG* 280,4475 Average Number of Bay Delta Enhancement Stamps Sold 2007 - 2009 (Row 2 + Row 3 + Row 4)/3 288,7256 Bay Delta Counties Population IMPLAN 9,564,0567 Sacramento Counties Population IMPLAN 3,488,9368 San Joaquin Counties Population IMPLAN 3,992,4039 Total Population 3 Regions Row 6 + Row 7 + Row 8 17,045,395
10 Bay Delta Counties Anglers (Row 6/Row 9) x Row 5 162,00211 Sacramento Counties Anglers (Row 7/Row 9) x Row 5 59,09812 San Joaquin Counties Anglers (Row 8/Row 9) x Row 5 67,626
* http://www.dfg.ca.gov/licensing/pdffiles/sf_items_2000.pdf
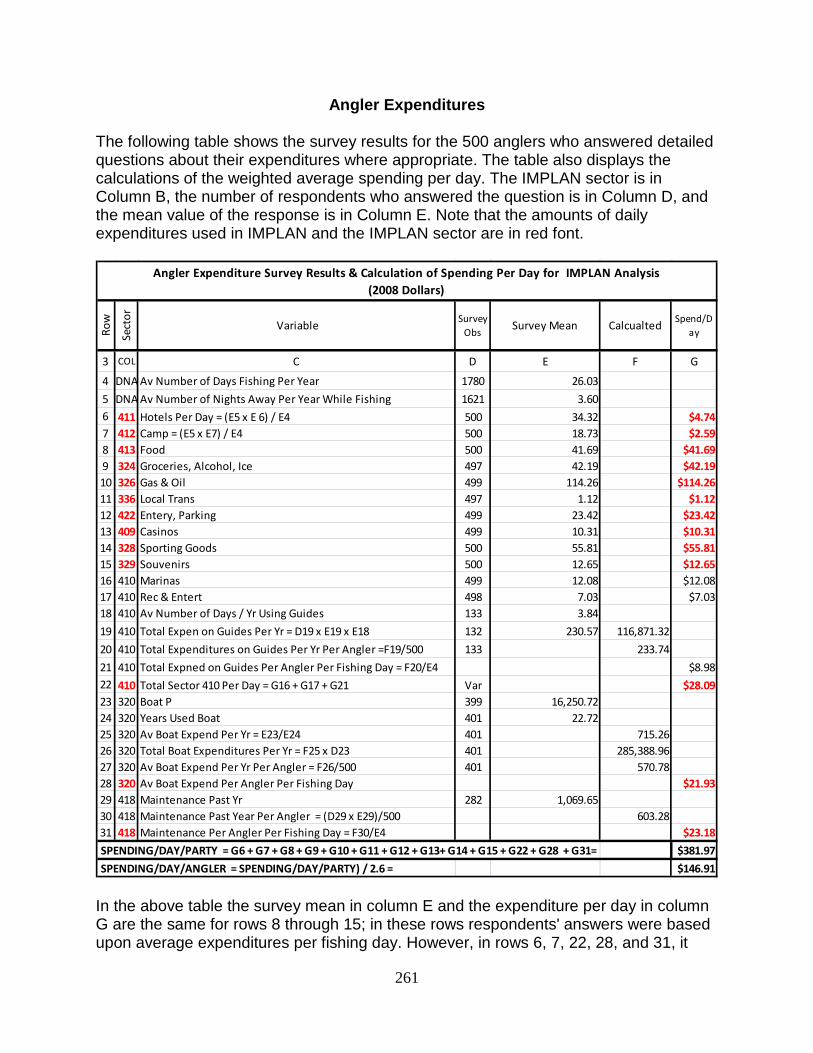
261
Angler Expenditures
The following table shows the survey results for the 500 anglers who answered detailed questions about their expenditures where appropriate. The table also displays the calculations of the weighted average spending per day. The IMPLAN sector is in Column B, the number of respondents who answered the question is in Column D, and the mean value of the response is in Column E. Note that the amounts of daily expenditures used in IMPLAN and the IMPLAN sector are in red font.
Angler Expenditure Survey Results & Calculation of Spending Per Day for IMPLAN Analysis (2008 Dollars)
Row
Sect
or
Variable Survey Obs Survey Mean Calcualted Spend/D
ay
3 COL C D E F G
4 DNA Av Number of Days Fishing Per Year 1780 26.035 DNA Av Number of Nights Away Per Year While Fishing 1621 3.606 411 Hotels Per Day = (E5 x E 6) / E4 500 34.32 $4.747 412 Camp = (E5 x E7) / E4 500 18.73 $2.598 413 Food 500 41.69 $41.699 324 Groceries, Alcohol, Ice 497 42.19 $42.1910 326 Gas & Oil 499 114.26 $114.2611 336 Local Trans 497 1.12 $1.1212 422 Entery, Parking 499 23.42 $23.4213 409 Casinos 499 10.31 $10.3114 328 Sporting Goods 500 55.81 $55.8115 329 Souvenirs 500 12.65 $12.6516 410 Marinas 499 12.08 $12.0817 410 Rec & Entert 498 7.03 $7.0318 410 Av Number of Days / Yr Using Guides 133 3.8419 410 Total Expen on Guides Per Yr = D19 x E19 x E18 132 230.57 116,871.3220 410 Total Expenditures on Guides Per Yr Per Angler =F19/500 133 233.7421 410 Total Expned on Guides Per Angler Per Fishing Day = F20/E4 $8.9822 410 Total Sector 410 Per Day = G16 + G17 + G21 Var $28.0923 320 Boat P 399 16,250.7224 320 Years Used Boat 401 22.7225 320 Av Boat Expend Per Yr = E23/E24 401 715.2626 320 Total Boat Expenditures Per Yr = F25 x D23 401 285,388.9627 320 Av Boat Expend Per Yr Per Angler = F26/500 401 570.7828 320 Av Boat Expend Per Angler Per Fishing Day $21.9329 418 Maintenance Past Yr 282 1,069.6530 418 Maintenance Past Year Per Angler = (D29 x E29)/500 603.2831 418 Maintenance Per Angler Per Fishing Day = F30/E4 $23.18 SPENDING/DAY/PARTY = G6 + G7 + G8 + G9 + G10 + G11 + G12 + G13+ G14 + G15 + G22 + G28 + G31= $381.97 SPENDING/DAY/ANGLER = SPENDING/DAY/PARTY) / 2.6 = $146.91
In the above table the survey mean in column E and the expenditure per day in column G are the same for rows 8 through 15; in these rows respondents' answers were based upon average expenditures per fishing day. However, in rows 6, 7, 22, 28, and 31, it
262
was necessary to calculate a weighted average expenditure per day since answers were not based upon average expenditure per fishing day. For example in rows 6 and 7, answers were based upon the number of nights away per year while fishing. In order to get the average expenditure per day in Column G, $34.32 = Average spent on hotel per day (Low because some spent $0.) x 3.6 = Average number of nights away $123.44 = Average total expenditures on hotels $123.44 / 26.03 = $4.74 = Average total expenditures on hotels per 26.03 days fishing Per Year Thus, $4.74 is the weighted average that each angler spent on hotels per fishing day. Camp fees in row 7 were calculated in a similar manner. Calculating the weighted average expenditures for guides and boats was more complicated because the number of respondents, shown in column D, was less than the entire sample of 500. $230.57 = Average expenditure per day on guides x 132 = Number of respondents who hired guides x 3.84 = Average number of days respondents hired guides $116,871.32 = Average total expenditures on guides $116,871.32 / 500 = $233.74 = Weighted average total expenditures for all 500 anglers on guides $233.74 / 26.03 = $8.98 = Weighted average expenditures on guides per angler per day The weighted average amount spent to purchase boats and for boat maintenance was calculated in a manner similar to the weighted average spent for guides. The sum of Column G is $381.97 which is the weighted average expenditure per fishing
party per day. Dividing this expenditure by 2.6, the average number of anglers per party, yields an average expenditure per angler of $146.91.
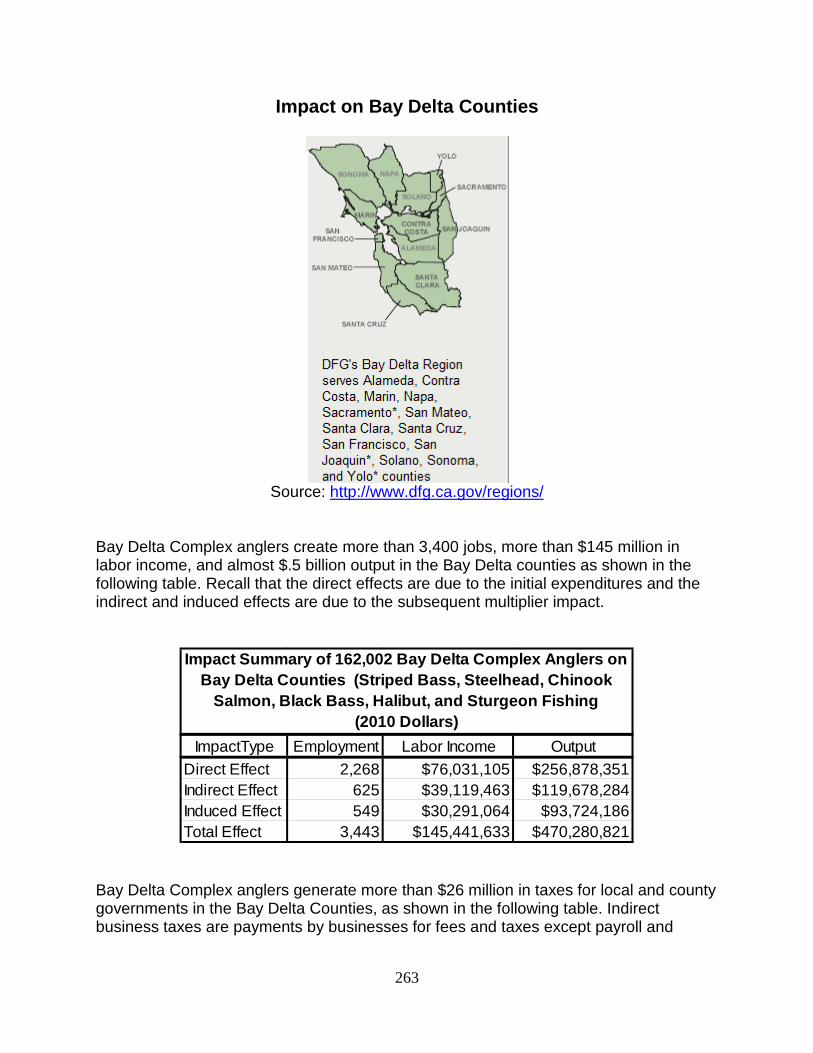
263
Impact on Bay Delta Counties
Source: http://www.dfg.ca.gov/regions/
Bay Delta Complex anglers create more than 3,400 jobs, more than $145 million in labor income, and almost $.5 billion output in the Bay Delta counties as shown in the following table. Recall that the direct effects are due to the initial expenditures and the indirect and induced effects are due to the subsequent multiplier impact.
Impact Summary of 162,002 Bay Delta Complex Anglers on
Bay Delta Counties (Striped Bass, Steelhead, Chinook Salmon, Black Bass, Halibut, and Sturgeon Fishing
(2010 Dollars)ImpactType Employment Labor Income Output
Direct Effect 2,268 $76,031,105 $256,878,351Indirect Effect 625 $39,119,463 $119,678,284Induced Effect 549 $30,291,064 $93,724,186Total Effect 3,443 $145,441,633 $470,280,821
Bay Delta Complex anglers generate more than $26 million in taxes for local and county governments in the Bay Delta Counties, as shown in the following table. Indirect business taxes are payments by businesses for fees and taxes except payroll and
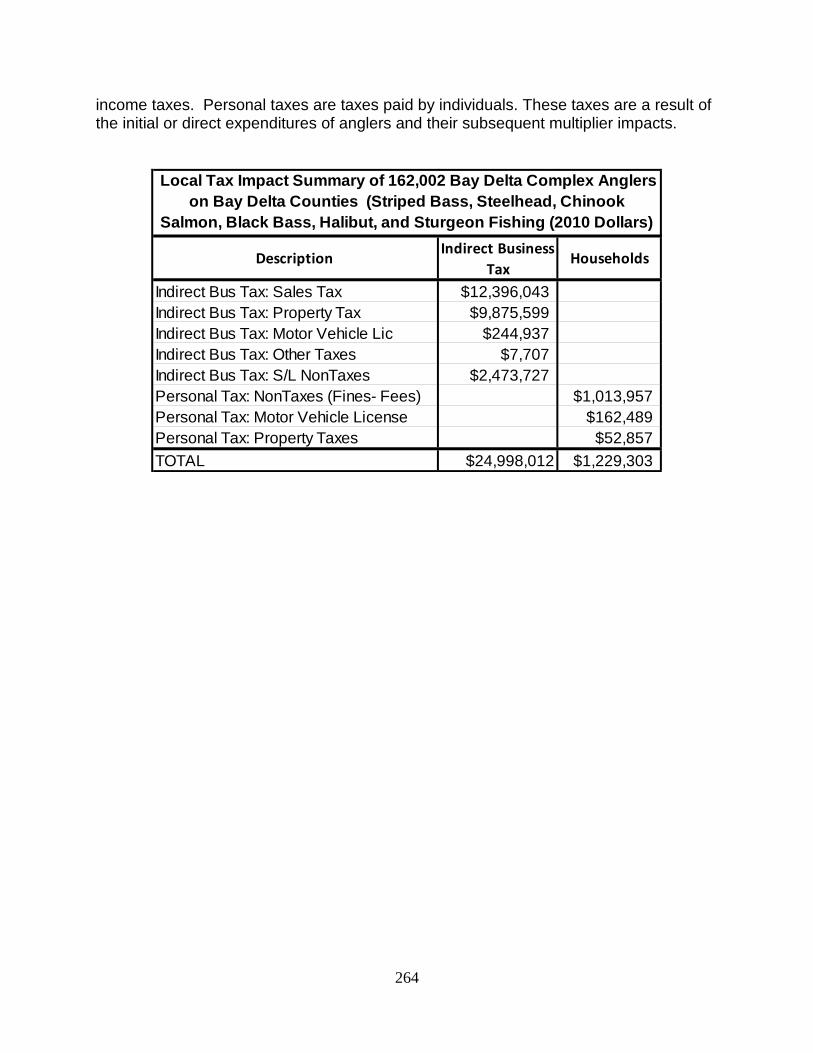
264
income taxes. Personal taxes are taxes paid by individuals. These taxes are a result of the initial or direct expenditures of anglers and their subsequent multiplier impacts.
Local Tax Impact Summary of 162,002 Bay Delta Complex Anglers
on Bay Delta Counties (Striped Bass, Steelhead, Chinook Salmon, Black Bass, Halibut, and Sturgeon Fishing (2010 Dollars)
Description Indirect Business Tax
Households
Indirect Bus Tax: Sales Tax $12,396,043Indirect Bus Tax: Property Tax $9,875,599Indirect Bus Tax: Motor Vehicle Lic $244,937Indirect Bus Tax: Other Taxes $7,707Indirect Bus Tax: S/L NonTaxes $2,473,727Personal Tax: NonTaxes (Fines- Fees) $1,013,957Personal Tax: Motor Vehicle License $162,489Personal Tax: Property Taxes $52,857TOTAL $24,998,012 $1,229,303
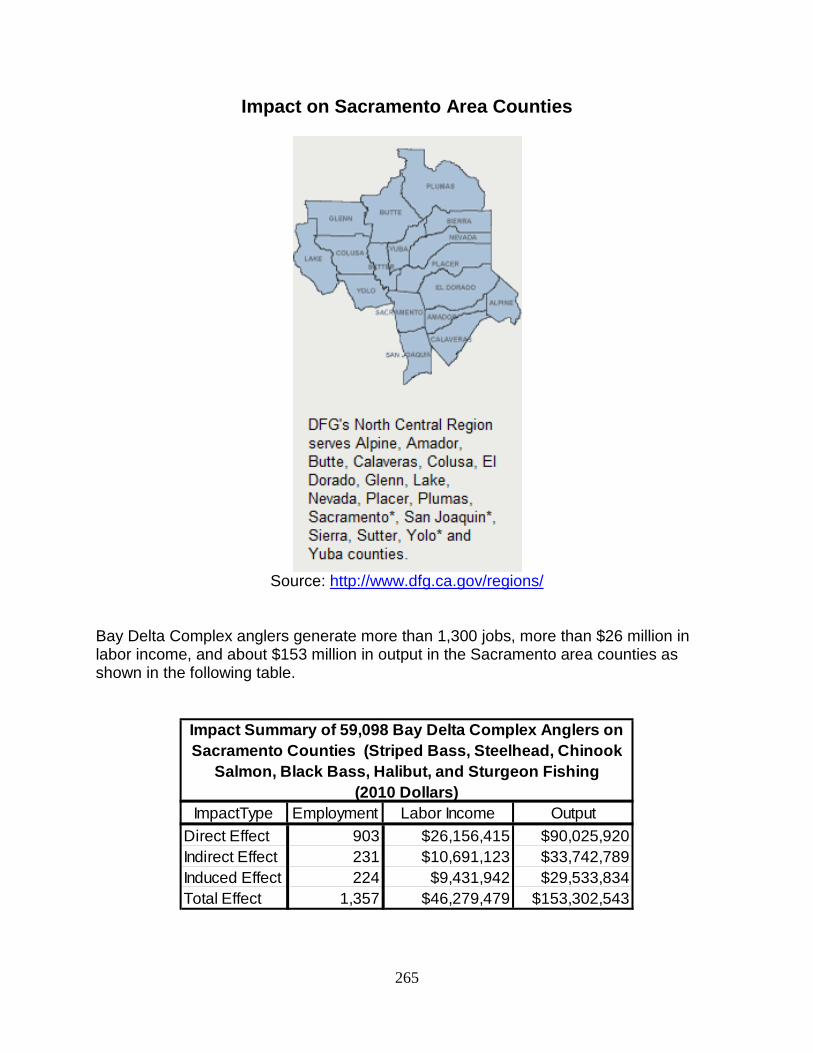
265
Impact on Sacramento Area Counties
Source: http://www.dfg.ca.gov/regions/
Bay Delta Complex anglers generate more than 1,300 jobs, more than $26 million in labor income, and about $153 million in output in the Sacramento area counties as shown in the following table.
Impact Summary of 59,098 Bay Delta Complex Anglers on Sacramento Counties (Striped Bass, Steelhead, Chinook
Salmon, Black Bass, Halibut, and Sturgeon Fishing (2010 Dollars)
ImpactType Employment Labor Income OutputDirect Effect 903 $26,156,415 $90,025,920Indirect Effect 231 $10,691,123 $33,742,789Induced Effect 224 $9,431,942 $29,533,834Total Effect 1,357 $46,279,479 $153,302,543
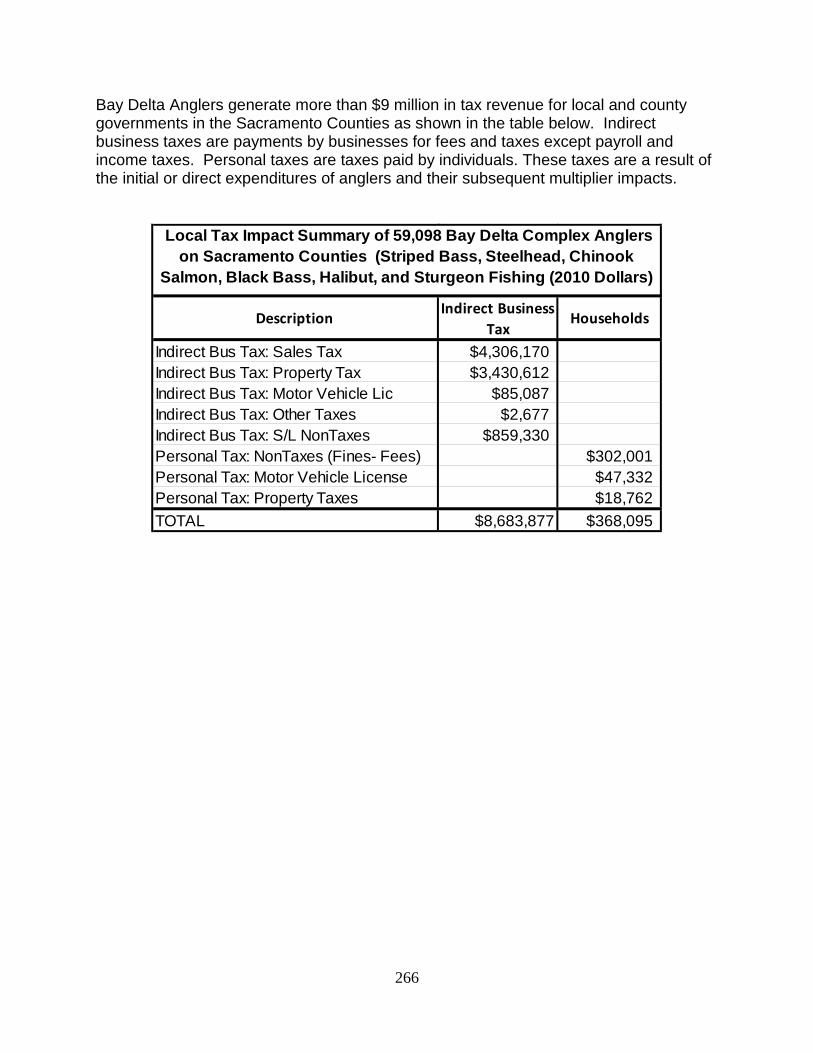
266
Bay Delta Anglers generate more than $9 million in tax revenue for local and county governments in the Sacramento Counties as shown in the table below. Indirect business taxes are payments by businesses for fees and taxes except payroll and income taxes. Personal taxes are taxes paid by individuals. These taxes are a result of the initial or direct expenditures of anglers and their subsequent multiplier impacts.
Local Tax Impact Summary of 59,098 Bay Delta Complex Anglers on Sacramento Counties (Striped Bass, Steelhead, Chinook
Salmon, Black Bass, Halibut, and Sturgeon Fishing (2010 Dollars)
Description Indirect Business Tax
Households
Indirect Bus Tax: Sales Tax $4,306,170Indirect Bus Tax: Property Tax $3,430,612Indirect Bus Tax: Motor Vehicle Lic $85,087Indirect Bus Tax: Other Taxes $2,677Indirect Bus Tax: S/L NonTaxes $859,330Personal Tax: NonTaxes (Fines- Fees) $302,001Personal Tax: Motor Vehicle License $47,332Personal Tax: Property Taxes $18,762TOTAL $8,683,877 $368,095
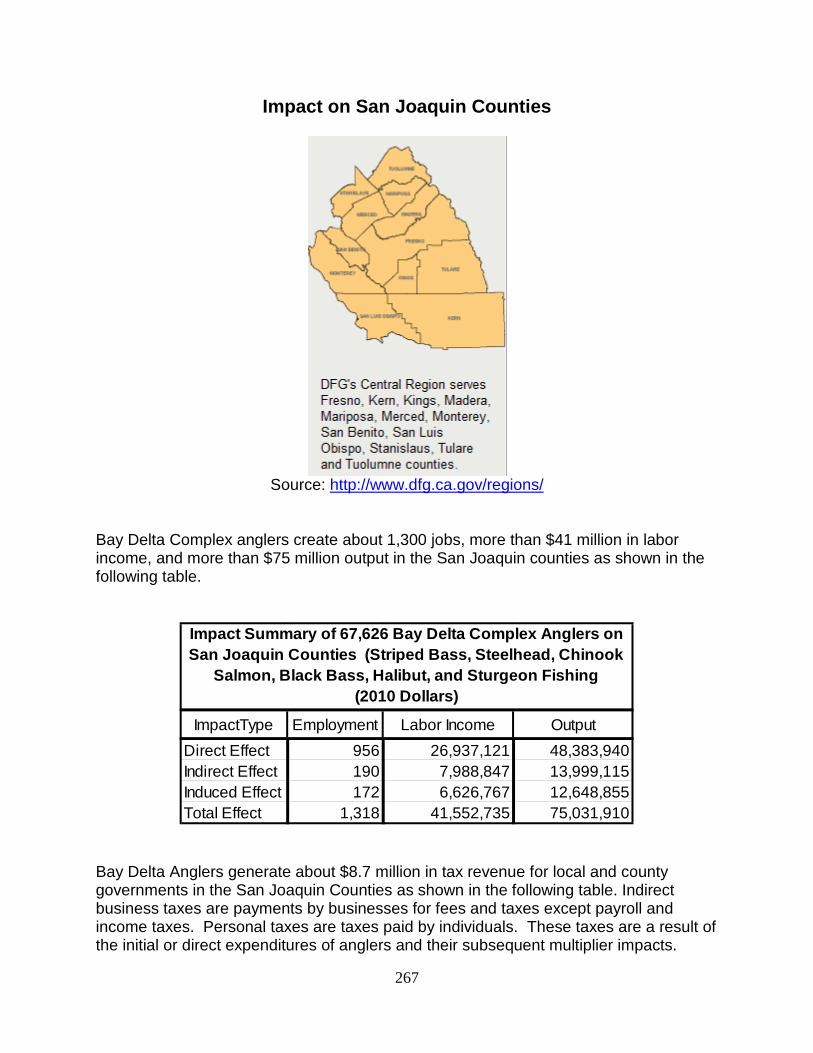
267
Impact on San Joaquin Counties
Source: http://www.dfg.ca.gov/regions/
Bay Delta Complex anglers create about 1,300 jobs, more than $41 million in labor income, and more than $75 million output in the San Joaquin counties as shown in the following table.
Impact Summary of 67,626 Bay Delta Complex Anglers on San Joaquin Counties (Striped Bass, Steelhead, Chinook
Salmon, Black Bass, Halibut, and Sturgeon Fishing (2010 Dollars)
ImpactType Employment Labor Income OutputDirect Effect 956 26,937,121 48,383,940Indirect Effect 190 7,988,847 13,999,115Induced Effect 172 6,626,767 12,648,855Total Effect 1,318 41,552,735 75,031,910
Bay Delta Anglers generate about $8.7 million in tax revenue for local and county governments in the San Joaquin Counties as shown in the following table. Indirect business taxes are payments by businesses for fees and taxes except payroll and income taxes. Personal taxes are taxes paid by individuals. These taxes are a result of the initial or direct expenditures of anglers and their subsequent multiplier impacts.
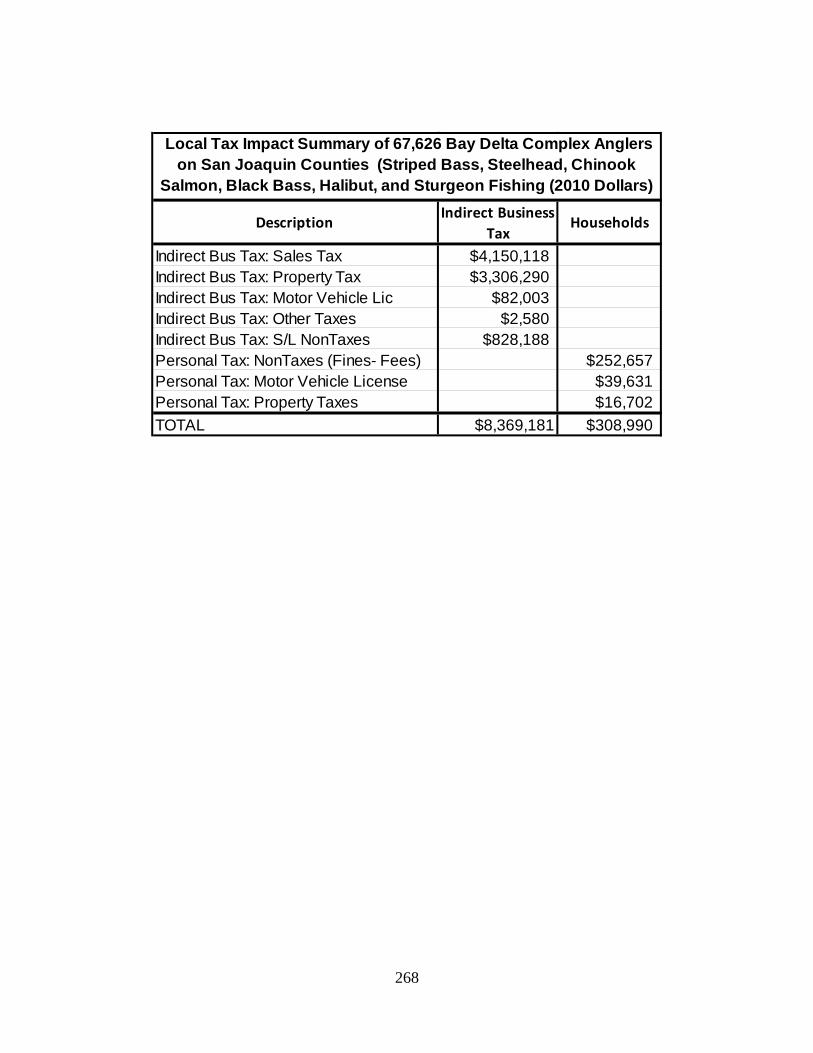
268
Local Tax Impact Summary of 67,626 Bay Delta Complex Anglers on San Joaquin Counties (Striped Bass, Steelhead, Chinook
Salmon, Black Bass, Halibut, and Sturgeon Fishing (2010 Dollars)
Description Indirect Business Tax
Households
Indirect Bus Tax: Sales Tax $4,150,118Indirect Bus Tax: Property Tax $3,306,290Indirect Bus Tax: Motor Vehicle Lic $82,003Indirect Bus Tax: Other Taxes $2,580Indirect Bus Tax: S/L NonTaxes $828,188Personal Tax: NonTaxes (Fines- Fees) $252,657Personal Tax: Motor Vehicle License $39,631Personal Tax: Property Taxes $16,702TOTAL $8,369,181 $308,990
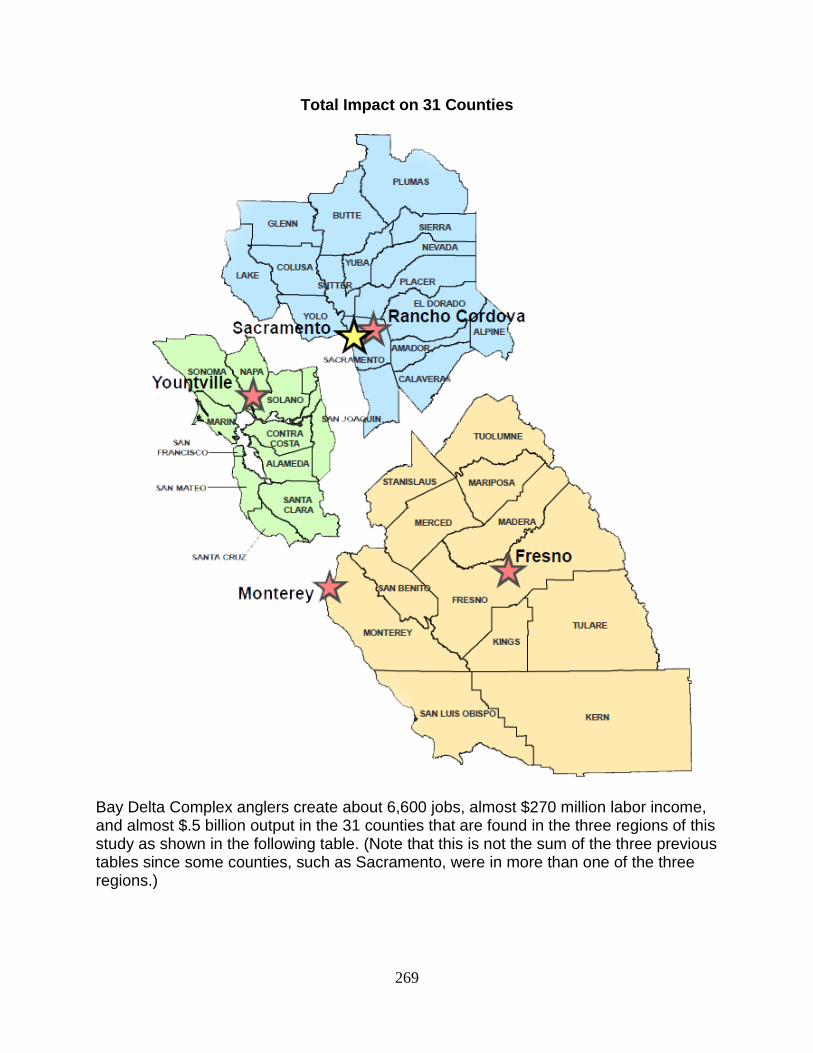
269
Total Impact on 31 Counties
Bay Delta Complex anglers create about 6,600 jobs, almost $270 million labor income, and almost $.5 billion output in the 31 counties that are found in the three regions of this study as shown in the following table. (Note that this is not the sum of the three previous tables since some counties, such as Sacramento, were in more than one of the three regions.)
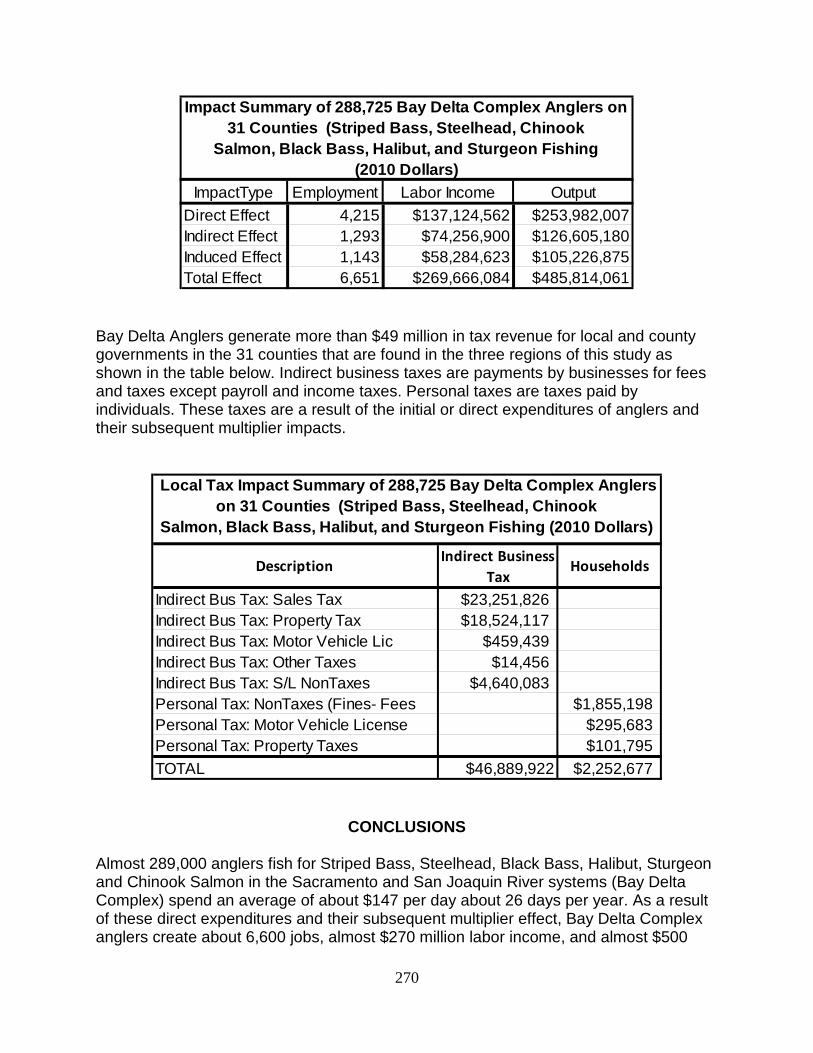
270
Impact Summary of 288,725 Bay Delta Complex Anglers on 31 Counties (Striped Bass, Steelhead, Chinook
Salmon, Black Bass, Halibut, and Sturgeon Fishing (2010 Dollars)
ImpactType Employment Labor Income OutputDirect Effect 4,215 $137,124,562 $253,982,007Indirect Effect 1,293 $74,256,900 $126,605,180Induced Effect 1,143 $58,284,623 $105,226,875Total Effect 6,651 $269,666,084 $485,814,061
Bay Delta Anglers generate more than $49 million in tax revenue for local and county governments in the 31 counties that are found in the three regions of this study as shown in the table below. Indirect business taxes are payments by businesses for fees and taxes except payroll and income taxes. Personal taxes are taxes paid by individuals. These taxes are a result of the initial or direct expenditures of anglers and their subsequent multiplier impacts.
Local Tax Impact Summary of 288,725 Bay Delta Complex Anglers
on 31 Counties (Striped Bass, Steelhead, Chinook Salmon, Black Bass, Halibut, and Sturgeon Fishing (2010 Dollars)
Description Indirect Business Tax
Households
Indirect Bus Tax: Sales Tax $23,251,826Indirect Bus Tax: Property Tax $18,524,117Indirect Bus Tax: Motor Vehicle Lic $459,439Indirect Bus Tax: Other Taxes $14,456Indirect Bus Tax: S/L NonTaxes $4,640,083Personal Tax: NonTaxes (Fines- Fees $1,855,198Personal Tax: Motor Vehicle License $295,683Personal Tax: Property Taxes $101,795TOTAL $46,889,922 $2,252,677
CONCLUSIONS Almost 289,000 anglers fish for Striped Bass, Steelhead, Black Bass, Halibut, Sturgeon and Chinook Salmon in the Sacramento and San Joaquin River systems (Bay Delta Complex) spend an average of about $147 per day about 26 days per year. As a result of these direct expenditures and their subsequent multiplier effect, Bay Delta Complex anglers create about 6,600 jobs, almost $270 million labor income, and almost $500

271
million output income in the 31 counties in the three regions of this study. They also generate more than $49 million in taxes for local and county governments in this 31 county area. In this report note that jobs can be either full-time or part-time since IMPLAN does not produce full-time equivalent counts.
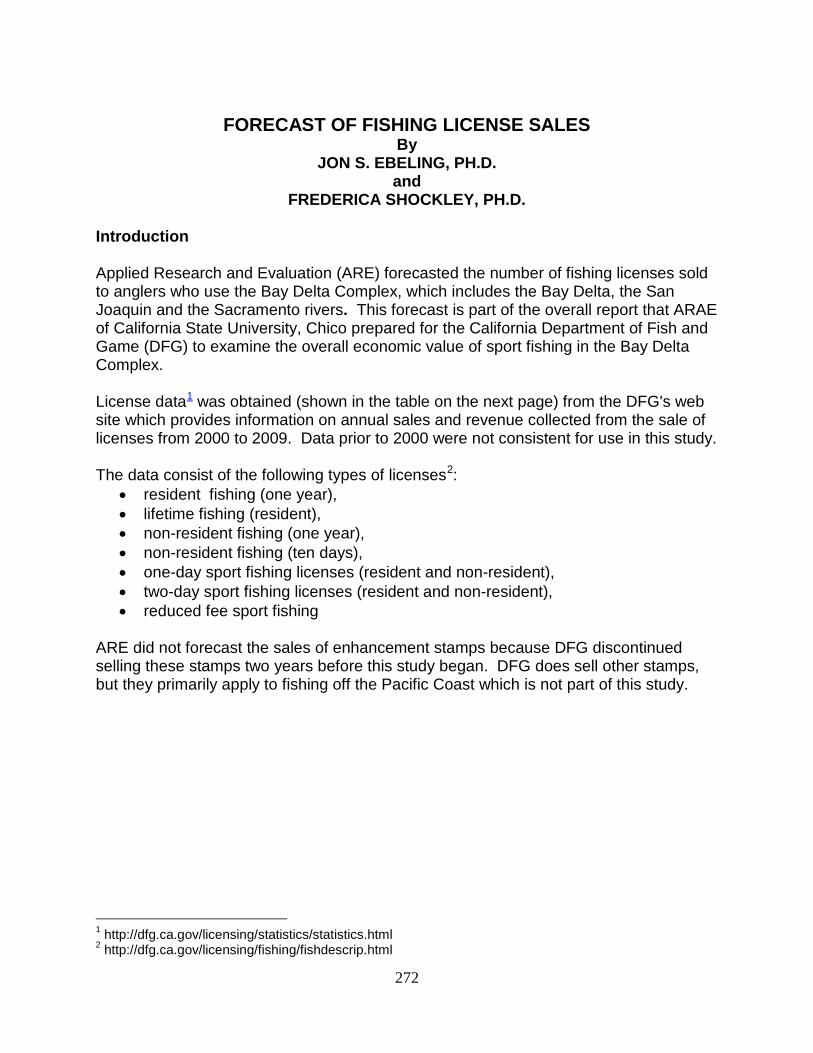
272
FORECAST OF FISHING LICENSE SALES
By JON S. EBELING, PH.D.
and FREDERICA SHOCKLEY, PH.D.
Introduction Applied Research and Evaluation (ARE) forecasted the number of fishing licenses sold to anglers who use the Bay Delta Complex, which includes the Bay Delta, the San Joaquin and the Sacramento rivers. This forecast is part of the overall report that ARAE of California State University, Chico prepared for the California Department of Fish and Game (DFG) to examine the overall economic value of sport fishing in the Bay Delta Complex. License data1 was obtained (shown in the table on the next page) from the DFG's web site which provides information on annual sales and revenue collected from the sale of licenses from 2000 to 2009. Data prior to 2000 were not consistent for use in this study.
The data consist of the following types of licenses2:
• resident fishing (one year), • lifetime fishing (resident), • non-resident fishing (one year), • non-resident fishing (ten days), • one-day sport fishing licenses (resident and non-resident), • two-day sport fishing licenses (resident and non-resident), • reduced fee sport fishing
ARE did not forecast the sales of enhancement stamps because DFG discontinued selling these stamps two years before this study began. DFG does sell other stamps, but they primarily apply to fishing off the Pacific Coast which is not part of this study.
1 http://dfg.ca.gov/licensing/statistics/statistics.html 2 http://dfg.ca.gov/licensing/fishing/fishdescrip.html
273
TABLE 1.1 SPORT FISHING LICENSES BY TYPE3
This table can be found at the following url: http://www.dfg.ca.gov/licensing/pdffiles/sf_items_10yr.pdfhttp://www.dfg.ca.gov/licensing/pdffiles/sf_items_10yr.pdf Measures used as independent variables in this study include the following:
• personal disposable income for California • percent unemployment for California • percent unemployment for the nation • annual population for the Bay Area • California population • California consumer price index (CPI) • national consumer price index (CPI)
3http://www.dfg.ca.gov/licensing/pdffiles/sf_items_10yr.pdfhttp://www.dfg.ca.gov/licensing/pdffiles/sf_items_10yr.pdf
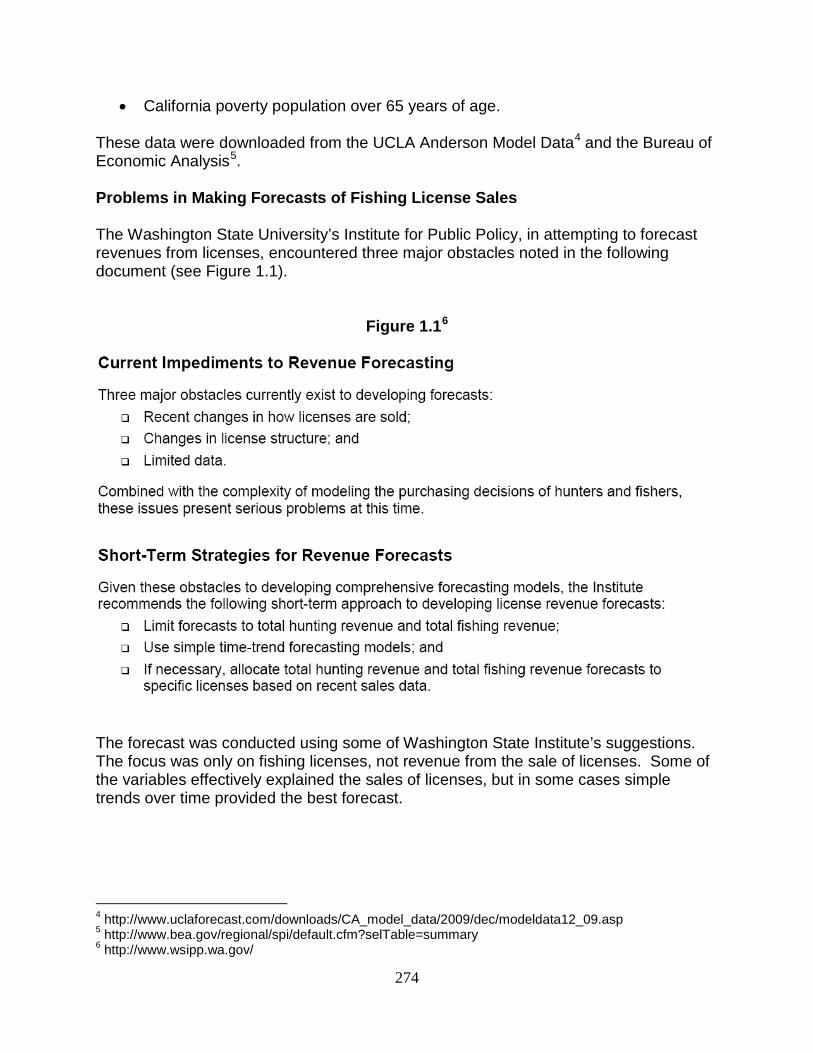
274
• California poverty population over 65 years of age. These data were downloaded from the UCLA Anderson Model Data4 and the Bureau of Economic Analysis5.
Problems in Making Forecasts of Fishing License Sales The Washington State University’s Institute for Public Policy, in attempting to forecast revenues from licenses, encountered three major obstacles noted in the following document (see Figure 1.1).
Figure 1.16
The forecast was conducted using some of Washington State Institute’s suggestions. The focus was only on fishing licenses, not revenue from the sale of licenses. Some of the variables effectively explained the sales of licenses, but in some cases simple trends over time provided the best forecast.
4 http://www.uclaforecast.com/downloads/CA_model_data/2009/dec/modeldata12_09.asp 5 http://www.bea.gov/regional/spi/default.cfm?selTable=summary 6 http://www.wsipp.wa.gov/
275
FORECASTING MODEL This is the general model used for this forecast: L = f (u, pop, y, t)
L = the number of licenses sold u = the unemployment rate pop = population y = per capita disposable income for the nation and for California t = trend in years The dependent variable (L) in this analysis is the number of licenses sold (frequencies of sales of licenses) over time. The number of licenses sold provides a better forecast than revenue from sales of licenses since revenue may change due to changes in license fees. The agency can multiply the forecasted number of licenses sold by the fee to obtain an estimate for future revenue. The model forecasted five years of sales frequencies beginning in the year 2010. As unemployment (u) increases, anglers have less disposable income to spend on fishing, but the opportunity cost of their time fishing is also lower; hence the relationship between (u) and (L) could be either positive or negative. As the population (pop) increases, other things remaining the same, angling is expected to increase. As income (y) increases, anglers can afford to spend more money on fishing, but the opportunity cost of their time also increases; hence the relationship between (y) and (L) could be either positive or negative. Forecasting license sales using time in years (t) picks up relevant trends such as increasing urbanization and increasing numbers of single-female headed households. The trend in years (t) could have a negative relationship to (L) if the increasing female households and increasing urbanization are dominant factors. On the other hand, the relationship between (t) and (L) could be positive if other unknown factors dominate, such as license sales, restructuring, fish management issues, and changes in the weather. The specific variables thought to influence the purchase of sports fishing licenses, and their computer acronyms, are as follows:
• time in years from 2000 to 2009 (t), • personal disposable income in California (pcdisinc), • national personal disposable income (pcdisus), • unemployment rate in California (ueca), • national unemployment rate (natu), • annual population of the bay area (baypop), • annual population of California (calpop)
276
METHODS The number of licenses sold is regressed with the independent variables previously listed, in order to project a five year forecast of the number of licenses sold. Each of the license sales will be analyzed using a set of criteria. That analysis will enable the selection of relevant variables for making predictions over the next five years, beginning with 2010. It is not considered good procedure to forecast beyond five years, especially when there is as small an amount of data as is available here. Regression is the use of data to produce an equation to forecast a variable (in this case number of licenses sold). The regression’s results show the estimated slope of the function that relates license sales to the independent variables and its intercept with the vertical axis in the graph. Stepwise regression was the method used to produce an equation for the forecast. The procedure analyzes all the independent variables to identify which of them meet the criteria for inclusion in the equation. Stepwise regression then produces the remaining set of independent variables. Appendix A presents the names of each of these variables used in the regression programs. Issues with the Data The major problem encountered in this study was getting sufficient data to make a reliable forecast. License data is inconsistently measured in the years prior to 2000, and there have been recent major changes in the methods of license sales from "brick front" stores to online. This change is expected to increase the error in the forecasts and the discrepancy between the forecasts and actual sales of licenses. Consequently, the longest consistent time series that could be obtained was only 10 years. Further, there are problems in that some data are not continuous. For example, one-day sport fishing licenses were not sold from 2000 through 2003. We have attempted to overcome some of these problems by forecasting each type of licenses sold by the DFG instead of forecasting total revenue. This may help to provide a clearer understanding of the short-run future of fishing license sales. It is important to mention that the inflationary impact on revenues for each category of license was forecast relying on the Chained California Consumer Price Index from the 1982-1984 base. 7 Selection Criteria Stepwise regression uses a set of criteria to select those independent variables which accurately predict changes in the dependent variable. This procedure uses the computer to evaluate and eliminate independent variables that do not meet the criteria 7 Steven Landefeld and Robert P. Parker, Survey of Current Business, “Bea’s Chained Indices, Time Series, and Measures of Long Term Economic Growth, May 1997.
277
listed below. In this way, the equation narrows its focus to those independent variables that appear to have some potential value in the forecasting activity. The following criteria were used to determine which variables to present in this report:
• an adjusted R square (R2) of .30 or higher and
• a significant ‘t’ value at p<= .10 for each of the independent variables chosen to be in the equation,
• the direction of the sign of the coefficient in the estimation procedures; if the sign
is contrary to the logic of the expected behaviors of sports anglers, then that variable was excluded.
Regression variables that did not meet the above requirements were dropped from the presentation. Forecasted Variables Measures of licenses sold that were forecasted are as follows:
• rsffr (one-year resident sport fishing licenses), • lflfr (lifetime fishing licenses), • nrlssr (non-resident ten-day licenses), • nsffr (nonresident one year sport fishing licenses), • rfl (reduced fee license for low-income over 65 and disabled veterans), • daylic2 (two day resident and non-resident licenses )
Multiple regressions using several independent variables at the same time did not yield any results with variables that met our criteria for significance. Stepwise regression was used to find those independent variables that seem to have the most significant influence on the dependent variable using a criterion of 10%. If an independent variable shows a significance of 10% or less, then it is included in the estimated equation.
RESULTS SECTION 1 TREND IN NUMBER OF ONE-YEAR RESIDENT FISHING LICENSES SOLD
The equation in Table 1.2 suggests that as the California unemployment rate increases, the purchases of resident fishing licenses decreases. A marginal increase of one percentage point in the unemployment rate will decrease the number of resident sports fishing licenses sold by 42,456. Although unemployment reduces the opportunity cost of taking a day off to fish, apparently this reduction in cost is more than offset by the
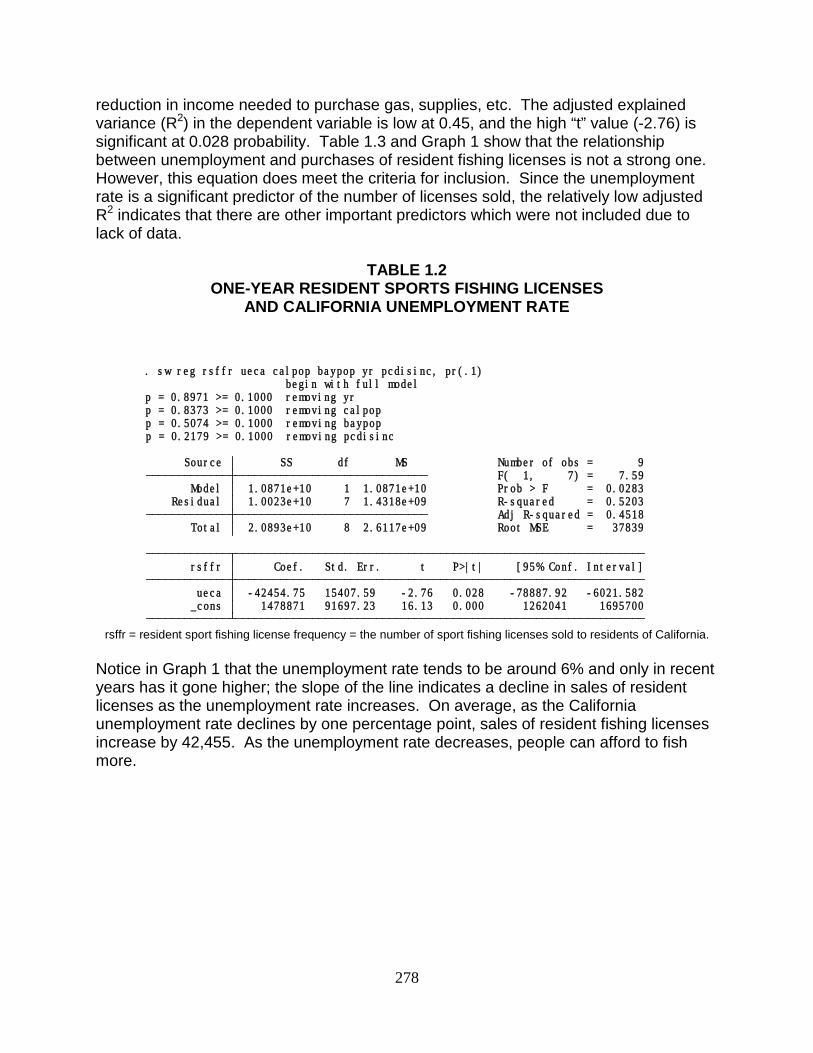
278
reduction in income needed to purchase gas, supplies, etc. The adjusted explained variance (R2) in the dependent variable is low at 0.45, and the high “t” value (-2.76) is significant at 0.028 probability. Table 1.3 and Graph 1 show that the relationship between unemployment and purchases of resident fishing licenses is not a strong one. However, this equation does meet the criteria for inclusion. Since the unemployment rate is a significant predictor of the number of licenses sold, the relatively low adjusted R2 indicates that there are other important predictors which were not included due to lack of data.
TABLE 1.2
ONE-YEAR RESIDENT SPORTS FISHING LICENSES AND CALIFORNIA UNEMPLOYMENT RATE
_cons 1478871 91697.23 16.13 0.000 1262041 1695700 ueca -42454.75 15407.59 -2.76 0.028 -78887.92 -6021.582 rsffr Coef. Std. Err. t P>|t| [95% Conf. Interval]
Total 2.0893e+10 8 2.6117e+09 Root MSE = 37839 Adj R-squared = 0.4518 Residual 1.0023e+10 7 1.4318e+09 R-squared = 0.5203 Model 1.0871e+10 1 1.0871e+10 Prob > F = 0.0283 F( 1, 7) = 7.59 Source SS df MS Number of obs = 9
p = 0.2179 >= 0.1000 removing pcdisincp = 0.5074 >= 0.1000 removing baypopp = 0.8373 >= 0.1000 removing calpopp = 0.8971 >= 0.1000 removing yr begin with full model. sw reg rsffr ueca calpop baypop yr pcdisinc, pr(.1)
rsffr = resident sport fishing license frequency = the number of sport fishing licenses sold to residents of California.
Notice in Graph 1 that the unemployment rate tends to be around 6% and only in recent years has it gone higher; the slope of the line indicates a decline in sales of resident licenses as the unemployment rate increases. On average, as the California unemployment rate declines by one percentage point, sales of resident fishing licenses increase by 42,455. As the unemployment rate decreases, people can afford to fish more.
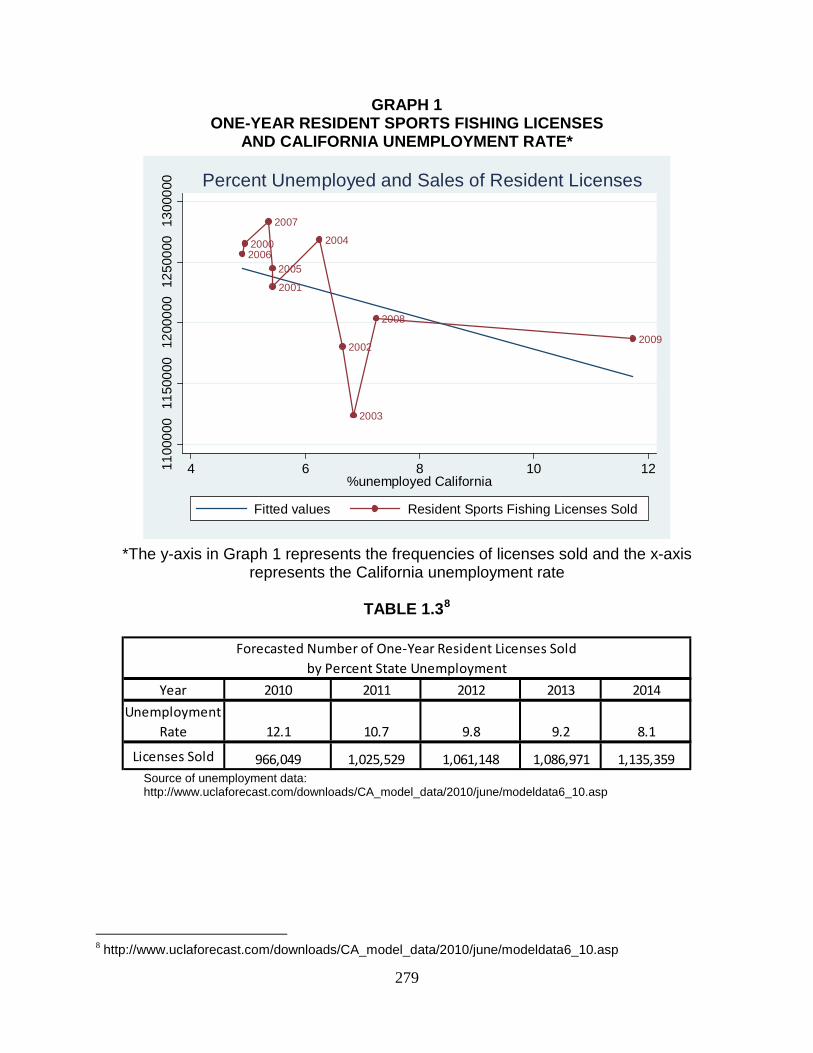
279
GRAPH 1 ONE-YEAR RESIDENT SPORTS FISHING LICENSES
AND CALIFORNIA UNEMPLOYMENT RATE*
20062000
2007
2005
2001
2004
2002
2003
2008
2009
1100
000
1150
000
1200
000
1250
000
1300
000
4 6 8 10 12%unemployed California
Fitted values Resident Sports Fishing Licenses Sold
Percent Unemployed and Sales of Resident Licenses
*The y-axis in Graph 1 represents the frequencies of licenses sold and the x-axis
represents the California unemployment rate
TABLE 1.38
Forecasted Number of One-Year Resident Licenses Sold by Percent State Unemployment
Year 2010 2011 2012 2013 2014Unemployment
Rate 12.1 10.7 9.8 9.2 8.1
Licenses Sold 966,049 1,025,529 1,061,148 1,086,971 1,135,359 Source of unemployment data: http://www.uclaforecast.com/downloads/CA_model_data/2010/june/modeldata6_10.asp
8 http://www.uclaforecast.com/downloads/CA_model_data/2010/june/modeldata6_10.asp
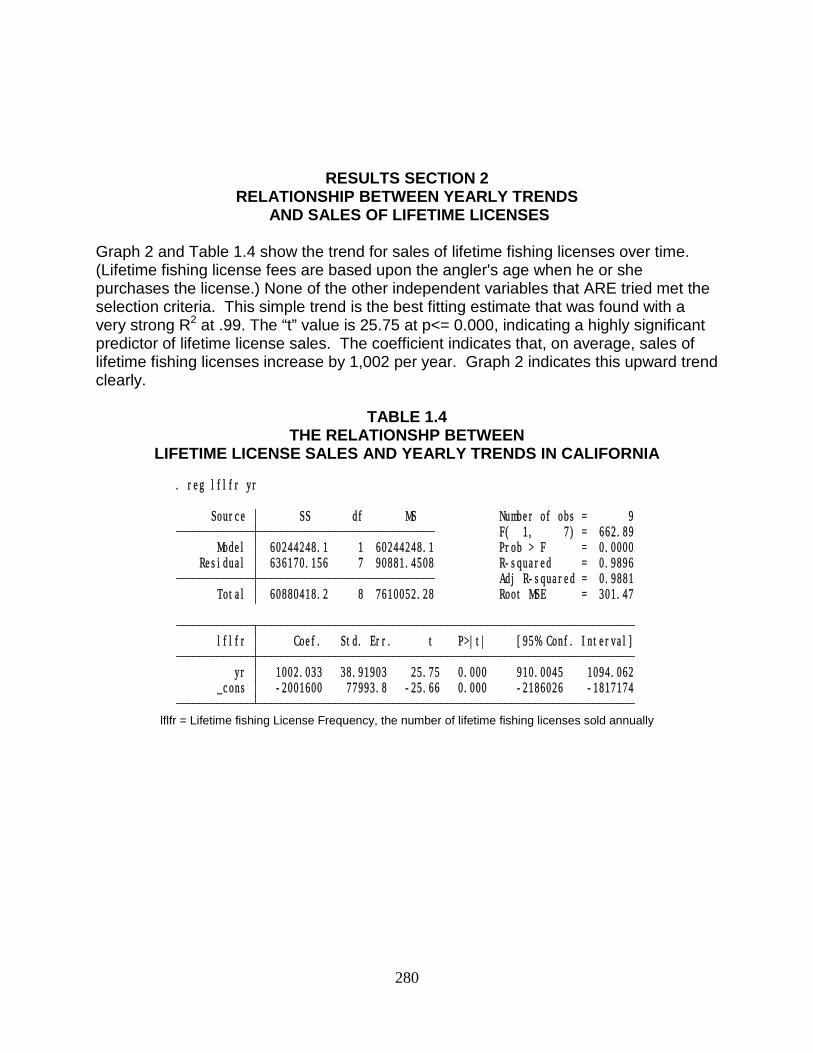
280
RESULTS SECTION 2 RELATIONSHIP BETWEEN YEARLY TRENDS
AND SALES OF LIFETIME LICENSES Graph 2 and Table 1.4 show the trend for sales of lifetime fishing licenses over time. (Lifetime fishing license fees are based upon the angler's age when he or she purchases the license.) None of the other independent variables that ARE tried met the selection criteria. This simple trend is the best fitting estimate that was found with a very strong R2 at .99. The “t” value is 25.75 at p<= 0.000, indicating a highly significant predictor of lifetime license sales. The coefficient indicates that, on average, sales of lifetime fishing licenses increase by 1,002 per year. Graph 2 indicates this upward trend clearly.
TABLE 1.4 THE RELATIONSHP BETWEEN
LIFETIME LICENSE SALES AND YEARLY TRENDS IN CALIFORNIA
_cons -2001600 77993.8 -25.66 0.000 -2186026 -1817174 yr 1002.033 38.91903 25.75 0.000 910.0045 1094.062 lflfr Coef. Std. Err. t P>|t| [95% Conf. Interval]
Total 60880418.2 8 7610052.28 Root MSE = 301.47 Adj R-squared = 0.9881 Residual 636170.156 7 90881.4508 R-squared = 0.9896 Model 60244248.1 1 60244248.1 Prob > F = 0.0000 F( 1, 7) = 662.89 Source SS df MS Number of obs = 9
. reg lflfr yr
lflfr = Lifetime fishing License Frequency, the number of lifetime fishing licenses sold annually
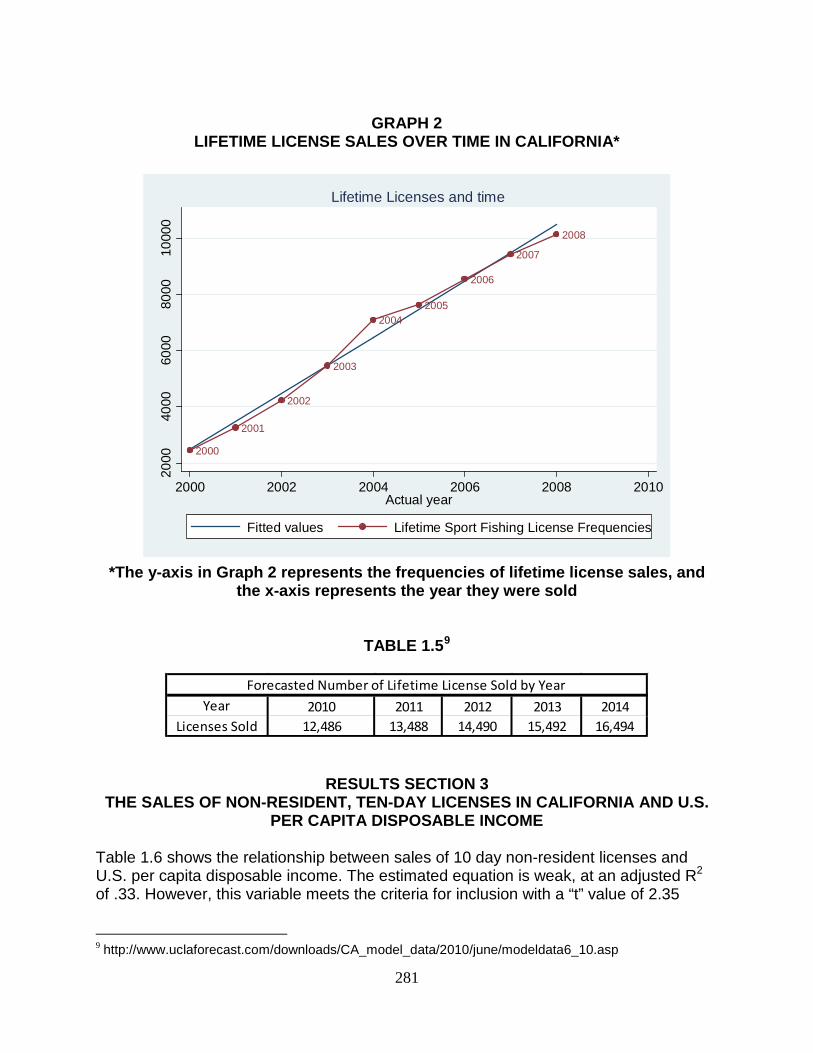
281
GRAPH 2
LIFETIME LICENSE SALES OVER TIME IN CALIFORNIA*
2000
2001
2002
2003
20042005
2006
2007
2008
2000
4000
6000
8000
1000
0
2000 2002 2004 2006 2008 2010Actual year
Fitted values Lifetime Sport Fishing License Frequencies
Lifetime Licenses and time
*The y-axis in Graph 2 represents the frequencies of lifetime license sales, and
the x-axis represents the year they were sold
TABLE 1.59
Forecasted Number of Lifetime License Sold by YearYear 2010 2011 2012 2013 2014
Licenses Sold 12,486 13,488 14,490 15,492 16,494
RESULTS SECTION 3
THE SALES OF NON-RESIDENT, TEN-DAY LICENSES IN CALIFORNIA AND U.S. PER CAPITA DISPOSABLE INCOME
Table 1.6 shows the relationship between sales of 10 day non-resident licenses and U.S. per capita disposable income. The estimated equation is weak, at an adjusted R2 of .33. However, this variable meets the criteria for inclusion with a “t” value of 2.35
9 http://www.uclaforecast.com/downloads/CA_model_data/2010/june/modeldata6_10.asp
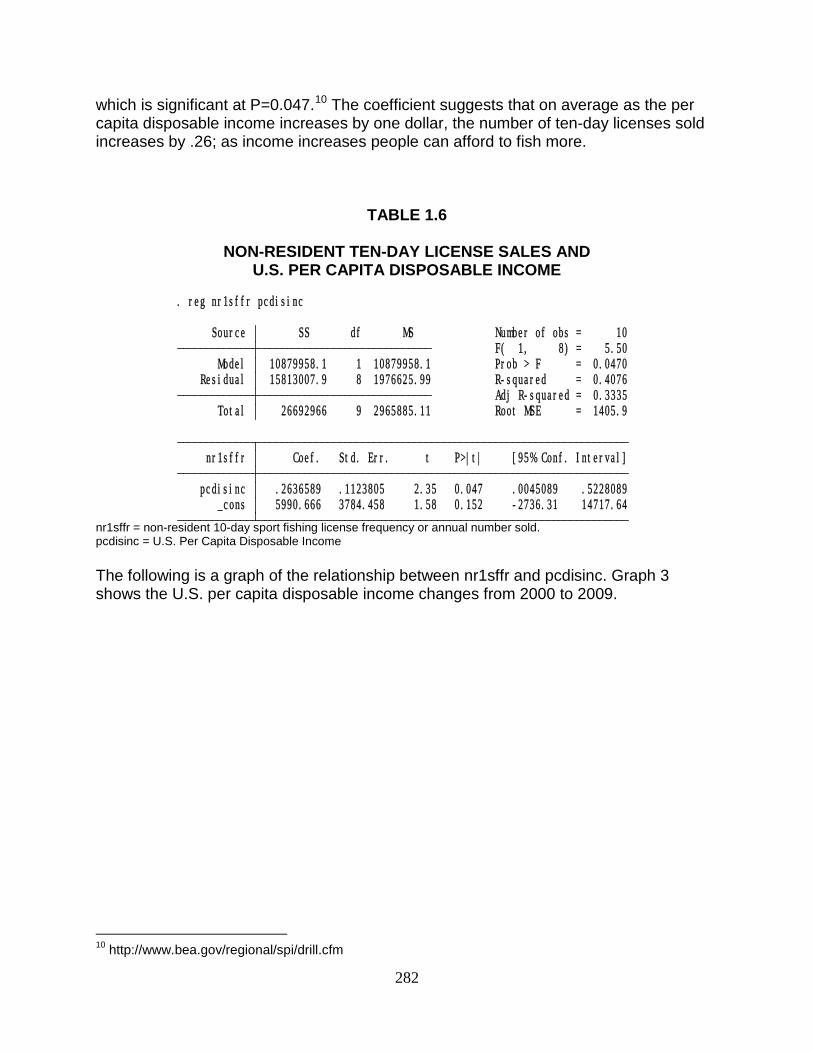
282
which is significant at P=0.047.10 The coefficient suggests that on average as the per capita disposable income increases by one dollar, the number of ten-day licenses sold increases by .26; as income increases people can afford to fish more.
TABLE 1.6
NON-RESIDENT TEN-DAY LICENSE SALES AND U.S. PER CAPITA DISPOSABLE INCOME
_cons 5990.666 3784.458 1.58 0.152 -2736.31 14717.64 pcdisinc .2636589 .1123805 2.35 0.047 .0045089 .5228089 nr1sffr Coef. Std. Err. t P>|t| [95% Conf. Interval]
Total 26692966 9 2965885.11 Root MSE = 1405.9 Adj R-squared = 0.3335 Residual 15813007.9 8 1976625.99 R-squared = 0.4076 Model 10879958.1 1 10879958.1 Prob > F = 0.0470 F( 1, 8) = 5.50 Source SS df MS Number of obs = 10
. reg nr1sffr pcdisinc
nr1sffr = non-resident 10-day sport fishing license frequency or annual number sold. pcdisinc = U.S. Per Capita Disposable Income
The following is a graph of the relationship between nr1sffr and pcdisinc. Graph 3 shows the U.S. per capita disposable income changes from 2000 to 2009.
10 http://www.bea.gov/regional/spi/drill.cfm
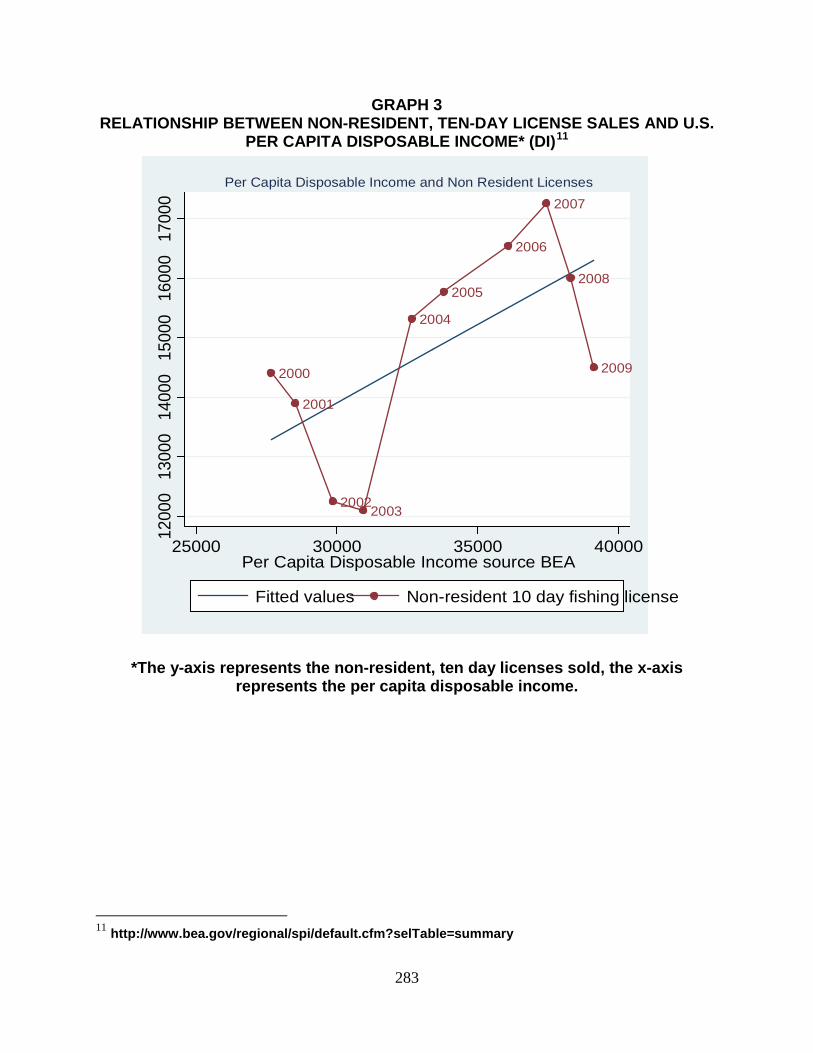
283
GRAPH 3 RELATIONSHIP BETWEEN NON-RESIDENT, TEN-DAY LICENSE SALES AND U.S.
PER CAPITA DISPOSABLE INCOME* (DI)11
2000
2001
20022003
2004
2005
2006
2007
2008
2009
1200
013
000
1400
015
000
1600
017
000
25000 30000 35000 40000Per Capita Disposable Income source BEA
Fitted values Non-resident 10 day fishing license
Per Capita Disposable Income and Non Resident Licenses
*The y-axis represents the non-resident, ten day licenses sold, the x-axis represents the per capita disposable income.
11 http://www.bea.gov/regional/spi/default.cfm?selTable=summary
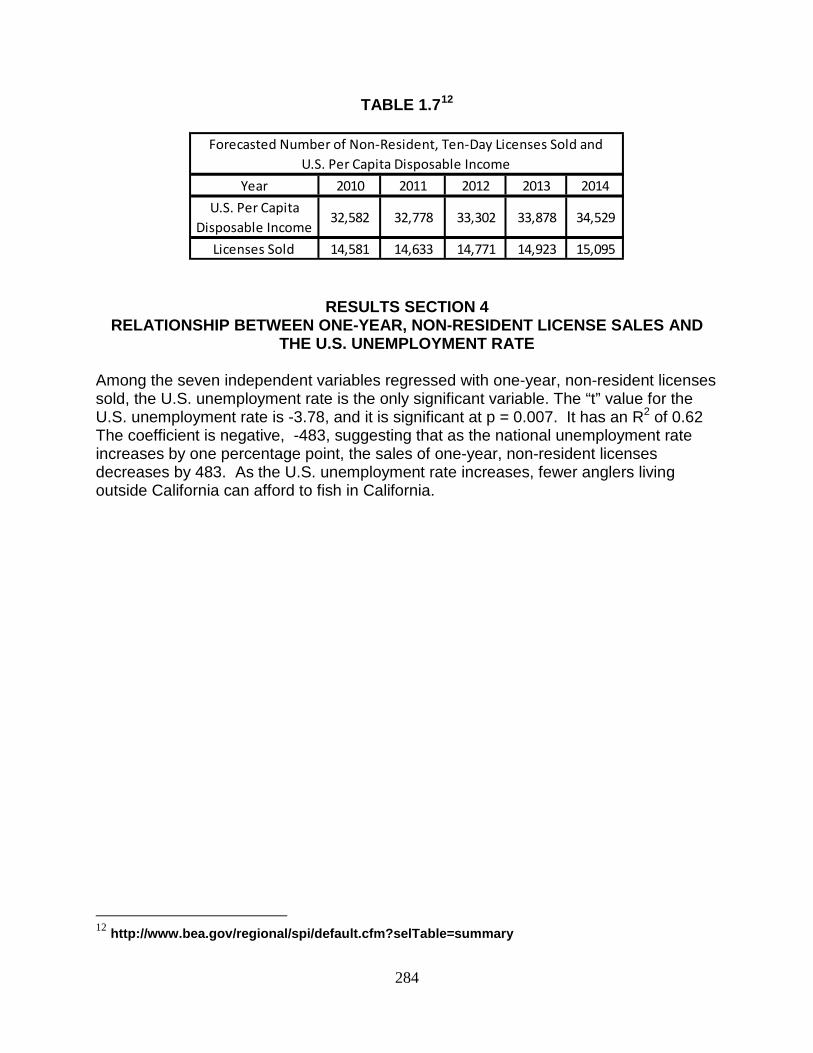
284
TABLE 1.712
Forecasted Number of Non-Resident, Ten-Day Licenses Sold and U.S. Per Capita Disposable Income
Year 2010 2011 2012 2013 2014U.S. Per Capita
Disposable Income32,582 32,778 33,302 33,878 34,529
Licenses Sold 14,581 14,633 14,771 14,923 15,095
RESULTS SECTION 4 RELATIONSHIP BETWEEN ONE-YEAR, NON-RESIDENT LICENSE SALES AND
THE U.S. UNEMPLOYMENT RATE Among the seven independent variables regressed with one-year, non-resident licenses sold, the U.S. unemployment rate is the only significant variable. The “t” value for the U.S. unemployment rate is -3.78, and it is significant at p = 0.007. It has an R2 of 0.62 The coefficient is negative, -483, suggesting that as the national unemployment rate increases by one percentage point, the sales of one-year, non-resident licenses decreases by 483. As the U.S. unemployment rate increases, fewer anglers living outside California can afford to fish in California.
12 http://www.bea.gov/regional/spi/default.cfm?selTable=summary
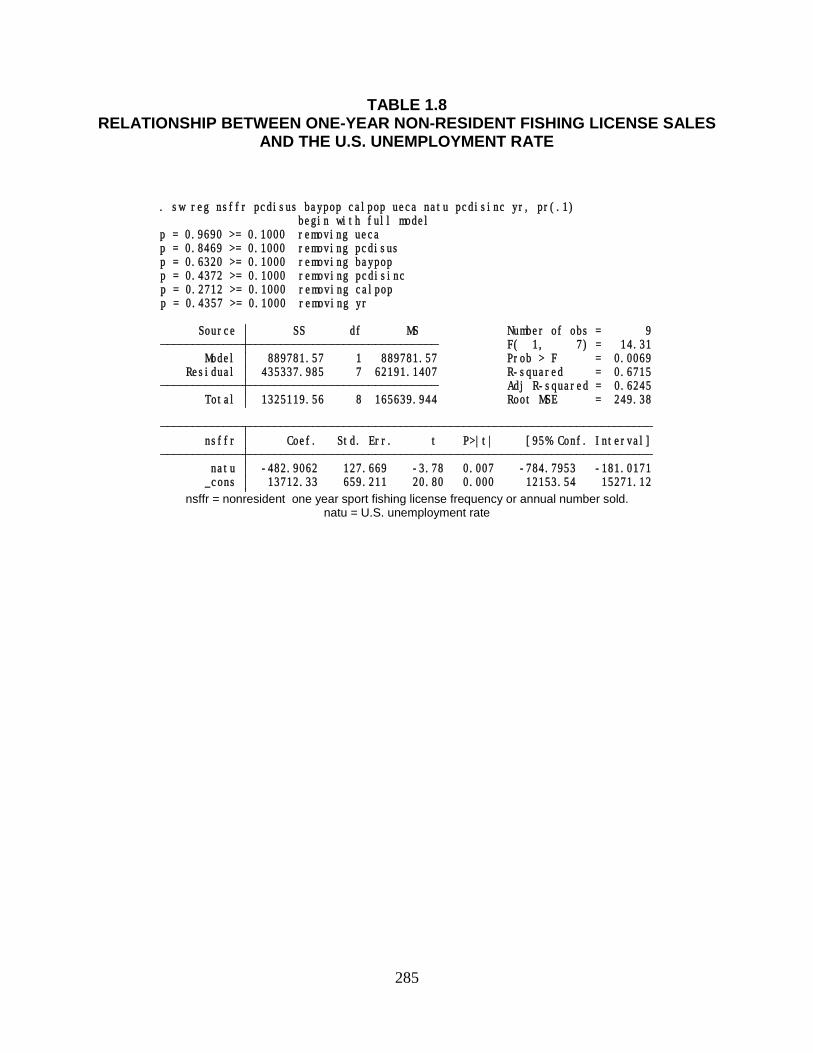
285
TABLE 1.8 RELATIONSHIP BETWEEN ONE-YEAR NON-RESIDENT FISHING LICENSE SALES
AND THE U.S. UNEMPLOYMENT RATE
_cons 13712.33 659.211 20.80 0.000 12153.54 15271.12 natu -482.9062 127.669 -3.78 0.007 -784.7953 -181.0171 nsffr Coef. Std. Err. t P>|t| [95% Conf. Interval]
Total 1325119.56 8 165639.944 Root MSE = 249.38 Adj R-squared = 0.6245 Residual 435337.985 7 62191.1407 R-squared = 0.6715 Model 889781.57 1 889781.57 Prob > F = 0.0069 F( 1, 7) = 14.31 Source SS df MS Number of obs = 9
p = 0.4357 >= 0.1000 removing yrp = 0.2712 >= 0.1000 removing calpopp = 0.4372 >= 0.1000 removing pcdisincp = 0.6320 >= 0.1000 removing baypopp = 0.8469 >= 0.1000 removing pcdisusp = 0.9690 >= 0.1000 removing ueca begin with full model. sw reg nsffr pcdisus baypop calpop ueca natu pcdisinc yr, pr(.1)
nsffr = nonresident one year sport fishing license frequency or annual number sold.
natu = U.S. unemployment rate
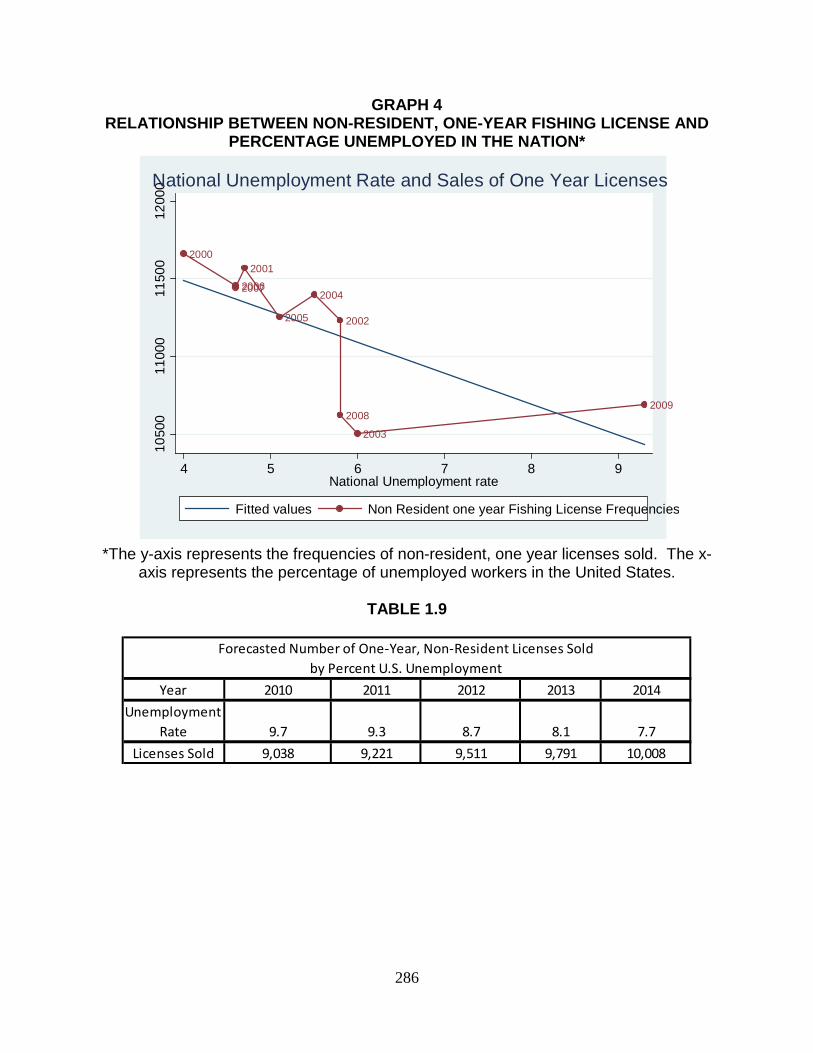
286
GRAPH 4 RELATIONSHIP BETWEEN NON-RESIDENT, ONE-YEAR FISHING LICENSE AND
PERCENTAGE UNEMPLOYED IN THE NATION*
2000
20062007
2001
2005
2004
2002
2008
2003
2009
1050
011
000
1150
012
000
4 5 6 7 8 9National Unemployment rate
Fitted values Non Resident one year Fishing License Frequencies
National Unemployment Rate and Sales of One Year Licenses
*The y-axis represents the frequencies of non-resident, one year licenses sold. The x-
axis represents the percentage of unemployed workers in the United States.
TABLE 1.9
Forecasted Number of One-Year, Non-Resident Licenses Sold by Percent U.S. Unemployment
Year 2010 2011 2012 2013 2014Unemployment
Rate 9.7 9.3 8.7 8.1 7.7Licenses Sold 9,038 9,221 9,511 9,791 10,008
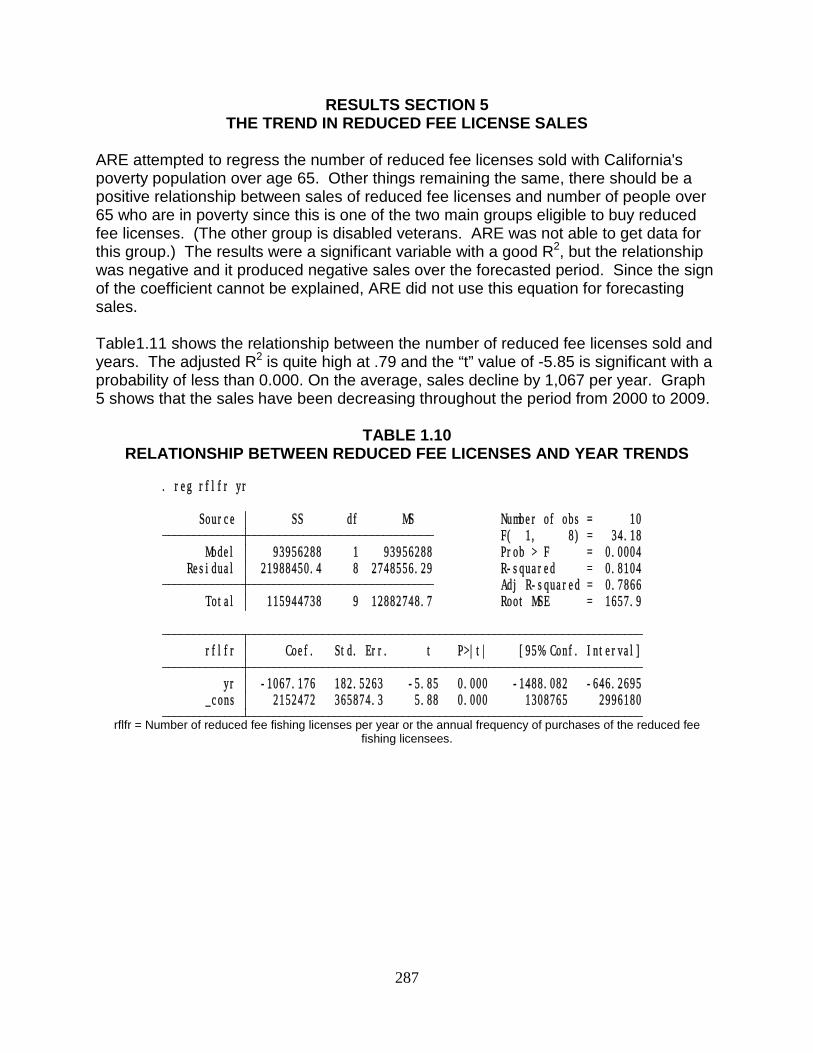
287
RESULTS SECTION 5 THE TREND IN REDUCED FEE LICENSE SALES
ARE attempted to regress the number of reduced fee licenses sold with California's poverty population over age 65. Other things remaining the same, there should be a positive relationship between sales of reduced fee licenses and number of people over 65 who are in poverty since this is one of the two main groups eligible to buy reduced fee licenses. (The other group is disabled veterans. ARE was not able to get data for this group.) The results were a significant variable with a good R2, but the relationship was negative and it produced negative sales over the forecasted period. Since the sign of the coefficient cannot be explained, ARE did not use this equation for forecasting sales. Table1.11 shows the relationship between the number of reduced fee licenses sold and years. The adjusted R2 is quite high at .79 and the “t” value of -5.85 is significant with a probability of less than 0.000. On the average, sales decline by 1,067 per year. Graph 5 shows that the sales have been decreasing throughout the period from 2000 to 2009.
TABLE 1.10
RELATIONSHIP BETWEEN REDUCED FEE LICENSES AND YEAR TRENDS
_cons 2152472 365874.3 5.88 0.000 1308765 2996180 yr -1067.176 182.5263 -5.85 0.000 -1488.082 -646.2695 rflfr Coef. Std. Err. t P>|t| [95% Conf. Interval]
Total 115944738 9 12882748.7 Root MSE = 1657.9 Adj R-squared = 0.7866 Residual 21988450.4 8 2748556.29 R-squared = 0.8104 Model 93956288 1 93956288 Prob > F = 0.0004 F( 1, 8) = 34.18 Source SS df MS Number of obs = 10
. reg rflfr yr
rflfr = Number of reduced fee fishing licenses per year or the annual frequency of purchases of the reduced fee
fishing licensees.
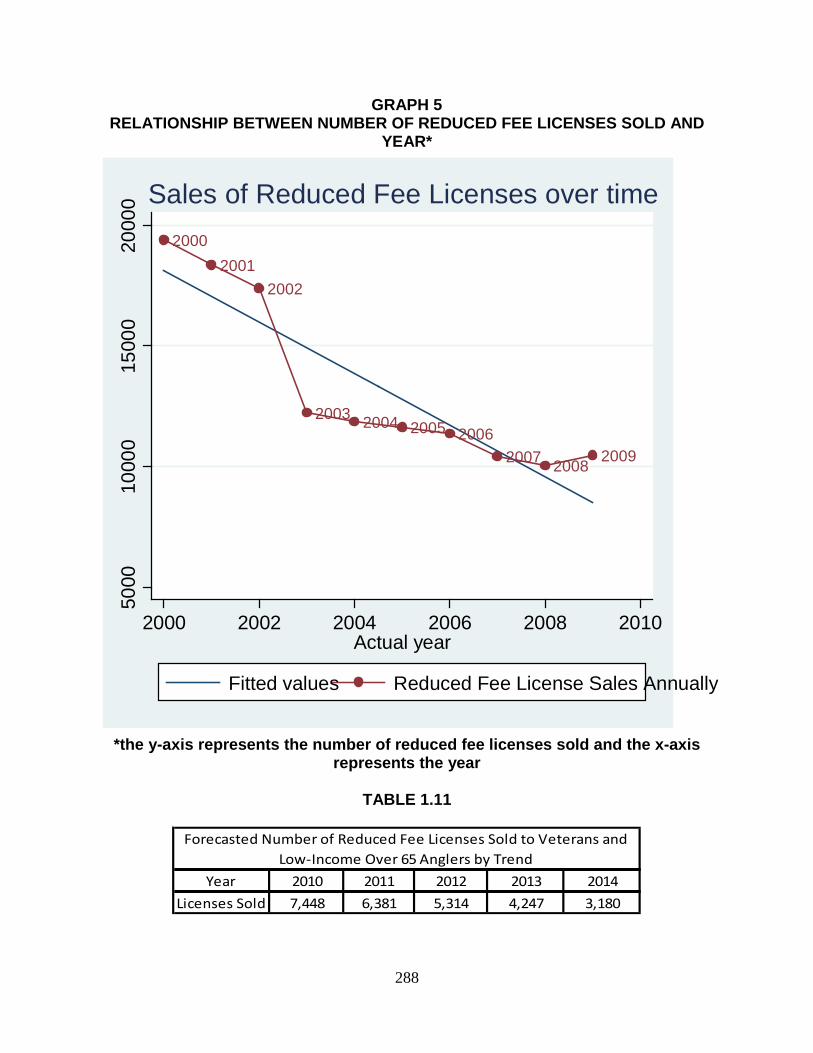
288
GRAPH 5 RELATIONSHIP BETWEEN NUMBER OF REDUCED FEE LICENSES SOLD AND
YEAR*
20002001
2002
2003 2004 2005 20062007 2008 2009
5000
1000
015
000
2000
0
2000 2002 2004 2006 2008 2010Actual year
Fitted values Reduced Fee License Sales Annually
Sales of Reduced Fee Licenses over time
*the y-axis represents the number of reduced fee licenses sold and the x-axis
represents the year
TABLE 1.11
Forecasted Number of Reduced Fee Licenses Sold to Veterans and Low-Income Over 65 Anglers by Trend
Year 2010 2011 2012 2013 2014Licenses Sold 7,448 6,381 5,314 4,247 3,180
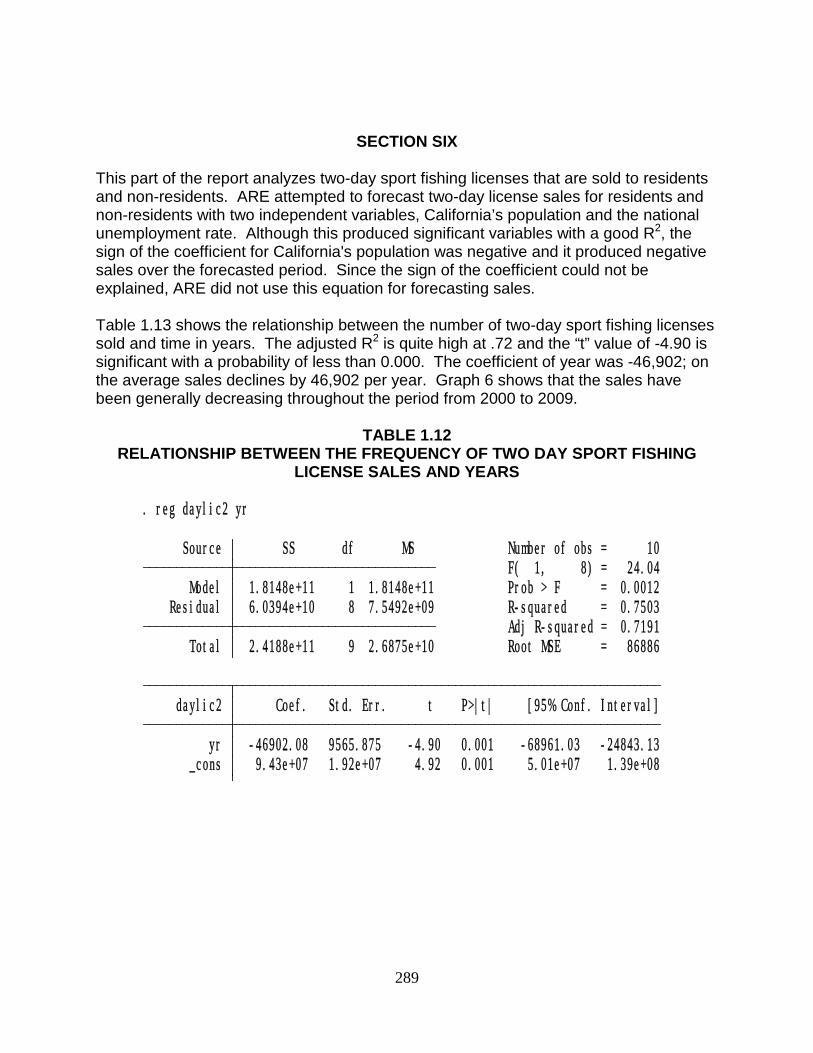
289
SECTION SIX This part of the report analyzes two-day sport fishing licenses that are sold to residents and non-residents. ARE attempted to forecast two-day license sales for residents and non-residents with two independent variables, California’s population and the national unemployment rate. Although this produced significant variables with a good R2, the sign of the coefficient for California's population was negative and it produced negative sales over the forecasted period. Since the sign of the coefficient could not be explained, ARE did not use this equation for forecasting sales. Table 1.13 shows the relationship between the number of two-day sport fishing licenses sold and time in years. The adjusted R2 is quite high at .72 and the “t” value of -4.90 is significant with a probability of less than 0.000. The coefficient of year was -46,902; on the average sales declines by 46,902 per year. Graph 6 shows that the sales have been generally decreasing throughout the period from 2000 to 2009.
TABLE 1.12
RELATIONSHIP BETWEEN THE FREQUENCY OF TWO DAY SPORT FISHING LICENSE SALES AND YEARS
_cons 9.43e+07 1.92e+07 4.92 0.001 5.01e+07 1.39e+08 yr -46902.08 9565.875 -4.90 0.001 -68961.03 -24843.13 daylic2 Coef. Std. Err. t P>|t| [95% Conf. Interval]
Total 2.4188e+11 9 2.6875e+10 Root MSE = 86886 Adj R-squared = 0.7191 Residual 6.0394e+10 8 7.5492e+09 R-squared = 0.7503 Model 1.8148e+11 1 1.8148e+11 Prob > F = 0.0012 F( 1, 8) = 24.04 Source SS df MS Number of obs = 10
. reg daylic2 yr
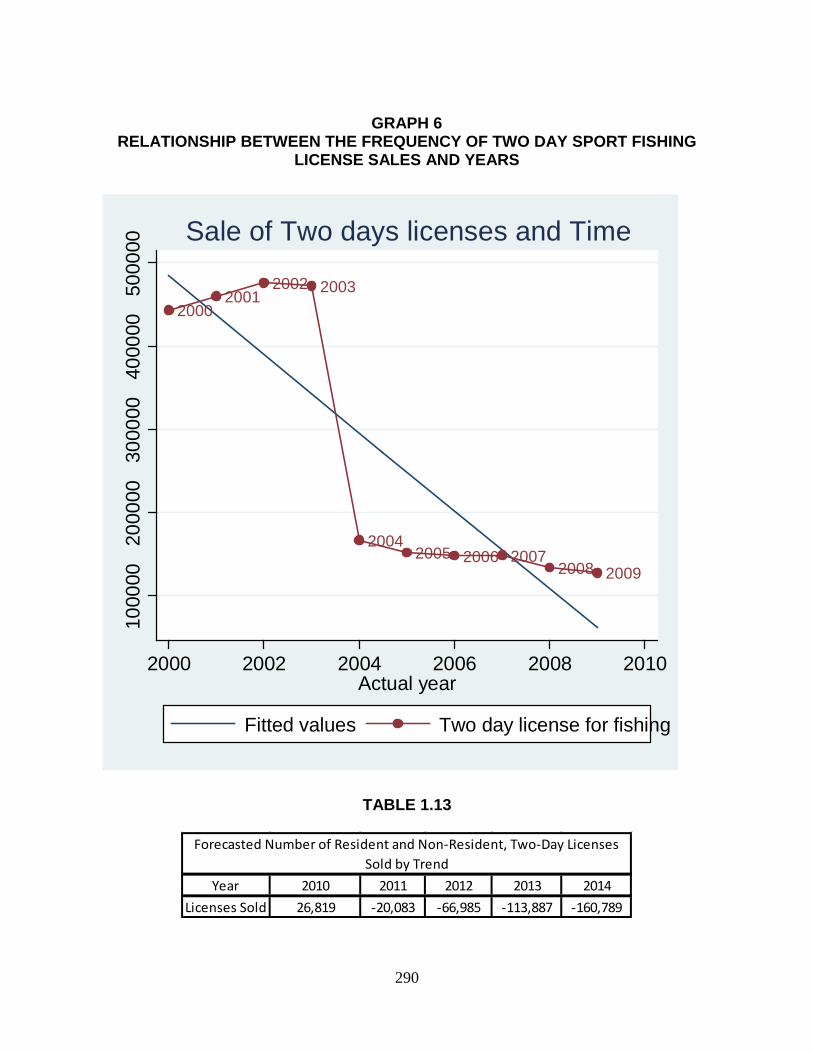
290
GRAPH 6
RELATIONSHIP BETWEEN THE FREQUENCY OF TWO DAY SPORT FISHING LICENSE SALES AND YEARS
20002001
2002 2003
20042005 2006 2007
2008 2009
1000
0020
0000
3000
0040
0000
5000
00
2000 2002 2004 2006 2008 2010Actual year
Fitted values Two day license for fishing
Sale of Two days licenses and Time
TABLE 1.13
Forecasted Number of Resident and Non-Resident, Two-Day Licenses Sold by Trend
Year 2010 2011 2012 2013 2014Licenses Sold 26,819 -20,083 -66,985 -113,887 -160,789
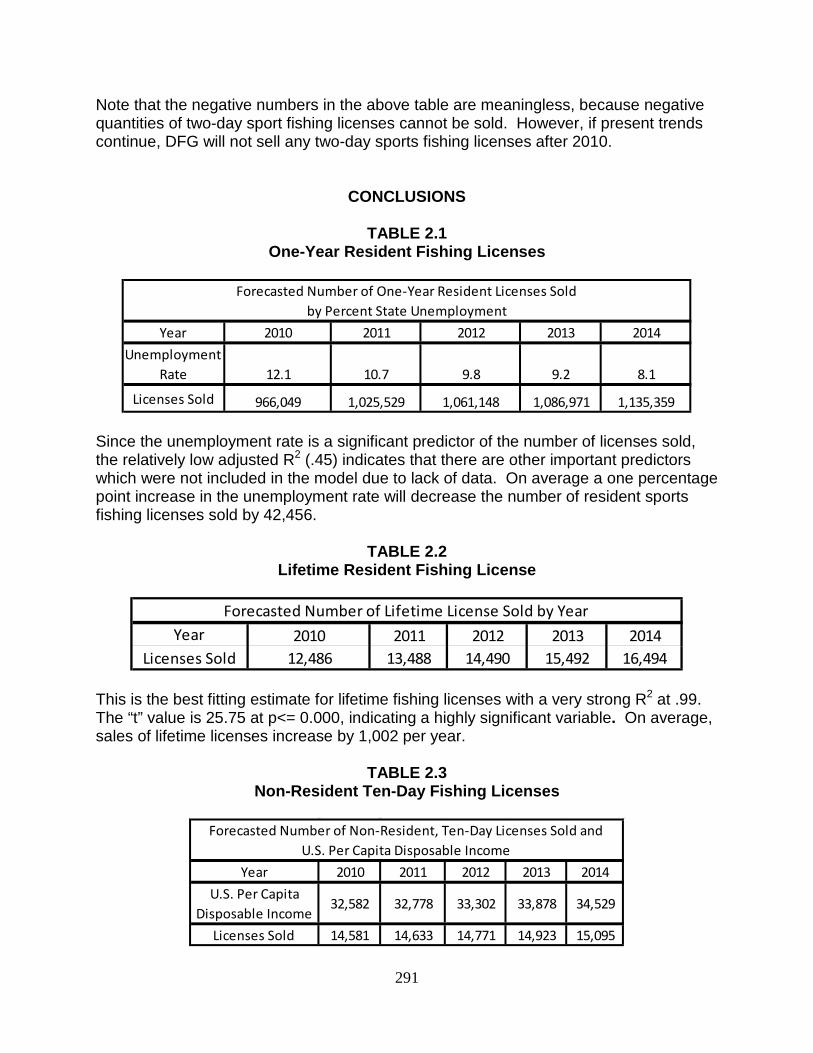
291
Note that the negative numbers in the above table are meaningless, because negative quantities of two-day sport fishing licenses cannot be sold. However, if present trends continue, DFG will not sell any two-day sports fishing licenses after 2010.
CONCLUSIONS
TABLE 2.1
One-Year Resident Fishing Licenses
Forecasted Number of One-Year Resident Licenses Sold by Percent State Unemployment
Year 2010 2011 2012 2013 2014Unemployment
Rate 12.1 10.7 9.8 9.2 8.1
Licenses Sold 966,049 1,025,529 1,061,148 1,086,971 1,135,359 Since the unemployment rate is a significant predictor of the number of licenses sold, the relatively low adjusted R2 (.45) indicates that there are other important predictors which were not included in the model due to lack of data. On average a one percentage point increase in the unemployment rate will decrease the number of resident sports fishing licenses sold by 42,456.
TABLE 2.2 Lifetime Resident Fishing License
Forecasted Number of Lifetime License Sold by Year
Year 2010 2011 2012 2013 2014Licenses Sold 12,486 13,488 14,490 15,492 16,494
This is the best fitting estimate for lifetime fishing licenses with a very strong R2 at .99. The “t” value is 25.75 at p<= 0.000, indicating a highly significant variable. On average, sales of lifetime licenses increase by 1,002 per year.
TABLE 2.3 Non-Resident Ten-Day Fishing Licenses
Forecasted Number of Non-Resident, Ten-Day Licenses Sold and
U.S. Per Capita Disposable IncomeYear 2010 2011 2012 2013 2014
U.S. Per Capita Disposable Income
32,582 32,778 33,302 33,878 34,529
Licenses Sold 14,581 14,633 14,771 14,923 15,095
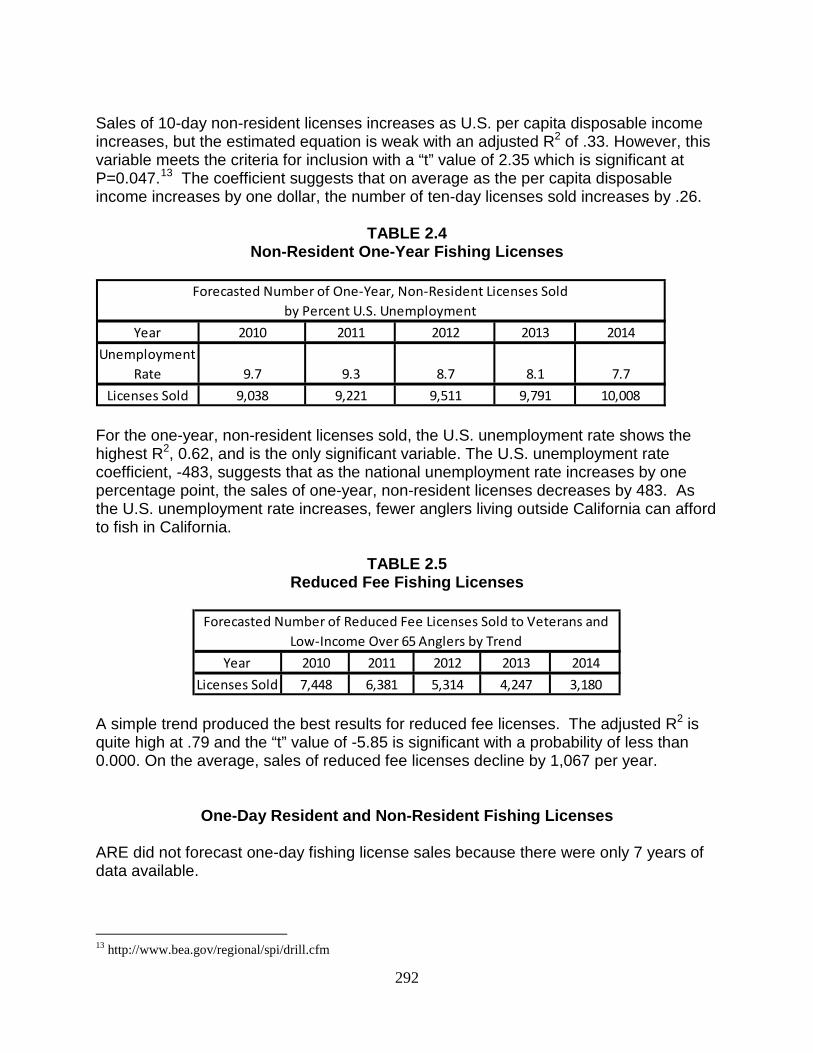
292
Sales of 10-day non-resident licenses increases as U.S. per capita disposable income increases, but the estimated equation is weak with an adjusted R2 of .33. However, this variable meets the criteria for inclusion with a “t” value of 2.35 which is significant at P=0.047.13 The coefficient suggests that on average as the per capita disposable income increases by one dollar, the number of ten-day licenses sold increases by .26.
TABLE 2.4 Non-Resident One-Year Fishing Licenses
Forecasted Number of One-Year, Non-Resident Licenses Sold
by Percent U.S. UnemploymentYear 2010 2011 2012 2013 2014
Unemployment Rate 9.7 9.3 8.7 8.1 7.7
Licenses Sold 9,038 9,221 9,511 9,791 10,008 For the one-year, non-resident licenses sold, the U.S. unemployment rate shows the highest R2, 0.62, and is the only significant variable. The U.S. unemployment rate coefficient, -483, suggests that as the national unemployment rate increases by one percentage point, the sales of one-year, non-resident licenses decreases by 483. As the U.S. unemployment rate increases, fewer anglers living outside California can afford to fish in California.
TABLE 2.5 Reduced Fee Fishing Licenses
Forecasted Number of Reduced Fee Licenses Sold to Veterans and
Low-Income Over 65 Anglers by TrendYear 2010 2011 2012 2013 2014
Licenses Sold 7,448 6,381 5,314 4,247 3,180 A simple trend produced the best results for reduced fee licenses. The adjusted R2 is quite high at .79 and the “t” value of -5.85 is significant with a probability of less than 0.000. On the average, sales of reduced fee licenses decline by 1,067 per year.
One-Day Resident and Non-Resident Fishing Licenses
ARE did not forecast one-day fishing license sales because there were only 7 years of data available.
13 http://www.bea.gov/regional/spi/drill.cfm
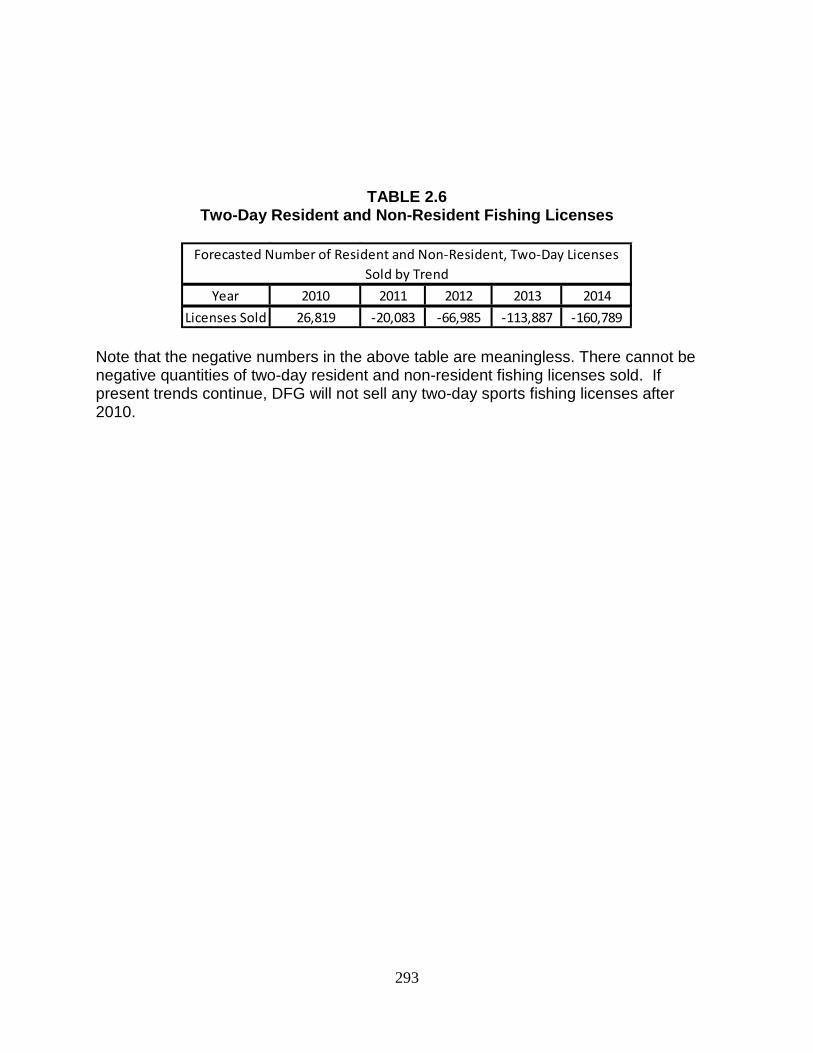
293
TABLE 2.6 Two-Day Resident and Non-Resident Fishing Licenses
Forecasted Number of Resident and Non-Resident, Two-Day Licenses
Sold by Trend Year 2010 2011 2012 2013 2014
Licenses Sold 26,819 -20,083 -66,985 -113,887 -160,789 Note that the negative numbers in the above table are meaningless. There cannot be negative quantities of two-day resident and non-resident fishing licenses sold. If present trends continue, DFG will not sell any two-day sports fishing licenses after 2010.
294
APPENDIX A
CODEBOOK FOR THE VARIABLES USED IN THE TREND ANALYSIS FOR THE DEPARTMENT OF FISH AND GAME
Codebook for the variables used in the DFG forecasting of licenses:
1. Yr- Year, from 2000- 2010 2. ydfrca- Personal disposable income ; years 2000-2010, collected from the
UCLA forecast, smoothed into annual data using simple moving average, from http://www.docstoc.com/docs/21540088/Lecture-2-Moving-Average-and-Exponential-Smoothing/
3. UECA- Unemployment in California; years 2000-2010, collected from the
UCLA forecast, smoothed into annual data using simple moving average, process gained from http://www.docstoc.com/docs/21540088/Lecture-2-Moving-Average-and-Exponential-Smoothing/
4. Annual population bay area- baypop ; years 2000-2008 (estimates), a
summation of the individual county by county population estimates (all of the counties in the three regions), based on the 2000 census, taken from the Census Bureau web site at http://www.census.gov/popest/counties/CO-EST2009-01.html
5. California population- calpop; Years 2000-2008 (estimates). The estimates of
the population of California since 2000, based on the 2000 census, taken from the Census Bureau website at http://www.census.gov/popest/counties/CO-EST2009-01.html
License Frequencies 6. RSFFR- Resident Sport Fishing License frequency- The annual frequency of
purchases of the Resident Sport Fishing License Years 2000-2009 collected from the California DFG website at http://www.dfg.ca.gov/licensing/statistics/statistics.html#Sport%20Fishing%20Licenses (in 2000’s under Sport Fishing Licenses) Fees, Number Issued, and Revenue
7. LFLFR- Lifetime Sport Fishing License Frequency- - The annual frequency of
purchases of the Lifetime Sport Fishing License Years 2000-2009 collected from the California DFG website at http://www.dfg.ca.gov/licensing/statistics/statistics.html#Sport%20Fishing%2
295
0Licenses (in 2000’s under Sport Fishing Licenses) Fees, Number Issued, and Revenue
8. NSFFR- Nonresident Sport Fishing one year fishing License Frequency- The
annual frequency of purchases of the Nonresident Sport Fishing License Years 2000-2009 collected from the California DFG website at http://www.dfg.ca.gov/licensing/statistics/statistics.html#Sport%20Fishing%20Licenses (in 2000’s under Sport Fishing Licenses) Fees, Number Issued, and Revenue
9. NR1SFFR-Non-resident Ten-Day Sport Fishing License Frequency- The
annual frequency of purchases of the Nonresident 1 day Sport Fishing License Years 2000-2009 collected from the California DFG website at http://www.dfg.ca.gov/licensing/statistics/statistics.html#Sport%20Fishing%20Licenses (in 2000’s under Sport Fishing Licenses) Fees, Number Issued, and Revenue
10. RFLFR- Reduced Fee License Frequency- The annual frequency of
purchases of the Reduced Fee License Years 2000-2009 collected from the California DFG website at http://www.dfg.ca.gov/licensing/statistics/statistics.html#Sport%20Fishing%20Licenses (in 2000’s under Sport Fishing Licenses) Fees, Number Issued, and Revenue
11. pcdisinc We created this in Stata float %9.0g Per Capita Disposable Income’s source was from the Bureau of Economic Analysis. http://www.bea.gov/regional/spi/action.cfm for California.
12. povertyplus65 U.S. Census bureau of those over 65 and in poverty in
California. From: http://factfinder.census.gov/servlet/DTTTable?_brn=y& context=d…Based on estimates from the American Community Survey for years in the data file.
Related Documents