An Economic Analysis of Sanitary and Phytosanitary Barriers to Trade Lia Nogueira Ph.D. Student School of Economic Sciences Washington State University P.O. Box 646210 Pullman, WA, 99164-6210 E-mail: [email protected] Telephone: (509) 338-5823 Fax: (509) 335-1173 Hayley H. Chouinard Assistant Professor School of Economic Sciences Washington State University Thomas L. Marsh Associate Professor School of Economic Sciences Washington State University Thomas I. Wahl Professor/Chair Agribusiness and Applied Economics North Dakota State University Christine Wieck Research Fellow Institute for Food and Resource Economics University of Bonn November 2007

Welcome message from author
This document is posted to help you gain knowledge. Please leave a comment to let me know what you think about it! Share it to your friends and learn new things together.
Transcript

An Economic Analysis of Sanitary and Phytosanitary Barriers to Trade
Lia Nogueira
Ph.D. Student School of Economic Sciences Washington State University
P.O. Box 646210 Pullman, WA, 99164-6210
E-mail: [email protected] Telephone: (509) 338-5823
Fax: (509) 335-1173
Hayley H. Chouinard
Assistant Professor School of Economic Sciences Washington State University
Thomas L. Marsh
Associate Professor School of Economic Sciences Washington State University
Thomas I. Wahl
Professor/Chair Agribusiness and Applied Economics
North Dakota State University
Christine Wieck
Research Fellow Institute for Food and Resource Economics
University of Bonn
November 2007

An Economic Analysis of Sanitary and Phytosanitary Barriers to Trade
Abstract
In order to estimate the effects of changing SPS barriers to trade on Washington State apples in
China, India, Mexico and Taiwan, we started by characterizing the full export model. The SPS
costs elasticities obtained from the export supply equations were used in the revenue simulation.
Our results bring some promising information to Washington State apple producers. China is
confirmed as an attractive market, regardless of SPS barriers to trade. Exports to Mexico and
Taiwan may increase significantly if SPS barriers are reduced. Even though exports to India
may decrease if SPS barriers are enforced, the loss may be insignificant.
Keywords: SPS barriers to trade, revenue effects, apples.
JEL Code: F14, Q17, Q18.

1
An Economic Analysis of Sanitary and Phytosanitary Barriers to Trade
The Sanitary and Phytosanitary Measures Agreement of the World Trade Organization (WTO)
allows its members to set standards on food products to protect domestic consumers. In practice,
sanitary and phytosanitary (SPS) barriers take the form of import standards or regulations that
reflect the country’s concern for SPS issues that could harm domestic producers. These concerns
include the introduction of disease or other pests, and some claim that SPS barriers exist in
certain countries to protect domestic producers from international competition (Yue, Beghin and
Hensen 2006).
According to USDA/FAS (2006) "trade issues continue to be a significant barrier for US
apples in certain destination markets". Specifically, SPS barriers related to fire blight, codling
moth, apple maggot and other pests limit or prohibit US apple exports to some countries
(Krissoff, Calvin and Gray 1997). SPS barriers may also reduce the flow of apples into a
country by imposing quarantine restrictions that delay shipments. Often the level of SPS
requirements is more restrictive than scientists consider necessary to protect the domestic
product.1 SPS barriers sometimes raise unnecessary costs to producers. It is argued that
reducing SPS barriers to trade will decrease costs to producers and increase exports. We
examine the effect of SPS barriers to trade imposed by China, India, Mexico and Taiwan on the
Washington State apple industry. The specific question we answer in this study is what are the
effects of changing the level of SPS barriers to trade on the revenue received by Washington
State producers.
1 It should be noted that the scientific levels themselves generate significant debate.

2
Apple production and exports are important for the United States and Washington State.
Apples are the third most valuable fruit crop in the United States, after grapes and oranges
(Dimitri, Tegene and Kaufman 2003). The United States is the second largest producer and one
of the top five exporters of apples in the world. Nearly 60 percent of the US produced apples,
and around 85 percent of the US exported apples are grown in Washington State. However,
trade barriers affecting US apples limit the amount of US exports or impose additional costs on
US apple producers and exporters, thereby reducing the revenue for the US apple industry.
Some work has been done regarding the demand for US apples in other countries and the
effects of removing or reducing trade barriers. Different approaches have been taken. Import
demand, export demand, gravity equation and general or partial equilibrium models are
commonly used for trade estimation (Arize 2001; Calvin and Krissoff 1998 and 2005; Devadoss
and Wahl 2004; Krissoff, Calvin and Gray 1997; Seale, Sparks and Buxton 1992; Yue, Beghin
and Jensen 2006). The most common method used to calculate an SPS tariff equivalent is the
price wedge approach (Calvin and Krissoff 1998 and 2005; Krissoff, Calvin and Gray 1997;
Yue, Beghin and Jensen 2006). The price wedge or tariff equivalent approach measures the
difference in price between the imported good and the product in the domestic market (Beghin
and Bureau 2001). This difference is attributed to transportation costs, tariffs and non-tariff
barriers (NTB). The limitations of this method are: the impossibility to distinguish between the
different NTBs; the data available is rarely specific enough to reflect differences in quality of
imported products; and even if the data have the level of detail needed, domestic goods are
assumed to be perfect substitutes for imported goods, which is a very strong assumption.
We estimate the complete system of equations that characterize the export model,
including all stages involved, and we incorporate an estimate of the cost of complying with the

3
SPS regulations in order to obtain more precise estimates than with the price wedge method.
This study complements the literature by including a direct estimate of the SPS compliance
costs, by analyzing countries not thoroughly studied before and by estimating price elasticities
while including SPS costs in the model. Then, we estimate quantity changes for Washington
State apples given specific SPS barrier reductions. This allows us to calculate the associated
revenue changes with changes in the SPS restrictions. Our results yield estimates to provide
policy recommendations that can be used by the industry to argue for the reduction of SPS
barriers in other countries.
Virtually none of the import or export demand models analyze trade barriers. Import and
export demand models usually only calculate the corresponding import and export demand
elasticities that are then used in different studies. Most of the studies of the effects of trade
barriers use price and income elasticities from the literature instead of estimating the elasticities
directly. Subsequently, they use those elasticities to analyze the effect of removing trade barriers
on the demand for US apples (Krissoff, Calvin and Gray 1997, Calvin and Krissoff 1998 and
2005). However, two studies analyzing trade barriers, Yue, Beghin and Jensen (2006) and
Devadoss and Wahl (2004), estimate their own elasticities and analyze the effect of reducing
barriers to trade.
Krissoff, Calvin and Gray (1997) analyze the effects of removing SPS requirements in
Japan, South Korea and Mexico on US apple exports to those countries. Calvin and Krissoff
(1998 and 2005) quantify the SPS barriers for US apples in Japan and estimate the trade and
welfare effects for Japan of removing those barriers, specifically for Fuji apples. These authors
use a partial equilibrium model to estimate trade flows simulating a reduction in SPS barriers to
trade. Yue, Beghin and Jensen (2006) estimate the tariff equivalent of technical barriers to trade

4
(TBT) for apples in Japan. Afterward, they evaluate the effect of removing the Japanese TBT on
US apple exports using the gravity equation. All these studies use the price wedge approach to
estimate the tariff equivalent of the SPS barriers to trade. These studies yield different results,
while Krissoff, Calvin and Gray (1997) and Calvin and Krissoff (1998 and 2005) find great
increase in US apple exports after SPS barriers are removed, Yue, Beghin and Jensen (2006) find
limited export increase for US apples after removing the barriers in Japan. Devadoss and Wahl
(2004) estimate supply, demand and excess supply equations to examine welfare effects under
different trade scenarios reducing the ad valorem tariff for apples in India. They conclude that
India will greatly benefit from reducing trade barriers.
There is evidence suggesting that SPS restrictions may greatly reduce the amount of US
apple exports. Estimates of the increased value of US apples exported if SPS barriers are
removed vary by author and country, ranging from $5 million US dollars (USD) to $280 million
USD, with most estimates in the $5 to $50 million USD range (Krissoff, Calvin and Gray 1997;
Northwest Horticultural Council 2004; Loveland and Hamilton 2007). These studies suggest
that the reduction of SPS barriers could greatly benefit the Washington apple industry.
The rest of the article proceeds as follows. The next section presents the model,
including the theoretical background and empirical specification. We then describe the data and
empirical issues. Results are then presented. The article ends with some brief conclusions.
Model
Theoretical Background
In order to specify the demand and supply equations used for the revenue simulation, we need to
start by examining the Washington State apple industry. Washington State apple producers

5
require the services of warehouses for the commercialization of their product. Some producers
own the warehouses, while others contract for the provided services. Nonetheless, warehouses
do not buy the apples, they solely provide the intermediary service to the producers, and charge
them for it.
Warehouses are in charge of sorting, grading, packing and storing the apples and are also
responsible for all the sales, marketing, and paperwork related to exports and regulation
compliance. Warehouses may contract with other companies or provide all or some of these
services internally. Contracting for services or internalizing usually depends on the country
apples are exported to. All the SPS paperwork is done at the warehouse level. Only a few
countries, like Japan, require SPS regulations that impose a direct cost on the producer by
requiring extra steps in the production method. Most of the time it is the producer who bears the
SPS compliance costs.
The importer is responsible for paying the transportation costs from the warehouse to the
importing country, and the corresponding ad valorem tariffs and taxes if applicable. The
importer pays directly to the warehouse Free On Board (FOB)2 prices in USD for the apples.
These FOB prices are determined internationally by supply and demand forces and depend on
the variety, size, grade and packaging of the apples. Exchange rate fluctuations may play an
important role since the importer pays the product in USD.
The export model consists of the supply function for warehouses or exporters (export
supply equation) and the demand function for importers (import demand equation). Once we
characterize the supply and demand equations, we can analyze the revenue changes given
different scenarios for SPS barriers.
2 FOB price quotations include the cost of loading the product onto the transportation carrier, while the transportation cost and insurance are not included.

6
To derive the export supply and the import demand equations, we start by specifying an
industry indirect profit function for exporters in Washington and importers in each country
studied. We assume that exporters and importers are price taking firms. This is a valid
assumption since China3, India, Mexico and Taiwan are small players in apple imports. Even
though the United States is the second largest apple exporter with a share of apple exports of
approximately 16 percent, there are many individual exporting firms in the United States
justifying the price taking assumption.
The exporter’s profit is a function of output prices, input price, cost of value added
activities and services, and SPS costs. Even though the warehouse charges the producer for the
SPS compliance paperwork and at the end the producer is the one who bears the SPS compliance
cost, these SPS compliance costs also limit the quantity exported by requiring quarantine
measures or other fumigation treatments that delay shipments and it makes the apples more
expensive. Thus, SPS barriers should be part of the exporter’s profit function. The indirect
profit function for the exporting industry can be defined in a general form by:
(1) ))tcos,SPS,w,p(x),tcos,SPS,w,p(y()tcos,SPS,w,p( Π=Π ,
where Π(p,w,SPS,cost) represents the indirect profit function for the exporting industry; p, w,
SPS, cost, y, and x are vectors of output prices, input prices, SPS costs, the cost of value added
activities and services, output quantities, and input quantities, respectively.
The conditional factor output supply (export supply) equation for apples is obtained by
applying Hotelling’s Lemma to the profit function for the exporting industry:
(2) )tcos,SPS,w,p(yp
)tcos,SPS,w,p(=
∂
Π∂.
3 China has dramatically increased apple imports in the last 10 years, but it remains a small player in the international arena regarding apple imports.

7
The importer’s profit is a function of output price, input prices, ad valorem tariff, and
exchange rate. The indirect profit function for the importing industry can be defined in a general
form by:
(3) ))ER,TR,w,p(x),ER,TR,w,p(y()ER,TR,w,p( Π=Π ,
where Π(p,w,TR,ER) represents the indirect profit function for the importing industry; p, w, TR,
ER, y, and x are vectors of output prices, input prices, ad valorem tariffs, exchange rate, output
quantities, and input quantities, respectively.
Applying Hotelling’s Lemma to the indirect profit function for the importing industry, we
derive the conditional factor input demand (import demand) equation for apples:
(4) )ER,TR,w,p(xw
)ER,TR,w,p(−=
∂
π∂.
We estimate the export supply (equation 2) and import demand (equation 4) equations as
explained in the following section.
Empirical Specification
In order to estimate the effects of SPS barriers to trade we use the specific profit function for the
importers and exporters and from these derive the import demand and export supply equations.
The normalized quadratic functional form is chosen to describe both importers’ and exporters’
profit functions. Due to its flexibility and properties such as the estimation of own- and cross-
price and substitution elasticities, constant returns to scale and homogeneity in prices (through
price normalization), we consider the normalized quadratic to be an adequate functional form
(Diewert and Morrison 1986; Featherstone and Moss 1994; Marsh 2005; Shumway, Saez and
Gottret 1988). The profit function for the importing industry is given by:

8
(5)
( )2
1
2
11 110
2
1
2
1
2
1
)ER(ERmpER)TR(
TRmpTRmpmpmp)mp(
ee*i
k
i ieett
k
i
*iitt
k
i
k
j
*j
*iij
k
i
*ii
**m
α+α+α+α+
α+α+α+α+α=Π
∑
∑∑ ∑∑
=
== ==
where wp/m*m Π=Π and wp/mpmp*
i = represent the normalized profit and import or input
prices for importers, and wp is the wholesale or output price. Subscript i represents the different
countries exporting apples to the importing country and subscript k represents the number of
exporting countries to that country. TR is the ad valorem tariff rate and ER represents the
exchange rate, both are specific for the importing country. The corresponding import demand
equations after applying Hotelling’s Lemma are:
(6) ∑ =α+α+α+α=−
k
j ieit*jijii ERTRmpmq
1
for i=1,…,k., where mq is the imported quantity from the United States by country i. The import
demand equation for Mexico also includes an anti-dumping duty variable. 4 Mexico has been
imposing anti-dumping duties to US red and golden delicious apples5 since September 1st, 1997.
These duties started at a rate of 101.1 percent and have been eliminated, re-imposed, and
decreased since then. The current anti-dumping duty is 47.05 percent for most apple exporters.
The profit function for the exporting industry is:
(7)
( )2
1
2
11 110
2
1
2
1
2
1
)Cost(CostxpCost)SPS(
SPSxpSPSxpxpxp)xp(
cc
n
i
*iiccss
*i
n
i iss
n
i
n
j
*j
*iij
n
i
*ii
**x
β+β+β+β+
β+β+β+β+β=Π
∑
∑∑ ∑∑
=
== ==
where pp/x*x Π=Π and pp/xpxp*
i = represent the normalized profit and export or output
prices for exporters, and pp is the producer or input price. Subscript i represents the different
4 Anti-dumping duties are the duties imposed by an importing country when an exporting country prices its product at a price below the own domestic price or below its production cost. 5 These are the two main varieties exported to the Mexican market.

9
countries importing apples from Washington State and subscript n represents the number of
countries that Washington State exports to. SPS represents the cost of complying with the SPS
regulations and Cost is the cost of the value added activities and services.
SPS costs are specific for the importing country. Mexico and Taiwan require US
producers to comply with detailed work plans to be able to export. The work plan for Mexico is
related to phytosanitary policies and it includes the inspection of growing and shipping areas, a
cold storage treatment, and extensive inspections of the fruit prior to shipping. The work plan
for Taiwan includes orchard certifications, packing house registration, a cold storage treatment
and extensive inspections. This work plan was implemented in August 2003 after two codling
moth incidents in 2002 which disrupted US apple exports to Taiwan (Miller 2003).
The corresponding export supply equations after applying Hotelling’s Lemma are:
(8) ∑ =β+β+β+β=
n
ij icis*jijii CostSPSxpxq
for i=1,…,n., where xq is the exported quantity from the United States to country i. The export
supply equation for Taiwan also includes a binary variable equal to one for time that the three-
strike policy has been in place from August 2003 to date, and zero otherwise. The work plan for
Taiwan includes a three-strike system for codling moth detection, in which the whole Taiwanese
market is closed to US apples if there are three occurrences of codling moth in independent
shipments per apple season. From December 2004 to April 2005 the Taiwanese market was
closed to US apples due to three codling moth incidents. There were two codling moth
detections in the past season.
Once we obtain the estimated coefficients on the import demand and export supply
equations, we calculate the corresponding elasticities. Then, we use those elasticities to simulate

10
revenue and quantity changes for Washington State apple producers when increasing and
decreasing SPS costs.
Data and Empirical Issues
The data are monthly from January 1995 to March 2007 for China, Mexico and the United
States, from January 1999 to March 2007 for India, and from January 1996 to March 2007 for
Taiwan. The import quantities and values for all countries involved in the analysis consist of
kilograms (kg) and USD for imports of fresh apples (Harmonized System code 080810) for
China, India, Mexico, and Taiwan. Quantities were transformed to 1,000 pounds and prices to
USD/pound. The import valuation is done in Cost, Insurance and Freight Import Value (CIF)6,
except for Mexico that reports import valuation in FOB prices. Unit import prices (CIF prices in
USD/kg or FOB prices in USD/kg for Mexico) for the United States and its main competitors in
each market are obtained by dividing import value by quantity imported for each country. The
competitors included in the import demand equation for China are New Zealand and Chile;
China and New Zealand are included in the equation for India; Canada, Argentina and Chile are
included for Mexico; and Japan, Chile and New Zealand are included for Taiwan. Not all
countries import apples from the United States or its main competitors in all months and thus,
prices and quantities are not available for the complete time series. These data were obtained
from the Global Trade Atlas.
Monthly retail prices of Fuji apples for China from January 1995 to September 2007 were
provided by Fred Gale, Senior Economist at the Economic Research Service, USDA. Monthly
wholesale prices of apples for India from May 2000 to September 2007 were obtained from the
6 CIF value includes insurance costs, transportation and miscellaneous charges to the first port of arrival in the importing country.

11
Agricultural Marketing Net of the Indian Government (website: http://dacnet.nic.in/dmi/
agmarkweb/SA_Pri_Month.aspx). Monthly wholesale prices of Red Delicious, Golden
Delicious and Starking apples for Mexico from January 1995 to September 2007 were obtained
through the Sistema Nacional de Información e Integración de Mercados of the Secretaría de
Economía (website: http://www.economia-sniim.gob.mx/). Monthly wholesale prices of Red
Delicious, Golden Delicious, and Fuji apples for Taiwan from January 1996 to September 2007
were obtained through Taiwan’s Council of Agriculture (website: http://amis.afa.gov.tw).
Information on tariffs was obtained from the Foreign Agricultural Service of the USDA,
the TRAINS database of the United Nations Conference on Trade and Development, and the
Northwest Horticultural Council website (www.nwhort.org). Monthly exchange rate data for
China, India, Mexico and Taiwan were obtained from the Pacific Exchange Rate Service, Sauder
School of Business, University of British Columbia. In the import demand equation for Mexico
an anti-dumping variable was added. Information on this variable was obtained through the
Foreign Agricultural Service of the USDA.
The export quantities and values, similar to the import data, consist of kg and USD for
exports of fresh apples for the United States. Quantities were transformed to 1,000 pounds and
prices to USD/pound. The export valuation is done in Free Along Ship Export Value (FAS)7.
Unit export prices (FAS prices in USD/kg) for the United States to each market are obtained by
dividing export value by quantity exported to each country. The competitors included in the
export supply equation for China and Taiwan are Canada and Mexico; Canada, Mexico and the
US retail price are included in the equation for India; and Canada and the United Kingdom are
included for Mexico. These data were obtained from the Global Trade Atlas. There are some
7 FAS value includes the value of exports at the export port including inland transportation, insurance and other costs of placing the goods alongside the carrier. This quotation excludes loading charges, freight, and insurance.

12
discrepancies in the data depending on the reporting country. US apple exports (reported by the
United States) do not necessarily match with imports of US apples (reported by each country
studied). Producer prices by month in Washington State were obtained from the National
Agricultural Statistics Service. These prices were converted from US cents/pound to
USD/pound.
The calculation of SPS costs was done in two parts. First, telephone interviews were
conducted. We identified 21 apple exporters in Washington State as potential participants of the
interviews. From this sample, we obtained 13 complete interviews. Second, we contacted the
Washington State Department of Agriculture (WSDA), to obtain information regarding costs
associated with the various certificates and inspections for each country. This information
(including changes over time) was provided by Jason Kelly, Communications Director, WSDA.
With the information from the telephone interviews to exporters and the WSDA, we were able to
calculate the price in USD per 1,000 pounds to comply with the SPS regulations to each of the
countries analyzed.
The cost index variable refers to the monthly total food marketing cost index, obtained
from the Economic Research Service of the USDA. In the export supply equation for Taiwan a
three-strike variable was added. Information on this variable was obtained through the Foreign
Agricultural Service of the USDA. Summary statistics for all variables used in the estimation are
presented in the appendix.
Empirical Issues
Tests for normality, heteroskedasticity, autocorrelation, seasonality, unit root and endogeneity of
prices were performed. The data does not present enough evidence to reject the normality

13
assumption in all equations. The hypotheses of homoskedasticity, unit root and endogeneity of
prices were rejected in all equations. Autocorrelation of order one and seasonality were found in
most equations (import demand and export supply equations for China and India, export supply
equation for Mexico and autocorrelation only in export supply equation for Taiwan).
We correct for heteroskedasticity in the estimation method as described in the results
section. A one-month lag of the dependent variable and a binary variable8 describing the apple
season in the corresponding country were added to the corresponding equation to account for
autocorrelation and seasonality in the data. There is economic as well as econometric
justification to include a one-month lag in the model. Adding a one-month lag of the dependent
variable is consistent with the theory of adaptive expectations, given that apple transactions are
done in a short term basis.
In the import demand equation for China, the US import price, the NZ import price and
the China retail price were normalized using the Chile import price instead of the China retail
price due to multicollinearity problems between the Chile import price and the NZ import price.
In the import demand equation for India, the US import price, the China import price and the NZ
import price were normalized using the India wholesale price. The ad valorem tariff variable
was dropped due to not enough variation in the time period studied.9 In the import demand
equation for Mexico, the US import price, the Canada import price, the Argentina import price
and the Chile import price were normalized using the Mexico wholesale price. The exchange
rate variable was not used due to multicollinearity with the US import price variable. In the
import demand equation for Taiwan, the US import price, the Japan import price, the Chile
import price and the NZ import price were normalized using the Taiwan wholesale price.
8 Apple season equals one during the apple season months in the corresponding country and zero otherwise. 9 The ad valorem tariff in India was 40 percent from January 1999 to December 2000 and 50 percent afterwards.

14
In the export supply equation for China, the China export price, the Canada export price
and the Mexico export price were normalized using the Washington State producer price. In the
export supply equation for India, the India export price, the Canada export price and the US retail
price were normalized using the Mexico export price due to multicollinearity between the
Mexico export price and the India export price when normalized using the Washington State
producer price. In the export supply equation for Mexico, the Mexico export price, the Canada
export price and the UK export price were normalized using the Washington State producer
price. In the equation for Mexico, the monthly packaging food marketing cost index was used
instead of the total food marketing cost index due to multicollinearity problems between the total
food marketing cost index and the export price. In the export supply equation for Taiwan, the
Taiwan export price, the Canada export price and the Mexico export price were normalized using
the Washington State producer price.
Results
We estimate the complete set of import demand and export supply equations (equations 6 and 8)
as seemingly unrelated estimation for each country using STATA. We consider the import
demand and export supply equations as a complete set since they represent a joint export
decision (Diewert and Morrison 1986; Goldstein and Khan 1978). The estimation was done in
two steps to correct for the heteroskedasticity found in the data. In the first step, ordinary least
squares was used to obtain estimates for each equation. In the second step, seemingly unrelated
estimation was used to allow for correlation between the import demand and export supply
equations and to correct for heteroskedasticity. The result is a single parameter vector and a
simultaneous robust covariance matrix.

15
Results from the seemingly unrelated estimation are reported in tables 1 to 4 for China,
India, Mexico and Taiwan, respectively. These results were used to calculate demand and
supply elasticities at the mean values for own price, competitors’ prices, ad valorem tariff,
exchange rate, SPS costs, and cost index for each country, anti-dumping duties for Mexico and
three-strikes for Taiwan. These elasticities are presented in tables 5 to 8 for China, India,
Mexico and Taiwan, respectively. Subsequently, the elasticities for SPS costs were used to
simulate revenue and quantity changes for Washington State apple producers when increasing
and decreasing SPS costs. The results for the different scenarios are presented in tables 9 to 12
for China, India, Mexico and Taiwan, respectively.
Estimated own price coefficients on the import demand equations have the expected
negative signs. However, only the estimated own price coefficient in the import demand
equation for Taiwan is significant. 10 In terms of the import demand equations for apples, it is
usual to classify apples from different countries as complements or substitutes based on the
geographical location of the countries. That is, apples from countries located in the same
hemisphere are expected to be substitutes, since both countries have the same growing season.
Conversely, apples from countries located in different hemispheres are expected to be
complements, given that their growing seasons are opposite. Nevertheless, given the storability
of apples, this it may be more appropriated to think of complements and substitutes through
demand oriented characteristics, like apple quality and varieties. Thus, we consider apples of
different varieties and/or quality to be complements and apples of the same varieties and/or
quality to be substitutes.
10 The significance level is 10 percent for all results discussed in this section, unless otherwise noted. Specific significance levels are found in the tables.
16
Following this reasoning, the estimated coefficients on competitors’ prices in the import
demand equation suggest that China considers domestic and US apples to be complements.
Washington apples are not considered close substitutes for Chinese domestic apples (personal
communication with Fred Scarlett, Northwest Fruit Exporters and Mark Powers, Vice President,
Northwest Horticultural Council). In general, Chinese apples are of different varieties and have
lower quality than Washington apples. This situation creates a niche market in China for
Washington apples, allowing Washington apple exporters to receive a premium for their product.
Imported apples in China have a higher price than domestic apples, differentiating both products
and making them attractive to consumers with different characteristics, specifically income.
In the case of Mexico, the estimated coefficients on competitors’ prices in the import
demand equation suggest that Mexico regards Canadian apples as complements for US apples,
and Chilean apples as substitutes for US apples. These results suggest that Canadian and US
apples exported to Mexico are of different quality or variety, whereas Chilean and US apples
have closer characteristics. Results for the import demand equation for Taiwan suggest that NZ
apples are considered complements for US apples, and Chilean and US apples are considered
substitutes. As in the case of Mexico, Taiwanese consumers regard Chilean and US apples as
similar products. However, they consider NZ and US apples as having different characteristics.
We expect the coefficient on ad valorem tariff to be negative for all countries, given that
the tariff represents an extra cost in the transaction. The estimated coefficient on ad valorem
tariff is negative as expected for China, but positive for Mexico and Taiwan. Given the little
variability observed in this variable for most of the countries, it is quite possible that the
coefficient on ad valorem tariff could be capturing some other effect that the model is failing to
correctly identify, for example changes in demand over time.

17
The estimated coefficient on exchange rate is negative for all countries, significant for
India and Taiwan and insignificant for China. When the exchange rate increases, the local
currency becomes more expensive relative to the US dollar. Therefore, the importing country
can now afford fewer apples. Our results are consistent with this argument. The coefficient on
anti-dumping duty for Mexico is also expected to be negative, since it acts like a tariff increasing
the transaction cost. The estimated coefficient is in effect negative, yet insignificant.
Estimated own price coefficients on the export supply equations have the expected
positive sign. All these coefficients are significant. Following a similar reasoning as in the case
of the import demand equations, we consider apples being exported to different countries as
complements or substitutes given the specific variety and/or quality of the apples. The estimated
coefficients on competitors’ prices in the export supply equation suggest that the United States
regards apples going to the domestic market and India as substitutes. Given that US retailer
price is the price for red delicious apples, and this is the main variety exported to India, we
expected red delicious apples for the domestic market and for India to be substitutes. Apples
exported to Mexico are considered substitutes to apples exported to Canada, and complements to
apples exported to the UK. The main varieties exported to Mexico are red and golden delicious
and to the UK are pink ladies, which is consistent with our findings. However, the Canadian
market receives all varieties and grades of US apples, which explains the substitution effect.
When exporting to Taiwan, US exporters regard apples exported to Canada as substitutes and
apples to Mexico as complements. Consumers in Taiwan prefer sweeter, larger and higher
quality fruit, and fuji apples (especially from Washington State) are the most popular fruits.
Since this variety is not very popular in Mexico yet, the US exporters view the Taiwanese and

18
the Mexican markets as complements. However, fuji apples are a popular variety in Canada as
well, and thus the substitution between the Canadian and Taiwanese markets.
We expect the coefficient on SPS cost to be negative given that SPS regulations increase
costs, paperwork and inspections required to export apples. The estimated coefficient on SPS
costs is significantly positive for China, insignificantly negative for India, and significantly
negative for Mexico and Taiwan. The case of China is somewhat different that the other
countries in this analysis, since fresh produce imports have increase dramatically in the last ten
years. Apple imports have increased almost ten-fold from the mid-nineties to 2006. And this
trend is expected to increase (Huang and Gale 2006; Shields and Huang 2004; USDA/FAS
2007). Such a large and increasing demand for good quality fresh apples overpowers the true
effect of the SPS regulations. Given that the cost of compliance for SPS regulations has
increased in the last few years same as apple demand, and thus apple imports, it is not surprising
to find a strong positive correlation between SPS costs and apple exports to China. However,
this result should not be misinterpreted as implying that as SPS costs increase, apple exports to
China are expected to increase.
The food marketing cost index was included to proxy the cost of value added activities
and services that the exporters incur when commercializing apples. Consequently, we expect the
coefficient on cost index to be negatively correlated with quantity exported. The estimated
coefficient on cost index is positive for China and Mexico, and negative for Taiwan. Both the
total food marketing cost index and the packaging food marketing cost index have been
increasing over time. Thus, it is not surprising that the estimated coefficient for China is
positive, as in the discussion regarding the estimated coefficient for SPS costs. However, it is
unexpected that the estimated coefficient on cost index for Mexico is positive. The coefficient

19
on the three-strikes variable in the model for Taiwan is expected to be negative given that this
policy introduced certifications, cold storage treatment, inspections that increase costs.
Nevertheless, the estimated coefficient on this variable is significantly positive.
The estimated coefficient on the one month lagged dependent variable is positive in all
equations, as we expected. Imported or exported quantity this month is positively correlated
with next month’s quantity. The estimated coefficient on apple season is positive for both
equations in the system for China, negative in the import demand equation for India, and
negative in the export supply equation for Mexico. Results for China suggest that quantity
demanded and supplied increases during the apple season in China and the US (it is the same).
This result is not quite intuitive. However, it could also be driven by the high quantity demanded
by China in the last years. Results for India suggest that demand for US apples decreases during
the apple season in India. This result is intuitive given the lack of adequate storage and
infrastructure in India to conserve apples through the year. Thus, during Indian apple season,
domestic apples have good quality and lower price than imported apples. Results for Mexico
suggest that the supply of US apples decreases during Mexican apple season. Given the cold
storage requirements for Mexico, this result was expected. Furthermore, this supports the claim
that the work plan for Mexico has been effective in keeping US apples out of the Mexican
market (or at least decreased the quantity of US apples) until most of the domestic crop has been
marketed (Zertuche 1995).
Import demand and export supply elasticities were calculated at the mean values for own
price, competitors’ prices, ad valorem tariff, exchange rate, SPS costs and cost index for each
country, anti-dumping duties for Mexico and three-strikes for Taiwan (tables 5 to 8). All
calculated own price elasticities are inelastic. Own price import demand elasticities range from
20
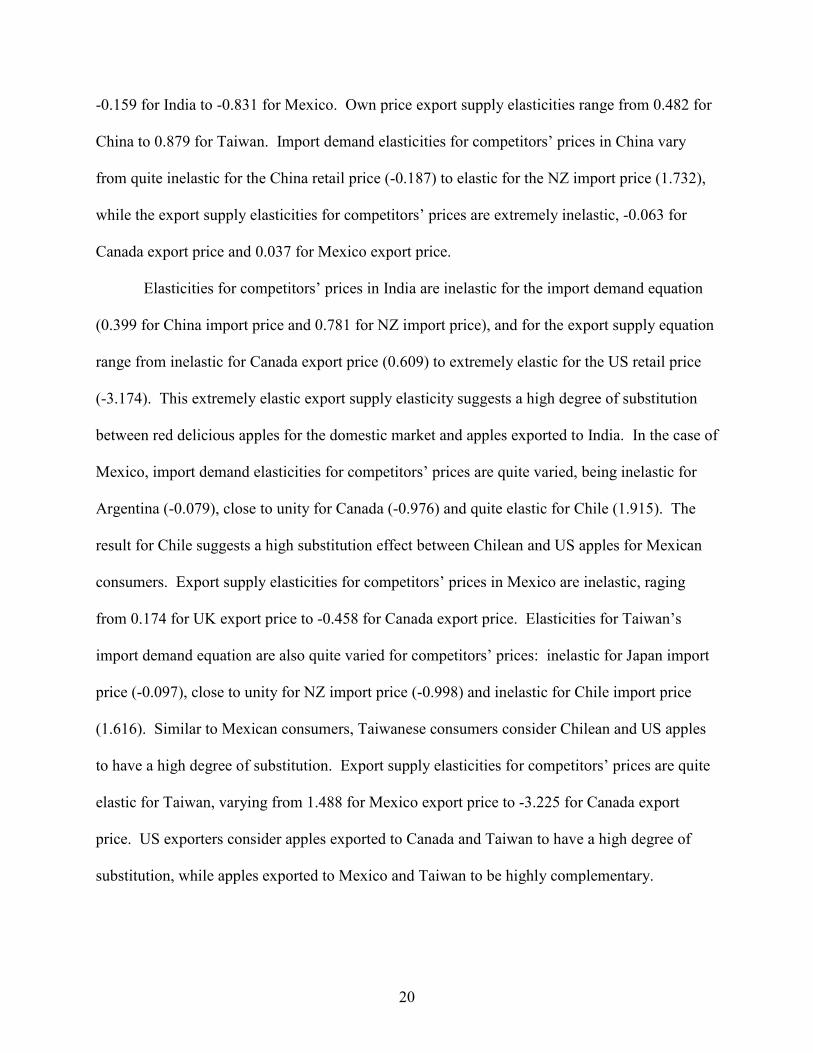
-0.159 for India to -0.831 for Mexico. Own price export supply elasticities range from 0.482 for
China to 0.879 for Taiwan. Import demand elasticities for competitors’ prices in China vary
from quite inelastic for the China retail price (-0.187) to elastic for the NZ import price (1.732),
while the export supply elasticities for competitors’ prices are extremely inelastic, -0.063 for
Canada export price and 0.037 for Mexico export price.
Elasticities for competitors’ prices in India are inelastic for the import demand equation
(0.399 for China import price and 0.781 for NZ import price), and for the export supply equation
range from inelastic for Canada export price (0.609) to extremely elastic for the US retail price
(-3.174). This extremely elastic export supply elasticity suggests a high degree of substitution
between red delicious apples for the domestic market and apples exported to India. In the case of
Mexico, import demand elasticities for competitors’ prices are quite varied, being inelastic for
Argentina (-0.079), close to unity for Canada (-0.976) and quite elastic for Chile (1.915). The
result for Chile suggests a high substitution effect between Chilean and US apples for Mexican
consumers. Export supply elasticities for competitors’ prices in Mexico are inelastic, raging
from 0.174 for UK export price to -0.458 for Canada export price. Elasticities for Taiwan’s
import demand equation are also quite varied for competitors’ prices: inelastic for Japan import
price (-0.097), close to unity for NZ import price (-0.998) and inelastic for Chile import price
(1.616). Similar to Mexican consumers, Taiwanese consumers consider Chilean and US apples
to have a high degree of substitution. Export supply elasticities for competitors’ prices are quite
elastic for Taiwan, varying from 1.488 for Mexico export price to -3.225 for Canada export
price. US exporters consider apples exported to Canada and Taiwan to have a high degree of
substitution, while apples exported to Mexico and Taiwan to be highly complementary.

21
The elasticity of demand for ad valorem tariff is inelastic for all countries, ranging from
0.078 for Mexico to 0.705 for Taiwan. On the other hand, the elasticity of demand for exchange
rate is quite elastic, ranging from -1.221 for Taiwan to -4.991 for India.11 The anti-dumping
duty elasticity is quite inelastic, -0.019. This is a surprising result given the high rate of the duty.
The elasticity of supply the SPS costs elasticities are elastic for China (2.159), Mexico (-1.126)
and Taiwan (-1.278) and inelastic and insignificant for India (-0.277). The cost index export
supply elasticity is elastic, ranging from 1.318 for Mexico to -4.452 for Taiwan.12 Finally, the
three-strike elasticity is quite inelastic, 0.102.
The SPS costs elasticities are used to calculate quantity and revenue changes for
Washington State apple producers under five different scenarios (tables 9 to 12). The scenarios
considered are: 20 percent increase in SPS costs, 50 percent increase in SPS costs, 20 percent
decrease in SPS costs, 50 percent decrease in SPS costs and the complete elimination of SPS
costs. Even though simulation results for China are included, we do not consider them to be
valid given the previous discussion regarding the large and increasing trend in fresh produce
imports.
In general our results are approximately within the range of estimates in the literature.
Simulation results for India13 suggest that increasing SPS costs 20 to 50 percent may decrease
revenue for Washington apple producers by 5.54 to 13.85 percent, or $338 to $844 thousand
USD on average per year. Conversely, decreasing SPS costs 20 to 50 percent may increase
revenue by 5.54 to 13.85 percent, or $338 to $844 thousand USD on average per year. If SPS
costs are completely eliminated, revenue for Washington apple producers may increase by 27.7
11 The value for China is -7.099, but insignificant. 12 However, the value for India is close to unity: -0.994, but insignificant. 13 It should be noted that the coefficient on SPS costs for India is insignificant. Nevertheless, we performed the simulation as it if were significant to provide a baseline for future comparisons.

22
percent, or $1.7 million USD on average per year. In the case of India, the scenarios including
an increase in SPS costs are more relevant. The ad valorem tariff for apples in India has been 50
percent since 2001. This is the maximum rate that the WTO authorizes. The tariff increased
from 40 to 50 percent in 2001 when India removed quantitative restrictions on apples. It is
believed that SPS barriers have not been enforced in India until now (Deodhar, Landes and
Krissoff 2006). However if these SPS barriers are enforced, some believe they could pose a
potential threat to Washington apple imports. These results provide a some evidence suggesting
that if India increases the SPS barriers for apples the revenue loss for Washington apple
producers may not be too large.
Simulation results for Mexico suggest that Washington apple producers may increase
revenue by 112.6 percent or $61.6 million USD on average per year if SPS barriers to Mexico
are completely eliminated. In a more conservative setting, if SPS costs are decreased 20 to 50
percent, revenue may increase by 22.52 to 56.3 percent, or $12.3 to $30.8 million USD on
average per year. On the other hand, if SPS costs increase 20 to 50 percent, then revenue may
decrease by 22.52 to 56.3 percent, or $12.3 to $30.8 million USD on average per year. In the
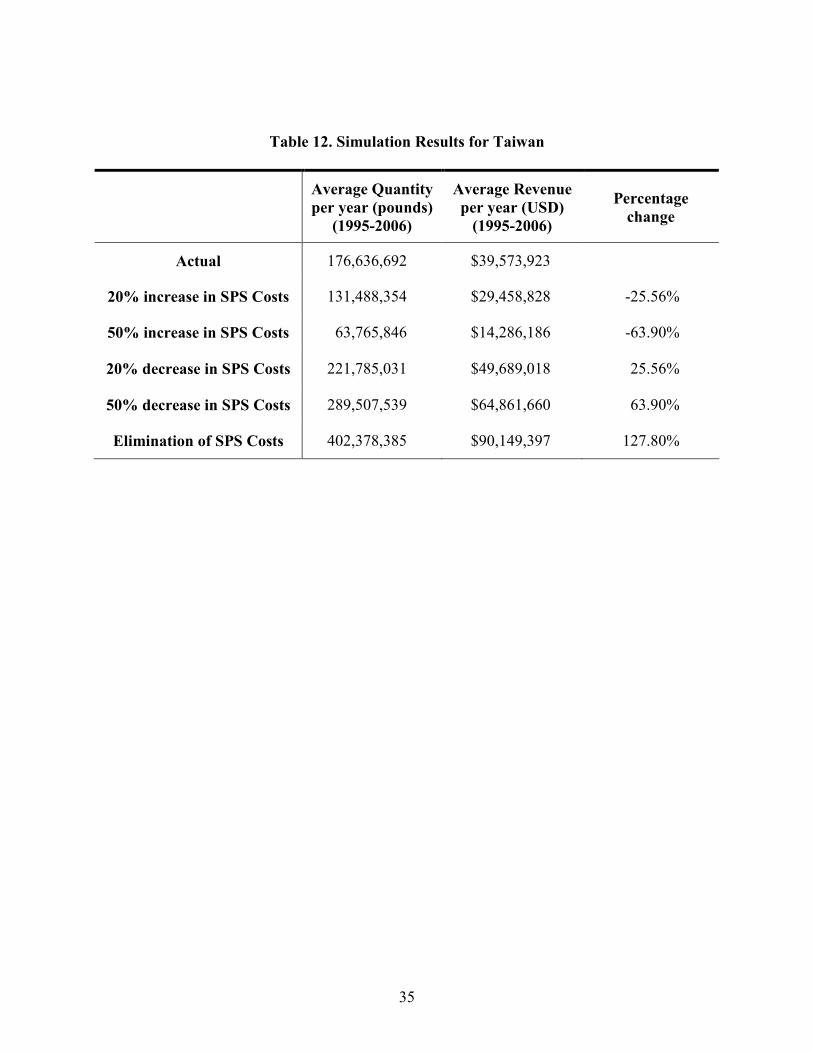
case of Taiwan, completely eliminating SPS barriers to trade may increase revenue for producers
by 127.8 percent or $50.6 million USD on average per year. Decreasing SPS costs 20 to 50
percent may increase producers’ revenue by $10 to $25 million USD on average per year.
Whereas increasing SPS costs 20 to 50 percent may decrease producers’ revenue by $10 to $25
million USD on average per year. As mentioned before, both Mexico and Taiwan require US
producers to comply with an extensive and burdensome work plan. Producer organizations, like
the Northwest Fruit Exporters, and government agencies have been lobbying for the reduction
and simplification of these work plans. Our results suggest that exports to Mexico and Taiwan

23
may increase significantly if SPS barriers are reduced, which supports the lobbying efforts of the
relevant organizations and agencies.
Conclusions
In order to estimate the effects of changing SPS barriers to trade on Washington State apples in
China, India, Mexico and Taiwan, we started by characterizing the full export model. We
estimate the complete set of import demand and export supply equations and we calculated the
corresponding import demand and export supply elasticities. The SPS costs elasticities obtained
from the export supply equations were used in the revenue simulation. Specifically, we
estimated quantity and revenue changes for Washington State apple producers when increasing
SPS costs 20 and 50 percent, decreasing SPS costs 20 and 50 percent, and completely
eliminating SPS costs.
Results from this study show that apples are a quite inelastic commodity in terms of own
price supply and demand for the countries studied. Regarding competitors’ prices, results
suggest that domestic US red delicious apples have a high degree of substitution with US apples
being exported to India. Mexican and Taiwanese consumers regard US and Chilean apples as
highly substitutable. US exporters consider apples exported to Canada and Taiwan to have a
high degree of substitution, while apples exported to Mexico and Taiwan to be highly
complementary. Elasticities for exchange rate and SPS costs are quite elastic for most countries,
suggesting that quantities are extremely sensitive to changes in both variables.
Our simulation results suggest that there are large gains to be made if SPS costs are
reduced, especially in Mexico and Taiwan. Revenue for Washington State apple producers may
increase between approximately 5 and 64 percent, or $340 thousand to $31 million USD on

24
average per year per country, depending on the specific reduction on SPS costs and country.
Furthermore, if SPS costs are completely eliminated in India, Mexico and Taiwan, producers
may gain between approximately 28 to 128 percent, or $1.7 to $62 million USD in revenue on
average per year per country. Mexico and Taiwan are confirmed as attractive markets for
Washington apples if SPS barriers are reduced or eliminated. In India, we find a limited change
in apple imports due to the inelastic SPS cost elasticity of supply. This result represents good
news for Washington State apple producers, given that it is believed that SPS barriers have not
been enforced in India until now and SPS barriers could be enforced if India is required by the
WTO to lower its ad valorem tariff. Thus, if India increases the SPS barriers for apples the
revenue loss for Washington apple producers may not be too large.
Unfortunately, we could not draw any satisfactory conclusions for China. Results for
China seem to be driven by the dramatic increase in fresh produce imports in the last ten years,
and thus, it is difficult to identify any other effect. However, it seems that regardless of the SPS
restrictions in this country, the demand for quality apples is so high that Chinese consumers are
willing to pay a premium for imported apples, making China an extremely attractive market for
Washington apples.
Our results bring some promising information to Washington State apple producers.
China is confirmed as an attractive market, regardless of SPS barriers to trade. Exports to
Mexico and Taiwan may increase significantly if SPS barriers are reduced. Even though exports
to India may decrease if SPS barriers are enforced, the loss may be insignificant. In general, we
provide further evidence of the potential increase in revenue if SPS barriers are reduced.
However, the other side of the story must be analyzed as well. A very interesting area for future

25
research derived from this study is to analyze the effects of changing SPS barriers to trade for US
apples in China, India, Mexico and Taiwan.
References
Arize, A.C. 2001. “Traditional Export Demand Relation and Parameter Instability: An
Empirical Investigation.” Journal of Economic Studies 28(6): 378-396.
Beghin, J.C., and J.C. Bureau. 2001. “Quantitative Policy Analysis of Sanitary, Phytosanitary
and Technical Barriers to Trade.” Économie Internationale 87: 107-130.
Calvin, L., and B. Krissoff. 2005. “Resolution of the US-Japan Apple Dispute: New
Opportunities for Trade.” Electronic Outlook Report from the Economic Research
Service FTS-318-01, ERS, USDA.
–––. 1998. “Technical Barriers to Trade: A Case Study of Phytosanitary Barriers and US-
Japanese Apple Trade.” Journal of Agricultural and Resource Economics 23(2): 351-
366.
Deodhar, S.Y., M. Landes and B. Krissoff. 2006. “Prospects for India’s Emerging Apple
Market.” Electronic Outlook Report from the Economic Research Service FTS-319-01,
ERS, USDA.
Devadoss, S., and T. Wahl. 2004. “Welfare Impacts of Indian Apple Trade Policies.” Applied
Economics 36: 1289-1294.
Diewert, W.E., and C.J. Morrison. 1988. “Export Supply and Import Demand Functions: A
Production Theory Approach.” In R. C. Feenstra, ed. Empirical Methods for
International Trade. Cambridge, Mass. and London: MIT Press, pp. 207-222.

26
Dimitri, C., A. Tegene, and P.R. Kaufman. 2003. “US Fresh Produce Markets: Marketing
Channels, Trade Practices, and Retail Pricing Behavior.” Electronic Report from the
Economic Research Service AER-825, ERS, USDA.
Featherstone, A., and C. Moss. 1994. “Measuring Economies of Scale and Scope in
Agricultural Banking.” American Journal of Agricultural Economics, 76(3): 655-661.
Huang, S., and F. Gale. 2006. “China’s Rising Fruit and Vegetable Exports Challenge US
Industries.” Electronic Outlook Report from the Economic Research Service FTS-320-
01, ERS, USDA.
Krissoff, B., L. Calvin, and D. Gray. 1997. “Barriers to Trade in Global Apple Markets.” In
Fruit and Tree Nuts Situation and Outlook FTS-280, ERS, USDA, pp. 42-51.
Goldstein, M., and M.S. Khan. 1978. “The Supply and Demand for Exports: A Simultaneous
Approach.” The Review of Economics and Statistics, 60(2): 275-286.
Loveland, V., and R. Hamilton. 2007. “The Washington State Report on Foreign Trade
Barriers to Food and Agricultural Exports.” Washington State Department of Agriculture,
AGR PUB 200-184 (N/3/07).
Marsh, T.L. 2005. “Economic Substitution for US Wheat Food Use by Class.” The Australian
Journal of Agricultural and Resource Economics 49: 283-301.
Miller, J. 2003. “Taiwan Fresh Deciduous Fruit Annual 2003.” USDA/FAS GAIN Report,
TW3032.
–––. 2006. “Taiwan Fresh Deciduous Fruit Annual 2006.” USDA/FAS GAIN Report, TW6035.
Northwest Horticultural Council. 2004. Submission for the Annual National Trade Estimate
Report on Foreign Trade Barriers 2004.
–––. 2006. Website: http://www.nwhort.org/

27
Seale, J.L., A.L. Sparks, and B.M. Buxton. 1992. “A Rotterdam Application to International
Trade in Fresh Apples: a Differential Approach.” Journal of Agricultural and Resource
Economics 17(1): 138-149.
Shields, D., and S.W. Huang. 2004. “Chapter 6: China’s Fruit and Vegetable Trade.” In
Global Trade Patterns in Fruits and Vegetables. Agriculture and Trade Report Number
WRS-04-06, Economic Research Service/USDA, pp. 52-63.
Shumway, C.R., R.R. Saez, and P.E. Gottret. 1988. “Multiproduct Supply and Input Demand
in US Agriculture.” American Journal of Agricultural Economics 70(2): 330-337.
USDA/FAS. 2006. “World Apple Situation and Outlook.” Horticultural and Tropical Products
Division.
USDA/FAS. 2007. “World Markets and Trade: World Apple Situation.” Office of Global
Analysis, May 2007.
Yue, C., J. Beghin, and H.H. Jensen. 2006. “Tariff Equivalent of Technical Barriers to Trade
with Imperfect Substitution and Trade Costs.” American Journal of Agricultural
Economics 88(4): 947-960.
Zertuche, C. 1995. “Fresh Deciduous Fruit: The Mexican Market for Apple and Pear
Products.” USDA/FAS GAIN Report, MX5506.

28
Table 1. Estimation Results for China
Import Demand Equation Export Supply Equation
Dependent Variable: Quantity Dependent Variable: Quantity
Variable Estimate P-Value Variable Estimate P-Value
-399.09 0.803 392.02* 0.055 US Import Price (1597.11)
China Export Price (204.23)
1964.83 0.204 -40.26 0.904 NZ Import Price (1545.93)
Canada Export Price (333.96)
-162.41** 0.035 32.15 0.905 China Retail Price (77.03)
Mexico Export Price (268.87)
-1448.15* 0.056 1393.93* 0.078 Ad Valorem Tariff (756.38)
SPS Costs (790.17)
-977.67 0.328 8.38*** 0.001 Exchange Rate
(999.50) Cost Index
(2.50)
0.4986*** 0.000 0.3157*** 0.000 1 Month Lag
(0.1054) 1 Month Lag
(0.0605)
538.61*** 0.003 450.57*** 0.005 Apple Season
(181.40) Apple Season
(159.28)
7358.69 0.354 -6728.71*** 0.000 Constant
(7938.78) Constant
(1153.34)
Observations 77 Observations 105
R-squared 0.5924 R-squared 0.6247
Chi-squared 170.66 Chi-squared 764.57
Note: robust standard errors are reported in parenthesis, demand and supply prices are normalized, and ***, **, * denote 1, 5 and 10 percent significance level, respectively.

29
Table 2. Estimation Results for India
Import Demand Equation Export Supply Equation
Dependent Variable: Quantity Dependent Variable: Quantity
Variable Estimate P-Value Variable Estimate P-Value
-542.21 0.829 1973.11*** 0.001 US Import Price
(2511.24)
India Export Price (593.79)
1471.49 0.389 1369.12 0.208 China Import Price (1709.81)
Canada Export Price (1088.50)
2427.88 0.117 -2854.46*** 0.000 NZ Import Price
(1550.29) US Retail Price
(623.78)
--- --- -454.54 0.636 Ad Valorem Tariff ---
SPS Costs (959.04)
-356.47** 0.040 -5.70 0.462 Exchange Rate
(173.40) Cost Index
(7.75)
0.6175*** 0.000 0.8371*** 0.000 1 Month Lag
(0.1134) 1 Month Lag
(0.0611)
-2519.08*** 0.000 153.23 0.580 Apple Season
(664.35) Apple Season
(276.85)
14633.46* 0.090 10300.88*** 0.002 Constant
(8622.10) Constant
(3247.38)
Observations 29 Observations 79
R-squared 0.7703 R-squared 0.7887
Chi-squared 249.72 Chi-squared 1423.88
Note: robust standard errors are reported in parenthesis, demand and supply prices are normalized, and ***, **, * denote 1, 5 and 10 percent significance level, respectively.

30
Table 3. Estimation Results for Mexico
Import Demand Equation Export Supply Equation
Dependent Variable: Quantity Dependent Variable: Quantity
Variable Estimate P-Value Variable Estimate P-Value
-33846.71 0.197 8262.22*** 0.000 US Import Price
(26239.86)
Mexico Export Price (1095.39)
-42327.58* 0.056 -5454.86*** 0.000 Canada Import Price (22136.19)
Canada Export Price (1162.44)
-3705.44 0.885 2209.67* 0.061 Argentina Import Price (25573.51)
UK Import Price (1177.34)
100561.00*** 0.003 Chile Import Price (33534.99)
73017.83*** 0.001 Ad Valorem Tariff (22476.27)
--- --- -12215.64*** 0.002 Exchange Rate
--- SPS Costs
(3988.06)
-1547.61 0.802 Cost Index 69.84*** 0.000 Anti-dumping Duty (6162.66) (20.00)
--- --- 0.6292*** 0.000 1 Month Lag
--- 1 Month Lag
(0.0087)
--- --- -6848.92*** 0.000 Apple Season
--- Apple Season
(443.16)
24439.76*** 0.007 67.49 0.981 Constant
(9129.24) Constant
(2875.25)
Observations 21 Observations 134
R-squared 0.7896 R-squared 0.7405
Chi-squared 1704.11 Chi-squared 65442.01
Note: robust standard errors are reported in parenthesis, demand and supply prices are normalized, and ***, **, * denote 1, 5 and 10 percent significance level, respectively.

31
Table 4. Estimation Results for Taiwan
Import Demand Equation Export Supply Equation
Dependent Variable: Quantity Dependent Variable: Quantity
Variable Estimate P-Value Variable Estimate P-Value
-9519.80*** 0.005 8733.74*** 0.000 US Import Price (3359.05)
Taiwan Export Price (1883.94)
-387.43 0.245 -24713.25*** 0.000 Japan Import Price (333.05)
Canada Export Price (2139.40)
25225.95*** 0.004 15629.02*** 0.000 Chile Import Price (8656.64)
Mexico Import Price (2890.27)
-15674.51** 0.011 -7749.11*** 0.005 NZ Import Price (6173.68)
SPS Costs (2772.26)
19470.64** 0.021 -126.53*** 0.000 Ad Valorem Tariff (8419.93)
Cost Index (19.43)
-326.51 0.476 6752.58*** 0.002 Exchange Rate (457.60)
Three Strikes (2139.04)
--- --- 0.2842*** 0.000 1 Month Lag
--- 1 Month Lag
(0.0240)
--- --- --- --- Apple Season
--- Apple Season
---
14372.28 0.373 103054.70*** 0.000 Constant
(16147.52) Constant
(10669.69)
Observations 34 Observations 120
R-squared 0.5379 R-squared 0.5158
Chi-squared 256.57 Chi-squared 22216.41
Note: robust standard errors are reported in parenthesis, demand and supply prices are normalized, and ***, **, * denote 1, 5 and 10 percent significance level, respectively.

32
Table 5. Elasticity Results for China
Import Demand Elasticities Export Supply Elasticities
Own Price -0.353 Own Price 0.482*
New Zealand Price 1.732 Canada Price -0.063
China Retail Price -0.187** Mexico Price 0.037
Ad Valorem Tariff -0.328* SPS Costs 2.159*
Exchange Rate -7.099 Cost Index 3.670***
Note: ***, **, * denote significance at the 1, 5 and 10 percent level, respectively.
Table 6. Elasticity Results for India
Import Demand Elasticities Export Supply Elasticities
Own Price -0.159 Own Price 0.639***
China Price 0.399 Canada Price 0.609
New Zealand Price 0.781 US Retail Price -3.174***
Ad Valorem Tariff --- SPS Costs -0.277
Exchange Rate -4.991** Cost Index -0.994
Note: ***, **, * denote significance at the 1, 5 and 10 percent level, respectively.
Table 7. Elasticity Results for Mexico
Import Demand Elasticities Export Supply Elasticities
Own Price -0.831 Own Price 0.503***
Canada Price -0.976* Canada Price -0.458***
Argentina Price -0.079 UK Price 0.174*
Chile Price 1.915***
Ad Valorem Tariff 0.078*** SPS Costs -1.126***
Anti-dumping Duty -0.019 Cost Index 1.318***
Note: ***, **, * denote significance at the 1, 5 and 10 percent level, respectively.

33
Table 8. Elasticity Results for Taiwan
Import Demand Elasticities Export Supply Elasticities
Own Price -0.658*** Own Price 0.879***
Japan Price -0.097 Canada Price -3.225***
Chile Price 1.616*** Mexico Price 1.488***
New Zealand Price -0.998** SPS Costs -1.278***
Ad Valorem Tariff 0.705** Cost Index -4.452***
Exchange Rate -1.221 Three Strikes 0.102***
Note: ***, **, * denote significance at the 1, 5 and 10 percent level, respectively.
Table 9. Simulation Results for China
Average Quantity
per year (pounds)
(1995-2006)
Average Revenue
per year (USD)
(1995-2006)
Percentage
change
Actual 11,524,252 $2,548,036
20% increase in SPS Costs 16,500,424 $3,648,278 43.18%
50% increase in SPS Costs 23,964,681 $5,298,640 107.95%
20% decrease in SPS Costs 6,548,080 $1,447,794 -43.18%
50% decrease in SPS Costs -916,178 -$202,569 -107.95%
Elimination of SPS Costs -13,356,608 -$2,953,173 -215.90%

34
Table 10. Simulation Results for India
Average Quantity
per year (pounds)
(1995-2006)
Average Revenue
per year (USD)
(1995-2006)
Percentage
change
Actual 27,671,294 $6,096,996
20% increase in SPS Costs 26,138,304 $5,759,222 -5.54%
50% increase in SPS Costs 23,838,820 $5,252,562 -13.85%
20% decrease in SPS Costs 29,204,284 $6,434,769 5.54%
50% decrease in SPS Costs 31,503,768 $6,941,430 13.85%
Elimination of SPS Costs 35,336,243 $7,785,864 27.70%
Table 11. Simulation Results for Mexico
Average Quantity
per year (pounds)
(1995-2006)
Average Revenue
per year (USD)
(1995-2006)
Percentage
change
Actual 277,502,916 $54,702,774
20% increase in SPS Costs 215,009,259 $42,383,710 -22.52%
50% increase in SPS Costs 121,268,774 $23,905,112 -56.30%
20% decrease in SPS Costs 339,996,572 $67,021,839 22.52%
50% decrease in SPS Costs 433,737,057 $85,500,437 56.30%
Elimination of SPS Costs 589,971,199 $116,298,099 112.60%
35
Table 12. Simulation Results for Taiwan
Average Quantity
per year (pounds)
(1995-2006)
Average Revenue
per year (USD)
(1995-2006)
Percentage
change
Actual 176,636,692 $39,573,923
20% increase in SPS Costs 131,488,354 $29,458,828 -25.56%
50% increase in SPS Costs 63,765,846 $14,286,186 -63.90%
20% decrease in SPS Costs 221,785,031 $49,689,018 25.56%
50% decrease in SPS Costs 289,507,539 $64,861,660 63.90%
Elimination of SPS Costs 402,378,385 $90,149,397 127.80%

36
Appendix
Table A1. Summary Statistics for China
Variable Units Obs. Mean Std. Dev. Min Max
Quantity pounds 147 1008.21 1329.82 0.00 5921.22
US Import Price USD/pound 148 0.23 0.0934 0.08 0.46
Chile Import Price USD/pound 91 0.27 0.0978 0.13 0.52
New Zealand Import Price USD/pound 125 0.24 0.0960 0.10 0.41
China Retail Price USD/pound 153 0.30 0.0683 0.20 0.68
Ad Valorem Tariff percentage 153 0.29 0.1455 0.10 0.40
Exchange Rate CYN/USD 153 8.22 0.1726 7.52 8.46
China Export Price USD/pound 116 0.30 0.0884 0.17 0.81
Canada Export Price USD/pound 147 0.38 0.0525 0.29 0.50
Mexico Export Price USD/pound 147 0.28 0.0531 0.19 0.52
WA Producer Price USD/pound 148 0.22 0.0610 0.10 0.39
SPS Costs USD/1000pounds 153 1.79 0.1668 1.70 2.08
Cost Index index 147 499.91 40.78 441.50 582.90

37
Table A2. Summary Statistics for India
Variable Units Obs. Mean Std. Dev. Min Max
Quantity pounds 99 2703.21 3309.06 0.00 17151.55
US Import Price USD/pound 73 0.30 0.0497 0.19 0.50
China Import Price USD/pound 63 0.27 0.0449 0.15 0.47
New Zealand Import Price USD/pound 51 0.32 0.0516 0.20 0.57
India Wholesale Price USD/pound 79 0.28 0.0779 0.10 0.49
Exchange Rate INR/USD 105 45.27 2.10 40.13 48.96
India Export Price USD/pound 88 0.29 0.0627 0.14 0.41
Canada Export Price USD/pound 99 0.38 0.0570 0.29 0.50
Mexico Export Price USD/pound 99 0.29 0.0568 0.24 0.52
US Retail Price USD/pound 105 0.97 0.0920 0.81 1.26
SPS Costs USD/1000pounds 105 1.84 0.1852 1.70 2.08
Cost Index index 99 521.20 32.23 464.60 582.90

38
Table A3. Summary Statistics for Mexico
Variable Units Obs. Mean Std. Dev. Min Max
Quantity pounds 147 23452.87 15573.84 443.87 84578.18
US Import Price USD/pound 145 0.38 0.0875 0.18 0.62
Canada Import Price USD/pound 92 0.33 0.0862 0.15 0.53
Argentina Import Price USD/pound 34 0.35 0.0354 0.25 0.42
Chile Import Price USD/pound 89 0.33 0.0534 0.24 0.51
Mexico Wholesale Price USD/pound 153 0.56 0.0976 0.37 0.87
Ad Valorem Tariff percentage 153 0.10 0.0879 0.00 0.20
Anti-dumping Duty percentage 153 0.23 0.2944 0.00 1.01
Mexico Export Price USD/pound 147 0.28 0.0531 0.19 0.52
Canada Export Price USD/pound 147 0.38 0.0525 0.29 0.50
UK Export Price USD/pound 147 0.35 0.0906 0.22 0.59
WA Producer Price USD/pound 148 0.22 0.0610 0.10 0.39
SPS Costs USD/1000pounds 153 2.08 0.2137 1.94 2.45
Cost Index index 147 423.63 30.32 386.90 495.60

39
Table A4. Summary Statistics for Taiwan
Variable Units Obs. Mean Std. Dev. Min Max
Quantity pounds 135 14578.88 12801.62 0.00 57750.12
US Import Price USD/pound 128 0.30 0.1006 0.22 0.91
Japan Import Price USD/pound 104 1.02 0.8687 0.46 3.87
Chile Import Price USD/pound 88 0.30 0.0594 0.10 0.56
New Zealand Import Price USD/pound 77 0.30 0.0883 0.10 0.82
Taiwan Wholesale Price USD/pound 112 0.59 0.1873 0.19 1.47
Ad Valorem Tariff percentage 141 0.32 0.1270 0.20 0.50
Exchange Rate TWD/USD 141 32.20 2.25 27.00 35.02
Taiwan Export Price USD/pound 132 0.29 0.0647 0.14 0.48
Canada Export Price USD/pound 135 0.38 0.0534 0.29 0.50
Mexico Export Price USD/pound 135 0.28 0.0545 0.19 0.52
WA Producer Price USD/pound 136 0.22 0.0622 0.10 0.39
SPS Costs USD/1000pounds 141 2.39 0.2657 2.18 2.82
Cost Index index 135 504.81 38.93 448.30 582.90
Three Strikes binary variable 141 0.35 0.48 0.00 1.00
Related Documents