An Economic Analysis of Life Insurance Company Expenses By Dan Segal Leonard N. Stern School of Business New York University 40W. 4th St. NYC, NY 10012 (212) 998 0036 E-mail: [email protected] This report has been submitted to the North American Actuarial Journal for publication consideration August 2000

Welcome message from author
This document is posted to help you gain knowledge. Please leave a comment to let me know what you think about it! Share it to your friends and learn new things together.
Transcript

An Economic Analysis of Life Insurance Company Expenses
By
Dan Segal
Leonard N. Stern School of Business
New York University
40W. 4th St.
NYC, NY 10012
(212) 998 0036
E-mail: [email protected]
This report has been submitted to the North American Actuarial Journal
for publication consideration
August 2000

An Economic Analysis of Life Insurance Company Expenses
2
Summary of Results
This paper estimates the acquisitionand maintenance costs associated with life policies as
a function of the amount of insurance and number of policies of an insurer by estimating a cost
function for our sample of insurers. Our sample consists of firms that responded to a survey
requesting information regarding the number of employees and agents employed by the firm
from 1995 to 1998. We excluded very small firms from the analysis. The final sample consists of
448 firm-year observations. The overall costs associated with life policies, that is, acquisition and
maintenance costs, are computed as the marginal cost of the cost function, which represent the
present value of total costs.
We examine several statistical characteristics of these costs – at the mean and at the
median of the sample, and for different company sizes. The data indicate that there is a large
variation among life insurance companies and that the costs associated with life policies of the
largest insurers are much higher than the corresonding costs of other firms. Comparing the costs
between firms that use branches as their main distribution system (henceforth referred to as
“branch firms”) and firms that use other marketing systems (“non-branch firms”) reveal that the
costs of branch firms are generally higher.
Given the estimated marginal costs, we illustrate an “Expense Table” using the
following assumptions: (1) the ratio of acquisition (maintenance) expenses to total costs is
69.37% (30.63%), (2) the average duration of whole (term) life policy is 14 (11) years, and (3)
the discount rate is 10%. The Expense Table is constructed separately for branch firms and non-
branch firms.

An Economic Analysis of Life Insurance Company Expenses
3
Expense Table– Illustration
First Year Charges ($) per Policy and Amount of Insurance for Branch and Non-BranchFirms
Branch Firms Non-Branch FirmsWhole Term Whole Term
Policy 149.00 149.00 158.00 158.00
Amount (000) 9.40 2.60 6.70 1.00
Maintenance Charges ($) per Policy and Amount of Insurance for Branch and Non-BranchFirms
Branch Firms Non-Branch FirmsWhole Term Whole Term
Policy 9.30 10.70 9.80 11.40
Amount (000) 0.58 0.19 0.41 0.07
I - Methodology
The purpose of this study is to develop a methodology that can be used to construct life
insurance industry benchmark expense factors. To do so, an illustrative Expense Table (“the
Expense Table”) is constructed based on reported expense experience for U.S. insurers during
1995-98. The costs reflected are all operating expenses of the life insurance line of business
except commissions and taxes.
When estimating the costs associated with life insurance policies, one needs to take into
account the multi-product nature of the life insurance industry. Broadly, the products of life
insurance companies can be classified into three lines of business: life insurance, annuities and
other accumulation products, and Accident & Health (A&H). As these product types are
different in nature, so too are the costs associated with each of them. The National Association of
Insurance Commissioners (NAIC) Annual Statement shows both the total costs associated with
the entire operation of the insurer and the costs associated with each line of business. However,

An Economic Analysis of Life Insurance Company Expenses
4
the allocation of the total costs across lines of business crucially depends upon the allocation
method used by each insurer. Since insurers may employ different cost allocation methods, each
of which may provide different allocations of the same costs, relying on the allocations made by
the companies may provide distorted results as to the “true” costs associated with each line of
business. Therefore, our approach to the problem of identifying the costs associated with life
insurance policies is to first estimate the portion of total costs attributed to the life insurance line
of business, and then to compute the costs associated with each life insurance policy.
To identify the costs associated with each line of business, among other important
economic aspects of the firms’ operations, economics theory suggests the estimation of cost
function, where the costs to be allocated are modeled as a function of input prices and physical
outputs. The costs associated with each line of business can be estimated by computing the
marginal cost of the cost function for each output; i.e., using the estimated cost function, the
marginal cost with respect to each line of business proxies for the costs associated with each
product. Since the cost function is estimated based on a sample of insurers, the estimated
marginal costs represent the average marginal costs of the sample and therefore the average cost
of each line of business.
For our purpose, we estimate the cost function, where costs are defined as the insurance
total operating expenses as summarized in Exhibit 5 of the insurers’ regulatory Annual
Statements. Total operating costs, however, consists of both the costs associated with selling and
issuing new policies (acquisition costs) and the costs of maintaining existing policies
(maintenance costs). Assuming that the ratio of issuance expenses to maintenance expenses is
stable over time, and that technology, mortality rates, lapse rates and other factors that have an
effect on a company’s operations do not change dramatically over the years, the estimated

An Economic Analysis of Life Insurance Company Expenses
5
marginal costs are not only the costs attributed to new policies, but also the costs of selling and
maintaining the policies as long as they are in force. To put it differently, the estimated marginal
costs represent the present value of the overall costs associated with the policies.
The construction of our illustrative Expense Table consists of two steps. In the first step,
the estimated marginal costs are assigned to acquisition and maintenance costs, which represent
the present value of these costs. To separate total costs into acquisition and maintenance costs,
one needs to make an assumption regarding the portion of total costs that is attributed to these
two functions. In the second step, one needs to compute the yearly charges such that the present
value of first year charge and those of subsequent years would equal the acquisition and
maintenance costs obtained from the estimated marginal costs, respectively. To operationalize
the second step, assumptions regarding the average duration of a typical life policy and on
discount rate are required.
Based on results of other studies, insurer characteristics that need to be addressed when
constructing the Expense Table are distribution systems and the size of the insurers. Since most
insurers employ more than one distribution system, it is hard to define (and measure) the
insurer’s “exact” distribution system. Therefore, we broadly classify the firms into two groups
according to their primary distribution system – branch and all other systems. The distribution
system is accounted for in the regression estimation, as well as in the computations leading to the
Expense Table.
Our results show that size of insurer may be an important factor in determining the
Expense Table. In general, based on our sample, larger firms exhibit higher operating expenses
for each line of business. One potential reason is that large insurers may not be as efficient as

An Economic Analysis of Life Insurance Company Expenses
6
small insurers, and therefore their costs of selling new policies and maintaining existing policies
are higher.
The remainder of this study is organized as follows. The next section provides a
description of the outputs and of the input prices that are used in the estimation of the cost
function. Section III describes the cost function and the estimation method, and Section IV
provides the estimation results. Section V describes and illustrates suggested methodology to
construct the Expense Table using the marginal costs of the cost function.
II– Outputs, Input Prices1 and Data
The estimation of cost function requires physical outputs and input prices. Several
previous studies have estimated the cost function of the life insurance industry. While most
studies agree on input definition, they differ in output definition and measurement. Below, we
provide a short description and critique of the outputs used in the literature, and then describe the
outputs and input prices that are used in this study.
Outputs
Outputs in the Literature
As with all service sectors, output definition and measurement are not trivial. Most
studies define the outputs by lines of the business, that is, life policies, annuities and accident and
health (A&H), whereas some studies add investment income as an additional output. Similarly,
the major differences among studies of the cost structure of the life insurance industry are in the
area of output measurement.
The Glossary provides exact definition of each variable and its reference in the Annual Statement

An Economic Analysis of Life Insurance Company Expenses
7
Geehan (1986) provides a useful discussion of the issues involved and presents a
comparison of major studies that use different output measures. Grace and Timme (1992),
Gardner and Grace (1993), and Fecher et al. (1993) measure outputs as the dollar value of
premiums and annuity considerations. Premiums, however, are a questionable measure of life
policies and annuities, some of the later for which are recognized as deposits. They do not
represent physical output but rather revenues (price per unit multiplied by the number of units of
insurance ). Furthermore, for whole life insurance policies, only a portion of the premium covers
the risk-bearing that life insurance companies provide to the insured. The remaining portion
covers the cash value of the policy, future expected dividends (in the case of participating
policies), and the expenses of the company. Thus, a portion of the premium actually belongs to
the insured and should not be considered as revenue for the insurer.
Yungert (1993) measures outputs by additions to reserves. The major problem with the
use of additions to reserves as an output measure is that reserves change when policies age,
regardless of whether new policies are sold. Furthermore, the change in reserves measures the
change in liabilities, rather than the outcome of the selling effort.
In a more recent study, Cummins and Zi (1998) distinguish between the two principal
services provided by life insurance companies: risk bearing/pooling and intermediation services.
As a proxy for risk bearing/pooling, they use incurred benefits by line of business, whereas for
the intermediation service they use additions to reserves. Here again the proxy for output is
disputable, as benefits represent incurred obligations that were established in the past. Hence
they do not measure current output but past cumulative output.
Following Cummins and Zi (1998), we characterize the outputs by their primary service.
Life policies provide either pure risk protection (e.g., term life policies) or a mix of risk
An Economic Analysis of Life Insurance Company Expenses
8
protection and intermediation services (e.g., whole life policies). Annuities can be viewed as a
saving vehicle, and therefore, the service can be characterized as intermediation. A&H policies,
on the other hand, provide risk protection services alone.
Life insurance output
The risk bearing/pooling that life insurance companies provide for new policies can be
approximated by the total amount of insurance sold during the year. The total amount of
insurance sold during the year measures the outcome of the selling effort and the additional risk
that the company bears and, therefore, can represent the output of the life insurance line of
business. Furthermore, the total amount of insurance measure of output may be appropriate to all
types of life policies, both those that provide pure risk protection (term life) and those that serve
also as savings vehicle.
Since the costs associated with whole life policies are different from those associated
with term life policies, we separate the total amount of insurance sold into whole life policies’
amount of insurance sold and term life policies’ amount of insurance sold.
Part of the costs associated with life policies is fixed, that is, expenses that are not related
to the size of the policy. Therefore, we include the number of life policies as another dimension
of output. We assume that the fixed cost associated with life policies is the same for term and
whole life policies.
In summary, we use three outputs for the life insurance line of business: number of life
policies sold during the year, whole life policies amount of insurance sold, and term life policies
amount of insurance sold.

An Economic Analysis of Life Insurance Company Expenses
9
Annuities output
The profits/losses of life insurance companies from annuities stem from the difference
between the actual return on investments and the return credited to the contracts. Assuming a
positive spread, the larger the annuity considerations, the higher is the expected profit. Hence, a
plausible proxy for the output is annuity considerations, which represent the increase in the
earning “base” of this line of business.
A&H output
A&H policies provide primarily risk protection. Since we could not quantify the amount
of risk associated with each new policy, we use A&H premiums as a proxy for the A&H output.
In equilibrium, where the risk associated with A&H policies is priced correctly, premiums are a
good proxy for risk.
To summarize, we use five outputs: number of new life policies sold, whole life policies’
amount of insurance sold, term life policies’ amount of insurance sold, total annuity
considerations, and total A&H premiums.
Inputs and Input Prices
The operating costs of life insurance can be classified broadly into labor-related
expenses, capital expenses, and materials consisting of all other expenses.
Price of Labor
Labor is defined as the total number of employees and agents employed by the company.
We compute the price of labor as the total cost of employees and agents divided by the total
number of agents and employees. The total cost of agents is computed as the sum of direct
commissions, contributions for benefit plans, payments under non-funded benefit plans and other
agent welfare. The total cost of employees is the sum of salaries, contributions for benefit plans,

An Economic Analysis of Life Insurance Company Expenses
10
payments under non-funded benefit plans and other employee welfare. The price of labor is a
surrogate for the average cost of employees. Therefore, for companies for which the computed
price of labor is less than $15,000 we change the price of labor to $15,000, and for companies for
which the computed price of labor is greater than $120,000 we change the price of labor to
$120,0002.
Price of Capital
Capital is defined as the sum of capital expenses: rent, equipment rental, and
depreciation. Since we cannot obtain the price of each of the capital expenses, we compute the
price of capital as the ratio of capital expense to the number of employees and agents, effectively
computing capital expense per employee. However, assuming that capital per employee (the
space each employee occupies and the quality of equipment each operates) is equal across
companies, this ratio may serve as a proxy for the price of capital.
Price of Materials
The third input, materials, consists of all other expenses that appear in Exhibit 5 – Exhibit
of General Expenses in the statutory Annual Statements, other than labor and capital expenses.
Most of the expense items are directly related to selling new policies and servicing existing
policies. Therefore, a reasonable price for materials would be the ratio of materials expense to
the total number of policies sold and serviced. However, since we cannot obtain an estimate of
the number of policies serviced during the year, we use instead the number of policies that were
sold and terminated during the year in the denominator. We compute the number of policies
terminated during the year as the number of policies at the end of year (t-1) plus the number of
2 Note that the computed price of labor depends on the number of employees, data that were provided by thecompanies included in the sample. Since some companies may have counted part time employees as full timeemployees or gave just an estimate of the number of employees, the resultant price of labor has significant variationacross companies. In addition, for some companies the average yearly price of labor is unreasonable (below $1000

An Economic Analysis of Life Insurance Company Expenses
11
policies sold during year (t) minus the number of policies at the end of year (t). Hence, for each
line of business3, we compute the number of policies that were sold and terminated during the
year as
2*# of policies sold + # of policies at the end of year t-1 - # of policies at the end of year t
Data
The insurance financial data were obtained from the regulatory Annual Statement filed by
insurers as reported in the National Association of Insurance Commissioners (NAIC) life
insurance data tapes for 1995-1998. The NAIC tapes do not include information as to the
number of employees and agents that insurers employ. The number of employees and agents is
required in order to compute adequate measures of labor and the price of labor and capital.
Therefore, we include in the sample only companies which responded to a survey that requested
the number of employees and agents, or companies for which we have these data from LOMA’s
Expense Management Program (EMaP). EMaP is a detailed expense study of life insurance
companies that chose to participate in the program.
The initial sample consists of 733 observations (companies-years). We exclude firms for
which the data are not consistent or show negative direct premiums, revenues, benefits,
commissions, amount of insurance, labor related expenses, and capital expenses (154
observations). In addition, we exclude from the sample small companies that either had less than
10 employees and agents, operating costs less than $1,000,000, or sold less than 1,000 life
policies (131 observations). The final sample consists of 448 observations, 111 firms in 1995,
114 in 1996, 111 in 1997, and 112 in 1998. Milliman & Robertson, Inc. provided data on the
or above $200,000). Hence, we had to modify the price of labor to make it more reasonable. Alternatively, we couldhave omitted these observations, but that would have reduced the statistical power of the analysis.3 The data do not contain information as to the number of insureds under A&H group master policies. Therefore, forthe computation we use the number of master policies.

An Economic Analysis of Life Insurance Company Expenses
12
sample firms’ distribution systems, on the estimated ratio of issuance costs from total costs, and
on estimated average duration of whole and term life policies.
III-Cost Function
Define
Pl = price of laborPk = price of capitalPm = price of materialsWAMT = whole life policies amount of insurance soldTAMT = term life policies amount of insurance soldLIFPOL = total number of life policies issuedANN = total annuity considerationsAH = total A&H premiumsC = total insurance general expenses (=labor expense + capital expense + materials expense)L_SH = the share of labor related expenses of total costs = labor expense/CK_SH = the share of capital related expenses of total costs = capital expense/CM_SH= the share of materials related expenses of total costs = materials expense/CD = dummy variable for marketing system: 0 if branch and 1 otherwise
Note that since total cost is equal to the sum of labor, capital and materials expenses, the
sum of labor share, capital share and materials share must equal one, where each share represents
the percentage of total cost devoted to each of the inputs.
Let,
Cit=Plitα1Pkitα2Pmit
α3LIFPOLitβ1WAMTit
β2TAMTβ3ANNitβ4AHit
β5 (1)
Where all the variables are as defined above, i index firms, and t stands for year. Equation (1)
defines total costs as a non-linear function of inputs and outputs. This form of function is
commonly referred to as a Cobb-Douglas cost function. In order to estimate the function, we
transform it to linear form by taking the natural log of both sides of the equation. Equation (1)
constrains the economies of scale to be constant for all firms. This constraint seems to be too
restrictive, especially for the life insurance industry. To allow scale economies to differ across
firms we add half times the square of the natural log of all outputs (the firms index and the time

An Economic Analysis of Life Insurance Company Expenses
13
index are suppressed). In addition, to examine whether the cost structure of firms that use
primarily branch offices as a distribution system are different than the cost structure of firms that
use other distribution systems, we also add D (a dummy variable) times all the variables that
involve outputs. So equation (1) becomes:
∑∑∑ ∑∑ ++++=5
1
25
1
5
1
5
1
221
3
1
**)ln( kkkkkkkkii YDYDYYPC γλδβα (2)
i = L, M, KYk = LIFPOL, WAMT, TAMT, ANN, AHD=0 if branch, 1 otherwise
The marginal costs of the outputs are computed as the first derivative of total costs with
respect to each of the outputs. Using equation (2), the marginal cost with respect to term life
policies amount of insurance sold (TAMT) of a non-branch company (D=1) is computed as
follows
∂ln(C)/∂ln(TAMT) = (TAMT/C)* ∂C/∂TAMT
èMCTAMT=∂C/∂TAMT=(C/TAMT)*(∂ln(C)/∂ln(TAMT)), so
MCTAMT(D=1)=∂C/∂TAMT=(C/TAMT)*[βTAMT + δTAMTln(TAMT)+λTAMT+
γTAMT ln(TAMT)] (3)
And, the marginal cost with respect to term life policies amount of insurance sold (TAMT) of a
branch company (D=0) is
MCTAMT(D=0)=∂C/∂TAMT=(C/TAMT)*[βTAMT + δTAMTln(TAMT)] (4)
Similarly, we compute the marginal costs of the remaining outputs: LIFPOL, WAMT, ANN and
AH.
The marginal costs of LIFPOL,
MCLIFPOL(D=1)=∂C/∂LIFPOL=(C/LIFPOL)*[βLIFPOL +
δLIFPOLln(LIFPOL)+λLIFPOL+γLIFPOL ln(LIFPOL)] (5)
An Economic Analysis of Life Insurance Company Expenses
14
MCLIFPOL(D=0)=∂C/∂LIFPOL=(C/LIFPOL)*[βLIFPOL + δLIFPOLln(LIFPOL)](6)
The marginal costs of WAMT,
MCWAMT(D=1)=∂C/∂WAMT=(C/WAMT)*[βWAMT + δWAMTln(WAMT)+λWAMT+γWAMT
ln(WAMT)] (6)
MCWAMT(D=0)=∂C/∂WAMT=(C/WAMT)*[βWAMT + δWAMTln(WAMT)] (7)
The marginal costs of ANN,
MCANN(D=1)=∂C/∂ANN=(C/ANN)*[βANN + δANNln(ANN)+λANN+
γANN ln(ANN)] (8)
MCANN(D=0)=∂C/∂ANN=(C/ANN)*[βANN + δANNln(ANN)] (9)
And, the marginal costs of AH,
MCAH(D=1)=∂C/∂AH=(C/AH)*[βAH + δAHln(AH)+λAH+γAH ln(AH)] (10)
MCAH(D=0)=∂C/∂AH=(C/AH)*[βAH + δAHln(AH)] (11)
Specification and Estimation
Before estimating the model one needs to impose the homogeneity constraint - the sum of
α1,α2, and α3 must equal one. The reason is that if all prices increase by the same proportion,
then total costs must increase by the same proportion (see equation (1)). We impose the
homogeneity constraint by dividing all input prices and total costs by one of the input prices4, so
the empirical model of equation (2) becomes
∑
∑∑ ∑
+
++++++=
5
1
2
5
1
5
1
5
1
221
210
*
**)ln(*)ln(*)ln(
εγ
λδβααα
kk
kkkkkk
YD
YDYYPkPlC
(12)
4 The results of the estimation of the cost function are invariant to the price we use as a scaler

An Economic Analysis of Life Insurance Company Expenses
15
where C*=C/Pm, Pl*=Pl/Pm, Pk*=Pk/Pm, α0 is the intercept, ε is the disturbance term which is
assumed to be homoscadastic and normally distributed with zero mean and variance σ2. All other
variables are as defined above.
To estimate equation (12), economic theory suggests imposing additional constraints on
the model by adding two share equations to the system, that is,
∑
∑∑ ∑
+
++++++=
5
1
2
5
1
5
1
5
1
2210
*
**)ln(*)ln(*)ln(
εγ
λδβααα
kk
kkkkkk
YD
YDYYPkPlC
(13)
L_SH = α1 + εl (14)
K_SH = α2 + εk (15)
The introduction of the share equations into the system assures that the shares implied by
the estimated cost function are as close as possible to the actual cost shares. We include in the
estimation only two share equations, since the sum of the cost shares is 1. The system of
equations (13-15) is estimated using the Seemingly Unrelated Regression Equations (SURE)
procedure.
IV - Results
Table 1 – Descriptive Statistics (Number of Obseravtions=457)
Variable MEAN MIN Q1(25th Percentile)
MEDIAN Q3(75th Percentile)
MAX
COST ($000) 92,577 1,055 4,912 15,992 57,548 3,663,918TAMT (000) 2,372,869 0 14,410 195,340 1,377,000 57,091,000WAMT (000) 1,290,050 0 37,840 184,550 958,930 26,258,000ANN ($000) 141,912 0 163 7,064 40,597 5,315,036AH ($000) 134,137 0 443 9,137 62,073 6,562,188LIFPOL 91,452 1,000 6,233 15,944 56,017 3,708,830PL 32,117 15,000 15,000 20,243 37,602 120,000PK 2,975 20 390 1,490 3,744 40,009PM 174 1 34 86 197 2,798L_SH 0.56 0.02 0.50 0.58 0.64 0.84
An Economic Analysis of Life Insurance Company Expenses
16
K_SH 0.10 0.04 0.07 0.10 0.13 0.33M_SH 0.33 0.03 0.25 0.31 0.38 0.96
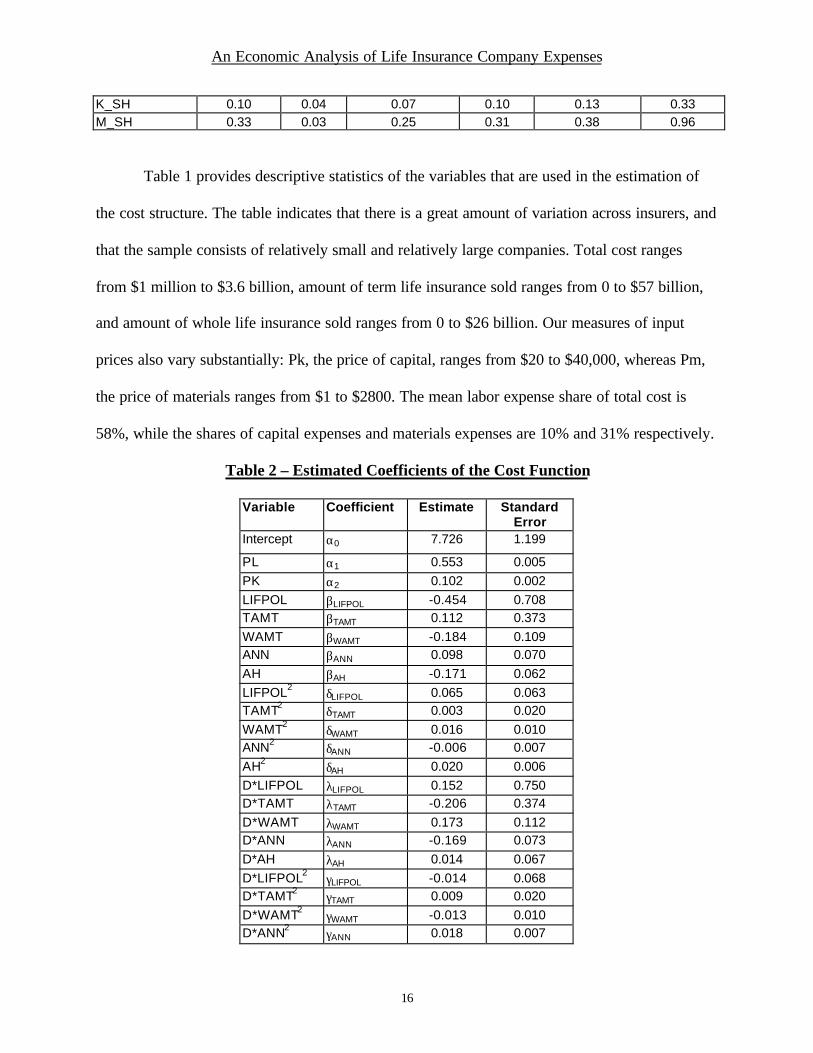
Table 1 provides descriptive statistics of the variables that are used in the estimation of
the cost structure. The table indicates that there is a great amount of variation across insurers, and
that the sample consists of relatively small and relatively large companies. Total cost ranges
from $1 million to $3.6 billion, amount of term life insurance sold ranges from 0 to $57 billion,
and amount of whole life insurance sold ranges from 0 to $26 billion. Our measures of input
prices also vary substantially: Pk, the price of capital, ranges from $20 to $40,000, whereas Pm,
the price of materials ranges from $1 to $2800. The mean labor expense share of total cost is
58%, while the shares of capital expenses and materials expenses are 10% and 31% respectively.
Table 2 – Estimated Coefficients of the Cost Function
Variable Coefficient Estimate StandardError
Intercept α0 7.726 1.199
PL α1 0.553 0.005
PK α2 0.102 0.002
LIFPOL βLIFPOL -0.454 0.708TAMT βTAMT 0.112 0.373
WAMT βWAMT -0.184 0.109ANN βANN 0.098 0.070
AH βAH -0.171 0.062
LIFPOL2 δLIFPOL 0.065 0.063TAMT2 δTAMT 0.003 0.020
WAMT2 δWAMT 0.016 0.010ANN2 δANN -0.006 0.007
AH2 δAH 0.020 0.006
D*LIFPOL λLIFPOL 0.152 0.750D*TAMT λTAMT -0.206 0.374
D*WAMT λWAMT 0.173 0.112D*ANN λANN -0.169 0.073
D*AH λAH 0.014 0.067
D*LIFPOL2 γLIFPOL -0.014 0.068D*TAMT2 γTAMT 0.009 0.020
D*WAMT2 γWAMT -0.013 0.010D*ANN2 γANN 0.018 0.007

An Economic Analysis of Life Insurance Company Expenses
17
D*AH2 γAH 0.004 0.006
Table 2 presents the estimated coefficients of the cost function along with their standard
errors. The coefficient of PL, α1, the estimated labor share, is 0.553, while the actual mean of the
labor share is 0.56. Similarly, the estimated capital share, 0.102, is very close to the mean of the
actual capital share, 0.1. Since the cost shares add up to 1.0, the estimated materials share is
0.344. The R-Sq. of the regression is fairly high, 84%, indicating that the correlation between the
natural log of costs and the variables on the right hand side of the regression is over 90%.
Using equations 4-11 and applying the relevant coefficients from the estimated cost
functions, we compute the marginal costs of the outputs for branch and non-branch companies.
Table 3 – Marginal Costs of Each Output, Evaluated at the Means, by Distribution System
Output Branch (D=0) Other (D=1)Life Policy $207 $194Term Life Amount of Insurance 0.0035 0.0014Whole Life Amount of Insurance 0.0120 0.0087Annuity Premiums 0.0089 0.0540A&H Premiums 0.0800 0.1300
Table 3 shows that the fixed cost of acquiring (not including commissions) and issuing a
life policy is $207 for companies which use branch office as their main distribution system and
$194 for companies which use other distribution systems. The marginal costs expressed in terms
of amount of insurance (term and whole) are higher for branch companies. For branch (non-
branch) companies the marginal cost of whole life amount of insurance is $12 ($8.70) per
thousand, while the marginal cost of term life amount of insurance is $3.50 ($1.40) per thousand.
For both types of distribution systems, the marginal cost of whole life amount of insurance is
greater than that of term life amount of insurance. The marginal costs of annuity and A&H

An Economic Analysis of Life Insurance Company Expenses
18
policies, however, are lower for branch companies. According to Table 3, as an illustration, the
marginal cost of term (whole) life policy with $100,000 amount of insurance of a branch
company is $557 ($1,407). Note that these marginal costs represent both the acquisition and
maintenance costs of the policy; that is, these are the average present values of the total costs
associated with a term (whole) life policy of the sample firms.
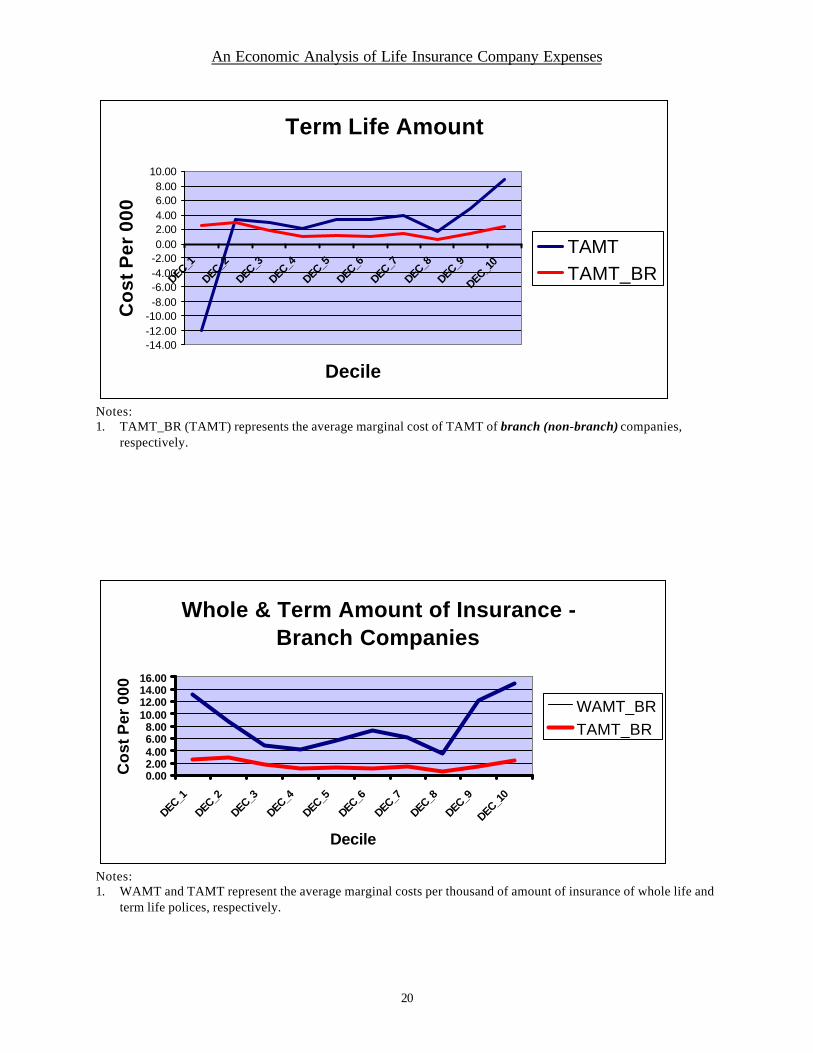
Table 4 and subsequent graphs show the marginal costs of the outputs by deciles of size
of insurer (measured using total costs) for the two marketing systems.
Table 4 – Marginal Costs ($) of Each Output, Evaluated at the Means of Deciles
DEC_1 DEC_2 DEC_3 DEC_4 DEC_5 DEC_6 DEC_7 DEC_8 DEC_9 DEC_10POL 31.60 41.26 32.44 33.46 105.67 83.49 84.09 157.35 320.49 452.07
POL_BR 38.66 53.73 38.21 37.30 119.60 89.44 89.25 160.84 318.55 423.58
WAMT 41.81 17.54 7.81 6.74 7.70 8.99 7.76 4.72 13.66 15.65WAMT_BR 13.10 8.80 4.86 4.12 5.71 7.32 6.10 3.62 12.16 14.98
TAMT -12.10 3.38 2.97 2.18 3.42 3.35 3.92 1.70 4.84 8.84TAMT_BR 2.57 3.00 1.84 1.07 1.23 1.08 1.39 0.58 1.41 2.40
ANN 294.66 69.92 9.72 20.65 8.22 0.92 0.71 3.13 -5.85 -22.63
ANN_BR -76.03 41.78 22.00 67.29 55.79 35.00 24.52 50.90 55.70 129.46AH 21.91 59.17 70.03 41.77 104.44 101.51 60.32 64.45 139.62 130.29
AH_BR 100.86 102.65 115.69 69.38 189.78 157.02 94.98 99.20 214.18 189.61
Notes:1. POL_BR, WAMT_BR, TAMT_BR, ANN_BR, AH_BR represent the marginal cost of LIFPOL, WAMT,
TAMT, ANN, and AH of branch companies, respectively.2. POL, WAMT, TAMT, ANN, AH represent the marginal cost of LIFPOL, WAMT, TAMT, ANN, and AH of
non-branch companies, respectively.

An Economic Analysis of Life Insurance Company Expenses
19
Notes:1. POL_BR (POL) represents the average marginal cost of LIFPOL of branch (non-branch) companies,
respectively.
Notes1. WAMT_BR (WAMT) represents the average marginal cost of WAMT of branch (non-branch) companies,
respectively.
Life Policy
0.0050.00
100.00
150.00200.00250.00
300.00350.00400.00
450.00500.00
DEC_1 DEC_2 DEC_3 DEC_4 DEC_5 DEC_6 DEC_7 DEC_8 DEC_9 DEC_10
Decile
Co
st
POL
POL_BR
Whole Life Amount
0.00
5.0010.00
15.00
20.0025.00
30.00
35.0040.00
45.00
DEC_1
DEC_2
DEC_3
DEC_4
DEC_5
DEC_6
DEC_7
DEC_8
DEC_9
DEC_10
Decile
Co
st P
er 0
00
WAMT
WAMT_BR
An Economic Analysis of Life Insurance Company Expenses
20
Notes:1. TAMT_BR (TAMT) represents the average marginal cost of TAMT of branch (non-branch) companies,
respectively.
Notes:1. WAMT and TAMT represent the average marginal costs per thousand of amount of insurance of whole life and
term life polices, respectively.
Term Life Amount
-14.00-12.00-10.00-8.00-6.00-4.00-2.000.002.004.006.008.00
10.00
DEC_1
DEC_2
DEC_3
DEC_4
DEC_5
DEC_6
DEC_7
DEC_8
DEC_9
DEC_10
Decile
Co
st P
er 0
00
TAMT
TAMT_BR
Whole & Term Amount of Insurance - Branch Companies
0.002.004.006.008.00
10.0012.0014.0016.00
DEC_1
DEC_2
DEC_3
DEC_4
DEC_5
DEC_6
DEC_7
DEC_8
DEC_9
DEC_10
Decile
Co
st P
er 0
00
WAMT_BR
TAMT_BR

An Economic Analysis of Life Insurance Company Expenses
21
Notes:1. WAMT and TAMT represent the average marginal costs per thousand of amount of insurance of whole life and
term life polices, respectively.
Whole & Term Amount of Insurance - Non-Branch Companies
-18.00-12.00-6.000.006.00
12.0018.0024.0030.0036.0042.0048.00
DEC_1
Decile
Co
st P
er 0
00
WAMTTAMT

An Economic Analysis of Life Insurance Company Expenses
22
Decile 1 includes all the companies for which total cost is less than the 10th percentile of
total cost, decile 2 includes the companies for which total cost is between the 10th and 20th
percentiles of total cost, and so forth. Decile 10 includes the largest insurers in the sample. The
marginal costs of LIFPOL, TAMT and WAMT at the means of the first seven deciles are similar.
However, for the largest insurers (decile 8 and up) the marginal costs are much higher. For
example, the marginal cost per life policy in the 8th decile is more than twice marginal cost per
life policy than that in the 7th quartile ($255 vs. $124). These results suggest that the Expense
Table should be stratified according to size.
Comparing between branch and other distribution systems reveals that the marginal costs
of branch companies are generally lower. However, for WAMT and LIFPOL, the differences
seem to be remote for most deciles. In addition, the graphs show that the marginal cost of
WAMT is consistently greater than the marginal cost of TAMT. This is expected since whole life
policies incur additional administrative costs for policy loans, transfers to and from non-
forfeiture status, payment of surrender values, policy changes involving changes in cash values,
etc. That suggests that the Expense Table should be constructed separately for whole life and
term life policies.
Table 5 presents the ratio of actual total costs to the estimated total costs (ACT (C)/EST
(C)). This ratio measures how much the predicted total costs, according to the cost function,
deviate from the actual total costs. We compute the estimated total costs by taking the exponent
of the estimated ln (C) and multiplying it by the price of materials. The mean (median) of the
ratio of actual costs to estimated costs is 1.24 (1.01). That is, for the median firm of the sample
the predicted total cost using the estimated cost function deviates by 1% from the actual total
costs. The table also indicates, as is common in regression analysis, that there are outliers in the

An Economic Analysis of Life Insurance Company Expenses
23
data, such as the two extremes – Min and Max in the table. In addition, as can be seen from the
table, certain values for annuities are negative, indicating that the models used may not be
appropriate for the extremes for annuity writers or that extreme variation occurs for the small
relative amount of business. Looking at 80% of the data, from the 10th to the 90th percentiles we
find that the ratio ranges from 0.44 to 2.3. Given the substantial variation across the sample
firms, we believe that the variation of the ratio of actual costs to estimated costs is reasonable.
Table 5 – Ratio of estimated costs to actual costs
Percentile ACT (C)/EST (C)MEAN 1.24Min. 0.1110th 0.4420th 0.5925th 0.6630th 0.7040th 0.89Med. 1.0160th 1.1770th 1.4175th 1.6380th 1.7790th 2.31Max. 6.04
V – Expense Table
To construct the Expense Table we rely on the marginal costs of the life insurance
outputs, LIFPOL, WAMT and TAMT, which are evaluated at the sample means and appear in
Table 3. The Expense Table is constructed separately for branch and non-branch firms. It also
specifies the first year and subsequent years’ charges for whole and term life policies.
Before proceeding with the analysis, it is important to note that the marginal costs
represent the present value of all costs associated with life policies through their duration.

An Economic Analysis of Life Insurance Company Expenses
24
Therefore, the present value of the issuance and maintenance costs prescribed by the Expense
Table must be equal to the marginal costs obtained from the cost function.
The first step of the analysis requires an assumption for the relative weights of
acquisition/issuance and total maintenance costs. The second step consists of the computation of
the yearly charges such that the present value of these charges equal the marginal cost of the life
policy (term and whole) which was obtained from the estimated cost function. This step requires
assumptions regarding interest rate/s and average duration of the policy.
The following analysis provides a step-by-step description of the construction of the
Expense Table. The analysis consists of several assumptions. Each of the assumptions can be
changed – the following is just an illustration of the Expense Table given these assumptions.
Step 1 – Separate total costs to issuance and maintenance costs.
Table 6 shows the marginal costs per policy and amount of insurance for whole life and
term life policies and for branch and non-branch firms (the table replicates the results in Table
3).
Table 6 - Marginal Costs ($) of Each Output, Evaluated at the Means, by
Distribution System
Branch Firms Non-Branch FirmsWhole Term Whole Term
Policy 195.00 195.00 207.00 207.00Amount ($000) 12.20 3.50 8.74 1.40
To separate total costs to acquisition/issuance and maintenance costs we assume that the
acquisition (maintenance) expense account for 69.37% (30.63%)5 of total costs. These ratios of
acquisition and maintenance expense of total costs are provided by Milliman & Robertson, Inc.
5 Note that the implied ratio of acquisition expense to maintenance expense is the industry’s average. Generally,faster (slower) growing companies would incur a higher (lower) than average ratio of acquisition expense tomaintenance expense.

An Economic Analysis of Life Insurance Company Expenses
25
Multiplying the marginal costs of LIFPOL, WAMT and TAMT by these ratios, we compute the
present value of acquisition and maintenance expenses for branch and non-branch firms:
Table 7 – Present Value ($) of Acquisition and Maintenance Expenses of Term and
Whole Life Policies, By Distribution System
Branch Firms Non-Branch FirmsAcquisition Maintenance Acquisition Maintenance
Whole Term Whole Term Whole Term Whole Term
Policy 135.30 135.30 59.70 59.70 143.60 143.60 63.40 63.40
Amount($000)
8.50 2.40 3.70 1.10 6.10 0.90 2.70 0.40
Step 2 – Computation of the annual charges for the first year and subsequent years
The first year charge covers acquisition expenses whereas the subsequent yearly charges
cover the maintenance expenses. This step relies on the following assumptions:
1. All charges are paid at the end of the year.
This assumption is made to simplify the computation. Alternatively, one can assume
that the charges are made at the beginning or middle of the year or are made on a
monthly basis.
2. Acquisition expenses are recovered in the first year of the policy and maintenance
expenses are recovered in subsequent years.
3. Average duration of whole (term) life policy is 14 (11) years. Acquisition expenses
are assumed to be recovered over these periods.
These assumptions are based on information provided by Milliman & Robertson, Inc .
The duration of the whole and term life policies determines the period in which both
the acquisition and maintenance expenses must be recovered. It follows that
maintenance expenses associated with whole (term) life policies are recovered in 13
(10) years, because the first year charges cover acquisition expenses only. Since the
An Economic Analysis of Life Insurance Company Expenses
26
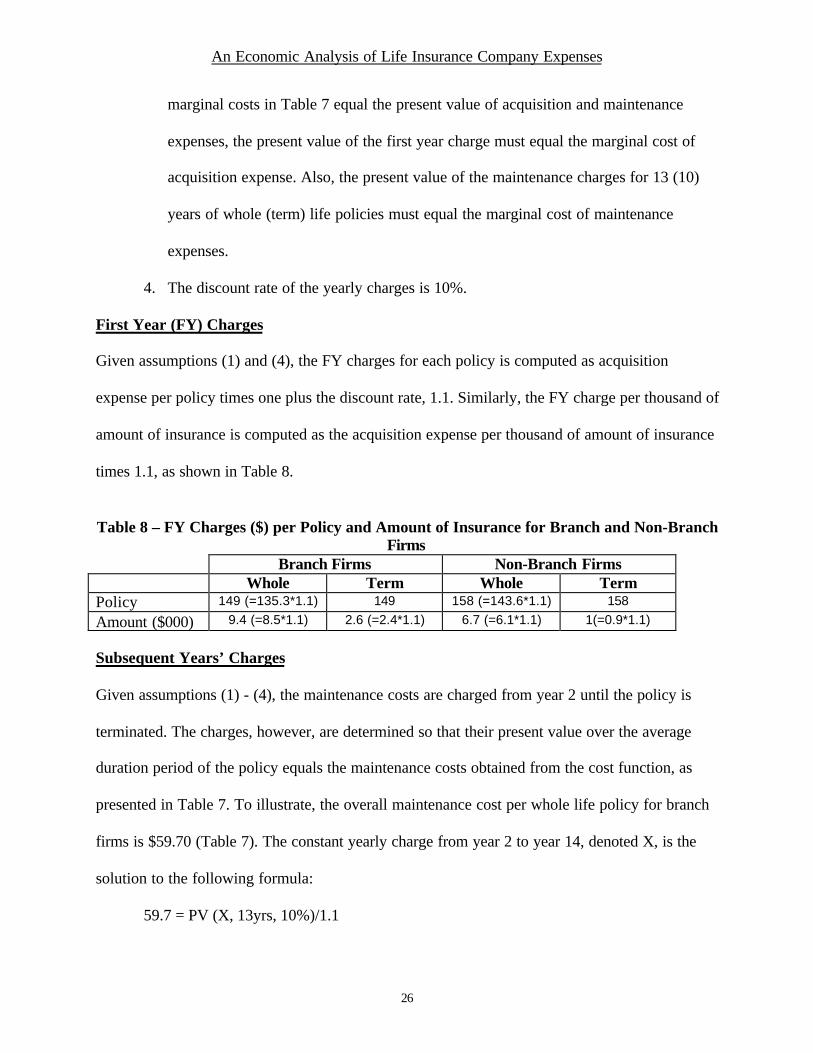
marginal costs in Table 7 equal the present value of acquisition and maintenance
expenses, the present value of the first year charge must equal the marginal cost of
acquisition expense. Also, the present value of the maintenance charges for 13 (10)
years of whole (term) life policies must equal the marginal cost of maintenance
expenses.
4. The discount rate of the yearly charges is 10%.
First Year (FY) Charges
Given assumptions (1) and (4), the FY charges for each policy is computed as acquisition
expense per policy times one plus the discount rate, 1.1. Similarly, the FY charge per thousand of
amount of insurance is computed as the acquisition expense per thousand of amount of insurance
times 1.1, as shown in Table 8.
Table 8 – FY Charges ($) per Policy and Amount of Insurance for Branch and Non-BranchFirms
Branch Firms Non-Branch FirmsWhole Term Whole Term
Policy 149 (=135.3*1.1) 149 158 (=143.6*1.1) 158
Amount ($000) 9.4 (=8.5*1.1) 2.6 (=2.4*1.1) 6.7 (=6.1*1.1) 1(=0.9*1.1)
Subsequent Years’ Charges
Given assumptions (1) - (4), the maintenance costs are charged from year 2 until the policy is
terminated. The charges, however, are determined so that their present value over the average
duration period of the policy equals the maintenance costs obtained from the cost function, as
presented in Table 7. To illustrate, the overall maintenance cost per whole life policy for branch
firms is $59.70 (Table 7). The constant yearly charge from year 2 to year 14, denoted X, is the
solution to the following formula:
59.7 = PV (X, 13yrs, 10%)/1.1

An Economic Analysis of Life Insurance Company Expenses
27
The PV formula in the brackets provides the present value of X for 13 years at a 10% discount
rate from the end of year 14 to the end of year 1. This present value needs to be further
discounted to the present, and therefore is divided by 1.1. Applying the same formula to the
maintenance cost per amount of insurance, we get the yearly charge for the amount of insurance.
Similarly, we compute the maintenance charges for term life policy, where the average duration
of the policy is 11 years and repeat the analysis for non-branch firms. The results are reported in
Table 9.
Table 9 – Maintenance Charges ($) per Policy and Amount of Insurance for Branch andNon-Branch Firms
Branch Firms Non-Branch FirmsWhole Term Whole Term
Policy 9.3 10.7 9.8 11.4
Amount (000) 0.58 0.19 0.41 0.07

An Economic Analysis of Life Insurance Company Expenses
28
GLOSSARY
Variable Name Definition NAIC Annual StatementReferences (98 Format)
C Insurance GeneralExpenses Incurred
Exhibit 5; (L10, col. 5 –L10, col. 4)
TAMT Amount of Term LifeInsurance Sold Duringthe Year
Exhibit of Life Ins.;L2 , col. 4 less line 29D,col. 2
WAMT Amount of Whole LifeInsurance Sold Duringthe Year
Exhibit of Life Ins.;L29, col.. 2
ANN Total AnnuityConsiderations
Exhibit 1 Pt 1;L20a, col. 4 + col. 7
A&H Total Accident andHealth Premiums
Exhibit 1 Pt 1;L20a, col. 8 + col. 9+col.10
LIFPOL Total number of lifepolicies issued duringthe year
Exhibit of Life Insurance,L1 (col.1+col.3+col.5+col.8)
Pl Price of Labor = totallabor expense/number ofemployee and agents
Total Labor Expense =Exh. 1 Pt 2, L31, Col.1+Exh 5, col. 5-col. 4,(L2-L3.32+L7.1-L7.3)
Pk Price of Capital = totalcapital expense/ numberof employee and agents
Capital Expense=Exh. 5, col. 5-col. 4, (L1+ L5.5+L5.6+L9.1)
TOTPOL Total number of policiessold and terminated =2*Policies issued duringyear +Policies in Force (t-1) +Policies in Force (t)
Polices in Force (t-1):Exh. of Life Insurance, L1(col. 1+col.3+col.5+col.8)+ Exh. of Number ofPolicies, Contracts…;Supp. Contracts, L1 (col.1-col.4) +Annuities, L1 (col.1+col.2 +col.4) +A&H Insurance, L1(Col.1+Col.3+Col.5)Policies in Force (t):Same exhibits and col..,L20, L9, L9, L10Policies Issued duringyear:Same exhibits and col..,L2
Pm Price of Materials =Materials Expense/TOTPOL
Material Expense =Exh. 5, col. 5-col. 4,(L4.1-L5.4 + L6.1-L6.8+L9.3)

An Economic Analysis of Life Insurance Company Expenses
29
References
Black, Kenneth Jr. and Harrold D.Skipper, Jr, Life Insurance, Twelfth Ed. 1994
Blair, Roger D., Jerry R. Jackson, and Ronald J. Vogel, “Economics of Scale in theAdministration of Health Insurance,” Review of Economics and Statistics, 1975, 185-189
Caves, W. Douglas, Laurtis R. Christensen, and Michael W. Trethway, “Flexible Cost Functionsfor Multiproduct Firms,” Review of Economics and Statistics, 1980, 62, 477-81
Chambers, Robert G., Applied Production Analysis, 1988
Cobb, S. and P. Douglas, “A Theory of Production,” American Economic Review, 1928, 18,139-165
Cummins, David J. and Hongmin Zi, “Comparison of Frontier Efficiency Models: AnApplication to the U.S Life Insurance Industry,” Journal of Productivity Analysis, 1998, 10,131-152
Fecher, F., D. Kessler, S. Parelman, and P. Pestieau, “Productive Performance of the FrenchInsurance Industry,” Journal of Productivity Analysis, 1993, 4, 77-93
Gardner, L., and M. F. Grace, “X-Efficiency in the U.S Life Insurance Industry,” Journal ofBanking and Finance, 1993, 17, 497-510
Geehan, Randall, “Economies of Scale in Insurance: Implications for Regulation”, The InsuranceIndustry in Economic Development, 1986, 137-160
Grace, Martin F. and Stephen G. Timme, “ An Examination of Cost Economics in the UnitedStates Life Insurance Industry,” Journal of Risk and Insurance, 1992, 59, 72-103
Greene, William H., Econometric Analysis, 3rd Ed., 1997a, (Prentice-Hall, Englewood Cliffs,NJ)
Greene, William H., Limdep Computer Program: Version 7.0, 1998, Econometric Software,Plainview, NY
Insurance Accounting & Systems Association, Inc, Life Insurance Accounting, Third Ed. 1994
Life Office Management Association (LOMA), Inc., Expense Management Program (Emap)Manual, Expense Year 1997 February 1998, 1998
Saunders, Arthur R., Life Insurance Company Financial Statements, 1993
Yungert, A. M., “The Measurement of Efficiency in Life Insurance: Estimates of a MixedNormal-Gamma Error Model,” Journal of Banking and Finance, 1993, 17, 483-496
Related Documents