An Australian Actuarial Risk Tool (AART) A Risk Assessment Model for Offender Management Max Maller Crime and Data Linkage Research Analyst Email: [email protected]

An Australian Actuarial Risk Tool (AART) A Risk Assessment Model for Offender Management Max Maller Crime and Data Linkage Research Analyst Email: [email protected].
Dec 19, 2015
Welcome message from author
This document is posted to help you gain knowledge. Please leave a comment to let me know what you think about it! Share it to your friends and learn new things together.
Transcript

An Australian Actuarial Risk Tool(AART)
A Risk Assessment Model for Offender Management
Max MallerCrime and Data Linkage Research Analyst
Email: [email protected]

Why we built it:
• A request for a robust and accurate risk assessment tool as support in assessing supervised adult offenders
• An opportunity to apply a prediction model based on survival analysis that a team of us developed from research into long term criminal careers
Can be applied across a wide range of offending scenarios such as reimprisonment, re-arrest, court decisions etc.
AART was originally built for adult offenders in Western Australia
- has been in operation in WA Corrective Services since 1999
- won the 2002 Premiers Excellence Award for Management Improvement and Governance
A version was later built for juvenile offenders
Prototypes were built for specific types of re-offending (adults and juveniles)

The Team
Prof. Rod Broadhurst (ANU): criminological knowledge and insight
Prof. Ross Maller (ANU): mathematical brilliance (survival analysis, incidence functions, conditional risk, outliers etc. etc.)
Ms. Nini Loh (UWA): data analysing and patience
and me: system design, construction, maintenance

Australian Actuarial Risk Tool
An actuarial model for re-offending would accurately predict risk for any offender in the
population would accurately predict risk now and in the future
by taking into account any changes that occur in reoffending behaviour
… and ideally should be able to accurately predict the risk of an
offender failing within any chosen time interval; and
Is much more informative than a simple count
Many risk instruments base their predictions on a group or groups of offenders in a particular scenario (such as, released from prison during a 12 month period) who they then follow up for 2 years or so and count whether or not each of them re-offended.
Does this represent population reoffending?
Does it still work later?
Is 2 years flexible enough?
How informative of what’s going on is a count of how many re-offended?
What’s actuarial? Covers everything and stays up to date

Example using AARTAn Officer requests a risk assessment for an offender he is about to supervise.
The Officer enters
• Male• Non Aboriginal• 19.5• First arrest• Armed Robbery (code = 211)
The tool requires 5 pieces of information about the offender:
1. Sex2. Aboriginal/Non-Aboriginal3. Age4. Career arrest point5. Current Offence
AART stirs from its slumber and …
. searches a prepared matrix for a group of offenders that EXACTLY match our robber on the above 5 factors.
. if it can’t find an exact match, it looks for the ‘closest’ match it can.
. when it finds this ‘best fit’ group, it extracts risk points from their Kaplan-Meier failure ‘curve’
. and finally it performs some adjustments to produce risk estimates tailored precisely for our robber – the quantum and direction of the adjustments depend on the variance of our robber’s factors from the group ‘average’.

AART RESULT
For Male, Non-Aboriginal, Age=19.5, Arrest = 1, Offence=211
Group Adjusted Found …. Time Risk Risk after 7 iterations at: 1 year 0.309 0.471 Arrest 1 for M N 2 years 0.381 0.550 Age: group_3 (19+) 3 years 0.448 0.618 Offence: anco (211) 4 years 0.491 0.658 age_av = 24.636 5 years 0.510 0.674 cell_count = 148/75 ever 0.563 0.720 Rowid = 101943

Conditional Risk Example
AART RESULT
For Male, Non-Aboriginal, Age=19.5, Arrest = 1, Offence=211,
Failtime=10 months, Conditional:fail=2years,survived=6 months
Time Group Adjusted LOCATED after 7 iterations AT:
6 months 0.185 0.311 Rowid = 101943
9 months 0.254 0.404 cell_count = 148/75
12 months 0.309 0.471 age_av= 24.636
18 months 0.352 0.519 Found at:
2 years 0.381 0.550 Arrest 1 for M N
3 years 0.448 0.618 Age: group_3 (19+)
4 years 0.491 0.658 Offence: anco (211)
5 years 0.510 0.674
Maximum 0.563 0.720 Found failpoint for max was 3374 days
Requested Adjusted Risk of re-offending within 10 months is 0.413 Found_failpoint = 299 Found_phat = 0.261
Conditional Adjusted Risk of reoffending within 2 years
having already survived 6 months is 0.347

The Data
Police incident reports and court convictions were not viable sources
Police in WA collect a ‘charge’ record for every offence for which a person is arrested or summonsed.
This dataset was clearly the best indicator of reoffending available in WA and was chosen as the basis for AART
Why?
1. identified individuals … so could group charges into ‘arrests’ could track offenders could determine time between arrests accurately
2. included the complete population of arrests (not samples)
3. included important recidivism discriminators (demographic and offence information)
4. available over a long period of time (since 1984)
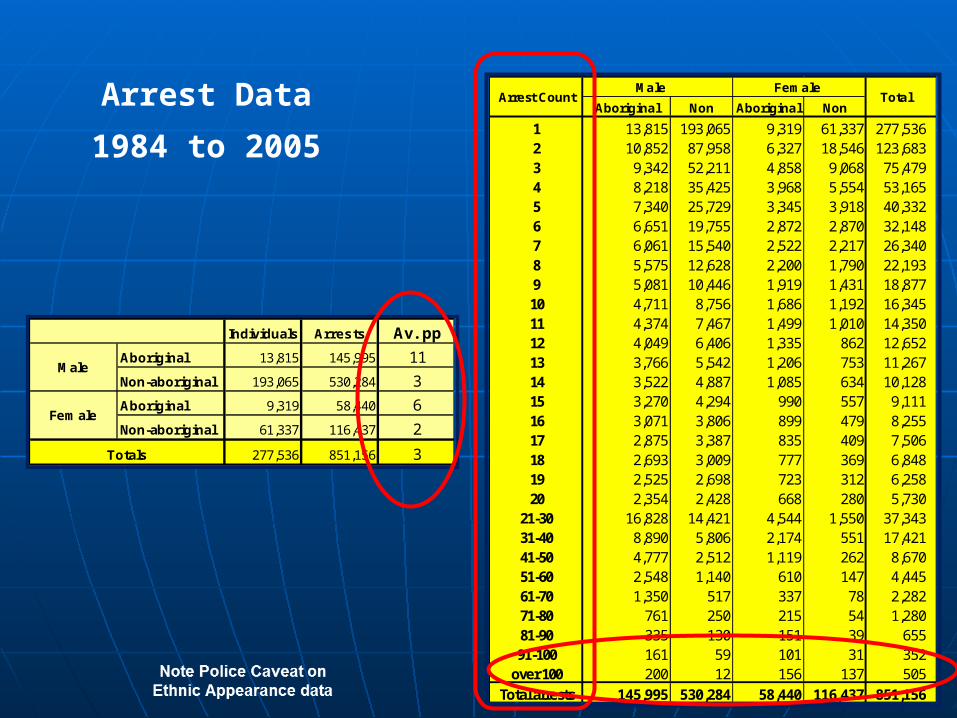
Arrest Data
1984 to 2005
Male
Aboriginal Non Aboriginal Non
1 13,815 193,065 9,319 61,337 277,5362 10,852 87,958 6,327 18,546 123,6833 9,342 52,211 4,858 9,068 75,4794 8,218 35,425 3,968 5,554 53,1655 7,340 25,729 3,345 3,918 40,3326 6,651 19,755 2,872 2,870 32,1487 6,061 15,540 2,522 2,217 26,3408 5,575 12,628 2,200 1,790 22,1939 5,081 10,446 1,919 1,431 18,87710 4,711 8,756 1,686 1,192 16,34511 4,374 7,467 1,499 1,010 14,35012 4,049 6,406 1,335 862 12,65213 3,766 5,542 1,206 753 11,26714 3,522 4,887 1,085 634 10,12815 3,270 4,294 990 557 9,11116 3,071 3,806 899 479 8,25517 2,875 3,387 835 409 7,50618 2,693 3,009 777 369 6,84819 2,525 2,698 723 312 6,25820 2,354 2,428 668 280 5,730
21-30 16,828 14,421 4,544 1,550 37,34331-40 8,890 5,806 2,174 551 17,42141-50 4,777 2,512 1,119 262 8,67051-60 2,548 1,140 610 147 4,44561-70 1,350 517 337 78 2,28271-80 761 250 215 54 1,28081-90 335 130 151 39 65591-100 161 59 101 31 352
over 100 200 12 156 137 505Total arrests 145,995 530,284 58,440 116,437 851,156
FemaleTotal Arrest Count
Individuals Arrests Av. pp
Aboriginal 13,815 145,995 11
Non-aboriginal 193,065 530,284 3
Aboriginal 9,319 58,440 6
Non-aboriginal 61,337 116,437 2
277,536 851,156 3
Male
Female
Totals
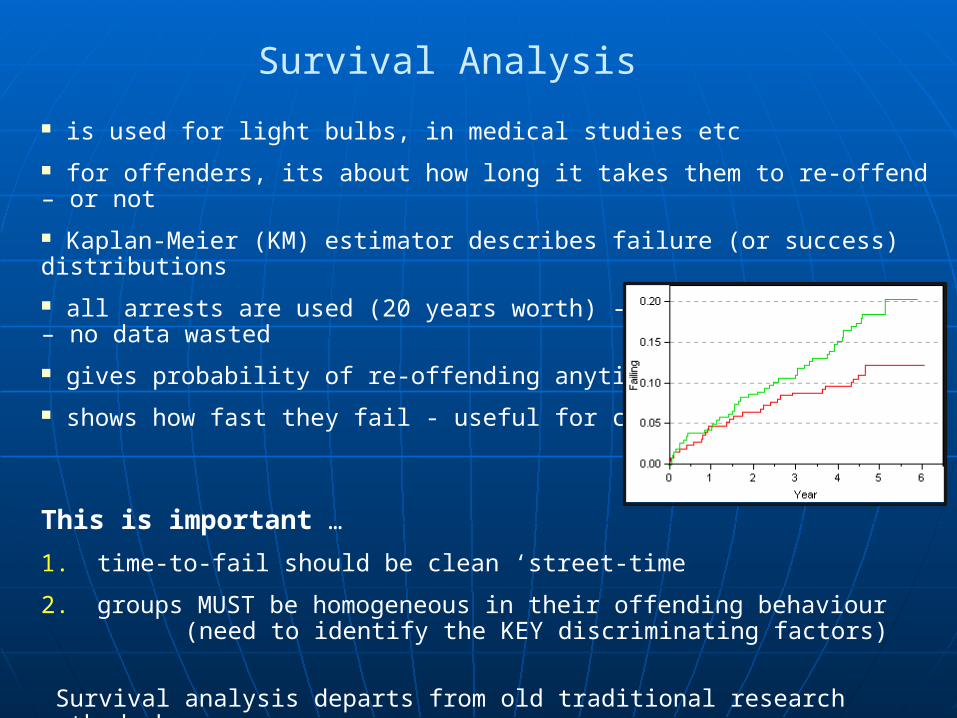
Survival Analysis
is used for light bulbs, in medical studies etc
for offenders, its about how long it takes them to re-offend – or not
Kaplan-Meier (KM) estimator describes failure (or success) distributions
all arrests are used (20 years worth) - no follow-up period – no data wasted
gives probability of re-offending anytime in the future
shows how fast they fail - useful for comparing groups too
This is important …
1. time-to-fail should be clean ‘street-time
2. groups MUST be homogeneous in their offending behaviour (need to identify the KEY discriminating factors)
Survival analysis departs from old traditional research methods here

1. Categorise ‘like’ arrests into groups likely to reoffend in a similar way using the best data you can
Variables we identified as important:sexrace (aboriginal/non-aboriginal)arrest cardinality (current arrest in career)age at arrestmost serious offence for which arrested
2. Set a minimum Group Size of 100
3. Find ‘like’ cases using an iterative search mechanism
Grouping strategy

Adult Actuarial Risk Model
Risk data Risk Estimation Process
Risk Matrix
Population contingency tables
Iterative Risk Search Engine
Evaluation data Risk Adjustment process
Adjusted Risk Estimate
OFFENDER BEING
ASSESSED
KM Step Function Array
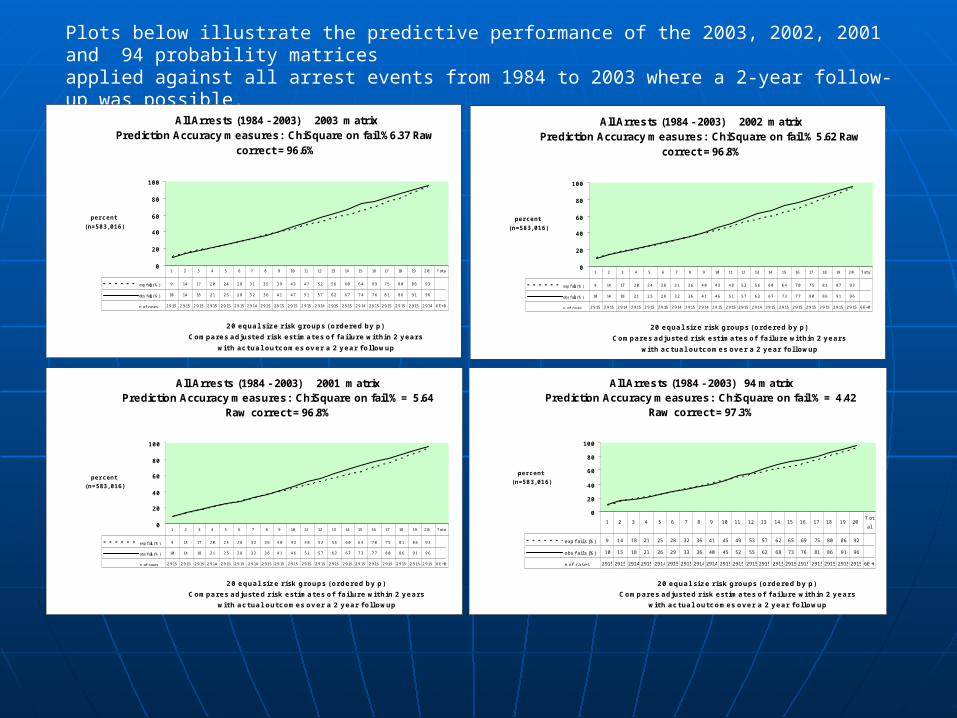
Plots below illustrate the predictive performance of the 2003, 2002, 2001 and 94 probability matricesapplied against all arrest events from 1984 to 2003 where a 2-year follow-up was possible.
All Arrests (1984 - 2003) 2003 matrixPrediction Accuracy measures: ChiSquare on fail %6.37 Raw
correct = 96.6%
0
20
40
60
80
100
20 equal size risk groups (ordered by p)
Compares adjusted risk estimates of failure within 2 years
with actual outcomes over a 2 year followup
per cent
(n=583,016)
exp f ails (%) 9 14 17 20 24 28 31 35 39 43 47 52 56 60 64 69 75 80 86 93
obs f ails (%) 10 14 18 21 25 28 32 36 41 47 51 57 62 67 74 76 81 86 91 96
n of cases 2915 291512915129151291512915 2914 2915 2915 2915 2915 2914 2915 2915 2914 2915 2915 291512915 2914 6E+0
1 2 3 4 5 6 7 8 9 10 11 12 13 14 15 16 17 18 19 20 Total
All Arrests (1984 - 2003) 2002 matrixPrediction Accuracy measures: ChiSquare on fail % 5.62 Raw
correct = 96.8%
0
20
40
60
80
100
20 equal size risk groups (ordered by p)
Compares adjusted risk estimates of failure within 2 years
with actual outcomes over a 2 year followup
per cent
(n=583,016)
exp f ails (%) 9 14 17 20 24 28 31 36 40 43 48 52 56 60 64 70 75 81 87 93
obs f ails (%) 10 14 18 21 25 28 32 36 41 46 51 57 63 67 73 77 80 86 91 96
n of cases 2915 2915 2914 2915129151291512914 2915 2914 291512915 2915 2914 2915 2915 291512915129151291512915 6E+0
1 2 3 4 5 6 7 8 9 10 11 12 13 14 15 16 17 18 19 20 Total
All Arrests (1984 - 2003) 2001 matrixPrediction Accuracy measures: ChiSquare on fail % = 5.64
Raw correct = 96.8%
0
20
40
60
80
100
20 equal size risk groups (ordered by p)
Compares adjusted risk estimates of failure within 2 years
with actual outcomes over a 2 year followup
per cent
(n=583,016)
exp f ails (%) 9 14 17 20 24 28 32 36 40 43 48 52 56 60 64 70 75 81 86 93
obs f ails (%) 10 14 18 21 25 28 32 36 41 46 51 57 62 67 73 77 80 86 91 96
n of cases 291512915 2915 2914 291512915 2914 2915 2915 2915 2915129151291512915 2915 2915 2915 291512915 291516E+0
1 2 3 4 5 6 7 8 9 10 11 12 13 14 15 16 17 18 19 20 T otal
All Arrests (1984 - 2003) 94 matrixPrediction Accuracy measures: ChiSquare on fail % = 4.42
Raw correct = 97.3%
0
20
40
60
80
100
20 equal size risk groups (ordered by p)
Compares adjusted risk estimates of failure within 2 years
with actual outcomes over a 2 year followup
per cent
(n=583,016)
exp f ai ls (%) 9 14 18 21 25 28 32 36 41 45 49 53 57 62 65 69 75 80 86 92
obs f ai ls (%) 10 15 18 21 26 29 33 36 40 45 52 55 62 68 73 76 81 86 91 96
n of cases 2915 2915 2914 2915 29142915 29152914 2914 29152915 29152915 291529152915 29152915 29152915 6E +0
1 2 3 4 5 6 7 8 9 10 11 12 13 14 15 16 17 18 19 20T ot
al
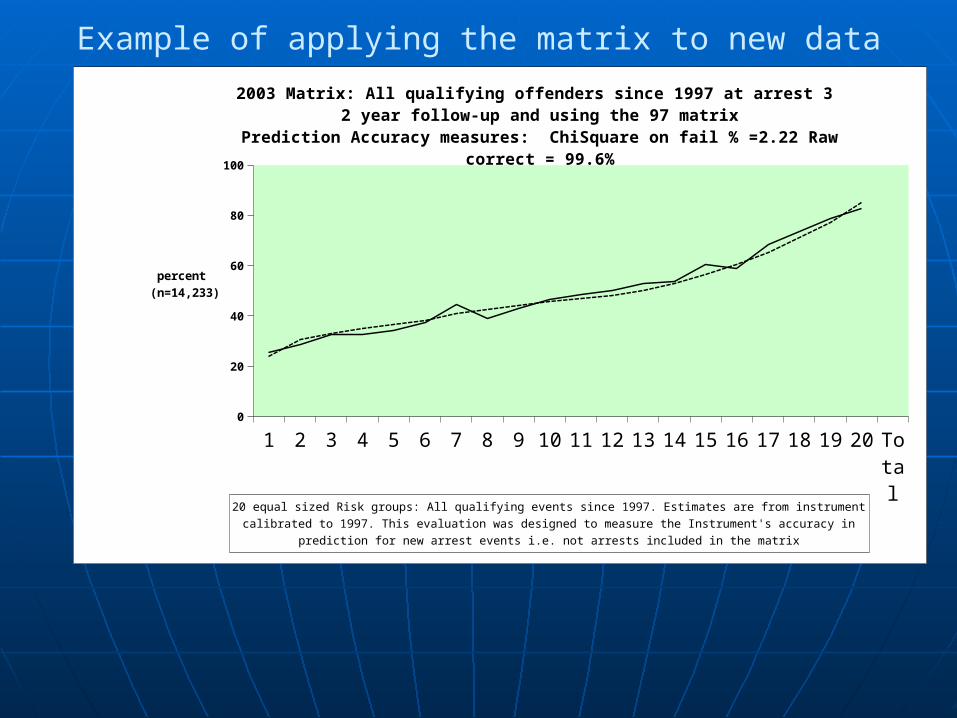
Example of applying the matrix to new data
1 2 3 4 5 6 7 8 9 10 11 12 13 14 15 16 17 18 19 20 Total
exp fails (%)
23.94625386497
89
30.68371810407
88
32.89447487341
77
34.83097013361
46
36.44702996624
47
38.18502419831
22
40.82566858286
52
42.74611115049
22
44.31985048945
15
45.67370244585
09
46.93956955898
88
48.28111323488
04
50.18447374120
97
52.70335773417
73
56.29193394233
48
60.61396435814
6
65.24440382981
72
71.00379817862
17
77.16124976933
89
85.29295851758
08
NaN
obs fails (%)
25.59774964838
26
28.69198312236
29
32.48945147679
33
32.77074542897
33
34.03656821378
34
37.27144866385
37
44.38202247191
01
39.09985935302
39
42.75668073136
43
46.69479606188
47
48.45505617977
53
50.07032348804
5
52.88326300984
53
53.72714486638
54
60.33755274261
6
58.98876404494
38
68.49507735583
69
73.41772151898
74
78.90295358649
79
82.84106891701
83
NaN
n of cases
711 711 711 711 711 711 712 711 711 711 712 711 711 711 711 712 711 711 711 711 14223
10
30
50
70
90
2003 Matrix: All qualifying offenders since 1997 at arrest 3 2 year follow-up and using the 97 matrix
Prediction Accuracy measures: ChiSquare on fail % =2.22 Raw correct = 99.6%
20 equal sized Risk groups: All qualifying events since 1997. Estimates are from instrument calibrated to 1997. This eval -uation was designed to measure the Instrument's accuracy in prediction for new arrest events i.e. not arrests included in
the matrix
percent (n=14,233)

Evaluating completeness
The Instrument has been applied against a large number of individual test cases and groups and has been found to predict consistently well.
In theory, it can be applied against any offender or group of offenders and should predict consistently.
Note what probabilistic estimation entails.
If an individual has a risk of 0.8 of re-offending within 2 years, then 8 out of 10 offenders LIKE HIM are expected to re-offend.
Even though all 10 could be considered ‘high risk’ offenders, 2 of them probably won’t re-offend

Thank you for your kind attention
Any questions?
Measurement and Evaluation
Extensions of the model
Instrument:Competing Risk
Conditional Risk
Research:
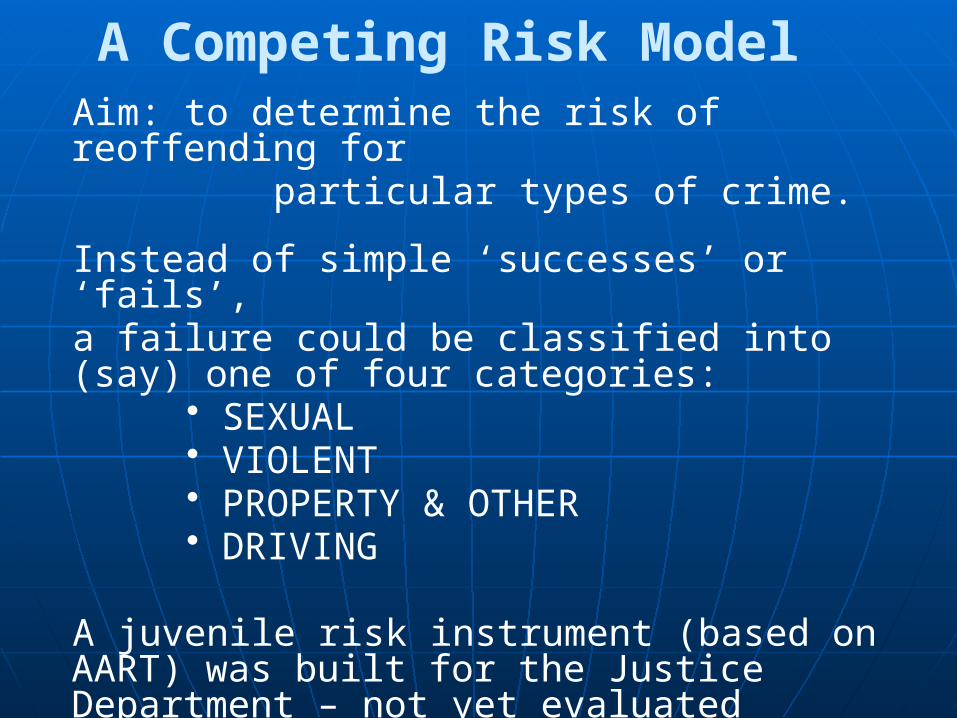
A Competing Risk ModelAim: to determine the risk of reoffending for particular types of crime.
Instead of simple ‘successes’ or ‘fails’,a failure could be classified into (say) one of four categories:
• SEXUAL • VIOLENT • PROPERTY & OTHER• DRIVING
A juvenile risk instrument (based on AART) was built for the Justice Department – not yet evaluated

A Conditional Risk Model
Aim: to re-assess risk AFTER a period of time during which reoffending has not occurred.
For example, in the case of a supervised community corrections client, it could be that a re-assessment of risk is desired after a period of 12 months supervision (during which the offender has remained in the community and has not reoffended)
The AART
• Currently measures ‘time-to-fail’ from the point of arrest to the next arrest, net of any non-street time.
• Its possible to provide a quantitative re-calculation of risk given information about the length of time the offender has ‘survived’ without further offending
• So re-assessment at any point in time is possible
Unconditional Risks 2 yrs 4 yrstime F(t) Survived P(fail) Survived P(fail)
0 0.00 0 0.54 0 0.650.5 0.30 0.5 0.34 0.5 0.49
1 0.42 1 0.21 1 0.401.5 0.49 1.5 0.10 1.5 0.31
2 0.54 2 0.00 2 0.242.5 0.58 2.5 0.17
3 0.61 Table 2 3 0.113.5 0.63 3.5 0.05
4 0.65 4 0.004.5 0.66
… Table 3
Table 1
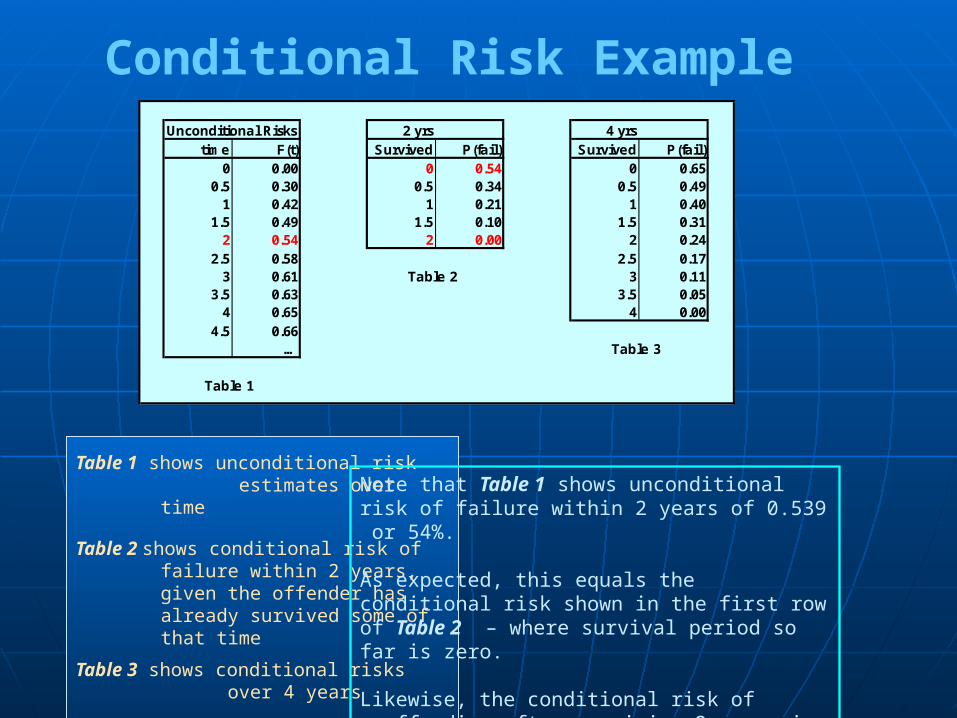
Table 1 shows unconditional risk estimates over time
Table 2 shows conditional risk of failure within 2 years, given the offender has already survived some of that time
Table 3 shows conditional risks over 4 years
Note that Table 1 shows unconditional risk of failure within 2 years of 0.539 or 54%.
As expected, this equals the conditional risk shown in the first row of Table 2 – where survival period so far is zero.
Likewise, the conditional risk of reoffending after surviving 2 years is zero.
Conditional Risk Example
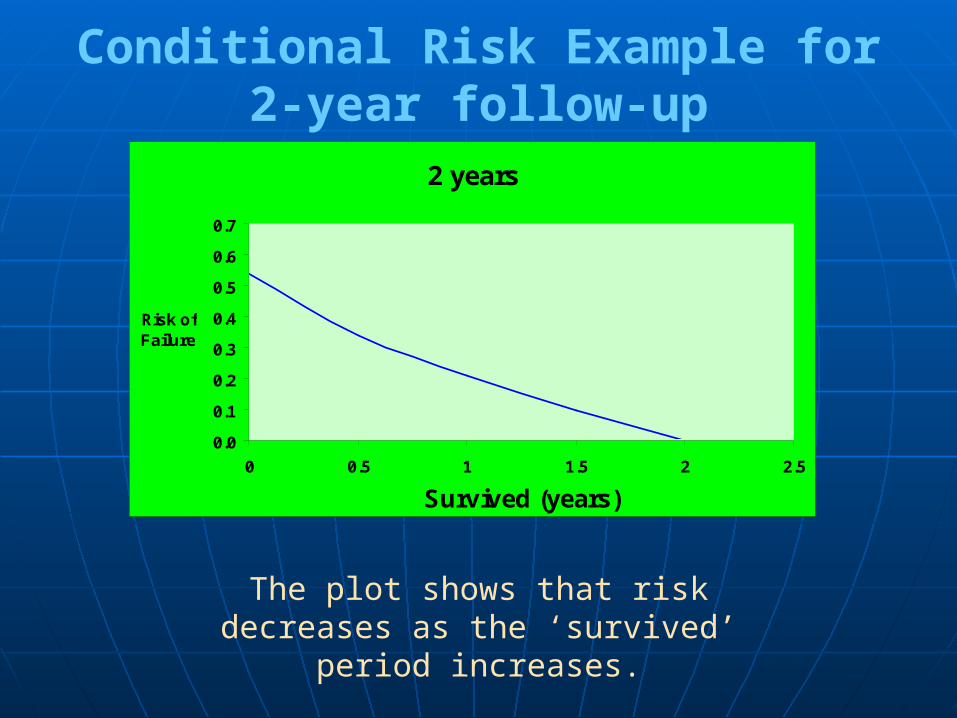
Conditional Risk Example for 2-year follow-up
2 years
0.0
0.1
0.2
0.3
0.4
0.5
0.6
0.7
0 0.5 1 1.5 2 2.5
Survived (years)
Risk ofFailure
The plot shows that risk decreases as the ‘survived’ period increases.
In developing the Instrument, it was clear to us that survival analysis presented as a most valuable tool in the measurement of recidivism and also in comparing the behaviour of different groups (eg a treated group compared to a control group).
Measurement and Evaluation

Here is a plot of KM estimates:
KM estimates for all Male Non-Aboriginal arrests (n = 395,211)
0.0
0.2
0.4
0.6
0.8
1.0
0 5 10 15 20Years
Rate of failure
Measurement and Evaluation
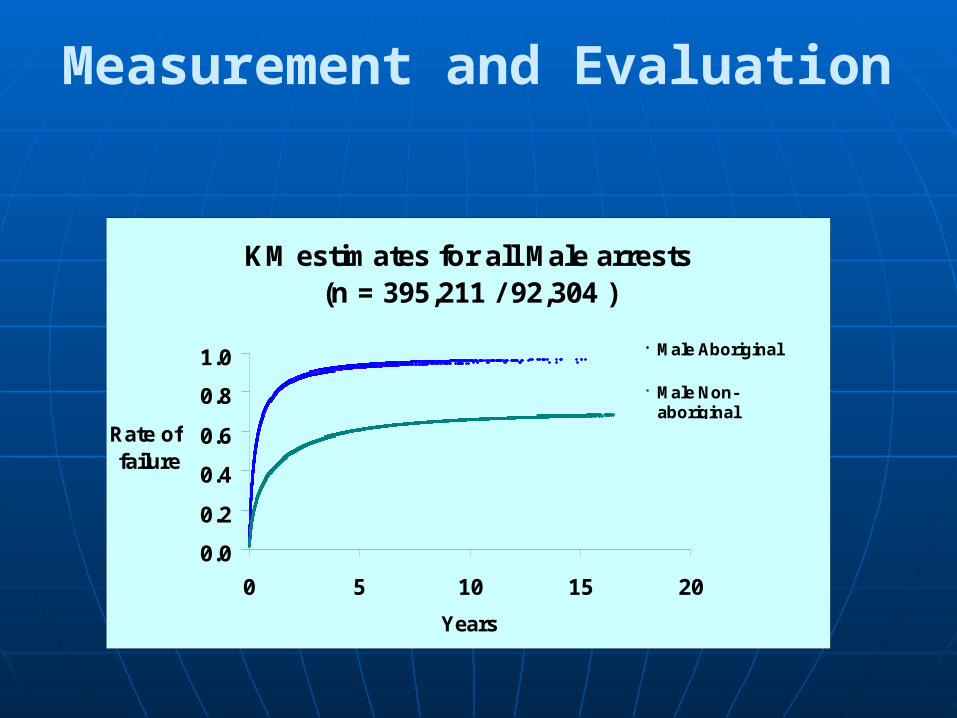
KM estimates for all Male arrests (n = 395,211 / 92,304 )
0.0
0.2
0.4
0.6
0.8
1.0
0 5 10 15 20
Years
Rate of failure
Male Aboriginal
Male Non-aboriginal
Measurement and Evaluation
Related Documents