NOAA Technical Memorandum NMFS-SEFSC-555 AN ASSESSMENT OF THE LEATHERBACK TURTLE POPULATION IN THE ATLANTIC OCEAN A Report of the Turtle Expert Working Group U.S. Department of Commerce National Oceanic and Atmospheric Administration National Marine Fisheries Service Southeast Fisheries Science Center 75 Virginia Beach Drive Miami, Florida 33149 April 2007

Welcome message from author
This document is posted to help you gain knowledge. Please leave a comment to let me know what you think about it! Share it to your friends and learn new things together.
Transcript
NOAA Technical Memorandum NMFS-SEFSC-555
AN ASSESSMENT OF THE LEATHERBACK TURTLE POPULATION IN THE ATLANTIC OCEAN
A Report of the Turtle Expert Working Group
U.S. Department of Commerce National Oceanic and Atmospheric Administration
National Marine Fisheries Service Southeast Fisheries Science Center
75 Virginia Beach Drive Miami, Florida 33149
April 2007

NOAA Technical Memorandum NMFS-SEFSC-555
AN ASSESSMENT OF THE LEATHERBACK TURTLE POPULATION IN THE ATLANTIC OCEAN
A Report of the Turtle Expert Working Group
U.S. DEPARTMENT OF COMMERCE Carlos M. Gutierrez, Secretary
National Oceanic and Atmospheric Administration
Conrad C. Lautenbacker Jr., Undersecretary for Oceans and Atmosphere
National Marine Fisheries Service William T. Hogarth, Assistant Administrator for Fisheries
Southeast Fisheries Science Center
Miami, Florida
April 2007 This Technical Memorandum series is used for documentation and timely communication of preliminary results, interim reports, or special-purpose information. This memorandum has been reviewed by the Center for Independent Experts.
ii
NOTICE The National Marine Fisheries Service (NMFS) does not approve, recommend, or endorse any proprietary product or material mentioned in this publication. No reference shall be made to the NMFS, or to this publication furnished by NMFS, in any advertising or sales promotion which would indicate or imply that NMFS approves, recommends, or endorses any proprietary product or proprietary material mentioned herein or which has as its purpose any intent to cause directly or indirectly the advertised product to be used or purchased because of NMFS publication. This report should be cited as follows: Turtle Expert Working Group. 2007. An Assessment of the Leatherback Turtle Population in the Atlantic Ocean. NOAA Technical Memorandum NMFS-SEFSC-555, 116 p. Copies may be obtained by writing: National Marine Fisheries Service Southeast Fisheries Science Center 75 Virginia Beach Drive Miami, Florida 33149 or National Technical Information Service 5258 Port Royal Road Springfield, Virginia 22161 (703) 487-4650 FAX: (703) 321-8547 Rush Orders: (800) 336-4700 PDF version available at www.sefsc.noaa.gov
iii
Leatherback Turtle Expert Working Group Larisa Avens National Marine Fisheries Service Beaufort Laboratory Beaufort, N.C. 28516 Didiher Chacon WIDECAST-Costa Rica Asociacion ANAI Apdo. 170-2070, Sabanilla San Jose, Costa Rica 170-2070, Central America Peter Dutton National Marine Fisheries Service Southwest Fisheries Science Center La Jolla, California 92037-1508 Scott Eckert Wider Carib. Sea Turtle Consv. Network Duke University Marine Lab 135 Duke Marine Lab Road Beaufort, NC 28516 USA Tomo Eguchi National Marine Fisheries Service Southwest Fisheries Science Center La Jolla, California 92037-1508 Sheryan Epperly National Marine Fisheries Service 75 Virginia Beach Drive, Miami, FL 33149 Benny Gallaway LGL Ecological Research Associates, Inc. 1410 Cavitt Street Bryan, TX 77801 USA Marc Girondot University of Paris XI Bât 362 Orsay, 91405 Paris, France Matthew Godfrey Wildlife Resources Commission 307 Live Oak Street Beaufort, North Carolina 28516 USA
Edo Goverse Leatherback Sea Turtle Research and Monitoring Project Suriname Netherlands Committee for IUCN Plantage Middenlaan 2K 1018 DD Amsterdam, The Netherlands Heather Haas National Marine Fisheries Service Northeast Fisheries Science Center 166 Water Street Woods Hole, Massachusetts 02543 Selina Heppell Oregon State University Dept. Fisheries and Wildlife Corvallis, OR 97331 USA Maartje Hilterman Program Officer Biodiversity Netherlands Committee for IUCN Plantage Middenlaan 2K 1018 DD Amsterdam, The Netherlands Mike James Nova Scotia Leatherback Turtle Working Group Dalhousie University Halifax, Nova Scotia B3H 4J1 Canada Laurent Kelle Regional Marine Turtle Program / Programme Régional "Tortues Marines" WWF 5 Lot. Katoury / Route de Montabo 97 300 Cayenne, Guyane française 97300 Peter Lutz Florida Atlantic University Department of Biological Sciences Boca Raton, FL 33431-0991 USA Yvette Merton Marine Turtle Project Research Coordinator STINASU Paramaribo, Suriname, South America Peter Pritchard Chelonian Research Institute 401 South Central Avenue Oviedo, FL 32765 USA
iv
Paul Richards National Marine Fisheries Service 75 Virginia Beach Drive, Miami, FL 33149 Chris Sasso National Marine Fisheries Service 75 Virginia Beach Drive, Miami, FL 33149 Melissa Snover National Marine Fisheries Service Pacific Islands Fisheries Science Center Honolulu, HI Kelly Stewart Duke University Beaufort, NC 28516 USA Nancy Thompson National Marine Fisheries Service 75 Virginia Beach Drive, Miami, FL 33149 Manjula Tiwari National Marine Fisheries Service Southwest Fisheries Science Center La Jolla, California 92037-1508 Sebastian Troëng Caribbean Conservation Corporation San Pedro, San José, Costa Rica, Central America CR Observer: Dennis Klemm National Marine Fisheries Service Southeast Regional Office St. Petersburg, FL
v
Table of Contents Introduction................................................................................................................................... 1 Management of Leatherback Sea Turtles................................................................................... 2 Historical Distribution, Population size and Utilization ........................................................... 3 Stock Structure.............................................................................................................................. 5 Conceptual model.......................................................................................................................... 7 Life history................................................................................................................................... 10
Stages ........................................................................................................................................ 10 Sex Ratios ................................................................................................................................. 11
Strandings and In-water Sightings ........................................................................................ 11 Hatchling Sex Ratio .............................................................................................................. 15
Age and growth ........................................................................................................................ 16 Survival..................................................................................................................................... 16
Stock Status ................................................................................................................................. 17 Florida ...................................................................................................................................... 17 Northern Caribbean ................................................................................................................. 18
Puerto Rico............................................................................................................................ 18 US Virgin Islands (St. Croix)................................................................................................ 19 British Virgin Islands (Tortola) ............................................................................................ 20
Western Caribbean Stock......................................................................................................... 20 Southern Caribbean/Guianas Stock........................................................................................ 24
Guianas Overview................................................................................................................. 24 Guyana .................................................................................................................................. 26 Suriname ............................................................................................................................... 27 French Guiana....................................................................................................................... 34 Venezuela.............................................................................................................................. 39 Trinidad................................................................................................................................. 39 Dominica............................................................................................................................... 41
Miscellaneous Caribbean ........................................................................................................ 42 Brazil......................................................................................................................................... 43 Atlantic Africa Stock ................................................................................................................ 44
Trend analysis on the observed number of nests and nesting females................................... 45 Regression analyses ................................................................................................................. 46 Bayesian statistical modeling................................................................................................... 47 Results....................................................................................................................................... 48
North Caribbean.................................................................................................................... 48 West Caribbean..................................................................................................................... 49 Southern Caribbean/Guianas ................................................................................................ 49 Florida ................................................................................................................................... 49 West Africa ........................................................................................................................... 49 South Africa .......................................................................................................................... 50 Brazil..................................................................................................................................... 50
Discussion................................................................................................................................. 50 Population Size Estimation ........................................................................................................ 53
Background .............................................................................................................................. 53
vi
Methods .................................................................................................................................... 55 Results....................................................................................................................................... 59 Discussion................................................................................................................................. 59
In-water data ............................................................................................................................... 62 Movements................................................................................................................................ 62
Flipper and PIT tags.............................................................................................................. 62 Satellite Telemetry ................................................................................................................ 63
Results....................................................................................................................................... 65 Western North Atlantic Nesting Assemblages ..................................................................... 65 Florida ................................................................................................................................... 65 Western Caribbean................................................................................................................ 65 Northern Caribbean............................................................................................................... 65 Southern Caribbean/Guianas ................................................................................................ 66 South Atlantic Nesting Assemblages.................................................................................... 66 Foraging Grounds ................................................................................................................. 67 Conclusions .......................................................................................................................... 68
Aerial and shipboard surveys .................................................................................................... 72 Strandings .................................................................................................................................... 78
Spatial and Temporal Pattern in the US STSSN .................................................................... 78 Non-US Strandings in the Atlantic ......................................................................................... 83
Threats ......................................................................................................................................... 84 US waters.................................................................................................................................. 84 Canadian waters....................................................................................................................... 85 Western Caribbean................................................................................................................... 85 Trinidad and Tobago ............................................................................................................... 85 Guianas..................................................................................................................................... 86 French Guiana ......................................................................................................................... 87 Suriname .................................................................................................................................. 87 Guyana ..................................................................................................................................... 88 Brazil......................................................................................................................................... 88 Africa ........................................................................................................................................ 88 Southwest Atlantic ................................................................................................................... 89 Atlantic High Seas ................................................................................................................... 89
Discussion and Synthesis -Atlantic Leatherback Turtles- Status, Trends and Threat ........ 89 Stock Structure ......................................................................................................................... 89 Population Size......................................................................................................................... 90 Threats ...................................................................................................................................... 90 Trends ....................................................................................................................................... 93
Conservation Strategies.............................................................................................................. 94 Research Recommendations ...................................................................................................... 95 Acknowledgements ..................................................................................................................... 97 Literature Cited .......................................................................................................................... 98 Appendix 1 ................................................................................................................................. 115 Appendix 2 ................................................................................................................................. 116
1
Introduction The first Turtle Expert Working Group (TEWG) was convened in 1995 at the request of Mr. Rolland Schmitten, Assistant Administrator, National Oceanic and Atmospheric Administration (NOAA), National Marine Fisheries Service (NMFS). The charge to Dr. Bradford Brown, Director, Southeast Fisheries Science Center (SEFSC) was to convene a team of population biologists, sea turtle scientists, and life history specialists to compile and examine information on the status of sea turtle species. The first TEWG resulted in the publication of status reports for the Atlantic loggerhead turtle, Caretta caretta, and the Kemp’s ridley, Lepidochelys kempii (TEWG 1998, 2000). This current report is the product of the Leatherback Sea Turtle TEWG which was first convened in November, 2004 in Miami, Florida, USA. The contents of this report represent the deliberations over four meetings (second and third meetings in Orsay, France and St. Joseph, Trinidad respectively) with considerable work in between culminating with the final meeting in Halifax, Canada in March 2006. The essence of this report is the presentation of data collected by a variety of researchers throughout the Atlantic Ocean on the nesting beaches and on turtles in the water within the context of multiple stocks. The report follows the structure of previous TEWG reports by presenting the historical context and understanding of the life history and status of turtles, identifying stock structure, providing empirical data, and exploratory analyses to determine status. For this report, a conceptual model which describes the life history of leatherback turtles is presented for the North Atlantic Ocean basin. A synthesis of the empirical data and trend analyses is presented by stock to visually describe status. The purpose of the population size estimation is to provide an estimate that utilizes the best information we have and incorporates uncertainty. The major known and hypothesized threats are discussed to help direct management approaches to ensure recovery or sustainability. Finally, as with any scientific report, we provide a section on research needs that would continue to elucidate the life history of this species while providing a quantitative data base for future stock assessments. In general, our current understanding of leatherback population dynamics in the Atlantic suggests that the adult female population is relatively stable but nest numbers could fluctuate considerably due to individual variance in remigration intervals, clutch number, and the reduced site fidelity in leatherbacks. The data in the tables presented in the body of the text are owned by the collector of the data and protected as such. A letter was sent from the NMFS/SEFSC Director as chair of the TEWG which stated that “Due to the need to safeguard ownership of the data and information, NMFS wants to clarify the intended use of these data shared with the TEWG. NMFS, in conjunction with collaborating parties, will use these data in assessing the status of leatherbacks in the Atlantic Ocean and producing a final TEWG report on that status. All data shall remain the property of the provider and will only be used in the report with their permission. It is unacceptable for members to use any data or information as part of the TEWG process for publication without the consent and/or collaboration of the original provider. ” These data tables form the basis for the analyses. It is the TEWG’s recommendation that the results of these analyses be interpreted with caution and within the assumptions as explicitly stated.
2
Management of Leatherback Sea Turtles Conservation of Atlantic leatherback sea turtles is complicated by the wide spatial distribution of the species, encompassing much of the Atlantic basin, including terrestrial, coastal, and pelagic habitats throughout various life stages, and crossing numerous political boundaries. As a result, it is necessary for effective management measures to be enacted at multiple levels, from international to local, and to incorporate fishery bycatch reduction, nesting habitat protection, in-water habitat protection, and the reduction of intentional take. The implementation of international laws and agreements are essential to the successful conservation of leatherbacks. Such measures help ensure that conservation efforts made in one country are not rendered futile by impacts to the species as the turtles enter other political boundaries or the high seas. Currently there are a number of existing agreements and international laws that provide a means to advance the conservation of leatherbacks in the Atlantic. The Convention on International Trade in Endangered Species of Wild Fauna and Flora (CITES) is a global agreement with 169 Party countries. The purpose of this agreement is to ensure that the international trade in plant and animal specimens does not threaten the survival of any species. The inclusion of leatherbacks under CITES helps prevent the emergence of an international market for leatherbacks or leatherback products. The possibility of bycatch reduction, technology transfer, and other environmental measures taken through international fishing agreements, such as the International Commission for the Conservation of Atlantic Tunas, are also potential avenues through which large-scale impacts to leatherback sea turtles can be reduced. Indirect benefits to leatherback sea turtles also are realized through international efforts such as the United Nations Convention on the Law of the Sea. Although not specific to sea turtle protection, that convention established measures to protect the environment of the open ocean through requirements to limit offshore pollution and dumping. As with all initiatives at all levels, the effectiveness is highly dependent upon the degree of commitment, resources, and enforcement devoted to the measures. Therefore, the mere existence of the agreements and conventions are not sufficient to ensure the necessary protections for leatherback sea turtles. Regional efforts to protect leatherback sea turtles include the Inter-American Convention for the Protection and Conservation of Sea Turtles (IAC), the Protocol to the Cartagena Convention concerning Specially Protected Areas and Wildlife (SPAW), and the Convention on Migratory Species (CMS or Bonn Convention). The IAC is a treaty focusing specifically on the protection of sea turtles and their habitat in the Americas. The stated objective of the IAC is "to promote the protection, conservation and recovery of sea turtle populations and of the habitats on which they depend, based on the best available scientific evidence, taking into account the environmental, socioeconomic and cultural characteristics of the Parties." There are currently 12 signatory nations, with 9 having ratified the treaty. The Convention for the Protection and Development of the Marine Environment of the Wider Caribbean Region (Cartagena Convention), and its SPAW Protocol, implements the United Nations Environment Programme (UNEP) Regional Seas Programme in the Wider Caribbean Region. The objective of the SPAW Protocol (which includes 12 Contracting Parties of the 22 Parties to the Cartagena Convention)) is to “protect rare and fragile ecosystems and habitats, thereby protecting the endangered and threatened species residing therein”. The SPAW protocol has been instrumental in stopping oil exploration in French Guiana until an environmental impact assessment is carried out. Also under the auspices of the UNEP, the Bonn Convention (also known as the Convention on
3
Migratory Species) includes a Memorandum of Understanding (MOU) on Marine Turtles of the Atlantic Coast of Africa. This MOU includes 26 Range States along the Atlantic Coast of Africa, from Morocco to South Africa, with the overall aim “to create a monitoring and protection network for nesting and feeding sites in close collaboration with local communities, fishermen, travel operators and coastal developers”. This MOU also contains a resolution (Res. VII.6) specific to bycatch. Although large-scale international agreements and initiatives are important, informal, or smaller-scale international cooperation such as bilateral agreements, are also highly valuable mechanisms that have been used for conservation and management in the past, and will be important in the future. The use of technology transfer for fishery bycatch reduction among nations, along with the outreach, education, and funding assistance to increase acceptance of such technology, is a vital tool for leatherback conservation. Such programs have included trawl turtle excluder device (TED) and longline bycatch reduction and mitigation (circle hooks, gear removal equipment and training). In addition, technology transfer has occurred, and continues to occur, between the United States and various other nations. Management at the national and local levels also provides an important means of furthering the goals of leatherback conservation. Many nations have laws aimed at protecting leatherbacks, including bans on intentional take, though the effectiveness and authority of these laws vary greatly. Fishery regulations to reduce bycatch, in the form of gear modification requirements, effort limitations, or time/area closures are frequently used by many nations to limit leatherback interactions and mortalities with varying degrees of success. Management measures aimed at protecting the nesting beaches through access restrictions, guarding of nests, nest relocations, and other means are also commonly used by many nations, as are in-water protected areas. Implementation and enforcement of such conservation measures in many nations are often limited or inconsistent as a result of severe resource limitations, and in many cases do not occur without an input of funding and assistance from external sources. Historical Distribution, Population size and Utilization The leatherback turtle is now known to have a wide nesting distribution in the tropical Atlantic and Pacific oceans, especially on mainland shores but with somewhat widespread island nesting in the Antilles. Oceanic islands rarely, if ever, harbor leatherback nesting colonies. Indian Ocean nesting occurs in South Africa/ Mozambique, Andaman and Nicobar Islands (India), Sri Lanka, and previously in Malaysia. Favored nesting habitat is characterized by deep, clean, high energy beaches with either a deep water oceanic approach or by a shallow water approach with mud banks but without coral or rock formations. Early mariners rarely if ever commented upon leatherback turtles in their published accounts, and the size of populations prior to the second half of the 20th century is almost entirely conjectural. Since its description in 1761 in Italy by Vandelli (Fretey and Bour 1980), the ancient literature about leatherbacks consists primarily of accounts of individuals, usually stranded turtles reported in local newspapers, in some cases compiled into review documents such as that of Brongersma (1971). In his thorough account of the turtles of the USA and Canada, Carr (1952) reported only a single unquestionable Atlantic nesting record (for 1947-Flagler Beach, Florida), together with “rumors” of nesting in the Florida Keys, Brazil, and
4
Jamaica. However he did allude to Deraniyagala’s (1939) observations of non-Atlantic nesting in Sri Lanka (Ceylon). In the 1960s, more nesting sites were identified in Trinidad and Tobago, Costa Rica, Guyana, Suriname, French Guiana, Colombia, etc. in the Atlantic; along parts of the Mexican coast in the Pacific; and a colony described as the world’s largest was announced in Terengganu, Malaysia. Later, Costa Rican Pacific nesting grounds (notably Playa Grande) were identified, and the full extent of Mexican Pacific nesting was clarified. At present, we cannot offer any persuasive accounts or estimates of pre 1960’s nesting, nor can we explain the extraordinary lack of published observations of nesting by the world’s largest turtle. In some cases, indigenous or local people may have been fully aware of nesting leatherbacks but had no reason to publicize the information. Further due to the tendency of leatherbacks to nest on high energy beaches, human habitation along these beaches has only recently become significant on some of the nesting beaches. However, the possibility remains that leatherbacks were indeed scarce in early years. This hypothesis must now be linked with the ease with which leatherbacks may now be seen, even by tourists, in many nations including Trinidad and Tobago, Costa Rica, and French Guiana. Has there indeed been an increase, and if so will it continue? Data accumulated during the last 2-3 decades offer some insight into this question. Long term monitoring in Trinidad, Suriname, Guyana, Puerto Rico, Florida and elsewhere indicates nesting population increases, sometimes by an order of magnitude or more. Other colonies (eg, those in Caribbean Costa Rica, Nicaragua, Honduras, etc.) may be stable or slightly declining rather than increasing, a large colony in Gabon (West Africa) has been announced. In contrast, the South China Sea and East Pacific nesting colonies have undergone catastrophic collapse. Links between cause and effect with respect to population trends are difficult to identify with any certainty. Few populations have been exploited as heavily (on the nesting beaches) as those of Guyana and Trinidad, yet these are thriving; whereas Terengganu and Playa Grande have not experienced beach slaughter of adults, but were subjected to high levels of egg poaching, and both populations have collapsed. It has been suggested that high-seas mortality due to fisheries bycatch on foraging grounds contributed significantly to the collapse of those Pacific nesting populations. A growing, although still somewhat inchoate body of thought suggests that the ocean basin-wide changes in populations of leatherbacks may derive from non-anthropogenic macro-causes rather than from the merits or defects of land-based conservation efforts. In addition to the phenomena of increasing or decreasing populations, there is the case of Florida, where leatherback nesting is now a regular seasonal occurrence in the mid-Atlantic counties of the state. This parallels the recent colonization of Florida beaches by nesting green turtles, and it still lacks a persuasive explanation. Possibly it is associated with the basin-wide improving status of leatherbacks in the Atlantic Ocean, or oceanic warming extending the nesting range of Dermochelys nesting to the north. It may also simply represent a random but successful colonization of the Florida coast by Caribbean female leatherbacks. The Florida colonization coinciding with the Caribbean population upsurge is noteworthy.
5
It is probable that the leatherbacks of the Atlantic break down into stocks that may ultimately require separate management. However, the content/definition or even the number of these stocks is not yet clear, and is complicated by several factors. These include:
i) The hypothetical stocks are distinguished mostly by collective criteria such as different haplotype ratios rather than the exclusive presence of unique haplotypes in specific populations.
ii) Leatherback females have been documented to make shifts of at least several hundred km between nesting sites even within a season, and “shift” of hatchlings from their natal beaches to a different, distant nesting beach when they mature may be quite frequent, although very difficult to document.
iii) Some of the hypothesized stocks, although not all, may mingle extensively while at sea and male mediated gene flow seems to be occurring.
Nevertheless, there may be a tenable recognition of a dichotomous separation of stocks in the Atlantic, e.g., with one group nesting in the low latitudes of the Caribbean and Americas and feeding in the northern hemisphere waters of the North Atlantic, and an African nesting group feeding in the southern hemisphere, South Atlantic waters. The opposing seasonality of these two feeding zones is reflected in the seasonality of nesting and might contribute to genetic isolation of the stocks The role of human utilization in the depletion of leatherback populations is not well understood, although there has been collapse of certain populations following protracted egg harvest (eg Pacific Costa Rica and Mexico, Terengganu, Malaysia). Use of the meat in much less widespread, but this has been common in Guyana and Trinidad and also in Pacific Mexico, and certain Antillean Islands may have minor trade in “trunkback oil” for medicinal purposes. But on a global basis leatherbacks (apart from their eggs) have been exploited much less than other species such as the green sea turtle (Chelonia mydas), the olive ridley sea turtle (Lepidochelys olivacea), and the hawksbill sea turtle (Eretmochelys imbricate). Stock Structure Molecular genetics is a useful tool for determining stock structure in sea turtles. The extent to which dispersal occurs between nesting beaches, either through imprecise natal homing, or imprecise adult nest site fidelity, determines the geographic boundaries of these regional stocks. Work is underway to define the stock boundaries, using several tools: molecular genetics, tagging and resighting and satellite telemetry. Each of these approaches has limitations. Tagging and telemetry studies of individual turtles at sea and on nesting beaches has been an important tool for determining the extent of nesting dispersal within and across seasons. Although tagging has contributed to understanding linkages between foraging areas and nesting beaches, it has not been able to address natal homing and hatchling dispersal, or population origin of males. Molecular genetics is a powerful tool for defining stocks, but lack of differentiation between some populations based on mitochondrial DNA (mtDNA) data for leatherbacks in the Atlantic has been ascribed to shared common ancestors over evolutionary time scales (tens of thousands of years), rather than a reflection of contemporary patterns of dispersal and gene flow (Dutton et al. 1999).
6
Microsatellites are polymorphic nuclear markers that are currently being applied to provide better resolution of leatherback stock structure. Like mtDNA, the stock differentiation is measured by shifts in allele frequencies, rather than by fixation of distinct alleles or haplotypes. Used in combination with mtDNA, microsatellites also reveal patterns of male—mediated gene flow (Dutton 1995, 1996, Dutton et al. 2002 & unpublished). In the Atlantic, the nesting assemblages in French Guiana, Guyana, Suriname and Trinidad have been identified as one distinct genetic stock based on mtDNA and nuclear data. This is also consistent with tagging data. Costa Rica (Tortuguero and Gandoca beaches) appears to be a distinct stock, although it is unclear where the boundary between Costa Rica and the Guiana (Guyana, Suriname, and French Guiana)/Trinidad stock falls, since rookeries in between (Panama, Colombia, Venezuela) have not yet been surveyed. Tagging and resighting along with telemetry data suggest Venezuela is part of the Guiana/Trinidad stock. This boundary may be somewhat difficult to delineate, since there is likely to be dispersal from Costa Rica on the one side, and from the Guianas on the other, into an area of overlap. A northern Caribbean stock has also been identified based on genetic data from St. Croix, although the boundary is also unclear, but probably includes Culebra Island, Vieques Island, Puerto Rico and the British Virgin Islands. Other Caribbean Islands, such as St. Lucia, Dominican Republic, and Grenada, have yet to be surveyed. Preliminary data (mtDNA) suggest Brazil can be considered a distinct stock (Dutton et al. unpublished). West Africa (in the eastern Atlantic) appears to be distinct based on data from Gabon, as is the South Africa rookery in Natal (Dutton et al. 2002 & unpublished). Tagging and genetic studies so far show that leatherbacks found in the waters of the North Atlantic are part of the western Atlantic genetic stocks (Dutton in press, Roden et al. in press; unpublished), whereas some tag return data indicate that leatherbacks from West Africa forage off the Atlantic coast of South America (Billes et al. 2006). South African leatherbacks have been tracked from nesting beaches in Natal, around the Cape of Good Hope into the South Atlantic. To summarize discussion of this Turtle Expert Working Group: Initially, 4 separate stocks were proposed: Northern Caribbean; Southern Caribbean; Western Caribbean; and Eastern Atlantic. However, the consensus after further discussion was that 7 stocks should be considered: Florida; Northern Caribbean; Western Caribbean; Southern Caribbean/Guyana Shield/Trinidad; West Africa; South Africa and Brazil. While these conclusions were based on genetics, the inclusion of tag return information into this discussion complicates the clear division of stocks as females have been shown to move great distances for nesting sites within and among nesting seasons. For example, the switching between nesting beaches by individual females as far as from Honduran and Colombian beaches to beaches in Costa Rica (Troëng et al. 2004) suggests that the entire coast can be considered one large rookery. There are, however, a small number of observations (n=4) of leatherback females tagged on Costa Rican and Panamanian beaches and later emerging on beaches in Cuba, Florida, St Croix and Grenada (Ordoñez et al. submitted, Troëng et al. 2004, C. Fernández pers. comm., S. Garner pers. comm., C. Ordoñez pers. comm.). These records of leatherback females nesting outside the perceived rookery limits (Honduras-Colombia) undermine the notion of a distinct Western Caribbean leatherback stock. Also, a female leatherback originally tagged on St. Croix, nested in Dominica, a Southern Caribbean/Guianas stock nesting beach (S. Eckert pers. comm.). A leatherback turtle tagged in Pacuare Nature Reserve in Costa Rica was later seen on a beach in
7
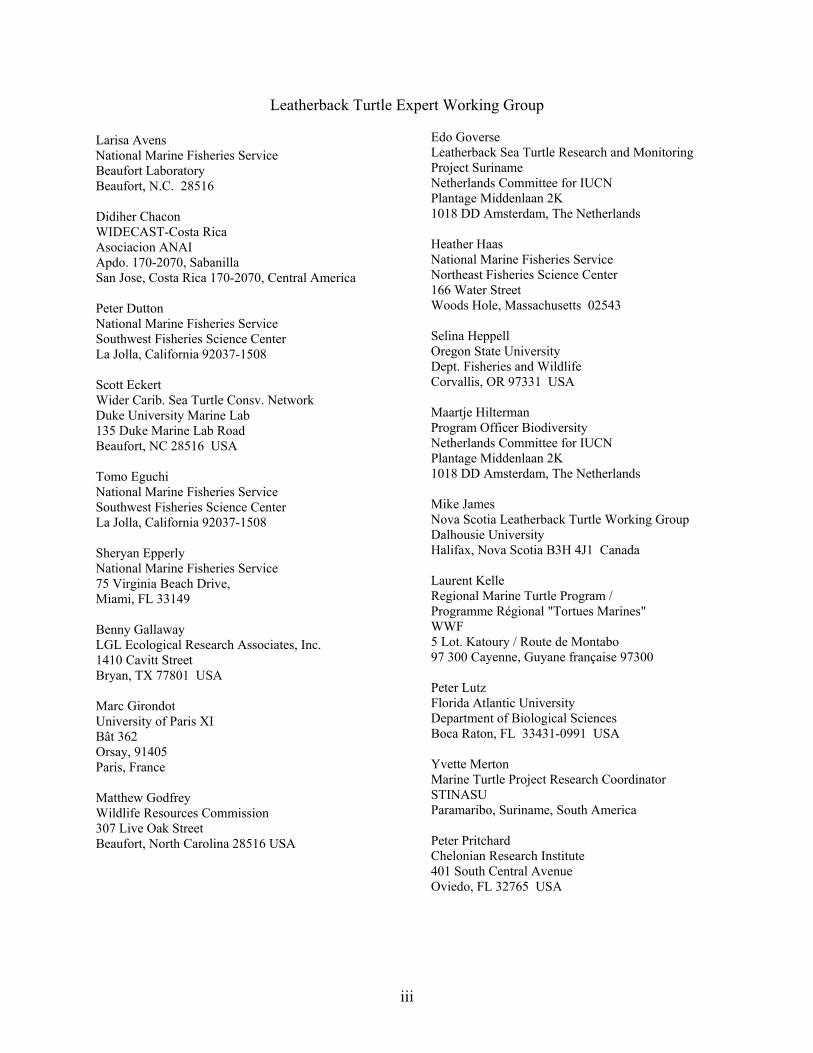
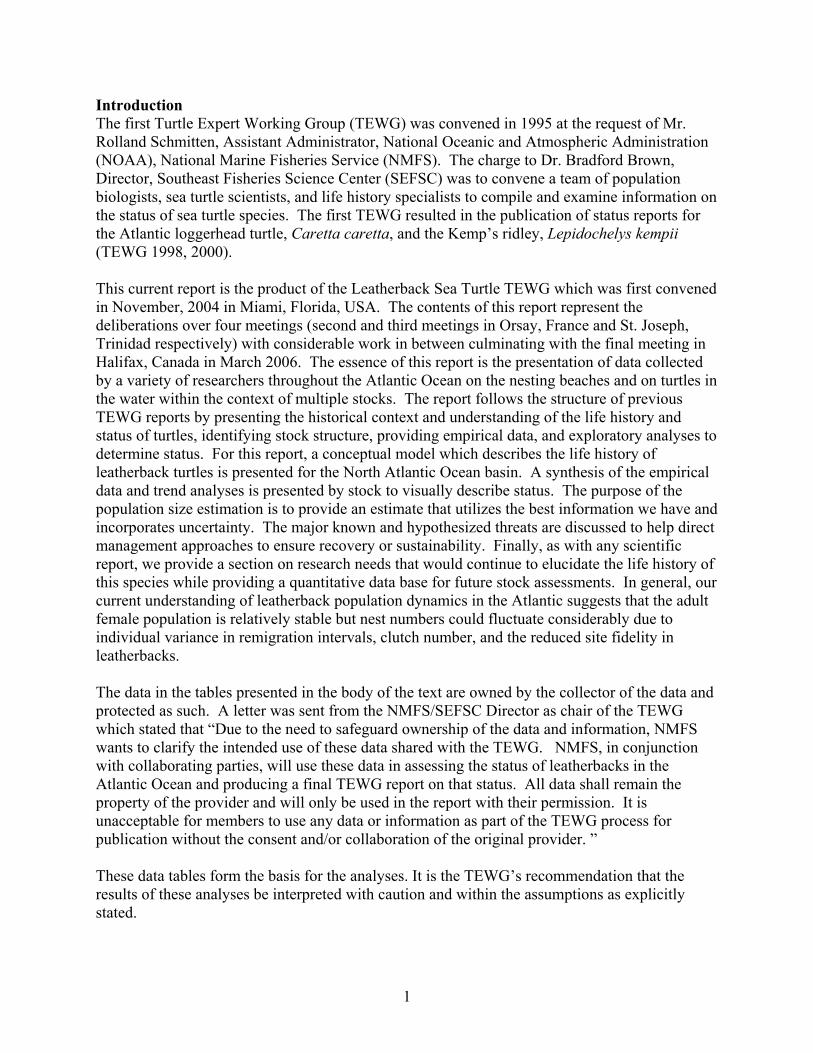
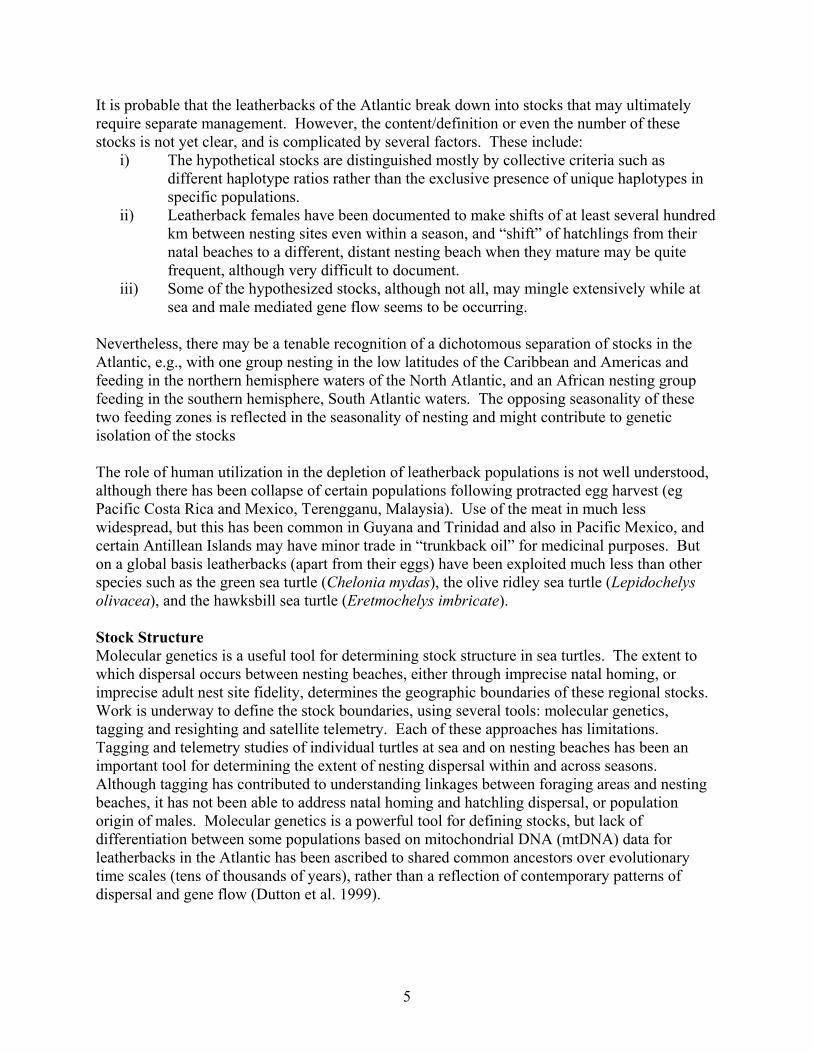
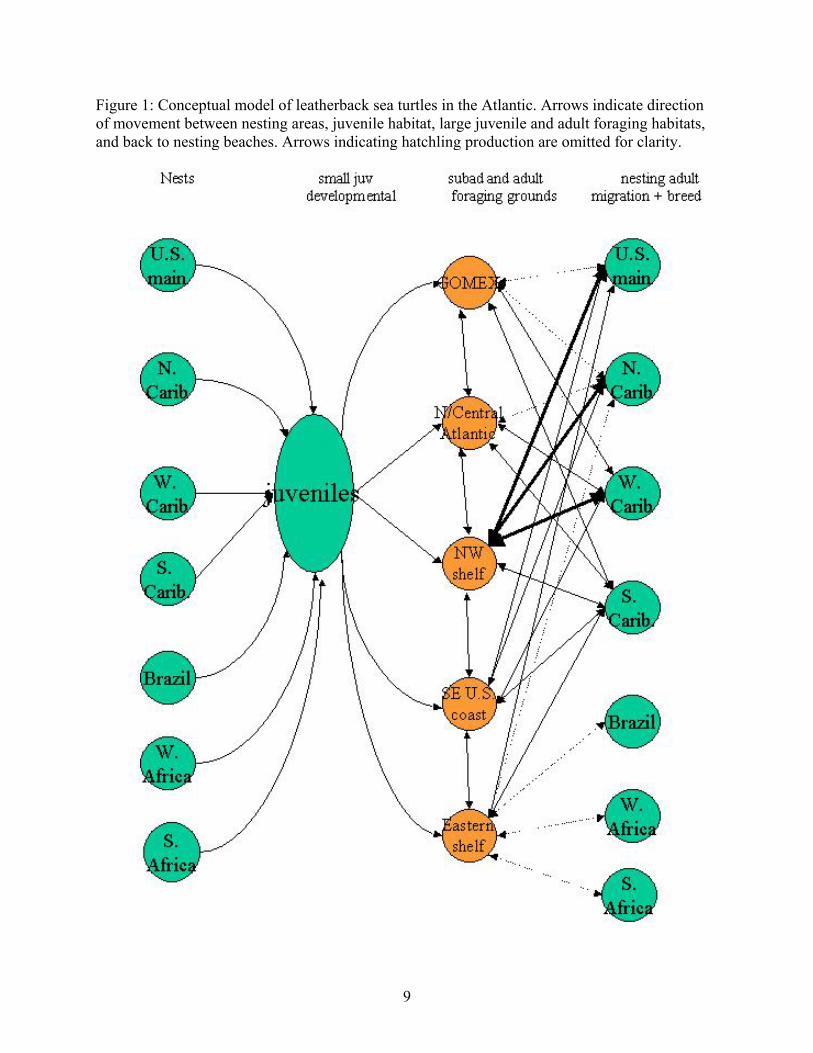
the Indian River Lagoon, Florida but may have been disoriented (Troëng et al. 2004; D. Bagley pers. comm.; C. Fernández pers. comm.). Conceptual model We developed a basic conceptual model for leatherback sea turtles in the Northern Hemisphere of the Atlantic based on the hypothesis that there are 7 stocks (see Stock section for details) in the Atlantic basin and on hypotheses about the limited information on demography, movement, and foraging habitat (Figure 1). Conspicuously absent from previous demographic models of sea turtles is our growing knowledge about the movements from nesting to foraging habitats. For leatherbacks these movements and habitat uses may be critical to population dynamics. Our conceptual model tries to incorporate this knowledge and associated hypotheses. In this model, stocks are defined by the nesting beach: US mainland (Florida), North Caribbean, West Caribbean, Southern Caribbean/Guianas, Brazil, West Africa, and South Africa. From these nesting beaches hatchlings move to some unknown pelagic developmental habitat, and then as subadults, they move into one of 5 hypothesized foraging grounds for the Northern Hemisphere: The Gulf of Mexico, North/Central Atlantic, Northwestern shelf, Southeastern US coast, and the Eastern shelf (see Figure 1). From these foraging grounds, adults migrate back toward the nesting beaches to breed and nest, possibly in proximity to where they hatched (as has been seen in the Pacific, Nordmoe et al 2004). The 5 foraging areas are each associated with several nesting grounds. For example, in the model, individuals foraging in the Gulf of Mexico may nest in any of the three Caribbean nesting areas, or on the US mainland (Figure 1). We have primarily considered the Northern Hemisphere populations and foraging areas in this conceptual model since we have very limited knowledge of Southern Hemisphere foraging areas. Use of the Eastern Shelf foraging area by Brazilian and South African nesting populations is largely speculative (as indicated by the dotted lines, Figure 1). We recognize that the lack of empirical estimates for many of the major elements of our conceptual model, the lack of quantification of uncertainty for other parameters, and the typically large variance estimates that exist for the even smaller proportion of the major parameters for which we have some data, renders a precise population dynamical model an impossible task at this time. Our conceptual model requires further understanding of leatherback sea turtles, more data to define demographic parameters, and a more thorough understanding of the processes that govern these parameters. This understanding would allow us to develop both more useful demographic models and predictive quantitative models. Satellite telemetry studies have begun to show the extent to which these turtles may travel. Further telemetry studies are needed to examine habitat use and migration. It would be useful to couple transmitters with devices to measure body temperature, and other physiological conditions (e.g. field metabolic rates, Southwood et al. 2005), to link these processes with oceanic conditions (Block 2005). More data on leatherback movement would be vital to our conceptual model to define the transition rates to and from foraging, breeding, and nesting grounds. Furthermore, other issues such as density dependence (Girondot et al. 2002) may have ramifications for our conceptual model and on any future modeling efforts. The possible existence of other Atlantic stocks or subgroups, or the reduction in the number of stocks, would also likely have an impact on our conceptual model. The amount of mixing and breeding in all of the foraging grounds is unknown, and thus the number of genetic stocks has considerable uncertainty associated with it. Therefore, we also considered a
8
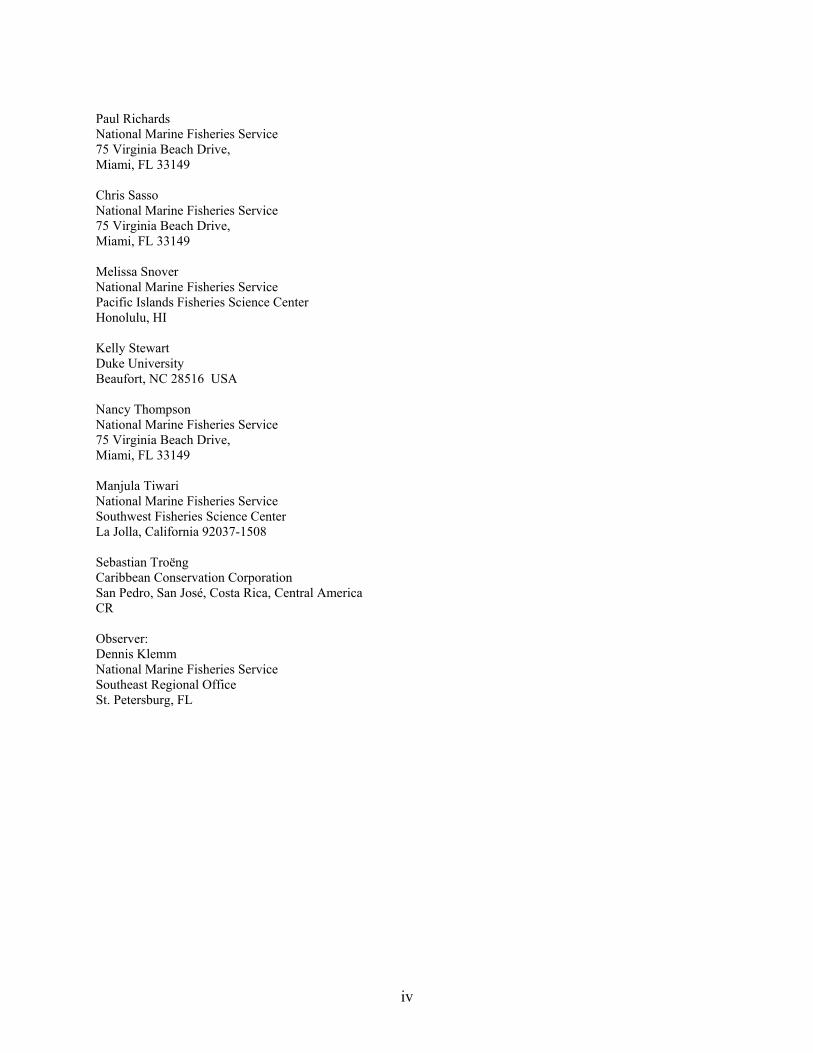
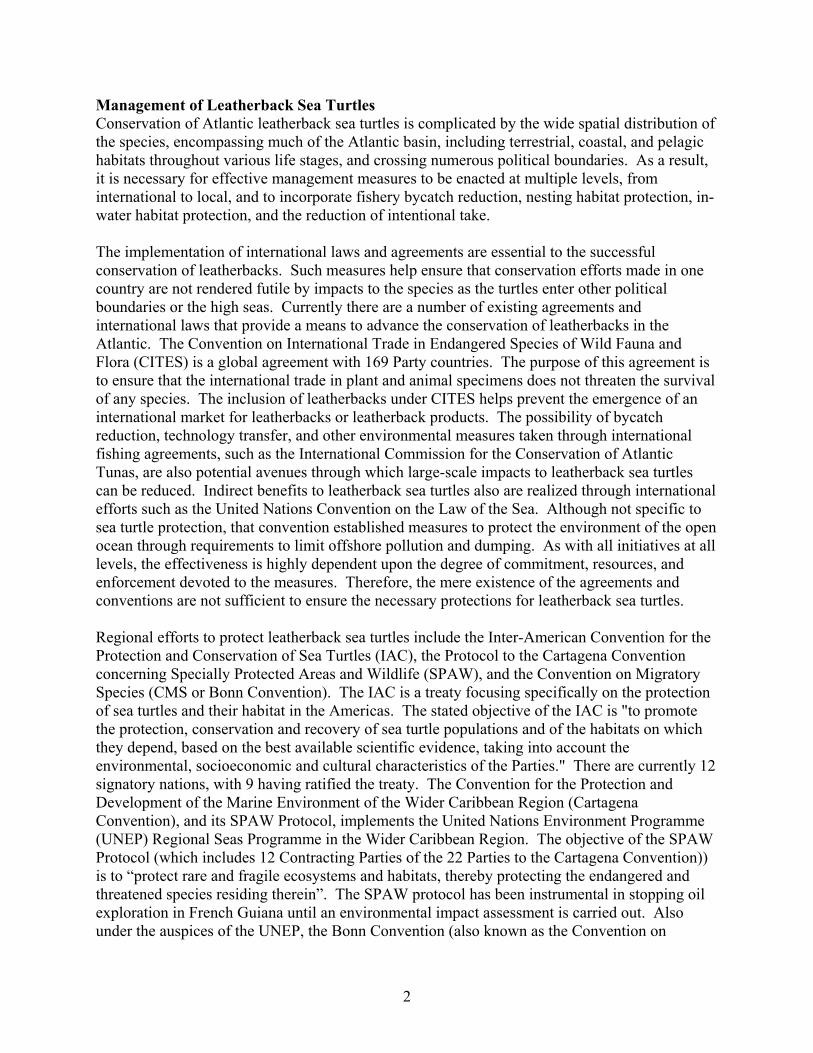
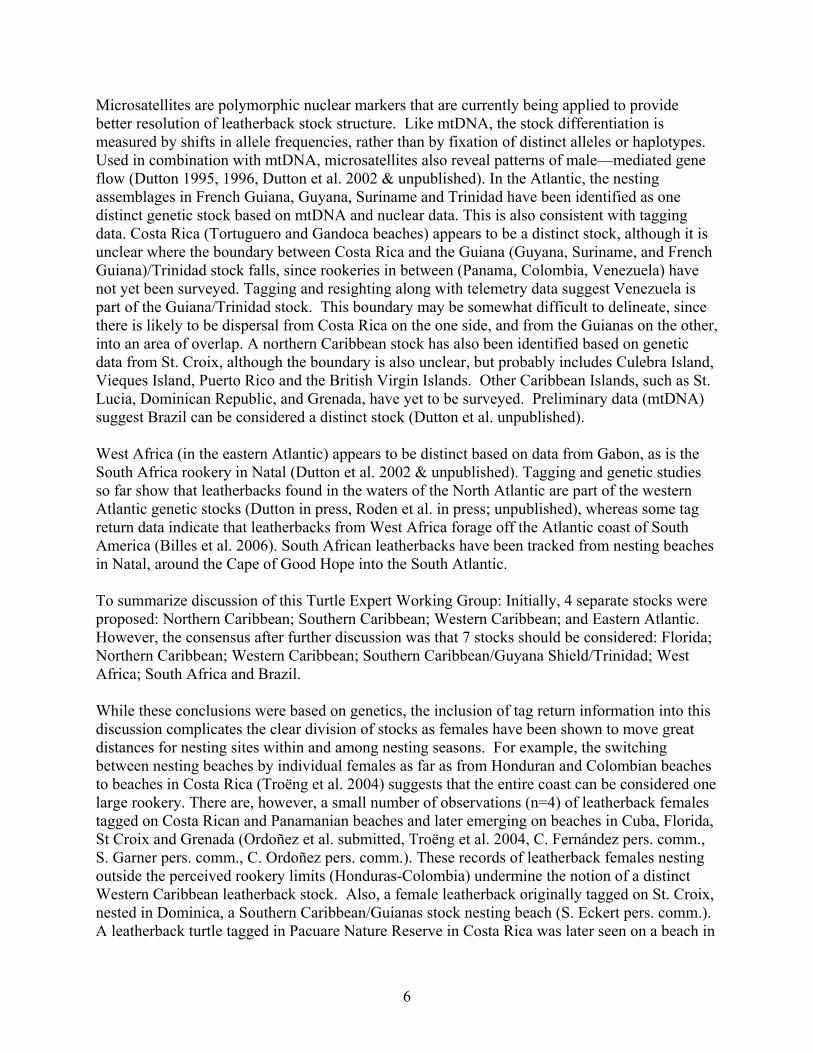
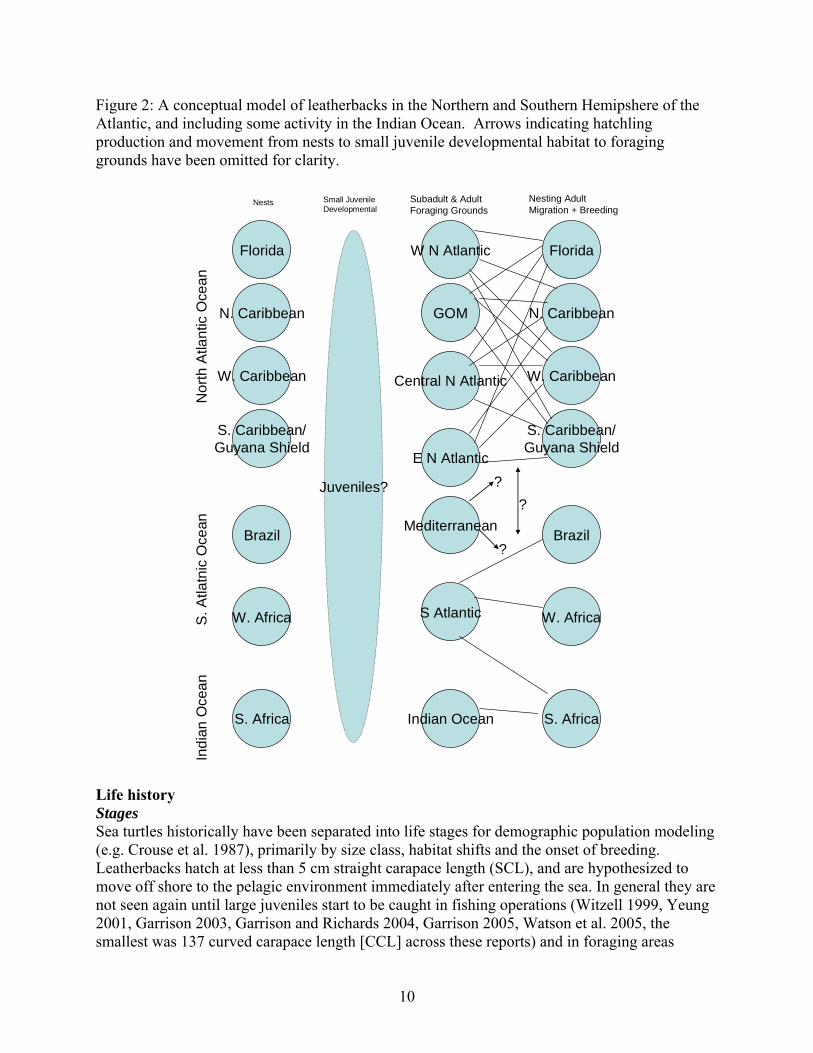
simpler model in which there may only be two Atlantic stocks, a Northern and a Southern hemisphere stock, as well as a more complex model that includes the southern hemisphere and foraging grounds based on the movement section of this report (Figure 2).
9
Figure 1: Conceptual model of leatherback sea turtles in the Atlantic. Arrows indicate direction of movement between nesting areas, juvenile habitat, large juvenile and adult foraging habitats, and back to nesting beaches. Arrows indicating hatchling production are omitted for clarity.
10
Figure 2: A conceptual model of leatherbacks in the Northern and Southern Hemipshere of the Atlantic, and including some activity in the Indian Ocean. Arrows indicating hatchling production and movement from nests to small juvenile developmental habitat to foraging grounds have been omitted for clarity.
Florida
N. Caribbean
W. Caribbean
S. Caribbean/Guyana Shield
Brazil
W. Africa
S. Africa
Nor
th A
tlant
ic O
cean
S. A
tlatn
icO
cean
Indi
an O
cean
Juveniles?
W N Atlantic
GOM
Central N Atlantic
E N Atlantic
S Atlantic
Indian Ocean
Florida
N. Caribbean
W. Caribbean
S. Caribbean/Guyana Shield
Brazil
W. Africa
S. Africa
Nests Small JuvenileDevelopmental
Subadult & AdultForaging Grounds
Nesting AdultMigration + Breeding
Mediterranean?
?
?
Life history Stages Sea turtles historically have been separated into life stages for demographic population modeling (e.g. Crouse et al. 1987), primarily by size class, habitat shifts and the onset of breeding. Leatherbacks hatch at less than 5 cm straight carapace length (SCL), and are hypothesized to move off shore to the pelagic environment immediately after entering the sea. In general they are not seen again until large juveniles start to be caught in fishing operations (Witzell 1999, Yeung 2001, Garrison 2003, Garrison and Richards 2004, Garrison 2005, Watson et al. 2005, the smallest was 137 curved carapace length [CCL] across these reports) and in foraging areas
11
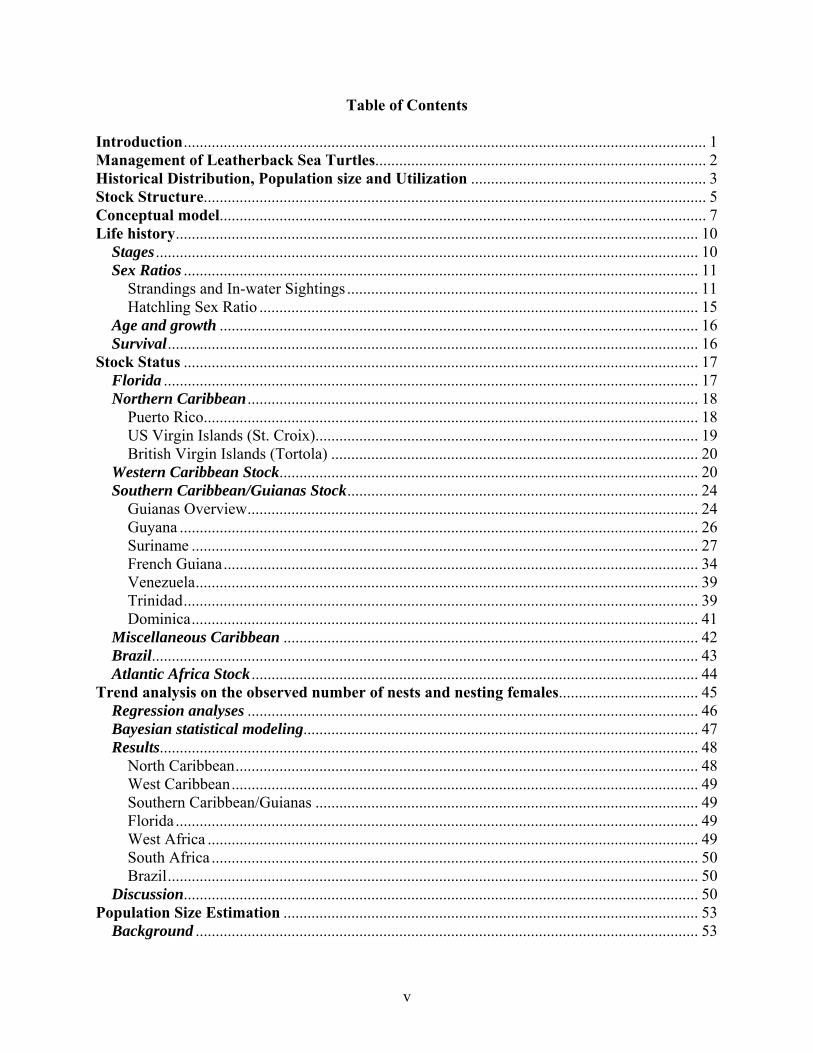
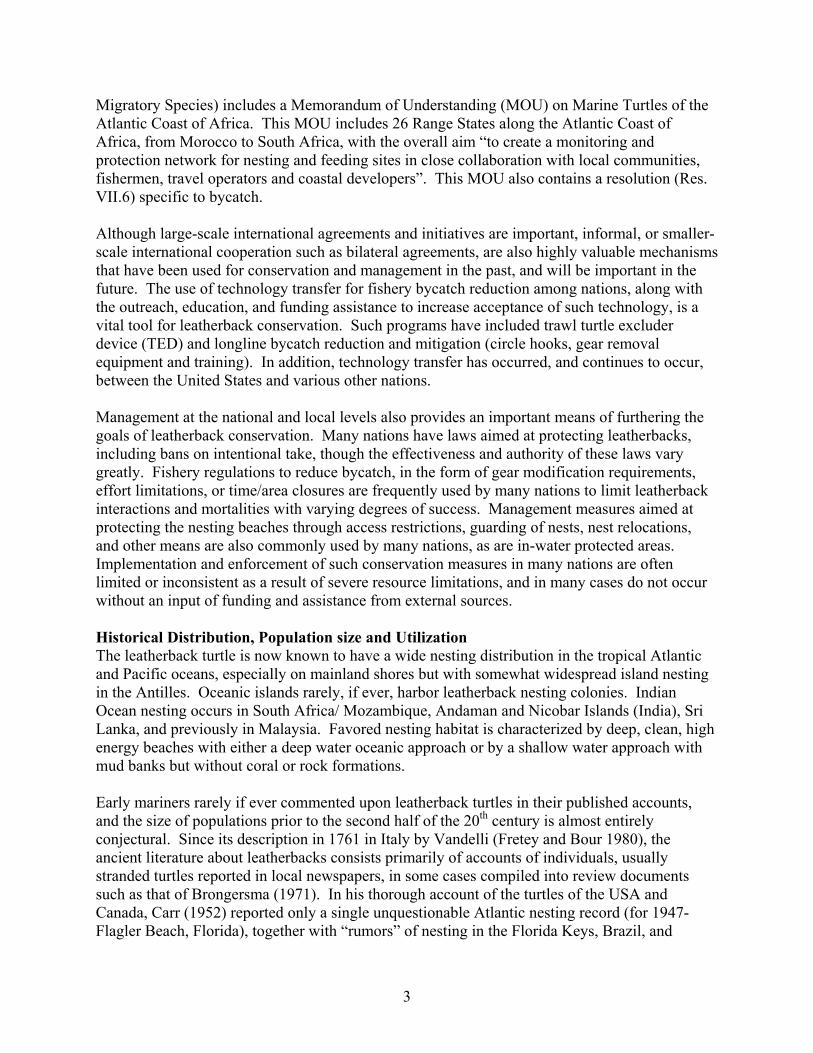
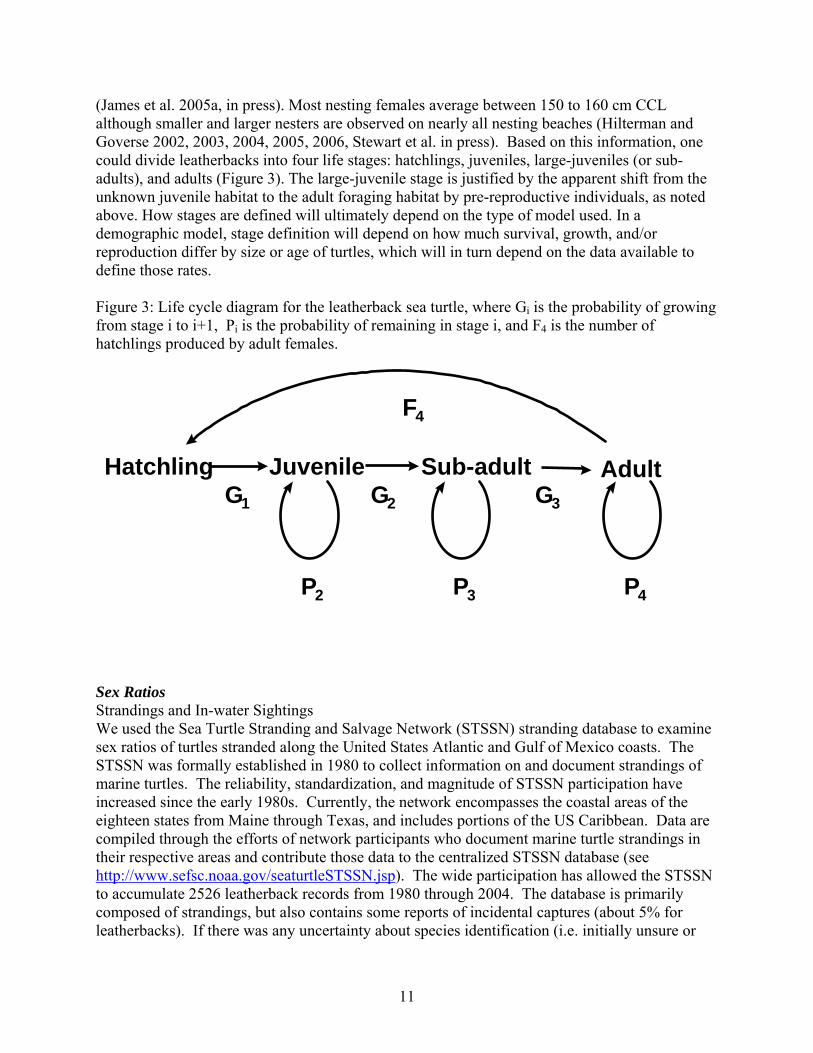
(James et al. 2005a, in press). Most nesting females average between 150 to 160 cm CCL although smaller and larger nesters are observed on nearly all nesting beaches (Hilterman and Goverse 2002, 2003, 2004, 2005, 2006, Stewart et al. in press). Based on this information, one could divide leatherbacks into four life stages: hatchlings, juveniles, large-juveniles (or sub-adults), and adults (Figure 3). The large-juvenile stage is justified by the apparent shift from the unknown juvenile habitat to the adult foraging habitat by pre-reproductive individuals, as noted above. How stages are defined will ultimately depend on the type of model used. In a demographic model, stage definition will depend on how much survival, growth, and/or reproduction differ by size or age of turtles, which will in turn depend on the data available to define those rates. Figure 3: Life cycle diagram for the leatherback sea turtle, where Gi is the probability of growing from stage i to i+1, Pi is the probability of remaining in stage i, and F4 is the number of hatchlings produced by adult females.
Sex Ratios Strandings and In-water Sightings We used the Sea Turtle Stranding and Salvage Network (STSSN) stranding database to examine sex ratios of turtles stranded along the United States Atlantic and Gulf of Mexico coasts. The STSSN was formally established in 1980 to collect information on and document strandings of marine turtles. The reliability, standardization, and magnitude of STSSN participation have increased since the early 1980s. Currently, the network encompasses the coastal areas of the eighteen states from Maine through Texas, and includes portions of the US Caribbean. Data are compiled through the efforts of network participants who document marine turtle strandings in their respective areas and contribute those data to the centralized STSSN database (see http://www.sefsc.noaa.gov/seaturtleSTSSN.jsp). The wide participation has allowed the STSSN to accumulate 2526 leatherback records from 1980 through 2004. The database is primarily composed of strandings, but also contains some reports of incidental captures (about 5% for leatherbacks). If there was any uncertainty about species identification (i.e. initially unsure or
F
P P P
G G G
4
Hatchling Juvenile Sub-adult Adult
2 3 4
1 2 3
12
probable with no photos, measurements, or other evidence it was not a leatherback) the record was not included in these analyses. Even though data from stranded animals contain certain biases, we think the STSSN data are informative as long as potential biases are considered and the conclusions do not reach beyond what is supported by the data. Dead and injured turtles are more likely to be included in the STSSN database if the turtles were close to shore at the time of injury/death and if they stranded in a time and area with high participation in the STSSN. Although the STSSN has some participation from the US Caribbean and Bermuda, the majority of the records (> 99%) come from the mainland United States. No records from Bermuda are considered in this analysis. Sampling biases in STSSN data could bias the estimated sex ratio if males and females exhibit different behavioral patterns in relation to the sampling biases. For example, if the migratory or nesting behavior of females gives them a higher or lower probability of becoming stranded in an area with high STSSN participation, sex ratios derived from STSSN data would be biased. The sex ratio estimate would be biased toward females if nesting behavior brought more females than males close to mainland United States shoreline. This bias is not expected to be large because of the relatively low amount of leatherback nesting in the mainland United States (mostly in Florida). The sex ratio estimate would be biased towards males if migratory behavior of females makes them less likely to be found near the mainland United States. This scenario could occur if female prevalence in coastal US waters decreased during the year that they nested elsewhere. For example, if the northern extreme of the summer migration for females in nesting years is less than during non-nesting years, observed sex ratios in the United States (or at least the northern portions of the United States) may be biased towards males when compared to the broader Atlantic population. It should also be noted that in general, strandings data are not necessarily reflective of the overall population and that some subsets of the STSSN data that are used in the subsequent data summaries consist of small samples. Because the STSSN database is biased toward strata with high STSSN coverage, the patterns observed in the STSSN database should not be assumed to represent patterns in the larger Atlantic population. For the turtles with sex classification, we recalculated sex ratios for various regional and size-class subsets of the data. Although most (n=2181) of the records did not contain sex information, the accuracy of the existing sex classification (n=344) is high because each of these records was reviewed prior to the record being entered into the database (Wendy Teas, NMFS Miami, pers. comm.). The overall proportion of females in the database is 60% (n=344) and the proportion of female was similar in adults (57% for leatherbacks > 145 cm curved carapace length) and juveniles (61% for 100 – 145 cm, Table 1) was similar. The proportion of females was greater in the Gulf of Mexico (87%, Florida Gulf of Mexico through Texas) than the southern north Atlantic (59%, North Carolina through Florida Atlantic) and the northwest Atlantic (57%, Virginia through Maine), although the proportion of females varied slightly within wide size classes (Table 2). Although this dataset only contains information from nearshore and onshore strandings, we divided the dataset to compare the sex ratios of turtles stranded inside and outside of the COLREGS demarcation line. (The COLREGS line is a line on National Ocean Service navigation charts which separates the ocean from inshore waters. The line generally runs across the mouth of bays and estuaries.) The proportion of females was relatively constant inside (60%, n=98) and outside (60%, n=247) the COLREGS line.
13
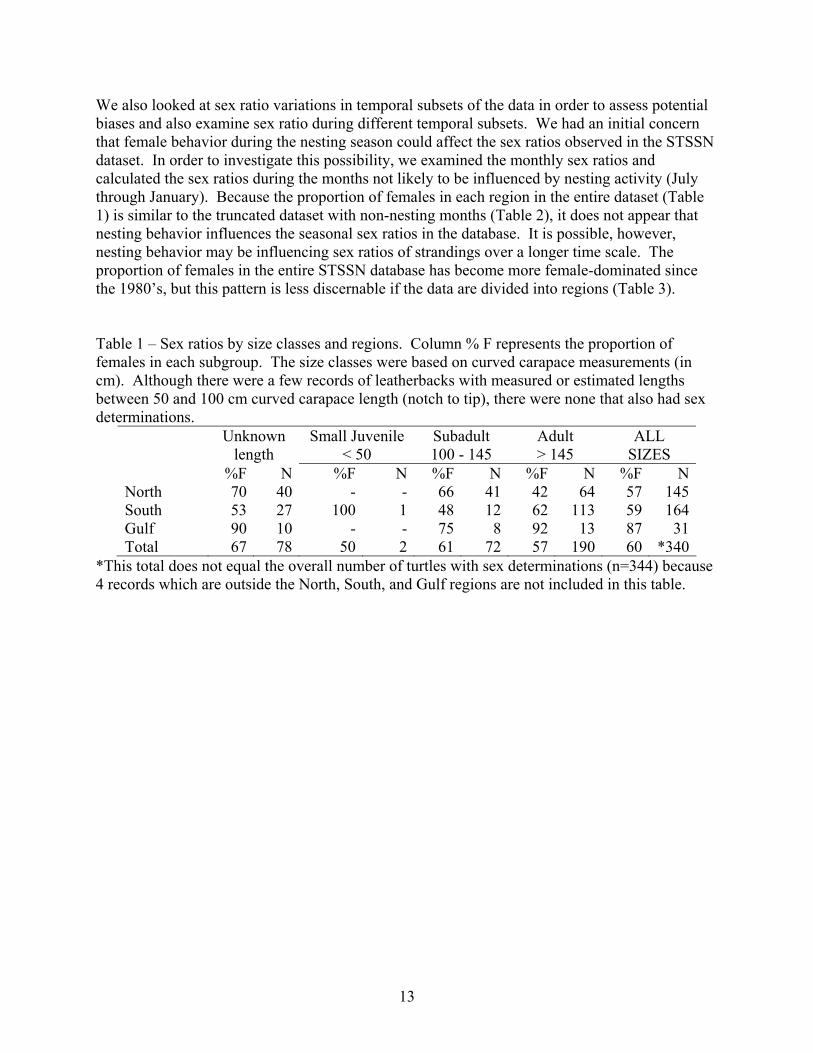
We also looked at sex ratio variations in temporal subsets of the data in order to assess potential biases and also examine sex ratio during different temporal subsets. We had an initial concern that female behavior during the nesting season could affect the sex ratios observed in the STSSN dataset. In order to investigate this possibility, we examined the monthly sex ratios and calculated the sex ratios during the months not likely to be influenced by nesting activity (July through January). Because the proportion of females in each region in the entire dataset (Table 1) is similar to the truncated dataset with non-nesting months (Table 2), it does not appear that nesting behavior influences the seasonal sex ratios in the database. It is possible, however, nesting behavior may be influencing sex ratios of strandings over a longer time scale. The proportion of females in the entire STSSN database has become more female-dominated since the 1980’s, but this pattern is less discernable if the data are divided into regions (Table 3). Table 1 – Sex ratios by size classes and regions. Column % F represents the proportion of females in each subgroup. The size classes were based on curved carapace measurements (in cm). Although there were a few records of leatherbacks with measured or estimated lengths between 50 and 100 cm curved carapace length (notch to tip), there were none that also had sex determinations.
Unknown length
Small Juvenile < 50
Subadult 100 - 145
Adult > 145
ALL SIZES
%F N %F N %F N %F N %F NNorth 70 40 - - 66 41 42 64 57 145South 53 27 100 1 48 12 62 113 59 164Gulf 90 10 - - 75 8 92 13 87 31Total 67 78 50 2 61 72 57 190 60 *340
*This total does not equal the overall number of turtles with sex determinations (n=344) because 4 records which are outside the North, South, and Gulf regions are not included in this table.
14
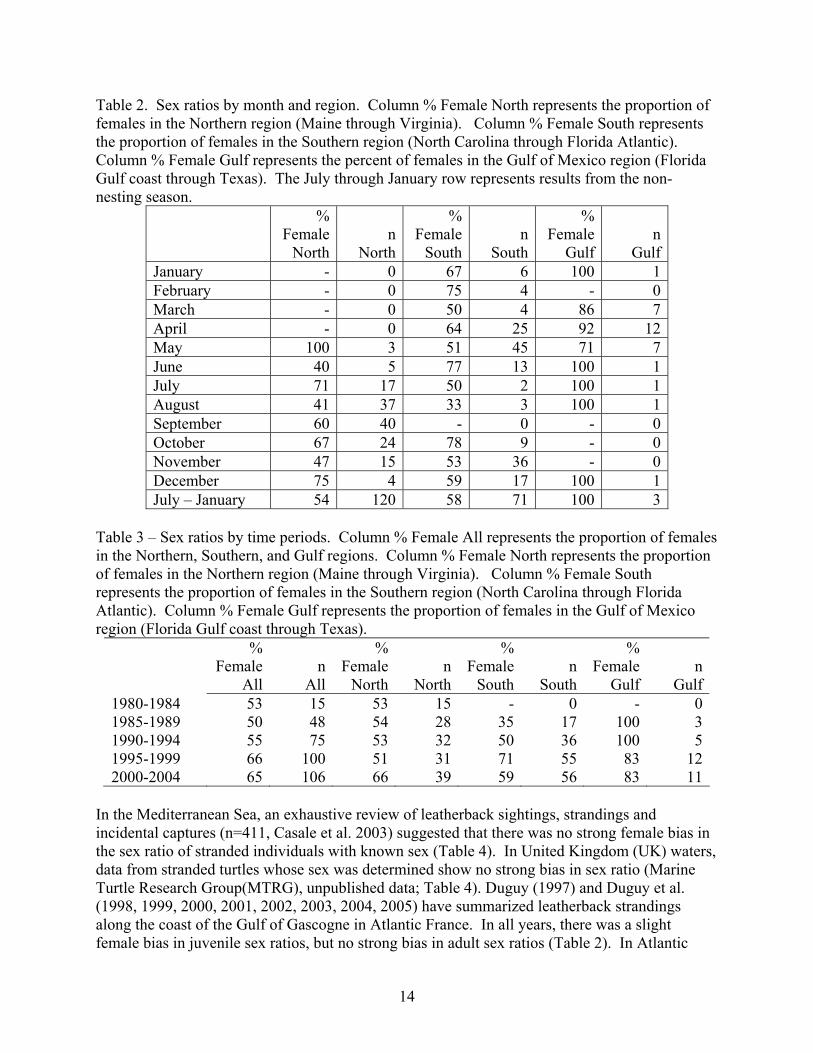
Table 2. Sex ratios by month and region. Column % Female North represents the proportion of females in the Northern region (Maine through Virginia). Column % Female South represents the proportion of females in the Southern region (North Carolina through Florida Atlantic). Column % Female Gulf represents the percent of females in the Gulf of Mexico region (Florida Gulf coast through Texas). The July through January row represents results from the non-nesting season.
% Female
Northn
North
% Female
Southn
South
% Female
Gulf n
GulfJanuary - 0 67 6 100 1February - 0 75 4 - 0March - 0 50 4 86 7April - 0 64 25 92 12May 100 3 51 45 71 7June 40 5 77 13 100 1July 71 17 50 2 100 1August 41 37 33 3 100 1September 60 40 - 0 - 0October 67 24 78 9 - 0November 47 15 53 36 - 0December 75 4 59 17 100 1July – January 54 120 58 71 100 3
Table 3 – Sex ratios by time periods. Column % Female All represents the proportion of females in the Northern, Southern, and Gulf regions. Column % Female North represents the proportion of females in the Northern region (Maine through Virginia). Column % Female South represents the proportion of females in the Southern region (North Carolina through Florida Atlantic). Column % Female Gulf represents the proportion of females in the Gulf of Mexico region (Florida Gulf coast through Texas).
% Female
All
n
All
% Female
Northn
North
% Female
South
n
South
% Female
Gulf n
Gulf1980-1984 53 15 53 15 - 0 - 01985-1989 50 48 54 28 35 17 100 31990-1994 55 75 53 32 50 36 100 51995-1999 66 100 51 31 71 55 83 122000-2004 65 106 66 39 59 56 83 11
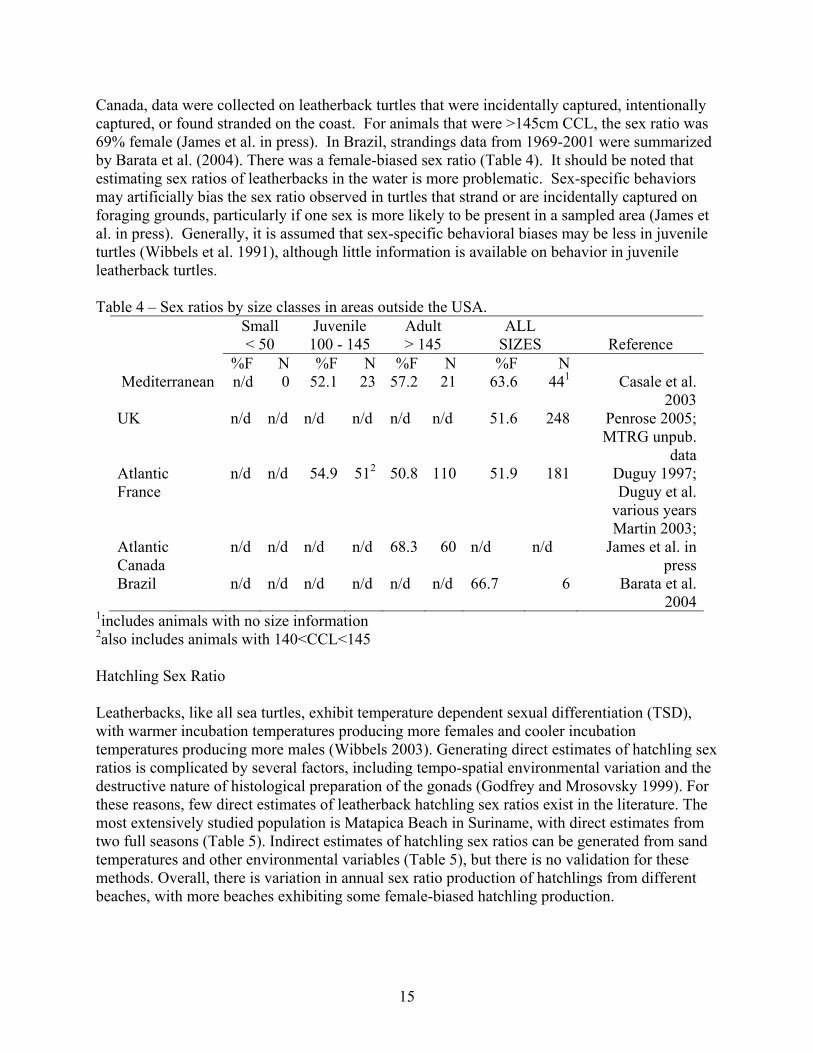
In the Mediterranean Sea, an exhaustive review of leatherback sightings, strandings and incidental captures (n=411, Casale et al. 2003) suggested that there was no strong female bias in the sex ratio of stranded individuals with known sex (Table 4). In United Kingdom (UK) waters, data from stranded turtles whose sex was determined show no strong bias in sex ratio (Marine Turtle Research Group(MTRG), unpublished data; Table 4). Duguy (1997) and Duguy et al. (1998, 1999, 2000, 2001, 2002, 2003, 2004, 2005) have summarized leatherback strandings along the coast of the Gulf of Gascogne in Atlantic France. In all years, there was a slight female bias in juvenile sex ratios, but no strong bias in adult sex ratios (Table 2). In Atlantic
15
Canada, data were collected on leatherback turtles that were incidentally captured, intentionally captured, or found stranded on the coast. For animals that were >145cm CCL, the sex ratio was 69% female (James et al. in press). In Brazil, strandings data from 1969-2001 were summarized by Barata et al. (2004). There was a female-biased sex ratio (Table 4). It should be noted that estimating sex ratios of leatherbacks in the water is more problematic. Sex-specific behaviors may artificially bias the sex ratio observed in turtles that strand or are incidentally captured on foraging grounds, particularly if one sex is more likely to be present in a sampled area (James et al. in press). Generally, it is assumed that sex-specific behavioral biases may be less in juvenile turtles (Wibbels et al. 1991), although little information is available on behavior in juvenile leatherback turtles. Table 4 – Sex ratios by size classes in areas outside the USA.
Small < 50
Juvenile 100 - 145
Adult > 145
ALL SIZES
Reference
%F N %F N %F N %F N Mediterranean n/d 0 52.1 23 57.2 21 63.6 441 Casale et al.
2003UK n/d n/d n/d n/d n/d n/d 51.6 248 Penrose 2005;
MTRG unpub. data
Atlantic France
n/d n/d 54.9 512 50.8 110 51.9 181 Duguy 1997; Duguy et al.
various years Martin 2003;
Atlantic Canada
n/d n/d n/d n/d 68.3 60 n/d n/d James et al. in press
Brazil n/d n/d n/d n/d n/d n/d 66.7 6 Barata et al. 2004
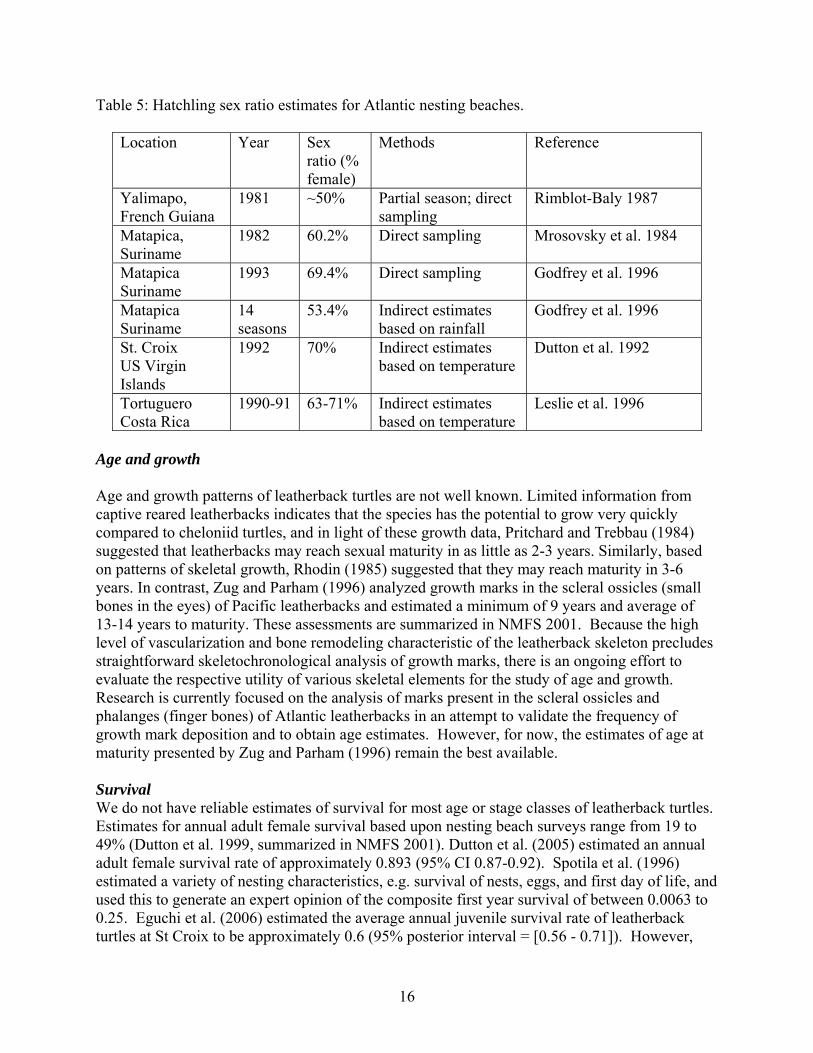
1includes animals with no size information 2also includes animals with 140<CCL<145 Hatchling Sex Ratio Leatherbacks, like all sea turtles, exhibit temperature dependent sexual differentiation (TSD), with warmer incubation temperatures producing more females and cooler incubation temperatures producing more males (Wibbels 2003). Generating direct estimates of hatchling sex ratios is complicated by several factors, including tempo-spatial environmental variation and the destructive nature of histological preparation of the gonads (Godfrey and Mrosovsky 1999). For these reasons, few direct estimates of leatherback hatchling sex ratios exist in the literature. The most extensively studied population is Matapica Beach in Suriname, with direct estimates from two full seasons (Table 5). Indirect estimates of hatchling sex ratios can be generated from sand temperatures and other environmental variables (Table 5), but there is no validation for these methods. Overall, there is variation in annual sex ratio production of hatchlings from different beaches, with more beaches exhibiting some female-biased hatchling production.
16
Table 5: Hatchling sex ratio estimates for Atlantic nesting beaches.
Location Year Sex ratio (% female)
Methods Reference
Yalimapo, French Guiana
1981 ~50% Partial season; direct sampling
Rimblot-Baly 1987
Matapica, Suriname
1982 60.2% Direct sampling Mrosovsky et al. 1984
Matapica Suriname
1993 69.4% Direct sampling Godfrey et al. 1996
Matapica Suriname
14 seasons
53.4% Indirect estimates based on rainfall
Godfrey et al. 1996
St. Croix US Virgin Islands
1992 70% Indirect estimates based on temperature
Dutton et al. 1992
Tortuguero Costa Rica
1990-91 63-71% Indirect estimates based on temperature
Leslie et al. 1996
Age and growth Age and growth patterns of leatherback turtles are not well known. Limited information from captive reared leatherbacks indicates that the species has the potential to grow very quickly compared to cheloniid turtles, and in light of these growth data, Pritchard and Trebbau (1984) suggested that leatherbacks may reach sexual maturity in as little as 2-3 years. Similarly, based on patterns of skeletal growth, Rhodin (1985) suggested that they may reach maturity in 3-6 years. In contrast, Zug and Parham (1996) analyzed growth marks in the scleral ossicles (small bones in the eyes) of Pacific leatherbacks and estimated a minimum of 9 years and average of 13-14 years to maturity. These assessments are summarized in NMFS 2001. Because the high level of vascularization and bone remodeling characteristic of the leatherback skeleton precludes straightforward skeletochronological analysis of growth marks, there is an ongoing effort to evaluate the respective utility of various skeletal elements for the study of age and growth. Research is currently focused on the analysis of marks present in the scleral ossicles and phalanges (finger bones) of Atlantic leatherbacks in an attempt to validate the frequency of growth mark deposition and to obtain age estimates. However, for now, the estimates of age at maturity presented by Zug and Parham (1996) remain the best available. Survival We do not have reliable estimates of survival for most age or stage classes of leatherback turtles. Estimates for annual adult female survival based upon nesting beach surveys range from 19 to 49% (Dutton et al. 1999, summarized in NMFS 2001). Dutton et al. (2005) estimated an annual adult female survival rate of approximately 0.893 (95% CI 0.87-0.92). Spotila et al. (1996) estimated a variety of nesting characteristics, e.g. survival of nests, eggs, and first day of life, and used this to generate an expert opinion of the composite first year survival of between 0.0063 to 0.25. Eguchi et al. (2006) estimated the average annual juvenile survival rate of leatherback turtles at St Croix to be approximately 0.6 (95% posterior interval = [0.56 - 0.71]). However,
17
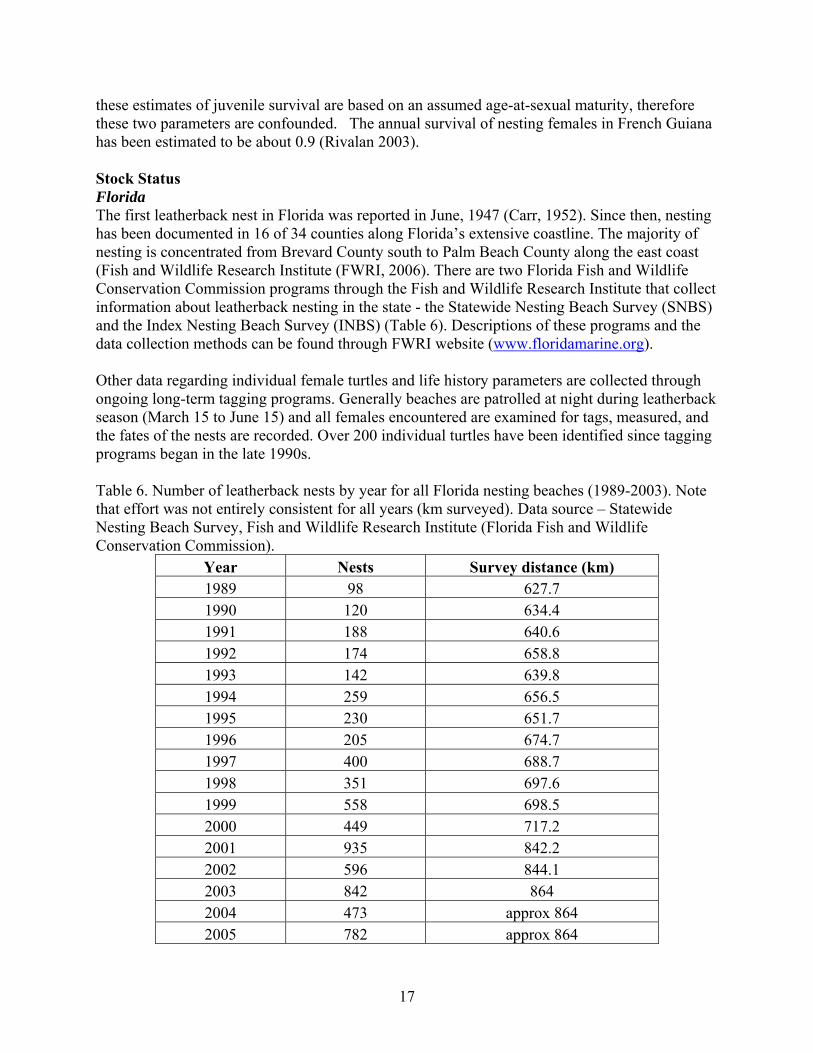
these estimates of juvenile survival are based on an assumed age-at-sexual maturity, therefore these two parameters are confounded. The annual survival of nesting females in French Guiana has been estimated to be about 0.9 (Rivalan 2003). Stock Status Florida The first leatherback nest in Florida was reported in June, 1947 (Carr, 1952). Since then, nesting has been documented in 16 of 34 counties along Florida’s extensive coastline. The majority of nesting is concentrated from Brevard County south to Palm Beach County along the east coast (Fish and Wildlife Research Institute (FWRI, 2006). There are two Florida Fish and Wildlife Conservation Commission programs through the Fish and Wildlife Research Institute that collect information about leatherback nesting in the state - the Statewide Nesting Beach Survey (SNBS) and the Index Nesting Beach Survey (INBS) (Table 6). Descriptions of these programs and the data collection methods can be found through FWRI website (www.floridamarine.org). Other data regarding individual female turtles and life history parameters are collected through ongoing long-term tagging programs. Generally beaches are patrolled at night during leatherback season (March 15 to June 15) and all females encountered are examined for tags, measured, and the fates of the nests are recorded. Over 200 individual turtles have been identified since tagging programs began in the late 1990s. Table 6. Number of leatherback nests by year for all Florida nesting beaches (1989-2003). Note that effort was not entirely consistent for all years (km surveyed). Data source – Statewide Nesting Beach Survey, Fish and Wildlife Research Institute (Florida Fish and Wildlife Conservation Commission).
Year Nests Survey distance (km) 1989 98 627.7 1990 120 634.4 1991 188 640.6 1992 174 658.8 1993 142 639.8 1994 259 656.5 1995 230 651.7 1996 205 674.7 1997 400 688.7 1998 351 697.6 1999 558 698.5 2000 449 717.2 2001 935 842.2 2002 596 844.1 2003 842 864 2004 473 approx 864 2005 782 approx 864
18
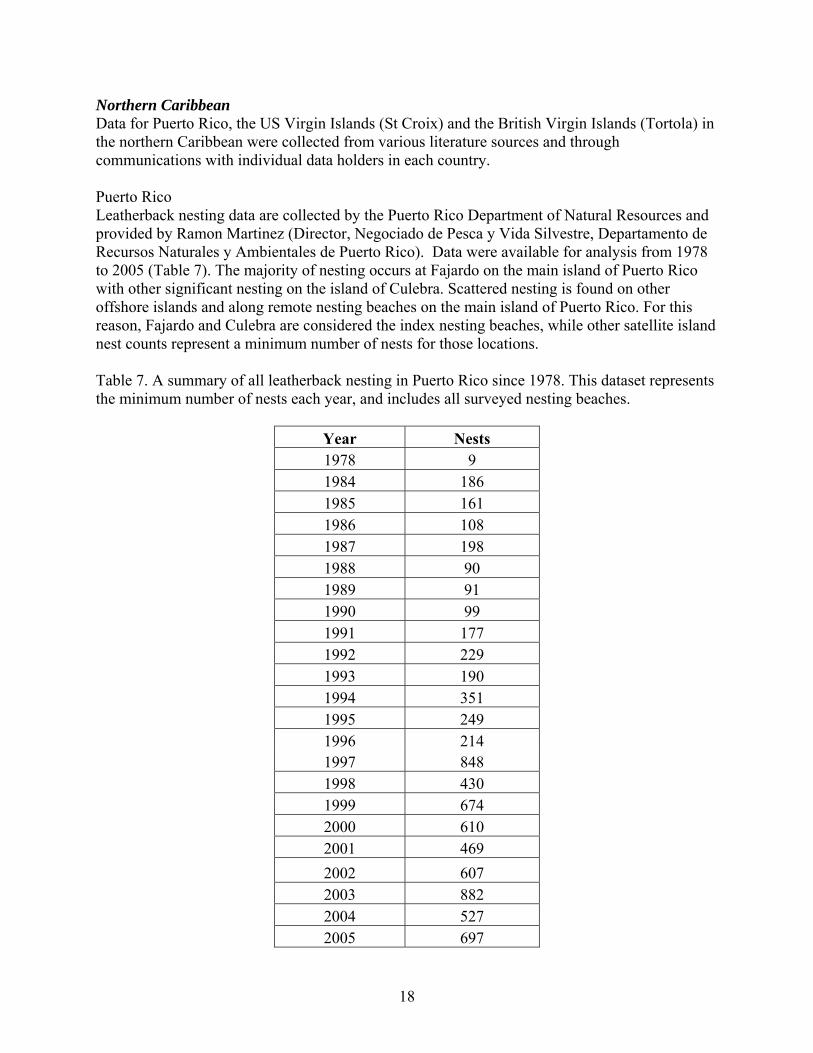
Northern Caribbean Data for Puerto Rico, the US Virgin Islands (St Croix) and the British Virgin Islands (Tortola) in the northern Caribbean were collected from various literature sources and through communications with individual data holders in each country. Puerto Rico Leatherback nesting data are collected by the Puerto Rico Department of Natural Resources and provided by Ramon Martinez (Director, Negociado de Pesca y Vida Silvestre, Departamento de Recursos Naturales y Ambientales de Puerto Rico). Data were available for analysis from 1978 to 2005 (Table 7). The majority of nesting occurs at Fajardo on the main island of Puerto Rico with other significant nesting on the island of Culebra. Scattered nesting is found on other offshore islands and along remote nesting beaches on the main island of Puerto Rico. For this reason, Fajardo and Culebra are considered the index nesting beaches, while other satellite island nest counts represent a minimum number of nests for those locations. Table 7. A summary of all leatherback nesting in Puerto Rico since 1978. This dataset represents the minimum number of nests each year, and includes all surveyed nesting beaches.
Year Nests 1978 9 1984 186 1985 161 1986 108 1987 198 1988 90 1989 91 1990 99 1991 177 1992 229 1993 190 1994 351 1995 249 1996 214 1997 848 1998 430 1999 674 2000 610 2001 469 2002 607 2003 882 2004 527 2005 697
19
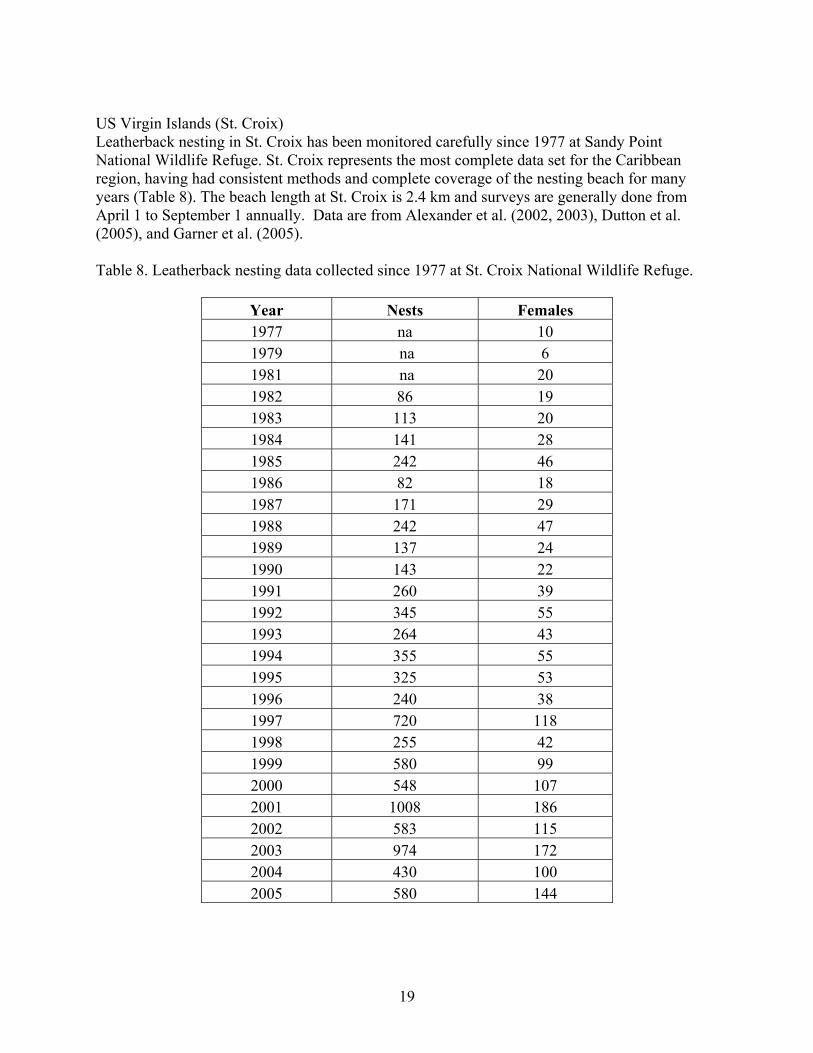
US Virgin Islands (St. Croix) Leatherback nesting in St. Croix has been monitored carefully since 1977 at Sandy Point National Wildlife Refuge. St. Croix represents the most complete data set for the Caribbean region, having had consistent methods and complete coverage of the nesting beach for many years (Table 8). The beach length at St. Croix is 2.4 km and surveys are generally done from April 1 to September 1 annually. Data are from Alexander et al. (2002, 2003), Dutton et al. (2005), and Garner et al. (2005). Table 8. Leatherback nesting data collected since 1977 at St. Croix National Wildlife Refuge.
Year Nests Females 1977 na 10 1979 na 6 1981 na 20 1982 86 19 1983 113 20 1984 141 28 1985 242 46 1986 82 18 1987 171 29 1988 242 47 1989 137 24 1990 143 22 1991 260 39 1992 345 55 1993 264 43 1994 355 55 1995 325 53 1996 240 38 1997 720 118 1998 255 42 1999 580 99 2000 548 107 2001 1008 186 2002 583 115 2003 974 172 2004 430 100 2005 580 144
20
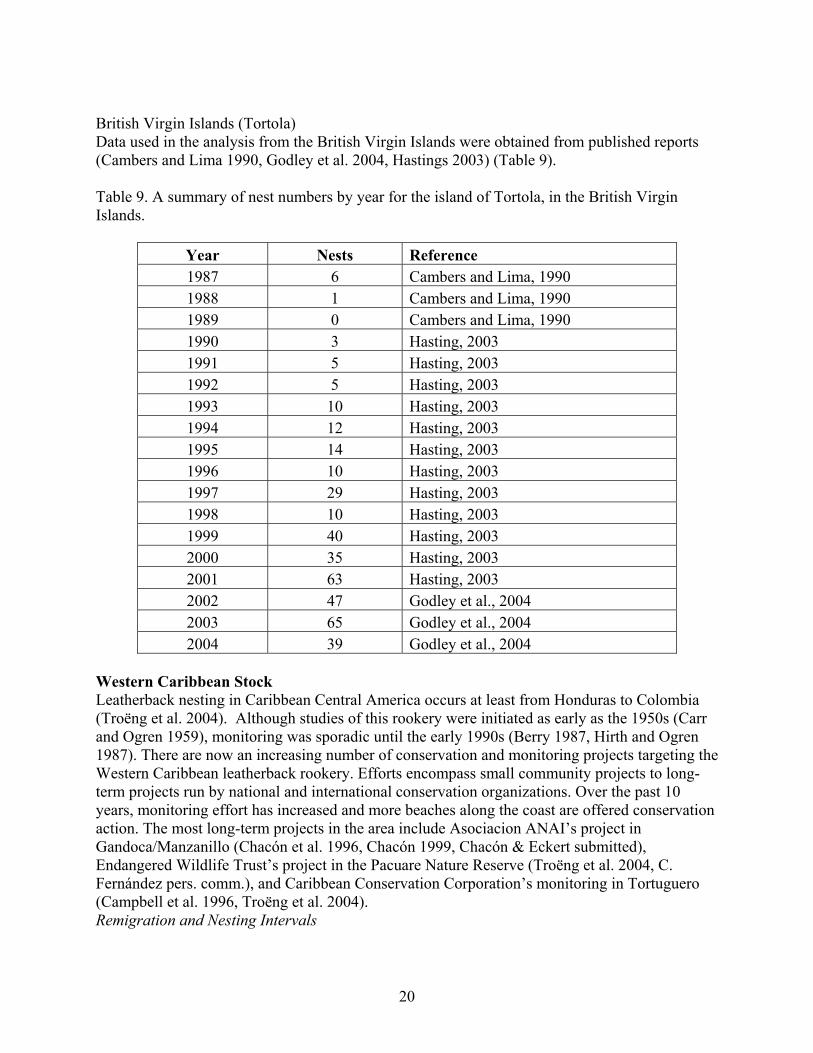
British Virgin Islands (Tortola) Data used in the analysis from the British Virgin Islands were obtained from published reports (Cambers and Lima 1990, Godley et al. 2004, Hastings 2003) (Table 9). Table 9. A summary of nest numbers by year for the island of Tortola, in the British Virgin Islands.
Year Nests Reference 1987 6 Cambers and Lima, 1990 1988 1 Cambers and Lima, 1990 1989 0 Cambers and Lima, 1990 1990 3 Hasting, 2003 1991 5 Hasting, 2003 1992 5 Hasting, 2003 1993 10 Hasting, 2003 1994 12 Hasting, 2003 1995 14 Hasting, 2003 1996 10 Hasting, 2003 1997 29 Hasting, 2003 1998 10 Hasting, 2003 1999 40 Hasting, 2003 2000 35 Hasting, 2003 2001 63 Hasting, 2003 2002 47 Godley et al., 2004 2003 65 Godley et al., 2004 2004 39 Godley et al., 2004
Western Caribbean Stock Leatherback nesting in Caribbean Central America occurs at least from Honduras to Colombia (Troëng et al. 2004). Although studies of this rookery were initiated as early as the 1950s (Carr and Ogren 1959), monitoring was sporadic until the early 1990s (Berry 1987, Hirth and Ogren 1987). There are now an increasing number of conservation and monitoring projects targeting the Western Caribbean leatherback rookery. Efforts encompass small community projects to long-term projects run by national and international conservation organizations. Over the past 10 years, monitoring effort has increased and more beaches along the coast are offered conservation action. The most long-term projects in the area include Asociacion ANAI’s project in Gandoca/Manzanillo (Chacón et al. 1996, Chacón 1999, Chacón & Eckert submitted), Endangered Wildlife Trust’s project in the Pacuare Nature Reserve (Troëng et al. 2004, C. Fernández pers. comm.), and Caribbean Conservation Corporation’s monitoring in Tortuguero (Campbell et al. 1996, Troëng et al. 2004). Remigration and Nesting Intervals
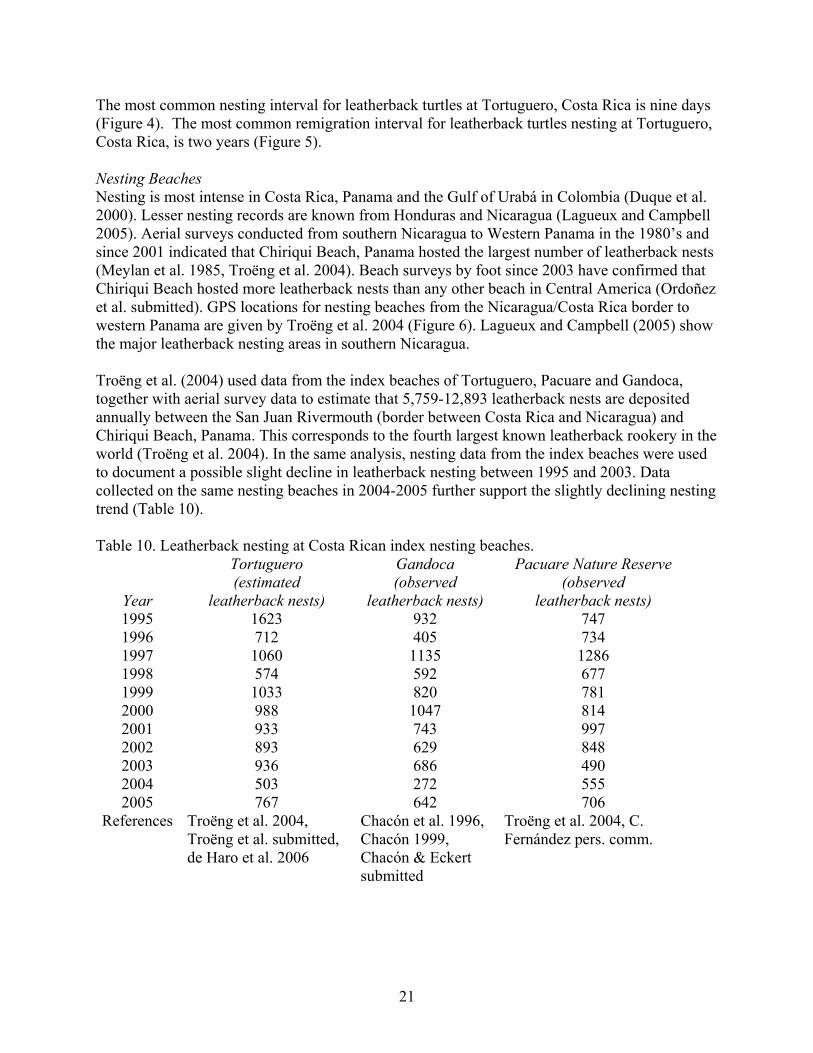
21
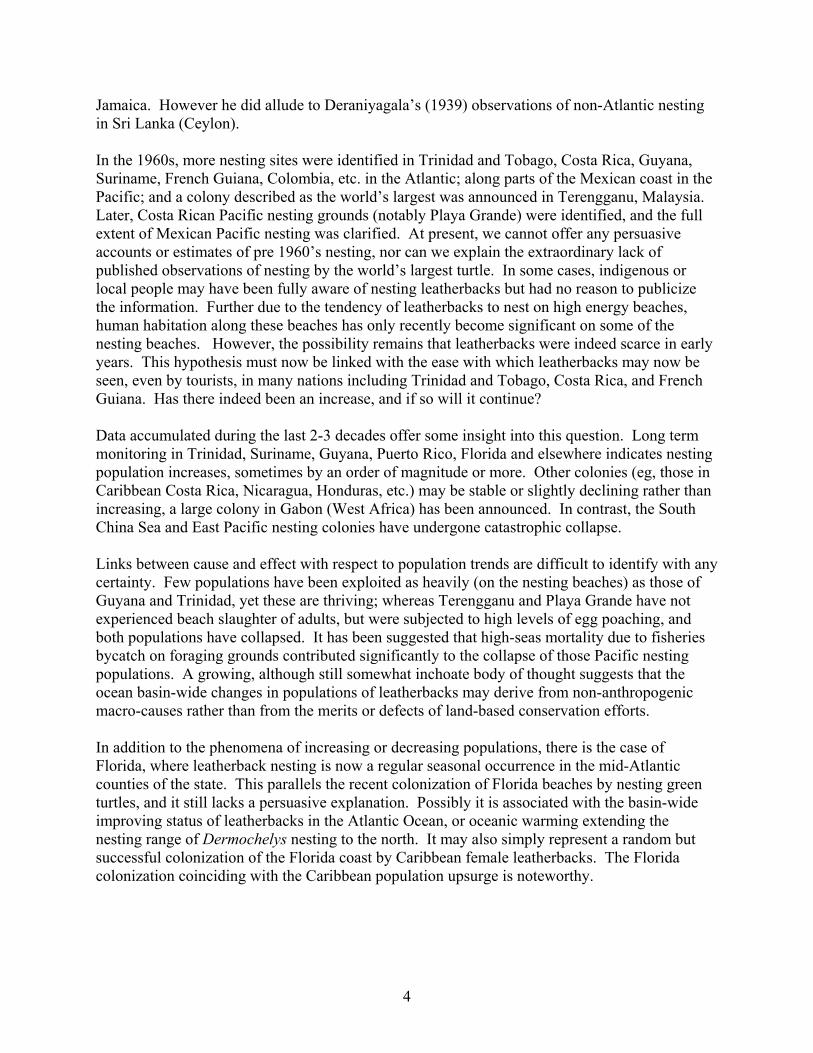
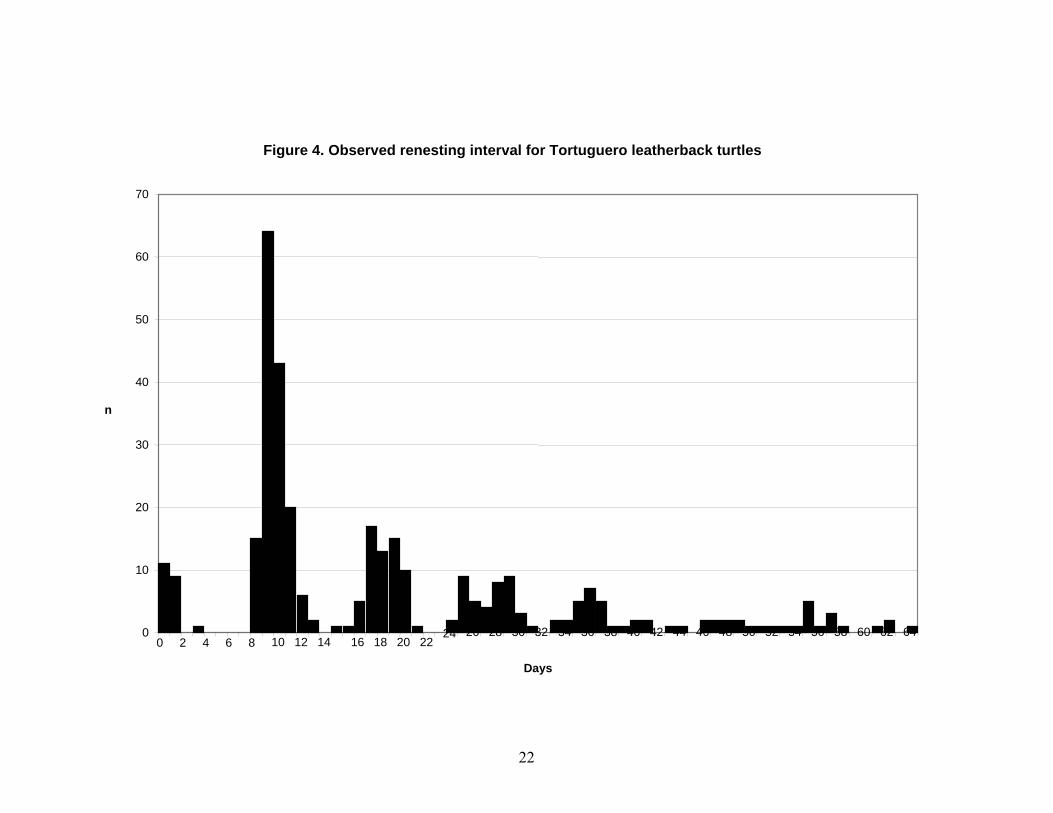
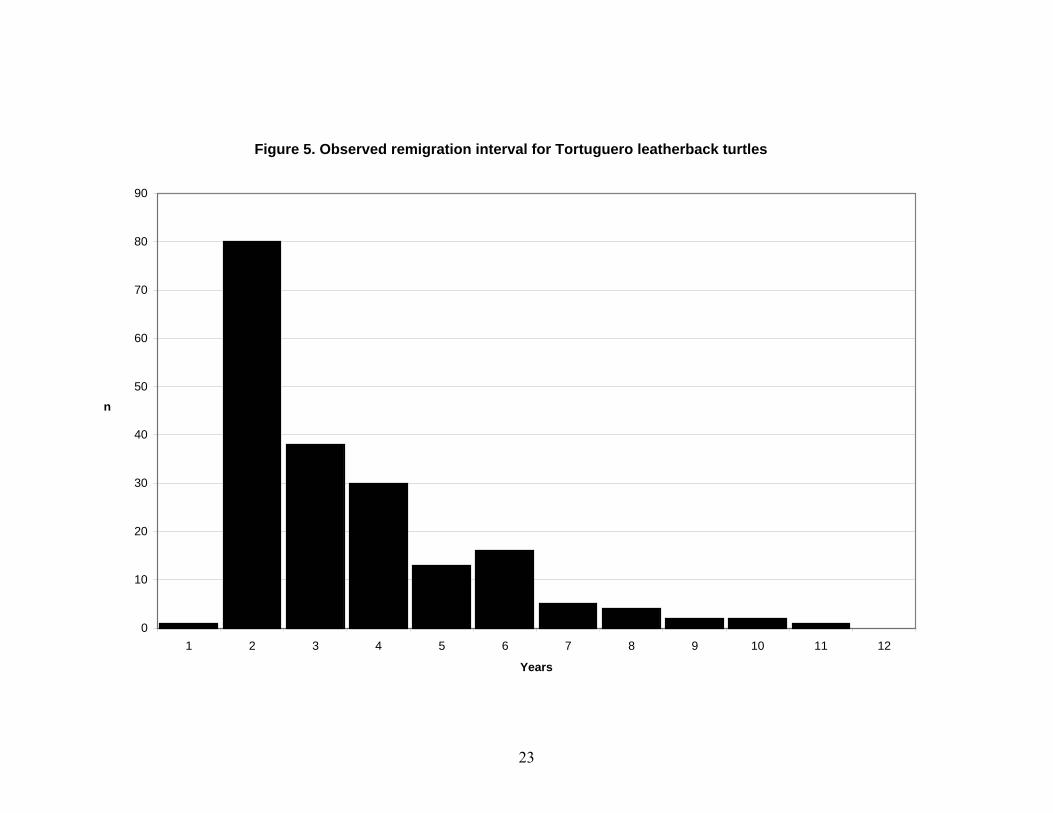
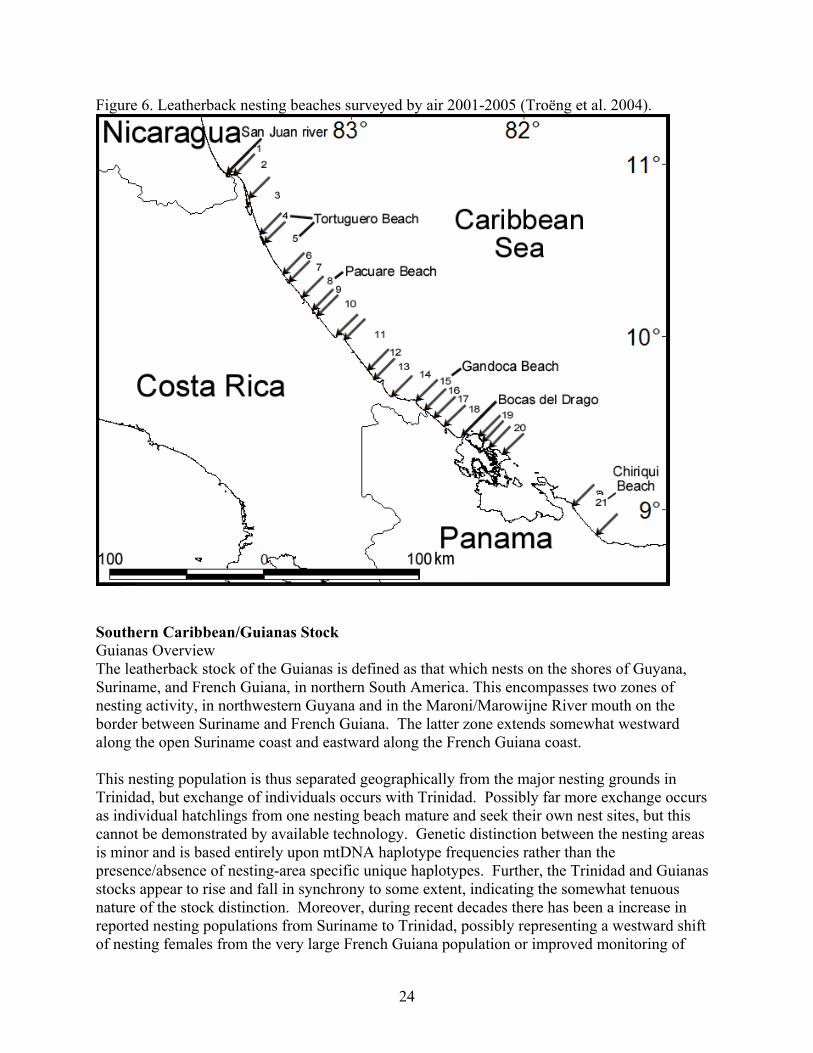
The most common nesting interval for leatherback turtles at Tortuguero, Costa Rica is nine days (Figure 4). The most common remigration interval for leatherback turtles nesting at Tortuguero, Costa Rica, is two years (Figure 5). Nesting Beaches Nesting is most intense in Costa Rica, Panama and the Gulf of Urabá in Colombia (Duque et al. 2000). Lesser nesting records are known from Honduras and Nicaragua (Lagueux and Campbell 2005). Aerial surveys conducted from southern Nicaragua to Western Panama in the 1980’s and since 2001 indicated that Chiriqui Beach, Panama hosted the largest number of leatherback nests (Meylan et al. 1985, Troëng et al. 2004). Beach surveys by foot since 2003 have confirmed that Chiriqui Beach hosted more leatherback nests than any other beach in Central America (Ordoñez et al. submitted). GPS locations for nesting beaches from the Nicaragua/Costa Rica border to western Panama are given by Troëng et al. 2004 (Figure 6). Lagueux and Campbell (2005) show the major leatherback nesting areas in southern Nicaragua. Troëng et al. (2004) used data from the index beaches of Tortuguero, Pacuare and Gandoca, together with aerial survey data to estimate that 5,759-12,893 leatherback nests are deposited annually between the San Juan Rivermouth (border between Costa Rica and Nicaragua) and Chiriqui Beach, Panama. This corresponds to the fourth largest known leatherback rookery in the world (Troëng et al. 2004). In the same analysis, nesting data from the index beaches were used to document a possible slight decline in leatherback nesting between 1995 and 2003. Data collected on the same nesting beaches in 2004-2005 further support the slightly declining nesting trend (Table 10). Table 10. Leatherback nesting at Costa Rican index nesting beaches.
Year
Tortuguero (estimated
leatherback nests)
Gandoca (observed
leatherback nests)
Pacuare Nature Reserve (observed
leatherback nests) 1995 1623 932 747 1996 712 405 734 1997 1060 1135 1286 1998 574 592 677 1999 1033 820 781 2000 988 1047 814 2001 933 743 997 2002 893 629 848 2003 936 686 490 2004 503 272 555 2005 767 642 706
References Troëng et al. 2004, Troëng et al. submitted, de Haro et al. 2006
Chacón et al. 1996, Chacón 1999, Chacón & Eckert submitted
Troëng et al. 2004, C. Fernández pers. comm.
22
Figure 4. Observed renesting interval for Tortuguero leatherback turtles
0
10
20
30
40
50
60
70
0 2 4 6 8 10 12 14 16 18 20 2224 26 28 30 32 34 36 38 40 42 44 46 48 50 52 54 56 58 60 62 64
Days
n
23
Figure 5. Observed remigration interval for Tortuguero leatherback turtles
0
10
20
30
40
50
60
70
80
90
1 2 3 4 5 6 7 8 9 10 11 12
Years
n
24
Figure 6. Leatherback nesting beaches surveyed by air 2001-2005 (Troëng et al. 2004).
Southern Caribbean/Guianas Stock Guianas Overview The leatherback stock of the Guianas is defined as that which nests on the shores of Guyana, Suriname, and French Guiana, in northern South America. This encompasses two zones of nesting activity, in northwestern Guyana and in the Maroni/Marowijne River mouth on the border between Suriname and French Guiana. The latter zone extends somewhat westward along the open Suriname coast and eastward along the French Guiana coast. This nesting population is thus separated geographically from the major nesting grounds in Trinidad, but exchange of individuals occurs with Trinidad. Possibly far more exchange occurs as individual hatchlings from one nesting beach mature and seek their own nest sites, but this cannot be demonstrated by available technology. Genetic distinction between the nesting areas is minor and is based entirely upon mtDNA haplotype frequencies rather than the presence/absence of nesting-area specific unique haplotypes. Further, the Trinidad and Guianas stocks appear to rise and fall in synchrony to some extent, indicating the somewhat tenuous nature of the stock distinction. Moreover, during recent decades there has been a increase in reported nesting populations from Suriname to Trinidad, possibly representing a westward shift of nesting females from the very large French Guiana population or improved monitoring of
25
nesting beaches resulting in more complete nesting surveys. This conclusion remains uncertain, and, although the French Guiana population has shifted from the open-sea coast of Silébache to the Les Hattes/Ya:Lima:Po nesting beach near the mouth of the Mana River, it has not undergone an overall diminution that would correspond to the increases further west. A distinctive feature of the Guianas nesting beaches is their shifting, even ephemeral, nature. This applies to all of the beaches except for those that are sheltered by a location within a river mouth (Galibi Nature Reserve, Ya:Lima:Po), or protected by rocky headlands where the Guyana Shield comes near the coast in extreme eastern French Guiana (Montjoly Beach and others on the Île de Cayenne). In Suriname, the cycle of beach erosion and accretion is thought to have a temporal amplitude of about 35 years (Augustinus, 1978). Although it has not been formally studied in Guyana, the overall synchrony appears similar. Another distinctive feature of this zone is the extremely heavy silt load carried by the coastal waters. This derives from the rocks of the ancient Guyana Shield and from the Amazon itself, the products of erosion being brought to the sea by the many large rivers in this high rainfall area. The silt phenomenon may carry certain advantages for leatherback nesting and recruitment in that it makes not only for high opacity, possibly facilitating successful escape of hatchlings, but also offers a “soft landing” for leatherbacks arriving from pelagic waters. The turtles may sometimes be stranded on low-tide mud banks, but this offers temporary inconvenience only (Goverse and Hilterman 2003), whereas impact with rocks or coral reefs can do a leatherback serious harm. Scientific study of the marine turtles of the Guianas is relatively recent, having been initiated in Guyana in 1964 and French Guiana in 1968 by Pritchard, and by Schulz in Suriname in 1964. Before that time, the scientific literature includes virtually no mention of leatherbacks in the Guianas, although Schulz (1964) does draw attention to late 19th century utilization of green turtles in Suriname, and early colonial maps have an indication of “Schildpad Baie” on the open Suriname coast. Biet (1664) does mention huge seven-sided turtles in French Guiana in 1652. Pritchard (2004) has documented the changes in the Guianas nesting population of all marine turtle species during the recent 35-year cycle. Leatherback nesting has increased greatly throughout the region (except on the open-sea coast of French Guiana). It has become the most abundant instead of the least abundant marine turtle species in North-western Guyana. It has increased approximately tenfold on highly dynamic, open-sea beaches of Suriname, some of which emerged only in the late1990’s to early 2000’s, (originally Bigisanti, now Matapica, Samsambo, Kolukumbo, etc) and has, in the early 1970s, colonized the green turtle beaches of Galibi Nature Reserve (Babunsanti, Pruimenboom, etc). Meanwhile, olive ridleys have virtually abandoned Guyana and even Suriname, but are now laying several hundreds of nests on beaches east of Cayenne (Kwata pers. comm.) Within Guyana, nesting by small numbers (< 10) of leatherbacks occurred at “Shell Beach” (NW District) in the 1960s. However, with the loss by erosion of this large beach, other beaches were colonized, including Kamwatta Beach. Other beaches that have been used include Gwennie, Iron Punt, and Almond Beach. In recent years, the greatest number of nesting activities has been observed at Luri, Kamwatta, Almond, Annette, Peter’s, and Tiger Beaches.
26
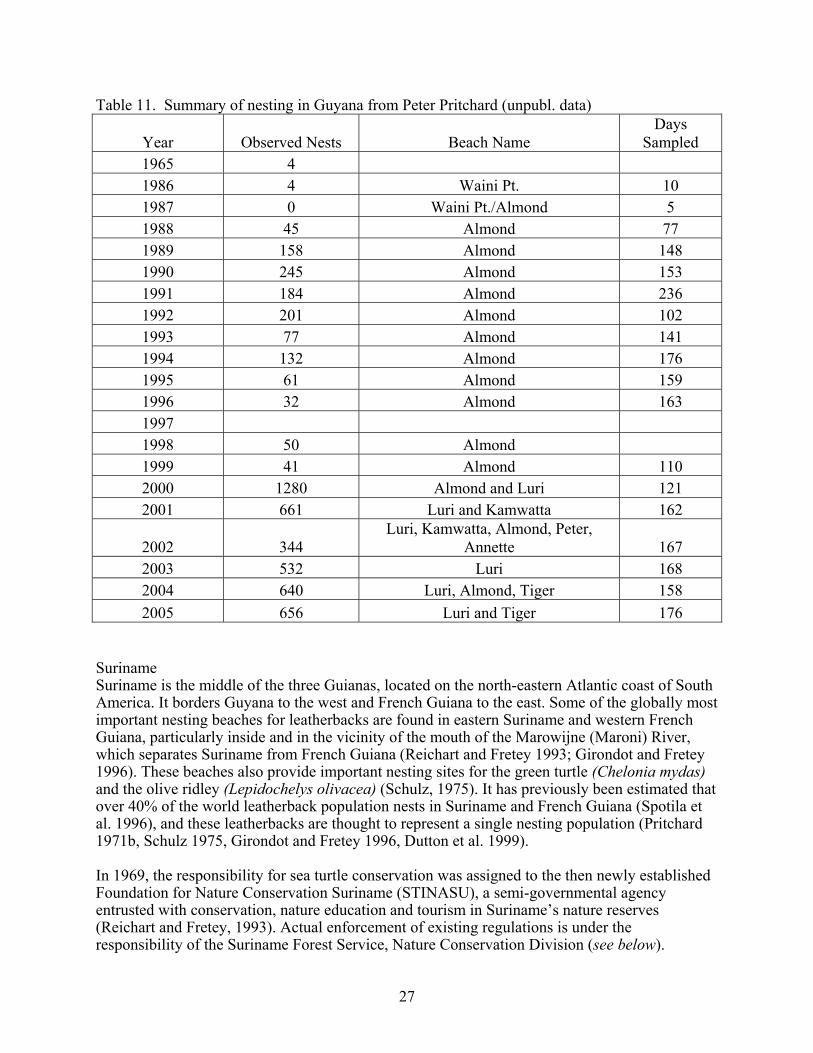
Guyana Leatherback nesting data collection started in Guyana around 1965 with very short visits to the northwestern beaches (Table 11). At that time it was a matter of following up rumors about the presence and hunting of turtles in the northwestern beaches, and not as a scientific exercise in itself. For the last two decades, however, the primary purpose of the scientific research on the beach has remained the same: conservation of nesting turtles and the prevention of their slaughter. In the 1980’s, negotiations were conducted with the turtle hunters to buy, tag and release turtles that had been captured for slaughter. The flipper tags became respected as a symbol of ownership, and rarely were those turtles killed by hunters when they found them subsequently. Presently, nesting data collection is influenced by the amount of beach that is actually available each nesting season. For example, Shell Beach had been one of the largest nesting beaches in early years, but was lost to erosion nearly 30 years ago. Geomorphological changes have altered the length of available nesting beach habitat and consequently the distance surveyed each year. An aerial survey is now flown early in the season to determine the location and amount of available nesting habitat and to count nests. Once the nesting beach locations have been established, conservation camps are built and remain at those locations for the duration of the season, which is usually 6 months (early March to late August). Improvements have been made in the data collection methods, as a result of learning what worked and what did not work over time. For each turtle encountered, data are recorded for the size of the turtle, status of external and PIT tags, nesting attempt outcome, weather, time and tide observations and whether or not the turtle has been observed previously. Although the data from Guyana may be less consistent than those from many other places because of the shifting beaches, accurate sighting records are available for individual turtles. Good estimates of nest counts are available for 1988 to 2005.
27
Table 11. Summary of nesting in Guyana from Peter Pritchard (unpubl. data)
Year Observed Nests Beach Name Days
Sampled 1965 4 1986 4 Waini Pt. 10 1987 0 Waini Pt./Almond 5 1988 45 Almond 77 1989 158 Almond 148 1990 245 Almond 153 1991 184 Almond 236 1992 201 Almond 102 1993 77 Almond 141 1994 132 Almond 176 1995 61 Almond 159 1996 32 Almond 163 1997 1998 50 Almond 1999 41 Almond 110 2000 1280 Almond and Luri 121 2001 661 Luri and Kamwatta 162
2002 344 Luri, Kamwatta, Almond, Peter,
Annette 167 2003 532 Luri 168 2004 640 Luri, Almond, Tiger 158 2005 656 Luri and Tiger 176
Suriname Suriname is the middle of the three Guianas, located on the north-eastern Atlantic coast of South America. It borders Guyana to the west and French Guiana to the east. Some of the globally most important nesting beaches for leatherbacks are found in eastern Suriname and western French Guiana, particularly inside and in the vicinity of the mouth of the Marowijne (Maroni) River, which separates Suriname from French Guiana (Reichart and Fretey 1993; Girondot and Fretey 1996). These beaches also provide important nesting sites for the green turtle (Chelonia mydas) and the olive ridley (Lepidochelys olivacea) (Schulz, 1975). It has previously been estimated that over 40% of the world leatherback population nests in Suriname and French Guiana (Spotila et al. 1996), and these leatherbacks are thought to represent a single nesting population (Pritchard 1971b, Schulz 1975, Girondot and Fretey 1996, Dutton et al. 1999). In 1969, the responsibility for sea turtle conservation was assigned to the then newly established Foundation for Nature Conservation Suriname (STINASU), a semi-governmental agency entrusted with conservation, nature education and tourism in Suriname’s nature reserves (Reichart and Fretey, 1993). Actual enforcement of existing regulations is under the responsibility of the Suriname Forest Service, Nature Conservation Division (see below).
28
Although monitoring of nest numbers of this rookery was initiated as early as the 1960s, first by Schulz and since 1969 by STINASU (Pritchard 1971b, Schulz 1975, Reichart and Fretey 1993) and some minor tagging studies were conducted in the late 1960s and early 1970s (Schulz 1975), as well as several nest ecological studies (e.g., Schulz 1975, Whitmore and Dutton 1985; Mrosovsky et al. 1984, Godfrey et al. 1996), nesting female population size and parameters had not been studied prior to the late 1990s. In 1999, a leatherback PIT tagging program was initiated under the WWF-Guianas regional marine turtle program, implemented until 2002 by the Biotopic Foundation and from 2002-2005 by the Netherlands Committee for International Union for the Conservation of Nature and Natural Resources (IUCN NL), in close collaboration with STINASU. Biometric data and data on nest survival, hatch success and sand temperatures were also collected and are available in the reports of Hilterman (2001), Hilterman and Goverse (2002, 2003, 2004, 2005, 2006) and Goverse et al. (2006). Nesting beaches The Surinamese coastline is highly dynamic and subject to successive phases of beach erosion and accretion, and is dominated by extensive mudflats. Nesting beaches are found mainly in the eastern part of the country (Schulz, 1975; Augustinus, 1978) (Figure 7 and Table 12). Total beach length is approximately 30-40 km but fluctuates over the years and beach topography strongly differs between the beaches (Hilterman et al. in press). In 1999-2005, when the PIT tagging studies were conducted, leatherbacks nested primarily at Babunsanti (Galibi Nature Reserve), Samsambo and Kolukumbo (dynamic beaches west of the Marowijne Estuary) and Matapica. Formerly, when the latter beach was located more to the east, it was first known as Bigisanti and subsequently as Krofajapasi (Reichart and Fretey, 1993). Because of its stability, importance for leatherback nesting and the presence of a permanent field station, Babunsanti is the only beach where PIT tagging patrols were conducted in each consecutive nesting season in 1999-2005. Nest numbers Daily nest counts on most beaches in Suriname have been conducted by STINASU from 1969 to now. It is interesting to mention that Stedman (1796) wrote that in Suriname ‘… the turtles are … generally distinguished by the names of calipee or green turtle, and carett’ (this latter name refers to olive ridley turtle) (Schulz 1971); he did not mention specifically the presence of leatherbacks. The annual count of leatherback nests has fluctuated significantly, but it increased from less than 300 in the late 1960s to over 11,000 nests in the 1980s (Reichart and Fretey, 1993), and in 2001 a total of 30,000 nests was estimated, based on nightly observations during PIT tagging patrols (Hilterman and Goverse 2002). In conducting early morning nest counts, STINASU field staff visually distinguished between “nests” and “false crawls”. Annual counting effort varies and not all beaches and beach sections are regularly surveyed. On moderate-density nesting beaches with a high, wide profile, such as Matapica, nest counts may be a good indicator of actual nesting activity (Hilterman and Goverse, 2002). On high- density nesting beaches, however, such as Kolukumbo and narrow shallow beaches such as Babunsanti, nest counts do not seem to be a very reliable way of determining nesting activity because crawls and nests may be covered up and obscured by subsequent nesters or by high tide (Girondot and Fretey, 1996; Hilterman and Goverse 2002). For example, in 2005 it was shown that nesting events counted at Babunsanti underestimated the actual number of nesting events observed during PIT tagging patrols (which were themselves incomplete) by 40%
29
(Hilterman and Goverse 2006). Therefore, it can be assumed that the historic nest count numbers, including the peaks of over 10,000 nests in the 1980’s and early 1990’s, also significantly underestimated the true number of nests - by at least a factor of 1.4. Taking this into account, the actual Suriname nest numbers may in fact have been more or less stable since the early 1980’s, instead of showing a steady increase. Additionally, no nest counts were conducted in the Galibi Nature Reserve (GNR) in 1990-1993 because, in those years, the reserve was occupied by armed rebellious Amerindians. Nest number estimates for the GNR in those years were made by Marc Girondot (Girondot et al. in press). Also, for the years 1994-2000, rough nest count data were corrected by M. Girondot but these may still be underestimates because some beaches or beach sections were not monitored at all. Nest numbers presented in (Table 13) are based on rough, uncorrected and often incomplete nest counts for most of the years. By combining the rough nest count data of STINASU with observed nesting events and observed missed nestings during the PIT tagging patrols Hilterman and Goverse attempted to derive more accurate estimates of leatherback nest numbers in the 2001-2005 nesting seasons. Gaps of several days were filled by using the average of three days before and three days after (Schulz, 1975). For beaches or sections that were not regularly monitored, but which represented suitable nesting areas, rough estimates were made based on occasional nest counts that were extrapolated to the whole season, taking into account the seasonal nesting pattern. Observed internesting period (OIP) data and the proportion of false crawls, as recorded by STINASU, were used to correct nest number estimates for false crawls. Hence, nest numbers until the late 1980s (mostly rough, often incomplete counts) cannot simply be compared to those of the late 1980’s – late 1990’s (estimates based on highly incomplete counts or on French Guiana nest numbers) and the period from late 1990’s until now (combination of nest counts on beaches where no tagging patrols were done with estimates based on nightly observations during PIT tagging patrols). Number of nesting females Since 1999, a total of 8,461 individual leatherback females have been identified nesting in Suriname. During 2001-2005 alone, the total was 7,936. As annual tagging effort and beach coverage varied but were incomplete in all of the years, the annual number of nesting females in Suriname is believed to be a minimum of 1,500 to 5,500. In any case, the PIT tagging data since 2001 – the first year with a comprehensive tagging program – have shown that earlier estimates of the annual female population size for Suriname of 600-2000 turtles (e.g., Spotila et al. 1996) are much too few and that exchange between beaches, at least on the time scale of the PIT tagging programme, is relatively infrequent (Hilterman and Goverse 2006). The decrease of the proportion of newly tagged turtles (from 89.9% to 40.5%) and the similar increase of remigrants (from 0% to 45.6%) in only a six year period, and the moderate frequency of intra- and interseasonal nesting exchange between beaches (Hilterman and Goverse 2007) suggest that, at least on the time scale of the PIT tagging programme, individual females tend to be relatively faithful to one side of the Marowijne Estuary. Approximately 6% of the total number of observed females in Fr Guiana/Suriname (combined) in 2001, and 5.4% in 2002, made an intra-seasonal shift between Surinamese and French
30
Guianese beaches (Rivalan 2003, Hilterman and Goverse 2003). For the years with relatively good PIT tagging patrols on 2 or 3 beaches with preliminary data indicated that at least 80% of females return to the beach within Suriname where they nested a previous year. The annual proportion of observed "non-Surinamese" leatherback females is stable (14-18% of all observed females). Turtles of this group must be a combination of within season and between-season exchanging females. Nesting frequency (intra-seasonal) For the years 2001-2005, average observed clutch frequency (OCF) ranged between 1.6 and 3.1 nests per female. The proportion of one-time observed nesters ranged between 46.4% and 66.7%. OCF was related to monitoring effort. Estimated clutch frequency (ECF) ranged between 4.1 and 4.9. The proportion of one-time observed nesters was significantly lower among the remigrant females (e.g., 40.1% in 2005) than among the newly tagged females (e.g., 63.3% in 2005) and non-Surinamese females (e.g., 77.7% in 2005) (Chi-square, x2=85.3, df=2, p<0.001). Mean ECF was significantly higher for the remigrants (e.g., 5.0 ± 2.2 nests in 2005) than for the new turtles (e.g., 4.2 ± 1.8 nests in 2005) and non-Surinamese turtles (e.g., 4.4 ± 1.8 nests in 2005) (Kruskal-Wallis, p=0.01). Remigration and nesting intervals The most common observed internesting period (OIP) for leatherback turtles at Suriname is nine days, average OIP ranges between 9.5 and 9.6 days. The most common observed remigration interval (with 78.8% of females) is two years, followed by three years (19.2% of turtles); 2.1% of females return in first year or after third year.
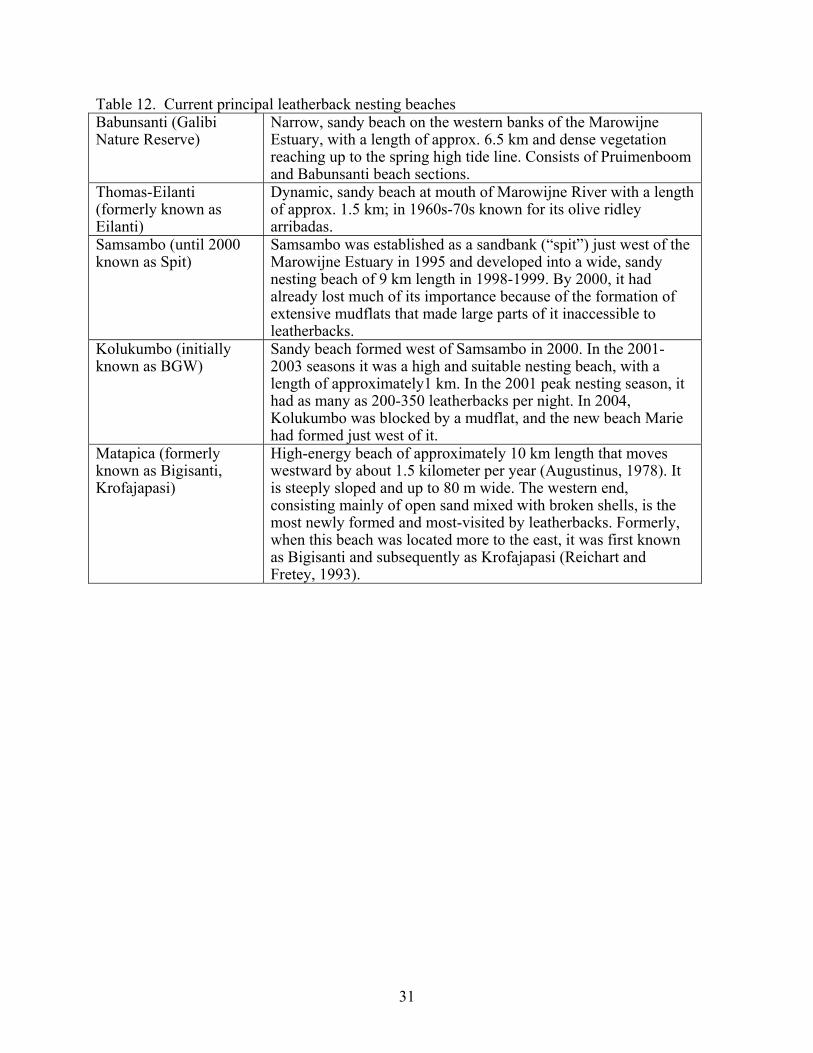
31
Table 12. Current principal leatherback nesting beaches Babunsanti (Galibi Nature Reserve)
Narrow, sandy beach on the western banks of the Marowijne Estuary, with a length of approx. 6.5 km and dense vegetation reaching up to the spring high tide line. Consists of Pruimenboom and Babunsanti beach sections.
Thomas-Eilanti (formerly known as Eilanti)
Dynamic, sandy beach at mouth of Marowijne River with a length of approx. 1.5 km; in 1960s-70s known for its olive ridley arribadas.
Samsambo (until 2000 known as Spit)
Samsambo was established as a sandbank (“spit”) just west of the Marowijne Estuary in 1995 and developed into a wide, sandy nesting beach of 9 km length in 1998-1999. By 2000, it had already lost much of its importance because of the formation of extensive mudflats that made large parts of it inaccessible to leatherbacks.
Kolukumbo (initially known as BGW)
Sandy beach formed west of Samsambo in 2000. In the 2001-2003 seasons it was a high and suitable nesting beach, with a length of approximately1 km. In the 2001 peak nesting season, it had as many as 200-350 leatherbacks per night. In 2004, Kolukumbo was blocked by a mudflat, and the new beach Marie had formed just west of it.
Matapica (formerly known as Bigisanti, Krofajapasi)
High-energy beach of approximately 10 km length that moves westward by about 1.5 kilometer per year (Augustinus, 1978). It is steeply sloped and up to 80 m wide. The western end, consisting mainly of open sand mixed with broken shells, is the most newly formed and most-visited by leatherbacks. Formerly, when this beach was located more to the east, it was first known as Bigisanti and subsequently as Krofajapasi (Reichart and Fretey, 1993).
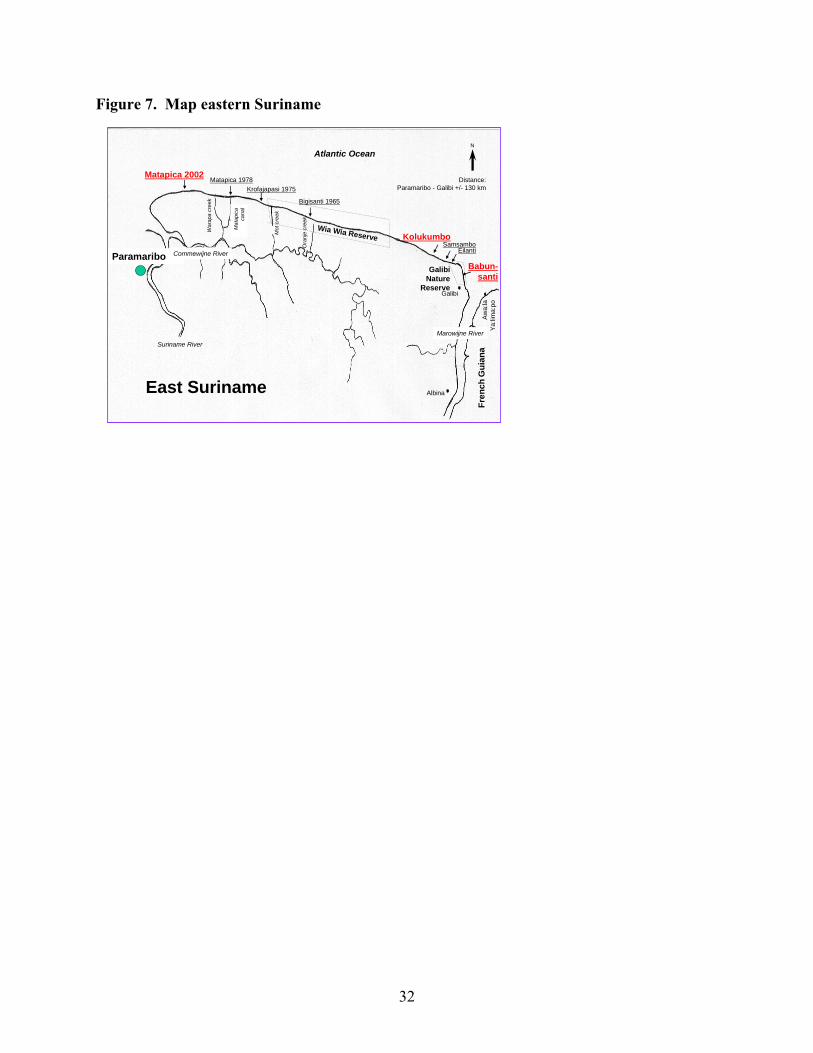
32
Figure 7. Map eastern Suriname
Paramaribo
Galibi
Fren
chG
uian
a
GalibiNature
Reserve
Wia Wia Reserve
Marowijne River
Suriname River
Commewijne River
Albina
Matapica 2002
Aw
a:la
Ya:li
ma:
po
Babun-santi
East Suriname
KolukumboSamsambo
Atlantic OceanN
Eilanti
Bigisanti 1965
Krofajapasi 1975Matapica 1978
Ora
nje
cree
k
Mat
apic
a ca
nal
War
apa
cree
k
Mot
cree
k
Distance:Paramaribo - Galibi +/- 130 km
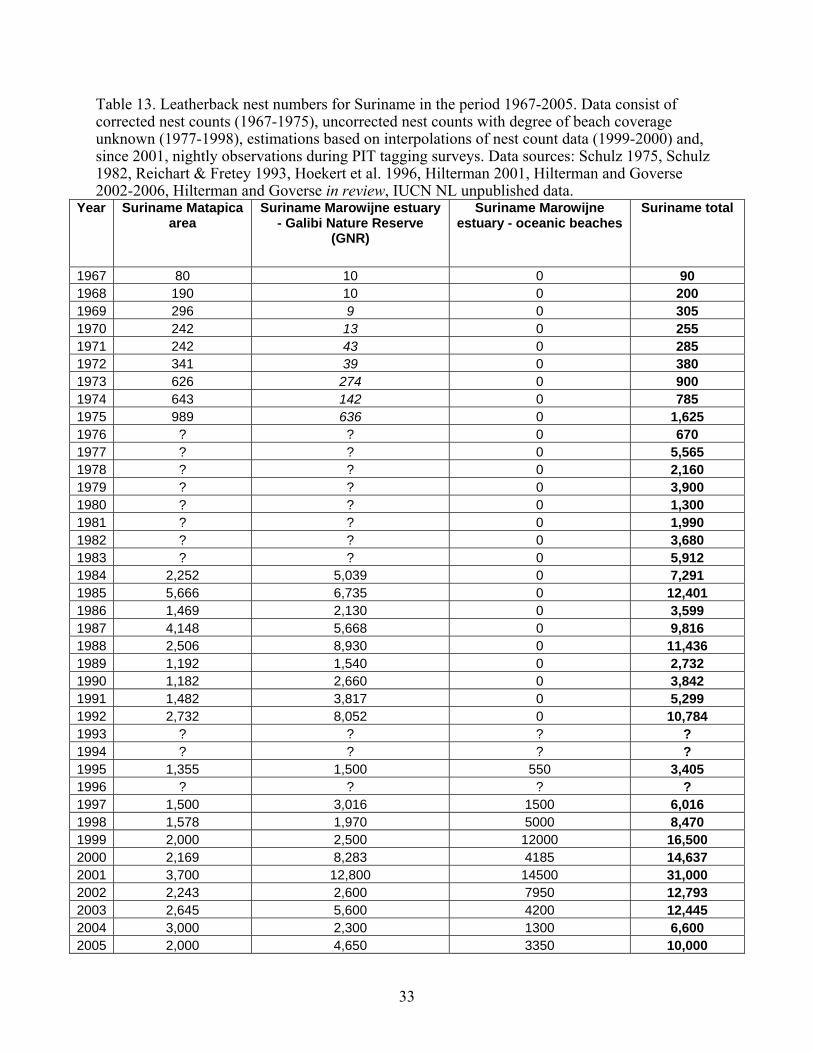
33
Table 13. Leatherback nest numbers for Suriname in the period 1967-2005. Data consist of corrected nest counts (1967-1975), uncorrected nest counts with degree of beach coverage unknown (1977-1998), estimations based on interpolations of nest count data (1999-2000) and, since 2001, nightly observations during PIT tagging surveys. Data sources: Schulz 1975, Schulz 1982, Reichart & Fretey 1993, Hoekert et al. 1996, Hilterman 2001, Hilterman and Goverse 2002-2006, Hilterman and Goverse in review, IUCN NL unpublished data.
Year Suriname Matapica area
Suriname Marowijne estuary - Galibi Nature Reserve
(GNR)
Suriname Marowijne estuary - oceanic beaches
Suriname total
1967 80 10 0 90 1968 190 10 0 200 1969 296 9 0 305 1970 242 13 0 255 1971 242 43 0 285 1972 341 39 0 380 1973 626 274 0 900 1974 643 142 0 785 1975 989 636 0 1,625 1976 ? ? 0 670 1977 ? ? 0 5,565 1978 ? ? 0 2,160 1979 ? ? 0 3,900 1980 ? ? 0 1,300 1981 ? ? 0 1,990 1982 ? ? 0 3,680 1983 ? ? 0 5,912 1984 2,252 5,039 0 7,291 1985 5,666 6,735 0 12,401 1986 1,469 2,130 0 3,599 1987 4,148 5,668 0 9,816 1988 2,506 8,930 0 11,436 1989 1,192 1,540 0 2,732 1990 1,182 2,660 0 3,842 1991 1,482 3,817 0 5,299 1992 2,732 8,052 0 10,784 1993 ? ? ? ? 1994 ? ? ? ? 1995 1,355 1,500 550 3,405 1996 ? ? ? ? 1997 1,500 3,016 1500 6,016 1998 1,578 1,970 5000 8,470 1999 2,000 2,500 12000 16,500 2000 2,169 8,283 4185 14,637 2001 3,700 12,800 14500 31,000 2002 2,243 2,600 7950 12,793 2003 2,645 5,600 4200 12,445 2004 3,000 2,300 1300 6,600 2005 2,000 4,650 3350 10,000
34
French Guiana Historical data Despite observations and reports of large numbers of leatherbacks in French Guiana and Suriname over the past 30 years, leatherbacks are mentioned infrequently in literature published before 1950. Many historical authors have described the marine fauna of French Guiana but leatherbacks appeared for the first time in discussions of the region only in 1664 (Biet 1664). The next description of this turtle species was by Goupy des Marets in 1675 (Goupy des Marets 1675 - 1676, 1687 - 1690) who probably copied Biet’s descriptions. Another 50 years passed before they were reported again by Barrère (1741). In 1774, leatherbacks are described as being seen near the Kourou River estuary in French Guiana in a document that codified the regulation of marine turtles fishing activity (Anonymous 1774). The next historical document available with information about leatherbacks in the Maroni/Marowijne River region was published by Kappler (1881), nearly 100 years later. The 1941 and 1945 fisheries reports of Diemont and Geijskes (Schulz 1971) contained a number of observations on leatherback sea turtles nesting in Suriname. Finally, the main nesting beaches were “discovered” in the late 1960s, and population surveys have been conducted on these beaches since then (Pritchard 1969, Schulz 1971). From 1967, work in this region has concentrated on counting nests (since 2001 combined with counting females on the beach) in Suriname and counting nests and female leatherbacks on the beach in French Guiana and numerous reports or publications deal with these data. Some data have not been published elsewhere than this report, provided by Kulalasi, the Amana Nature Reserve, Sépanguy, Kwata, WWF, ONCFS, Diren, under the “convention de gestion de la base de données Tortues Marines de Guyane” agreement. Data used in this report could be slightly different from the values used in previous reports (Chevalier and Girondot 2000, Girondot et al. In press) due to the improvement in our knowledge of the dynamics of nesting in this region. Nesting activity of leatherbacks in French Guiana is located in 4 different regions. West French Guiana The Amana Nature Reserve encompasses 40 km of coastline, with many nesting beaches of variable importance. Such beaches are traditionally split into 2 categories, depending on their location towards the Maroni/Marowijne Estuary: the estuarine beaches, and the oceanic beaches. However, such distinction is subjective, and does not follow clear boundaries. Within Maroni-Mana estuary Name of the beach Synonymous and name of sections Ya:lima:po beach Yalimapo, Ya:lima:po, Awala-Yalimapo or Les
Hattes with beach sections called Vigie, Bois tombé, Chimili or Simili or Si:mi:li, Awala or Awa:la
Pointe Kawana Pointe Isère
35
West French Guiana Oceanic beaches Name of the beach Synonymous and name of sections Pointe-Isère Pointe-Isère, Apo:tïlï, Pointe Kawana, Pointe
Panama Farez Aztec Felix Irakompapy Iracompapy, Irak, Ilako Papon’bo Ilets bâches Siletbâches, Organabo Malmanoury Kourou nesting beach Name of the beach Synonymous and name of sections Kourou CSG
Beach sections are named from East to West: les Roches, Pim poum, la Cocoteraie, les 205, le village amérindien, le quartier de l'Anse et la piste de l'Anse. Karouabo
Cayenne region nesting beaches Beach sections are named from East to West: Name of the beach Synonymous and name of sections Mahury Ma Gosselin Go Apcat AP1 AP2 AP3 Montjoly MO1, MO2,MO3,MO4,MO5 Zéphyr Ze Macouria Pointe Liberté PL Data available for French Guiana For 20 years (1979 -1999), monitoring of nesting leatherback turtles has been centered on one nesting site, Awala-Yalimapo. Although this beach may have represented the main nesting place for leatherbacks over this period of time, uncertainty remains on numbers of non-recorded nesting events that have most likely occurred on other coastal areas. The majority of all the potential nesting beaches have only been monitored since 2002. Since 1979 in Awala-Yalimapo, nest counts have been performed during night patrols (4 h or 6 h) or using morning nest counts. Night patrols were used in Yalimapo when more than 40 nests per night per km were attained. At the beginning and the end of the nesting season, when the number of nesting activities is low, morning nest counts were used. From 1989 to 2001, one nest count per 6 days was performed. For Yalimapo, when night patrols count nests, the time period was calculated to encompass the highest number of nests: Beginning 1 hour before high tide if high tide is in the evening, centered around high tide when high tide is in the middle of the night, or beginning 3 hours before high tide if high tide is in the morning.
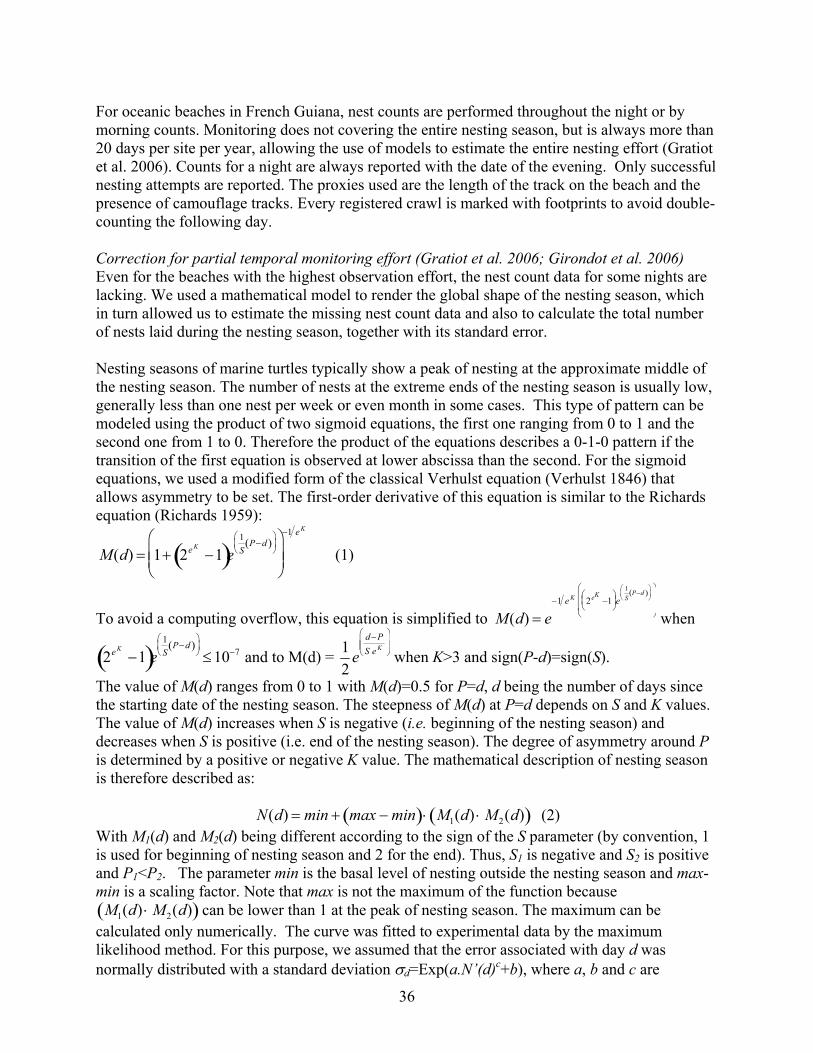
36
For oceanic beaches in French Guiana, nest counts are performed throughout the night or by morning counts. Monitoring does not covering the entire nesting season, but is always more than 20 days per site per year, allowing the use of models to estimate the entire nesting effort (Gratiot et al. 2006). Counts for a night are always reported with the date of the evening. Only successful nesting attempts are reported. The proxies used are the length of the track on the beach and the presence of camouflage tracks. Every registered crawl is marked with footprints to avoid double-counting the following day. Correction for partial temporal monitoring effort (Gratiot et al. 2006; Girondot et al. 2006) Even for the beaches with the highest observation effort, the nest count data for some nights are lacking. We used a mathematical model to render the global shape of the nesting season, which in turn allowed us to estimate the missing nest count data and also to calculate the total number of nests laid during the nesting season, together with its standard error. Nesting seasons of marine turtles typically show a peak of nesting at the approximate middle of the nesting season. The number of nests at the extreme ends of the nesting season is usually low, generally less than one nest per week or even month in some cases. This type of pattern can be modeled using the product of two sigmoid equations, the first one ranging from 0 to 1 and the second one from 1 to 0. Therefore the product of the equations describes a 0-1-0 pattern if the transition of the first equation is observed at lower abscissa than the second. For the sigmoid equations, we used a modified form of the classical Verhulst equation (Verhulst 1846) that allows asymmetry to be set. The first-order derivative of this equation is similar to the Richards equation (Richards 1959):
M(d) = 1+ 2e K
−1( )e1S
P−d( )⎛ ⎝ ⎜
⎞ ⎠ ⎟ ⎛
⎝ ⎜ ⎜
⎞
⎠ ⎟ ⎟
−1 e K
(1)
To avoid a computing overflow, this equation is simplified to M(d) = e−1 e K 2eK
−1⎛ ⎝ ⎜
⎞ ⎠ ⎟ e
1S
P−d( )⎛ ⎝ ⎜
⎞ ⎠ ⎟
⎛
⎝
⎜ ⎜
⎞
⎠
⎟ ⎟ when
2e K
−1( )e1S
P−d( )⎛ ⎝ ⎜
⎞ ⎠ ⎟ ≤10−7 and to M(d) = 1
2e
d −PS e K
⎛
⎝ ⎜ ⎜
⎞
⎠ ⎟ ⎟ when K>3 and sign(P-d)=sign(S).
The value of M(d) ranges from 0 to 1 with M(d)=0.5 for P=d, d being the number of days since the starting date of the nesting season. The steepness of M(d) at P=d depends on S and K values. The value of M(d) increases when S is negative (i.e. beginning of the nesting season) and decreases when S is positive (i.e. end of the nesting season). The degree of asymmetry around P is determined by a positive or negative K value. The mathematical description of nesting season is therefore described as:
N(d) = min + max − min( )⋅ M1(d) ⋅ M2(d)( ) (2) With M1(d) and M2(d) being different according to the sign of the S parameter (by convention, 1 is used for beginning of nesting season and 2 for the end). Thus, S1 is negative and S2 is positive and P1<P2. The parameter min is the basal level of nesting outside the nesting season and max-min is a scaling factor. Note that max is not the maximum of the function because
M1(d) ⋅ M2(d)( ) can be lower than 1 at the peak of nesting season. The maximum can be calculated only numerically. The curve was fitted to experimental data by the maximum likelihood method. For this purpose, we assumed that the error associated with day d was normally distributed with a standard deviation σd=Exp(a.N’(d)c+b), where a, b and c are
37
parameters that were also fitted. This function has the advantage of being strictly positive and monotonically increasing according to N’(d) for positive values of a and c. It also takes into account the observed heteroscedasticity, i.e. counts that are more dispersed at the peak of nesting season. Correction for spatial sampling effort (Girondot et al. In press) Some early reports lack a clear description of the sampling method used to collect the data, the exact temporal window (both in terms of hours and dates the beaches were patrolled), and/or the extent of the sampled area. Therefore, the quality of data varies greatly according to the site and the year. An initial attempt to analyze trends in this region revealed a strong correlation between the number of nests observed on beaches in French Guiana and those observed in Suriname, near the Maroni/Marowijne Estuary (Chevalier and Girondot 2000). It also demonstrated a temporal tendency for a higher proportion of nests laid in eastern Suriname, as compared to central Suriname (Chevalier and Girondot 2000). This tendency has been supported also by using more powerful statistical tools and extending the analysis to all the principal nesting sites in French Guiana and Suriname. A least-squares criterion between the angular transformations of the logistic model and the proportion of nests at eastern Suriname relative to the total nest number in Suriname has been used. Similarly, the relationship between nest counts in Yalimapo and eastern Suriname has been enhanced using the most recent years, as previously described in Chevalier and Girondot (2000). However, whereas this relationship was still observed using GLM modeling, the three most recent points were clearly outliers based on Tukey’s biweight test (Press et al. 1992). Therefore, the strong relationship between Yalimapo and eastern Suriname was not observed for the data from the most recent years and the fitted equation (nests at Yalimapo=5.69 nests at Babunsanti) could not be used after 1999. This recent change in the relationship is probably related to the development of new large areas of nesting habitat at the western edge of this region (Kolukumbo and Samsambo beaches) or changes in the sampling effort in this region. The determination coefficient, r2, multiplied by the confidence of the reference count was then used as an index of confidence for the estimates generated from this relationship. For oceanic beaches, there is a lack of formal historical information. Partial information is available in various published or unpublished reports (Pritchard 1969, 1971a,b, 1973b) and these beaches have been visited each year since 1985. However, the available information is not extensive enough to precisely establish the nest numbers for each entire nesting season. Instead, using available information, we constructed the most plausible temporal series on these beaches but assigned a confidence index of 0. Monitoring has been implemented annually in this region since 2002. Nesting values since then are much more accurate, after having been corrected (Gratiot et al, 2006). A similar situation exists for beaches in the Cayenne region. Whereas nesting occurred in this region before 1984, all sandy beaches in the region disappeared from 1985 until 1988 when new beach re-appeared in eastern French Guiana. At that time, nests were regularly reported to field workers west of French Guiana as well as in Kourou. Nesting activity has been actively recorded from 1999 in eastern French Guiana. However, only partial nest counts have been conducted and the confidence indices from these estimates were coded as 0.5. In 2002, nightly nest counts were available for all principal nesting beaches of French Guiana and Suriname (De Dijn, pers. comm.), except for Galibi Nature Reserve where data were partly based on nightly observations of PIT-tagged females on the beaches (Hilterman and Goverse 2003). Using these data it has been possible to correct for partial information on all the beaches (Table 14).
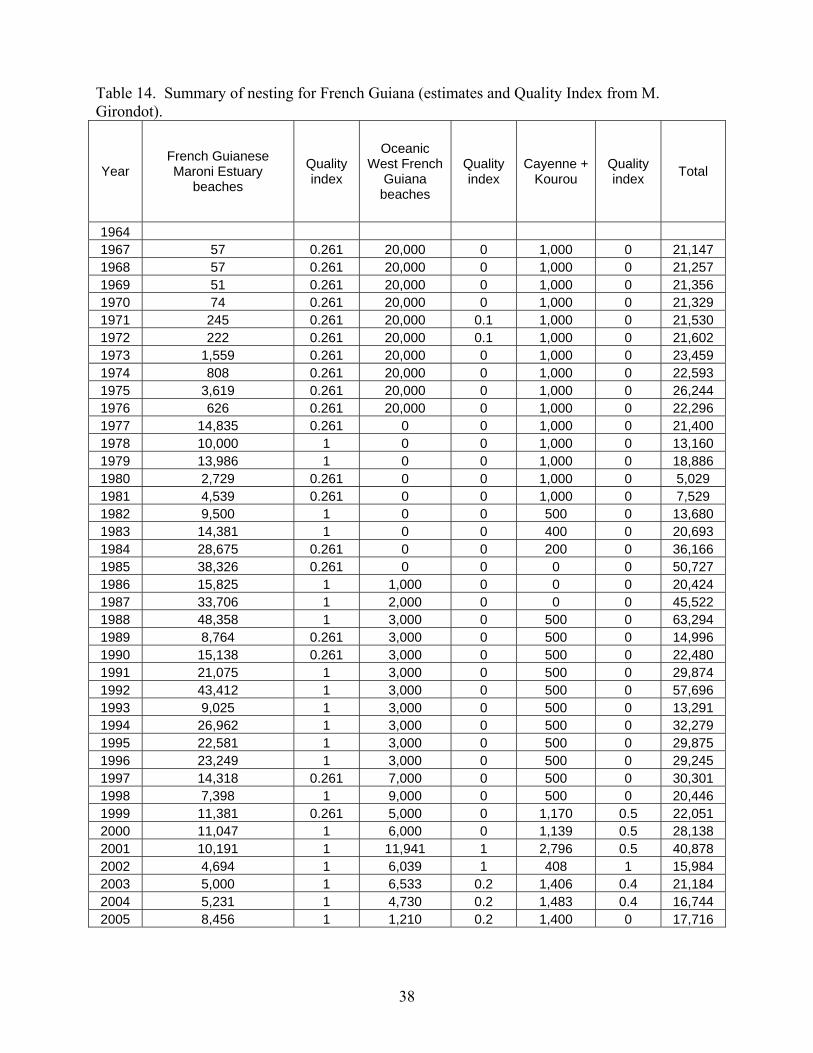
38
Table 14. Summary of nesting for French Guiana (estimates and Quality Index from M. Girondot).
Year French Guianese Maroni Estuary
beaches
Quality index
Oceanic West French
Guiana beaches
Quality index
Cayenne + Kourou
Quality index Total
1964 1967 57 0.261 20,000 0 1,000 0 21,147 1968 57 0.261 20,000 0 1,000 0 21,257 1969 51 0.261 20,000 0 1,000 0 21,356 1970 74 0.261 20,000 0 1,000 0 21,329 1971 245 0.261 20,000 0.1 1,000 0 21,530 1972 222 0.261 20,000 0.1 1,000 0 21,602 1973 1,559 0.261 20,000 0 1,000 0 23,459 1974 808 0.261 20,000 0 1,000 0 22,593 1975 3,619 0.261 20,000 0 1,000 0 26,244 1976 626 0.261 20,000 0 1,000 0 22,296 1977 14,835 0.261 0 0 1,000 0 21,400 1978 10,000 1 0 0 1,000 0 13,160 1979 13,986 1 0 0 1,000 0 18,886 1980 2,729 0.261 0 0 1,000 0 5,029 1981 4,539 0.261 0 0 1,000 0 7,529 1982 9,500 1 0 0 500 0 13,680 1983 14,381 1 0 0 400 0 20,693 1984 28,675 0.261 0 0 200 0 36,166 1985 38,326 0.261 0 0 0 0 50,727 1986 15,825 1 1,000 0 0 0 20,424 1987 33,706 1 2,000 0 0 0 45,522 1988 48,358 1 3,000 0 500 0 63,294 1989 8,764 0.261 3,000 0 500 0 14,996 1990 15,138 0.261 3,000 0 500 0 22,480 1991 21,075 1 3,000 0 500 0 29,874 1992 43,412 1 3,000 0 500 0 57,696 1993 9,025 1 3,000 0 500 0 13,291 1994 26,962 1 3,000 0 500 0 32,279 1995 22,581 1 3,000 0 500 0 29,875 1996 23,249 1 3,000 0 500 0 29,245 1997 14,318 0.261 7,000 0 500 0 30,301 1998 7,398 1 9,000 0 500 0 20,446 1999 11,381 0.261 5,000 0 1,170 0.5 22,051 2000 11,047 1 6,000 0 1,139 0.5 28,138 2001 10,191 1 11,941 1 2,796 0.5 40,878 2002 4,694 1 6,039 1 408 1 15,984 2003 5,000 1 6,533 0.2 1,406 0.4 21,184 2004 5,231 1 4,730 0.2 1,483 0.4 16,744 2005 8,456 1 1,210 0.2 1,400 0 17,716
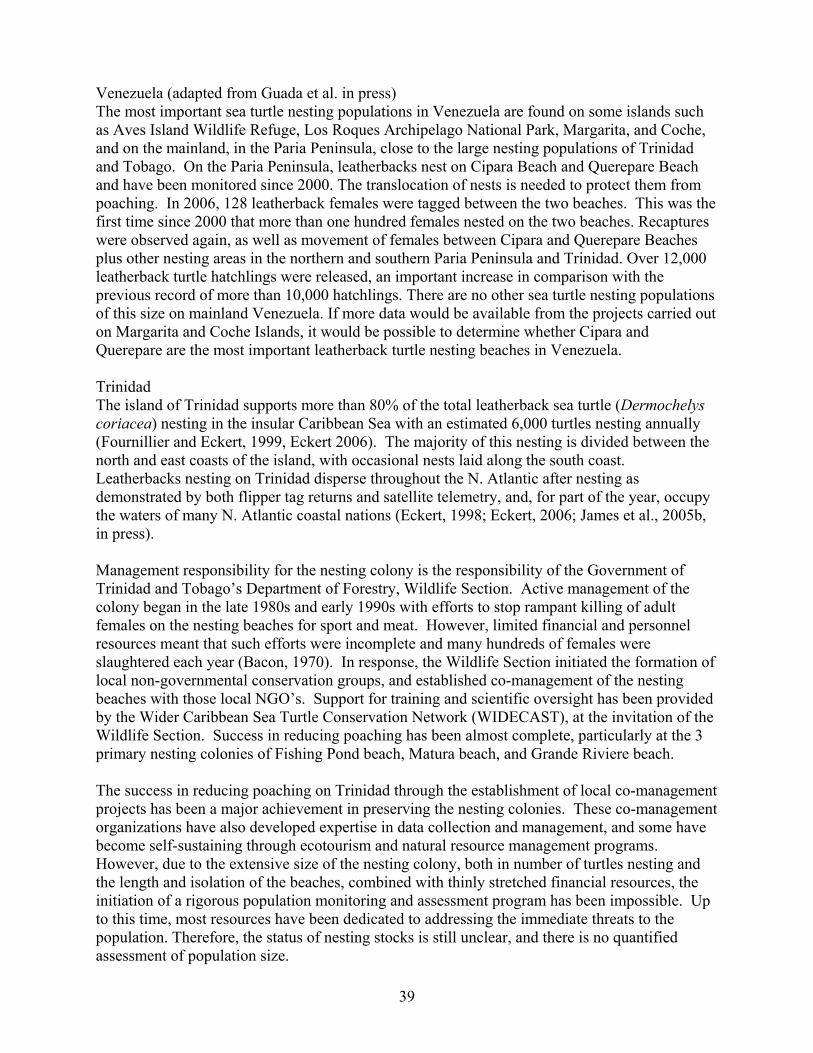
39
Venezuela (adapted from Guada et al. in press) The most important sea turtle nesting populations in Venezuela are found on some islands such as Aves Island Wildlife Refuge, Los Roques Archipelago National Park, Margarita, and Coche, and on the mainland, in the Paria Peninsula, close to the large nesting populations of Trinidad and Tobago. On the Paria Peninsula, leatherbacks nest on Cipara Beach and Querepare Beach and have been monitored since 2000. The translocation of nests is needed to protect them from poaching. In 2006, 128 leatherback females were tagged between the two beaches. This was the first time since 2000 that more than one hundred females nested on the two beaches. Recaptures were observed again, as well as movement of females between Cipara and Querepare Beaches plus other nesting areas in the northern and southern Paria Peninsula and Trinidad. Over 12,000 leatherback turtle hatchlings were released, an important increase in comparison with the previous record of more than 10,000 hatchlings. There are no other sea turtle nesting populations of this size on mainland Venezuela. If more data would be available from the projects carried out on Margarita and Coche Islands, it would be possible to determine whether Cipara and Querepare are the most important leatherback turtle nesting beaches in Venezuela. Trinidad The island of Trinidad supports more than 80% of the total leatherback sea turtle (Dermochelys coriacea) nesting in the insular Caribbean Sea with an estimated 6,000 turtles nesting annually (Fournillier and Eckert, 1999, Eckert 2006). The majority of this nesting is divided between the north and east coasts of the island, with occasional nests laid along the south coast. Leatherbacks nesting on Trinidad disperse throughout the N. Atlantic after nesting as demonstrated by both flipper tag returns and satellite telemetry, and, for part of the year, occupy the waters of many N. Atlantic coastal nations (Eckert, 1998; Eckert, 2006; James et al., 2005b, in press). Management responsibility for the nesting colony is the responsibility of the Government of Trinidad and Tobago’s Department of Forestry, Wildlife Section. Active management of the colony began in the late 1980s and early 1990s with efforts to stop rampant killing of adult females on the nesting beaches for sport and meat. However, limited financial and personnel resources meant that such efforts were incomplete and many hundreds of females were slaughtered each year (Bacon, 1970). In response, the Wildlife Section initiated the formation of local non-governmental conservation groups, and established co-management of the nesting beaches with those local NGO’s. Support for training and scientific oversight has been provided by the Wider Caribbean Sea Turtle Conservation Network (WIDECAST), at the invitation of the Wildlife Section. Success in reducing poaching has been almost complete, particularly at the 3 primary nesting colonies of Fishing Pond beach, Matura beach, and Grande Riviere beach. The success in reducing poaching on Trinidad through the establishment of local co-management projects has been a major achievement in preserving the nesting colonies. These co-management organizations have also developed expertise in data collection and management, and some have become self-sustaining through ecotourism and natural resource management programs. However, due to the extensive size of the nesting colony, both in number of turtles nesting and the length and isolation of the beaches, combined with thinly stretched financial resources, the initiation of a rigorous population monitoring and assessment program has been impossible. Up to this time, most resources have been dedicated to addressing the immediate threats to the population. Therefore, the status of nesting stocks is still unclear, and there is no quantified assessment of population size.
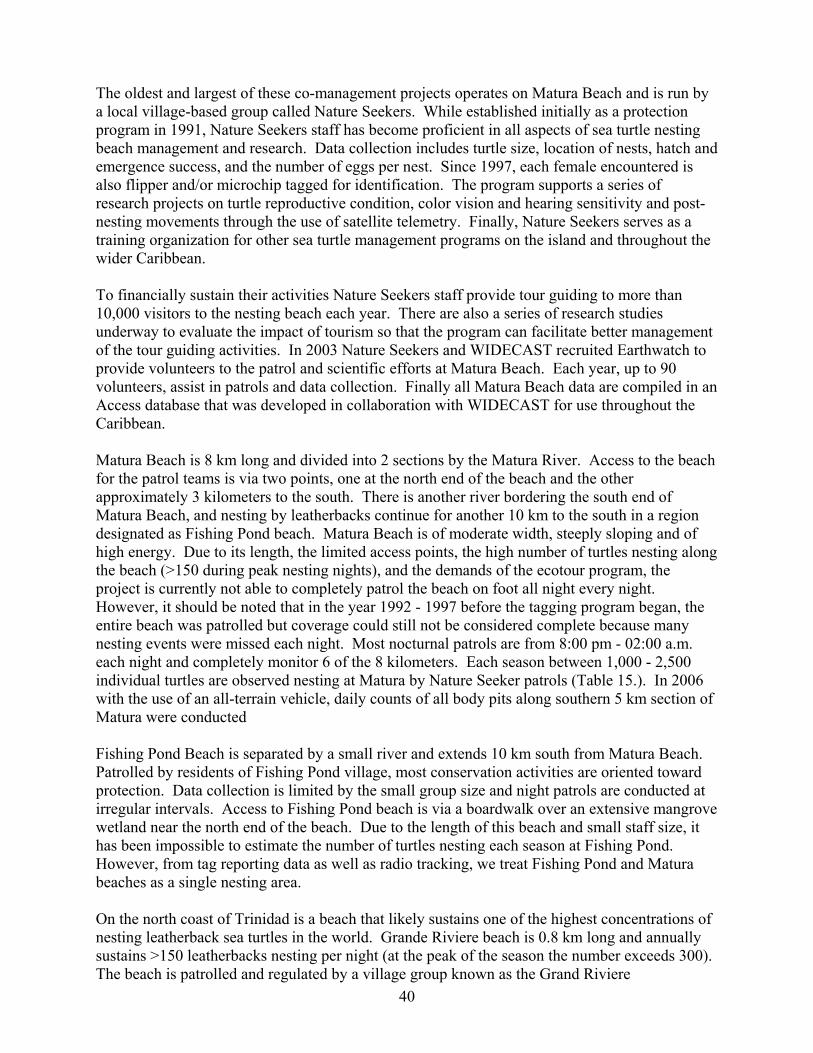
40
The oldest and largest of these co-management projects operates on Matura Beach and is run by a local village-based group called Nature Seekers. While established initially as a protection program in 1991, Nature Seekers staff has become proficient in all aspects of sea turtle nesting beach management and research. Data collection includes turtle size, location of nests, hatch and emergence success, and the number of eggs per nest. Since 1997, each female encountered is also flipper and/or microchip tagged for identification. The program supports a series of research projects on turtle reproductive condition, color vision and hearing sensitivity and post-nesting movements through the use of satellite telemetry. Finally, Nature Seekers serves as a training organization for other sea turtle management programs on the island and throughout the wider Caribbean. To financially sustain their activities Nature Seekers staff provide tour guiding to more than 10,000 visitors to the nesting beach each year. There are also a series of research studies underway to evaluate the impact of tourism so that the program can facilitate better management of the tour guiding activities. In 2003 Nature Seekers and WIDECAST recruited Earthwatch to provide volunteers to the patrol and scientific efforts at Matura Beach. Each year, up to 90 volunteers, assist in patrols and data collection. Finally all Matura Beach data are compiled in an Access database that was developed in collaboration with WIDECAST for use throughout the Caribbean. Matura Beach is 8 km long and divided into 2 sections by the Matura River. Access to the beach for the patrol teams is via two points, one at the north end of the beach and the other approximately 3 kilometers to the south. There is another river bordering the south end of Matura Beach, and nesting by leatherbacks continue for another 10 km to the south in a region designated as Fishing Pond beach. Matura Beach is of moderate width, steeply sloping and of high energy. Due to its length, the limited access points, the high number of turtles nesting along the beach (>150 during peak nesting nights), and the demands of the ecotour program, the project is currently not able to completely patrol the beach on foot all night every night. However, it should be noted that in the year 1992 - 1997 before the tagging program began, the entire beach was patrolled but coverage could still not be considered complete because many nesting events were missed each night. Most nocturnal patrols are from 8:00 pm - 02:00 a.m. each night and completely monitor 6 of the 8 kilometers. Each season between 1,000 - 2,500 individual turtles are observed nesting at Matura by Nature Seeker patrols (Table 15.). In 2006 with the use of an all-terrain vehicle, daily counts of all body pits along southern 5 km section of Matura were conducted Fishing Pond Beach is separated by a small river and extends 10 km south from Matura Beach. Patrolled by residents of Fishing Pond village, most conservation activities are oriented toward protection. Data collection is limited by the small group size and night patrols are conducted at irregular intervals. Access to Fishing Pond beach is via a boardwalk over an extensive mangrove wetland near the north end of the beach. Due to the length of this beach and small staff size, it has been impossible to estimate the number of turtles nesting each season at Fishing Pond. However, from tag reporting data as well as radio tracking, we treat Fishing Pond and Matura beaches as a single nesting area. On the north coast of Trinidad is a beach that likely sustains one of the highest concentrations of nesting leatherback sea turtles in the world. Grande Riviere beach is 0.8 km long and annually sustains >150 leatherbacks nesting per night (at the peak of the season the number exceeds 300). The beach is patrolled and regulated by a village group known as the Grand Riviere
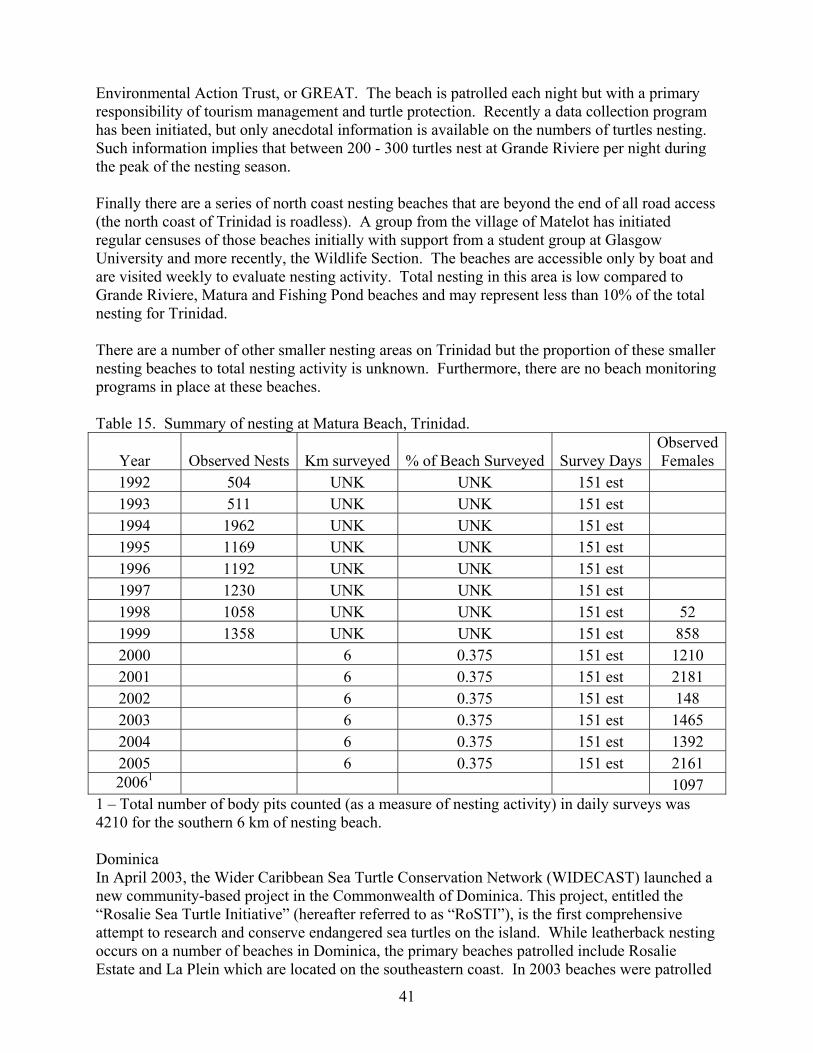
41
Environmental Action Trust, or GREAT. The beach is patrolled each night but with a primary responsibility of tourism management and turtle protection. Recently a data collection program has been initiated, but only anecdotal information is available on the numbers of turtles nesting. Such information implies that between 200 - 300 turtles nest at Grande Riviere per night during the peak of the nesting season. Finally there are a series of north coast nesting beaches that are beyond the end of all road access (the north coast of Trinidad is roadless). A group from the village of Matelot has initiated regular censuses of those beaches initially with support from a student group at Glasgow University and more recently, the Wildlife Section. The beaches are accessible only by boat and are visited weekly to evaluate nesting activity. Total nesting in this area is low compared to Grande Riviere, Matura and Fishing Pond beaches and may represent less than 10% of the total nesting for Trinidad. There are a number of other smaller nesting areas on Trinidad but the proportion of these smaller nesting beaches to total nesting activity is unknown. Furthermore, there are no beach monitoring programs in place at these beaches. Table 15. Summary of nesting at Matura Beach, Trinidad.
Year Observed Nests Km surveyed % of Beach Surveyed Survey Days Observed Females
1992 504 UNK UNK 151 est 1993 511 UNK UNK 151 est 1994 1962 UNK UNK 151 est 1995 1169 UNK UNK 151 est 1996 1192 UNK UNK 151 est 1997 1230 UNK UNK 151 est 1998 1058 UNK UNK 151 est 52 1999 1358 UNK UNK 151 est 858 2000 6 0.375 151 est 1210 2001 6 0.375 151 est 2181 2002 6 0.375 151 est 148 2003 6 0.375 151 est 1465 2004 6 0.375 151 est 1392 2005 6 0.375 151 est 2161 20061 1097
1 – Total number of body pits counted (as a measure of nesting activity) in daily surveys was 4210 for the southern 6 km of nesting beach. Dominica In April 2003, the Wider Caribbean Sea Turtle Conservation Network (WIDECAST) launched a new community-based project in the Commonwealth of Dominica. This project, entitled the “Rosalie Sea Turtle Initiative” (hereafter referred to as “RoSTI”), is the first comprehensive attempt to research and conserve endangered sea turtles on the island. While leatherback nesting occurs on a number of beaches in Dominica, the primary beaches patrolled include Rosalie Estate and La Plein which are located on the southeastern coast. In 2003 beaches were patrolled
42
from 22 April – 15 December, in 2004 from 1 March to 30 October and in 2005 from 17 March to 30 September. In 2003, 7 leatherbacks were encountered and tagged, 18 in 2004, and 12 in 2005. Miscellaneous Caribbean For many locations in the Caribbean there is no nest monitoring nor has there been sufficient genetic sampling to assign these islands to a particular stock. As such the information presented here are the summarized number of nesting females as estimated in WIDECAST reports and data summaries. Data were either not extensive enough to do trend analysis or there is no known leatherback nesting for the following locations: Anguilla, Antigua, Bahamas, Cayman Islands, Cuba, Dominican Republic, Haiti, Jamaica, Montserrat, Saba, St. Eustatius, St. Kitts and Nevis, St. Maarten, and the Turks and Caicos Islands (see Table 16).
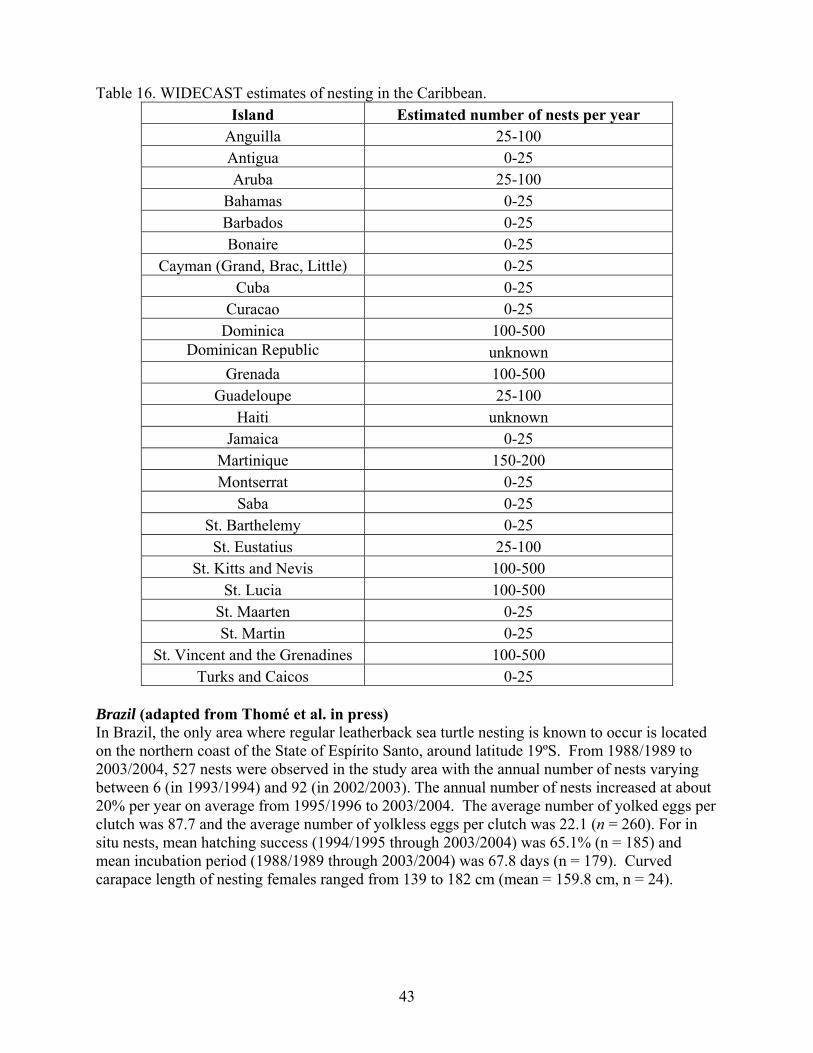
43
Table 16. WIDECAST estimates of nesting in the Caribbean. Island Estimated number of nests per year
Anguilla 25-100 Antigua 0-25 Aruba 25-100
Bahamas 0-25 Barbados 0-25 Bonaire 0-25
Cayman (Grand, Brac, Little) 0-25 Cuba 0-25
Curacao 0-25 Dominica 100-500
Dominican Republic unknown Grenada 100-500
Guadeloupe 25-100 Haiti unknown
Jamaica 0-25 Martinique 150-200 Montserrat 0-25
Saba 0-25 St. Barthelemy 0-25 St. Eustatius 25-100
St. Kitts and Nevis 100-500 St. Lucia 100-500
St. Maarten 0-25 St. Martin 0-25
St. Vincent and the Grenadines 100-500 Turks and Caicos 0-25
Brazil (adapted from Thomé et al. in press) In Brazil, the only area where regular leatherback sea turtle nesting is known to occur is located on the northern coast of the State of Espírito Santo, around latitude 19ºS. From 1988/1989 to 2003/2004, 527 nests were observed in the study area with the annual number of nests varying between 6 (in 1993/1994) and 92 (in 2002/2003). The annual number of nests increased at about 20% per year on average from 1995/1996 to 2003/2004. The average number of yolked eggs per clutch was 87.7 and the average number of yolkless eggs per clutch was 22.1 (n = 260). For in situ nests, mean hatching success (1994/1995 through 2003/2004) was 65.1% (n = 185) and mean incubation period (1988/1989 through 2003/2004) was 67.8 days (n = 179). Curved carapace length of nesting females ranged from 139 to 182 cm (mean = 159.8 cm, n = 24).
44
Atlantic Africa The Atlantic coast of Africa consists of 29 geopolitical units and extends over 14,000 km of coastline including the offshore island groups. Research and conservation initiatives are relatively young in this region and available data on leatherbacks tend to be largely descriptive or very recent making it difficult to identify the status and trends of the African leatherback populations. Moving north to south along the coast of Atlantic Africa, no nesting has been found in the Kingdom of Morocco (Tiwari et al.2001) and there are no records of nesting in Macaronesia in the literature. Nesting has been reported in Mauritania and Senegal (Maigret 1978, 1983; Dupuy 1986), but whether nesting is regular remains to be confirmed. Leatherbacks are rare in the Gambia and occasional nesting is yet to be determined (Barnett et al. 2004, Fretey et al. in review). Low nesting activities in Guinea-Bissau, on the island of Adonga in the Bijagos archipelago, were reported by Agardy (1993). In Guinea, leatherbacks are sometimes captured at sea, but nesting is yet to be documented (Fretey et al. in review). In Sierra Leone nesting occurs on Sherbro Island (Fretey and Malaussena, 1991). Liberia supports leatherback nesting although continued and more extensive monitoring is needed to determine the size of the population (M. Tiwari, pers. comm.). From Cote d’Ivoire, 218 nests were counted over 41 km of beach in February 2001 (Gomez 2005). Surveys in Ghana have recorded leatherback nests (Carr and Campbell 1995); it appears to be the second most common species to nest along the coast of Ghana and between August 1998 and April 2000, 319 leatherback nests were counted along a 14 km stretch, which lies within the core nesting area for sea turtles in Ghana (Amiteye 2000). Along the 177 km coastline of Togo and Benin, nesting activity is low and sporadic. Recently 30 nests were counted between August 2002 and January 2003 from five beaches in Togo (Segniagbeto, unpublished data). Surveys are needed in Nigeria, to identify potential nesting areas and there is low, but regular nesting in southern Cameroon. On a 15 km beach in Cameroon, the mean number of nests counted between the 1998/99 and 2000/01 seasons was 28 nests (SD = 5.8; range = 25-35, Angoni unpublished data). There is scattered nesting in Sao Tome and Principe, and on continental Equatorial Guinea (Fretey 2001). The waters of Sao Tome and Principe may be important developmental habitats because of the accidental capture of 4 juvenile leatherbacks (17 to 21 cm in carapace length) in March 1994 (Fretey et al., 1999). In the Gulf of Guinea, a large nesting population is found on the island of Bioko in Equatorial Guinea. The mean number of nests recorded on 5 nesting beaches monitored on this island between 2000/2001 and 2004/2005 was 3,896 (SD = 1461.5; range = 2,127-5,071; Rader et al. 2006). However, the most important nesting beaches for leatherbacks in the eastern Atlantic lies in the Gabon-Congo bio-geographical complex, which stretches for approximately 1,120 km. Gabon supports one of the largest leatherback nesting beaches in the world along with the Guianas; the number of females estimated to nest in Gabon is between 6,000 and 7,000. Based on estimates largely from Gabon and Equatorial Guinea a minimum of 30,000-35,000 nests per year are likely to be laid in Atlantic Africa (Fretey et al. in review). In the Republic of Congo, along 20 km of beach, 70 leatherback nests were counted between October and December during the 2003/2004 nesting season (Renatura Report 2003/2004 season) and at least 148 nests were recorded during the 2005/2006 nesting season (Renatura Report 2005/2006 season) . Recently, the first transatlantic movements from the eastern Atlantic to the western Atlantic were described. Four leatherbacks tagged on the nesting beaches of Gabon were recaptured in the waters of Argentina and Brazil (Billes et al. 2006).
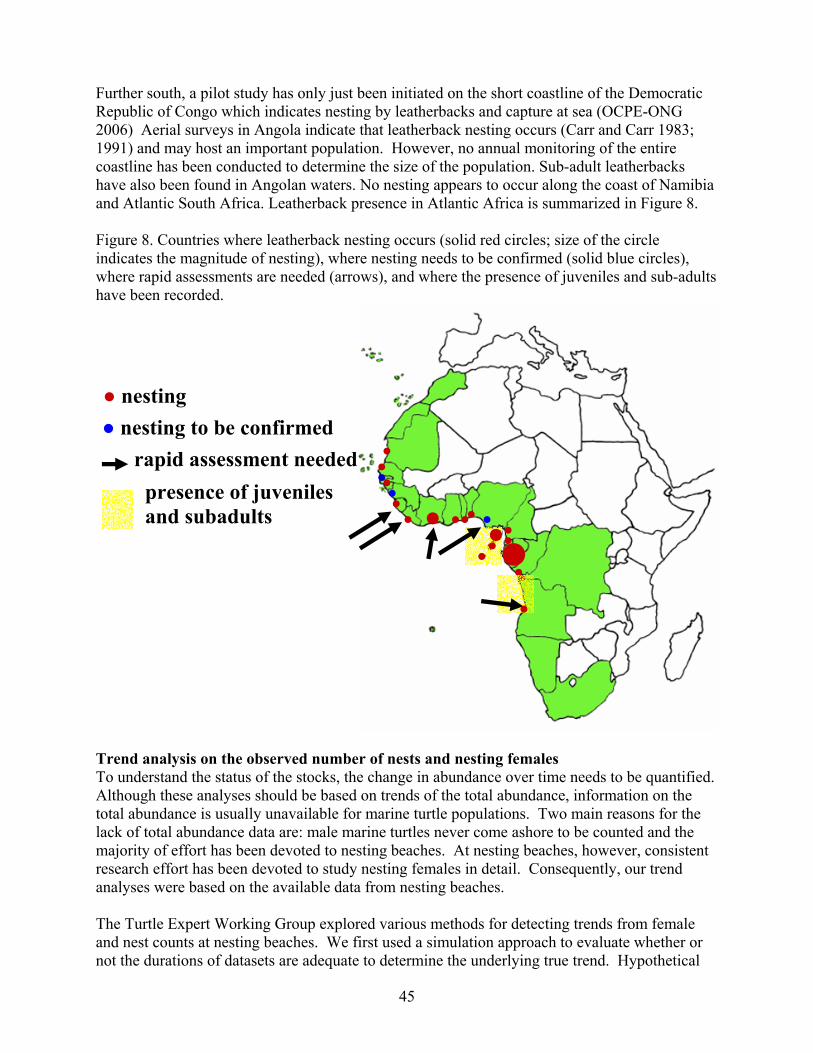
45
Further south, a pilot study has only just been initiated on the short coastline of the Democratic Republic of Congo which indicates nesting by leatherbacks and capture at sea (OCPE-ONG 2006) Aerial surveys in Angola indicate that leatherback nesting occurs (Carr and Carr 1983; 1991) and may host an important population. However, no annual monitoring of the entire coastline has been conducted to determine the size of the population. Sub-adult leatherbacks have also been found in Angolan waters. No nesting appears to occur along the coast of Namibia and Atlantic South Africa. Leatherback presence in Atlantic Africa is summarized in Figure 8. Figure 8. Countries where leatherback nesting occurs (solid red circles; size of the circle indicates the magnitude of nesting), where nesting needs to be confirmed (solid blue circles), where rapid assessments are needed (arrows), and where the presence of juveniles and sub-adults have been recorded.
Trend analysis on the observed number of nests and nesting females To understand the status of the stocks, the change in abundance over time needs to be quantified. Although these analyses should be based on trends of the total abundance, information on the total abundance is usually unavailable for marine turtle populations. Two main reasons for the lack of total abundance data are: male marine turtles never come ashore to be counted and the majority of effort has been devoted to nesting beaches. At nesting beaches, however, consistent research effort has been devoted to study nesting females in detail. Consequently, our trend analyses were based on the available data from nesting beaches. The Turtle Expert Working Group explored various methods for detecting trends from female and nest counts at nesting beaches. We first used a simulation approach to evaluate whether or not the durations of datasets are adequate to determine the underlying true trend. Hypothetical
● ●●
●
●
●
●●
●●●
●●
●
●●
●●
●●
●
● nesting ● nesting to be confirmed
presence of juvenilesand subadults
rapid assessment needed
●
●●●
46
populations were simulated using a stochastic model such that each population had a true underlying trend. Natural populations have a great deal of annual variability in the numbers of nesting females as a result of variable remigration intervals. Our simulated data reproduced this level of variability. We found that time series less than 10 years were not adequate for determining the true population growth rate. In many cases, the estimated trend for time intervals less than 10 years was the opposite of the true trend. Hence we have limited our analyses to time-series datasets that have received relatively consistent monitoring for a time interval of at least 10 consecutive years. Monitoring efforts and methods employed are described in the Stock Status section of this document. The time series data used in the trend analysis are considered to reflect relatively constant effort based on survey design documentation or discussion with the biologists working at each site. Six of the seven stocks identified in this report contained nesting beaches with adequate durations of monitoring. We used two approaches to determine the trend of each of these beaches; regression analyses and Bayesian modeling. The common assumption among these approaches was that the underlying female population can be sufficiently modeled by the geometric population growth model. Because no datasets indicated an obvious asymptote in the counts, we did not consider density dependence. The purpose of this trend analysis was to identify the most likely exponential rate, which can serve as an index of population status, and acknowledge that there may be other viable models which should be explored in the future to assess the trends. Regression analyses We used simple linear regression analyses to make inference on population trends of nesting stocks. In this approach, we used two methods: the natural log of the observed female or nest counts against time and the natural log of the observed growth rates (i.e., the ratio between two consecutive counts) against the square root of the duration in years between the two counts (Morris and Doak 2002). For the first method, the estimated slope represents the natural log of the geometric growth rate. To compute the 95% confidence interval around the estimate, we used Student’s t distribution with the T-2 degrees of freedom, where T is the number of data points in the time series. For the second approach, we first smoothed the data by using a 3 yr running sum to account for variable remigration intervals. The method outlined by Morris and Doak (2002; see also Dennis et al. 1991) assumes that each census captures all individuals, or at least a similar proportion of the individuals. This is not possible with nesting turtle data as adult females do not nest every year, hence we applied a running sum to the data. The regression line was forced to go through the origin because the instantaneous growth rate is, by definition, zero over the time duration of zero. In this method, population growth rate, r, is decomposed in to two terms, μ̂ and 2σ̂ such that
2/ˆˆ 2σμ +=r and re=λ .
The value of μ̂ is the slope of the regression line forced through zero and 100(1-α) % confidence intervals around μ̂ are approximated by a 2-tailed Student’s t distribution
))ˆ(ˆ( 1, μμ α SEt T −± ,
47
where T is the length of the time series after the running sum is applied and 2σ̂ is the error mean
square of the regression. The 100(1-α) % confidence intervals for 2σ̂ are approximated using a χ2 distribution with T-1 degrees of freedom (Morris and Doak 2002) )/ˆ)1(,/ˆ)1(( 2
1,122
1,2
−−− −− TT TT αα χσχσ . Bayesian statistical modeling We also used a Bayesian state-space modeling approach to estimate the annual growth rate of nesting females. We developed a Bayesian approach because the measure of uncertainty in a Bayesian approach is more transparent than results from the frequentist approach. In Bayesian statistics, uncertainty is measured in probability. Consequently, we can make such statements as ‘the parameter falls into an interval with 95% probability’ or ‘the average annual population growth rate is greater than 1 with probability y.’ The equivalent probability statements cannot be used for intervals obtained via frequentist statistics. The Bayesian probability statement, of course, is conditional on the data and the model. In the following, we describe assumptions, the model, and statistical approach. To construct a statistical model for nesting leatherback turtles in the Atlantic, we made the following assumptions: (1) The number of females or nests at each nesting beach is well below the carrying capacity so that there is no density dependence, (2) the observed number of females or nests annually is a random sample from the total stock, i.e., they are independent, (3) the observed number of females annually is a random sample from a uniform distribution between 0 and the total population size, (4) all nesting females are observed, and (5) each stock abundance follows the geometric population growth model. In other words, the upper bound for the observed number of females in each year is expressed by the discrete time geometric function: 0NN t
t λ= (1) In this simple model, we treat the initial population size N0 as another unknown parameter. The inference on the growth rate (λ) and N0 is made by fitting this model to the observed data. Consequences of violating the assumptions are discussed in Discussion. The mathematical details are shown in Appendix 1. The result of an analysis is summarized by a joint probability distribution of the unknown parameters. Inference on the parameters is made from the posterior distribution. To make inference on one parameter, other parameters are integrated out from the joint distribution. The resulting distribution is called the marginal distribution. We numerically obtained the marginal posterior distribution of λ for each dataset. For each analysis, two independent Markov chains of 155,000 steps were run. The first 5,000 steps were discarded as ‘burn-in’ samples. To avoid serial autocorrelations, a sample was retained every three steps of each chain. Consequently, 50,000 samples were retained for each chain. A total of 100,000 samples from the joint posterior distribution were used to make inference on the two parameters. Convergence of chains was tested by using R statistics of Gelman et al. (2003). Computations were conducted using Matbugs program in Matlab (Mahdaviani and Murphy 2006) and WinBugs software (Spiegelhalter et al. 2004). The code used to compute posterior distributions in WinBugs is shown in Appendix 2. We used the median of a marginal posterior distribution as the point estimate, whereas a 95% posterior probability interval (PI) is used to express the uncertainty around the point estimate (median).
48
To test the performance of the Bayesian state-space modeling, we analyzed simulated datasets with the three analytical methods and compared the outcomes. We also tested the effects of non-constant sampling on the analytical methods through simulated data. Simulation analyses indicated that the proposed method can provide precise estimates of population growth rates from count data, which are commonly obtained for a nesting beach study. Although the estimate of the initial population size is negatively biased, no directional bias was found for the population growth rate. Potential biases caused by temporal changes in sampling effort are discussed in Discussion. To test if the model was appropriate for the observed data, we simulated data from the joint posterior distribution. For each set of parameters, i.e., N0 and λ, we created a time series of simulated ‘observed’ data. From 100,000 simulated data, we computed 2.5 and 97.5 percentiles of the number of simulated females for each year. If the model was appropriate, the true observed number of females would likely fall into the 95 percent band. The majority of datasets were based on the number of nests rather than the number of females. The Turtle Expert Working Group decided to use the conversion factor of five, i.e., five nests per female on the average, to compute the number of females from the number of nests based on the expert opinion of the Group. This value should be updated as more data are collected in the field. For trend analyses, the conversion does not affect the outcome because it is a constant scaling factor. Results Estimated average annual population growth rates are presented in Table 17. Coefficient of determinations for log-transformed regression analyses ranged from 0.04 to 0.84. Because of the fluctuations in the number of nesters at any beach, the regression analysis was not expected to perform well. However, the visual inspection of raw data indicated that the log-linear model probably was appropriate. Results of the two regression methods were quite comparable (Table 17). Convergence of Markov chains for each dataset was confirmed by using the convergence statistics of Gelman et al. (2002), where all R̂ statistics were less than 1.02 (results not shown). The simulation analyses indicated that the geometric model was appropriate for the observed data (results not shown).
North Caribbean British Virgin Islands (BVI) Data for the number of nests from 1994 to 2004 were available for the trend analysis. The estimated annual growth rates were approximately 1.2 (Table 17), where the regression analysis provided more precise estimate than the Bayesian analysis. The probability that the population was growing was greater than 0.9. Puerto Rico Nest count data were available for Puerto Rico between 1984 and 2005. The estimated annual population growth rate was approximately 1.1 with estimated interval between 1.04 and 1.12. All analyses indicated the population was likely growing over the time series. US Virgin Islands (USVI) For US Virgin Islands, we used the number of observed females at Sandy Point, St Croix, from 1986 to 2004. All analyses indicated the average annual growth rate was approximately 1.10
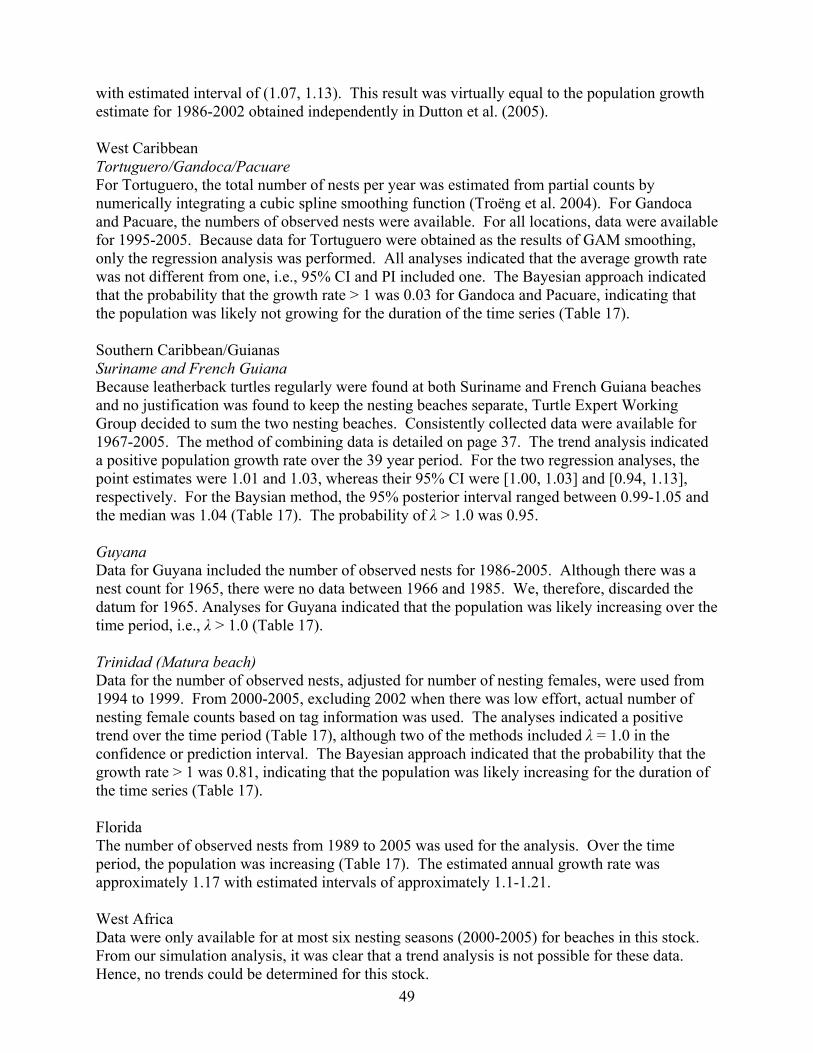
49
with estimated interval of (1.07, 1.13). This result was virtually equal to the population growth estimate for 1986-2002 obtained independently in Dutton et al. (2005). West Caribbean Tortuguero/Gandoca/Pacuare For Tortuguero, the total number of nests per year was estimated from partial counts by numerically integrating a cubic spline smoothing function (Troëng et al. 2004). For Gandoca and Pacuare, the numbers of observed nests were available. For all locations, data were available for 1995-2005. Because data for Tortuguero were obtained as the results of GAM smoothing, only the regression analysis was performed. All analyses indicated that the average growth rate was not different from one, i.e., 95% CI and PI included one. The Bayesian approach indicated that the probability that the growth rate > 1 was 0.03 for Gandoca and Pacuare, indicating that the population was likely not growing for the duration of the time series (Table 17). Southern Caribbean/Guianas Suriname and French Guiana Because leatherback turtles regularly were found at both Suriname and French Guiana beaches and no justification was found to keep the nesting beaches separate, Turtle Expert Working Group decided to sum the two nesting beaches. Consistently collected data were available for 1967-2005. The method of combining data is detailed on page 37. The trend analysis indicated a positive population growth rate over the 39 year period. For the two regression analyses, the point estimates were 1.01 and 1.03, whereas their 95% CI were [1.00, 1.03] and [0.94, 1.13], respectively. For the Baysian method, the 95% posterior interval ranged between 0.99-1.05 and the median was 1.04 (Table 17). The probability of λ > 1.0 was 0.95. Guyana Data for Guyana included the number of observed nests for 1986-2005. Although there was a nest count for 1965, there were no data between 1966 and 1985. We, therefore, discarded the datum for 1965. Analyses for Guyana indicated that the population was likely increasing over the time period, i.e., λ > 1.0 (Table 17). Trinidad (Matura beach) Data for the number of observed nests, adjusted for number of nesting females, were used from 1994 to 1999. From 2000-2005, excluding 2002 when there was low effort, actual number of nesting female counts based on tag information was used. The analyses indicated a positive trend over the time period (Table 17), although two of the methods included λ = 1.0 in the confidence or prediction interval. The Bayesian approach indicated that the probability that the growth rate > 1 was 0.81, indicating that the population was likely increasing for the duration of the time series (Table 17). Florida The number of observed nests from 1989 to 2005 was used for the analysis. Over the time period, the population was increasing (Table 17). The estimated annual growth rate was approximately 1.17 with estimated intervals of approximately 1.1-1.21. West Africa Data were only available for at most six nesting seasons (2000-2005) for beaches in this stock. From our simulation analysis, it was clear that a trend analysis is not possible for these data. Hence, no trends could be determined for this stock.
50
South Africa Data were available for 1963-1997. The estimated annual growth rate was 1.06 with the estimated intervals of approximately 1.02-1.04. The Bayesian method provided a similar result, where the median growth rate was 1.04 and the 95% posterior interval of [1.03, 1.05]. Brazil Data were available for 1988-2003. The estimated annual growth rate was 1.07 with the estimated 95% confidence interval of 1.02-1.14. The Bayesian modeling approach provided the median growth rate of 1.08 and the 95% posterior interval of 1.04-1.13. The probability of the population was growing during this time period was >0.99. Discussion Results of the trend analyses are contingent on the underlying assumptions and simplifications of the reality, i.e., modeling. Limitations of a model, therefore, need to be addressed when it is applied to any particular population. Our trend analyses were based on the geometric population model. Although the geometric model describes the general mechanism by which an animal population changes its size over time, the model ignores inter and intra annual variability in the demographic parameters. The growth rate is the only factor that affected the population growth in the model, where other factors that might affect the annual population growth rate, such as density dependence and age distribution, were not included. Further, the available datasets included only the adult female portion of each stock. Because the number of females was computed from the number of observed nests for some stocks, uncertainty in the number of nests per female was ignored. The total population growth rate of a stock, therefore, may be different from the one estimated in this analysis as we assumed that the proxy (i.e. number of nests) was a good indicator of total population. Change in sampling effort could have significant effects on estimated trends (see for example Kelle et al. 2007). Because there was no consistent measure of effort in any dataset, we did not attempt to include survey effort in our modeling exercise. Consequently, the analysis is based on an implicit assumption that the monitoring effort was constant over time. In reality, however, the beach monitoring effort can fluctuate from year to year. Through a simulation analysis (results not shown), we found that estimated growth rate can be biased in either direction if the monitoring effort changed over time. For future studies, therefore, beach monitoring effort should be recorded. The definition of stocks also would have affected the estimated population growth rate. In this analysis, the Turtle Expert Working Group defined seven stocks based on microsatellite allele frequencies at twelve loci and movement data via satellite telemetry. These data were collected from nesting beaches where long-term research was conducted. These sites were not selected randomly from the all available nesting beaches. The sampled sites, therefore, might not represent the specific stocks. There was evidence that leatherback turtles may move among beaches within a nesting season. Further, the site fidelity of leatherback turtles to their natal beaches might not be as strong as other marine turtle species. The observed genetic differences among the nesting beaches may become insignificant over time as the populations grow and individuals disperse over wide areas. The duration of each time series also affected the estimates. The effect of duration of time series on estimated parameters can be biological or statistical. The number of nesters at a nesting
51
beach oscillates naturally. Consequently, a short time series does not capture a long-term trend, which is more significant to the health of a natural population than a short-term trend. Statistical approaches used in this report were not designed to detect oscillation of a population. In summary, trends for six management units were estimated using three independent analytical methods. Except for Western Caribbean, these stocks appeared to be increasing over the time series. These estimated growth rates, although positive trends are quite apparent from the raw data, are contingent on underlying assumptions and models. However, it must be stressed that the monitoring effort was improved over the last decade into several management units (e.g. Costa-Rica/Panama, Guianas, West Africa, Trinidad). More detailed studies should be conducted to obtain the intrinsic rate of population increase for the species without relying on the approximation from nest counts from beach monitoring.
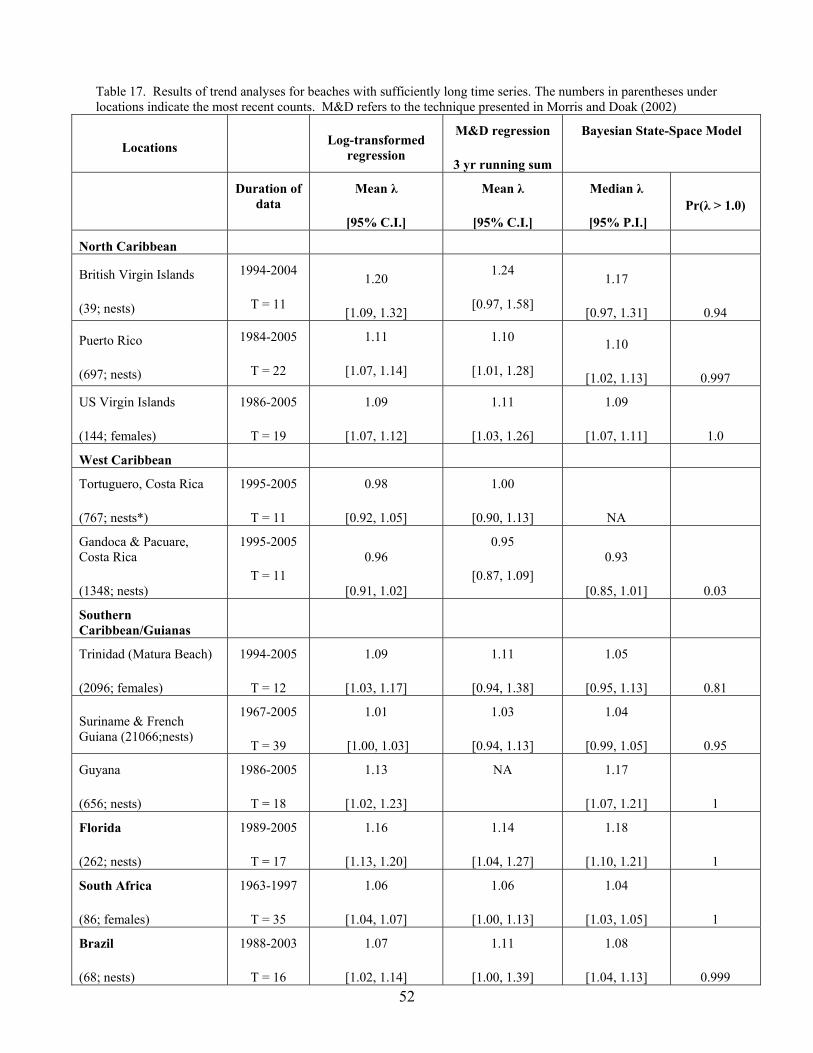
52
Table 17. Results of trend analyses for beaches with sufficiently long time series. The numbers in parentheses under locations indicate the most recent counts. M&D refers to the technique presented in Morris and Doak (2002)
Locations
Log-transformed regression
M&D regression
3 yr running sum
Bayesian State-Space Model
Duration of
data Mean λ
[95% C.I.]
Mean λ
[95% C.I.]
Median λ
[95% P.I.] Pr(λ > 1.0)
North Caribbean
British Virgin Islands
(39; nests)
1994-2004
T = 11
1.20
[1.09, 1.32]
1.24
[0.97, 1.58]
1.17
[0.97, 1.31] 0.94
Puerto Rico
(697; nests)
1984-2005
T = 22
1.11
[1.07, 1.14]
1.10
[1.01, 1.28]
1.10
[1.02, 1.13] 0.997
US Virgin Islands
(144; females)
1986-2005
T = 19
1.09
[1.07, 1.12]
1.11
[1.03, 1.26]
1.09
[1.07, 1.11] 1.0
West Caribbean
Tortuguero, Costa Rica
(767; nests*)
1995-2005
T = 11
0.98
[0.92, 1.05]
1.00
[0.90, 1.13] NA
Gandoca & Pacuare, Costa Rica
(1348; nests)
1995-2005
T = 11 0.96
[0.91, 1.02]
0.95
[0.87, 1.09] 0.93
[0.85, 1.01] 0.03
Southern Caribbean/Guianas
Trinidad (Matura Beach)
(2096; females)
1994-2005
T = 12
1.09
[1.03, 1.17]
1.11
[0.94, 1.38]
1.05
[0.95, 1.13] 0.81
Suriname & French Guiana (21066;nests)
1967-2005
T = 39
1.01
[1.00, 1.03]
1.03
[0.94, 1.13]
1.04
[0.99, 1.05] 0.95
Guyana
(656; nests)
1986-2005
T = 18
1.13
[1.02, 1.23]
NA 1.17
[1.07, 1.21] 1
Florida
(262; nests)
1989-2005
T = 17
1.16
[1.13, 1.20]
1.14
[1.04, 1.27]
1.18
[1.10, 1.21] 1
South Africa
(86; females)
1963-1997
T = 35
1.06
[1.04, 1.07]
1.06
[1.00, 1.13]
1.04
[1.03, 1.05] 1
Brazil
(68; nests)
1988-2003
T = 16
1.07
[1.02, 1.14]
1.11
[1.00, 1.39]
1.08
[1.04, 1.13] 0.999
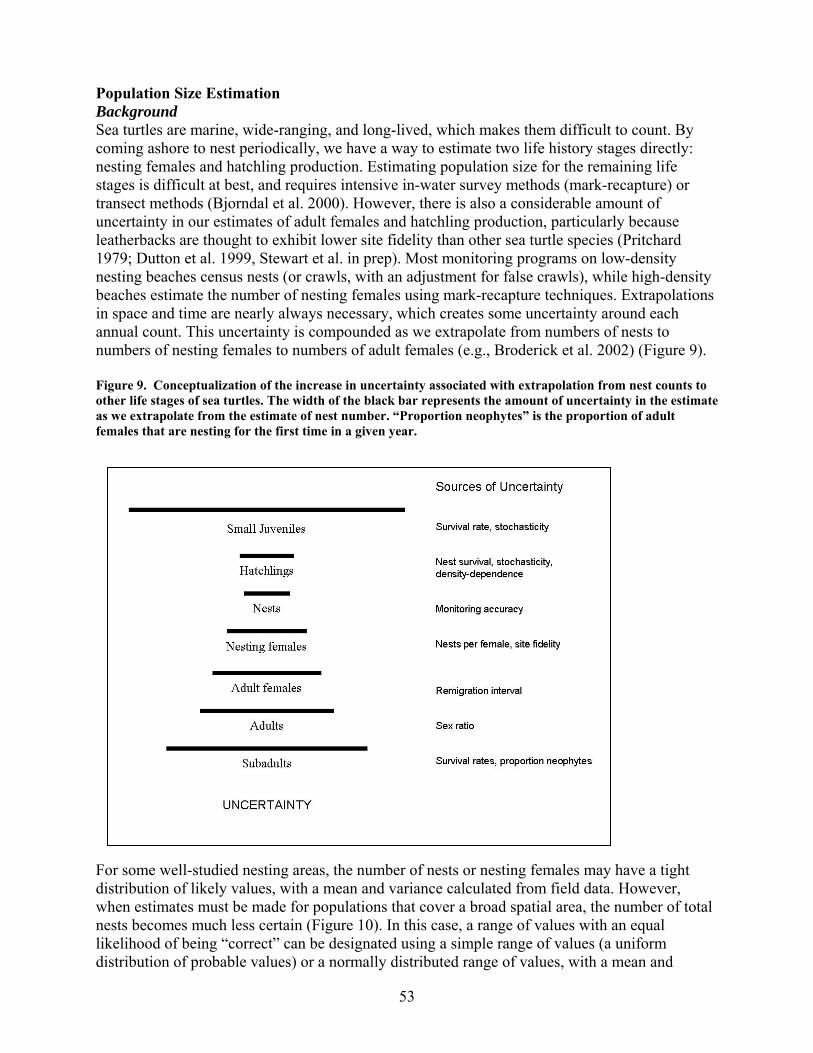
53
Population Size Estimation Background Sea turtles are marine, wide-ranging, and long-lived, which makes them difficult to count. By coming ashore to nest periodically, we have a way to estimate two life history stages directly: nesting females and hatchling production. Estimating population size for the remaining life stages is difficult at best, and requires intensive in-water survey methods (mark-recapture) or transect methods (Bjorndal et al. 2000). However, there is also a considerable amount of uncertainty in our estimates of adult females and hatchling production, particularly because leatherbacks are thought to exhibit lower site fidelity than other sea turtle species (Pritchard 1979; Dutton et al. 1999, Stewart et al. in prep). Most monitoring programs on low-density nesting beaches census nests (or crawls, with an adjustment for false crawls), while high-density beaches estimate the number of nesting females using mark-recapture techniques. Extrapolations in space and time are nearly always necessary, which creates some uncertainty around each annual count. This uncertainty is compounded as we extrapolate from numbers of nests to numbers of nesting females to numbers of adult females (e.g., Broderick et al. 2002) (Figure 9). Figure 9. Conceptualization of the increase in uncertainty associated with extrapolation from nest counts to other life stages of sea turtles. The width of the black bar represents the amount of uncertainty in the estimate as we extrapolate from the estimate of nest number. “Proportion neophytes” is the proportion of adult females that are nesting for the first time in a given year.
For some well-studied nesting areas, the number of nests or nesting females may have a tight distribution of likely values, with a mean and variance calculated from field data. However, when estimates must be made for populations that cover a broad spatial area, the number of total nests becomes much less certain (Figure 10). In this case, a range of values with an equal likelihood of being “correct” can be designated using a simple range of values (a uniform distribution of probable values) or a normally distributed range of values, with a mean and
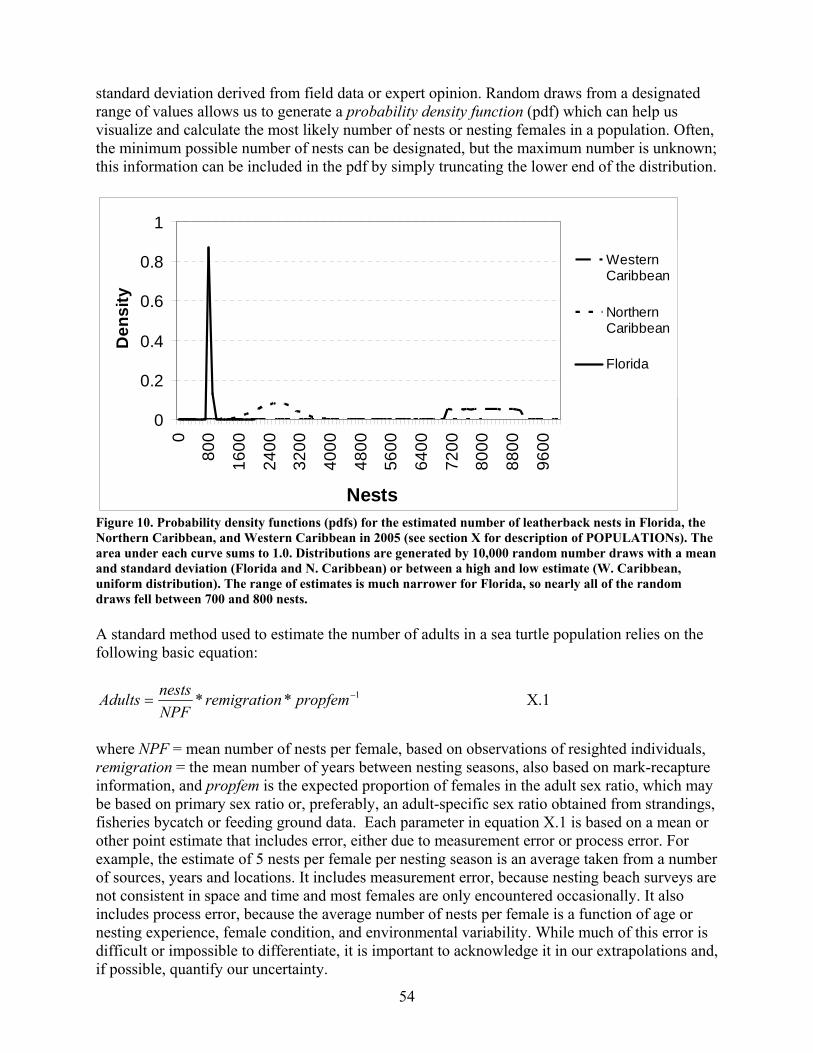
54
standard deviation derived from field data or expert opinion. Random draws from a designated range of values allows us to generate a probability density function (pdf) which can help us visualize and calculate the most likely number of nests or nesting females in a population. Often, the minimum possible number of nests can be designated, but the maximum number is unknown; this information can be included in the pdf by simply truncating the lower end of the distribution.
0
0.2
0.4
0.6
0.8
1
0
800
1600
2400
3200
4000
4800
5600
6400
7200
8000
8800
9600
Nests
Den
sity
WesternCaribbean
NorthernCaribbean
Florida
Figure 10. Probability density functions (pdfs) for the estimated number of leatherback nests in Florida, the Northern Caribbean, and Western Caribbean in 2005 (see section X for description of POPULATIONs). The area under each curve sums to 1.0. Distributions are generated by 10,000 random number draws with a mean and standard deviation (Florida and N. Caribbean) or between a high and low estimate (W. Caribbean, uniform distribution). The range of estimates is much narrower for Florida, so nearly all of the random draws fell between 700 and 800 nests. A standard method used to estimate the number of adults in a sea turtle population relies on the following basic equation:
1** −= propfemnremigratioNPFnestsAdults X.1
where NPF = mean number of nests per female, based on observations of resighted individuals, remigration = the mean number of years between nesting seasons, also based on mark-recapture information, and propfem is the expected proportion of females in the adult sex ratio, which may be based on primary sex ratio or, preferably, an adult-specific sex ratio obtained from strandings, fisheries bycatch or feeding ground data. Each parameter in equation X.1 is based on a mean or other point estimate that includes error, either due to measurement error or process error. For example, the estimate of 5 nests per female per nesting season is an average taken from a number of sources, years and locations. It includes measurement error, because nesting beach surveys are not consistent in space and time and most females are only encountered occasionally. It also includes process error, because the average number of nests per female is a function of age or nesting experience, female condition, and environmental variability. While much of this error is difficult or impossible to differentiate, it is important to acknowledge it in our extrapolations and, if possible, quantify our uncertainty.
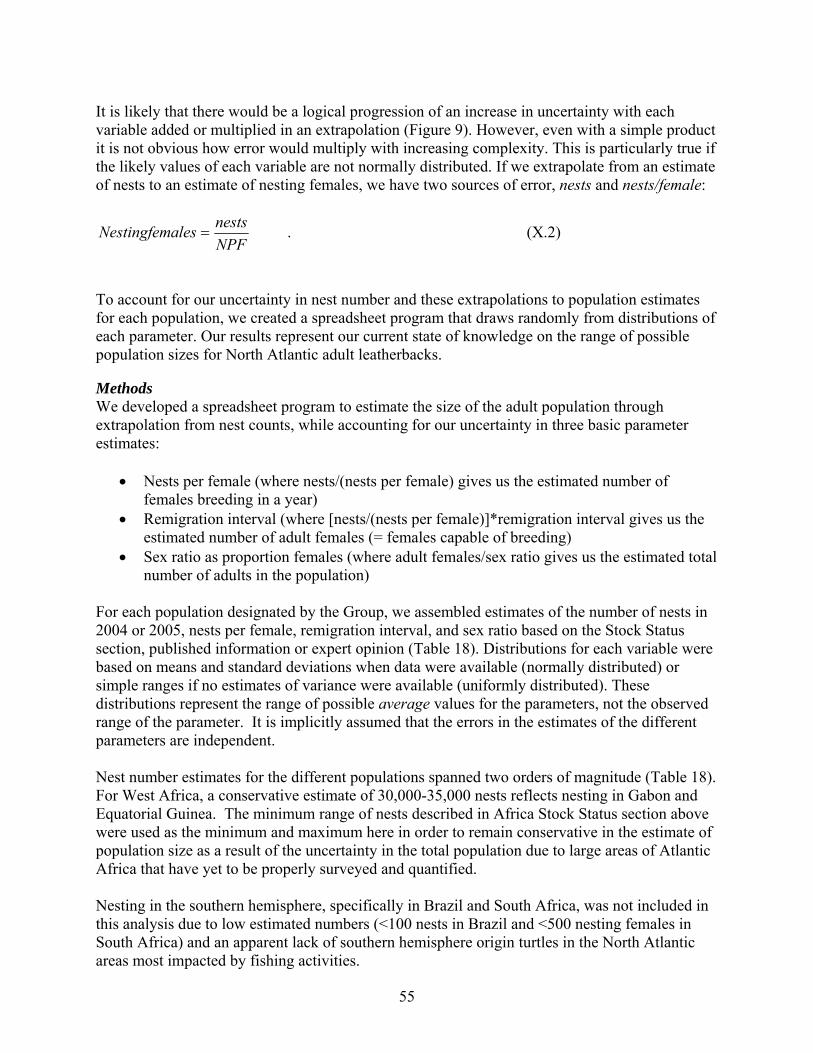
55
It is likely that there would be a logical progression of an increase in uncertainty with each variable added or multiplied in an extrapolation (Figure 9). However, even with a simple product it is not obvious how error would multiply with increasing complexity. This is particularly true if the likely values of each variable are not normally distributed. If we extrapolate from an estimate of nests to an estimate of nesting females, we have two sources of error, nests and nests/female:
NPFnestsalesNestingfem = . (X.2)
To account for our uncertainty in nest number and these extrapolations to population estimates for each population, we created a spreadsheet program that draws randomly from distributions of each parameter. Our results represent our current state of knowledge on the range of possible population sizes for North Atlantic adult leatherbacks. Methods We developed a spreadsheet program to estimate the size of the adult population through extrapolation from nest counts, while accounting for our uncertainty in three basic parameter estimates:
• Nests per female (where nests/(nests per female) gives us the estimated number of females breeding in a year)
• Remigration interval (where [nests/(nests per female)]*remigration interval gives us the estimated number of adult females (= females capable of breeding)
• Sex ratio as proportion females (where adult females/sex ratio gives us the estimated total number of adults in the population)
For each population designated by the Group, we assembled estimates of the number of nests in 2004 or 2005, nests per female, remigration interval, and sex ratio based on the Stock Status section, published information or expert opinion (Table 18). Distributions for each variable were based on means and standard deviations when data were available (normally distributed) or simple ranges if no estimates of variance were available (uniformly distributed). These distributions represent the range of possible average values for the parameters, not the observed range of the parameter. It is implicitly assumed that the errors in the estimates of the different parameters are independent. Nest number estimates for the different populations spanned two orders of magnitude (Table 18). For West Africa, a conservative estimate of 30,000-35,000 nests reflects nesting in Gabon and Equatorial Guinea. The minimum range of nests described in Africa Stock Status section above were used as the minimum and maximum here in order to remain conservative in the estimate of population size as a result of the uncertainty in the total population due to large areas of Atlantic Africa that have yet to be properly surveyed and quantified. Nesting in the southern hemisphere, specifically in Brazil and South Africa, was not included in this analysis due to low estimated numbers (<100 nests in Brazil and <500 nesting females in South Africa) and an apparent lack of southern hemisphere origin turtles in the North Atlantic areas most impacted by fishing activities.
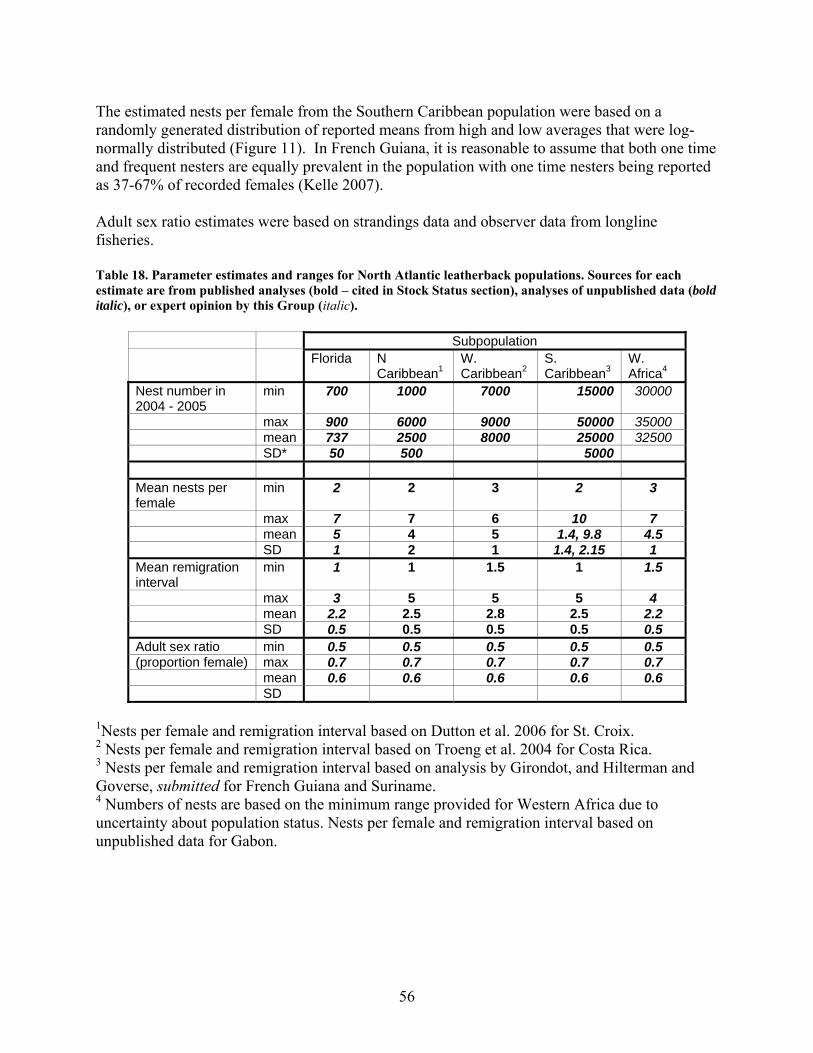
56
The estimated nests per female from the Southern Caribbean population were based on a randomly generated distribution of reported means from high and low averages that were log-normally distributed (Figure 11). In French Guiana, it is reasonable to assume that both one time and frequent nesters are equally prevalent in the population with one time nesters being reported as 37-67% of recorded females (Kelle 2007). Adult sex ratio estimates were based on strandings data and observer data from longline fisheries. Table 18. Parameter estimates and ranges for North Atlantic leatherback populations. Sources for each estimate are from published analyses (bold – cited in Stock Status section), analyses of unpublished data (bold italic), or expert opinion by this Group (italic).
Subpopulation Florida N
Caribbean1 W. Caribbean2
S. Caribbean3
W. Africa4
Nest number in 2004 - 2005
min 700 1000 7000 15000 30000
max 900 6000 9000 50000 35000 mean 737 2500 8000 25000 32500 SD* 50 500 5000
Mean nests per female
min 2 2 3 2 3
max 7 7 6 10 7 mean 5 4 5 1.4, 9.8 4.5 SD 1 2 1 1.4, 2.15 1
Mean remigration interval
min 1 1 1.5 1 1.5
max 3 5 5 5 4 mean 2.2 2.5 2.8 2.5 2.2 SD 0.5 0.5 0.5 0.5 0.5
Adult sex ratio min 0.5 0.5 0.5 0.5 0.5 (proportion female) max 0.7 0.7 0.7 0.7 0.7
mean 0.6 0.6 0.6 0.6 0.6 SD
1Nests per female and remigration interval based on Dutton et al. 2006 for St. Croix. 2 Nests per female and remigration interval based on Troeng et al. 2004 for Costa Rica. 3 Nests per female and remigration interval based on analysis by Girondot, and Hilterman and Goverse, submitted for French Guiana and Suriname. 4 Numbers of nests are based on the minimum range provided for Western Africa due to uncertainty about population status. Nests per female and remigration interval based on unpublished data for Gabon.
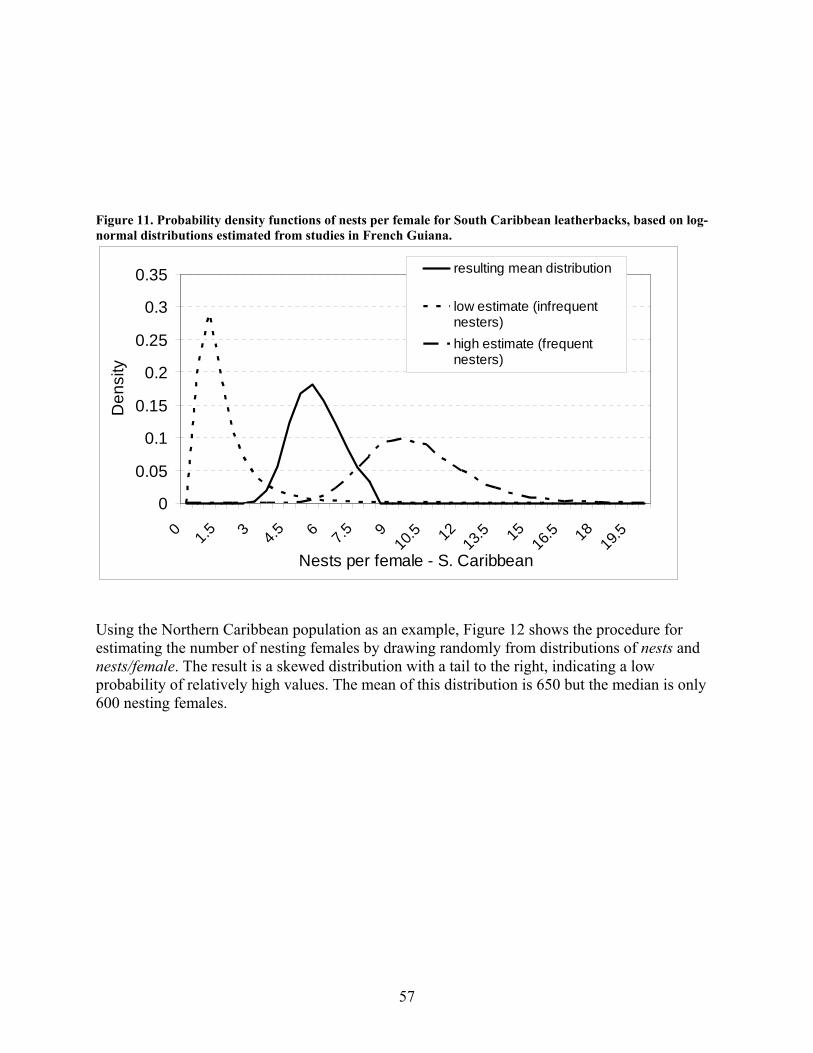
57
Figure 11. Probability density functions of nests per female for South Caribbean leatherbacks, based on log-normal distributions estimated from studies in French Guiana.
0
0.05
0.1
0.15
0.2
0.25
0.3
0.35
0 1.5 3 4.5 6 7.5 910
.5 12 13.5 15 16
.5 18 19.5
Nests per female - S. Caribbean
Den
sity
resulting mean distribution
low estimate (infrequentnesters)high estimate (frequentnesters)
Using the Northern Caribbean population as an example, Figure 12 shows the procedure for estimating the number of nesting females by drawing randomly from distributions of nests and nests/female. The result is a skewed distribution with a tail to the right, indicating a low probability of relatively high values. The mean of this distribution is 650 but the median is only 600 nesting females.
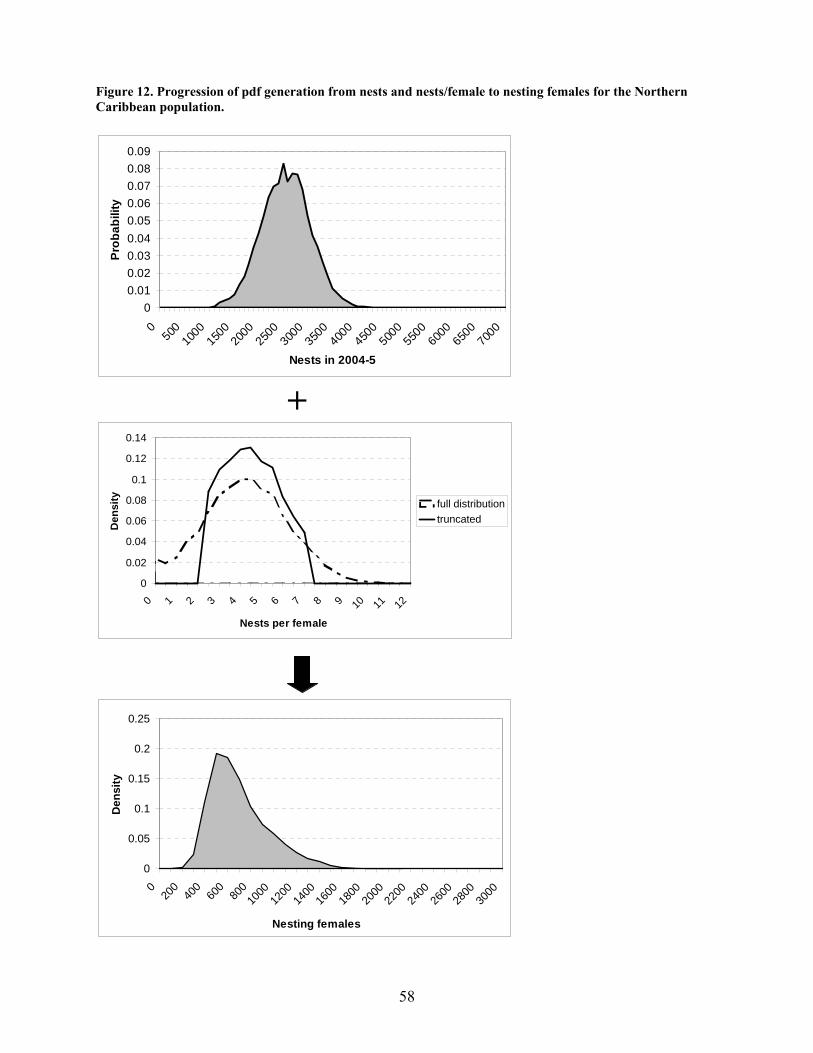
58
Figure 12. Progression of pdf generation from nests and nests/female to nesting females for the Northern Caribbean population.
00.010.020.030.040.050.060.070.080.09
050
010
0015
0020
0025
0030
0035
0040
0045
0050
0055
0060
0065
0070
00
Nests in 2004-5
Prob
abili
ty
+
0
0.02
0.04
0.06
0.08
0.1
0.12
0.14
0 1 2 3 4 5 6 7 8 9 10 11 12
Nests per female
Den
sity full distribution
truncated
0
0.05
0.1
0.15
0.2
0.25
020
040
060
080
010
0012
0014
0016
0018
0020
0022
0024
0026
0028
0030
00
Nesting females
Den
sity
59
All Monte Carlo random draws for each parameter were run 10,000 times using the Excel add-in PopTools™, available as freeware from CSIRO in Australia (www.csiro.au), which allows rapid random number generation from various distributions. The resulting distributions for each parameter were then truncated according to minimum and maximum values for the means that were agreed upon by the Group (Figure 12, Table 18). Truncations allowed realistic bounds to be set on the range of likely means based on current understanding of sea turtle biology. This truncation generally reduced the number of “replicates” to around 8500, depending on the spread of the data. Finally, each randomly drawn parameter value was used to generate an estimate of nesting females, adult females, and adults for the populations (Equation X.1). Results Results are provided as means, standard deviations, and ranges for the middle 50% of the result distribution and middle 90% of the result distribution (Figure 13). Due to a natural tendency for the multiplicative extrapolation to result in larger numbers, the distributions of adult females and adults were somewhat skewed from a normal distribution, resulting in mean values that were always 3-6% greater than the medians. All populations showed a typical pattern of increase in the coefficient of variation for each extrapolated estimate (Figure 14 example: N. Caribbean). A simple summation of the 5th and 95th percentiles across individual subpopulation results in a population estimate of 34,000-94,000 adult leatherbacks in the North Atlantic (Table 19). Discussion While the range of our population size estimate is large, it reflects our uncertainty in nest numbers and their extrapolation to adults. As estimates improve, the range will likely decrease. Some of the ranges provided for nests per female and remigration interval were likely too large, in part because of low recapture probabilities for leatherbacks. This analysis provides an estimate of adult abundance for all populations in the greater North Atlantic, and does not provide estimates for the number or origin of leatherbacks in specific foraging areas. It also does not provide an estimate of subadult abundance. One method for estimating subadult population size is to backcalculate cohort sizes starting with an assumed proportion of neophytes (first time nesters) on the nesting beaches in a given year and a constant annual mortality rate. This extrapolation also assumes a stable age distribution for the population (constant proportion of animals in each age class), a known population growth rate, and a fixed age at maturity. Although the analysis could be done with distributions of possible means for these parameters, the results would be tenuous at best at this time, given those assumptions. Trends in the adult population size estimate were not possible to estimate because trends in sex ratio and remigration rates are not available. Environmental variation or changes in age distribution could affect the estimates of population size.
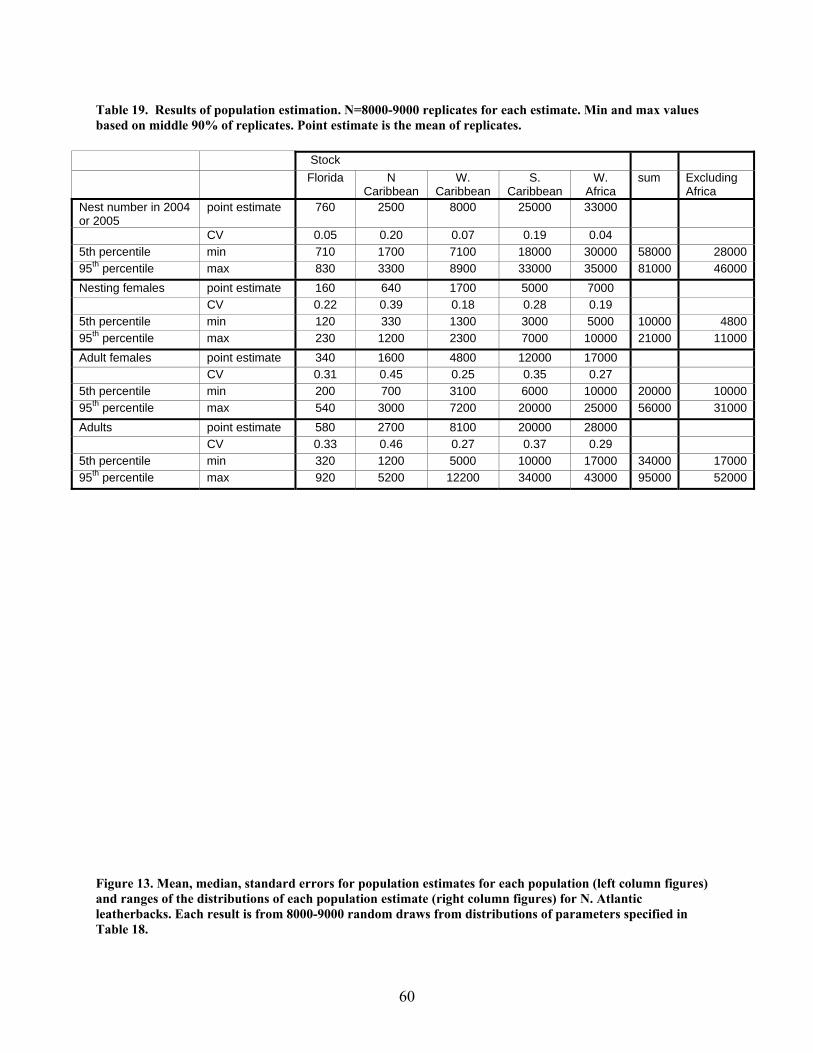
60
Table 19. Results of population estimation. N=8000-9000 replicates for each estimate. Min and max values based on middle 90% of replicates. Point estimate is the mean of replicates.
Stock Florida N
Caribbean W.
Caribbean S.
Caribbean W.
Africa sum Excluding
Africa Nest number in 2004 or 2005
point estimate 760 2500 8000 25000 33000
CV 0.05 0.20 0.07 0.19 0.04 5th percentile min 710 1700 7100 18000 30000 58000 2800095th percentile max 830 3300 8900 33000 35000 81000 46000Nesting females point estimate 160 640 1700 5000 7000
CV 0.22 0.39 0.18 0.28 0.19 5th percentile min 120 330 1300 3000 5000 10000 480095th percentile max 230 1200 2300 7000 10000 21000 11000Adult females point estimate 340 1600 4800 12000 17000
CV 0.31 0.45 0.25 0.35 0.27 5th percentile min 200 700 3100 6000 10000 20000 1000095th percentile max 540 3000 7200 20000 25000 56000 31000Adults point estimate 580 2700 8100 20000 28000
CV 0.33 0.46 0.27 0.37 0.29 5th percentile min 320 1200 5000 10000 17000 34000 1700095th percentile max 920 5200 12200 34000 43000 95000 52000
Figure 13. Mean, median, standard errors for population estimates for each population (left column figures) and ranges of the distributions of each population estimate (right column figures) for N. Atlantic leatherbacks. Each result is from 8000-9000 random draws from distributions of parameters specified in Table 18.
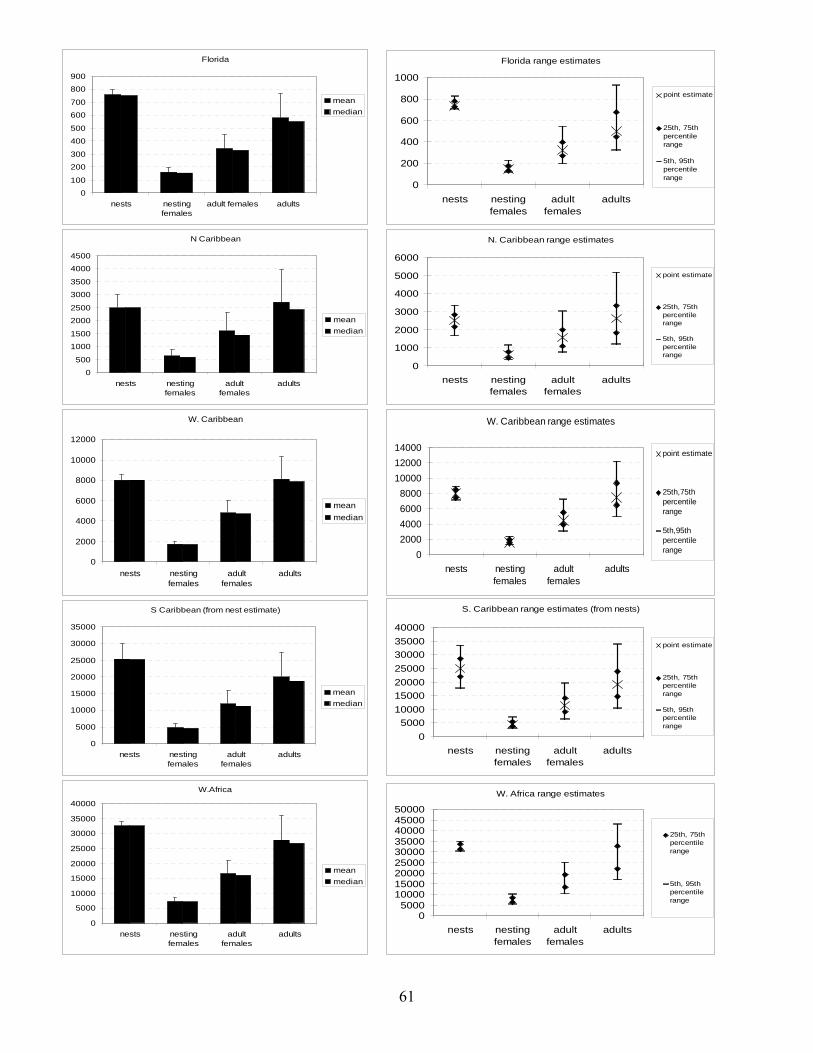
61
Florida
0
100
200
300
400
500
600
700
800
900
nests nestingfemales
adult females adults
meanmedian
Florida range estimates
0
200
400
600
800
1000
nests nestingfemales
adultfemales
adults
point estimate
25th, 75thpercentilerange
5th, 95thpercentilerange
N Caribbean
0
500
1000
1500
2000
2500
3000
3500
4000
4500
nests nestingfemales
adultfemales
adults
meanmedian
N. Caribbean range estimates
0
1000
2000
3000
4000
5000
6000
nests nestingfemales
adultfemales
adults
point estimate
25th, 75thpercentilerange
5th, 95thpercentilerange
W. Caribbean
0
2000
4000
6000
8000
10000
12000
nests nestingfemales
adultfemales
adults
meanmedian
W. Caribbean range estimates
02000400060008000
100001200014000
nests nestingfemales
adultfemales
adults
point estimate
25th,75thpercentilerange
5th,95thpercentilerange
S Caribbean (from nest estimate)
0
5000
10000
15000
20000
25000
30000
35000
nests nestingfemales
adultfemales
adults
meanmedian
S. Caribbean range estimates (from nests)
05000
10000150002000025000300003500040000
nests nestingfemales
adultfemales
adults
point estimate
25th, 75thpercentilerange
5th, 95thpercentilerange
W.Africa
0
5000
10000
15000
20000
25000
30000
35000
40000
nests nestingfemales
adultfemales
adults
meanmedian
W. Africa range estimates
05000
100001500020000250003000035000400004500050000
nests nestingfemales
adultfemales
adults
25th, 75thpercentilerange
5th, 95thpercentilerange
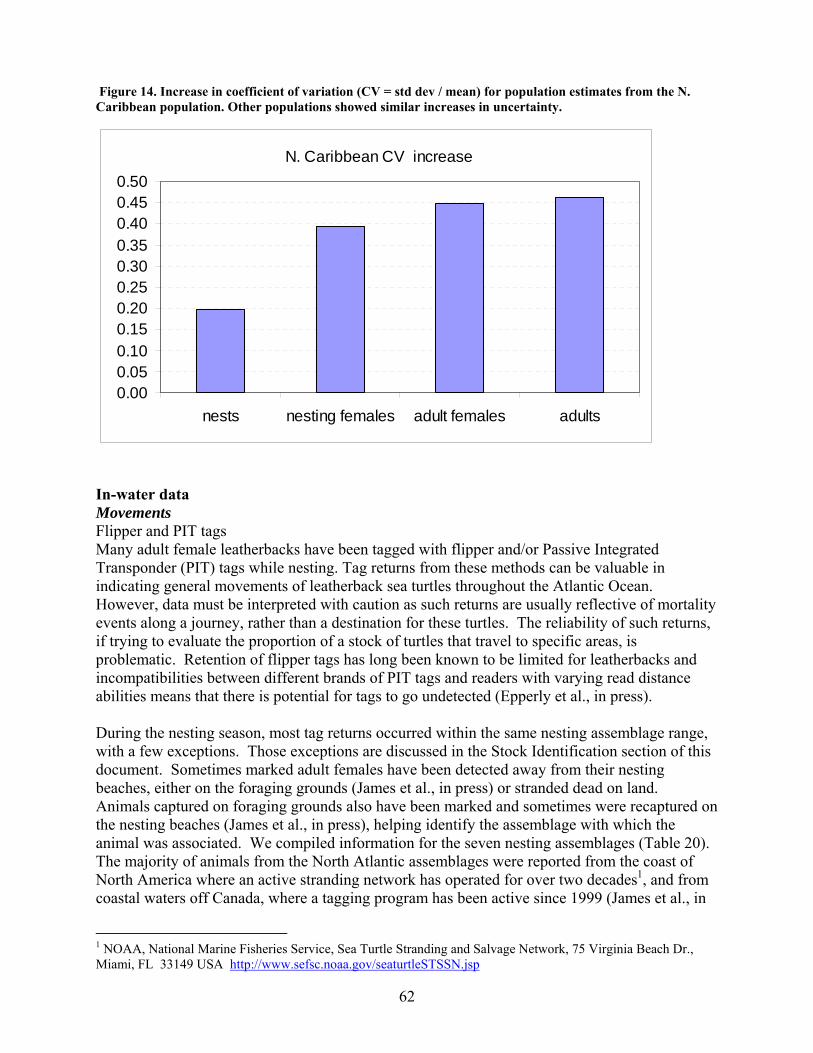
62
Figure 14. Increase in coefficient of variation (CV = std dev / mean) for population estimates from the N. Caribbean population. Other populations showed similar increases in uncertainty.
N. Caribbean CV increase
0.000.050.100.150.200.250.300.350.400.450.50
nests nesting females adult females adults
In-water data Movements Flipper and PIT tags Many adult female leatherbacks have been tagged with flipper and/or Passive Integrated Transponder (PIT) tags while nesting. Tag returns from these methods can be valuable in indicating general movements of leatherback sea turtles throughout the Atlantic Ocean. However, data must be interpreted with caution as such returns are usually reflective of mortality events along a journey, rather than a destination for these turtles. The reliability of such returns, if trying to evaluate the proportion of a stock of turtles that travel to specific areas, is problematic. Retention of flipper tags has long been known to be limited for leatherbacks and incompatibilities between different brands of PIT tags and readers with varying read distance abilities means that there is potential for tags to go undetected (Epperly et al., in press). During the nesting season, most tag returns occurred within the same nesting assemblage range, with a few exceptions. Those exceptions are discussed in the Stock Identification section of this document. Sometimes marked adult females have been detected away from their nesting beaches, either on the foraging grounds (James et al., in press) or stranded dead on land. Animals captured on foraging grounds also have been marked and sometimes were recaptured on the nesting beaches (James et al., in press), helping identify the assemblage with which the animal was associated. We compiled information for the seven nesting assemblages (Table 20). The majority of animals from the North Atlantic assemblages were reported from the coast of North America where an active stranding network has operated for over two decades1, and from coastal waters off Canada, where a tagging program has been active since 1999 (James et al., in
1 NOAA, National Marine Fisheries Service, Sea Turtle Stranding and Salvage Network, 75 Virginia Beach Dr., Miami, FL 33149 USA http://www.sefsc.noaa.gov/seaturtleSTSSN.jsp
63
press). Also, a stranding program in Europe has contributed a number of recapture records (Duguy et al. 2003, 2004). The South Atlantic records are reported from fishery interactions and a stranding (Billes et al. 2006a) Satellite Telemetry Due to their highly migratory nature, leatherback movements on the high seas are best monitored using satellite telemetry. This technology has the potential to provide information on travel routes and habitat use. While the majority of reported telemetry tracks were derived from monitoring adult females as they moved away from their nesting beaches (Ferraroli 2004; Ferraroli et al. 2004a; Hays et al. 2003; Eckert 2006; Eckert et al. 2006; Sale et al. 2006), mature females, males and subadults of both sexes (n = 42) also have been satellite tracked from foraging areas off Nova Scotia, Canada (James et al. 2005a, b). We compiled both published and unpublished data available through February 2006 to identify areas of high use and to determine if there are stock-specific patterns of habitat use. North Atlantic We obtained the Argos location data for turtles equipped with satellite tags on nesting beaches of the North Atlantic: Florida (Eckert et al. 2006; K. Stewart Duke University unpubl. data) and Chris Johnson (Marinelife Center of Juno Beach unpubl. data2), Costa Rica and Panama (Stephen Morreale, unpubl. data3; CCC unpubl. data4; WWF unpubl. data5, Troëng et al. submitted), Suriname (CCC and WWF unpubl. data), French Guiana (Ferraroli 2004; Ferraroli et al. 2003; CNRS unpubl. data6; WWF unpubl. data), Trinidad (Eckert, 2006), Anguilla [Work carried out as part of the OTEP Funded Turtles in the UK Overseas Territories (TUKOT) by Department of Fisheries and Marine Resources, The Anguilla National Trust, Marine Conservation Society, Marine Turtle Research Group, BVI Conservation and Fisheries Department, and SEATURTLE.ORG, unpubl. data7] and British Virgin Islands [Work carried out by FCO/Defra funded turtles in the Caribbean Overseas Territories (TCOT) by BVI Conservation and Fisheries Department, Marine Conservation Society, and the Marine Turtle 2 Kelly Stewart, Duke University Marine Laboratory, Beaufort, NC 28516, USA and Chris Johnson, Marinelife Center of Juno Beach, Juno Beach, FL 33408, USA 3 Stephen J. Morreale, Department of Natural Resources, Cornell University, Ithaca, NY 14853 USA 4 Sebastian Troëng, Caribbean Conservation Corporation, 4424 NW 13th St. Ste A-1, Gainesville, FL 32601, USA, http://www.cccturtle.org/sat-wwf-leatherback.htm 5 Carlos Drews, Sebastian Troëng, WWF, http://www.panda.org/about_wwf/where_we_work/latin_america_and_caribbean/our_solutions/marine_turtle_programme/projects/leatherback_tracking_project/tracking_logs/index.cfm 6 Sandra Ferraroli, Sabrina Fossette, Jean-Yves Georges, and Yvon Le Maho, Centre National de la Recherche Scientifique, Institut Pluridisciplinaire Hubert Curien, Département Ecologie Physiologie et Ethologie (formerly Centre d'Ecologie et Physiologie Energétiques), 23 rue Becquerel, 67087 Strasbourg, France, http://www.cnrs.fr/ 7 Department of Fisheries and Marine Resources (DFMR), Crocus Hill, Anguilla, British West Indies.; The Anguilla National Trust, P.O. Box 1234, The Valley, Anguilla, British West Indies; Marine Conservation Society (MCS), Unit 3, Wolf Business Park, Ross on Wye, Hereford HR9 5NB, United Kingdom; Marine Turtle Research Group (MTRG), Center for Ecology and Conservation, University of Exeter in Cornwall, Tremough Campus, Penryn TR10 9EX, United Kingdom; Conservation & Fisheries Department, Ministry of Natural Resources & Labour, Government of the BVI, P.O. Box 3323, Road Town, Tortola, British Virgin Islands; SEATURTLE.ORG, 1 Southampton Place, Durham, NC 27705. http://www.seaturtle.org/tracking/index.shtml?project_id=70
64
Research Group, unpubl. data8]. We also obtained similar data from foraging ground animals tagged in coastal foraging grounds off Canada (James 2005a; M. C. James, unpubl. data9). Locations provided by ARGOS have a range of accuracies classified as Z,B,A,0,1,2,3, with 3 of highest accuracy and B as lowest, locations are not determined for Location Class Z. Locations of lower quality tend to be less predictable. We filtered all data, except those of Morreale, to exclude aberrant locations with a filtering algorithm for PC-SAS Version 8.0 created by David C. Douglas (USGS)10. The program uses 3 primary filtering algorithms. The Minimum Redundant Distance (MRD) algorithm allows the user to set a maximum plausible distance (based on travel time) between data points beyond which subsequent locations are rejected. The Distance-Angle Rate (DAR) algorithm evaluates the angle of divergence from a path determined by 3 consecutive points and rejects those that exceed a user set angle of divergence. Finally there is a hybrid filter which combines the MRD and DAR criteria; we used the hybrid filter. The filter also allows the user to set at what quality level all locations will be accepted; we selected LC>1. Morreale’s data already were filtered in a similar manner (see Morreale et al. 1996). We calculated median daily locations for each turtle based on the filtered positions. Median daily locations for missing days less than 32 days and greater than 1 day from known positions were filled using a simple linear interpolation with the distance between the known positions divided evenly between the missing days. These locations were tallied, by nesting assemblage, into hexagonal area bins standardized for horizontal distance from 45ºW over the curvature of the earth using cos(lat)*(lon+45) (see James et al., 2005c). We intended to combine these data among subpopulations to elucidate habitat use. However, we decided not to do this because (1) we were not able to obtain all the tracking data, (2) the beaches were not sampled in proportion to their population sizes, thus, combining data could not be done without weighting the beaches accordingly to size and number of PTTs deployed, (3) tracks were of varying duration, with many tags being released to study internesting behavior, not long-term movements. The contributions to the weighted graphic would need to take into account the number of days of tracking, and (4) the tracks did not represent a full cycle, tracking the turtles from the time they left the beach to the time they returned 2 or more years later. South Atlantic With the exception of data from a foraging ground animal off Uruguay (WWF and Karumbé unpubl. data11), we did not obtain ARGOS data for South Atlantic nesting subpopulations. This is an area where a large number of tags were only recently deployed and most tracks are not yet complete. Instead tracks and summary data were complied from publications (Sale et al. 2005; 8 Conservation & Fisheries Department, Ministry of Natural Resources & Labour, Government of the BVI, P.O. Box 3323, Road Town, Tortola, British Virgin Islands; Marine Conservation Society (MCS), Unit 3, Wolf Business Park, Ross on Wye, Hereford HR9 5NB, United Kingdom; Marine Turtle Research Group, Center for Ecology and Conservation, University of Exeter in Cornwall, Tremough Campus, Penryn TR10 9EX, United Kingdom. 9 Michael James, Canadian Sea Turtle Research Project, Department of Biology, Dalhousie University, Halifax, Nova Scotia, Canada, B3H 4J1 10 US Geological Survey, Alaska Science Center, 3100 National Park Rd., Juneau, Alaska 99801 USA ([email protected]) http://alaska.usgs.gov/science/biology/spatial/ 11 Milagros Lopez Mendilaharsu, Karumbé Scientific Coordinator, Proyecto Karumbé, Montevido, Uruguay, www.karumbe.8k.com
65
Luschi et al. 2006) and unpublished data (Billis et al. in press; Luciano Soares, Projeto Tamar-Ibama, pers. comm.; Brendan Godley, Marine Turtle Research Group, pers. comm. Results Western North Atlantic Nesting Assemblages We processed data for 138 turtles representing 15,562 days of tracking. The composites for each Western North Atlantic nesting assemblage are shown in Figure 15. Florida Nesting female leatherbacks were tagged with satellite transmitters from Juno Beach and within the Archie Carr National Wildlife Refuge at Melbourne Beach, Florida. Most turtles remained on the North American continental shelf for 3 of 4 seasons during the duration of tracking (Figure 15A) (Eckert et al. 2006; Stewart and Johnson, unpubl. data). One turtle did move across the Atlantic to the region between Mauritania and the Cape Verde Islands and another to the low latitude mid-Atlantic. Although no Florida turtles were followed into the Gulf of Mexico, Hildebrand (1987) reported that a turtle flipper tagged while nesting at Jupiter Beach was later recaptured in the Gulf of Campeche near Cayo Arcas. Western Caribbean Females satellite tracked from the beaches of Tortuguero (Troëng et al. in review; Morreale unpubl. data.), Mondonguillo/Pacuare (Morreale unpubl. data), and Gandoca (D. Chacón unpubl. data) in Costa Rica, and Chiriqui Beach (CCC unpub. data.) in Panama swam north and northeast after completing nesting (Figure 15B). Some of these turtles entered the Gulf of Mexico and the North Atlantic through the Yucatán Channel, the Windward Passage (between Cuba and Haiti), the Mona Passage (between Dominican Republic and Puerto Rico) and through the Leeward Islands. Satellite telemetry of leatherback turtles from Costa Rica and Panama beaches suggests females from this stock forage in the waters of the Gulf of Mexico, the Western North Atlantic and to a lesser extent in the Central North Atlantic. Recoveries of metal flipper tags from the Gulf of Mexico, US Eastern Seaboard and Canada confirm this pattern, but recoveries from Spain and Morocco indicate that females may also disperse to the Eastern North Atlantic (Troëng et al. 2004). Northern Caribbean Satellite tracking data for the Northern Caribbean assemblage is limited. There is one reported long-term track from Anguilla and two short tracks for internesting intervals off the British Virgin Islands (Figure 15C). The one long-term track shows movement directly northward to just east of Newfoundland, with a return southeast to about the same latitude as the deployment location (see website for the most up-to-date track on this turtle12). Other researchers have deployed tags on Puerto Rico nesting animals (Molly Lutcavage, pers. comm.). Only one long-term track was reported, along with 4 brief (≤ 3 months) tracks. The long term track indicated the animal moved into the eastern Atlantic, northeast of the Azores. The short term tracks showed both northeast and northwest movements. Flipper tagged animals have been found in the Gulf of Mexico near Cayo Triangulos off the Yucatán Peninsula and along the eastern seaboard of North America, from Florida to Nova Scotia (Table 20).
12 http://www.seaturtle.org/tracking/index.shtml?project_id=70
66
Southern Caribbean/Guianas Nesting leatherbacks of the north and east coasts of Trinidad, Suriname, and French Guiana have also been equipped with satellite transmitters. Post nesting movements of this nesting population showed that they utilized the entire North Atlantic Ocean (Figure 15D). One turtle satellite tagged in Suriname returned to French Guiana waters fourteen months later. Turtles tracked from Grenada, but not included herein, followed a similar pattern (Hays et al. 2004). Post nesting movements recorded positions on the continental shelf of North America, the high seas of the upper latitudes, and the eastern Atlantic Ocean. None moved into the Mediterranean Sea or the South Atlantic Ocean. Although not tracked into the Gulf of Mexico, tag returns indicate that individuals of this nesting assemblage do enter the Gulf (Table 20). Post nesting movements from Trinidad were generally north, with two remaining inside the Caribbean as they moved northwest and north. Three others moved directly out of the Caribbean past Barbados into higher latitude waters, until fall when they moved to a region west of Mauritania and the Cape Verde Islands (Eckert, 2006). Of the 9 turtles tracked from the nesting colony in Grenada, 2 turtles left the Caribbean to the north and northeast moving to the central north Atlantic before turning south or southeast later; 7 moved to the northeast, often turning to Africa towards the end of their tracks, and two moved eastward (Hays et al., 2004). Ferraroli et al. (2004) reported on the tracks of 12 leatherbacks leaving French Guiana. They, too, moved northwest and north, but several also headed east. One track ended at the equator. Pritchard (1973) reported the movement of a turtle from Bigisanti, Suriname in May 1970 to Salt Pond, Ghana in April 1971, where it was caught. South Atlantic Nesting Assemblages Brazil Luciano Soares (Projeto Tamar-Ibama National Coordination Assistant) provided the following (pers. comm.): Projeto Tamar-Ibama´s programme, " Study of the Biology of Sea Turtles in Brazil through Satellite Telemetry", has installed 4 PTT tags on three nesting leatherbacks during December 2005 on the coast of Espírito Santo, and on one adult female leatherback incidentally caught in a gillnet off the coast of São Paulo. The first nesting leatherback was killed in a fishing net a few days after being tagged. The other turtles moved directly south upon the completion of nesting or the deployment of transmitters. At the conclusion of tracking the data will be analyzed by collaborating researchers. At Tamar´s website www.projetotamar.org.br are detailed maps, including bathymetry, for these and the other 35 marine turtles monitored by the program (Antonio de Padua Almeida pers. comm.). Nesting occurs in Brazil between October and January with a peak of nesting in November and December. From such nesting it could be inferred from similar data in the Pacific Ocean, that these individuals are Southern Hemisphere foraging turtles. Recent satellite telemetry data seems to confirm this. West Africa Satellite telemetry data of leatherbacks (n=10) leaving nesting beaches in Gabon 2002-2003 indicated that some remained on Africa’s continental shelf, near the nesting beaches (n=3) or moved south (n=4) or north (n=1), while others (n=2) moved offshore, but still remained at or south of the equator (Billes et al., 2006a; Jacques Fretey pers. comm.). Additional tagging has occurred since that study. Brendan Godley (Marine Turtle Research Group) provided the following (pers. comm.): A tracking project at Mayumba, Gabon was launched in early 2006 as part of an international collaboration. At the time of writing, 4 transmitters had been deployed
67
with others planned and the tracks are available to view on their website13. Recently, three more leatherback turtles have been tagged with satellite transmitters as part of WWF and partners’ Atlantic leatherback tracking project. Those tracks also can be viewed on the web14. There is evidence that some post-nesting animals move to South America. Flipper-tag recoveries (n=4) occurred in the waters of Argentina and Brazil (Billes et al. 2006b). South Africa Eleven leatherbacks were tracked during 1996-2003 from the Maputaland Marine Reserve of South Africa, in the southwest Indian Ocean. Nine turtles were tracked for up to 8 months. (Sale et al. 2005; Luschi et al. 2006). After leaving the nesting beaches, 4 initially remained at low latitudes. Later, 2 of these, along with the other 5 headed southwest. Three rounded the Cape of Good Hope, moving from the Indian Ocean into the South Atlantic Ocean and a fourth was moving along the same path when the transmitter ceased (Sale et al. 2005). Luschi et al. (2006) showed that the oceanic currents exerted a strong influence on the movement of the leatherbacks. Tag returns of leatherbacks marked in this area all have been from nearby areas within the Indian Ocean basin: South Africa, Mozambique, and Madagascar (Hughes 1996); none were reported from the Atlantic (George Hughes pers. comm.). Foraging Ground Nova Scotia Turtles tagged in coastal waters off Nova Scotia occupy shelf and slope waters off Canada and the United States during the summer and fall, before moving to tropical waters for the winter (Figure 16). Telemetry data suggests that most mature males, subadults and females in their internesting years make annual spring migrations to high latitudes of the western Atlantic (James et al., 2005a,b,c). For mature females, movement to foraging areas in shelf waters at high latitudes can occur in the months immediately following nesting, however, flipper and PIT recoveries suggest that most animals venture to Canadian coastal foraging habitat the year(s) following nesting (James et al. in press). Nesting origins of 21 leatherbacks encountered in coastal waters off Atlantic Canada have been confirmed through flipper tag and/or PIT tag recoveries (Goff et al, 1994, n=1; James et al. in press, n=23). Only Western Atlantic nesting areas are represented in this sample, including beaches in French Guiana, Suriname, Trinidad, Costa Rica, Panama, Colombia, Grenada and Puerto Rico (James et al. in press). Uruguay One satellite tag was deployed on female leatherback (148 cm) captured by a pelagic longline vessel off Uruguay15. The animal moved northward towards the equator, but did not cross it, and then followed a similar path towards the original position of deployment (Figure 16).
13 http://www.seaturtle.org/tracking/?project_id=104 14 http://www.panda.org/about_wwf/where_we_work/latin_america_and_caribbean/our_solutions/marine_turtle_programme/projects/leatherback_tracking_project/tracking_logs/index.cfm and http://www.cccturtle.org/sat-wwf-leatherback.htm 15 http://www.seaturtle.org/tracking/?tag_id=57124&dyn=1143726760
68
Conclusions Marked or satellite tracked turtles from the Florida and North Caribbean assemblages have been re-sighted off North America, in the Gulf of Mexico and along the Atlantic coast (Table 20) and a few have moved to western Africa, north of the equator. In contrast, Western Caribbean and Southern Caribbean/Guianas animals have been found more commonly in the eastern Atlantic, off Europe and northern Africa, as well as along the North American coast. There are no reports of marked animals from the Western North Atlantic assemblages entering the Mediterranean Sea or the South Atlantic Ocean, though in the case of the Mediterranean this may be due more to a lack of data rather than failure of Western North Atlantic turtles moving into the Sea. The tagging data coupled with the satellite telemetry data indicate that animals from the western North Atlantic nesting subpopulations use virtually the entire North Atlantic Ocean In the South Atlantic Ocean, tracking and tag return data follow three primary patterns. Although telemetry data from the West African nesting assemblage showed that all but one remained on the shallow continental shelf, there clearly is movement to foraging areas of the south coast of Brazil and Argentina. There is also a small nesting aggregation of leatherbacks in Brazil, and while data is limited to a few satellite tracks, these turtles seem to remain in the southwest Atlantic foraging along the continental shelf margin as far south as Argentina. South African nesting turtles apparently forage primarily south, around the tip of the continent. Leatherbacks occur throughout West African waters. Leatherbacks are rare around the waters of the Azores and Morocco, but occasional captures of turtles from French Guiana, Grenada, and Costa Rica have been reported (Fretey & Girondot 1996, Troëng et al. 2004, Hays et al. 2004). In April 1971, a leatherback tagged at Bigisanti Beach, Suriname, in May 1970 was recaptured at Salt Pond in Ghana (Pritchard 1973a). Leatherbacks have been reported from Namibian waters (Roos, unpublished data) and from accidental captures in nets and strandings (Griffin pers. comm.). Leatherbacks are captured in the fisheries in South African and Namibian waters (Peterson 2005). There is no nesting in Atlantic South Africa, but females nesting on Indian Ocean beaches may be migrating around the Cape of Good Hope into southeast Atlantic waters (Hughes et al. 1998). Recently, the first transatlantic movements from the eastern Atlantic to the western Atlantic were described: four leatherbacks tagged on the nesting beaches of Gabon were recaptured in the waters of Argentina and Brazil (Billes et al. 2006). Satellite telemetry is currently revealing the routes of leatherbacks as they travel from Gabon towards Brazilian waters (WWF and partners, http://www.panda.org). Table 20. Resightings of marked (flipper or PIT tags) turtles away from the nesting beaches. Data for Florida were compiled from Hildebrand (1987) and K. Stewart (pers. comm.). Data for the Northern Caribbean was compiled from Rafe Boulon (pers. comm.), NOAA Fisheries STSSN16, Cooperative Marine Turtle Tagging Program17, and James et al. (in press). Data for the Western Caribbean was compiled from NOAA Fisheries STSSN, and Troëng et al. (2004) and James et al. (in press). Data from the S. Caribbean/Guyana Shield was compiled from James et al. (in press), S. Eckert (pers. comm.), E. Goverse (pers. comm.), Pritchard (1973), S. Ferraroli (2004, pers. comm.), NOAA Fisheries STSSN, and K. Stewart (pers. comm.). Data from W. Africa is from Billes et al. (2006b). Not included are 3 records from animals likely tagged while
16 http://www.sefsc.noaa.gov/seaturtleSTSSN.jsp 17 http://accstr.ufl.edu/cmttp.html
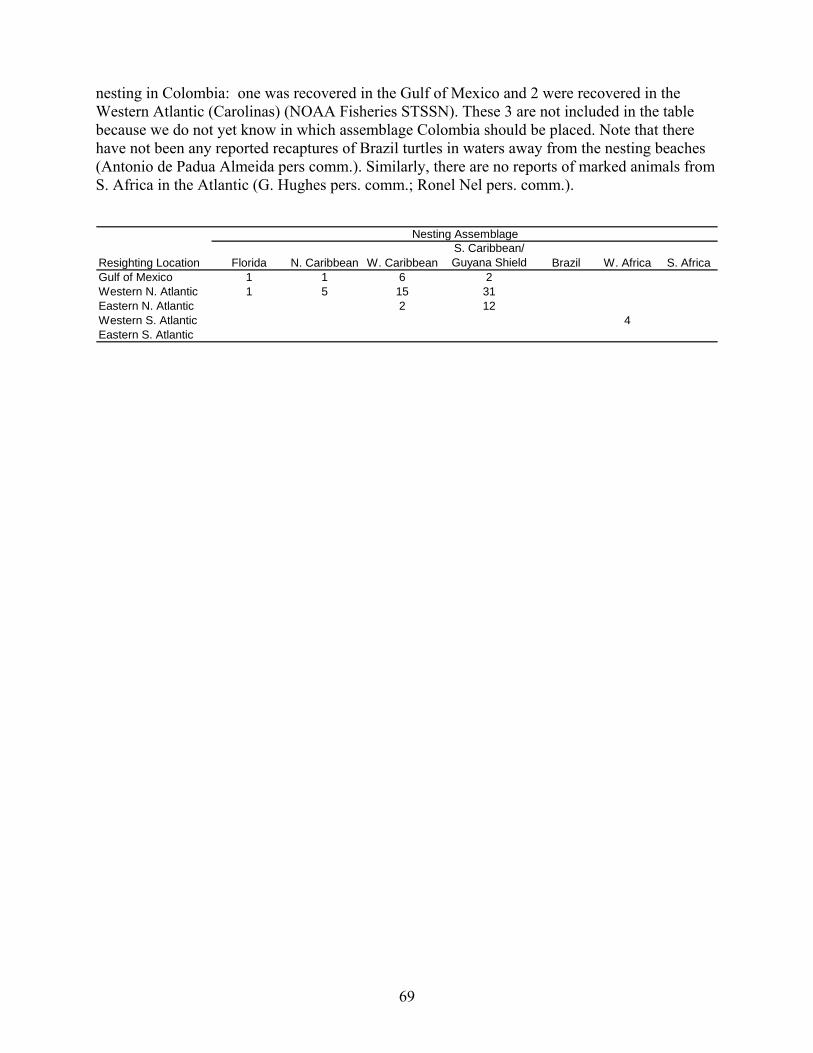
69
nesting in Colombia: one was recovered in the Gulf of Mexico and 2 were recovered in the Western Atlantic (Carolinas) (NOAA Fisheries STSSN). These 3 are not included in the table because we do not yet know in which assemblage Colombia should be placed. Note that there have not been any reported recaptures of Brazil turtles in waters away from the nesting beaches (Antonio de Padua Almeida pers comm.). Similarly, there are no reports of marked animals from S. Africa in the Atlantic (G. Hughes pers. comm.; Ronel Nel pers. comm.).
Florida N. Caribbean W. CaribbeanS. Caribbean/ Guyana Shield Brazil W. Africa S. Africa
Gulf of Mexico 1 1 6 2Western N. Atlantic 1 5 15 31Eastern N. Atlantic 2 12Western S. Atlantic 4Eastern S. Atlantic
Resighting Location
Nesting Assemblage
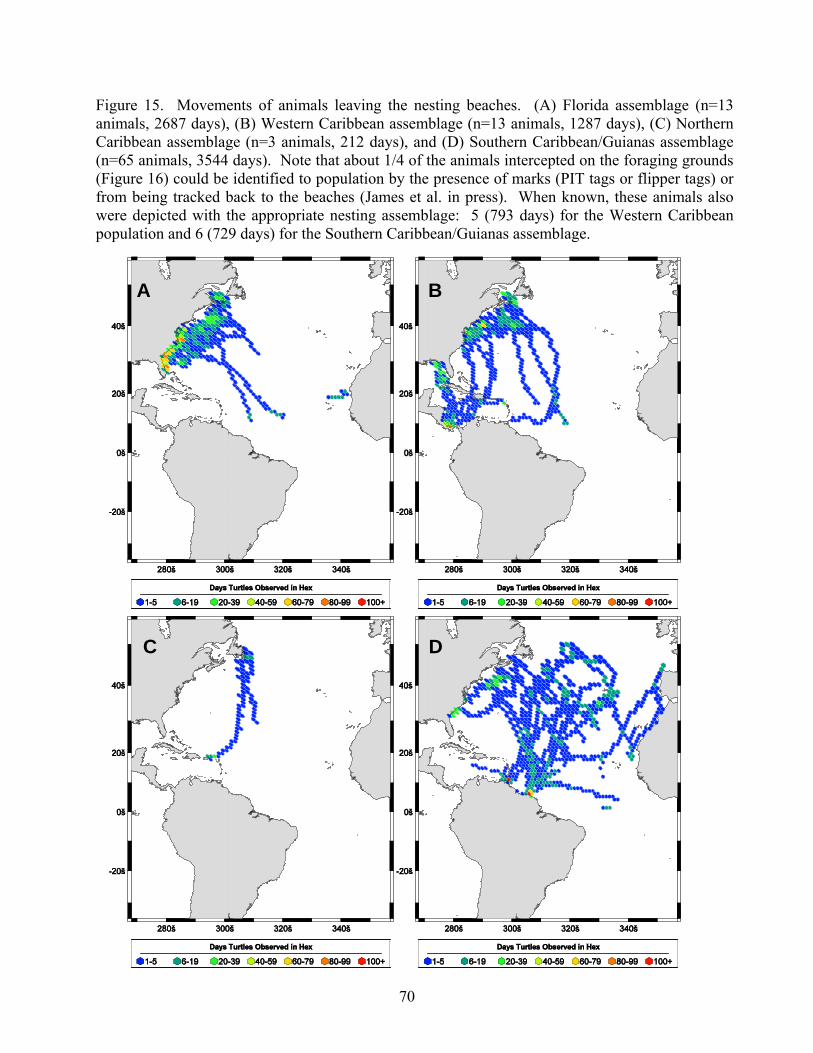
70
Figure 15. Movements of animals leaving the nesting beaches. (A) Florida assemblage (n=13 animals, 2687 days), (B) Western Caribbean assemblage (n=13 animals, 1287 days), (C) Northern Caribbean assemblage (n=3 animals, 212 days), and (D) Southern Caribbean/Guianas assemblage (n=65 animals, 3544 days). Note that about 1/4 of the animals intercepted on the foraging grounds (Figure 16) could be identified to population by the presence of marks (PIT tags or flipper tags) or from being tracked back to the beaches (James et al. in press). When known, these animals also were depicted with the appropriate nesting assemblage: 5 (793 days) for the Western Caribbean population and 6 (729 days) for the Southern Caribbean/Guianas assemblage.
A BA B
C DC D
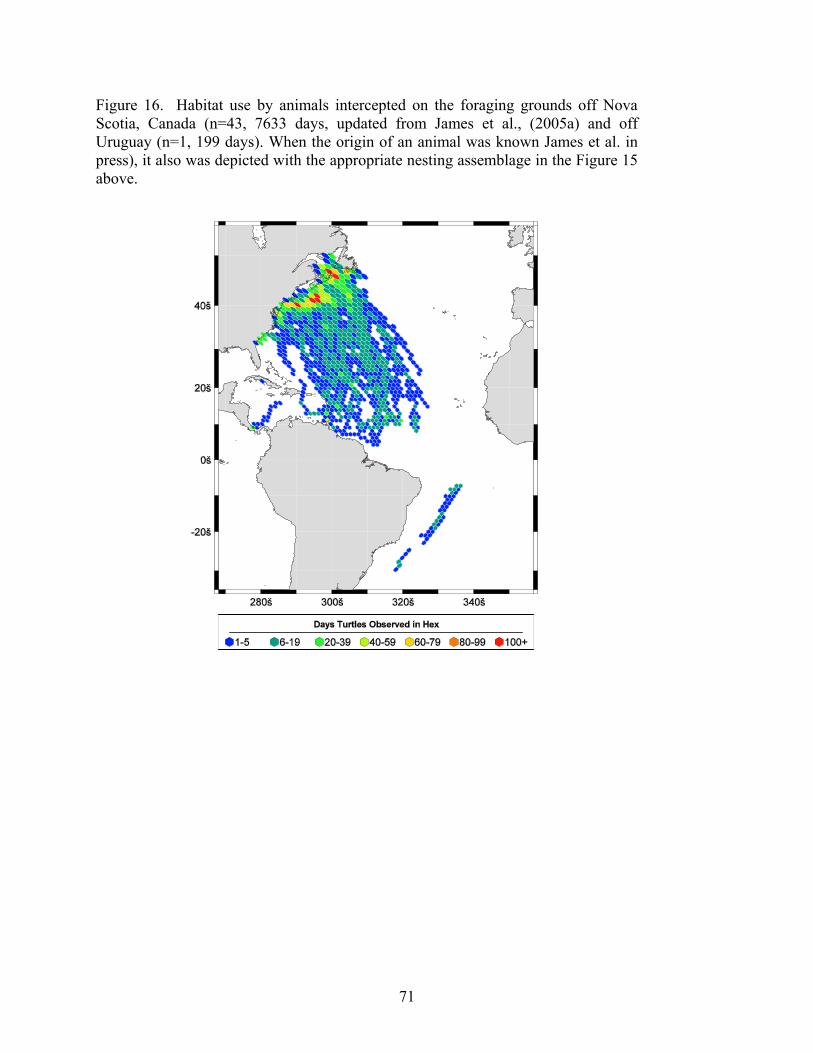
71
Figure 16. Habitat use by animals intercepted on the foraging grounds off Nova Scotia, Canada (n=43, 7633 days, updated from James et al., (2005a) and off Uruguay (n=1, 199 days). When the origin of an animal was known James et al. in press), it also was depicted with the appropriate nesting assemblage in the Figure 15 above.
72
Aerial and shipboard surveys A number of aerial and shipboard surveys for leatherback turtles have been conducted along the Atlantic US coast. Here we briefly summarize those conducted up to the year 2000 (summarized more fully in NOAA tech memo NMFS-SEFSC-455 2001), and then discuss more recent aerial surveys conducted by the Southeast Fisheries Science Center. Aerial surveys off the Atlantic coast of the US (from Cape Hatteras, North Carolina or the North Carolina /Virginia border north into the Gulf of Maine out to the 2000 m isobath) from the 1970’s and 1994-1998 indicate that turtles were sighted out to and beyond the 2000 m isobath, but most were found much nearer the coast. Turtles were not seen in these waters in the winter, and in the summer increased in density southward with a concentration in coastal waters south of Long Island (Shoop and Kenney 1992, NMFS 2001). Analysis of leatherback sightings data further north, off Canada’s coast, suggests spatio-temporal patterns in this species’ distribution at high latitudes (James et al. 2006). Canadian sightings data, coupled with satellite telemetry data (James et al. 2005c), indicates that turtles normally migrate to northern foraging areas (above 38ºN) in late spring, with peak density in coastal waters off Nova Scotia occurring in August. Departure from Canadian shelf waters typically occurs in September and October; however, leatherbacks may remain in northern waters beyond the shelf break into December (James et al. in press, 2006). Aerial surveys of the waters off the South Atlantic Coast, from Cape Hatteras, North Carolina south to Key West, Florida and out to the western boundary of the Gulf stream, were conducted by the NOAA Fisheries from 1982-1984 (Thompson 1984, Schroeder and Thompson 1987). In these surveys, leatherbacks were seen in all seasons, with increasing abundance beginning in the spring and peaking in the summer. Turtles were evenly distributed out to the Gulf Stream except in the Spring when they were more concentrated near the coast. In the summer of those years leatherback turtle sightings were clustered off of Cape Canaveral and Daytona Beach, concentrated in 20-40m depth water (Schroeder and Thompson 1987). Leatherbacks have been hypothesized to be using thermal cues in these waters to find areas of high resources (Thompson and Huang 1993, Knowlton and Weigle 1989). In the Gulf of Mexico, aerial surveys between 1982 and 1998 found leatherbacks mostly in the coastal waters east of the Mississippi River delta, with the abundance of turtle sightings increasing during the spring to a peak in summer (summarized in NMFS 2001). Turtles were sighted both near the coast and in deeper water in the summer, but only in deep water farther off the coast in the winter. Since then, the NOAA Fisheries has conducted aerial surveys off the Atlantic coast in the winter and summer of 2002, summer of 2004 and winter of 2005 (Figures 17-20). The 2002 winter (January 16 to February 28) survey extended from the south end of Delaware Bay to the Georgia/Florida border, while the 2005 winter (January 30 to March 9) survey was shifted southward, extending from the mouth of the Chesapeake Bay to Jupiter Inlet in Florida. Summer surveys were conducted starting just south of Long Island south to Jupiter Inlet from mid July though August (July17 to August 28, 2002 and July 16 to August 31, 2004). The locations of turtle sightings along flight paths were recorded in all but the first winter (2002) survey, when turtle sighting locations were only recorded as the end point of each flight path. Sightings of
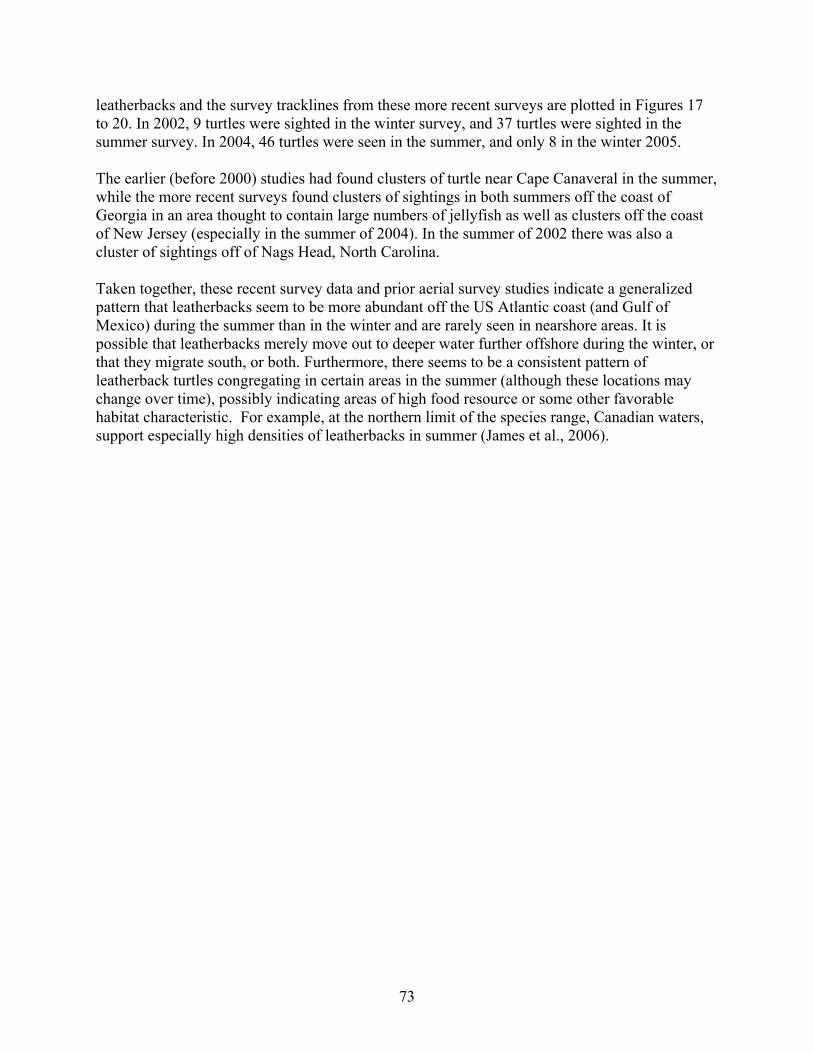
73
leatherbacks and the survey tracklines from these more recent surveys are plotted in Figures 17 to 20. In 2002, 9 turtles were sighted in the winter survey, and 37 turtles were sighted in the summer survey. In 2004, 46 turtles were seen in the summer, and only 8 in the winter 2005. The earlier (before 2000) studies had found clusters of turtle near Cape Canaveral in the summer, while the more recent surveys found clusters of sightings in both summers off the coast of Georgia in an area thought to contain large numbers of jellyfish as well as clusters off the coast of New Jersey (especially in the summer of 2004). In the summer of 2002 there was also a cluster of sightings off of Nags Head, North Carolina. Taken together, these recent survey data and prior aerial survey studies indicate a generalized pattern that leatherbacks seem to be more abundant off the US Atlantic coast (and Gulf of Mexico) during the summer than in the winter and are rarely seen in nearshore areas. It is possible that leatherbacks merely move out to deeper water further offshore during the winter, or that they migrate south, or both. Furthermore, there seems to be a consistent pattern of leatherback turtles congregating in certain areas in the summer (although these locations may change over time), possibly indicating areas of high food resource or some other favorable habitat characteristic. For example, at the northern limit of the species range, Canadian waters, support especially high densities of leatherbacks in summer (James et al., 2006).
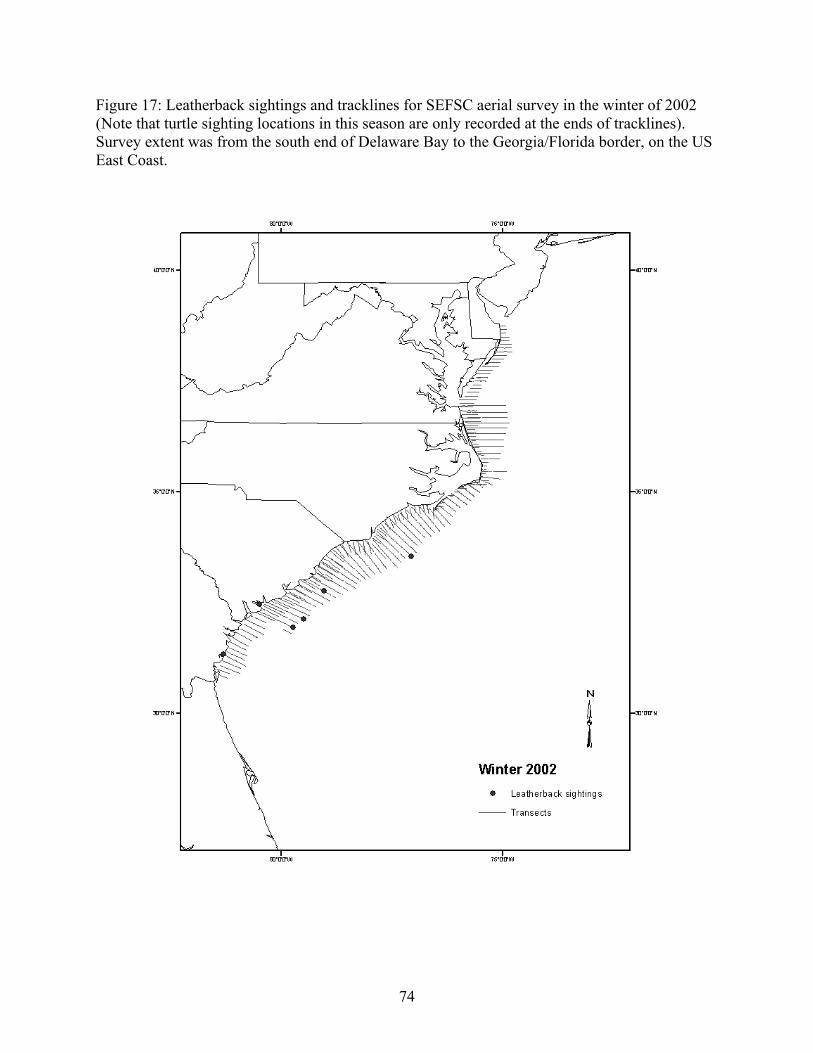
74
Figure 17: Leatherback sightings and tracklines for SEFSC aerial survey in the winter of 2002 (Note that turtle sighting locations in this season are only recorded at the ends of tracklines). Survey extent was from the south end of Delaware Bay to the Georgia/Florida border, on the US East Coast.
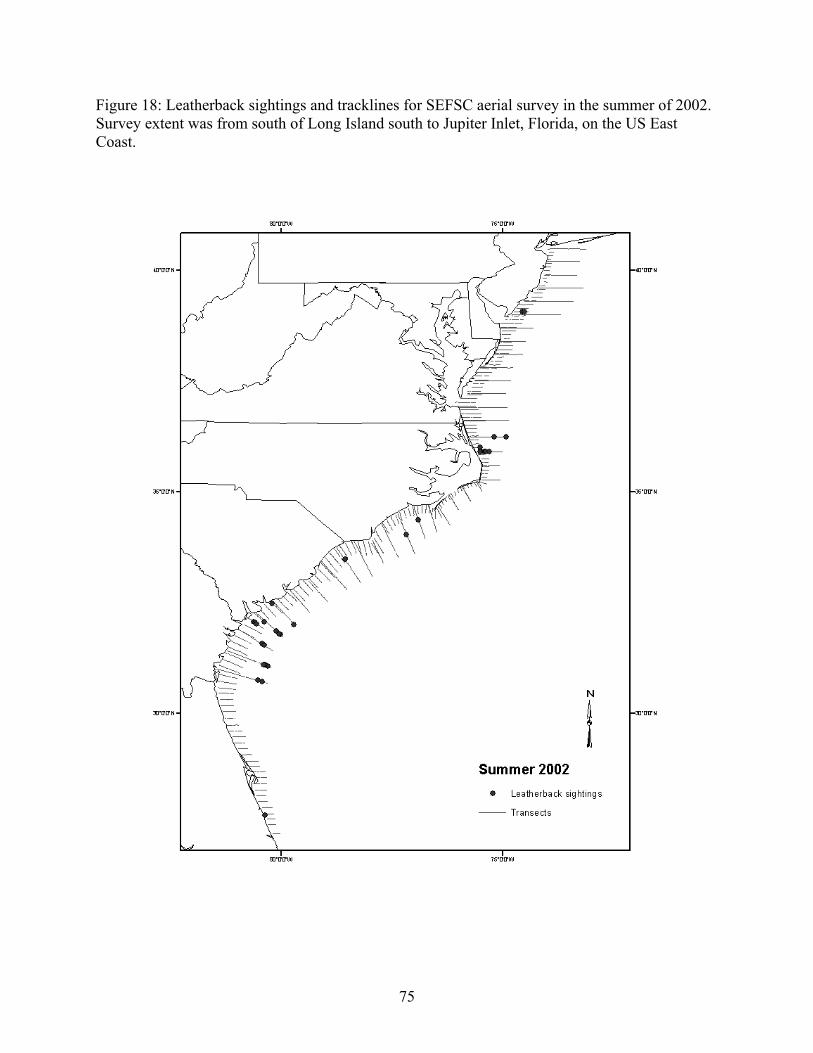
75
Figure 18: Leatherback sightings and tracklines for SEFSC aerial survey in the summer of 2002. Survey extent was from south of Long Island south to Jupiter Inlet, Florida, on the US East Coast.
76
Figure 19: Leatherback sightings and survey tracklines from SEFSC aerial survey in the summer of 2004. Survey extent was from south of Long Island south to Jupiter Inlet, Florida, on the US East Coast.
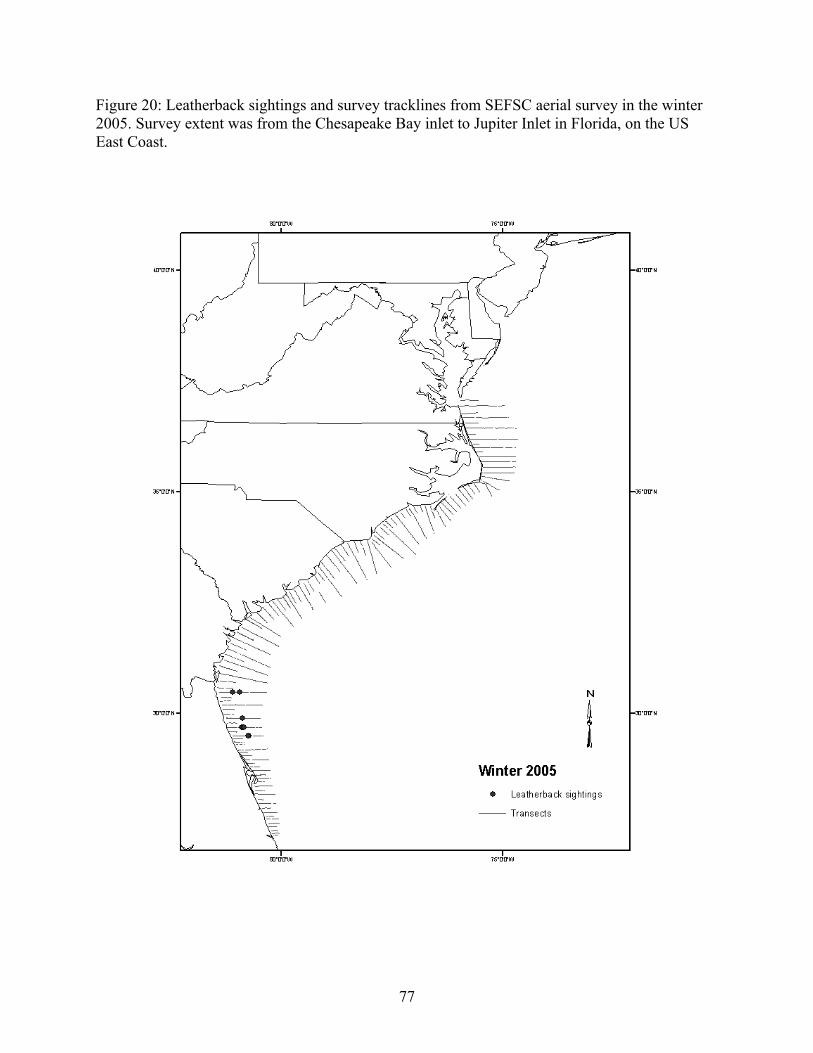
77
Figure 20: Leatherback sightings and survey tracklines from SEFSC aerial survey in the winter 2005. Survey extent was from the Chesapeake Bay inlet to Jupiter Inlet in Florida, on the US East Coast.
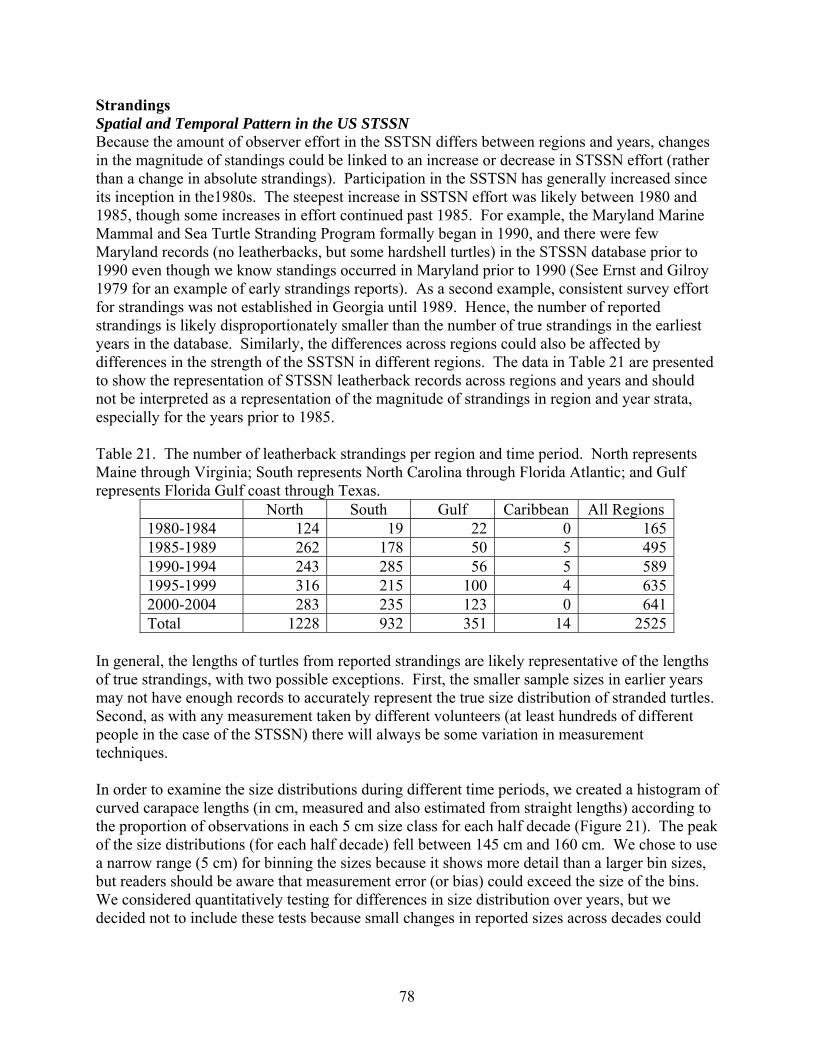
78
Strandings Spatial and Temporal Pattern in the US STSSN Because the amount of observer effort in the SSTSN differs between regions and years, changes in the magnitude of standings could be linked to an increase or decrease in STSSN effort (rather than a change in absolute strandings). Participation in the SSTSN has generally increased since its inception in the1980s. The steepest increase in SSTSN effort was likely between 1980 and 1985, though some increases in effort continued past 1985. For example, the Maryland Marine Mammal and Sea Turtle Stranding Program formally began in 1990, and there were few Maryland records (no leatherbacks, but some hardshell turtles) in the STSSN database prior to 1990 even though we know standings occurred in Maryland prior to 1990 (See Ernst and Gilroy 1979 for an example of early strandings reports). As a second example, consistent survey effort for strandings was not established in Georgia until 1989. Hence, the number of reported strandings is likely disproportionately smaller than the number of true strandings in the earliest years in the database. Similarly, the differences across regions could also be affected by differences in the strength of the SSTSN in different regions. The data in Table 21 are presented to show the representation of STSSN leatherback records across regions and years and should not be interpreted as a representation of the magnitude of strandings in region and year strata, especially for the years prior to 1985. Table 21. The number of leatherback strandings per region and time period. North represents Maine through Virginia; South represents North Carolina through Florida Atlantic; and Gulf represents Florida Gulf coast through Texas.
North South Gulf Caribbean All Regions 1980-1984 124 19 22 0 1651985-1989 262 178 50 5 4951990-1994 243 285 56 5 5891995-1999 316 215 100 4 6352000-2004 283 235 123 0 641Total 1228 932 351 14 2525
In general, the lengths of turtles from reported strandings are likely representative of the lengths of true strandings, with two possible exceptions. First, the smaller sample sizes in earlier years may not have enough records to accurately represent the true size distribution of stranded turtles. Second, as with any measurement taken by different volunteers (at least hundreds of different people in the case of the STSSN) there will always be some variation in measurement techniques. In order to examine the size distributions during different time periods, we created a histogram of curved carapace lengths (in cm, measured and also estimated from straight lengths) according to the proportion of observations in each 5 cm size class for each half decade (Figure 21). The peak of the size distributions (for each half decade) fell between 145 cm and 160 cm. We chose to use a narrow range (5 cm) for binning the sizes because it shows more detail than a larger bin sizes, but readers should be aware that measurement error (or bias) could exceed the size of the bins. We considered quantitatively testing for differences in size distribution over years, but we decided not to include these tests because small changes in reported sizes across decades could
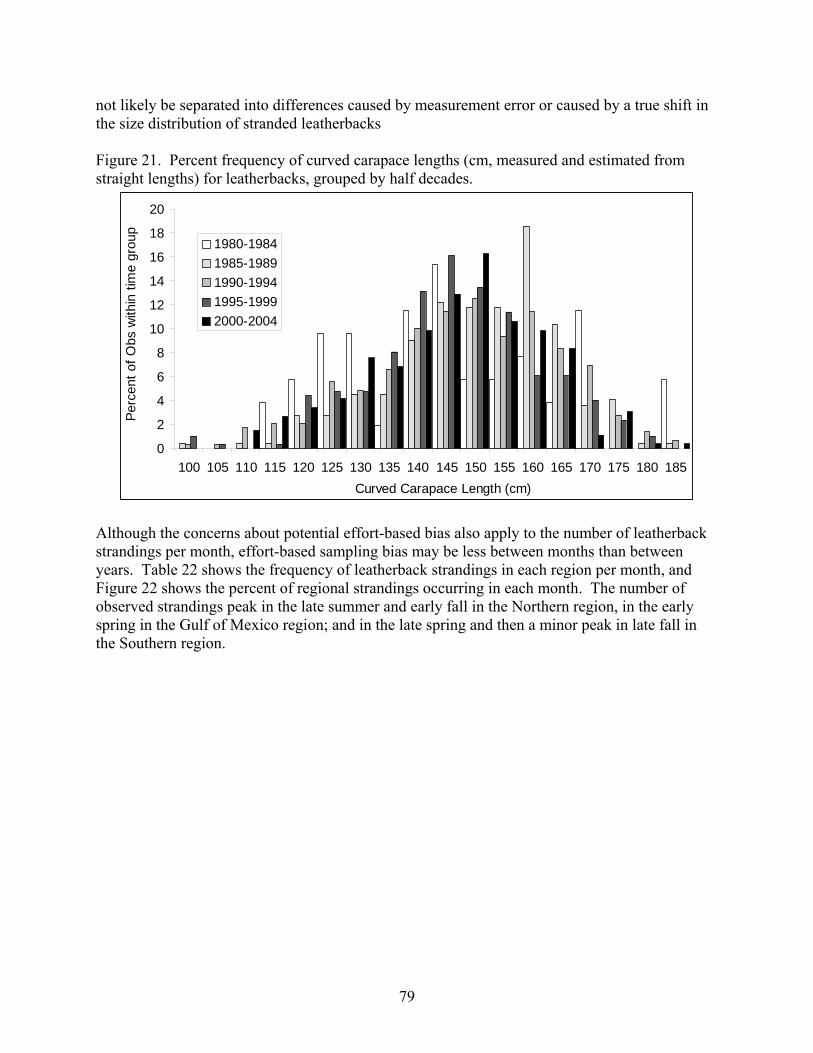
79
not likely be separated into differences caused by measurement error or caused by a true shift in the size distribution of stranded leatherbacks
Figure 21. Percent frequency of curved carapace lengths (cm, measured and estimated from straight lengths) for leatherbacks, grouped by half decades.
0
2
4
6
8
10
12
14
16
18
20
100 105 110 115 120 125 130 135 140 145 150 155 160 165 170 175 180 185Curved Carapace Length (cm)
Perc
ent o
f Obs
with
in ti
me
grou
p
1980-19841985-19891990-19941995-19992000-2004
Although the concerns about potential effort-based bias also apply to the number of leatherback strandings per month, effort-based sampling bias may be less between months than between years. Table 22 shows the frequency of leatherback strandings in each region per month, and Figure 22 shows the percent of regional strandings occurring in each month. The number of observed strandings peak in the late summer and early fall in the Northern region, in the early spring in the Gulf of Mexico region; and in the late spring and then a minor peak in late fall in the Southern region.
80
Table 22. The number of leatherback strandings per region and month, grouped by region. North represents Maine through Virginia; South represents North Carolina through Florida Atlantic; and Gulf represents Florida Gulf coast through Texas.
North South GulfJanuary 10 42 10February 4 39 11March 2 53 37April 4 114 92May 25 239 77June 81 104 51July 150 26 23August 309 18 20September 353 22 0October 188 62 7November 80 127 12December 22 86 11
Figure 22. Histogram of the percent of regional strandings occurring in each month, grouped by region. North represents Maine through Virginia; South represents North Carolina through Florida Atlantic; and Gulf represents Florida Gulf coast through Texas.
0
5
10
15
20
25
30
1 2 3 4 5 6 7 8 9 10 11 12Months
Perc
ent o
f stra
ndin
g NorthSouthGulf
Size In order to compare turtles that were measured using different techniques, curved carapace measurements were estimated from straight carapace measurements based on paired observations of the two measurements (n=185). The curved measurement was chosen as a standard because it had fewer missing measurements (n=1734) than the straight measurements (n=2009). Because this was a large dataset, we chose to base the regression equation on the relationship between curved and straight measurements in this dataset rather than on previously published equations (such as Teas 1993; log straight carapace length = 0.355 + 0.921 * log curve carapace length; N= 29, r2= 0.96, p=0.001). The regression equation created from this dataset is:
81
Log curved carapace length = 0.13080 + 0.98162 * log straight carapace length N=185, r2=0.9940; p<0.0001
We estimated 331 missing curved lengths from straight carapace length, bringing the total number of record with measured and estimated curved lengths to 1123. The size range for leatherbacks in the STSSN database are consistent with the size range seen on nesting beaches. Most of the measured turtles were between 125 cm (0.1 quantile) and 166 cm curved carapace length (0.9 quantile). The database contains 11 leatherbacks less than 30 cm measured (and estimated from straight) curved carapace length. The database contains an additional post-hatchling from New York with an approximate length of less than 30 cm, but this turtle was not included in the length analysis because the length was approximate (unknown if measurement was curved or straight). All of these small (posthatchling) turtles were found outside the COLREGS line, and most were found in Florida (also 1 from Georgia and 1 from Puerto Rico). Figure 23 shows length distributions by sex and region.
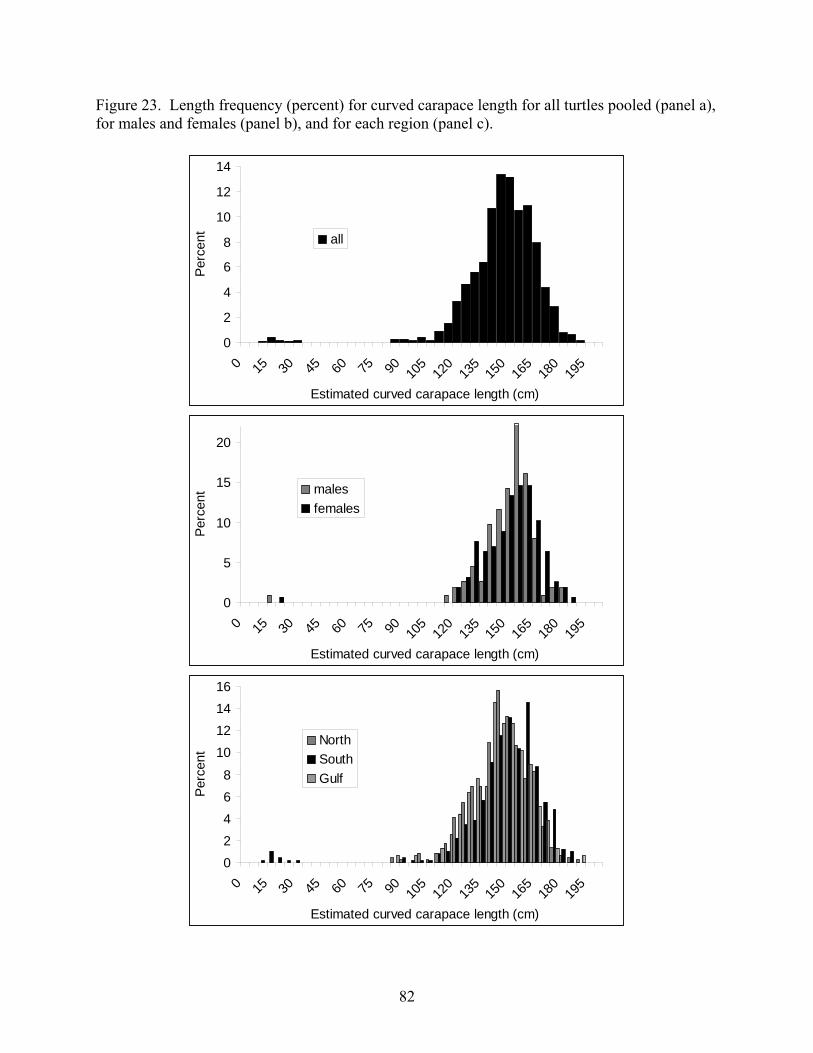
82
Figure 23. Length frequency (percent) for curved carapace length for all turtles pooled (panel a), for males and females (panel b), and for each region (panel c).
0
2
4
6
8
10
12
14
0 15 30 45 60 75 90 105
120
135
150
165
180
195
Estimated curved carapace length (cm)
Perc
ent all
0
5
10
15
20
0 15 30 45 60 75 90 105
120
135
150
165
180
195
Estimated curved carapace length (cm)
Perc
ent males
females
02468
10121416
0 15 30 45 60 75 90 105
120
135
150
165
180
195
Estimated curved carapace length (cm)
Perc
ent
NorthSouthGulf
83
Non-US Strandings in the Atlantic The most comprehensive sea turtle stranding network in the Atlantic basin is the US STSSN. Elsewhere, data collected on leatherbacks that are incidentally observed at sea or stranded on the coast have been summarized by various researchers or groups. The caveats outlined for the data from the US STSSN apply equally to data originating in other areas. In Canadian waters, 851 geo-referenced records of live and dead leatherback turtles were reported by fishers and tour boat operators off Nova Scotia from 1998-2005, with reported sightings across all years peaking on August 5 (James et al. 2006). Concurrent field research has revealed a leatherback size-class distribution mainly representing large sub-adult and adult animals (mean CCL= 147.9 cm), and a significantly female-biased sex ratio among mature turtles (James et al. in press). Entanglement in fixed fishing gear appears to be the most important source of mortality for leatherbacks in Canadian waters (James et al., 2005a). In the Mediterranean, Casale et al. (2003) summarized all leatherback occurrences up to the year 2000 (n=411). For the individuals that were measured (n=96), all individuals had >100 cm carapace length, except one that was 6 cm. The majority (60.4%) were >140 cm carapace length. The temporal distribution of leatherback occurrences in the Mediterranean was concentrated in the months of July-September. The most serious source of known mortality was incidental capture by fisheries, specifically drift/set nets and longlines. In UK waters, a sighting and strandings network has over 700 records of leatherbacks in its database from 1748-2004 (Penrose 2005). Nearly all of records (sightings and strandings) were confined to May-October. The size of the stranded turtles ranged from 81 to >200 cm CCL (MTRG unpublished data). For incidentally captured turtles, the primary gear involved was pots (particularly the pot ropes that caused entanglement) for lobster, crab and whelk (Pierpoint 2000). In French Atlantic waters from 1979-2000 there were 1249 records of leatherbacks gleaned from records of in-water observations, strandings and incidental captures (Martin 2003). Live leatherbacks were most often sighted in July-September, which also corresponded to the months with the greatest local sea surface temperature. Stranded leatherbacks were most often reported in October-November. Nets, ropes and trawls were the most common fishing gear with which leatherbacks interacted. In Brazil between 1969 and 2001, 143 leatherbacks were reported, including observations, strandings and incidental captures (Barata et al. 2004). The records were clustered into three regions: the northeastern coast, the southeastern coast, and the southern coast. There was a seasonal pattern in the different regions: the northeast had a nominal peak in April, the southeast had a peak in July-August, and the south had a peak in December. Most turtles were >110 cm CCL. Longlines, fishing weirs and fishing nets were identified as the primary gear types in Brazilian waters that are involved in leatherback interactions. During the 2000-2003 seasons in Suriname, respectively 37, 43, 15 and 17 dead leatherbacks washed ashore on the surveyed beaches, in 2005 there were 6 (Hilterman 2001, Hilterman and Goverse 2002-2006). Obviously, these figures are incomplete as not all beaches were surveyed. (No data available for 2004).
84
Threats Threats to leatherback turtles generally fall into four broad categories: fisheries interactions, marine debris ingestion, poaching, and boat strikes. Leatherbacks are known to interact with fisheries in coastal and pelagic habitats. Leatherbacks are vulnerable throughout their range to capture in longlines and trawls, especially those without turtle excluder devices. In addition to the longline and trawls, interactions with gill nets, pots and traps, and pound nets are known to occur (NMFS-SEFSC 2001). Interactions with fixed gear represent a key threat to leatherbacks in temperate coastal foraging habitats (James et al. 2005a). Along with fisheries interactions, ingestion of marine debris continues to be a threat to leatherbacks. Leatherbacks are known to consume plastic, and they may not be able to distinguish between prey items and plastic (Mrosovsky 1983, Barreiros and Barcelos 2001). Poaching of leatherback turtles and their eggs still occurs in the Atlantic basin. Boat strikes are reported to the STSSN but do not appear to be a significant source of mortality. Determining whether the boat strike was pre or post-mortem can be difficult US waters Although data from stranded animals contain certain biases (as discussed in the Life History: Sex Ratio: STSSN data section of this document) and it would likely be unwise to quantify the magnitude of threats based on strandings data, we believe the STSSN data can be used to identify a subset of potential threats. In order to investigate these threats we looked at the note codes of the SSTSN leatherback records (n=2525). We investigated information gained through necropsies by querying the database to see how many leatherback records contained information about plastics or persistent marine debris found in digestive tract, plastic ingestion noted, tar and/or oil in digestive tract, fishing hooks found in digestive tract, balloons found in digestive tract, or lightstick found in GI tract. There were 27 necropsy notes that indicated plastics or persistent marine debris was found in the digestive tract; 14 necropsy notes that indicated plastic ingestion; 5 necropsies that indicated balloons were found in the digestive tract; and one that indicated a fishing hook was found in the digestive tract upon necropsy or X-raying. There were no records indicating tar, oil, monofilament line, or lightsticks in the digestive tract. In the US, pelagic longline fisheries and the shrimp fishery represent the largest documented takes of leatherbacks (NMFS-SEFSC 2001). Epperly et al. (2002) estimated there were 3,090 leatherback-shrimp trawl interactions in the U.S., which given the use of large openings TEDs was estimated to result in 80 mortalities annually. We investigated evidence of fishery interactions by examining note codes associated with entangled/hooked/trapped but not incidentally captured turtles. There were 226 entangled/hooked/trapped note codes that indicated some interaction with fishing gear other than direct capture. These note codes included entangled in fishing line, entangled in fishing net, entangled in crab/lobster trap line, caught in abandoned gear, entangled in rope (not deliberately tied), entangled in conch/whelk pot line, hook in mouth, monofilament or steel line protruding from mouth or cloaca, hook in flipper or other soft body part (not in mouth). Of this list, the most frequent note indicated “Entangled in crab/lobster trap line” (n=163).
85
Canadian waters Leatherback turtles interact with a variety of fisheries in Canadian waters. Fishery observer records confirm incidental capture in pelagic longline fisheries targeting tuna and swordfish (Javitech Limited 2002, 2003). Leatherbacks are also vulnerable to entanglement in both vertical and floating lines associated with fixed-gear fisheries (James et al., 2005a). However, leatherback encounters with any type of line, including those associated with vessel and aquaculture moorings, may result in entanglement. The petroleum industry has recently shown considerable interest in assessing oil and natural gas resource potential in both shelf and slope waters off Canada’s coast (http://www.cnsopb.ns.ca/). While the impacts of offshore petroleum exploration and development on sea turtles are not fully understood, sublethal effects on leatherbacks may include displacement from primary foraging areas with accompanying energetic costs. Necropsy results to date have not indicated that ship strikes or ingestion of plastics and other marine debris represent significant sources of leatherback mortality in Canadian waters, however, sample sizes are small (n<25 turtles, 1998-2005). Western Caribbean Terrestrial threats to the Western Caribbean leatherback rookery are better known than survival threats in the marine environment. Killing of nesting females on beaches in Panama, and occasionally in Costa Rica, was a major threat to the population in the past but such mortality is believed to have been reduced since conservation efforts were expanded to include the affected beaches (Troëng et al. 2004, C. Ordoñez pers. comm.). Illegal take of eggs remain a major threat on many beaches (Troëng et al. 2004). Illegal take of eggs is non-existent on Chiriqui Beach but depredation of eggs and hatchlings by dogs remain a problem (Ordoñez et al. submitted). For some Western Caribbean leatherback nesting beaches, coastal erosion, and the accumulation of logs and other debris have negative impacts and reducing the amount of available nesting habitat and possibly forcing leatherback females to deposit their eggs in suboptimal locations (Chacón 1999). In-water threats include incidental capture in fisheries activities and boat collisions. Fisheries activities and boat collisions could not be ruled out as the cause of death for 20 stranded or floating carcasses (13 of which were found along the Gulf and Atlantic coasts of the USA) of leatherback turtles originally tagged on Western Caribbean nesting beaches (Troëng et al. 2004). Embedded longline fishing hooks have been removed from leatherback turtles nesting at Tortuguero, Costa Rica and females with carapace damage from propeller cuts have also been observed on the nesting beach (de Haro et al. 2006). Trinidad and Tobago Killing leatherback sea turtles on nesting beaches for meat has been almost entirely eliminated by nocturnal patrols on Trinidad. At unmonitored areas some killing likely occurs, but is thought to be less than 20 turtles per year. On Tobago the situation is quite different, and while
86
leatherback nesting is far lower (approximately 50 - 100 turtles per year), mortality rates are quite high. The most serious source of mortality of leatherbacks in Trinidad is the bycatch of turtles by gillnet fisheries. Based on interviews with fisherman operating from Matelot (April-May 1992), Fournillier and Eckert (1999) reported a capture rate of 10 leatherbacks per 61 m of net per season. They note that between March and August 1995, seven Matelot fishermen documented the capture of 139 leatherbacks. They also note that in 1997, 200-450 leatherbacks were captured in gillnets between Balandra Bay and Salybia on the east coast of Trinidad, and that the leatherback deaths off Galera Point were so high that the total for the northeast region probably exceeded 1,000 leatherbacks annually (Fournillier and Eckert 1999). In 1999, Eckert and Lien (1999) report on interviews they conducted with fishermen on the east and north coasts and note that fishermen from Manzanilla (3 boats) reported catching 1 leatherback per day (5 days each week) from January - April, with a 50% mortality. In Mayaro, where 50 boats operate (25 from Mayaro, 50 are from other ports), each boat reportedly caught 5 leatherbacks between January and April. Mortality is reported to be in excess of 95% due to an illegal black market sale of leatherback meat in that area. A study by the Trinidad and Tobago's Institute for Marine Affairs (IMA), in 2002 confirm that bycatch of leatherbacks is high in Trinidad. IMA estimated that more than 3,000 leatherbacks were captured incidental to gillnet fishing in the coastal waters of Trinidad in 2000, and that one half or more of the gravid turtles may be killed (Lee Lum, 2003). Guianas Geomorphological change of beaches has always been a fact of life for leatherbacks nesting in the Guianas, and they adapt to it appropriately. Indeed, when new beaches develop, they may be colonized within months by nesting leatherbacks, which take advantage of the fresh, clean sand (or seashell, in Guyana) and absence of entangling or deep-rooted beach vegetation (Ipomaea, etc.). However, Ipomaea seems not to be a problem for leatherbacks because the turtles can easily uproot and destroy the plants. In Guyana, the Arawak community, which originally migrated from Venezuela in the early 19th century, has hunted nesting turtles for many years primarily for food, although private conservation efforts (subsequently becoming an activity of the Guyana Marine Turtle Conservation Society; GMTCS), have greatly reduced this hunting. Nevertheless, beach vigilance is difficult in view of the length of the coast to be patrolled, and the constantly changing nesting sites. Many nests are threatened by erosion in Guyana, but this is currently mitigated by a GMTCS program to move eggs that are threatened by tidal erosion (or by poachers). Some at-sea mortality continues, and was very heavy in the high nesting year of 2000; most of it occurs in artisanal gill nets set close to the shore. Live-caught leatherback turtles are often killed with machetes, to minimize net damage. Very little deliberate killing of leatherbacks occurs in Suriname and French Guiana, although there is regular bycatch in the Maroni/Marowijne Estuary (e.g. Chevalier 2000). Egg collection,
87
although illegal, has a lengthy history in Suriname, and there is still a high rate of illegal egg collection in Suriname. French Guiana Erosion on beaches leads to the natural destruction of leatherback turtle clutches. Mole crickets have been identified as a regular predator of leatherback turtle clutches (Maros et al, 2003). Egg poaching still occurs on the main beaches of the Amana Nature Reserve, on the beaches of Cayenne/Montjoly, but does not exceed 5% of the nests laid (ONCFS, pers. comm.).This low level of poaching seems closely related to the important protective presence on beaches. In French Guiana few if any leatherback nests are harvested by Amerindian or Creole inhabitants who prefer green or olive ridley eggs. Nests are subject to feral and domestic dog predation. The level of nest predation is relatively low at the West and has decreased in recent years (Girondot 2006). The level of predation could be higher in the East (de Thoisy, pers. comm.) but has not been evaluated. Jaguars occasionally prey on adult leatherback turtles on remote beaches of the Amana Nature Reserve. High levels of organochloride pesticides have been detected in the sand at the main nesting beach of French Guiana (Guirlet 2005). The consequences of this exposure are still unknown but could explain the low hatchling success for this beach (Girondot et al. In press). Major threats to leatherback turtles in French Guiana are now mostly ocean-based. Leatherback turtles in French Guiana regularly interact with coastal gillnets. This phenomenon was described in 1979 (Fretey 1979), and confirmed to be high in the Maroni estuary, and related to illegal fishing pressures (Chevalier 2001). Some 26 leatherback turtles were caught in coastal gillnets and released off the Cayenne/Montjoly nesting sites in 2003 (Gratiot et al 2003). An interview-based study has estimated that the leatherback turtle represents 70-85% of the marine turtles incidentally captured by coastal gill-netters in French Guiana (Delamare 2005). Injuries potentially related to interaction with fisheries (i.e. scars on shoulders, presence of a hook or piece of net) have been recorded on 8-10% of the nesting females on the Western oceanic nesting sites (Morisson et al. 2003). Leatherback turtle interactions with shrimp trawlers are known to occur off French Guiana coasts (Armag, pers. comm.). No information exists regarding potential interaction with long-liners, although sightings of nesting leatherback turtles with hooks imbedded are reported yearly. Suriname The major threat in Suriname is egg poaching, nearly 100% on unmonitored beaches. Even on beaches where STINASU is present, it occurs fairly regularly (De Dijn 2001, Hilterman and Goverse 2006, Y. Merton of STINASU pers. comm.). It is believed by the Amerindian as well as by another ethnic group that turtle eggs are aphrodisiacs. STINASU is not mandated to arrest poachers but does have programs to raise awareness. Alternative economic programs/ activities such as eco-tourism are implemented with the villagers. Having tourists and volunteers on the beaches during nesting season also assists in deterring poachers close to the accommodation. Beach erosion and feral dogs are only minor problems for leatherback nests in Suriname. For the 2001-2005 nesting seasons, between 9-18% of all nesting females showed injuries that were possibly fisheries related. Injuries were categorized as “machete or net scars and wounds” (83%
88
of all injuries), “hooks in flesh” or “propeller damage” (1%), “(partly) missing flippers or hind limbs” (16%). Some turtles showed multiple injuries. Current legal situation regarding sea turtle conservation in Suriname Marine turtles nest on the beaches within and just outside the Galibi Nature Reserve (GNR) and the Matapica Management Area. Within the nature conservation law these areas fall under management of the Suriname Forest Service, of the Ministry of Physical Planning, Land- and Forest management. Under the same law the marine turtles are protected: no part (eggs, shell, meat) of the turtles are to be collected year round. During nesting season permission is given to Amerindian villagers who live around the reserve for egg-collection for personal us; sale is forbidden. During the nesting season, shrimp trawlers are mandated to use turtle excluder devices. This participation is monitored by the Ministry of Agriculture, Animal Husbandry and Fisheries. Suriname Forest Service and the Nature Conservation Division (NCD), who have a permanent field-unit at the border of the GNR manned by game wardens, do the beach patrols. There is no permanent post for Matapica and the field-unit is understaffed. They rely on funding to increase control during the nesting-season. STINASU is mandated by NCD to do nature-research, nature-education and tourism activities within the nature reserves and protected areas. Within STINASU the Research Department has a marine turtle unit in charge of the monitoring during the nesting season. All stakeholders of the GNR are represented in the Galibi Nature Reserve Council: Nature Conservation Division, STINASU, Fisheries Service and a local village organization (STIDUNAL) (Y. Merton pers. comm.). Guyana Threats to leatherbacks in Guyana continue to be from hunting, egg collection and incidental capture in nearshore fisheries. Much of the nesting turtle slaughter has been prevented because of the presence of the monitoring crew for the majority of each nesting season since 1988. Egg collection has been mostly curtailed for this reason as well, but occasionally poached nests are found on remote stretches of beach. Incidental capture does continue, but efforts are made each year to close the fishery in nearshore waters adjacent to the nesting beach. These rules are not always respected, but the number of dead stranded leatherbacks has decreased dramatically in recent years. Brazil There is no significant alteration of the nesting habitat in Espírito Santo, egg poaching has been reduced to very low levels, and there is no subsistence hunting for sea turtles of any species (Thomé et al. in press). The main current challenges to sea turtle conservation in Espírito Santo are the incidental capture of sea turtles in artisanal fisheries operating close to nesting beaches and in industrial fisheries operating off the State coast, and offshore activities related to the oil industry. Africa Threats to sea turtles in Atlantic Africa include collection of eggs, harvest of females for consumption, oil exploitation activities, chemical and industrial pollution as well as sand mining. Logs that have broken loose from timber rafts often form fatal obstructions for females emerging on to the beach to nest. Erosion threatens some nesting beaches. However, one of the biggest threats for leatherbacks in Atlantic waters, particularly in the Gulf of Guinea, is probably accidental capture in fisheries. Hundreds of leatherbacks are thought to be caught by artisanal and commercial fisheries. Studies evaluating bycatch are slowly getting underway in some
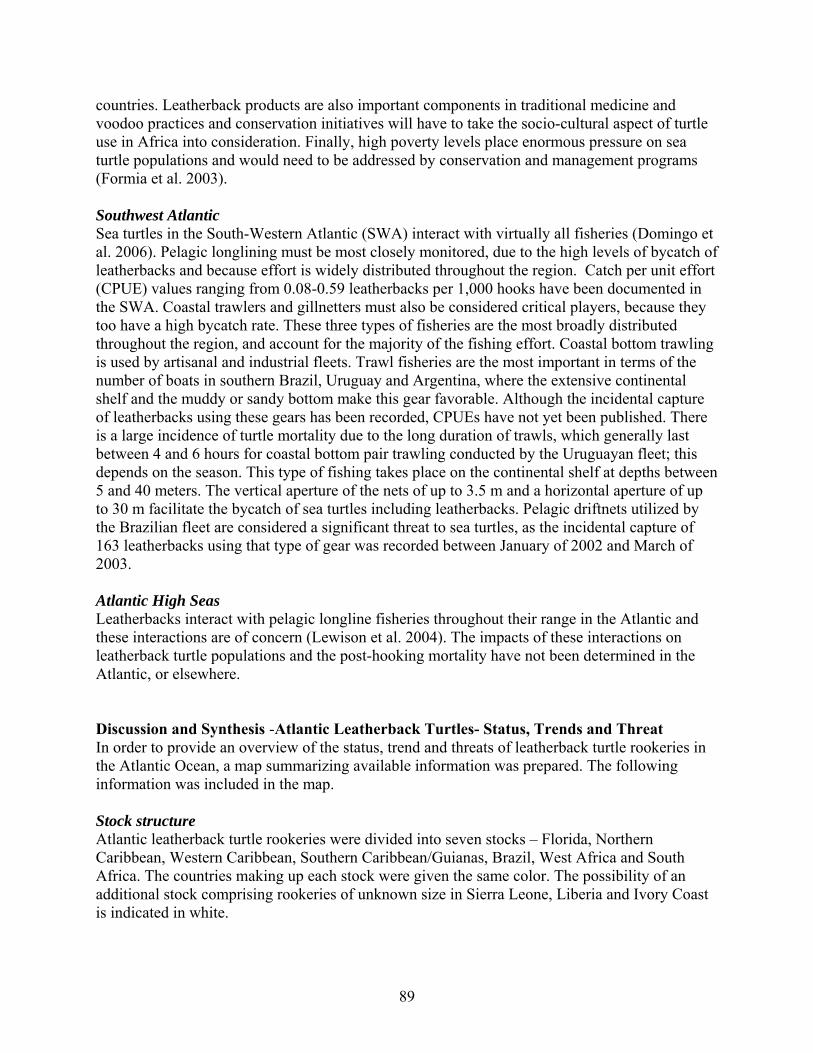
89
countries. Leatherback products are also important components in traditional medicine and voodoo practices and conservation initiatives will have to take the socio-cultural aspect of turtle use in Africa into consideration. Finally, high poverty levels place enormous pressure on sea turtle populations and would need to be addressed by conservation and management programs (Formia et al. 2003). Southwest Atlantic Sea turtles in the South-Western Atlantic (SWA) interact with virtually all fisheries (Domingo et al. 2006). Pelagic longlining must be most closely monitored, due to the high levels of bycatch of leatherbacks and because effort is widely distributed throughout the region. Catch per unit effort (CPUE) values ranging from 0.08-0.59 leatherbacks per 1,000 hooks have been documented in the SWA. Coastal trawlers and gillnetters must also be considered critical players, because they too have a high bycatch rate. These three types of fisheries are the most broadly distributed throughout the region, and account for the majority of the fishing effort. Coastal bottom trawling is used by artisanal and industrial fleets. Trawl fisheries are the most important in terms of the number of boats in southern Brazil, Uruguay and Argentina, where the extensive continental shelf and the muddy or sandy bottom make this gear favorable. Although the incidental capture of leatherbacks using these gears has been recorded, CPUEs have not yet been published. There is a large incidence of turtle mortality due to the long duration of trawls, which generally last between 4 and 6 hours for coastal bottom pair trawling conducted by the Uruguayan fleet; this depends on the season. This type of fishing takes place on the continental shelf at depths between 5 and 40 meters. The vertical aperture of the nets of up to 3.5 m and a horizontal aperture of up to 30 m facilitate the bycatch of sea turtles including leatherbacks. Pelagic driftnets utilized by the Brazilian fleet are considered a significant threat to sea turtles, as the incidental capture of 163 leatherbacks using that type of gear was recorded between January of 2002 and March of 2003. Atlantic High Seas Leatherbacks interact with pelagic longline fisheries throughout their range in the Atlantic and these interactions are of concern (Lewison et al. 2004). The impacts of these interactions on leatherback turtle populations and the post-hooking mortality have not been determined in the Atlantic, or elsewhere. Discussion and Synthesis -Atlantic Leatherback Turtles- Status, Trends and Threat In order to provide an overview of the status, trend and threats of leatherback turtle rookeries in the Atlantic Ocean, a map summarizing available information was prepared. The following information was included in the map. Stock structure Atlantic leatherback turtle rookeries were divided into seven stocks – Florida, Northern Caribbean, Western Caribbean, Southern Caribbean/Guianas, Brazil, West Africa and South Africa. The countries making up each stock were given the same color. The possibility of an additional stock comprising rookeries of unknown size in Sierra Leone, Liberia and Ivory Coast is indicated in white.
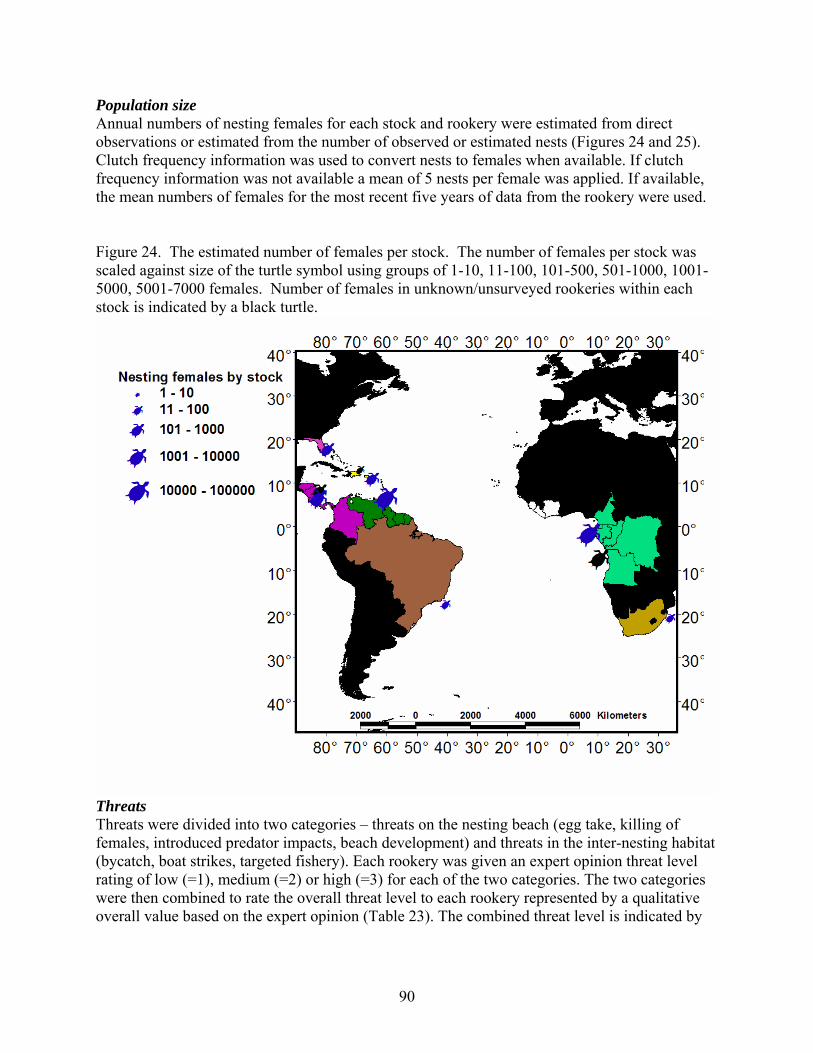
90
Population size Annual numbers of nesting females for each stock and rookery were estimated from direct observations or estimated from the number of observed or estimated nests (Figures 24 and 25). Clutch frequency information was used to convert nests to females when available. If clutch frequency information was not available a mean of 5 nests per female was applied. If available, the mean numbers of females for the most recent five years of data from the rookery were used. Figure 24. The estimated number of females per stock. The number of females per stock was scaled against size of the turtle symbol using groups of 1-10, 11-100, 101-500, 501-1000, 1001-5000, 5001-7000 females. Number of females in unknown/unsurveyed rookeries within each stock is indicated by a black turtle.
Threats Threats were divided into two categories – threats on the nesting beach (egg take, killing of females, introduced predator impacts, beach development) and threats in the inter-nesting habitat (bycatch, boat strikes, targeted fishery). Each rookery was given an expert opinion threat level rating of low (=1), medium (=2) or high (=3) for each of the two categories. The two categories were then combined to rate the overall threat level to each rookery represented by a qualitative overall value based on the expert opinion (Table 23). The combined threat level is indicated by
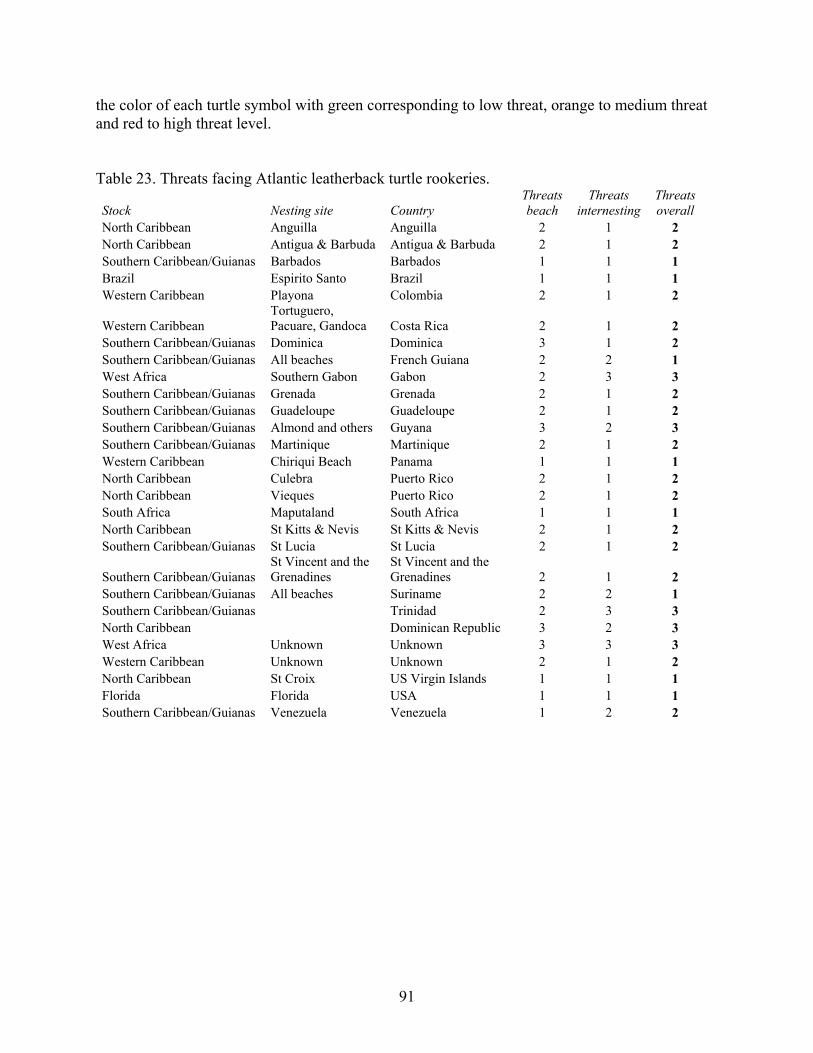
91
the color of each turtle symbol with green corresponding to low threat, orange to medium threat and red to high threat level. Table 23. Threats facing Atlantic leatherback turtle rookeries.
Stock Nesting site Country Threats beach
Threats internesting
Threats overall
North Caribbean Anguilla Anguilla 2 1 2 North Caribbean Antigua & Barbuda Antigua & Barbuda 2 1 2 Southern Caribbean/Guianas Barbados Barbados 1 1 1 Brazil Espirito Santo Brazil 1 1 1 Western Caribbean Playona Colombia 2 1 2
Western Caribbean Tortuguero, Pacuare, Gandoca Costa Rica 2 1 2
Southern Caribbean/Guianas Dominica Dominica 3 1 2 Southern Caribbean/Guianas All beaches French Guiana 2 2 1 West Africa Southern Gabon Gabon 2 3 3 Southern Caribbean/Guianas Grenada Grenada 2 1 2 Southern Caribbean/Guianas Guadeloupe Guadeloupe 2 1 2 Southern Caribbean/Guianas Almond and others Guyana 3 2 3 Southern Caribbean/Guianas Martinique Martinique 2 1 2 Western Caribbean Chiriqui Beach Panama 1 1 1 North Caribbean Culebra Puerto Rico 2 1 2 North Caribbean Vieques Puerto Rico 2 1 2 South Africa Maputaland South Africa 1 1 1 North Caribbean St Kitts & Nevis St Kitts & Nevis 2 1 2 Southern Caribbean/Guianas St Lucia St Lucia 2 1 2
Southern Caribbean/Guianas St Vincent and the Grenadines
St Vincent and the Grenadines 2 1 2
Southern Caribbean/Guianas All beaches Suriname 2 2 1 Southern Caribbean/Guianas Trinidad 2 3 3 North Caribbean Dominican Republic 3 2 3 West Africa Unknown Unknown 3 3 3 Western Caribbean Unknown Unknown 2 1 2 North Caribbean St Croix US Virgin Islands 1 1 1 Florida Florida USA 1 1 1 Southern Caribbean/Guianas Venezuela Venezuela 1 2 2
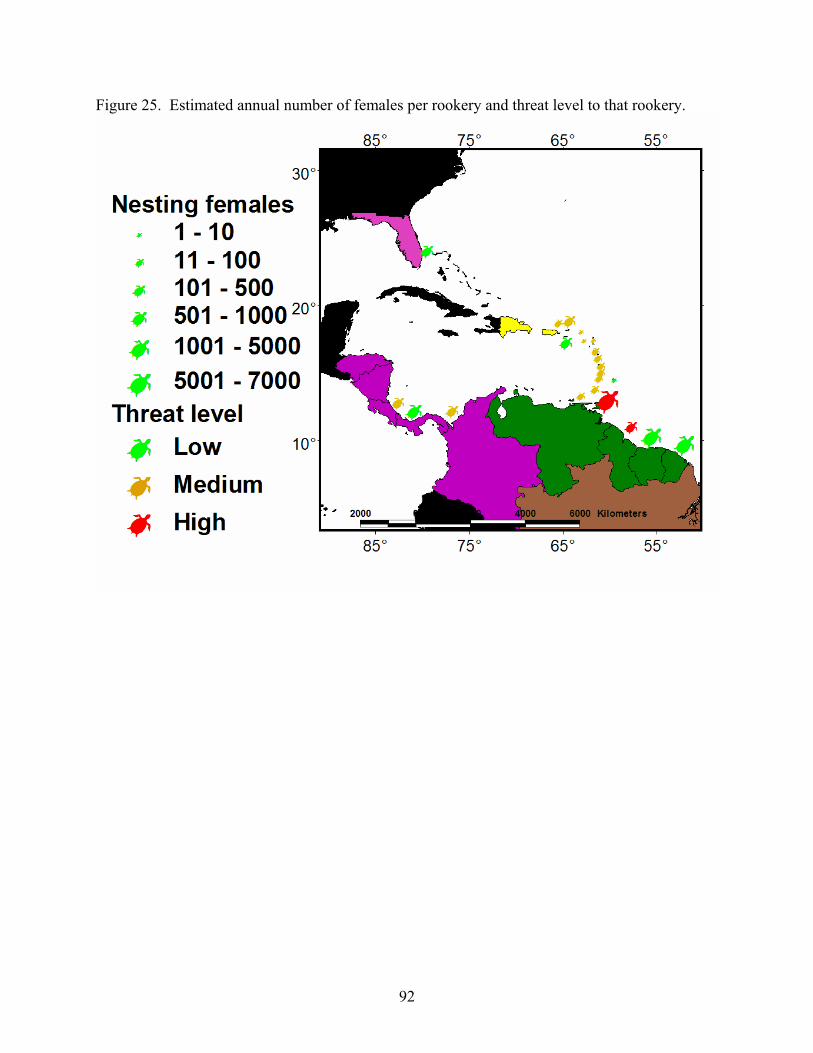
92
Figure 25. Estimated annual number of females per rookery and threat level to that rookery.
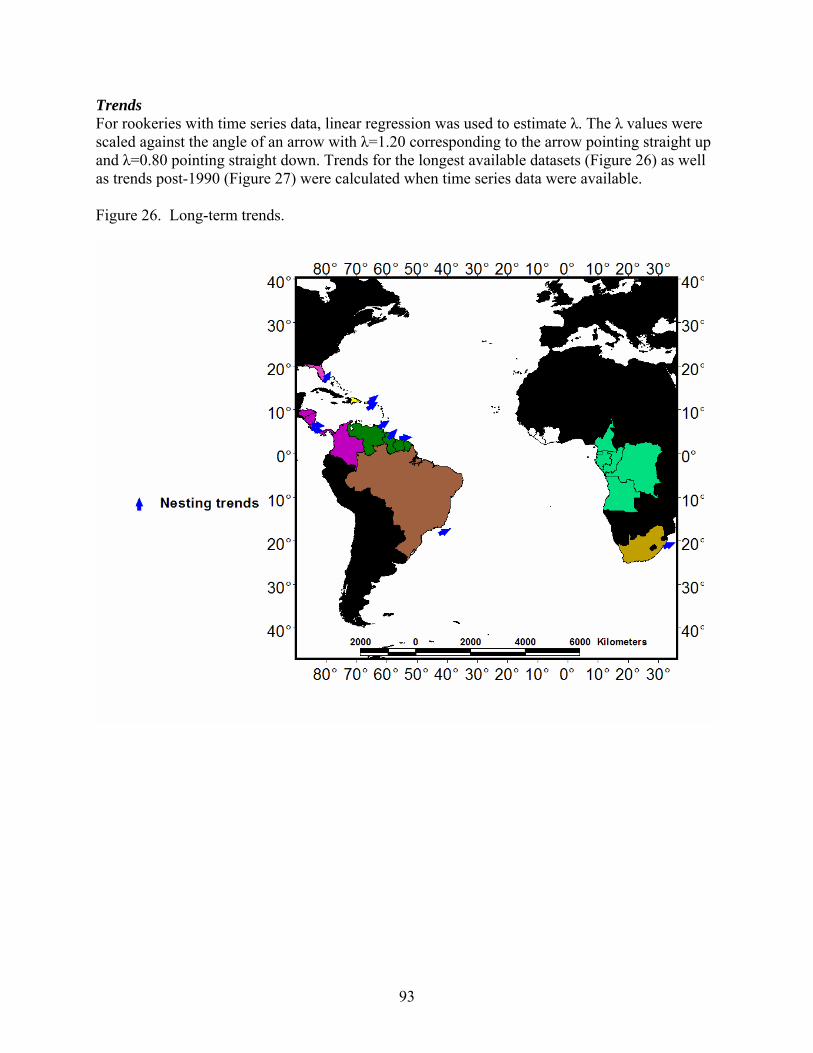
93
Trends For rookeries with time series data, linear regression was used to estimate λ. The λ values were scaled against the angle of an arrow with λ=1.20 corresponding to the arrow pointing straight up and λ=0.80 pointing straight down. Trends for the longest available datasets (Figure 26) as well as trends post-1990 (Figure 27) were calculated when time series data were available. Figure 26. Long-term trends.
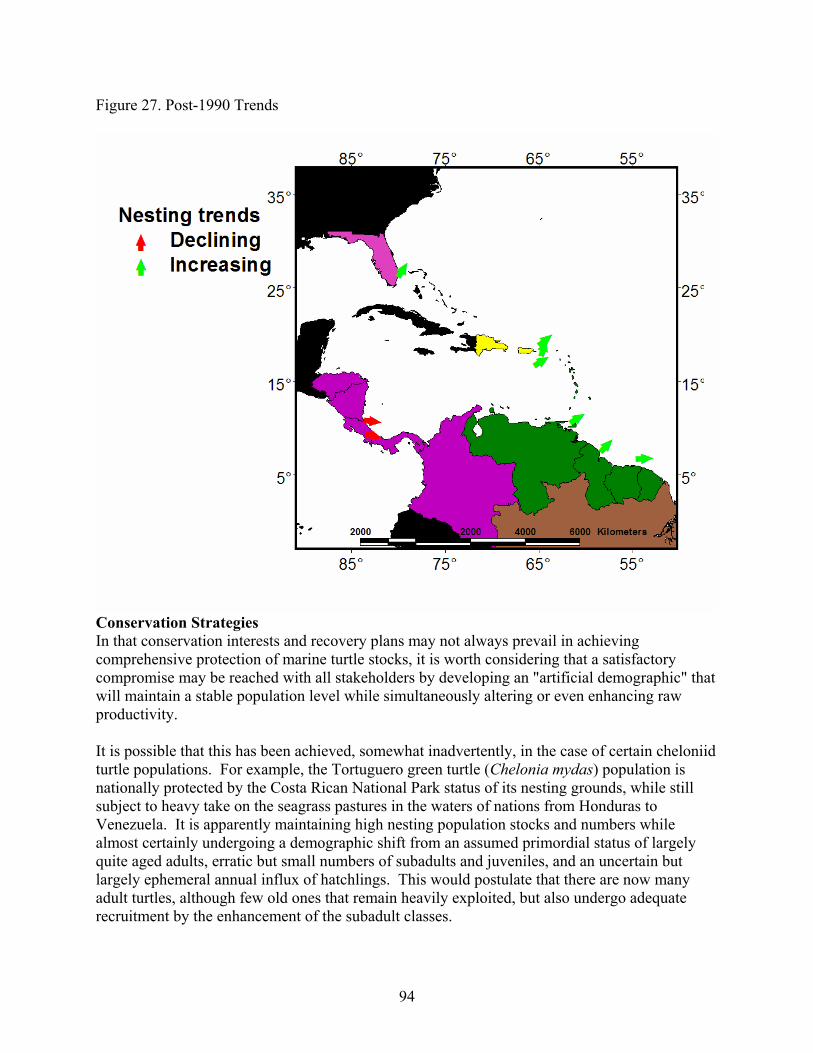
94
Figure 27. Post-1990 Trends
Conservation Strategies In that conservation interests and recovery plans may not always prevail in achieving comprehensive protection of marine turtle stocks, it is worth considering that a satisfactory compromise may be reached with all stakeholders by developing an "artificial demographic" that will maintain a stable population level while simultaneously altering or even enhancing raw productivity. It is possible that this has been achieved, somewhat inadvertently, in the case of certain cheloniid turtle populations. For example, the Tortuguero green turtle (Chelonia mydas) population is nationally protected by the Costa Rican National Park status of its nesting grounds, while still subject to heavy take on the seagrass pastures in the waters of nations from Honduras to Venezuela. It is apparently maintaining high nesting population stocks and numbers while almost certainly undergoing a demographic shift from an assumed primordial status of largely quite aged adults, erratic but small numbers of subadults and juveniles, and an uncertain but largely ephemeral annual influx of hatchlings. This would postulate that there are now many adult turtles, although few old ones that remain heavily exploited, but also undergo adequate recruitment by the enhancement of the subadult classes.
95
The Kemp's ridleys (Lepidochelys kempii) in Tamaulipas, Mexico, and also the olive ridleys (Lepidochelys olivacea) in Pacific Mexico, have both had histories of heavy exploitation, mainly of eggs in the former case and of adults in the latter. Later, instigation of good nesting beach protection was achieved in both cases. The Kemp's ridleys, after a generational delay, eventually responded with a steady annual increase in nests, and with the interesting detail of a change in mean female body mass from around 40 kg to around 30 kg, suggestive of an essentially youthful, newly recruited adult population. The olive ridleys at Escobilla, somewhat surprisingly, responded to the years of heavy industrial exploitation with a reasonably stable annual nesting population. Subsequently, in 1990, this exploitation was stopped and nesting numbers doubled in the following season and did not plateau until they reached about a million nestings per season several years later. These events assume that the impact of exploitation before the ban was offset by the very high hatchling production and survival, the beach being protected during the nesting season by armed Marines. But the population was prevented from increasing during these years by the industrial take, by which many, if not most, of the newly recruited adult females were slaughtered before the end of their first year of maturity. Possibly, the industrial take kept the population slightly below the level at which mutual nest destruction would become excessive. These examples illustrate the concept of stabilizing turtle populations at a certain size by generating an "artificial demographic," provoked by a combination of simultaneous stresses and enhancements that improve recruitment while accepting some level of otherwise intolerable anthropogenic take. It carries some level of risk because we lack the data to calibrate the switchover to the new demographic before it occurs, but it may be worth considering as an interim management strategy, especially in the face of external stresses that cannot, at present, be stopped. It is conceivable that the current widespread positive trends in western Atlantic leatherback populations represent an example of this phenomenon. Research Recommendations Efforts should be made to develop collaborative, international research plan on the dynamics of leatherbacks. Such a plan may include the use of stochastic simulation models to assess the relative sensitivity of leatherback dynamics to parameter uncertainty and set common research priorities to allow for the efficient use of limited funding. An international effort is clearly needed in order to understand stock structure and habitat use of leatherbacks.
• Nesting beach surveys must continue to be done as they provide a valuable assessment of
the nesting female population. However, methods need to be standardized to make valid comparisons among years and beaches. In addition, monitoring effort must be systematically and quantitatively documented. Without documenting effort, trends and projections become difficult, if not impossible, as monitoring effort and nests (or females) can be confounded. A review and standardization of methods to fill in missing observation nights and extrapolating to unsurveyed beaches would help improve
96
estimates of total nests. An analysis of nightly data may prove useful in demonstrating utility of sampling rather than nightly monitoring.
• In addition to nest counts, flipper and PIT tagging of nesting females would greatly
increase the available information and allow for the estimation of demographic parameters. More effort also is necessary to obtain precise estimates of remigration intervals, the number of nests per season, and the sex ratio of hatchlings. Within a nesting season, mark-recapture studies should be conducted to estimate the number of nesting females. Combined with data for multiple seasons, these mark-recapture studies can provide information on other vital rates, such as population growth rates and survival rates. Mark-recapture data should be shared among nesting beaches such that movement rates among nesting beaches can be determined. Multi-state and multi-site CMR models with robust design to analyze these data are lacking now but are needed.
• When available, nesting beach data should be analyzed to look for changes over time or
values of life history parameters such as: length-to-weight ratios of nesting females, nests per season, fecundity, remigration interval, etc. There is also a need to validate hatchling sex ratios and determine the effect of temperature in order to improve the ability to predict hatchling sex ratios and examine changes over time.
• In-water surveys also should be conducted to provide better understanding of distribution
in space and time for the Atlantic population as a whole as well as for each nesting assemblage. In conjunction with in-water surveys, satellite tagging of individuals can provide the necessary insight into leatherback use of habitat. Further, such information can provide critical data for computing the probability of interactions with fishing activities, if locations of fishing activities can be known.
• Validation of age and growth through captive rearing studies, bone growth assessment,
and tagging data should be continued in order to identify the age at first reproduction and the longevity of leatherbacks. Large scale making of hatchlings with dated tags could yield enough tag recoveries to contribute to the understanding of age and growth.
• A simple population dynamics model relating survival to age or stage could be
constructed to determine the combinations of values of life history that could be consistent with the observed rates of population change. In addition, an investigation of the effect of imprecision in individual nesting parameter statistics on the precision of the overall estimates of population size may improve such models.
• A review of the synchrony in leatherback nesting at all geographic scales, time series
analysis, autocorrelation and cross-correlation could be used to examine the effect of nesting synchrony on the estimation of population rates of change.
• A Bayesian model relating population trajectory to nesting beach counts, including
process error, synchronous periodic nesting behavior, and observational errors, could be investigated to make forward predictions.
97
• Research on the effects of environmentally driven changes in parameters, such as clutch frequency and remigration intervals, should be continued and expanded as they can have a profound effect on the interpretation of nesting beach trends. This should be a top priority.
• There is a need to get more and better data on bycatch numbers and mortality. Estimating
the mortality rate of leatherbacks due to fishery interactions remains a critical need for management. Fishery interactions are often implicated as a cause of turtle declines but as of yet there are no estimates of these mortality rates or definitive links between these interactions and negative population growth rates. Estimates of mortality rates and their effect on population growth rate would greatly enhance our understanding of leatherback population dynamics. Similarly, understanding the effect of egg poaching on population growth would enhance leatherback management.
• Genetic sampling should be continued, especially from beaches that have not been
sampled. Surveys from missing areas, such as the Caribbean and Africa, would greatly improve our understanding of genetic relationships of the various stocks. These genetic data need to be evaluated with relevant tagging data to further enhance our understanding of stock structure. In addition, sampling on the various foraging grounds can help identify the nesting assemblages using those foraging grounds. Genetic samples of hatchlings and neophytes can provide direct estimates of age at first reproduction in the future.
• Research on the effects of organochlorines (and other pollutants) on the viability of eggs
and the vigour of hatchlings should be initiated on beaches. Surveys of pathology, parasites, diseases, and contaminate load from nesters, bycatch, and strandings would allow provide better insight into the stressors on this species.
Acknowledgements We want to thank participants and state and national coordinators of the Sea Turtle Stranding and Salvage Network (STSSN) for the use of the United States stranding data. The analysis of telemetry data could not have been accomplished without the generous data contributions of Michael James (Dalhousie University); Scott Eckert (WIDECAST); Kelly Stewart (Duke University); Chris Johnson (Marinelife Center of Juno Beach); Sebastian Troëng (CCC); Carlos Drews (WWF); Milagros Lopez Mendilaharsu (Karumbé); Sandra Ferraroli, Sabrina Fossette, Jean-Yves Georges, and Yvon Le Maho (CNRS); Brendan Godley (Marine Turtle Research Group); Department of Fisheries and Marine Resources (DFMR); The Anguilla National Trust, Marine Conservation Society (MCS); Marine Turtle Research Group (MTRG); British Virgin Islands Conservation & Fisheries Department; and SEATURTLE.ORG. We appreciate assistance in analysis of these data by Scott Sherrill-Mix and Ransom Myers (Dalhousie University). We also greatly appreciate the contributions of Luciano Soares (Projeto TAMAR) and Brendan Godley (Marine Turtle Research Group) who allowed us to reference the tracks of recent satellite tag deployments in the South Atlantic. We also thank George Hughes, Ronel Nel, and Antonio de Paudo Almeida for providing information on the location of their tag recaptures and Gabriel Segniagbeto (Togo) and Hyacinthe Angoni (Cameroon) for use of unpublished data.
98
Literature Cited Agardy, T. 1993. Report of a mission to the Bijagos Archipelago, 10-18 February 1993. Miméograph, 4 p. Aiken, J.J., B.J. Godley, A.C. Broderick, T. Austin, G. Ebanks-Petrie, and G.C. Hays. 2001. Two hundred years after a commercial marine turtle fishery: the current status of marine turtles nesting in the Cayman Islands. Oryx 35: 145-151. Alexander, J., S. Deishley, K. Garrett, W. Coles, and D. Dutton. 2002. Tagging and nesting research on leatherback sea turtles (Dermochelys coriacea) on Sandy Point, St. Croix, U.S. Virgin Islands, 2002. Annual Report to Fish and Wildlife Service. Alexander, J., K. Garrett, J. Conrad, W. Coles, and P. Dutton. 2003. Tagging and nesting research on leatherback sea turtles (Dermochelys coriacea) on Sandy Point, St. Croix, U.S. Virgin Islands, 2003. Annual Report to Fish and Wildlife Service. Amiteye, B.T. 2000. Distribution and some aspects of the reproductive biology of sea turtles in Ghana. M.Sc. Thesis, University of Ghana, Ghana. Anonymous. 1774. Réglement de la peche a la Tortüe. in Unpublished manuscript. Association Kwata. Les tortues marines sur l'Est de la Guyane: bilan de l'année 2004. Suivi des populations, éducation à l'environnement, potentiel touristique. Guyane (FR): Kwata, décembre 2004. 40p. Augustinus, P.G.E.F., 1978. The changing shorelines of Suriname (South America). Natuurwetenschappelijke Studiekring voor Suriname en de Nederlandse Antillen, Utrecht, the Netherlands, No. 95, 232p. Bacon, P.R. 1970. Studies on the Leatherback Turtle, (L) in Trinidad, West Indies. Biol Cons 2, 213_217. Barata, P.C.R., E.H.S.M. Lima, M. Borges-Martins, J.T. Scalfoni, C. Bellini, and S. Siciliano. 2004. Records of the leatherback sea turtle (Dermochelys coriacea) on the Brazilian coast, 1969-2001. Journal of the Marine Biological Association of the UK, 84:1233-1240. Barnett, L.K., C. Emms, A. Jallow, A. Mbenga Cham, and J.A. Mortimer. 2004. The distribution and conservation status of marine turtles in The Gambia, West Africa: a first assessment. Oryx 38:203-208. Barreiros, J.P., and J. Barcelos, 2001. Plastic ingestion by a leatherback turtle Dermochelys coriacea from the Azores (NE Atlantic). Marine Pollution Bulletin 42:1196-1197. Barrère, P. 1741. Essai sur l'histoire naturelle de la France équinoxiale. Piget, Paris, France.
99
Barrioz, S., J.F. Szpigel, I. Nolibos, J. Gratiot, I. Vogel, and B. De Thoisy. 2003. Suivi des pontes de tortues marines sur l'Est Guyanais. Guyane (FR): Kwata/SEPANGUY/DIREN-Guyane, janvier 2003. 32p. Berry, F. 1987. Aerial and ground surveys of Dermochelys coriacea nesting in Caribbean Costa Rica, 1987. In: Proceedings of the Second Western Atlantic Turtle Symposium. NOAA Technical Memorandum, NMFS-SEFC-226, 305-310. Biet, A. 1664. Voyage de la France Equinoxiale en l’Isle de Cayenne, en l'année 1652. Paris. Billis, A., J.-Y. Georges, S. Fossette, J. Tiwari, and J. Fretey. 2006a. Movements of Eastern Atlantic leatherbacks during and after the nesting season : conservation implications at the Atlantic scale. P. 81 in : Frick, M., Panagopoulou, A., Rees, A. F., & K. Williams (Comp.), Book of Abstracts. 26th Annual Symposium on Sea Turtle Biology and Conservation, Island of Crete, Greece, 3-6 April 2006, 376 pp. Billes, A., J. Fretey, B. Verhage, B. Huijbregts, B. Giffoni, L.Prosdocimi, D.A. Albareda, J-Y. Georges, and M. Tiwari. 2006b. First evidence of leatherback movement from Africa to South America. Mar. Turtle Newsletter 111: 13-14. Bjorndal. K.A., A.B. Bolten, and M.Y. Chaloupka. 2000. Green turtle somatic growth model: evidence for density dependence. Ecological Applications 10:269-282. Block, B.A. 2005. Physiological Ecology in the 21st Century: Advancements in Biologging Science. Integrative and Comparative Biology 45:305–320 . Boulon, R.H., P.H. Dutton, and D. McDonald. 1996. Leatherback turtles (Dermochelys coriacea) on St. Croix, U.S. Virgin Islands: Fifteen years of conservation. Chelonian Conservation and Biology. 2(2): 141-147. Broderick, A.C., F. Glen, B. J. Godley, and G. C. Hays. 2002. Estimating the number of green and loggerhead turtles nesting annually in the Mediterranean. Oryx 36:227-335. Brongersma, L.D. 1972. Ocean records of turtles (North Atlantic Ocean). In: IUCN (1971). Proceedings of the second working meeting of marine turtle specialists. IUCN Publications New Series. Supplementary Paper No. 31, 109p., pp.103-108. Cambers, G., and L. Halstead. 1990. Leatherback turtles disappearing from the BVI. Marine Turtle Newsletter. 49:4-7. Campbell, C.L., C.J. Lagueux, and J.A. Mortimer. 1996. Leatherback turtle, Dermochelys coriacea, nesting at Tortuguero, Costa Rica, in 1995. Chelonian Conservation and Biology 2: 169-172.
100
Carr, A.F. 1952. Handbook of Turtles: The Turtles of the United States, Canada and Baja California. Ithaca, NY: Comstock Publishing Associates, division of Cornell University Press, 542 p. Carr, T. and C.L. Campbell. 1995. A management strategy outline for marine turtle conservation in Ghana. Appendix I : Survey of the Sea Turtles of Ghana. Report to the Wildlife Department, Republic of Ghana, Mimeograph, 23 p. Carr, T. and N. Carr. 1983. Survey of the Sea Turtles of Angola. A Report to the New York Zoological Society, 14 p. Carr, T. and N. Carr. 1991. Surveys of the sea turtles of Angola. Biological Conservation 58:19-30. Carr, A. & L. Ogren. 1959. The ecology and migrations of sea turtles, 3, Dermochelys in Costa Rica. American Museum Novitates. 29 p. Casale, P., P. Nicolosi, D. Freggi, M. Turchetto, and R. Argano. 2003. Leatherback turtles (Dermochelys coriacea) in Italy and in the Mediterranean basin. Herpetological Journal 13:135-139. Chacón, D., W. McLarney, C. Ampie, and B. Venegas. 1996. Reproduction and conservation of the leatherback sea turtle Dermochelys coriacea (Testudines: Dermochelyidae) on Gandoca Beach. Costa Rica. Revista de Biología Tropical 44:853-860. Chacón, D. 1999. Anidación de la tortuga Dermochelys coriacea (Testudines: Dermochelyidae) en playa Gandoca, Costa Rica (1990 a 1997). Revista de Biología Tropical 47: 225-236. Chacón, D. & Eckert, K.L. in review. Chelonian Conservation and Biology. Chevalier, J., 2000. Etude des captures accidentelles de tortues marines lies a la Pêche dans l'Oqest Guyanais. Direction Régionale de l’Environnent Guyane, Cayenne, French Guiana, 23p. Chevalier, J., and M. Girondot. 1998. Dynamique de pontes des Tortues luths en Guyane française durant la saison 1997. Bull. Soc. Herp. Fr. 85-86:5-19. Chevalier, J., and M. Girondot, 2000. Recent population trend for Dermochelys coriacea in French Guiana. In: F.A. Abreu-Grobois, R. Briseño-Dueñas, R. Márquez, and L. Sarti (Compilers), 2000. Proceedings of the eighteenth annual symposium on sea turtle biology and conservation. NOAA Technical Memorandum NMFS-SEFC-436, 293p., pp.56-57 Chevalier, J., B. Cazelles, and M. Girondot. 1998. Apports scientifiques à la conservation des Tortues luths en Guyane Française. Journal d'Agriculture Tropicale et de Botanique Appliquée Revue d’Ethnobiologie 40(1-2):485-507.
101
Chevalier, J., X. Desbois, and M. Girondot. 1999. The reason of decline of Leatherback turtles (Dermochelys coriacea) in French Guiana: an hypothesis. Pages 79-87 in C. Miaud, and R. Guyétant, editors. Current studies in Herpetology. Proceedings of the ninth ordinary general meeting of the Societas Europaea Herpetologica, 478p. Conley, W.J., and B.A. Hoffman. 1987. Nesting activity of sea turtles in Florida USA 1979-1985. Florida Sci. 50:201-210. Crouse, D.T., L.B. Crowder, and H. Caswell. 1987. A stage-based population model for loggerhead sea turtles and implications for conservation. Ecology 68: 1412-1423. de Haro, A., S. Troëng, P. Antman, V. Castillo, P. Garcés, C. Frohlich, A. Marin, I. Palomares, L. Reinhold, A. Sagone, and E. Vargas. 2006. Report on the 2005 leatherback program at Tortuguero, Costa Rica. Unpublished report by the Caribbean Conservation Corporation to the Ministry of Environment and Enery of Costa Rica, San José. Delamare, A. 2005. Estimation des captures accidentelles de tortues marines par les fileyeurs de la pêche côtière en Guyane. Mémoire de fin d’études pour l’obtention du Diplôme d’Agronomie Approfondie, Spécialisation Halieutique. Agrocampus de Rennes - WWF, 45 p. Dennis, B., P.L. Munholland, and J. M. Scott. 1991. Estimation of growth and extinction parameters for endangered species. Ecological Monographs 61:115-143. Deraniyagala, P.E.P. 1939. Order Testudinata. In: The Tetrapod Reptiles of Ceylon. Vol. 1. Testudinates and Crocodilians. Ceylon Journal of Science. Colombo Museum Natural History Series. Colombo Museum, Colombo, Sri Lanka, and Dulau and Co., Ltd., London.; 412p. De Thoisy, B., G. Talvy, I. Nolibos, S. Barrioz, J.F. Szpigel, and I. Vogel. Suivi des pontes de tortues marines sur l'Est Guyanais. Guyane (FR): Kwata/SEPANGUY/DIREN-Guyane, janvier 2002. 24 p. Dijn, B. de, 2001. Country report Suriname. In: A. Schouten, K. Mohadin, S. Adhin, and E. McClintock (Editors), 2001. Proceedings of the fifth regional marine turtle symposium for the Guianas. STINASU and WWF-Guianas, 69p., pp.22-26. Domingo, A., L. Bugoni, L. Prosdocimi, P. Miller, M. Laporta, D.S. Monteiro, A. Estrades snf D. Albareda. 2006. The impact generated by fisheries on Sea Turtles in the Southwestern Atlantic. WWF Progama Marino para Latinoamérica y el Caribe, San José, Costa Rica Dominici, G.O. 1996. Montioreo de anidamientos de tortuga tinglar Dermochelys coriacea en playas bel Parque National Jaragua. Memoria del II Congreso del al BIodiversidad Caribeña. Santo Domingo, República Dominicana. 17-17 Enero 1996. Duguy, R. 1997. Les tortues marines dans le Golfe de Gascogne. Annales de la Société des Sciences Naturelles de la Charente-Maritime 8:633-645.
102
Duguy, R., P. Moriniere, and A. Meunier. 1998. Observations de tortues marines en 1997 (Atlantique). Annales de la Société des Sciences Naturelles de la Charente-Maritime 8 :281-779. Duguy, R., P. Moriniere, and A. Meunier. 1999. Observations de tortues marines en 1998 (Atlantique). Annales de la Société des Sciences Naturelles de la Charente-Maritime 8:911-924. Duguy, R., P. Moriniere, and A. Meunier. 2000. Observations de tortues marines en 1999 (Atlantique et Manche). Annales de la Société des Sciences Naturelles de la Charente-Maritime 8:1025-1034. Duguy, R., P. Moriniere, and A. Meunier. 2001. Observations de tortues marines en 2000 (Atlantique et Manche). Annales de la Société des Sciences Naturelles de la Charente-Maritime 9:17-25. Duguy, R., P. Moriniere, and A. Meunier. 2002. Observations de tortues marines en 2001 (Atlantique et Manche). Annales de la Société des Sciences Naturelles de la Charente-Maritime 9:161-172. Duguy, R., P. Moriniere, and A. Meunier. 2003. Observations de tortues marines en 2002 (Atlantique et Manche). Annales de la Société des Sciences Naturelles de la Charente-Maritime 9:265-273. Duguy, R., P. Moriniere, and A. Meunier. 2004. Observations de tortues marines en 2003 (côtes atlantiques). Annales de la Société des Sciences Naturelles de la Charente-Maritime 9:361-366. Duguy, R., P. Moriniere, and A. Meunier. 2005. Observations de tortues marines en 2004 (côtes atlantiques). Annales de la Société des Sciences Naturelles de la Charente-Maritime 9:461-466. Dupuy, A.R. The status of marine turtles in Senegal. Marine Turtle Newsletter 39:4-7. Duque, V.M., V.P. Paez, and J.A. Patino. 2000. Ecologia de anidacion y conservacion de la tortuga cana, Dermochelys coriacea, en la Playona, golfo de Uraba Chocoano (Colombia), en 1998. Actual Biol 22: 37-53. Dutton, P.H. 1996. Use of molecular markers for stock identification, fingerprinting, and the study of mating behavior in leatherback turtles. In Bowen, B.W. And W.N. Witzell (eds.) “Proceedings of the International Symposium on Sea Turtle Conservation Genetics”. NOAA Technical Memorandum NMFS-SEFSC-396:79-86. Dutton, P.H. In Press. Geographic variation in foraging strategies of leatherbacks: A hedge against catastrophe? Proceedings of the 26th Annual Symposium on Sea Turtle Biology and Conservation. NOAA Tech. Memo. Dutton, P.H., B.W. Bowen, D.W. Owens, A. Barragan, and S.K. Davis. 1999. Global phylogeography of the leatherback turtle, Dermochelys coriacea: shallow phylogenetic history in an ancient organismal lineage. Journal of Zoology 248:397-409.
103
Dutton, D.L., P.H. Dutton, M. Chaloupka, and R.H. Boulon. 2005. Increase of a Caribbean leatherback turtle Dermochelys coriacea nesting population linked to long-term nest protection. Biological Conservation 126:186-194. Dutton, P.H., Roden, S., Garrison, L., and Hughes, G. In Press. Genetic population structure of leatherbacks in the Atlantic eluciated by microsatellite markers. Proceedings of the 22nd Annual Symposium on Sea Turtle Biology and Conservation. NOAA Tech. Memo. Eckert, S.A. 1998. Perspectives on the use of satellite telemetry and other electronic technologies for the study of marine turtles, with reference to the first year long tracking of leatherback sea turtles. In: S.P. Epperly and J. Braun (Compilers), 1998. Proceedings of the seventeenth annual symposium on sea turtle biology and conservation. NOAA Technical Memorandum NMFS-SEFSC-415, 294p., pp.46-48. Eckert, S.A. 2002. Distribution of juvenile leatherback sea turtle Dermochelys coriacea sightings. Marine Ecology Progress Series 230:289-293. Eckert, S.A. 2006. High-use areas for Atlantic leatherback sea turtles (Dermochelys coriacea) as identified using satellite telemetered location and dive information. Marine Biology 149:1257-1267. Eckert, S., D. Bagley, S.Kubis, L. Ehrhart, C. Johnson, K. Stewart, D. DeFreese. 2006. Internesting, post-nesting movements and foraging habitats of leatherback sea turtles (Dermochelys coriacea) nesting in Florida. Chelonian Conservation and Biology 5:239-248. Eckert, S.A. and K.L. Eckert. 2005. Size and status of insular Caribbean leatherback nesting populations. Presentation at CCC Leatherback Retreat, St. Catherine’s Island, GA. January 2005. Eguchi, T., P.H. Dutton, S.A. Garner, and J. Alexander-Garner. 2006. Estimating juvenile survival rates and age at first nesting of leatherback turtles at St. Croix, US Virgin Islands. Abstract. Proceedings of the 26th Annual Symposium on Sea Turtle Biology and Conservation. U.S. Department of Commerce. NOAA Technical Memorandum NMFS-SEFSC. Epperly, S., L. Belskis, and L. Stokes. In press. Using passive integrated transponder (PIT) RFID equipment. Proceedings of the 25th Annual Sea Turtle Symposium. U.S. Department of Commerce. NOAA Technical Memorandum NMFS-SEFSC. Epperly, S., L. Avens, L. Garrison, T. Henwood, W. Hoggard, J. Mitchell, J. Nance, J. Poffenberger, C. Sasso, E. Scott-Denton, and C.d Yeung. 2002. Analysis of sea turtle bycatch in the commercial shrimp fisheries of southeast U.S. waters and the Gulf of Mexico. U.S. Department of Commerce, NOAA Technical memorandum NMFS-SEFSC-490. 88 p. Ernst, C.H. and M.J. Gilroy. 1979. Are leatherback turtles, Dermochelys coriacea, common along the middle Atlantic coast? Bulletin Maryland Herpetological Society. 15:16-19.
104
Ferraroli, S. 2004. Etude de désplacments en mer de tortues luths nidifiant sur le plateau de Guyanes: contribution à leur conservation. Ph.D. dissertation. L’Universite Louis Pasteur, Strasbourg, France, 130 p. Ferraroli, S., J.Y. Georges, P. Gaspar, and Y. Le Maho. 2004a. Where leatherback turtles meet fisheries. Nature 429:521-522. Ferraroli, S., F. Séhoe, and L. Kelle. Campagne Kawana 2004b. Rapport d’activité. Direction Régionale de l’Environmnet – Guyane et de WWF-France, 21p. Florida Fish and Wildlife Conservation Commission (FMRI). 2003. Reported nesting activity of the leatherback turtle, Dermochelys coriacea in Florida, 1993-2002. 37 p. Formia A., M. Tiwari, J. Fretey, and A. Billes. 2003. Sea Turtle Conservation along the Atlantic Coast of Africa. Marine Turtle Newsletter 100:33-37. Fournillier, K. and K.L. Eckert. 1999. DRAFT Sea Turtle Recovery Action Plan for Trinidad and Tobago. 132. Caribbean Environment Programme, Kingston, Jamaica. Fretey, J. 2001. Biogeography and Conservation of Marine Turtles of the Atlantic Coast of Africa / Biogéographie et conservation des tortues marines de la côte atlantique de l’Afrique. CMS Technical Series Publication, n° 6, UNEP/CMS Secretariat, Bonn, Germany, 429 pp. Fretey, J. and R. Bour. 1980. Redecouverte du type de Dermochelys coriacea (Vandelli) (Testudinata, Dermochelyidae). Bollecttino Zool. 47:193-205. Fretey, J. and J.P. Malaussena. 1991. Sea turtle nesting in Sierra Leone, West Africa. Marine Turtle Newsletter 54:10-12. Fretey, J. and M. Girondot, 1996. Leatherback Turtles, Dermochelys coriacea, Nesting in French Guiana, 1978-1995. Chelonian Conservation and Biology 2: 204-208. Fretey, J. J.F. Dontaine, and O. Neves. 1999. São Tomé et Príncipe : zone de croissance pour les tortues-luths? NDIVA Complément Écosystèmes Marins Canopée 15:i-ii. Fretey, J., A. Billes, and M. Tiwari. In review. Status of leatherback, Dermochelys coriacea, populations in Atlantic Africa. Chelonia Conservation and Biology. FWRI. 2006. Leatherback nesting in Florida. http://www.floridamarine.org/features/category_main.asp?id=1289 Garner, J.A., S.A. Garner, and W. Coles. 2005. Tagging and nesting research on leatherback sea turtles (Dermochelys coriacea) on Sandy Point, St. Croix, U.S. Virgin Islands, 2005. Annual Report to Fish and Wildlife Service.
105
Garrison, L.P. 2002. Estimated bycatch of marine mammals and turtles in the U.S. Atlantic Pelagic Longline Fleet during 2001-2002. NOAA Technical Memorandum NMFS-SEFSC-515, 52p.
Garrison, L.P. 2003. Estimated bycatch of marine mammals and turtles in the U.S. Atlantic Pelagic Longline Fleet during 2001-2002. NOAA Technical Memorandum NMFS-SEFSC-515, 60p. WITH ERRATUM.
Garrison, L.P. and P.M. Richards. 2004. Estimated Bycatch of Marine Mammals and Turtles in the U.S. Atlantic Pelagic Longline Fleet During 2003. NOAA Technical Memorandum NMFS-SEFSC-527, 57p.
Gelman, A., J.B. Carlin, H.S. Stern, and D.B. Rubin. 2003. Bayesian Data Analysis. Second edition. Chapman and Hall/CRC, Boca Raton, FL. Girondot M. 2006. Comportement alimentaire des prédateurs de tortues marines en dehors de la saison de ponte ; vers un contrôle non-destructif de la population de chiens errants. In: Rapport pour le Secrétariat d'Etat à l'Outremer. Orsay, France: Laboratoire d'Ecologie, Systématique et Evolution, 2006: 44. Girondot, M., and J. Fretey, 1996. Leatherback turtles, Dermochelys coriacea, nesting in French Guiana, 1978-1995. Chelonian Conservation and Biology 2:204-208. Girondot, M., M.H. Godfrey, L. Ponge, and P. Rivalan. In press. Historical records and trends of leatherbacks in French Guiana and Suriname. Chelonian Conservation and Biology. Girondot, M., P. Rivalan, R. Wongsopawiro, J.-P. Briane, V. Hulin, S. Caut, E. Guirlet, and M.H. Godfrey. 2006. Phenology of marine turtle nesting revealed by a statistical model of the nesting season. BMC Ecology 6:11. Godfrey, M.H., R. Barreto, and N. Mrosovsky. 1996. Estimating past and present sex ratios of sea turtles in Suriname. Canadian Journal of Zoology 74:267-277. Godfrey, M.H. and N. Mrosovsky. 1999. Estimating hatchling sex ratios. In: K.L. Eckert, K.A. Bjorndal, F.A. Abreu-Grobois, and M. Donnelly (Editors). Research and management techniques for the conservation of sea turtles. IUCN/SSC Marine Turtle Specialist Group Publication No. 4, 235p., pp.113-135 Godley, B.J., A.C. Broderick, L.M. Campbell, S. Ranger, and P.B. Richardson. 2004. An Assessment of the Status and Exploitation of Marine Turtles in the UK Overseas Territories in the Wider Caribbean. Final Project Report for the Department of Environment, Food and Rural Affairs and the Foreign and Commonwealth Office. 253 p. (TCOT final report). Goff G.P., J. Lien, and J. Fretey. 1994. The migration of a tagged leatherback turtle, Dermochelys coriacea, from French Guiana, South America, to Newfoundland, Canada, in 128 days. Canadian Field-Naturalist 108:72-73.
106
Gomez J. 2005. Marine turtles in Ivory Coast (West Africa). In Coyne, M. S. ,Clark, R. D. (Compilers). Pages: 180-182. Proceedings of the Twenty-First Annual Symposium on Sea Turtle Biology and Conservation. NOAA Technical Memorandum NMFS-SEFSC-528. Goupy des Marets, J. 1675 - 1676, 1687 - 1690. A la Guyanne a la fin du XVII ème siècle. G. Debien, Université de Dakkar. Goverse, E., and M.L. Hilterman, 2003. Leatherbacks stuck in the mud: a matter of life or death? In: J.A. Seminoff (Compiler), 2003. Proceedings of the twenty-second annual symposium on sea turtle biology and conservation. NOAA Technical Memorandum NMFS-SEFC-503, 308p., pp.145. Goverse, E., and M.L. Hilterman, and M.H. Godfrey. 2006. Sand temperature profiles of three major leatherback (Dermochelys coriacea) nesting beaches in Suriname 2000-2002. In: Pilcher, H.J. (Compiler). Proceedings of the twenty-third annual symposium on sea turtle biology and conservation. NOAA Technical Memorandum NMFS-SEFSC-536, 261p., pp.11-13. Gratiot, J., J. Barrioz,, J.F. Szpigel, E. Souka, and B. De Thoisy. Suivi des populations de tortues marines de l'Ile de Cayenne. Guyane (FR). Kwata/ONCFS/DIREN-Guyane, décembre 2003. 42p. Gratiot, N., J. Gratiot, L. Kelle, and B. de Thoisy. 2006. Estimation of a turtle nesting season from incomplete data: Statistical adjustment of a sinusoidal function. Animal Conservation 9:95- 102. Guada, H.J., M. Malavar, M. de los Angeles Rondón Médicci, E. Fajardo, A. Jardim, and A. Humanes. In press. Moving forward in the research and conservation efforts of the most important leatherback turtle nesting beaches in the Venezuelan mainland. Proceedings of the twenty-fifth annual symposium on sea turtle biology and conservation. NOAA Technical Memorandum NMFS-SEFSC. Guirlet, E. 2005. Ecotoxicologie et écologie de la réussite d'incubation chez la tortue luth, Dermochelys coriacea, en Guyane française [Ecotoxicology and Ecology of Hatching Success in the Leatherback Turtle, Dermochelys coriacea, in French Guiana]. Master Ecologie, Biodiversité et Evolution. Orsay, France: Université Paris Sud et CNRS.
Hasting, M. 2003. A conservation success: Leatherback turtles in the British Virgin Islands. Marine Turtle Newsletter. 99:5-7. Hays, G.C., J.D.R. Houghton, and A.E. Myers. 2004. Pan-Atlantic leatherback turtle movements. Nature 429:522. Hildebrand, H. 1987. A reconnaissance of beaches and coastal waters from the border of Belize to the Mississippi River as habitats for marine turtles. Final report by U.S. Fish and Wildlife Service, Region 2, Albuquerque, NM to NOAA/NMFS/SEFS Panama City Lab, FL (purchase order #NA-84-CF-A-134), 63 p.
107
Hilterman, M.L. 2001. The sea turtles of Suriname, 2000. Guianas Forests and Environmental Conservation Project (CFECP). Technical Report, World Wildlife Fund Guianas/Biotopic Foundation, Amsterdam, the Netherlands, 63p. http://www.seaturtle.org/pdf/Hilterman_2001_Biotopic.pdf Hilterman, M.L., and E. Goverse. 2002. Aspects of nesting and nest success of the leatherback turtle (Dermochelys coriacea) in Suriname, 2001. Guianas Forests and Environmental Conservation Project (CFECP). Technical Report, World Wildlife Fund Guianas/Biotopic Foundation, Amsterdam, the Netherlands, 34p. http://www.seaturtle.org/pdf/Hilterman_2002_WWFReport.pdf Hilterman, M.L., and E. Goverse, 2003. Aspects of nesting and nest success of the leatherback turtle (Dermochelys coriacea) in Suriname, 2002. Guianas Forests and Environmental Conservation Project (CFECP). Technical Report, World Wildlife Fund Guianas/Biotopic Foundation, Amsterdam, the Netherlands, 31p. http://www.seaturtle.org/pdf/Hilterman_2003_Biotopic.pdf Hilterman, M.L., and E. Goverse, 2004. Annual report on the 2003 Leatherback Turtle Research and Monitoring Project in Suriname. World Wildlife Fund - Guianas Forests and Environmental Conservation Project (WWF-GFECP) Technical Report of the Netherlands Committee for IUCN (NC-IUCN), Amsterdam, the Netherlands, 21p. http://www.seaturtle.org/pdf/Hilterman_2004_NC-IUCN.pdf Hilterman, M.L., and E. Goverse. 2005. Annual Report on the 2004 Leatherback Turtle Research and Monitoring Project in Suriname. World Wildlife Fund - Guianas Forests and Environmental Conservation Project (WWF-GFECP) Technical Report of the Netherlands Committee for IUCN (NC-IUCN), Amsterdam, the Netherlands, 18p. http://www.seaturtle.org/gforum/gforum.cgi?do=post_attachment;postatt_id=348;guest=4448132 Hilterman, M.L., and E. Goverse. 2006. Annual Report on the 2005 Leatherback Turtle Research and Monitoring Project in Suriname. World Wildlife Fund – Guianas Forests and Environmental Conservation Project (WWF-GFECP) Technical Report of the IUCN Netherlands Committee (IUCN NL), Amsterdam, the Netherlands, 19p. http://www.seaturtle.org/gforum/gforum.cgi?do=post_attachment;postatt_id=348;guest=4448132 Hilterman, M.L., and E. Goverse. 2007. Nesting and nest success of the leatherback turtle (Dermochelys coriacea) in Suriname, 1999-2005. Chelonian Conservation and Biology. Hilterman, M.L., E. Goverse, M.T. Tordoir, and H.A. Reichart. In press. Beaches come and beaches go: coastal dynamics in Suriname are affecting important sea turtle rookeries. Proceedings of the twenty-fifth annual symposium on sea turtle biology and conservation. NOAA Technical Memorandum NMFS-SEFSC. Hirth, H. and L. Ogren. 1987. Some aspects of the ecology of the leatherback turtle Dermochelys coriacea at Laguna Jalova, Costa Rica. NOAA Technical Report, NMFS 56, 14p. Hughes, G.R. 1996. Nesting of the leatherback turtle (Dermochelys coriacea) in Tongaland, KwaZulu-Natal, South Africa, 1963-1995. Chelonian Conservation Biology 2:153-158.
108
Hughes, G.R., P. Luschi, R. Mencacci, and F. Papi. 1998. The 7000-km oceanic journey of a leatherback turtle tracked by satellite. Journal of Experimental Marine Biology and Ecology 229: 209-217. James, M.C., A. Ottensmeyer, and R.A. Myers. 2005a. Identification of high-use habitat and threats to leatherback sea turtles in northern waters: new directions for conservation. Ecology Letters 8:195-201. James, M.C., S.A. Eckert, and R.A. Myers. 2005b. Migratory and reproductive movements of male leatherback turtles (Dermochelys coriacea). Marine Biology 147:845-853. James, M.C., R.A. Myers, and C.A. Ottensmeyer. 2005c. Behaviour of leatherback sea turtles, Dermochelys coriacea, during the migratory cycle. Proceedings of the Royal Society (B) 272: 1547-1555. James, M.C., S.A. Sherrill-Mix, K. Martin, and R.A. Myers. 2006. Canadian waters provide critical foraging habitat for leatherback sea turtles. Biological Conservation 133:321-331. James, M.C., S.A. Sherrill-Mix, and R.A. Myers. in press. Population characteristics and seasonal migrations of leatherback sea turtles at high latitudes. Marine Ecology Progress Series. Javitech Limited. 2002. Report on sea turtle interactions in the 2001 pelagic longline fishery. Report submitted to Nova Scotia Swordfish Association & Habitat Stewardship Program, Canadian Wildlife Service, Environment Canada. Javitech, Dartmouth, N.S. Javitech Limited. 2003. Report on Sea Turtle Interactions in the 2002 Pelagic (Offshore) Longline Fishery. Report submitted to Nova Scotia Swordfish Association & Habitat Stewardship Program, Canadian Wildlife Service, Environment Canada. Javitech, Dartmouth, N.S. Kappler, A. 1881. Holländisch-Guiana, Erlebnisse und Erfahrungen während eines 43-jährigen Aufenhalts in der Kolonie Suriname. Stuttgart. Kelle, L., N. Gratiot, I. Nolibos, J. Thérèse, R. Wongsopawiro, and B. de Thoisy,. 2007. Monitoring of Nesting Leatherback Turtles (Dermochelys coriacea): Contribution of Remote Sensing for Real-Time Assessment of Beach Coverage in French Guiana. Chelonian Conservation and Biology. Knowlton, A.R. and B. Weigle. 1989. A note on the distribution of leatherback turtles (Dermochelys coriacea) along the Florida Coast in February 1988. Proceedings of the Ninth Annual Workshop on Sea Turtle Conservation and Biology. NOAA Technical Memorandum NMFS-SEFC-232, 306 p. Lagueux, C.J. and C.L. Campbell. 2005. Marine turtle nesting and conservation needs on the south-east coast of Nicaragua. Oryx 39:398-405.
109
Lee Lum, L. An assessment of incidental turtle catch in the gillnet fishery in Trinidad and Tobago, West Indies. Project #00_026_005. 2003. Institue for Marine Affairs. Chaguaramas, Trinidad 22 p. LeSage, J.P. 2001. MCMC convergence diagnostics, modeled after Splus CODA. http://www.spatial-econometrics.com/gibbs/contents.html Lewis, C.B. 1940. The Cayman Islands and marine turtle. In: C. Grant (ed.) The Herpetology of the Cayman Islands Bulletin of the Institute of Jamaica. Science Series. No. 2. 65 p. Lewison, R.B., S.A. Freeman, and L.B. Crowder. 2004. Quantifying the effects of fisheries on threatened species: the impact of pelagic longlines on loggerhead and leatherback sea turtles. Ecology Letters 7:221-231. Luschi, P., J.R.E. Lutjeharms, P. Lambardi, R. Mencacci, G.R. Hughes and G.C. Hays. 2006. A review of migratory behaviour of sea turtles off southeastern Africa. South African Journal of Science 102:51-58. Mahdaviani, M. and K. Murphy. 2006. MATBUGS. http://www.cs.ubc.ca/~murphyk/Software/index.html Maigret, J. 1978. Sea turtles nesting on the coast of Senegal. Marine Turtle Newsletter 8:4. Maigret, J. 1983. Répartition des tortues de mer sur les côtes ouest Africaines. Bulletin de la Société Herpétologique de France 28: 22-34. Martin, C.R. 2003. The behaviour of free-living marine turtles: underwater activities, migrations & seasonal occurrences. PhD thesis: University of Wales. 190 p. Meylan, A., P. Meylan, and A. Ruiz. 1985. Nesting of Dermochelys coriacea in Caribbean Panama. Journal of Herpetology 19:293-297. Meylan, A., B.A. Schroeder, and A. Mosier. 1995. Sea turtle nesting activity in the state of Florida 1979-1992. Fla. Mar. Res. Publ. No. 52. 51 p. Morreale, S.J., E.A. Standora, J.R. Spotila, and F.V. Paladino. 1996. Migration corridor for sea turtles. Naure 384:319-320. Morris, W.F. and D.F. Doak. 2002. Quanititative Conservation Biology. Theory and practice of population viability analysis. Sinauer Associates, Inc. Sunderland, MA Morisson, M., L. Kelle, and F. Sehoe. Campagne Kawana 2003. Rapport d’activité. Guyane (FR): WWF, octobre 2003. 32 p. Mrosovsky, N., 1983. Conserving sea turtles. British Herpetological Society London. UK,176 p.
110
Mrosovsky, N., P.H. Dutton, and C.P. Whitmore. 1984. Sex ratios of two species of sea turtle nesting in Suriname. Canadian Journal of Zoology 62:2227-2239. National Marine Fisheries Service-Southeast Fisheries Science Center. 2001. Stock assessments of loggerhead and leatherback sea turtles and an assessment of the impact of the pelagic longline fishery on loggerhead and leatherback sea turtles of the western north Atlantic. US Dep Commer, NOAA Tech Memo NMFS-SEFSC-455, 343 p. Nordmoe, E.D., A.E. Sieg, P.R. Sotherland, J.M., Spotila, F.V., Paladino, and R.D. Reina. 2004. Nest site fidelity of leatherback turtles at Playa Grande, Costa Rica. Animal Behaviour 68:387-394. OCPE-ONG . 2006. Etude pilote sur la présence, l’activité et la promotion de la conservation des tortues marines a la côte Atlantique Congolaise. Ordoñez, C., S. Troëng, A. Meylan, P. Meylan, and A. Ruiz. In review. Chiriqui Beach, Panama, the most important leatherback nesting beach in Central America. Chelonian Conservation and Biology. Penrose, R.S. 2005. UK & Eire Marine Turtle Strandings & Sightings: Annual Report 2004. Marine Environmental Monitoring report, 23 p. Peterson, S. 2005. Initial bycatch assessment : South Africa’s domestic pelagic longline fishery, 2000-2003. Birdlife South Africa. Pierpoint, C. 2000. Bycatch of marine turtles in UK & Irish waters. JNCC Report 310, 30 p. Press, W.H., S.A. Teukolshy, W.T. Vetterling, and B.P. Flannery. 1992. Numerical Recipes in C : The Art of Scientific Computing. Cambridge University Press, Cambridge, UK. Pritchard, P.C.H. 1969. Sea turtles of the Guianas. Bulletin of the Florida Sate Museum, Biological Science 13:85-140. Pritchard, P.C.H. 1971a. The Leatherback or Leathery Turtle. IUCN Monograph No.1. Marine Turtle Series. Morges, Switzerland, 39p. Pritchard, P.C.H., 1971b. Sea turtles in French Guiana. In: IUCN, 1971. Proceedings of the second working meeting of marine turtle specialists. IUCN Publications New Series. Supplementary Paper No. 31, 109p., pp.38-40. Pritchard, P.C.H. 1973a. International migrations of South American sea turtles (Cheloniidae and Dermochelyidae). Animal Behaviour 21:18-27. Pritchard, P.C.H. 1973b. Report on leatherback turtle research and conservation project in French Guiana. WWF grant 1973.
111
Pritchard, P.C.H. 1979. Marine turtles of Papua New Guinea. Consultant report to the Wildlife Div., Dept. Lands and Env., Konedobu, Papua New Guinea. Pritchard, P.C.H. 1988. Synopsis of biological data on the leatherback sea turtle, Dermochelys coriacea. FAO Fisheries Synopsis. Pritchard, P.C.H. 2004. Long-term sea turtle nesting cycles in the Guianas. Proceedings of the Twenty-First Annual Symposium on Sea Turtle Biology and Conservation. NOAA Technical Memorandum NMFS-SEFSC-528. 368 p. Rader, H., M.A.E. Mba, W. Morra, and G. Hearn. 2006. Marine Turtles on the Southern Coast of Bioko Island (Gulf of Guinea, Africa), 2001-2005. Marine Turtle Newsletter 111:8-10. Reichart, H.A., and J. Fretey, 1993. WIDECAST sea turtle recovery action plan for Suriname. K.L. Eckert (Editor). UNEP-CEP Technical Report No. 24. UNEP-Caribbean Environment Programme, Kingston, Jamaica, 65p. Renatura Report: Study and protection of the marine turtles in Congo Republic program activity report 2003/2004 season. Renatura Report: Rapport d’activite du programme d’etude et de sauvegarde des tortues marines au Congo. Septembre 2005 – juillet 2006. Rhodin, A.G.J. 1985. Comparative chondro-osseous development and growth of marine turtles. Copeia 1985 :752-771. Richards, F.J. 1959. A flexible growth function for empirical use. Journal of Experimental Botany 29:290-300. Rimblot-Baly, F., J. Lescure, J. Fretey, and C. Pieau. 1986. Sensibilité à la température de la différenciation sexuelle chez la tortue Luth, Dermochelys coriacea (Vandelli, 1761); application des données de l'incubation artificielle à l'étude de la sex-ratio dans la nature. Annales de Sciences Naturelles, Zoologie 13:277-290. Rivalan, P. 2003. La dynamique des populations de tortues luths de Guyane française: recherche des facteurs impliqués et application à la mise en place de stratégies de conservation. [PhD report] l’Université de Paris XI, Orsay, France, 248p. Rivalan, P., J.-P. Briane, S. Caut, B. de Dijn, S. Ferraroli, E. Goverse, J. Gratiot, M.L. Hilterman, E. Johannesen, S. Langin, S. Lieutenant, F. Macé, J. Marmet, A. Maros, Y. Merton, I. Nolibos, B. Viseux, R. Wongsopawiro, and M. Girondot. In press. Modeling marine turtles nesting season: a meta-analysis for 16 nesting beaches covering 600 km of coast line for 3 species in the guianas region during the 2002 nesting season. In press in Proceedings of 24th Annual Symposium on Sea Turtle Conservation and Biology.
112
Roden, S., Dutton, P.H., and Epperly, S.P. In Press. Stock composition of foraging leatherback populations in the North Atlantic based on analysis of multiple genetic markers. Proceedings of the 24th Annual Symposium on Sea Turtle Biology and Conservation. NOAA Tech. Memo. Ross, J.P. 1981. Leatherbacks Nesting in the Dominican Republic. Marine Turtle Newsletter. 18: 5-6. Sale, A., P. Luschi, R. Mencacci, P. Lambardi, G.R.Hughes, G.C. Hays, S. Benvenuti, and F. Papi. 2006. Long-term monitoring of leatherback turtle diving behaviour during oceanic movements. Journal of Experimental Marine Biology and Ecology 328:197-210. Schroeder, B.A. and N.B. Thompson. 1987. Distribution of the loggerhead turtle, Caretta caretta, and the leatherback turtle, Dermochelys coriacea, in the Cape Canaveral, Florida area: results of aerial surveys. In W.N. Witzell, ed., Proceedings of the Cape Canaveral, Florida, Sea Turtle Workshop. NOAA Technical Report 53. Schulz, J.P. 1964. Zeeschildpadden, Deel II: Zeeschildpadden in Suriname. Paramaribo : Dienst Landsbosbeheer Suriname, 44 pp. Schulz, J.P. 1971. Nesting beaches of sea turtles in west French Guiana. Proceedings of the Koninklijke Nederlandse Akademie Van Wetenschappen C. 74:398-404. Schulz, J.P. 1975. Sea turtles nesting in Suriname. Zoologische Verhandelingen No.143. Rijksmuseum van Natuurlijke Historie te Leiden. E.J. Brill, Leiden, the Netherlands, 143p. Schulz, J.P. 1982. Status of sea turtle populations nesting in Suriname with notes on sea turtles nesting in Guyana and French Guiana. in K. A. Bjondarl, editor. Biology and conservation of sea turtles. Smithsonian Institution Press,Washington D.C., U.S.A., 583 p., pp.435-437. Shoop, C,R. and R.D. Kenney. 1992. Seasonal distributions and abundances of loggerhead and leatherback sea turtles in the waters of the northeastern United States. Herp Monogr 6:43-67 Silverman, B.W. 1986. Density Estimation for Statistics and Data Analysis, Chapman and Hall, London. Southwood, A.L., R.D. Andrews, F.V. Paladino, and D.R. Jones. 2005. Effects of Diving and Swimming Behavior on Body Temperatures of Pacific Leatherback Turtles in Tropical Seas. Physiological and Biochemical Zoology 78:285–297. Spiegelhalter, D., A. Thomas, N. Best, and D. Lunn. 2004. WinBUGS User Manual. http://mathstat.helsinki.fi/openbugs/ Spotila, J.R., A.E. Dunham, A.J. Leslie, A.C. Steyermark, P.T. Plotkin, and F.V. Paladino. 1996. Worldwide population decline of Dermochelys coriacea: are leatherback turtles going extinct? Chelonian Conservation and Biology 2(2):209-222.
113
Stedman, J.G. 1796. Narrative of a five years'expedition against the revolted negroes of Surniam in Guiana, on the wild coast of South America, from the year 1772 to 1776. London. Stewart, K., C. Johnson, S.A. Eckert, D. Bagley, L.M. Ehrhart, and N. Desjardin. in prep. Nesting site fidelity for leatherback turtles along the coast of Florida, USA. Stewart, K., and C. Johnson. 2006. Leatherback sea turtle (Dermochelys coriacea). In: Biology and Conservation of Florida Turtles. Edited by P.A. Meylan. Chelonian Research Monographs 3:144-157. Stewart, K, C. Johnson, and M.H. Godfrey. In press. The minimum size of leatherbacks at reproductive maturity, with a review of sizes from the Indian, Atlantic and Pacific Ocean basins. Herpetological Journal. Thomé J.C.A., C. Baptistotte, L.M. de P. Moreira, J.T. Scalfoni, A.P. Almeida, D.B. Rieth, and P.C. R. Barata. In press. Nesting biology and conservation of the leatherback sea turtle (Dermochelys coriacea) in the State of Espírito Santo, Brazil, 1988/1989 to 2003/2004. Chelonian Conservation Biology. Thompson, N. 1984. Progress report on estimating density and abundance of marine turtles: results of first year pelagic surveys in the Southeast U.S. National Marine Fisheries Service, Miami, FL, NOAA-NMFS-SAW/84/MMT/7, 64p. Thompson, N.A. and H. Huang .1993. Leatherback turtles in Southeast U.S. waters. NOAA Technical Memorandum NMFS-SEFSC-318, 25p. Tiwari, M., A. Moumni, H. Chfiri, and H. El Habouz. 2001. A report on sea turtle nesting activity in the Kingdom abundance of Morocco and Western Sahara. B.C.G. Testudo, 5: 71-77.marine turtles: results of first year pelagic surveys in the Southeast U.S. National Marine Fisheries Service, Miami, FL, NOAA-NMFS-SAW/84/MMT/7, 64p. Troëng, S., D. Chacón, and B. Dick. 2004. Possible decline in leatherback turtle Dermochelys coriacea nesting along the coast of Caribbean Central America. Oryx 38:395-403. Troëng, S., E. Harrison, and D. Evans. In review. Leatherback nesting trend and threats at Tortuguero, Costa Rica. Chelonian Conservation and Biology. Turtle Expert Working Group. 1998. An Assessment of the Kemp’s ridley (Lepidochelys kempii) and Loggerhead (Caretta caretta) Sea Turtle Populations in the Western North Atlantic. NOAA Tech. Mem. NMFS-SEFSC-409, 96 p. Turtle Expert Working Group. 2000. Assessment update for the Kemp’s ridley (Lepidochelys kempii) and Loggerhead (Caretta caretta) Sea Turtle Populations in the Western North Atlantic. NOAA Tech. Mem. NMFS-SEFSC-444, 115 p.
114
Verhulst, P.F. 1846. Deuxième mémoire sur la loi d'accroissement de la population. Mémoires de l'Académie Royale des Sciences, des Lettres et des Beaux-Arts de Belgique 20:1-32. Watson, J. W., S.P. Epperly, A.K. Shah, and D.G. Foster. 2005. Fishing methods to reduce sea turtle mortality associated with pelagic longlines. Canadian Journal of Fisheries and Aquatic Science 62:965-981. Wibbels, T. 2003. Critical approaches to sex determination in sea turtles. In Biology of Sea Turtles (eds P.L. Lutz, J.A. Musick & J. Wyneken), Vol. II, pp. 103-134. CRC Press, Boca Raton. Witzell, W.N. 1999. Distribution and relative abundance of sea turtles caught incidentally by the U.S. pelagic longline fleet in the western North Atlantic Ocean, 1992-1995. Fishery Bulletin 97:200-211 Wood, F.F., and J.R. Wood. 1994. Sea turtles of the Cayman Islands. Pages 229-236 in M.A. Brunt and J.E. Davies (eds). The Cayman Islands: Natural History and Biogeography. Kluwer Academic Publishers, the Netherlands. Yeung, C. 2001. Estimates of marine mammal and marine turtle bycatch by the U.S. Atlantic pelagic longline fleet in 1999-2000. NOAA Technical Memorandum NMFS-SEFSC-467, 43p.
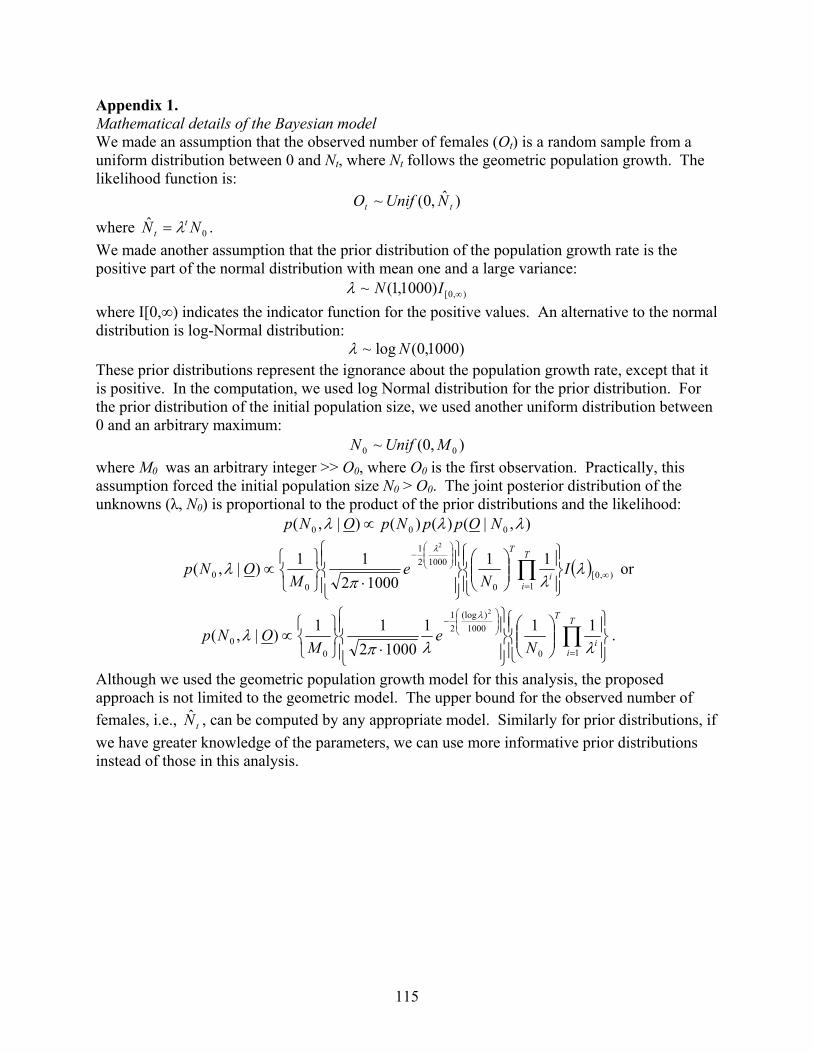
115
Appendix 1. Mathematical details of the Bayesian model We made an assumption that the observed number of females (Ot) is a random sample from a uniform distribution between 0 and Nt, where Nt follows the geometric population growth. The likelihood function is:
)ˆ,0(~ tt NUnifO
where 0ˆ NN t
t λ= . We made another assumption that the prior distribution of the population growth rate is the positive part of the normal distribution with mean one and a large variance:
),0[)1000,1(~ ∞INλ where I[0,∞) indicates the indicator function for the positive values. An alternative to the normal distribution is log-Normal distribution:
)1000,0(log~ Nλ These prior distributions represent the ignorance about the population growth rate, except that it is positive. In the computation, we used log Normal distribution for the prior distribution. For the prior distribution of the initial population size, we used another uniform distribution between 0 and an arbitrary maximum:
),0(~ 00 MUnifN where M0 was an arbitrary integer >> O0, where O0 is the first observation. Practically, this assumption forced the initial population size N0 > O0. The joint posterior distribution of the unknowns (λ, N0) is proportional to the product of the prior distributions and the likelihood:
),|()()()|,( 000 λλλ NOppNpONp ∝
( ) ),0[10
100021
00
1110002
11)|,(
2
∞=
⎟⎟⎠
⎞⎜⎜⎝
⎛−
⎪⎭
⎪⎬⎫
⎪⎩
⎪⎨⎧
⎟⎟⎠
⎞⎜⎜⎝
⎛
⎪⎭
⎪⎬⎫
⎪⎩
⎪⎨⎧
⋅⎭⎬⎫
⎩⎨⎧
∝ ∏ λλπ
λλ
IN
eM
ONpT
ii
T
or
⎪⎭
⎪⎬⎫
⎪⎩
⎪⎨⎧
⎟⎟⎠
⎞⎜⎜⎝
⎛
⎪⎭
⎪⎬⎫
⎪⎩
⎪⎨⎧
⋅⎭⎬⎫
⎩⎨⎧
∝ ∏=
⎟⎟⎠
⎞⎜⎜⎝
⎛− T
ii
T
Ne
MONp
10
1000)(log
21
00
11110002
11)|,(
2
λλπλ
λ
.
Although we used the geometric population growth model for this analysis, the proposed approach is not limited to the geometric model. The upper bound for the observed number of females, i.e., tN̂ , can be computed by any appropriate model. Similarly for prior distributions, if we have greater knowledge of the parameters, we can use more informative prior distributions instead of those in this analysis.
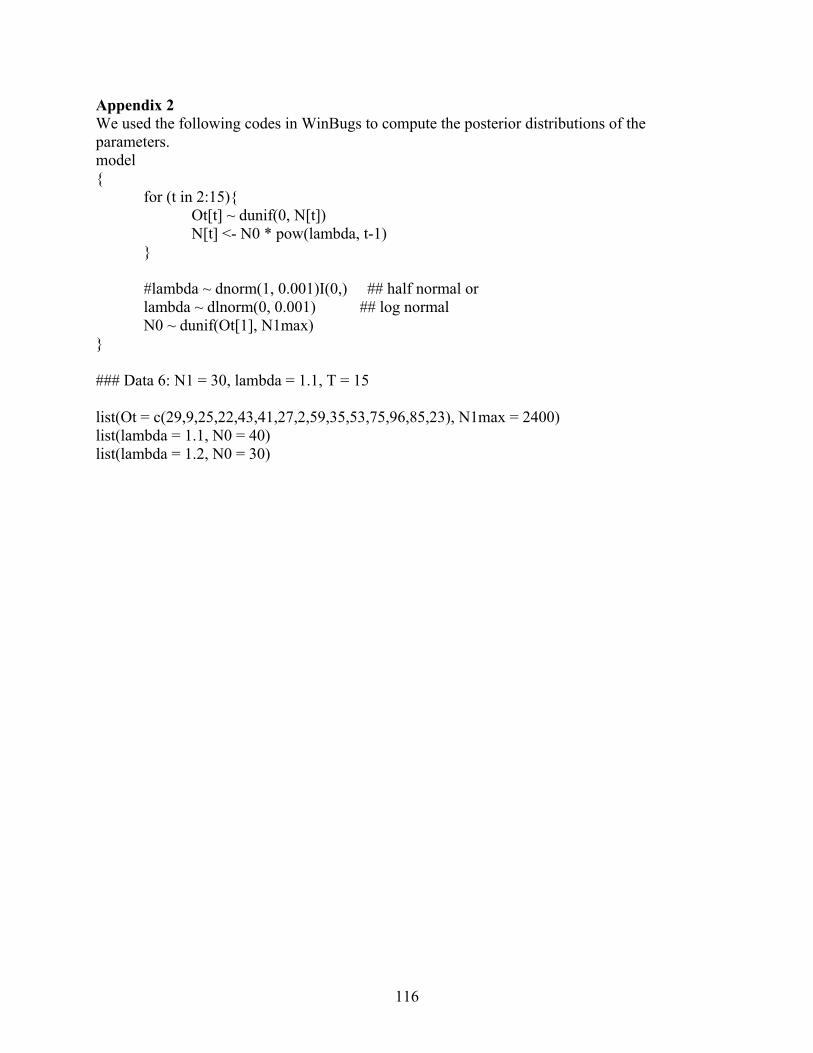
116
Appendix 2 We used the following codes in WinBugs to compute the posterior distributions of the parameters. model { for (t in 2:15){ Ot[t] ~ dunif(0, N[t]) N[t] <- N0 * pow(lambda, t-1) } #lambda ~ dnorm(1, 0.001)I(0,) ## half normal or lambda ~ dlnorm(0, 0.001) ## log normal N0 ~ dunif(Ot[1], N1max) } ### Data 6: N1 = 30, lambda = 1.1, T = 15
list(Ot = c(29,9,25,22,43,41,27,2,59,35,53,75,96,85,23), N1max = 2400) list(lambda = 1.1, N0 = 40) list(lambda = 1.2, N0 = 30)
Related Documents