Report Reference: UC15080.5 27th May 2021 An assessment of persistent organic pollutants (POPs) in waste domestic seating

Welcome message from author
This document is posted to help you gain knowledge. Please leave a comment to let me know what you think about it! Share it to your friends and learn new things together.
Transcript

Report Reference: UC15080.5
27th May 2021
An assessment of persistent organic
pollutants (POPs) in waste domestic seating

RESTRICTION: This report has the following limited distribution:
External: Environment Agency
Any enquiries relating to this report should be referred to the Project Manager at the
following address:
Water Research Centre Limited (WRc),
Frankland Road, Blagrove,
Swindon, Wiltshire, SN5 8YF
Telephone: + 44 (0) 1793 865000
Website: www.wrcplc.co.uk
Follow Us:
WRc is an Independent Centre
of Excellence for Innovation and
Growth. We bring a shared
purpose of discovering and
delivering new and exciting
solutions that enable our clients
to meet the challenges of the
future. We operate across the
Water, Environment, Gas, Waste
and Resources sectors.

Document History
Version
number
Purpose Issued by Quality Checks
Approved by
Date
V1.0 Draft report issued client for review. Further revision of Tier 3 testing may
follow
Peter Keeley-Lopez Jane Turrell 23.03.21
V2.0 Draft report following initial client
comments.
Jane Turrell Peter Keeley-Lopez 22.04.21
V3.0 Draft report with final analytical data Jane Turrell Peter Keeley-Lopez 02.05.21
V4.0 Final Report Jane Turrell Peter Keeley-Lopez 06.05.21
© WRc 2021 The contents of this document are subject to copyright and all rights are reserved. No part of this document may be reproduced, stored in a retrieval system or transmitted, in any form or by any means electronic, mechanical, photocopying, recording or otherwise, without the prior written consent of WRc.
This document has been produced by WRc.
An assessment of persistent organic pollutants
(POPs) in waste domestic seating
Authors:
Peter Keeley-Lopez
Materials waste and resources consultant
Waste and Resources
Date: 27th May 2021
Report
Reference:
UC15080.5
Jane Turrell
Principal consultant
Waste and Resources
Project
Manager:
Kate Tinkler
Project No.: 17370-0
Claudia Peppicelli
Resource recovery consultant
Waste and Resources
James Vernon
Environmental chemist
Waste and Resources
Client: Environment Agency
Client Manager: Bob McIntyre

Contents
Glossary .............................................................................................................................. 1
Summary ............................................................................................................................. 2
1. Introduction ............................................................................................................. 5
1.1 Brominated Flame Retardants and Persistent Organic Pollutants ............................. 5
1.2 Waste Domestic Seating.......................................................................................... 6
1.3 Flame Retardants in Domestic Seating .................................................................... 7
2. Sampling ............................................................................................................... 11
2.1 Site Based Sampling ............................................................................................. 11
2.2 Sample Breakdown ............................................................................................... 13
3. Testing Approach .................................................................................................. 17
3.1 Tiered Approach .................................................................................................... 17
3.2 Chemical Screening Using X-ray Fluorescence...................................................... 17
3.3 Chemical Testing ................................................................................................... 18
3.4 Approach to Data Interpretation ............................................................................. 20
3.5 Sample Scanning and Composition Determination ................................................. 22
4. Tier 1 – XRF screening ......................................................................................... 25
4.1 XRF Scanning Data ............................................................................................... 25
4.2 Bromine Analysis ................................................................................................... 26
4.3 Domestic Seating Covers – Textile, Leather and Leatherette ................................. 30
4.4 Tier 1 Summary ..................................................................................................... 32
5. Tiers 2 and 3 – Analytical Laboratory Testing ......................................................... 36
5.1 Sample Selection................................................................................................... 36
5.2 Tier 2 Results ........................................................................................................ 38
5.3 Tier 3 – Semi-Quantitative and Quantitative Testing ............................................... 39
5.4 Overview of Results ............................................................................................... 39
5.5 Summary of Tier 3 Testing ..................................................................................... 43
6. Summary of Findings and Conclusions .................................................................. 49
References ........................................................................................................................ 54

Appendices
Appendix A Data Collation and Calculation of Component Proportions in
Domestic Seating Units ........................................................................ 55
Appendix B Item Label Information .......................................................................... 68
Appendix C Tier 1 - XRF Screening ......................................................................... 71
Appendix D Laboratory Analytical Testing ................................................................ 96
Appendix E Brominated Flame Retardant and Brominated POPs
Tonnages in Waste Domestic Seating ................................................ 128
List of Tables
Table 2.1 Sampling dates and locations ............................................................... 11
Table 2.2 Summary of items sampled from sites .................................................. 14
Table 2.3 Typical examples of items sampled....................................................... 15
Table 2.4 Typical components in domestic seating ............................................... 16
Table 3.1 Calculated composition of domestic seating items................................. 24
Table 4.1 Number of items and scans of each domestic seating category ............................................................................................... 25
Table 4.2 Summary of bromine concentrations found in samples across all sites ................................................................................................. 26
Table 4.3 Minimum bromine (assumed as decaBDE) concentration in covers which would cause an entire item to exceed POPs MCL ..................................................................................................... 27
Table 4.4 FTIR results for selected leather/leatherette samples ............................ 33
Table 5.1 Samples sent for Tier 2 testing ............................................................. 36
Table 5.2 Samples sent for Tier 3 testing ............................................................. 37
Table 5.3 DecaBDE concentrations found in covers compared with the minimum decaBDE concentration required in a cover for a POPs classification ............................................................................... 41
Table 5.4 HBCDD, PBDE and deca-BDPE concentrations in textile and leatherette ‘cover’ samples ................................................................... 45
Table 5.5 HBCDD, PBDE and deca-BDPE concentrations in foam and lining samples....................................................................................... 47
Table 6.1 Summary of XRF scanning results ........................................................ 52
Table 6.2 Summary of Tier 3 testing results .......................................................... 53
Table A.1 Number of items of soft-furnishings by group and category ................... 56
Table A.2 Range unit dimensions by domestic seating category ........................... 58
Table A.3 Weights by item category...................................................................... 60
Table A.4 Calculated material densities ................................................................ 61
Table A.5 Composition assumptions for furniture items ......................................... 63

Table A.6 Average armchair and chair component surface areas and volumes ................................................................................................ 64
Table A.7 Average sofa component surface areas and volumes ........................... 64
Table A.8 Relative proportions of covers in each domestic seating item ................ 66
Table A.9 Relative proportions of filling components in each domestic seating item .......................................................................................... 67
Table B.1 Item labelling information (where available and applicable) ................... 68
Table C.1 Key for XRF data table ......................................................................... 71
Table C.2 Bromine, antimony and chlorine data for all scanned components .......................................................................................... 71
Table D.1 Tier 3 sample description and photographs ........................................... 96
Table D.2 GC parameters ................................................................................... 108
Table D.3 GC-HRMS PBDE and HxBB ion masses ............................................ 108
Table D.4 MRM transitions for HBCDD ............................................................... 109
Table D.5 GC-MS screening parameters ............................................................ 110
Table D.6 GC parameters for GC-ECD measurement ......................................... 111
Table D.7 MRM transitions for organophosphorous flame retardants................... 112
Table D.8 Results of the Tier 2 qualitative analysis ............................................. 114
Table D.9 HBCDD, PBDE and deca-BDPE concentrations in textile and leatherette ‘cover’ samples ................................................................. 115
Table D.10 HBCDD, PBDE and Deca-BDE concentrations in foam and lining samples..................................................................................... 117
Table D.11 Simplified bromine mass balance ........................................................ 120
Table D.12 Results of organophosphorous flame retardant analysis ..................... 126
Table D.13 Tier 2 and Tier 3 data comparison (3 test laboratories)........................ 127
Table E.1 Estimated proportions of domestic seating categories in the UK waste stream ................................................................................ 128
Table E.2 Estimated tonnes of POPs classified brominated flame retardants per 100,000 tonnes of waste domestic seating (WDS) ................................................................................................ 130
List of Figures
Figure 2.1 Proportion of items sampled from sites ................................................. 14
Figure 3.1 Generic data collation and calculation process ...................................... 21
Figure 4.1 Comparison between XRF data from the waste sites and re-use site................................................................................................. 26
Figure 4.2 Distribution of bromine content by component type per item category ............................................................................................... 28
Figure 4.3 Antimony vs. bromine XRF comparison (by component category) .............................................................................................. 30
Figure 4.4 Bromine content in covers by item type per material ............................. 31

Figure 5.1 Bromine accountability for textile cover samples ................................... 42
Figure 5.2 Bromine accountability for leatherette cover samples ............................ 42
Figure 5.3 Bromine accountability for foam and lining samples .............................. 43
Figure A.1 Data collection and calculation process for components in furnishings ............................................................................................ 55
Figure A.2 Examples of common furniture categories ............................................ 58
Environment Agency
Report Reference: UC15080.5/17370-0 27th May 2021
© WRc 2021 1
Glossary
BFR Brominated flame retardants
Br-PFR Brominated-phosphorous flame retardant
c-decaBDE Commercial decaBDE formulation
c-octaBDE Commercial octaBDE formulation
c-pentaBDE Commercial pentaBDE formulation
Cl-PFR Chlorinated-phosphorous flame retardant
DecaBDE Decabromodiphenyl ether
EA Environment Agency
EfW Energy from waste
FR Flame retardant
GC HRMS Gas chromatography high resolution mass spectrometry
HBCDD Hexabromocyclododecane
HeptaBDE Hexabromodiphenyl ether
HexaBDE Hexabromodiphenyl ether
HWRC Household waste recycling centre
LC-MS Liquid chromatography mass spectrometry
LOD Limit of detection
MCCP Medium chain chlorinated paraffin
MCL Maximum concentration limit
NonaBDE Nonabromodiphenyl ether
OctaBDE Octabromodiphenyl ether
PBDE Polybrominated diphenyl ether
PentaBDE Pentabromodiphenyl ether
PFR Phosphorous flame retardants
POP Persistent Organic Pollutant
PVC Polyvinyl chloride
SCCP Short chain chlorinated paraffin
TBBPA Tetrabromobisphenol A
TetraBDE Tetrabromodiphenyl ether
TriBDE Tribromodiphenyl ether
WRc Water Research Centre
WTS Waste transfer station
XRF X-ray fluorescence

Environment Agency
Report Reference: UC15080.5/17370-0 27th May 2021
© WRc 2021 2
Summary
WRc were commissioned by the Environment Agency to undertake a sampling and
characterisation programme of waste domestic seating. The project aimed to assess whether
brominated flame retardants (BFRs) classified as persistent organic pollutants (POPs) are
present in waste domestic seating. The project had a particular focus on polybrominated
diphenyl ethers (PBDEs) and hexabromocyclododecane (HBCDD) which are POPs classified
BFRs and which are known to have be added to domestic seating in the past.
In November 2020, WRc took 282 samples of waste domestic seating from six sites in England.
Five of those sites were ‘waste’ sites which included an energy from waste facility, two waste
transfer stations, two household waste recycling centres and one re-use charity.
Samples of textile components from domestic seating items were taken. These included
samples of covers, foams, linings and other textiles e.g. wadding and elastic straps. The
components were taken to WRc’s laboratories to undergo a three-tiered chemical assessment.
In the first tier, all the sampled components (282 items) underwent chemical screening using
X-ray fluorescence (XRF) analysis to test for the presence of bromine. This exercise highlighted
samples which may contain BFRs. A selected number underwent a second and/or third tier of
assessment, which involved semi-quantitative and qualitative analysis of PBDEs and other
flame retardants using more selective analytical method.
The Tier 1 results provide the typical bromine concentrations found in textile components in UK
waste domestic seating. The results across all sites showed similar bromine concentrations in
the textile components demonstrating that the sampling programme has provided a good cross-
section of UK domestic seating. Bromine was most frequently detected in textile covers with
over half (54%) of all covers containing bromine concentrations at >1% wt. The results showed
that 97% of leather covers had a bromine concentration <0.1% wt. indicating that BFRs are not
commonly added to leather covers (only a single cover identified as leather contained bromine).
However, bromine was detected in 19% of synthetic leather or ‘leatherette’ samples at
concentrations of >1% wt. Further characterisation of synthetic leather revealed that these
covers are made from various polymers including polyvinyl chloride, polyester, polypropylene
and polyurethane.
Bromine was detected in foam samples, but only 6% contained bromine at concentrations of
>1% wt. Bromine was sometimes detected in foams even when it was not detected in the covers
indicating that several types of flame retardants could be present in the differing components
within a single domestic seating item.
The determination of the weights of the various textile components in the domestic seating
items allowed for their relative proportions to be determined i.e. covers account for between

Environment Agency
Report Reference: UC15080.5/17370-0 27th May 2021
© WRc 2021 3
approximately 15 to 25% of the weight of an entire sofa. This means that if bromine was present
as decaBDE at functional levels (>1% wt.) the sofa should be described as a POPs waste.
Testing in Tiers 2 and 3 determined which FRs were present in the domestic seating
components. The results showed that POPs-classified BFRs are present in a proportion of
waste domestic seating at concentrations that would result in a POPs classification. Of the
textile covers which were tested in Tier 3, 81% were found to have concentrations of decaBDE
or HBCDD at levels which would result in a POPs classification for the entire item. No
differences in the concentrations of these chemicals were observed between textile sofas,
armchairs or chairs. Coupled with the results of the XRF screening, the data suggests that
POPs-classified BFRs are prevalent in waste textile domestic seating. The results also showed
25% of leatherette covers contained POPs-classified BFRs at concentrations which would
result in a POPs classification. One foam sample and one lining sample were found to contain
decaBDE at concentrations above 1% wt., and another lining sample contained HBCDD at a
concentration around 0.6% wt.
Analyses showed that for the lining and foams there were a significant number of samples with
‘missing bromine’ i.e. bromine detected by XRF but not accounted for by HBCDD or PBDE
analysis. This may be due difficulties in extractions of the brominated compounds associated
with the matrix in which they are found, which impacts the quantitative and qualitative analysis.
It also indicates that other brominated compounds may be present. Some samples tested were
found to contain DBDPE (decabromodiphenyl ethane) but none were found to contain the
common flame retardant TBBPA (tetrabromobisphenol A). It is also possible some samples
contain polymeric flame retardants which consist of a co-polymer of a brominated polymer and
another such as styrene. If present, they are unlikely to be extracted during testing and so would
not be accounted for. These are more likely to be present in foam samples due to their known
use in expanded polystyrenes.
Chlorinated phosphorous based flame retardants have also been detected in a number of
samples during both Tier 2 and Tier 3 analysis. These compounds are not currently POPs
classified but may require monitoring in the future.
A significant number of samples were found to contain decaBDE alongside compounds typical
of a commercial decaBDE flame retardant formulation, namely nonaBDE and antimony
(antimony trioxide).
Despite difficulties experienced during analytical testing, these challenges have mainly been
overcome by the expertise of the test laboratories. Interlaboratory verification of results, with
few inconsistencies, showed beyond reasonable doubt that the concentration of POPs in
domestic seating exceeds thresholds. The data does indicate that testing these types of
matrices is extremely difficult and application of current standard methods may not be sufficient.
Technical expertise in this instance has been used to overcome a variety of complex analytical
issues to generate a robust dataset to support regulatory decision making.

Environment Agency
Report Reference: UC15080.5/17370-0 27th May 2021
© WRc 2021 4
The data presented in this report indicates that POPs-classified components can be found
predominately in the covers of textile and leatherette domestic seating, but not those made from
natural leather. Taking into account the proportion of POPs containing components in the total
units the data suggests that some items of waste domestic seating should be classified as
POPs waste and therefore undergo suitable end of life waste management.
The data produced from the sampling and testing of domestic seating has been used to
estimate the amount of POPs-classified brominated flame retardants in UK domestic seating
waste. Based on the results from this study, there is between 364 and 476 tonnes of POPs-
classified brominated flame retardants per 100,000 tonnes of waste domestic seating. The
majority of the POPs are likely to be decaBDE based on the results of the Tier 3 testing. Textile
covers from sofas account for 88% of the POPs in the waste stream and when combined with
the textile covers from armchairs account for 94%. This is due to the high brominated
concentrations found in a large proportion of the textile covers tested and the overall weight of
these items in the total weight of the unit.

Environment Agency
Report Reference: UC15080.5/17370-0 27th May 2021
© WRc 2021 5
1. Introduction
1.1 Brominated Flame Retardants and Persistent Organic Pollutants
To comply with fire safety regulations, domestic seating must contain flame retardants or
incorporate design features (such as layers of different fabrics) to reduce their flammability and
limit serious fires. However, some chemicals, which were previously legitimately used as flame
retardants, have now been designated as being persistent in the environment as well as
carcinogenic and / or toxic to humans, animals and aquatic organisms. Brominated flame
retardants (BFRs) such as some PBDEs (polybrominated diphenyl ethers) are a class of
persistent organic pollutants (POPs).
The POPs Regulations1 implements the Stockholm convention and sets a maximum
concentration limit of 1,000 mg kg-1 for the sum of POPs-classified PBDEs which are as follows:
• tetrabromodiphenyl ether (tetraBDE);
• pentabromodiphenyl ether (pentaBDE);
• hexabromodiphenyl ether (hexaBDE);
• heptabromodiphenyl ether (heptaBDE); and
• decabromodiphenyl ether (decaBDE).
Additionally, a maximum concentration limit (MCL) of 1000 mg kg-1 in waste is set for
hexabromocyclododecane (HBCDD) in the POPs Regulation. When wastes contain POPs
above the MCL, they must be treated in such a way that the POPs are destroyed or irreversibly
transformed.
It is known that decaBDE and HBCDD have been used in domestic seating sold in the UK.
DecaBDE was listed as a substance of very high concern (SCHC) in 2012 by REACH and in
February 2017 the REACH registration of decaBDE was published. The provisions set out in
this registration came into force in the EU which ban the use of decaBDE in quantities greater
than 0.1% wt.. Phasing out of decaBDE (and other BFRs) occurred throughout various
industries before this time. However, it is likely that items of domestic seating which are now
1 The Persistent Organic Pollutants (Amendment) (EU Exit) Regulations 2020 No. 1358

Environment Agency
Report Reference: UC15080.5/17370-0 27th May 2021
© WRc 2021 6
entering the UK’s waste streams were manufactured during the time when these chemicals
were in use.
1.2 Waste Domestic Seating
The purpose of this study was to determine whether POPs-classified BFRs were present in UK
waste domestic seating such as sofas and armchairs. It also aimed to identify which
components within seating units are most likely to contain these chemicals and if so whether
the concentration would be high enough so that the entire item (by weight) should be classified
as a POPs waste. An assessment of the chemical composition of these items informs an
accurate description that would help to ensure that when they reach their end of life, they
undergo appropriate waste management. This would reduce the likelihood that these chemicals
would enter the wider environment. The current practice for waste domestic seating in the UK
is to send the items to energy from waste (EfW) facilities or landfill.
Waste domestic seating are produced by domestic households and are usually large bulky
items such as sofas and armchairs which contain various components such as coverings,
foams, inner linings, and wooden and / or steel frameworks. These items can be discarded from
households in several ways. They can be taken to household waste recycling centres
(HWRCs), collected as bulky waste collections (BWCs), via a commercial take-back scheme,
or donated to charity for reuse.
According to a WRAP report, most domestic seating are discarded as waste and only a small
proportion is sent for reuse2. In the same report, the HWRC and BWC streams were shown to
account for over 95% of sofas discarded from households whereas voluntary collections
account for only a small proportion. When domestic seating like sofas are collected at HWRCs
or from BWCs, they are usually inspected to determine whether they can be reused and
donated to local charities. Approximately 20% of domestic seating are sent for reuse and the
remaining proportion are sent for recycling, energy from waste or landfill.
Typically, the HWRC and BWC waste will be sent to a waste transfer station (WTS) where the
items will be bulked ahead of being sent for further processing, for example, mechanical
treatment and / or thermal treatment. In addition to a WTS being the intermediate destination
for HWRC and BWC domestic seating, it is commonplace for units collected by trade take-back
schemes to be delivered to the same location. In some areas, instead of the domestic seating
going to a WTS, they are sent directly to an energy from waste facility where they are
incinerated.
To approach this study, WRc devised a sampling plan to recover a representative cross-section
of samples from the UK domestic seating waste stream which included textiles and polymer
2 Benefits of Reuse Case Study: Domestic Furniture WRAP November 2011

Environment Agency
Report Reference: UC15080.5/17370-0 27th May 2021
© WRc 2021 7
materials for chemical testing. Fundamentally the approach was developed to produce a
dataset representative of the national domestic seating waste stream based on the information
discussed above.
Following site sampling a three-tiered testing strategy was implemented. This involved initial
screening for bromine and other metals using a handheld X-ray fluorescence (XRF) analyser
(Tier 1). Tier 1 screening highlighted a cross-section of samples to undergo additional
laboratory testing for broad screening of commonly used FRs in fabric and polymer foams to
produce semi-quantitative compound analysis (Tier 2). Finally chemical extraction and
quantitative laboratory analysis was used to test for PBDEs and other flame retardants identified
in the screening process (Tier 3).
1.3 Flame Retardants in Domestic Seating
Flame retardants can be added to textiles in a number of ways. Reactive flame-retardants are
added during the polymerisation process and become an integral part of the polymer and form
a co-polymer with the fabric. The result is a modified polymer with flame retardant properties
and different molecular structure compared to the original polymer molecule. Additive flame-
retardants, which include PBDEs, are incorporated into the polymer prior to, during, or more
frequently after polymerisation as a coating. Additive flame-retardants are monomer molecules
that are not chemically bonded to the polymer and can be considered chemically discrete
surface areas of a manufactured article. They are commonly added with metal oxide synergists
to improve their performance. They may therefore, in contrast to reactive flame retardants, be
released from the polymer during normal use and thereby also discharged to the environment.
In contrast to many additives, chemical flame-retardants can appreciably impair the properties
of polymers. So, there is a trade-off between the decrease in performance of the polymer
caused by the flame retardant and fire retardancy requirements. In the case of fabrics that are
designated as “flame retardant,” which have been topically treated with chemicals, the flame
retardancy of the fabric is likely to dissipate over time, particularly with repeated cleaning and
at end of life they may no longer contain functional levels of FRs.
1.3.1 Brominated flame retardants other than PBDEs and HBCDD
The phase out of PBDEs has led to an increase in use of other halogenated flame retardants
(HFRs) which are primarily based on chlorine and bromine such as TBBPA
(Tetrabromobisphenol A) and phosphorus-based flame retardants.
Flame retardants can be added as formulations which can contain a mixture of chemicals. The
PBDEs normally added as commercial formulations include:
• commercial-pentaBDE (c-pentaBDE), composed of tetra, penta and hexaBDE (an old
formulation used in polyurethane foams);
• commercial-octaBDE (c-octaBDE), mainly composed of hepta, octa and decaBDE; and

Environment Agency
Report Reference: UC15080.5/17370-0 27th May 2021
© WRc 2021 8
• commercial-decaBDE (c-decaBDE), mainly composed of decaBDE.
The PBDE formula most likely to be present in waste domestic seating is c-decaBDE as the c-
pentaBDE and c-octaBDE formulations were phased out prior to c-decaBDE’s use. However,
as the age of waste domestic seating will vary, possibly over a 30-year period, these older
formulations could still be present in some items.
Tetrabromobisphenol A (TBBPA) is an example of a commonly used BFR which is not currently
classified as a POP. It is primarily used as a ‘reactive’ flame retardant and forms an integral
part of the polymer to which it is added, but can be used as an additive flame retardant in the
manufacture of some polymers. Although a main use of this chemical is as a flame retardant
for epoxy resin polymers, for example in printed circuit boards it can have uses in textiles (but
only polymer-based textiles). Other brominated flame retardants which have been identified as
alternatives for commercial PBDE formulations are ethylene bis(tetrabromophthalimide)
(EBTBP) and decabromodiphenyl ethane (DBDPE).
Ethylene bis(tetrabromophthalimide) is an additive fire retardant that is added to a polymer
mixture to produce a blend which is primarily used in electrical and electronics components,
wire and cable insulation, switches etc. It is commonly used in high impact polystyrene (HIPS),
polyethylene, polypropylene, thermoplastic polyesters, polyamide, ethylene propylene-diene
terpolymers (EPDM rubbers) and other synthetic rubbers, polycarbonate, ethylene copolymers,
ionomer resins and epoxies but it is also used in some textile treatments.
Decabromodiphenyl ethane (DBDPE) is a BFR which is structurally similar to decaBDE and
has therefore been used as a dec-BDE replacement flame retardant in textiles. The application
of DBDPE to textiles is similar to decaBDE and it can be added in formulations with metal oxide
synergists such as antimony trioxide in DBDPE-ATO formulations. Due to its similarity with
decaBDE, there is some concern about the effects of DBDPE and the chemical is currently
being evaluated under REACH for its persistence, bioaccumulation and toxicity. However, there
are currently no restrictions on its use in textiles or other plastics.
XRF screening can be used to provide supporting evidence for the presence of many
chlorinated or brominated flame retardants especially where they are added with metal oxide
synergists, For example the potential presence of decaBDE is commonly linked with antimony
trioxide as the metal oxide synergist. The decaBDE/ATO formulation was widely used in textiles
and therefore the bromine concentration coupled with the antimony concentration provides a
good indication that the bromine may be present as decaBDE.
1.3.2 Phosphorus flame retardants
Another group of flame retardants, which have been increasingly used since many brominated
products were designated as POPs are phosphorous flame retardants (PFRs). PFRs can be
divided in three main groups, inorganic, organic and halogen containing PFRs. Most of the

Environment Agency
Report Reference: UC15080.5/17370-0 27th May 2021
© WRc 2021 9
PFRs have a mechanism of action in the solid phase of burning materials (char formation), but
some may also be active in the gas phase.
Some phosphorous based flame retardants (PFRs) contain bromine, although they are
reportedly less common than chlorinated-PFRs or other non-halogenated PFRs.
Tris(2,3-dibromopropyl) phosphate was briefly used in the 1970s, but was subsequently
withdrawn from use due to fears surrounding it possible carcinogenic effects. Tris(2,4-
dibromophenyl) phosphate is a similar chemical but is reportedly not commercially available
and so unlikely to be present in domestic seating textiles.
Formulations of ammonium phosphates and ammonium bromide are sold for use on cellulosic–
synthetic fibre blends and tris(tribromoneopentyl) phosphate can be added to polyolefins which
can be used for some foams. Inorganic phosphinates (hypophosphites): aluminium
phosphinate Phoslite IP-A and calcium phosphinate (Phoslite IP-C) are claimed to be useful
when added as mixed formulations in thermoplastics such as polypropylene with halogenated
(particularly brominated) flame retardants.
1.3.3 Brominated polymeric flame retardants
Brominated polymeric flame retardants were developed as alternatives for HBCDDs to act as
flame retardants in foams. It is a co-polymer of styrene and a brominated butadiene. The
bromine, which provides the flame retardant properties, is bound to the polymer structure. The
retardant contains similar aliphatic bromine as in HBCDD but with a higher molecular weight
structure. These are a further example of ‘reactive’ flame retardants and have been used in
expanded polystyrene and extruded polystyrene foams. The flame retardancy properties of
these ‘poly-FRs’ are reported to be superior to the HBCDDs which they were intended to
replace. The environmental risks of poly-FRs are thought to be lower than other brominated
flame retardants, but research in this area is still on-going.
1.3.4 Brominated azo dyes
Following the classification of some BFRs as POPs, several studies have investigated the
presence of brominated compounds in indoor house dusts (Dhungana et al., 2019) (Peng et
al., 2016). The studies have identified that in addition to being present as flame retardants,
bromine is also present in house-dust produced from fabric and carpet dyes in the form of
brominated azo dyes.
Currently more than 3000 azo dyes have been developed for a broad spectrum of colours and
represent more than 65% of the global dye market (Benkhaya, M’rabet and El Harfi, 2020). The
azo dyes are synthetic dyes formed by azo groups which consists of two nitrogen atoms linked
with each other. These dyes are not directly applied on the fabrics but, they are added within
the fibres themselves producing bright and resistant tones of colour. Although published
literature is sparse it is reported (Peng et al., 2016) that a large group of brominated compounds

Environment Agency
Report Reference: UC15080.5/17370-0 27th May 2021
© WRc 2021 10
in house dusts are attributable to the azo dyes family. Three brominated azo-dye compounds
identified in house dust include Disperse Blue 373, Disperse Violet 93, Disperse Orange 61 and
2-bromo-4,6-dinitroaniline (Dhungana et al., 2019).
There is very little information available on about how widely used these compounds are or their
typical addition rates to textiles. If they are present, then they could be detected by their bromine
content during XRF screening. These alternative BFRs and bromine compounds may be
present in domestic seating although possibly only those manufactured recently. XRF screening
is only used as guide and is supported by further laboratory analysis to identify whether the
bromine is present as PBDEs or another flame retardant.
Unfortunately, XRF used to detect bromine is not able to determine the presence of lighter
elements such as phosphorous and aluminium which appear to be key indicators of some
PFRs. Therefore, additional testing was undertaken on some of the laboratory samples to
assess whether they did contain PFRs to provide some indication on whether they were likely
to impact the PBDE reporting due to complex interactions between the chemicals during
extraction.
Environment Agency
Report Reference: UC15080.5/17370-0 27th May 2021
© WRc 2021 11
2. Sampling
2.1 Site Based Sampling
The aim of the sampling programme was to produce a robust dataset which was a
representative cross section of the waste domestic seating produced in the UK. WRc sent site
teams to take samples of domestic seating from five waste sites and a single re-use charity.
The site visits were conducted after liaison with the operators to ensure that the samples
collected would be representative of the typical waste domestic seating received at each site.
The site visits were undertaken in November 2020 and, despite some disruption to the volumes
of domestic seating seen at the sites due to the Covid-19 pandemic, the samples obtained are
considered to be a good cross section of the type and quality of waste domestic seating in the
UK at the time of the study.
The five waste sites included two Household waste recycling centres (HWRCs), two waste
transfer stations (WTSs) and one energy from waste (EfW) facility in addition to the single re-
use charity, their locations are shown in Table 2.1. All sites received their waste from a wide
catchment area across their respective counties covering a range of demographics providing
confidence that the samples obtain were representative of the UK waste stream as a whole.
Table 2.1 Sampling dates and locations
Site Sampling date (2020) Location Type of facility
Site 1 9th November Somerset WTS
Site 2 9th November Hampshire WTS
Site 3 16th November Worcestershire EfW
Site 4 17th November Leicestershire HWRC
Re-use 24th November Bristol Re-use charity
Site 5 25th November Buckinghamshire HWRC
Where space was available, for example at the EfW facility, the operator pre-stockpiled
domestic seating items for sampling. At most site items were randomly sampled as and when
they were delivered in multiple consignments during the site visit. At the re-use charity, all
domestic seating items were sampled from the warehouse and the adjacent shop.
Each domestic seating item or ‘unit’ was photographed and where possible the following
information was obtained:
• item category and sub-category (three seater sofa, two seater sofa, etc.);

Environment Agency
Report Reference: UC15080.5/17370-0 27th May 2021
© WRc 2021 12
• weight;
• colour;
• age;
• flammability label (yes/no);
• country of manufacture;
• material description (textile, leather, plastic, etc.);
• brand; and
• approximate dimensions.
Not all this information was always available for every item and only 20% of the items sampled
were found to have a flammability or fire safety label. The information which has been gathered
from the sampling is provided in Appendix B. There does not seem to be a correlation between
having a fire label and bromine being present. There are plenty of units with labels and no
bromine. There are also examples in this table (but obviously in the rest of the dataset) where
bromine is present without a fire label, but this might be because it has been removed.
Many units, particularly those discarded as waste were damaged or had pieces missing. It is
likely that many owners had removed flammability labels from the items as well as any branding.
Nevertheless, the site teams were able to obtain good information about the materials used for
coverings and the category/sub-category which the units belonged to.
During the sampling of a ‘unit’, necessary but not complete dismantling was undertaken to
enable access to textile or foam components. Each unit was photographed and a sample was
taken of each textile or foam component. Each item was labelled and placed into a sampling
bag ahead of return to WRc for screening using XRF.
The types of textile or foam components which were recovered from domestic seating included:
• fabric covers;
• foam cushions;
• polymer back casings;
• textile linings (i.e. on the underside of chairs and stools); and
• internal textiles.
Each textile or foam sample was dried (if necessary), measured for its dimensions and weighed.
This was to determine the weight per unit area or volume so that the relative weight of the
component to the entire unit could be determined. This allowed the concentrations of key
chemicals such as ‘total’ bromine or decaBDE in a specific component to be converted to the
concentration in the entire unit. This was important for waste POPs assessment and description
purposes and the calculation method is outlined in Section 3.5.

Environment Agency
Report Reference: UC15080.5/17370-0 27th May 2021
© WRc 2021 13
During the site visit at the re-use charity, the domestic seating were not dismantled, or any
samples removed from them. Instead in-situ chemical screening was undertaken using a
handheld XRF analyser. All easily accessible textile or foam components were scanned using
the XRF analyser to test for the presence of bromine. This is the same approach used in the
chemical screening of the waste domestic seating samples which was performed at WRc’s
laboratories rather than ‘on-site’. Therefore, no samples of re-use domestic seating were sent
for further laboratory testing to avoid the need to purchase and then destruct items which were
destined for reuse. However, the chemical screening results showed no observable differences
in the chemical composition of domestic seating as waste or for re-use and therefore laboratory
testing results are considered to be characteristic of domestic seating across all waste streams.
This will be discussed in more detail later in the report.
2.2 Sample Breakdown
Across the sampling campaign, a total of 282 items were sampled, from which 985 components
were taken back to WRc for XRF chemical screening. The components sampled from the waste
sites were taken for XRF scanning, whereas for any items at the reuse charity scanning took
place in-situ.
The breakdown of the items sampled from each site are given in Table 2.2 and Figure 2.1
below.
Most of the items sampled on each site visit were sofas. These included standard or reclining
two-seaters or three-seaters, sofa beds and five-seater corner sofas. The next significant
category of item were armchairs, including club (or rolled arm), wingback, tub or bucket and
recliners. Chairs were also found on all sites, but much less often than sofas or armchairs.
These were typically found in the form of dining or office chairs. Any bespoke or more unique
items were categorised as “Other”, which includes domestic seating such as footstools,
beanbag chairs, and bed-bases or headboards. The number of items sampled from Site 1 and
Site 2 were significantly less than from the other sites, as full weighing and measuring was
undertaken at these sites, which may explain why the proportions of the items sampled by item
category are skewed more towards individual categories (i.e. "sofas” for Site 1 and “chairs” for
Site 2). Overall, the proportion of each category of item found in each of the site visits was
generally consistent. This gives confidence that the items sampled during this project are
representative of the current overall UK waste stream for domestic seating. Typical examples
of items from each of the categories shown in Table 2.3
During the waste site visits samples of textile components were taken from the items. From all
types of items similar components were recovered. Each item typically contained a cover which
was either a textile, leather or synthetic leather; foam used for the seating and inner layers of
textile; and ‘wadding’ which separated the cover from the foam. Some items contained plastic
linings and elastic bands but there were usually only minor components within the item.
Examples of the components taken from the domestic seating items are shown in Table 2.4.

Environment Agency
Report Reference: UC15080.5/17370-0 27th May 2021
© WRc 2021 14
Table 2.2 Summary of items sampled from sites
Site visit and
code
Number of items
Sofas Armchairs Chairs Other Total
Site 1 (CC) 13 5 1 0 19
Site 2 (WF) 8 6 9 5 28
Site 3 (KM) 22 13 10 2 47
Site 4 (LC) 30 12 8 2 52
Site 5 (HH) 52 12 3 5 72
Re-use (SP) 31 17 15 1 64
Total 156 65 46 15 282
Figure 2.1 Proportion of items sampled from sites
0%
10%
20%
30%
40%
50%
60%
70%
80%
90%
100%
Site 1 Site 2 Site 3 Site 4 Site 5 Reuse site
% o
f it
em
s
Item category
Sofas
Armchairs
Chairs
Other

Environment Agency
Report Reference: UC15080.5/17370-0 27th May 2021
© WRc 2021 15
Table 2.3 Typical examples of items sampled
2-seater sofa 3-seater sofa
Club armchair Tub armchair
Dining chair Office chair
Footstool Headboard

Environment Agency
Report Reference: UC15080.5/17370-0 27th May 2021
© WRc 2021 16
Table 2.4 Typical components in domestic seating
Cover (textile) Cover (leather)
Cover (leatherette) Lining
Foam (homogenous) Foam (heterogenous)
Wadding Misc. (straps)

Environment Agency
Report Reference: UC15080.5/17370-0 27th May 2021
© WRc 2021 17
3. Testing Approach
3.1 Tiered Approach
A three-tiered testing strategy has been adopted for this study consisting of:
i. initial screening for bromine and other metals was undertaken using a hand-held XRF
device as an indication of the presence of BFRs, additives and synergists added to
improve the performance of the flame retardants;
ii. use of a rapid broad screening technique to provide information on a wide range of
commonly used flame retardants; and
iii. chemical extraction and semi-quantitative and quantitative analysis of PBDEs and other
flame retardants identified in the screening process.
3.2 Chemical Screening Using X-ray Fluorescence
Chemical screening was undertaken to determine whether bromine was present in the sampled
components. Bromine is the key indicator of BFRs as they are brominated organic compounds.
XRF analysis can be used to quickly identify whether bromine is present in a sample, but the
technique cannot be used to identify the specific brominated compound(s). However, XRF
analysis is a good chemical screening tool to enable more focused, complex analytical testing
to be used to determine the bromine compounds present.
As well as bromine the analyser was able to determine the presence of chlorine, barium,
antimony, cadmium, bismuth, lead, selenium, arsenic, mercury, gold, zinc, copper, nickel, iron,
chromium, vanadium and titanium. XRF is a surface analytical technique and so the
concentration of the detected elements will reflect their concentration at the surface of the
material.
This additional elemental analysis was able to be used to provide information about the
characteristics of the samples and further information about chemical additives that were likely
to have been present. For example, antimony trioxide can be added to polymers alongside
BFRs as it acts as a synergist enhancing the flame retardant’s performance. Therefore, where
antimony was found alongside bromine there is strong evidence that the bromine was present
in a BFR. The concentration of chlorine was able to be used to indicate whether a sample was
likely to be composed of polyvinyl chloride (PVC), however various chlorinated flame retardants
are known to exist. The presence of chromium or iron in samples were likely to be from the
leather tanning process. Therefore, using chlorine, chromium and iron data helped distinguish
between natural and synthetic leather (commonly PVC), although additional testing helped
confirm this.

Environment Agency
Report Reference: UC15080.5/17370-0 27th May 2021
© WRc 2021 18
The elemental concentration was determined using a handheld XRF analyser using a
programme calibrated for polymer analysis. The analyser was held against the surface of the
component and the elemental composition was determined following a scan acquisition time of
30 seconds.
The MCL for POPs-classified PBDEs in waste is 1,000 mg kg-1. However, for BFRs to be
effective, they are normally added to materials at concentrations greater than 5% wt.
(50,000 mg kg-1). Therefore, functional levels of BFRs could be considered to be > 5% wt. whilst
low levels would be between 0.1% wt. to 5% wt. and trace levels would be considered to be
< 0.1% wt. Domestic seating textiles are not normally recycled and so if low levels or BFRs
were detected it may be that these compounds could have migrated from the material or have
undergone some degradation.
Several PBDE congeners3 are classified as POPs, but most were phased out of use long before
decaBDE (and c-decaBDE). tetraBDE, pentaBDE and the commercial formulation of c-
octaBDE (which includes hexaBDE and heptaBDE) were given a POPs classification and
subsequently banned in 2004, DecaBDE was not classified as a POP until 2019. Restrictions
on HBCDD were put in place in 2014. Considering the age of the domestic seating in the waste
stream, decaBDE is likely to be the most prevalent POPs-classified PBDE if present. However,
it is known that decaBDE can degrade to ‘lower’ congeners following prolonged exposure to
UV light.
Based on the results of the chemical screening, some of the textile components containing high
bromine levels, indicating the presence of BFRs were selected for further laboratory testing.
The selection of samples for laboratory testing was based on ensuring that there was a good
cross section of source items (sofas, armchairs, etc,), components (cover, foam, linings) and
material type (textiles, leather, etc,). Some of the units showed extreme wear and tear on the
outer covers particularly textiles. Samples collected from units with well-worn outer covers may
exhibit lower bromine due to washing and wear on the fabric.
3.3 Chemical Testing
3.3.1 Sample preparation
WRc undertook all sample preparation of samples identified for laboratory testing. Sample
preparation plays a vital role in data quality and so preparing a representative sample for
3 There are several molecular isomers of polybrominated diphenyl ethers known as congeners. The
variations are due to the number and position of bromine atoms in the chemical structure. For example
tetrabromodiphenyl ether contains three bromine atoms and decabromodiphenyl ether contains ten.

Environment Agency
Report Reference: UC15080.5/17370-0 27th May 2021
© WRc 2021 19
analysis is extremely important. WRc’s on-site laboratories operate under ISO/IEC 17025:2017
and UKAS accreditation.
To prepare the samples for analysis, WRc took a representative sub-sample of each proposed
cover, lining fabric or foam and ground the sample to <1 mm using step-wise particle size
reduction techniques. The sample grinding was performed using cryogenic milling with liquid
nitrogen. This approach was used to mitigate against the heat generated during milling of the
textiles or other polymers which could lead to degradation of target compounds within the
sample. Reducing the sample to a particle size of <1 mm helps to achive a high extraction
efficiency of the target compounds to avoid an underestimation of concentrations present.
The prepared samples were then sent to nominated sub-contract laboratories in a cool box to
limit the sample’s exposure to changes in temperature. WRc kept a full audit trail of sample
movements in-house and used appropriate chain of custody forms which were sent with the
samples to ensure sample identity was retained.
The test facilities confirmed that UK sample preparation was acceptable, both in terms of
avoiding excessive heating (which would be indicated by the smell of degraded polymers) and
from the quality of the measured flame retardant fingerprints.
3.3.2 Testing laboratories
Tier 2- rapid chemical screening tests
Twenty samples were sent to VU University Amsterdam for screening.
The samples were screened for: PBDEs, HBCDD, TBBP-A, Cl-PFRs, Br-PFRs,
Decabromodiphenyl ethane (DBDPE), bis-tetrabromophthalimide (EBTBP) and SCCP / MCCP
(short and medium chain chlorinated paraffins).
Details of the analytical method are provided in Appendix D Section D2. Initial solvent extraction
of the test samples for screening was undertaken with toluene and 2-propanol. Use of a polar
solvent is usually advantageous for comprehensive PBDE extraction. However, in the case of
fabric and foam samples, potentially due to the presence of high concentrations of other
additives (e.g. PFR and Cl-PFRs), the addition of 2-propanol led to complete precipitation of
the decaBDE from the test solution. WRc provided Amsterdam with feedback from the Tier 3
test laboratory undertaking quantitative testing who also identified initial extraction efficiency
issues for the PBDE analysis to guide method refinement. Further work was undertaken by
Amsterdam to refine the extraction method. It was found that use of toluene alone provided a
sufficient extraction efficiency that was confirmed through quantitative testing undertaken by
Eurofins. All samples were re-extracted and the data reported for decaBDE in Appendix D is on
this basis.

Environment Agency
Report Reference: UC15080.5/17370-0 27th May 2021
© WRc 2021 20
QA measures include duplicate analysis of a number of samples, procedural blanks, use of an
internal reference material (foam), and the analyses of analytical standards (SCCPs, PBDEs,
HBCDD, phthalates, PFRs, TBBP-A, Cl-PFRs, and Br-PFRs). The average sample-to-sample
relative standard deviations (RSDs) is less than <25 %. The limit of detection is about 0.1% of
the product being analysed.
Tier 3 – semi-quantitative and quantitative testing
A total of 50 samples were submitted for quantitative testing to Fraunhofer IVV.
Initial testing focussed on PBDEs and HBCDD.
Following analysis of initial test data two further avenues of testing were pursued. The initial
Fraunhofer toluene and 2-propanol extraction led to poor extraction of PBDEs in textile and
foam matrices. However, following a number of method revisions a procedure using a static
rather than a multi-stage automated accelerated extraction was used with toluene alone to
provide a quantitative measure of PBDEs. The alternative method used a very short column,
which would ensure very limited Deca-BDE degradation using a GC-quadrupole MS. The
evaluation of the mass spectra also identified the presence of other flame retardants (TBBPA,
phosphorus-based flame retardants). Further analyses were completed on a further 14 samples
to verify this initial data.
Both the Tier 2 and 3 laboratories have world-ranking experience in testing for FRs in relevant
waste matrices. However, the samples of domestic seating have proved to be particularly
challenging. The presence of other flame retardant additives in textiles and foams aside from
PBDEs and HBCDD have led to complications with what are proven tests. Completion of testing
has required expert method revisions and revalidation by both laboratories. The data produced
has been corroborated between the three laboratories involved in testing, which provides a high
level of confidence in the final data, especially where we are reporting the concentration of POP
classified BFRs above threshold limits. As illustrated in Section 5 in some cases where the
BFRs are reactive or potentially polymeric in nature (they are integral to the polymer rather than
being a surface application that can be extracted) the data may still be an underestimate of
what is present in the test sample, but we are confident that there are no false positives.
3.4 Approach to Data Interpretation
XRF screening was used to understand which components in a domestic seating item were
most likely to contain bromine. The laboratory analysis was used to assess whether the bromine
was present as POPs-classified BFRs. When POPs-classified compounds were found, their
concentration in the component was converted to their concentration in the entire item for
comparison against the MCL.

Environment Agency
Report Reference: UC15080.5/17370-0 27th May 2021
© WRc 2021 21
For example, if the cover of a sofa was found to have a decaBDE concentration of 10% wt.,
would the entire item have a decaBDE which exceeded the MCL of 0.1% wt. (1,000 mg kg-1).
This would determine whether the sofa should be classified as a POPs waste.
To enable the conversion from component concentration to entire item concentration, the
relative weights of the cover, foam and linings in different items of domestic seating had to be
determined. This determination was made using measurements taken during the sampling
campaign and measurements taken from on-line research.
As it would have been complex and time consuming to completely strip each unit to measure
the relative weights of all the domestic seating component items, the approach taken was to
produce generic values for a range of domestic seating items which would allow the calculations
to be undertaken. The on-site measurements were used to validate the findings produced by
the research to generate weight proportions for each component with a margin of error. These
proportions were used to recalculate the compound concentrations found in the components to
determine the concentration in the entire item.
The generic data collation and calculation process is provided in Figure 3.1. Further details on
the assumptions used to complete the calculation process are provided in Appendix A.
Figure 3.1 Generic data collation and calculation process

Environment Agency
Report Reference: UC15080.5/17370-0 27th May 2021
© WRc 2021 22
3.4.1 Standard items categories
Based on observations made during sampling and online market research the domestic seating
items were grouped into the following categories into which all sampled items were placed.
• Sofas:
o slim 2 and 3 seater;
o padded 2 and 3 seater;
o reclining 2 and 3 seater; and
o 5 seater corner sofa.
• Armchair:
o club/rolling arm;
o wingback;
o tub/bucket; and
o recliner.
• Chair:
o dining chair;
o office chair; and
o bar stool.
Domestic seating items are made of several components which are summarised as follows:
• the main frame that can be metallic or wooden, and in some cases a sprung base;
• the filling materials for cushions, and padding on the arms, front and back (foam and
wadding);
• the outer covers (leather, leatherette or textiles); and
• lining materials that cover the bottom or back of the object and in some cases is used
to cover the back of the cushions and seats. This material is often a black polymeric
paper like fabric.
For each domestic seating category, the weight proportions of each of these four ‘components’
were determined which were then to be used for compound concentration conversions. The
calculated proportions are presented in Appendix A alongside the methodology for their
determination.
3.5 Sample Scanning and Composition Determination
All samples of the components were taken to WRc’s laboratories and scanned using an XRF
analyser to determine their bromine concentration. The XRF data is presented in Section 4 and
Appendix B. Alongside the scanning measurements the dimensions and weights of the
components were taken. These measurements, supported by market research, were used to
calculate the relative proportions of the different components in the items. This was to enable
a conversion of the concentration of a parameter such as bromine or decaBDE in the
component to its concentration in the entire item to aid data interpretation.
Environment Agency
Report Reference: UC15080.5/17370-0 27th May 2021
© WRc 2021 23
As discussed above, all the different types of domestic seating typically contained textile
components including an outer cover, foam and inner linings. The items also had some sort of
frame which accounted for a significant proportion of the weight of the item, especially when it
was a steel frame which was typical of reclining sofas and chairs.
The composition of the different domestic seating items was calculated, and the results are
provided in Table 3.1. A detailed description of the calculation methodology is provided in
Appendix A. The different types of sofas and armchairs and the differences in design, material
of construction among other things has resulted in the calculation of a range (maximum and
minimum) of the relative proportions. This will provide a margin of error for any conversion of
compound concentrations, which could be used to determine whether an item might a POPs
waste beyond reasonable doubt or a possible POPs waste.

Environment Agency
Report Reference: UC15080.5/17370-0 27th May 2021
© WRc 2021 24
Table 3.1 Calculated composition of domestic seating items
Group Category
Cover
leather
wt.%
Variation
(-)
Variation
(+)
Cover
leatherette
wt.%
Variation
(-)
Variation
(+)
Cover
textile
wt.%
Variation
(-)
Variation
(+)
Sofas
2-seater Slim 25 4.1 0.3 21 3.3 0.3 16 2.7 0.2
Padded 22 3.9 2.9 18 3.1 2.4 14 2.6 1.8
Recliner 22 1.8 3.1 18 1.5 2.5 12 1 1.7
3-seater Slim 22 3.5 1.6 18 2.8 1.3 14 2.2 0.9
Padded 25 3.5 1.6 20 2.8 1.3 16 2.2 0.9
Recliner 20 5.7 2.5 16 4.6 2.1 11 3.1 1.4
Corner sofa (5-seater) 23 7.9 3.3 18 6.4 2.7 12 4.3 1.8
Chairs
Armchair Club (incl.
rolled arm) 10 0.6 0.6 6 0.4 0.4 4 0.3 0.3
Wingback 12 0.5 0.5 8 0.3 0.3 5 0.2 0.2
Tub/Bucket 14 2.5 2.5 10 1.7 1.7 6 1 1
Recliner 7 0.8 0.8 5 0.5 0.5 3 0.3 0.3
Chair* Dining chair 12 1.4 1.4 10 1.2 1.2 6 0.8 0.8
Office chair 6 2.9 2.9 5 2.4 2.4 3 1.6 1.6
Other* Bar stool 11 4.2 4.2 9 3.4 3.4 6 2.3 2.3
*no range data is provided as these items have similar sizes and weights therefore variability is low.

Environment Agency
Report Reference: UC15080.5/17370-0 27th May 2021
© WRc 2021 25
4. Tier 1 – XRF screening
4.1 XRF Scanning Data
The first tier of the assessment, chemical screening using a handheld XRF analyser was
primarily undertaken to determine the bromine concentration in the sampled components, as
bromine is the key indicator of BFRs. As well as the bromine concentration the analyser was
able to determine the concentration other elements could provide some insight into either the
type of material the component was (e.g. high chlorine can be linked to PVC) or identify if
specific synergists or additives have been used which can be linked to the use of a wider range
of flame retardants.
Table 4.1 shows the number of items and scans undertaken for each domestic seating
category. In total 985 scans were made of components taken from the sites. The summary
statistics for the different component types are shown in Table 4.2.
The data obtained was similar across all sites and Figure 4.1 shows the comparison between
the bromine distribution of the items scanned at the waste sites and the re-use charity. This
shows that there was no difference in bromine concentration in items derived from the two
different waste streams and so provides justification that the interpretations of the data
produced in this work are applicable to both streams.
Table 4.1 Number of items and scans of each domestic seating category
Location Sofas Armchairs Chairs* Other
Items Scans Items Scans Items Scans Items Scans
Site 1 13 72 5 38 1 5 0 0
Site 2 8 30 6 23 9 32 5 19
Site 3 22 89 13 62 10 32 2 8
Site 4 30 114 12 53 8 25 2 8
Site 5 52 166 12 41 3 9 5 13
Re-use site 31 72 17 46 15 27 1 1
Total 156 543 65 263 46 130 15 49
Key: * Dining and office

Environment Agency
Report Reference: UC15080.5/17370-0 27th May 2021
© WRc 2021 26
Table 4.2 Summary of bromine concentrations found in samples across all sites
Sample
type
Minimum Average 95th %ile Maximum % scans
>1 wt.%
Number of
scans
Cover 0.00 1.66 7.89 11.5 34.8 319
Lining 0.00 0.13 0.67 4.46 1.60 250
Wadding 0.00 0.02 0.14 0.61 0.00 135
Foam 0.00 0.17 1.18 7.36 5.68 264
Misc 0.00 0.04 0.17 0.42 0.00 17
Figure 4.1 Comparison between XRF data from the waste sites and re-use site
4.2 Bromine Analysis
The distribution of bromine in the scanned components is given in Figure 4.2. The distribution
is plotted by component category (covers, linings, wadding, foams, or misc.) for each item type
(sofas, armchairs, chairs or other). These plots show the bromine content broken into
concentration ranges and the proportion of scans for each component category that lie within
each range. For example, the total proportion of scans for covers in sofas add up to 100% over
each of the five concentration ranges.
The majority of scans for each of the component categories recorded bromine concentrations
below functional levels (<0.1% wt.). Scans which found bromine at functional levels (i.e.
>1% wt.) were mostly taken on samples of covers and foams, and the majority of such samples
were taken from sofas or armchairs.
The bromine concentrations were determined at a component level, but this concentration must
be converted to its concentration in the entire item for comparison against any concentration
thresholds (i.e. POPs MCL). Based on the relative proportions of the components in domestic
0%
10%
20%
30%
40%
50%
60%
70%
80%
90%
100%
≥0 & ≤0.01 >0.01 & ≤0.05 >0.05 & ≤0.1 >0.1 & ≤1 >1 & ≤5 >5 & ≤10 >10
% o
f X
RF
Scan
s
Br Content %
Waste Sites Re-use site

Environment Agency
Report Reference: UC15080.5/17370-0 27th May 2021
© WRc 2021 27
seating and if assuming all the bromine was present as decaBDE, the minimum concentrations
of bromine in covers of different items are shown in Table 4.3.
Due to the greater amount of covering on a sofa, the minimum bromine concentration required
for the sofa to exceed the MCL is lower than other item types. As leather has a greater density
than textile and leatherette covers, the minimum bromine concentration is lower. Despite these
variations it is likely that if decaBDE was present at functional levels in sofa covers the entire
item should exceed the MCL. Higher concentrations of decaBDE would be required in
armchairs and chairs due to their make-up, but if the compound was present at levels around
5% wt. then the item would likely be significant over the threshold beyond reasonable doubt.
Table 4.3 Minimum bromine (assumed as decaBDE) concentration in covers which
would cause an entire item to exceed POPs MCL
Item type
Bromine concentration in covers required for item to exceed POPs MCL
(assuming bromine is present as decaBDE) mg kg-1
Textile Leatherette Leather
Sofas
2 seater ‘slim’ 5,100 4,000 3,300
2 seater ‘padded’ 5,400 4,200 3,700
2 seater ‘recliner’ 6,400 4,200 3,500
3 seater ‘slim’ 5,500 4,500 3,500
3 seater ‘padded’ 5,100 4,000 3,300
3 seater ‘recliner’ 6,000 4,000 3,500
5 seat corner sofa 5,100 4,500 3,500
Armchairs
Club 19,200 12,500 8,500
Wingback 17,500 10,300 7,000
Tub/bucket 12,700 7,500 5,000
Recliner 24,000 14,000 9,000
Chairs
Dining chair 9,900 6,800 5,800
Office chair 18,200 12,100 10,000
Bar stool 13,200 8,800 7,400
Other
Footstool 17,000 3,900 3,800
Across the whole dataset, 75% of scans found bromine below functional levels (<0.1 wt.%),
12% of scans found bromine between 0.1% wt. and 1% wt., 8% scans found bromine between

Environment Agency
Report Reference: UC15080.5/17370-0 27th May 2021
© WRc 2021 28
1% wt. and 5% wt. and 5% of scans found bromine greater than 5% wt. Most scans with high
bromine content were those taken on covers where 35% of scans had a bromine concentration
>1% wt.. Therefore, particular focus was given to investigate the bromine distribution in covers
by their material, specifically between three categories; natural leather, synthetic leather (or
leatherette) and textile covers.
Figure 4.2 Distribution of bromine content by component type per item category
0%
20%
40%
60%
80%
100%
≥0 & ≤0.01 >0.01 & ≤0.05 >0.05 & ≤0.1 >0.1 & ≤1 >1 & ≤5 >5 & ≤10 >10
% o
f X
RF
Scan
s
Br Content %
Sofas Cover
Lining
Wadding
Foam
Misc
0%
20%
40%
60%
80%
100%
≥0 & ≤0.01 >0.01 & ≤0.05 >0.05 & ≤0.1 >0.1 & ≤1 >1 & ≤5 >5 & ≤10 >10
% o
f X
RF
Scan
s
Br Content %
Armchairs Cover
Lining
Wadding
Foam
Misc
0%
20%
40%
60%
80%
100%
≥0 & ≤0.01 >0.01 & ≤0.05 >0.05 & ≤0.1 >0.1 & ≤1 >1 & ≤5 >5 & ≤10 >10
% o
f X
RF
Scan
s
Br Content %
Chairs Cover
Lining
Wadding
Foam
Misc

Environment Agency
Report Reference: UC15080.5/17370-0 27th May 2021
© WRc 2021 29
As outlined above the covers were the components which were most likely to contain bromine
at high levels. Only 6% of foam samples were found to contain bromine greater than 1% wt.
and only 3% were found to contain bromine between 0.5 and 1% wt. Where bromine was found
in foams the concentration was normally between 0.05 and 0.5% wt. (18% of samples).
Therefore, foams typically only contained low levels of bromine when detected.
However, for some items, such as padded sofas, the foam counts for a large proportion of the
total item and so a decaBDE concentration of between 3,500 and 6,400 mg kg-1 would be
sufficient to result in a POPs classification. It was not the case that a foam would only contain
bromine if the cover did. Therefore, even if the domestic seating were not found to contain
bromine in the cover, it may still be a POPs waste due to the foam.
The XRF analysis included other elements which could be used to identify the component
material, such as antimony (added as antimony trioxide as a synergist with BFRs), chromium
or iron (typically added to natural leathers during tanning processes4), chlorine (found at
36% wt. in PVC materials) and titanium (present as a whitening agent in polymers or during the
tanning process to produce white leathers). These key indicators were used to inform the
identification of the materials in each cover component, or where such indicators were absent
from a material then further testing was required. A visual inspection was performed for cover
samples where the material remained inconclusive after reviewing the XRF data. A selection of
leather or leatherette cover samples were sent for further testing, Fourier-transform infrared
spectroscopy (FTIR), to confirm the cover material.
Figure 4.3 shows the relationship between bromine and antimony in the domestic seating
samples. Antimony is also seen present for samples with higher concentrations of bromine
(which would be associated with functional levels for BFRs). Antimony trioxide is a known
synergist for BFRs and a common flame-retardant formulation for textile backings was
44 Leather International Tanning with iron salts - an old system in a new light* 28 March 2004
0%
20%
40%
60%
80%
100%
≥0 & ≤0.01 >0.01 & ≤0.05 >0.05 & ≤0.1 >0.1 & ≤1 >1 & ≤5 >5 & ≤10 >10
% o
f X
RF
Scan
s
Br Content %
Other Cover
Lining
Wadding
Foam

Environment Agency
Report Reference: UC15080.5/17370-0 27th May 2021
© WRc 2021 30
decaBDE and antimony trioxide. Therefore, the trend showing a correlation between antimony
and bromine provides a good indication that BFRs are present and possibly decaBDE. There
are also examples of bromine concentrations and antimony concentrations with no presence of
the other element. This also provides evidence that other types of flame retardants or chemicals
are also present in the samples.
Therefore, to attempt to unpick this complexity, further analytical testing has been undertaken
to try and understand whether the samples taken from domestic seating items contain other
brominated compounds, or whether the interactions between other flame retardants during
testing results in low-reporting of PBDE concentrations.
Figure 4.3 Antimony vs. bromine XRF comparison (by component category)
4.3 Domestic Seating Covers – Textile, Leather and Leatherette
Figure 4.4 shows the bromine distribution of leather, leatherette or textile covers plotted by item
type. Only one single leather cover, 1% of the leather dataset, was found with bromine
concentrations >1% wt., compared with 19% of leatherette and 54% of textile covers. Although
FTIR analysis confirmed that this was a leather sample, it could be possible that it was some
sort of composite.
Conversely, 97% of leather covers were found with bromine concentrations <0.1% wt,
compared with 75% of leatherette covers and 43% of textile covers. In summary, most of the
bromine found at functional levels using XRF analysis on domestic seating covers was found
in the textile covers.
0.00
2.00
4.00
6.00
8.00
10.00
12.00
14.00
0.0 0.5 1.0 1.5 2.0 2.5 3.0 3.5 4.0 4.5 5.0
Bro
min
e w
t.%
Antimony wt.%
Cover
Foam
Lining
Wadding
Misc

Environment Agency
Report Reference: UC15080.5/17370-0 27th May 2021
© WRc 2021 31
Figure 4.4 Bromine content in covers by item type per material
0%
10%
20%
30%
40%
50%
60%
70%
80%
90%
100%
≥0 & ≤0.01 >0.01 & ≤0.05 >0.05 & ≤0.1 >0.1 & ≤1 >1 & ≤5 >5 & ≤10 >10
% o
f X
RF
scan
s
Br Content %
Leather Sofa
Armchair
Chair
Other
0%
10%
20%
30%
40%
50%
60%
70%
80%
90%
100%
≥0 & ≤0.01 >0.01 & ≤0.05 >0.05 & ≤0.1 >0.1 & ≤1 >1 & ≤5 >5 & ≤10 >10
% o
f X
RF
scan
s
Br Content %
Leatherette
Sofa
Armchair
Chair
Other
0%
10%
20%
30%
40%
50%
60%
70%
80%
90%
100%
≥0 & ≤0.01 >0.01 & ≤0.05 >0.05 & ≤0.1 >0.1 & ≤1 >1 & ≤5 >5 & ≤10 >10
% o
f X
RF
scan
s
Br Content %
Textile
Sofa
Armchair
Chair
Other

Environment Agency
Report Reference: UC15080.5/17370-0 27th May 2021
© WRc 2021 32
The XRF data has shown that there appears to be a difference between the likelihood of a
synthetic leather cover containing bromine and a natural leather cover. A greater proportion of
synthetic leather samples were found to contain bromine (19% of leatherette samples
compared with 1%). This may be of consequence for description purposes and future
management of waste domestic seating.
To differentiate between leather and leatherette samples, a combination of techniques were
used. It is typical of natural leather samples to have a ‘polished’ outer surface and an unpolished
suede-like inner surface. Conversely, leatherette samples typically have a plastic web-like
backing. Therefore, visual observation of the samples was primarily used to differentiate
between them. To support this the XRF data was used to identify leatherette components which
were likely to be composed of polyvinyl chloride (PVC) based on the chlorine concentration
being >36 wt.% (upper detection limit). Similarly, the leather samples were commonly seen to
contain high concentrations of elements such as chromium or iron which are commonly used
as tanning salts.
However, to provide additional data a selection of samples were sent for FTIR analysis to
determine whether they were natural leather or not and if not what polymer they were made of.
Table 4.4 shows the results of the analysis alongside the additional data. The results show the
leatherette samples were made of a range of polymers including polypropylene, polyester and
polyurethane as well as the PVC samples found via XRF. These samples are presented
alongside their XRF data and the difference in the bromine content between the leatherette and
natural leather samples can be seen.
4.4 Tier 1 Summary
Several conclusions can be made from the first tier of the assessment. The chemical screening
has shown that brominated compounds are present in waste domestic seating in the UK. The
typical composition of waste domestic seating seemed to be generally similar across the
country and no difference was observed between the bromine distribution between waste
domestic seating and those destined for reuse. Therefore, data collected from laboratory
analysis of samples derived from waste domestic seating is relevant to items going for reuse.
Bromine was found in several components of items, but mainly in the covers, foam and linings.
Little bromine was detected in other components which also only represent a small proportion
of the entire item.
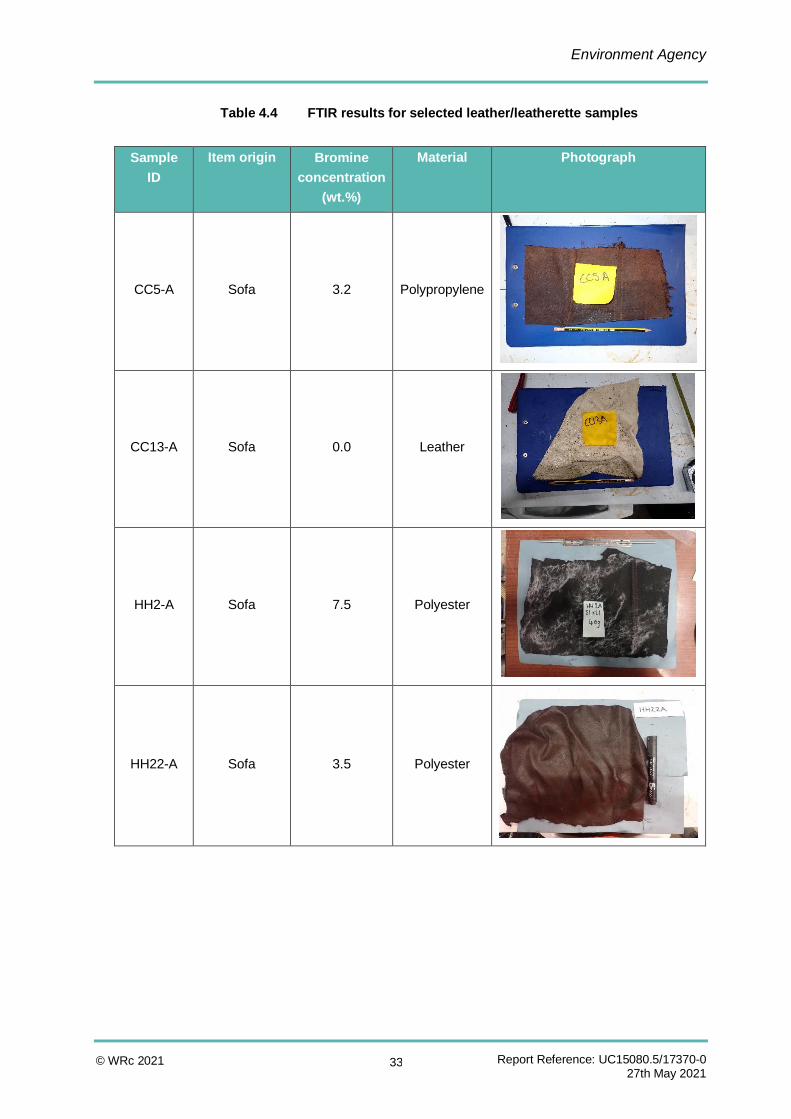
Environment Agency
Report Reference: UC15080.5/17370-0 27th May 2021
© WRc 2021 33
Table 4.4 FTIR results for selected leather/leatherette samples
Sample
ID
Item origin Bromine
concentration
(wt.%)
Material Photograph
CC5-A Sofa 3.2 Polypropylene
CC13-A Sofa 0.0 Leather
HH2-A Sofa 7.5 Polyester
HH22-A Sofa 3.5 Polyester

Environment Agency
Report Reference: UC15080.5/17370-0 27th May 2021
© WRc 2021 34
Sample
ID
Item origin Bromine
concentration
(wt.%)
Material Photograph
HH57-A Sofa 3.9 Polyurethane
HH64-C Sofa 3.1 Polyurethane
LC38-A Sofa 0.3 Leather
WF16-E Sofa 3.9 Polyester
Covers were most likely to contain bromine and just over half (54%) of textile covers contained
bromine at concentrations >1% wt. However, the results showed that natural leather covers
typically did not contain bromine at high levels and 97% contained <0.1% wt. of bromine.
Synthetic leather or leatherette were found to contain bromine at high levels but not as often as
textile covers.
In general, similar data was produced across the different domestic seating categories. For
example, there was little observable difference between sofas and armchairs with similar
bromine readings being detected across comparable components. A distinction was made

Environment Agency
Report Reference: UC15080.5/17370-0 27th May 2021
© WRc 2021 35
between office and dining chairs to assess whether there was a difference between these chair
types. Although the dataset for these items was substantially smaller than for sofas and
armchairs, there appears to be some differences between the two categories. No high bromine
levels were detected in the covers of office chairs whereas high bromine levels were detected
in dining chair covers. However, similar bromine levels were found in the foams and lining of
the two types of chairs which was also observed during Tier 3 testing.
Although the bromine data collected during tier 1 provides no information on the compounds of
bromine present, the concentrations of bromine in many cases were characteristic of functions
levels of BFRs in textiles (1-5% wt.). Additionally, there is some correlation between the
concentration of bromine and antimony which provides an indication that decaBDE may be
present due to the wide use of commercial decaBDE formulations with antimony trioxide.
However, given that there are examples of bromine present without antimony trioxide there may
be other BFRs or brominated compounds present. This gives additional emphasis on the further
laboratory analysis which will be discussed in the following sections.
Although there are limitations of using XRF as a screening tool for PBDEs and HBCDD, the
approach is a fast method and has highlighted the most likely components where these
compounds could be added. The sampling also provided data on the relative proportions of
domestic seating components. This data has shown that if PBDEs were present at ‘functional’
levels in either the covers or foams then this concentration is likely to cause the entire item to
exceed the MCL for POPs-PBDEs.

Environment Agency
Report Reference: UC15080.5/17370-0 27th May 2021
© WRc 2021 36
5. Tiers 2 and 3 – Analytical Laboratory Testing
5.1 Sample Selection
The chemical screening highlighted components which are found to contain bromine at levels
indicating that they could contain BFRs. Some of these samples were selected for further Tier 2
and Tier 3 analysis.
The selection of the samples was based on several factors:
• the bromine concentration;
• the type of component (cover, foam, lining);
• the source of the component (sofa, armchair, etc.);
• the material (textile, leather/leatherette); and
• matched samples (i.e. two different components from the same item).
These factors were used to produce a set of samples which encompassed the variety of item
types and components which were sampled during the project. The rationale to test matched
samples was included to provide an insight as to whether different types of flame retardants
were present in the same item and whether it was possible that there would be some migration
of flame retardants over time from the cover to the linings and foam.
The list of samples and their testing suite sent for Tier 2 and 3 analysis is shown in Table 5.1
and Table 5.2 respectively. Photographs of the samples are provided alongside their ‘source
items’ in Appendix D.
Table 5.1 Samples sent for Tier 2 testing
WRc
sample
number
Code Source item Component XRF Bromine (% wt.)
W9084 KM22-A Armchair Cover (leatherette) 11.5
W9080 KM16-A Sofa Cover (textile) 9.64
W9038 WF24-A Armchair Cover (textile) 8.94
W9176 HH56-A Sofa Cover (textile) 7.98
W9036 WF16-A Sofa Cover (leatherette) 6.88
W9020 CC17-A Sofa Cover (textile) 6.50

Environment Agency
Report Reference: UC15080.5/17370-0 27th May 2021
© WRc 2021 37
WRc
sample
number
Code Source item Component XRF Bromine (% wt.)
W9027 CC4-B Armchair Cover (textile) 5.29
W9029 CC11-B Sofa Cover (textile) 4.06
W9025 CC27-B Sofa Cover (textile) 3.31
W9032 WF2-A Dining chair Cover (leatherette) 2.34
W9093 CC26-C Sofa Foam 1.97
W9034 WF6-B Office chair Foam 1.77
W9092 LC22-D Sofa Foam 1.67
W9021 CC17-B Sofa Foam 0.86
W9031 CC5-C Sofa Foam 0.61
W9082 KM17-B Sofa Foam 0.47
W9081 KM17-A Sofa Cover (textile) 6.31
W9023 CC23-B Armchair Cover (textile) 3.63
W9563 WF21-C Sofa green foam 0.006
W9564 LC17-D Sofa mixed colour foam 0.31
Table 5.2 Samples sent for Tier 3 testing
Sample ID Item source Component XRF Bromine
concentration (% wt.)
Site 1
CC17-A Sofa Cover (textile) 6.50
CC17-B Sofa Foam 0.86
CC8-A Armchair Cover (textile) 6.28
CC23-B Armchair Cover (textile) 3.63
CC23-D Armchair Lining 0.88
CC27-B Sofa Cover (textile) 3.31
CC25-B Sofa Cover (textile) 4.50
CC4-B Armchair Cover (textile) 5.29
CC6-A Dining chair Cover (textile) 6.15
CC11-B Sofa Cover (textile) 4.06
CC8-H Armchair Foam 0.53
CC5-C(A) Sofa Foam 0.61
Site 2
WF2-A Dining chair Cover (leatherette) 2.34
WF2-D Dining chair Lining 0.82
WF6-B Office chair Foam 1.77
WF16-A Sofa Cover (leatherette) 6.88
WF16-B Sofa Cover (textile) 6.99
WF16-C Sofa Foam 0.57
WF24-A Armchair Cover (textile) 8.94
WF9-A Footstool Cover (textile) 3.55
Site 3
KM11-D Other Cover (textile) 9.86

Environment Agency
Report Reference: UC15080.5/17370-0 27th May 2021
© WRc 2021 38
Sample ID Item source Component XRF Bromine
concentration (% wt.)
KM12-E Armchair Lining 0.45
KM16-A Sofa Cover (textile) 9.64
KM17-A Sofa Cover (textile) 6.31
KM17-B Sofa Foam 0.47
KM20-C Sofa Foam 1.47
KM22-A Armchair Cover (leatherette) 11.5
KM22-B Armchair Cover (textile) 6.66
KM26-D Armchair Foam 1.67
KM37-B Sofa Foam 1.20
KM40-C Sofa Foam 1.61
Site 4
LC15-B Sofa Cover (textile) 10.5
LC22-A Sofa Cover (textile) 8.11
LC22-D Sofa Foam 1.67
LC26-C Sofa Foam 1.97
LC7-D Office chair Lining 0.93
LC29-A Sofa Cover (leatherette) 4.03
LC33-G Armchair Cover (textile) 9.50
LC38-C Sofa Foam 1.36
LC38-D Sofa Foam 1.30
LC44-D Armchair Foam 1.35
Site 5
HH19-A Sofa Cover (textile) 6.98
HH19-B Sofa Lining 0.31
HH2-A Sofa Cover (leatherette) 7.51
HH22-A Sofa Cover (leatherette) 3.57
HH32-C Armchair Foam 2.06
HH34-C Armchair Foam 2.07
HH51-D Sofa Foam 7.36
HH56-A Sofa Cover (textile) 7.98
HH72-A Sofa Cover (textile) 10.5
5.2 Tier 2 Results
The primary aim of this study was to detect POPs-classified BFRs in domestic seating. The Tier
2 analysis was used to support quantitative testing and provide information on what other
compounds could also be present in the domestic seating.
In Tier 2 all samples were screened for the following determinands: PBDEs, HBCDD, TBBPA,
Cl-PFRs, Br-PFRs, EBTBP, DBDPE and SCCPs / MCCPs. The analytical screening and
quantitative testing are presented in Appendix D.
In summary, the Tier 2 testing has shown that other than BFRs chlorinated-PFRs and possibly
other chlorinated compounds like medium chain chlorinated paraffins are present in domestic

Environment Agency
Report Reference: UC15080.5/17370-0 27th May 2021
© WRc 2021 39
seating. Additional testing in Tier 3 also showed that chlorinated phosphorous flame retardants
were present in some samples and this data is presented in Appendix D.
TCEP, TCIPP, TDCIPP, HBCB, and MCCPs have been found in some samples above or close
to 0.1% wt. DecaBDE209 was found at concentrations below 0.1% wt. as well as at
concentrations above 1% wt. These data, bar one sample, have been confirmed by quantitative
testing undertaken by Eurofins.
SCCPs were not identified in the screening test but MCCPs were identified in one sample above
0.1% wt. and two samples at >1% wt.
5.3 Tier 3 – Semi-Quantitative and Quantitative Testing
The Tier 3 testing provides definitive evidence for the presence of POPs in domestic seating
waste. Tier 3 test data is provided in Appendix D. There is a high level of confidence in the test
data which was produced following method development and expansion of the test suite to
identify brominated compounds that had not been accounted for by initial testing. However, the
XRF test data on the extraction residues indicates that there are some samples where the
bromine has not been fully recovered (illustrated in Figures 5.1 to 5.3) and it is surmised that
these samples may contain Br Poly-FRs. In the majority of samples, the bromine content can
be completely accounted for by the analysis undertaken. During method refinement the
extractions were run on multiple systems to provide robust compound identification. During this
cross-comparison an additional brominated substance identified as Decabromodiphenyl ethane
was also identified in high concentrations of some samples.
5.4 Overview of Results
Both HBCDD and decaBDE have been found at percentage levels (>1% wt.) in both textile and
leatherette covers. No natural leather samples were tested due to the typically low bromine
concentrations found in those samples. DecaBDE has been found alongside other PBDE
congeners, most commonly nonaBDE, which is typical of the commercial formulations of these
flame retardants. The levels of decaBDE in textile covers were consistent across sofas,
armchairs and chairs indicating that similar flame retardant formulations were used in all these
textile materials.
Out of the 21 textile covers which were tested, 17 contained decaBDE or HBCDD at
concentrations greater than 1% wt. equating to 81% of the samples and all but one contained
decaBDE at concentrations greater than 0.1% wt. (1,000 mg kg-1). During XRF scanning 54%
of the textile covers were found to contain bromine at a concentration greater than 1% wt. and
coupled with the PBDE analysis it appears that POPs classified PBDEs are prevalent in textile
domestic seating.
Half of the leatherette samples (3 out of 6) contained decaBDE at concentrations greater than
1% wt. which is a lower proportion than the textile covers although the sample size was much

Environment Agency
Report Reference: UC15080.5/17370-0 27th May 2021
© WRc 2021 40
smaller. A lower proportion of leatherette samples (19%) were found to contain bromine at
concentrations greater than 1% wt. compared to textile covers therefore the data suggests that
POPs classified BFRs are less prevalent in leatherette covers but could be present in some
items.
The HBDE and PBDE results for foams and linings also showed that one foam and one lining
sample contained decaBDE at percentage levels which is a lower proportion than what was
seen in the cover samples. This could be partially explained by the typically lower bromine
concentration which were observed in foams and linings from the XRF scanning. One foam
sample contained tetraBDE and pentaBDE which are characteristic of commercial pentaBDE
formulations which probably reflects the age of the item.
5.4.1 Comparison against POPs thresholds
The decaBDE concentrations found in the covers of the domestic seating samples sent for
Tier 3 testing were compared with the minimum decaBDE concentrations required in the covers
for the entire item to be classified as a POPs waste. The comparison is shown in Table 5.3
where the POPs threshold is the calculated value based on the total weight of the item. For
sofas, either textile or leather, the minimum decaBDE concentration is approximately
0.4 – 0.8% wt. All the sofa covers which were found to contain decaBDE exceeding this limit
had concentrations significantly greater than this value between 4 and 20% wt. Therefore, the
items from which these covers were sourced would be classified as POPs wastes beyond
reasonable doubt and 76% of textile covers tested had a decaBDE concentration exceeding
the limit. However, one sample which did not exceed this limit had a HBCDD concentration of
79,739 mg kg-1 (7.97% wt.), which would also mean the source sofa would also be a POPs
waste. Therefore, 81% of the textile covers sent for Tier 3 testing contained POPs at
concentrations high enough for the entire sofa to be classified as a POPs waste.
A lower proportion of leatherette sofas were found to contain POPs in the covers which would
result in a POPs classification (25%), but that may be due to the smaller sample size than the
textile covers. Similar proportions were recorded for the textile and leatherette armchairs and
chairs (89% and 100%) respectively although only two leatherette samples were tested.
The results show that POPs-classified BFRs (predominately decaBDE) are present in a
significant proportion of textile and leatherette domestic seating above the POPs threshold.

Environment Agency
Report Reference: UC15080.5/17370-0 27th May 2021
© WRc 2021 41
Table 5.3 DecaBDE concentrations found in covers compared with the minimum
decaBDE concentration required in a cover for a POPs classification
Component type
Minimum decaBDE
concentration for POPs
classification
(mg kg-1)
Range of decaBDE found
in items
(mg kg-1)
% of samples exceeding POPs
classification due to decaBDE
Total number of samples
tested
Textile sofa 4,200 – 7,680 696 – 204,245 75% 12
Leatherette sofa 4,800 – 5,400 859 – 45,883 25% 4
Textile armchairs and chairs
11,880 – 28,800 3,221 – 118,050 89% 9
Leatherette armchairs and chairs
8,890 – 16,800 44,257 – 137,212 100% 2
5.4.2 Bromine accountability
The HBCDD and PBDE results were compared with XRF data to determine the bromine mass
balance or ‘bromine accountability’ for each of the samples during the analysis. For some
samples the concentrations of HBCDD and/or PBDEs were shown to account to the total
amount of bromine detected by XRF. However, for other samples there is a ‘bromine gap’ which
means a proportion of the bromine present in the samples has not been accounted for. Two
possible explanations for the bromine gap are:
• extraction issues during the analytical testing for some samples have resulted in an
under-reporting of the HBCDD or PBDE data; or
• other brominated compounds are present in the samples which have not been detected
or cannot be extracted due to their specific chemistry. For example, reactive
brominated flame retardants bound to the polymer are not likely to be extracted during
testing.
Additional testing was undertaken to determine whether other brominated flame retardants
were present in the some of the samples. The testing focused on the following brominated flame
retardants:
• tetrabromobisphenol A (TBBPA);
• 1,2-bis(tribromophenoxy)-ethane (TBPE); and
• decabromodiphenyl ethane (DBDPE).

Environment Agency
Report Reference: UC15080.5/17370-0 27th May 2021
© WRc 2021 42
Neither TBBPA nor TBPE were found in any of the samples in concentrations greater than trace
amounts. However, for some samples DBDPE was confirmed to be present at percentage
levels which has been assumed to account for the ‘missing’ bromine in those samples although
quantitative testing would be required to confirm this.
Plots showing the ‘bromine accountability’ for each of the samples tested are shown in Figure
5.1 to Figure 5.3. In general, the bromine accountability for the textile samples is good with the
majority being shown to contain decaBDE. Two samples were shown to contain DBDPE, and
only two samples had a significant amount of ‘missing bromine’. Based on the results of the
other samples it is possible that the low results of these two samples is questionable. For the
other materials significantly more samples contain ‘missing bromine’ which may indicate that
those samples could contain other types of brominated compounds. This may be particularly
true for foams were brominated-polymers are known to have been used in expanded
polystyrene. However, it may also be the case that the test matrix caused issues with the
extraction technique employed for this analysis.
Figure 5.1 Bromine accountability for textile cover samples
Figure 5.2 Bromine accountability for leatherette cover samples
0%
20%
40%
60%
80%
100%
Bro
min
e a
ccounta
bili
ty (
%)
Textile cover samples
HBCDD DecaBDE Other PBDEs Deca-BDPE Unknown
0%
20%
40%
60%
80%
100%
WF2-A WF16-A KM22-A LC29-A HH2-A HH22-A
Bro
min
e a
ccounta
bili
ty (
%)
Leatherette cover samples

Environment Agency
Report Reference: UC15080.5/17370-0 27th May 2021
© WRc 2021 43
Figure 5.3 Bromine accountability for foam and lining samples
5.5 Summary of Tier 3 Testing
The results of the Tier 3 analysis showed that POPs-classified PBDEs and HBCDD were
present in the samples analysed. DecaBDE was commonly found at percentage levels in textile
covers and also in some leatherette covers. DecaBDE was found in one foam and one lining
sample above 1% wt., but the concentrations found in the covers far outweighed those found
in the other components.
The concentrations of decaBDE and HBCDD in the covers were consistently found at levels
which would result in a POPs classification of the entire item. This was true for sofas, armchairs
and chairs. The concentrations found in textile covers in particular were significantly above the
‘minimum’ concentration required for the entire item to be classified as a POPs waste.
Therefore, even accounting for analytical challenges, the items which the components were
sourced would be classified as POPs wastes beyond reasonable doubt.
For some of the samples not all the bromine determined via XRF could be accounted for by
HBCDD and PBDE detected during the testing. Although in some cases other brominated flame
retardants were identified and shown to be present, there was still a significant amount of
‘missing bromine’. It is possible that some of the missing bromine could be present as other
compounds such as brominated-polymers in foams, but it is also possible that the HBCDD or
PBDE concentrations were under-reported due to limitations of the extraction technique.
The Tier 2 testing supported the data obtained during Tier 3, but also indicated that some
samples contained other chemicals such as chlorinated PFRs and medium chained chlorinated
paraffins. The analytical laboratory reported that in some cases the presence of these
compounds can interfere with the testing for brominated flame retardants if they were
0%
10%
20%
30%
40%
50%
60%
70%
80%
90%
100%
Bro
min
e a
ccounta
bili
ty (
%)
Foam and lining samples
Environment Agency
Report Reference: UC15080.5/17370-0 27th May 2021
© WRc 2021 44
unexpectedly present. This emphasises that the analytical testing for flame retardants is
complex and can result in difficulties during analysis.
Nevertheless, despite some challenges in testing for some of the samples, the results show
that POP-classified BFRs can be present in a significant number of domestic seating in the UK.
The Tier 3 analysis data for textile and leatherette covers are shown in Table 5.4 and the data
for foam and lining samples are shown in Table 5.5. The text presented in black were derived
from GC-HRMS for the PBDEs and HPLC-MS for HBCDD. The results which are highlighted in
orange were verified by GC-ECD analysis.

Environment Agency
Report Reference: UC15080.5/17370-0 27th May 2021
© WRc 2021 45
Table 5.4 HBCDD, PBDE and deca-BDPE concentrations in textile and leatherette ‘cover’ samples
Sample code
Item source
Concentration (mg kg-1)
HBCDD
tetraBDE
BDE-47
PentaBDE
BDE-99
HeptaBDE
BDE-183
OctaBDE
BDE-197
OctaBDE
BDE-196
NonaBDE
BDE-206
NonaBDE
BDE-207
DecaBDE
BDE-209 Deca-BDPE
Textile covers
CC17-A Sofa 92,997 0.98 n.d. (<0.24)
n.d. (<0.92)
n.d. (<0.51)
n.d. (<1.01)
n.d. (<40.6)
n.d. (<18.4)
696 n.d. (<10.0)
CC27-B Sofa 45 n.d. (<0.41)
n.d. (<0.26)
1 1 8 210 1,841 114,234 n.d. (<10.0)
CC25-B Sofa n.d. (<10.0)
n.d. (<0.57)
n.d. (<0.39)
2 3 24 277 2,006 121,472 n.d. (<10.0)
CC11-B Sofa n.d. (<10.0)
n.d. (<0.57)
n.d. (<0.18)
n.d. (<0.70)
1 12 171 1,754 97,951 n.d. (<10.0)
CC8-A Armchair 161 n.d. (<0.33)
n.d. (<0.24)
n.d. (<1.08)
1 21 204 1,498 82,889 n.d. (<10.0)
CC23-B Armchair 414 n.d. (<0.38)
n.d. (<0.20)
n.d. (<1.42)
n.d. (<0.51)
6 140 1,180 75,195 n.d. (<10.0
CC4-B Armchair n.d. (<10.0)
n.d. (<0.5)
0.4 1 1 4 207 1,666 71,890 n.d. (<10.0)
CC6-A Dining chair n.d. (<10.0)
n.d. (<0.5)
0.4 1 1 7 205 2,330 93,198 n.d. (<10.0)
WF16-B Sofa n.d. (<10.0)
n.d. (<0.59)
0.5 1 1 5 238 1,942 98,857 5,229
WF24-A Armchair n.d. (<10.0)
n.d. (<0.28)
0.3 1 2 15 273 2,174 118,050 n.d. (<10.0)
WF9-A Footstool n.d. (<10.0)
n.d. (<0.26)
n.d. (<0.17)
n.d. (<0.66)
1 12 203 1,195 65,305 77
KM22-B Armchair 44 n.d. (<0.03)
n.d. (<0.05)
0.8 1 13 157 1,489 90,536 178
KM11-D Footstool 2,352 0.2
0.2 3 6 41 483 165 2,285 n.d*
KM16-A Sofa 48 n.d. (<0.03)
n.d. (<0.05)
0.1 0.6 1 11 23 217 7,387

Environment Agency
Report Reference: UC15080.5/17370-0 27th May 2021
© WRc 2021 46
Sample code
Item source
Concentration (mg kg-1)
HBCDD
tetraBDE
BDE-47
PentaBDE
BDE-99
HeptaBDE
BDE-183
OctaBDE
BDE-197
OctaBDE
BDE-196
NonaBDE
BDE-206
NonaBDE
BDE-207
DecaBDE
BDE-209 Deca-BDPE
KM17-A Sofa 29,149 n.d. (<0.03)
n.d. (<0.05)
0.8 n.d. (<0.51)
3 126 886 43,398 11
LC15-B Sofa 58 n.d. (<0.04)
n.d. (<0.07)
1 5 34 516 241 6,333 n.d.*
LC22-A Sofa 8 n.d. (<0.03)
0.22 1 1 7 209 1,349 68,286 n.d. (<10.0)
LC33-G Armchair n.d. (<10.0)
n.d. (<0.03)
n.d. (<0.04)
1 1 8 111 1,502 97,951 n.d.
HH19-A Sofa 119 n.d. (<0.26)
n.d. (<0.17)
n.d. (<0.57)
n.d. (<0.51)
n.d. (<1.01)
n.d. (<0.51)
n.d. (<28.8)
2,929 7,598
HH56-A Sofa 15,195 n.d. (<6.13)
n.d. (<0.31)
2 1 7 164 1,141 81,267 499
HH72-A Sofa 699 n.d. (<1.70
n.d. (<0.31)
n.d. (<1.50)
1 3 319 4,325 204,245 576
Leatherette covers
WF2-A Dining chair 289 0.6 0.6 n.d. (<1.52)
2 12 103 426 44,257 n.d. (<10.0)
WF16-A Sofa 18,959 n.d. (<0.35)
n.d. (<0.21)
n.d. (<1.08)
0.5 6 133 n.d. (<22.1)
n.d. (<859) n.d.*
KM22-A Armchair n.d. (<10.0)
0.04 n.d. (<0.05)
0.9 1 12 185 1,969 137,212 264
LC29-A Sofa 53 n.d. (<0.05)
n.d. (<0.05)
0.3 n.d. (<0.51)
4 62 391 45,883 11,227
HH2-A Sofa 128 n.d. (<0.53)
n.d. (<0.31)
n.d. (<1.19)
n.d. (<0.51)
n.d. (<1.01)
26 16 1,548 8,142
HH22-A Sofa n.d. (<10.0)
n.d. (<0.46)
n.d. (<0.31)
n.d. (<0.96)
n.d. (<0.51)
n.d. (<1.01)
33 n.d. (<14.2)
n.d. (<1,023)
6,224

Environment Agency
Report Reference: UC15080.5/17370-0 27th May 2021
© WRc 2021 47
Table 5.5 HBCDD, PBDE and deca-BDPE concentrations in foam and lining samples
Sample code
Item source
Concentration (mg kg-1)
HBCDD
tetraBDE
BDE-47
PentaBDE
BDE-99
HeptaBDE
BDE-183
OctaBDE
BDE-197
OctaBDE
BDE-196
NonaBDE
BDE-206
NonaBDE
BDE-207
DecaBDE
BDE-209 Deca-BDPE
Foams
CC17-B Sofa 1,027 n.d.
(<0.43) n.d.
(<0.24) n.d.
(<1.53) n.d.
(<0.51) n.d.
(<1.01) n.d.
(<21.1) n.d.
(<15.1) 28 n.d.
(<10.0)
CC5-C Sofa 562 0.3 n.d.
(<0.14) n.d.
(<0.59) n.d.
(<0.51) 2 77 183 10,563 n.d.
(<10.0)
CC8-H Armchair 53 n.d.
(<0.23) n.d.
(<0.14) n.d.
(<0.59) n.d.
(<0.51) 3 56 56 3,186 n.d.
(<10.0)
WF16-C Sofa n.d.
(<10.0) n.d.
(<0.42) n.d.
(<0.26) n.d.
(<0.5) n.d.
(<0.51) n.d.
(<1.01) 33 85 4,240 137
WF6-B Office chair
16 n.d. (<0.41)
n.d. (<0.21)
n.d. (<1.00)
n.d. (<0.51)
1 37 n.d. (<27.0)
1,820 30
KM17-B Sofa 429 n.d.
(<0.03) n.d.
(<0.05) 0.1 n.d.
(<0.51) n.d.
(<1.01) n.d.
(<43.0) n.d.
(<35.0) 871 n.d.
(<10.0)
KM20-C Sofa 39 n.d.
(<0.03) n.d.
(<0.05) n.d.
(<0.03) n.d.
(<0.51) n.d.
(<1.01) n.d.
(<18.4) n.a.
(<17.0) 385 n.d.
(<10.0)
KM37-B Sofa 148 n.d.
(<0.03) n.d.
(<0.05) 0.1 n.d.
(<0.51) 3 50 72 3,099 n.d.
(<10.0)
KM40-C Sofa 9 n.d.
(<0.03) n.d.
(<0.05) 0.1 n.d.
(<0.51) 1 31 23 363 3,760
KM12-E Armchair 52
0.1 0.1 1 9 27 488 434 7,404 n.d.*
KM26-D Armchair 25 n.d.
(<0.03) n.d.
(<0.05) 0.1 0.6 1 36 45 1,099 587
LC22-D Sofa n.d.
(<10.0) n.d.
(<0.03) n.d.
(<0.04) 0.1 n.d.
(<0.51) n.d.
(<1.01) 34 28 967 338
LC26-C Sofa n.d.
(<10.0) n.d.
(<0.03) n.d.
(<0.05) 0.1 n.d.
(<0.51) 1 41 18 802 3,112
LC38-C Sofa n.d.
(<10.0) n.d.
(<0.03) n.d.
(<0.04) n.d.
(<0.03) n.d.
(<0.51) n.d.
(<1.01) n.d.
(<39.2) n.d.
(<16.3) n.d.
(<713) n.d.
(<100)

Environment Agency
Report Reference: UC15080.5/17370-0 27th May 2021
© WRc 2021 48
Sample code
Item source
Concentration (mg kg-1)
HBCDD
tetraBDE
BDE-47
PentaBDE
BDE-99
HeptaBDE
BDE-183
OctaBDE
BDE-197
OctaBDE
BDE-196
NonaBDE
BDE-206
NonaBDE
BDE-207
DecaBDE
BDE-209 Deca-BDPE
LC38-D Sofa n.d.
(<10.0) n.d.
(<0.03) n.d.
(<0.05) n.d.
(<0.03) n.d.
(<0.51) n.d.
(<1.01) n.d.
(<36.4) n.d.
(<18.1) 74 73
LC44-D Armchair n.d.
(<10.0) n.d.
(<0.03) n.d.
(<0.06) n.d.
(<0.05) n.d.
(<0.51) n.d.
(<1.01) n.d.
(<34.1) n.d.
(<20.4) 133 1,369
HH51-D Sofa n.d.
(<10.0) n.d.
(<6.33) 6 n.d.
(<0.99) 1 11 228 19 134,311 127
HH32-C Armchair 315 11,686 17,478 n.d.
(<0.96) n.d.
(<0.51) n.d.
(<1.01) 50 n.d.
(<30.3) 36 44
HH34-C Armchair n.d.
(<10.0) n.d.
(<49.17) n.d.
(<0.31) n.d.
(<0.99) n.d.
(<0.51) n.d.
(<1.01) 14 n.d.
(<18.5) 61 44
Linings
CC23-D Armchair 6,085 n.d.
(<0.20) n.d.
(<0.34) n.d.
(<1.08) 1 5 122 159 12,215 n.d.
(<10.0)
WF2-D Dining chair
16 n.d. (<0.41)
n.d. (<0.22)
n.d. (<0.69)
1 7 263 52 1,739 n.d.*
LC7-D Office chair
n.d. (<10.0)
n.d. (<0.03)
n.d. (<0.05)
0.1 5 23 531 290 5,736 n.d.*
HH19-B Sofa 396 n.d.
(<0.26) n.d.
(<0.26) n.d.
(<0.90) n.d.
(<0.51) 2 177 n.d.
(<29.0) 390 n.d.*
n.d. – not detected (detection limit in brackets)
n.d.* not detected, extraction was performed with polar solvent which may have resulted in underestimated results

Environment Agency
Report Reference: UC15080.5/17370-0 27th May 2021
© WRc 2021 49
6. Summary of Findings and Conclusions
A significant amount of information which can be used to inform the future classification of UK
domestic seating has been collected as part of this Environment Agency led study. At the
present time we are still awaiting the quantitative analytical test data, but a number of
preliminary conclusions can be made.
1. Sample collection: The sampling programme carried out at two HWRCs, two waste
transfer stations, a reception hall taking bulky waste at an EfW facility and one re-use
charity warehouse and shop has produced a robust dataset which is considered to be
representative of waste domestic seating produced within the UK. Although the site
visits were undertaken during Covid-19 restrictions, discussions with site personnel
confirmed the waste stream to be typical of the cross section of the type and cross-
section of items received at each site during routine operations. All sites received their
waste from a wide catchment area across their respective counties covering a range of
demographics providing confidence that the samples obtain were representative of the
UK waste stream as a whole.
2. The sample: A total of 282 items of soft furniture were sampled in November 2020.
Sample collection was weighted towards sofas and armchairs as these represent the
highest proportion of item types in the UK waste stream. At the first three sites each
item or unit of furniture was the weighed and accurate dimensions of the units recorded
to allow quantification of the weight of the covers, linings, and foam to be calculated as
a percentage of the whole unit using a calculated surface area and measured density
data. Samples were collected from all textile or foam components within the unit and
included: outer covers (textile, leather and synthetic leather / leatherette), under-covers,
cushions base linings, unit base linings, frame covers, foam layers and webbing.
Samples were given unique identifiers and taken to the WRc waste laboratory for XRF
screening ahead of a sub-sample being selected for analytical testing.
3. Target compounds: Flame retardants can be added to textiles in a number of ways.
Reactive flame retardants are added during the polymerisation process and become
an integral part of the polymer and form a co-polymer. The result is a modified polymer
with flame retardant properties and different molecule structure compared to the original
polymer molecule. Additive flame retardants, which include PBDEs, are incorporated
into the polymer prior to, during, or more frequently after polymerisation as a coating.
Additive flame retardants are monomer molecules that are not chemically bounded to
the polymer. They are commonly added with metal oxide synergists to improve their
performance. They may therefore, in contrast to reactive flame retardants, be released
from the polymer during normal use and thereby also discharged to the environment.
In contrast to most additives, chemical flame retardants can appreciably impair the
properties of polymers. The basic problem is the trade-off between the decrease in

Environment Agency
Report Reference: UC15080.5/17370-0 27th May 2021
© WRc 2021 50
performance of the polymer caused by the flame retardant and the fire retardancy
requirements. In the case of fabrics that are designated as “flame retardant,” that have
been topically treated with chemicals, the flame retardancy of the fabric will dissipate
over time, particularly with repeated cleaning and at end of life they may no longer
contain functional levels of flame retardants. In this study the target compounds were
PBDEs and HBCDD which are additive flame retardants. However, by screening for
bromine, it is possible that other flame retardants have been detected, such as TBBPA,
which is a reactive type. To address this issue a tired testing regime was adopted to
assess for PBDEs and HBCDD in the domestic seating waste.
4. Test regime: A three-tiered testing strategy was adopted for domestic seating testing
consisting of:
i. initial screening for bromine and other metals (as an indication of the presence
of BFRs and synergists added to improve the performance of the FRs) using a
hand-held XRF device (282 samples);
ii. use of a broad screening technique to provide information on a wide range of
commonly used FR’s (20 samples); and
iii. testing of a chemical extraction and quantitative analysis of PBDEs congeners
and HBCDD (50 samples) and other flame retardants (14 samples for selected
PFRs and TBBPA).
5. XRF data analysis: The XRF data showed no differences between samples collected
at the different sites for both the waste sites and the re-use charity. This indicates that
the composition of waste domestic seating is consistent across the country and the
data can be taken to be a good representation of that composition. The majority of
scans for each of the component categories recorded bromine concentrations below
functional levels (<0.1% wt.). Scans which found bromine at functional levels (i.e.
>1% wt.) were mostly recorded on samples of covers and foams, and the majority of
such samples were taken from sofas or armchairs. Only 1% of leather covers (a single
sample) were found with bromine concentrations >1% wt., compared with 19% of
leatherette and 54% of textile covers. Leather and leatherette covers were identified by
a combination of dismantling (looking at both sides of the cover) and chemical testing.
Leather items were usually identified by a polished outer surface and suede, unpolished
inner surface. However, for some items chemical testing was required to determine the
material. The chemical testing revealed that a range of polymer types are used to make
synthetic leather covers. Only 6% of foam samples were found to contain bromine
greater than 1% wt. and only 3% were found to contain bromine between 0.5 and
1% wt.. Where bromine was found in foams the concentration was normally between
0.05 and 0.5% wt. (18% of samples). The bromine concentrations were determined at
a component level, but this concentration must be converted to its concentration in the
entire item for comparison against any concentration thresholds (i.e. POPs MCL). Due
to the greater amount of covering on a sofa, the minimum bromine concentration

Environment Agency
Report Reference: UC15080.5/17370-0 27th May 2021
© WRc 2021 51
required for the sofa to exceed the MCL is lower than other item types. As leather has
a greater weight than textile and leatherette covers, the minimum bromine
concentration is lower. Despite the variations it is likely that if decaBDE was present at
functional levels in sofa covers the entire item should exceed the MCL. Higher
concentrations of decaBDE would be required in armchairs and chairs due to their
make-up, but if the compound was present at levels around 5% then the item would
likely be significantly over the POPs MCL. A summary of the XRF scanning results is
shown in Table 6.1 and this shows the total number of scans done and the percentage
which recorded a bromine content >1% wt.. This provides an indication on the
proportion of the samples which are suspected of containing BFRs at functional levels.
6. Chemical tests: Despite some difficulties experienced during analytical testing, these
challenges have been overcome by the expertise of the test laboratories. The available
data shows a high level of comparability between three laboratories and although there
are a few inconsistencies we can therefore be confident that the study has shown
beyond reasonable doubt that the concentration of POPs in domestic seating exceeds
thresholds although the accuracy of definitive concentrations is subject to some error.
The data does indicate that testing these types of matrices is extremely difficult and
application of standard methods may not be sufficient. Technical expertise in this
instance has been used to overcome a variety of complex analytical issues to generate
a robust dataset to support regulatory decision making.
Chemical analyses have shown that POPs classified PBDEs and HBCDD are present
in some domestic seating in the UK at concentrations which would result in a POPs
classification. DecaBDE was the most common POPs-classified compound found in
samples and was consistently found at percentage levels in textile covers as well as in
some leatherette covers. One foam and one lining sample also contained decaBDE
above 1% wt.. HBCDD was found in a small number of samples at high percentage
levels which would also result in a POPs classification. The chemical testing combined
with the XRF data showed that for textile domestic seating bromine is present in a large
proportion of the waste stream and it is likely that the bromine is present as decaBDE.
Although other brominated flame retardants were found, for example DBDPE, these
compounds are not considered to currently be common in the waste stream. DBDPE
was used as a replacement for decaBDE and so may become more prevalent in waste
over time. DBDPE is not currently classified as a POP, but it is currently under REACH
assessment for its bio-persistence. However, some of the ‘missing bromine’ reported
in the analysis may be due to under-reporting due to analytical difficulties particularly
during the extraction stage of the analysis. Additional testing also identified that
chlorinated PFRs are present in some of the domestic seating samples and although
these chemicals also not currently POPs they may become a concern in the future. A
summary of the Tier 3 testing is provided in Table 6.2. This shows the proportion of the
samples tested with high levels of POPs-classified brominated flame retardants (>1%
wt.).

Environment Agency
Report Reference: UC15080.5/17370-0 27th May 2021
© WRc 2021 52
7. Estimation of POPs in UK waste domestic seating: Based on the results of the XRF
analysis and Tier 3 chemical testing the amount of POPs-classified BFRs in waste
domestic seating could be estimated. The methodology for the calculations is provided
in Appendix E. Based on these calculations, there is an estimation of between 364 and
476 tonnes of POPs-classified BFRs per 100,000 tonnes of waste domestic seating in
the UK. Although some of these POPs may be present as HBCDD and some older
PBDEs, the majority would be expected to be decaBDE. Textile covers from sofas
accounted for 88% of the amount of POPs-classified brominated flame retardants and
when combined with textile covers from armchairs, accounted for 94% of the total.
Table 6.1 Summary of XRF scanning results
Sample type Number of scans % with bromine over 1% wt.
Sofas
Textile cover 94 66%
Leather cover 47 2%
Leatherette cover 32 31%
Foam 147 6%
Lining 134 3%
Wadding 78 0%
Armchairs
Textile cover 40 58%
Leather cover 20 0%
Leatherette cover 13 8%
Foam 72 6%
Lining 74 0%
Wadding 35 0%
Chairs – Office
Textile cover 11 0%
Leather cover 1 0%
Leatherette cover 6 0%
Foam 15 7%
Lining 11 0%
Wadding 4 0%
Chairs – Dining
Textile cover 19 37%
Leather cover 5 0%
Leatherette cover 10 10%
Foam 18 0%
Lining 19 0%
Wadding 12 0%

Environment Agency
Report Reference: UC15080.5/17370-0 27th May 2021
© WRc 2021 53
Sample type Number of scans % with bromine over 1% wt.
Other
Textile cover 17 35%
Leather cover 2 0%
Leatherette cover 2 0%
Foam 12 8%
Lining 12 0%
Wadding 6 0%
Table 6.2 Summary of Tier 3 testing results
Sample type Number of samples tested
% of sample with HBCDD or POPs classified PBDEs >1% wt.
Sofas
Textile covers 12 75%
Leatherette covers 4 25%
Leather covers 0 -
Foams 12 17%
Linings 1 0%
Armchairs
Textile covers 6 100%
Leatherette covers 1 100%
Leather covers 0 -
Foams 5 20%
Linings 2 50%
Chairs
Textile covers (Dining chair) 1 100%
Leatherette covers (Dining chair) 1 100%
Leather covers 0 -
Foams 1 0%
Linings 2 0%
Other
Textile covers 2 (footstools) 50%
Leatherette covers 0 -
Leather covers 0 -
Foams 0 -
Linings 0 -

Environment Agency
Report Reference: UC15080.5/17370-0 27th May 2021
© WRc 2021 54
References
Benkhaya, S., M’rabet, S. and El Harfi, A. (2020) ‘Classifications, properties, recent synthesis and applications of azo dyes’, Heliyon. Elsevier, 6(1), pp. e03271–e03271. doi: 10.1016/j.heliyon.2020.e03271.
Dhungana, B. et al. (2019) ‘Abundances and concentrations of brominated azo dyes detected in indoor dust’, Environmental Pollution, 252, pp. 784–793. doi: https://doi.org/10.1016/j.envpol.2019.05.153.
Peng, H. et al. (2016) ‘Mutagenic Azo Dyes, Rather Than Flame Retardants, Are the Predominant Brominated Compounds in House Dust’, Environmental Science & Technology. American Chemical Society, 50(23), pp. 12669–12677. doi: 10.1021/acs.est.6b03954.

Environment Agency
Report Reference: UC15080.5/17370-0 27th May 2021
© WRc 2021 55
Appendix A Data Collation and Calculation of Component Proportions in Domestic Seating Units
Approach
During the domestic seating sampling campaign, the sampled units have been allocated into a
discrete number of groups based on detailed physical measurements completed on site and
then benchmarked with on-line product dimensions to provide a compatibility check. Both site
measurements and manufacturers data were used to determine the relative proportions (by
either surface area or volume) of the different components within a unit (covers, foams etc.)
taking into account their thickness and weight / density in each domestic seating unit. This
information has then been used to back calculate XRF bromine and POPs testing data on a
component level to the proportion in the overall unit for comparison against relevant thresholds.
The data collection and calculation processes are outlined in Figure A.1.
Figure A.1 Generic data collation and calculation process
Each of the calculation steps and assumptions used in this report are explained in the
following section. Where appropriate natural variability between domestic seating items from

Environment Agency
Report Reference: UC15080.5/17370-0 27th May 2021
© WRc 2021 56
different manufacturers in terms of the frame design, fabrics and construction has been taken
into account by producing range data for each measurement criteria.
Data Collation
A2.1 Domestic seating categories
For ease of comparison the domestic seating items sampled have been grouped as follows:
• sofas;
• armchairs (part of a suite or individual chairs);
• chairs (dining, office); and
• others (footstools, headboards, children’s’ furniture and bean bags, etc.).
Each main group has then been sub-divided into ‘categories’ and all items sampled in the field
sampling programme have been allocated to a category as listed in Table A.1. In some cases
the group or category has been estimated based on available seating cushions and side pieces
as the base frame was not always present, in these cases the sizes of the available pieces
were used to identify a potential source item.
Table A.1 Number of items of soft-furnishings by group and category
Group Category Items (No.) %
Armchairs Club (incl. rolled arm) 36 14%
Wingback 9 3%
Tub/Bucket 7 3%
Recliner 5 2%
Chairs Dining chair 21 8%
Office chair 17 7%
Bar stool 4 2%
Sofas
2-seater slim textile 40 15%
2-seater slim leather 14 5%
2-seater padded textile 14 5%
2-seater padded leather 27 10%
2-seater recliner 9 3%
3-seater slim textile 11 4%
3-seater slim leather 5 2%
3-seater padded textile 4 2%
3-seater padded leather 7 3%
3-seater recliner 6 2%
corner sofa 5 seats recliner (at LC slim) 9 3%
Others Footstools/ headboards /children’s furniture/bean-bags and a futon
6 2%

Environment Agency
Report Reference: UC15080.5/17370-0 27th May 2021
© WRc 2021 57
A2.2 Item composition
Most soft-furnishing items are made up of a combination of components:
• the main frame that is made of metal or wood;
• webbing under the seats and in some cases springs in older and more top-end units;
• polymer foams used in the seat and back as dense filling materials present in a range
of colours, densities and thickness;
• thin foam layer found on arm cover and more generally over the frame;
• polyester or cotton wadding that was commonly found between the outer cover and
lining and the main foam seat or padded back;
• covers (outer and inner) on the frame and cushion covers which included real leather,
synthetic leather (leatherette / PVC) and a range of textiles (synthetic and non-synthetic
fabrics used alone or mixed); and
• a paper-like lining material that covers the bottom or back of a unit and in some cases
is used to cover the back or underside of cushions and parts of the frame behind the
cushions.
A2.3 Standard item sizes
The measurements of the different item categories which have been calculated from site
recorded data and online research. The summation of sizes is provided in Error! Reference s
ource not found. and are used as a basis for subsequent surface area calculations for fabric
covers and volume calculations for any foams and wadding. Figure A.2 provides examples of
common domestic seating found on the market with their schematic diagrams and specific
measurements. These can be used as a reference for the categories cited in Table A.2.

Environment Agency
Report Reference: UC15080.5/17370-0 27th May 2021
© WRc 2021 58
Figure A.2 Examples of common furniture categories
2 seater sofa 3 seater sofa
Recliner chair 5 seater corner sofa
Standard club chair
Table A.2 Range unit dimensions by domestic seating category
Item Type Average
(cm)
Minimum
(cm)
Maximum
(cm)
Item Type
Average
(cm)
Minimum
(cm)
Maximum
(cm)
Sofa Recliner armchair
Width 3-seater 160 125 185
Overall
width
95 68 102
Depth 89 81 102
Overall
Depth
95 95 96
Height 91 66 100
Overall
Height
99 96 104

Environment Agency
Report Reference: UC15080.5/17370-0 27th May 2021
© WRc 2021 59
Item Type Average
(cm)
Minimum
(cm)
Maximum
(cm)
Item Type
Average
(cm)
Minimum
(cm)
Maximum
(cm)
Seat depth 55 51 64
Seat
depth
54 51 56
Seat height 45 38 55
Seat
height
48 46 49
Arm width 25 20 30 Arm width 20 15 25
Armchairs Club Dining chair (review range)*
Overall width 103 95 108 Back
Width
41 37 44
Overall Depth 95 90 97 Back
Height
53 30 66
Overall Height 97 90 101 Seat
Width
45 42 48
Seat depth 53 52 54 Seat
depth
58 42 54
Seat height 52 50 55
Arm width 25 18 30
Wingback armchairs Office chair
Overall width 74 60 82 Back
Width
43 40 45
Overall Depth 90 86 96 Back
Height
54 50 60
Overall Height 101 110 92 Seat
Width
52 49 54
Seat depth 52 50 54 Seat
depth
46 42 50
Seat height 45 43 47 Bar stool
Arm width 15 10 20 Back
Width 41 37 45
Tub armchair Back
Height 33 32 33
Overall width 71 68 79 Seat
Width 41 37 45
Overall Depth 66 62 70 Seat
depth 38 37 38
Overall Height 75 72 78 Other
Seat depth 53 44 55 Overall
width
89 60 115
Seat height 42 37 46 Overall
Depth
68 50 98
Arm width 15 Overall
Height
43 37 50
Overall
width
89 60 115

Environment Agency
Report Reference: UC15080.5/17370-0 27th May 2021
© WRc 2021 60
A2.4 Standard item weights
It was not possible to measure the weight of the frame as opposed to the weight of the entire
unit with covers and foams in a field setting as this would have required complete and time
intensive dismantling of the complete unit. On-line market research was used as the main
source of information for the weights of different domestic seating types as it provided a wider
set of data than the site data which was compromised in some cases by incomplete units. The
site data was used to verify the weight data in addition to data from the furniture re-use network
Typical item weights are presented in Table A.3.
Table A.3 Weights by item category
Item Category
Market research data Site data
Mode (kg)
Minimum (kg)
Maximum (kg)
Mode (kg)
Minimum (kg)
Maximum (kg)
Sofas
2-seater slim 45 40 50 30 (2) 30 60
2-seater padded 55 50 60 40 (3) 40 80
2-seater recliner 65 60 70 70 (2) 70 100
3-seater slim 62 60 70 - 80 80
3-seater padded 70 65 75 - 30 100
3-seater recliner 90 80 92 - 80 100
corner recliner 5 seats 128 95 150 - 60 170
Armchairs
Armchair, club 30 20 35 30 (3) 10 70
Wingback 25 15 28 20 (4) 20 40
Tub/bucket chair 15 12 18 20 (3) 20 30
Recliner 45 40 48 50 (2) 50 50
Chairs
Office char 15 7 18 10 (6) 10 20
Dining chair 10 5 11 10 (6) 10 40
Bar stool 10 6 15 10 (2) 10 10
Others
Foot stool 18 10 28 20 (2) 10 20
A2.5 Component density
The size and weight of each sample collected during the sampling campaign were recorded in
the WRc laboratory and this information used to calculate the densities of the covering
materials. The lengths of the sides of each sample (outer upholstery, inner lining or filler such
as wadding or foam) were measured together with their dry weights. Wet site samples were

Environment Agency
Report Reference: UC15080.5/17370-0 27th May 2021
© WRc 2021 61
dried ahead of weighing. This data was then used to calculate first the volume and secondly
the density of each type of domestic seating component.
Average density values for the three main upholstery cover materials are listed in Table A.4.
Table A.4 Calculated material densities
Type of material Average density (g/cm3)
Leather 0.92
Leatherette 0.75
Textile 0.50
Foam 3.00
Wadding 1.50
Lining foam 1.55
Example foam density data is published in a number of technical furnishing websites5. The most
common values range from 24 to 40 kg/m3. Specifically, in the case of domestic seat cushions,
the foam density is normally circa 28 kg/m3. A comparison of this data with the site data
indicates that the average foam density is circa 36 kg/m3. It is postulated that significant use
may have compacted the foam in discarded units leading to a higher measured density.
Combining this data an average value of 30 kg/m3 has been used for the foam density in
subsequent calculations. Foam data is reported in Table A.4 which includes with average
values for the cushion foam, lining foam and wadding materials.
Calculation Approach
The calculation approach is identified in Figure A.1. The calculations have been approached
by:
• Assign each furniture unit to a group and sub-category for which we have calculated
the mode and minimum and maximum size ranges.
• Calculate the surface area of each fabric (outer fabrics (including textile, leather and
leatherette) and liners which are contained within the unit taking into account where
they are found within a unit.
5 https://furnitureblog.simplicitysofas.com/blog/what-is-the-difference-between-a-sofa-cushions-foam-
density-and-firmness/

Environment Agency
Report Reference: UC15080.5/17370-0 27th May 2021
© WRc 2021 62
• Calculating the volume of foams and waddings used in the items taking into account
the differences which arise between fully padded and slim line units.
Assumptions and proportion calculations are provided below.
A3.1 Unit surface area and volume calculations
A number of variables were taken into account when calculating the relative proportions of
components within different units. These include:
• Unit volume: The inner volume of a unit ‘behind’ the frame is occupied by voids / air-
space.
• Fillers and foams: The cushions that constitute the seating and backs of sofas and
armchairs are filled with 100 % foam and the shape is assumed to be a cuboid. It is
assumed that padding of arms and other padded areas of the frame represent a second
cushion made up of lining foam, wadding and fabric lining. This allows us to take into
account the different levels of padding with units, including recliners. This layer of 2 cm
foam has been assumed to be present underneath the entire outer cover to soften the
edges of the main frame.
• Upholstery covers: the total surface of each category of item is calculated based on the
frame dimensions and level of padding. The outer upholstery cover is then expressed
as a fraction of the total surface area of the item. The outer cover has been assumed
to be 2 mm in thickness.
• Covers of cushions: the surface area of each cushion is calculated as a cuboid. For
textile covers the surface area is 100% of the total surface area of the cushion. In the
case of leather or leatherette items only 50% of the cushions are considered to be
covered in the fabric.
• Linings: the bottom of a unit is commonly covered by a paper-like black polyester
material lining. A softer lining fabric is often used also to cover the underside and back
of cushions.
• Wadding: an intermediate layer commonly used on top of the foam layer and before a
lining material and the upholstery cover. The volume has been calculated using the
outer upholstery cover surface area using an assumption of thickness of 1 cm.
In calculating the total surface area of the outer upholstery cover a refinement has been
introduced for leather and leatherette covers. Observations on site identified that only the part
of the cushion seen by the user was covered by the primary material. Therefore, the calculation
of the total surface only takes into account fifty percent of the cushions total outer surface. For
slim sofas covered in textile with movable cushions most likely the entire outer surface of the
cushions is covered by the same textile.

Environment Agency
Report Reference: UC15080.5/17370-0 27th May 2021
© WRc 2021 63
The assumptions for the percentage surface area and volumes are summarised in Table A.5.
Table A.5 Composition assumptions for furniture items
Surface area assumptions Volume assumptions
Category Outer covers
Black lining
White lining
Lining foam
Padding foam
Padded wadding
Foam filled cushion
Sofa slim textile
70% 30% 70% 70% - 75% 100%
Sofa slim leather
60-65% 35% 60-65% 70% - 75% 100%
Sofa padded textile
80% 20% 80% 70% 50% 75% 100%
Sofa padded leather
80% 20% 80% 70% 50% 75% 100%
Sofa recliner/corner
80% 20% 80% 70% 50% 75% 100%
A3.2 Calculated proportion of components by unit item
Based on the assumptions and calculations presented above, the calculated surface area and
volume of each component in the overall unit is provided in Table A.6 and A.7.
The percentage weight of each component for different domestic seating items are presented
in Table A.8 and A.9.
The values for each component that constitutes the item are presented as an average
associated with a maximum, variation (+) and minimum, variation (-), value. This approach
allows to take into consideration any intrinsic variability that each item may have due to
differences in the size and weight. The range data was calculated using the average, minimum
and maximum size values presented in Table A.2 and A.3.

Environment Agency
Report Reference: UC15080.5/17370-0 27th May 2021
© WRc 2021 64
Table A.6 Average armchair and chair component surface areas and volumes
Group Category Total surface
of the item
(cm2)
Outer cover
surface
area (cm2)
Foam
volume
(cm3)
Wadding
volume
(cm3)
Inter lining
surface
area (cm2)
Armchair Club (incl.
rolled arm) 64,900 49,900 218,400 48,600 14,900
Wingback 46,200 35,700 132,300 34,700 10,600
Tub/Bucket 37,000 29,700 109,700 27,800 7,400
Recliner 67,100 52,200 251,600 50,300 14,8000
Chair Dining Chair 8,600 6,500 16,200 3,200 2,200
Office Chair 7,000 4,700 17,700 2,400 2,400
Bar stool 7,200 5,700 11,000 2,900 1,500
Table A.7 Average sofa component surface areas and volumes
Category
Total
surface of
the item
(cm2)
Outer
cover
surfaces
(cm2)
Foam
volumes
(cm3)
Wadding
volumes
(cm3)
Inter lining
surfaces
(cm2)
Textile sofas
2-seater slim 96,300 73,100 302,200 72,200 23,200
2-seater padded 106,000 83,100 535,700 79,500 22,900
3-seater slim 124,700 94,200 403,400 93,500 30,500
3-seater padded 141,000 109,700 746,300 105,800 31,300
Leather and leatherette sofas
2-seater slim 97,000 62,000 303,200 72,800 35,000
2-seater padded 106,600 72,100 536,400 80,000 34,500
2-seater recliner 144,900 95,100 726,500 108,700 49,900
3-seater slim 124,700 79,000 403,400 93,500 45,700
3-seater padded 141,000 93,300 746,300 105,800 47,700
3-seater recliner 169,700 112,100 900,900 127,300 57,600
Corner sofa 5 seats
recliner 234,000 156,600 1,351,800 175,500 77,500

Environment Agency
Report Reference: UC15080.5/17370-0 27th May 2021
© WRc 2021 65
A3.3 Comparison with WRAP data
The WRAP study (Benefits of Reuse Case Study: Domestic Furniture, 2011) mentioned in its
final report that “An ‘average’ sofa is modelled as being made of particleboard (63%), foam
(PUR) (9%), woven cotton (8%), softwood (8%), low alloyed steel (8%), polyester (3%),
phosphorous (used in flame retardants) (1%) and melamine (1%).”
These findings are lower than the proportions calculated in the table above. The numbers are
comparable with the slim textile sofas, but not of the other types of sofas. However, it is
reasonable for the covers of sofas to account for a larger proportion especially when materials
like leather are used due to its greater density than textiles.

Environment Agency
Report Reference: UC15080.5/17370-0 27th May 2021
© WRc 2021 66
Table A.8 Relative proportions of covers in each domestic seating item
Group Category
Cover
leather
wt.%
Variation
(-)
Variation
(+)
Cover
leatherette
wt.%
Variation
(-)
Variation
(+)
Cover
textile
wt.%
Variation
(-)
Variation
(+)
Sofas
2-seater Slim 25 4.1 0.3 21 3.3 0.3 16 2.7 0.2
Padded 22 3.9 2.9 18 3.1 2.4 14 2.6 1.8
Recliner 22 1.8 3.1 18 1.5 2.5 12 1 1.7
3-seater Slim 22 3.5 1.6 18 2.8 1.3 14 2.2 0.9
Padded 25 3.5 1.6 20 2.8 1.3 16 2.2 0.9
Recliner 20 5.7 2.5 16 4.6 2.1 11 3.1 1.4
Corner sofa (5-seater) 23 7.9 3.3 18 6.4 2.7 12 4.3 1.8
Chairs
Armchair Club (incl.
rolled arm) 10 0.6 0.6 6 0.4 0.4 4 0.3 0.3
Wingback 12 0.5 0.5 8 0.3 0.3 5 0.2 0.2
Tub/Bucket 14 2.5 2.5 10 1.7 1.7 6 1 1
Recliner 7 0.8 0.8 5 0.5 0.5 3 0.3 0.3
Chair* Dining chair 12 1.4 1.4 10 1.2 1.2 6 0.8 0.8
Office chair 6 2.9 2.9 5 2.4 2.4 3 1.6 1.6
Other* Bar stool 11 4.2 4.2 9 3.4 3.4 6 2.3 2.3

Environment Agency
Report Reference: UC15080.5/17370-0 27th May 2021
© WRc 2021 67
Table A.9 Relative proportions of filling components in each domestic seating item
Group Category Wadding
wt.% range
Foam
wt.% range
Lining
wt.%
Sofas
2-seater Slim 2 +/-0.6% 11 +/- 3% 0.6
Padded 2 +/-0.5% 19 +/- 4% 0.6
Recliner 1 +/-0.3% 15 +/- 3% 0.7
3-seater Slim 2 +/-0.5% 17 +/- 2% 0.7
Padded 2 +/-0.5% 35 +/- 5% 0.9
Recliner 2 +/-0.9% 35 +/- 2% 0.8
Corner sofa (5-seater) 1 42 +/- 3% 1
Chairs
Armchair Club (incl.
rolled arm) 2 +/-0.2% 10 +/-2% 0.2
Wingback 2 +/-0.1% 13 +/-1% 0.3
Tub/Bucket 3 +/-0.5% 12 +/-1% 0.6
Recliner 1 +/-0.1% 9 +/-3% 0.5
Chair* Dining chair 1 4 0.4
Office chair 0.2 3 0.3
Other* Bar stool 0.3 2 0.2

Environment Agency
Report Reference: UC15080.5/17370-0 27th May 2021
© WRc 2021 68
Appendix B Item Label Information
During site sampling, all units were assessed to determine whether they had any labels present
including brand, country of manufacture and whether or not flammability labels were present.
Only 20% of the items taken from waste sites (excluding the re-use site) had a fire label
attached. The fire labels were predominantly those which stated the items conformed to the
Furniture and Furnishings (Fire Safety) Regulations 1988/1989, 1993 or 2010 alongside a label
which stated whether the filling was match or cigarette resistant. For the majority of the items,
no other labels or information were either present or readable. This may be partly due to them
being removed by the owners, the print had worn off during use and cleaning, or the item was
damaged or not completely present during sampling as it was often the case that at the waste
sites only part of the item was present or it has been damaged during compaction or transport.
For those items that did include additional labels, the information is displayed in Table B.1
below. The samples highlighted underwent the Tier 3 chemical testing.
There does not seem to be a correlation between having a fire label and bromine being present.
There are plenty of units with labels and no bromine. There are also examples in this table (but
obviously in the rest of the dataset) where bromine is present without a fire label, but this might
be because it has been removed.
Table B.1 Item labelling information (where available and applicable)
Item Type XRF Bromine >0.1% wt.
Fire label
Manufacturer Brand/Model Origin Age
CC1 Sofa Foam, lining Yes
CC2 Sofa Cover, lining No F8753M 2013
CC3 Sofa None Yes Furniture Village Trilogy
CC4 Armchair Cover, foam Yes
CC5 Sofa Cover, wadding,
lining
Yes
CC7 Armchair Cover, foam Yes 2014
CC8 Armchair Cover, foam, lining
Yes M & S Abbey 2001
CC10 Sofa Cover, wadding
No Carpenter Ltd Cotus Branch
Camden Lounger ST RX36100
2011
CC11 Sofa Cover, foam Yes Next
CC21 Armchair Lining Yes
WF1 Dining chair
None Yes
WF5 Dining chair
Cover Yes
WF7 Office chair
None Yes IKEA Tokkel Made in
China
WF8 Other None Yes
WF10 Other Lining Yes

Environment Agency
Report Reference: UC15080.5/17370-0 27th May 2021
© WRc 2021 69
Item Type XRF Bromine >0.1% wt.
Fire label
Manufacturer Brand/Model Origin Age
WF12 Other None Yes
WF13 Armchair None Yes IKEA 001.008.77/18871 Made in
Poland
WF15 Office chair
None Yes
WF17 Office chair
Lining Yes Julian Bowen Malmo Recliner & Footstool - Brown
WF18 Armchair Lining Yes Land of Leather 01 May 2008
WF19 Sofa None No 06 June 2006
WF20 Sofa None Yes Land of Leather
WF23 Armchair None No Parker knoll
WF24 Armchair Cover Yes jc & mp smith ltd furniture
#297525
WF25 Sofa None Yes Made in
Poland (?)
WF26 Armchair None Yes # 1004542
KM1 Armchair Cover, lining Yes
KM4 Sofa Lining, foam Yes
KM5 Sofa Lining No 2007
KM7 Sofa None Yes 2003
KM10 Sofa Cover Yes 2009
KM11 Other Cover, lining Yes 2016
KM12 Armchair Lining Yes 2005
KM18 Armchair Lining Yes IKEA 1999
KM20 Sofa Foam Yes 2006
KM25 Sofa Cover Yes 2004
KM29 Armchair None Yes
KM32 Office chair
None Yes
KM33 Office chair
None Yes
KM34 Sofa Cover Yes
KM39 Dining chair
None Yes
KM40 Sofa Cover, foam Yes
KM45 Armchair Cover, foam Yes
LC1 Sofa Cover, foam Yes 2017
LC2 Sofa None Yes 2010
LC3 Sofa Cover Yes 2015
LC4 Sofa None No 2003
LC6 Sofa Cover, lining Yes
LC15 Sofa Cover Yes 2014

Environment Agency
Report Reference: UC15080.5/17370-0 27th May 2021
© WRc 2021 70
Item Type XRF Bromine >0.1% wt.
Fire label
Manufacturer Brand/Model Origin Age
LC18 Sofa Cover Yes
HH38 Sofa None Yes Next - Home
SP3 Sofa Cover Yes DFS
SP5 Sofa Cover Yes DFS
SP6 Sofa None Yes Comfortex
SP7 Sofa Cover, foam Yes
SP8 Sofa Cover Yes M&S
SP10 Office chair
None Yes IKEA
SP11 Armchair None Yes John Lewis
SP12 Armchair Cover Yes G. Plan
SP26 Sofa Cover, foam Yes M&S
SP41 Armchair Cover Yes Quartz Contracts
SP43 Sofa None Yes Multiyork

Environment Agency
Report Reference: UC15080.5/17370-0 27th May 2021
© WRc 2021 71
Appendix C Tier 1 - XRF Screening
XRF Scanning Data
For the first tier of the assessment, chemical screening using a handheld XRF analyser was
primarily undertaken to determine the bromine concentration in the sampled components, as
bromine is the key indicator of BFRs. XRF analysis cannot identify specific compounds that are
present, but allows the selection of samples with significant levels of bromine present to be
selected for more complex analytical testing. As well as the bromine concentration the analyser
was able to determine the concentration of other parameters such as chlorine, and antimony
The concentrations of the other elements can provide some insight into either the type of
material (e.g. high chlorine can be linked to PVC) or identify if specific synergists or additives
have been used which can be linked to the use of a wider range of flame retardants.
In total 985 XRF scans were undertaken on the furnishing components taken from the sampled
domestic seating units. A traffic light system has been applied to the XRF data based on the
bromine concentration. The thresholds used in the traffic light assessment are identified in
Table C.1. The XRF data set is provided in Table C.2.
Table C.1 Key for XRF data table
Trace Transition Functional
Br < 1,000 1,000 < Br < 10,000 Br ≥ 10,000
Sb < 1,000 1,000 < Sb < 10,000 Sb ≥ 10,000
Table C.2 Bromine, antimony and chlorine data for all scanned components
Category Code Sub-category
XRF concentration mg kg-1
Br Sb Cl
Sofa CC1-A Cover (leather) 39.2 0.00 0.00
Sofa CC1-B Wadding 10.2 176 0.00
Sofa CC1-C Foam 4,499 0.00 0.00
Sofa CC1-D Lining 2,783 162 0.00
Sofa CC1-E Misc. 149 0.00 0.00
Sofa CC1-F Lining 28.8 55.1 0.00
Sofa CC1-G Lining 38.5 71.6 0.00
Sofa CC2-A Lining 6,709 0.00 0.00
Sofa CC2-B Lining 8,406 44.5 0.00
Sofa CC2-C Foam 633 151 0.00

Environment Agency
Report Reference: UC15080.5/17370-0 27th May 2021
© WRc 2021 72
Category Code Sub-category
XRF concentration mg kg-1
Br Sb Cl
Sofa CC2-D Foam 128 0.00 0.00
Sofa CC2-E Lining 1,124 354 0.00
Sofa CC2-F Lining 30.1 0.00 0.00
Sofa CC2-G Cover (leatherette) 6,602 52.1 0.00
Sofa CC2-H Cover (leatherette) 7,736 65.6 0.00
Sofa CC3-A Lining 27,997 5,055 0.00
Sofa CC3-B Lining 227 120 0.00
Sofa CC3-C Foam 626 82.6 0.00
Sofa CC3-D Lining 15.0 0.00 0.00
Sofa CC3-E Lining 45.9 0.00 0.00
Armchair CC4-A Lining 31.9 75.0 0.00
Armchair CC4-B Cover (textile) 52,882 11,621 0.00
Armchair CC4-C Foam 98.0 0.00 0.00
Armchair CC4-D Foam 1,354 184 0.00
Armchair CC4-E Lining 23.3 0.00 0.00
Armchair CC4-F Wadding 93.9 58.4 0.00
Armchair CC4-G Lining 30.0 0.00 0.00
Sofa CC5-A Cover (leatherette) 31,659 2,790 0.00
Sofa CC5-B Foam 208 0.00 0.00
Sofa CC5-C(A) Wadding 6,141 754 0.00
Sofa CC5-C(B) Wadding 2,138 193 0.00
Sofa CC5-D Lining 6,292 378 0.00
Sofa CC5-E(A) Lining 5,930 326 0.00
Sofa CC5-E(B) Lining 44,634 4,134 0.00
Sofa CC5-F Lining 42.7 69.3 0.00
Sofa CC5-G Misc. 139 36.7 0.00
Dining chair CC6-A Cover (textile) 61,475 22,030 0.00
Dining chair CC6-B Lining 143 103 0.00
Dining chair CC6-C Wadding 50.8 102 0.00
Dining chair CC6-D Foam 89.9 0.00 0.00
Dining chair CC6-E Misc. 15.4 0.00 0.00
Armchair CC7-A Lining 440 115 0.00
Armchair CC7-B Wadding 450 197 0.00
Armchair CC7-C Cover (textile) 61,741 9,288 0.00
Armchair CC7-D Lining 265 55.7 0.00
Armchair CC7-E Cover (textile) 32,332 3,973 0.00
Armchair CC7-F Misc. 900 70.0 0.00
Armchair CC7-G Foam 1,560 118 0.00
Armchair CC8-A Cover (textile) 62,751 31,029 0.00
Armchair CC8-B Lining 3,056 412 0.00
Armchair CC8-C Wadding 547 236 0.00

Environment Agency
Report Reference: UC15080.5/17370-0 27th May 2021
© WRc 2021 73
Category Code Sub-category
XRF concentration mg kg-1
Br Sb Cl
Armchair CC8-D Lining 383 194 0.00
Armchair CC8-E Wadding 542 207 0.00
Armchair CC8-F Lining 1,199 200 0.00
Armchair CC8-G Lining 2,520 582 0.00
Armchair CC8-H Foam 5,316 683 0.00
Armchair CC8-I Lining 115 0.00 0.00
Armchair CC8-J Misc. 104 203 0.00
Armchair CC8-K Misc. 1,040 211 0.00
Armchair CC8-L Lining 149 65.6 0.00
Sofa CC9-A Lining 23.3 0.00 0.00
Sofa CC9-B Wadding 26.0 33.2 0.00
Sofa CC9-C Cover (textile) 40,403 8,478 0.00
Sofa CC9-D Cover (textile) 61,196 7,751 0.00
Sofa CC9-E Foam 17.7 0.00 0.00
Sofa CC9-F Foam 11.6 0.00 0.00
Sofa CC10-A Cover (textile) 11,327 4,011 0.00
Sofa CC10-B Wadding 1,381 363 0.00
Sofa CC10-C Foam 0.00 0.00 0.00
Sofa CC11-A Lining 212 67.1 0.00
Sofa CC11-B Cover (textile) 40,580 3,825 0.00
Sofa CC11-C Wadding 49.2 141 0.00
Sofa CC11-D Foam 3,713 160 0.00
Sofa CC13-A Cover (leather) 44.3 0.00 0.00
Sofa CC13-B Lining 33.4 0.00 0.00
Sofa CC13-C Foam 187 0.00 0.00
Sofa CC13-D Lining 138 76.6 0.00
Sofa CC13-E Misc. 22.7 0.00 0.00
Sofa CC13-F Misc. 21.4 34.0 0.00
Sofa CC13-G Lining 4,154 418 0.00
Sofa CC13-H Foam 3,523 0.00 0.00
Sofa CC13-I Lining 3,254 701 0.00
Sofa CC13-J Wadding 16.0 149 0.00
Sofa CC13-K Misc. 69.9 0.00 0.00
Sofa CC15-A Foam 0.00 0.00 0.00
Sofa CC15-B Wadding 8.07 66.9 0.00
Sofa CC15-C Lining 6,789 2,309 0.00
Sofa CC15-D Cover (textile) 33,923 11,635 0.00
Sofa CC15-E Cover (textile) 146 0.00 0.00
Sofa CC17-A Cover (textile) 66,968 12,947 0.00
Sofa CC17-B Foam 8,481 158 0.00
Sofa CC19-A Wadding 733 85.8 0.00

Environment Agency
Report Reference: UC15080.5/17370-0 27th May 2021
© WRc 2021 74
Category Code Sub-category
XRF concentration mg kg-1
Br Sb Cl
Sofa CC19-B Foam 232 0.00 0.00
Sofa CC19-C Cover (textile) 24,103 2,119 0.00
Sofa CC19-D Cover (textile) 12,485 756 0.00
Sofa CC19-E Lining 178 0.00 0.00
Armchair CC21-A Foam 103 0.00 0.00
Armchair CC21-B Lining 7,187 1,519 0.00
Armchair CC21-C Misc. 84.4 0.00 0.00
Armchair CC21-D Cover (leatherette) 9.66 63.5 0.00
Armchair CC21-E Wadding 57.4 64.7 0.00
Armchair CC21-F Lining 9,648 1,803 0.00
Armchair CC23-A Lining 6,618 493 0.00
Armchair CC23-B Cover (textile) 36,263 1,121 0.00
Armchair CC23-C Cover (textile) 46,327 1,718 0.00
Armchair CC23-D Lining 8,801 361 0.00
Armchair CC23-E Foam 41.1 0.00 0.00
Armchair CC23-F Misc. 46.2 0.00 0.00
Sofa CC25-A Foam 13.4 114 0.00
Sofa CC25-B Cover (textile) 44,989 2,232 0.00
Sofa CC25-C Lining 549 32.0 0.00
Sofa CC27-A Misc. 4,196 1,683 0.00
Sofa CC27-B Cover (textile) 33,109 16,142 0.00
Sofa CC27-C Lining 1,092 41.8 0.00
Sofa CC27-D Foam 11.5 0.00 0.00
Dining chair WF1-A Cover (leatherette) 67.6 1,123 360,000
Dining chair WF1-B Foam 0.00 0.00 0.00
Dining chair WF1-C Lining 10.4 0.00 0.00
Dining chair WF2-A Cover (leatherette) 23,434 77.8 0.00
Dining chair WF2-B Wadding 1,559 116 0.00
Dining chair WF2-C Foam 100 0.00 0.00
Dining chair WF2-D Lining 8,182 1,623 0.00
Dining chair WF3-A Cover (leather) 16.7 0.00 0.00
Dining chair WF3-B Wadding 0.00 151 0.00
Dining chair WF3-C Cover (textile) 8.47 0.00 0.00
Dining chair WF3-D Wadding 0.00 0.00 0.00
Dining chair WF4-A Cover (leather) 29.2 0.00 0.00
Dining chair WF4-B Foam 16.2 0.00 88,268
Dining chair WF4-C Lining 527 70.6 0.00
Dining chair WF5-A Cover (textile) 30,602 26,225 0.00
Dining chair WF5-B Foam 175 86.4 0.00
Office chair WF6-A Cover (textile) 528 35.0 0.00
Office chair WF6-B Foam 17,698 0.00 0.00

Environment Agency
Report Reference: UC15080.5/17370-0 27th May 2021
© WRc 2021 75
Category Code Sub-category
XRF concentration mg kg-1
Br Sb Cl
Office chair WF7-A Cover (leatherette) 6.38 91.3 0.00
Office chair WF7-B Lining 16.5 0.00 0.00
Office chair WF7-C Wadding 12.0 0.00 0.00
Office chair WF7-D Wadding 7.70 104 0.00
Other WF8-A Cover (textile) 6.43 0.00 0.00
Other WF8-B Wadding 14.6 0.00 0.00
Other WF8-C Cover (textile) 16.3 69.7 0.00
Other WF8-D Foam 16.2 0.00 0.00
Other WF8-E Lining 13.8 0.00 0.00
Other WF8-F Wadding 199 121 0.00
Other WF9-A Cover (textile) 35,526 8,252 0.00
Other WF9-B Foam 1,315 115 50,985
Other WF9-C Lining 20.8 0.00 0.00
Other WF10-A(A) Lining 415 0.00 0.00
Other WF10-A(B) Cover (leatherette) 0.00 360 360,000
Other WF10-B Lining 1,452 0.00 0.00
Other WF10-C Wadding 11.0 0.00 0.00
Other WF11-A Cover (textile) 23.6 0.00 0.00
Other WF11-B Cover (textile) 8.51 0.00 0.00
Other WF11-C Foam 13.7 0.00 0.00
Other WF12-A Cover (textile) 0.00 59.5 0.00
Other WF12-B Lining 25.0 65.6 0.00
Other WF12-C Cover (textile) 6.02 0.00 0.00
Armchair WF13-A Cover (textile) 17.8 0.00 0.00
Armchair WF13-B Wadding 0.00 140 0.00
Armchair WF13-C Foam 18.7 0.00 0.00
Armchair WF13-D Lining 26.7 0.00 0.00
Armchair WF13-E Cover (textile) 3.65 0.00 0.00
Armchair WF14-A Cover (textile) 19.7 0.00 0.00
Armchair WF14-B Foam 6.03 0.00 0.00
Armchair WF14-C Lining 13.6 34.8 0.00
Office chair WF15-A Cover (leather) 35.7 0.00 0.00
Office chair WF15-B Foam 35.1 0.00 0.00
Office chair WF15-C Lining 20.6 0.00 0.00
Sofa WF16-A Cover (leatherette) 68,766 16,562 0.00
Sofa WF16-B Cover (textile) 69,901 15,727 0.00
Sofa WF16-C Foam 5,681 586 0.00
Sofa WF16-D Lining 291 53.8 0.00
Sofa WF16-E Cover (leatherette) 38,643 5,190 0.00
Sofa WF16-F Wadding 842 228 0.00
Sofa WF16-G Foam 116 0.00 0.00

Environment Agency
Report Reference: UC15080.5/17370-0 27th May 2021
© WRc 2021 76
Category Code Sub-category
XRF concentration mg kg-1
Br Sb Cl
Sofa WF16-H Lining 29.3 58.8 0.00
Office chair WF17-A Cover (leatherette) 27.1 2,910 360,000
Office chair WF17-B Wadding 8.93 111 0.00
Office chair WF17-C Foam 47.0 0.00 0.00
Office chair WF17-D Lining 2,792 451 0.00
Office chair WF17-E Lining 235 76.3 0.00
Office chair WF17-F Foam 226 0.00 0.00
Office chair WF17-G Lining 2,220 834 0.00
Armchair WF18-A(A) Cover (leather) 111 0.00 0.00
Armchair WF18-A(B) Cover (leather) 15.4 0.00 0.00
Armchair WF18-B Lining 115 60.2 0.00
Armchair WF18-D Foam 2,616 0.00 0.00
Armchair WF18-E Lining 1,957 122 0.00
Sofa WF19-A Cover (leather) 0.00 39.9 0.00
Sofa WF19-B Foam 6.19 0.00 0.00
Sofa WF19-C Lining 141 45.5 0.00
Sofa WF20-A Cover (leather) 53.5 0.00 0.00
Sofa WF21-A Cover (leatherette) 0.00 250 360,000
Sofa WF21-B Foam 0.00 0.00 0.00
Sofa WF21-C Foam 62.3 0.00 0.00
Sofa WF21-D Lining 2,332 367 0.00
Sofa WF22-A Cover (leather) 28.2 0.00 0.00
Sofa WF22-B Foam 10.7 167 0.00
Sofa WF22-C Foam 0.00 0.00 0.00
Sofa WF22-D Cover (leather) 12.7 0.00 0.00
Sofa WF22-E Foam 9.17 0.00 0.00
Armchair WF23-A Cover (textile) 11.1 0.00 0.00
Armchair WF23-B Wadding 14.3 0.00 0.00
Armchair WF24-A Cover (textile) 89,449 13,166 0.00
Armchair WF24-B Foam 32.7 0.00 0.00
Armchair WF24-C Lining 54.0 0.00 0.00
Sofa WF25-A Cover (textile) 20.7 0.00 0.00
Sofa WF25-B Foam 12.8 0.00 0.00
Sofa WF25-C Lining 15.1 92.5 0.00
Armchair WF26-A Cover (leatherette) 20.2 2,709 360,000
Armchair WF26-B Wadding 16.3 74.4 0.00
Armchair WF26-C Foam 7.30 0.00 0.00
Armchair WF26-D Lining 8.78 0.00 0.00
Armchair WF26-E Lining 26.2 0.00 0.00
Sofa WF27-A Cover (textile) 63.9 118 0.00
Sofa WF27-B Wadding 365 200 0.00

Environment Agency
Report Reference: UC15080.5/17370-0 27th May 2021
© WRc 2021 77
Category Code Sub-category
XRF concentration mg kg-1
Br Sb Cl
Sofa WF27-C Foam 0.00 0.00 0.00
Sofa WF27-D Lining 68.0 35.8 0.00
Sofa WF27-E Lining 50.6 64.8 0.00
Sofa WF28-A Cover (leatherette) 8.94 10,983 360,000
Armchair KM1-A Lining 1,035 101 0.00
Armchair KM1-B Wadding 0.00 85.4 0.00
Armchair KM1-C Wadding 68.0 96.2 0.00
Armchair KM1-D Lining 197 0.00 0.00
Armchair KM1-E Lining 142 0.00 0.00
Armchair KM1-F Cover (textile) 12,345 2,719 0.00
Armchair KM2-A Cover (leatherette) 0.00 6,581 360,000
Armchair KM2-B Lining 15.2 0.00 0.00
Armchair KM2-C Foam 0.00 0.00 0.00
Armchair KM2-D Lining 0.00 0.00 0.00
Armchair KM2-E Lining 11.1 0.00 0.00
Armchair KM2-F Misc. 0.00 0.00 0.00
Sofa KM3-A Wadding 0.00 118 0.00
Sofa KM3-B Lining 0.00 0.00 0.00
Sofa KM3-C Foam 0.00 0.00 0.00
Sofa KM3-D Cover (leather) 41.1 0.00 0.00
Sofa KM3-E Foam 0.00 0.00 0.00
Sofa KM4-A Lining 4,817 1,634 0.00
Sofa KM4-B Wadding 149 126 0.00
Sofa KM4-C Cover (leatherette) 230 2,499 360,000
Sofa KM4-D Lining 4,534 808 0.00
Sofa KM4-E Foam 1,193 0.00 0.00
Sofa KM4-F Lining 9.84 90.0 0.00
Sofa KM4-G Foam 0.00 0.00 0.00
Sofa KM4-H Foam 149 0.00 0.00
Sofa KM5-A Cover (leather) 0.00 0.00 0.00
Sofa KM5-B Cover (leatherette) 415 94.7 0.00
Sofa KM5-C Cover (leather) 11.3 0.00 0.00
Sofa KM5-D Wadding 7.22 158 0.00
Sofa KM5-E Lining 17.0 56.1 0.00
Sofa KM5-F Lining 3,870 1,263 0.00
Sofa KM5-G Foam 8.36 0.00 0.00
Sofa KM5-H Foam 6.57 43.4 0.00
Sofa KM6-A Cover (leather) 12.4 0.00 0.00
Sofa KM6-B Wadding 0.00 103 0.00
Sofa KM6-C Lining 11.3 0.00 0.00
Sofa KM6-D Foam 9.42 0.00 0.00

Environment Agency
Report Reference: UC15080.5/17370-0 27th May 2021
© WRc 2021 78
Category Code Sub-category
XRF concentration mg kg-1
Br Sb Cl
Sofa KM7-A Cover (leather) 18.7 0.00 0.00
Sofa KM7-B Wadding 0.00 144 0.00
Sofa KM7-C Cover (leather) 8.36 0.00 0.00
Sofa KM7-D Lining 0.00 0.00 0.00
Sofa KM7-E Wadding 0.00 113 0.00
Sofa KM7-F Foam 0.00 0.00 0.00
Sofa KM7-G Foam 5.65 0.00 0.00
Dining chair KM8-A Lining 9.01 0.00 0.00
Dining chair KM8-B Lining 6.57 0.00 0.00
Dining chair KM8-C Wadding 0.00 172 0.00
Dining chair KM8-D Cover (textile) 0.00 0.00 0.00
Armchair KM9-A Cover (leather) 22.6 0.00 0.00
Armchair KM9-B Wadding 0.00 133 0.00
Armchair KM9-C Lining 0.00 0.00 0.00
Sofa KM10-A Cover (leatherette) 14,162 3,252 0.00
Sofa KM10-B Foam 52.5 0.00 0.00
Sofa KM10-C Lining 19.4 85.1 0.00
Other KM11-A Foam 39.0 0.00 0.00
Other KM11-B Lining 1,033 96.9 0.00
Other KM11-C Lining 136 33.0 0.00
Other KM11-D Cover (textile) 96,767 8,608 0.00
Armchair KM12-A Cover (leather) 7.20 0.00 0.00
Armchair KM12-B Cover (leather) 42.1 0.00 0.00
Armchair KM12-C Foam 13.3 0.00 0.00
Armchair KM12-D Foam 6.58 0.00 0.00
Armchair KM12-E Lining 4,505 2,141 0.00
Armchair KM12-F Wadding 22.9 139 0.00
Sofa KM13-A Cover (textile) 13,482 1,955 0.00
Sofa KM13-B Lining 9.99 50.2 0.00
Sofa KM13-C Wadding 0.00 152 0.00
Sofa KM14-A Cover (textile) 78,799 7,135 0.00
Sofa KM14-B Wadding 54.9 141 0.00
Armchair KM15-A Cover (leather) 34.0 0.00 0.00
Armchair KM15-B Lining 14.3 0.00 0.00
Armchair KM15-C Foam 32.9 0.00 0.00
Armchair KM15-D Lining 9.67 122 0.00
Sofa KM16-A Cover (textile) 96,401 10,656 0.00
Sofa KM16-B Foam 0.00 0.00 0.00
Sofa KM16-C Wadding 855 248 0.00
Sofa KM16-D Foam 0.00 0.00 0.00
Sofa KM17-A Cover (textile) 63,138 32,067 0.00

Environment Agency
Report Reference: UC15080.5/17370-0 27th May 2021
© WRc 2021 79
Category Code Sub-category
XRF concentration mg kg-1
Br Sb Cl
Sofa KM17-B Foam 4,749 0.00 0.00
Armchair KM18-A Cover (textile) 2.27 0.00 0.00
Armchair KM18-B Wadding 0.00 173 0.00
Armchair KM18-C Foam 12.5 0.00 0.00
Armchair KM18-D Lining 2,430 0.00 0.00
Sofa KM19-A Cover (textile) 0.00 95.4 0.00
Sofa KM19-B Wadding 0.00 155 0.00
Sofa KM19-C Wadding 0.00 149 0.00
Sofa KM19-D Foam 6.91 0.00 0.00
Sofa KM20-A Cover (textile) 186 0.00 0.00
Sofa KM20-B Lining 96.0 100 0.00
Sofa KM20-C Foam 14,675 0.00 0.00
Sofa KM21-A Cover (textile) 10.5 47.1 0.00
Sofa KM21-B Lining 0.00 47.6 0.00
Sofa KM21-C Wadding 0.00 169 0.00
Armchair KM22-A Cover (leatherette) 114,663 11,043 0.00
Armchair KM22-B Cover (textile) 66,593 6,134 0.00
Armchair KM22-C Foam 0.00 0.00 360,000
Armchair KM22-D Wadding 280 152 0.00
Armchair KM22-E Lining 38.3 39.7 0.00
Sofa KM23-A Cover (textile) 71,214 9,092 0.00
Sofa KM23-B Foam 0.00 0.00 0.00
Sofa KM23-C Lining 19.7 121 0.00
Sofa KM23-D Lining 4.10 0.00 0.00
Sofa KM23-E Lining 0.00 145 0.00
Sofa KM23-F Lining 28.4 0.00 0.00
Sofa KM23-G Wadding 0.00 74.3 0.00
Sofa KM24-A Cover (leatherette) 18.2 1,830 360,000
Sofa KM24-B Foam 24.3 0.00 0.00
Sofa KM24-C Wadding 1,965 129 0.00
Sofa KM25-A Lining 0.00 0.00 0.00
Sofa KM25-B Lining 21.9 0.00 0.00
Sofa KM25-C Lining 391 76.0 0.00
Sofa KM25-D Foam 593 57.1 0.00
Sofa KM25-E Cover (textile) 82,039 33,282 0.00
Armchair KM26-A Cover (leatherette) 159 68.1 0.00
Armchair KM26-B Lining 17.4 117 0.00
Armchair KM26-C Lining 10.6 0.00 0.00
Armchair KM26-D Foam 16,664 0.00 0.00
Armchair KM27-A Cover (textile) 79,769 32,807 0.00
Armchair KM27-B Lining 106 144 0.00

Environment Agency
Report Reference: UC15080.5/17370-0 27th May 2021
© WRc 2021 80
Category Code Sub-category
XRF concentration mg kg-1
Br Sb Cl
Armchair KM27-C Wadding 60.7 176 0.00
Armchair KM27-D Foam 1,765 226 0.00
Armchair KM27-E Foam 97.8 0.00 0.00
Armchair KM28-A Cover (textile) 22.2 0.00 0.00
Armchair KM28-B Wadding 0.00 176 0.00
Armchair KM28-C Lining 4.76 0.00 0.00
Armchair KM28-D Wadding 133 66.5 0.00
Armchair KM28-E Wadding 6.87 0.00 0.00
Armchair KM29-A Foam 12.1 0.00 0.00
Armchair KM29-B Wadding 0.00 184 0.00
Armchair KM29-C Cover (leather) 55.0 0.00 0.00
Armchair KM29-D Lining 199 154 0.00
Armchair KM29-E Lining 45.7 0.00 0.00
Armchair KM29-F Foam 0.00 0.00 0.00
Armchair KM29-G Foam 0.00 0.00 0.00
Dining chair KM30-A Cover (textile) 686 147 0.00
Dining chair KM30-B Cover (textile) 2,527 98.7 0.00
Dining chair KM30-C Foam 11.6 0.00 0.00
Dining chair KM30-D Foam 17.5 0.00 0.00
Office chair KM31-A Cover (textile) 9.83 0.00 0.00
Office chair KM31-B Foam 15.1 0.00 0.00
Office chair KM31-C Foam 48.3 0.00 0.00
Office chair KM32-A Cover (textile) 38.7 0.00 0.00
Office chair KM32-B Foam 17.2 0.00 0.00
Office chair KM33-A Cover (textile) 132 92.3 0.00
Office chair KM33-B Foam 26.1 0.00 0.00
Office chair KM33-C Foam 10.8 0.00 0.00
Sofa KM34-A Cover (textile) 77,056 29,489 0.00
Sofa KM34-B Foam 409 68.4 0.00
Sofa KM35-A Cover (textile) 469 104 0.00
Sofa KM35-B Foam 0.00 0.00 0.00
Sofa KM35-C Lining 14.3 0.00 0.00
Sofa KM35-D Wadding 40.8 165 0.00
Sofa KM35-E Wadding 22.4 130 0.00
Dining chair KM36-A Cover (leatherette) 7.52 44.7 360,000
Dining chair KM36-B Foam 13.0 0.00 0.00
Dining chair KM36-C Lining 0.00 0.00 0.00
Sofa KM37-A Cover (leather) 18.8 0.00 0.00
Sofa KM37-B Foam 12,047 0.00 0.00
Other KM38-A Cover (textile) 672 100 0.00
Other KM38-B Cover (textile) 48,346 6,473 0.00

Environment Agency
Report Reference: UC15080.5/17370-0 27th May 2021
© WRc 2021 81
Category Code Sub-category
XRF concentration mg kg-1
Br Sb Cl
Other KM38-C Foam 2,050 163 0.00
Other KM38-D Lining 10.4 0.00 0.00
Dining chair KM39-A Cover (leatherette) 0.00 956 360,000
Dining chair KM39-B Foam 7.80 0.00 0.00
Dining chair KM39-C Lining 161 60.3 0.00
Dining chair KM39-D Lining 327 62.3 0.00
Sofa KM40-A Cover (textile) 25,037 2,136 0.00
Sofa KM40-B Lining 789 55.3 0.00
Sofa KM40-C Foam 16,102 1,325 0.00
Sofa KM40-D Wadding 190 173 0.00
Sofa KM41-A Lining 0.00 0.00 0.00
Sofa KM41-B Foam 4.23 0.00 0.00
Sofa KM41-C Cover (leather) 51.4 0.00 0.00
Dining chair KM42-A Cover (leatherette) 0.00 1,841 360,000
Dining chair KM42-B Cover (leatherette) 42.8 2,953 360,000
Dining chair KM42-C Cover (leatherette) 39.0 2,239 360,000
Dining chair KM42-D Foam 0.00 0.00 0.00
Dining chair KM42-E Foam 0.00 0.00 0.00
Office chair KM43-A Foam 25.1 0.00 0.00
Office chair KM43-B Cover (textile) 13.2 0.00 0.00
Sofa KM44-A Cover (textile) 0.00 0.00 0.00
Sofa KM44-B Foam 5.14 0.00 0.00
Armchair KM45-A Cover (textile) 80,179 22,426 0.00
Armchair KM45-B Lining 139 494 0.00
Armchair KM45-C Foam 1,933 81.1 360,000
Armchair KM45-D Wadding 88.9 210 0.00
Office chair KM46-A Cover (textile) 678 140 0.00
Office chair KM46-B Foam 91.5 0.00 0.00
Armchair KM47-A Foam 22.0 0.00 0.00
Armchair KM47-B Cover (leather) 0.00 0.00 0.00
Armchair KM47-C Lining 7.42 0.00 0.00
Sofa LC1-A Cover (textile) 23,222 102 0.00
Sofa LC1-B Foam 1,069 0.00 0.00
Sofa LC1-C Lining 617 0.00 0.00
Sofa LC2-A Cover (textile) 402 0.00 0.00
Sofa LC2-B Lining 5.99 0.00 0.00
Sofa LC2-C Foam 0.00 0.00 0.00
Sofa LC3-A Cover (textile) 40,054 5,856 0.00
Sofa LC3-B Foam 238 0.00 0.00
Sofa LC3-C Cover (textile) 37,808 5,233 0.00
Sofa LC3-D Lining 191 100 0.00

Environment Agency
Report Reference: UC15080.5/17370-0 27th May 2021
© WRc 2021 82
Category Code Sub-category
XRF concentration mg kg-1
Br Sb Cl
Sofa LC3-E Lining 85.4 33.7 0.00
Sofa LC4-A Lining 6.70 169 0.00
Sofa LC4-B Cover (leather) 12.8 0.00 0.00
Sofa LC4-C Foam 0.00 0.00 0.00
Dining chair LC5-A Cover (leatherette) 23.3 11,809 0.00
Dining chair LC5-B Wadding 45.3 172 0.00
Dining chair LC5-C Foam 386 0.00 0.00
Sofa LC6-A Cover (textile) 84,617 34,769 0.00
Sofa LC6-B Lining 2,088 392 0.00
Sofa LC6-C Wadding 493 279 0.00
Office chair LC7-A Cover (leatherette) 1,614 7,971 217,318
Office chair LC7-B Cover (leatherette) 1,028 21.3 360,000
Office chair LC7-C Foam 8.15 0.00 0.00
Office chair LC7-D Lining 9,297 0.00 0.00
Sofa LC8-A Foam 19.6 0.00 0.00
Sofa LC8-B Cover (leather) 22.5 0.00 0.00
Sofa LC8-C Lining 677 142 0.00
Sofa LC8-D Wadding 10.1 198 0.00
Sofa LC8-E Misc. 8.95 0.00 0.00
Office chair LC9-A Cover (leatherette) 38.8 6,039 360,000
Office chair LC9-B Foam 41.1 0.00 0.00
Office chair LC10-A Lining 4,890 244 0.00
Office chair LC10-B Lining 558 86.5 0.00
Office chair LC10-C Foam 22.4 0.00 0.00
Sofa LC12-A Cover (leather) 20.9 0.00 0.00
Sofa LC12-B Wadding 6.22 194 0.00
Sofa LC12-C Foam 5.40 0.00 360,000
Sofa LC13-A Cover (textile) 15,876 8,615 0.00
Sofa LC13-B Lining 1,426 322 0.00
Sofa LC13-C Wadding 18.1 107 0.00
Sofa LC14-A Cover (leather) 48.6 0.00 0.00
Sofa LC14-B Lining 7.94 103 0.00
Sofa LC14-C Foam 0.00 0.00 0.00
Sofa LC14-D Wadding 44.6 112 0.00
Sofa LC15-A Cover (textile) 86,968 7,583 0.00
Sofa LC15-B Cover (textile) 105,372 8,695 0.00
Sofa LC15-C Lining 45.6 0.00 0.00
Sofa LC15-D Wadding 27.4 148 0.00
Sofa LC15-E Foam 11.5 0.00 0.00
Sofa LC16-A Cover (leatherette) 9.74 3,206 360,000
Sofa LC16-B Foam 0.00 0.00 0.00

Environment Agency
Report Reference: UC15080.5/17370-0 27th May 2021
© WRc 2021 83
Category Code Sub-category
XRF concentration mg kg-1
Br Sb Cl
Sofa LC16-C Lining 9.28 0.00 0.00
Sofa LC16-D Foam 429 0.00 0.00
Sofa LC16-E Foam 5.54 0.00 0.00
Sofa LC16-F Wadding 11.2 129 0.00
Sofa LC17-A Lining 1,337 98.6 0.00
Sofa LC17-B Cover (textile) 61,787 11,834 0.00
Sofa LC17-C Foam 3,338 60.8 0.00
Sofa LC17-D Foam 3,124 0.00 0.00
Sofa LC17-E Wadding 135 205 0.00
Sofa LC17-F Cover (textile) 703 283 0.00
Sofa LC17-G Lining 106 0.00 0.00
Sofa LC18-A Cover (textile) 27,089 35,988 0.00
Sofa LC18-B Cover (textile) 32,165 39,755 0.00
Sofa LC18-C Wadding 7.45 0.00 0.00
Sofa LC18-D Foam 64.6 0.00 0.00
Sofa LC18-E Wadding 259 220 0.00
Sofa LC19-A Cover (textile) 257 20,990 0.00
Sofa LC19-B Foam 12.9 0.00 0.00
Other LC20-A Cover (leatherette) 38.0 2,301 0.00
Other LC20-B Wadding 0.00 88.1 0.00
Other LC20-C Foam 0.00 0.00 0.00
Sofa LC21-A Cover (leatherette) 0.00 4,014 360,000
Sofa LC21-B Lining 8.35 0.00 0.00
Sofa LC21-C Lining 4.20 73.8 0.00
Sofa LC21-D Foam 8.75 0.00 0.00
Sofa LC22-A Cover (textile) 81,067 34,673 0.00
Sofa LC22-B Lining 310 145 0.00
Sofa LC22-C Lining 26.9 0.00 0.00
Sofa LC22-D Foam 16,733 529 0.00
Sofa LC22-E Wadding 8.35 175 0.00
Sofa LC24-A Cover (leatherette) 18.0 116 360,000
Sofa LC24-B Foam 7.56 0.00 0.00
Sofa LC25-A Cover (leatherette) 18.3 2,680 360,000
Sofa LC25-B Cover (leatherette) 11.2 1,561 360,000
Sofa LC25-C Foam 0.00 0.00 0.00
Sofa LC26-A Cover (textile) 703 130 0.00
Sofa LC26-B Foam 34.4 0.00 0.00
Sofa LC26-C Foam 19,680 0.00 0.00
Sofa LC26-D Lining 22.1 105 0.00
Armchair LC28-A Cover (leather) 26.8 0.00 0.00
Armchair LC28-B Cover (leatherette) 11.4 3,790 360,000

Environment Agency
Report Reference: UC15080.5/17370-0 27th May 2021
© WRc 2021 84
Category Code Sub-category
XRF concentration mg kg-1
Br Sb Cl
Armchair LC28-C Foam 2,743 297 0.00
Armchair LC28-D Lining 575 0.00 0.00
Armchair LC28-E Foam 37.7 0.00 0.00
Armchair LC28-F Wadding 14.5 163 0.00
Armchair LC28-G Wadding 11.3 98.5 0.00
Armchair LC28-H Wadding 8.01 94.1 0.00
Sofa LC29-A Cover (leatherette) 40,309 12,422 0.00
Sofa LC29-B Foam 42.3 0.00 0.00
Sofa LC29-C Wadding 2,553 335 0.00
Dining chair LC30-A Cover (leatherette) 25.0 6,253 360,000
Dining chair LC30-B Wadding 0.00 174 0.00
Dining chair LC30-C Foam 0.00 0.00 0.00
Dining chair LC30-D Foam 18.0 0.00 0.00
Armchair LC31-A Cover (textile) 25.6 20,587 0.00
Armchair LC31-B Foam 40.9 0.00 0.00
Armchair LC31-C Foam 23.1 0.00 0.00
Armchair LC31-D Foam 6,622 0.00 0.00
Office chair LC32-A Cover (leatherette) 0.00 8,884 0.00
Office chair LC32-B Cover (textile) 0.00 5,232 0.00
Office chair LC32-C Wadding 0.00 143 0.00
Office chair LC32-D Foam 255 0.00 0.00
Office chair LC32-E Lining 2,879 1,083 0.00
Armchair LC33-A Cover (textile) 4.73 46.6 0.00
Armchair LC33-B Foam 3,365 190 0.00
Armchair LC33-C Lining 35.0 122 0.00
Armchair LC33-D Wadding 0.00 131 0.00
Armchair LC33-E Foam 24.6 0.00 0.00
Armchair LC33-F Foam 13.3 0.00 0.00
Armchair LC33-G Cover (textile) 94,966 11,753 0.00
Armchair LC33-H Lining 27.2 0.00 0.00
Armchair LC35-A Cover (leatherette) 0.00 440 0.00
Armchair LC35-B Lining 10.6 0.00 0.00
Armchair LC35-C Foam 4,666 0.00 0.00
Armchair LC35-D Lining 2,454 700 0.00
Armchair LC36-A Cover (leather) 25.2 0.00 0.00
Armchair LC36-B Foam 4.95 158 0.00
Armchair LC36-C Lining 7.68 0.00 0.00
Armchair LC36-D Foam 12.6 0.00 0.00
Sofa LC37-A Cover (leather) 333 0.00 0.00
Sofa LC37-B Wadding 162 98.7 0.00
Sofa LC37-C Foam 31.5 0.00 0.00

Environment Agency
Report Reference: UC15080.5/17370-0 27th May 2021
© WRc 2021 85
Category Code Sub-category
XRF concentration mg kg-1
Br Sb Cl
Sofa LC37-D Lining 3,420 342 0.00
Sofa LC38-A Cover (leather) 2,598 0.00 0.00
Sofa LC38-B Foam 14.9 187 0.00
Sofa LC38-C Foam 13,621 0.00 0.00
Sofa LC38-D Foam 12,988 0.00 0.00
Sofa LC38-E Lining 9.93 0.00 0.00
Sofa LC39-A Cover (textile) 55,745 23,724 0.00
Sofa LC39-B Foam 290 66.9 0.00
Sofa LC40-A Cover (leatherette) 46.8 1,473 360,000
Sofa LC40-B Cover (leatherette) 140 9,058 0.00
Sofa LC40-C Wadding 12.9 197 0.00
Sofa LC40-D Wadding 0.00 108 0.00
Armchair LC41-A Cover (leather) 131 0.00 0.00
Armchair LC41-B Lining 12.8 54.2 0.00
Armchair LC41-C Wadding 15.8 99.8 0.00
Armchair LC41-D Lining 244 148 0.00
Armchair LC41-E Foam 14.5 0.00 0.00
Armchair LC42-A Cover (textile) 37,316 10,286 0.00
Armchair LC42-B Foam 306 138 0.00
Armchair LC42-C Lining 76.0 108 0.00
Sofa LC43-A Cover (leather) 298 0.00 0.00
Sofa LC43-B Lining 1,472 260 0.00
Sofa LC43-C Foam 28.5 0.00 0.00
Sofa LC43-D Wadding 72.8 98.7 0.00
Armchair LC44-A Cover (leatherette) 13.2 2,740 360,000
Armchair LC44-B Lining 8.36 65.0 0.00
Armchair LC44-C Foam 17.7 169 0.00
Armchair LC44-D Foam 13,499 0.00 0.00
Armchair LC44-E Foam 11.8 0.00 0.00
Armchair LC45-A Cover (leatherette) 30.2 0.00 0.00
Armchair LC45-B Foam 16.2 0.00 0.00
Armchair LC45-C Lining 289 74.8 0.00
Sofa LC46-A Cover (textile) 79,768 18,945 0.00
Sofa LC46-B Lining 85.9 63.5 0.00
Sofa LC46-C Foam 28.6 0.00 64,999
Sofa LC46-D Foam 829 101 0.00
Sofa LC47-A Cover (textile) 29,261 5,253 0.00
Sofa LC47-B Foam 93.6 0.00 0.00
Dining chair LC48-A Cover (leatherette) 0.00 2,392 0.00
Dining chair LC48-B Foam 701 0.00 0.00
Other LC49-A Cover (textile) 57,527 5,817 0.00

Environment Agency
Report Reference: UC15080.5/17370-0 27th May 2021
© WRc 2021 86
Category Code Sub-category
XRF concentration mg kg-1
Br Sb Cl
Other LC49-B Cover (textile) 100 73.4 0.00
Other LC49-C Lining 80.7 66.7 0.00
Other LC49-D Lining 10.7 102 0.00
Other LC49-E Foam 33.3 0.00 0.00
Sofa LC50-A Cover (leather) 60.7 0.00 0.00
Sofa LC50-B Wadding 0.00 115 0.00
Sofa LC50-C Foam 23.4 0.00 0.00
Armchair LC51-A Cover (leatherette) 24.3 0.00 0.00
Armchair LC51-B Wadding 161 123 0.00
Armchair LC51-C Lining 1,690 514 0.00
Armchair LC51-D Wadding 0.00 148 0.00
Sofa LC52-A Cover (leather) 129 0.00 0.00
Sofa LC52-B Lining 4,598 772 0.00
Sofa LC52-C Lining 862 1,400 0.00
Sofa LC52-D Wadding 24.3 141 0.00
Sofa LC53-A Cover (textile) 31,459 6,410 0.00
Sofa LC53-B Cover (textile) 67,288 5,174 0.00
Sofa LC53-C Foam 760 0.00 0.00
Sofa LC53-D Cover (textile) 34,858 9,766 0.00
Armchair LC54-A Cover (textile) 70,694 6,545 0.00
Armchair LC54-B Wadding 0.00 139 0.00
Armchair LC55-A Cover (leatherette) 12.9 0.00 0.00
Armchair LC55-B Foam 6.90 0.00 0.00
Armchair LC55-C Foam 6.53 0.00 0.00
Dining chair LC56-A Cover (textile) 10.6 0.00 0.00
Dining chair LC56-B Wadding 0.00 0.00 0.00
Sofa HH1-A Cover (textile) 42.1 0.00 0.00
Sofa HH1-B Foam 10,180 0.00 0.00
Sofa HH1-C Lining 8.08 107 0.00
Sofa HH2-A Cover (leatherette) 75,072 23,254 0.00
Sofa HH2-B Wadding 3,411 222 0.00
Sofa HH2-C Foam 115 58.3 0.00
Armchair HH3-A Cover (textile) 3.01 0.00 0.00
Armchair HH3-B Lining 7.92 63.3 0.00
Armchair HH3-C Wadding 8.58 104 0.00
Armchair HH3-D Foam 0.00 0.00 0.00
Armchair HH4-A Cover (leather) 55.6 0.00 0.00
Armchair HH4-B Wadding 58.8 129 0.00
Armchair HH4-C Foam 4,609 0.00 0.00
Sofa HH5-A Cover (leather) 50.8 0.00 0.00
Sofa HH5-B Foam 14.7 0.00 0.00

Environment Agency
Report Reference: UC15080.5/17370-0 27th May 2021
© WRc 2021 87
Category Code Sub-category
XRF concentration mg kg-1
Br Sb Cl
Sofa HH6-A Cover (leatherette) 29,505 9,889 0.00
Sofa HH6-B Wadding 620 133 0.00
Sofa HH6-C Foam 105 0.00 0.00
Sofa HH6-D Foam 12.9 0.00 0.00
Sofa HH6-E Lining 5,332 1,635 0.00
Sofa HH7-A Cover (textile) 7,483 1,510 0.00
Sofa HH7-B Foam 7.24 0.00 0.00
Sofa HH8-A Cover (textile) 151 116 0.00
Sofa HH8-B Wadding 8.01 113 0.00
Other HH9-A Cover (textile) 19,397 8,956 0.00
Other HH9-B Foam 21.3 0.00 0.00
Armchair HH10-A Cover (textile) 34,774 13,429 0.00
Armchair HH10-B Foam 1,887 113 0.00
Sofa HH11-A Cover (textile) 51,520 8,811 0.00
Sofa HH11-B Lining 2,405 90.6 0.00
Sofa HH11-C Wadding 243 153 0.00
Dining chair HH12-A Cover (textile) 8.23 0.00 0.00
Dining chair HH12-B Wadding 13.1 0.00 0.00
Dining chair HH12-C Wadding 11.2 0.00 0.00
Armchair HH13-A Cover (leather) 21.8 0.00 0.00
Armchair HH13-B Wadding 0.00 134 0.00
Armchair HH13-C Lining 14.7 122 0.00
Armchair HH13-D Foam 10.6 0.00 360,000
Sofa HH14-A Cover (textile) 31,354 14,324 0.00
Sofa HH14-B Foam 114 0.00 0.00
Sofa HH14-C Wadding 764 195 0.00
Sofa HH15-A Cover (textile) 50,082 6,366 0.00
Sofa HH15-B Lining 3,986 159 0.00
Sofa HH15-C Wadding 383 179 0.00
Sofa HH15-D Lining 64.1 0.00 0.00
Sofa HH16-A Cover (leatherette) 5.82 49.9 0.00
Sofa HH16-B Foam 0.00 0.00 360,000
Sofa HH17-A Cover (textile) 20.0 65.4 0.00
Sofa HH17-B Wadding 6.64 146 0.00
Sofa HH17-C Lining 14.9 0.00 0.00
Sofa HH18-A Cover (leather) 102 0.00 0.00
Sofa HH18-B Lining 1,881 1,284 0.00
Sofa HH18-C Wadding 43.8 0.00 0.00
Sofa HH18-D Foam 37.7 0.00 0.00
Sofa HH18-E Lining 11,045 2,514 0.00
Sofa HH19-A Cover (textile) 69,773 11,024 0.00

Environment Agency
Report Reference: UC15080.5/17370-0 27th May 2021
© WRc 2021 88
Category Code Sub-category
XRF concentration mg kg-1
Br Sb Cl
Sofa HH19-B Lining 3,108 198 0.00
Sofa HH19-C Wadding 338 226 0.00
Sofa HH19-D Lining 167 0.00 0.00
Sofa HH20-A Cover (leather) 11.3 0.00 0.00
Sofa HH20-B Foam 228 0.00 0.00
Sofa HH20-C Lining 23.9 0.00 0.00
Sofa HH20-D Lining 20.7 0.00 0.00
Sofa HH21-A Cover (leather) 9.97 0.00 0.00
Sofa HH21-B Foam 23.0 0.00 0.00
Sofa HH21-C Lining 13.9 0.00 0.00
Sofa HH22-A Cover (leatherette) 35,710 4,033 0.00
Sofa HH22-B Foam 161 0.00 0.00
Sofa HH23-A Cover (leatherette) 0.00 2,084 360,000
Sofa HH23-B Foam 8.66 0.00 0.00
Sofa HH23-C Lining 7.92 0.00 0.00
Sofa HH24-A Cover (leather) 28.0 0.00 0.00
Sofa HH24-B Wadding 34.1 145 0.00
Sofa HH24-C Foam 39.1 0.00 0.00
Armchair HH25-A Cover (textile) 20,984 2,267 0.00
Armchair HH25-B Foam 202 0.00 0.00
Sofa HH26-A Cover (textile) 57,113 8,492 0.00
Sofa HH26-B Foam 2,951 216 0.00
Sofa HH27-A Cover (leather) 56.3 0.00 0.00
Sofa HH27-B Foam 13.1 0.00 360,000
Armchair HH28-A Cover (leatherette) 0.00 0.00 360,000
Armchair HH28-B Lining 16.8 80.9 0.00
Armchair HH28-C Wadding 12.1 0.00 0.00
Armchair HH28-D Misc. 9.70 0.00 0.00
Sofa HH29-A Cover (textile) 22.0 0.00 0.00
Sofa HH29-B Wadding 17.7 146 0.00
Sofa HH29-C Foam 18.9 0.00 0.00
Sofa HH30-A Cover (leatherette) 26.1 2,353 360,000
Sofa HH30-B Foam 38.5 0.00 0.00
Sofa HH30-C Misc. 32.0 140 0.00
Sofa HH30-D Wadding 0.00 172 0.00
Sofa HH31-A Cover (textile) 0.00 0.00 0.00
Sofa HH31-B Lining 0.00 0.00 0.00
Sofa HH31-C Foam 0.00 0.00 0.00
Sofa HH31-D Wadding 0.00 127 0.00
Armchair HH32-A Cover (leather) 92.8 0.00 0.00
Armchair HH32-B Wadding 337 105 0.00

Environment Agency
Report Reference: UC15080.5/17370-0 27th May 2021
© WRc 2021 89
Category Code Sub-category
XRF concentration mg kg-1
Br Sb Cl
Armchair HH32-C Foam 20,580 0.00 0.00
Armchair HH32-D Foam 200 0.00 0.00
Armchair HH33-A Cover (textile) 9.89 0.00 0.00
Armchair HH33-B Foam 255 46,663 360,000
Armchair HH33-C Lining 11.3 0.00 0.00
Armchair HH33-D Foam 0.00 0.00 0.00
Armchair HH34-A Cover (textile) 45.5 0.00 0.00
Armchair HH34-B Lining 121 70.9 0.00
Armchair HH34-C Foam 20,740 0.00 0.00
Sofa HH35-A Cover (textile) 0.00 0.00 0.00
Sofa HH35-B Lining 0.00 0.00 0.00
Sofa HH35-C Foam 14.6 0.00 0.00
Sofa HH35-D Wadding 0.00 139 0.00
Armchair HH36-A Cover (leather) 34.3 0.00 0.00
Armchair HH36-B Lining 4.66 54.1 0.00
Armchair HH36-C Lining 0.00 0.00 0.00
Armchair HH36-D Wadding 0.00 116 0.00
Armchair HH36-E Foam 16.3 0.00 0.00
Armchair HH36-F Foam 12.2 0.00 0.00
Sofa HH37-A Cover (leatherette) 298 2,889 360,000
Sofa HH37-B Foam 6.21 0.00 0.00
Sofa HH38-A Cover (leather) 22.9 0.00 0.00
Sofa HH38-B Lining 0.00 154 0.00
Sofa HH38-C Wadding 0.00 91.3 0.00
Sofa HH38-D Foam 0.00 0.00 0.00
Sofa HH39-A Cover (textile) 35,291 1,901 0.00
Sofa HH39-B Foam 2,508 0.00 0.00
Sofa HH39-C Lining 130 0.00 0.00
Sofa HH40-A Cover (textile) 49,023 11,204 0.00
Sofa HH40-B Lining 6,754 315 0.00
Sofa HH40-C Wadding 55.1 205 0.00
Other HH41-A Cover (textile) 31.7 0.00 0.00
Other HH41-B Wadding 35.8 173 0.00
Other HH41-C Foam 0.00 0.00 0.00
Other HH41-D Lining 38.4 0.00 0.00
Sofa HH42-A Cover (textile) 37,802 24,525 0.00
Sofa HH42-B Foam 8,785 377 0.00
Sofa HH42-C Foam 7,882 0.00 0.00
Sofa HH42-D Lining 98.5 0.00 0.00
Sofa HH43-A Cover (leather) 29.1 0.00 0.00
Sofa HH43-B Lining 11.0 0.00 0.00

Environment Agency
Report Reference: UC15080.5/17370-0 27th May 2021
© WRc 2021 90
Category Code Sub-category
XRF concentration mg kg-1
Br Sb Cl
Sofa HH43-C Wadding 0.00 150 0.00
Sofa HH44-A Cover (leatherette) 24.3 0.00 360,000
Sofa HH44-B Foam 278 0.00 0.00
Dining chair HH45-A Cover (textile) 57,643 20,950 0.00
Dining chair HH45-B Wadding 461 144 0.00
Sofa HH46-A Cover (textile) 14,536 2,591 0.00
Sofa HH46-B Lining 77.0 98.4 0.00
Sofa HH46-C Foam 29.2 0.00 0.00
Other HH47-A Cover (textile) 6.71 146 0.00
Other HH47-B Lining 0.00 0.00 0.00
Other HH47-C Foam 0.00 0.00 0.00
Armchair HH48-A Cover (textile) 16.4 0.00 0.00
Armchair HH48-B Foam 22.1 0.00 0.00
Sofa HH49-A Cover (textile) 59,789 11,083 0.00
Sofa HH49-B Foam 47.8 0.00 0.00
Sofa HH50-A Cover (textile) 43.3 0.00 0.00
Sofa HH50-B Lining 11.3 0.00 0.00
Sofa HH50-C Wadding 54.4 170 0.00
Sofa HH51-A Cover (textile) 57.4 1,883 360,000
Sofa HH51-B Cover (textile) 35.0 0.00 0.00
Sofa HH51-C Lining 86.0 186 0.00
Sofa HH51-D Foam 73,551 31,204 0.00
Other HH52-A Cover (textile) 10,007 1,751 0.00
Other HH52-B Wadding 381 211 0.00
Other HH52-C Foam 1,312 38.9 360,000
Sofa HH53-A Cover (leatherette) 11.6 468 360,000
Sofa HH53-B Lining 14.2 0.00 0.00
Sofa HH53-C Wadding 15.9 93.9 0.00
Sofa HH53-D Misc. 104 51.0 0.00
Sofa HH53-E Foam 14,332 0.00 0.00
Sofa HH54-A Cover (textile) 22,697 5,665 0.00
Sofa HH54-B Lining 410 0.00 0.00
Sofa HH54-C Wadding 25.5 143 0.00
Sofa HH55-A Cover (leather) 18.8 0.00 0.00
Sofa HH55-B Foam 16.1 0.00 0.00
Sofa HH56-A Cover (textile) 79,817 14,781 0.00
Sofa HH56-B Foam 2,850 186 0.00
Sofa HH56-C Foam 255 0.00 0.00
Sofa HH56-D Foam 1,500 0.00 0.00
Sofa HH57-A Cover (leatherette) 38,808 4,397 0.00
Sofa HH57-B Wadding 303 204 0.00

Environment Agency
Report Reference: UC15080.5/17370-0 27th May 2021
© WRc 2021 91
Category Code Sub-category
XRF concentration mg kg-1
Br Sb Cl
Sofa HH57-C Foam 65.5 0.00 360,000
Sofa HH58-A Cover (leatherette) 16.1 1,895 360,000
Sofa HH58-B Wadding 0.00 193 0.00
Sofa HH59-A Cover (textile) 59.3 0.00 0.00
Sofa HH59-B Wadding 107 149 0.00
Sofa HH59-C Foam 20.1 0.00 0.00
Sofa HH60-A Cover (textile) 25,186 8,431 0.00
Sofa HH60-B Foam 1,671 0.00 0.00
Sofa HH60-C Wadding 1,723 192 0.00
Sofa HH60-D Foam 1,623 98.4 0.00
Sofa HH61-A Cover (textile) 40.1 0.00 0.00
Sofa HH61-B Lining 20.5 0.00 0.00
Sofa HH61-C Wadding 0.00 182 0.00
Sofa HH62-A Cover (leather) 11.0 0.00 0.00
Sofa HH62-B Foam 10.1 0.00 0.00
Sofa HH62-C Lining 5,038 922 0.00
Sofa HH62-D Lining 14,892 2,860 0.00
Sofa HH62-E Foam 82.1 0.00 0.00
Sofa HH63-A Cover (textile) 20.6 0.00 0.00
Sofa HH63-B Lining 40.0 0.00 0.00
Sofa HH63-C Foam 10.3 0.00 0.00
Sofa HH64-A Wadding 52.5 82.7 0.00
Sofa HH64-B Foam 26.6 0.00 0.00
Sofa HH64-C Cover (leather) 31,496 3,070 0.00
Sofa HH64-D Foam 20.1 0.00 360,000
Sofa HH64-E Lining 2,066 655 0.00
Sofa HH65-A Cover (textile) 62,428 6,376 0.00
Sofa HH65-B Foam 36.4 0.00 0.00
Sofa HH66-A Cover (textile) 21.3 0.00 0.00
Sofa HH66-B Wadding 0.00 0.00 0.00
Sofa HH66-C Lining 3.03 0.00 0.00
Sofa HH66-D Wadding 0.00 98.1 0.00
Other HH67-A Cover (textile) 413 13,927 0.00
Armchair HH69-A Foam 0.00 0.00 0.00
Armchair HH69-B Wadding 16.5 113 0.00
Armchair HH69-C Cover (textile) 480 57.2 360,000
Dining chair HH70-A Cover (textile) 210 147 0.00
Dining chair HH70-B Wadding 50.1 125 0.00
Dining chair HH70-C Lining 87.5 95.3 0.00
Dining chair HH70-D Foam 953 0.00 0.00
Sofa HH71-A Cover (textile) 54,847 15,257 0.00

Environment Agency
Report Reference: UC15080.5/17370-0 27th May 2021
© WRc 2021 92
Category Code Sub-category
XRF concentration mg kg-1
Br Sb Cl
Sofa HH71-B Wadding 0.00 110 0.00
Sofa HH71-C Lining 1,057 125 0.00
Sofa HH72-A Cover (textile) 105,060 30,072 0.00
Sofa HH72-B Wadding 131 210 0.00
Sofa HH72-C Foam 47.4 0.00 0.00
Sofa HH73-A Wadding 0.00 90.0 0.00
Sofa HH73-B Cover (leatherette) 16,957 909 360,000
Sofa HH73-C Lining 27.0 113 0.00
Sofa HH73-D Lining 173 0.00 0.00
Sofa SP1-A Cover (leather) 446 0.00 0.00
Sofa SP1-B Lining 83.4 0.00 0.00
Sofa SP1-C Foam 0.00 100 0.00
Sofa SP2-A Cover (leather) 36.1 0.00 0.00
Sofa SP3-A Cover (textile) 53,558 5,659 0.00
Sofa SP3-B Foam 432 148 0.00
Sofa SP3-C Lining 90.9 161 0.00
Sofa SP4-A Cover (textile) 17,960 1,319 0.00
Sofa SP4-B Foam 1,173 83.1 0.00
Sofa SP5-A Cover (textile) 20,881 6,037 0.00
Sofa SP5-B Lining 300 146 0.00
Sofa SP5-C Foam 927 334 0.00
Sofa SP6-A Cover (textile) 334 0.00 0.00
Sofa SP6-B Foam 0.00 0.00 0.00
Sofa SP7-A Cover (textile) 53,604 1,827 0.00
Sofa SP7-B Lining 90.8 0.00 0.00
Sofa SP7-C Foam 6,599 451 0.00
Sofa SP7-D Lining 47.5 0.00 0.00
Sofa SP8-A Cover (textile) 82,530 11,951 0.00
Sofa SP8-B Lining 190 0.00 0.00
Sofa SP8-C Foam 689 139 0.00
Sofa SP8-D Wadding 418 111 0.00
Sofa SP8-E Lining 21.0 0.00 0.00
Dining chair SP9-A Cover (textile) 93.1 0.00 0.00
Office chair SP10-A Cover (textile) 7.91 1,396 0.00
Armchair SP11-A Cover (textile) 16.6 56.4 0.00
Armchair SP11-B Lining 0.00 0.00 0.00
Armchair SP11-C Foam 0.00 118 0.00
Armchair SP12-A Cover (textile) 25,775 3,389 0.00
Armchair SP12-B Lining 128 180 0.00
Armchair SP12-C Foam 903 0.00 0.00
Armchair SP13-A Cover (leather) 175 0.00 0.00

Environment Agency
Report Reference: UC15080.5/17370-0 27th May 2021
© WRc 2021 93
Category Code Sub-category
XRF concentration mg kg-1
Br Sb Cl
Sofa SP14-A Cover (leather) 43.3 34.0 0.00
Sofa SP15-A Cover (leather) 33.9 72.3 0.00
Armchair SP16-A Cover (textile) 1,932 0.00 0.00
Armchair SP16-B Lining 0.00 0.00 0.00
Armchair SP16-C Foam 9.96 0.00 0.00
Armchair SP16-D Lining 186 0.00 0.00
Sofa SP17-A Cover (textile) 6.99 102 0.00
Sofa SP17-B Lining 7.49 151 0.00
Armchair SP18-A Cover (leather) 245 0.00 0.00
Armchair SP18-B Lining 1,063 0.00 0.00
Armchair SP18-C Foam 38.7 0.00 0.00
Dining chair SP19-A Cover (textile) 24,824 3,777 0.00
Armchair SP20-A Cover (textile) 21,527 5,655 0.00
Armchair SP20-B Lining 4,278 12,602 360,000
Armchair SP20-C Foam 1,121 237 0.00
Armchair SP21-A Cover (textile) 47,775 11,097 0.00
Armchair SP21-B Lining 3,908 13,314 360,000
Armchair SP21-C Foam 1,166 293 0.00
Dining chair SP22-A Cover (textile) 34.4 0.00 0.00
Dining chair SP22-B Lining 4.99 0.00 0.00
Sofa SP23-A Cover (leather) 24.5 40.8 0.00
Sofa SP24-A Cover (textile) 21.4 0.00 0.00
Sofa SP24-B Lining 9.49 74.5 0.00
Sofa SP24-C Foam 0.00 63.6 0.00
Sofa SP25-A Cover (textile) 9,925 2,690 0.00
Sofa SP25-B Lining 332 0.00 0.00
Sofa SP25-C Foam 28.4 0.00 0.00
Sofa SP26-A Cover (textile) 16,129 3,556 0.00
Sofa SP26-B Lining 274 172 0.00
Sofa SP26-C Foam 4,319 126 0.00
Armchair SP27-A Cover (textile) 196 805 0.00
Armchair SP27-B Lining 15.8 0.00 0.00
Armchair SP27-C Foam 26.9 0.00 0.00
Sofa SP28-A Cover (leather) 125 0.00 0.00
Sofa SP29-A Cover (textile) 21,281 3,594 0.00
Sofa SP29-B Lining 141 0.00 0.00
Sofa SP29-C Foam 2,026 208 0.00
Sofa SP30-A Cover (textile) 25,101 3,960 0.00
Sofa SP30-B Lining 148 181 0.00
Sofa SP31-A Cover (textile) 6,387 3,080 0.00
Armchair SP32-A Cover (textile) 56,539 6,053 0.00

Environment Agency
Report Reference: UC15080.5/17370-0 27th May 2021
© WRc 2021 94
Category Code Sub-category
XRF concentration mg kg-1
Br Sb Cl
Armchair SP32-B Foam 4,571 375 0.00
Sofa SP33-A Cover (leather) 41.0 0.00 0.00
Sofa SP33-B Lining 243 157 0.00
Sofa SP33-C Foam 0.00 139 0.00
Armchair SP34-A Cover (leather) 25.0 0.00 0.00
Armchair SP34-B Lining 0.00 0.00 0.00
Armchair SP34-C Foam 0.00 0.00 0.00
Sofa SP35-A Cover (leatherette) 46.4 2,735 360,000
Sofa SP35-B Lining 19.3 0.00 0.00
Sofa SP35-C Foam 0.00 145 0.00
Armchair SP36-A Cover (leatherette) 44.4 2,814 360,000
Armchair SP36-B Lining 0.00 58.2 0.00
Armchair SP36-C Foam 0.00 134 0.00
Other SP37-A Cover (leather) 0.00 3,010 360,000
Dining chair SP38-A Cover (leather) 951 0.00 0.00
Dining chair SP38-B Lining 104 0.00 0.00
Dining chair SP39-A Cover (textile) 0.00 0.00 0.00
Dining chair SP39-B Lining 0.00 0.00 0.00
Dining chair SP39-C Foam 0.00 0.00 0.00
Armchair SP40-A Cover (textile) 56,132 16,235 0.00
Armchair SP40-B Lining 28.0 5,352 360,000
Armchair SP40-C Foam 267 0.00 0.00
Armchair SP41-A Cover (textile) 32,354 15,687 0.00
Armchair SP42-A Cover (textile) 53.3 857 0.00
Armchair SP42-B Lining 0.00 0.00 0.00
Armchair SP42-C Foam 103 728 360,000
Sofa SP43-A Cover (textile) 8.52 0.00 0.00
Sofa SP43-B Lining 19.2 0.00 0.00
Sofa SP43-C Foam 0.00 0.00 0.00
Dining chair SP44-A Cover (leather) 438 0.00 0.00
Dining chair SP44-B Lining 150 0.00 0.00
Sofa SP45-A Cover (leather) 41.2 0.00 0.00
Sofa SP45-B Lining 685 143 0.00
Sofa SP45-C Foam 8.20 0.00 0.00
Sofa SP46-A Cover (textile) 63,909 2,299 0.00
Sofa SP46-B Lining 99.0 132 0.00
Sofa SP46-C Foam 771 197 0.00
Dining chair SP47-A Cover (textile) 15,878 1,870 0.00
Dining chair SP47-B Foam 48.2 0.00 0.00
Sofa SP48-A Cover (textile) 41,694 13,248 0.00
Sofa SP48-B Lining 143 0.00 0.00

Environment Agency
Report Reference: UC15080.5/17370-0 27th May 2021
© WRc 2021 95
Category Code Sub-category
XRF concentration mg kg-1
Br Sb Cl
Sofa SP48-C Foam 994 258 0.00
Armchair SP49-A Cover (leather) 10.9 57.1 0.00
Sofa SP50-A Cover (leather) 12.8 0.00 0.00
Armchair SP51-A Cover (leather) 24.2 0.00 0.00
Armchair SP51-B Cover (textile) 165 147 0.00
Armchair SP51-C Lining 254 0.00 0.00
Armchair SP51-D Foam 0.00 167 0.00
Armchair SP52-A Cover (textile) 13,066 4,580 0.00
Armchair SP52-B Lining 206 131 0.00
Armchair SP52-C Foam 521 0.00 0.00
Sofa SP53-A Cover (leather) 17.0 0.00 0.00
Sofa SP53-B Lining 402 0.00 0.00
Sofa SP53-C Foam 7.91 0.00 0.00
Dining chair SP54-A Cover (textile) 8.16 2,833 0.00
Dining chair SP54-B Lining 0.00 0.00 0.00
Office chair SP55-A Cover (textile) 30.5 0.00 0.00
Office chair SP55-B Lining 0.00 0.00 0.00
Sofa SP56-A Cover (leather) 18.9 0.00 0.00
Sofa SP57-A Cover (leather) 22.7 50.3 0.00
Sofa SP58-A Cover (leather) 35.5 49.4 0.00
Sofa SP59-A Cover (leather) 570 119 0.00
Sofa SP59-B Lining 4,686 62.7 0.00
Sofa SP59-C Foam 737 67.4 0.00
Dining chair SP60-A Cover (textile) 20,115 2,575 0.00
Dining chair SP60-B Lining 5.95 0.00 0.00
Dining chair SP61-A Cover (leather) 10.7 0.00 0.00
Dining chair SP61-B Lining 5.86 0.00 0.00
Office chair SP62-A Cover (textile) 23.8 0.00 0.00
Office chair SP62-B Lining 5.49 0.00 0.00
Office chair SP63-A Cover (textile) 21.8 0.00 0.00
Dining chair SP64-A Cover (textile) 20,507 5,327 0.00
Dining chair SP64-B Lining 10.9 0.00 0.00

Environment Agency
Report Reference: UC15080.5/17370-0 27th May 2021
© WRc 2021 96
Appendix D Laboratory Analytical Testing
Samples Submitted for Quantitative Chemical Testing
The samples which were sent for Tier 3 testing are shown in Table D.1. The samples are shown
alongside their ‘source item’ i.e. sofa, arm chair etc.
Table D.1 Tier 3 sample description and photographs
Sample information Item Component
W9078 - EA-KM11-D Other (footstool) Cover (textile) Bromine (9.86%)
W9079 - EA-KM12-E Armchair (club) Lining (textile) Bromine (0.45%)
W9080 - EA-KM16-A Sofa (unknown size) Cover (textile) Bromine (9.64%)
W9081 - EA-KM17-A Sofa (unknown size) Cover (textile) Bromine (6.31%)

Environment Agency
Report Reference: UC15080.5/17370-0 27th May 2021
© WRc 2021 97
Sample information Item Component
W9082 - EA-KM17-B Sofa (unknown size) Foam Bromine (0.47%)
W9083 - EA-KM20-C Sofa (unknown size) Foam Bromine (1.47%)
W9084 - EA-KM22-A Armchair (unknown shape) Cover (leatherette) Bromine (11.5%)
W9085 - EA-KM22-B Armchair (unknown shape) Cover (textile) Bromine (6.7%)
W9086 - EA-KM26-D Armchair (unknown shape) Foam Bromine (1.7%)
W9087 - EA-KM37-B Other (footstool) Foam Bromine (1.2%)
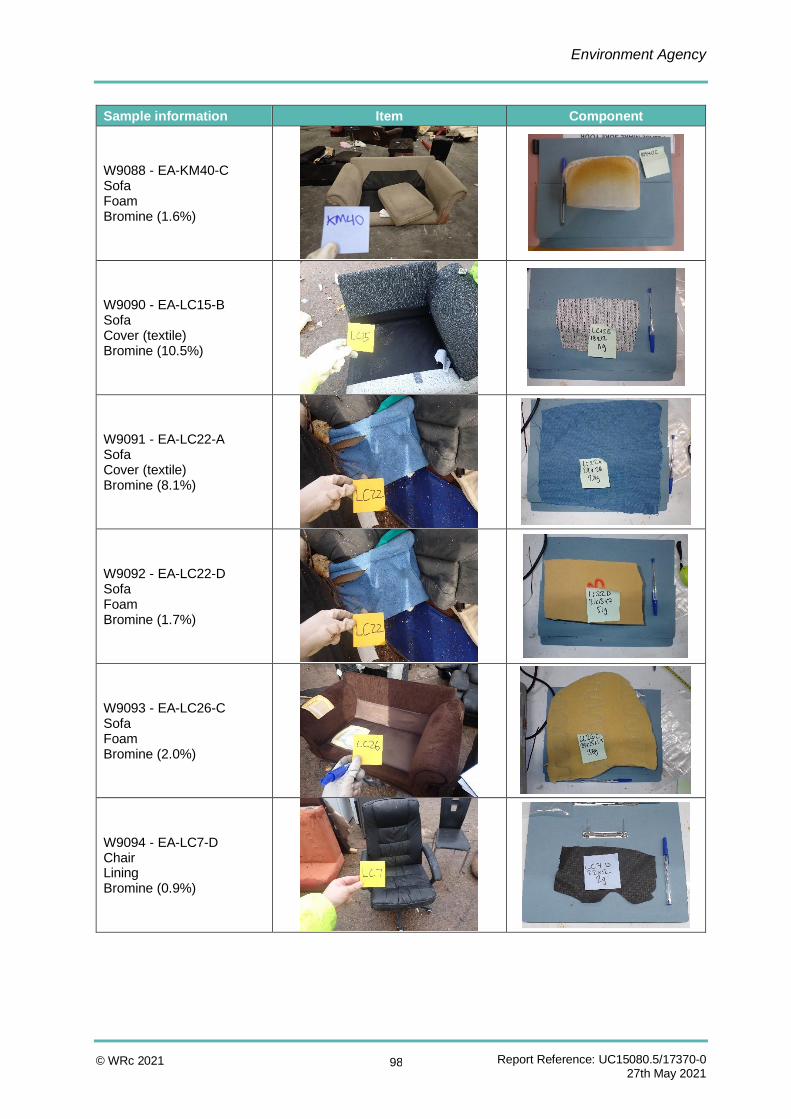
Environment Agency
Report Reference: UC15080.5/17370-0 27th May 2021
© WRc 2021 98
Sample information Item Component
W9088 - EA-KM40-C Sofa Foam Bromine (1.6%)
W9090 - EA-LC15-B Sofa Cover (textile) Bromine (10.5%)
W9091 - EA-LC22-A Sofa Cover (textile) Bromine (8.1%)
W9092 - EA-LC22-D Sofa Foam Bromine (1.7%)
W9093 - EA-LC26-C Sofa Foam Bromine (2.0%)
W9094 - EA-LC7-D Chair Lining Bromine (0.9%)

Environment Agency
Report Reference: UC15080.5/17370-0 27th May 2021
© WRc 2021 99
Sample information Item Component
W9095 - EA-LC29-A Sofa Cover (leatherette) Bromine (4.0%)
W9096 - EA-LC33-G Armchair Cover (textile) Bromine (9.5%)
W9097 - EA-LC38-C Sofa Foam Bromine (1.4%)
W9098 - EA-LC38-D Sofa Foam Bromine (1.3%)
W9099 - EA-LC44-D Armchair Foam Bromine (1.3%)
W9020 - EA-CC17-A Sofa Cover (textile)
No image available.

Environment Agency
Report Reference: UC15080.5/17370-0 27th May 2021
© WRc 2021 100
Sample information Item Component
W9021 - EA-CC17-B Sofa Foam Bromine (0.8%)
No image available.
W9022 - EA-CC8-A Armchair Cover (textile) Bromine (6.3%)
W9023 - EA-CC23-B Armchair Cover (textile) Bromine (3.6%)
W9024 - EA-CC23-D Armchair Lining Bromine (0.9%)
W9025 - EA-CC27-B Sofa Cover (textile) Bromine (3.3%)
W9026 - EA-CC25-B Sofa Cover (textile) Bromine (4.5%)

Environment Agency
Report Reference: UC15080.5/17370-0 27th May 2021
© WRc 2021 101
Sample information Item Component
W9027 - EA-CC4-B Armchair Cover (textile) Bromine (5.3%)
W9028 - EA-CC6-A Chair Cover (textile) Bromine (6.1%)
W9029 - EA-CC11-B Sofa Cover (textile) Bromine (4.1%)
W9030 - EA-CC8-H Armchair Foam Bromine (0.5%)
W9031 - EA-CC5-C Sofa Foam Bromine (0.6%)
W9032 - EA-WF2-A Chair Cover (leatherette) Bromine (2.3%)

Environment Agency
Report Reference: UC15080.5/17370-0 27th May 2021
© WRc 2021 102
Sample information Item Component
W9033 - EA-WF2-D Chair Lining Bromine (0.8%)
W9034 - EA-WF6-B Chair Foam Bromine (1.8%)
W9036 - EA-WF16-A Sofa Cover (leatherette) Bromine (6.9%)
W9036 - EA-WF16-B Sofa Cover (textile) Bromine (7.0%)
W9037 - EA-WF16-C Sofa Foam Bromine (0.6%)
W9038 - EA-WF24-A Armchair Cover (textile) Bromine (8.9%)

Environment Agency
Report Reference: UC15080.5/17370-0 27th May 2021
© WRc 2021 103
Sample information Item Component
W9039 - EA-WF9-A Footstool Cover (textile) Bromine (3.6%)
W9169 - EA-HH19-A Sofa Cover (textile) Bromine (7.0%)
W9170 - EA-HH19-B Sofa Lining Bromine (0.3%)
W9171 - EA-HH2-A Sofa Cover (leatherette) Bromine (7.5%)
W9172 - EA-HH22-A Sofa Cover (leatherette) Bromine (3.6%)
W9173 - EA-HH32-C Armchair Foam Bromine (2.1%)

Environment Agency
Report Reference: UC15080.5/17370-0 27th May 2021
© WRc 2021 104
Sample information Item Component
W9174 - EA-HH34-C Armchair Foam Bromine (2.0%)
W9175 - EA-HH51-D Sofa Foam Bromine (7.4%)
W9176 - EA-HH56-A Sofa Cover (textile) Bromine (8.0%)
W9177 - EA-HH72-A Sofa Cover (textile) Bromine (10.5%)

Environment Agency
Report Reference: UC15080.5/17370-0 27th May 2021
© WRc 2021 105
Details of Sub-contract Laboratory Experience and Test Methods
D2.1 Tier 2 screening - Amsterdam
Screening tests were sub-contracted to the Institute for Environmental Studies (IVM), VU
University Amsterdam, de Boelelaan 1087, 1081 HV Amsterdam in The Netherlands. IVM are
the oldest environmental research institute in The Netherlands (established in 1971), and is
rated with high scores on scientific excellence. They have significant experience of undertaking
traditional quantitative analysis on flame retardants in a wide range of matrices. Of specific
relevance to this project is a semi-quantitative broad range screening tool that has been
developed to asess the presence of a wide range of flame retardants and additives in polymer
plastics and other matrices. They have published a substantial number of technical papers in
recognised scientific journals and worked with research institutes world-wide in the completion
of this work.
Pre-milled samples were extracted with toluene using sonication, followed by 2-propanol and
another sonication step. For the extraction of BDE209 toluene alone was used due to poor
recovery using 2-propanol. The extracts were centrifuged and a small amount, in triplicate, is
added to an atmospheric pressure matrix-assisted laser desorption ionization (AP-MALDI)
plate. Final measurements are performed with an AP-MALDI source (MassTech, AP-MALDI
(ng) UHR) coupled to a high-resolution quadrupole time-of-flight (qTOF Compact Bruker) mass
spectrometer, except for BDE209, which was measured with LC-APCI-QTOFMS in negative
mode. Identification of the chemicals is based on the exact mass and isotope patterns and were
compared to analytical standards, see below. Identification was performed on confidence level
4 according to the scheme of Schymanski et al. 2014. QA measures include duplicate analysis
of a number of samples, procedural blanks, use of an intern reference material (foam), and the
analyses of analytical standards (SCCPs, PBDEs, HBCDD, phthalates, PFRs, TBBP-A, Cl-
PFRs, and Br-PFRs). The average sample-to-sample relative standard deviation (RSDs) is less
than <25 %. The limit of detection is about 0.1% of the product analysed.
D2.2 Tier 3 semi-quantitative and quantitative analysis - Fraunhofer Institute
The Fraunhofer Institute for Process Engineering and Packaging (Fraunhofer IVV) based in
Giggenhauser Str. 35, 85354 Freising, Germany was substracted to undertake the quantitative
testing of PBDEs and other flames retardents in domestic seating. The project team are
focussed on recycling and the environment, and use state of the art analytical equipment to
developing test methods for flame retardant chemicals in a variety of different matrices. Many
of these methods have been published in the scientific literature and include the measurement
of PBDEs in air, dust, and polymer matrices.
Fraunhofer IVV operate a quality management system which meets the requirements of DIN
EN ISO/IEC 17025: 2018 and hence also the requirements of ISO 9001:2015 for the test
laboratories.

Environment Agency
Report Reference: UC15080.5/17370-0 27th May 2021
© WRc 2021 106
D2.2.1 Laboratory experience in analysis of decaBDE and HBCDD in waste
Fraunhofer IVV has considerable experience in the analysis of FR in waste matrices and in
particular PBDEs through involvement in various studies since 1999. Fraunhofer adopt a
flexible approach to test for these chemicals and adapt the method according to the analytical
needs and matrices using techniques including gas chromatography (GC)-quadrupole mass
spectrometry (MS), gas chromatography – high resolution mass spectrometry (GC-HRMS),
HPLC-Electron Capture Detection(ECD)-HRMS, liquid chromatography – high resolution mass
spectrometry (LC-HRMS) and X-ray fluorescence (XRF). Fraunhofer IVV is recognised as a
world leader in PBDE analysis. It has been involved in pan-European interlaboratory
assessments for PBDE analysis to ensure quality. They have also taken a lead in PBDE method
development and have published several scientific articles in this field:
• Schlummer et al. (2002), Recycling of technical polymers from electronic waste while
eliminating brominated flame retardants and PBDD/F, Organohal. Compds.
• Schlummer et al. (2005), Analysis of flame retardant additives in polymer fractions of
waste of electric and electronic equipment (WEEE) by means of HPLC-UV/MS and
GPC-HPLC-UV, Journal of Chromatography A.
• Cleres et al. (2009), Parallel pressurized solvent extraction of PCDD/PCDF, PBDE,
and PFC from soil, sludge, and sediment samples, Organohal. Compds.
• Schlummer et al. (2015), Rapid identification of PS foam wastes containing HBCDD
or its alternative PolyFR by X-ray fluorescence spectroscopy (XRF), Waste
Management & Research.
• Sinduku et al (2015)., Polybrominated diphenyl ethers listed as Stockholm
Convention POPs, other brominated flame retardants and heavy metals in e-waste
polymers in Nigeria, Environmental science and pollution research international.
• Schlummer et al. (2017), Recycling of flame retarded waste polystyrene foams (EPS
and XPS) to PS granules free of hexabromocyclododecane (HBCDD), Advances in
Recycling & Waste Management.
Fraunhofer use different extraction solvents depending on the test matrix, which include
toluene, tetrahydrofuran (THF) and iso-propanol to ensure optimum extraction of PBDEs and
other flame retardants. The extraction methods are assessed using XRF to estimate the
extraction efficiency of the process which can give an indication on the limitation of the
technique and the mass balance of an atomic compound. This can also provide an insight as
to whether the brominated flame retardants are chemically bound to the polymer matrix
(backbone flame retardants) or are mobile within the matrix (matrix flame retardants).
The analytical methods have undergone appropriate method development for POPs. An
important part of the method development is the use of isotope labelled standards. Fraunhofer
have incorporated the development of new analytical methods for the analysis of contaminants
into the quality management system (DIN EN ISO/IEC 17025). Their expertise in method
development was confirmed by the re-accreditation body in 2000, 2006, 2011, 2012, 2016.

Environment Agency
Report Reference: UC15080.5/17370-0 27th May 2021
© WRc 2021 107
D2.2.2 Quality control and assurance methods
Quality control and assurance were undertaken according to DIN EN ISO/IEC 17025 and
included the use of a preliminary bromine screening using XRF during the clean-up step to
predict dilution steps and the use of internal standards ("isotope dilution"). This approach
allowed for recoveries (extraction efficiencies) and limits of detection (LODs) for each individual
sample to be estimated.
Alongside the use of XRF during the clean-up step, XRF of the post extraction residues was
also undertaken. To undertake the XRF analysis, the subsamples were filled in plastic cuvettes
lined with 12µm Prolene® film and subjected to a measurement using a Spectro XEPOS bench-
top XRF instrument using the standard method for plastics. LODs of the energy dispersive XRF
(ED-XRF) method are less than 10 mg/kg with this setup.
An important quality control step also included the analysis of sufficient blank samples. The use
of GC-HRMS enabled Fraunhofer to perform the analysis selectively with strict observation of
the bromine isotopic ratios. This reduced the potential for extraction overlap of different PBDE
congeners which can cause either over-estimation or underestimatiom of concentration.
The quality control methods used in this work indicated that the intial extractions were unable
to characterise or identify all bromine containing substances in the samples. Therefore
additional experiments were preformed to determine whether alternative brominated
compounds were present and therefore may clarify the discrepency between initial LC and GC-
MS results and XRF data. As well as the testing for alternative brominated compounds the
additional analysis included phosphorous-based flame retardants which may have caused
interference in the initial extraction process. This information supported the use of an alternative
extraction method to determine the decaBDE concentration in some samples where suspected
interference was at play.
D2.2.3 PBDEs and HBCDD
ASE extraction
Extraction and quantification of brominated diphenyl ethers from all samples was performed by
pressurised liquid extraction with DCM and 2-propanol (100 bar, 100°C, 3 cycles) followed by
a dilution and filtration step.
PBDEs by GC-High resolution MS
Each sample was spiked with each 10 µL of the internal standards MBDE-MXG and
MBDE-ISS-G. After thoroughly mixing the sample was subjected to GC-HRMS analysis.

Environment Agency
Report Reference: UC15080.5/17370-0 27th May 2021
© WRc 2021 108
The GC-HRMS (Thermo MAT 95 S) was operated in single ion monitoring mode (SIM),
monitoring two fragment ions per analyte. PBDEs were quantified by an internal standard
method.
The applied methods are in accordance with IEC 62321. The GC separation parameters are
provided Table D.2and measurement criteria for the PBDEs in Table D.3
Table D.2 GC parameters
Parameter Conditions
Injection temperature 300 °C
Injection method splitless (1 min)
Injection volume 1 µl
Carrier gas Helium
Column flow 1,2 ml/min (constant flow)
Oven temperature 170 °C (2.5 min) 20 °C/min-230 °C (4 min) 20 °C/min-340 °C (4 min)
Column pre column (deactivated, 2m x 0.32 mm)+ DB-5HT (15 m x 0.25 mm, 0.1 µm) (Agilent J&W)
Table D.3 GC-HRMS PBDE ion masses
Native Internal Standard Lock/Cali Mass
TriBDE 405.8026 407.8006 392.9751 l
417.8429 419.8409 430.9723 c
TetraBDE 483.7126 495.7529 480.9688 l
485.7106 497.7508 504.9691 c
PentaBDE 563.6211 575.6614 554.9644 l
565.6191 577.6593 580.9627 c
HexaBDE 481.6970 493.7372 480.9688 l
483.6950 495.7352 504.9691 c
HeptaBDE 561.6055 573.6457 554.9644 l
563.6035 575.6437 592.9627 c
OctaBDE 639.5160 651.5562 630.9585 l
641.5140 653.5542 654.9595 c
NonaBDE 719.4245 731.4647 704.9531 l
721.4225 733.4626 754.9531 c
DecaBDE 797.3350 809.3752 792.9497 l
799.3329 811.3732 830.9467 c
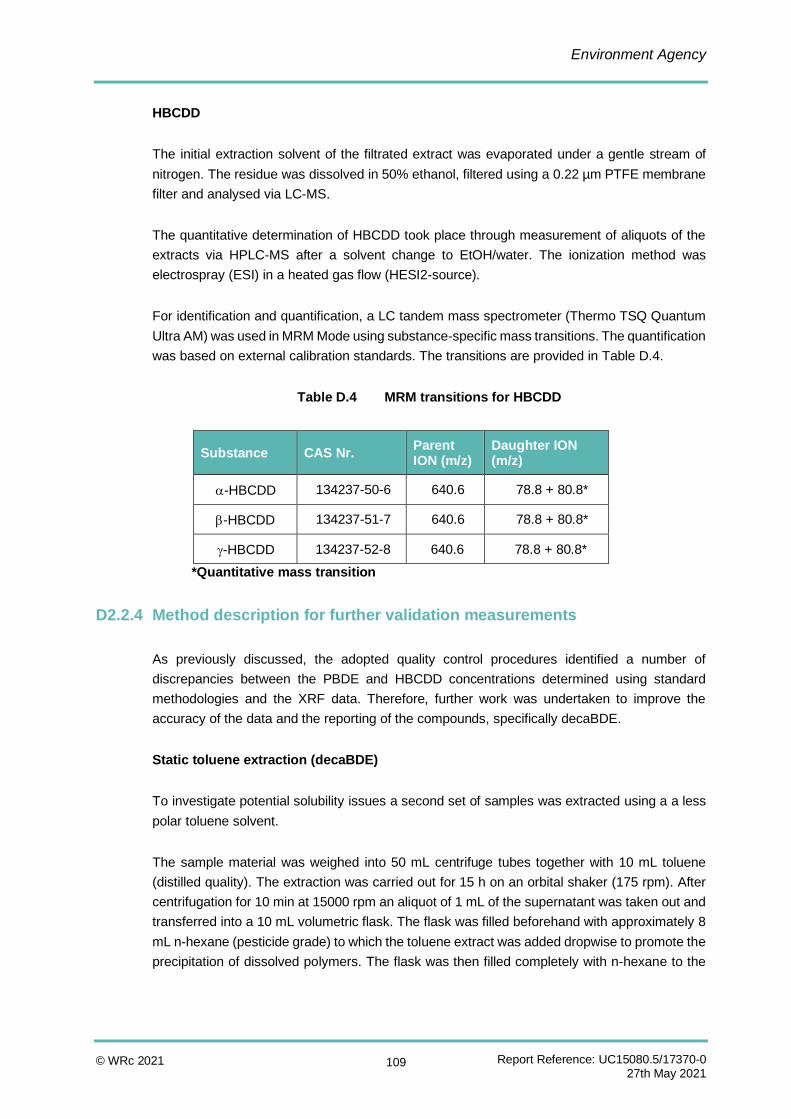
Environment Agency
Report Reference: UC15080.5/17370-0 27th May 2021
© WRc 2021 109
HBCDD
The initial extraction solvent of the filtrated extract was evaporated under a gentle stream of
nitrogen. The residue was dissolved in 50% ethanol, filtered using a 0.22 µm PTFE membrane
filter and analysed via LC-MS.
The quantitative determination of HBCDD took place through measurement of aliquots of the
extracts via HPLC-MS after a solvent change to EtOH/water. The ionization method was
electrospray (ESI) in a heated gas flow (HESI2-source).
For identification and quantification, a LC tandem mass spectrometer (Thermo TSQ Quantum
Ultra AM) was used in MRM Mode using substance-specific mass transitions. The quantification
was based on external calibration standards. The transitions are provided in Table D.4.
Table D.4 MRM transitions for HBCDD
Substance CAS Nr. Parent ION (m/z)
Daughter ION (m/z)
-HBCDD 134237-50-6 640.6 78.8 + 80.8*
-HBCDD 134237-51-7 640.6 78.8 + 80.8*
-HBCDD 134237-52-8 640.6 78.8 + 80.8*
*Quantitative mass transition
D2.2.4 Method description for further validation measurements
As previously discussed, the adopted quality control procedures identified a number of
discrepancies between the PBDE and HBCDD concentrations determined using standard
methodologies and the XRF data. Therefore, further work was undertaken to improve the
accuracy of the data and the reporting of the compounds, specifically decaBDE.
Static toluene extraction (decaBDE)
To investigate potential solubility issues a second set of samples was extracted using a a less
polar toluene solvent.
The sample material was weighed into 50 mL centrifuge tubes together with 10 mL toluene
(distilled quality). The extraction was carried out for 15 h on an orbital shaker (175 rpm). After
centrifugation for 10 min at 15000 rpm an aliquot of 1 mL of the supernatant was taken out and
transferred into a 10 mL volumetric flask. The flask was filled beforehand with approximately 8
mL n-hexane (pesticide grade) to which the toluene extract was added dropwise to promote the
precipitation of dissolved polymers. The flask was then filled completely with n-hexane to the

Environment Agency
Report Reference: UC15080.5/17370-0 27th May 2021
© WRc 2021 110
mark. The whole toluene/n-hexane mixture was then filtered through syringe filters (PTFE
membrane, 0.45 µm). An aliquot of the filtrated extract was then taken for HBCDD analysis via
LC-MS (Thermo TSQ Quantum LC-MS-MS, neg mode, ESI, SRM; Column: EVO C18). An
aliquot of the extract was analyzed by GC-ECD and (for three samples) by GC-Quadrupole-
MS.
Screening of samples with GC-quadrupole MS
A screening for unknown compounds for a subset of three samples was performed on a gas
chromatography (quadrupole) mass spectrometry system of the type Shimadzu QP2010 Ultra
for validation purposes. An additional aim of this work was to verify that there was no loss of
DecaBDE on the analytical columns.
The used GC-MS-method was based on a simplified GC-MS-method for brominated flame
retardants proposed by the National Institute for Environmental Studies, Japan (Table D.5).
Table D.5 GC-MS screening parameters
Method Parameter Conditions
GC
Injection temperature 300 °C
Injection method splitless (1 min)
Injection volume 0.5 µl
Carrier gas Helium
Column flow 2.65 ml/min (constant flow)
Oven temperature 100 °C (1 min) 65 °C/min-175 °C (0 min) 45 °C/min-300 °C (0 min)
35 °C/min-320 °C (0.5 min)
Column DB-5HT (5 m x 0.25 mm, 0.1 µm) (Agilent J&W)
MS
Interface temperature 300 °C
Ion source temperature 230 °C
Ionisation energy 70 eV
Full scan mass range 150 – 850 m/z
Static extraction of a further subset of samples
A further subset of samples were extracted by means of a static toluene extraction. An amount
of 0.5 g of sample was mixed with 50 ml toluene (distilled quality) and stored at 60°C for a
period > 10 hours. The samples were directly analyzed by GC-ECD for TBBPA. After solvent
exchange the extract was analyzed on HPLC-MS for phosphor-based flame retardants.

Environment Agency
Report Reference: UC15080.5/17370-0 27th May 2021
© WRc 2021 111
GC-ECD
The GC-ECD was used for a screening for TBBPA and a look for further halogenated
substances. Set-up conditions are provided in Table D.6.
Table D.6 GC parameters for GC-ECD measurement
Parameter Conditions
Injection temperature 300 °C
Injection method splitless (1 min)
Injection volume 1 µL
Carrier gas Helium
Column flow 1,2 mL/min (constant flow)
Oven temperature 170 °C (2.5 min) 20 °C/min-230 °C (4 min) 20 °C/min-340 °C (4 min)
Column pre column (deactivated, 2m x 0.32 mm)+ DB-5HT (15 m x 0.25 mm, 0.1 µm) (Agilent J&W)
Phosphor-based flame retardants
After filtration, an aliquot of 1 mL was evaporated under a gentle nitrogen stream. The residue
was dissolved in 1 mL acetonitrile (LCMS grade), filtered (0.22 µm Nylon) and analyzed by LC-
MS/MS. The quantification was based on external calibration standards.
For identification and quantification, a LC tandem mass spectrometer (Waters Quattro Ultimate
Platinum) was used in MRM Mode using substance-specific mass transitions (Table D.7).
Ionization was performed by heated electrospray ionization (HESI) in positive mode. For each
substance two MRM-transitions have been measured and quantified. There was only one
MRM-transition for the substance Diphenyl (ethylhexyl) phosphate. MRM transitions are
identified in Table D.7.

Environment Agency
Report Reference: UC15080.5/17370-0 27th May 2021
© WRc 2021 112
Table D.7 MRM transitions for organophosphorous flame retardants
Substance CAS Nr. Parent
ION (m/z) Daughter
ION1 (m/z) Daughter
ION2 (m/z)
Tri(iso)butyl phosphate
126-71-6 267.1 99.1 155.1
Tris(2-chlorethyl) phosphate
115-96-8 284.9 99.1 222.9
Triphenyl phosphate
115-86-6 326.9 77.3 152.1
Tris(2-chlorpropyl) phosphate (Mixture of isomers)
13674-84-5 326.9 99.1 250.9
Diphenyl(ethylhexyl) phosphate
1241-94-7 363.0 251.0 -
Tris(2-butoxyethyl) phosphate
78-51-3 399.1 101.3 299.1
Tris(2-ethylhexyl) phosphate
78-42-2 435.0 99.1 210.9
D2.2.5 Summary of approach and findings
The bromine content based on XRF could not be explained by the amounts of brominated
compounds (PBDEs and HBCDD) found by means of LC-MS and GC-MS therefore a search
for other flame retardants and bromine sources was performed.
Two main interfering factors were identified:
• Phosphor based flame retardants which cause solubility issues when present
especially with the samples extracted with ASE.
• BDPE 209 (decabromodiphenylethane) was identified as a main source of bromine
in some samples.
The results presented in this report include the results from GC-HMRS for the PBDEs and the
HBCDD results are from HPLC-MS. DecaBDE (BDE-209) and NonaBDE (BDE-207)
concentrations were validated using GC-ECD and are based on a static toluene extraction.
During this extraction no solubility limitations or interfering influences were observed. The
HBCDD data were also validated using the toluene extraction and EC-ECD measurement.
GC-quadrupole-MS screenings revealed the presence of BDPE 209 in a number of samples.
BDPE 209 was only present in the toluene extracts and not in the ASE extracts which might be
explained by the less polar nature of the compound. Decabromodiphenyl ethane (BDPE 209)
is used as a replacement flame retardant for the structurally similar decabromodiphenyl ether
(decaBDE). Quantitative analytical testing did not detect TBBPA.
Environment Agency
Report Reference: UC15080.5/17370-0 27th May 2021
© WRc 2021 113
Tier 2 Screening Results
The results of the Tier 2 screening analysis are provided in Table D.8. The results have been
generated from a qualitative analysis technique and therefore provided as concentration
ranges. The PBDE and decaBDE data will be provided once analytical test data has been
refined as the current extraction efficiency has not been satisfactorily proven.
The results are presented for the following compounds:
• Chlorinated phosphorous flame retardants (Cl-PFRs)
i. Tris(2-chloroethyl) phosphate (TCEP)
ii. Tris(2-chloroisopropyl) phosphate (TClPP)
• Brominated flame retardants (BFRs)
i. Decabromodiphenylethane (DBDPE)
ii. Hexabromocyclododecane (HBCDD)
iii. Ethylene bis(tetrabromophthalimide) (EBTBP)
iv. Tetrabromobisphenol A (TBBPA)
• Chlorinated paraffins (CPs)
i. Short chain chlorinated paraffins (SCCPs)
ii. Medium chain chlorinated paraffins (MCCPs).

Environment Agency
Report Reference: UC15080.5/17370-0 27th May 2021
© WRc 2021 114
Table D.8 Results of the Tier 2 qualitative analysis
Cl-PFRs Br-PFRs BFRs CPs
Sample ID TCEP
115-96-8
TCIPP
13674-84-5
TDCIPP
13674-87-8
TBPP
126-72-7
TNBPP
19186-97-1 PBDEs
BDE209
1163-19-5
DBDPE
284-366-9
HBCDD
3194-55-6
EBTBP
32588-76-4
TBBPA
79-94-7
SCCPs
85535-84-8
MCCPs
85535-85-9
KM22-A - X - - - - XX 7.5%* - - - - - XX
KM16-A - X X - - - X 0.18%* - - - - - -
WF24-A - - - - - - X 0.16%* - - - - - -
HH56-A - - - - - - (x) 0.0%* - X - - - -
WF16-A - (x) - - - - (x) 0.02%* - - - - - X
CC17-A - (x) - - - - X 0.09%* - XX - - - -
CC4-B X - - - - - XX 4.4%* - - - - - -
CC11-B - (x) - - - - (x) 0.0%* - - - - - -
CC27-B - - - - - - XX 9.8%* - - - - - XX
WF2-A - X - - - - X 0.09%* - - - - - -
CC26-C - XX - - - - X 0.12%* - - - - - -
WF6-B - XX - - - - (x) 0.0%* - - - - - -
LC22-D - XX - - - - XX 7.2% - - - - - -
CC17-B - X - - - - XX 11.4%* - X - - - -
CC5-C - - - - - - X 0.07%* - - - - - -
KM17-B - XX - - - - XX 4.4%* - XX - - - -
KM17-A - X - - - - XX 11.8%* - - - - - -
CC23-B - (x) - - - - XX 13.7%* - - - - - -
WF21-C - X - - - - XX 8.1%* - - - - - - LC17-D - XX - - - - XX 1.05%* - - - - - -
Key: XX = >1% w/w, X = >0.1% w/w, (x) = below <0.1% w/w, - = not detected. * = quantitative confirmatory analysis by Eurofins (%w/w).
Sample submitted for Tier 3 screening

Environment Agency
Report Reference: UC15080.5/17370-0 27th May 2021
© WRc 2021 115
Tier 3 test data for HBCDD, PBDEs and Deca-BDPE
The results of the Tier 3 testing are shown in Table D.9Table D.10 and have been split into the sample categories. The highlighted cells show
results which were validated with GC-ECD measurements. Table D.11 shows a simplified bromine mass balance or bromine accountability
for each sample based on the XRF results before and after extraction and the bromine compounds determined through the GC measurements.
Table D.9 HBCDD, PBDE and deca-BDPE concentrations in textile and leatherette ‘cover’ samples
Sample code
Item source
Concentration (mg kg-1)
HBCDD
tetraBDE
BDE-47
PentaBDE
BDE-99
HeptaBDE
BDE-183
OctaBDE
BDE-197
OctaBDE
BDE-196
NonaBDE
BDE-206
NonaBDE
BDE-207
DecaBDE
BDE-209 Deca-BDPE
Textile covers
CC17-A Sofa 92,997 0.98 n.d. (<0.24)
n.d. (<0.92)
n.d. (<0.51)
n.d. (<1.01)
n.d. (<40.6)
n.d. (<18.4)
696 n.d. (<10.0)
CC27-B Sofa 45 n.d. (<0.41)
n.d. (<0.26)
1 1 8 210 1,841 114,234 n.d. (<10.0)
CC25-B Sofa n.d. (<10.0)
n.d. (<0.57)
n.d. (<0.39)
2 3 24 277 2,006 121,472 n.d. (<10.0)
CC11-B Sofa n.d. (<10.0)
n.d. (<0.57)
n.d. (<0.18)
n.d. (<0.70)
1 12 171 1,754 97,951 n.d. (<10.0)
CC8-A Armchair 161 n.d. (<0.33)
n.d. (<0.24)
n.d. (<1.08)
1 21 204 1,498 82,889 n.d. (<10.0)
CC23-B Armchair 414 n.d. (<0.38)
n.d. (<0.20)
n.d. (<1.42)
n.d. (<0.51)
6 140 1,180 75,195 n.d. (<10.0
CC4-B Armchair n.d. (<10.0)
n.d. (<0.5)
0.4 1 1 4 207 1,666 71,890 n.d. (<10.0)
CC6-A Dining chair n.d. (<10.0)
n.d. (<0.5)
0.4 1 1 7 205 2,330 93,198 n.d. (<10.0)
WF16-B Sofa n.d. (<10.0)
n.d. (<0.59)
0.5 1 1 5 238 1,942 98,857 5,229
WF24-A Armchair n.d. (<10.0)
n.d. (<0.28)
0.3 1 2 15 273 2,174 118,050 n.d. (<10.0)

Environment Agency
Report Reference: UC15080.5/17370-0 27th May 2021
© WRc 2021 116
Sample code
Item source
Concentration (mg kg-1)
HBCDD
tetraBDE
BDE-47
PentaBDE
BDE-99
HeptaBDE
BDE-183
OctaBDE
BDE-197
OctaBDE
BDE-196
NonaBDE
BDE-206
NonaBDE
BDE-207
DecaBDE
BDE-209 Deca-BDPE
WF9-A Footstool n.d. (<10.0)
n.d. (<0.26)
n.d. (<0.17)
n.d. (<0.66)
1 12 203 1,195 65,305 77
KM22-B Armchair 44 n.d. (<0.03)
n.d. (<0.05)
0.8 1 13 157 1,489 90,536 178
KM11-D Footstool 2,352 0.2
0.2 3 6 41 483 165 2,285 n.d*
KM16-A Sofa 48 n.d. (<0.03)
n.d. (<0.05)
0.1 0.6 1 11 23 217 7,387
KM17-A Sofa 29,149 n.d. (<0.03)
n.d. (<0.05)
0.8 n.d. (<0.51)
3 126 886 43,398 11
LC15-B Sofa 58 n.d. (<0.04)
n.d. (<0.07)
1 5 34 516 241 6,333 n.d.*
LC22-A Sofa 8 n.d. (<0.03)
0.22 1 1 7 209 1,349 68,286 n.d. (<10.0)
LC33-G Armchair n.d. (<10.0)
n.d. (<0.03)
n.d. (<0.04)
1 1 8 111 1,502 97,951 n.d.
HH19-A Sofa 119 n.d. (<0.26)
n.d. (<0.17)
n.d. (<0.57)
n.d. (<0.51)
n.d. (<1.01)
n.d. (<0.51)
n.d. (<28.8)
2,929 7,598
HH56-A Sofa 15,195 n.d. (<6.13)
n.d. (<0.31)
2 1 7 164 1,141 81,267 499
HH72-A Sofa 699 n.d. (<1.70
n.d. (<0.31)
n.d. (<1.50)
1 3 319 4,325 204,245 576
Leatherette covers
WF2-A Dining chair 289 0.6 0.6 n.d. (<1.52)
2 12 103 426 44,257 n.d. (<10.0)
WF16-A Sofa 18,959 n.d. (<0.35)
n.d. (<0.21)
n.d. (<1.08)
0.5 6 133 n.d. (<22.1)
n.d. (<859) n.d.*
KM22-A Armchair n.d. (<10.0)
0.04 n.d. (<0.05)
0.9 1 12 185 1,969 137,212 264
LC29-A Sofa 53 n.d. (<0.05)
n.d. (<0.05)
0.3 n.d. (<0.51)
4 62 391 45,883 11,227

Environment Agency
Report Reference: UC15080.5/17370-0 27th May 2021
© WRc 2021 117
Sample code
Item source
Concentration (mg kg-1)
HBCDD
tetraBDE
BDE-47
PentaBDE
BDE-99
HeptaBDE
BDE-183
OctaBDE
BDE-197
OctaBDE
BDE-196
NonaBDE
BDE-206
NonaBDE
BDE-207
DecaBDE
BDE-209 Deca-BDPE
HH2-A Sofa 128 n.d. (<0.53)
n.d. (<0.31)
n.d. (<1.19)
n.d. (<0.51)
n.d. (<1.01)
26 16 1,548 8,142
HH22-A Sofa n.d. (<10.0)
n.d. (<0.46)
n.d. (<0.31)
n.d. (<0.96)
n.d. (<0.51)
n.d. (<1.01)
33 n.d. (<14.2)
n.d. (<1,023)
6,224
Table D.10 HBCDD, PBDE and Deca-BDE concentrations in foam and lining samples
Sample
code
Item
source
Concentration (mg kg-1)
HBCDD tetraBDE
BDE-47
PentaBDE
BDE-99
HeptaBDE
BDE-183
OctaBDE
BDE-197
OctaBDE
BDE-196
NonaBDE
BDE-206
NonaBDE
BDE-207
DecaBDE
BDE-209
Deca-
BDPE
Foams
CC17-B Sofa 1,027 n.d.
(<0.43)
n.d.
(<0.24)
n.d.
(<1.53)
n.d.
(<0.51)
n.d.
(<1.01)
n.d.
(<21.1)
n.d.
(<15.1)
28 n.d.
(<10.0)
CC5-C Sofa 562 0.3 n.d.
(<0.14)
n.d.
(<0.59)
n.d.
(<0.51)
2 77 183 10,563 n.d.
(<10.0)
CC8-H Armchair 53 n.d.
(<0.23)
n.d.
(<0.14)
n.d.
(<0.59)
n.d.
(<0.51)
3 56 56 3,186 n.d.
(<10.0)
WF16-C Sofa n.d.
(<10.0)
n.d.
(<0.42)
n.d.
(<0.26)
n.d.
(<0.5)
n.d.
(<0.51)
n.d.
(<1.01)
33 85 4,240 137
WF6-B Office
chair
16 n.d.
(<0.41)
n.d.
(<0.21)
n.d.
(<1.00)
n.d.
(<0.51)
1 37 n.d.
(<27.0)
1,820 30
KM17-B Sofa 429 n.d.
(<0.03)
n.d.
(<0.05)
0.1 n.d.
(<0.51)
n.d.
(<1.01)
n.d.
(<43.0)
n.d.
(<35.0)
871 n.d.
(<10.0)
KM20-C Sofa 39 n.d.
(<0.03)
n.d.
(<0.05)
n.d.
(<0.03)
n.d.
(<0.51)
n.d.
(<1.01)
n.d.
(<18.4)
n.a.
(<17.0)
385 n.d.
(<10.0)

Environment Agency
Report Reference: UC15080.5/17370-0 27th May 2021
© WRc 2021 118
Sample
code
Item
source
Concentration (mg kg-1)
HBCDD tetraBDE
BDE-47
PentaBDE
BDE-99
HeptaBDE
BDE-183
OctaBDE
BDE-197
OctaBDE
BDE-196
NonaBDE
BDE-206
NonaBDE
BDE-207
DecaBDE
BDE-209
Deca-
BDPE
KM37-B Sofa 148 n.d.
(<0.03)
n.d.
(<0.05)
0.1 n.d.
(<0.51)
3 50 72 3,099 n.d.
(<10.0)
KM40-C Sofa 9 n.d.
(<0.03)
n.d.
(<0.05)
0.1 n.d.
(<0.51)
1 31 23 363 3,760
KM12-E Armchair 52
0.1 0.1 1 9 27 488 434 7,404 n.d.*
KM26-D Armchair 25 n.d.
(<0.03)
n.d.
(<0.05)
0.1 0.6 1 36 45 1,099 587
LC22-D Sofa n.d.
(<10.0)
n.d.
(<0.03)
n.d.
(<0.04)
0.1 n.d.
(<0.51)
n.d.
(<1.01)
34 28 967 338
LC26-C Sofa n.d.
(<10.0)
n.d.
(<0.03)
n.d.
(<0.05)
0.1 n.d.
(<0.51)
1 41 18 802 3,112
LC38-C Sofa n.d.
(<10.0)
n.d.
(<0.03)
n.d.
(<0.04)
n.d.
(<0.03)
n.d.
(<0.51)
n.d.
(<1.01)
n.d.
(<39.2)
n.d.
(<16.3)
n.d.
(<713)
n.d.
(<100)
LC38-D Sofa n.d.
(<10.0)
n.d.
(<0.03)
n.d.
(<0.05)
n.d.
(<0.03)
n.d.
(<0.51)
n.d.
(<1.01)
n.d.
(<36.4)
n.d.
(<18.1)
74 73
LC44-D Armchair n.d.
(<10.0)
n.d.
(<0.03)
n.d.
(<0.06)
n.d.
(<0.05)
n.d.
(<0.51)
n.d.
(<1.01)
n.d.
(<34.1)
n.d.
(<20.4)
133 1,369
HH51-D Sofa n.d.
(<10.0)
n.d.
(<6.33)
6 n.d.
(<0.99)
1 11 228 19 134,311 127
HH32-C Armchair 315 11,686 17,478 n.d.
(<0.96)
n.d.
(<0.51)
n.d.
(<1.01)
50 n.d.
(<30.3)
36 44
HH34-C Armchair n.d.
(<10.0)
n.d.
(<49.17)
n.d.
(<0.31)
n.d.
(<0.99)
n.d.
(<0.51)
n.d.
(<1.01)
14 n.d.
(<18.5)
61 44
Linings

Environment Agency
Report Reference: UC15080.5/17370-0 27th May 2021
© WRc 2021 119
Sample
code
Item
source
Concentration (mg kg-1)
HBCDD tetraBDE
BDE-47
PentaBDE
BDE-99
HeptaBDE
BDE-183
OctaBDE
BDE-197
OctaBDE
BDE-196
NonaBDE
BDE-206
NonaBDE
BDE-207
DecaBDE
BDE-209
Deca-
BDPE
CC23-D Armchair 6,085 n.d.
(<0.20)
n.d.
(<0.34)
n.d.
(<1.08)
1 5 122 159 12,215 n.d.
(<10.0)
WF2-D Dining
chair
16 n.d.
(<0.41)
n.d.
(<0.22)
n.d.
(<0.69)
1 7 263 52 1,739 n.d.*
LC7-D Office
chair
n.d.
(<10.0)
n.d.
(<0.03)
n.d.
(<0.05)
0.1 5 23 531 290 5,736 n.d.*
HH19-B Sofa 396 n.d.
(<0.26)
n.d.
(<0.26)
n.d.
(<0.90)
n.d.
(<0.51)
2 177 n.d.
(<29.0)
390 n.d.*
n.d. – not detected (detection limit in brackets)
n.d.* not detected, extraction was performed with polar solvent which may have resulted in underestimated results

Environment Agency
Report Reference: UC15080.5/17370-0 27th May 2021
© WRc 2021 120
Table D.11 Simplified bromine mass balance
Sample number Initial sample XRF
(ppm Br)
XRF after extraction
(ppm Br)
Extraction efficiency of toluene %
% bromine explained by analysis
Remarks
KM11-D 70,810 - N/A 7% Br content is not explained, lack of sample
KM12-E 10,307 - N/A 64% Br content is largely explained
KM16-A 74,797 58,410 22% 8% Low extraction efficiency
KM17-A 48,393 216 ~ 100% ~ 100% Br content is explained
KM17-B 5,480 3,866 295 20% Low extraction efficiency, extracted bromine is explained
KM20-C 15,053 8,076 46% 2% Medium extraction efficiency, brominated compounds not suitable for GC assumed present
KM22-A 76,630 6 100% ~ 100% Br content explained
KM22-B 65,957 7 100% ~ 100% Br content explained
KM26-D 12,337 11,320 8% 8% Low extraction efficiency, but analytical data fits well
KM37-B 14,303 6,534 54% 16% Medium extraction efficiency, brominated compounds not suitable for GC assumed present
KM40-C 3,297 0.3 100% ~ 100% Br content explained
LC15-B 65,707 - N/A 8% Lack of data
LC22-A 40,733 48 100% ~ 100% Br content explained
LC22D 15,440 13,620 12% 9% Low extraction efficiency, but data fits well
LC26-C 23,750 11,630 51% 12% Br not explained
LC7-D 9,344 - N/A 50% Medium extraction efficiency, lack of some data
LC29-A 47,873 32,370 32% ~ 100% Br content is explained

Environment Agency
Report Reference: UC15080.5/17370-0 27th May 2021
© WRc 2021 121
Sample number Initial sample XRF
(ppm Br)
XRF after extraction
(ppm Br)
Extraction efficiency of toluene %
% bromine explained by analysis
Remarks
LC33-G 40,830 0.5 100% ~ 100% Br content is explained
LC38-C 15,487 15,770 0% 0.2% Low extraction efficiency
LC38-D 14,737 13,910 6% 0.7% Low extraction efficiency
LC44-D 15,467 13,090 15% 7% Low extraction efficiency, but data fits well
CC17-A 54,507 - N/A ~ 100% Br content explained
CC17-B 1,583 73 95% 76% Br content explained
CC8-A 41,517 271 99% ~ 100% Br content explained
CC23-B 7,533 1.4 100% ~ 100% Br content explained
CC23-D 7,533 1.4 100% ~ 100% Br content explained
CC27-B 74,813 9.5 100% ~ 100% Br content explained
CC25-B 58,647 7.2 100% ~ 100% Br content explained
CC4-B 35,263 7 100% ~ 100% Br content explained
CC6-A 52,150 3.6 100% ~ 100% Br content explained
CC11-B 48,790 1.5 100% ~ 100% Br content explained
CC8-H 2,102 54.6 97% ~ 100% Br content explained
CC5-C 10,517 5.8 100% ~ 100% Br content explained
WF2-A 29,217 - N/A ~ 100% Br content explained
WF2-D 14,040 - N/A 16% Br content is generally low
WF6-B 19,997 8,287 59% 14% Br not explained

Environment Agency
Report Reference: UC15080.5/17370-0 27th May 2021
© WRc 2021 122
Sample number Initial sample XRF
(ppm Br)
XRF after extraction
(ppm Br)
Extraction efficiency of toluene %
% bromine explained by analysis
Remarks
WF16-A 51,423 65.7 100% ~ 100% Br content explained
WF16-B 45,053 10.6 100% ~ 100% Br content explained
WF16-C 1,981 5.1 100% ~ 100% Br content explained
WF24-A 42,910 4.9 100% ~ 100% Br content explained
WF9-A 31,647 14.1 100% ~ 100% Br content explained
HH19-A 70,427 58,530 17% 10% Low extraction efficiency
HH19-B 9,045 - N/A 16% Low extraction efficiency, lack of data
HH2-A 66,210 52,730 20% 11% Low extraction efficiency
HH22-A 29,280 18,600 36% 17% Low extraction efficiency
HH32-C 18,493 63.4 100% ~ 100% Br content explained
HH34-C 22,687 39.2 100% 14% Br not explained
HH51-D 78,643 - N/A 0.9% Low extraction efficiency, lack of some data
HH56-A 57,590 3,373 94% ~ 100% Br content explained
HH72-A 104,167 24.3 100% ~ 100% Br content explained

Environment Agency
Report Reference: UC15080.5/17370-0 27th May 2021
© WRc 2021 123
Tier 3 Organophosphorous Flame Retardants
In addition to the HBCDD and PBDE analysis, some of the samples sent for Tier 3 testing were also tested for organo PFRs. Some samples
were shown to have high concentrations of chlorinated PFRs, in-particular Tris(2-chloropropyl) phosphate which is normally present as a
mixture of isomers. The compounds tested for are listed in Table D.7 and the results are presented in Table D.12.
Test Data Comparison
Table D.12 Results of organophosphorous flame retardant analysis
Sample Component
Tris(2-
chlorethyl)
phosphate
(m/z 223)
Tris(2-
chlorpropyl)
phosphate
(m/z 251)
Tri(iso)butyl
phosphate
(m/z 155)
Triphenyl
phosphate
(m/z 152)
Tris(2-
butoxyethyl)
phosphate
(m/z 299)
Diphenyl(ethyl
hexyl)
phosphate
(m/z 251)
Triphenyl
phosphate
(m/z 152)
KM16-A textile cover n.d (<0.25) 1450.4 0.1 158.7 72. 79.1 1.82
KM17-A textile cover n.d (<0.25) 3445.3 0.7 0.3 6.5 0.4 0.26
LC22-A textile cover n.d (<0.25) 261.0 0.3 0.4 17.2 0.1 0.29
LC26-C foam 0.26 103510 0.4 8.8 3.2 49.0 0.28
LC38-C foam n.d (<0.25) 61688 1.2 2.4 15.7 4.0 n.d (<0.25)
CC17-A textile cover 2.2 675.2 0.4 20.4 0.5 5.6 0.4
CC8-A textile cover 17.5 248.0 0.3 0.5 0.2 0.1 0.5
WF2-A Leatherette cover 6.5 2717.4 0.3 9.9 14.6 1.6 1.2
WF6-B foam 3.5 21421 0.4 4.1 13.8 0.7 0.7
HH51-D Foam 0.3 55.3 0.5 0.3 0.1 0.2 0.3
HH19-A lining 0.4 87.1 0.1 49.5 0.8 0.1 0.1
HH22-A Leatherette cover 0.4 1522.7 0.4 13.3 2.7 8.1 0.1
HH32-C Foam 61.5 25.0 0.3 1332. 1.0 0.2 0.8
HH72-A textile cover 1.0 572.6 0.5 2.6 4.6 3.4 0.9

Environment Agency
Report Reference: UC15080.5/17370-0 27th May 2021
© WRc 2021 124

Environment Agency
Report Reference: UC15080.5/17370-0 27th May 2021
© WRc 2021 125
Table D.13 provides a comparison between Tier 1 (XRF – hand-held), Tier 2 (Chemical
screening) and Tier 3 quantitative testing (XRF – WD-XRF). Generally there is a good
comparison between the different tests but some are different particularly foam polymer
samples. Eurofins and Amsterdam report high DecaBDE concentrations in the foams in
comparison to Fraunhofer. Interestingly the XRF data reported for some of these samples is
much lower than the reported decaBDE concentration. Whilst this could be due to poor
representativity in the XRF scanning the WRc XRF scanning on the whole sample and that
undertaken by Fraunhofer on the finely ground sample is comparable, which points to the fact
that the flame retardants are ‘reactive’ rather than ‘additive’. If the flame retardant was present
as a surface coating we would expect the ground whole sample ‘front and back’ to give a lower
XRF reading.
There are some textile cover samples where the XRF value is lower than the decaBDE
concentration reported by all three laboratories at percentage levels. In a couple of instances,
the Fraunhofer XRF is a couple of percentage points higher than the WRc value, but in these
cases they report an over-recovery of bromine i.e. 120% bromine extraction or 150% in some
cases. As Eurofins also report a similar decaBDE value this potentially represents the margin
of error between laboratories.
The available data shows a high level of comparability and therefore we can be confident that
we have shown beyond reasonable doubt that the concentration of POPs in domestic seating
exceeds thresholds although the accuracy of definitive concentrations is subject to some error.
The data does indicate that testing these types of matrices is extremely difficult and application
of standard methods may not be sufficient. Technical expertise in this instance has been used
to overcome initial extraction and precipitation issues to generate a robust dataset to support
regulatory decision making.

Environment Agency
Report Reference: UC15080.5/17370-0 27th May 2021
© WRc 2021 126
Table D.12 Results of organophosphorous flame retardant analysis
Sample Component
Tris(2-
chlorethyl)
phosphate
(m/z 223)
Tris(2-
chlorpropyl)
phosphate
(m/z 251)
Tri(iso)butyl
phosphate
(m/z 155)
Triphenyl
phosphate
(m/z 152)
Tris(2-
butoxyethyl)
phosphate
(m/z 299)
Diphenyl(ethyl
hexyl)
phosphate
(m/z 251)
Triphenyl
phosphate
(m/z 152)
KM16-A textile cover n.d (<0.25) 1450.4 0.1 158.7 72. 79.1 1.82
KM17-A textile cover n.d (<0.25) 3445.3 0.7 0.3 6.5 0.4 0.26
LC22-A textile cover n.d (<0.25) 261.0 0.3 0.4 17.2 0.1 0.29
LC26-C foam 0.26 103510 0.4 8.8 3.2 49.0 0.28
LC38-C foam n.d (<0.25) 61688 1.2 2.4 15.7 4.0 n.d (<0.25)
CC17-A textile cover 2.2 675.2 0.4 20.4 0.5 5.6 0.4
CC8-A textile cover 17.5 248.0 0.3 0.5 0.2 0.1 0.5
WF2-A Leatherette cover 6.5 2717.4 0.3 9.9 14.6 1.6 1.2
WF6-B foam 3.5 21421 0.4 4.1 13.8 0.7 0.7
HH51-D Foam 0.3 55.3 0.5 0.3 0.1 0.2 0.3
HH19-A lining 0.4 87.1 0.1 49.5 0.8 0.1 0.1
HH22-A Leatherette cover 0.4 1522.7 0.4 13.3 2.7 8.1 0.1
HH32-C Foam 61.5 25.0 0.3 1332. 1.0 0.2 0.8
HH72-A textile cover 1.0 572.6 0.5 2.6 4.6 3.4 0.9
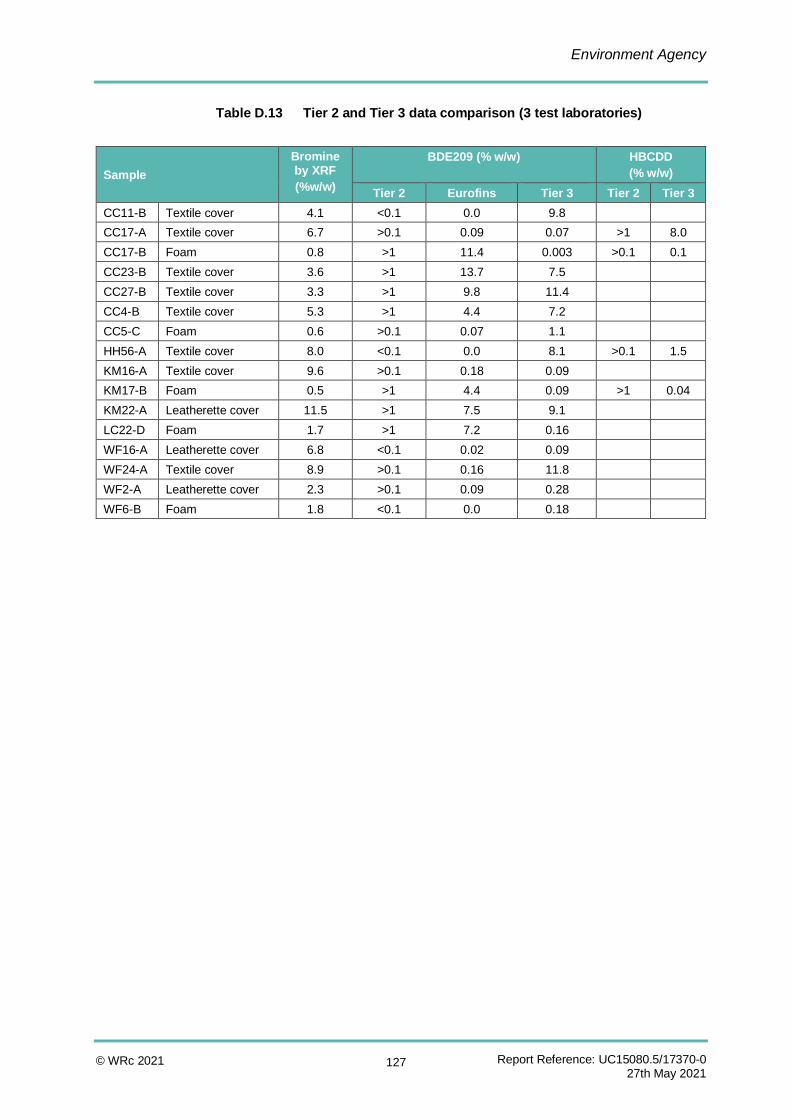
Environment Agency
Report Reference: UC15080.5/17370-0 27th May 2021
© WRc 2021 127
Table D.13 Tier 2 and Tier 3 data comparison (3 test laboratories)
Sample
Bromine by XRF
(%w/w)
BDE209 (% w/w) HBCDD
(% w/w)
Tier 2 Eurofins Tier 3 Tier 2 Tier 3
CC11-B Textile cover 4.1 <0.1 0.0 9.8
CC17-A Textile cover 6.7 >0.1 0.09 0.07 >1 8.0
CC17-B Foam 0.8 >1 11.4 0.003 >0.1 0.1
CC23-B Textile cover 3.6 >1 13.7 7.5
CC27-B Textile cover 3.3 >1 9.8 11.4
CC4-B Textile cover 5.3 >1 4.4 7.2
CC5-C Foam 0.6 >0.1 0.07 1.1
HH56-A Textile cover 8.0 <0.1 0.0 8.1 >0.1 1.5
KM16-A Textile cover 9.6 >0.1 0.18 0.09
KM17-B Foam 0.5 >1 4.4 0.09 >1 0.04
KM22-A Leatherette cover 11.5 >1 7.5 9.1
LC22-D Foam 1.7 >1 7.2 0.16
WF16-A Leatherette cover 6.8 <0.1 0.02 0.09
WF24-A Textile cover 8.9 >0.1 0.16 11.8
WF2-A Leatherette cover 2.3 >0.1 0.09 0.28
WF6-B Foam 1.8 <0.1 0.0 0.18

Environment Agency
Report Reference: UC15080.5/17370-0 27th May 2021
© WRc 2021 128
Appendix E Brominated Flame Retardant and Brominated POPs Tonnages in Waste Domestic Seating
Based on the results of the XRF and further chemical testing, the amount of BFRs and POPs-
classified BFRs per 100,000 tonnes of waste domestic seating can be estimated.
The sampling data provides a good estimation of the flows of the different types of waste
domestic seating in the UK. During the site sampling campaign all available domestic seating
items were tested and so this provides a good basis to use as an estimation of the proportions
of sofas, armchairs etc. in the waste stream.
Table E.1 Estimated proportions of domestic seating categories in the UK waste
stream
Domestic
seating category
Number
sampled
Average
weight of items
(kg)
Estimated total
weight of items
sampled (kg)
Estimated mass
proportion of
waste stream
(%)
Sofas 156 70 10,920 81%
Armchairs 65 30 1,920 14%
Office chairs 17 10 170 1%
Dining chairs 24 10 250 2%
Other 15 20 300 2%
Using the data in Table E.1 and the compositional data for each of the categories combined
with the XRF and Tier 3 chemical testing data, the tonnages of BFRs and POPs-classified BFRs
in domestic seating can be estimated.
To determine the tonnages of the BFRs, the tonnages of each of the components for each
domestic seating category were estimated using the typical or average compositional data. This
was then multiplied by the average bromine concentration for each component. Assuming all
the bromine was present as flame retardants, the bromine weight was converted to the weight
of decaBDE based on its relative molecular mass. This value was the estimated amount of
BFRs in domestic seating.
Using the Tier 3 chemical testing data, the amount of POPs-classified BFRs in the waste stream
was estimated by multiplying the estimated amount of BFRs by the proportion of the samples
tested for each component which were found to contain POPs over 1%. This assumes that all

Environment Agency
Report Reference: UC15080.5/17370-0 27th May 2021
© WRc 2021 129
the bromine in those samples were POPs-classified and no other brominated compounds were
present. A minimum estimation was made using the Tier 3 > 1% proportions for each of the
individual components for each domestic seating category, whereas a maximum estimation
was made using the maximum proportion which was determined for the components across all
categories.
The results of the calculations are shown in Table E.2 and show that there are an estimated
520 tonnes of BFRs present per 100,000 tonnes of waste domestic seating. Out of those 520
tonnes, between 364 and 476 tonnes are estimated to be POPs-classified.
The table shows that the textile covers from sofas account for 87% of the estimated POPs in
the waste stream and when combined with textile covers from armchairs they account for 93%
of the POPs. Despite some leatherette covers being found to contain POPs, a smaller
proportion of the leatherette covers were found to contain bromine than the textile covers and
so they account for only about 4% of the estimated POPs presence in the waste stream. The
typically low bromine contents found in leather covers means that leather covers are not thought
to contribute to the total POPs content in the domestic seating waste stream.

Environment Agency
Report Reference: UC15080.5/17370-0 27th May 2021
© WRc 2021 130
Table E.2 Estimated tonnes of POPs classified brominated flame retardants per 100,000 tonnes of waste domestic seating
(WDS)
Domestic seating category
Estimated tonnes of component per
100,000 tonnes of WDS
Average bromine concentration
determined by XRF (g/tonne)
Estimated tonnes of BFRs per
100,000 tonnes of WDS
% estimated as POPs
Estimated tonnes of POPs-classified BFRs per 100,000
tonnes of WDS (minimum)
Estimated tonnes of POPs-classified BFRs per 100,000
tonnes of WDS (maximum)
Sofas
Textile covers 10,064 32,672 395 81% 320 395
Leatherette covers 2,681 12,665 41 25% 10 41
Leather covers 3,063 774 3 0% 0 0
Wadding 1,611 354 0.7 17% 0.1 0.2
Foam 20,133 2,028 49 17% 8 12
Lining 644 1,591 1 0% 0 0.6
Armchairs
Textile covers 621 28,388 21 100% 21 21
Leatherette covers 177 8,845 2 100% 2 2
Leather covers 427 58 0.03 0% 0 0
Wadding 283 86 0.03 25% 0.01 0.01
Foam 1,558 1,404 3 25% 0.7 0.7
Lining 57 856 0.1 50% 0.03 0.03
Office chairs
Textile covers 23 135 0 0% 0 0
Leatherette covers 21 452 0.01 0% 0 0.01
Leather covers 4 36 0 0% 0 0
Wadding 3 7 0 0% 0 0
Foam 38 1,239 0.1 0% 0 0.01
Lining 4 2,083 0.01 0% 0 0

Environment Agency
Report Reference: UC15080.5/17370-0 27th May 2021
© WRc 2021 131
Domestic seating category
Estimated tonnes of component per
100,000 tonnes of WDS
Average bromine concentration
determined by XRF (g/tonne)
Estimated tonnes of BFRs per
100,000 tonnes of WDS
% estimated as POPs
Estimated tonnes of POPs-classified BFRs per 100,000
tonnes of WDS (minimum)
Estimated tonnes of POPs-classified BFRs per 100,000
tonnes of WDS (maximum)
Dining chairs
Textile covers 62 12,351 0.9 100% 0.9 0.9
Leatherette covers 54 2,364 0.2 100% 0.2 0.2
Leather covers 33 289 0.01 0% 0 0
Wadding 18 183 0 0% 0 0
Foam 74 1,255 0.1 0% 0 0.03
Lining 7 494 0 0% 0 0
Others
Textile covers 113 15,815 2 50% 1 2
Leatherette covers 20 19 0 0% 0 0
Leather covers 12 0 0 0% 0 0
Wadding 44 107 0 0% 0 0
Foam 553 436 0.3 0% 0 0.1
Lining 18 270 0 0% 0 0
Total 520 364 476
Related Documents