An article on peanut butter reported the following scores (quality ratings on a scale of 0 to 100) for various brands. Construct a comparative stem-and-leaf plot and compare the graphs. Creamy:56446236395350 65454056 684130 4050563022 Crunchy:62537542474034 62525034 423675 80475662

An article on peanut butter reported the following scores (quality ratings on a scale of 0 to 100) for various brands. Construct a comparative stem-and-leaf.
Dec 14, 2015
Welcome message from author
This document is posted to help you gain knowledge. Please leave a comment to let me know what you think about it! Share it to your friends and learn new things together.
Transcript

An article on peanut butter reported the following scores (quality ratings on a scale of 0 to 100) for various brands. Construct a comparative stem-and-leaf plot and compare the graphs.
Creamy: 56 44 62 36 39 53 5065 45 40 56 68 41
30 40 50 56 30 22
Crunchy: 62 53 75 42 47 40 3462 52 50 34 42 36
75 80 47 56 62

Creamy: 56 44 62 36 39 53 5065 45 40 56 68 41 3040 50 56 30 22
Crunchy: 62 53 75 42 47 40 3462 52 50 34 42 36 7580 47 56 62
Center: The center of the creamy is roughly 45 whereas the center for crunchy is higher at 51.Shape: Both are unimodal but crunchy is skewed to the right while creamy is more symmetric.Spread: The range for creamy and crunchy are equal at. There doesn’t seem to be any gaps in the distribution.

Variation

Which Brand of Paint is better? Why?
Brand A
10
60
50
30
40
20
Brand B
35
45
30
35
40
25
Standard Deviation
It’s a measure of the typical or average deviation (difference) from the mean.
Variance
This is the average of the squared distance from the mean.

Which Brand of Paint is better? Why?
Brand A
10
60
50
30
40
20
Brand B
35
45
30
35
40
25
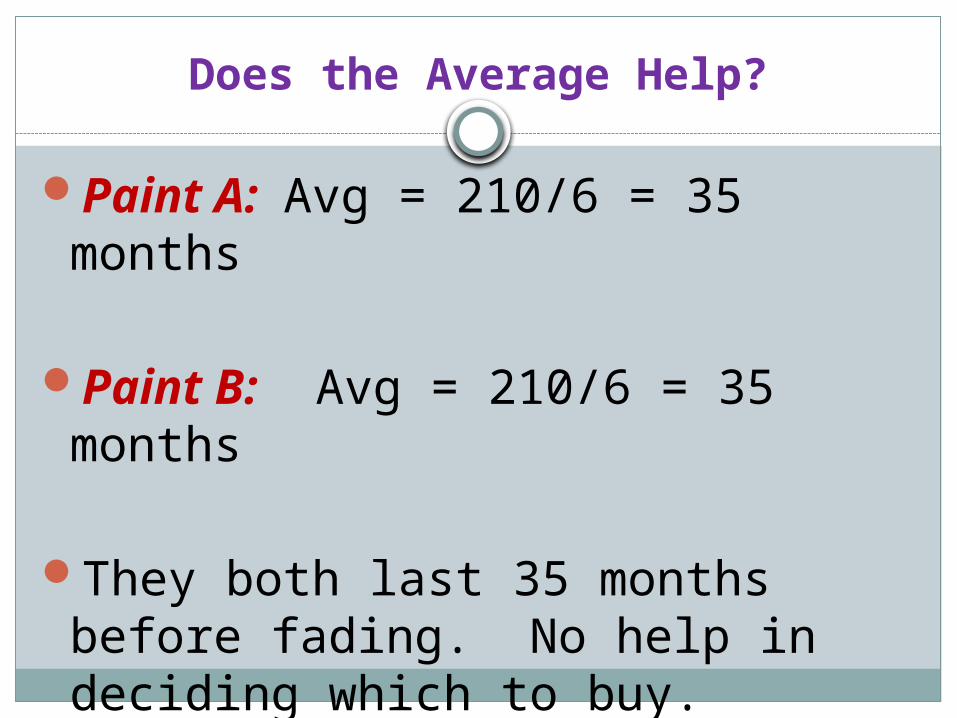
Does the Average Help?
Paint A: Avg = 210/6 = 35 months
Paint B: Avg = 210/6 = 35 months
They both last 35 months before fading. No help in deciding which to buy.

Consider the Spread
Paint A: Spread = 60 – 10 = 50 months
Paint B: Spread = 45 – 25 = 20 months
Paint B has a smaller variance which means that it performs more consistently. Choose paint B.
Formula for Population
Variance =
Standard Deviation =

Formula for Sample
Variance =
Standard Deviation =
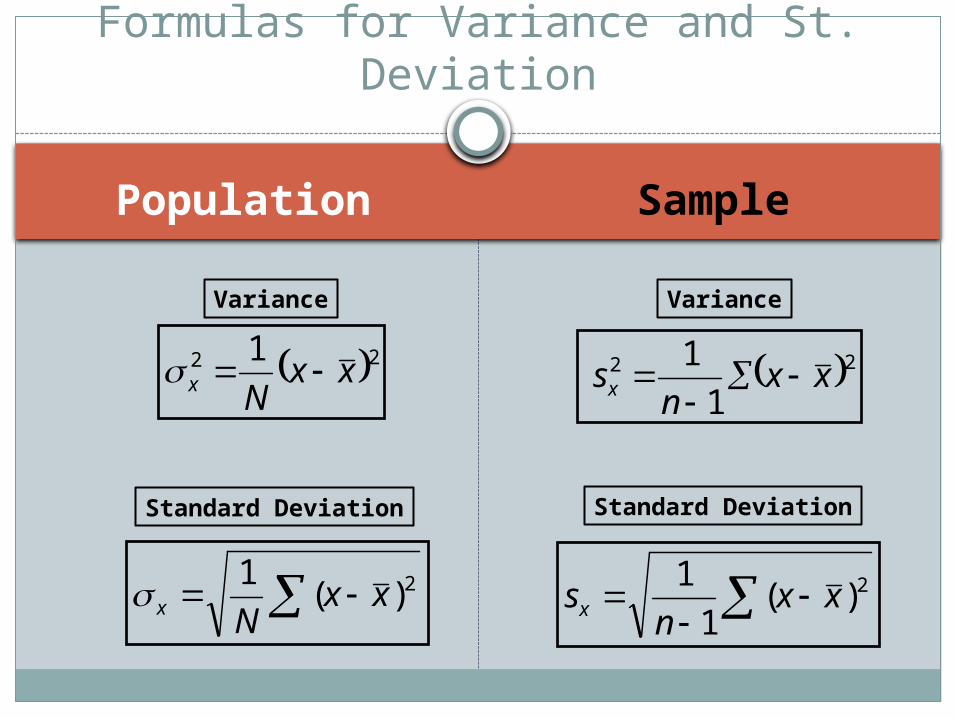
Formulas for Variance and St. Deviation
Population Sample
22 1xx
Nx
2)(1
xxNx
Variance
Standard Deviation
22
1
1 xx
nsx
2)(1
1xx
nsx
Variance
Standard Deviation
Standard Deviation
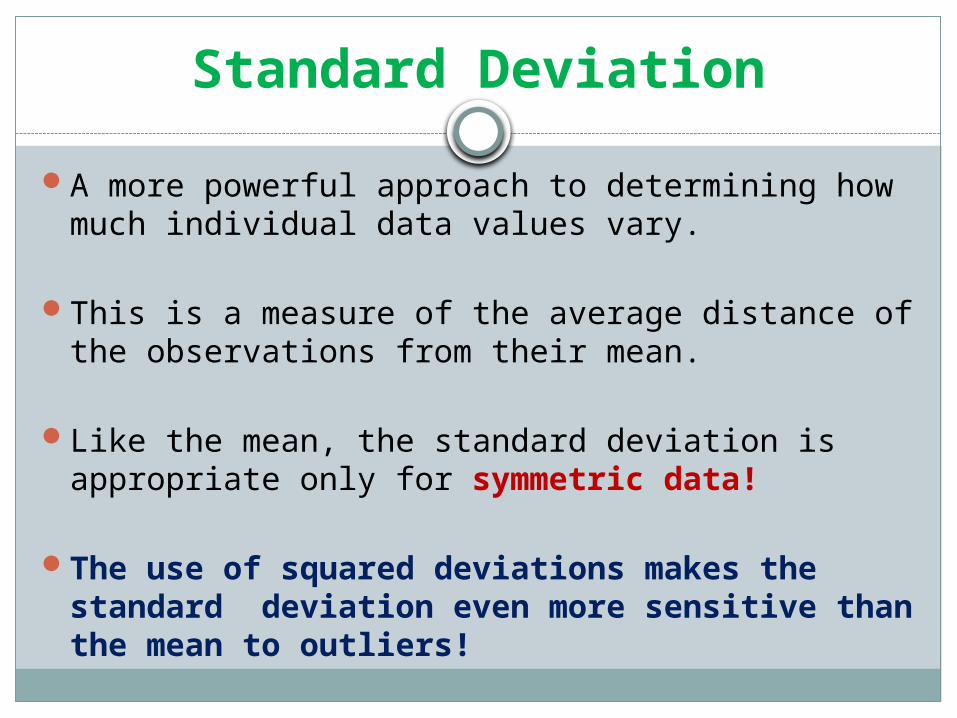
A more powerful approach to determining how much individual data values vary.
This is a measure of the average distance of the observations from their mean.
Like the mean, the standard deviation is appropriate only for symmetric data!
The use of squared deviations makes the standard deviation even more sensitive than the mean to outliers!

Standard Deviation
One way to think about spread is to examine how far each data value is from the mean.
This difference is called a deviation.
We could just average the deviations, but the positive and negative differences always cancel each other out! So, the average deviation is always 0 not very helpful!

Finding Variance
To keep them from canceling out, we square each deviation.
Squaring always gives a positive value, so the sum will not be zero!
Squaring also emphasizes larger differences – a feature that turns out to be good and bad.
When we add up these squared deviations and find their average (almost), we call the result the variance.

Finding Standard Deviation
This is the average of the squared distance from the mean.
Variance will play an important role later – but it has a problem as a measure of spread.
Whatever the units of the original data are, the variance is in squared units – we want measures of spread to have the same units as the data, so to get back to the original units, we take the square root of .
The result is, s, is the standard deviation.
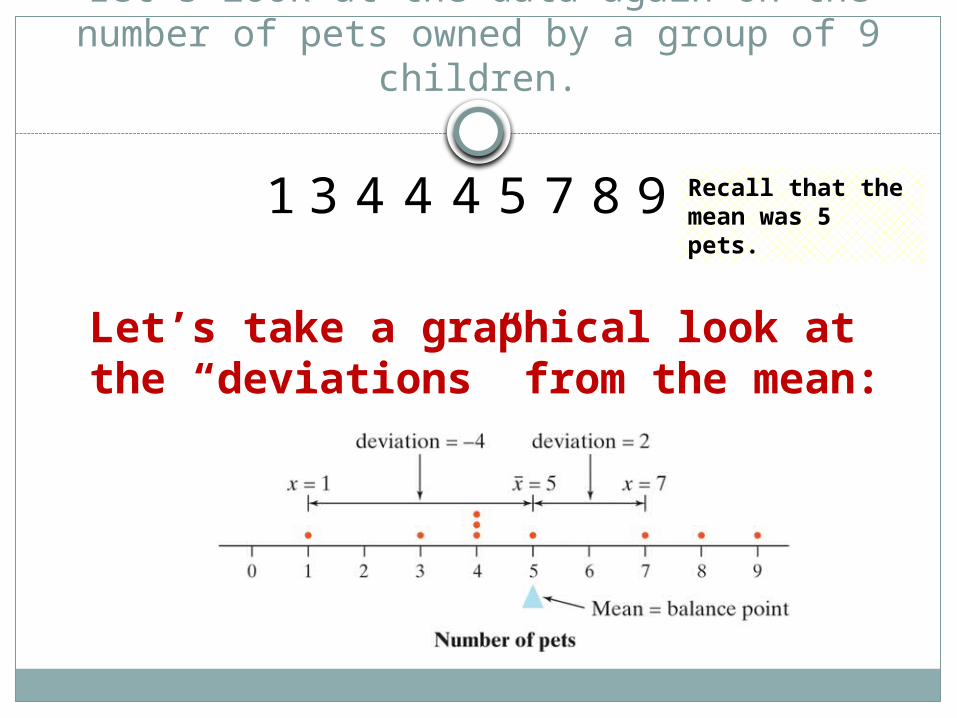
Let’s look at the data again on the number of pets owned by a group of 9 children.
987544431 Recall that the mean was 5 pets.
Let’s take a graphical look at the “deviations” from the mean:

Let’s Find the Standard Deviation and Variance of the Data Set of Pets 987544431
Petsx
Deviations Squared Deviations
1
3
4
4
4
5
7
8
9
Sum = Sum = 16
5Mean
1 – 5 = -4
3 – 5 = -2
4 – 5 = -1
4 – 5 = -1
4 – 5 = -1
5 – 5 = 0 7 – 5 = 2
8 – 5 = 3
9 – 5 = 4
164 2
42 2
11 2
11 2 11 2
422
932
1642
0
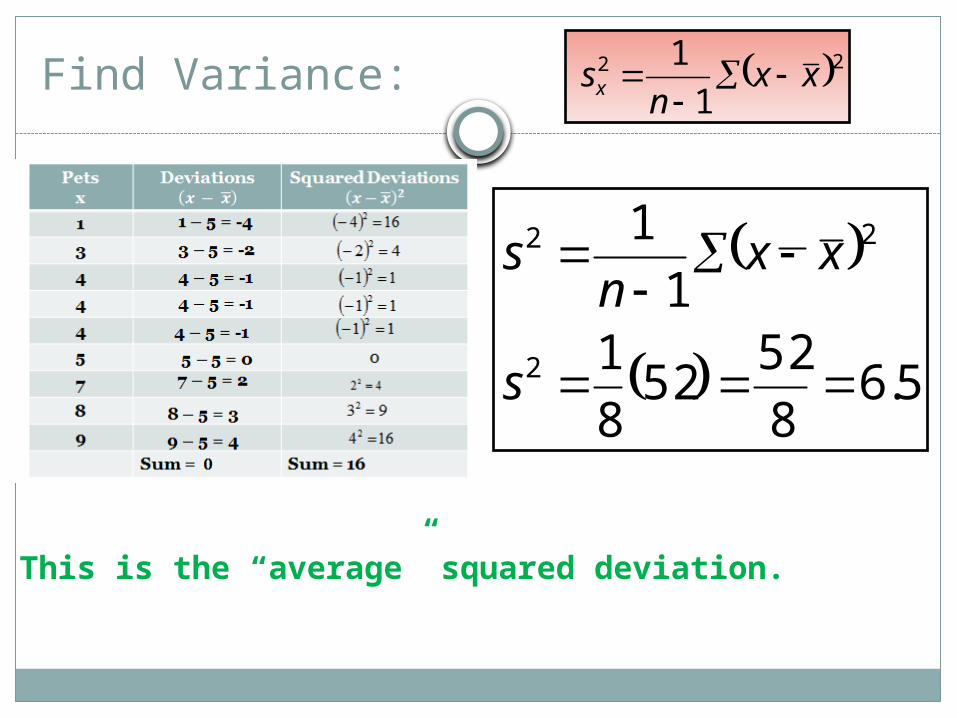
Find Variance:
5.68
5252
8
11
1
2
22
s
xxn
s
This is the “average” squared deviation.
22
1
1 xx
nsx

Find the Standard Deviation:
This 2.55 is roughly the average distance of the values in the data set from the mean.
2)(1
1 xx
nsx
55.25.62 ss
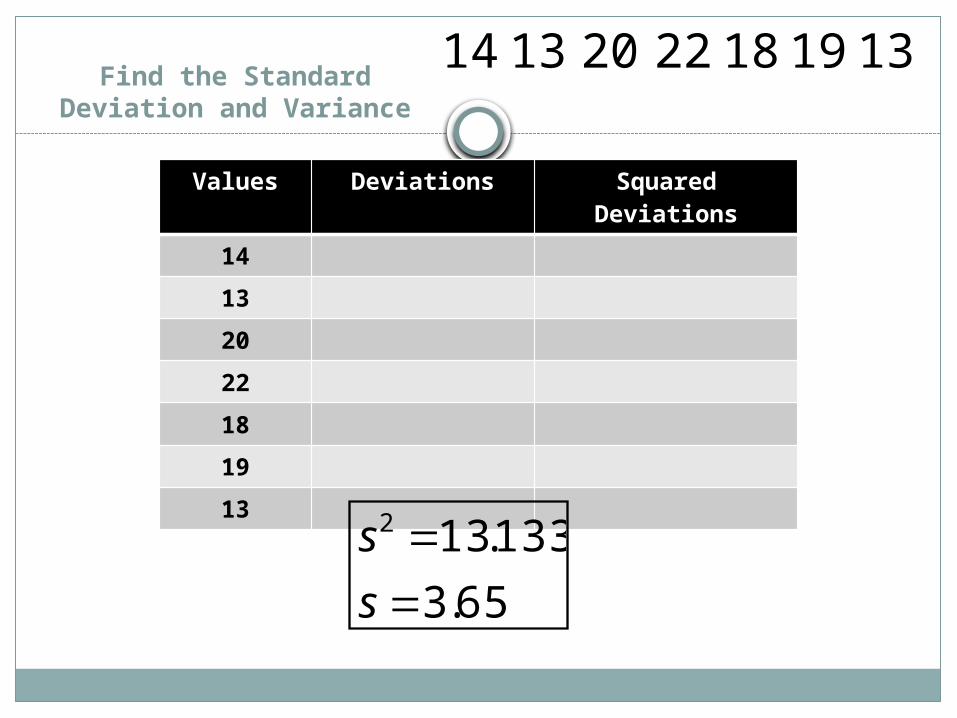
Find the Standard Deviation and Variance
13191822201314
Values Deviations Squared Deviations
14
13
20
22
18
19
13
65.3
133.132
s
s

Homework
Worksheet
Related Documents