Turkish Journal of Electrical Engineering and Computer Sciences Turkish Journal of Electrical Engineering and Computer Sciences Volume 30 Number 1 Article 9 1-1-2022 An approach for performance prediction of saturated brushed An approach for performance prediction of saturated brushed permanent magnetdirect current (DC) motor from physical permanent magnetdirect current (DC) motor from physical dimensions dimensions RASUL TARVIRDILU REZA ZEINALI HULUSİ BÜLENT ERTAN Follow this and additional works at: https://dctubitak.researchcommons.org/elektrik Part of the Computer Engineering Commons, Computer Sciences Commons, and the Electrical and Computer Engineering Commons Recommended Citation Recommended Citation TARVIRDILU, RASUL; ZEINALI, REZA; and ERTAN, HULUSİ BÜLENT (2022) "An approach for performance prediction of saturated brushed permanent magnetdirect current (DC) motor from physical dimensions," Turkish Journal of Electrical Engineering and Computer Sciences: Vol. 30: No. 1, Article 9. https://doi.org/ 10.3906/elk-2008-10 Available at: https://dctubitak.researchcommons.org/elektrik/vol30/iss1/9 This Article is brought to you for free and open access by TÜBİTAK Academic Journals. It has been accepted for inclusion in Turkish Journal of Electrical Engineering and Computer Sciences by an authorized editor of TÜBİTAK Academic Journals.

Welcome message from author
This document is posted to help you gain knowledge. Please leave a comment to let me know what you think about it! Share it to your friends and learn new things together.
Transcript
Turkish Journal of Electrical Engineering and Computer Sciences Turkish Journal of Electrical Engineering and Computer Sciences
Volume 30 Number 1 Article 9
1-1-2022
An approach for performance prediction of saturated brushed An approach for performance prediction of saturated brushed
permanent magnetdirect current (DC) motor from physical permanent magnetdirect current (DC) motor from physical
dimensions dimensions
RASUL TARVIRDILU
REZA ZEINALI
HULUSİ BÜLENT ERTAN
Follow this and additional works at: https://dctubitak.researchcommons.org/elektrik
Part of the Computer Engineering Commons, Computer Sciences Commons, and the Electrical and
Computer Engineering Commons
Recommended Citation Recommended Citation TARVIRDILU, RASUL; ZEINALI, REZA; and ERTAN, HULUSİ BÜLENT (2022) "An approach for performance prediction of saturated brushed permanent magnetdirect current (DC) motor from physical dimensions," Turkish Journal of Electrical Engineering and Computer Sciences: Vol. 30: No. 1, Article 9. https://doi.org/10.3906/elk-2008-10 Available at: https://dctubitak.researchcommons.org/elektrik/vol30/iss1/9
This Article is brought to you for free and open access by TÜBİTAK Academic Journals. It has been accepted for inclusion in Turkish Journal of Electrical Engineering and Computer Sciences by an authorized editor of TÜBİTAK Academic Journals.
Turk J Elec Eng & Comp Sci(2022) 30: 127 – 139© TÜBİTAKdoi:10.3906/elk-2008-10
Turkish Journal of Electrical Engineering & Computer Sciences
http :// journa l s . tub i tak .gov . t r/e lektr ik/
Research Article
An approach for performance prediction of saturated brushed permanent magnetdirect current (DC) motor from physical dimensions
Rasul Tarvirdilu–Asl1, Reza Zeinali2, Hulusi Bulent Ertan3,∗1Canada Excellence Center, McMaster University, Ontario, Canada
2Department of Electrical Engineering, Eindhoven University of Technology, Eindhoven, The Netherlands3Mechatronics Engineering Department, Atılım University, Ankara, Turkey
Received: 04.08.2020 • Accepted/Published Online: 20.01.2021 • Final Version: 19.01.2022
Abstract: An analytical approach for performance prediction of saturated brushed permanent magnet direct current(DC) motors is proposed in this paper. In case of a heavy saturation in the stator back core of electrical machines, someflux completes its path through the surrounding air, and the conventional equivalent circuit cannot be used anymore.This issue has not been addressed in the literature. The importance of considering the effect of the flux penetratingthe surrounding air is shown in this paper using finite element simulations and experimental results, and an analyticalapproach is proposed to consider this effect on magnet operating point determination and performance prediction ofsaturated brushed permanent magnet DC motors. An analytical method is also presented to determine the boundaryradius of the surrounding air for obtaining accurate results in finite element (FE) solutions and analytical calculations.An analytical approach based on Carter’s coefficient is also proposed to calculate the effective length of the magnet whenthe length of the magnet and rotor length are not the same. The accuracy of the proposed analytical model is illustratedusing finite element simulations and experimental results. With this accuracy, this analytical model is very suitable tobe used for reliable and quick mathematical design optimization.
Key words: Analytical modeling, finite element simulations, magnet operating point, permanent magnet brushed DCmotor
1. IntroductionDespite the great competition from other types of motors such as switched reluctance and brushless permanentmagnet motors, brushed permanent magnet direct current (DC) motors are still dominant in low power andcost-sensitive applications. These motors are used in many automotive applications, including electro-hydraulicsystems [1]. Cheaper production cost and lower fabrication time are some of the advantages offered by permanentmagnet direct current (PMDC) motors with brushes. DC machines with wound field windings are also popularin the industry. Weight optimization of brush-type DC machines with wound field excitation is aimed at [2] and[3]. However, permanent magnet excitation is dominant for the reasons discussed in [4]. With the availability ofcheaper permanent magnets, the wound field in DC machines is often replaced with permanent magnets, makingthis type of motor very popular in many applications. As a consequence, although their design methodology iswell studied, there is still considerable research on this type of motor [4–6, 12]. Accurate analysis and designoptimization are naturally of much interest.∗Correspondence: [email protected]
This work is licensed under a Creative Commons Attribution 4.0 International License.127
Tarvirdilu–Asl et al./Turk J Elec Eng & Comp Sci
Finite element method (FEM) is implemented in lots of research conducted on design, weight, and costoptimizations of electrical machines [7–10]. The design of PM machines using the finite element method isaimed at [11]. A significant reduction in weight and volume of the motor is attained using the finite elementmethod in [13], based on using a new magnetic material. FEM-based geometry modifications are proposedin [13] to reduce acoustic noise and cogging torque in a brushed PMDC motor, to be used in the automotivecooling system application. However, using a pure FEM-based study can be tedious and time-consuming dueto the huge number of iterations required in solving the optimization problem. On the other hand, a preciseanalytical model can give a thorough insight into the problem and reduce the optimization time greatly.
Combining FEM and analytical model can also be utilized for design optimization purposes, which mergesthe accuracy of the finite element method with the rapidity of analytical calculations [9]. In some cases, analyticalmodels can be improved by employing finite element method results or measurements [14, 15]. Flux and fluxdensity distribution and motor parameters including winding inductances can be computed using FEM, andused in analytical models to predict motor performance using analytical equations [16].
An accurate analytical model of a DC motor can be used for performance calculation, current control[17], speed control [18–21], and for design and optimization purposes [14]. Determination of the air gapflux is an important task. A linear magnetic circuit is assumed in some studies [22–24], which reduces thecomplexity of taking nonlinearities into account. However, the accuracy of the obtained solution will be lowin such an approach. Some other methods have also been proposed in the literature to calculate the magneticflux distribution. For example, in [25], analytic magnetic field solution is obtained with certain simplifyingassumptions, by solving Laplacian/quasi–Poissonian magnetic field equations to determine the magnetic fluxdistribution in the air gap region of a permanent magnet brushed DC motor. In another study, Maxwellequations in two-dimensional space are used to develop an analytical model for the determination of no–loadflux in a brushed PMDC motor [15].
Avoiding magnetic saturation in core material may be a crucial step in improving the performance ofelectrical machines; however, it may not be always possible due to manufacturing constraints. It is noticeablethat, in heavy saturation conditions, some flux completes its path through the surrounding air instead of themotor’s magnetic circuit, and the general magnetic equivalent circuit cannot be used to calculate DC motorperformance. This issue is discussed by several authors in the literature [26–28] The papers mentioned above donot take into account the effect of the flux which leaks out of the stator frame and completes its path throughthe surrounding air. However, an accurate analytical model which considers saturation effects can acceleratethe design calculations and offers a very handy tool to design engineers.
The difference in magnet, stator, and rotor lengths in PM brushed DC motors increases the complexityof analytical modeling and calculations of the machine, because, in the determination of the magnet operatingpoint, effective magnet length has to be taken into account. [29] investigates the effects of magnet length in ACmachines. In this paper, we also present an analytical solution to this problem.
The main contributions of this paper are summarized as follows; first, an analytical approach is proposedto consider the effect of the flux completing its path through the surrounding air in magnet operating pointdetermination and performance prediction of saturated brushed PMDC motors. This approach can be furthergeneralized to be used for any saturated electric machine. Second, an analytical method is developed toestimate the boundary radius of the surrounding air for obtaining accurate results in FE solutions and analyticalcalculations.
In this paper, in section 2, the steady-state equivalent circuit, calculation of induced emf, and armature
128

Tarvirdilu–Asl et al./Turk J Elec Eng & Comp Sci
resistance of a PM brushed DC motor and prediction of its steady-state performance are discussed. Section3 involves the calculation of the magnet operating point while taking into account the effective length of themagnet (due to the difference between magnet and rotor axial lengths) and the flux leaking to the surroundingair under heavy saturation conditions. A method is also proposed to determine the magnetomotive force(MMF) drop on the stator back core for this case. Finally, in Sections 4 and 5, analytically calculated resultsare compared with measurements and finite element simulation results of a test PMDC motor to verify theaccuracy of the proposed analytical methods.
2. Prediction of steady-state performanceThe circuit model for prediction of the steady-state performance of a brushed DC motor is well established.This model requires the induced armature electromotive force (emf) and the armature resistance values forpredicting the motor speed and efficiency at a certain terminal voltage. Therefore, at the design stage, theproblem is that of calculation of armature resistance and the induced emf on the armature windings at a givenspeed, using the information available for the geometry of the magnetic circuit and material properties. It isknown that the induced emf, Ea , can be calculated from equation (1).
Ea = kφpωm = pZa
2πa× Bav × πDi
p× L × ωm (1)
where, k is the motor constant. φp and ωm are the pole flux in Wb and mechanical speed in rad/sec respectively.Pole number of the PMDC motor is shown by p . Za , a , Bav , and Di are the number of conductors of armaturewinding, number of parallel paths in the winding, air gap mean flux density, and inner diameter of the stator,respectively. L stands for rotor core axial length.
The armature resistance calculation from the physical dimensions is quite straightforward. The cross-section of a typical PM brushed DC motor is shown in Figure 1a. Suppose that there are Sa slots on thearmature and each slot has Zas conductors, and there are “a” parallel paths.
Assuming that the dimensions of the motor and the wire material are known, the resistance of one of theparalleled coils can be calculated using equation (2).
Rcoil = ρLcoil
Awire= ρ
Ncoil × 2 × (L + Lend) + Lwcπd2
c4
(2)
In this equation, the copper resistivity is shown by ρ . Lcoil , Awire , and Ncoil are total length of wire inone coil, wire cross-sectional area, and number of turns per coil, respectively. Lend is the end winding length,which also includes coil end extension, and dc is the wire diameter. Lwc stands for coil to commutator barconnection (see Figure 1b). The resistance seen at the armature terminals is as given in equation (3)
Ra = Rbrush + NactiveRcoil
a(3)
where a is the number of parallel paths and Nactive is the number of active coils taking into account the coilsshorted by the brushes. Rbrush stands for the brush resistance.
The difficulty in establishing the equivalent circuit of a given motor stems from the difficulty associatedwith predicting the value of induced armature emf. More precisely, from the difficulty of calculating flux per
129

Tarvirdilu–Asl et al./Turk J Elec Eng & Comp Sci
pole accurately for a given magnet shape and taking saturation into account in the magnetic circuit, in case itexists. The following section addresses this problem and introduces a new approach for accurate calculation ofthe pole flux.
Air region
Stator back-core (frame)
Magnet
Rotor Tooth
Rotorback-core
Leaking pole flux
Boundary for FEM
solution (A=0)End winding
a b
Figure 1. (a) Cross section of the test motor and flux leaking to the surrounding air. (b) Rotor and winding configurationof the test motor.
3. Calculation of flux per poleMost commercial motors have some saturation in their magnetic circuit. Unless this is taken into account, theinduced emf cannot be well predicted, and the performance of the motor cannot be accurately determined. Afurther difficulty arises if the magnet axial length and the core length are not identical (see Figure 2).
3.1. Effective axial length of magnetAs shown in Figure 2 the magnet axial length may not be the same as rotor core axial length.
Stator
Magnet
RotorL
Magnet
Stator
0.5(Lstator-Lrotor)
0.5(Lmagnet-Lrotor)
Magnet axiallenght
Rotor corelength
Symmetry axis
Lmagnet
Lrotor
a b c
g
Figure 2. (a) Cross section of the test motor and flux leaking to the surrounding air. (b) Rotor and winding configurationof the test motor. (c) Motor and its mirror image (axial view) for calculation of effective core length using Carter’scoefficient.
The calculation of pole flux created by the magnet depends on what the effective axial length of themagnet is. Magnetic flux density distribution inside the magnet obtained using 3–D finite element simulationsis shown in Figure 2b. It is observed that the flux density distribution inside the magnet is not uniform and
130

Tarvirdilu–Asl et al./Turk J Elec Eng & Comp Sci
the flux density is reduced towards the magnet edges in the axial direction. Therefore, an effective length ofthe magnet needs to be defined.
To estimate the effective axial length of the magnet, the model shown in Figure 2c is used. This modelis created by placing mirror image of the axial view of a PM motor (The mirror image is distinguished by itsdarker colour in this figure). Considering the geometry in Figure 2c, Carter’s coefficient (cs ) can be calculatedfrom equation (4) [30, 31]. The effective length of the magnet can then be calculated by dividing the magnetlength of the PMDC motor to the calculated Carter’s coefficient.
Cs = Lmagnet
Lrotor + 4gπ ln
(1 + π(Lmagnet−Lrotor)
4g
) (4)
The accuracy of this approach is very good, as can be followed from Table 1, where the analyticallycalculated air gap flux density and FE results are given for a test motor (both with and without outer airregion), using the approach descried above. This table also compares FEM obtained values with the analyticallycalculated rotor tooth flux density and stator back core flux density, under open circuit condition. The errorbetween the analytical calculation and FEM calculations are also presented in the table. Column 3 is the errorbetween FEM and analytical calculation without the outer air region. Column 6 presents the error betweenanalytical and FEM predictions when the outer air region is considered. Finally, the last column presents theerror in FEM calculations with and without considering the outer region. This last column indicates that whenthe outer air region flux is considerable, it needs to be included in the predictions for good accuracy. Theanalytical air gap flux density calculation procedure is explained in section 3.2.
Table 1. Analytically calculated flux density levels calculated using Carter’s coefficient and FEM simulations results(with and without considering the outer air region)
Without consideringthe outer air region
Consideringthe outer air region
Difference between FE results with and withoutconsidering the outer air region (%)
Analytical FEM Error (%) Analytical FEMWith outer air regionError between analyticand FEM (%)
Error between FEM withand without outer airregion (%)
Magnet fluxdensity (mean)
0.27 0.266 1.5 0.284 0.278 2.16 4.5
Air gap fluxdensity (mean)
0.29 0.281 3.2 0.31 0.303 2.31 7.8
Tooth fluxdensity (mean)
1.46 1.4 4.2 1.55 1.58 1.9 12.9
Statorback-core fluxdensity (peak)
2.35 2.37 0.84 2.25 2.20 2.27 7.2
3.2. Calculation of magnet operating point
For the calculation of the open circuit induced emf on the armature winding, the only unknown parameter inequation (1) is the mean flux density in the air gap (Bav ). To determine Bav , the operating point of the magnetmust be found. The magnet operating point is defined as the intersection point of magnet recoil line and load
131
Tarvirdilu–Asl et al./Turk J Elec Eng & Comp Sci
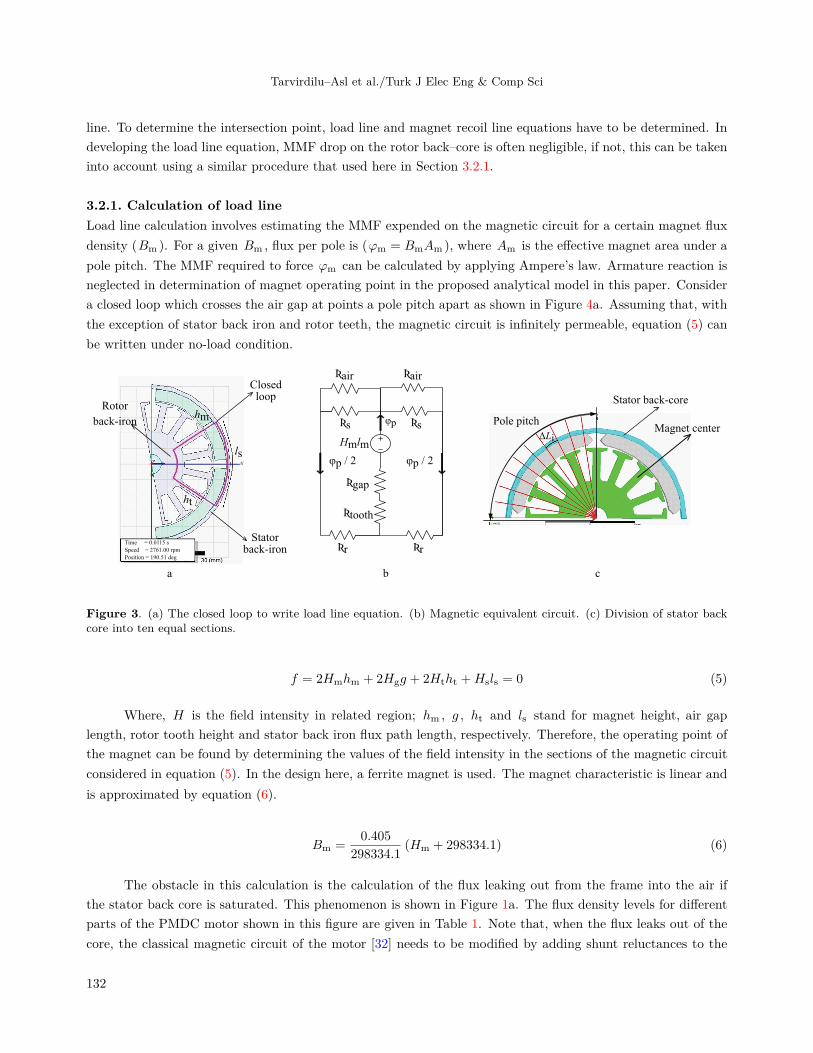
line. To determine the intersection point, load line and magnet recoil line equations have to be determined. Indeveloping the load line equation, MMF drop on the rotor back–core is often negligible, if not, this can be takeninto account using a similar procedure that used here in Section 3.2.1.
3.2.1. Calculation of load lineLoad line calculation involves estimating the MMF expended on the magnetic circuit for a certain magnet fluxdensity (Bm ). For a given Bm , flux per pole is (φm = BmAm ), where Am is the effective magnet area under apole pitch. The MMF required to force φm can be calculated by applying Ampere’s law. Armature reaction isneglected in determination of magnet operating point in the proposed analytical model in this paper. Considera closed loop which crosses the air gap at points a pole pitch apart as shown in Figure 4a. Assuming that, withthe exception of stator back iron and rotor teeth, the magnetic circuit is infinitely permeable, equation (5) canbe written under no-load condition.
Time = 0.0115 s
Speed = 2761.00 rpm
Position = 190.51 deg
g
Y
Rotor
back-iron
Closedloop
Statorback-iron
Ʀair Ʀair
Ʀs Ʀs
Hmlm
φp / 2 φp / 2
Ʀgap
Ʀtooth
ƦrƦr
φp
ΔLi
Pole pitch
Stator back-core
Magnet center
a b c
ht
ls
hm
Figure 3. (a) The closed loop to write load line equation. (b) Magnetic equivalent circuit. (c) Division of stator backcore into ten equal sections.
f = 2Hmhm + 2Hgg + 2Htht + Hsls = 0 (5)
Where, H is the field intensity in related region; hm , g , ht and ls stand for magnet height, air gaplength, rotor tooth height and stator back iron flux path length, respectively. Therefore, the operating point ofthe magnet can be found by determining the values of the field intensity in the sections of the magnetic circuitconsidered in equation (5). In the design here, a ferrite magnet is used. The magnet characteristic is linear andis approximated by equation (6).
Bm = 0.405298334.1
(Hm + 298334.1) (6)
The obstacle in this calculation is the calculation of the flux leaking out from the frame into the air ifthe stator back core is saturated. This phenomenon is shown in Figure 1a. The flux density levels for differentparts of the PMDC motor shown in this figure are given in Table 1. Note that, when the flux leaks out of thecore, the classical magnetic circuit of the motor [32] needs to be modified by adding shunt reluctances to the
132
Tarvirdilu–Asl et al./Turk J Elec Eng & Comp Sci
flux paths of the flux in the stator back iron. The modified equivalent magnetic circuit is depicted in Figure3b. In this figure reluctance Rair represents the air region reluctance outside the stator, through which leakageflux flows. Estimation of the value of the leakage flux path reluctance is discussed in the following section.
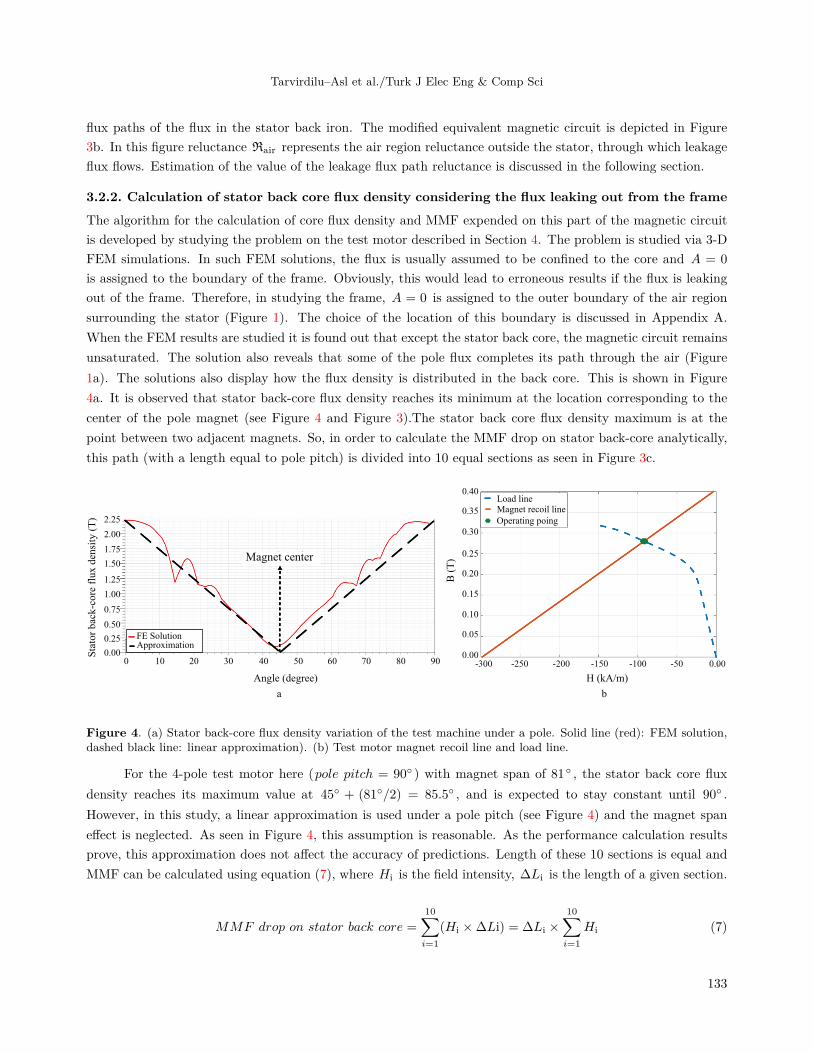
3.2.2. Calculation of stator back core flux density considering the flux leaking out from the frameThe algorithm for the calculation of core flux density and MMF expended on this part of the magnetic circuitis developed by studying the problem on the test motor described in Section 4. The problem is studied via 3-DFEM simulations. In such FEM solutions, the flux is usually assumed to be confined to the core and A = 0is assigned to the boundary of the frame. Obviously, this would lead to erroneous results if the flux is leakingout of the frame. Therefore, in studying the frame, A = 0 is assigned to the outer boundary of the air regionsurrounding the stator (Figure 1). The choice of the location of this boundary is discussed in Appendix A.When the FEM results are studied it is found out that except the stator back core, the magnetic circuit remainsunsaturated. The solution also reveals that some of the pole flux completes its path through the air (Figure1a). The solutions also display how the flux density is distributed in the back core. This is shown in Figure4a. It is observed that stator back-core flux density reaches its minimum at the location corresponding to thecenter of the pole magnet (see Figure 4 and Figure 3).The stator back core flux density maximum is at thepoint between two adjacent magnets. So, in order to calculate the MMF drop on stator back-core analytically,this path (with a length equal to pole pitch) is divided into 10 equal sections as seen in Figure 3c.
Magnet center
Sta
tor
bac
k-c
ore
flu
x d
ensi
ty (
T) 2.25
2.00
1.75
1.50
1.25
1.00
0.75
0.50
0.25
0.000 10 20 30 40 50 60 70 80 90
B (
T)
0.40
0.35
0.30
0.25
0.20
0.15
0.10
0.05
0.00-300 -250 -200 -150 -100 -50 0.00
a b
FE SolutionApproximation
Load lineMagnet recoil line
Operating poing
Angle (degree) H (kA/m)
Figure 4. (a) Stator back-core flux density variation of the test machine under a pole. Solid line (red): FEM solution,dashed black line: linear approximation). (b) Test motor magnet recoil line and load line.
For the 4-pole test motor here (pole pitch = 90 ) with magnet span of 81 , the stator back core fluxdensity reaches its maximum value at 45 + (81/2) = 85.5 , and is expected to stay constant until 90 .However, in this study, a linear approximation is used under a pole pitch (see Figure 4) and the magnet spaneffect is neglected. As seen in Figure 4, this assumption is reasonable. As the performance calculation resultsprove, this approximation does not affect the accuracy of predictions. Length of these 10 sections is equal andMMF can be calculated using equation (7), where Hi is the field intensity, ∆Li is the length of a given section.
MMF drop on stator back core =10∑
i=1(Hi × ∆Li) = ∆Li ×
10∑i=1
Hi (7)
133

Tarvirdilu–Asl et al./Turk J Elec Eng & Comp Sci
As discussed above, due to saturation in stator back-core, some of the pole flux completes its path in theair, outside the motor frame. This phenomenon is modeled by considering an air area outside of the stator bythe outer diameter of diameter of Do,air = 300 mm (≈ 2.94 × Do,stator ) which is depicted in Figure 1a. In thisstudy, diameter of the air region is selected so that at the boundary the flux density is 1% of the maximumstator back core flux density. Appendix 1 presents an analytical method for the calculation of diameter of thisboundary. Significance of including the flux leaking out of the stator core and its effects on magnet operatingpoint and performance calculation of the PMDC motor are discussed in Appendix 2.
With the above consideration, the maximum stator back core flux density Bs,max for a given magnet fluxdensity Bm can be determined using (8).
φstator,max = φmagnet
2− φair → Bs,max = 1
As
Am
2Bm −
10∑i=1
(Hi × ∆Li)
Rair
(8)
Using the approach described above the load line for the magnetic circuit i.e Bm versus MMF drop alongthe magnetic circuit can be obtained. The intersection of the load line with the MMF versus Bm characteristicsof the magnet MMF = Bmhm where hm is the magnet thickness), as seen in Figure 4b, is the operating pointof the magnet. Note that given Bm , the mean air gap flux density Bav and hence the emf induced at thisoperating point can be calculated from (1).
In the sections above an analytical approach for the calculation of parameters of equivalent circuit of abrushed permanent-magnet DC motor is described. In the following sections, the accuracy of prediction of theperformance of the motor using this equivalent circuit will be tested by comparing its predictions with testsperformed on a test motor. Also, the results of the predictions from the analytical approach will be comparedwith FEM solution performance predictions.
4. The test motorA commercial permanent–magnet brushed DC test motor is used to verify the accuracy of the approachdeveloped in this paper. This motor is used to drive the radiator fan in automotive applications. Cross-section of this motor (4-pole, 225 W, 26 V), is depicted in Figure 1. Rotor structure and winding configurationcan also be seen in Figure 1b. Lap winding is used in the armature with 60 conductors per slot. There are 4parallel paths in the winding. The specifications of the test machine are given in Appendix 2.
The armature resistance is measured by applying a voltage to the motor terminals and measuring thecurrent. The coil resistance is calculated in the usual manner, and considering that the brush short circuitstwo laminations, the resistance that appears across the brushes is calculated. The coil resistance is subtractedfrom measured armature resistance and the difference is assumed to be the brush resistance, which is given inAppendix 2. The brush drop nonlinearity and its dependence on the temperature is neglected in this paper.
5. Verification of the proposed analytical modelIn the verification process, the applied voltage to the motor is set to 26 V, which is the rated voltage of the testmachine. In analytical predictions, copper loss calculation is easy as the armature current is available. In theprediction of losses, a simple approach is used. Since the armature magnetic material flux densities are availablefrom the method, W/kg loss curves of the magnetic material is used in the usual manner.
134

Tarvirdilu–Asl et al./Turk J Elec Eng & Comp Sci
For verification purposes, first, the open-circuit characteristic of the test motor is predicted using themethod described in this paper. The open-circuit characteristics of the motor is also measured by driving itat various speeds. Measured and predicted open circuit characteristics of the test motor are given in Figure 6.It can be observed from Figure 6 that the open-circuit characteristics of the machine is well predicted by theproposed method.
Next, the operating point of the magnet and consequently the flux densities in different parts of the motorare calculated using the proposed analytical model. The test motor is also simulated using 3-D FEM. In thissolution, the number of meshes is selected automatically as 35216 by the software, and transient solver is usedto carrying out the simulations. The motor circuit model for two commutator segments is shown in Figure 5.The resistance values in Figure 5 are set to half of one coil resistance (see Appendix 2) because a half symmetricmodel is used in simulations.
Figure 5. PMDC motor excitation circuit for two commutator segments.
No-l
oad
volt
age
Ea
(V)
30
25
20
15
10
51000 1500 2000 2500 3000 3500 4000
MeasurementsCalculations
Rotor speed (rpm)
Figure 6. Predicted and measured no-load voltage vs speed.
The finite element solution indicates that the maximum stator back-core flux density is 2.25 T as givenin Table 1. Variation of the stator back core flux density variation is given in Figure 4. Based on the B-Hcharacteristic of the stator and rotor core, the knee point of the curve happens approximately at B = 1.8 T.So, it can be concluded that the stator back-core goes into heavy saturation in this application.
Although the higher flux density on the stator side does not cause any core loss since the stator flux isDC, it leads to a huge MMF-drop on the stator back-core and decreases the magnet flux density. Consequently,
135

Tarvirdilu–Asl et al./Turk J Elec Eng & Comp Sci
the pole flux decreases significantly. As a consequence, the efficiency of the motor is reduced. This large MMFdrop on stator back-core can be reduced by increasing the stator frame thickness or stator length.
The steady-state performance (torque, speed, input current, and losses) of the test motor is predictedmotor at full load and at rated speed, using the proposed analytical method and presented in Table 2. Table 2also includes the performance calculations for the test motor obtained using FE simulations and measurements(First 3 rows of the table). This table shows that the analytical calculation method proposed has very goodaccuracy and the prediction accuracy is just as good as FEM predictions. Predicted torque, output power, andefficiency of the motor are within a few percent of the measured values.
Predicted flux density values in various parts of the test motor are already presented in Table 1. In thistable, FEM calculated values are also given. As can be observed from the table flux density prediction accuracyof the analytical method is very good too.
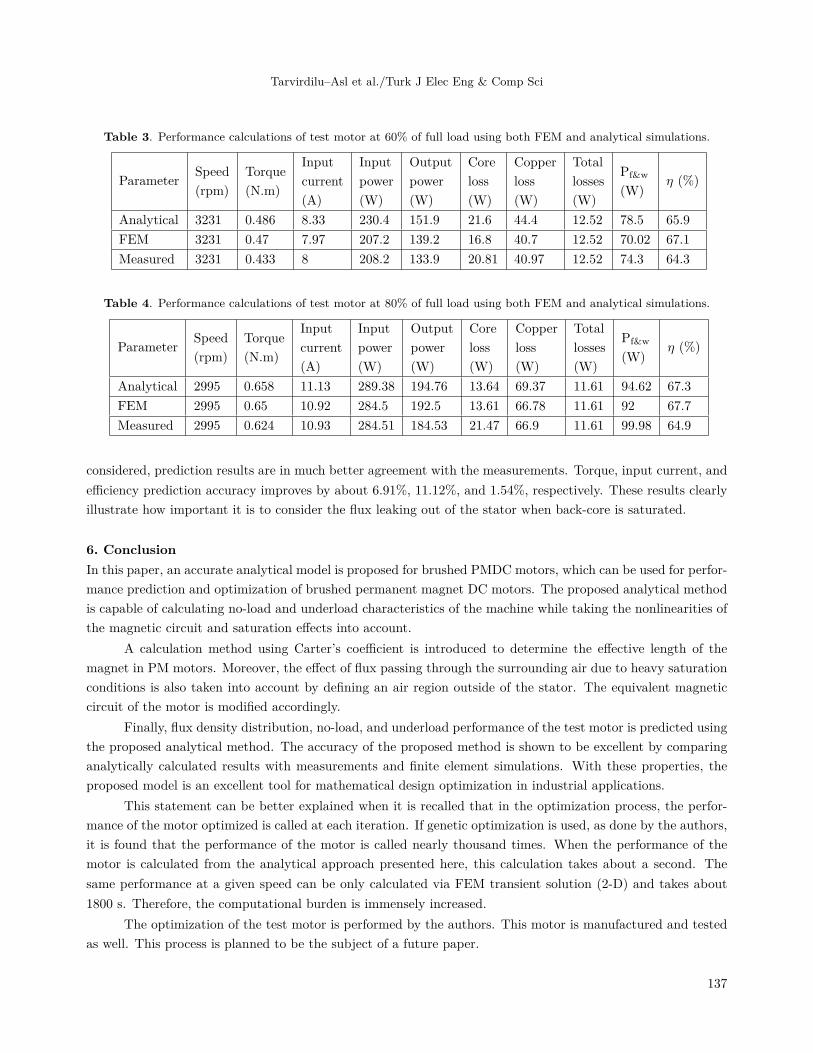
The test motor performance is also predicted under 60% and 80% of the nominal load in Table 3 andTable 4, respectively. In these tables measurement results and 3-D finite element simulation results for the sameoperating conditions are presented. It can be observed that analytically calculated results are in very goodagreement with 3-D FE simulations and experimental results.
By comparing the analytically predicted open-circuit characteristics and underload performance of thetest motor, as well as the flux density calculation results, with measurements and 3-D finite element simulations,the excellent accuracy of the proposed analytical model is verified.
Table 2. Performance calculations of test motor at full load using both FEM and analytical simulations with andwithout considering the outer air region.
Parameter Speed(rpm)
Torque(N.m)
Inputcurrent(A)
Inputpower(W)
Outputpower(W)
Coreloss(W)
Copperloss(W)
Pf&w
(W)
Totallosses(W)
η (%)
Consideringthe outer air region
Analytical 2761 0.825 13.57 352.82 227.83 13.07 101.22 10.7 124.99 64.57FEM 2761 0.833 13.75 357.5 230.15 14.8 101.85 10.7 127.35 64.38Measured 2761 0.825 13.85 360.05 227.77 13.4 108.18 10.7 132.28 63.3
Without consideringthe outer air region
Analytical 2761 0.88 15.52 403.52 243.74 12.31 133.57 10.7 159.78 60.4FEM 2761 0.89 15.49 402.74 246.63 11.9 134.51 10.7 156.11 61.24
Difference between measurementsand FE results with consideringthe outer air region (%)
0 0.97 -0.72 -0.71 1.04 9.93 5.85 0 -3.73 1.71
Difference between measurementsand FE results without consideringthe outer air region (%)
0 7.88 11.84 11.86 8.28 -11.72 24.34 0 15.01 -3.25
Percentage of accuracy improvement 0 6.91 11.12 11.15 7.24 1.79 18.49 0 14.28 1.54
To illustrate the importance of developing a model, which includes the flux leaking out of the magneticcircuit, Table 1 and Table 2 present the flux density and performance prediction of the test motor when theouter air region is not included in the model.
Table 1 illustrates that including the outer air region in the model changes the magnet operating pointand increases the flux density in the air gap, the rotor teeth, and the stator back core by 4.5%, 7.8%, 12.9%,and 7.2%, respectively.
The performance of the test motor with and without the outer air region are presented under full loadcondition in Table 2, When this table is investigated, it can be observed that when the outer air region is
136
Tarvirdilu–Asl et al./Turk J Elec Eng & Comp Sci
Table 3. Performance calculations of test motor at 60% of full load using both FEM and analytical simulations.
Parameter Speed(rpm)
Torque(N.m)
Inputcurrent(A)
Inputpower(W)
Outputpower(W)
Coreloss(W)
Copperloss(W)
Totallosses(W)
Pf&w
(W)η (%)
Analytical 3231 0.486 8.33 230.4 151.9 21.6 44.4 12.52 78.5 65.9FEM 3231 0.47 7.97 207.2 139.2 16.8 40.7 12.52 70.02 67.1Measured 3231 0.433 8 208.2 133.9 20.81 40.97 12.52 74.3 64.3
Table 4. Performance calculations of test motor at 80% of full load using both FEM and analytical simulations.
Parameter Speed(rpm)
Torque(N.m)
Inputcurrent(A)
Inputpower(W)
Outputpower(W)
Coreloss(W)
Copperloss(W)
Totallosses(W)
Pf&w
(W)η (%)
Analytical 2995 0.658 11.13 289.38 194.76 13.64 69.37 11.61 94.62 67.3FEM 2995 0.65 10.92 284.5 192.5 13.61 66.78 11.61 92 67.7Measured 2995 0.624 10.93 284.51 184.53 21.47 66.9 11.61 99.98 64.9
considered, prediction results are in much better agreement with the measurements. Torque, input current, andefficiency prediction accuracy improves by about 6.91%, 11.12%, and 1.54%, respectively. These results clearlyillustrate how important it is to consider the flux leaking out of the stator when back-core is saturated.
6. ConclusionIn this paper, an accurate analytical model is proposed for brushed PMDC motors, which can be used for perfor-mance prediction and optimization of brushed permanent magnet DC motors. The proposed analytical methodis capable of calculating no-load and underload characteristics of the machine while taking the nonlinearities ofthe magnetic circuit and saturation effects into account.
A calculation method using Carter’s coefficient is introduced to determine the effective length of themagnet in PM motors. Moreover, the effect of flux passing through the surrounding air due to heavy saturationconditions is also taken into account by defining an air region outside of the stator. The equivalent magneticcircuit of the motor is modified accordingly.
Finally, flux density distribution, no-load, and underload performance of the test motor is predicted usingthe proposed analytical method. The accuracy of the proposed method is shown to be excellent by comparinganalytically calculated results with measurements and finite element simulations. With these properties, theproposed model is an excellent tool for mathematical design optimization in industrial applications.
This statement can be better explained when it is recalled that in the optimization process, the perfor-mance of the motor optimized is called at each iteration. If genetic optimization is used, as done by the authors,it is found that the performance of the motor is called nearly thousand times. When the performance of themotor is calculated from the analytical approach presented here, this calculation takes about a second. Thesame performance at a given speed can be only calculated via FEM transient solution (2-D) and takes about1800 s. Therefore, the computational burden is immensely increased.
The optimization of the test motor is performed by the authors. This motor is manufactured and testedas well. This process is planned to be the subject of a future paper.
137
Tarvirdilu–Asl et al./Turk J Elec Eng & Comp Sci
Acknowledgment
This research has been funded by FAZ A.Ş, İzmir, Turkey.
References
[1] Ackva A, Ombach G, Junak J. Numerical coupled analysis of DC motors including saturation and commutationeffects. Power Electronics and Applications 2005; 1 (1): P1-P6. doi: 10.1109/EPE.2005.219267
[2] Aker MN, Lu TF, Li Q. Weight optimisation of brush-type wound-field direct current motors. In: Proceedings ofthe IEEE Internatinal Symposium on Intelligent Control; Vancouver, BC, Canada; 2002. pp. 397-402.
[3] Aker MN, Lu TF. A method for optimising the weight and response of brush-type wound-field direct current motors.In: 7th International Conference on Control, Automation, Robotics and Vision, 2002. ICARCV 2002; Singapore;2002. pp. 1343-1348.
[4] Wang S, Hong J, Sun Y, Cao H. Effect Comparison of Zigzag Skew PM Pole and Straight Skew Slot for VibrationMitigation of PM Brush DC Motors. IEEE Transactions on Industrial Electronics 2020; 67 (1): 4752-4761. doi:10.1109/TIE.2019.2927175
[5] Hunstable FE. Brushed electric motor/generator 2019; US Patent 10,284,029.
[6] Klein FN, Kenyon ME. Permanent magnet DC motors design criteria and operation advantages. IEEE Transactionson Industry Applications 1984; IA-20 (6): 1525-1531. doi: 10.1109/TIA.1984.4504637
[7] Cros J, Viarouge P, Kakhki MT. Design and optimization of soft magnetic composite machines with finite elementmethods. IEEE Transactions on Magnetics 2011; 47 (10): 4384-4390. doi: 10.1109/TMAG.2011.2157113
[8] Yamazaki K, Kanou Y. Shape optimization of rotating machines using time-stepping adaptive finite element method.IEEE Transactions on Magnetics 2010; 46 (8): 3113-3116. doi: 10.1109/TMAG.2010.2043651
[9] Tarvirdilu-Asl R. Optimum pole combination to maximize torque density in switched reluctance motors for electricvehicle applications. M.Sc, Middle East Technical University, Ankara, Turkey, 2016.
[10] Tarvirdilu-Asl R, Zeinali R, Ertan HB. FEM-based design modifications and efficiency improvements of a brushedpermanent magnet DC motor. In: 2017 International Conference on Optimization of Electrical and ElectronicEquipment (OPTIM) & 2017 Int Aegean Conference on Electrical Machines and Power Electronics (ACEMP);Braşov, Romania; 2017. pp. 401-407.
[11] Zhu ZQ, Jewell GW, Howe D. Finite element analysis in the design of permanent magnet machines. In: IEESeminar on Current Trends in the Use of Finite Elements (FE) in Electromechanical Design and Analysis (Ref. No.2000/013); London, UK; 2000. pp. 1/1-1/7.
[12] Hayashi Y, Mitarai H, Honkura Y. Development of a DC brush motor with 50% weight and volume reductionusing an Nd-Fe-B anisotropic bonded magnet. IEEE transactions on magnetics 2003; 39 (1): 2893-2895. doi:10.1109/TMAG.2003.815739
[13] Boglietti A, Cavagnino A, Tenconi A. Low cost solutions to reduce cogging torque and acoustic noise of smallbrushed DC motors for automotive radiator cooling fan modules. In: IECON 2012 - 38th Annual Conference onIEEE Industrial Electronics Society; Montreal, QC, Canada; 2012. pp. 1870-1876.
[14] Boules N. Design optimization of permanent magnet DC motors. IEEE Transactions on Industry Applications 1990;26 (4): 786-792. doi: 10.1109/28.56006
[15] Cros J, Sincero GCR, Viarouge P. Design method for brush permanent magnet DC motors. In: 2009 IEEEInternational Electric Machines and Drives Conference; Miami, FL, USA; 2009. pp. 1625-1632.
[16] Zaki A, Ibrahim S. Modeling and analysis of PM brushed DC motor using FEM. In: 2005 European Conference onPower Electronics and Applications; Dresden, Germany; 2005. pp. P1-P6.
138

Tarvirdilu–Asl et al./Turk J Elec Eng & Comp Sci
[17] Abeykoon AMHS, Senevirathne HR. Disturbance observer based current controller for a brushed DC motor. In:2012 IEEE 6th International Conference on Information and Automation for Sustainability; Beijing, China; 2012.pp. 47-52.
[18] Acarnley PP, Al-Tayie JK. Estimation of speed and armature temperature in a brushed DC drive using the extendedKalman filter. Electric Power Applications 1997; 144 (1): 13-20. doi: 10.1049/ip-epa:19970927
[19] Kumar CA, Nair NK. Multi-objective PI controller design with an application to speed control of permanentmagnet DC motor drives. In: 2011 International Conference on Signal Processing, Communication, Computing andNetworking Technologies; Thuckafay, India; 2011. pp. 424-429.
[20] Santana J, Naredo JL, Sandoval F, Grout I, Argueta OJ. Simulation and construction of a speed control for a DCseries motor. Mechatronics 2002; 12 (1): 1145-1156. doi: 10.1016/S0957-4158(02)00019-3
[21] Scott J, McLeish J, Round WH. Speed control with low armature loss for very small sensorless brushed DC motors.IEEE Transactions on industrial electronics 2009; 56 (4): 1223-1229. doi: 10.1109/TIE.2008.2007046
[22] Yildiz AB. Electrical equivalent circuit based modeling and analysis of direct current motors. International Journalof Electrical Power & Energy Systems 2012; 43 (1): 1043-1047. doi: 10.1016/j.ijepes.2012.06.063
[23] Glowacz Z, Glowacz W. Mathematical model of DC motor for analysis of commutation processes. In: 2007 IEEEInternational Symposium on Diagnostics for Electric Machines, Power Electronics and Drives; Craców, Poland;2007. pp. 138-141.
[24] Martínez JSV, López PG, Juárez JJM. Series Wound DC Motor modeling and simulation, considering magnetic,mechanical and electric power losses. In: 2009 52nd IEEE International Midwest Symposium on Circuits andSystems; Cancún, Mexico; 2009. pp. 1073-1077.
[25] Ishak D, Hassan AHA. Analytical modeling of permanent magnet excited brushed DC motor for low-cost appli-cations. In: 2008 5th International Symposium on Mechatronics and Its Applications; Amman, Jordan; 2008. pp.1-5.
[26] Dalal A, Singh AK, Kumar P. Effect of saturation on equivalent circuit analysis of induction motor in practicalscenario. In: 2013 Annual IEEE India Conference (INDICON); Mumbai, India; 2013. pp. 1-5.
[27] Guha S, Kar NC. A new method of modeling magnetic saturation in electrical machines. In: 2006 CanadianConference on Electrical and Computer Engineering; Ottawa, Canada; 2006. pp. 1094-1097.
[28] Moallem M, Dawson GE. An improved magnetic equivalent circuit method for predicting the characteristics of highlysaturated electromagnetic devices. IEEE Transactions on magnetics 1998; 34 (5): 3632-3635. doi: 10.1109/20.717858
[29] Pyrhönen J, Ruuskanen V, Nerg J, Puranen J, Jussila H. Permanent-magnet length effects in AC machines. IEEEtransactions on magnetics 2010; 46 (10): 3783-3789. doi: 10.1109/TMAG.2010.2050002
[30] Krause P, Wasynczuk O, Sudhoff S, Pekarek S. Analysis of electric machinery and drive systems. Hoboken, NJ,USA: Wiley-IEEE Press, 2002.
[31] Say MG. Alternating current machines. New York, USA: Pitman, 1976.
[32] Miller TJE. Brushless permanent Magnet and reluctance motor drives. Oxford, UK: Oxford Science Publications,1989.
139
Tarvirdilu–Asl et al./Turk J Elec Eng & Comp Sci
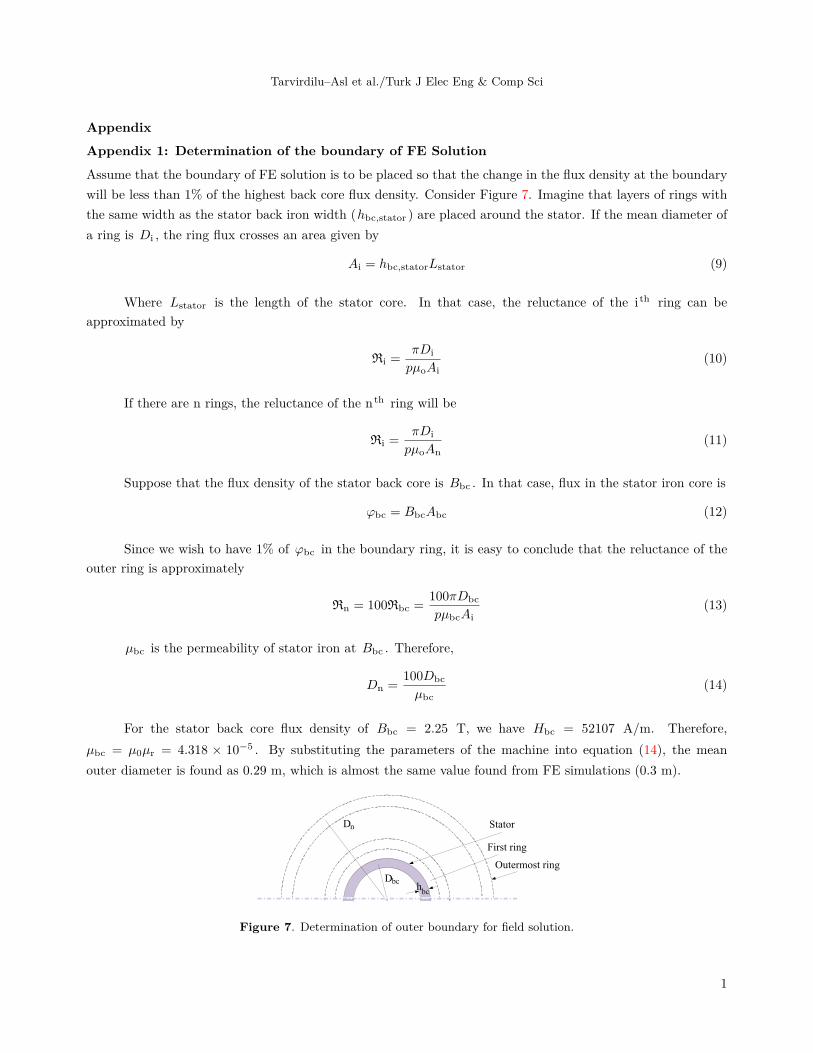
AppendixAppendix 1: Determination of the boundary of FE Solution
Assume that the boundary of FE solution is to be placed so that the change in the flux density at the boundarywill be less than 1% of the highest back core flux density. Consider Figure 7. Imagine that layers of rings withthe same width as the stator back iron width (hbc,stator ) are placed around the stator. If the mean diameter ofa ring is Di , the ring flux crosses an area given by
Ai = hbc,statorLstator (9)
Where Lstator is the length of the stator core. In that case, the reluctance of the i th ring can beapproximated by
Ri = πDi
pµoAi(10)
If there are n rings, the reluctance of the n th ring will be
Ri = πDi
pµoAn(11)
Suppose that the flux density of the stator back core is Bbc . In that case, flux in the stator iron core is
φbc = BbcAbc (12)
Since we wish to have 1% of φbc in the boundary ring, it is easy to conclude that the reluctance of theouter ring is approximately
Rn = 100Rbc = 100πDbc
pµbcAi(13)
µbc is the permeability of stator iron at Bbc . Therefore,
Dn = 100Dbc
µbc(14)
For the stator back core flux density of Bbc = 2.25 T, we have Hbc = 52107 A/m. Therefore,µbc = µ0µr = 4.318 × 10⁻⁵ . By substituting the parameters of the machine into equation (14), the meanouter diameter is found as 0.29 m, which is almost the same value found from FE simulations (0.3 m).
Stator
First ring
Outermost ring
Dn
Dbch
bc
Figure 7. Determination of outer boundary for field solution.
1

Tarvirdilu–Asl et al./Turk J Elec Eng & Comp Sci
Appendix 2: Test motor data26 V, 4-pole, 225 W, Armature lap winding Coil resistance = 0.38 Ω30 turns per coil, wire diameter of 0.5 mm Stator outer diameter = 102 mmNumber of parallel paths, a = 4 Stator inner diameter = 81.93 mmCoil end extension length Lend = 40 mm Rotor core length = 22.7 mmEnd connection length of the coil to commutator bars,Lwc = 40 mm Magnet length = 39 mmBrush resistance = 0.275 Ω Stator core length = 44 mm
Appendix 3: Core material data
Magnetization data of the test motor core materialRow B(mT) H(A/m) Row B(mT) H(A/m)1 101.6575 48.07692 8 1510.497 877.40382 350.2762 72.11538 9 1620.994 2283.6543 571.2707 96.15385 10 1731.492 5468.754 792.2652 120.1923 11 1841.989 10456.735 902.762 132.2115 12 1897.238 14002.46 1123.757 180.2885 13 2007.735 25180.297 1455.249 637.0192
2
Related Documents