Manuscript submitted to Canadian Journal of Remote Sensing (research paper) An approach for mapping large-area impervious surfaces: Synergistic use of Landsat 7 ETM+ and high spatial resolution imagery Limin Yang*, Chengquan Huang, Collin G. Homer, Bruce K. Wylie and Michael J. Coan Raytheon Corporation, U.S. Geological Survey EROS Data Center, Sioux Falls, SD 57198 USA * corresponding author Limin Yang USGS/EROS Data Center Sioux Falls, South Dakota 57198 U.S.A. Tel: (605) 594-6039 E-mail: [email protected]

Welcome message from author
This document is posted to help you gain knowledge. Please leave a comment to let me know what you think about it! Share it to your friends and learn new things together.
Transcript

Manuscript submitted to Canadian Journal of Remote Sensing (research paper)
An approach for mapping large-area impervious surfaces: Synergistic use of Landsat 7 ETM+ and high spatial resolution imagery
Limin Yang*, Chengquan Huang, Collin G. Homer, Bruce K. Wylie and Michael J. Coan Raytheon Corporation, U.S. Geological Survey EROS Data Center, Sioux Falls, SD 57198 USA
* corresponding author Limin Yang USGS/EROS Data Center Sioux Falls, South Dakota 57198 U.S.A. Tel: (605) 594-6039 E-mail: [email protected]

An approach for mapping large-area impervious surfaces: Synergistic use of Landsat 7 ETM+ and high spatial resolution imagery*
Limin Yang, Chengquan Huang, Collin G. Homer, Bruce K. Wylie and Michael J. Coan
Raytheon Corporation, U.S. Geological Survey EROS Data Center, Sioux Falls, SD 57198 USA
Abstract: A wide range of urban ecosystem studies, including urban hydrology, urban climate, land use planning and resource management require current and accurate geospatial data of urban impervious surfaces. We developed an approach to quantify urban impervious surfaces as a continuous variable by using multi-sensor and multi-source datasets. Subpixel percent impervious surfaces at 30-meter resolution were mapped using a regression tree model. The utility, practicality and affordability of the proposed method for large-area imperviousness mapping were tested over three spatial scales (Sioux Falls, South Dakota, Richmond, Virginia, and the Chesapeake Bay areas of the United States). Average error of predicted versus actual percent impervious surface ranged from 8.8 to 11.4% with correlation coefficients from 0.82 to 0.91. The approach is being implemented to map impervious surfaces for the entire United States as one of the major components of the circa 2000 national land cover database.
INTRODUCTION
The status and trends of urban land cover and land use significantly impact the quality of human life and urban ecosystems. Accurate, up-to-date and spatially explicit data on urban land cover and land use are required to support urban land management decision-making, ecosystem monitoring and urban planning (Ridd, 1995).
One of the most important land cover types characteristic of urban and suburban environment is the impervious surfaces developed through anthropogenic activities. Impenetrable surface, such as rooftops, roads and parking lots have been identified as a key environmental indicator of urban land use and water quality (e.g. Arnold and Gibbons,1996). The spatial extent and distribution of impervious surfaces impact urban climate by altering sensible and latent heat fluxes within the urban surface and boundary layers; Impervious surface also increases the frequency and intensity of downstream runoff and decreases water quality. Strong correlation between imperviousness of a drainage basin and the
* This work was performed under U.S. Geological Survey contract 1434-CR-97-CN-40274. This paper is preliminary and has not been edited or reviewed for conformity with U.S. Geological Survey standards or nomenclature.
U.S. Department of the Interior U.S. Geological Survey 2

quality of its receiving streams has been reported. For example, stream quality usually starts to degrade if more than ten percent of the area of a watershed is impervious (Schueler, 1994).
In recognizing its environmental significance, impervious surface has been identified as one of the major components of the circa 2000 National Land-Cover Data base (NLCD 2000) to be developed through the Multi-Resolution Land Characteristics (MRLC) 2000 Consortium (Homer et al., 2002). The MRLC 2000 consortium was formed to meet the needs of several federal agencies of the United States (U.S. Geological Survey, Environmental Protection Agency, USDA Forest Service, NASA and NOAA) for Landsat 7 Enhanced Thematic Mapper Plus (ETM+) imagery and land cover/land use data. Through the MRLC 2000 consortium, agencies formed a partnership and pooled resources to develop: 1) a multi-temporal Landsat 7 ETM+ image dataset containing three dates of imagery per path-row for the United States, and 2) a consistently developed circa 2000 national land cover database.
PREVIOUS STUDIES OF URBAN IMPERVIOUS SURFACES
Numerous research efforts have been devoted to quantify urban impervious surfaces using ground-measured and remotely sensed data (Deguchi and Sugio, 1994; Williams and Norton, 2000; Phinn et al., 2000). The methodologies range from multiple regression (Foster, 1980; Ridd, 1995), spectral unmixing (Ji and Jensen, 1999; Ward et al., 2000), artificial neural network (Wang, 2000; Flanagan and Civco, 2001), classification trees (Smith and Goetz, 2001), and integration of remote sensing data with geographic information systems (Prisloe et al., 2001).
Ridd (1995) proposed a conceptual model, i.e., vegetation-impervious surface-soil (VIS) for urban ecosystem analysis. This framework presents a systematic standard for characterizing urban ecosystem from morphological, biophysical, and anthropogenic perspectives. Using this model detailed land cover land use and biophysical parameters were obtained for urban ecosystems using remote sensing data. Forster (1980) examined the relationship between Landsat MSS data and percent land cover types sampled at the pixel level from the Sydney metropolitan area using multiple regression techniques. He found that variables most closely correlated with intensity of urban developed areas were those of normalized band ratios.
More recent studies adopted advanced machine learning algorithms and spectral unmixing that allow the derivation of imperviousness at the sub-pixel level. For instance, Flanagan and Civco (2001) conducted a subpixel impervious surface mapping using artificial neural network and an ERDAS Imagine subpixel classifier. For four municipal study areas in Connecticut, the overall accuracy at impervious-non-impervious detection level varied from 71 to 94% with a root mean square error (RMSE) of 0.66 to 5.97%. Wang et al. (2000) developed a
U.S. Department of the Interior U.S. Geological Survey 3

subpixel proportional land cover information transformation (SPLIT) model, a modularized artificial neural network-based algorithm, to quantify proportion of land cover types from high-resolution multispectral videography. Overall accuracy achieved was 87.6%. Spectral unmixing and classification trees classifier have also been capable of quantifying sub-pixel impervious surface. The accuracy of imperviousness estimates from unmixing was also comparable (Ji and Jenson, 1999; Ward et al. 2000), whereas overall within-class accuracy using classification trees was about 84% in a study of Montgomery County, Maryland (Smith and Goetz, 2001). Thus far almost all research conducted was confined within a limited spatial area (one urban setting or at county-level), and each study used only one type of data for developing training data for model prediction. RESEARCH OBJECTIVES It was the goal of this research to develop a repeatable, accurate, and cost-effective method to map large-area impervious surface percentage at 30-meter spatial resolution for the entire United States. The research presented here described an alternative approach to extracting sub-pixel imperviousness information using a regression tree algorithm and Landsat 7 ETM+ as well as two types of high-spatial resolution imagery. The primary research questions were:
1) is regression tree a reliable and robust algorithm for mapping impervious surfaces nation-wide?
2) what are the optimal input variables for modeling impervious surfaces and are they scale-dependent?
3) can a regression tree model developed using training data from one particular location be applied to another area with a broader scale?
4) is the high spatial-resolution imagery a cost-effective data source for deriving training/test data for large-area impervious surface mapping?
DATA AND PREPROCESSING
Study Area
The proposed procedure was tested in three geographic areas within the United States representing different spatial scales: Sioux Falls, South Dakota (local scale of ~1000 square km), Richmond, Virginia (sub-regional scale of ~10,000 square km) and Chesapeake Bay of eastern United States (regional scale of ~ 100,000 square km).
Data Landsat 7 ETM+ images were the primary data source for mapping impervious surfaces. Data quality of Landsat 7 ETM+ is superior to its predecessors (e.g. Landsat 5) with significant improvement of on-flight radiometric and geometric
U.S. Department of the Interior U.S. Geological Survey 4

calibration, inclusion of a 15-meter resolution panchromatic band, and an improved 60-meter spatial resolution thermal infrared band. Two types of high-spatial resolution images, IKONOS from the Space Imaging and the Digital Orthophoto Quadrangles (DOQ) of the US Geological Survey scanned from the National Aerial Photography Program (NAPP) color infrared photographs, were utilized for derivation of training/test data. With a nominal spatial resolution of 1-meter, the DOQ image has three bands: green, red and near infrared.1 Table 1 lists all Landsat data used for each of the three study areas. For Sioux Falls, a leaf-on (June, 2000) cloud-free IKONOS image covering the city and surrounding areas was available for deriving training/validation data. A Landsat 7 ETM+ scene that covers the same area with only one-day apart from the IKONOS data acquisition date was also available along with another leaf-off (October, 2000) image. Coincidence of time and similar spectral bandwidth of the two data sets provided good opportunities for testing impervious surface mapping at a local scale. Similar to Sioux Falls, Landsat ETM+ data available for Richmond study included two scenes (one leaf-on and one leaf-off). The high-resolution data used for deriving training and test data were the DOQs acquired in spring of the late 1980s to early 1990s. For the Chesapeake Bay study, nine ETM+ scenes were required to cover the entire area. Three Landsat images (spring, summer, and fall each) were available for each path/row. Training data source was the DOQs acquired in spring and summer of the late 1980s to 1990s.
Image Preprocessing All ETM+ data preprocessing followed standard specifications including: 1) radiometric and geometric calibration and terrain-correction (Irish 2000), 2) conversion from digital number to at-satellite reflectance (for six reflective bands) or at-satellite radiance temperature (the thermal band), 3) referenced to the National Albers equal area map projection and re-sampled using cubic convolution to 30-meter resolution. After initial pre-processing Tasseled-cap brightness, greenness and wetness were derived using at-satellite reflectance-based coefficients (Huang et al. 2002b). For IKONOS data the 1-m panchromatic data was fused with 4-m multispectral bands, resulting in an image of four bands (blue, green, red and NIR) with “sharpened” spatial resolution of 1-m. Both IKONOS and DOQ data were in UTM projection and were reprojected to Albers equal area projection. To ensure
1 Detailed information on the DOQ images is available at http://edc.usgs.gov/glis/hyper/guide/usgs_doq.
U.S. Department of the Interior U.S. Geological Survey 5

a high degree of accuracy in image co-registration (between high resolution imagery and the Landsat 7 ETM+ imagery), exact projection transformation was used. Visual inspection revealed that misregistration errors between the DOQ/IKONOS and the ETM+ images were generally less than 1 ETM+ pixel. For the Chesapeake Bay area, additional data preprocessing was made by Earthsat Corporation (under USGS contract number 010112C0012) to mask clouds and cloud shadows and hazy areas. Spectral values of each ETM+ bands of the masked areas were subsequently estimated based on cloud-free images from other two dates using regression tree techniques. Detailed description of the procedure is beyond the scope of this study. This process was deemed necessary because per-pixel mapping required non-contaminated reflectance data and spatially continuous estimates were desired.
METHODS AND PROCEDURES The proposed methodology for impervious surface mapping consists of several steps: 1) algorithm selection, 2) training/validation data development, 3) predictive variable selection and initial regression tree modeling and assessment, and 4) final modeling and mapping (fig. 1).
Regression Tree Algorithm The general classification and regression tree (CART) algorithm conducts a binary recursive partitioning process. The process splits each parent node into two child nodes and the process is repeated, treating each child node as a potential parent node (Breiman et al., 1984). The regression tree algorithm produces rule-based models for prediction of continuous variables based on training data. Each rule set defines the conditions under which a multivariate linear regression model is established. Regression tree models can account for non-linear relationship between predictive and target variables and allow both continuous and discrete variables as input variables. It has been reported that accuracy and predictability of the regression tree models were better than those of the simple linear regression models (De’Ath and Fabricius, 2000; Huang, 2002a). The regression tree algorithm we used to model impervious surfaces is a commercial software called Cubist,2 which is one type of the regression tree algorithm.3 The quality of the constructed regression tree can be measured by an average error R of a tree T, expressed by
2 use of any trade, product, or company names is for descriptive purposes only and does not imply endorsement by the U.S. Government. 3 detailed information on Cubist software is available at http://rulequest.com/cubist-info.html.
U.S. Department of the Interior U.S. Geological Survey 6

| (1) )(|)(1
1ii
n
iN xgyTR ρ−= ∑
=
Function )( ixg
ρ represents the regression plane through the example set, and N is the number of samples used for establish the tree. In order to compare the quality of several regression trees, a relative error is often used and is defined as:
)()()( µRTRTRE = (2)
where µ(R ) is the average error that would result from always predicting the mean value. It is used to standardize the average error, . )(TR Besides the average error and relative error, Cubist also calculates Product-Moment correlation coefficient (r) between actual and predicted values. All three statistical measures were used throughout the study to evaluate model performance. Another feature of Cubist is its ability to estimate predictive accuracy by n-fold cross-validation. Using this option the training data set can be divided into n blocks of roughly equal size. For each block in turn, a model is built from the data in the remaining blocks and tested using the holdout block. The final accuracy of the model is estimated by averaging model results from all n-fold tests (Michie et al., 1994).
Training/test Data Collection Successful modeling using regression tree techniques relies on the quality of training/test data. In this study, training data selection was constrained by potential data availability nation-wide. A large number of training data were collected for each study area representing spectral and spatial variability of impervious areas due to differences in building materials, ages, surface colors and spatial orientation. For Sioux Falls, four subset windows of approximately 2000 x 2000 meter each were selected from the IKONOS image. Training and test data of impervious surfaces were obtained by an unsupervised clustering algorithm. Each cluster was interpreted and labeled with one or more of the five land cover classes (water, vegetated areas, bare soil, impervious surfaces and shadow), and was further modified by screen digitizing and recoding to reduce misclassification. A
U.S. Department of the Interior U.S. Geological Survey 7
final product was a binary raster image of impervious versus non-impervious pixels at 1-meter. Training and test data for Richmond were derived from four DOQ image windows (1,800 x 1,800 meters each). Three of them were in the metropolitan Richmond area and the other was in City Farm located in the west part of the study area. These image windows were visually selected to capture spectral variation of impervious surfaces, and to avoid areas where land cover changes occurred between the acquisition of the DOQ and the ETM+ images. The selected DOQ images were classified using a decision tree classification program called C5 (Quinlan, 1993). Each pixel was classified as one of five land cover classes: impervious surface, forest, grass, water and shadow. The classifications were manually edited to correct confusions between impervious surface and other classes. The reference data derived from each DOQ image were then divided into nine equal-sized blocks, six of which were randomly selected for use as training data and the remaining as test data. Using randomly selected pixel-blocks rather than individual pixels as test data should reduce possible bias in model accuracy assessment due to spatial auto-correlation between training and test data (Campbell, 1981; Freidl et al., 2000). For the Chesapeake Bay area, a special module was developed by Earthsat Corporation to select training and test data based on spatial and spectral characteristics of the imagery and impervious surface. The selection process took into account spectral variance accounted for by each selected sample and continued to add samples until the variances captured reached a pre-defined threshold. As the result, the process selected twenty DOQs and a portion of each DOQ was classified into impervious surfaces using a combination of unsupervised/supervised methods with some manual editing and recoding. For all three-study areas, once the final classification was made, all 1-meter pixels mapped as impervious surface were tallied using a 30x30 meter grid geographically aligned with ETM+ pixels to compute impervious surfaces percentage. In this process, the IKONOS (or DOQ) 1–meter pixel whose coordinates matched that of the upper-left ETM+ pixel was used as the starting point of the 30-meter grid. One-meter shadow class pixels were excluded from the percent impervious calculation within each 30-meter pixel.
Predictive Variable Selection and Initial Regression Tree Modeling An initial regression tree model was developed using training data obtained from the high-resolution data. It involved two tasks, feature selection for most relevant input variables and preliminary regression tree modeling. Both tasks were accomplished using the Cubist software. Although all spectral bands could be input to Cubist, using fewer variables to reduce data volume and computing time
U.S. Department of the Interior U.S. Geological Survey 8

was desirable. The relative importance of the predictive variables was assessed based on their position within a multivariate linear regression at a given tree node, because the variables were ordered in decreasing relevance to the percent imperviousness. Once the initial prediction was made, quality control was performed. The predicted percent impervious surface was evaluated either by cross-validation (Sioux Falls) or by using holdout test data (Richmond and the Chesapeake Bay) as well as visual inspection of the predicted maps. For areas where magnitude of over- and/or under-prediction exceeded 10%, additional training samples were selected and a new model built to improve prediction.
Final Regression Tree Model and Mapping
The final regression tree model was built using the most relevant input variables and all available training data, and then applied to all pixels to map percent impervious surfaces. Accuracy of the final model was obtained through validation using holdout test data. Test error estimates generated by the Cubist software were considered reliable because they were based on set-aside test data not used to build the regression tree model. Final products consisted of: 1) spatial estimates of subpixel percent imperviousness at 30 meter resolution, 2) rule sets on conditions under which each prediction model was built, and 3) error estimates of the prediction through validation. RESULTS
Sioux Falls, South Dakota Several regression tree models were built by Cubist using combinations of different input variables (fourteen ETM+ spectral bands and six Tasseled-cap transformed bands from leaf-on and leaf-off images). Table 2 lists accuracy estimates, through cross-validation, when various combinations of input variables were used. The correlation coefficient ranged from 0.82 to 0.89 with an average error of 9.2 % to 11.4%. In most cases, changes in accuracy estimates were rather small, suggesting use of fewer input variables. Analysis of rule-sets from the model output revealed that the most important variables were Tasseled-cap greenness, band 4 (NIR), band 7 (mid-IR) and band 3 (VIS) of the leaf-on image. Thus, the final regression tree model was built using leaf-on data only and applied to map the entire city of Sioux Falls.
U.S. Department of the Interior U.S. Geological Survey 9

Visual inspection revealed that the spatial pattern of modeled impervious surface was quite reasonable (fig. 2). Major urban centers and a shopping mall complex were predicted with the highest percent imperviousness. The model also correctly predicted different intensity in development between old and newly developed residential areas. A major weakness of the model prediction was at the edge of the city where some bare soil was mapped as the medium-to-high imperviousness due to spectral confusion.
Richmond, Virginia Several regression tree models were built by using different combinations of spectral bands and band ratios. Based on evaluations using hold-out data (6962 pixels), the model developed using a minimum number of 5 bands, i.e., leaf-on bands 1, 4, 5, 6 and 7, was almost as accurate as those developed using more bands (by adding those of second and third power of the original ETM+ spectral bands and a texture band). The accuracies of different models differed only slightly, with correlation coefficients ranging from 0.88 to 0.91 and average error from 8.8% to 10% (table 3). Therefore, a final model was made using a subset of leaf-on spectral bands only (band 1, 4, 5, 7 and a thermal band). Visually, the model predictions were quite reasonable in urban area located within the two scenes, including Richmond, Petersburg, and a part of Newport News and Frederick in the east, and Charlottesville and Lynchburg in the west (fig 3a). Outside the urban areas, however, the model did predict considerable amount of imperviousness in some fallow fields and bare ground. Much of the problems should be fixable if an accurate non-urban mask is available. We made some efforts to create an urban mask in a subsequent study. As one of the research objectives, we tested whether a model developed from one city can be applied to another city. To do this, a regression tree model established using Sioux Falls training data was applied to the Richmond area. Figure 3 shows, to a large extent, a similar pattern between two imperviousness maps (3a using regression model built from the Sioux Falls training data and 3b using Richmond training data). The areas with high impervious surface were similarly mapped by using the two models, probably due to the fact that both cities are located in the mid-latitude with minimum topography. Main differences between the two were found in low-to-medium intensity developed areas, where percent impervious surfaces estimated using the Sioux Falls model was higher as compared to that predicted using the Richmond training data. Further checking using high-resolution DOQ suggested that the average of the over-prediction using the Sioux Falls model was about 10%. The discrepancy is likely due to differences between the ETM+ images of the two locations. The presence of haze within the leaf-on image of Richmond resulted in high spectral values of the three visible bands. Because visible bands were mostly positively correlated
U.S. Department of the Interior U.S. Geological Survey 10
with the percent impervious surface in Sioux Falls model, when applied to Richmond, the higher values of the visible bands caused an overestimation. The results of this test imply a possibility to spatially apply impervious model to a different area with similar intensity in urban development using good quality images with minimum topographic and atmospheric impacts.
Chesapeake Bay Area To test robustness and feasibility of the method when applied to large areas, several regression tree models were built for the Chesapeake Bay area by Earthsat Corporation (under a USGS contract number 010112C0012). Model evaluations using holdout data resulted in correlation coefficients varying from 0.87 to 0.90 with average error from 8.8% to 10.2% (table 4). Quantitatively, 200,000 pixels within the training DOQs were randomly selected and used to assess model prediction by comparing model predicted and actual values. The result showed that the error was near normally distributed and approximately 70% of the samples fall within 18% of absolute error bound (fig. 4). Overall, estimation of percent imperviousness improved with ETM+ image of all three dates utilized. Use of three tasseled cap bands performed equally well as compared to the results obtained using all six spectral bands. The final impervious surface layer was produced using tasseled cap transformed bands from all three dates and a leaf-on thermal band. Judging by spatial pattern, the overall performance of the model was satisfactory (fig. 5). In particular, the model predicted well for areas with medium-to-high imperviousness, extending from the Philadelphia-Baltimore-Washington DC metropolitan areas to its surroundings. Areas mapped as lower-medium imperviousness were mostly reasonable but with notable commission errors in some bare fields. Since our ultimate goal is to map the impervious surfaces nation-wide, a major challenge is to accurately map imperviousness of all urban areas, and at the same time, minimize commission errors. Towards this end, we tried to develop an urban mask from several ancillary data layers. One of these was a raster image of cities derived from the NOAA Defense Meteorological Satellite Program (DMSP) night light data (Elvidge et al., 1997). Another one was an aggregate of urban land cover/land use classes from the USGS 1990 national land cover dataset (Vogelmann et al., 2001). Both images were of 1-kilometer spatial resolution. In addition, a vector file of the TIGER 2000 roads from the U.S. Census Bureau was buffered and combined with the two raster images. Although being useful, this urban/road mask was problematic in some areas due to the coarse spatial resolution of the images and road buffers.
U.S. Department of the Interior U.S. Geological Survey 11

CONCLUSIONS We developed an approach to quantifying impervious surfaces as a continuous variable using Landsat ETM+ and high-resolution imagery. Estimates of percent impervious surface at the subpixel (30 meter) level were modeled and spatially mapped using a regression tree algorithm. Three geographic areas representing local, subregional and regional scales were tested using this method, and the model performance was assessed through holdout data not used to build the models. Regardless of change in spatial scale, the regression tree was capable of predicting imperviousness with consistent and acceptable accuracy. For all three areas tested, the correlation coefficient between model predicted and actual percent impervious surface ranged from 0.82 to 0.91, and the average error varied from 8.8 % to 11.4%. Because the procedure was mostly automated and took only limited computing time, we believe that the method is cost-effective and suitable for large-area imperviousness mapping. Using spectral bands from both leaf-on and leaf-off imagery usually improved model prediction, but only to a limited extent. When only a single image was used, the regression tree was still able to predict impervious surfaces without significant loss in accuracy. The use of Tasseled-cap transformation bands reduced the number of input variables without compromising quality of the final product. For all three tests, the most relevant set of input variables in model prediction were one band each in visible, NIR and mid-IR spectrum or the three Tasseled-cap bands. In addition, using either DOQ or IKONOS as training data showed little difference in terms of accuracy predicted by using regression tree algorithm. Applying the regression tree model developed from one urban area to another one with similar geographic settings may be possible provided that the input ETM+ images for both areas are acquired in the same season with little atmospheric impacts (clouds and haze). This spatial extensibility may be beneficial in large-area impervious surface mapping because training/validation data can be quite expensive to obtain, and in some cases, may not even be available. It should be noted however, that we have only tested one pair of cities and the results, hence, are not conclusive. Further tests are needed in other urban areas with different environmental settings (e.g. arid or tropical areas) to fully understand this issue. In this study, all validation of the regression tree models was made through either cross-validation and/or an independently data. For large-area impervious surface mapping, collecting field-based measurements for training/test data is likely cost-prohibitive. High-resolution imagery provides an alternative. It is
U.S. Department of the Interior U.S. Geological Survey 12

important to use a probability-based sampling protocol for selecting validation data from an image. In this way, the validation data will be independent from the training data with minimum spatial auto-correlation (Friedl et al., 2000). In all three tests of varying spatial extent, commission errors in mapped impervious surfaces occurred due to similar spectral properties among bare fields, county roads, some rocks/sand beach and urban built-up areas. This is particularly an issue for large-area mapping and is yet to be resolved. One possible improvement is to develop an accurate urban mask based on satellite imagery with spatial resolution better than 1-kilometer and other ancillary data (e.g. an up-to-date version of the US 2000 Census data). Methods developed from this pilot study have been revised and implemented for the operational phase. The production of NLCD 2000 is proceeding using mapping zones defined based on ecological and environmental characteristics. Subpixel impervious surface estimates of two mapping zones were finished in January 2002 with completion for the entire United States targeted for 2004.
ACKNOWLEDGEMENTS
We acknowledge Nate Herold, David Cunningham and Greg Koeln of Earthsat Corporation who developed a working version of impervious surface mapping and applied it to the Chesapeake Bay areas (under USGS contract number 010112C0012) with Greenhorne & O’Mara Inc. Thanks are due to Daniel Civco, David Nowak and Jeffery Walton for sharing their experiences in remote sensing application of imperviousness mapping. References: Arnold, C.A. Jr. and Gibbons, C.J. (1996), “Impervious Surface Coverage: the Emergence of a Key Urban Environmental Indicator”, Journal of the American Planning Association, Vol. 62(2), pp. 243-258. Breiman, L., Friedman, J., Olshen, R and Stone, C. (1984), Classification and Regression Trees, Chapman and Hall, New York, 358 pp. Campbell, J. B. (1981), “Spatial Correlation Effects upon Accuracy of Supervised Classification of Land Cover”, Photogrammetric Engineering & Remote Sensing, Vol. 47(3): 355-363. Deguchi, C. and Sugio, S. (1994), “Estimations for Impervious Areas by the Use of Remote Sensing Imagery”, Water Science and Technology, Vol. 29(1-2), pp. 135-144.
U.S. Department of the Interior U.S. Geological Survey 13

Elvidge, C.D., Baugh, K.E., Kihn, E.A., Kroehl, H.W., and Davis, E.R. (1997), “Mapping City Light with Nighttime Data from the DMSP Operational Linescan System”, Photogrammetric Engineering & Remote Sensing, Vol. 63(6), pp. 727-734. Flanagan, M. and Civco, D.L. (2001), “Subpixel Impervious Surface Mapping”, in Proceedings, 2001 ASPRS Annual Convention, St. Louis, MO, April 23-27, CD-ROM. Forster, B.C. (1980), “Urban Residential Ground Cover Using Landsat Digital Data”, Photogrammetric Engineering & Remote Sensing, Vol. 46(4), pp. 547-558. Friedl, M. A., Woodcock, C., Gopal, S., Muchoney, D., Strahler, A.H. and Barker-Schaaf, C. (2000), “A Note on Procedures Used for Accuracy Assessment in Land Cover Maps Derived from AVHRR Data”, International Journal of Remote Sensing, Vol. 21, pp.1073-1077. Homer, C., Huang, C., Yang, L., and Wylie, B. (2002), “Development of a Circa 2000 Land cover Database for the United States”, submitted to the 2002 ASPRS Annual Convention. Huang, C. and Townshend, J. R. G. (2002a), “A Stepwise Regression Tree for Nonlinear Approximation: Applications to Estimating Subpixel Land Cover”, International Journal of Remote Sensing, in press. Huang, C., Wylie, B., Yang. L., Homer, C. and Zylstra, G. (2002b), “Derivation of a Tasseled Cap Transformation Based on Landsat 7 at-Satellite Reflectance”, International Journal of Remote Sensing, in press. Irish, R.R. (2000) Landsat 7 Science Data User’s Handbook, Report 430-15-01-003-0, National Aeronautics and Space Administration, http://ltpwww.gsfc.nasa.gov/IAS/handbook/handbook_toc.html. Ji, M.H., and Jensen, J.R. (1999), “Effectiveness of Subpixel Analysis in Detecting and Quantifying Urban Imperviousness from Landsat Thematic Mapper Imagery”, Geocarto International, Vol. 14(4), pp. 31-39. Michie, D., Spiegelhalter, D. J., and Taylor, C. C. (Editors), 1994, Machine Learning, Neural and Statistical Classification (New York: Ellis Horwood), 289 pp.
Phinn, S.R., Stanford, M., Shyy, P.T. and Murray, A. (2000). “A Sub-Pixel Scale Approach for Monitoring the Composition and Condition of Urban Environments Based on the (VIS) Vegetation-Impervious-Surface Model”, 10th Australasian Remote Sensing and Photogrammetry Conference (ARSPC), Adelaide, Australia. Prisloe, S., Lei, Y.J. and Hurd, J. (2001), “Interactive GIS-Based Impervious Surface Model”, 2001 ASPRS Annual Convention, St. Louis, MO, April 23-27, CD-ROM.
U.S. Department of the Interior U.S. Geological Survey 14

Quinlan, J.R., 1993. C4.5 : programs for machine learning. Morgan Kaufmann series in machine learning. Morgan Kaufmann Publishers, San Mateo, CA, 302 pp.
Smith, A. J., Goetz, S.J. and Prince, S.D. (2001), “Subpixel estimates of Impervious Surface Cover from Landsat Thematic Mapper Imagery”, Remote Sensing of Environment, in press. Ridd, M.K. (1995), “Exploring a V-I-S (Vegetation-Impervious surface-Soil) model for Urban Ecosystem Analysis through Remote Sensing: Comparative Anatomy for Cities”, International Journal of Remote Sensing, Vol. 16(12), pp. 2165-2185. Schueler, T.R. (1994), “The Importance of Imperviousness”, Watershed Protection Techniques, Vol. 1(3), pp. 100-111. Vogelmann, J.E., Howard, S.M., Yang, L., Larson, C.R., Wylie, B.K. and Van Driel, N.J. (2001), “Completion of the 1990s national land cover data set for the Conterminous United States from Landsat Thematic Mapper data and ancillary data sources”, Photogrammetric Engineering and Remote Sensing, Vol. 67 (6), pp. 650-662. Wang, Y.Q., Zhang, X. and Lampa, W. (2000), “Improvement of Spatial Accuracy in Natural resources Mapping using Multisensor Remote Sensing and Multisource Spatial Data”, in Proceedings, the 4th International Symposium on Spatial Accuracy Assessment in natural Resources and environmental Sciences, Amsterdam, Netherlands, July, 2000. pp. 723-730. Ward, D., Phinn, S.R. and Murry, A.T. (2000), “Monitoring Growth in Rapidly Urbanized Areas using Remotely Sensed Data”, Professional Geographer, Vol. 52(3), pp. 371-386. Williams, D.J. and Norton, S.B., 2000. “Determining Impervious Surfaces in Satellite Imagery using Digital Orthrophotography”. in Proceedings of the 2000 ASPRS Annual Conference, Washington D.C., May 22-26, 2000, CD-ROM.
U.S. Department of the Interior U.S. Geological Survey 15

List of Figures Figure 1. The proposed procedure for impervious surface mapping using Landsat 7 and high spatial resolution imagery and a regression tree model. Figure 2. Spatial prediction of subpixel percent imperviousness for Sioux Falls, South Dakota, USA. Areas near A is a shopping mall complex, B is in downtown area, and C is within a bare field Figure 3. Histogram and cumulative percentage of absolute error between predicted and actual percent imperviousness using sampled pixels from the Chesapeake Bay study area. Figure 4. Spatial prediction of subpixel percent imperviousness for Richmond, Virginia, USA. Note 4a was from the prediction using the Sioux Falls model whereas 4b was from the Richmond model. Figure 5. Spatial prediction of subpixel percent imperviousness for the Chesapeake Bay study area, USA.
U.S. Department of the Interior U.S. Geological Survey 16
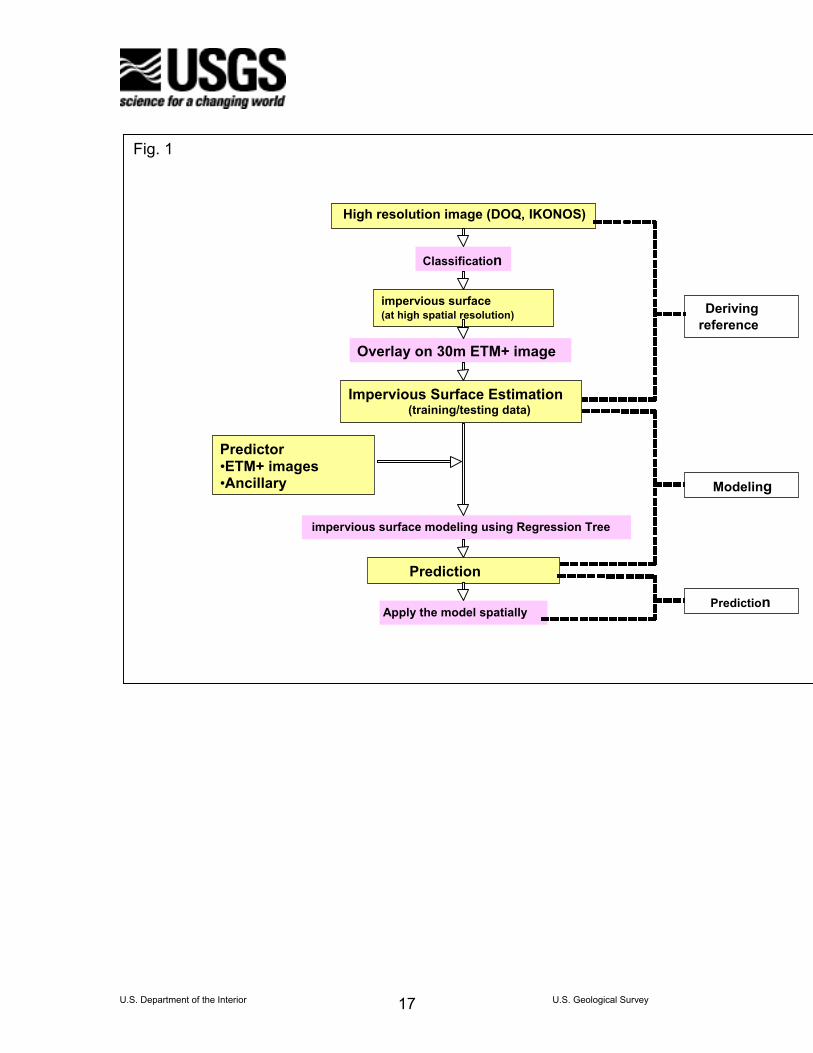
Fig. 1
High resolution image (DOQ, IKONOS) Classification
impervious surface (at high spatial resolution)
Predictor •ETM+ images
Overlay on 30m ETM+ image
Impervious Surface Estimation (training/testing data)
Apply the model spatially
impervious surface modeling using Regression Tree
Deriving reference
Prediction
Modeling
Prediction
•Ancillary
U.S. Department of the Interior U.S. Geological Survey 17
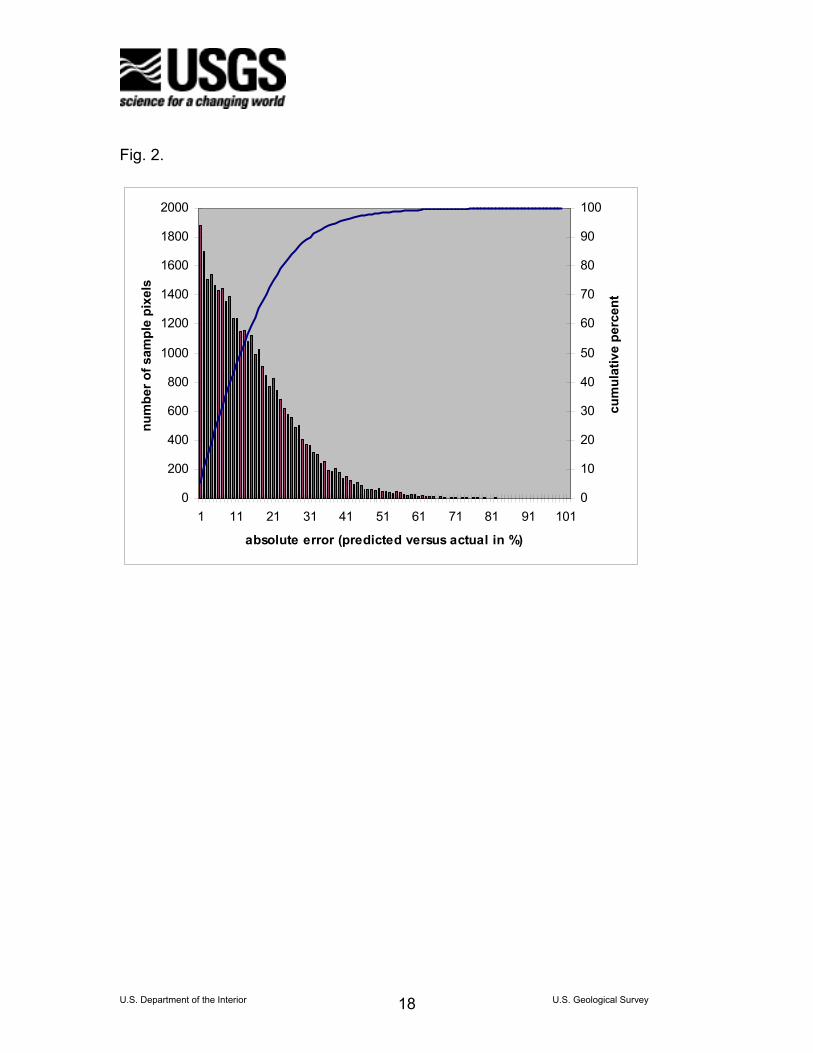
Fig. 2.
0
200
400
600
800
1000
1200
1400
1600
1800
2000
1 11 21 31 41 51 61 71 81 91 101
absolute error (predicted versus actual in %)
num
ber o
f sam
ple
pixe
ls
0
10
20
30
40
50
60
70
80
90
100
cum
ulat
ive
perc
ent
U.S. Department of the Interior U.S. Geological Survey 18
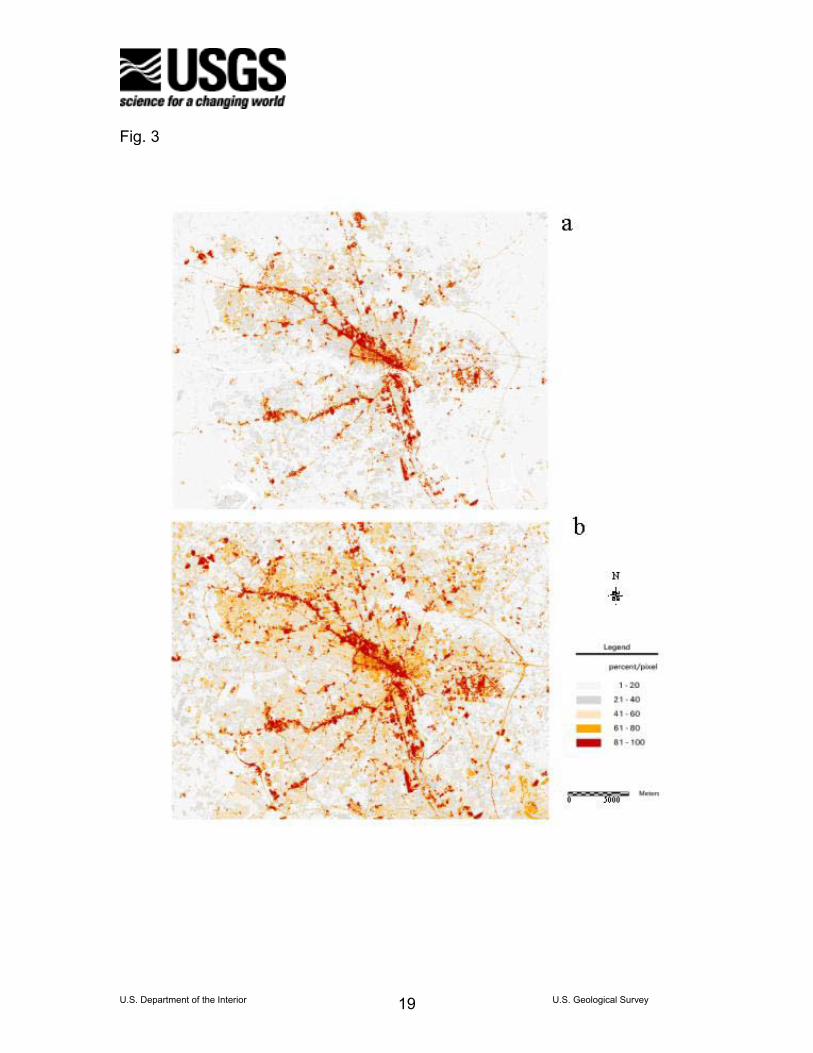
Fig. 3
U.S. Department of the Interior U.S. Geological Survey 19
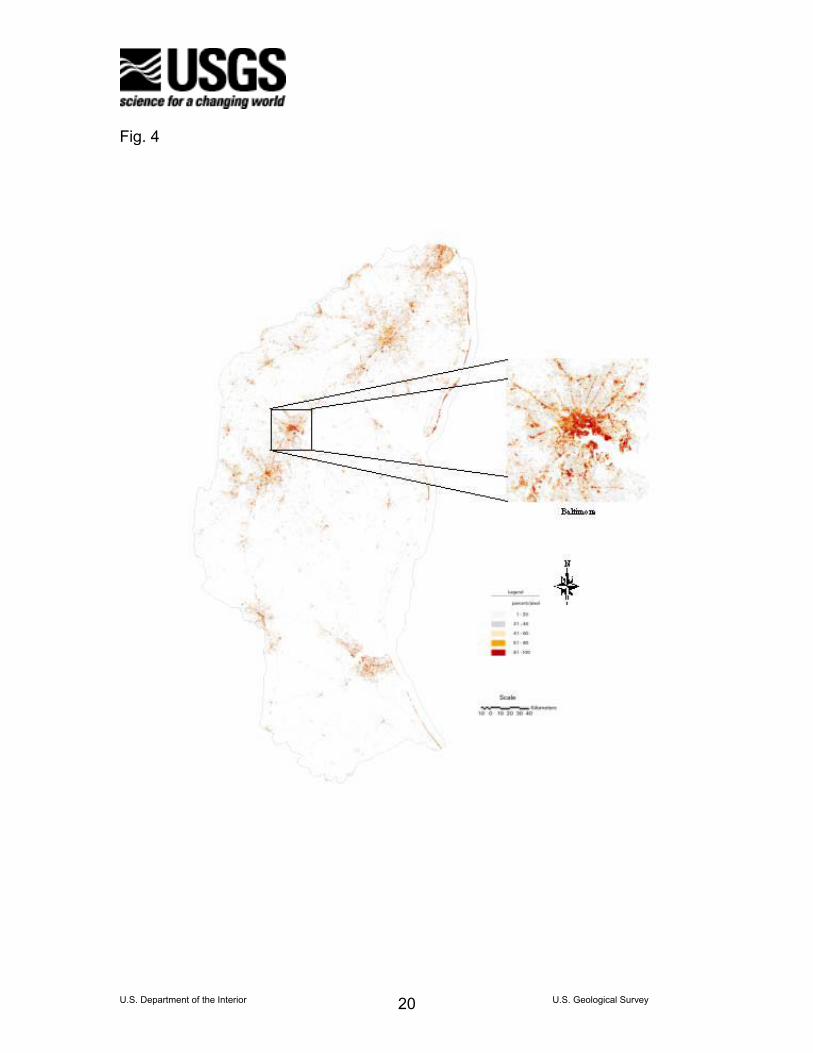
Fig. 4
U.S. Department of the Interior U.S. Geological Survey 20

Fig. 5 Table 1. Landsat 7 ETM+ imagery utilized for imperviousness mapping
Location Path Row Spring Summer Fall Virginia 15 34 Jul. 28, 1999 Nov. 17, 1999 16 34 Jul. 19, 1999 Nov. 8, 1999 Sioux Falls 29
30 June 30, 2000 Oct. 20, 2000
East Coast 14-15 32-35 March-April 2000-2001
July 1999
Sept.-Oct. 1999-2000
U.S. Department of the Interior U.S. Geological Survey 21
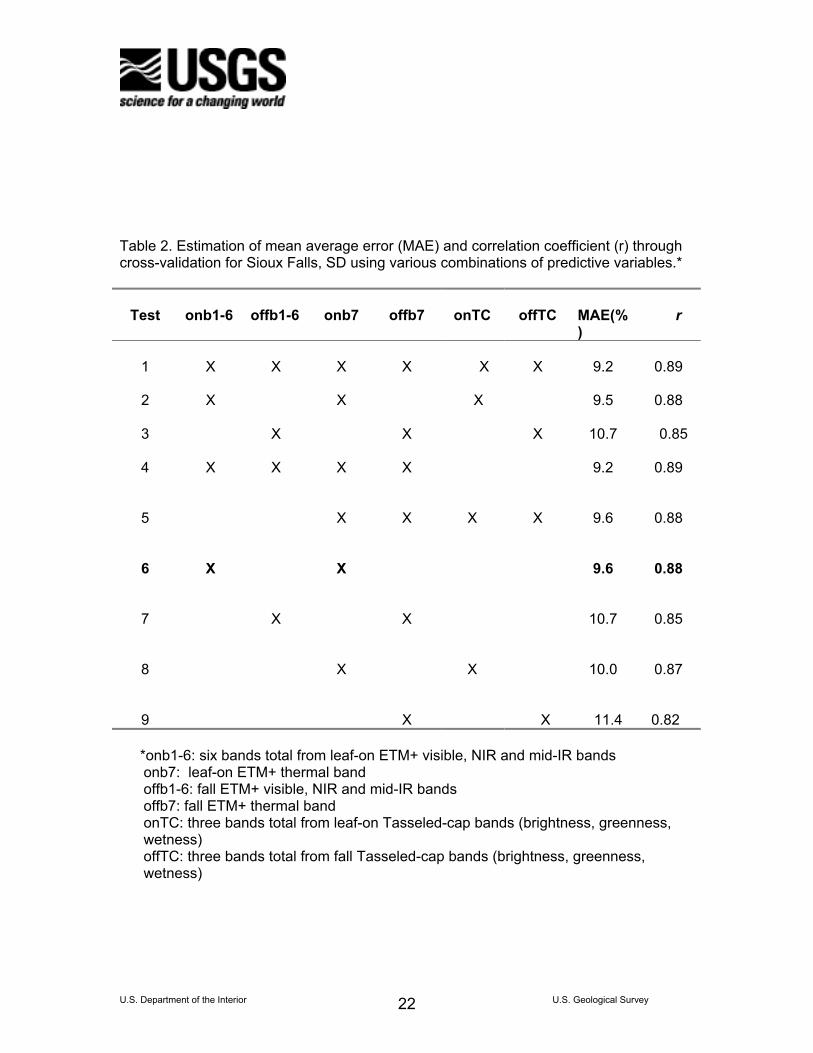
Table 2. Estimation of mean average error (MAE) and correlation coefficient (r) through cross-validation for Sioux Falls, SD using various combinations of predictive variables.*
Test
onb1-6
offb1-6
onb7
offb7
onTC
offTC
MAE(%)
r
1
X
X X X X X 9.2
0.89
2
X
X X 9.5
0.88
3 X X X 10.7 0.85
4
X X
X X
9.2 0.89
5
X X X X 9.6 0.88
6
X
X 9.6 0.88
7
X
X
10.7
0.85
8
X X 10.0 0.87
9 X X 11.4 0.82 *onb1-6: six bands total from leaf-on ETM+ visible, NIR and mid-IR bands
onb7: leaf-on ETM+ thermal band offb1-6: fall ETM+ visible, NIR and mid-IR bands offb7: fall ETM+ thermal band onTC: three bands total from leaf-on Tasseled-cap bands (brightness, greenness, wetness) offTC: three bands total from fall Tasseled-cap bands (brightness, greenness, wetness)
U.S. Department of the Interior U.S. Geological Survey 22
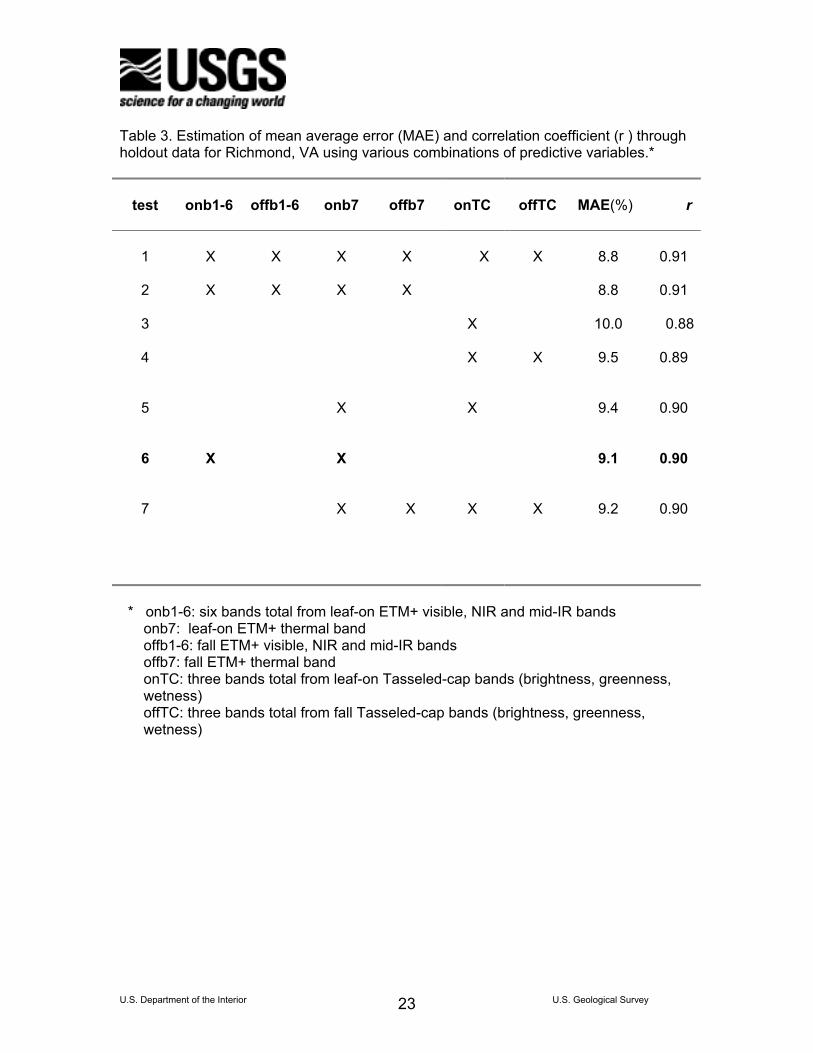
Table 3. Estimation of mean average error (MAE) and correlation coefficient (r ) through holdout data for Richmond, VA using various combinations of predictive variables.*
test
onb1-6
offb1-6
onb7
offb7
onTC
offTC
MAE(%)
r
1
X
X X X X X
8.8
0.91
2
X
X X X
8.8
0.91
3 X 10.0 0.88
4
X X
9.5
0.89
5
X X 9.4 0.90
6
X
X 9.1
0.90
7
X
X X X
9.2
0.90
* onb1-6: six bands total from leaf-on ETM+ visible, NIR and mid-IR bands
onb7: leaf-on ETM+ thermal band offb1-6: fall ETM+ visible, NIR and mid-IR bands offb7: fall ETM+ thermal band onTC: three bands total from leaf-on Tasseled-cap bands (brightness, greenness, wetness) offTC: three bands total from fall Tasseled-cap bands (brightness, greenness, wetness)
U.S. Department of the Interior U.S. Geological Survey 23
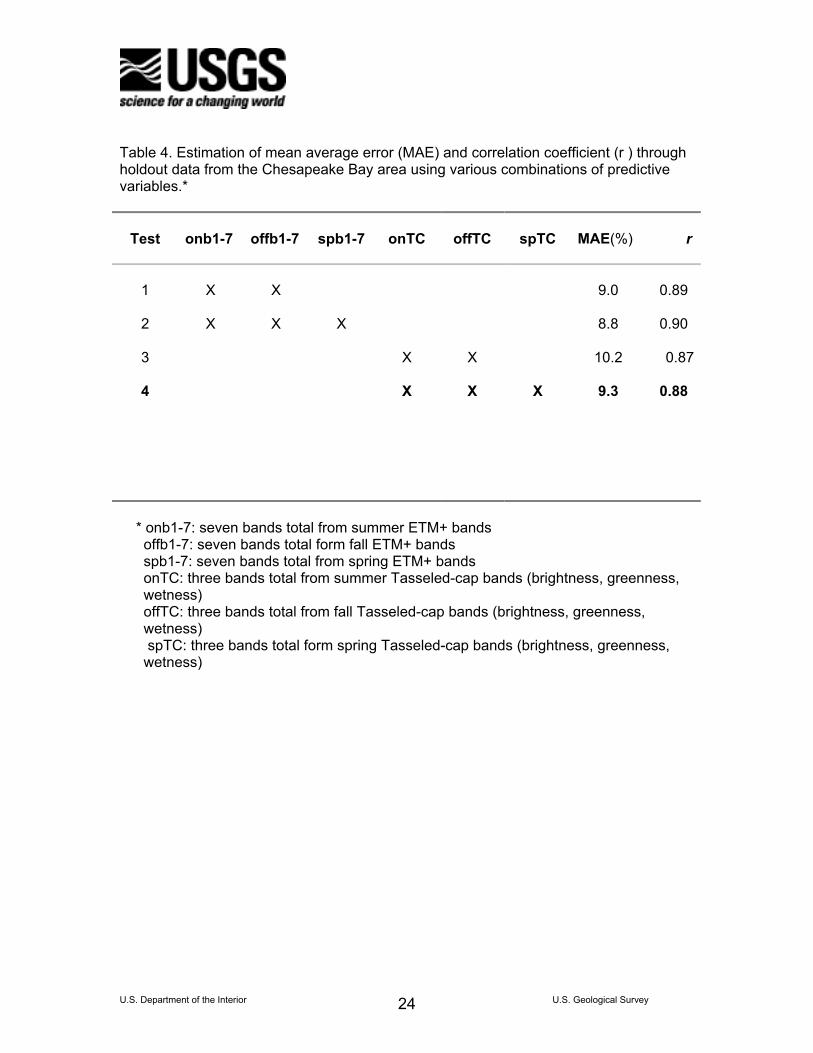
Table 4. Estimation of mean average error (MAE) and correlation coefficient (r ) through holdout data from the Chesapeake Bay area using various combinations of predictive variables.*
Test
onb1-7
offb1-7
spb1-7
onTC
offTC
spTC
MAE(%)
r
1
X
X
9.0
0.89
2
X
X X
8.8
0.90
3 X X 10.2 0.87
4
X X X
9.3
0.88
* onb1-7: seven bands total from summer ETM+ bands
offb1-7: seven bands total form fall ETM+ bands spb1-7: seven bands total from spring ETM+ bands onTC: three bands total from summer Tasseled-cap bands (brightness, greenness, wetness) offTC: three bands total from fall Tasseled-cap bands (brightness, greenness, wetness) spTC: three bands total form spring Tasseled-cap bands (brightness, greenness, wetness)
U.S. Department of the Interior U.S. Geological Survey 24
Related Documents