An Application of Cluster Analysis to HIV/AIDS Prevalence in Nigeria Data clustering is a vital tool when it comes to understanding data items with similar characteristics in a data set for the sake of grouping. Clustering may be for understanding or utility. Clustering for understanding, which is the focus of this work deals with grouping items with common characteristics in order to better understand a dataset and to identify possible or pre-interest sub-groups that could be formed from such data. The HIV prevalence statistics in Nigeria is measured bi-annually across 36 states and FCT which were zoned under 6 geo- political zones happens to be a suitable data to implement this subject matter. Cluster Analysis was implemented through the general methods of Hierarchical (agglomerative nesting) and Partitioning methods (K-Means). These techniques where implemented on the platform of R (Statistical Computing Language) to cluster HIV prevalence rate in Nigeria so as to find out states that could be considered same category and to investigate the concentration of the disease in respect to geo-political zones. Relative type of validation was used for cluster validation (a mechanism for evaluating the correctness of clustering). 2012 Raheem Kabir Kola Department Of Statistics, University Of Abuja, Nigeria 2012

An Application of Cluster Analysis to HIV/AIDS Prevalence in Nigeria
Dec 22, 2015
A research work intend to group HIV/AIDS prevalence within States in Nigeria by means of Cluster Analysis, using R (Statistical Computing Language).
Welcome message from author
This document is posted to help you gain knowledge. Please leave a comment to let me know what you think about it! Share it to your friends and learn new things together.
Transcript
An Application of Cluster Analysis to HIV/AIDS Prevalence in Nigeria Data clustering is a vital tool when it comes to understanding data items with similar characteristics in a data set for the sake of grouping. Clustering may be for understanding or utility. Clustering for understanding, which is the focus of this work deals with grouping items with common characteristics in order to better understand a dataset and to identify possible or pre-interest sub-groups that could be formed from such data. The HIV prevalence statistics in Nigeria is measured bi-annually across 36 states and FCT which were zoned under 6 geo-political zones happens to be a suitable data to implement this subject matter. Cluster Analysis was implemented through the general methods of Hierarchical (agglomerative nesting) and Partitioning methods (K-Means). These techniques where implemented on the platform of R (Statistical Computing Language) to cluster HIV prevalence rate in Nigeria so as to find out states that could be considered same category and to investigate the concentration of the disease in respect to geo-political zones. Relative type of validation was used for cluster validation (a mechanism for evaluating the correctness of clustering).
2012
Raheem Kabir Kola Department Of Statistics, University Of Abuja, Nigeria
2012
1
AN APPLICATION OF CLUSTER ANALYSIS TO HIV/AIDS
PREVALENCE IN NIGERIA
RAHEEM KABIR KOLA
DEPARTMENT OF STATISTICS
FACULTY OF SCIENCE, UNIVERSITY OF ABUJA,
NIGERIA
IN PARTIAL FULFILMENT FOR
THE AWARD OF BACHELOR OF SCIENCE (B.Sc.) DEGREE IN
STATISTICS
2012
2
CHAPTER ONE
INTRODUCTION
1.0 Introduction
Cluster analysis divides data into groups called clusters such that items in the
same cluster are similar while items in different cluster are distinct, the essence of
such grouping may be for understanding or for utility. The first case, clustering for
understanding has to do with understanding the behaviour of data or in some
respect knowing the characteristics that data items may have in common, this is
the focal point of this work. Meanwhile, clustering for utility has to do with
classification of data for further usage or analysis.
Over the years, the world had suffered several deaths due to a virus known as HIV,
several institutes, governments and international organisations had invested a lot
in providing measures to curb the spread of this disease, but till date HIV still
posed a significant challenge among other diseases particularly in Africa. Nigeria
as a case study has second highest number of people living with HIV (CIA World
Factbook, 2012) with an estimate of 3.3 million of its populace which amounts to
about 2% of the entire population. The country has 36 states zoned under 6 geo-
political zones. The HIV prevalence rate is measured periodically across these
states by means of a sentinel survey.
This research work applied the technique of cluster analysis on the platform of R
(statistical computing) to classify the spread of this virus among the populace of
Nigeria. Classification of this information would help to take better decisions as to
what part of the country needs certain attention.
1.1 Objective
This study intends to implement Cluster Analysis using R (Statistical Computing)
and to understand the nature of the spread of Human Immunodeficiency Virus
3
state-wise by classifying the prevalence rate among states and to investigate if
states in a particular geographical location have similar prevalence. These goals
are itemised as follows:
1. Categorize states according to level of prevalence
2. Determine the areas where we have high concentration or dominance
3. Implement Cluster Analysis using R (Statistical Computing) and
4. Make further recommendation on the prevalence of most affected areas.
1.2 Scope
This study is concerned with identifying the possible categories for which Nigerian
states could be categorized by the rate of HIV prevalence among states by means
of cluster analysis. It does not in any way investigate or probe into factors that
could be responsible for concentration of the disease in certain geographical areas
with high concentration or dominance.
The implemented Cluster analysis was based on specific algorithms of
Agglomerative (hierarchical method) and K-means (partitioning method), in which
case all computations were made using the Cluster Library available in R, thus
there is less attention for detail theoretical computations usually involved in
Clustering techniques. Graphs (Dendogram and banner plot) were used in
appropriate places. Advanced concepts, such as model based clustering and
numerical clustering validation is beyond the scope of this work.
The relative type of cluster validation was used in attempt to validate the result of
our clustering.
1.3 Limitation
Research works that depends on data acquired over long periodic circles involving
a large population like Nigeria are likely be challenged by one or two drawbacks.
4
A major restriction to this study is the inability to access sufficient and consistent
data such as quarterly prevalence rate which is as a problem attributable to
inefficient medical system. The HIV Sentinel survey usually commence bi-annually
which forms a sequence of 2 years lag as from 1991, but in 2007, no survey was
conducted until 2008 which resulted in a 3 years lag and altered the sequence.
Also, until 1999 HIV sentinel survey did not cover the entire states in Nigeria. For
this reasons the use of average prevalence rate was employed (average
prevalence rate from 1999 to 2003 and 2005 to 2010).
Unwillingness to disclose HIV status by infected persons due to Stigmatization is
another factor of concern as this restricted the source of data acquisition to
antenatal patients. Therefore the available data may not be a true representation.
5
1.4 Definition of terms
AIDS: Acquired Immune Deficiency Syndrome
Cluster: A cluster is an ordered list of objects, which have some common
characteristics.
Cluster Membership: Items in a particular cluster have same cluster membership.
Cluster Size: number of items or members in a cluster.
Console: command line (not graphical)
Class: A class in an object oriented programming is a construct that serves as a
template for creating, or instantiating, specific objects within a program (plural
classes).
Dendogram: a tree like structure used to display the result of hierarchical
clustering.
Function: A chunk of code written to achieve a particular goal in programming,
usually gives a result in return.
GUI: Graphical User Interface
HIV: Human Immunodeficiency Virus, a retrovirus that causes AIDS.
HSS: HIV Sentinel Survey
IDE: Integrated Development Environment (an interface that enhances
programming and code writing)
Object: is an instance of a class (see class above).
Seroprevalence: is the number of persons in a population who test positive for a
specific disease based on serology (blood serum) specimens
Sentinel survey: a survey system in which a designated group of reporting sources
(hospitals, agencies e.t.c.) from certain geographical location agrees to report all
cases of one or more notifiable conditions for the purpose of acquiring high
quality data.
6
CHAPTER TWO
LITERATURE REVIEW
2.0 HIV prevalence in Nigeria
The HIV and AIDS pandemic have constituted the greatest health challenge in
Nigeria over time. In 2012 Nigeria was adjudged to have the second highest
burden of HIV in the world after South Africa.
Since the first reported case of HIV and AIDS in Nigeria in 1986, the epidemic has
continued to unleash a huge blow on the commonwealth with about 3.3 million
Nigerians currently infected. To respond to this epidemic, the Federal Government
of Nigeria put in place several programmes aimed at controlling and mitigating its
effect. The sole purpose of these intervention programmes is usually the
continuous monitoring of the HIV epidemic via a biennial sentinel survey among
pregnant women at finishing antenatal clinics in Nigeria.
In the African region, active HIV sero-surveillance using pregnant women
attending ante-natal clinics as the survey population is employed in line with the
World Health Organization (WHO) plus the Joint United international locations
Programme on HIV and AIDS (UNAIDS). The HIV sentinel sero-surveillance survey
has been conducted biennially in Nigeria since 1991.
The HIV prevalence in Nigeria had been on a consistent increase from 1.8% in
1991 to 5.8% in 2001 before a decline to 5% in 2003 and 4% in 2005. The report of
the 2005 survey further reaffirms that no state or community is spared this
epidemic. There are wide variations in HIV prevalence among states and between
urban and rural places across the commonwealth. Data resulting from sentinel
survey could be inconclusive to get ready direct comparisons between aggregate
figures acquired inside a several surveys due to differences in location and counts
of survey sites.
7
2.1 Research works on HIV /AIDS
Over the years, there are agencies responsible for monitoring and control of the
HIV/AIDs. Example of such agencies include NACA (National Agency for the
Control of Aids), UNFPA (United Nations Fund for Population Activities), These
agencies organises periodic survey to estimate data needed to investigate the
nature of HIV prevalence and also conduct research works based on specifications
of international organisation such as WHO (World Health Organisation), UNAIDS
(Joint United Nations Programme on HIV/AIDS) and so on.
There is little or no literature on the study HIV Prevalence using Cluster Analysis,
though certain clustering techniques were employed in available works majorly
from Federal Ministry of Health and some HIV/AIDS agencies in the country.
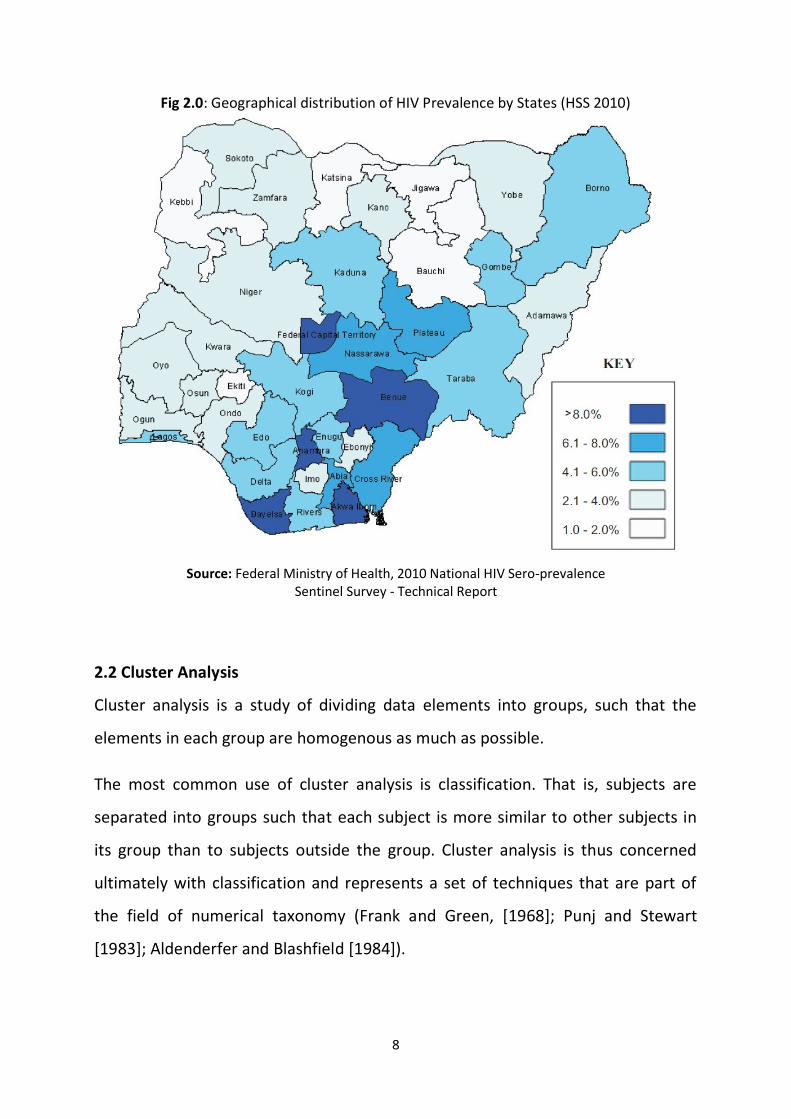
The Federal Ministry of Health, recent research on HIV prevalence presented a
clustering by state of HIV spread in a map view as found in the technical report of
National HIV Sero-prevalence Sentinel Survey 2010 (figure 2.0 below).
8
Fig 2.0: Geographical distribution of HIV Prevalence by States (HSS 2010)
Source: Federal Ministry of Health, 2010 National HIV Sero-prevalence
Sentinel Survey - Technical Report
2.2 Cluster Analysis
Cluster analysis is a study of dividing data elements into groups, such that the
elements in each group are homogenous as much as possible.
The most common use of cluster analysis is classification. That is, subjects are
separated into groups such that each subject is more similar to other subjects in
its group than to subjects outside the group. Cluster analysis is thus concerned
ultimately with classification and represents a set of techniques that are part of
the field of numerical taxonomy (Frank and Green, [1968]; Punj and Stewart
[1983]; Aldenderfer and Blashfield [1984]).
9
Though, Clustering is often confused or used interchangeably with classification,
but the two can be distinguish. In classification the objects are assigned to pre
defined classes or groups, whereas in clustering the classes or groups are also to
be found by the algorithm used. Thus classification is a supervised approach while
clustering is unsupervised.
The term cluster analysis does not identify a particular statistical method or
model, as do discriminant analysis, factor analysis, and regression. We do not have
to make any assumptions about the underlying distribution of the data. Using
cluster analysis, groups of related variables can be formed, similar to the case of
factor analysis. There are numerous ways to sort cases into groups. The choice of
a method depends on the size of the data and other factors. Methods commonly
used for small data sets are impractical for data files with thousands of cases.
CLARA (clustering for large sample) was suggested by Kaufman and Rousseeuw
(1990).
There are generally two major approaches used for clustering, these are
Hierarchical method and Partitioning method.
2.2.1 Hierarchical Clustering
The hierarchical procedures are characterized by the construction of a hierarchy
or tree-like structure. In some methods every single point starts as a unit (single-
point) cluster. At the next level the two closest points are placed in a cluster. At
the next level a third point joins the first two or else a second two-point cluster is
formed, based on different criterion rules for assignment. A popular technique for
hierarchical clustering is the Agglomerative Nesting which is discussed in
subsequent section. The results of hierarchical clustering are usually presented in
a dendogram, this clustering technique relies on dissimilarity (distance) matrix.
10
2.2.1.1 Dissimilarity Matrix:
Dissimilarity matrix (also called distance matrix) describes pairwise distinction
between 𝑝 objects. It is a square symmetrical 𝑝 𝑋 𝑝 matrix with the (ab)th
element equal to the value of a chosen measure of distinction between the (a)th
and the (b)th object. The diagonal elements are either not considered or are
usually equal to zero - i.e. the distinction between an object and itself is
postulated as zero.
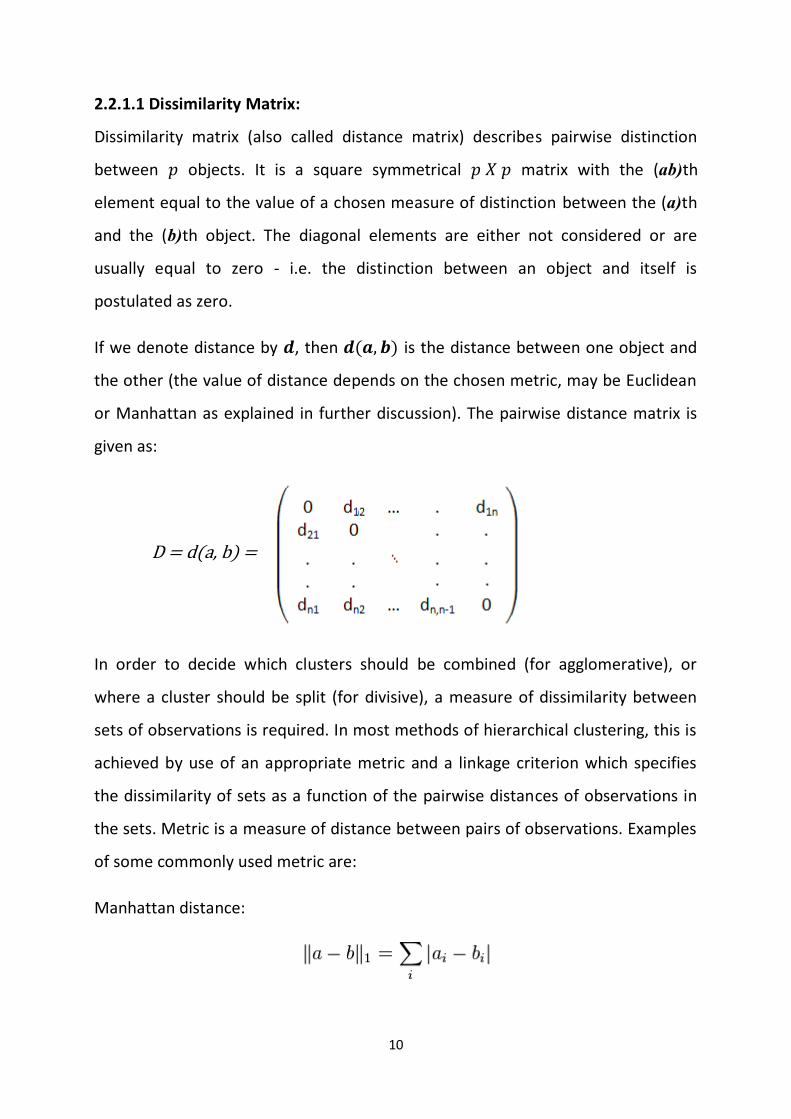
If we denote distance by 𝒅, then 𝒅(𝒂,𝒃) is the distance between one object and
the other (the value of distance depends on the chosen metric, may be Euclidean
or Manhattan as explained in further discussion). The pairwise distance matrix is
given as:
In order to decide which clusters should be combined (for agglomerative), or
where a cluster should be split (for divisive), a measure of dissimilarity between
sets of observations is required. In most methods of hierarchical clustering, this is
achieved by use of an appropriate metric and a linkage criterion which specifies
the dissimilarity of sets as a function of the pairwise distances of observations in
the sets. Metric is a measure of distance between pairs of observations. Examples
of some commonly used metric are:
Manhattan distance:
D = d(a, b) =
11
Euclidean Distance:
Squared Euclidean Distance:
Maximum Distance:
2.2.1.2 Linkage Criteria
Linkage criterion determines how clusters should be formed; it computes the
distance between clusters.
A linkage criterion specifies the dissimilarity of sets as a function of the pairwise
distances of observations in the sets. Metric is a measure of distance between
pairs of observations. Examples of some commonly used linkage are single linkage,
complete linkage and the ward’s method. Some of these methods are discussed
below.
Single Linkage Rule
The single linkage or minimum distance rule starts out by finding the two points
with the minimum distance. These are placed in the first cluster. At the next stage
a third point joins the already-formed cluster of two if the minimum distance to
any of the members of the cluster is smaller than the distance between the two
closest unclustered points. Otherwise, the two closest unclustered points are
placed in a cluster. The process continues until all points end up in one cluster.
The distance between two clusters is defined as the shortest distance from a point
in the first cluster that is closest to a point
12
Complete Linkage Rule
The complete linkage option starts out in just the same way by clustering the two
points with the minimum distance. However, the criterion for joining points to
clusters or clusters to clusters involves maximum (rather than minimum) distance.
That is, a third point joins the already formed cluster of two if the maximum
distance to any of the members of the cluster is smaller than the distance
between the two closest un-clustered points. In other words, the distance
between two clusters is the longest distance from a point in the first cluster to a
point in the second cluster.
Average Linkage
The average linkage option starts out in the same way as the other two. However,
in this case the distance between two clusters is the average distance from points
in the first cluster to points in the second cluster.
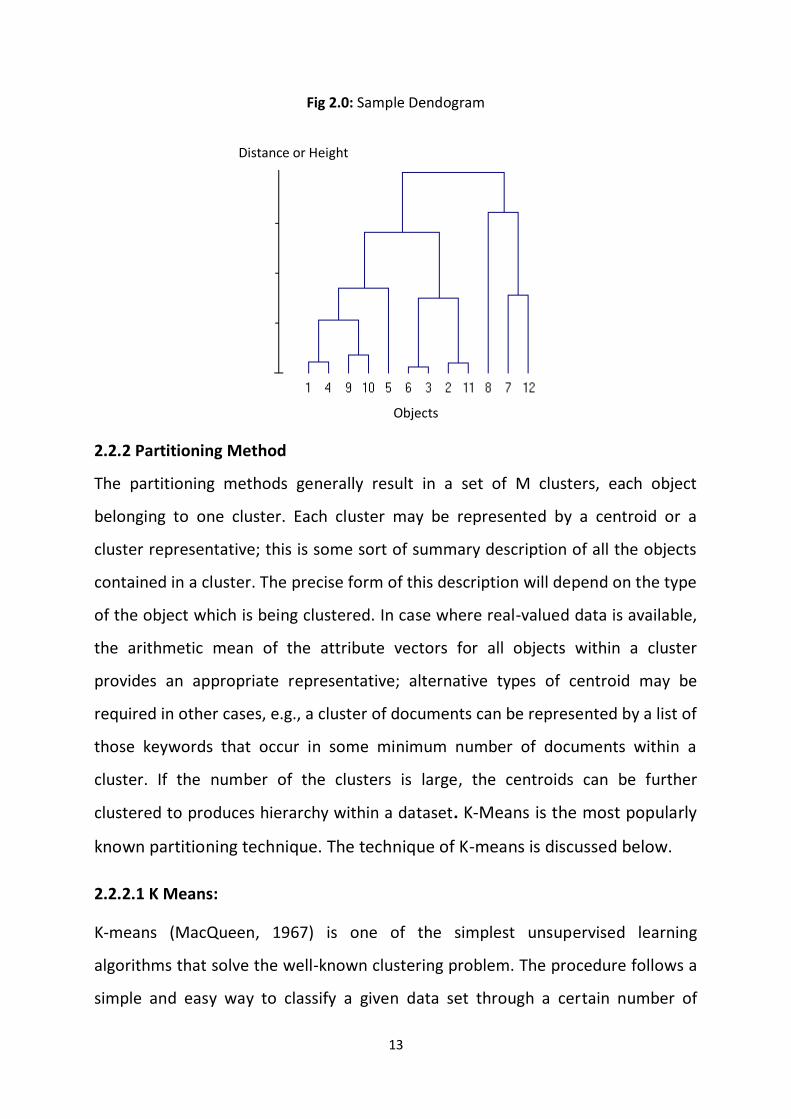
2.2.1.3 Dendogram
A dendogram (from Greek dendron "tree", -gramma "drawing") is a tree diagram
frequently used to illustrate the arrangement of the clusters produced by
hierarchical clustering. Dendograms are often used in computational biology to
illustrate the clustering of genes.
The x-axis of a dendogram usually consists of clusters while the y-axis (height)
denotes the distance between one cluster and the other.
13
Fig 2.0: Sample Dendogram
2.2.2 Partitioning Method
The partitioning methods generally result in a set of M clusters, each object
belonging to one cluster. Each cluster may be represented by a centroid or a
cluster representative; this is some sort of summary description of all the objects
contained in a cluster. The precise form of this description will depend on the type
of the object which is being clustered. In case where real-valued data is available,
the arithmetic mean of the attribute vectors for all objects within a cluster
provides an appropriate representative; alternative types of centroid may be
required in other cases, e.g., a cluster of documents can be represented by a list of
those keywords that occur in some minimum number of documents within a
cluster. If the number of the clusters is large, the centroids can be further
clustered to produces hierarchy within a dataset. K-Means is the most popularly
known partitioning technique. The technique of K-means is discussed below.
2.2.2.1 K Means:
K-means (MacQueen, 1967) is one of the simplest unsupervised learning
algorithms that solve the well-known clustering problem. The procedure follows a
simple and easy way to classify a given data set through a certain number of
Distance or Height
Objects

14
clusters (denoted by k) fixed a priori. The main idea is to define k centroids, one
for each cluster. These centroids are then placed far away from each other as
much as possible. The next step is to take each point belonging to a given data set
and associate it to the nearest centroid. When no point is pending, the first step is
completed and an early groupage is done. At this point we need to re-calculate k
new centroids as barycenters of the clusters resulting from the previous step.
After we have these k new centroids, a new binding has to be done between the
same data set points and the nearest new centroid. A loop has been generated. As
a result of this loop we may notice that the k centroids change their location step
by step until no more changes are done. In other words centroids do not move
any more.
Finally, this algorithm aims at minimizing an objective function, in this case a
squared error function.
A. Algorithm for K-means
1. Place K points into the space represented by the objects that are being
clustered. These points represent initial group centroids.
2. Assign each object to the group that has the closest centroid.
3. When all objects have been assigned, recalculate the positions of the K
centroids.
4. Repeat Steps 2 and 3 until the centroids no longer move. This produces a
separation of the objects into groups from which the metric to be
minimized can be calculated.
B. Benefits of using K-means
1. With a large number of variables, K-Means may be computationally faster
than hierarchical clustering (if K is small).
2. K-Means may produce tighter clusters than hierarchical clustering,
especially if the clusters are globular.
15
C. Drawback of using K-means
1. Difficulty in comparing quality of the clusters produced (e.g. for different
initial partitions or values of K affect outcome).
2. Fixed number of clusters can make it difficult to predict what K should be.
3. Does not work well with non-globular clusters.
4. Different initial partitions can result in different final clusters. It is helpful to
rerun the program using the same as well as different K values, to compare
the results achieved.
2.3 Cluster Validation
Since there are diverse ways of conducting cluster analysis, and each method has
combination of possible alternatives whereby choice of selection depends on
users discretion, there is need to do a check on the resulting output. Cluster
validation has to do with the evaluation of the result obtained in a particular
clustering technique.
Conducting a Cluster Analysis is not much of an easy task but cluster validation is
proven to be more difficult.
“The validation of clustering structures is the most difficult and frustrating part of
cluster analysis. Without a strong effort in this direction, cluster analysis will
remain a black art accessible only to those true believers who have experience
and great courage.” - Algorithms for Clustering Data, Jain and Dubes.
Techniques for validating the result of cluster analysis are generally categorized as
Intrinsic, Extrinsic and Relative. Intrinsic technique uses certain properties()
present in the result of the conducted analysis for evaluation while the Extrinsic
uses parameters outside the result for evaluation. The Relative Technique
evaluates a clustering structure by comparing it to other clustering schemes. The
Relative type of cluster validation was used in attempt to validating the result of
our clustering.
16
CHAPTER THREE
METHODOLOGY
Cluster analysis is a study of dividing data items into groups such that the
elements of each group are homogenous as much as possible. There are basically
two major approaches used for grouping in cluster analysis, these are Hierarchical
and Partitioning method.
For the sake of this work, Agglomerative nesting and K-Means approach which are
methods of Hierarchical and Partitioning clustering would be our focus
3.0 Agglomerative Nesting (Hierarchical)
Agglomerative nesting often called AGNES uses an algorithm in a bottom-up
manner till a single rooted tree like diagram (dendogram) is formed. The algorithm
is as follows:
1. Initially, put each article in its own cluster.
2. Among all current clusters, pick the two clusters with the smallest distance.
3. Replace these two clusters with a new cluster, formed by merging the two
original ones.
4. Repeat the above two steps until there is only one remaining cluster in the
pool.
3.0.1 Distance Measure
In order to compute clustering, a measure of dissimilarity between sets of
observations is required. This is sometime refers to as proximity matrix (a matrix
of distance measure which could either be similarity measure or dissimilarity
measure as in the case of hierarchical clustering). The proximity matrix is achieved
by use of an appropriate metric such as Euclidean distance and Manhattan
distance measures.
17
Euclidean distance: is an inter point distance, it takes the magnitude of the
expression data into account and therefore, preserves more information about
the data. Euclidean distance is the length of the shortest path between two points
and required standardization when used. Mathematically given as:
Manhattan Distance:
The Manhattan distance also known as the City-Block distance is the sum of
distances along each dimension. This distance measure corresponds to the
distance of travel between two points. By formula:
The cluster analysis computation of this work uses the Manhattan distance.
3.0.2 Ward’s Linkage Criterion
Linkage criterion determines how clusters should be formed; it computes the
distance between clusters.
Ward's method is a criterion applied in hierarchical cluster analysis. Ward's
minimum variance method is a special case of the objective function approach
originally presented by Joe H. Ward, Jr. (1963). Ward suggested a general
agglomerative hierarchical clustering procedure, where the criterion for choosing
the pair of clusters to merge at each step is based on the optimal value of an
objective function
Ward's minimum variance criterion minimizes the total within-cluster variance. At
each step the pair of clusters with minimum cluster distance are merged
18
This method is distinct from other methods because it uses an analysis of variance
approach to evaluate the distances between clusters. In general, this method is
considered very efficient.
3.0.3 Agglomerative Coefficient
Agnes computes a coefficient, called Agglomerative Coefficient (AC), which
measures the clustering structure of the data set.
Agglomerative Coefficient is a dimensionless quantity, varying between 0 and 1.
When AC is close to 1 there is an indication that a very clear structuring has been
found. Otherwise when AC is close to 0 it indicates that the algorithm has not
found a natural structure. In other words, the data consists of only one big cluster.
3.1 K-Means (Partitioning)
This is a method of cluster analysis which aims to partition n observations into k
clusters in which each observation belongs to the cluster with the nearest mean.
K-means is a prototyped based approach that requires that the number of cluster
be specified before the analysis is conducted.
Determining number of cluster to specify is a major challenge of using the k-
means. There are several theories on how to compute and obtain the appropriate
number; these would not be discussed since it is beyond the scope of this work.
There is a Rule of thumb for convenience sake which is an estimate given as:
𝑘 ≈ 𝑛/2
Where: 𝑘 – Number of clusters to specify
𝑛 – Sample size
3.2 R-Console
R-console is a platform independent open source package built for statistical
computing. It based on object oriented programming (works with objects and
classes). The power of R lies in the flexibility to write customized functions and
classes that makes up an R package. This feature of R makes it possible to have
19
thousands of packages by several developers. These packages are known as
LIBRARY. These Libraries can be found on CRAN (Comprehensive R Archive
Network).
The cluster library in R consists of all required function for cluster analysis
computation. The cluster library is usually invoked with the function
library(cluster)
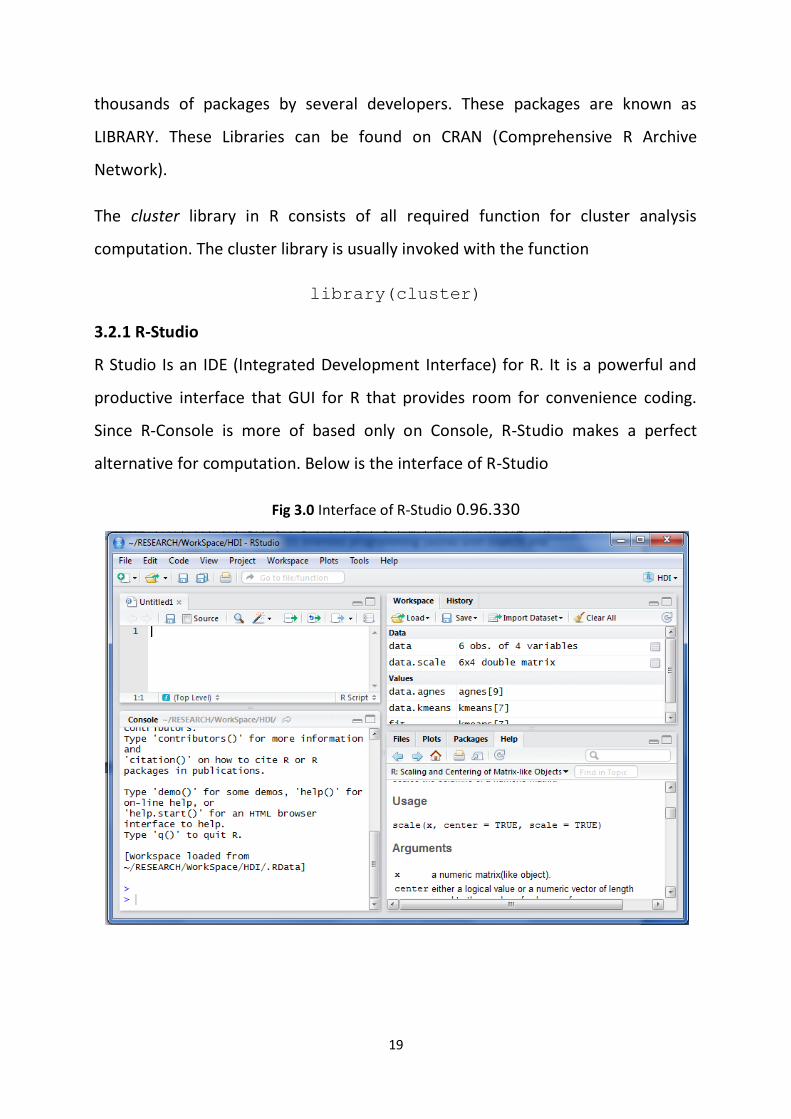
3.2.1 R-Studio
R Studio Is an IDE (Integrated Development Interface) for R. It is a powerful and
productive interface that GUI for R that provides room for convenience coding.
Since R-Console is more of based only on Console, R-Studio makes a perfect
alternative for computation. Below is the interface of R-Studio
Fig 3.0 Interface of R-Studio 0.96.330
20
CHAPTER FOUR
DATA PRESENTATION AND ANALYSIS
This section discussed the detail examination and explanation of the findings
made at the process of this work. Graphical Illustrations were employed to depict
the result of findings.
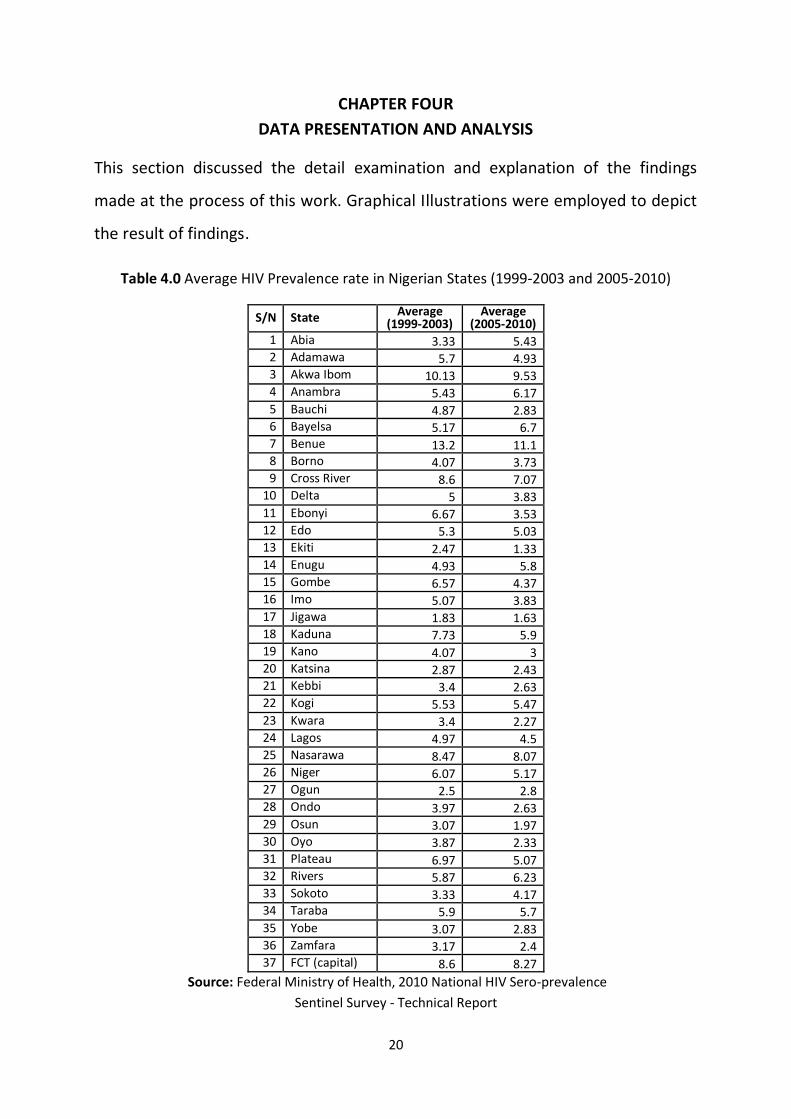
Table 4.0 Average HIV Prevalence rate in Nigerian States (1999-2003 and 2005-2010)
S/N State Average (1999-2003)
Average (2005-2010)
1 Abia 3.33 5.43 2 Adamawa 5.7 4.93 3 Akwa Ibom 10.13 9.53 4 Anambra 5.43 6.17 5 Bauchi 4.87 2.83 6 Bayelsa 5.17 6.7 7 Benue 13.2 11.1 8 Borno 4.07 3.73 9 Cross River 8.6 7.07
10 Delta 5 3.83 11 Ebonyi 6.67 3.53 12 Edo 5.3 5.03 13 Ekiti 2.47 1.33 14 Enugu 4.93 5.8 15 Gombe 6.57 4.37 16 Imo 5.07 3.83 17 Jigawa 1.83 1.63 18 Kaduna 7.73 5.9 19 Kano 4.07 3 20 Katsina 2.87 2.43 21 Kebbi 3.4 2.63 22 Kogi 5.53 5.47 23 Kwara 3.4 2.27 24 Lagos 4.97 4.5 25 Nasarawa 8.47 8.07 26 Niger 6.07 5.17 27 Ogun 2.5 2.8 28 Ondo 3.97 2.63 29 Osun 3.07 1.97 30 Oyo 3.87 2.33 31 Plateau 6.97 5.07 32 Rivers 5.87 6.23 33 Sokoto 3.33 4.17 34 Taraba 5.9 5.7 35 Yobe 3.07 2.83 36 Zamfara 3.17 2.4 37 FCT (capital) 8.6 8.27
Source: Federal Ministry of Health, 2010 National HIV Sero-prevalence
Sentinel Survey - Technical Report
21
The table 4.0 above shows the average HIV prevalence rate across the 36 states of
the Federal Republic of Nigeria, adopted from the technical report by Federal
Ministry of health, 2010 National HIV Sero-prevalence Sentinel Survey. The states
would be taken for objects while the periods (i.e. 1999-2003 and 2005-2010)
represent the variables.
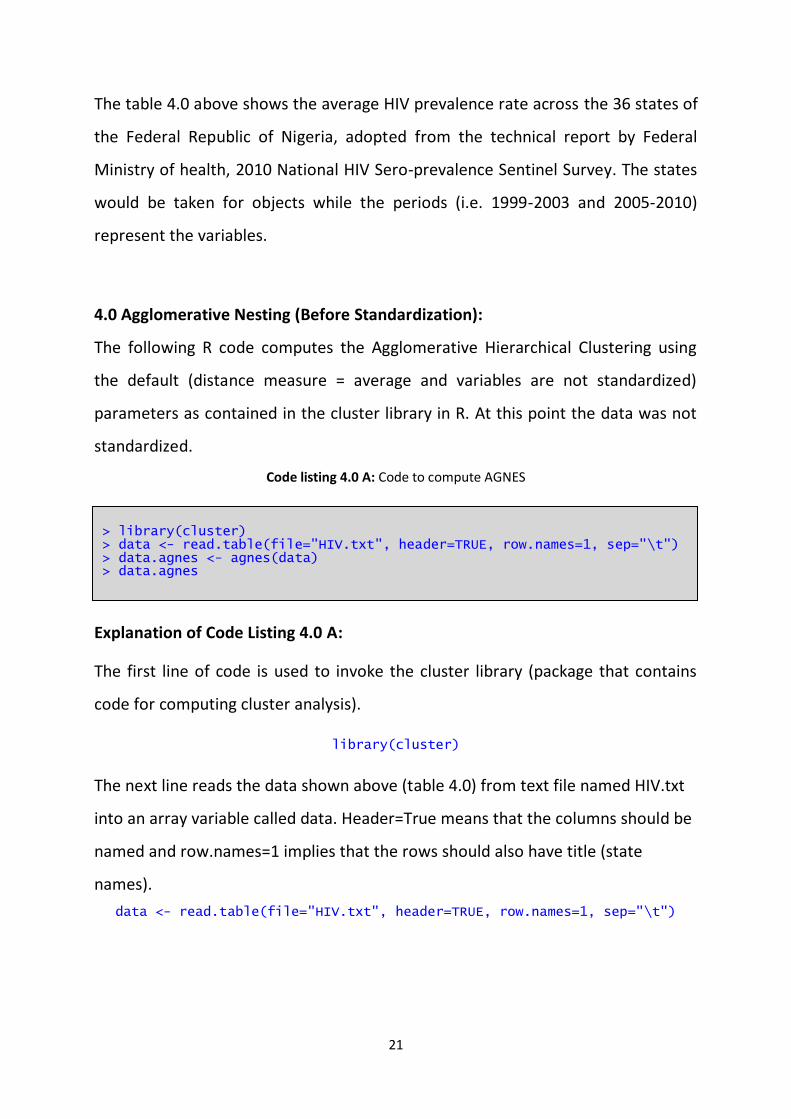
4.0 Agglomerative Nesting (Before Standardization):
The following R code computes the Agglomerative Hierarchical Clustering using
the default (distance measure = average and variables are not standardized)
parameters as contained in the cluster library in R. At this point the data was not
standardized.
Code listing 4.0 A: Code to compute AGNES
Explanation of Code Listing 4.0 A:
The first line of code is used to invoke the cluster library (package that contains
code for computing cluster analysis).
library(cluster)
The next line reads the data shown above (table 4.0) from text file named HIV.txt
into an array variable called data. Header=True means that the columns should be
named and row.names=1 implies that the rows should also have title (state
names).
data <- read.table(file="HIV.txt", header=TRUE, row.names=1, sep="\t")
> library(cluster) > data <- read.table(file="HIV.txt", header=TRUE, row.names=1, sep="\t") > data.agnes <- agnes(data) > data.agnes
22
The line of code below creates and object called data.agnes (an instance of agnes
class). Where agnes implies Agglomerative nesting
data.agnes <- agnes(data)
The last line (data.agnes) executes the agnes computation.
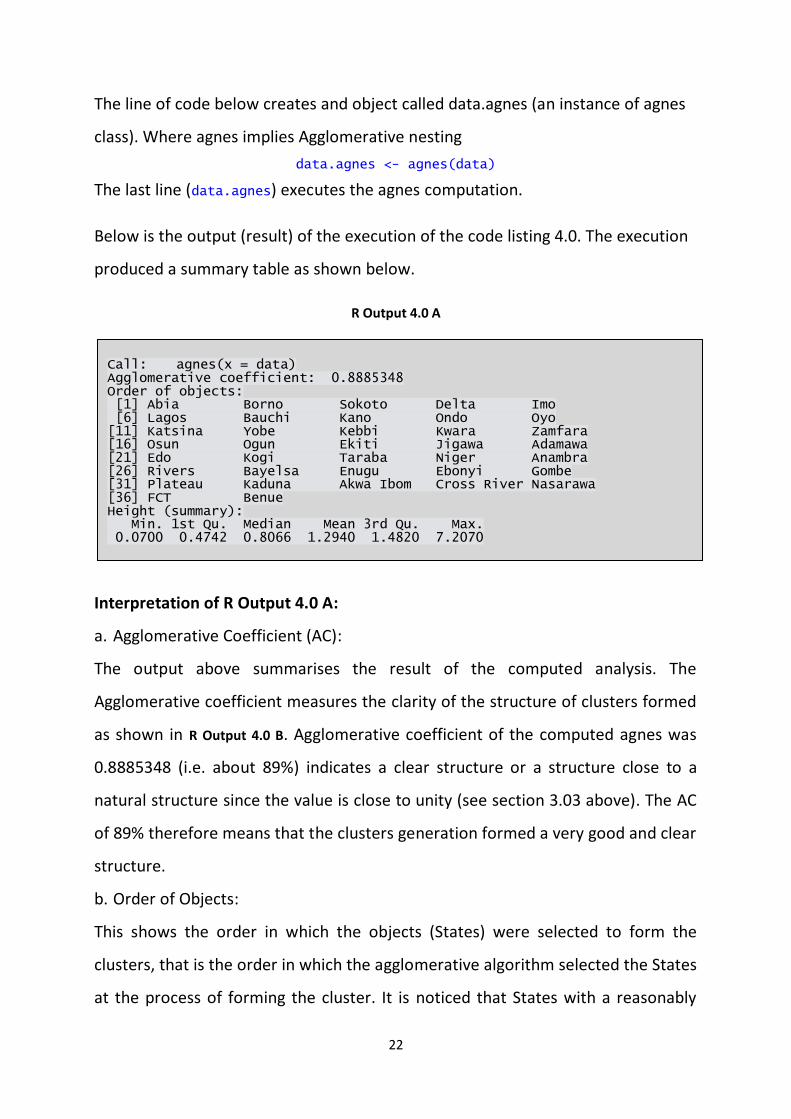
Below is the output (result) of the execution of the code listing 4.0. The execution
produced a summary table as shown below.
R Output 4.0 A
Interpretation of R Output 4.0 A:
a. Agglomerative Coefficient (AC):
The output above summarises the result of the computed analysis. The
Agglomerative coefficient measures the clarity of the structure of clusters formed
as shown in R Output 4.0 B. Agglomerative coefficient of the computed agnes was
0.8885348 (i.e. about 89%) indicates a clear structure or a structure close to a
natural structure since the value is close to unity (see section 3.03 above). The AC
of 89% therefore means that the clusters generation formed a very good and clear
structure.
b. Order of Objects:
This shows the order in which the objects (States) were selected to form the
clusters, that is the order in which the agglomerative algorithm selected the States
at the process of forming the cluster. It is noticed that States with a reasonably
Call: agnes(x = data) Agglomerative coefficient: 0.8885348 Order of objects: [1] Abia Borno Sokoto Delta Imo [6] Lagos Bauchi Kano Ondo Oyo [11] Katsina Yobe Kebbi Kwara Zamfara [16] Osun Ogun Ekiti Jigawa Adamawa [21] Edo Kogi Taraba Niger Anambra [26] Rivers Bayelsa Enugu Ebonyi Gombe [31] Plateau Kaduna Akwa Ibom Cross River Nasarawa [36] FCT Benue Height (summary): Min. 1st Qu. Median Mean 3rd Qu. Max. 0.0700 0.4742 0.8066 1.2940 1.4820 7.2070
23
low or average prevalence rate were found at the top of the ordering while States
with high prevalence were towards the end. Though this seem to look as if the
States were arranged in ascending order of prevalence rate, but it does not exactly
appear that way. Further result shed more light to the ordering. This ordering
appears as nodes of the dendogram in R Output 4.0 B.
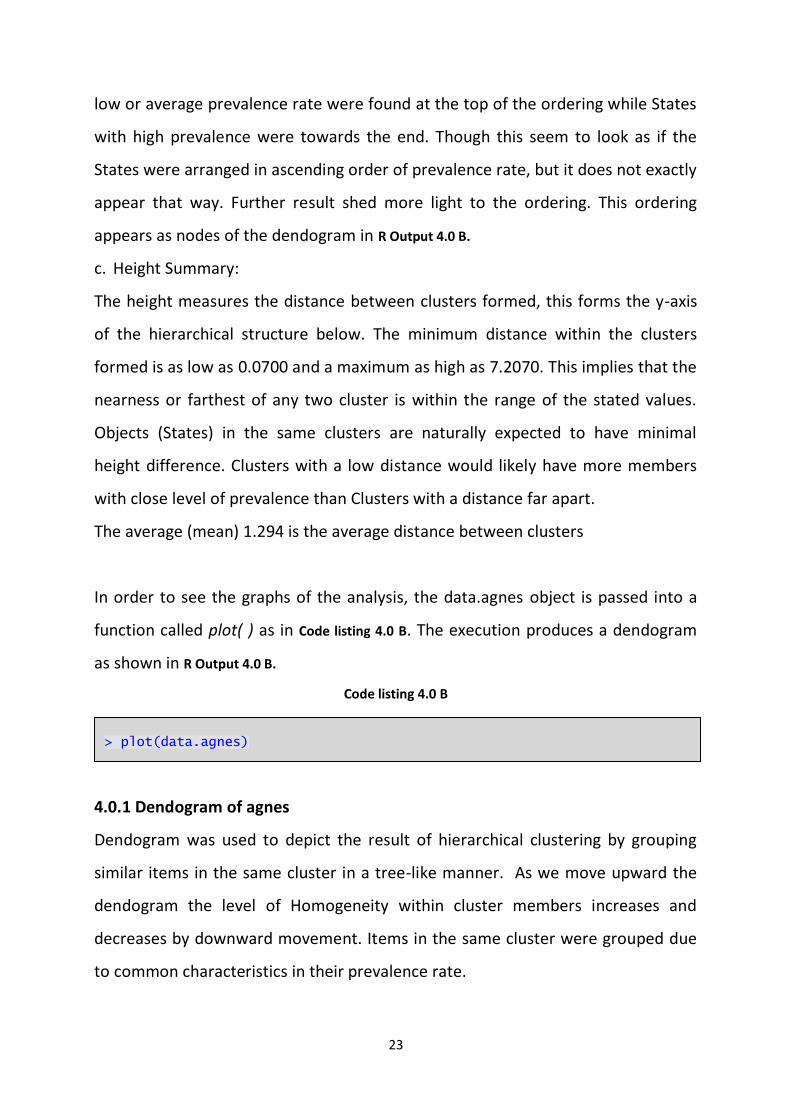
c. Height Summary:
The height measures the distance between clusters formed, this forms the y-axis
of the hierarchical structure below. The minimum distance within the clusters
formed is as low as 0.0700 and a maximum as high as 7.2070. This implies that the
nearness or farthest of any two cluster is within the range of the stated values.
Objects (States) in the same clusters are naturally expected to have minimal
height difference. Clusters with a low distance would likely have more members
with close level of prevalence than Clusters with a distance far apart.
The average (mean) 1.294 is the average distance between clusters
In order to see the graphs of the analysis, the data.agnes object is passed into a
function called plot( ) as in Code listing 4.0 B. The execution produces a dendogram
as shown in R Output 4.0 B.
Code listing 4.0 B
4.0.1 Dendogram of agnes
Dendogram was used to depict the result of hierarchical clustering by grouping
similar items in the same cluster in a tree-like manner. As we move upward the
dendogram the level of Homogeneity within cluster members increases and
decreases by downward movement. Items in the same cluster were grouped due
to common characteristics in their prevalence rate.
> plot(data.agnes)
24
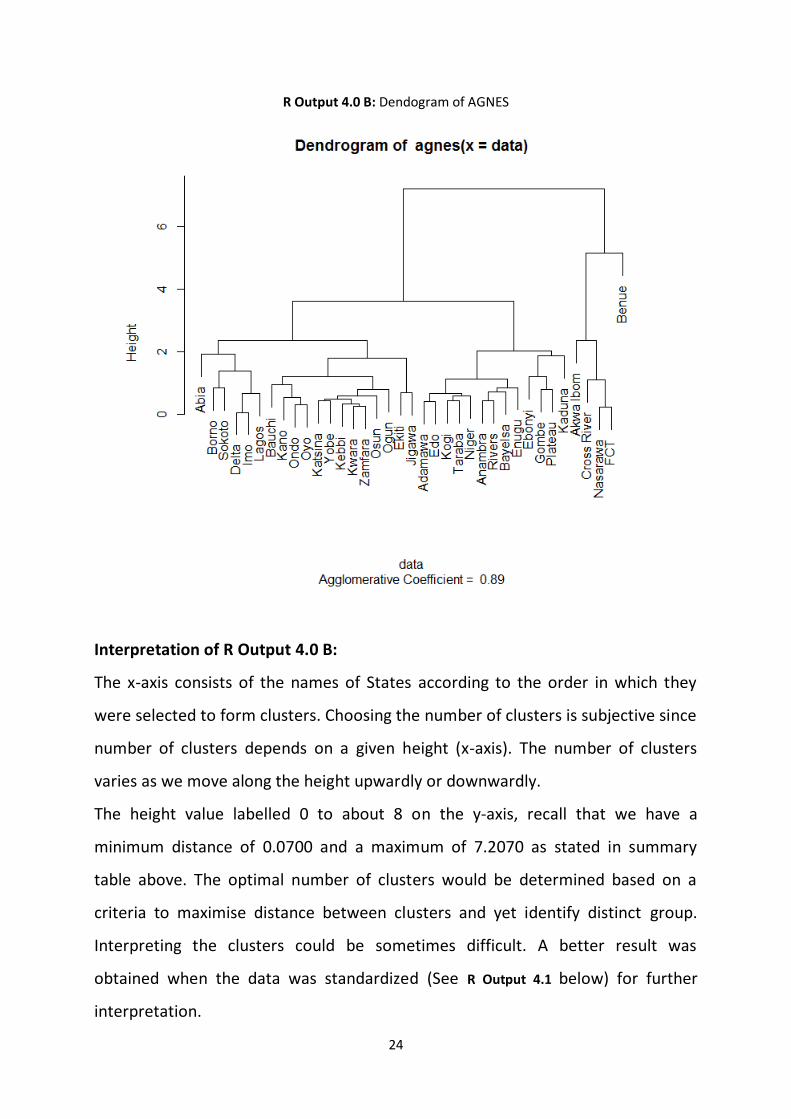
R Output 4.0 B: Dendogram of AGNES
Interpretation of R Output 4.0 B:
The x-axis consists of the names of States according to the order in which they
were selected to form clusters. Choosing the number of clusters is subjective since
number of clusters depends on a given height (x-axis). The number of clusters
varies as we move along the height upwardly or downwardly.
The height value labelled 0 to about 8 on the y-axis, recall that we have a
minimum distance of 0.0700 and a maximum of 7.2070 as stated in summary
table above. The optimal number of clusters would be determined based on a
criteria to maximise distance between clusters and yet identify distinct group.
Interpreting the clusters could be sometimes difficult. A better result was
obtained when the data was standardized (See R Output 4.1 below) for further
interpretation.
25
4.1 Agglomerative Nesting (after Standardization)
After computing the agglomerative nesting (agnes) with the un-standardised data,
the analysis was re-computed with the standardised data this is to ensure that one
variable do not dominate the analysis.
The code listing 4.1 was used to execute the agnes specifying the distance
measure (Manhattan) and enforcing that the data be standardized with the
Ward’s method of linkage as in the next line.
metric=”manhattan”, methord=”ward”, stand=TRUE
Code listing 4.1 A
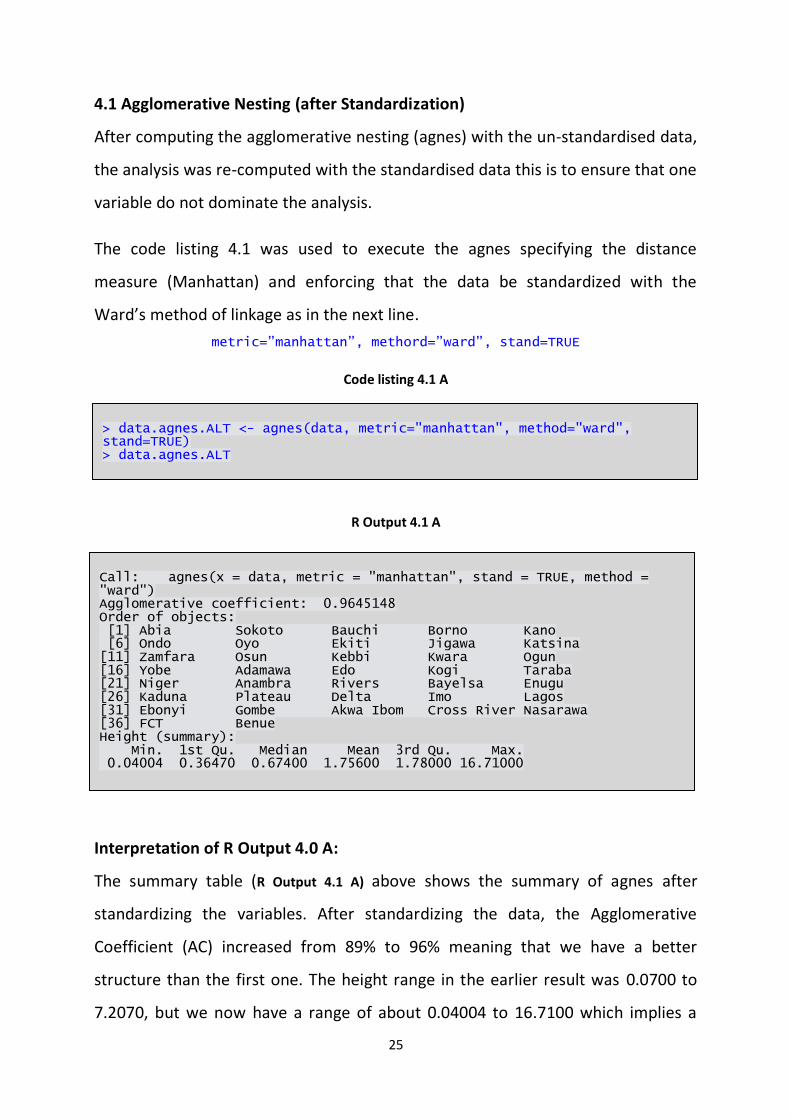
R Output 4.1 A
Interpretation of R Output 4.0 A:
The summary table (R Output 4.1 A) above shows the summary of agnes after
standardizing the variables. After standardizing the data, the Agglomerative
Coefficient (AC) increased from 89% to 96% meaning that we have a better
structure than the first one. The height range in the earlier result was 0.0700 to
7.2070, but we now have a range of about 0.04004 to 16.7100 which implies a
> data.agnes.ALT <- agnes(data, metric="manhattan", method="ward", stand=TRUE) > data.agnes.ALT
Call: agnes(x = data, metric = "manhattan", stand = TRUE, method = "ward") Agglomerative coefficient: 0.9645148 Order of objects: [1] Abia Sokoto Bauchi Borno Kano [6] Ondo Oyo Ekiti Jigawa Katsina [11] Zamfara Osun Kebbi Kwara Ogun [16] Yobe Adamawa Edo Kogi Taraba [21] Niger Anambra Rivers Bayelsa Enugu [26] Kaduna Plateau Delta Imo Lagos [31] Ebonyi Gombe Akwa Ibom Cross River Nasarawa [36] FCT Benue Height (summary): Min. 1st Qu. Median Mean 3rd Qu. Max. 0.04004 0.36470 0.67400 1.75600 1.78000 16.71000
26
wider difference between clusters. This enhances the aim of maximizing the inter-
cluster distance. Several changes were also noticed in the order of objects.
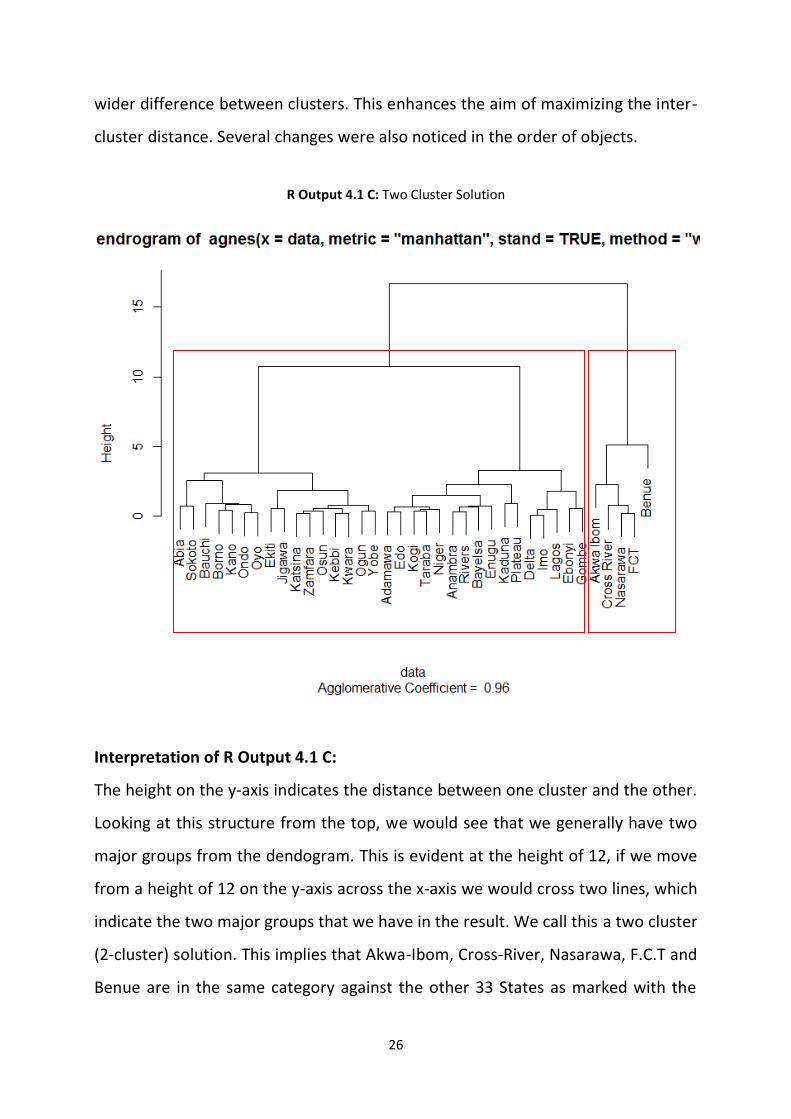
R Output 4.1 C: Two Cluster Solution
Interpretation of R Output 4.1 C:
The height on the y-axis indicates the distance between one cluster and the other.
Looking at this structure from the top, we would see that we generally have two
major groups from the dendogram. This is evident at the height of 12, if we move
from a height of 12 on the y-axis across the x-axis we would cross two lines, which
indicate the two major groups that we have in the result. We call this a two cluster
(2-cluster) solution. This implies that Akwa-Ibom, Cross-River, Nasarawa, F.C.T and
Benue are in the same category against the other 33 States as marked with the
27
red rectangles. A reflection of this is showed on the average prevalence rate;
these states have the highest prevalence rates.
As we move down the dendogram and read the line in the same manner used to
obtain a 2-Cluster solution above, we would encounter more clusters. The
dendogram was further analysed below.
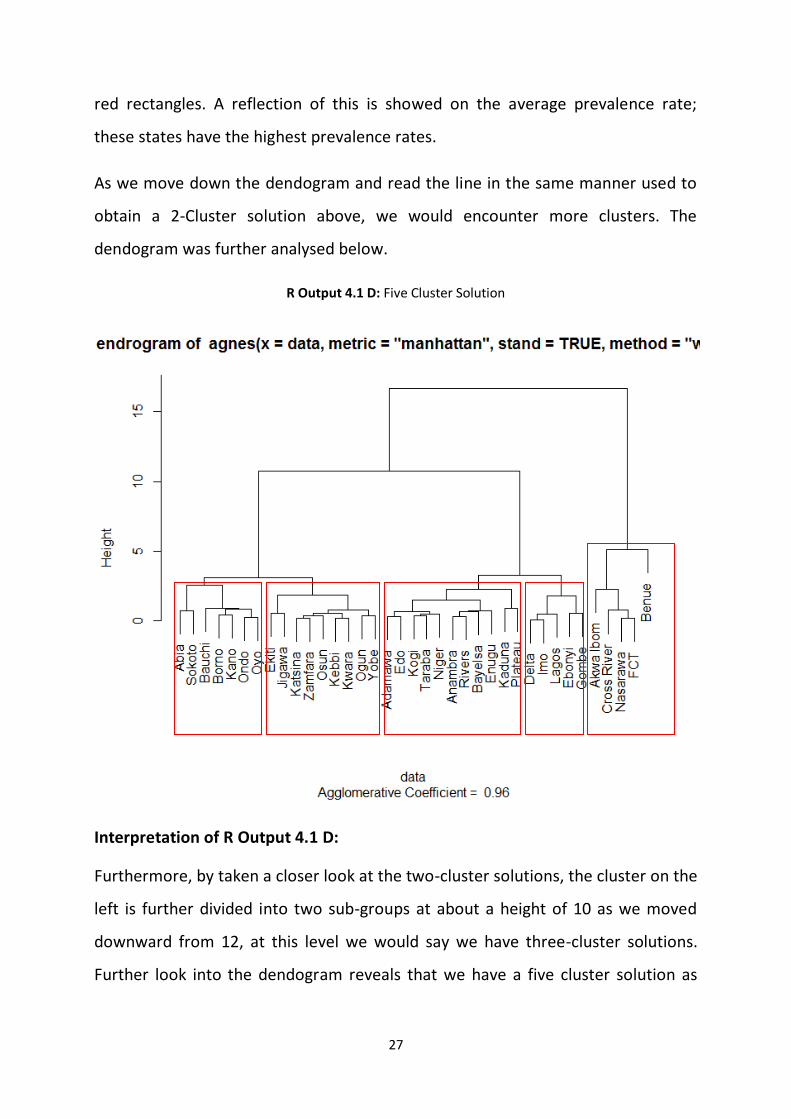
R Output 4.1 D: Five Cluster Solution
Interpretation of R Output 4.1 D:
Furthermore, by taken a closer look at the two-cluster solutions, the cluster on the
left is further divided into two sub-groups at about a height of 10 as we moved
downward from 12, at this level we would say we have three-cluster solutions.
Further look into the dendogram reveals that we have a five cluster solution as
28
shown in the figure R Output 4.1 D above. At this point, the States are distributes in 5
clusters of sizes 7, 9, 11, 5, and 5 taking each group from the left.
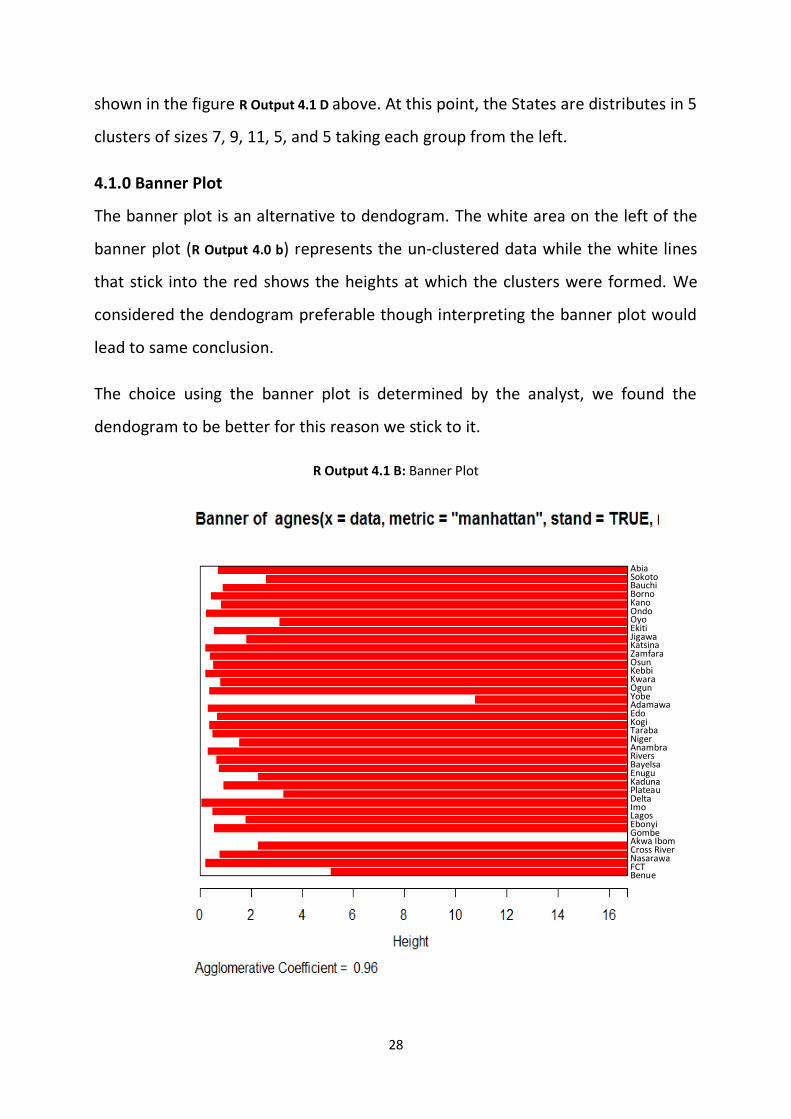
4.1.0 Banner Plot
The banner plot is an alternative to dendogram. The white area on the left of the
banner plot (R Output 4.0 b) represents the un-clustered data while the white lines
that stick into the red shows the heights at which the clusters were formed. We
considered the dendogram preferable though interpreting the banner plot would
lead to same conclusion.
The choice using the banner plot is determined by the analyst, we found the
dendogram to be better for this reason we stick to it.
R Output 4.1 B: Banner Plot
Abia Sokoto Bauchi Borno Kano Ondo Oyo Ekiti Jigawa Katsina Zamfara Osun Kebbi Kwara Ogun Yobe Adamawa Edo Kogi Taraba Niger Anambra Rivers Bayelsa Enugu Kaduna Plateau Delta Imo Lagos Ebonyi Gombe Akwa Ibom Cross River Nasarawa FCT Benue
29
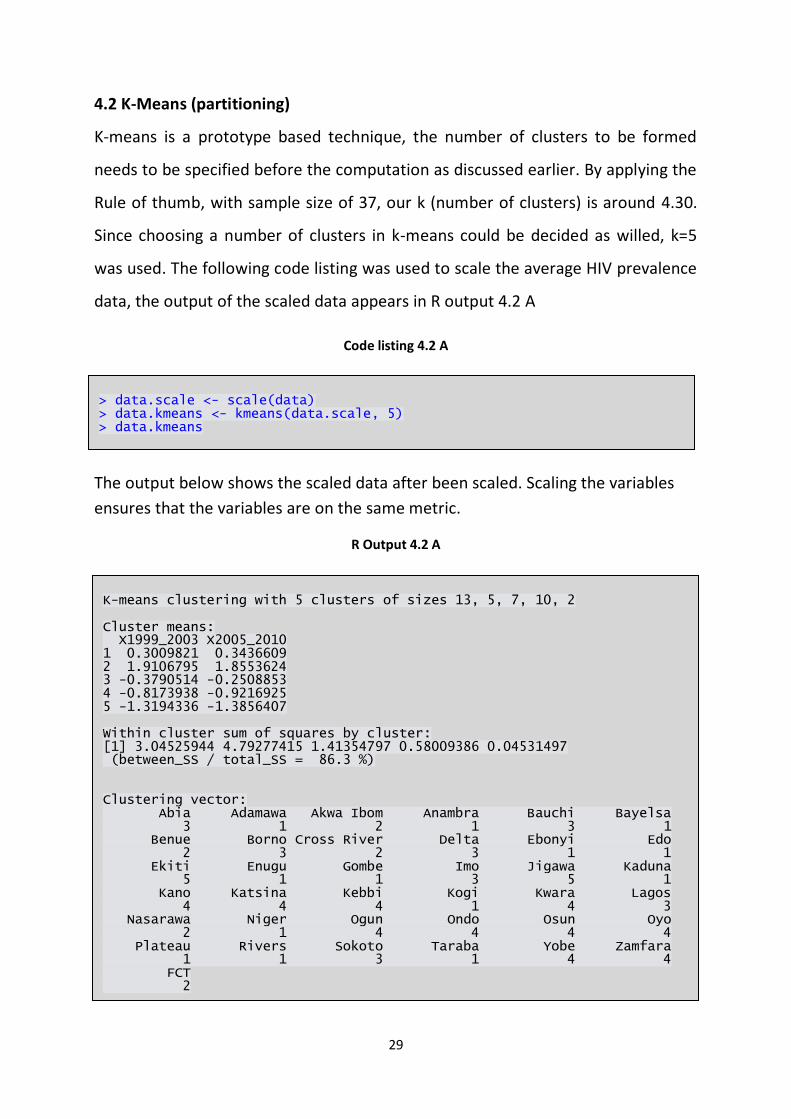
4.2 K-Means (partitioning)
K-means is a prototype based technique, the number of clusters to be formed
needs to be specified before the computation as discussed earlier. By applying the
Rule of thumb, with sample size of 37, our k (number of clusters) is around 4.30.
Since choosing a number of clusters in k-means could be decided as willed, k=5
was used. The following code listing was used to scale the average HIV prevalence
data, the output of the scaled data appears in R output 4.2 A
Code listing 4.2 A
K MEANS
The output below shows the scaled data after been scaled. Scaling the variables
ensures that the variables are on the same metric.
R Output 4.2 A
> data.scale <- scale(data) > data.kmeans <- kmeans(data.scale, 5) > data.kmeans
K-means clustering with 5 clusters of sizes 13, 5, 7, 10, 2 Cluster means: X1999_2003 X2005_2010 1 0.3009821 0.3436609 2 1.9106795 1.8553624 3 -0.3790514 -0.2508853 4 -0.8173938 -0.9216925 5 -1.3194336 -1.3856407 Within cluster sum of squares by cluster: [1] 3.04525944 4.79277415 1.41354797 0.58009386 0.04531497 (between_SS / total_SS = 86.3 %) Clustering vector: Abia Adamawa Akwa Ibom Anambra Bauchi Bayelsa 3 1 2 1 3 1 Benue Borno Cross River Delta Ebonyi Edo 2 3 2 3 1 1 Ekiti Enugu Gombe Imo Jigawa Kaduna 5 1 1 3 5 1 Kano Katsina Kebbi Kogi Kwara Lagos 4 4 4 1 4 3 Nasarawa Niger Ogun Ondo Osun Oyo 2 1 4 4 4 4 Plateau Rivers Sokoto Taraba Yobe Zamfara 1 1 3 1 4 4 FCT 2 Within cluster sum of squares by cluster: [1] 3.04525944 4.79277415 1.41354797 0.58009386 0.04531497 (between_SS / total_SS = 86.3 %)
30
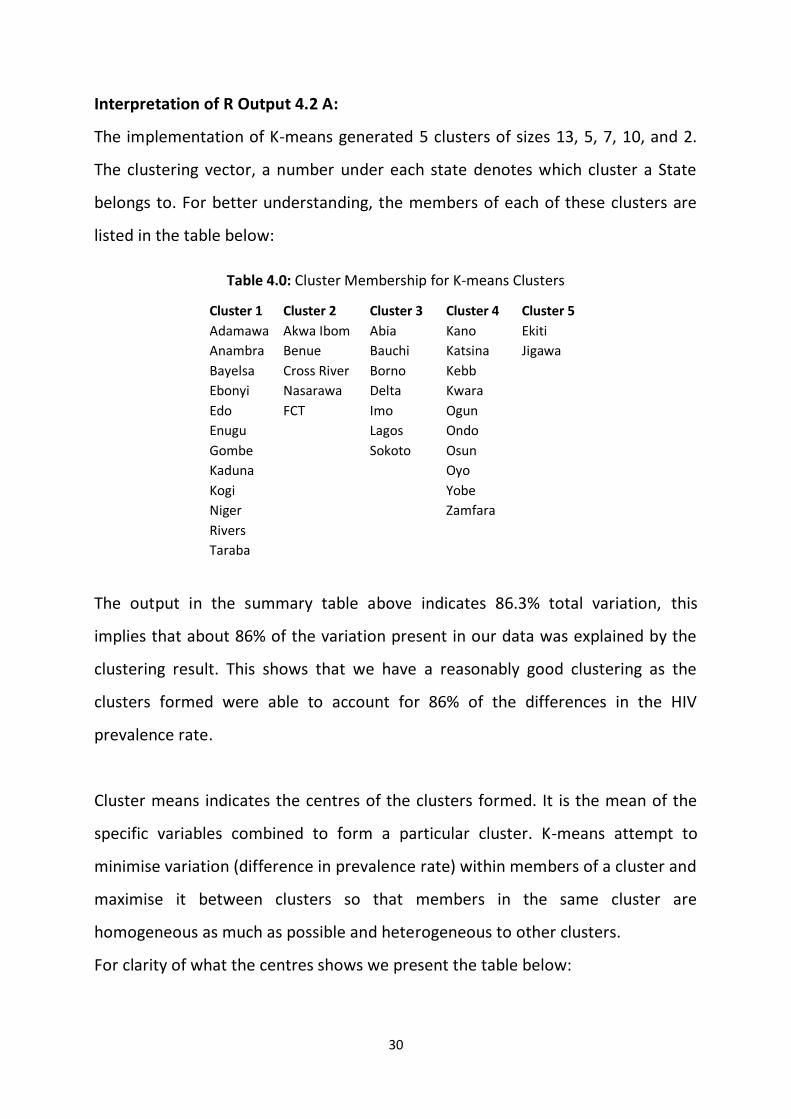
Interpretation of R Output 4.2 A:
The implementation of K-means generated 5 clusters of sizes 13, 5, 7, 10, and 2.
The clustering vector, a number under each state denotes which cluster a State
belongs to. For better understanding, the members of each of these clusters are
listed in the table below:
Table 4.0: Cluster Membership for K-means Clusters
Cluster 1 Cluster 2 Cluster 3 Cluster 4 Cluster 5
Adamawa Akwa Ibom Abia Kano Ekiti
Anambra Benue Bauchi Katsina Jigawa
Bayelsa Cross River Borno Kebb Ebonyi Nasarawa Delta Kwara Edo FCT Imo Ogun Enugu
Lagos Ondo
Gombe
Sokoto Osun Kaduna
Oyo
Kogi
Yobe Niger
Zamfara
Rivers Taraba
The output in the summary table above indicates 86.3% total variation, this
implies that about 86% of the variation present in our data was explained by the
clustering result. This shows that we have a reasonably good clustering as the
clusters formed were able to account for 86% of the differences in the HIV
prevalence rate.
Cluster means indicates the centres of the clusters formed. It is the mean of the
specific variables combined to form a particular cluster. K-means attempt to
minimise variation (difference in prevalence rate) within members of a cluster and
maximise it between clusters so that members in the same cluster are
homogeneous as much as possible and heterogeneous to other clusters.
For clarity of what the centres shows we present the table below:
31
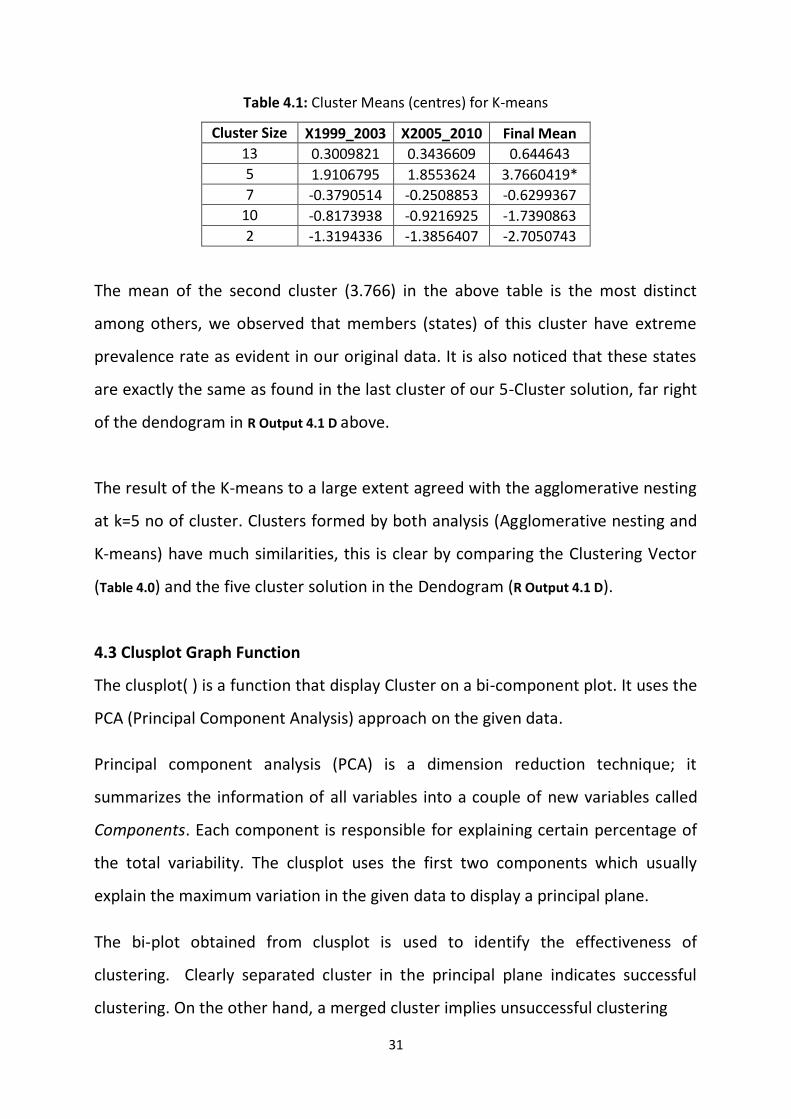
Table 4.1: Cluster Means (centres) for K-means
Cluster Size X1999_2003 X2005_2010 Final Mean
13 0.3009821 0.3436609 0.644643
5 1.9106795 1.8553624 3.7660419*
7 -0.3790514 -0.2508853 -0.6299367
10 -0.8173938 -0.9216925 -1.7390863
2 -1.3194336 -1.3856407 -2.7050743
The mean of the second cluster (3.766) in the above table is the most distinct
among others, we observed that members (states) of this cluster have extreme
prevalence rate as evident in our original data. It is also noticed that these states
are exactly the same as found in the last cluster of our 5-Cluster solution, far right
of the dendogram in R Output 4.1 D above.
The result of the K-means to a large extent agreed with the agglomerative nesting
at k=5 no of cluster. Clusters formed by both analysis (Agglomerative nesting and
K-means) have much similarities, this is clear by comparing the Clustering Vector
(Table 4.0) and the five cluster solution in the Dendogram (R Output 4.1 D).
4.3 Clusplot Graph Function
The clusplot( ) is a function that display Cluster on a bi-component plot. It uses the
PCA (Principal Component Analysis) approach on the given data.
Principal component analysis (PCA) is a dimension reduction technique; it
summarizes the information of all variables into a couple of new variables called
Components. Each component is responsible for explaining certain percentage of
the total variability. The clusplot uses the first two components which usually
explain the maximum variation in the given data to display a principal plane.
The bi-plot obtained from clusplot is used to identify the effectiveness of
clustering. Clearly separated cluster in the principal plane indicates successful
clustering. On the other hand, a merged cluster implies unsuccessful clustering
32
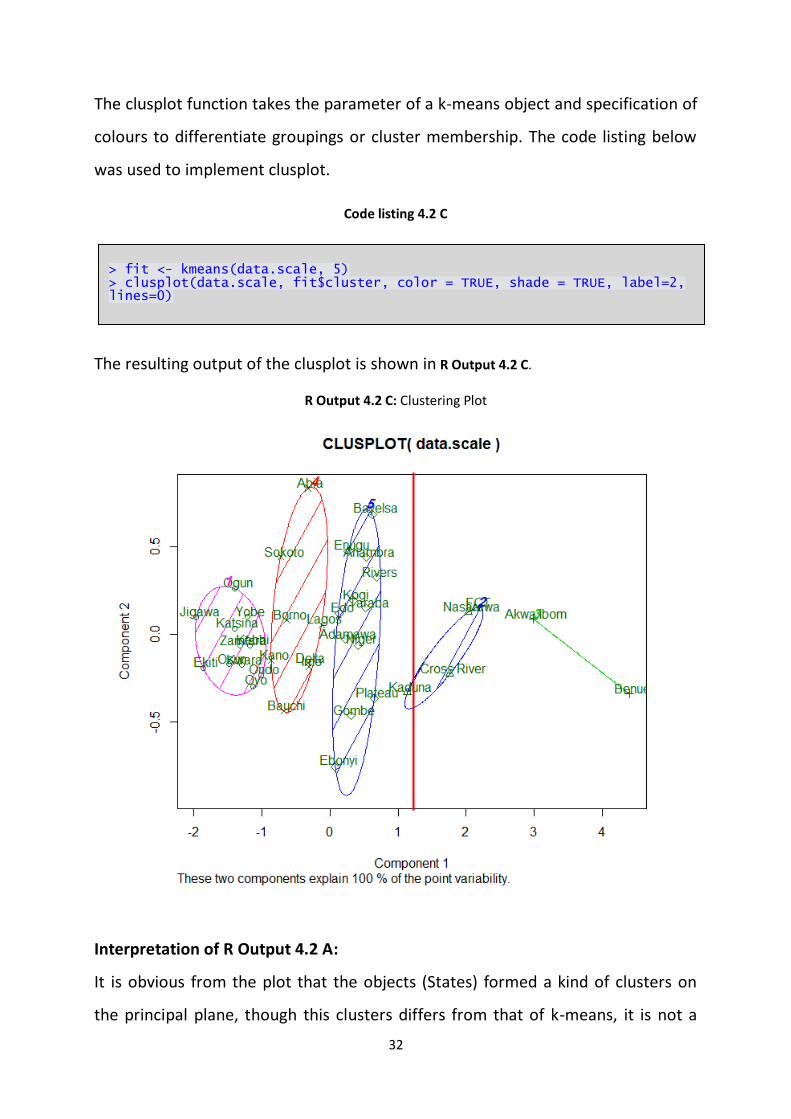
The clusplot function takes the parameter of a k-means object and specification of
colours to differentiate groupings or cluster membership. The code listing below
was used to implement clusplot.
Code listing 4.2 C
The resulting output of the clusplot is shown in R Output 4.2 C.
R Output 4.2 C: Clustering Plot
Interpretation of R Output 4.2 A:
It is obvious from the plot that the objects (States) formed a kind of clusters on
the principal plane, though this clusters differs from that of k-means, it is not a
> fit <- kmeans(data.scale, 5) > clusplot(data.scale, fit$cluster, color = TRUE, shade = TRUE, label=2, lines=0)
33
problem since the clustering plot aims to show the spread of the objects on the
plane, we are interested in knowing if these objects worth having a substantial
grouping as claimed by the K-means by looking at their spread on the plane.
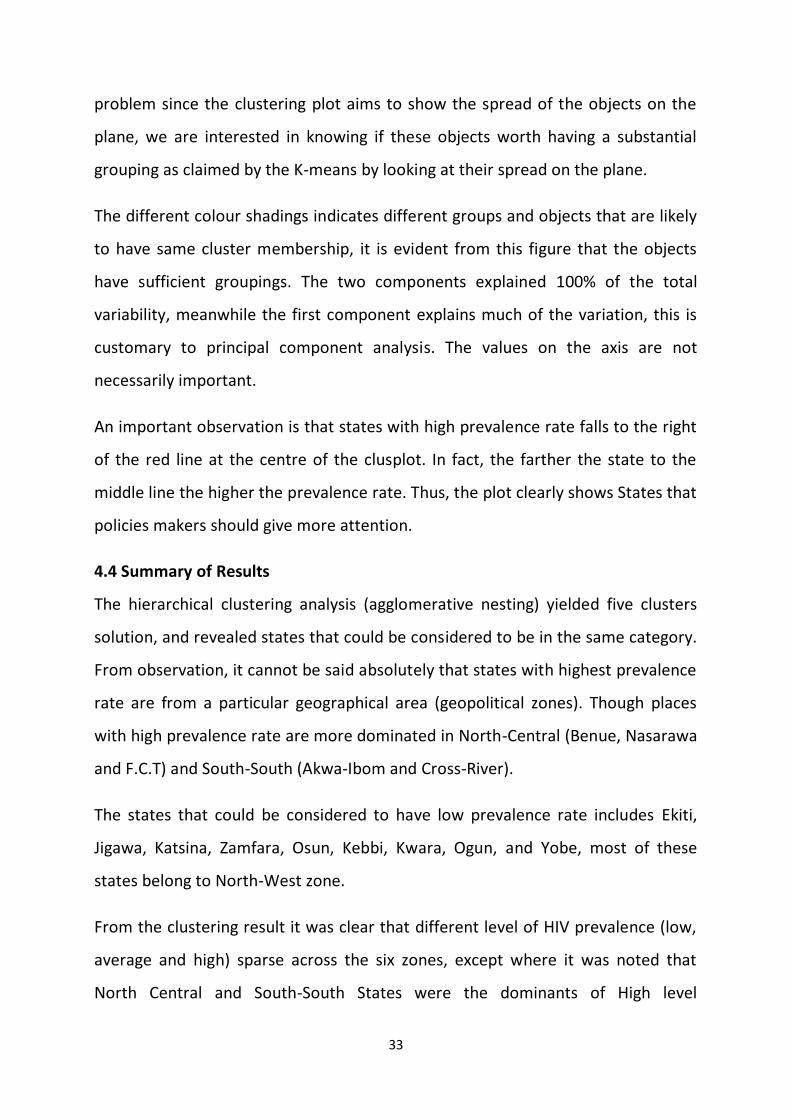
The different colour shadings indicates different groups and objects that are likely
to have same cluster membership, it is evident from this figure that the objects
have sufficient groupings. The two components explained 100% of the total
variability, meanwhile the first component explains much of the variation, this is
customary to principal component analysis. The values on the axis are not
necessarily important.
An important observation is that states with high prevalence rate falls to the right
of the red line at the centre of the clusplot. In fact, the farther the state to the
middle line the higher the prevalence rate. Thus, the plot clearly shows States that
policies makers should give more attention.
4.4 Summary of Results
The hierarchical clustering analysis (agglomerative nesting) yielded five clusters
solution, and revealed states that could be considered to be in the same category.
From observation, it cannot be said absolutely that states with highest prevalence
rate are from a particular geographical area (geopolitical zones). Though places
with high prevalence rate are more dominated in North-Central (Benue, Nasarawa
and F.C.T) and South-South (Akwa-Ibom and Cross-River).
The states that could be considered to have low prevalence rate includes Ekiti,
Jigawa, Katsina, Zamfara, Osun, Kebbi, Kwara, Ogun, and Yobe, most of these
states belong to North-West zone.
From the clustering result it was clear that different level of HIV prevalence (low,
average and high) sparse across the six zones, except where it was noted that
North Central and South-South States were the dominants of High level
34
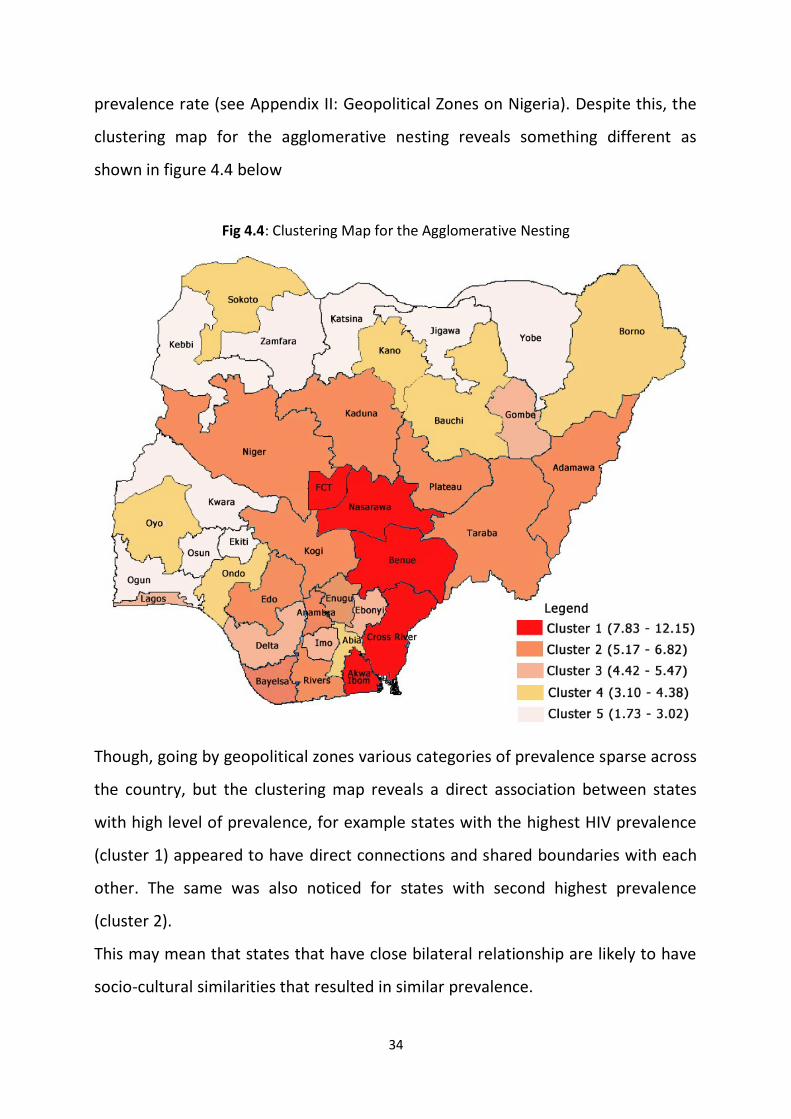
prevalence rate (see Appendix II: Geopolitical Zones on Nigeria). Despite this, the
clustering map for the agglomerative nesting reveals something different as
shown in figure 4.4 below
Fig 4.4: Clustering Map for the Agglomerative Nesting
Though, going by geopolitical zones various categories of prevalence sparse across
the country, but the clustering map reveals a direct association between states
with high level of prevalence, for example states with the highest HIV prevalence
(cluster 1) appeared to have direct connections and shared boundaries with each
other. The same was also noticed for states with second highest prevalence
(cluster 2).
This may mean that states that have close bilateral relationship are likely to have
socio-cultural similarities that resulted in similar prevalence.
35
4.5 Cluster Validation
The result of our clustering was subjected to validation by means of Relative
approach as discussed earlier (Section 2.3)
K-means produced clusters of sizes 13, 5, 7, 10, and 2 while the Hierarchical
produced clusters of sizes 7, 9, 11, 5, and 5. If we compare members of a given
cluster in k-means to the members of a similar cluster in hierarchical we would see
that there are lots of similarity between the clusters produced by the two
methods. For clarity, we assign a group number to each cluster in both methods as
follows:
K-means Clusters:
Group No. Group 1 Group 2 Group 3 Group 4 Group 5
Cluster Size 13 5 7 10 2
Agglomerative Nesting Clusters:
Group No. Group 1 Group 2 Group 3 Group 4 Group 5
Cluster Size 11 5 7 5 5
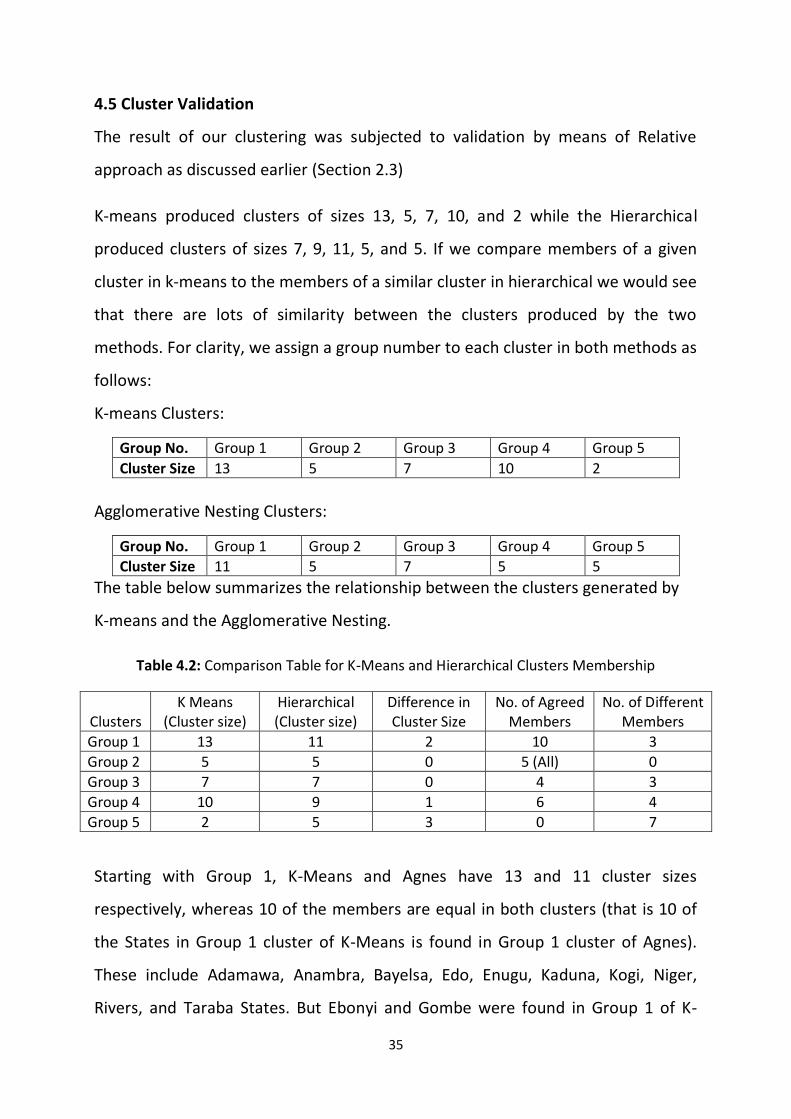
The table below summarizes the relationship between the clusters generated by
K-means and the Agglomerative Nesting.
Table 4.2: Comparison Table for K-Means and Hierarchical Clusters Membership
Clusters
K Means (Cluster size)
Hierarchical (Cluster size)
Difference in Cluster Size
No. of Agreed Members
No. of Different Members
Group 1 13 11 2 10 3
Group 2 5 5 0 5 (All) 0
Group 3 7 7 0 4 3
Group 4 10 9 1 6 4
Group 5 2 5 3 0 7
Starting with Group 1, K-Means and Agnes have 13 and 11 cluster sizes
respectively, whereas 10 of the members are equal in both clusters (that is 10 of
the States in Group 1 cluster of K-Means is found in Group 1 cluster of Agnes).
These include Adamawa, Anambra, Bayelsa, Edo, Enugu, Kaduna, Kogi, Niger,
Rivers, and Taraba States. But Ebonyi and Gombe were found in Group 1 of K-
36
Means and Plateau in Group 1 of Agnes which implies a difference of 3 members,
2 from K-Means and 1 from Agnes.
There is a high level of similarity between the cluster sizes produced by the two
methods as shown in the column “Difference in Cluster Size”. In fact, they both
have equal cluster sizes on two occasions (Group 2 and 3). Group 2 and 3 have
equal number of members in both K-Means and Agglomerative methods, though
there is member difference in Group 3. A special case is the Group 2, they do not
only have equal number of members, but they also have the same States (Akwa-
Ibom, Cross-River, Nasarawa, FCT, and Benue) as cluster members.
Group 5 appears to be the only case where there no similar member in both cases.
Therefore, both clusters have 7 distinct members in which 2 belong to K-Means
and 5 to Agnes. Exact match is not expected as both methods uses different
algorithm to make their clustering.
It is reasonable to say that the difference in cluster sizes in both K-means and
Agnes is low and there exist a high level of similarity in clustering and cluster
membership yielded by both methods, this indicates goodness in the clustering
results obtained.
37
CHAPTER FIVE
SUMMARY, RECOMMENDATION AND CONCLUSION
5.0 Summary
The HIV prevalence rate in Nigeria is measured bi-annually, pregnant women
under antenatal care in survey sites are usually the major source of measuring this
statistics. The HIV prevalence data used for this work covers the periods of 1999
to 2010, though this period was split into two variables, the first variable being the
period between 1999 – 2003 and the second variable is between 2005 – 2010,
each variable consists 3 years data point since the measurement is done bi-
annually. The split was necessary to correct the possible anomalies that could be
posed by inconsistent lag in the second variable (2005 – 2010), which also led to
the use of average prevalence rate in our analysis (see Appendix I).
We intend to find possible classification for which we can determine States with
common situation of the HIV spread. We conducted a Cluster analysis using the
clustering schemes from two clustering methods, Hierarchical and the Partitioning
methods.
Agglomerative nesting an approach of Hierarchical clustering, divides data items
into homogeneous group by means of a proximity matrix and a linkage criterion,
this agglomerative techniques was first used on the prevalence data. This resulted
in a five cluster solution after detail study of the output and a hierarchical
structure (dendogram) as shown in R Output 4.1 D. The 36 States were grouped into
clusters of sizes 7, 9, 11, 5, and 5. This result was accepted to a large extent since
it generated the number of clusters that coincides with the recent literatures by
(FMOH 2010) as recommended by WHO.
In the case of Partitioning method, we used the K-means, a prototype based
approach in which a priori information about number of cluster must be specified.
38
In conducting the K-means clustering, we specified k (number of cluster) to be
formed as five (k=5), the same number of clusters generated in the agglomerative
approach which is also the approximated value for using the rule of thumb for
determining the appropriate number cluster for K-means clustering. This was
done to see how well we can rely on the grouping done by the Hierarchical
procedure, another reason for this is for cluster validation. The result of the K-
means agreed with the agglomerative to a large extent, since they both have more
similarities than differences.
The Relative type of Cluster validation (a check mechanism) was used to critically
compare the clustering produced by the two clustering shames to ascertain that
we did not cluster in noise (that is clustering when it is not necessary). A
comparison table Fig 4.0 was established in order to ease the task of validating the
clustering result.
5.1 Recommendation
The quality of data plays a vital role in any statistical analysis. It is highly important
that the sentinel survey for acquiring the HIV prevalence rate be made consistent.
There should be consideration for having more sources of acquiring the
prevalence rate rather than patients under antenatal care only.
Conducting a cluster analysis is not an easy task, the fact that there are multiple
ways of implementing cluster analysis in which combination of steps and possible
alternatives depends on the choice of analyst makes it subjective. Meanwhile,
each combination of steps and alternatives has its own weakness. It is important
to use different clustering schemes on the data of interest in order to see the
direction of the obtained result and to avoid misleading clustering.
A tabular mechanism for comparing result of two clustering scheme used in Table
4.2 above provides an easy alternative for comparing clustering results from
39
different clustering scheme. Further research works could develop numerical
computations to enhance or optimize this approach and make the process faster.
A major aim of Governments and Agencies concerned with HIV issues is to
minimize the spread of this disease as much as possible. The plot above (R Output
4.2 C) could be an easy way to clearly identify States that require more attention.
More of the programmes such as awareness and education on HIV should be
channelled to such States. Another point of interest that government and agencies
in control of HIV in Nigeria should look into is the connection between bilateral
relationships and prevalence rates; the clustering map (figure 4.4) gives an insight
on this.
5.2 Conclusion
From the results obtained it can be said that we have a successful clustering that
classified the spread of HIV among Nigerian states where North-Central and the
South-South geopolitical zones are important areas that require more attention.
Clustering Plot (R Output 4.2 C), a graph of K-means clustering reveals an
important measure for identifying areas (states) under risk; this graph requires a
closer look.
Despite the fact that K-means and Agglomerative clustering are different
clustering techniques and choice of using any may be based on the type of data;
the final results of these techniques for the same data shows lots of similarities.
40
References
Alka A. (2011) Cluster Analysis Using R, “winter school of data mining techniques
and tools for knowledge discovery in agricultural datasets”.
Brian S. E., Sabine L., Morven L. and Daniel St. (2011), Cluster Analysis - 5th
Edition, John Wiley & Sons, Ltd. 2011, 61, 80-81.
Jeromy A. (2007) Cluster Analysis & Factor Analysis, Lecture Note: 325-711
Research Methods.
Kaufman, L. and Rousseeuw P. (1990). Finding Groups in Data: An Introduction to
Cluster Analysis. John Wiley and Sons, London. ISBN: 10:0471878766.
Maindonald J. H. (2008), Using R for Data Analyisis and Graphics – Introduction,
Code and Commentary.
Marija N., IBM SPSS Statistical Procedure SPC pp361-363
http://www.norusis.com/pdf/SPC_v13.pdf
Pang-Ning T., Micheal S. and Vipin K. (2006) Introduction to Data Mining, Addison-
Wesley, ISBN-13: 9780321321367.
Raza A. (425), Usman G. (462), and Aasim Saeed (464): Data Clustering and Its
Application, http://members.tripod.com/asim_saeed/paper.htm
Steven M. H. (2006) Cluster Analysis, Department of Geology, University of
Georgia, GA 20602-2501.
The R Development Core Team (2010) R: A language and Environment for
Statistical Computing, Reference index version 2.11.1.
Volker H. and Sebastian W. (2000), Clustering Techniques: A brief survey, Institut
fur Biomathematik and Biometrie, 7.
41
Ward, J. H., Jr. (1963), Hierarchical Grouping to Optimize an Objective Function,
Journal of the American Statistical Association, 58, 236–244.
http://www.statmethods.net/advstats/cluster.html
https://onlinecourses.science.psu.edu/stat857/book/export/html/3
http://en.wikipedia.org/wiki/Hierarchical_clustering
http://stats.stackexchange.com/questions/7250/using-the-stats-package-in-r-for-
kmeans-clustering
http://www.indexmundi.com/nigeria/demographics_profile.html
http://www.stat.berkeley.edu/classes/s133/Clus-a.html
http://home.deib.polimi.it/matteucc/Clustering/tutorial_html/kmeans.html#mac
queen
Related Documents