An apparatus for the measurement of the electronic spectra of cold ions in a radio-frequency trap Inauguraldissertation Zur Erlangung der Würde eines Doktors der Philosophie vorgelegt der Philosophisch-Naturwissenschaftlichen Fakultät der Universität Basel von Anatoly Dzhonson aus Poronaisk (Russland) Basel, 2007

Welcome message from author
This document is posted to help you gain knowledge. Please leave a comment to let me know what you think about it! Share it to your friends and learn new things together.
Transcript

An apparatus
for the measurement
of the electronic spectra of cold ions
in a radio-frequency trap
Inauguraldissertation
Zur Erlangung der Würde eines Doktors der Philosophie
vorgelegt der Philosophisch-Naturwissenschaftlichen Fakultät
der Universität Basel
von
Anatoly Dzhonson
aus Poronaisk (Russland)
Basel, 2007

2
Genehmigt von der Philosophisch-Naturwissenschaftlichen Fakultät
aus Antrag von
Prof. Dr. John P. Maier und Prof. Dr. Martin Jungen
Basel, den 13. Februar 2007
Prof. Dr. Hans-Peter Hauri
Dekan

3
To my parents and cat

4
Acknowledgments
I would like to thank Prof. Dr. John P. Maier for giving me the opportunity to work in his
group. The challenging project he proposed prepared me to be ready to take responsibility
and make my own decisions, both now and in the future. The excellent working environment
and resources available during my studies are greatly appreciated.
Dr. Timothy Schmidt (The University of Sydney, Australia) and Dr. Przemyslaw Kolek
(University of Krakow, Poland) are thanked for their help during the initial stages
of the instrument’s construction. Many thanks to Prof. Dr. Dieter Gerlich (Technical University
of Chemnitz, Germany) for his help in the development of the apparatus. Prof. Dr. Evan Bieske
(University of Melbourne, Australia) is greatly thanked for his help while collecting spectra
of the first trapped ions, and for useful suggestions involving the operating scheme of the whole
experiment.
I am also grateful to the people who were technically involved in the experiment:
Dieter Wild and Grischa Martin (mechanical workshop) for machining the various vacuum
chambers and associated components of the apparatus. The experiment setup is still supported
and continuously improved by the workshop. Jacques Lecoultre is also thanked for providing
exotic chemical substances and Georg Holderied for building up TTL fast switch, power
supplies, RF generators and many other very useful electronic devices, without which
the experiment would not work. Thanks to Georg Holderied for being always ready to assist
with technical advice.
My sincere appreciations are given to Esther Stalder and Daniela Tischhauser, from
secretary the office, for taking care of bureaucratic matters and making life easier. Thanks
to Dr. Evan Jochnowitz for his help in correcting this thesis, for scientific discussion
and English lessons.

5
This project has been supported by the Swiss National Science Foundation
(No. 200020-100019).
I also would like to thank Prof. Dr. Martin Jungen for acting as the co-referee of this thesis.
6
TABLE OF CONTENTS
CHAPTER 1 INTRODUCTION. ............................................................................................8
1.1 INTERSTELLAR MEDIUM....................................................................................................8 1.1.1 A brief overview of ISM. ..........................................................................................8 1.1.2 A classification of the ISM.....................................................................................11
1.1.2.1 Dark nebulae......................................................................................................11 1.1.2.2 Reflection nebulae. ............................................................................................12 1.1.2.3 H ΙΙ regions.........................................................................................................12 1.1.2.4 Planetary nebulae...............................................................................................12 1.1.2.5 Supernova remnants. .........................................................................................12
1.2 IONS OF ASTROPHYSICAL INTEREST. ...............................................................................14 1.3 LABORATORY ELECTRONIC SPECTROSCOPY ON MOLECULAR IONS..................................18
1.3.1 N2O and 1,4-dichlorobenzene cations. ..................................................................18 1.3.2 2,4-hexadiyne cation..............................................................................................20 1.3.3 Polyacetylene cations. ...........................................................................................22 1.3.4 Protonated polyacetylene cations..........................................................................24
CHAPTER 2 EXPERIMENTAL. .........................................................................................26
2.1 APPARATUS. ...................................................................................................................26 2.1.1 Ion source. .............................................................................................................28 2.1.2 Quadrupole mass filter. .........................................................................................32
2.1.2.1 Technical details. ...............................................................................................32 2.1.2.2 Principle of operation. .......................................................................................34
2.1.3 22-pole radio frequency ion trap...........................................................................38 2.1.3.1 Technical details. ...............................................................................................38 2.1.3.2 Principle of operation. .......................................................................................41
2.1.4 Daly detector. ........................................................................................................43 2.2 LASER OPTICAL SCHEME. ................................................................................................46
2.2.1 One-colour experiment. .........................................................................................46 2.2.2 Two-colour experiment..........................................................................................48
2.3 SOFTWARE AND DATA ACQUISITION CARDS. ...................................................................51 2.3.1 ABB Extrel mass spectrometer. .............................................................................51 2.3.2 Nermag mass spectrometer. ..................................................................................55 2.3.3 Sunlight EX OPO laser spectrometer....................................................................59 2.3.4 Data acquisition cards and electrical connection.................................................63
2.3.4.1 PCI-6023E (device 1). .......................................................................................64 2.3.4.2 PCI-6713 (device 2). .........................................................................................65 2.3.4.3 PCI-DAS6014 (device 3). .................................................................................67 2.3.4.4 DAQ cards electrical connections. ....................................................................69 2.3.4.5 Software pulse generator. ..................................................................................70
2.4 EXPERIMENTAL APPROACH.............................................................................................72
CHAPTER 3 RESULTS AND DISCUSSION......................................................................75
3.1 ONE-PHOTON TWO-COLOUR PHOTOFRAGMENTATION SPECTROSCOPY. ...........................75 3.1.1 N2O cation. ............................................................................................................75 3.1.2 2,4-hexadiyne cation..............................................................................................76
3.1.2.1 Internal temperature of 2,4-hexadiyne cation....................................................76 3.1.2.2 Vibrational structure. .........................................................................................80

7
3.2 TWO-PHOTON ONE-COLOUR PHOTOFRAGMENTATION SPECTROSCOPY. ...........................84 3.2.1 1,4-dichlorobenzene cation. ..................................................................................84
3.3 TWO-PHOTON TWO-COLOUR PHOTOFRAGMENTATION SPECTROSCOPY. ..........................91 3.3.1 Polyacetylene cations. ...........................................................................................91 3.3.2 Protonated polyacetylene cations..........................................................................96
CHAPTER 4 CONCLUSIONS............................................................................................106
CHAPTER 5 OUTLOOK. ...................................................................................................109
BIBLIOGRAPHY......................................................................................................................111

8
Chapter 1 Introduction.
1.1 Interstellar medium.
While most cosmologists cannot agree on what happened during the first second
after the Big Bang, the prevailing viewpoint describes an infinitely hot, dense point
that expanded, thinned and cooled to 1015 K. The inflation era lasted from 10-34 to 10-32 s,
followed by a change in density and temperature of several orders of magnitude during the first
10-12 seconds. During the following 10-5 seconds, quarks had fused into protons and neutrons,
primordial nucleosynthesis ended, thus producing atoms and ions. The universe became
transparent at 3×10⁵ years, forming simple molecules, the heaviest of which was lithium hydride,
and leaving only the 2.7 K microwave background as a relic of its initially violent beginnings.
After 109 years, the first galaxies and quasars formed. While galaxies are not forming at the
present epoch, the stars within them are, 15 billion years after the Big Bang.
The tenuous matter spread across the vast distances between the stars totals just a few percent
of the weight of all the visible stars in our own Galaxy and is termed the interstellar medium
(ISM).
1.1.1 A brief overview of ISM.
The ISM has two main components: bright and dark regions of mainly hydrogen
and helium gas, and dark swathes of dust. These are termed inhomogeneous due to their
non-uniform distribution. Most of the ISM is contained within the Galactic disk and the spiral
arms in a layer a few hundred parsecs thick.

9
One cannot explicitly say that the space between the stars is a vacuum, since the ISM
is clearly observable. It contains on average only one atom per cm3; fewer atoms than even
the best terrestrial laboratory vacuum can achieve. Any chemistry occurring in space will depend
on cosmic abundance of a particular element. Table 1 shows the abundance of the most common
atoms relative to the hydrogen atom.
Table 1 Fractional abundance of elements relative to hydroden.
Element Abundance H 1
He 0.1
O 7×10⁻⁴ C 3×10⁻⁴ N 1×10⁻⁴ Ne 0.8×10⁻⁴ Si 0.3×10⁻⁴ Mg 0.3×10⁻⁴ S 0.2×10⁻⁴ Fe 0.04×10⁻⁴
Until 1968, astronomers assumed that the ISM was mostly atomic hydrogen
with significantly fewer of the hydrogen atoms being bound with a single carbon or oxygen.
Then ammonia NH3 was discovered near the Galactic center, followed by water vapor H2O;
thereafter successively more complex molecules such as ethanol CH3CH2OH were observed.
Table 2 gives a summary of the interstellar molecules observed to date. Currently it is known
that the ISM is the site of a complex and varied chemistry that is very different to that one can
study on earth.

10
Table 2 The interstellar molecules found (January 2007).
Number of atoms Compound 2 H2, AlF, AlCl, C2, CH, CH+, CN, CO, CO+, CP, CSi, HCl, KCl, NH, NO,
NS, NaCl, OH, PN, SO, SO+, SiN, SiO, SiS, CS, HF, SH, FeO(?) 3 C3, C2H, C2O, C2S, CH2, HCN, HCO, HCO+, HCS+, HOC+, H2O, H2S,
HNC, HNO, MgCN, MgNC, N2H+, N2O, NaCN, OCS, SO2, c-SiC2, CO2,
NH2, H3+, SiCN, AlNC, SiNC
4 c-C3H, l-C3H, C3N, C3O, C3S, C2H2, CH2D+(?), HCCN, HCNH+, HNCO,
HNCS, HOCO+, H2CO, H2CN, H2CS, H3O+, NH3, SiC3, C4
5 C5, C4H, C4Si, l-C3H2, c-C3H2, CH2CN, CH4, HC3N, HC2NC, HCOOH, H2CHN, H2C2O, H2NCN, HNC3, SiH4, H2COH+
6 C5H, l-H2C4, C2H4, CH3CN, CH3NC, CH3OH, CH3SH, HC3NH+, HC2CHO, NH2CHO, C5N, HC4N
7 C6H, CH2CHCN, CH3C2H, HC5N, HCOCH3, NH2CH3, c-C2H4O, CH2CHOH
8 CH3C3N, HCOOCH3, CH3COOH(?), C7H, H2C6, CH2OHCHO, CH2CHCHO
9 CH3C4H, CH3CH2CN, (CH3)2O, CH3CH2OH, HC7N, C8H 10 CH3C5N(?), (CH3)2CO, NH2CH2COOH(?), CH3CH2CHO 11 HC9N 12 CH3OC2H5 13 HC11N
The gaseous component consists of a mixture of atoms and molecules and these
may be ionized or neutral. The dust component comprises only 1% of the ISM by mass
and consists of stardust, which is composed of silicates, graphite and amorphous carbon,
made in oxygen- and carbon-rich outflows from late-type giants and planetary nebulae.
Interstellar dust, which is formed in the interstellar medium, consists of silicates
and carbonaceous components, ranging in size from a few microns down to several Angstroms.
There is only indirect evidence to suggest that most interstellar dust formation occurs
in the ambient ISM. Despite its small relative mass, dust plays a key role in the thermodynamics
and chemistry of both the ISM and star formation.
Interstellar gas is transparent to photons with energies less than 13.6 eV (the Lyman limit);
that is, electromagnetic radiation ranging from the ultraviolet (UV) to the far-infrared (FIR).
Dust grains act as thermal intermediaries between photons and gas because they absorb light
with extreme efficiency. That is why dust looks dark on optical photographs. The actual effect of

11
the dust is that it both absorbs and scatters light; collectively called extinction. This allows
indirect shielding from UV light such that complex, organic molecules can be formed in the gas
phase and as ices on the surface of the grains themselves. The extremely varied physical
conditions (such as temperature, pressure and different types of electromagnetic radiation)
existing within the ISM produce a highly interesting and complex chemistry. Ultimately,
interstellar chemistry will produce the raw material available for the formation of planets
and life itself. These presolar molecules can be identified from samples buried in cometary
and meteoric matter. Without dust, the evolution of our Galaxy would have been very different
and the development of planetary systems would not have occurred.
1.1.2 A classification of the ISM.
The gas clouds comprising the ISM are termed gaseous nebulae and are highly dynamic
structures with relative speeds ∼10 km s-1. The following regions are differentiated: dark
nebulae, reflection nebulae, H ΙΙ regions, planetary nebulae, supernova remnants.
1.1.2.1 Dark nebulae.
Dark nebulae can be observed because they obscure background stars or stand out as dark
patches against regions of hot, glowing gases. Some are spherically shaped and self-gravitating,
named Bok globules, and are proposed as sites of star formation in giant molecular clouds
complexes. These Bok globules should not be confused with a class of smaller Bok globules
seen against ionized regions of ISM, which are not gravitationally bound. Molecular cloud
complexes are cool, have a lifetime of order 107 years, and as their name suggests, are a rich
source of molecules such as hydrogen H2 and carbon monoxide CO.
12
1.1.2.2 Reflection nebulae.
A reflection nebulae is a cloud of gas and dust which shines by reflecting light emanating
from stars (containing the star’s absorption spectrum). This light is scattered by dust grains
in the surrounding gas, revealing their presence. The reflection nebula appear bluer than the light
coming directly from the stars due to blue light being preferentially scattered relative to red light.
1.1.2.3 H ΙΙΙΙΙΙΙΙ regions.
H ΙΙ regions exist where neutral hydrogen (H Ι) atoms are exposed to photons of energy
greater than 13.6 eV from stars. These photons ionize the hydrogen atoms to form protons
and electrons. H ΙΙ regions are thus bright, ionized regions of hydrogen surrounding newborn hot,
bright stars (of spectral types O and B) These region are dominated by intense light emission
and thermal radio-continuum. The division between an H Ι and H ΙΙ regions is distinct
and resulting sphere of ionized hydrogen around the star.
1.1.2.4 Planetary nebulae.
These are similar to H ΙΙ regions except that the ionizing source is an old star in its death
throes rather than a newborn star. The resulting ionized region is more chemically complex,
dense and compact.
1.1.2.5 Supernova remnants.
Supernovae can be roughly classified as Type Ι or Type ΙΙ. A Type Ι supernova occurs
in typical binary stars, which consists of a low to medium mass star, which is in the process

13
of evolving into a red giant phase, and a companion star, which can be a white dwarf,
a Wolf-Rayet star, or a helium star. The expanding outer layers of the red giant are effectively
dumped onto the surface of the companion star; a process that increases the pressure, and thus
temperature, inside the star. At a certain moment in time a fusion process starts in the carbon-
rich interior of the companion star, releasing the remaining nuclear energy in a process termed
deflagration. Deflagration involves the breakup of the entire companion star, leaving only an
interstellar rubble.
A Type ΙΙ supernova occurs when a high-mass star explodes in its last stages of evolution.
Generally, it leaves gaseous remnants and a high-density neutron star. If the remnant is young,
there will exist an amorphous region emitting a continuous spectrum of synchrotron radiation
by electrons spiraling in intense magnetic fields. This (radio) emission from supernovae has thus
a non-thermal origin. The X-ray and optical emission from supernova remnants, on the other
hand, is thermal radiation arising from shock heating.
Table 3 summaries the physical conditions in the five general types of ISM.
Table 3 A broad classification of five types of interstellar medium.
Phase ηH (cm-3) Tgas (K) % ISM by volume % ISM by mass
Molecular cloud 102-105 20 < 1 ∼ 40
HΙ regions [cloud] 15 102 ∼ 3 ∼ 40
HΙ regions [intercloud] 0.5 6×10³-104 ∼ 47 ∼ 20
H ΙΙ regions 10-103 104 < 1
Supernova remnants 10-3 106 ∼ 50

14
1.2 Ions of astrophysical interest.
The article by A. Douglas published in 1977 proposing that carbon chains are good
candidates as carriers of some diffuse interstellar band absorption [1] has continued to be cited.
His arguments were based on their likely spectroscopic and photophysical properties; i.e. leading
to electronic transitions in visible part of the spectrum and possible broadenings
of the absorptions due to intramolecular processes. In order to test this hypothesis, gas phase
electronic spectra of the systems he was alluding to, e.g. the bare carbon chains Cn
(n=5, 7, …, 15) were required. Thus as part of research activity of group of Prof. Dr. J.P. Maier
dealing with the development and application of the methods to study the electronic spectra
of radicals and ions we set ourselves the goal of measuring these spectra in the gas phase.
As a first step the electronic absorption spectra were obtained in neon matrices at 6 K.
This was achieved using a cesium sputter source to produce the carbon anions, Cn-,
then co-deposition of the mass-selected species with excess of neon to trap the anions
in the matrix thus formed, and finally the neutral entities were generated by photodetachment
of the electrons. By this means the electronic spectra of the carbon chains anions, Cn- n=3-13,
neutrals Cn n=4-21 [2], and most recently of cations, Cn+ n=6-9 [3], could be observed
and identified. With this information in hand, gas phase spectra of those species possessing
electronic transitions in the DIB range [4], 400-900 nm, were aimed for. These were obtained
for a number of carbon cation, neutral and anion chains using supersonic free jets through which
a discharge runs. With acetylene seeded in a rare gas numerous such carbon chains can be
produced as diagnosed by mass-spectrometry. The electronic transitions were then observed
in absorption with pulsed and cw cavity ringdown methods for the cations and neutrals
and photodetachment processes for anions. This in turn allowed for the first time a direct
comparison of laboratory spectra with astronomical measurements [5].
15
All the comparisons proved negative, including those for bare carbon chains C4, C5 [6]
and for species which are known to be present in diffuse medium, e.g., C3H [7].
However the upper limits to the column densities derived, typically <1012 cm-2, are consistent
with the values obtained for the species detected by rotational spectroscopy [8].
Thus even though species with column densities around the latter values can be detected
in the mm-range, the relatively modest values of the oscillator strengths of the electronic
transitions, e.g. around 0.004 for C3H with origin band near 521 nm [7], would lead to DIB
with an equivalent width (EW) of less then 1 mo
Α , a hardly detectable DIB.
Several such comparisons, lead to the conclusion that Douglas’s hypothesis that carbon chains
Cn with n lying in the range 5 - 15 are good DIB candidates can be excluded [9].
More generally, this statement applies not only to the bare carbon chains but to also to their
derivatives such as those containing a hydrogen, CnH, comprising up to around a dozen of atoms.
The consequences of this are illustrated with reference to study, which detected C3
in diffuse clouds [10] and summarized in Table 4.
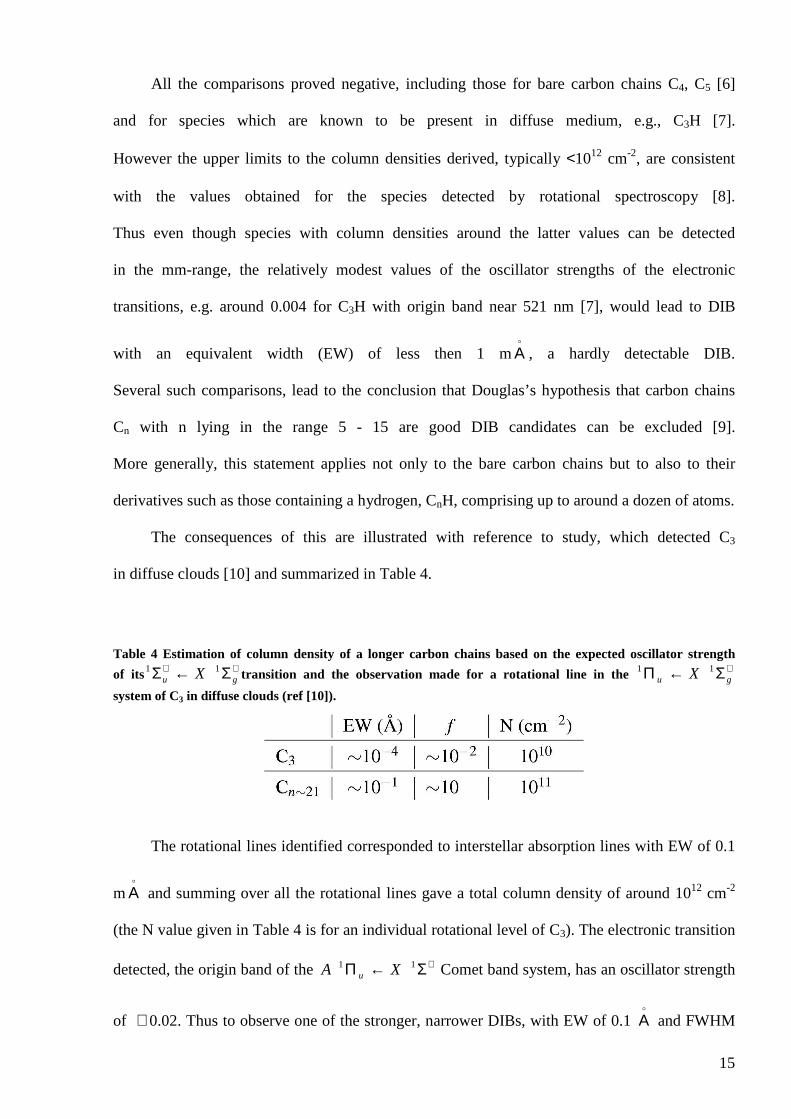
Table 4 Estimation of column density of a longer carbon chains based on the expected oscillator strength
of its ++ Σ←Σ gu X 11 transition and the observation made for a rotational line in the +Σ←Π gu X 11
system of C3 in diffuse clouds (ref [10]).
The rotational lines identified corresponded to interstellar absorption lines with EW of 0.1
mo
Α and summing over all the rotational lines gave a total column density of around 1012 cm-2
(the N value given in Table 4 is for an individual rotational level of C3). The electronic transition
detected, the origin band of the +Σ←Π 11 XA u Comet band system, has an oscillator strength
of ∼ 0.02. Thus to observe one of the stronger, narrower DIBs, with EW of 0.1 o
Α and FWHM

16
around 1 o
Α , either the column density of the species has to be two orders of magnitude larger
than for C3 or the oscillator strength, f, has to be correspondingly bigger.
The latter is the situation with the C2n+1 chains for their ++ Σ←Σ gu XA 11 transition.
This transition is found around 170 nm for C3 with an f value of around unity [11].
The wavelength of the transition shifts by regular increments with the length of the carbon chains
as can be seen in Figure 1-1 and f scales nearly with n.
Figure 1-1 Wavelength dependence of the electronic transition (origin band) on the number of carbon atoms for two series of carbon chains. The 400-900 nm DIB range is indicated.
Thus these odd-numbered chains C17, C19 … up to, say, C31 have these electronic
transitions in the 400-900 nm DIB region with f values in the 1-10 range. Their spectra have
been observed in absorption in 6 K neon matrices for up to C21 [12]. In Table 4 C21 is taken
as the example: to obtain a DIB with EW of 0.1 o
Α would require a column density of 1011 cm-2,
not an excessive amount. As a consequence the current goal is to obtain the spectra of the chains
of this size, as yet unsuccessfully.
The approach used for this purpose is resonance enhanced two-photon ionization (RE2PI)
combined with a laser vaporization source as illustrated by Figure 1-2.

17
Figure 1-2 Technique used to measure the electronic spectra of the C18 ring in the gas phase involving a two-colour excitation ionization scheme.
A tunable laser (λ1) scans the region where the electronic transitions are expected in view
of the spectra observed in neon matrices, and subsequently ionization is induced with
a F2 157 nm laser (λ2). As the mass-spectrum in Figure 1-3 shows, the sought after C17, C19 …
species are formed.
Figure 1-3 Typical mass-spectrum obtained from the laser vaporization source, using a 157 nm laser for the two-photon ionization.

18
However the RE2PI approach using nanosecond lasers failed to detect the transitions
suggesting that the lifetimes of the excited electronic states are in the picosecond range.
On the other hand the electronic spectra of C18 and C22 could be observed [13].
The similarity of the C18 origin band profile to the DIBs may suggest that one should look
also for the laboratory spectra of cyclic ring cations with large oscillator strength. For such
a purpose we have built up an instrument based on 22-pole trap to measure such spectra of large
cations, which have been collisionally equilibrated to 20-30 K temperatures pertinent
to the diffuse interstellar clouds. Low rotational temperatures are more easily obtained
in supersonic free jets, but the vibrational modes are not cooled. The first measurements with this
instrument were to demonstrate that both the rotations and vibrations have been relaxed.
1.3 Laboratory electronic spectroscopy on molecular
ions.
1.3.1 N2O and 1,4-dichlorobenzene cations.
A significant challenge remains the measurement of the electronic spectra of large
molecular ions in the gas phase and at low internal temperature. Problems include low ion
densities and spectral congestion due to the presence of species with overlapping absorptions and
vibrational hot bands. Sometimes it is feasible to generate sufficient densities of molecular ions
in a plasma or discharged supersonic expansion so that laser absorption, laser induced
fluorescence, or cavity ringdown spectra can be recorded. However, due to the chemical
complexity of plasma environments there are often difficulties in associating spectral features
with a particular molecular species.

19
An alternative approach to obtaining electronic spectra is by resonance enhanced
photodissociation, exposing the molecular ions to a tuneable laser beam in a tandem mass
spectrometer while detecting photofragment ions as a function of laser wavelength.
The advantages are that the parent molecular ions and photofragments can be mass-selected
removing any ambiguity in their identity, and that the photofragments can be detected
with almost unit efficiency conferring high sensitivity. In some cases, such as N2O+, it is possible
to access predissociative rovibronic states through the absorption of a single visible or UV
photon. Alternatively, if a single photon does not provide sufficient energy to fragment
the molecule it is possible that absorption of multiple photons will. For example, many organic
ions undergo rapid internal conversion from excited electronic states, yielding vibrationally hot
ions in the ground electronic state. If the vibrational energy exceeds the fragmentation threshold,
the ions can dissociate. Otherwise, the absorption/internal conversion process can continue until
the ions have sufficient energy to dissociate.
The resonance enhanced photodissociation approach has been used for many years
employing a variety of different mass spectrometers and ion traps. [14] One common difficulty
is that the molecular ions have considerable internal energy due to the violence of the ionisation
process, so that the electronic spectra are congested and difficult to interpret. This is a particular
problem for larger molecules. In order to circumvent this difficulty an apparatus has been
developed in which the ions’ rotational and vibrational degrees of freedom are deactivated
by helium buffer gas collisions in a cryogenically cooled 22-pole radio frequency trap. In this
paper the technique's advantages are illustrated by presenting the rotationally resolved
++ Π←Σ 2/322 ~~
XA spectrum of N2O+ and the vibrationally resolved gu BXBB 2
23
2 ~~ ←
spectrum of the p-DCB+ radical cation. Both molecular ions have been subject to previous
studies. The N2O+ cation is well understood having been investigated extensively through optical
emission, [15] lifetime, [16] and photodissociation studies. [17-19] Previously, the N2O+
++ Π←Σ 2/322 ~~
XA electronic spectrum has been obtained by detecting the NO+ fragment,

20
a strategy that is effective because the higher vibronic levels of the +Σ2~A state
are predissociative and lead to production of NO+ and O atom fragments. For the 12 level
of the +Σ2~A state, which is accessed in the current study, around 16 % of the molecules
fluoresce with the remainder dissociating. [16]
The p-DCB+ radical cation was investigated initially using the techniques of photoelectron
and emission spectroscopies in a molecular beam, [20] and later by absorption in the rare gas
matrixes. [21, 22] From pulsed electron beam excitation and emission intensity measurements
it has been estimated that the internal conversion rate is ≈1011 s-1. [20] As discussed in latter
article, fluorescence from the uBB 32~
00 level is weak, a situation attributed to rapid internal
conversion mediated by coupling with the uBC 22~
state. The current study is the first time that
a high-resolution gas-phase spectrum has been reported.
1.3.2 2,4-hexadiyne cation.
One of the challenges related to astronomical observations, in particular of absorptions
in diffuse interstellar clouds, is to measure in the laboratory the electronic spectra of larger and
transient ions where not only the rotational but also vibrational degrees of freedom have been
equilibrated to low temperatures. Once these become available, a direct comparison of the two
sets of data can be made [23] with the objective of identifying the carriers. A number of such
studies have proven possible in the last decade by producing cold smaller polyatomic cations
in pulsed discharge sources and measuring their electronic absorption spectra with sensitive
techniques such as cavity ring-down with pulsed and cw lasers [24]. The species could be
identified by analysis of the rotational structure in the spectra and/or previous knowledge
on the location of these electronic transitions from absorption measurements of mass-selected

21
species in neon matrices [2]. In the case of anions, and transient neutral species, identification
of the molecules can be made by mass-selection using multi-photon dissociation processes.
The usual approaches to study the electronic spectra of cold ions in the gas phase have
used molecular beams. This leads to low rotational temperatures but not all vibrational modes
are relaxed. For this reason some experiments have been carried using ions cooled to liquid
nitrogen temperatures for laser induced fluorescence [14] or photodissociation studies [25].
Another interesting way to improve the quality of such spectra was been using tagging methods
[26], whereby a rare gas is attached to the ion parent ion. The spectra can become significantly
sharper, but the rare gas causes a shift in transition energies compared to the bare ion [27].
Thus the goal of the present experiment is to relax both the rotational and vibrational
motions by collisions to low temperatures as pertinent to the interstellar medium, e.g. 10-50 K.
In this mass-selected ions are injected into a 22-pole radio-frequency trap where they are brought
to the low temperatures by collisions with cryogenically cooled helium gas [28]. The electronic
absorption is induced by tunable laser excitation and the process is detected by production
of fragment ions either in one or several photon processes.
Whether the cooling has been achieved can be shown on small ions by the resolution
of the rotational structure (e.g. N2O+ in ref. [28]) but for the lager organic ions such structure is
not resolved. This has been circumvented in this study by choosing an ion with K-structure,
i.e. a system with hydrogen atoms off a central carbon chain axis, which can be observed
with modest laser resolution, 2,4-Hexadiyne cation is the example chosen enabling the rotational
temperature to be determined. It was important to show that also such large ions are efficiently
cooled in the trap and the proof is provided here.
Related approaches employing photodissociation have been carried out in the past using
icr or tandem mass-spectrometers [29, 30], though cooling by collisions with helium atoms
to low temperatures as 10-20 K was not implemented, and most of the experiments sampled ions
with not well defined internal energy [31]. However this is a crucial aspect for the measurements

22
aimed at astronomical observations. In order to demonstrate the approach, a large organic cation
was chosen, 2,4-hexadiyne isomer of C6H6+, because its electronic spectrum, gu EXEA 22 ~~ ←
transition, has been characterized in molecular beams in emission [32], by laser induced
fluorescence [33], and the excited electronic state leads to fragmentation. Precisely, on formation
of the upper state, there is competition between fluorescence to the ground state and dissociation.
Both these decay channels have been studied; one by determination of the fluorescence quantum
yield [34] and the other via branching ratios of fragment ions [35]. For example on production
of the ion in the lowest vibrational level of the excited uE2 state, ~ 74 % of the time the ion falls
back down to the ground gEX 2~ state, and the rest fragments to produce dominantly C6H5
+
with minor amounts of C6H4+ and C4H4
+. As the measured breakdown curves show,
the yield of C6H5+ and C4H4
+ remains constant (around 0.20 and 0.05, respectively) on increasing
the internal energy in the uE2 state by around 4000 cm-1 [34].
Because the ion is a symmetric top (with assumed D3h symmetry) the K-structure
(rotation around the carbon containing axis) within the gu EXEA 22 ~~ ← transition can be
observed with modest resolution, enabling the temperature to be read-off from the spectrum.
By this means the viability and the concept of the approach has been tested and the results
are presented here. Most striking is the improvement in quality of the spectrum showing
numerous narrow vibronic bands with increasing complexity as the upper states are accessed,
in part due amplification of weaker bands by saturation. This new spectroscopic information
on the vibrational manifold in the uEA 2~ excited electronic state is presented.
1.3.3 Polyacetylene cations.
A number of polyacetylene cation chains have been studied in neon matrices [36, 37]
and in the gas phase. [38-43] Interest in these species stems from the observation

23
of hydrocarbons in combustion and interstellar environments. [44-47] In terms of astrophysical
relevance, large carbon chains are often speculated as being possible carriers of the unidentified
absorptions in diffuse interstellar clouds. In this vain, spectroscopic studies in the laboratory
are essential for astronomical assignments and help in the detection of new species
in the interstellar medium. Approximately 100 of the more than 130 molecules that have been
detected in the interstellar medium or circumstellar shells contain carbon. Because microwave
spectra of the linear polyacetylene cations are not available due to their centrosymmetric nature,
electronic spectroscopy offers a means of identification in the diffuse clouds.
It is crucial for a molecule to have a strong electronic transition moment in order
to assist astrophysical detection. One way to search for strong optical transitions is to examine
longer hydrocarbon chains for which the oscillator strength scales with size. [9] Carbon atoms
have an ability to easily create covalent bonds with themselves and form larger systems,
both ringed and linear. While smaller acetylene chains are apt to self-reaction, [48] larger ones
are predicted to be important intermediates toward the formation of soot, and thus may display
higher stability. [49, 50]
It has been suggested that the degree of ionization in interstellar clouds could be quite
large. [51] The ionization potentials of the polyacetylene hydrocarbon chains have been
measured up to HC8H, and the trend shows that while diacetylene’s value is 10.2 eV,
that of all larger carbon chains is less than 9 eV. [52, 53] Thus there may be a large abundance
of such ionized species located in the diffuse clouds.
Electronic absorption spectra obtained in 6 K neon matrices already exist for the large
acetylene cation series, [36] however gas phase values are needed for direct comparison
with astrophysical observations. In this paper results utilizing a technique that has been recently
developed in Basel for measuring the gas phase spectrum of collisionally cooled ions using
a two-colour two-photon approach are presented. [54] Ions are typically cooled to vibrational
and rotational temperatures on the order of 30-80 K, mimicking conditions that are relevant

24
in diffuse interstellar clouds. Such low temperatures also eliminate the presence of vibrational
hot bands, rendering assignments of the origin band straightforward.
While the neutral polyacetylene chains have been well documented and studied
up to HC28H in the gas phase, [55, 56] the cations have only been studied up to HC10H+, with
origin bands for HCnH+ (n = 4,6,8) having been rotationally resolved. Those for n=10
and greater will have rotational constants on the order of 0.01 cm-1 or less, [38] thus creating
difficulties in trying to elucidate the spectroscopic structure of these larger chains.
Previous observations of the absorption spectra of the A 2Π – X 2Π transition
for HC12H+, HC14H
+ and HC16H+ in 6 K neon matrices locate the origin bands at 934.1 nm,
1047.1 nm, and 1159.8 nm respectively. [36] Typically the gas phase transitions for smaller
polyacetylene cations are blue shifted by 100-130 cm-1 with respect to the neon matrix values.
[38] Taking into account such shifts places these transitions at 923.1 – 925.7 nm,
1033.3 – 1036.5 nm, and 1142.9 – 1146.8 nm in the gas phase. As the number of carbon atoms
increases the strong A 2Π – X 2Π electronic transition of the polyacetylene cations shifts linearly
(in nm) to the red.
1.3.4 Protonated polyacetylene cations.
Previous studies of the protonated polyacetylene cations include data from calculations,
[57-60] mass spectrometry, [60-62] and matrix-isolation experiments of their electronic
absorption spectra; [63] to this day the gas phase spectra have not been reported. To measure
these an apparatus has been built which incorporates the cooling capabilities of a 22-pole ion
trap. [28] Thus thermally cooled species can be spectroscopically interrogated.
The protonated polyacetylenes were chosen due to their chemical and astrophysical
significance. Unsaturated hydrocarbons have been shown to be present in the ISM and model
predictions also anticipate the presence of large polyacetylenic chains. [45, 46]

25
As many chemical reactions in the ISM are of the ion-molecule type, then protonated
polyacetylenes stand out as important intermediates bridging the gap in the chemistry of carbon
chains and cumulenes. [64]
To make significant comparisons to astrophysical observations it is necessary to create
ions both rotationally and vibrationally cooled. Previous studies have employed pulsed
molecular beam methods to produce cold polyatomic cations. [24, 65, 66] While these methods
have proven useful in rotationally cooling the created species, spectral congestion is still present
due to the fact that many of the vibrational modes are not fully relaxed. In this experiment
a desired species can be collisionally relaxed by trapping the ion in a cryogenically cooled He
bath. Both rotational and vibrational motions can be successfully lowered to temperatures
comparable to the interstellar medium (10-80 K).
The approach used has been previously tested in a one-photon experiment in which
2,4-hexadiyne cation was cooled and photodissociated. [67] In the latter an electronic absorption
was induced using tunable laser excitation and the process was monitored through the collection
of fragment ions. Thus the A 2Eu ← X 2Eg transition of C6H6+ was observed and it was shown
that rotational and vibrational temperatures of 30 K were attained. In the resulting spectrum all
vibrational hot bands were suppressed due to the low temperatures that were reached through
the use of cooled helium in the ion trap.
A two-photon one-colour process was utilized to study the spectrum
of p-dichlorobenzene cation. [28] Here the ions were once again mass selected and cooled
in the same helium filled ion trap, but this time two photons were required to probe
the B 2B3u ← X 2B2g transition of p-DCB+, as the B 2B3u state is bound. A rich vibronic structure
was observed and vibrational modes were assigned in the excited states. The photofragment
spectrum itself was due to the absorption of two photons of the same colour
in a process involving sequential internal conversion.

26
In this present study a two-photon two-colour photodissociation spectrum
of a collisionally cooled trapped cation is reported. The resulting measurement is the first gas
phase spectrum of a protonated polyacetylene species. Previously reported electronic absorption
spectra in a 6 K neon matrix [63] pinpointed the appropriate region to scan in the gas phase.
Besides locating the origin band for the three HCnH2+ (n = 4,6,8) species, the matrix results were
also able to provide useful vibrational frequencies for both the ground and excited states,
which in turn led to the assignment of the C2v nature of the protonated polyacetylenes.
Chapter 2 Experimental.
2.1 Apparatus.
The apparatus (Figure 2-1) consists of an electron impact ion source, a quadrupole mass
filter for selecting the desired molecular ion, a cryogenically cooled RF 22-pole trap, a second
quadrupole mass filter for selecting the charged photofragments, and a Daly ion detector. [68]
Figure 2-1 A schematic outlay of the 22-pole ion trap instrument.
All chambers are mounted on ball bushings that run along a track consisting of two
(∅ 2.5 cm) stainless steel rods. This makes it very convenient to open the chambers for

27
alignment, cleaning, or replacing components. The cryostat cold head is also supported
on a track that is oriented perpendicular to the main tracks, for opening up the chamber.
The system is evacuated by 5 turbo pumps. The source chamber is being pumped
by one turbo pump TMU 261 (pumping speed 210 l/s) and by its own membrane pump.
The chamber is separated from the rest of the system by a differential wall. This is done to
protect the quadrupole mass filters from being operated at relatively high pressure (5×10⁻⁵ mbar)
and to avoid gas condensation on the cryogenically cold 22-pole trap. The differential wall has
a small orifice (∅ 1 mm), which restricts gas flow and subsequently lowers the pressure
in the trap region by a factor of 100.
Each of the other four chambers is equipped with the same model turbo pump as the source
chamber. Exhaust lines of four turbo pumps are combined using long stainless steel bellows,
about 2.5 cm in diameter, which are then pumped out by a small turbo and membrane pumps.
Membrane pump is used to avoid oil contamination of the system. When one breaks vacuum,
the apparatus is filled with Ar gas to avoid water attachment to the inner walls and surfaces
of the system. This procedure significantly shortens the subsequent pumping time.
The system is sealed by conflate (CF) flanges, with soft copper gaskets. The entire system
reaches pressure as low as 1×10⁻⁹ mbar after 2 weeks of pumping. Pressures inside the chambers
are measured using Pfeiffer Vacuum Compact Cold Cathode Gauges, type IKR261. The fore line
pressures are monitored using a Pfeiffer Compact Pirani Gauge.
All electrical electrodes, ion sources, etc. are made of stainless steel, with the only
exception being the 22-pole ion trap, which is made out of oxygen free high conductivity copper
(OFHC copper) for good performance at low temperatures.

28
2.1.1 Ion source.
Figure 2-2 shows the assembled and ready-to-use ion source.
Figure 2-2 Photograph of the ion source, including the part of lens E2 that protrudes past the differential wall.
The ion source is a low-pressure electron impact source and is housed in the source
chamber. It consists of an oven to vaporize the solid sample and a gas inlet, which introduces
flow of the gaseous or vapors of volatile substances to an ionization region of the source.
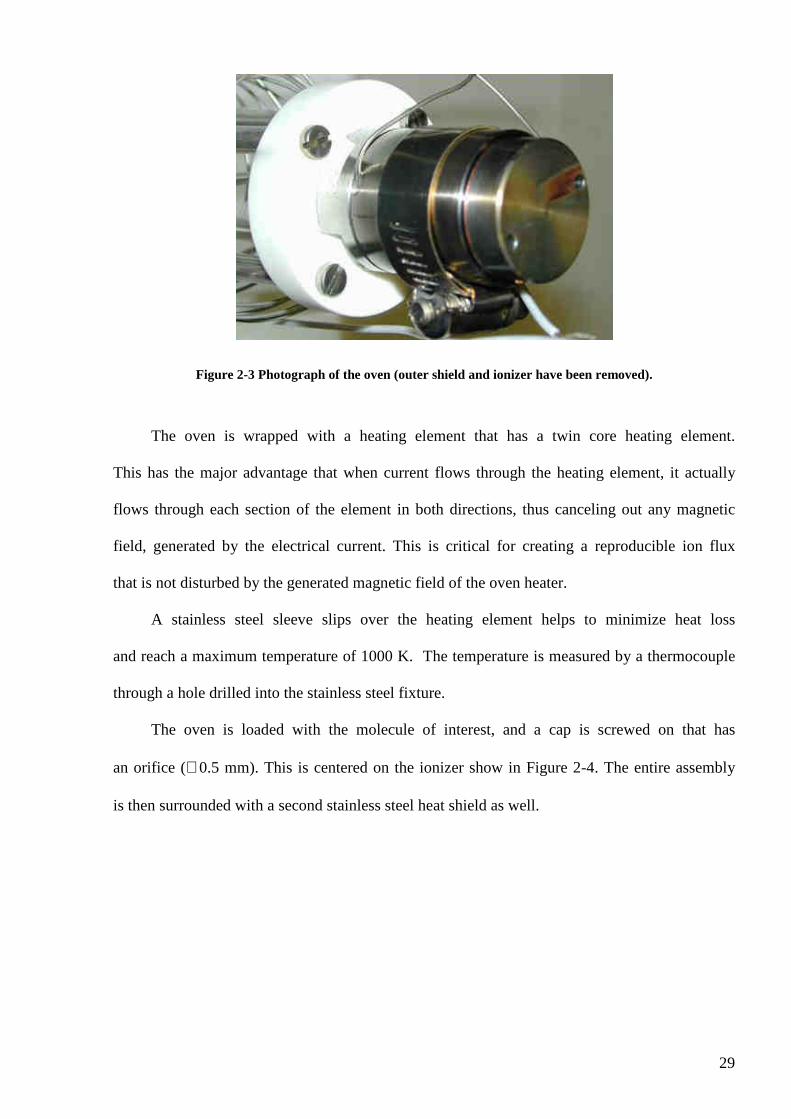
The oven, shown in Figure 2-3, is a stainless steel fixture, about 5.5 cm in length
and 2.5 cm in diameter, that is threaded on the outside.
29
Figure 2-3 Photograph of the oven (outer shield and ionizer have been removed).
The oven is wrapped with a heating element that has a twin core heating element.
This has the major advantage that when current flows through the heating element, it actually
flows through each section of the element in both directions, thus canceling out any magnetic
field, generated by the electrical current. This is critical for creating a reproducible ion flux
that is not disturbed by the generated magnetic field of the oven heater.
A stainless steel sleeve slips over the heating element helps to minimize heat loss
and reach a maximum temperature of 1000 K. The temperature is measured by a thermocouple
through a hole drilled into the stainless steel fixture.
The oven is loaded with the molecule of interest, and a cap is screwed on that has
an orifice (∅0.5 mm). This is centered on the ionizer show in Figure 2-4. The entire assembly
is then surrounded with a second stainless steel heat shield as well.

30
Figure 2-4 Electron Impact Ionizer.
The ionizer contains a thin Thorium doped tungsten wire (Goodfellow, 99.4 % W,
0.6 % Th, annealed, ∅ 0.1 mm) mounted on four electrically isolated holders. Heated by 2,2 A
electrical current the filament emits electrons to the center of the ionizer. The electrons
are additionally accelerated by a negative potential (10 – 30 V) applied to the filament
with respect to the ground. The principle electrical schematic of the ionizer is shown
in Figure 2-5.

31
Figure 2-5 Schematic electrical connection of the ionizer.
Ions are created in a small cylindrical piece made of metal mesh (9 mm in diameter,
11 mm long). The cylindrical mesh is mounted only a few mm from the orifice of the oven.
The mesh is held at a positive potential in a rage of 0.05-5.0 V. This potential actually defines
the potential energy of the charge particles. Ions created within the mesh can then escape through
the mesh if they have more than 5.0 eV of kinetic energy. Otherwise, they will be trapped
and can only escape through the extraction lenses into the first quadrupole. Ions created by an
electron impact in the inner volume of the cylindrical mesh are then extracted by the electrode,
which is usually at –15 V negative potential.
The entire ionizer assembly mounts onto the outer heat shield of the oven, and the last
element of the assembly, an extraction lens, slides into the sleeve (Figure 2-6) of a set

32
of electrical lenses mounted in the next chamber. Together, these electrical lenses couple
the ions produced in the source into the first quadrupole mass spectrometer.
The fixed voltages on the ion lenses are controlled by a bank of resistance dividers
that can be connected to either +15 V or –15 V power supplies. The voltages are set by a 10-turn
potentiometer, and can be individually monitored by connecting them to a built-in voltage
monitor. The entire panel was built by Georg Holderied in the electronics shop.
Floating box containing QMS1
ceramic spacer
Lens E1, -13V
Lens E2, +15V, drop to about +1V to extract ions
Lens E3, -13V
Differential pumping wall
mesh cylinder held at about +0.05V
ceramic mounting ring
outer oven heat shield
shield at -9V to direct electrons into mesh cylinder
Stainless Steel support for mesh cylinder
This portion of lens E2 is attached to the ion source.
This portion of lens E2 is attachedto the box containing QMS1
Figure 2-6 Schematic diagram of the ionizer and extraction lenses.
2.1.2 Quadrupole mass filter.
2.1.2.1 Technical details.

33
Figure 2-7 A drawing of a quadrupole. Colours indicate connected pairs of the rods.
A quadrupole is just a particular case of a multipole. It has four round rods (Figure 2-7)
that are connected to two outputs of RF generator. Four mutually parallel, high mechanical
precision, electrically isolated electrodes are oriented such that the electrical field between them
is hyperbolic. Opposite pairs of rods are typically electrically connected, yielding a requirement
for two electrical connections to the quadrupole.
While some manufacturers have chosen to fabricate high precision hyperbolic surfaced
electrodes, a common way to manufacture a quadrupole is to orient four round poles such that
their centers coincide with the corners of an imaginary square. The round poles are oriented such
that the distance between the faces of opposite poles is nominally 1/1.148 times the rod diameter.
This ratio is chosen such that the geometry center of the quadrupole approximates an ideal
hyperbolic field.
The first electric quadrupole in the apparatus is a resurrected Extrel quadrupole,
built in 1995. It has a 9.5 mm diameter quadrupole assembly, with a radio frequency supply that
provides 300 W of power at 880 kHz and a mass range of 3000 Daltons. The DC power supply
is a model U-1272. The RF power supply is a model 150QC quadrupole power supply.
The second (analysis) quadrupole is a Nermag model with 12.5 mm quadrupole diameter,
operating at 960 kHz with a mass range of 2000 Daltons.

34
2.1.2.2 Principle of operation.
Figure 2-8 Schematic of typical quadrupole power supply connection.
Figure 2-8 shows a schematic of connection for a typical quadrupole power supply.
In order to operate a quadrupole one has to provide a combination of precise DC and RF voltages
to the rods. Typically a constant RF is in the range of 700 kHz to a few MHz. A high voltage RF
transformer circuit has a single primary and two secondaries, which are 180 degrees out of phase
with each other. There are also resolving DC and pole bias offset DC power supplies. The pole
bias DC power supply determines the centerline potential of the quadrupole (i.e. same potential
and polarity added to both pairs of rods). Two resolving DC supplies provide equal magnitude
but opposite polarities to each pair of rods. The potentials for both of these DC supplies are
biased from ground by the pole bias supply.
The motion of a particle of charge-to-mass ratio e/m in the potential field of the quadrupole
can be described by the differential equations:
xtr
VV
m
e
dt
xd acdc
Ω
−+ cos
22
02
2
,
ytr
VV
m
e
dt
yd acdc
Ω
−− cos
22
02
2
and

35
02
2
=dt
zd,
where m is the mass of the ion, e is the charge of an electron, Vac is the applied zero-to-peak RF
voltage, Vdc is applied DC voltage, r0 is the affective radius between electrodes and Ω
is the applied radio frequency.
Each of the above equations is thus a special case of the Mathieu differential equation,
which in its general form is usually written
( ) 02cos22
2
=−+ uqad
uduu ξ
ξ,
where ξ = Ωt/2, u = x = y, 22
0
18
Ω
=−==r
V
m
eaaa dc
yxu , 22
0
14
Ω
===r
V
m
eqqq ac
yxu .
The Mathieu equation is solvable in an infinite series
( ) ( ) ξβξβ inCinCun
nn
n +−Γ++Γ= ∑∑∞
−∞=
∞
−∞=
2exp'2exp 22
which obviously reduces to a similar infinite sum of sine and cosine functions. But for our
purposes, it is acceptable to simply consider ion trajectories to be infinite sums of sine and cosine
functions in x-y plane, with each successive term having smaller amplitude and higher
frequency.
For a given system, the amplitude of the voltages and frequency determines which mass
(or range of masses) will have stable trajectories in the x-y plane and thus pass through
the quadrupole in z direction. Ions having unstable trajectories in the x-y planes will be
neutralized by striking the quadrupole electrodes.
It was shown that a particle of an any mass has a stable trajectory if the values of au and qu
are within the region bounded by curves [69]
8642
18874368
68687
2304
29
128
7
2
1uuuuu qqqqa +−+−= corresponding to the special case of β = 0,
and

36
5432
35864
11
1536
1
64
1
8
11 uuuuuu qqqqqa −−+−−= corresponding to β = 1.
Figure 2-9 One of the stability region of Mathieu Diagram calculated based on equations from reference [69].
Figure 2-9 shows the particular stability region of Mathieu diagram in two dimensions
(x and y). The stable ax, qx, ay, qy values are constrained within the solid boundary curves:
black corresponding to βx = 0, red to βx = 1, green to βy = 0, blue to βy = 1.

37
Figure 2-10 Expanded view of stability region of Mathieu diagram with suitable substitutions for a and q to convert into RF and DC space for mass 300 and 9.5 mm quadrupole operated at 880 kHz.
Figure 2-10 is an expanded view of the stability region of Figure 2-9, with suitable
substitution for the Mathieu parameters ax, qx, ay, qy to convert the axes into RF-DC voltage
space for m/z 300, with 148.120 ×
= roddr calculated based on a 9.5 mm round Extrel quadrupole
rod diameter, and operating frequency kHzf 8802
=Ω=π
. For any set of RF and DC voltages,
one could read directly from this figure whether ions of m/z 300 would have stable trajectories
through a 9.5 mm quadrupole operated at 880 kHz. It is evident from the figure that when no DC
voltage is applied to the rods, the quadrupole will be operating in an integral (ion guide) mode.
Straight (solid and dashed) lines show simultaneous change of DC and RF voltages upon a
mass scan. The dashed line is a low resolution scan and solid one is a high resolution. Mass
resolution can be increased by simply raising the slope of the scan line and lowering its intercept
with the triangle (stability region).

38
2.1.3 22-pole radio frequency ion trap.
Multipoles are widely used in many different applications. In general a multipole can be
driven as an ion guide or trap. To guide ions a certain amplitude of radio frequency is usually
applied to a multipole. By adding a small DC float voltage to the RF amplitude one can either
accelerate or decelerate ions. A multipole of a special configuration can be used for more
challenging purposes, for instance, focusing a charged particle beams to a relatively small sizes
[70].
In order to trap ions additional two electrodes in the entrance and in the end of a multipole
are required. By applying DC potential to these two electrodes one can accumulate, store ions
in principle infinitely. Once ions are trapped inside of a multipole one can do many of different
studies, e.g. chemical reactions [71], collisional relaxation and dissociation of cluster ions [72],
or resonant photofragmentation spectroscopy [28] and etc.
2.1.3.1 Technical details.
The 22-pole trap (Figure 2-11), which follows the design of Gerlich, [71, 73] consists
of 22 stainless steel rods (1 mm diameter, 36 mm length) equally spaced on an inscribed radius
of 10 mm.
Figure 2-11 22-pole RF Ion Trap.

39
The described geometry derives from the already established [74] important equation:
10
−=
n
rR ,
where R: rod radius; r0: inner radius of the rod arrangement or the so-called trap radius
and 2n: the number of rods.
The 22-pole trap is made almost entirely out of oxygen-free high conductivity copper.
Two flat pieces of copper on sides have arrays of 11 holes drilled into them. Rods were finally
press-fitted into them. The rods were cooled to low temperature and at the same time the copper
was heated up. Straight after the rods were quickly inserted into the copper pieces, so that when
the copper cools, they are rigidly held in place all the time.
In the Figure 2-11, it is clearly seen that the rods are only supported on one end
(look at the left end of the rod assembly, and you will see that half of the rods do not extend
far enough to touch the copper plate). This was done especially to avoid electrical contacts
between two sets of rods on opposite copper holders.
Moreover copper holders are electrically insulated from the copper trap housing by thin
sapphire (Al2O3) plates, which have no electrical conductance but have a relatively high heat
transmission. Indium foil was placed between the sapphire and copper edges to provide optimal
thermal contact. Being very soft, indium leaks into all surface imperfections providing the best
heat conductance.
The rod assembly is enclosed by a Π-shaped copper cover. The cover is screwed down
onto the trap housing to enclose the box and prevent gas from escaping quickly. It is electrically
isolated from the oscillating voltage of the endplates by the long cylindrical ceramic insulators
that fit into the hemi-cylindrical grooves. Two are shown in Figure 2-11on top of the copper
endplates. Two additional ones go in the two grooves in the front of the trap, as seen
in the figure, and two more go in an analogous pair of grooves on back of the trap.

40
These last four cylindrical ceramic insulators have a hole bored through them through which a
screw passes to hold the top of the box onto the whole system.
The copper box that contains the 22-pole trap is mounted on the second stage of helium
cryostat and is additionally surrounded by a heat shield of highly polished aluminum that
is bolted to the first stage of the cryostat. This shield is closed on all sides in order to avoid
radiative heat transfer from the room temperature surroundings.
Leybold COOLPOWER 5/100 cold head is used as a cryostat, which can provide 6 W
of cooling power at 20K, 100W at 80K. The cold head is powered by the Leybold COOLPAK
6000 compressor unit. A thin foil of indium conducts heat between the trap housing and the cold
head. Electrical connection wires and the helium buffer gas line are precooled on the first stage
of the cryostat to a temperature of 80 K before attachment to the trap. To measure the
temperature of the trap a calibrated silicon diode is mounted in the base of the 22-pole trap
housing. The lowest temperature achieved is slightly above 5 K.
It is imperative that no electrical connections that are subject to the low temperatures
of the trap are made with solder. Under low temperatures and repeated temperature cycling,
solder undergoes a phase change and becomes quite brittle, resulting in flaking and unreliable
connections under these conditions. Furthermore the ion trap moves by about 3 mm when cooled
down to 5 K due to thermal contraction of the cold head. Thus, the cold head has to be
on a translatable mount so that it can be aligned when cold. A Linos telescope with cross hairs
was used for proper alignment. The objective is a 1.2× magnifier and the two eyepieces
are f 25×, 10×. All electrical lenses, quadrupoles, etc. have the ability to mount crosshairs
on them (including the 22-pole device), and the telescope can be used to align these objects.
41
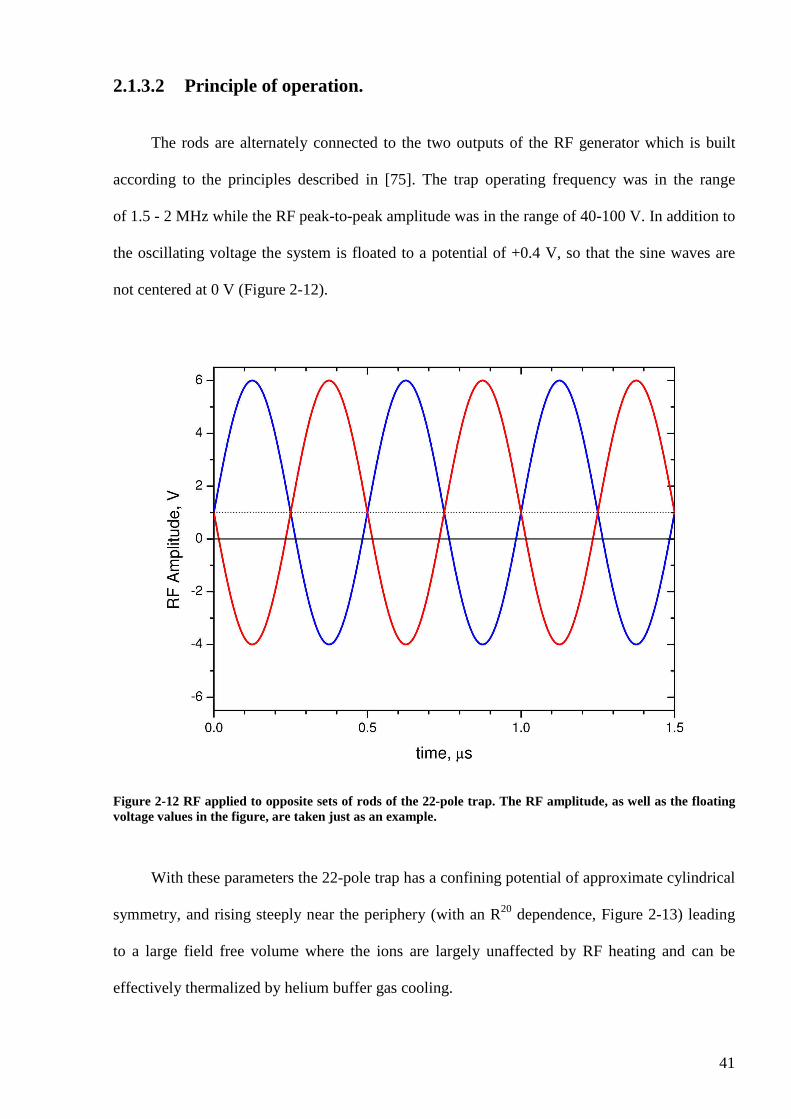
2.1.3.2 Principle of operation.
The rods are alternately connected to the two outputs of the RF generator which is built
according to the principles described in [75]. The trap operating frequency was in the range
of 1.5 - 2 MHz while the RF peak-to-peak amplitude was in the range of 40-100 V. In addition to
the oscillating voltage the system is floated to a potential of +0.4 V, so that the sine waves are
not centered at 0 V (Figure 2-12).
Figure 2-12 RF applied to opposite sets of rods of the 22-pole trap. The RF amplitude, as well as the floating voltage values in the figure, are taken just as an example.
With these parameters the 22-pole trap has a confining potential of approximate cylindrical
symmetry, and rising steeply near the periphery (with an R20 dependence, Figure 2-13) leading
to a large field free volume where the ions are largely unaffected by RF heating and can be
effectively thermalized by helium buffer gas cooling.

42
Figure 2-13 Cross-section of the effective potential surface for a quadrupole, octopole and 22-pole.
The base plate of 22-pole trap has three holes in it, just barely visible in the Figure 2-11,
which allow a stream of gas to enter. The actual gas inlets are on the opposite side of the base
plate, so that gas has to flow through the cold base plate before entering into the trap.
Helium is leaked into the trap using a continuous leak valve from Leybold. The pressure
in the trap was estimated as 5 × 10⁻⁴ mbar corresponding to a helium number density
of 4 × 1014 cm-3 at 10 K. Because the gauge (pressure meter) is mounted outside the trap there is
no direct pressure measurement. It is thought that the pressure inside the trap is actually about a
factor of 5× higher. The pressure gauge calibrated for N2 reads 1.5-2.5 × 10⁻⁵ mbar.
For He the pressure is about a factor of 6× higher (≈ 10-4 mbar).
Assuming a Langevin rate coefficient of ≈ 10-9 cm3 s-1, bimolecular thermalising collisions
occur at a frequency of ≈ 4 × 10⁵ s-1. Therefore the ion temperature is expected to approach

43
the ambient trap temperature in a few milliseconds. Ions are left to cool inside the trap for 70 ms
prior to firing the probe laser(s).
A potential of about 1.3 V was applied on the trap entrance lens and of about 1.9 V
on the exit side. The trap itself was floated at 0.4 V with respect to the ground. The idea
is to impinge the ions onto the trap with kinetic energies between 1.3 and 1.9 V, then use helium
collisions to cool them so they are trapped below the 1.3 V entrance potential. All these
potentials can be slightly different for a variety of ions. The small differences here come from
the fact that the production and trapping conditions for different ions require different electron
energies for electron impact, and slightly different extraction and trapping potentials.
2.1.4 Daly detector.
Ion detectors are widely used for many applications, as well as for mass spectrometry.
The simplest ion detector is a Faraday cup. It is a metal cup that is usually placed in the path
of the ion beam. It is attached to an electrometer which measures the ion-beam current.
A Faraday cup is capable of measuring both cation- and anion-beam currents. Because a Faraday
cup can only be used in an analog mode it is less sensitive than other detectors that are capable
of operating in a pulse-counting mode.
A channeltron is an ion detector which can be operated in pulse counting mode and
consequently is more sensitive. It has a horn-shaped continuous dynode structure that is coated
on the inside with an electron emissive material. By applying a high potential to the dynode one
creates continuous potential distribution along the channeltron. The high negative potential
at the entrance continuously decreases till the channeltron end. An ion striking the channeltron
creates secondary electrons that have an avalanche effect to create more secondary electrons
and finally a current pulse.

44
The principle similar to channeltron is used in microchannel plate (MCP) detectors.
A MCP consists of an array of glass capillaries (10-25 µm inner diameter) that are coated
on the inside with a electron-emissive material. The capillaries are biased at a high voltage, and
like the channeltron, an ion that strikes the inside wall one of the capillaries creates an avalanche
of secondary electrons. This cascading effect creates a gain of 103 to 104 and produces a current
pulse at the output.
All the detectors briefly mentioned above are usually placed in the path of the ion beam.
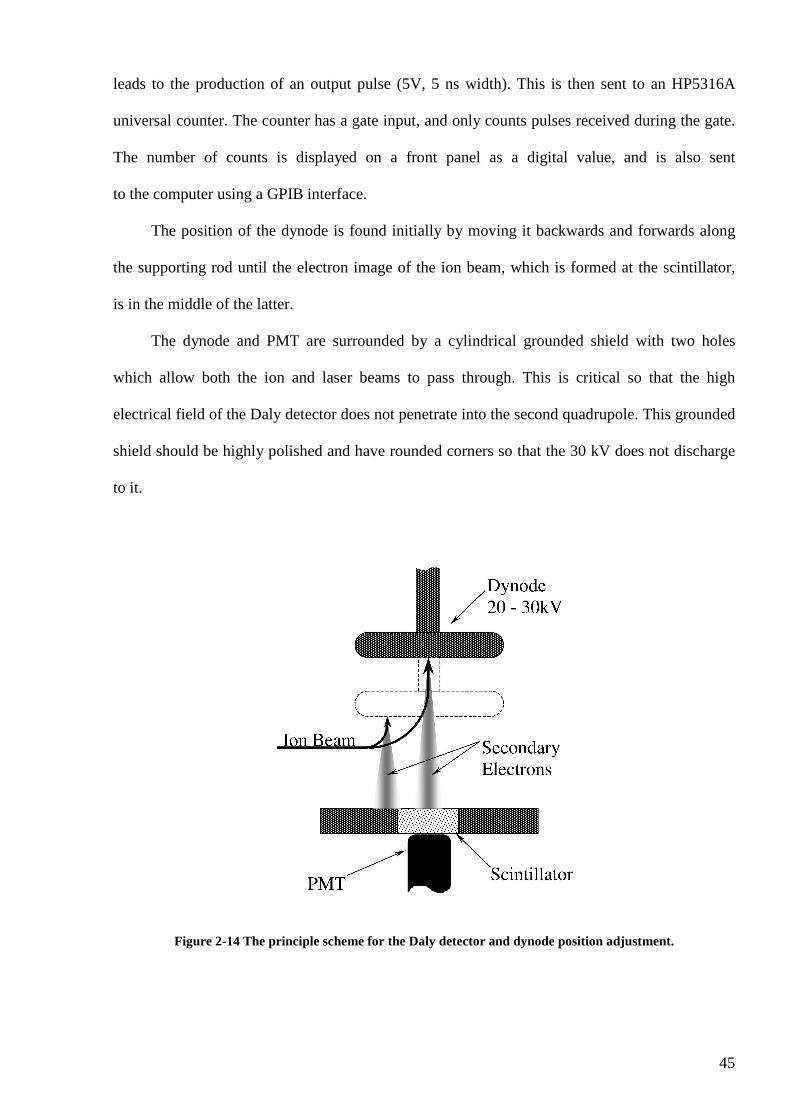
To circumvent such difficulty one may to use a Daly detector. This type of an ion detector
was introduced by N.R. Daly in 1960 [68]. A Daly detector (Figure 2-14) consists
of a conversion dynode, scintillator (BC400 plastic scintillator, 0.5 mm thick, from GC
Technology GmbH, Freidling 12 D-84172 Buch am Erlbach.) and photomultiplier tube
(R647 Hamamatsu PMT).
A critical feature of the scintillator is that it has been coated with a thin aluminum coating
(slightly transparent), so that the burst of electrons coming from the dynode must pass through
this aluminum coating prior to exciting the phosphor. This has two advantages. First, the highly
reflective aluminum coating greatly reduces the intensity of scattered laser light that hits the
detector, thereby reducing the background signal. Second, photons emitted from
the phosphor that are going in the wrong direction are reflected back to the PMT tube, so that
they are detected. The scintillator was custom-coated with aluminum for the J.P. Maier group
by the Department of Materials Science and Metallurgy, New Museums Site, Pembroke Street,
Cambridge CB23QZ, UK. The scintillator has a short pulse output, roughly 10 ns.
The dynode is a high polished metal knob at a negative high potential in a range of 20-30
kV, which emits secondary electrons when ions impinge on the surface. The secondary electrons
are accelerated onto the scintillator, providing light which is then detected by the PMT.
The output of the PMT is sent to a discriminator (Phillips Scientific Model 6904, 300 MHz),
which has a variety of outputs. In any event, every pulse that crosses the threshold (-20 mV)
45
leads to the production of an output pulse (5V, 5 ns width). This is then sent to an HP5316A
universal counter. The counter has a gate input, and only counts pulses received during the gate.
The number of counts is displayed on a front panel as a digital value, and is also sent
to the computer using a GPIB interface.
The position of the dynode is found initially by moving it backwards and forwards along
the supporting rod until the electron image of the ion beam, which is formed at the scintillator,
is in the middle of the latter.
The dynode and PMT are surrounded by a cylindrical grounded shield with two holes
which allow both the ion and laser beams to pass through. This is critical so that the high
electrical field of the Daly detector does not penetrate into the second quadrupole. This grounded
shield should be highly polished and have rounded corners so that the 30 kV does not discharge
to it.
Figure 2-14 The principle scheme for the Daly detector and dynode position adjustment.

46
The Daly detector is an ion counting counter. It operates between 0.1-2 × 10⁶ counts per
second. The large first dynode potential provides 6 electrons per ion impact and hence the high
gain of a Daly detector is about 107. The detector has a low noise level, 4×10-20 amp, and the
discrimination is small for ions in the high and low mass range. Admission of a gas
to the vacuum system does not affect the gain of the detector, as no activated surfaces
are situated within the vacuum.
Another advantage of the Daly detector is that the PMT and other electronics are external
to the vacuum. In the event of a fault occurring in the PMT a new one can be substituted
in a few minutes without letting air into the vacuum chamber. The Daly detector does not occupy
the main axis of the apparatus and thus allows one to introduce a laser beam into it.
2.2 Laser optical scheme.
2.2.1 One-colour experiment.
In the present studies electronic absorption spectra of molecular ions are recorded
via detection of fragments. If the exited electronic state of interest undergoes predissociation, this
is a one-photon experiment. In other words, if the one-photon resonant absorption brings
molecular ions above the fragmentation threshold the process is considered to be a one-photon
(colour) experiment. Figure 2-15 shows an example, where the first electronically exited state of
2,4-hexadiyne cation undergoes predissociation.

47
Figure 2-15 Energy diagram for 2,4-hexadiyne cation.
2,4-hexadiyne cation (linear isomer of C6H6+) has its first electronically exited state
slightly above the fragmentation threshold. After absorption of one resonant photon
2,4-hexadiyne cation dissociates to C4H4+ and C2H2. Recording the number of former cations
as a function of the laser wavelength gives an electronic absorption spectrum of 2,4-hexadine
cation. Figure 2-16 demonstrates the laser arrangement for a one-colour experiment.
Figure 2-16 Laser arrangement for an one-colour experiment.
48
A narrow band (0.3 cm-1) Nd:YAG pumped OPO system is externally triggered
from a BNC pulse generator. The external triggering is required in order to fire the laser exactly
when the ions are present in the trap. A pulse (width of 65 µs) from one channel of the pulse
generator is sent to the laser. Another channel of the pulse generator is sent to the external trigger
input of the apparatus. By adjusting the delay between these two channels one can fire
the laser at the required time.
The laser pulse is delivered to the 22-pole trap of the apparatus by three rectangular quartz
prisms. The laser beam is preliminary aligned through two diaphragms. These are separated by
approximately 2 meters and placed in front of a viewing port of the apparatus. Fine laser beam
adjustment is usually achieved by maximizing the yield of fragment ions.
2.2.2 Two-colour experiment.
A multi-photon approach is usually required if the lowest and some of the superposed
exited electronic states do not undergo predissociation. In the other words, if the energy
of the one resonant photon is not enough to bring a molecular ion above the fragmentation
threshold. In this case an additional absorption of a second photon can make it possible.
A process in which two photons of different energies are absorbed is considered
to be a two-colour experiment. Figure 2-17 shows an example of this, where the first
electronically exited state of C6H2+ (triacetylene cation) does not predissociate.

49
Figure 2-17 Energy diagram for triacetylene cation.
As can be seen from the figure, triacetylene cation has its first electronically exited state
below the fragmentation threshold. Only the absorption of a second, more energetic, photon (of
about 5eV) can dissociate triacetylene cation into C3H2+ and C3 neutral. Recording the number of
former fragments as a function of the laser wavelength gives an electronic absorption spectrum
of triacetylene cation. In Figure 2-18 the laser arrangement for a two-colour experiment is
shown.

50
Figure 2-18 Laser arrangement for a two-colour experiment.
As one can see from the figure there are two lasers. One is a narrow band (0.3 cm-1)
Nd:YAG pumped OPO and the second is a broad band (3 cm-1) Nd:YAG pumped OPO system.
The former laser system is used to provide tunable radiation while the other one delivers
the fixed wavelength. The second colour is typically in the range of 210 - 355 nm (5.9 - 3.5 eV).
The two laser systems are externally triggered from a BNC pulse generator. The external
triggering is required in order to fire the lasers exactly at the same time, and moreover at a time
when the trapped ions are present in the 22-pole trap. Pulses (width of 65 µs) from two
independent channels of the pulse generator are sent to the lasers with the delay determining
the relation to one another. This is necessary due to the lasers having different response times.
To circumvent this difficulty one has to adjust the delay between the two trigger pulses so that
the laser shots overlap in time. The third channel of the pulse generator is sent to the external
trigger input of the apparatus. By adjusting the delay on this channel one can fire the laser
at the required time.

51
The laser pulses are delivered to the 22-pole trap by a set of rectangular quartz prisms and
mirror. The mirror has an usually high reflectivity for the second fixed colour and transmission
for the first tunable radiation. Geometrical overlap of the two laser beams is controlled by using
two diaphragms. These are separated by approximately 2 meters and placed in front
of the viewing port of the apparatus. Fine alignment is usually done by maximizing the yield
of fragment ions. Optimal alignment involves obtaining the maximum yield of fragments
from two colours and minimum from either the first or second colour separately.
2.3 Software and data acquisition cards.
The experiment is run under software based on the Labview 7.0 platform. There are three
main programs used for the experiment. The first ABB Extrel Mass Spectrometer is used
to record the mass spectra of species produced and to filter a desired mass from all fragments.
The second program, named Nermag Mass Spectrometer, helps to analyze the particles collected
in the 22-pole trap and produced after laser exposure. The last program, named Sunlight EX OPO
Laser Spectrometer, records the electronic absorption spectra of the trapped particles.
The last program is specific to the Sunlight OPO System and cannot be used for any of the other
lasers. For instance, in order to control another laser system, (e.g. ScanMate dye laser or Ekspla
OPO system) one has to run a proper program.
2.3.1 ABB Extrel mass spectrometer.
The front panel (user interface) of the LabView program for ABB Extrel Mass
Spectrometer is shown in Figure 2-19.

52
Figure 2-19 Labview program for the ABB Extrel quadrupole mass spectrometer (user interface).
In order to start program press button 1 on the left top corner of the program window.
Button 2 stops the program at any time. Next step is to set the beginning and the end of the mass
scan with the first mass (3) and last mass (6) dial knobs. The exact mass value can be seen
on the digital display below each of the dial knobs. If the values of the first and last masses
are identical then the quadrupole will transmit only one specific mass.
The mass scan can be done in a few different ways. The drop-down dialog button 7 offers
three different options. One of the options is a single scan: after one successful mass scan
the program will stop and wait until the start scan button (13) is pressed again. This option

53
is often used to occasionally check the mass spectrum’s resolution. The second option is finite
scan, which performs a multiple scans, defined by the user. This option can be used to record
and average a few mass spectra. The actual scan number can be directly read out from scan
number display (15). The last scan option makes continuous infinite scans. To set this,
continuous scan has to be chosen. The last mode is best for fine resolution adjustment.
High resolution on the ABB Extrel mass spectrometer can be set through simultaneous
adjustment of digital controls 20, 21, 22. Pole bias (20) defines the quadrupole DC offset
in Volts and so kinetic energy of transmitted ions. Delta M (21) serves as a coarse adjustment
of the quadrupole resolution. Fine resolution adjustment can be done by Resolution (22) digital
control. If high resolution is still not achieved one can try to swap the DC and RF voltages
on the quadrupole rods. Usually two pairs of quadrupole rods must be identical, but due to
mechanical precision one can find better ion transmission by pressing the DC Pole Reverse
button (23). When necessary the resolution (resolving DC voltages) can be turned off by pressing
the 11 button which switches between Differential and Integral modes.
With the drop-down dialog button 8 one can choose whether the scan will be saved as a txt
file or just displayed on the screen as a mass spectrum. Control 12 defines the scan step-size.
If number of point per mass is set to 5 then the step-size will be 1/5 = 0.2 Dalton. The number
of ions at each point of the scan can be read out from digital display 10.
While a mass spectrum is recorded, scale (zoom-in or -out) can be adjusted by instruments
(4). The changes are directly seen on the screen (16), where the dotted red line (18) indicates
the current mass while scanning. In addition digital control mass shift (9) can correct the mass
spectrum if the maximum of the mass peak is ±0.5 Dalton away from the real mass. In order
to have the right mass peak position over the whole range a calibration procedure must be
initially performed. The calibration curve can be internally stored once and can later be applied
by pressing button 5.
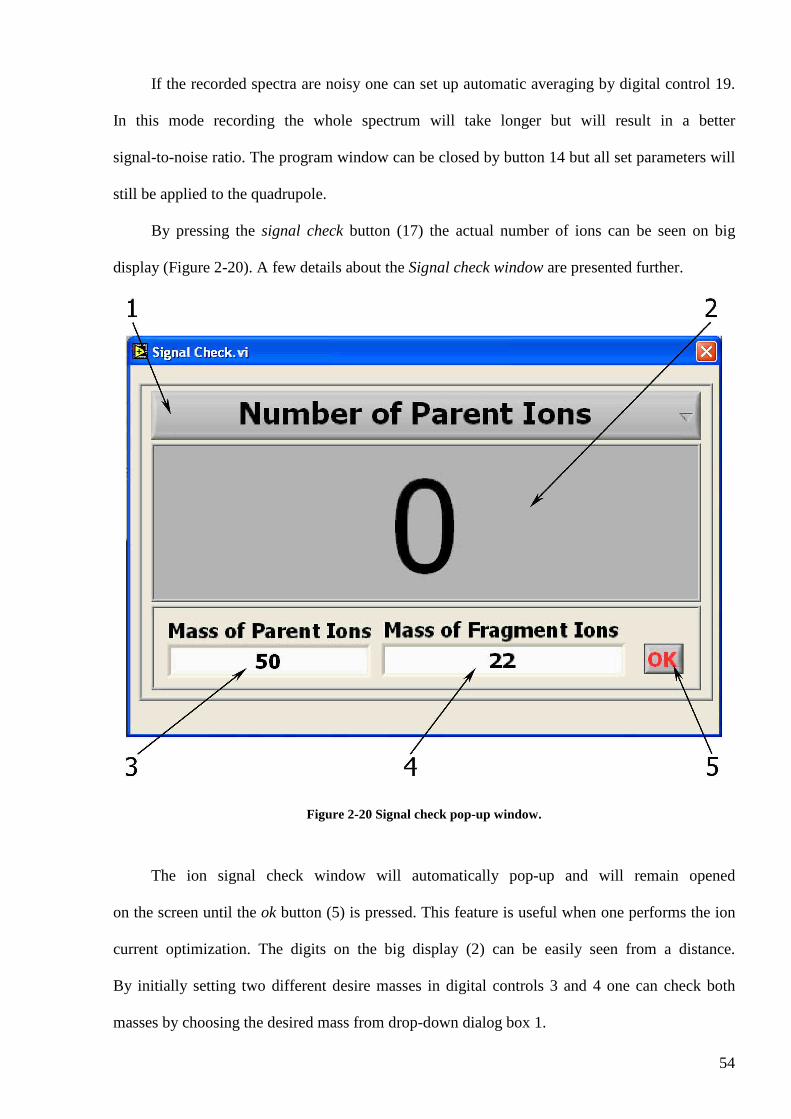
54
If the recorded spectra are noisy one can set up automatic averaging by digital control 19.
In this mode recording the whole spectrum will take longer but will result in a better
signal-to-noise ratio. The program window can be closed by button 14 but all set parameters will
still be applied to the quadrupole.
By pressing the signal check button (17) the actual number of ions can be seen on big
display (Figure 2-20). A few details about the Signal check window are presented further.
Figure 2-20 Signal check pop-up window.
The ion signal check window will automatically pop-up and will remain opened
on the screen until the ok button (5) is pressed. This feature is useful when one performs the ion
current optimization. The digits on the big display (2) can be easily seen from a distance.
By initially setting two different desire masses in digital controls 3 and 4 one can check both
masses by choosing the desired mass from drop-down dialog box 1.

55
2.3.2 Nermag mass spectrometer.
Front panel (user interface) of LabView program for Nermag Mass Spectrometer is shown
on Figure 2-21.
Figure 2-21 LabView program for Nermag quadrupole mass spectrometer (user interface).
In order to start the program press button 1 on the left top corner of the program window.
Button 2 stops the running program 2 at any time. To set the beginning and end of the mass scan
one has to adjust the desired values by the first mass (3) and last mass (5) dial knobs. The exact
mass values can be seen on the digital displays below each of the dial knobs. If the values
of the first and last masses are identical the quadrupole will transmit only one specific mass.

56
The mass scan can be done in different ways. The drop-down dialog button 6 offers three
different options. One of the options is a single scan: after one successful mass scan the program
will stop and wait until the start scan button (13) is pressed again. This option is often used
to check the mass spectral resolution. The second option is finite scan, which performs multiple
scans, with the number of scans defined by user in addition. This option can be used
to record a few mass spectra and later average them. The actual number of scans can be read
directly from the scan number display (15). The last option makes an infinite number of scans,
using the continuous scan option. The last mode is best for fine resolution adjustment.
Resolution on the Nermag mass spectrometer can only be adjusted manually on the quadrupole
control unit.
With the drop-down dialog button 7 one can choose whether the mass spectrum will be
saved as a txt file or displayed on the screen. The experimental approach can be changed
by drop-down dialog button 8. This dialog button offers either to run the experiment
in continuous or pulsed mode, which is required for spectroscopy on trapped ions. Continuous
mode can only be used for initial adjustment in order to make sure that ions can be efficiently
guided through the whole apparatus. Once ions are successfully guided, trapped ions mode must
be chosen to further adjust the various parameters and run spectroscopic measurements.
The control 12 defines the scan step-size. If the number of points per mass is set to 5 then
the step-size will be 1/5 = 0.2 Dalton. The number of ions at each point of the scan can be read
out from digital display 21. While a mass spectrum is recorded, the scale can be adjusted by the
set of instruments (4) and the changes can directly be seen on the screen (18), where the dotted
red line indicates the current mass while scanning. In addition, uncertainty in the mass
calibration (±0.5 Dalton) can be corrected by using the adjusted mass shift control (16).
A calibration procedure must be initially performed in order to have the right mass peak position
over the whole range of masses. The calibration curve can be internally stored and always
applied to a present mass scan.
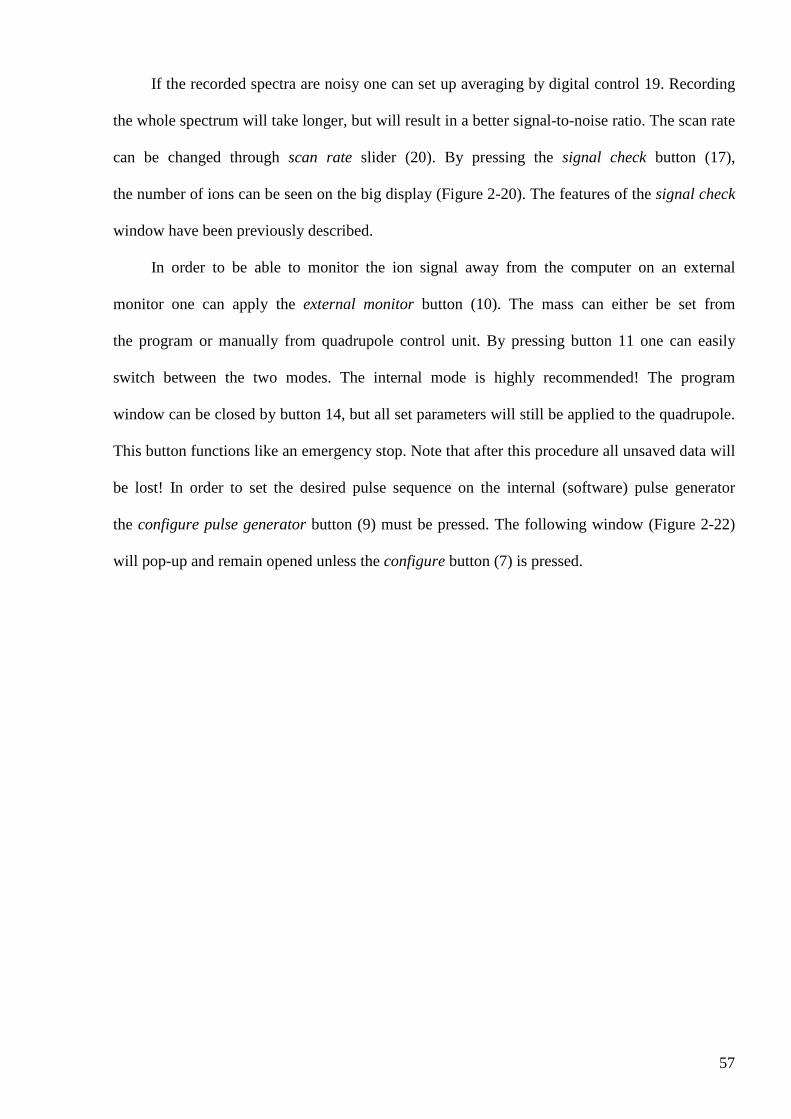
57
If the recorded spectra are noisy one can set up averaging by digital control 19. Recording
the whole spectrum will take longer, but will result in a better signal-to-noise ratio. The scan rate
can be changed through scan rate slider (20). By pressing the signal check button (17),
the number of ions can be seen on the big display (Figure 2-20). The features of the signal check
window have been previously described.
In order to be able to monitor the ion signal away from the computer on an external
monitor one can apply the external monitor button (10). The mass can either be set from
the program or manually from quadrupole control unit. By pressing button 11 one can easily
switch between the two modes. The internal mode is highly recommended! The program
window can be closed by button 14, but all set parameters will still be applied to the quadrupole.
This button functions like an emergency stop. Note that after this procedure all unsaved data will
be lost! In order to set the desired pulse sequence on the internal (software) pulse generator
the configure pulse generator button (9) must be pressed. The following window (Figure 2-22)
will pop-up and remain opened unless the configure button (7) is pressed.

58
Figure 2-22 Pulse generator (front panel).
The pulse generator has four independent channels (1, 6, 8, 9) capable of delivering
a single positive TTL pulse of a certain width and delay with respect to the external TTL trigger
signal. Channel 1 (1) is used to provide a pulse to one of the electrodes, which is mounted
in front of the ion source, in order to chop the ion beam. Channel 2 (6) provides a required pulse
to the 22-pole trap exit electrode in order to extract trapped ions toward the Daly detector.
Simultaneously, part of the output of channel 2 is sent to the counter gate input. This ensures that

59
counter will collect an ion signal only when ions are extracted. As one can see from Figure 2-22,
each of the channels has two dial knobs. The first (e.g. 3 on channel 1) sets a proper pulse delay
with respect to the trigger pulse, while the second (e.g. 5 on channel 1) sets the pulse width.
The exact value can be read out from the digital displays placed below each of the dial knobs.
The default scale is set to the µs regime, but can be redefined by a multiplexer available on each
four channels (e.g. 2, 4 on channel 1).
2.3.3 Sunlight EX OPO laser spectrometer.
The front panel of LabView program, which controls laser system is shown
in Figure 2-23.
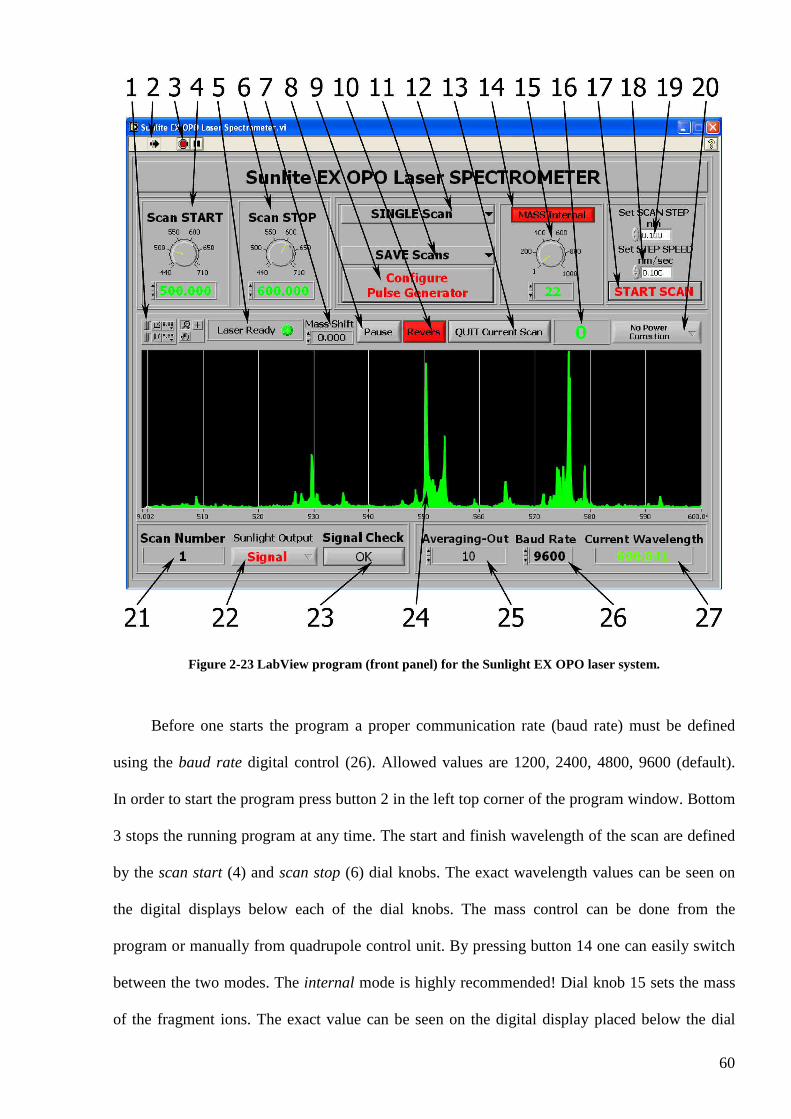
60
Figure 2-23 LabView program (front panel) for the Sunlight EX OPO laser system.
Before one starts the program a proper communication rate (baud rate) must be defined
using the baud rate digital control (26). Allowed values are 1200, 2400, 4800, 9600 (default).
In order to start the program press button 2 in the left top corner of the program window. Bottom
3 stops the running program at any time. The start and finish wavelength of the scan are defined
by the scan start (4) and scan stop (6) dial knobs. The exact wavelength values can be seen on
the digital displays below each of the dial knobs. The mass control can be done from the
program or manually from quadrupole control unit. By pressing button 14 one can easily switch
between the two modes. The internal mode is highly recommended! Dial knob 15 sets the mass
of the fragment ions. The exact value can be seen on the digital display placed below the dial

61
knob. In addition, one has to select the right mass shift value (7), which must be taken from the
Nermag mass spectrometer program. This ensures being on the maximum of signal
of fragmented ions.
The Sunlight output is defined from dialog button 22. Output can be either signal or idler
or doubled signal/idler. The wavelength scan can be performed in three different ways, as chosen
by the drop-down dialog button 12. One of the options is a single scan: after one successful mass
scan the program will stop and wait until the start scan button (17) is pressed again. This option
is usually used for recording an absorption spectrum. The second option is a finite scan, which
performs a set number of multiple scans. This option can be used to record and average a few
absorption spectra. The actual scan number can be read from the scan number display (21).
The last scan option involves making an infinite number of scans. Here, continuous scan has
to be chosen. The last mode is the best for adjusting of laser power or alignment. One can
directly see changes in the absorption spectrum on the screen (24).
With the drop-down dialog button 11 one can choose whether the mass spectrum will be
saved as a txt file or displayed on the screen. The control 19 defines the scan step-size.
The minimum step can be as small as 0.001 nm. In addition, one has to define the speed
of the wavelength change (18). In order to avoid a wavelength jitter it is important that the total
time of the wavelength change must not be less than 0.5 second per step. The number
of fragmented ions at each particular wavelength can be read out from the digital display 16.
An absorption spectrum can be displayed on the screen either as collected or as normalized
by the laser power curve. By choosing the normalization procedure from the drop-down dialog
button (20), the current spectrum can be normalized either by a first or a second order correction.
The Laser ready indicator (5) shows the status of the laser. When the LED is green
the laser has already changed the wavelength, while when red indicates that the wavelength
change is still in progress. The LED should normally be either always green or blinking,

62
indicating a change in wavelength. The current wavelength can be read out from digital
display 27.
The scale of the spectrum can be adjusted while scanning through a set of instruments (1),
where changes can be seen directly on screen (24). The Pause button (8) can be pressed when
one would like to check the laser stability, power and etc., without interfering with the current
scan. After all the checks are done one may return to the spectrum acquisition by simply pressing
the pause button once again.
If necessary the pulse generator can be reconfigured by pushing button 9. How to
configure the pulse generator has been already discussed. The reverse button (10) changes
the direction of the wavelength scan. Once it is pressed the stop button (6) starts blinking in
order to indicate that the end wavelength value has to be changed as soon as possible. If the
reverse button is red laser scans from blue to the red (from higher energy to lower one). If the
button is blue the wavelength scans from red to the blue (from lower energy to the higher one).
The current scan can be interrupted at any time by pushing button 13. This ensures that all
the data will be properly saved. A green button indicates that quitting of the current scan takes
place. Please do not push any buttons. When it is grey the current scan has been successfully
terminated. If the recorded spectra are noisy one can perform a signal average using digital
control 25. Recording the whole spectrum will take longer time but will result in a better
signal-to-noise ratio.
The signal check button (23), displays the number of ions (Figure 2-20). The features
of the signal check windows have been already discussed. A laser is usually connected to a PC
via RS232 port. The connection, based on optical fibers (Figure 2-24), significantly reduces any
interference from parasitic electrical signals always present in a laboratory.

63
Figure 2-24 Host PC and Laser PC connection based on optical fibers.
This becomes especially important when lasers are running in a nearby laboratory. In this
case a long RS232 electrical cable will not properly function.
2.3.4 Data acquisition cards and electrical connection.
There are three different types of data acquisition (DAQ) cards installed. PCI-6023E, PCI-
6713 by National Instruments and PCI-DAS6014 by Measurement Computing Corporation.
In the current setup these cards are named internally as device 1, device 2 and device 3,
respectively. The DAQ cards are used to provide all required analog voltages, TTL signals and
high precision pulse sequence. The DAQ cards serve like a bridge between the software installed
on the PC and the control units for the electronic instruments, e.g. quadrupole mass
spectrometers, lasers and etc. It also helps to synchronize the operation of all the experimental
equipment.

64
2.3.4.1 PCI-6023E (device 1).
The DAQ board (device 1) has no digital-to-analog converter outputs! It only provides
up to 16 analog inputs (0 through 15). Each channel pair, ACH <i, i+8> (i = 0..7), can be
configured as either one differential input or two single-ended inputs. The analog inputs have
12-bit resolution. The input ranges are bipolar-only. They have four ranges of ±10V, ±5V,
±500mV, ±50mV. The ranges are software-selectable. PCI-6023E provides up to eight digital
lines. Each of the lines can be configured either as digital input or output (software-selectable
function). This device uses the National Instruments DAQ-STC system timing controller
for time-related functions. The DAQ-STC consists of three timing groups that control analog
input, analog output, and general-purpose counter/timer function. These groups include a total
of seven 24-bit and three 16-bit counters and maximum timing resolution of 50 ns.
The DAQ-STC enables such applications as buffered pulse generation, equivalent time sampling,
and seamless changing of the sampling rate.
Table 5 gives a brief summary of the technical details and functions of the PCI-6023E
board.
Table 5 A brief summary of some features of the PCI-6023E (device 1) board with technical specification.
Technical specification Board Feature Parameter Characteristic
Analog Output Number of outputs Not available on this type of board Analog Input Number of inputs 16 (single-ended mode) 8 (differential mode) Signal Type and Direction Input only Resolution 12-bits, 1 in 4096 Impedance 100GΩ in parallel with 100 pF Protection On 42V, Off 35V Input signal range Bipolar only: ±10V, ±5V, ±500mV, ±50mV
(Software-selectable) Input coupling DC Sampling rate 200kS/s Monotonicity 12-bits, guaranteed monotonic DNL ±0.3 LSB typical, ±1.0 LSB max Digital Input / Output
Digital Type Discrete, 5V/TTL/CMOS compatible

65
Number of I/O 8 Configuration 8 bits, independently programmable for
input or output. All pins pulled up to +5VDC via 50kΩ resistors.
Input high voltage 2.0V min, 5.0V max Input low voltage 0V min, 0.8V max Output high voltage 4.35V min Output low voltage 0.4V max Data transfer Programmed I/O Power up / reset state Input mode (high impedance) Counter User counter type DAQ-STC Number of Channels 2 Resolution 24-bit Frequency Scalers 1, 4-bits Compatibility 5V/TTL/CMOS GRCTRn base clock source
(software selectable) Internal 20 MHz, 100 kHz and frequency scalers 10 MHz, 100 kHz or External (GPCTRn_SOURCE)
Internal 20 MHz clock source stability
±0.01%
Counter n Gate Available at connector (GPCTRn_GATE) Counter n Output Available at connector (GPCTRn_OUT) Clock input frequency 20 MHz max Pulse width (clock input) 10 ns min (in edge-detect mode) Pulse width (gate) 10 ns min (in edge-detect mode)
2.3.4.2 PCI-6713 (device 2).
The board (device 2) has no analog inputs! This is a Plug and Play, analog output, digital,
and timing I/O device for PCI bus computers. This card features a 12-bit digital-to-analog
converter with update rates up to 1 MS/s/channel for voltage output. There are up to eight
voltage output channels available. In addition, PCI-6713 card has eight lines of TTL-compatible
DIO, and 24-bit counter/timers for TIO.
The National Instruments device has no DIP switches, jumpers or potentiometers, so one
can easily software configure and calibrate it. This device, as well as previously described, uses
the National Instruments DAQ-STC system timing groups that control the analog inputs and
outputs, and general-purpose counter/timing functions. These groups include a total of seven

66
24-bit and three 16-bit counters and have a maximum timing resolution of 50 ns. Table 6 gives
a brief summary of the technical details and functions of the PCI-6713 board.
Table 6 A brief summary of some features of the PCI-6713 (device 2) board with technical specification.
Technical specification Board Feature Parameter Characteristic
Analog Output D/A Converter type Double-buffered, multiplying Signal Type and Direction Ouput only Resolution 12-bits, 1-in-4096 Number of Channels 8 voltage output Voltage Range ±10V, ±EXTREF Monotonicity 12-bits, guaranteed monotonic DNL ±0.3 LSB typ, ±1.0 LSB max Slew Rate 20V/µs min Settling Time (full scale
step) 3 µs to ±0.5 LSB accuracy
Noise 200µVrms, DC to 1MHz Current Drive ±5 mA max Output short-circuit duration Indefinite @25mA Output coupling DC Output impedance 0.1 ohms max Power up and reset DACs cleared to 0 V ±250mV max Analog Input Number of inputs Not available on this type of board Digital Input / Output
Digital Type Discrete, 5V/TTL/CMOS compatible
Number of I/O 8 Compatibility 5V/TTL/CMOS Configuration 8 bits, independently programmable for
input or output. All pins pulled up to +5VDC via 50kΩ resistors.
Input high voltage 2.0V min, 5.0V max Input low voltage 0V min, 0.8V max Output high voltage 4.35V min Output low voltage 0.4V max Data transfer Programmed I/O Power up / reset state Input mode (high impedance) Counter User counter type DAQ-STC Number of Channels 2 Resolution 24-bit Frequency Scalers 1, 4-bits Compatibility 5V/TTL/CMOS GRCTRn base clock source
(software selectable) Internal 20 MHz, 100 kHz and frequency scalers 10 MHz, 100 kHz or External (GPCTRn_SOURCE)
Internal 20 MHz clock source stability
±0.01%
Counter n Gate Available at connector (GPCTRn_GATE) Counter n Output Available at connector (GPCTRn_OUT)

67
Clock input frequency 20 MHz max Pulse width (clock input) 10 ns min (in edge-detect mode) Pulse width (gate) 10 ns min (in edge-detect mode)
2.3.4.3 PCI-DAS6014 (device 3).
The board (device 3) has two digital-to-analog outputs, as well as up to 16 analog inputs.
Each input can be individually con d as single-ended or differential. The analog inputs have 16-
bit resolution. The input ranges are bipolar-only. They have four ranges of ±10V (currently
in use), ±5V, ±500mV, ±50mV. The ranges are software-selectable.
The board provides nine user-configurable trigger/clock/gate pins. They are available
at a 100-pin I/O connector. Six are configurable as inputs and three are configurable as outputs.
Interrupts can be generated by up to seven ADC sources and up to four DAC sources
on the PCI-DAS6014.
The board contains an 82C54 counter chip, which consists of three 16-bit counters. Clock,
gate, and output signals from two of three counters are available on the 100-pin I/O connector.
The third counter is used internally. Table 7 summaries technical details of PCI-DAS6014
functions.
Table 7 A brief summary of some features of the PCI-DAS6014 (device 3) board with technical specification.
Technical specification Board Feature Parameter Characteristic
Analog Output D/A Converter type Double-buffered, multiplying Signal Type and Direction Ouput only Resolution 16-bits, 1-in-65536 Number of Channels 2 voltage output Voltage Range ±10V Monotonicity 16-bits, guaranteed monotonic DNL ±2 LSB typ Slew Rate 15V/µs min Settling Time (full scale step) 8 µs to ±1.0 LSB accuracy Noise 360µVrms, DC to 400kHz BW

68
Glitch Energy 200mV @ 1µs duration mid-scale Current Drive ±5 mA Output short-circuit duration Indefinite @25mA Output coupling DC Output impedance 0.1 ohms max Power up and reset DACs cleared to 0 V ±250mV max Analog Input Number of inputs 16 (single-ended mode) 8 (differential mode) Signal Type and Direction Input only Resolution 16-bits, 1 in 65536 Impedance 100GΩ in normal operation Protection On ±25V, Off ±15V Input signal range Bipolar only: ±10V, ±5V, ±500mV,
±50mV (Software-selectable) Input coupling DC Sampling rate 200kS/s min Monotonicity 16-bits, guaranteed monotonic Digital Input / Output Digital Type Discrete, 5V/TTL compatible Number of I/O 8 Configuration 8 bits, independently programmable for
input or output. All pins pulled up to +5V via 47K resistors (default). Positions available for pull down to ground. Hardware selectable via solder gap.
Input high voltage 2.0V min, 7.0V absolute max Input low voltage 0.8V max, -0.5V absolute min Output high voltage 3.80V min, 4.20V typical Output low voltage 0.55V max, 0.22V typical Data transfer Programmed I/O Power up / reset state Input mode (high impedance) Counter User counter type 82C54 Number of Channels 2 Resolution 16-bit Compatibility 5V/TTL CTRn base clock source
(software selectable) Internal 10 MHz, 100KHz or External (CTRn CLK)
Internal 10MHz clock source stability
50 ppm
Counter n Gate Available at connector (CTRn GATE) Counter n Output Available at connector (CTRn OUT) Clock input frequency 10 MHz max High pulse width (clock
input) 15 ns min
Low pulse width (clock input) 25 ns min Gate width high 25 ns min Gate width low 25 ns min Input low voltage 0.8V max Input high voltage 2.0V min Output low voltage 0.4V max Output high voltage 3.0V min

69
2.3.4.4 DAQ cards electrical connections.
The software described earlier, summarizes all the user provided settings and sends
the commands to the DAQ cads. According to the commands sent, the DAQ cards provide direct
voltage outputs, pulse sequences as well as analyze TTL signals or input voltages. Thus to work
together at the same time the DAQ card outputs (devices 1, 2, 3) are externally connected
with each other and with the controlled devices. Figure 2-25 shows all current electrical
connections required for the DAQ card outputs. Table 8 summarizes the electrical connections
between DAQ cards and external equipment.
Figure 2-25 DAQ cards electrical connection diagram.
Table 8 Connections between DAQ card outputs and external electronics.
Connector Number
Data transfer External device Application
1 Voltage output ABB Extrel QMS Input: Delta M; -10…+10V, 12-bit. 2 Voltage output ABB Extrel QMS Input: Pole Bias; -10…+10V, 12-bit. 3 Voltage output ABB Extrel QMS Input: Resolution; -10…+10V, 12-bit.
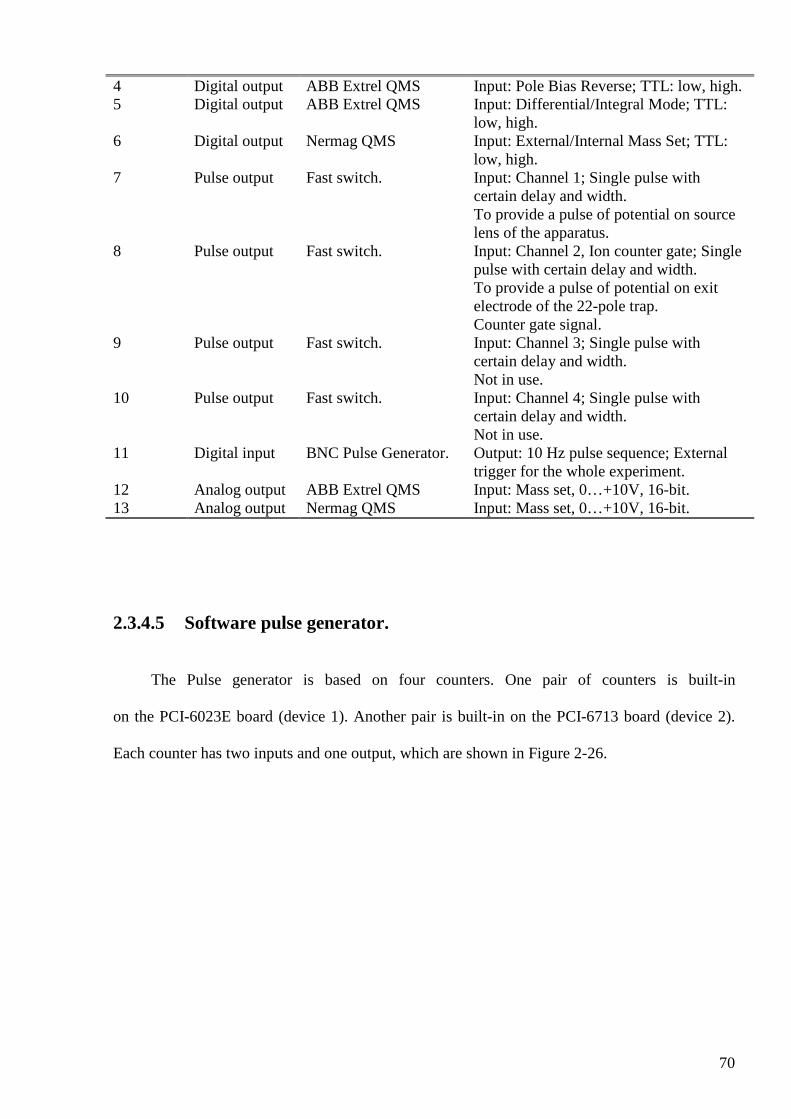
70
4 Digital output ABB Extrel QMS Input: Pole Bias Reverse; TTL: low, high. 5 Digital output ABB Extrel QMS Input: Differential/Integral Mode; TTL:
low, high. 6 Digital output Nermag QMS Input: External/Internal Mass Set; TTL:
low, high. 7 Pulse output Fast switch. Input: Channel 1; Single pulse with
certain delay and width. To provide a pulse of potential on source lens of the apparatus.
8 Pulse output Fast switch. Input: Channel 2, Ion counter gate; Single pulse with certain delay and width. To provide a pulse of potential on exit electrode of the 22-pole trap. Counter gate signal.
9 Pulse output Fast switch. Input: Channel 3; Single pulse with certain delay and width. Not in use.
10 Pulse output Fast switch. Input: Channel 4; Single pulse with certain delay and width. Not in use.
11 Digital input BNC Pulse Generator. Output: 10 Hz pulse sequence; External trigger for the whole experiment.
12 Analog output ABB Extrel QMS Input: Mass set, 0…+10V, 16-bit. 13 Analog output Nermag QMS Input: Mass set, 0…+10V, 16-bit.
2.3.4.5 Software pulse generator.
The Pulse generator is based on four counters. One pair of counters is built-in
on the PCI-6023E board (device 1). Another pair is built-in on the PCI-6713 board (device 2).
Each counter has two inputs and one output, which are shown in Figure 2-26.

71
Figure 2-26 Block diagram for the software pulse generator.
Input GPCTRn_SOURCE named clock acts as a bias frequency input for counter n.
GPCTRn_GATE named Gate acts as a trigger signal input. Output GPCTRn_OUT named
channel provides a high precision single pulse on each falling slope of the trigger pulse.
A bias frequency of 1 MHz, taken from pin FREQ_OUT (device 2), is sent to each of four
GPCTRn_SOURCE inputs. The frequency output can be configured from software to generate
any kind of desired frequency value. As higher frequency is as more precise pulse width
and delay one can obtain. Why it is so will become clear further on.
Each counter n configured from the Pulse Generator program generates a single pulse
with a certain delay to a trigger signal and certain pulse width. After successful trigger counter
starts counting number of bias frequency cycles. When the number of counts becomes equal
to certain (software-selectable) value, the counter output GPCTRn_OUT will go from low
to high value. The output will remain high unless the number of counts of bias frequency is less
than a certain value. After that counter output GPCTRn_OUT will go to low again.

72
Thus a counter output generates a single pulse with a certain delay and width. Since the bias
frequency equals to 1 MHz, time jitter will be as low as 1 µs (1/Ω).
2.4 Experimental approach.
The apparatus and experiment have been described. [54] Solid precursors, like
2,4-hexadiyne (C6H6) or para-dichlorobenzene (p-DCB), were placed directly into a stainless
steel oven, which was heated up to the required temperature (40 0C) by a resistive wire.
The vapor flowed through a 0.5 mm orifice after which electron impact ionization took place.
For gaseous precursors, like N2O or diacetylene, sample vapours were admitted
to the ionisation region through a needle valve. N2O is commercially available and stored
in a 1 L gas bottle at a pressure of around 11 bar. Diacetylene was synthesized by Jacques
Lecoultre and stored in a 1 L gas bottle at a pressure not higher that 500 mbar. This was done
due to diacetylene’s explosive nature. Lager amounts of diacetylene must be stored as a frozen
solid sample at –80 °C!
The pressure value in the ionization region was kept at ≈ 4 x 10⁻⁶ mbar (calibrated by N2).
The ionizing electrons’ energy was adjusted to be slightly above the target molecule’s ionisation
potential, 9 - 10 eV for p-DCB+ and 2,4-hexadiyne, 12 - 13 eV for N2O+ and around 12-30 eV
for diacetylene, depending on the size of the carbon chain.
The apparatus is run in a pulsed mode and the experiments were carried out at 10 Hz
(Figure 2-27). The pulse sequence is generated by a software pulse generator, which has already
been described above.

73
Figure 2-27 Timing and pulse sequence for the measurements carried out at 10 Hz.
Ions generated by the source are mass selected by the first quadrupole and are accumulated
in the 22-pole trap for 10 ms through collisions with ≈ 10-4 mbar helium buffer gas. Following
this, the potential of an electrostatic lens at the exit of the ion source is raised preventing more
ions from reaching the trap. The ions are constrained in the trap by a RF field and undergo
collisions with helium gas cooled by a cryostat operating at 6 K.
After being in the trap for 71 ms the ions are probed using either a one-colour
or two-colour pump-probe approach. In the case of an one-colour experiment, the light (typically
3 mJ) comes from a tunable OPO laser system (0.3 cm-1 bandwidth). A dye laser system was
used for the higher resolution (0.03 cm-1) measurements.
In the case of two-colour pump-probe experiment, the light was provided from both
a tunable Nd:YAG pumped OPO laser (0.3 cm-1) and the fixed doubled output from a broadband
OPO system (6 cm-1). Tunable radiation was used to promote an electronic excitation.
A subsequent UV photon was then used to initiate fragmentation of the excited ions.
For optimum signals the two laser beams must be overlapped in both time and space. The laser
beams were combined using a highly reflective 45° mirrors (200-355 nm). The tunable radiation

74
was passed through the mirror while the fixed UV beam was reflected by 90° to be collinear with
it. Time overlap was monitored using two identical photodiodes; jitter was less then 10 ns.
After a laser excitation, the potential of the exit lens of the trap is lowered for 10 ms
allowing the ions to exit through the second quadrupole mass filter, which is set to the mass
of the photofragment ions. The latter are eventually detected by a Daly detector, the output
of which is sent to a discriminator. Each detected ion produces a uniform spike (5 ns, 5 V)
on the discriminator output, sent to a 300 MHz counter. The number of fragment ions is counted
as a function of the laser wavelength to provide the absorption spectrum. The spectrum is
normalized for photon intensity, monitored shot to shot by a photodiode. Each data point
is an average of 50 cycles. Typically, 5-10 × 104 ions are trapped and irradiated on each cycle.
The background fragment count (without laser light) was usually < 10 per cycle.

75
Chapter 3 Results and discussion.
3.1 One-photon two-colour photofragmentation
spectroscopy.
3.1.1 N2O cation.
Figure 3-1 The absorption spectrum of N2O+ obtained by monitoring the NO+ fragment count as a function of photon wavelength. Also shown are simulated spectra for temperatures of 15, 25 and 35 K.
76
The ++ Π←Σ 2/322 ~~
XA band of N2O+ is shown in Figure 3-1. Also shown are simulated
spectra for temperatures of 15, 25 and 35 K. [76, 77] Molecular constants used in the simulations
are B" = 0.41157 cm-1, D" = 0.2985×10⁻⁶ cm-1, q" = 1.13×10⁻³ cm-1, A" = 132.434 cm-1, B' =
0.42893 cm-1, D' = 0.2855×10⁻⁶ cm-1, and γ" = 7.0×10⁻⁴ cm-1 and are taken from [17, 18].
It is apparent that the experimental spectrum corresponds well to the T = 25 K simulated
spectrum indicating that the N2O+ ions’ rotational degrees of the freedom are effectively cooled
by collisions with the helium buffer gas. In principle it is also possible to assess the translational
temperature of the N2O+ ions through the Doppler broadening of the rovibronic lines. However,
in the present case this was not possible because the bandwidth of the OPO radiation (≈ 0.5 cm-1)
was much greater than anticipated Doppler broadening (≈ 0.017 cm-1 at 25 K).
3.1.2 2,4-hexadiyne cation.
3.1.2.1 Internal temperature of 2,4-hexadiyne cation.
The electronic absorption process was monitored via the fragmentation channel leading
to C6H5+, C6H4
+ and C4H4+.

77
Figure 3-2 The gu EXEA 22 ~~ ← transition of 2,4-hexadiyne cation recorded (0.3 cm-1 resolution) via a
one-photon predissociation process by monitoring the C4H4+ fragment ions produced. The ions were
vibrationally and rotationally relaxed to around 30 K by collisions with cryogenically cooled helium in a 22-pole radiofrequency trap.
Figure 3-2 shows the spectrum in the 20000-22850 cm-1 range recorded by monitoring
the number of C4H4+ counts as function of laser frequency (0.3 cm-1 bandwidth). The relative

78
intensities of the vibronic bands differ somewhat for reasons discussed in the next section.
The origin band at 20553 cm-1 stands alone and there is no evidence of hot bands of type 01v
or 02v to lower energy, or sequence transitions 1
1v arising from residually populated vibrational
levels in the gEX 2~ ground state. The lowest frequency mode is around 120 cm-1 and thus
the vibrational temperature is below 30 K. When the laser bandwidth is reduced to 0.03 cm-1
the rotational structure due to the K-stacks is resolved. This is seen in Figure 3-3 together
with the quantum number assignment inferred in the analysis of the gu EXEA 22 ~~ → emission
spectrum [78].
Figure 3-3 The origin band in the gu EXEA 22 ~~ ← transition of 2,4-hexadiyne cation detected via
predissociation to C4H4+ using a laser band-width of 0.03 cm-1. The assignment of the K-structure is taken
from [78] and the intensity distribution corresponds to a rotational temperature in the 20-30 K range.
This pattern varies with temperature and the spectrum shown in Figure 3-3 resembles
closely the top trace in Figure 3-4 (reproduced from ref. [78]), i.e. a rotational temperature
in the 20-30 K range.
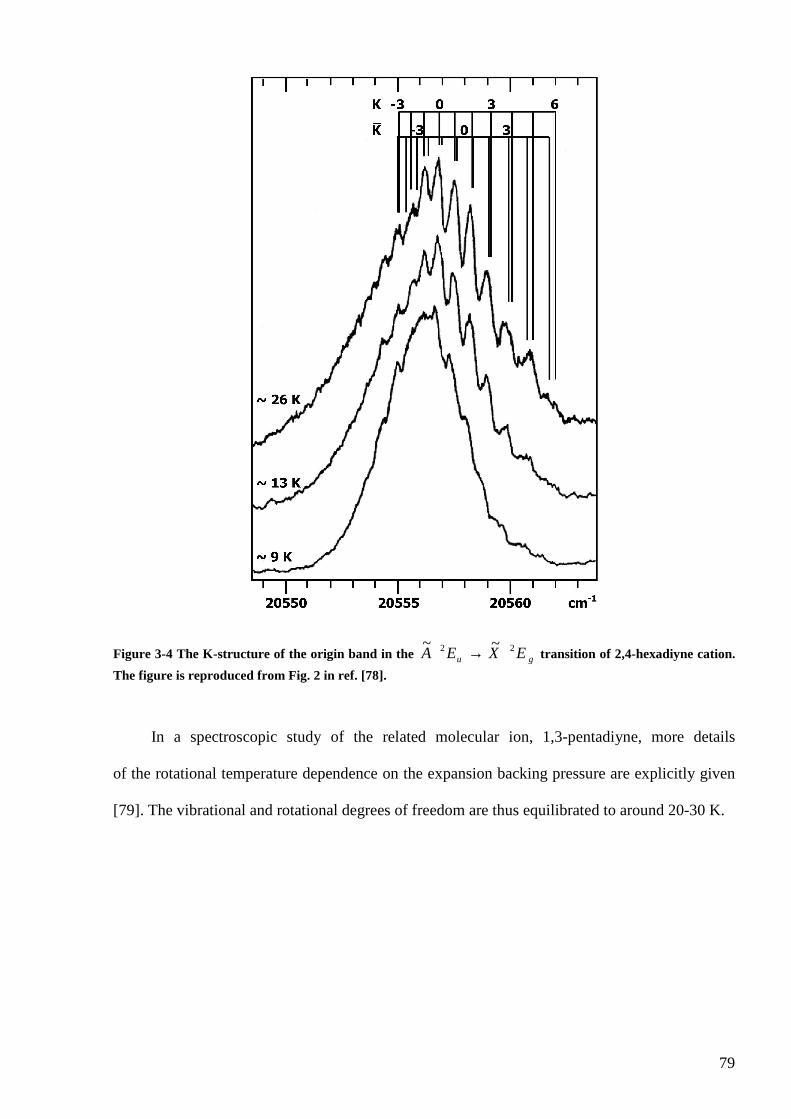
79
Figure 3-4 The K-structure of the origin band in the gu EXEA 22 ~~ → transition of 2,4-hexadiyne cation.
The figure is reproduced from Fig. 2 in ref. [78].
In a spectroscopic study of the related molecular ion, 1,3-pentadiyne, more details
of the rotational temperature dependence on the expansion backing pressure are explicitly given
[79]. The vibrational and rotational degrees of freedom are thus equilibrated to around 20-30 K.

80
3.1.2.2 Vibrational structure.
The electronic spectrum shows increasing complexity as the laser excitation frequency
is increased. Figure 3-5 reproduces the absorption spectrum of 2,4-hexadiyne cation from ref.
[33] obtained by laser induced fluorescence technique in 1980.
Figure 3-5 The gu EXEA 22 ~~ ← laser induced excitation spectrum of uncooled 2,4-hexadiyne cation taken
in 1980 [33].
In the spectrum reported earlier, using ions relaxed to about 150 K and recorded via a laser
induced fluorescence technique [33], only the totally symmetric modes (1v to 5v ) appear to be
strongly excited. Many more transitions are now apparent (Figure 3-2). In Table 9
the frequencies of all the observed distinct peaks in the spectrum are listed with the numbering
as shown in Figure 3-2.

81
Table 9 Wavenumbers of vibronic bands in the gu EXEA 22 ~~ ← system of 2,4-hexadiyne cation.
The numbering of the peaks is that shown in Figure 3-2.
No Band Wavenumber (cm-1) Relative to 000 (cm-1) Assignment
1 20553 0 000
2 20984 431 3 21004 451 4 21024 471 5 21046 493 6 21079 526 1
05
7 21166 613 8 21183 630 9 21213 660 10 21235 682 11 21255 702 12 21273 720 13 21352 799 14 21373 820 15 21443 890 16 21475 922 17 21505 952 18 21538 985 19 21556 1003 20 21579 1026 21 21605 1052 2
05
22 21647 1094 23 21663 1110 24 21686 1133 25 21712 1159 26 21726 1173 27 21754 1201 28 21773 1220 1
04
29 21801 1248 30 21877 1324 31 21889 1336 1
03
32 21961 1408 33 21985 1432 34 22021 1468 35 22045 1492 36 22072 1519 37 22092 1539 38 22111 1558 39 22135 1582 3
05
40 22165 1612 41 22187 1634 42 22226 1673 43 22248 1695 44 22268 1715 45 22297 1744 1
01054

82
46 22334 1781 47 22374 1821 48 22407 1854 1
01053
49 22434 1881 50 22457 1904 51 22489 1936
All these are new observations leading to a detailed mapping of the uEA 2~ exited
electronic state manifold. The strongest bands involve the totally symmetric modes 105 , 104 and
their combinations. There are too many other bands to be assigned only to transitions involving
the five ga1 modes where the D3h symmetry is retained in both electronic states, which have the
frequencies of 2911, 2266, 1378, 1255 and 560 cm-1 in the ground state of neutral 2,4-hexadiyne
[80]. For example, four distinct peaks lie just below the 105 transition (i.e. < 500 cm-1), which
have to correspond to the excitation of the degenerate modes in two, or more, quanta.
These can only be constructed from the four degenerate modes 14v (350 cm-1), 15v (121 cm-1)
both of ue symmetry, and 20v (245 cm-1) of ge , where the frequencies given are the values
of the neutral molecule. Thus the 10
10 1514 , 2
015 , 2020 transitions would each give a totally
symmetric level as would 4015 with several components with energies below 500 cm-1.
The number of such peaks increases with internal energy as more possibilities arise
for the formation of totally symmetric levels by appropriate combinations of the degenerate
modes, but a specific assignment would not be unambiguous. For this reason in Table 9
only the evident progressions and combinations involving totally symmetric modes are given.
The enhanced intensity of the transitions involving the degenerate modes is a result
of saturation. This is illustrated in Figure 3-6 where the region around the 105 transition
is recorded: trace a - using the same laser power as in Figure 3-2, and b attenuated by a factor
of around 300.

83
Figure 3-6 The region around the 105 transition in the gu EXEA 22 ~~ ← spectrum of 2,4-hexadiyne cation
detected via predissociation to form C4H4+ recorded: a) at 3 mJ/pulse (as in Fig. 3), b) at 9 µµµµJ/pulse (~300
times lower). The inset shows the dependence of the 105 band on laser energy indicating that the transition is
saturated.
The latter measurement is a reflection of a normal absorption; the bands arising from
the excitation of the degenerate modes are quite weak and reflect the Franck-Condon factors.
At the higher laser density these weak transitions are saturated leading to increased intensities.
At even higher powers (tens of mJ per pulse) the peaks in the spectrum broaden.
The inset of Figure 3-6 shows the intensity of the 105 band plotted as function of the laser power.
The non-linear dependence indicates saturation above 0.5 mJ/pulse. By this means the manifold
of the vibration levels in such cold polyatomic ions is “lit-up”.

84
3.2 Two-photon one-colour photofragmentation
spectroscopy.
3.2.1 1,4-dichlorobenzene cation.
As another test of the apparatus the spectrum of the p-DCB+ radical cation was measured
over the 19100 - 22700 cm-1 range by monitoring the C6H4Cl+ fragment (i.e., Cl loss channel).
Figure 3-7 The electronic transition of the p-DCB+ radical cation over the 19500 - 20700 cm-1 range obtained by monitoring the C6H4Cl+ fragment count. Wavenumbers and assignments for vibronic bands are given in Table 1.
The resulting spectrum, shown in Figure 3-7, exhibits a series of well-resolved vibronic
bands that can mainly be assigned to the dipole allowed gu BXBB 22
32 ~~ ← transition.
The excellent signal to noise ratio achieved is evident. The lower frequency bands, which have

85
widths of ≈ 10 cm-1, have peak intensities that are 103 larger than the background level
(≈ 10 counts/laser shot).
The lowest frequency transition, the gu BXBB 22
32 ~~ ← 00
0 band, is observed
at 19622 cm-1, in excellent agreement with the value derived from the optical emission spectrum
of p-DCB+ (19620 ± 10 cm-1) where the band was much broader (Figure 3-8). [20]
Figure 3-8 The emission spectrum of the p-DCB+ radical cation over the 16000- 20000 cm-1 range obtained in 1978 [20].
For p-DCB+ [21, 22, 81] the corresponding 000 transition occur at 19452 and 19212 cm-1
in Ne and Ar matrices respectively, representing matrix induced red shifts of 0.9 and 2.1%,
respectively. Wavenumbers and assignments for the lower energy gu BXBB 22
32 ~~ ← transitions
are listed in Table 10.

86
Table 10 Wavenumbers of vibronic bands for the gu BXBB 22
32 ~~ ← system of the p-DCB+ radical cation.
Band Wavenumber (cm-1)
Relative to 000
(cm-1)
Assignment
19622 0 000
19797 175 3002
19942 320 601
20046 424 2202
20118 496 601 300
2 20130 508 290
1 3001
20175 553 1702
20219 597 20260 638 60
2 20270 648 270
2 20359 737 50
1 20434 812 80
2 20459 837 290
2 20479 857 160
1 1701
20500 878 601 170
2 20530 908 20580 958 60
3 20682 1060 50
1 601 / 40
1
Assignments were made on the basis of a comparison between the experimental
frequencies of neutral p-DCB, and with Ar matrix absorption and gas-phase emission spectra
of p-DCB+. The prominent 320 cm-1 progression, which was also observed in Ar matrix
absorption spectra with a similar spacing (320 and 331 cm-1), [21, 22] corresponds to the ν6 (a1g)
vibration (symmetric C-Cl stretch). The enhanced spectral resolution and excellent S/N
of the gas phase spectrum compared to the earlier Ar matrix absorption spectra allow us
to identify a number of previously unobserved vibronic transitions including 3002 , 220
2 , 601 300
2 ,
2901 300
1 , 1702 , 50
1 , 802 , 290
2 , 1601 170
1 and 501 60
1 . Vibrational frequencies for the uBB 32~
state
based on these transitions, along with corresponding values for the S0 and S1 states of the neutral
p-DCB are given in Table 11.

87
Table 11 Selected vibrational frequencies bands for the S0 and S1 states of neutral p-DCB and for the
uBB 32~
state of the p-DCB+ radical cation.
Mode Neutral p-DCB S0
1
Neutral p-DCB S1
2
p-DCB+
uBB 32~
Ar matrix
p-DCB+
uBB 32~
this work
Description
5 (ag) 747 727 737 ring def. 6 (ag) 328 301 3203
3314 320 symmetric C-Cl stretch
8 (au) 405 167 406 ring twist 16 (b2g) 687 416 581 ring twist 17 (b2g) 298 276 out of plane C-Cl bend 22 (b2u) 226 225 212 in plane C-Cl bend 26 (b3g) 626 538 ring def. 27 (b3g) 350 339 324 in plane C-Cl bend 29 (b3u) 485 294 420 ring twist 30 (b3u) 122 75 88 out of plane C-Cl bend 1[82], 2[83, 84], 3[21], 4[22]
In most cases the p-DCB+ uBB 3
2~ state frequencies are similar to those of the neutral
p-DCB molecule. The p-DCB+ spectrum becomes congested above 21000 cm-1 (Figure 3-9)
where the gu BXBC 22
22 ~~ ← transition is predicted to occur. [20]

88
Figure 3-9 Spectrum of the p-DCB+ radical cation over the 19100 - 22700 cm-1 range obtained by monitoring the C6H4Cl+ fragment count as a function of photon wavelength. Transitions in the 19600 -
20700 cm-1 range can be assigned to the dipole allowed gu BXBB 22
32 ~~ ← system, while above 21000 cm-1
there are probably also contributions from vibronically induced gu BXBC 22
22 ~~ ← transitions.
Although dipole forbidden, it may be induced through vibronic coupling between
the uBC 22~
and uBB 32~
states. The only mode with appropriate symmetry to couple the two
states is the ν9(b1g ) vibration which has a frequency of 815 cm-1 in neutral p-DCB.
From the photoelectron spectrum, the uBC 22~
state was estimated to lie 1045 cm-1 above
the uBB 32~
state. It is also possible that it lies somewhat lower in energy and is effectively
isoenergetic with the uBB 32~
state. [20]
The C6H4Cl2+ photofragmentation process is now considered. A strong photodissociation
signal into C6H4Cl+ is observed when the laser is tuned to the gu BXBB 22
32 ~~ ← band origin
(19622 cm-1 ≈ 2.4 eV) despite the fact that the energetic threshold for the process has been
determined as 3.32 ± 0.18 eV, [81] around 0.9 eV above the gu BXBB 22
32 ~~ ← band origin.

89
The possibility that the p-DCB+ cations absorb but a single photon and already possess sufficient
internal energy to make up the deficit and take them above the fragmentation threshold
is unlikely given that very sharp vibronic bands are observed in the lower energy part
of the spectrum and because of the absence of vibrational hot bands. The most likely explanation
is that the photofragmentation process involves the absorption of 2 photons from the same 10 ns
laser pulse. Absorption of 2 photons from one laser pulse could occur in a sequential
photo-absorption/internal conversion cycle illustrated in Figure 3-10.
Figure 3-10 Scheme for a two photon dissociation of the p-DCB+ radical cation via the gu BXBB 22
32 ~~ ←
system. Each photon absorption is followed by rapid internal conversion to vibrationally excited levels
of the gBX 22~
state. Absorption of 2 photons is sufficient to exceed the threshold for fragmentation
into C6H4Cl+ + Cl.
Resonant excitation of a gu BXBB 22
32 ~~ ← transition yields, through internal conversion,
highly vibrationally excited gBX 22~
state ions which in turn absorb a second photon of the same
frequency to produce vibrationally energized uBB 32~
state ions which then internally convert
to produce gBX 22~
ions with ≈ 4.8 eV of vibrational energy. The second absorption step

90
would access uBB 32~
state levels with 2.4 eV of vibrational energy where the density
of vibrational states is high. This sequential process seems feasible given that very rapid internal
conversion from the uBB 32~
00 level has been deduced from emission studies (kic ≈ 1011 s-1).
[20] Internal conversion for higher uBB 32~
vibronic levels is likely to be even more rapid.
Based on the coincidence measurements, C6H4Cl2+ ions with Evib = 4.8 eV would dissociate
at rates of 104 - 105 s-1 (i.e. on timescales < 1 ms). [85]
It is interesting to note that the Ar matrix gu BXBB 22
32 ~~ ← absorption spectrum
is dominated by the 000 band and the ν6 progression, with the 60
n intensities dropping
as n increases. While the 000 and 60
n bands also occur in the gas phase photodissociation
spectrum, other transitions that might be expected to have much lower Franck-Condon factors,
such as the 2202 , 170
2 , and 802 bands, also appear with comparable intensities.
Furthermore, the photodissociation spectrum becomes increasingly congested above 21000 cm-1
with sharp peaks protruding from a broad intense background. There are several possible causes
for the intensity differences in the matrix and resonant 2 photon photodissociation spectra.
The most important effect is probably saturation of the first gu BXBB 22
32 ~~ ← absorption step
due to high laser powers so that the intensities of Franck-Condon weak transitions are boosted.
Secondly, as the laser frequency is increased and higher vibronic levels are accessed
in the uBB 32~
manifold in the first absorption step, the second photon absorption step will be
to higher energies in the uBB 32~
manifold where the density of vibrational states is larger
(see Figure 3-10). For this reason it is more likely that a second photon will be absorbed and that
the molecules will dissociate yielding a detectable fragment signal. If this is the case,
the consequence would be that the intensities of the higher frequency gu BXBB 22
32 ~~ ← vibronic
bands would be enhanced relative to the lower ones.

91
The sharp, narrow bands observed for the gu BXBB 22
32 ~~ ← system in the current study
can be contrasted with the broad features observed for the gBXE 22~~ ← system of uncooled
p-DCB+ radical cations in a RF ion trap over the 312 - 327 nm range. [86]
The spectrum obtained by monitoring C6H3+ photofragments showed a single broad feature
(fwhm ≈ 200 cm-1), which corresponds to the XE~~ ← 00
0 transition observed in the Ar matrix,
superimposed on a broad background. The helium buffer gas cooling is presumably responsible
for the far narrower vibronic bands (fwhm ≈ 8 cm-1) observed using our apparatus.
3.3 Two-photon two-colour photofragmentation
spectroscopy.
3.3.1 Polyacetylene cations.
The origin bands observed for the A 2Π – X 2Π electronic transitions of HC4H+ through
HC16H+ are shown in Figure 3-11.
Figure 3-11 Gas phase origin bands observed for the A 2ΠΠΠΠ – X 2ΠΠΠΠ transition of the HC2nH+ species.
and are summarized in Table 12.

92
Table 12 Observed band maxima (nm) for the A 2ΠΠΠΠ – X 2ΠΠΠΠ polyacetylene cation series in the gas phase, the estimated oscillator strengths f0-0 and inferred upper limits for the column densities Nmax in diffuse clouds.
Species Transition λmax, air f0-0 Nmax / 1012 cm-2
HC4H+ A 2Πu – X 2Πg 506.8 0.04a 1
HC6H+ A 2Πg – X 2Πu 600.2 0.06b 0.5
HC8H+ A 2Πu – X 2Πg 706.8 0.08c 0.3
HC10H+ A 2Πg – X 2Πu 815.4 0.10c 0.2
HC12H+ A 2Πu – X 2Πg 924.7 0.12c 0.1
HC14H+ A 2Πg – X 2Πu 1034.6 0.14c
HC16H+ A 2Πu – X 2Πg 1144.0 0.16c
a[87], b[53], cEstimated from trend (see text)
The bands are not rotationally resolved because the rotational constants vary
from 0.15 cm-1 for HC4H+ to less than 0.01 cm-1 for species larger than HC10H
+. The best laser
resolution obtained was 0.3 cm-1. In addition lifetime broadening might occur as a result
of intramolecular processes. A shift in the origin band to the red is observed as the number
of carbon atoms in the chain increases (Figure 3-12). Also of note is that photostability and
oscillator strength have been reported to increase with the number of carbon atoms as well. [38]

93
Figure 3-12 The linear relationship between the number of carbon atoms and the location of the origin band (A 2ΠΠΠΠ – X 2Π)Π)Π)Π) in the gas phase for the polyacetylene cations HC2nH
+.
Simulating the rotational profile of HC6H+ using spectroscopic constants taken
from the literature [38] demonstrated that temperatures as low as 30 K were obtained
(Figure 3-13). [88]

94
Figure 3-13 A simulation of the rotational profile for the A 2ΠΠΠΠg – X 2ΠΠΠΠu transition of HC6H+ demonstrates that
temperatures of 30 K were obtained in the ion trap.
Two spin orbit bands would be expected from a A 2Π – X 2Π transition
for the 2Π3/2 – 2Π3/2 and the 2Π1/2 – 2Π1/2 components. The intensity ratio of their two origin
bands is determined by the temperature and the spin-orbit splitting in the ground state
(A″ ~ -33 cm-1). [89] The separation between the two bands is determined by the difference
in spin orbit constants in the excited and ground states (∆A = A′ - A″ ~ 2 cm-1). In the spectra
presented, however, only the A 2Π3/2 – X 2Π3/2 transitions are observed due to the cold
temperatures obtained through the collisional cooling process.
Previous studies have shown that for HC4H+ approximately 80% of the ions in the v′=0
level of the A 2Πu state fluoresce, with minor channels losing energy through non-radiative
processes. [53] The cited experiment measured fluorescent lifetimes of 71 ns, 17 ns, and <6 ns
for the chain species HC4H+, HC6H
+, and HC8H+, respectively. The quantum yield, however,
was found to decrease as the chain size lengthened, indicating that the non-radiative channel

95
of relaxation becomes more important as the size of the radical increases. Figure 3-14 shows
agreement with such a result; the lifetimes of the excited ions held in the 22-pole ion trap were
probed by delaying the length of time between the excitation and fragmentation laser pulses.
Figure 3-14 Cooling dynamics of HC4H+ and HC6H
+ observed by varying the delay between pump (507 or 600 nm) and probe (210 or 248 nm) lasers while monitoring the intensity of the C4H
+ or C3H+ fragment ions.
Diacetylene cation was found to have an excited lifetime on the order of 75 ns.
Longer chains, on the other hand, demonstrated significantly longer lifetimes (> µs).
As the number of carbon atoms in the polyacetylene cations increases the radiative decay
channel becomes a more minor process.
These results are similar to the findings observed when examining the excited state
lifetimes of the protonated polyacetylenes, HCnH2+ of C2v symmetry, in the same ion trap. [54]

96
For the n=6,8 species it was concluded that an internal conversion process occurred on a sub-ns
time scale; whether the excited ions crossed into a lower lying triplet state or into the ground
state’s highly excited vibrational manifold could not be determined. TD-DFT calculations
indicated that more than a few triplet states were accessible through an intersystem crossing from
the B 1A1 singlet state that was being probed. In the case of the polyacetylene cations the spin
forbidden quartet states, 4Πu and 4Πg, lie higher in energy in the linear geometry than the doublet
states that are accessed in this experiment. [89] Calculations for HC4H+ and HC6H
+, however,
show that the quartet states drop closer toward the vicinity of the doublet states as the molecules
bend. Therefore the quartet states could also play a role in the dynamics observed, similar
to the triplet states for the protonated polyacetylene species. The long lifetimes observed
in the trap may thus be attributed to a population of molecules in either the ground state’s highly
excited vibrational levels or in the close lying quartet states. Excited radicals lose their internal
energy through collisions with the cooled helium buffer gas, resulting in a vibrational
to translational energy transfer which gradually cools the ions. Given the background pressure
of the buffer gas (approximately 4 x 10⁻⁴ mbar) and the size of the cold ion trap, an estimated
1 collision per µs occurs between the excited polyacetylene cation species and the helium gas.
3.3.2 Protonated polyacetylene cations.
The spectra were recorded for the regions where the respective transitions were first
observed in neon matrices after mass selected deposition. [63] 345 nm and 248 nm UV laser
light was chosen as the probe wavelength for HC8H2+ and HC6H2
+ respectively. Loss of both
C3H2 and C3H was monitored as the fragmentation channels for both HC8H2+ and HC6H2
+
cations.
The electronic absorption spectrum of HC8H2+, observed by measuring the fragment ion
C5H+, is shown in Figure 3-15.

97
Figure 3-15 The origin band in the B 1A1 ←←←← X 1A1 electronic transition for HC8H2+ and DC8D2
+ recorded via a two-photon two-colour photofragmentation process by monitoring the C5H
+ or C5D+ fragment ions produced.
The transition appears in the gas phase around 21,400 cm-1; a 14 cm-1 blue shift from
the neon matrix value. [63] This result is consistent with the polyacetylene cation series in which
gas to Ne matrix shifts amounted to no greater than one percent of the transition’s frequency.
[38] The corresponding transition for the deuterated species, DC8D2+, is also shown
in Figure 3-15. The deuterated species has a blue shift (8 cm-1) with respect to HC8H2+
and displays a similar rotational profile. Figure 3-16 shows the same HC8H2+ transition in higher
detail.
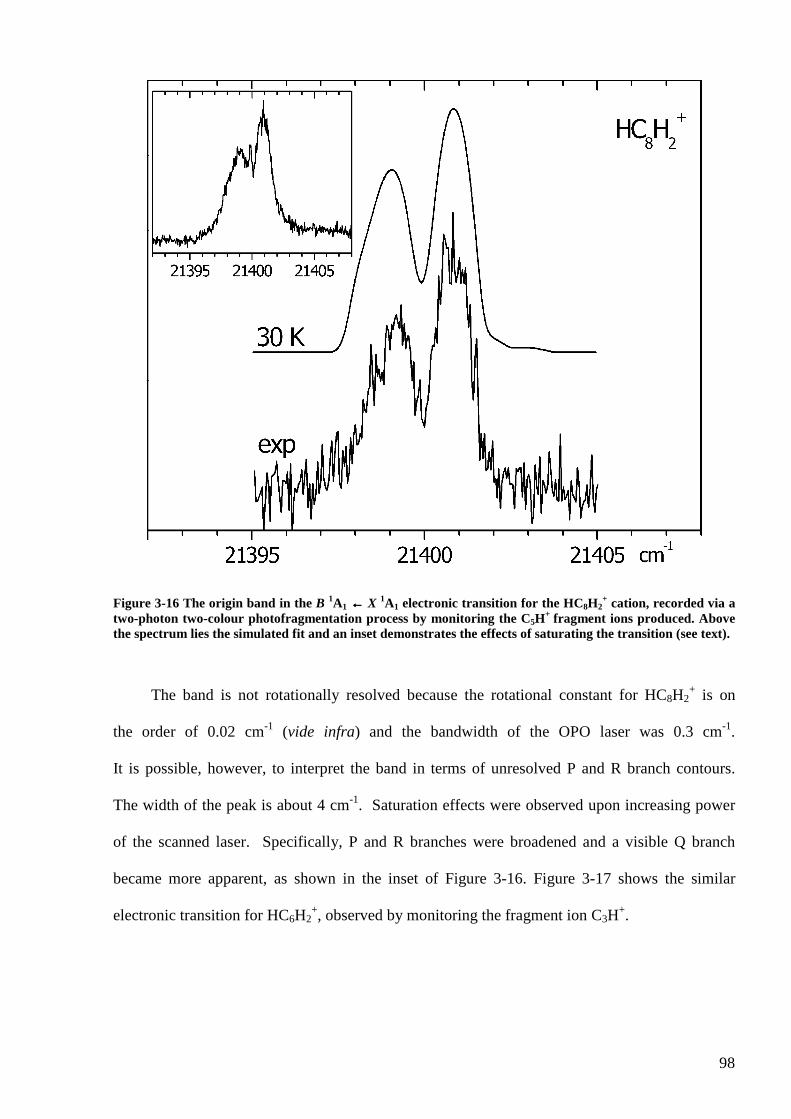
98
Figure 3-16 The origin band in the B 1A1 ←←←← X 1A1 electronic transition for the HC8H2+ cation, recorded via a
two-photon two-colour photofragmentation process by monitoring the C5H+ fragment ions produced. Above
the spectrum lies the simulated fit and an inset demonstrates the effects of saturating the transition (see text).
The band is not rotationally resolved because the rotational constant for HC8H2+ is on
the order of 0.02 cm-1 (vide infra) and the bandwidth of the OPO laser was 0.3 cm-1.
It is possible, however, to interpret the band in terms of unresolved P and R branch contours.
The width of the peak is about 4 cm-1. Saturation effects were observed upon increasing power
of the scanned laser. Specifically, P and R branches were broadened and a visible Q branch
became more apparent, as shown in the inset of Figure 3-16. Figure 3-17 shows the similar
electronic transition for HC6H2+, observed by monitoring the fragment ion C3H
+.

99
Figure 3-17 The origin band in the B 1A1 ←←←← X 1A1 electronic transition for the HC6H2+ cation, recorded via a
two-photon two-colour photofragmentation process by monitoring the C3H+ fragment ions produced. Above
the spectrum lies the simulated fit and an inset demonstrates the effects of saturating the transition (see text).
The transition occurs near 26,404 cm-1 in the gas phase, 10 cm-1 red shifted with respect
to the same transition observed in Ne matrices. The unresolved rotational profile has a width
of 6 cm-1. The rotational constant for HC6H2+ is on the order of 0.04 cm-1 and the laser
resolution obtained without the use of an internal etalon was 0.15 cm-1. An inset in Figure 3-17
demonstrates the effects of increasing the laser power: saturation leads to a broadened profile
and an increase in the relative intensity of the Q-branch.
There are a number of possible structures for the HC2nH2+ species. Previous analysis
from the IR spectra of the mass-selected HCnH2+ (n = 4,6,8) ions in a neon matrix [63] concluded
that the linear protonated form is preferred by the presence of C-H stretches in the CH2 group
and totally symmetric C-C stretches along the carbon skeleton. Calculations can give insight

100
into the geometries of the studied species as well. These have shown that a linear C2v structure
is the most stable isomer for the HC4H2+ species; [60] it can be argued that the interactions of the
π-type orbitals on all four carbon atoms inevitably form the linear carbon backbone.
On this basis one might expect that collisional relaxation of the larger chain species
(HC6H2+ and HC8H2
+) will likely result in linear C2v structures as well. To confirm this
assumption calculations on the ground state of both HC6H2+ and HC8H2
+ have been performed
using the B3LYP functional. [90, 91] A DFT B3LYP/cc-pVTZ level calculation verified
a C2v symmetry for these larger chains and revealed a 1A1 electronic ground state for both
species (Figure 3-18).
Figure 3-18 Calculated structures of the ground state HC6H2+ and HC8H2
+ using the DFT B3LYP/cc-pVTZ level of theory.
Table 13 . Inferred ground (X 1A1) and excited (B 1A1) state rotational constants. (Constant B refers to ½(B + C)).
HC6H2+ HC8H2
+
T0 / cm-1 26,404.0a 21,399.8a
B" / cm-1 0.0433b 0.0187b
B′/ cm-1 0.0426a 0.0186a
B"/ B′ 1.01 1.13 A"/ cm-1 9.585b 9.612b

101
A′/ cm-1 9.8a 9.8a
a Via TSF procedure b From DFT geometry calculated at the B3LYP/cc-PVTZ level
The DFT calculation also yields the ground state rotational constants (Table 14).
Because the electronic transitions in Figures 3-15, 3-16, 3-17 are not rotationally resolved it is
necessary to rely on calculations to obtain information concerning the spectroscopic properties of
the excited states. Thus a TD-DFT calculation, also at the DFT B3LYP/cc-pVTZ level of theory,
was carried out for the three lowest lying electronic transitions (Table 14).
Table 14 Calculated vertical excitation energies (eV) and oscillator strengths.
Species
State
TD-DFT (cc-PVTZ)
f
CIS (cc-pVDZ)
f
Experiment
HC6H2
+ 1A2 1.55 0.00 1.79 0.00 1A1 3.44 0.01 3.91 0.03 3.27 eV 1A2 3.82 0.00 4.13 0.00
HC8H2+ 1A2 1.25 0.00 1.66 0.00
1A1 2.75 0.01 3.36 0.07 2.60 eV 1A2 3.15 0.00 3.57 0.00
This predicts that only a vertical transition to the second excited electronic state is dipole
allowed. Therefore the origin band observed in the spectrum can be assigned as B 1A1 ← X 1A1,
a parallel a-type transition.
While the TD-DFT calculations can determine the symmetry of the excited state, a more
comprehensive calculation can verify if the transition actually populates a bound state.
Both a HF and a CIS calculation on the ground and excited states for both species were
performed using the cc-pVDZ basis set. The results, also shown in Table 14, indeed indicate
convergences to excited state geometries that demonstrate the same symmetries as the TD-DFT

102
calculation. Thus both methods are able to confirm a parallel transition, which is in accord with
the absence of K-structure expected for perpendicular bands in the observed spectrum.
As the rotational structure is unresolved a least squares procedure called “total spectrum
fitting” (TSF) was used to obtain the molecular constants. [92] The spectrum of an asymmetric
top molecule is characterized by the rotational constants A, B, and C in both the ground
and excited states, the transition frequency, temperature, spin statistical weights, a FWHM
of Gaussian line shape, and an amplitude and base line bias. This can yield spectroscopic
constants for the excited upper state. The ground state rotational constants A", B", and C" were
fixed using the results from the DFT calculation at the B3LYP/cc-pVTZ level, the transition
frequency was taken from the experimental spectrum, and the temperature was modeled at 30 K.
The simulations are shown in Figures 3-16, 3-17, and the results of the fitting procedure
are tabulated in Table 13. In general the A′ constants could be varied significantly (± 0.1 cm-1)
and still give reasonable profile fits which qualitatively match the experimental spectra.
This variation also introduced large errors in both the A′ constants and ∆A, as well as in T0.
For both of these species a proper analysis awaits the measurement of a rotationally resolved
spectrum.
From both the calculations and the experiments one can conclude that the ions undergo
a minimal change in geometry during the B 1A1 ← X 1A1 electronic transition from the ground
state to the second excited state: specifically, ∆A changes by no more than 2 % for HC6H2+
and HC8H2+, indicating that the hydrogen atoms occupy a similar geometry and the bond angles
are comparable in the two states. Also, for both ions the ratio of B"/B′ is close to unity, as would
be expected for a long chain in which only a minor change in molecular geometry takes place
during the electronic excitation.
Scanning to the blue of the origin band of HC8H2+ at 467.25 nm revealed the presence
of a vibrational band in the excited state. Located at 457.2 nm, this band matches well with the

103
matrix band observed at 457.5 nm: a 472 cm-1 C-C stretch. Other vibrational bands were not
sought.
In order to understand how the two-photon process proceeds the deactivation
of the protonated species in the bound excited electronic state was studied by varying the time
delay between the scanned and fixed fragmentation lasers. From this time dependence
(Figure 3-19) one can speculate about the dynamics occurring in the ion trap.
Figure 3-19 Cooling dynamics of excited HC8H2+, observed by varying the delay between the 467.30 nm pump
and 248 nm probe lasers while monitoring the intensity of the C5H2+ fragment ions.
A search for the HC8H2+ B 1A1 ← X 1A1 origin band using a laser induced fluorescence
spectrometer revealed no detectable signal, thus demonstrating that there must be a fast
depopulation of the excited state to the ground state on a subnanosecond time scale.
The measured time constant from the decay trace shown in Figure 3-19, however, lies in the µs

104
time regime is thus related to subsequent collisional deactivation: given the background pressure
of the buffer gas (≈ 4 x 10⁻⁴ mbar) and the size of the cold trap, an estimated 1 collision per µs
occurs between the excited protonated polyacetylene species and the helium gas, resulting
in a vibrational to translational energy transfer which gradually cools the hot ions. Figure 3-20
depicts the observed scenario: a conversion process depopulates the B 1A1 excited state faster
than the radiative decay to X 1A1, leading to a long lived excited population
in either the ground state or a triplet manifold.
Figure 3-20 Lack of fluorescence indicates that the excited electronic state B 1A1 obtained using λλλλ1 is short lived (< ns), thus decaying through an intermolecular process. A longer lived state, which exists either as a highly excited vibrational X 1A1 or a triplet manifold (e.g. 3A1), is subsequently depopulated through collisions with the helium buffer gas.
The second UV photon in the experiment then fragments the ions found in either of these
longer lived energy levels. Whether the excited ions cross into a lower lying triplet state
or are internally converted into the ground state’s highly excited vibrational manifold
is not certain.
The DFT theory predicts an electron configuration of (2b2)2(2b1)
2(3b2)2(3b1)
2 for the four
highest occupied molecular orbitals of HC6H2+, leaving the (4b2)
0(4b1)0(5b2)
0(5b1)0 orbitals open
for excitation (HC8H2+, by analogy, should have a similar electron configuration).
For comparison, a previous DFT calculation on HC4H2+ places the lowest lying triplet state

105
approximately 1.4 eV higher in energy than the singlet ground state, with the only difference
in geometry being a slightly lengthened H2C-C bond in the triplet state. [60] However, the lowest
lying triplet state for HC6H2+, as predicted using a simple TD-DFT calculation, is a 3A2 state with
an electron configuration of (2b2)2(2b1)
2(3b2)2(3b1)
1(4b2)1, thus rendering an intersystem crossing
from the excited 1A1 manifold to this triplet state doubly forbidden. According to the TD-DFT
calculations, at least two to three triplet states of 3A1 and 3A2 symmetry lie between B 1A1
and X 1A1 for both HC6H2+ and HC8H2
+ (HC8H2+: 3A2 (0.8 eV), 3A2 (1.8 eV), 3A2 (2.1 eV),
3A1 (2.8 eV), HC6H2+: 3A2 (1.0 eV), 3A2 (2.3 eV), 3A2 (2.6 eV), 3A1 (3.4 eV)). This leaves open
the possibility that one of these triplet states is absorbing the UV photon leading
to fragmentation.
106
Chapter 4 Conclusions.
The apparatus was developed to study the electronic spectra of large organic ions, which
may be of astronomical relevance. In order to obtain and compare the laboratory electronic
absorption spectra with interstellar absorptions, the internal degrees of the ions have
to be cooled to temperatures appropriate to interstellar space, 20 - 100 K. This has been achieved
as the recorded electronic spectra of N2O+ and p-DCB+ demonstrate. In the case of N2O
+,
the rotational temperature achieved is 25 K and for p-DCB+ the narrowness of the vibronic bands
and the absence of hot bands shows that the vibrational degrees of freedom have been cooled
to comparable temperatures. The resulting absorption spectrum of p-DCB+, rich in vibronic
structure, can be assigned to numerous modes in the excited state and their frequencies
are inferred. The photofragment spectrum is a result of absorption of two photons in a process
involving sequential internal conversion.
The analysis of the rotational K-structure resolved on the origin band
of the gu EXEA 22 ~~ ← transition of 2,4-hexadiyne cation, and the absence of sequence
vibrational bands, indicate that the approach developed to study the electronic spectra of larger
polyatomic cations which have been collisionally relaxed to temperatures relevant
to the interstellar medium is successful. In the present case the vibrational and rotational degrees
of freedom are equilibrated to 20-30 K. The system studied here was selected because one
photon transitions were known to lead to fragmentation from the excited electronic state
and the K-structure was resolvable. The richness of the vibronic spectrum is obtained
by saturating the weak transitions and thus may be used to deduce vibrational frequencies
in the excited electronic state in larger, cold ions.
The gas phase A 2Π – X 2Π origin bands of seven different polyacetylene cation chains
have been recorded, with HC12H+, HC14H
+, and HC16H+ presented for the first time.

107
A two-colour two-photon pump-probe experiment was used to dissociate the polyatomic species
in a 22-pole ion trap, which led to efficient cooling of the studied species through collisional
relaxation with cryogenically cooled helium. This allows a comparison of laboratory collected
spectra to astrophysical observations. In this series the data for HC4H+ through HC8H
+ were
previously compared to the diffuse interstellar bands (DIB) literature and revealed no distinct
matches. [5] A consultation of similar references [4, 93-96] also yields no corresponding features
for HC10H+. In the case of HC12H
+, HC14H+, and HC16H
+ the comparison is difficult due
to the fact that there are few detectable DIBs reported longward of 800 nm. A recent study
compiled DIB data up to 963 nm; [93] however no matches corresponding to the origin band
of HC12H+ were found.
An upper limit to the column density for this series can be estimated from
Nmax(cm-2) = 1.13 x 10²⁰Wmax
λ2 f, where f is the oscillator strength of the electronic transition and
Wmax represents the equivalent width. Experimental oscillator strengths have been reported
for HC4H+ and HC6H
+ (Table 1). [53, 87] Extrapolating this trend for longer chains yields
f0-0 = 0.08, f0-0 = 0.10, and f0-0 = 0.12 for HC8H+, HC10H
+, and HC12H+. [5, 97] Using estimated
equivalent widths Wmax = 10 mÅ as the sensitivity limit for DIB detection in the visible region
gives the upper limit column densities shown in Table 12.
The gas phase electronic spectra of two protonated polyacetylene chains have been
reported for the first time. A two-colour two-photon pump-probe experiment was used
to dissociate the polyatomic species in a 22-pole ion trap, which allowed efficient cooling
of the studied species through collisional relaxation with cryogenically cooled helium.
This enables a comparison of laboratory collected spectra to astrophysical observations.
The observed origin band (467.3 nm) in the electronic spectrum of HC8H2+ does not
correspond with any known feature listed in the diffuse interstellar bands (DIB) literature. [95,
96] In the case of HC6H2+, the origin band at 378.7 lies in a region where there are no detectable
DIBs, with the exception of some shallow broad absorptions. [4] An upper limit to the column

108
density of HC8H2+ can be estimated from Nmax(cm-2) = 1.13 x 10²⁰Wmax
λ2 f. Here, a calculated
oscillator strength f (0.03) is taken from the TD-DFT calculation and an equivalent width, Wmax,
of 10 mÅ is assumed as the sensitivity limit for DIB detection in the visible region based
on the weakest detectable features usually observed. [95] As a result an upper limit
for the column density of HC8H2+ in diffuse clouds is on the order of 1012 cm-2.
The absence of rotational structure makes a clear cut assignment of the geometry
difficult. Calculations and spectra from mass selected species trapped in neon matrices show
that the protonated form, HCnH2+ of C2v symmetry, is the structure observed. Through modeling
the band profile in the measured gas phase spectra both upper and lower state spectroscopic
constants were determined. The measurement of rotationally resolved spectra will be able
to confirm these proposed C2v structures.

109
Chapter 5 Outlook.
The experiments have proven that the apparatus, based on a 22-pole trap, is capable
of cooling the vibrational and rotational degrees of freedom of large cations to temperatures
relevant for the ISM. In order to improve performance, further modifications are suggested
and outlined below.
Reorienting the ion source could improve the operation by reducing background pressure.
The position of the current source causes some difficulties: because it creates a relatively high
background pressure in mass the spectrometer’s chamber. In order to prevent sparking in the
quadrupoles the background pressure must be reduced.
The current experimental setup also allows neutrals enter the mass spectrometer, which can
be then ionized or fragmented by UV laser light, resulting in a noticeable background, that can
hide weaker spectral features. Finally, having the main axis of the whole apparatus free
from the ion source will make laser alignment easier. To circumvent all these difficulties
one should install the ion source perpendicular with respect to the main axis of the apparatus
(Figure 5-1)
Figure 5-1 Simplified sketch of the modified apparatus.

110
As can be seen in the figure, ions generated in the source are then bent by 90 degrees
through a magnetic field. The magnetic bender is followed by a hexapole, which guides the ions
into the first quadrupole mass spectrometer. With such a configuration most of the neutrals will
end up in the turbopump of the source chamber, allowing only charged particles to enter the rest
of the apparatus. By filling the hexapole with room temperature helium buffer gas the ion’s
velocities can be equilibrated, resulting in a better mass resolutions.
The second proposed improvement is to install a piezzo-electric valve. Currently helium
buffer gas enters the 22-pole trap by continuous flow. On one hand, this allows one
to measure the cooling rate of an ion’s excited electronic state through collision with
cryogenically cooled helium. However, the presence of helium gas also limits the measurement
of the real lifetime of the exited state. To do this one must eliminate all helium just before
the laser excitation. In order to be able to do this it would be nice to fill the trap with helium for
only a short amount of time.
The piezzo valve can easily generate very short (∼ 10 µs) and intense gas pulses.
This will create a high number of helium atoms in the trap for a short time. At 5 K high
concentration of helium gas will create ion-helium complexes between the large ions and helium
through three body collisions. As a result, absorption of one resonant photon will lead to a rapid
dissociation of these complexes. An absorption spectrum of the large ions can thus be measured
by recording the number of these ionic complexes versus the wavelength of tunable laser
radiation.

111
BIBLIOGRAPHY.
1. Douglas, A.E., Origin of diffuse interstellar lines. Nature, 1977. 269(5624):
p. 130-132.
2. Maier, J.P., Electronic spectroscopy of carbon chains. Journal of Physical
Chemistry A, 1998. 102(20): p. 3462-3469.
3. Fulara, J., Shnitko, I., Batalov, A., Maier J.P., Electronic absorption spectra
of linear and cyclic Cn+ n=7-9 in a neon matrix. Journal of Chemical Physics,
2005. 123(4): p. 044305 1-6.
4. Herbig, G.H., The diffuse interstellar bands. Annual Review of Astronomy
& Astrophysics, 1995. 33: p. 19-73.
5. Motylewski, T., Linnartz, H., Vaizert, O., Maier, J.P., Galazutdinov, G.A.,
Musaev, F.A., Krelowski, J., Walker, G.A.H., Bohlender, D.A., Gas-phase
electronic spectra of carbon-chain radicals compared with diffuse interstellar
band observations. Astrophysical Journal, 2000. 531(1): p. 312-320.
6. Maier, J.P., Walker, G.A.H., Bohlender, D.A., Limits to interstellar C4 and C5
toward ζ ophiuchi. Astrophysical Journal, 2002. 566(1): p. 332-335.
7. Ding, H., Pino, T., Güthe, F., Maier, J.P., Gas phase electronic spectrum of C3H
in the visible. Journal of Chemical Physics, 2001. 115(15): p. 6913-6919.
8. Lucas, R., Liszt, H.S., Comparative chemistry of diffuse clouds. I. C2H and C3H2.
Astronomy & Astrophysics, 2000. 358(3): p. 1069-1076.
9. Maier, J.P., Walker, G.A.H., Bohlender, D.A., On the possible role of carbon
chains as carriers of diffuse interstellar bands. Astrophysical Journal, 2004.
602(1): p. 286-290.

112
10. Maier, J.P., Lakin, N.M., Walker, G.A.H., Bohlender, D.A., Detection of C3
in diffuse interstellar clouds. Astrophysical Journal, 2001. 553(1): p. 267-273.
11. Monninger, G., Förderer, M., Gürtler, P., Kalhofer, S., Petersen, S., Nemes, L.,
Szalay, P.G., Krätschmer, W., Vacuum ultraviolet spectroscopy of the carbon
molecule C3 in matrix isolated state: experiment and theory. Journal of Physical
Chemistry A, 2002. 106(24): p. 5779-5788.
12. Forney, D., Freivogel, P., Grutter, M., Maier, J.P., Electronic absorption spectra
of linear carbon chains in neon matrices. IV. C2n+1 n=2-7. Journal of Chemical
Physics, 1996. 104(13): p. 4954-4960.
13. Boguslavskiy, A.E., Ding, H., Maier, J.P., Gas-phase electronic spectra of C18
and C22 rings. Journal of Chemical Physics, 2005. 123(3): p. 034305 1-7.
14. Dunbar, R.C., Photofragmentation of molecular ions. In Molecular Ions:
Spectroscopy, Structure, and Chemistry, Ed. T.A. Miller And V.E. Bondybey.
1983, North-Holland: Amsterdam. 231.
15. Callomon, J.H., Creutzberg. F., The electronic emission spectrum of ionized
nitrous oxide, N2O+: A 2Σ + → X 2Π. Philosophical Transactions of The Royal
Society of London. Series A, Mathematical and Physical Sciences, 1974.
277(1266): p. 157-189.
16. Klapstein, D., Maier, J.P., Lifetimes of N2O+(A 2Σ +) and COS+ (A 2Π) in selected
vibronic levels. Chemical Physics Letters, 1981. 83(3): p. 590-593.
17. Frey, R., Kakoschke, R., Schlag, E.W., Spectroscopy of molecular ions:
Laser-induced fragmentation spectra of N2O+, A 2Σ + ↔ X 2Π. Chemical Physics
Letters, 1982. 93(3): p. 227-231.
18. Larzillière, M., Jungen, Ch., Fast ion beam laser spectroscopy of N2O+.
Effects of orbital angular momentum and vibrational anharmonicity. Molecular
Physics, 1989. 67(4): p. 807-837.

113
19. Orth, R.G., Dunbar, R.C., Photodissociation of nitrous oxide cation. Journal
of Chemical Physics, 1977. 66(4): p. 1616-1620.
20. Maier, J.P., Marthaler, O., Emission spectra of radical cations
of 1,3-dichlorobenzene, 1,4-dichlorobenzene and 1,3,5-trichlorobenzene
in the gas phase. Chemical Physics, 1978. 32(3): p. 419-427.
21. Friedman, R.S., Kelsall, B.J., Andrews, L., Vibronic absorption spectra
of dichloro- and dibromobenzene cations in solid argon at 20 K. Journal
of Physical Chemistry, 1984. 88(10): p. 1944-1950.
22. Szczepanski, J., Personette, W., Pellow, R., Chandrasekhar, T.M., Roser, D.,
Cory, M., Zerner, M., Vala, M., Vibrational and electronic spectra of matrix-
isolated para-dichlorobenzene radical cations. Journal of Chemical Physics,
1992. 96(1): p. 35-43.
23. Motylewski, T., Linnartz, H., Vaizert, O., Maier, J.P., Galazutdinov, G.A.,
Musaev, F.A., Krelowski, J., Walker, G.A.H., Bohlender, D.A., Gas-phase
electronic spectra of carbon-chain radicals compared with diffuse interstellar
band observations. Astrophysical Journal, 2000. 531(1): p. 312-320.
24. Khoroshev, D., Araki, M., Kolek, P., Birza, P., Chirokolava, A., Maier, J.P.,
Rotationally resolved electronic spectroscopy of a nonlinear carbon chain radical
C6H4+. Journal of Molecular Spectroscopy, 2004. 227(1): p. 81-89.
25. Nolting, D., Marian, C., Weinkauf, R., Protonation effect on the electronic
spectrum of tryptophan in the gas phase. Physical Chemistry Chemical Physics,
2004. 6(10): p. 2633-2640.
26. Duncan, M.A., Infrared spectroscopy to probe structure and dynamics in metal
ion-molecule complexes. International Reviews in Physical Chemistry, 2003.
22(2): p. 407-435.

114
27. Pino, T., Boudin, N., Bréchignac, P., Electronic absorption spectrum of cold
naphthalene cation in the gas phase by photodissociation of its van der Waals
complexes. Journal of Chemical Physics, 1999. 111(16): p. 7337-7347.
28. Dzhonson, A., Gerlich, D., Bieske, E.J., Maier, J.P., Apparatus for the study
of electronic spectra of collisionally cooled cations: para-dichlorobenzene.
Journal of Molecular Structure, 2006. 795(1-3): p. 93-97.
29. Dunbar, R.C., Photodissociation of trapped ions. International Journal of Mass
Spectrometry, 2000. 200(1-3): p. 571-589.
30. Duncan, M.A., Frontiers in the spectroscopy of mass-selected molecular ions.
International Journal of Mass Spectrometry, 2000. 200(1-3): p. 545-569.
31. Rolland, D., Specht, A.A., Blades, M.W., Hepburn, J.W., Resonance enhanced
multiphoton dissociation of polycyclic aromatic hydrocarbons cations in an RF
ion trap. Chemical Physics Letters, 2003. 373(3-4): p. 292-298.
32. Klapstein, D., Leutwyler, S., Maier, J.P., The emission spectrum
of the 2,4-hexadiyne cation in a supersonic free jet. Chemical Physics Letters,
1981. 84(3): p. 534-538.
33. Maier, J.P., Misev, L., Laser induced excitation spectra of the cations
of 1,3-pentadienes, R-(C≡C)-H2+, R = CH3, CD3, (A 2Ε ← X 2Ε) and
of 2,4-hexadienes, R-(C≡C)-R2+, R = CH3, CD3, (A 2Εu ← X 2Εg) in the gaseous
phase. Chemical Physics, 1980. 51(3): p. 311-318.
34. Forster, P., Maier, J.P., Thommen, F., Radiative and non-radiative decay rates
of alkyl substituted diacetylene cations at selected energies within their 2A states
determined via photoelectron-photon coincidence measurements. Chemical
Physics, 1981. 59(1-2): p. 85-90.
35. Dannacher, J., Photoelectron-photoion-coincidence measurements
on 2,4-hexadiyne. Chemical Physics, 1978. 29(3): p. 339-344.

115
36. Freivogel, P., Fulara, J., Lessen, D., Forney, D., Maier, J.P., Absorption spectra
of conjugated hydrocarbon cation chains in neon matrices. Chemical Physics,
1994. 189(2): p. 335-341.
37. Smith, A.M., Agreiter, J., Härtle, M., Engel, C., Bondybey, V.E., Rare gas matrix
studies of absorption and fluorescence of reactive intermediates formed
in discharges through acetylene. Chemical Physics, 1994. 189(2): p. 315-334.
38. Cias, P., Vaizert, O., Denisov, A., Mes, J., Linnartz, H., Maier, J.P., Electronic
gas-phase spectrum of the pentaacetylene cation. Journal of Physical Chemistry
A, 2002. 106(42): p. 9890-9892.
39. Klapstein, D., Kuhn, R., Maier, J.P., Ochsner, M., Zambach, W., Emission and
laser excitation spectra of the A 2Πu ↔ X 2Πg transition of rotationally cooled
triacetylene cation. Journal of Physical Chemistry, 1984. 88(22): p. 5176-5180.
40. Lecoultre, J., Maier, J.P., Rösslein, M., Geometric structure of diacetylene cation
in the X 2Πg and A 2Πu electronic states. Journal of Chemical Physics, 1988.
89(10): p. 6081-6085.
41. Pfluger, D., Motylewski, T., Linnartz, H., Sinclair, W.E., Maier, J.P., Rotationally
resolved A 2Πu ← X 2Πg electronic spectrum of tetraacetylene cation. Chemical
Physics Letters, 2000. 329(1-2): p. 29-35.
42. Pfluger, D., Sinclair, W.E., Linnartz, H., Maier, J.P., Rotationally resolved
electronic absorption spectra of triacetylene cation in a supersonic jet. Chemical
Physics Letters, 1999. 313(1-2): p. 171-178.
43. Sinclair, W.E., Pfluger, D., Linnartz, H., Maier, J.P., Rotationally resolved
A 2Πg ← X 2Πu electronic spectrum of triacetylene cation by frequency
modulation absorption spectroscopy. Journal of Chemical Physics, 1999. 110(1):
P. 296-303.

116
44. Homann, K.-H., Soot formation in premixed hydrocarbon flames. Angewandte
Chemie-International Edition, 1968. 7(6): p. 414-427.
45. McCarthy, M.C, Travers, M.J., Kovàcs, A., Gottlieb, C.A., Thaddeus, P., Eight
new carbon chain molecules. Astrophysical Journal Supplement Series, 1997.
113(1): p. 105-120.
46. Shindo, F., Benilan, Y., Guillemin, J.-C., Chaquin, P., Jolly, A., Raulin, F.,
Ultraviolet and infrared spectrum of C6H2 revisited and vapor pressure curve
in Titan's atmosphere. Planetary and Space Science, 2003. 51(1): P. 9-17.
47. Tielens, A.G.G.M., Snow, T.P., editors, The diffuse interstellar bands;
Laboratory studies of proposed carriers, Dordrecht, Kluwer, 1995, ISBN 0-7923-
3629-1.
48. Kloster-Jensen, E., Haink, H.-J., Christen, H., The electronic spectra
of unsubstituted mono- to pentaacetylene in gas-phase and in solution in range
1100 to 4000 0
Α . Helvetica Chimica Acta, 1974. 57(6): p. 1731-1744.
49. Heath, J.R., Zhang, Q., O'Brien, S.C., Curl, R.F., Kroto, H.W., Smalley, R.E.,
The formation of long carbon chain molecules during laser vaporization
of graphite. Journal of the American Chemical Society, 1987. 109(2): p. 359-363.
50. Stein, S.E., Fahr, A., High-temperature stabilities of hydrocarbons. Journal
of Physical Chemistry, 1985. 89(17): p. 3714-3725.
51. Roberge, W.G., Jones, D., Lepp, S., Dalgarno, A., Interstellar photodissociation
and photoionization rates. Astrophysical Journal Supplement Series, 1991. 77(2):
p. 287-297.
52. Allan, M., Heilbronner, E., Kloster-Jensen, E., Maier, J.P., The Π-states
of tetraacetylene radical cation. Chemical Physics Letters, 1976. 41(2):
p. 228-230.

117
53. Allan, M., Kloster-Jensen, E., Maier, J.P., Emission spectra of radical cations
of diacetylene (A 2Πu → X 2Πg), triacetylene (A 2Πg → X 2Πu) and tetraacetylene
(A 2Π u → X 2Π g, 000 ), and lifetimes of some vibronic levels of the A states.
Chemical Physics, 1976. 17(1): p. 11-18.
54. Dzhonson, A., Jochnowitz, E.B., Kim, E., Maier, J.P., Electronic absorption
spectra of the protonated polyacetylenes HC2nH2+ (n=3, 4) in the gas phase.
Journal of Chemical Physics, 2007. 126(4): p. 044301 1-5.
55. Kloster-Jensen, E., Haink, H.-J., Christen, H., The electronic spectra
of unsubstituted mono- to pentaacetylene in gas-phase and in solution in range
1100 to 4000 0
Α . Helvetica Chimica Acta, 1974. 57(6): p. 1731-1744.
56. Pino, T., Ding, H.B., Güthe, F., Maier, J.P., Electronic spectra of the chains
HC2nH (n=8-13) in the gas phase. Journal of Chemical Physics, 2001. 114(5):
p. 2208-2212.
57. Anand, S., Schlegel, H.B., Dissociation of benzene dication [C6H6]2+: exploring
the potential energy surface. Journal of Physical Chemistry A, 2005. 109(50):
p. 11551-11559.
58. Botschwina, P., Schramm, H., Sebald, P., A theoretical investigation of H2C4H+
and the proton affinity of HC4H. Chemical Physics Letters, 1990. 169(1-2):
p. 121-126.
59. Petrie, S., Knight, J.S., Freeman, C.G., MacLagan, R.G.A.R., McEwan, M.J.,
Sudkeaw, P., The proton affinity and selected ion/molecule reactions
of diacetylene. International Journal of Mass Spectrometry and Ion Processes,
1991. 105(1): p. 43-54.
60. Schröder, D., Loos, J., Schwarz, H., Thissen, R., Roithova, J., Herman, Z., Does
ionized diacetylene have a positive proton affinity? International Journal of Mass
Spectrometry, 2003. 230(2-3): p. 113-121.

118
61. Deakyne, C.A., Meot-Ner (Mautner), M., Buckley, T.J., Metz, R., Proton
affinities of diacetylene, cyanoacetylene, and cyanogen. Journal of Chemical
Physics, 1987. 86(4): p. 2334-2342.
62. Scott, G.B.I., Fairley, D.A., Freeman, C.G., McEwan, M.J., Adams, N.G.,
Babcock, L.M., CmHn+ reactions with H and H2: an experimental study. Journal
of Physical Chemistry A, 1997. 101(27): p. 4973-4978.
63. Batalov, A., Fulara, J., Shnitko, I., Maier, J.P., Electronic absorption spectra
of the protonated polyacetylenes H2CnH+ (n=4, 6, 8) in neon matrixes. Journal
of Physical Chemistry A, 2006. 110(35): p. 10404-10408.
64. Turner, B.E., Herbst, E., Terzieva, R., The physics and chemistry of small
translucent molecular clouds. XIII. The basic hydrocarbon chemistry.
Astrophysical Journal Supplement Series, 2000. 126(2): p. 427-460.
65. Araki, M., Cias, P., Denisov, A., Fulara, J., Maier, J.P., Electronic spectroscopy
of the nonlinear carbon chains C4H4+ and C8H4
+. Canadian Journal of Chemistry,
2004. 82(6): p. 848-853.
66. Birza, P., Motylewski, T. , Khoroshev, D., Chirokolava, A., Linnartz H., Maier,
J.P., CW cavity ring down spectroscopy in a pulsed planar plasma expansion.
Chemical Physics, 2002. 283(1-2): p. 119-124.
67. Dzhonson, A., Maier, J.P., Electronic absorption spectra of cold organic cations:
2,4-hexadiyne. International Journal of Mass Spectrometry, 2006. 255:
p. 139-143.
68. Daly, N.R., Scintillation type mass spectrometer ion detector. Review
of Scientific Instruments, 1960. 31(3): p. 264-267.
69. McLachlan, N.W., Theory and applications of Mathieu functions. 1947,
New York: Oxford University Press.

119
70. Röttgen, M., Judai, K., Antonietti, J.-M., Heiz, U., Rauschenbach, S., Kern, K.,
Conical octopole ion guide: design, focusing, and its application to the deposition
of low energetic clusters. Review of Scientific Instruments, 2006. 77(1):
p. 013302 1-6.
71. Gerlich, D., Ion-neutral collisions in a 22-pole trap at very low energies. Physica
Scripta, 1995. T59: p. 256-263.
72. Parks, J.H., Pollack, S., Hill, W., Cluster experiments in radio frequency Paul
traps: Collisional relaxation and dissociation. Journal of Chemical Physics, 1994.
101(8): p. 6666-6685.
73. Schlemmer, S., Lescop, E., Richthofen, J.V., Gerlich, D., Smith, M.A., Laser
induced reactions in a 22-pole ion trap: C2H2+ + hν3 + H2 → C2H3
+ + H. Journal
of Chemical Physics, 2002. 117(5): p. 2068-2075.
74. Gerlich, D., Inhomogeneous RF fields: a versatile tool for the study of processes
with slow ions. Advances in Chemical Physics, 1992. 82(1): p. 1-176.
75. Jones, R., Gerlich, D., Anderson, S.L., Simple radio-frequency power source
for ion guides and ion traps. Review of Scientific Instruments, 1997. 68(9):
p. 3357-3362.
76. Tan, X. Diatomic: A powerful spectral simulation program for diatomic
molecules. In The Ohio State University 57th International Symposium
on Molecular Spectroscopy. 2002. Columbus.
77. Tan, X., Diatomic: A spectral simulation program for diatomic molecules
on windows platforms, Release 1.28 ed., 2004.
78. Klapstein, D., Kuhn, R., Leutwyler, S., Maier, J.P., Emission spectra
of supersonically cooled dimethyldiacetylene cations. Chemical Physics, 1983.
78(2): p. 167-173.

120
79. Leutwyler, S., Klapstein, D., Maier, J.P., Emission spectra of supersonically
cooled methyldiacetylene cations. Chemical Physics, 1983. 78(2): p. 151-166.
80. Nielsen, C.J., The vibrational spectra of 2,4-hexadiyne (dimethyldiacetylene),
2,4-hexadiyne-d6 and 2,4-hexadiyne-1,1,1-d3. Spectrochimica Acta, Part A:
Molecular and Biomolecular Spectroscopy, 1983. 39A(11): p. 993-1005.
81. Muntean, F., Heumann, L., Armentrout, P.B., Modeling kinetic shifts in threshold
collision-induced dissociation. Case study: Dichlorobenzene cation dissociation.
Journal of Chemical Physics, 2002. 116(13): p. 5593-5602.
82. Green, J.H.S., Vibrational spectra of benzene derivatives - VI: p-Disubstituted
compounds. Spectrochimica Acta Part A: Molecular Spectroscopy, 1970. 26(7):
p. 1503-1513.
83. Rohlfing, E.A., Rohlfing, C.M., Resonant two-photon ionization spectroscopy
of jet-cooled p-dichlorobenzene. Journal of Physical Chemistry, 1989. 93(1):
p. 94-101.
84. Sands, W.D., Moore, R., Fluorescence excitation spectroscopy of jet cooled
p-dichlorobenzene and p-dichlorobenzene-d4. Journal of Physical Chemistry,
1989. 93(1): p. 101-107.
85. Olesik, S., Baer, T., Morrow, J.C., Dissociation rates of energy-selected dichloro-
and dibromobenzene ions. Journal of Physical Chemistry, 1986. 90(16):
p. 3563-3568.
86. Sasaki, T., Mikami, N., Trapped ion photodissociation spectroscopy.
Photodissociation of p-dichlorobenzene cation. Chemical Physics Letters, 1993.
209(4): p. 379-382.
87. Maier, J.P., Thommen, F., Radiative and nonradiative decay rates of state
selected H-(C≡C)2-H+, D-(C≡C)2-D
+, A 2Πu, determined by a photoelectron-

121
photon coincidence technique. Journal of Chemical Physics, 1980. 73(11):
p. 5616-5619.
88. Pgopher, A program for simulating rotational structure.
http://pgopher.chm.bris.ac.uk.
89. Komiha, N., Rosmus, P., Maier, J.P., Low lying quartet states in diacetylene,
triacetylene and benzene radical cations. Molecular Physics, 2006. 104(20-21):
p. 3281-3285.
90. Becke, A.D., Density-functional thermochemistry. III. The role of exact exchange.
Journal of Chemical Physics, 1993. 98(7): p. 5648-5652.
91. Lee, C., Yang, W., Parr, R.G., Development of the Colle-Salvetti correlation-
energy formula into a functional of the electron density. Physical Review B, 1988.
37(2): p. 785-789.
92. Araki, M., Motylewski, T., Kolek, P., Maier, J.P., Electronic absorption spectrum
of a nonlinear carbon chain: trans-C6H4+. Physical Chemistry Chemical Physics,
2005. 7(10): p. 2138-2141.
93. Cox, N.L.J., Kaper, L., Foing, B.H., Ehrenfreund, P., Diffuse interstellar bands
of unprecedented strength in the line of sight towards high-mass X-ray binary 4U
1907+09. Astronomy & Astrophysics, 2005. 438(1): p. 187-199.
94. Galazutdinov, G.A., Musaev, F.A., Krelowski, J., Walker, G.A.H., Narrow
diffuse interstellar bands: a survey with precise wavelengths. The Astronomical
Society of the Pacific, 2000. 112(771): p. 648-690.
95. Jenniskens, P., Desert, F.-X., A survey of diffuse interstellar bands
(3800-8680 0
Α ). Astronomy & Astrophysics Supplement Series, 1994. 106(1):
p. 39-78.

122
96. Tuairisg, S.O., Cami, J., Foing, B.H., Sonnentrucker, P., Ehrenfreund, P., A deep
echelle survey and new analysis of diffuse interstellar bands. Astronomy
& Astrophysics Supplement Series, 2000. 142(2): p. 225-238.
97. Watson, J.K.G., Homologous series of diffuse interstellar bands. Astrophysical
Journal, 1994. 437(2): p. 678-682.

123
Curriculum Vitae Personal Name: Anatoly G. Dzhonson Address: Byfangweg 6,
CH-4051Basel Switzerland
Office Phone: +41612673806 Mobile phone: +41764144267 Private phone: +41335349997 E-mail: [email protected] Home Page: http://www.chemie.unibas.ch/~dzhonson Date of birth: October 28th, 1978 Place of birth: Poronaisk, Sakhalin region, Russia Marital status: Single Children: No Citizenship: Russian Federation Education 2002 - 2007 PhD-student, Research Group of Prof. Dr. J.P. Maier. Department of Chemistry,
University of Basel, Switzerland. PhD completion in February 2007. 2000 - 2002 Novosibirsk State University, Department of Natural Sciences, Novosibirsk,
Russia. Master Diploma in Physical Chemistry, 2002. 1996 - 2000 Novosibirsk State University, Department of Natural Sciences, Novosibirsk,
Russia. Bachelor Diploma in Chemistry, Ecology and Management of Nature, 2000.
1994 - 1996 Specialized Scientific Study Center of Novosibirsk State University, Novosibirsk,
Russia. 1986 - 1994 Primary and Secondary School 2, Poronaisk, Sakhalin region, Russia.
124
List of publications • A.G. Dzhonson, E.B. Jochnowitz, and J.P. Maier “Electronic gas-phase spectra of lager
polyacetylene cations”. Journal of Physical Chemistry, In Press. • A.G. Dzhonson, E.B. Jochnowitz, E. Kim, and J.P. Maier “Electronic absorption spectra of
the protonated polyacetylenes HC2nH2+ (n=3, 4) in the gas phase”. Journal of Chemical
Physics, Volume 126, January 2007, Pages 044301 1-5. • A.G. Dzhonson and J.P. Maier “Electronic absorption spectra of cold organic cations:
2,4-hexadiyne”. International Journal of Mass Spectrometry, Volume 255, October 2006, Pages 139-143.
• A.G. Dzhonson, D. Gerlich, E.J. Bieske and J.P. Maier “Apparatus for the study of
electronic spectra of collisionally cooled cations: para-dichlorobenzene”. Journal of Molecular Structure, Volume 795, Issues 1-3, August 2006, Pages 93-97.
• V.M. Syutkin, B.V. Bol’shakov and A.G. Dzhonson “On the relation between oxygen
diffusion and secondary relaxation in glassy n-butanol” . Chemical Physics, Volume 324, Issues 2-3, May 2006, Pages 307-313.
• A.E. Boguslavskiy, A.G. Dzhonson, and J.P. Maier “The electronic spectra of carbon
chains, rings, and ions of astrophysical interest”. Astrochemistry; From laboratory studies to astronomical observations, Volume 855, December 2005, Pages 201-208.
• B.V. Bolshakov and A.G. Dzhonson “On the number of amorphous phases in n-butanol:
Kinetics of free radicals oxidation by oxygen in frozen n-butanol ” . Journal of Non-Crystalline Solids, Volume 351, Issue 5, March 2005, Pages 444-454.
• B.V. Bolshakov and A.G. Dzhonson “On the number of amorphous phases in n-butanol” .
Doklady Physical Chemistry, Volume 393, Numbers 1-3, November 2003, Pages 318-320(3).
Related Documents


