An analysis of the social and economic effects of Western consumption of Nile perch from Lake Victoria MARTIN VAN DER KNAAP MAXILLION CONSULTANCY www.maxillion.eu On behalf of the Netherlands Environmental Assessment Agency (MNP) APRIL 2006

Welcome message from author
This document is posted to help you gain knowledge. Please leave a comment to let me know what you think about it! Share it to your friends and learn new things together.
Transcript
An analysis of the social and economic effects
of Western consumption of Nile perch from Lake Victoria
MARTIN VAN DER KNAAP MAXILLION CONSULTANCY
www.maxillion.eu
On behalf of the Netherlands Environmental Assessment Agency (MNP)
APRIL 2006
Analysis of Western Consumption of Nile Perch from Lake Victoria Page 2 of 60
2
An analysis of the social and economic effects
of Western consumption of Nile perch from Lake Victoria
MAIN CONCLUSIONS .......................................................................................................... 4 SUMMARY............................................................................................................................... 5 LIST OF ABBREVIATIONS.................................................................................................. 8 LIST OF TABLES ................................................................................................................... 8 LIST OF FIGURES ................................................................................................................. 9 LIST VAN APPENDIXES....................................................................................................... 9 1 INTRODUCTION.......................................................................................................... 10
1.1 Problem definition.................................................................................................. 13 1.2 Sustainability of the Nile perch fishery ................................................................ 13
Box 1 LAKE VICTORIA FISHERIES ORGANIZATION............................................... 14 2 THE FISHERY CHAIN ................................................................................................ 14
2.1 Description of the fishery....................................................................................... 15 2.1.1 Boat owners and fishermen ........................................................................... 16 2.1.2 Other actors in the regional fishery .............................................................. 16 2.1.3 Traders and artisanal fish processors (for the East African consumer) ... 16 2.1.4 Agents .............................................................................................................. 16
2.2 Description of the industrial fish processing industry ........................................ 17 3 NATURAL RESOURCES............................................................................................. 18
3.1 Exploitation of the Nile perch ............................................................................... 18 3.2 Estimates of fish abundance and modelling......................................................... 19 3.3 Other environmental factors ................................................................................. 23 3.4 Rational management ............................................................................................ 24
4 ECONOMIC FACTORS............................................................................................... 25 4.1 Contribution of the Nile perch fishery to the GDP ............................................. 25
4.1.1 Kenya ............................................................................................................... 25 4.1.2 Tanzania ........................................................................................................... 25
4.2 Distribution of the earnings................................................................................... 27 4.3 Import and Export Data ....................................................................................... 30
4.3.1 Kenya ............................................................................................................... 30 4.3.2 Tanzania ........................................................................................................... 30 4.3.3 Uganda ............................................................................................................. 30
4.4 Regional Fish Trade ............................................................................................... 30 4.5 Prices, costs, etc. ..................................................................................................... 31 4.6 Competitive position (source: Globefish, 2005) .................................................... 33 4.7 Vulnerability to external factors ........................................................................... 35
5 SOCIOECONOMIC FACTORS.................................................................................. 36 5.1 Employment ............................................................................................................ 36 5.2 Spending pattern of Nile perch fishermen ........................................................... 36 5.3 Poverty and gender issues...................................................................................... 37 5.4 Access to animal protein ........................................................................................ 39 5.5 Health, education, etc............................................................................................. 41 5.6 Fishery versus agriculture ..................................................................................... 42
6 THE EFFECTS OF THE NILE PERCH PRODUCTION CHAIN.......................... 43 7 CONCLUSIONS AND EVALUATION OF IMPACTS............................................. 44
Analysis of Western Consumption of Nile Perch from Lake Victoria Page 3 of 60
3
8 RECOMMENDATIONS............................................................................................... 47 8.1 Socioeconomic (People).......................................................................................... 47 8.2 Natural resources (Planet)..................................................................................... 47 8.3 Economic (Profit) ................................................................................................... 47
9 REFERENCES AND FURTHER READING............................................................. 47 Appendix 1 Nile perch chain in East Africa ................................................................... 1 APPENDIX 2 Results of frame surveys in 2000, 2002 and 2004 ................................ 51 APPENDIX 3 Fishery management measures for Lake Victoria .............................. 55
4.1 Kenya ................................................................................................................... 58 4.2 Tanzania ............................................................................................................... 58 4.3 Uganda ................................................................................................................. 59
Analysis of Western Consumption of Nile Perch from Lake Victoria Page 4 of 60
4
An analysis of the social and economic effects of Western consumption of Nile perch
from Lake Victoria MAIN CONCLUSIONS The European Union is an important market for Nile perch fillets originating from Lake Victoria. The magnitude of the annual export from the countries bordering on Lake Victoria (Kenya, Tanzania and Uganda) comprises about 45,000 tonnes of Nile perch worth approximately € 170 million (2003). A significant percentage of the Nile perch import into Europe takes place via the Netherlands. Direct effects are generally positive Based on the available data about the developments in the fishery, fish processing, employment, income and local food availability (fish), the direct social and economic effects of Nile perch consumption in the West can be viewed as generally positive. Important conditions that have contributed to the positive developments are the following: - Kenya, Tanzania and Uganda have instituted a joint ban on industrial trawl fishing. As a
result, the growth in the fishery sector entirely benefits the capital-extensive, but also labour-intensive, local fishery sector.
- Fish processing has remained in the hands of mainly local fish processing companies; this means that the employment and the added value provided by fish processing benefits these countries.
- Besides Nile perch, there is a sufficient supply of other fish (dagaa and Tilapia) as a source of protein for the African population. Despite the fact that almost the entire Nile perch catch is exported as fillets, this has not created any local problems with the availability of fish as food.
Points of concern: living conditions and continuity in the longer term Besides the positive effects, there are also important concerns, both social and economic: - The rapid growth in the number of fishermen has led to the establishment of fishing
villages on islands and locations along the shores of the lake that do not have any facilities such as schools, water provision or health care.
- Due to the lack of reliable savings and banking facilities, the money earned in the fishery is often spent on drinking and prostitution; as a result, the increased income has not led automatically to an improvement in the living conditions. Prostitution has led to a high level of infection with HIV/AIDS.
- The Lake Victoria fishery is an “open access” fishery. This is a positive aspect in term of fairness and equality (anyone can join in), but the rapid and continuing growth in the number of fishermen has led unavoidably to extensive overfishing and is threatening the continuity of the fish export chain. Education and trustworthy savings and credit facilities are crucial if alternative employment is to be possible, especially for the children of the fishermen, artisanal processors and fish workers..
- Continuing the joint fishery policy and lake-wide management (also concerning the issue of excessive nutrients in the lake and water use) for the three countries remains an important condition for maintaining – and where necessary restoring – the quality of the lake and the fishery.
There appear to be good starting points for foreign donors to promote the regional development of institutional, economic and social infrastructure (healthcare, education,
Analysis of Western Consumption of Nile Perch from Lake Victoria Page 5 of 60
5
financial facilities, water provision, etc.) and to continue to support the joint fishery policy and where possible to expand it to include integrated catchment management (nutrients, pollutants, land and water use). SUMMARY Sustainability and consumption In a globalizing world, there is increasing interconnection and mutual dependence between continents and countries; among other things, this is caused by trade and tourism. For the Netherlands, the relationship with other countries is an important element in the concept of sustainable development (RIVM-MNP, 2004). In accordance with the concept of the “ecological footprint”, the Netherlands Environmental Assessment Agency (MNP) has developed a method to study the effects of consumption on global biodiversity. In this context, consumption comprises not only products (such as wood, soy beans, meat, fish, and coffee) but also services (tourism). In order to acquire a balanced picture of the effects of Western consumption in the framework of sustainability, the social and economic effects must be studied as well as the ecological effects. The present study aims to contribute to acquiring a picture of the social and economic effects of the Western consumption of Nile perch from Lake Victoria (East Africa). At the present time, very little structural monitoring is taking place in the three countries (Kenya, Tanzania, Uganda). The present study is therefore based partly on quantitative data, partly on qualitative data and partly on the observations of the author. Increasing exports, employment and earnings With the aim of studying the changes in the Nile perch fishery, the total Nile perch catch on Lake Victoria was related to the time period when the rapid development in the fishery sector began (1985); after this, production has increased steadily. This must be seen in the light of the changes in the size of the fishing fleet. From 1990 to 2002, the fleet grew by a factor of 2.5 (an increase of 265%) to a total of 51,712 boats. The increase from 1998 to 2004 was 46%. An important aspect of this increase in the local fishery is the fact that the three countries surrounding Lake Victoria (Kenya, Tanzania and Uganda) have made a joint decision to ban industrial trawl fishing on the lake. In recent years, the fishing effort has increased enormously (not only concerning the number of boats, but also the number of fishermen, gillnets and other fishing gear) with virtually no increase in total Nile perch production. The average catch per boat therefore decreased. In addition, hydro-acoustic expeditions have indicated that the Nile perch index is declining, while room is being made for fish species with a lower economic value. The export of Nile perch fillets to the EU has increased strongly (80%) from 1997 to 2003, despite the import stop in 1999/2000. The same applies to the import of fillets by the Netherlands, while Dutch exports of freshwater fish products also increased, with a peak in 2001. It is assumed that Nile perch products comprise the majority of these exports. Economic parameters are scarce, although the contribution of the Nile perch fishery to the GDP of Tanzania from 1993 to 1998 increased by 300%. The fish prices that are paid to the fishermen, expressed in local currency, have also increased sharply. In Kenya, the price increased by 140% between 1997 and 2003. The average income of a Ugandan crew member increased by 69% during the period 2000-2003. The total value of exports of Nile perch products to the EU reached a maximum of more than € 192,000,000 in 2002. After this,
Analysis of Western Consumption of Nile Perch from Lake Victoria Page 6 of 60
6
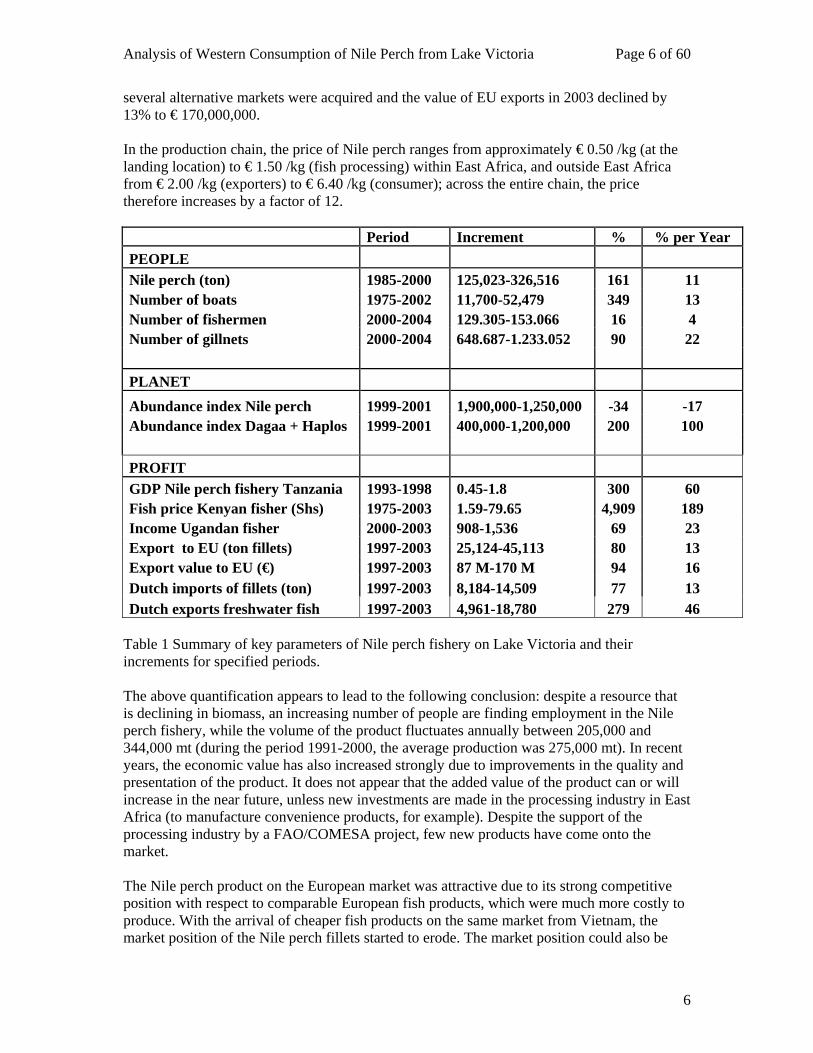
several alternative markets were acquired and the value of EU exports in 2003 declined by 13% to € 170,000,000. In the production chain, the price of Nile perch ranges from approximately € 0.50 /kg (at the landing location) to € 1.50 /kg (fish processing) within East Africa, and outside East Africa from € 2.00 /kg (exporters) to € 6.40 /kg (consumer); across the entire chain, the price therefore increases by a factor of 12. Period Increment % % per Year PEOPLE Nile perch (ton) 1985-2000 125,023-326,516 161 11 Number of boats 1975-2002 11,700-52,479 349 13 Number of fishermen 2000-2004 129.305-153.066 16 4 Number of gillnets 2000-2004 648.687-1.233.052 90 22 PLANET
Abundance index Nile perch 1999-2001 1,900,000-1,250,000 -34 -17 Abundance index Dagaa + Haplos 1999-2001 400,000-1,200,000 200 100 PROFIT GDP Nile perch fishery Tanzania 1993-1998 0.45-1.8 300 60 Fish price Kenyan fisher (Shs) 1975-2003 1.59-79.65 4,909 189 Income Ugandan fisher 2000-2003 908-1,536 69 23 Export to EU (ton fillets) 1997-2003 25,124-45,113 80 13 Export value to EU (€) 1997-2003 87 M-170 M 94 16 Dutch imports of fillets (ton) 1997-2003 8,184-14,509 77 13 Dutch exports freshwater fish 1997-2003 4,961-18,780 279 46
Table 1 Summary of key parameters of Nile perch fishery on Lake Victoria and their increments for specified periods. The above quantification appears to lead to the following conclusion: despite a resource that is declining in biomass, an increasing number of people are finding employment in the Nile perch fishery, while the volume of the product fluctuates annually between 205,000 and 344,000 mt (during the period 1991-2000, the average production was 275,000 mt). In recent years, the economic value has also increased strongly due to improvements in the quality and presentation of the product. It does not appear that the added value of the product can or will increase in the near future, unless new investments are made in the processing industry in East Africa (to manufacture convenience products, for example). Despite the support of the processing industry by a FAO/COMESA project, few new products have come onto the market. The Nile perch product on the European market was attractive due to its strong competitive position with respect to comparable European fish products, which were much more costly to produce. With the arrival of cheaper fish products on the same market from Vietnam, the market position of the Nile perch fillets started to erode. The market position could also be
Analysis of Western Consumption of Nile Perch from Lake Victoria Page 7 of 60
7
affected if Nile perch could be cultured outside East Africa and could still be marketed as the Nile perch product originating from East Africa. Increasing income does not automatically lead to improved living conditions Fish prices that are paid by the buyers to the fishermen have risen with the success of the Nile perch fishery; between 1997 and 2003 the fish price in local currency doubled. However, most of the fishermen live in fishing villages on islands and locations along the lakeshore with few facilities for education and healthcare. There are very few shops that carry a variety of sustainable consumption goods. Combined with the absence of a savings culture and possibilities for saving money, the fishermen spend their earnings in the shortest possible time on a market that is the result of the large sums of cash that circulate in the fishing communities. Much of the cash circulates via drinking and prostitution, which has also led to a high level of infection with HIV/AIDS. Despite the relatively high incomes, this spending pattern has led to dominant poverty in most of the fishing communities, and the possibilities for actually improving the living conditions remain limited. The lack of reasonable education possibilities for young people in the fishing villages prevents this poverty cycle from being broken, and the sons and daughters of the fishermen also end up in the fishing life. The Nile perch fishery has the potential to remove fishermen from the downward poverty spiral, but due to the relatively low investments required and the high earnings, the fishing effort will probably continue to increase until the open access system is converted into a more regulated system with a well-conceived licence structure. Continuity of fishery chain under pressure due to open access The fishery on Lake Victoria has open access. In terms of equality and fairness, this is a positive aspect (anyone can join in), but the rapid and continuing growth of the number of fishermen will lead unavoidably to serious over-fishing and will threaten the continuity of the fishery and export chain. The three producing countries are attempting to implement control measures by introducing a fishery management formula using BMUs (Beach Management Units). These units have the potential of organizing themselves into marketing associations and in this way achieving a stronger negotiating position with respect to the middlemen and agents. This process is just beginning and, partly due to a NOVIB project, the first 13 BMUs in Uganda have been established in cooperation the UFFCA (the Uganda Fisheries and Fish Conservation Association). In 2005, the EU-financed Fisheries Management Plan Implementation Project established more than 200 additional BMUs. However, there is still a long way to go before the approximately 1800 BMUs around Lake Victoria become active. In addition to regulating the access to the fishery, it is very important that educational facilities become available, along with reliable savings and credit facilities; this will offer the children of fishermen opportunities and alternatives to the Nile perch fishery.
Analysis of Western Consumption of Nile Perch from Lake Victoria Page 8 of 60
8
LIST OF ABBREVIATIONS BMU Beach Management Unit CIF Charge in freight CIFA Committee for Inland Fisheries for Africa COMESA Commodities East and Southern Africa CPUE Catch per Unit of Effort DRC Democratic Republic of the Congo EU European Union EPZA Export Processing Zones Authority, Kenya FAO Food and Agriculture Organization FOB Free on board FOR Free on rail FOT Free on truck GIS Geographic Information System HDI Human Development Index HIV/AIDS Auto Immune Deficiency Syndrome K. Shs Kenya Shillings Kg kilogram LNV Ministry of Agriculture, Nature and Food Quality LVFO Lake Victoria Fisheries Organization LVFRP Lake Victoria Fisheries Research Project MCS Monitoring, Control and Surveillance MSY Maximum Sustainable Yield mt Metric ton Tz. Shs. Tanzania Shillings UFFCA Uganda Fisheries and Fish Conservation Association Ug. Shs Uganda Shillings UNDP United Nations Development Programme US$ US dollar € Euro LIST OF TABLES Table 1 Summary of key parameters of Nile perch fishery on Lake Victoria and their
increments for specified periods. Table 2 Sustainable development considers the effect of choices “Here and now” on
“Elsewhere” and “Later”, balancing the social, economic and ecological aspects.
Table 3 Results of frame surveys by country (number of fishing boats). Table 4 Biomass (mt) estimates for Nile perch by bottom trawl Table 5 Biomass estimates (mt) for Nile perch and dagaa on Lake Victoria Table 6 Catch (mt), MSY and data on processing industry (mt) for Nile perch Table 7 Summary of various MSY estimates Table 8 Regional BNP figures (in millions of Tz Shs) and per capita GDP (Tz Shs) for
four regions in Tanzania Table 9 Number of stakeholders in the Nile perch production chain in Uganda Table 10 Average annual income per boat owner (per boat) and crew member in Uganda Table 11 Comparison of prices and costs (Ug. Shs.) per kg Nile perch (fresh weight) Table 12 Average prices to fishermen in Lake Victoria - Kenya waters, by major species,
1975–1988 (KSh/kg)
Analysis of Western Consumption of Nile Perch from Lake Victoria Page 9 of 60
9
Table 13 Percentage of interviewed persons who had consumed animal protein and fish 24 hours prior to interview
Table 14 Percentage malnutrition of children by country and location relative to lake (number of observations)
Table 15 Changes in various key parameters related to the Nile perch fishery in the periods for which data are available.
LIST OF FIGURES Figure 1 Map of Lake Victoria Figure 2 Nile perch catches in Lake Victoria 1975-2000 Figure 3 Abundance index of Nile perch in Lake Victoria Figure 4 Abundance index of dagaa and pelagic Haplochromis species in Lake Victoria Figure 5 Relative density of Nile perch in Lake Victoria Figure 6 Trend in observed and predicted Catch per Unit Effort (CPUE) 1975-2000.
Prediction based on BIODYN model Figure 7 Changes in numbers and mesh sizes of gillnets in Ugandan waters between
1990 and 2000 illustrating the increase in fishing effort over time and the change of fishing gear
Figure 8 Contribution of all fisheries to GDP of Tanzania 1985-2003 Figure 9 Contribution of the Nile perch to the fishery and GDP of Tanzania Figure 10 Sectoral contributions to Gross Domestic Product of Tanzania in 2002 Figure 11 Distribution of profits in the Nile perch fishery and processing chain in Uganda Figure 12 Evolution of prices for Nile perch (Kenyan shillings/kg) paid at the landing
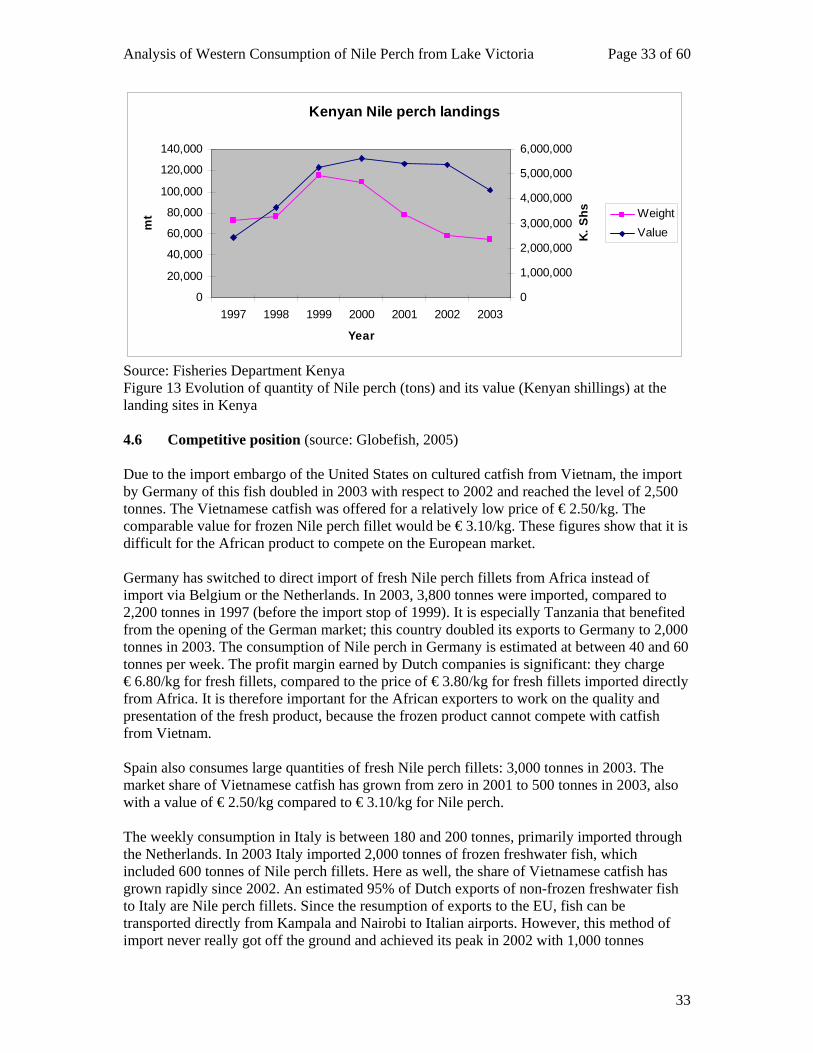
sites in Kenya 1997-2003 Figure 13 Evolution of quantity of Nile perch (tons) and its value (Kenyan shillings) at
the landing sites in Kenya Figure 14 Prices of Nile perch (€/kg whole fish) in the production/consumption chain Figure 15 Evolution of HDI in Kenya, Uganda and Tanzania Figure 4.1 Origin of Nile perch (mt) imported into Europe Figure 4.2 Origin of Nile perch (€) imported into Europe Figure 4.3 Trends of Nile perch import in EU countries Figure 4.4 Destination of freshwater fish exported form the Netherlands Figure 4.5 Destination of Nile perch products exported from Kenya Figure 4.6 Export of Tanzanian Nile perch products (mt) Figure 4.7 Export values of Tanzanian Nile perch (million US$) Figure 4.8 Export value (US$) of Ugandan Nile perch products LIST VAN APPENDIXES Annex 1 Nile perch chain in East Africa Annex 2 Results of frame surveys in 2000 and 2002 Annex 3 Fishery management measures on Lake Victoria Annex 4 Nile perch import and export data
Analysis of Western Consumption of Nile Perch from Lake Victoria Page 10 of 60
10
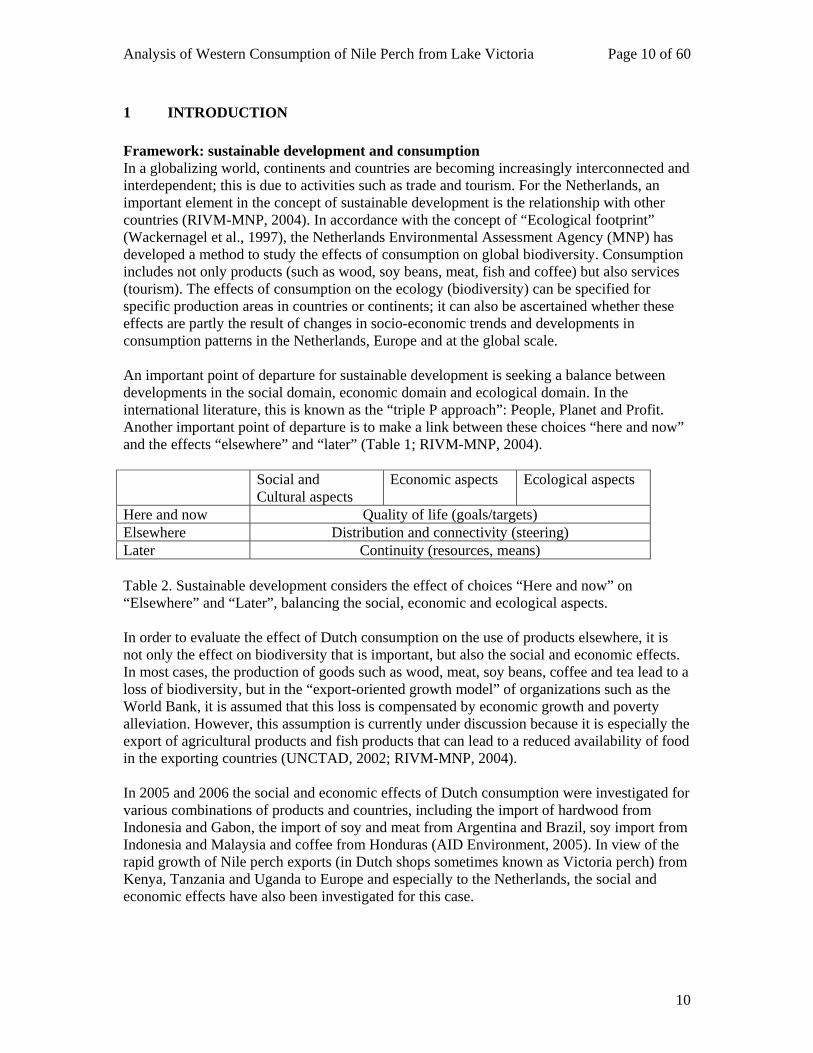
1 INTRODUCTION Framework: sustainable development and consumption In a globalizing world, continents and countries are becoming increasingly interconnected and interdependent; this is due to activities such as trade and tourism. For the Netherlands, an important element in the concept of sustainable development is the relationship with other countries (RIVM-MNP, 2004). In accordance with the concept of “Ecological footprint” (Wackernagel et al., 1997), the Netherlands Environmental Assessment Agency (MNP) has developed a method to study the effects of consumption on global biodiversity. Consumption includes not only products (such as wood, soy beans, meat, fish and coffee) but also services (tourism). The effects of consumption on the ecology (biodiversity) can be specified for specific production areas in countries or continents; it can also be ascertained whether these effects are partly the result of changes in socio-economic trends and developments in consumption patterns in the Netherlands, Europe and at the global scale. An important point of departure for sustainable development is seeking a balance between developments in the social domain, economic domain and ecological domain. In the international literature, this is known as the “triple P approach”: People, Planet and Profit. Another important point of departure is to make a link between these choices “here and now” and the effects “elsewhere” and “later” (Table 1; RIVM-MNP, 2004). Social and
Cultural aspects Economic aspects Ecological aspects
Here and now Quality of life (goals/targets) Elsewhere Distribution and connectivity (steering) Later Continuity (resources, means) Table 2. Sustainable development considers the effect of choices “Here and now” on “Elsewhere” and “Later”, balancing the social, economic and ecological aspects. In order to evaluate the effect of Dutch consumption on the use of products elsewhere, it is not only the effect on biodiversity that is important, but also the social and economic effects. In most cases, the production of goods such as wood, meat, soy beans, coffee and tea lead to a loss of biodiversity, but in the “export-oriented growth model” of organizations such as the World Bank, it is assumed that this loss is compensated by economic growth and poverty alleviation. However, this assumption is currently under discussion because it is especially the export of agricultural products and fish products that can lead to a reduced availability of food in the exporting countries (UNCTAD, 2002; RIVM-MNP, 2004). In 2005 and 2006 the social and economic effects of Dutch consumption were investigated for various combinations of products and countries, including the import of hardwood from Indonesia and Gabon, the import of soy and meat from Argentina and Brazil, soy import from Indonesia and Malaysia and coffee from Honduras (AID Environment, 2005). In view of the rapid growth of Nile perch exports (in Dutch shops sometimes known as Victoria perch) from Kenya, Tanzania and Uganda to Europe and especially to the Netherlands, the social and economic effects have also been investigated for this case.
Analysis of Western Consumption of Nile Perch from Lake Victoria Page 11 of 60
11
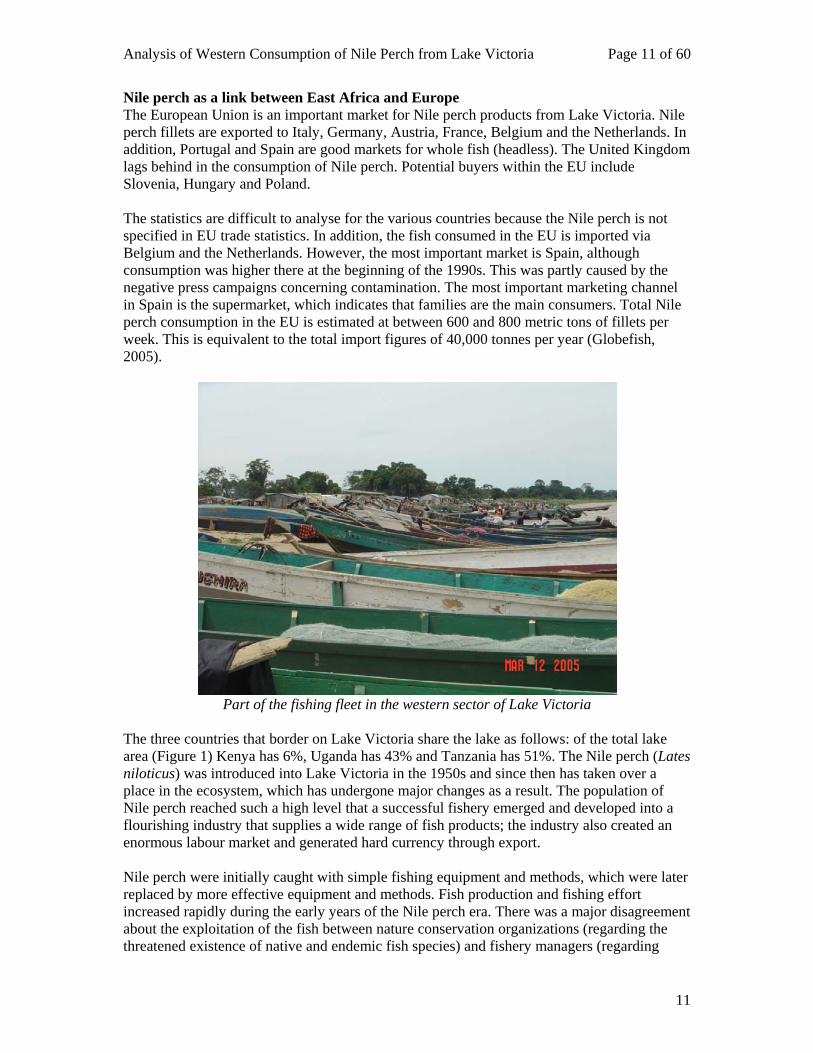
Nile perch as a link between East Africa and Europe The European Union is an important market for Nile perch products from Lake Victoria. Nile perch fillets are exported to Italy, Germany, Austria, France, Belgium and the Netherlands. In addition, Portugal and Spain are good markets for whole fish (headless). The United Kingdom lags behind in the consumption of Nile perch. Potential buyers within the EU include Slovenia, Hungary and Poland. The statistics are difficult to analyse for the various countries because the Nile perch is not specified in EU trade statistics. In addition, the fish consumed in the EU is imported via Belgium and the Netherlands. However, the most important market is Spain, although consumption was higher there at the beginning of the 1990s. This was partly caused by the negative press campaigns concerning contamination. The most important marketing channel in Spain is the supermarket, which indicates that families are the main consumers. Total Nile perch consumption in the EU is estimated at between 600 and 800 metric tons of fillets per week. This is equivalent to the total import figures of 40,000 tonnes per year (Globefish, 2005).
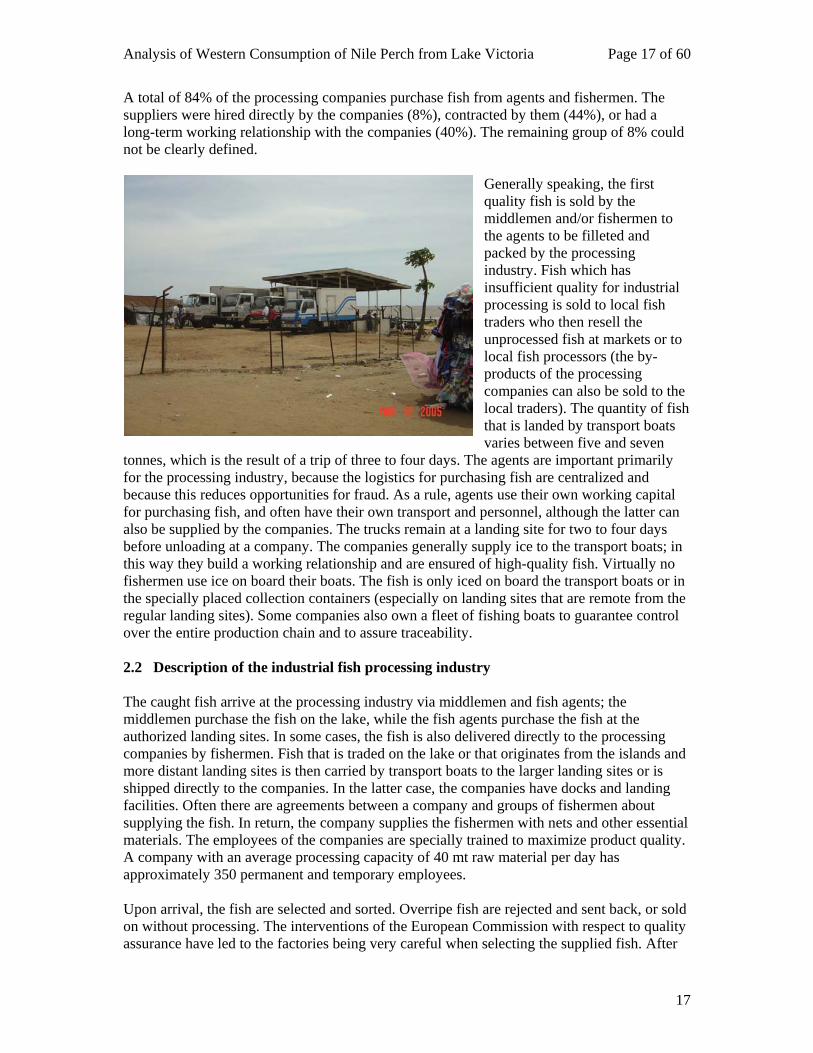
Part of the fishing fleet in the western sector of Lake Victoria
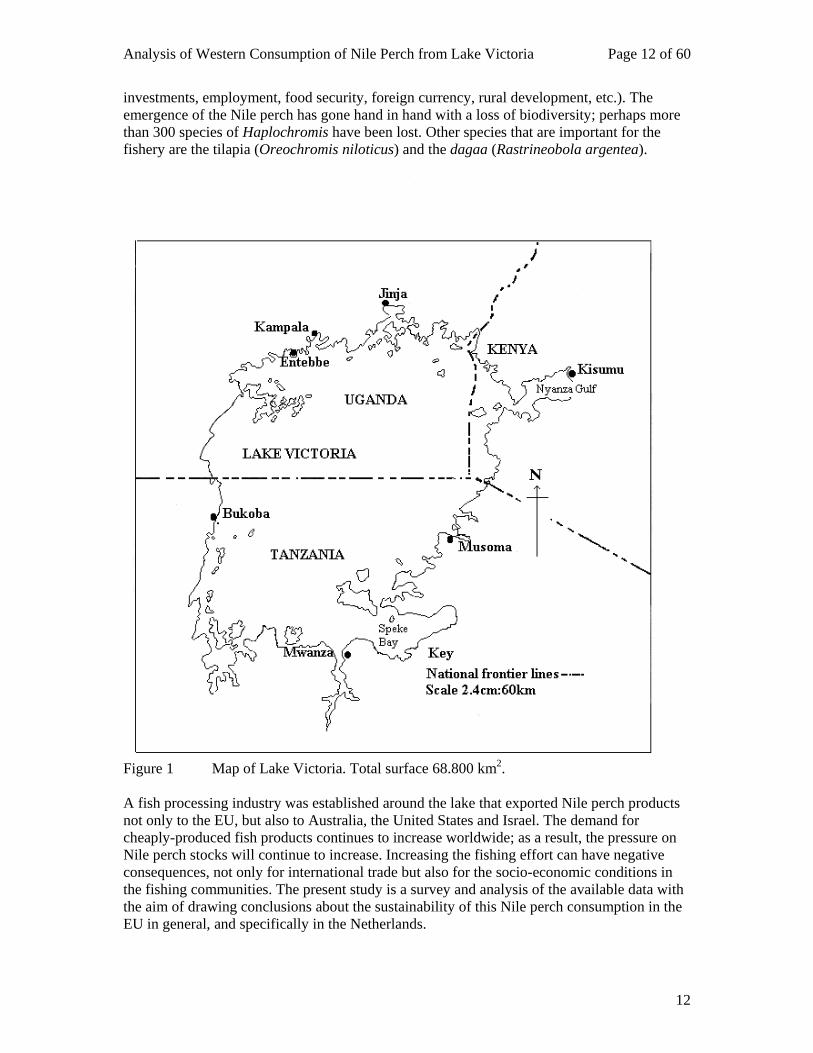
The three countries that border on Lake Victoria share the lake as follows: of the total lake area (Figure 1) Kenya has 6%, Uganda has 43% and Tanzania has 51%. The Nile perch (Lates niloticus) was introduced into Lake Victoria in the 1950s and since then has taken over a place in the ecosystem, which has undergone major changes as a result. The population of Nile perch reached such a high level that a successful fishery emerged and developed into a flourishing industry that supplies a wide range of fish products; the industry also created an enormous labour market and generated hard currency through export. Nile perch were initially caught with simple fishing equipment and methods, which were later replaced by more effective equipment and methods. Fish production and fishing effort increased rapidly during the early years of the Nile perch era. There was a major disagreement about the exploitation of the fish between nature conservation organizations (regarding the threatened existence of native and endemic fish species) and fishery managers (regarding
Analysis of Western Consumption of Nile Perch from Lake Victoria Page 12 of 60
12
investments, employment, food security, foreign currency, rural development, etc.). The emergence of the Nile perch has gone hand in hand with a loss of biodiversity; perhaps more than 300 species of Haplochromis have been lost. Other species that are important for the fishery are the tilapia (Oreochromis niloticus) and the dagaa (Rastrineobola argentea).
Figure 1 Map of Lake Victoria. Total surface 68.800 km2. A fish processing industry was established around the lake that exported Nile perch products not only to the EU, but also to Australia, the United States and Israel. The demand for cheaply-produced fish products continues to increase worldwide; as a result, the pressure on Nile perch stocks will continue to increase. Increasing the fishing effort can have negative consequences, not only for international trade but also for the socio-economic conditions in the fishing communities. The present study is a survey and analysis of the available data with the aim of drawing conclusions about the sustainability of this Nile perch consumption in the EU in general, and specifically in the Netherlands.
Analysis of Western Consumption of Nile Perch from Lake Victoria Page 13 of 60
13
1.1 Problem definition
What are the social and economic consequences for the population around Lake Victoria of the consumption of Nile perch in the Western countries, especially in Europe and the Netherlands? 1.2 Sustainability of the Nile perch fishery
According to Hannesson (1999) there are no long-term relationships in the fishery between international trade and economic development, since increasing trade also increases the demand for scarce fish, and the over-exploitation of the fishery resources continues. As a result, catches can decrease over the long term, along with the economic benefit of international trade. In the international fish trade, benefits can be generated if a fish-exporting country is able to deal with the problems of unlimited access to the resources. If a fishery is not well managed, the marketing possibilities in other countries will not be sustainable and international trade can ultimately lead to loss instead of profit. The Netherlands Ministry of Agriculture, Nature and Food Quality (LNV) has established guidelines for sustainable fisheries. Although these guidelines concern the situation in the Netherlands, they could also be applied to the situation on Lake Victoria, where a regional organization could be established to assist in the following areas:
• to prevent the carrying capacity of the fish environment from being exceeded and prevent a permanent erosion of environmental quality;
• to keep the fish stocks in Lake Victoria at a suitable level; • to ensure consumer access to good quality fish; • to provide sufficient attention to the socio-economic side of the fishery; • to ensure that other social values, such as environmental quality, animal welfare and
fair trade (with developing countries) are satisfied.
This is an obvious task for the Lake Victoria Fisheries Organization (see Box 1). The interplay between LVFO and the fishery chain should lead to achieving a balance between the three elements of People, Planet and Profit (the criteria used by the UNDP). This means a situation where the fishery:
• continues to be accepted by society; • does not cause any negative effects on the fish environment; • is clear and transparent about its production methods (product safety, traceability and
market orientation); • deals carefully with natural resources, avoiding their depletion to benefit future
generations • operates not only independently and profitably, but also can be acknowledged as
valuable in a socioeconomic and cultural sense. Ideally, the main aims of the three governments surrounding Lake Victoria and/or of the LVFO should comprise the following:
• A profitable Nile perch fishery (Profit) • An ecologically-responsible Nile perch fishery (Planet)
Analysis of Western Consumption of Nile Perch from Lake Victoria Page 14 of 60
14
• A socially-accepted Nile perch fishery (People) The complicating factor in the above is the bipartite nature of the fishery chain. On the one side, there is the profitable export of Nile perch products, while other artisanal products and by-products remain behind in the region for domestic and regional consumption. The characteristics of these remaining products could prevent international social acceptance (the appearance of specific products can cause aversion, such as the deep-fried Nile perch carcasses). The LVFO devotes itself to the development and implementation of fishery management measures. Since these measures have not yet been entirely implemented, one can also assume that the ecological conditions for the management of the Nile perch fishery have not yet been entirely satisfied.
Box 1 LAKE VICTORIA FISHERIES ORGANIZATION The LVFO is the result of the efforts of the Sub-Committee for Lake Victoria of the Committee for Inland Fisheries for Africa (CIFA) of the FAO. The Sub-Committee was converted into the regional fisheries organization LVFO in 1994. The main office of the LVFO is in Jinja, Uganda, and its Executive Committee comprises the directors of fishery and fishery research from the three participating countries. This group reports to the Policy and Steering Committee, which in turn is responsible to the Ministerial Council for Fishery Management on the lake. The aims of the LVFO are as follows: 1 Promote cooperation between the three countries on Lake Victoria in matters
concerning the lake. 2 Harmonize national measures for the sustainable use of the natural resources of the
lake. 3 Develop and monitor conservation and management measures to assure a healthy
ecosystem and sustainable use of the resources, to benefit present and future generations.
2 THE FISHERY CHAIN The Nile perch fishery chain comprises a number of components of which a few are located in East Africa and the rest are located elsewhere. From the catch to the final product for export, the activities take place in Africa. After this, the product is transported and traded outside the African continent. But there are also final products that are marketed domestically and in neighbouring countries. In general terms, the export chain can be described as follows: fish catch, fish trade, processing and packaging, intermediary trade, export, distribution and marketing, and consumption. The various components are presented in Appendix 1, where a distinction is made between the activities that take place within East Africa, where Africans (including Africans of Asian origin) play an important role, and outside Africa. It must be noted here that there is a parallel chain of fish that are not suitable for export. Fishermen and middlemen can decide to market fish of doubtful quality locally before they are offered to a fish processing company. Fish that are rejected by the companies can also find their way directly to the local market, where they sold whole or processed.
Analysis of Western Consumption of Nile Perch from Lake Victoria Page 15 of 60
15
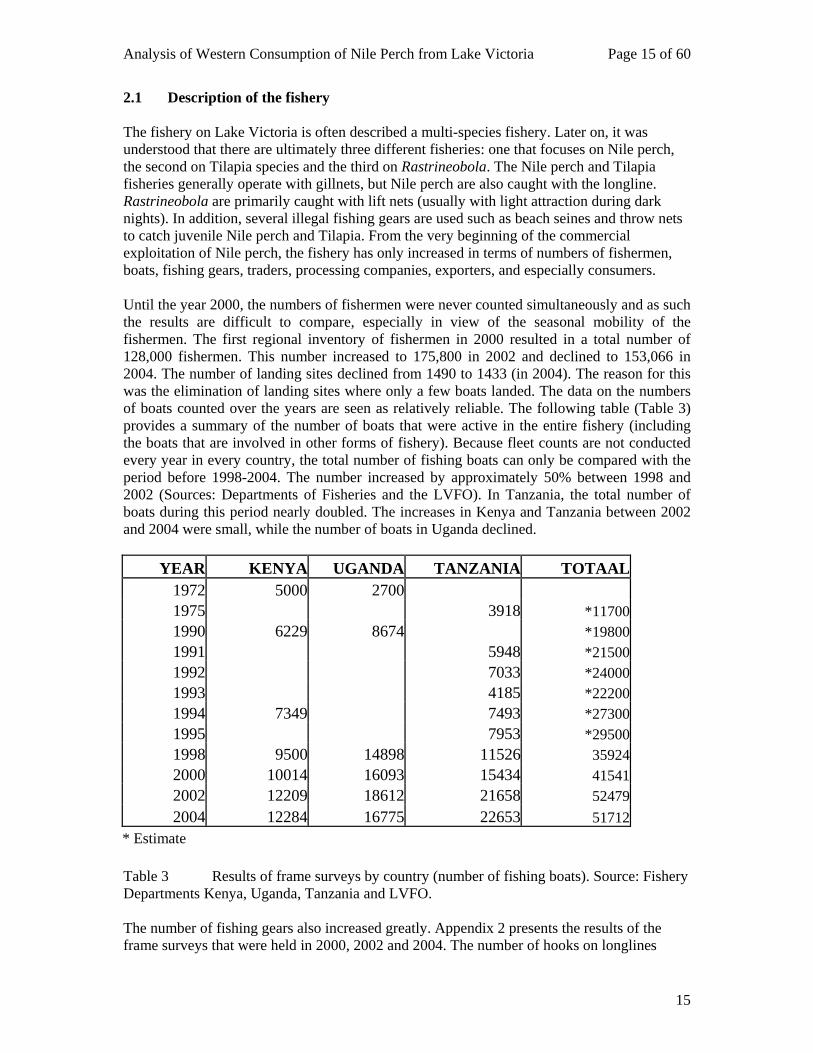
2.1 Description of the fishery The fishery on Lake Victoria is often described a multi-species fishery. Later on, it was understood that there are ultimately three different fisheries: one that focuses on Nile perch, the second on Tilapia species and the third on Rastrineobola. The Nile perch and Tilapia fisheries generally operate with gillnets, but Nile perch are also caught with the longline. Rastrineobola are primarily caught with lift nets (usually with light attraction during dark nights). In addition, several illegal fishing gears are used such as beach seines and throw nets to catch juvenile Nile perch and Tilapia. From the very beginning of the commercial exploitation of Nile perch, the fishery has only increased in terms of numbers of fishermen, boats, fishing gears, traders, processing companies, exporters, and especially consumers. Until the year 2000, the numbers of fishermen were never counted simultaneously and as such the results are difficult to compare, especially in view of the seasonal mobility of the fishermen. The first regional inventory of fishermen in 2000 resulted in a total number of 128,000 fishermen. This number increased to 175,800 in 2002 and declined to 153,066 in 2004. The number of landing sites declined from 1490 to 1433 (in 2004). The reason for this was the elimination of landing sites where only a few boats landed. The data on the numbers of boats counted over the years are seen as relatively reliable. The following table (Table 3) provides a summary of the number of boats that were active in the entire fishery (including the boats that are involved in other forms of fishery). Because fleet counts are not conducted every year in every country, the total number of fishing boats can only be compared with the period before 1998-2004. The number increased by approximately 50% between 1998 and 2002 (Sources: Departments of Fisheries and the LVFO). In Tanzania, the total number of boats during this period nearly doubled. The increases in Kenya and Tanzania between 2002 and 2004 were small, while the number of boats in Uganda declined.
YEAR KENYA UGANDA TANZANIA TOTAAL 1972 5000 2700 1975 3918 *11700 1990 6229 8674 *19800 1991 5948 *21500 1992 7033 *24000 1993 4185 *22200 1994 7349 7493 *27300 1995 7953 *29500 1998 9500 14898 11526 35924 2000 10014 16093 15434 41541 2002 12209 18612 21658 52479 2004 12284 16775 22653 51712
* Estimate Table 3 Results of frame surveys by country (number of fishing boats). Source: Fishery Departments Kenya, Uganda, Tanzania and LVFO. The number of fishing gears also increased greatly. Appendix 2 presents the results of the frame surveys that were held in 2000, 2002 and 2004. The number of hooks on longlines
Analysis of Western Consumption of Nile Perch from Lake Victoria Page 16 of 60
16
initially increased from 3.4 to 8 million (2002) and then declined to 6 million. The number of gillnets increased enormously in four years from 384,000 to 920,000 (the totals for the standard mesh sizes of 5, 5.5 and 6 inch of the stretched mesh). The degree of mechanization of the boats increased from 2% in 2000 to 19% in 2004 (9,609 outboard motors on 51,712 boats). Although in Appendix 2 no distinction is made between outboard motors of fishing boats or of transport boats, the mechanization degree percentages hardly change if the two boat types are added together. With the increase in the total number of boats and motors, the total investment amounts to many millions of Euros. 2.1.1 Boat owners and fishermen In 1999, the LVFRP conducted a Marketing Survey, and the collected data can be used to characterize the fishermen (SEDAWOG, 1999). This study must be seen as a regional baseline study which can be used to understand and describe later changes. At the time of the research, all fishermen were males; boat owners are primarily male, although there are increasing numbers of female boat owners. Women’s groups have become organized at various locations and have purchased boats, which they rent to male fishermen. Women and children can also own a boat if they inherit one after the death of a husband or father. In 1999, gillnets were used by 68% of fishermen, followed by 21% who used boat seines. The remaining 11% concentrated on the longline and other fishing gears. In total, 58% of the fishermen fished for Nile perch, 21% for dagaa and 20% for Tilapia. Catches are sold to agents of companies (27%), traders “on the bicycle” (25%), traders and processors that are linked to the landing site (17%) and external traders and consumers. At the time of the survey, trawlers were still being used to fish for Nile perch in Kenya. In 2000, a trawler ban also went into effect in Kenya, following the bans in Tanzania and Uganda), and this fishing method is no longer being used. 2.1.2 Other actors in the regional fishery Besides fishermen, boat owners and regional fish processors, the fishery has attracted many other craftsmen such as mechanics (for outboard motors), net menders, longshoremen, etc. 2.1.3 Traders and artisanal fish processors (for the East African consumer) The same LVFRP baseline study resulted in a description of the fish traders and fish processors for the national/domestic markets. Both men and women are involved in trading and processing fish. Half of the individuals who both trade and process fish also work in another sector. Most of these part-time traders (83%) also work in the agriculture sector. Of the group studied, 71% traded fish exclusively (without processing). Of the traders in this category, half traded in Nile perch, one-fourth in Tilapia and one-fourth in dagaa. Half of the traders purchased the fish directly from fishermen, one-third from wholesalers, 12% from local fish processors and 6% from the processing companies (rejected fish and skeletons) (SEDAWOG, 1999). 2.1.4 Agents
Analysis of Western Consumption of Nile Perch from Lake Victoria Page 17 of 60
17
A total of 84% of the processing companies purchase fish from agents and fishermen. The suppliers were hired directly by the companies (8%), contracted by them (44%), or had a long-term working relationship with the companies (40%). The remaining group of 8% could not be clearly defined.
Generally speaking, the first quality fish is sold by the middlemen and/or fishermen to the agents to be filleted and packed by the processing industry. Fish which has insufficient quality for industrial processing is sold to local fish traders who then resell the unprocessed fish at markets or to local fish processors (the by-products of the processing companies can also be sold to the local traders). The quantity of fish that is landed by transport boats varies between five and seven
tonnes, which is the result of a trip of three to four days. The agents are important primarily for the processing industry, because the logistics for purchasing fish are centralized and because this reduces opportunities for fraud. As a rule, agents use their own working capital for purchasing fish, and often have their own transport and personnel, although the latter can also be supplied by the companies. The trucks remain at a landing site for two to four days before unloading at a company. The companies generally supply ice to the transport boats; in this way they build a working relationship and are ensured of high-quality fish. Virtually no fishermen use ice on board their boats. The fish is only iced on board the transport boats or in the specially placed collection containers (especially on landing sites that are remote from the regular landing sites). Some companies also own a fleet of fishing boats to guarantee control over the entire production chain and to assure traceability. 2.2 Description of the industrial fish processing industry The caught fish arrive at the processing industry via middlemen and fish agents; the middlemen purchase the fish on the lake, while the fish agents purchase the fish at the authorized landing sites. In some cases, the fish is also delivered directly to the processing companies by fishermen. Fish that is traded on the lake or that originates from the islands and more distant landing sites is then carried by transport boats to the larger landing sites or is shipped directly to the companies. In the latter case, the companies have docks and landing facilities. Often there are agreements between a company and groups of fishermen about supplying the fish. In return, the company supplies the fishermen with nets and other essential materials. The employees of the companies are specially trained to maximize product quality. A company with an average processing capacity of 40 mt raw material per day has approximately 350 permanent and temporary employees. Upon arrival, the fish are selected and sorted. Overripe fish are rejected and sent back, or sold on without processing. The interventions of the European Commission with respect to quality assurance have led to the factories being very careful when selecting the supplied fish. After
Analysis of Western Consumption of Nile Perch from Lake Victoria Page 18 of 60
18
being washed and refrigerated, the fish are placed on ice and processed. According to the wishes of the final buyers, the fish are filleted, de-headed or only gutted. Washing, refrigeration (and/or freezing) and packaging are then carefully completed and checked. The majority of the companies satisfy the requirements to export fish products to the EU. 2.3 Nile perch products The processed and packaged fish products can be sold in various ways to exporters:
• Fresh products: FOB Entebbe • Frozen products: FOR/FOT Kampala • Self-arranged transport: CIF on foreign importers
The following fish products for export can be distinguished:
• Fresh fillets • Frozen fillets • Whole fish • De-headed and gutted fish • Swimming bladders (dried or frozen)
The local Nile perch products are the following:
• Damaged Nile perch (rejects) • Salted fish • Fried/deep fried “frames” (skeletons) • Fried/deep fried heads • Dried/deep fried undersized fish • Swimming bladders • Belly flaps • Fish oil • Fish meal
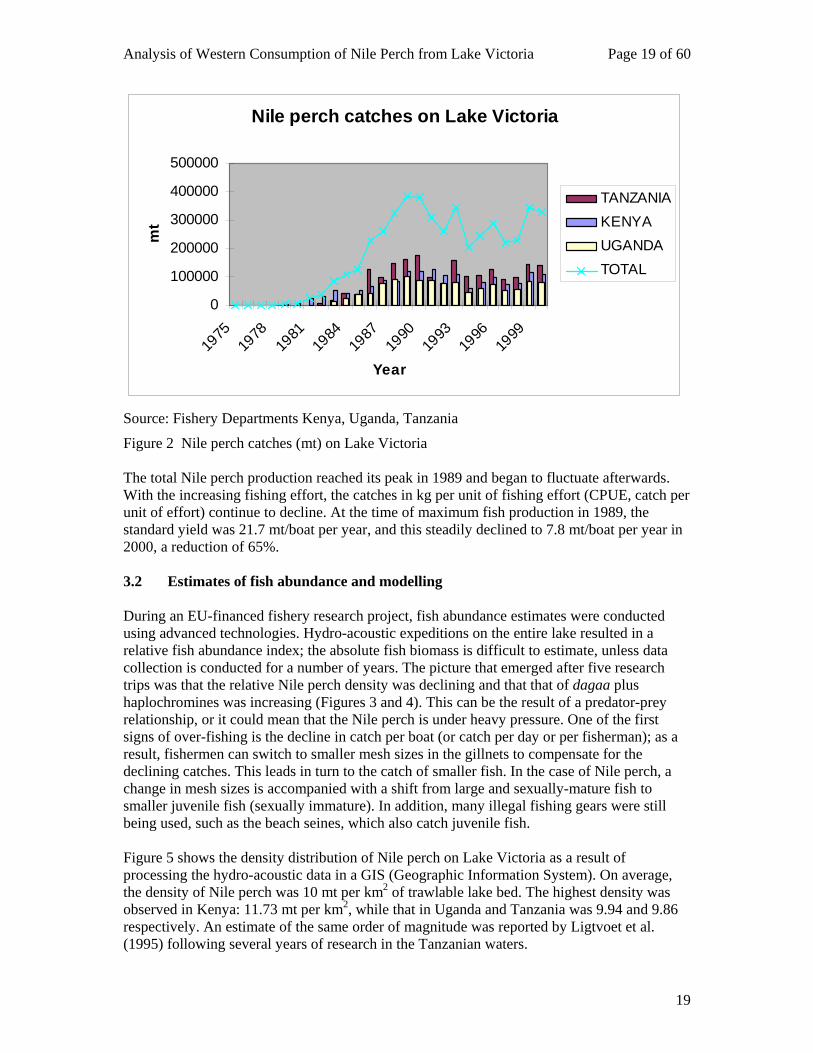
Potential products include fish soup, fish pasties, fish sticks, fish burgers, smoked fish and fish leather. Increasing the value by means of product diversification is currently being studied by a FAO/COMESA Project. 3 NATURAL RESOURCES 3.1 Exploitation of the Nile perch Catch statistics (tonnes) for Nile perch have been kept since 1975. The three countries surrounding the lake collect data, and the estimates are presented in the following graph (Figure 2):
Analysis of Western Consumption of Nile Perch from Lake Victoria Page 19 of 60
19
Nile perch catches on Lake Victoria
0
100000
200000
300000
400000
500000
1975
1978
1981
1984
1987
1990
1993
1996
1999
Year
mt
TANZANIAKENYAUGANDATOTAL
Source: Fishery Departments Kenya, Uganda, Tanzania
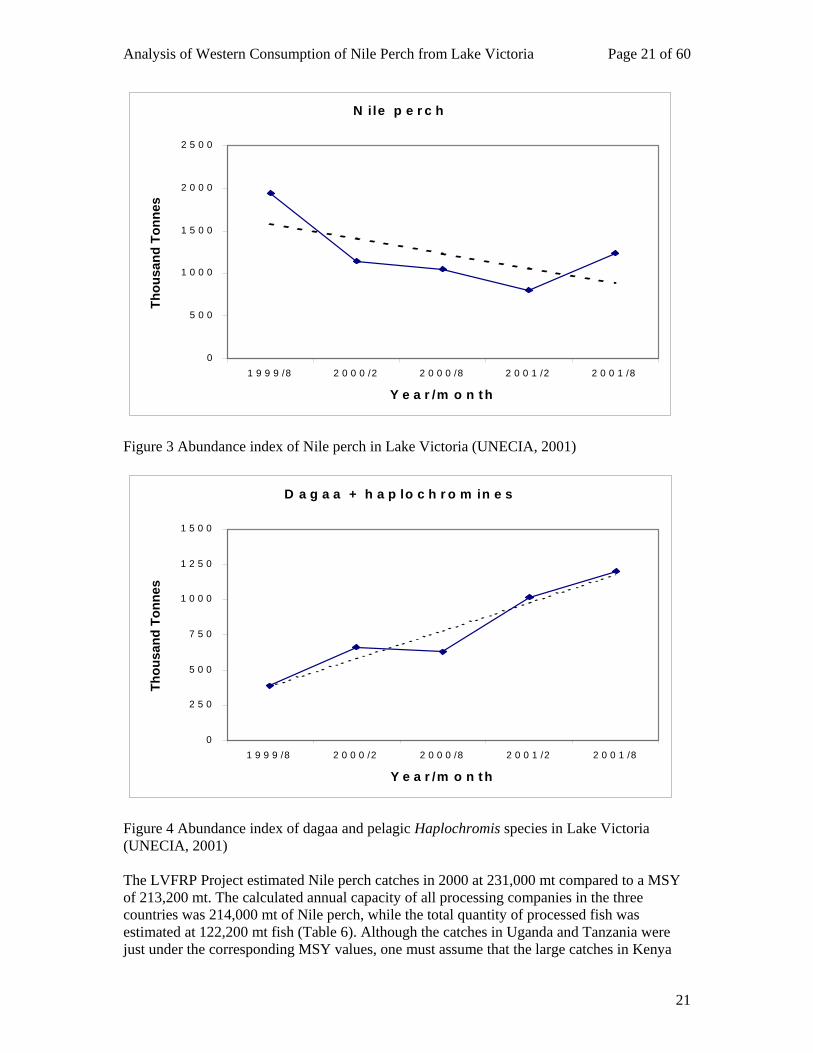
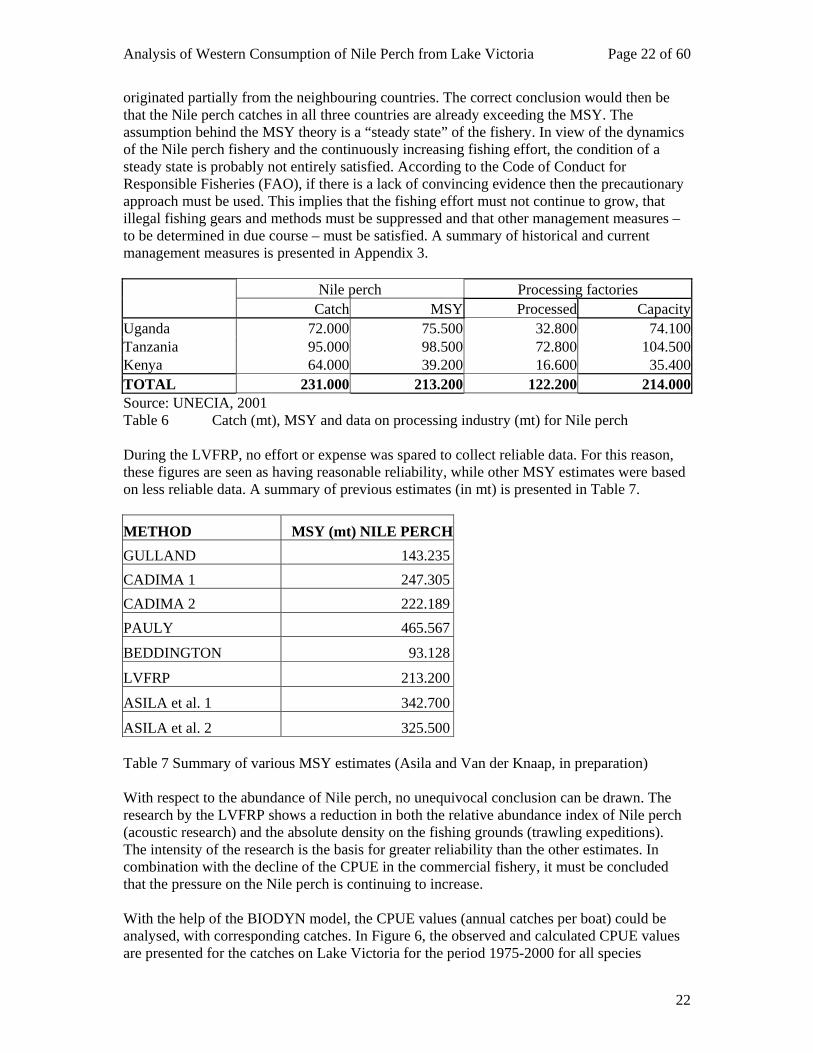
Figure 2 Nile perch catches (mt) on Lake Victoria The total Nile perch production reached its peak in 1989 and began to fluctuate afterwards. With the increasing fishing effort, the catches in kg per unit of fishing effort (CPUE, catch per unit of effort) continue to decline. At the time of maximum fish production in 1989, the standard yield was 21.7 mt/boat per year, and this steadily declined to 7.8 mt/boat per year in 2000, a reduction of 65%. 3.2 Estimates of fish abundance and modelling During an EU-financed fishery research project, fish abundance estimates were conducted using advanced technologies. Hydro-acoustic expeditions on the entire lake resulted in a relative fish abundance index; the absolute fish biomass is difficult to estimate, unless data collection is conducted for a number of years. The picture that emerged after five research trips was that the relative Nile perch density was declining and that that of dagaa plus haplochromines was increasing (Figures 3 and 4). This can be the result of a predator-prey relationship, or it could mean that the Nile perch is under heavy pressure. One of the first signs of over-fishing is the decline in catch per boat (or catch per day or per fisherman); as a result, fishermen can switch to smaller mesh sizes in the gillnets to compensate for the declining catches. This leads in turn to the catch of smaller fish. In the case of Nile perch, a change in mesh sizes is accompanied with a shift from large and sexually-mature fish to smaller juvenile fish (sexually immature). In addition, many illegal fishing gears were still being used, such as the beach seines, which also catch juvenile fish. Figure 5 shows the density distribution of Nile perch on Lake Victoria as a result of processing the hydro-acoustic data in a GIS (Geographic Information System). On average, the density of Nile perch was 10 mt per km2 of trawlable lake bed. The highest density was observed in Kenya: 11.73 mt per km2, while that in Uganda and Tanzania was 9.94 and 9.86 respectively. An estimate of the same order of magnitude was reported by Ligtvoet et al. (1995) following several years of research in the Tanzanian waters.
Analysis of Western Consumption of Nile Perch from Lake Victoria Page 20 of 60
20
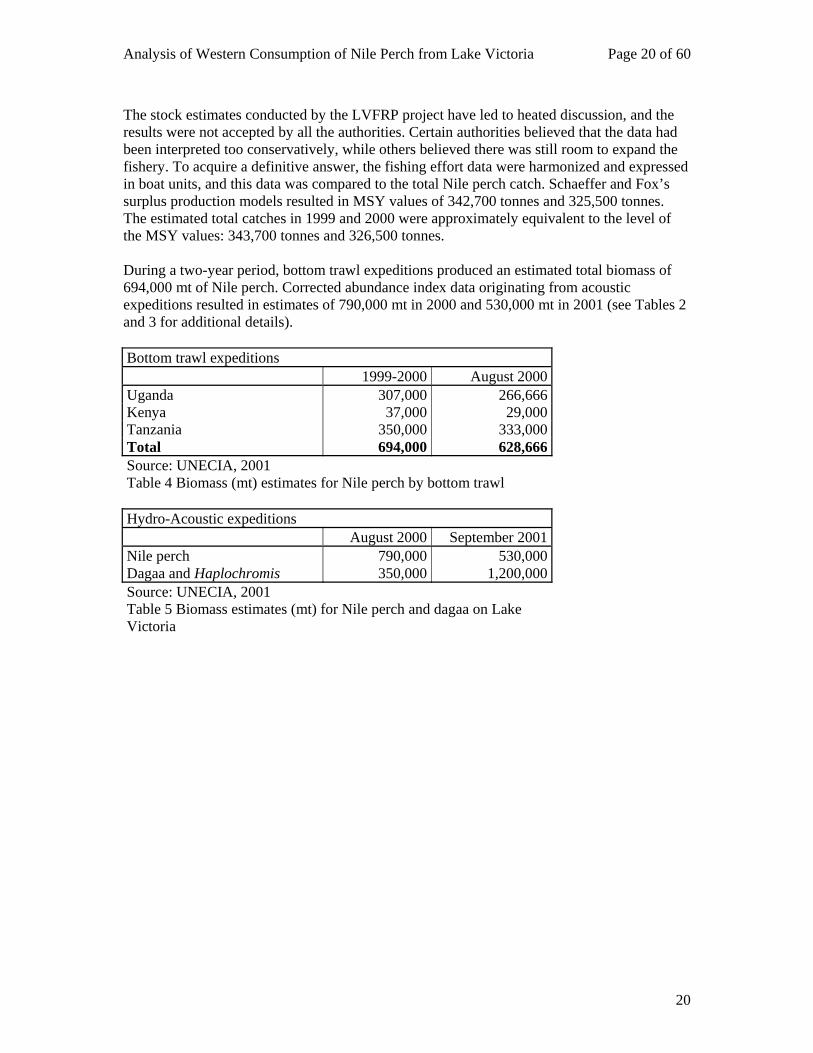
The stock estimates conducted by the LVFRP project have led to heated discussion, and the results were not accepted by all the authorities. Certain authorities believed that the data had been interpreted too conservatively, while others believed there was still room to expand the fishery. To acquire a definitive answer, the fishing effort data were harmonized and expressed in boat units, and this data was compared to the total Nile perch catch. Schaeffer and Fox’s surplus production models resulted in MSY values of 342,700 tonnes and 325,500 tonnes. The estimated total catches in 1999 and 2000 were approximately equivalent to the level of the MSY values: 343,700 tonnes and 326,500 tonnes. During a two-year period, bottom trawl expeditions produced an estimated total biomass of 694,000 mt of Nile perch. Corrected abundance index data originating from acoustic expeditions resulted in estimates of 790,000 mt in 2000 and 530,000 mt in 2001 (see Tables 2 and 3 for additional details). Bottom trawl expeditions 1999-2000 August 2000Uganda 307,000 266,666Kenya 37,000 29,000Tanzania 350,000 333,000Total 694,000 628,666Source: UNECIA, 2001 Table 4 Biomass (mt) estimates for Nile perch by bottom trawl Hydro-Acoustic expeditions August 2000 September 2001Nile perch 790,000 530,000Dagaa and Haplochromis 350,000 1,200,000Source: UNECIA, 2001 Table 5 Biomass estimates (mt) for Nile perch and dagaa on Lake Victoria
Analysis of Western Consumption of Nile Perch from Lake Victoria Page 21 of 60
21
N ile p e r c h
0
5 0 0
1 0 0 0
1 5 0 0
2 0 0 0
2 5 0 0
1 9 9 9 /8 2 0 0 0 /2 2 0 0 0 /8 2 0 0 1 /2 2 0 0 1 /8
Y e a r /m o n t h
Thou
sand
Ton
nes
Figure 3 Abundance index of Nile perch in Lake Victoria (UNECIA, 2001)
D a g a a + h a p lo c h r o m in e s
0
2 5 0
5 0 0
7 5 0
1 0 0 0
1 2 5 0
1 5 0 0
1 9 9 9 /8 2 0 0 0 /2 2 0 0 0 /8 2 0 0 1 /2 2 0 0 1 /8
Y e a r /m o n t h
Thou
sand
Ton
nes
Figure 4 Abundance index of dagaa and pelagic Haplochromis species in Lake Victoria (UNECIA, 2001) The LVFRP Project estimated Nile perch catches in 2000 at 231,000 mt compared to a MSY of 213,200 mt. The calculated annual capacity of all processing companies in the three countries was 214,000 mt of Nile perch, while the total quantity of processed fish was estimated at 122,200 mt fish (Table 6). Although the catches in Uganda and Tanzania were just under the corresponding MSY values, one must assume that the large catches in Kenya
Analysis of Western Consumption of Nile Perch from Lake Victoria Page 22 of 60
22
originated partially from the neighbouring countries. The correct conclusion would then be that the Nile perch catches in all three countries are already exceeding the MSY. The assumption behind the MSY theory is a “steady state” of the fishery. In view of the dynamics of the Nile perch fishery and the continuously increasing fishing effort, the condition of a steady state is probably not entirely satisfied. According to the Code of Conduct for Responsible Fisheries (FAO), if there is a lack of convincing evidence then the precautionary approach must be used. This implies that the fishing effort must not continue to grow, that illegal fishing gears and methods must be suppressed and that other management measures – to be determined in due course – must be satisfied. A summary of historical and current management measures is presented in Appendix 3. Nile perch Processing factories
Catch MSY Processed CapacityUganda 72.000 75.500 32.800 74.100Tanzania 95.000 98.500 72.800 104.500Kenya 64.000 39.200 16.600 35.400TOTAL 231.000 213.200 122.200 214.000Source: UNECIA, 2001 Table 6 Catch (mt), MSY and data on processing industry (mt) for Nile perch During the LVFRP, no effort or expense was spared to collect reliable data. For this reason, these figures are seen as having reasonable reliability, while other MSY estimates were based on less reliable data. A summary of previous estimates (in mt) is presented in Table 7.
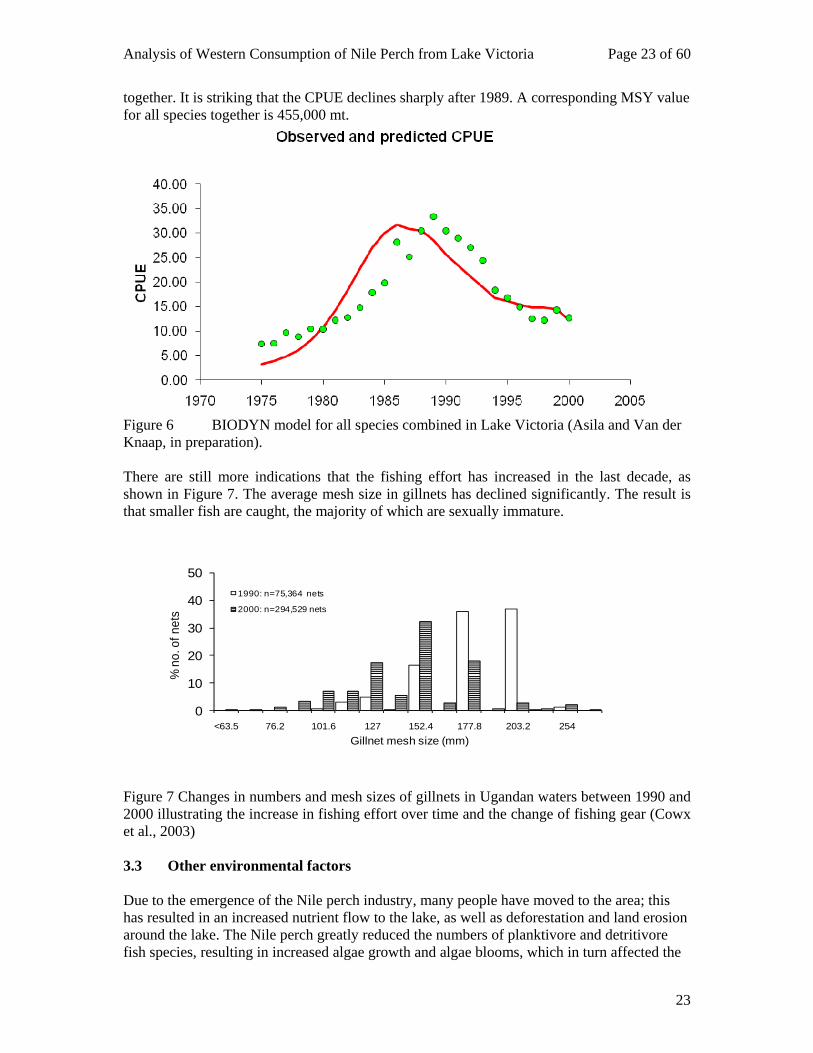
Table 7 Summary of various MSY estimates (Asila and Van der Knaap, in preparation) With respect to the abundance of Nile perch, no unequivocal conclusion can be drawn. The research by the LVFRP shows a reduction in both the relative abundance index of Nile perch (acoustic research) and the absolute density on the fishing grounds (trawling expeditions). The intensity of the research is the basis for greater reliability than the other estimates. In combination with the decline of the CPUE in the commercial fishery, it must be concluded that the pressure on the Nile perch is continuing to increase. With the help of the BIODYN model, the CPUE values (annual catches per boat) could be analysed, with corresponding catches. In Figure 6, the observed and calculated CPUE values are presented for the catches on Lake Victoria for the period 1975-2000 for all species
METHOD MSY (mt) NILE PERCHGULLAND 143.235CADIMA 1 247.305CADIMA 2 222.189PAULY 465.567
BEDDINGTON 93.128
LVFRP 213.200
ASILA et al. 1 342.700
ASILA et al. 2 325.500
Analysis of Western Consumption of Nile Perch from Lake Victoria Page 23 of 60
23
together. It is striking that the CPUE declines sharply after 1989. A corresponding MSY value for all species together is 455,000 mt.
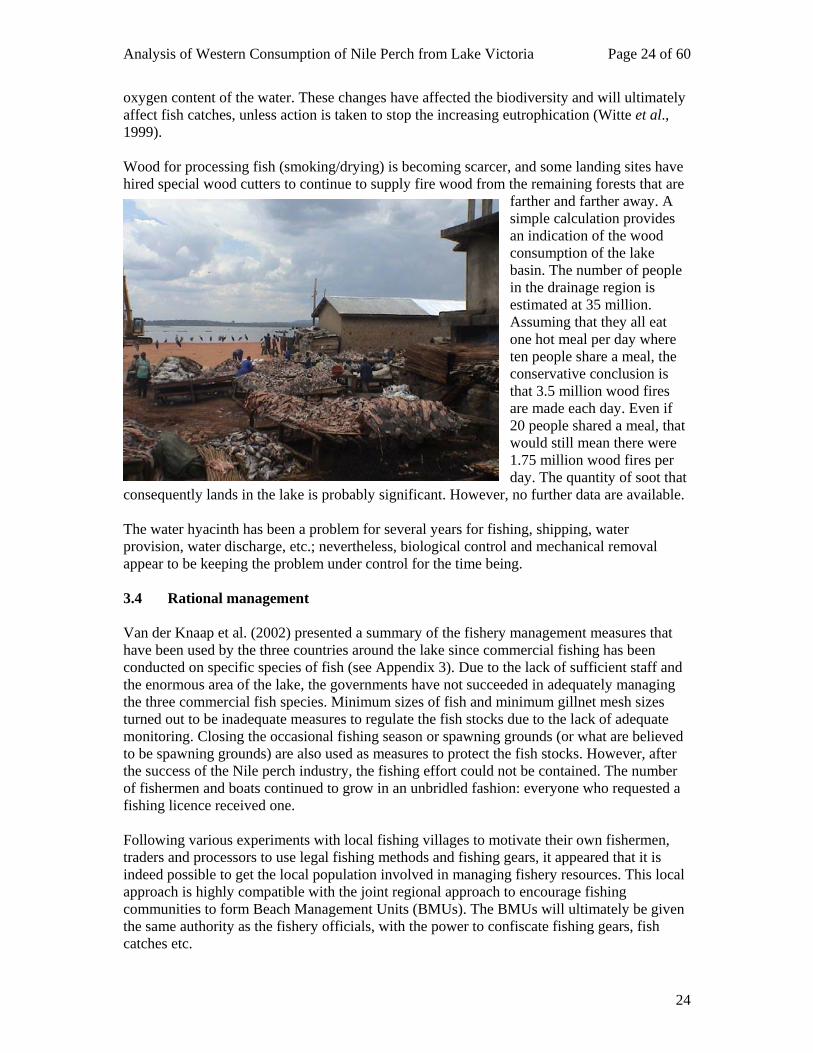
Figure 6 BIODYN model for all species combined in Lake Victoria (Asila and Van der Knaap, in preparation). There are still more indications that the fishing effort has increased in the last decade, as shown in Figure 7. The average mesh size in gillnets has declined significantly. The result is that smaller fish are caught, the majority of which are sexually immature.
Figure 7 Changes in numbers and mesh sizes of gillnets in Ugandan waters between 1990 and 2000 illustrating the increase in fishing effort over time and the change of fishing gear (Cowx et al., 2003) 3.3 Other environmental factors Due to the emergence of the Nile perch industry, many people have moved to the area; this has resulted in an increased nutrient flow to the lake, as well as deforestation and land erosion around the lake. The Nile perch greatly reduced the numbers of planktivore and detritivore fish species, resulting in increased algae growth and algae blooms, which in turn affected the
0
10
20
30
40
50
<63.5 76.2 101.6 127 152.4 177.8 203.2 254
% n
o. o
f net
s
Gillnet mesh size (mm)
1990: n=75,364 nets
2000: n=294,529 nets
Analysis of Western Consumption of Nile Perch from Lake Victoria Page 24 of 60
24
oxygen content of the water. These changes have affected the biodiversity and will ultimately affect fish catches, unless action is taken to stop the increasing eutrophication (Witte et al., 1999). Wood for processing fish (smoking/drying) is becoming scarcer, and some landing sites have hired special wood cutters to continue to supply fire wood from the remaining forests that are
farther and farther away. A simple calculation provides an indication of the wood consumption of the lake basin. The number of people in the drainage region is estimated at 35 million. Assuming that they all eat one hot meal per day where ten people share a meal, the conservative conclusion is that 3.5 million wood fires are made each day. Even if 20 people shared a meal, that would still mean there were 1.75 million wood fires per day. The quantity of soot that
consequently lands in the lake is probably significant. However, no further data are available. The water hyacinth has been a problem for several years for fishing, shipping, water provision, water discharge, etc.; nevertheless, biological control and mechanical removal appear to be keeping the problem under control for the time being. 3.4 Rational management Van der Knaap et al. (2002) presented a summary of the fishery management measures that have been used by the three countries around the lake since commercial fishing has been conducted on specific species of fish (see Appendix 3). Due to the lack of sufficient staff and the enormous area of the lake, the governments have not succeeded in adequately managing the three commercial fish species. Minimum sizes of fish and minimum gillnet mesh sizes turned out to be inadequate measures to regulate the fish stocks due to the lack of adequate monitoring. Closing the occasional fishing season or spawning grounds (or what are believed to be spawning grounds) are also used as measures to protect the fish stocks. However, after the success of the Nile perch industry, the fishing effort could not be contained. The number of fishermen and boats continued to grow in an unbridled fashion: everyone who requested a fishing licence received one. Following various experiments with local fishing villages to motivate their own fishermen, traders and processors to use legal fishing methods and fishing gears, it appeared that it is indeed possible to get the local population involved in managing fishery resources. This local approach is highly compatible with the joint regional approach to encourage fishing communities to form Beach Management Units (BMUs). The BMUs will ultimately be given the same authority as the fishery officials, with the power to confiscate fishing gears, fish catches etc.
Analysis of Western Consumption of Nile Perch from Lake Victoria Page 25 of 60
25
Despite all the management measures that have been implemented, it has turned out to be impossible to properly manage the Nile perch and other fish species. Fishery management cannot be conducted by the fishery departments alone. Fishermen, fish processors and exporters must also become involved. Closing fishing areas and fishing seasons would have serious socioeconomic consequences (comparable to the years of the import stops; see also Section 4.7); therefore other measures had to be implemented immediately with which all parties could agree. As a compromise, it was decided to protect both juvenile fish and spawners by establishing a minimum and maximum size for Nile perch. Beginning in 2002, only fish between 50 and 90 cm in total length could be supplied to the processing industry. Since the gillnets have a strongly selective effect, mesh sizes of 5 to 7 inches (12.5 to 17.5 cm of stretched mesh) were recommended. Due to the risk of theft, many fishermen have switched from gillnets to longlines. This fishing gear is less expensive and the average quality of the caught fish is higher than from gillnets. However, this method is significantly less selective than the gillnet fishery. An additional effect is that the longlines use live bait (young catfish and Haplochromis species); the quantity of bait used on longlines is estimated at 7,500 tonnes per year. 4 ECONOMIC FACTORS 4.1 Contribution of the Nile perch fishery to the GDP
4.1.1 Kenya
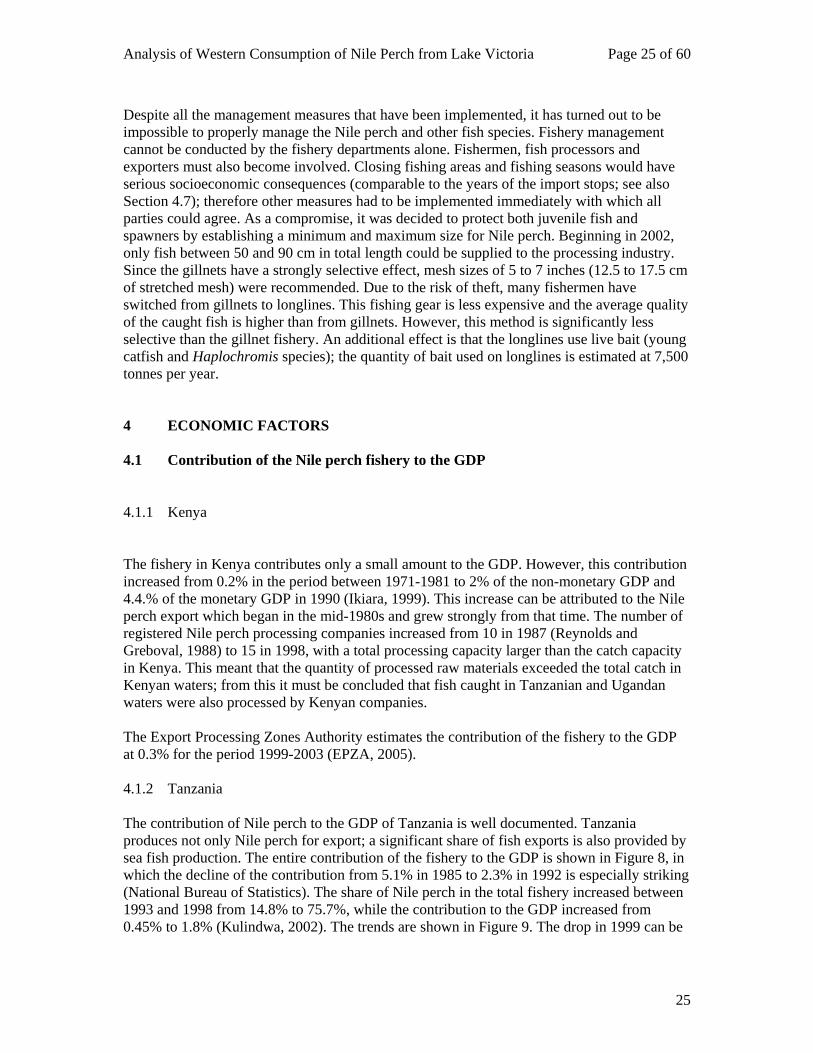
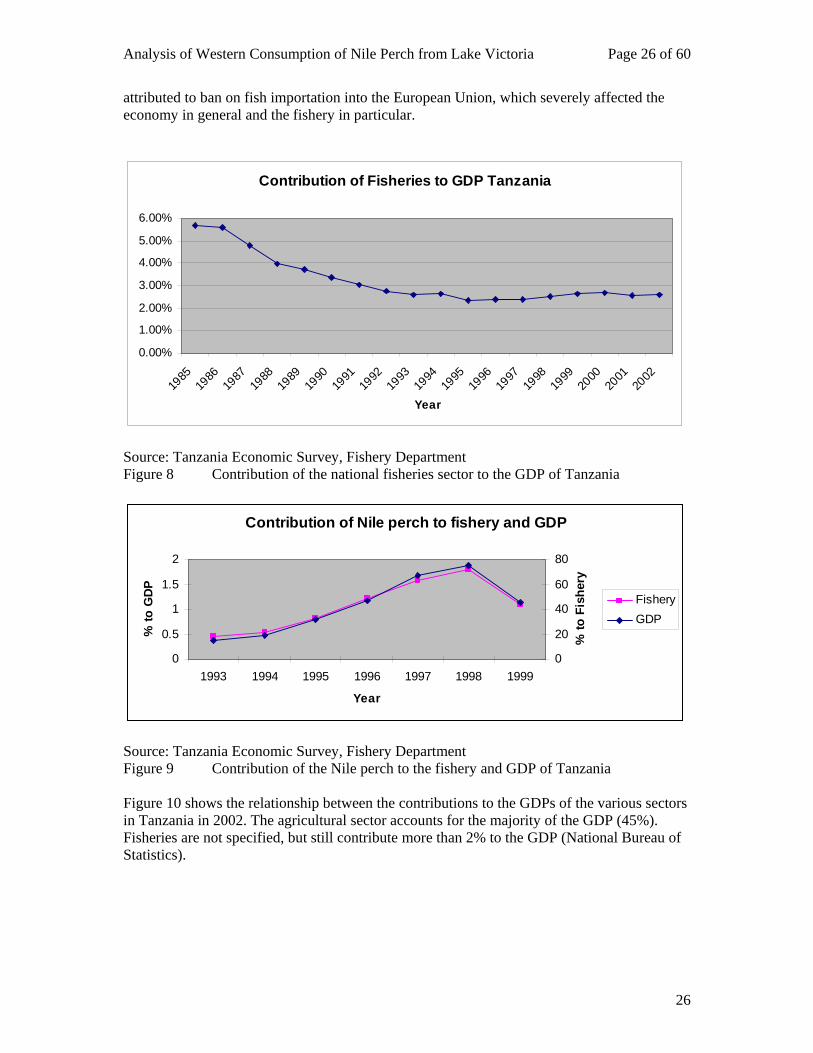
The fishery in Kenya contributes only a small amount to the GDP. However, this contribution increased from 0.2% in the period between 1971-1981 to 2% of the non-monetary GDP and 4.4.% of the monetary GDP in 1990 (Ikiara, 1999). This increase can be attributed to the Nile perch export which began in the mid-1980s and grew strongly from that time. The number of registered Nile perch processing companies increased from 10 in 1987 (Reynolds and Greboval, 1988) to 15 in 1998, with a total processing capacity larger than the catch capacity in Kenya. This meant that the quantity of processed raw materials exceeded the total catch in Kenyan waters; from this it must be concluded that fish caught in Tanzanian and Ugandan waters were also processed by Kenyan companies. The Export Processing Zones Authority estimates the contribution of the fishery to the GDP at 0.3% for the period 1999-2003 (EPZA, 2005). 4.1.2 Tanzania The contribution of Nile perch to the GDP of Tanzania is well documented. Tanzania produces not only Nile perch for export; a significant share of fish exports is also provided by sea fish production. The entire contribution of the fishery to the GDP is shown in Figure 8, in which the decline of the contribution from 5.1% in 1985 to 2.3% in 1992 is especially striking (National Bureau of Statistics). The share of Nile perch in the total fishery increased between 1993 and 1998 from 14.8% to 75.7%, while the contribution to the GDP increased from 0.45% to 1.8% (Kulindwa, 2002). The trends are shown in Figure 9. The drop in 1999 can be
Analysis of Western Consumption of Nile Perch from Lake Victoria Page 26 of 60
26
attributed to ban on fish importation into the European Union, which severely affected the economy in general and the fishery in particular.
Contribution of Fisheries to GDP Tanzania
0.00%
1.00%
2.00%
3.00%
4.00%
5.00%
6.00%
1985
1986
1987
1988
1989
1990
1991
1992
1993
1994
1995
1996
1997
1998
1999
2000
2001
2002
Year
Source: Tanzania Economic Survey, Fishery Department Figure 8 Contribution of the national fisheries sector to the GDP of Tanzania
Contribution of Nile perch to fishery and GDP
0
0.5
1
1.5
2
1993 1994 1995 1996 1997 1998 1999
Year
% to
GD
P
0
20
40
60
80
% to
Fis
hery
FisheryGDP
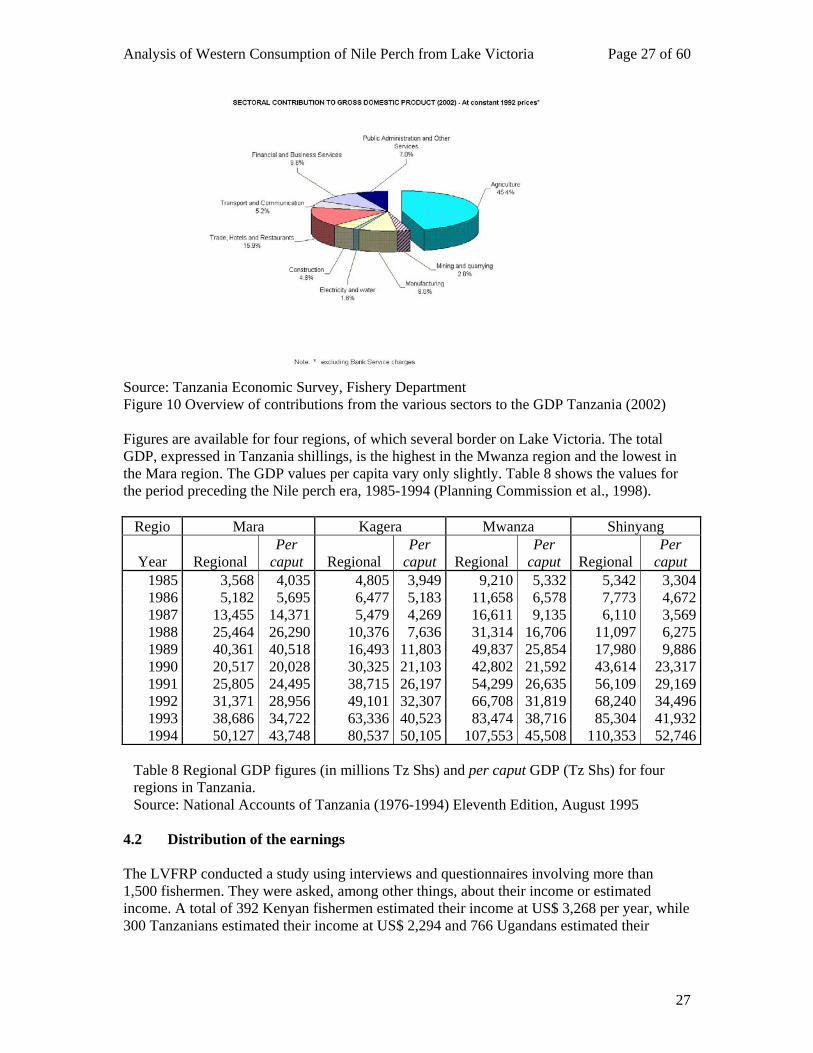
Source: Tanzania Economic Survey, Fishery Department Figure 9 Contribution of the Nile perch to the fishery and GDP of Tanzania Figure 10 shows the relationship between the contributions to the GDPs of the various sectors in Tanzania in 2002. The agricultural sector accounts for the majority of the GDP (45%). Fisheries are not specified, but still contribute more than 2% to the GDP (National Bureau of Statistics).
Analysis of Western Consumption of Nile Perch from Lake Victoria Page 27 of 60
27
Source: Tanzania Economic Survey, Fishery Department Figure 10 Overview of contributions from the various sectors to the GDP Tanzania (2002) Figures are available for four regions, of which several border on Lake Victoria. The total GDP, expressed in Tanzania shillings, is the highest in the Mwanza region and the lowest in the Mara region. The GDP values per capita vary only slightly. Table 8 shows the values for the period preceding the Nile perch era, 1985-1994 (Planning Commission et al., 1998).
Regio Mara Kagera Mwanza Shinyang
Year Regional Per
caput Regional Per
caput Regional Per
caput Regional Per
caput 1985 3,568 4,035 4,805 3,949 9,210 5,332 5,342 3,3041986 5,182 5,695 6,477 5,183 11,658 6,578 7,773 4,6721987 13,455 14,371 5,479 4,269 16,611 9,135 6,110 3,5691988 25,464 26,290 10,376 7,636 31,314 16,706 11,097 6,2751989 40,361 40,518 16,493 11,803 49,837 25,854 17,980 9,8861990 20,517 20,028 30,325 21,103 42,802 21,592 43,614 23,3171991 25,805 24,495 38,715 26,197 54,299 26,635 56,109 29,1691992 31,371 28,956 49,101 32,307 66,708 31,819 68,240 34,4961993 38,686 34,722 63,336 40,523 83,474 38,716 85,304 41,9321994 50,127 43,748 80,537 50,105 107,553 45,508 110,353 52,746
Table 8 Regional GDP figures (in millions Tz Shs) and per caput GDP (Tz Shs) for four regions in Tanzania. Source: National Accounts of Tanzania (1976-1994) Eleventh Edition, August 1995
4.2 Distribution of the earnings The LVFRP conducted a study using interviews and questionnaires involving more than 1,500 fishermen. They were asked, among other things, about their income or estimated income. A total of 392 Kenyan fishermen estimated their income at US$ 3,268 per year, while 300 Tanzanians estimated their income at US$ 2,294 and 766 Ugandans estimated their
Analysis of Western Consumption of Nile Perch from Lake Victoria Page 28 of 60
28
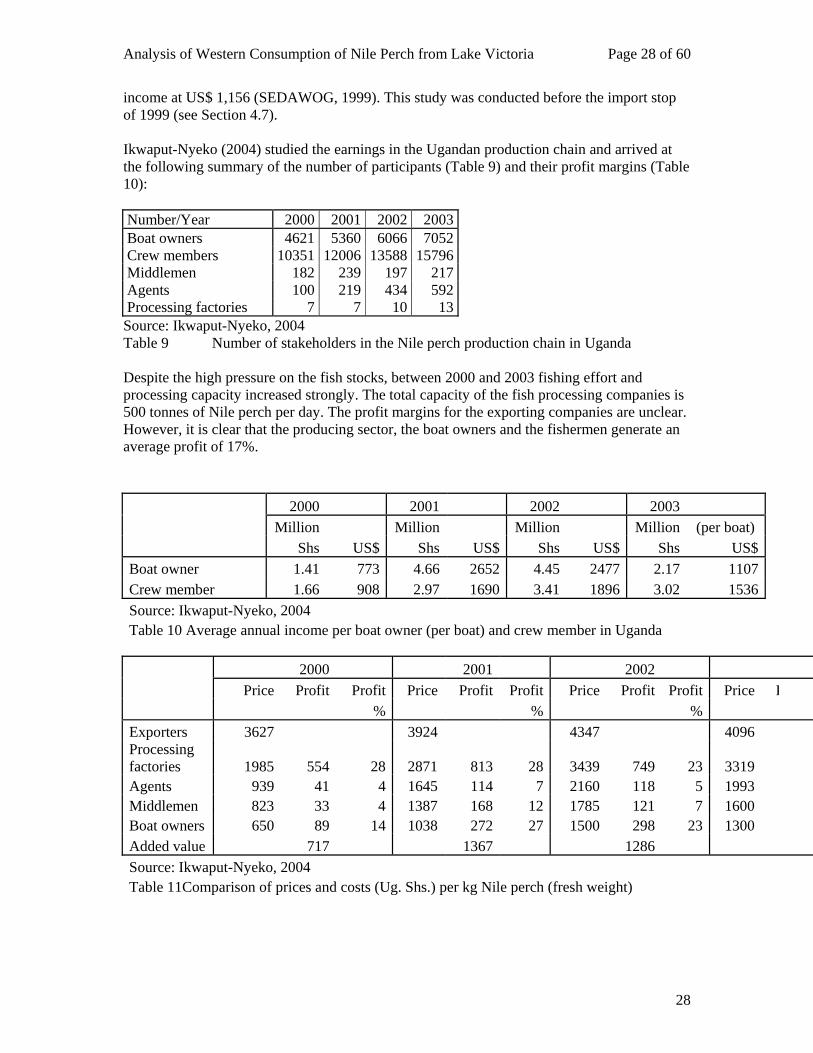
income at US$ 1,156 (SEDAWOG, 1999). This study was conducted before the import stop of 1999 (see Section 4.7). Ikwaput-Nyeko (2004) studied the earnings in the Ugandan production chain and arrived at the following summary of the number of participants (Table 9) and their profit margins (Table 10): Number/Year 2000 2001 2002 2003Boat owners 4621 5360 6066 7052Crew members 10351 12006 13588 15796Middlemen 182 239 197 217Agents 100 219 434 592Processing factories 7 7 10 13Source: Ikwaput-Nyeko, 2004 Table 9 Number of stakeholders in the Nile perch production chain in Uganda Despite the high pressure on the fish stocks, between 2000 and 2003 fishing effort and processing capacity increased strongly. The total capacity of the fish processing companies is 500 tonnes of Nile perch per day. The profit margins for the exporting companies are unclear. However, it is clear that the producing sector, the boat owners and the fishermen generate an average profit of 17%.
2000 2001 2002 2003 Million Million Million Million (per boat) Shs US$ Shs US$ Shs US$ Shs US$Boat owner 1.41 773 4.66 2652 4.45 2477 2.17 1107Crew member 1.66 908 2.97 1690 3.41 1896 3.02 1536Source: Ikwaput-Nyeko, 2004 Table 10 Average annual income per boat owner (per boat) and crew member in Uganda
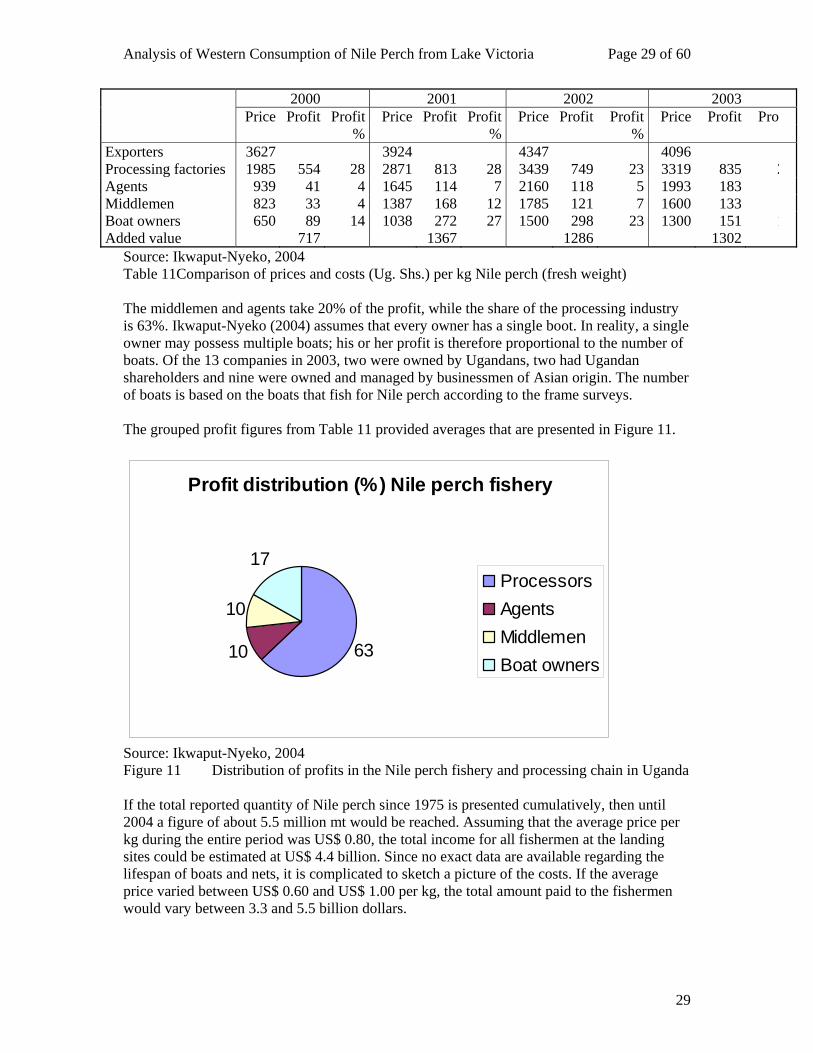
2000 2001 2002 Price Profit Profit Price Profit Profit Price Profit Profit Price P % % % Exporters 3627 3924 4347 4096Processing factories 1985 554 28 2871 813 28 3439 749 23 3319Agents 939 41 4 1645 114 7 2160 118 5 1993Middlemen 823 33 4 1387 168 12 1785 121 7 1600Boat owners 650 89 14 1038 272 27 1500 298 23 1300Added value 717 1367 1286 Source: Ikwaput-Nyeko, 2004 Table 11Comparison of prices and costs (Ug. Shs.) per kg Nile perch (fresh weight)
Analysis of Western Consumption of Nile Perch from Lake Victoria Page 29 of 60
29
2000 2001 2002 2003 Price Profit Profit Price Profit Profit Price Profit Profit Price Profit Prof % % % Exporters 3627 3924 4347 4096Processing factories 1985 554 28 2871 813 28 3439 749 23 3319 835 2Agents 939 41 4 1645 114 7 2160 118 5 1993 183Middlemen 823 33 4 1387 168 12 1785 121 7 1600 133Boat owners 650 89 14 1038 272 27 1500 298 23 1300 151 1Added value 717 1367 1286 1302
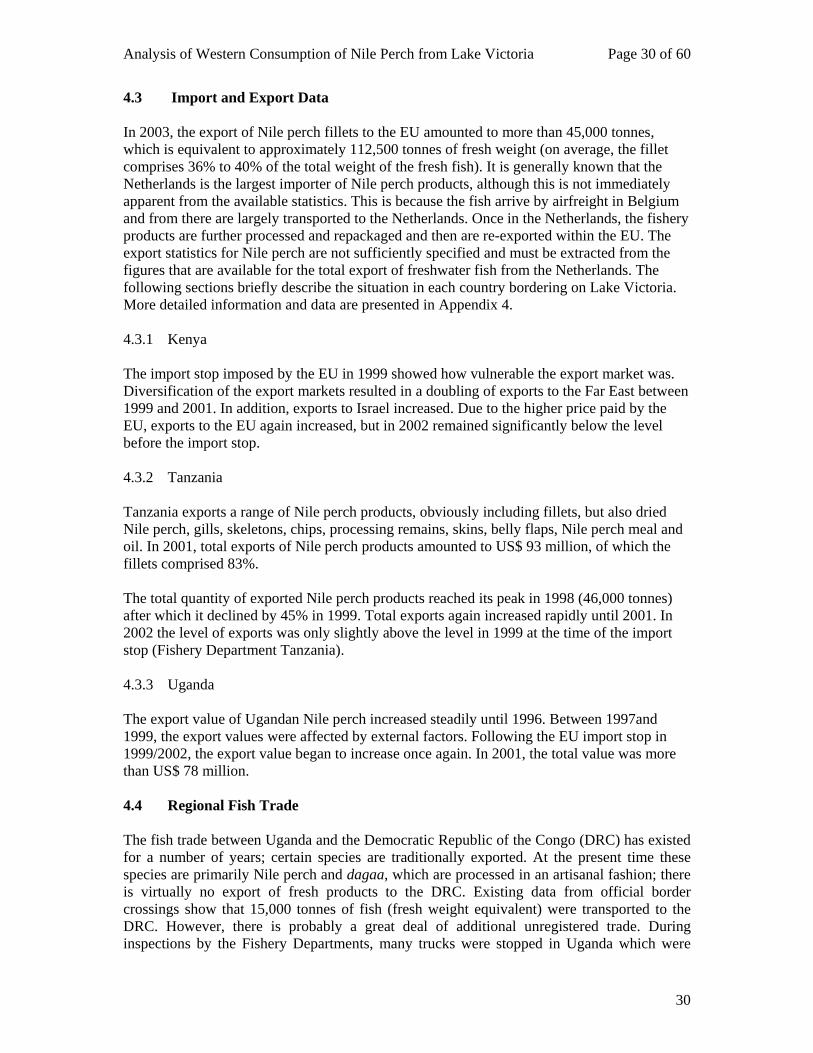
Source: Ikwaput-Nyeko, 2004 Table 11Comparison of prices and costs (Ug. Shs.) per kg Nile perch (fresh weight) The middlemen and agents take 20% of the profit, while the share of the processing industry is 63%. Ikwaput-Nyeko (2004) assumes that every owner has a single boot. In reality, a single owner may possess multiple boats; his or her profit is therefore proportional to the number of boats. Of the 13 companies in 2003, two were owned by Ugandans, two had Ugandan shareholders and nine were owned and managed by businessmen of Asian origin. The number of boats is based on the boats that fish for Nile perch according to the frame surveys. The grouped profit figures from Table 11 provided averages that are presented in Figure 11.
Profit distribution (%) Nile perch fishery
6310
10
17ProcessorsAgentsMiddlemenBoat owners
Source: Ikwaput-Nyeko, 2004 Figure 11 Distribution of profits in the Nile perch fishery and processing chain in Uganda If the total reported quantity of Nile perch since 1975 is presented cumulatively, then until 2004 a figure of about 5.5 million mt would be reached. Assuming that the average price per kg during the entire period was US$ 0.80, the total income for all fishermen at the landing sites could be estimated at US$ 4.4 billion. Since no exact data are available regarding the lifespan of boats and nets, it is complicated to sketch a picture of the costs. If the average price varied between US$ 0.60 and US$ 1.00 per kg, the total amount paid to the fishermen would vary between 3.3 and 5.5 billion dollars.
Analysis of Western Consumption of Nile Perch from Lake Victoria Page 30 of 60
30
4.3 Import and Export Data In 2003, the export of Nile perch fillets to the EU amounted to more than 45,000 tonnes, which is equivalent to approximately 112,500 tonnes of fresh weight (on average, the fillet comprises 36% to 40% of the total weight of the fresh fish). It is generally known that the Netherlands is the largest importer of Nile perch products, although this is not immediately apparent from the available statistics. This is because the fish arrive by airfreight in Belgium and from there are largely transported to the Netherlands. Once in the Netherlands, the fishery products are further processed and repackaged and then are re-exported within the EU. The export statistics for Nile perch are not sufficiently specified and must be extracted from the figures that are available for the total export of freshwater fish from the Netherlands. The following sections briefly describe the situation in each country bordering on Lake Victoria. More detailed information and data are presented in Appendix 4. 4.3.1 Kenya The import stop imposed by the EU in 1999 showed how vulnerable the export market was. Diversification of the export markets resulted in a doubling of exports to the Far East between 1999 and 2001. In addition, exports to Israel increased. Due to the higher price paid by the EU, exports to the EU again increased, but in 2002 remained significantly below the level before the import stop. 4.3.2 Tanzania Tanzania exports a range of Nile perch products, obviously including fillets, but also dried Nile perch, gills, skeletons, chips, processing remains, skins, belly flaps, Nile perch meal and oil. In 2001, total exports of Nile perch products amounted to US$ 93 million, of which the fillets comprised 83%. The total quantity of exported Nile perch products reached its peak in 1998 (46,000 tonnes) after which it declined by 45% in 1999. Total exports again increased rapidly until 2001. In 2002 the level of exports was only slightly above the level in 1999 at the time of the import stop (Fishery Department Tanzania). 4.3.3 Uganda The export value of Ugandan Nile perch increased steadily until 1996. Between 1997and 1999, the export values were affected by external factors. Following the EU import stop in 1999/2002, the export value began to increase once again. In 2001, the total value was more than US$ 78 million. 4.4 Regional Fish Trade The fish trade between Uganda and the Democratic Republic of the Congo (DRC) has existed for a number of years; certain species are traditionally exported. At the present time these species are primarily Nile perch and dagaa, which are processed in an artisanal fashion; there is virtually no export of fresh products to the DRC. Existing data from official border crossings show that 15,000 tonnes of fish (fresh weight equivalent) were transported to the DRC. However, there is probably a great deal of additional unregistered trade. During inspections by the Fishery Departments, many trucks were stopped in Uganda which were
Analysis of Western Consumption of Nile Perch from Lake Victoria Page 31 of 60
31
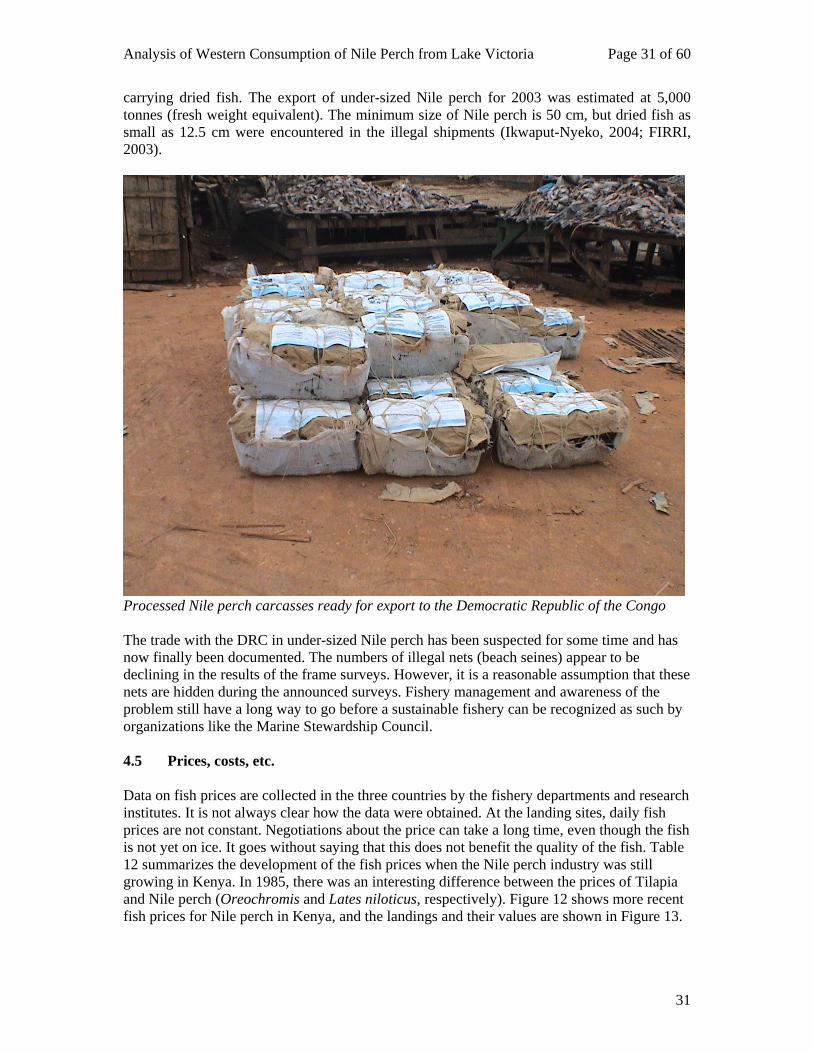
carrying dried fish. The export of under-sized Nile perch for 2003 was estimated at 5,000 tonnes (fresh weight equivalent). The minimum size of Nile perch is 50 cm, but dried fish as small as 12.5 cm were encountered in the illegal shipments (Ikwaput-Nyeko, 2004; FIRRI, 2003).
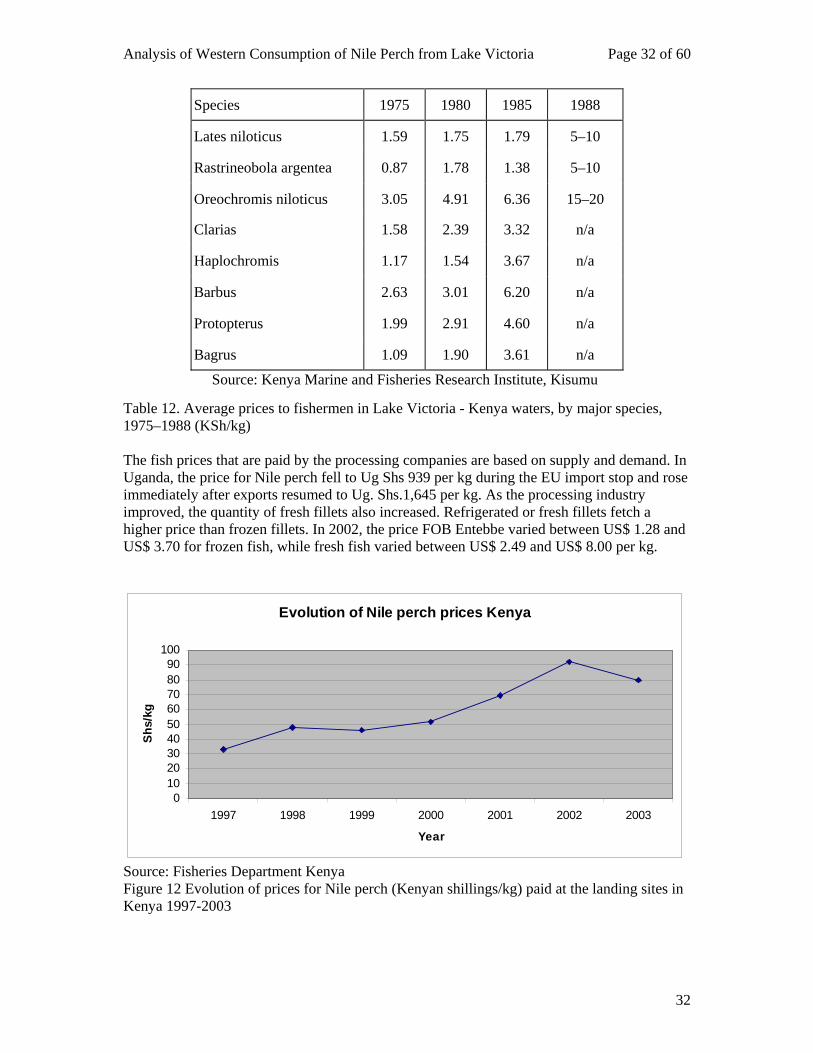
Processed Nile perch carcasses ready for export to the Democratic Republic of the Congo The trade with the DRC in under-sized Nile perch has been suspected for some time and has now finally been documented. The numbers of illegal nets (beach seines) appear to be declining in the results of the frame surveys. However, it is a reasonable assumption that these nets are hidden during the announced surveys. Fishery management and awareness of the problem still have a long way to go before a sustainable fishery can be recognized as such by organizations like the Marine Stewardship Council. 4.5 Prices, costs, etc. Data on fish prices are collected in the three countries by the fishery departments and research institutes. It is not always clear how the data were obtained. At the landing sites, daily fish prices are not constant. Negotiations about the price can take a long time, even though the fish is not yet on ice. It goes without saying that this does not benefit the quality of the fish. Table 12 summarizes the development of the fish prices when the Nile perch industry was still growing in Kenya. In 1985, there was an interesting difference between the prices of Tilapia and Nile perch (Oreochromis and Lates niloticus, respectively). Figure 12 shows more recent fish prices for Nile perch in Kenya, and the landings and their values are shown in Figure 13.
Analysis of Western Consumption of Nile Perch from Lake Victoria Page 32 of 60
32
Species 1975 1980 1985 1988
Lates niloticus 1.59 1.75 1.79 5–10
Rastrineobola argentea 0.87 1.78 1.38 5–10
Oreochromis niloticus 3.05 4.91 6.36 15–20
Clarias 1.58 2.39 3.32 n/a
Haplochromis 1.17 1.54 3.67 n/a
Barbus 2.63 3.01 6.20 n/a
Protopterus 1.99 2.91 4.60 n/a
Bagrus 1.09 1.90 3.61 n/a
Source: Kenya Marine and Fisheries Research Institute, Kisumu
Table 12. Average prices to fishermen in Lake Victoria - Kenya waters, by major species, 1975–1988 (KSh/kg) The fish prices that are paid by the processing companies are based on supply and demand. In Uganda, the price for Nile perch fell to Ug Shs 939 per kg during the EU import stop and rose immediately after exports resumed to Ug. Shs.1,645 per kg. As the processing industry improved, the quantity of fresh fillets also increased. Refrigerated or fresh fillets fetch a higher price than frozen fillets. In 2002, the price FOB Entebbe varied between US$ 1.28 and US$ 3.70 for frozen fish, while fresh fish varied between US$ 2.49 and US$ 8.00 per kg.
Evolution of Nile perch prices Kenya
0102030405060708090
100
1997 1998 1999 2000 2001 2002 2003
Year
Shs/
kg
Source: Fisheries Department Kenya Figure 12 Evolution of prices for Nile perch (Kenyan shillings/kg) paid at the landing sites in Kenya 1997-2003
Analysis of Western Consumption of Nile Perch from Lake Victoria Page 33 of 60
33
Kenyan Nile perch landings
0
20,000
40,000
60,000
80,000
100,000
120,000
140,000
1997 1998 1999 2000 2001 2002 2003
Year
mt
0
1,000,000
2,000,000
3,000,000
4,000,000
5,000,000
6,000,000
K. S
hs WeightValue
Source: Fisheries Department Kenya Figure 13 Evolution of quantity of Nile perch (tons) and its value (Kenyan shillings) at the landing sites in Kenya 4.6 Competitive position (source: Globefish, 2005) Due to the import embargo of the United States on cultured catfish from Vietnam, the import by Germany of this fish doubled in 2003 with respect to 2002 and reached the level of 2,500 tonnes. The Vietnamese catfish was offered for a relatively low price of € 2.50/kg. The comparable value for frozen Nile perch fillet would be € 3.10/kg. These figures show that it is difficult for the African product to compete on the European market. Germany has switched to direct import of fresh Nile perch fillets from Africa instead of import via Belgium or the Netherlands. In 2003, 3,800 tonnes were imported, compared to 2,200 tonnes in 1997 (before the import stop of 1999). It is especially Tanzania that benefited from the opening of the German market; this country doubled its exports to Germany to 2,000 tonnes in 2003. The consumption of Nile perch in Germany is estimated at between 40 and 60 tonnes per week. The profit margin earned by Dutch companies is significant: they charge € 6.80/kg for fresh fillets, compared to the price of € 3.80/kg for fresh fillets imported directly from Africa. It is therefore important for the African exporters to work on the quality and presentation of the fresh product, because the frozen product cannot compete with catfish from Vietnam. Spain also consumes large quantities of fresh Nile perch fillets: 3,000 tonnes in 2003. The market share of Vietnamese catfish has grown from zero in 2001 to 500 tonnes in 2003, also with a value of € 2.50/kg compared to € 3.10/kg for Nile perch. The weekly consumption in Italy is between 180 and 200 tonnes, primarily imported through the Netherlands. In 2003 Italy imported 2,000 tonnes of frozen freshwater fish, which included 600 tonnes of Nile perch fillets. Here as well, the share of Vietnamese catfish has grown rapidly since 2002. An estimated 95% of Dutch exports of non-frozen freshwater fish to Italy are Nile perch fillets. Since the resumption of exports to the EU, fish can be transported directly from Kampala and Nairobi to Italian airports. However, this method of import never really got off the ground and achieved its peak in 2002 with 1,000 tonnes
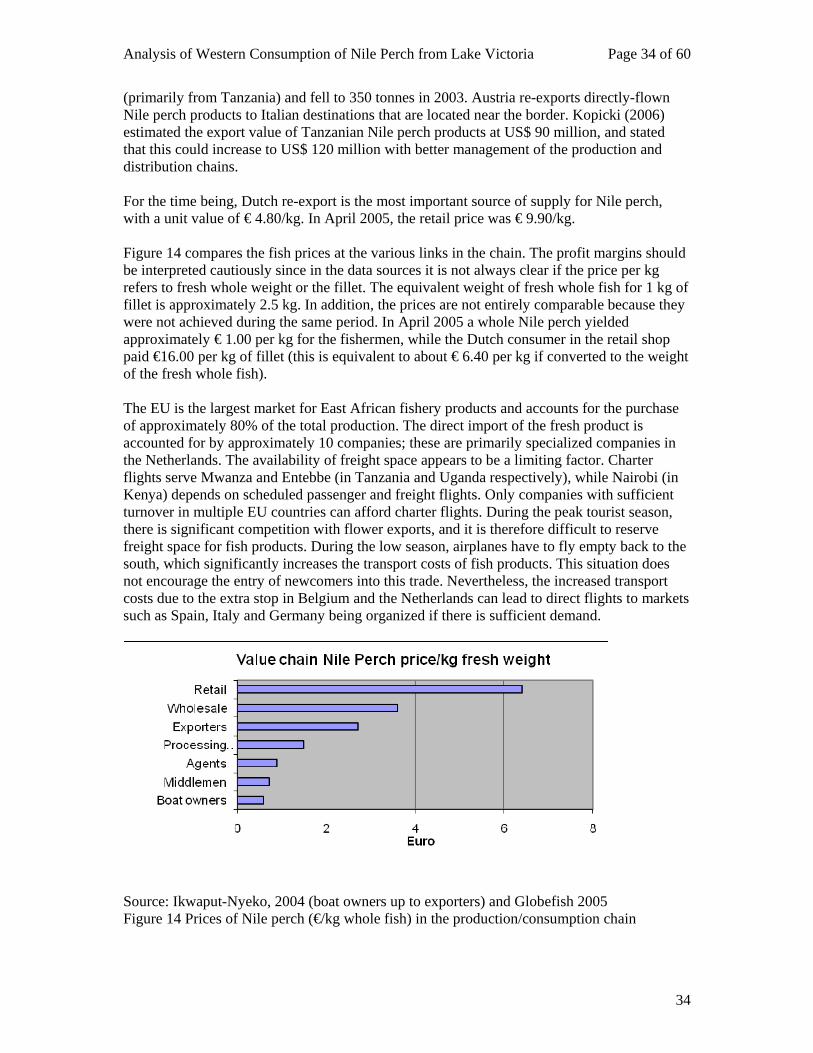
Analysis of Western Consumption of Nile Perch from Lake Victoria Page 34 of 60
34
(primarily from Tanzania) and fell to 350 tonnes in 2003. Austria re-exports directly-flown Nile perch products to Italian destinations that are located near the border. Kopicki (2006) estimated the export value of Tanzanian Nile perch products at US$ 90 million, and stated that this could increase to US$ 120 million with better management of the production and distribution chains. For the time being, Dutch re-export is the most important source of supply for Nile perch, with a unit value of € 4.80/kg. In April 2005, the retail price was € 9.90/kg. Figure 14 compares the fish prices at the various links in the chain. The profit margins should be interpreted cautiously since in the data sources it is not always clear if the price per kg refers to fresh whole weight or the fillet. The equivalent weight of fresh whole fish for 1 kg of fillet is approximately 2.5 kg. In addition, the prices are not entirely comparable because they were not achieved during the same period. In April 2005 a whole Nile perch yielded approximately € 1.00 per kg for the fishermen, while the Dutch consumer in the retail shop paid €16.00 per kg of fillet (this is equivalent to about € 6.40 per kg if converted to the weight of the fresh whole fish). The EU is the largest market for East African fishery products and accounts for the purchase of approximately 80% of the total production. The direct import of the fresh product is accounted for by approximately 10 companies; these are primarily specialized companies in the Netherlands. The availability of freight space appears to be a limiting factor. Charter flights serve Mwanza and Entebbe (in Tanzania and Uganda respectively), while Nairobi (in Kenya) depends on scheduled passenger and freight flights. Only companies with sufficient turnover in multiple EU countries can afford charter flights. During the peak tourist season, there is significant competition with flower exports, and it is therefore difficult to reserve freight space for fish products. During the low season, airplanes have to fly empty back to the south, which significantly increases the transport costs of fish products. This situation does not encourage the entry of newcomers into this trade. Nevertheless, the increased transport costs due to the extra stop in Belgium and the Netherlands can lead to direct flights to markets such as Spain, Italy and Germany being organized if there is sufficient demand.
Source: Ikwaput-Nyeko, 2004 (boat owners up to exporters) and Globefish 2005 Figure 14 Prices of Nile perch (€/kg whole fish) in the production/consumption chain
Analysis of Western Consumption of Nile Perch from Lake Victoria Page 35 of 60
35
With respect to the increasing competition from Asia, the possibility of eco-labelling should be noted as a possibility for achieving sustainable sales. Eco-labelling would also be an extra stimulus for the East African fishery authorities to actually begin managing the natural resources in a sustainable fashion. 4.7 Vulnerability to external factors During the last decade, fish exports to Europe have turned out to be vulnerable, especially when the EU imposed stricter demands regarding product hygiene and packaging. Fish exporters were expected to have their companies certified according to ISO-9000, although this requirement was not always taken seriously in East Africa. In Spain and Italy, Salmonella was encountered in 1997 in samples of Nile perch, and from that time all frozen Nile perch had to be tested for Salmonella before the fish could be marketed. In May 1997, a number of recommendations were made by the EU to achieve ISO-9000 certification of the fish processing companies, to which the industry responded positively. Due to heavy rainfall in the three East African countries and Mozambique, cholera broke out at the end of 1997. The EU inspectors once again conducted inspections and expressed their concern; they initiated an import embargo for fish from the four affected countries, which went into force on 6 January 1998. After several days, the “embargo” was relaxed and fish could be admitted to the EU following a cholera check. Like the Salmonella test, the cholera test is a simple test for microbial DNA and does not require much time to conduct. However, several EU Member States objected to this process; as a result, a more conventional method was used, which required four to five days to produce a reliable result. Such a method is feasible for frozen fish, but certainly not for fresh fish products. The import embargo on fresh fish forced the processing industry to reduce work days or entirely stop processing fish for the fresh fillet market. Fish was sold on the local markets, which resulted in fish prices falling by 50% and a sharp decline in income of the fishermen. This embargo lasted until 1 August 1998, during which the fish processing companies made large-scale investments in improved facilities. Insulated transport boats, ice on board transport boats and improved landing platforms were aimed at providing an improved product chain. In 1999, Uganda independently stopped fish exports. Nile perch could no longer be consumed locally or exported to the EU because fish were being caught that were contaminated with pesticides. Instead of using traditional fishing gear, the fish were being caught in various ways using poison. Depending on the depth, the wind direction and the current, the fish were stunned or killed by the poison and then collected for marketing. The poison also had an effect on the consumer of the fish, so the EU followed the initiative of Uganda and stopped the import of all Nile perch from Lake Victoria (i.e. from Kenya and Tanzania as well). This embargo concerned not only fresh fish, but also frozen fish, and a great deal of fish had to be destroyed. Alternative fish markets were not immediately available. The losses were significant and the fish price fell dramatically; for example in Uganda the price dropped from 1,500 to 300 Uganda Shillings per kg. The result was that boat owners kept their boats onshore, and many fishermen had no income at all. Fish processing companies reduced their activities or closed completely, thereby sending their employees on unpaid leave. Due to the high investments during the previous years it was impossible to continue to pay off the loans, and payment arrangements had to be made with the banks. At the same time, the exporters were forced to find other markets, which they did successfully; Japan, South Africa and the United States became more important markets, while new possibilities were sought in Australia and Israel. Tanzania was the first country to resume exports to the EU (in December 1999) while Kenya and Uganda followed at a later date after the Competent Authorities were clearly defined and harmonized.
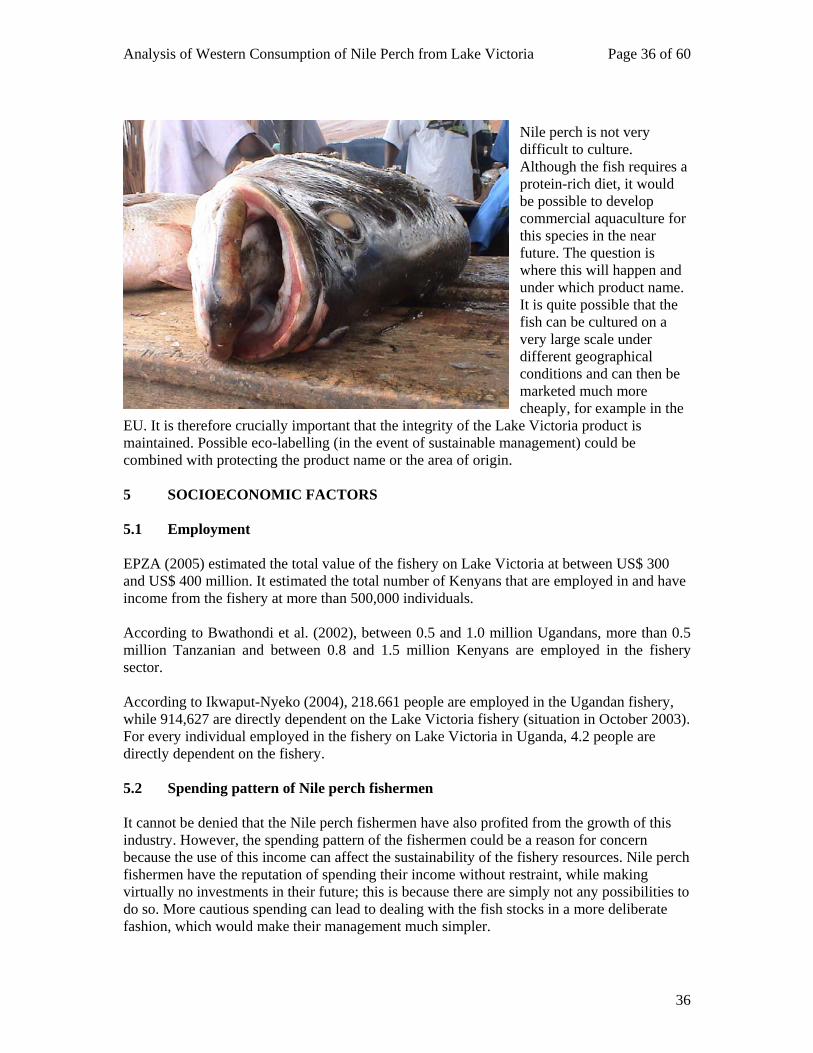
Analysis of Western Consumption of Nile Perch from Lake Victoria Page 36 of 60
36
Nile perch is not very difficult to culture. Although the fish requires a protein-rich diet, it would be possible to develop commercial aquaculture for this species in the near future. The question is where this will happen and under which product name. It is quite possible that the fish can be cultured on a very large scale under different geographical conditions and can then be marketed much more cheaply, for example in the
EU. It is therefore crucially important that the integrity of the Lake Victoria product is maintained. Possible eco-labelling (in the event of sustainable management) could be combined with protecting the product name or the area of origin. 5 SOCIOECONOMIC FACTORS 5.1 Employment EPZA (2005) estimated the total value of the fishery on Lake Victoria at between US$ 300 and US$ 400 million. It estimated the total number of Kenyans that are employed in and have income from the fishery at more than 500,000 individuals. According to Bwathondi et al. (2002), between 0.5 and 1.0 million Ugandans, more than 0.5 million Tanzanian and between 0.8 and 1.5 million Kenyans are employed in the fishery sector. According to Ikwaput-Nyeko (2004), 218.661 people are employed in the Ugandan fishery, while 914,627 are directly dependent on the Lake Victoria fishery (situation in October 2003). For every individual employed in the fishery on Lake Victoria in Uganda, 4.2 people are directly dependent on the fishery. 5.2 Spending pattern of Nile perch fishermen It cannot be denied that the Nile perch fishermen have also profited from the growth of this industry. However, the spending pattern of the fishermen could be a reason for concern because the use of this income can affect the sustainability of the fishery resources. Nile perch fishermen have the reputation of spending their income without restraint, while making virtually no investments in their future; this is because there are simply not any possibilities to do so. More cautious spending can lead to dealing with the fish stocks in a more deliberate fashion, which would make their management much simpler.
Analysis of Western Consumption of Nile Perch from Lake Victoria Page 37 of 60
37
There are cases known of crew members investing in livestock (SEDAWOG, 1999a). 5.3 Poverty and gender issues According to Reynolds and Greboval (1995), the Nile perch fishery on Lake Victoria generated a net financial profit of US$ 280 million per year between 1975 and 1989. According to the LVFO, the financial profit in 2003 was around US$ 600 million. Despite the fact that this profit is concentrated in a relatively small group of industrial fish processing companies, it can be assumed that the fishing communities have also benefited from the exploitation of the Nile perch. However, there is a concern about how the money is used by the fishermen and boat owners and how this spending affects the sustainability of the fishery resources. Various studies have shown that the boat owners and crew members enjoy relatively high incomes from the Nile perch fishery. Most boat owners do not have direct links with the fishing communities, but have joined the fishery from outside as investors. They usually have established businesses at the landing sites as well. In general, it can be stated that they have developed other income-generating activities with their income from the fishery. The poverty in the fishing communities is attributed to the reckless behaviour of fishermen and other stakeholders. This reckless behaviour could have resulted in the rapid increase in HIV/AIDS. The fishing communities generate relatively large sums of money, which attract hotels, bars, kiosks, restaurants and other service-based businesses (such as small-scale brothels). Due to a lack of savings possibilities, the income is brought immediately into circulation. When asked, all crew members stated that they want to have their own boat some day, but they do not succeed in this ambition due to their lack of savings behaviour. Consumption is thought to be more important than saving, certainly when cash is available. A well-known saying is that fishermen find it difficult to establish priorities due to their extravagance; what they earn each day is immediately spent on their family and concubines. BOX 2 A NEST EGG
The Nile perch fishery has the potential to remove fishermen from the downward spiral of poverty; however, due to the relatively low investment costs and high earnings, the fishing effort will probably continue to increase until the open access system is converted into a more regulated system with a well-conceived licence system.
In 2005, an experiment took place in Kenya involving a number of fishermen who were persuaded to save approximately 75% of their income from daily fishing. After one month, the saved capital was shown to the astonished fishermen. Some fishermen turned out to be able to save between € 500 and € 600 in one month. It goes without saying that a savings culture could emerge if reliable financial institutions could offer such services.
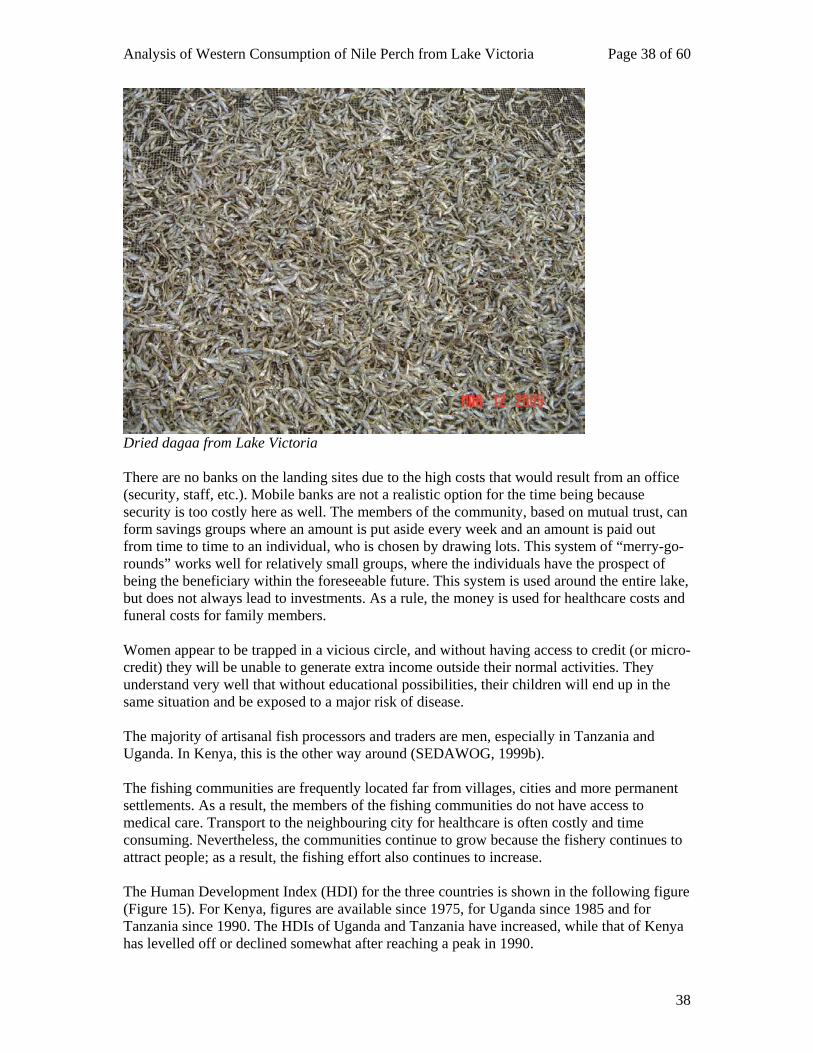
Analysis of Western Consumption of Nile Perch from Lake Victoria Page 38 of 60
38
Dried dagaa from Lake Victoria There are no banks on the landing sites due to the high costs that would result from an office (security, staff, etc.). Mobile banks are not a realistic option for the time being because security is too costly here as well. The members of the community, based on mutual trust, can form savings groups where an amount is put aside every week and an amount is paid out from time to time to an individual, who is chosen by drawing lots. This system of “merry-go-rounds” works well for relatively small groups, where the individuals have the prospect of being the beneficiary within the foreseeable future. This system is used around the entire lake, but does not always lead to investments. As a rule, the money is used for healthcare costs and funeral costs for family members. Women appear to be trapped in a vicious circle, and without having access to credit (or micro-credit) they will be unable to generate extra income outside their normal activities. They understand very well that without educational possibilities, their children will end up in the same situation and be exposed to a major risk of disease. The majority of artisanal fish processors and traders are men, especially in Tanzania and Uganda. In Kenya, this is the other way around (SEDAWOG, 1999b). The fishing communities are frequently located far from villages, cities and more permanent settlements. As a result, the members of the fishing communities do not have access to medical care. Transport to the neighbouring city for healthcare is often costly and time consuming. Nevertheless, the communities continue to grow because the fishery continues to attract people; as a result, the fishing effort also continues to increase. The Human Development Index (HDI) for the three countries is shown in the following figure (Figure 15). For Kenya, figures are available since 1975, for Uganda since 1985 and for Tanzania since 1990. The HDIs of Uganda and Tanzania have increased, while that of Kenya has levelled off or declined somewhat after reaching a peak in 1990.
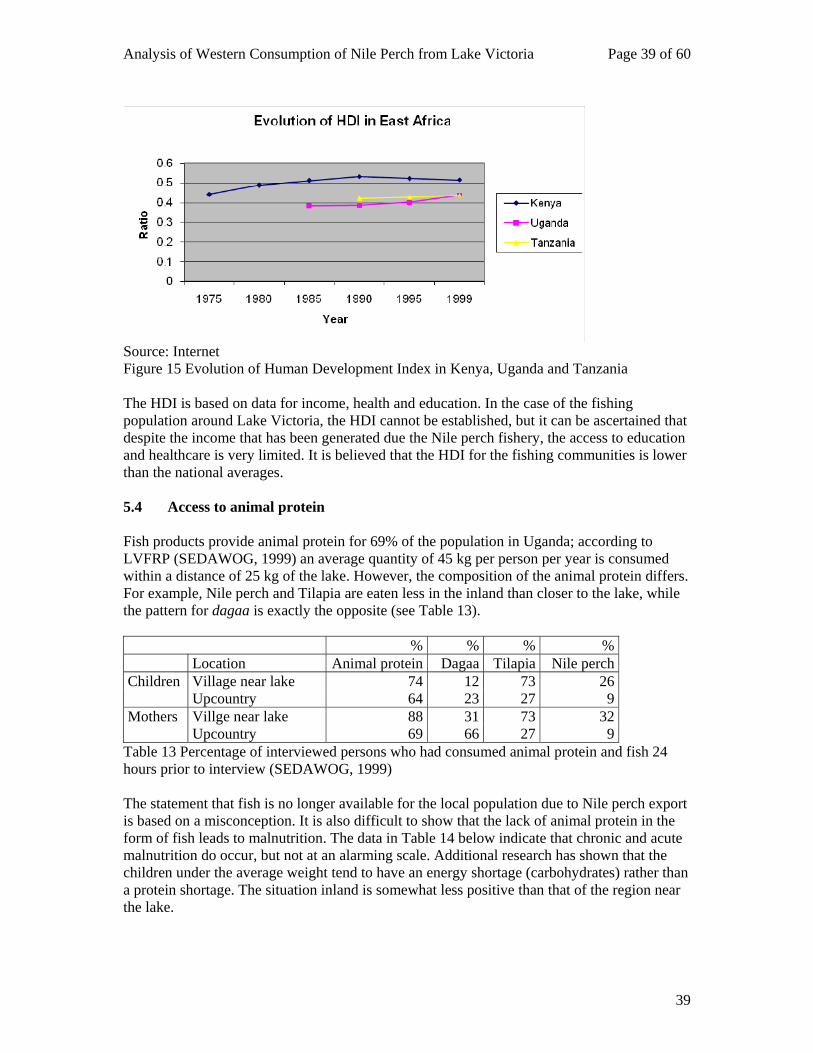
Analysis of Western Consumption of Nile Perch from Lake Victoria Page 39 of 60
39
Source: Internet Figure 15 Evolution of Human Development Index in Kenya, Uganda and Tanzania The HDI is based on data for income, health and education. In the case of the fishing population around Lake Victoria, the HDI cannot be established, but it can be ascertained that despite the income that has been generated due the Nile perch fishery, the access to education and healthcare is very limited. It is believed that the HDI for the fishing communities is lower than the national averages. 5.4 Access to animal protein Fish products provide animal protein for 69% of the population in Uganda; according to LVFRP (SEDAWOG, 1999) an average quantity of 45 kg per person per year is consumed within a distance of 25 kg of the lake. However, the composition of the animal protein differs. For example, Nile perch and Tilapia are eaten less in the inland than closer to the lake, while the pattern for dagaa is exactly the opposite (see Table 13). % % % % Location Animal protein Dagaa Tilapia Nile perch Children Village near lake 74 12 73 26 Upcountry 64 23 27 9 Mothers Villge near lake 88 31 73 32 Upcountry 69 66 27 9
Table 13 Percentage of interviewed persons who had consumed animal protein and fish 24 hours prior to interview (SEDAWOG, 1999) The statement that fish is no longer available for the local population due to Nile perch export is based on a misconception. It is also difficult to show that the lack of animal protein in the form of fish leads to malnutrition. The data in Table 14 below indicate that chronic and acute malnutrition do occur, but not at an alarming scale. Additional research has shown that the children under the average weight tend to have an energy shortage (carbohydrates) rather than a protein shortage. The situation inland is somewhat less positive than that of the region near the lake.
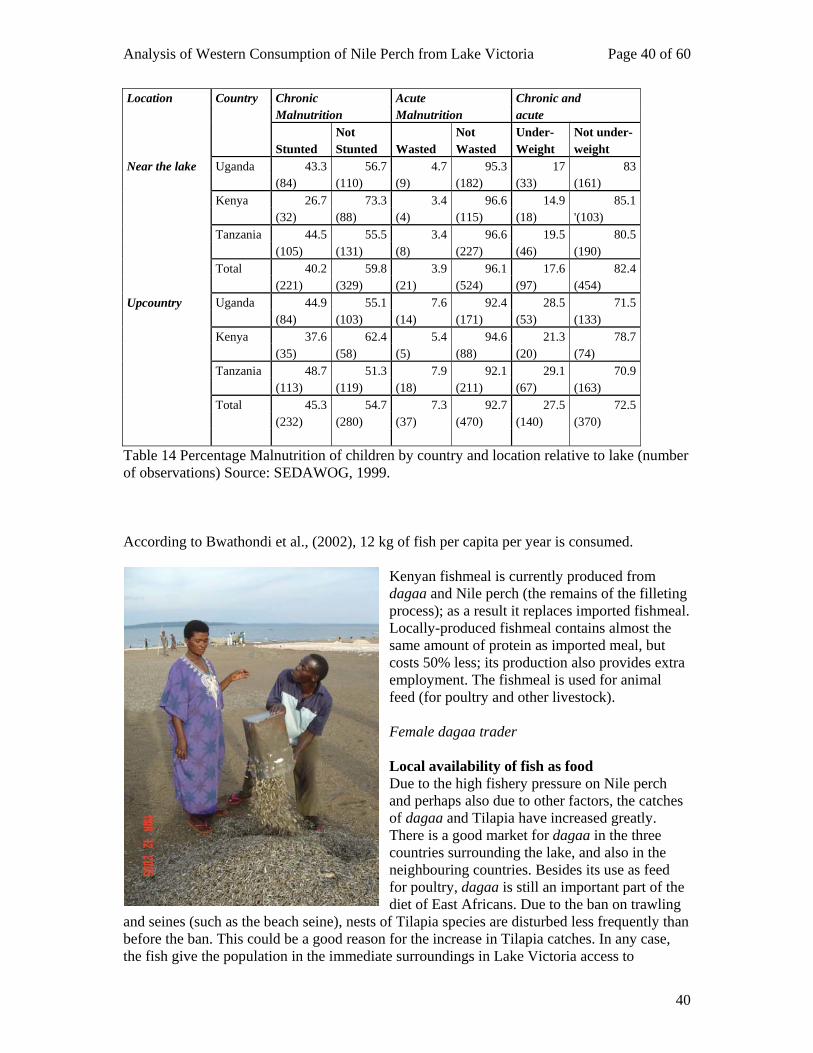
Analysis of Western Consumption of Nile Perch from Lake Victoria Page 40 of 60
40
Location Country Chronic Acute Chronic and Malnutrition Malnutrition acute Not Not Under- Not under- Stunted Stunted Wasted Wasted Weight weight Near the lake Uganda 43.3 56.7 4.7 95.3 17 83 (84) (110) (9) (182) (33) (161) Kenya 26.7 73.3 3.4 96.6 14.9 85.1 (32) (88) (4) (115) (18) '(103) Tanzania 44.5 55.5 3.4 96.6 19.5 80.5 (105) (131) (8) (227) (46) (190) Total 40.2 59.8 3.9 96.1 17.6 82.4 (221) (329) (21) (524) (97) (454) Upcountry Uganda 44.9 55.1 7.6 92.4 28.5 71.5 (84) (103) (14) (171) (53) (133) Kenya 37.6 62.4 5.4 94.6 21.3 78.7 (35) (58) (5) (88) (20) (74) Tanzania 48.7 51.3 7.9 92.1 29.1 70.9 (113) (119) (18) (211) (67) (163) Total 45.3 54.7 7.3 92.7 27.5 72.5 (232) (280) (37) (470) (140) (370) Table 14 Percentage Malnutrition of children by country and location relative to lake (number of observations) Source: SEDAWOG, 1999. According to Bwathondi et al., (2002), 12 kg of fish per capita per year is consumed.
Kenyan fishmeal is currently produced from dagaa and Nile perch (the remains of the filleting process); as a result it replaces imported fishmeal. Locally-produced fishmeal contains almost the same amount of protein as imported meal, but costs 50% less; its production also provides extra employment. The fishmeal is used for animal feed (for poultry and other livestock). Female dagaa trader Local availability of fish as food Due to the high fishery pressure on Nile perch and perhaps also due to other factors, the catches of dagaa and Tilapia have increased greatly. There is a good market for dagaa in the three countries surrounding the lake, and also in the neighbouring countries. Besides its use as feed for poultry, dagaa is still an important part of the diet of East Africans. Due to the ban on trawling
and seines (such as the beach seine), nests of Tilapia species are disturbed less frequently than before the ban. This could be a good reason for the increase in Tilapia catches. In any case, the fish give the population in the immediate surroundings in Lake Victoria access to
Analysis of Western Consumption of Nile Perch from Lake Victoria Page 41 of 60
41
affordable protein sources. It must also be noted that fresh Tilapia could be an outstanding export product if the European prices were higher. For the time being, it is cheaper for Europeans to culture Tilapia in Europe or to import cultured Tilapia (for example from China). There is a great deal of resistance in the “West” to the use of Nile perch carcasses for human consumption. In the neighbourhood of the fish processing companies in the three countries, fish remains are processed at specially-constructed locations. The carcasses are fried, dried and shipped inland, while the quality carcasses are well packed and exported to the DRC. Heads and swimming bladders are also processed. The swimming bladders are washed and dried and are sold for high kilo prices to exporters. 5.5 Health, education, etc. In 1982, the African HIV/AIDS epidemic was recognized for the first time in the fishing communities of Kasensero and Lukunyu in the Rakai District in Uganda. The degree of infection of HIV/AIDS is estimated to be significantly higher in the fishing villages in the African Great Lakes Region than in the agricultural regions (Allison, 2003).
In 2002, the Uganda Participatory Poverty Process (which is conducted in 60 communities in 12 districts) identified HIV/AIDS as the main cause of poverty in one-third of the villages studied; these villages included many fishing villages (GoU/MoFPED, 2002).
Fishing communities are described as the most vulnerable communities for HIV, although exact figures are lacking. In addition, they suffer a great deal from the impact of AIDS, but none (or very few) of the HIV/AIDS help services focus on the fishing communities (NAADS, 2003).
Susceptibility to HIV infection The risk of HIV infection can be derived from the properties of the fishing communities and the corresponding lifestyle. There are three reasons why HIV infection is so prevalent:
• The lack of attention of the government and the services sector for the problem. Despite the great importance of the fishery sector for the nutrition of the population and for export, the sector receives little in return from the government. Under pressure from the EU, much of the infrastructure at the landing sites has been improved, but little has been done to solve the problem of infrastructure and social facilities of the fishing communities. Even the larger landing sites rarely have electricity, piped drinking water or water wells, and the access roads are poorly maintained.
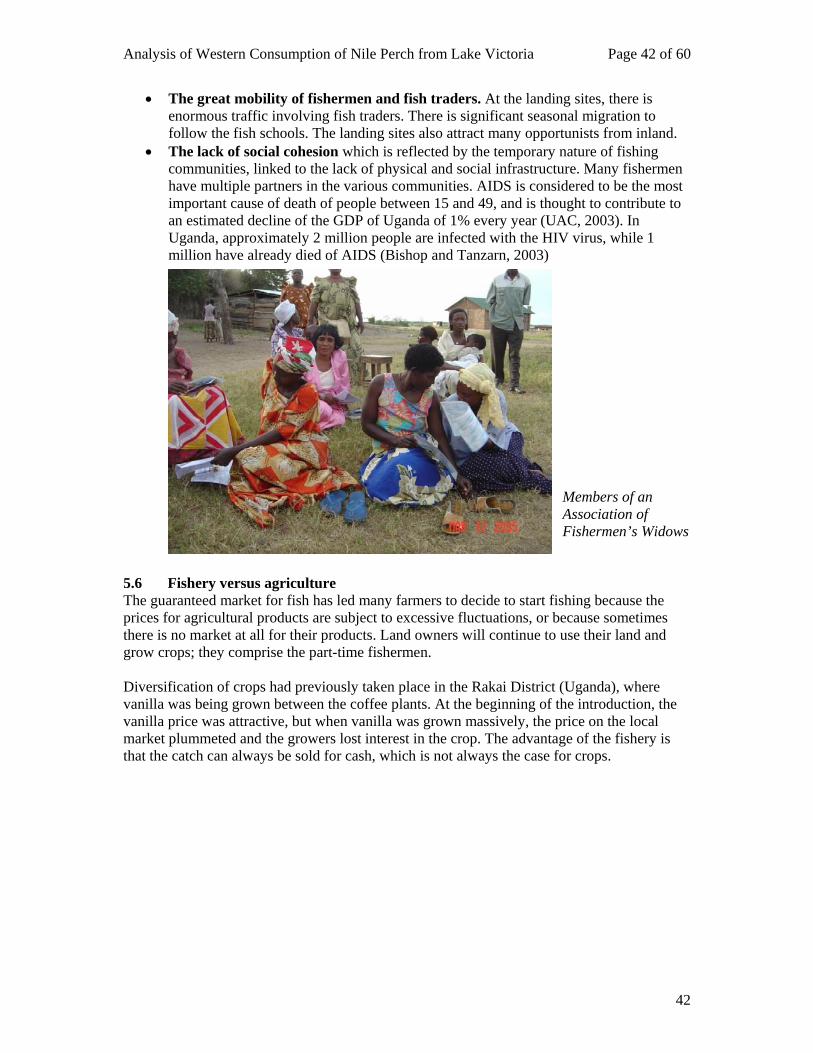
Analysis of Western Consumption of Nile Perch from Lake Victoria Page 42 of 60
42
• The great mobility of fishermen and fish traders. At the landing sites, there is enormous traffic involving fish traders. There is significant seasonal migration to follow the fish schools. The landing sites also attract many opportunists from inland.
• The lack of social cohesion which is reflected by the temporary nature of fishing communities, linked to the lack of physical and social infrastructure. Many fishermen have multiple partners in the various communities. AIDS is considered to be the most important cause of death of people between 15 and 49, and is thought to contribute to an estimated decline of the GDP of Uganda of 1% every year (UAC, 2003). In Uganda, approximately 2 million people are infected with the HIV virus, while 1 million have already died of AIDS (Bishop and Tanzarn, 2003)
Members of an
Association of Fishermen’s Widows
5.6 Fishery versus agriculture The guaranteed market for fish has led many farmers to decide to start fishing because the prices for agricultural products are subject to excessive fluctuations, or because sometimes there is no market at all for their products. Land owners will continue to use their land and grow crops; they comprise the part-time fishermen. Diversification of crops had previously taken place in the Rakai District (Uganda), where vanilla was being grown between the coffee plants. At the beginning of the introduction, the vanilla price was attractive, but when vanilla was grown massively, the price on the local market plummeted and the growers lost interest in the crop. The advantage of the fishery is that the catch can always be sold for cash, which is not always the case for crops.
Analysis of Western Consumption of Nile Perch from Lake Victoria Page 43 of 60
43
BOX 3 THE OBENGE EXPERIENCE
5.7 Longer-term continuity Since 2000, the numbers of fishermen, boats and nets have increased greatly on Lake Victoria because the licence systems do not have the aim of limiting the fishing pressure. Everyone who can purchase a licence can start fishing. If asked, crew members will tell that their dream is about owning their own boat. The creation of savings facilities must be linked with establishing a maximum number of fishing boats and nets to prevent continued over-fishing. A public education campaign will be required to convince the fishing communities to invest any money that they save in something besides the fishery. The latter applies to the young community members who, by investing in their education, could be taken out of the downward spiral of poverty to seek alternative employment and in this way strengthen their social position. 6 THE EFFECTS OF THE NILE PERCH PRODUCTION CHAIN The development of the Nile perch fishery has had enormous consequences for the aquatic resources (Nile perch stocks, biodiversity, etc.) and the socioeconomic situation of the fishermen and other participants in the chain. In addition, the changing conditions have led to policy changes. All these changes resulting from the trade in fishery products can be placed into three categories: direct, indirect and derived effects.
• The direct effects include the increased volume of Nile perch products, a strong increase in employment, improved technologies and infrastructure (processing companies) and an increase in hard currency.
Obenge is a fishing community in the Bondo District in Kenya where fishing for Nile perch has taken place for a number of years. The fishermen had a complaint and claimed that they took no responsibility for their fishing behaviour because the catches and their nets were sometimes stolen by neighbouring fishermen. Why should they invest in the costly large-meshed gillnets if these could disappear at any time? This was why they were fishing with small-meshed nets and illegal beach seines. Socioeconomic research indicated that the fishing community could be prepared to keep to the rules if the net thievery was stopped. Although the fishery research project was not intended to provide the fishermen with outboard motors, in this case an exception was made. The community had proposed to start using their large boat, which was unsuitable for fishing, as a patrol boat. However, an outboard motor then had to be installed. The research project provided the community with an outboard motor (including maintenance training beforehand), and the results were almost miraculous. Nets were no longer emptied or stolen and the fishermen took turns patrolling the fishing grounds at night. The surrounding fishermen could not compete with the fast boat and the thievery stopped. The fishermen then invested in nets with legal mesh sizes and their catches increased in weight (not necessarily in the number of fish per net but in terms of larger fish) and this attracted Nile perch buyers. With their increased income, water facilities could be improved, vegetable gardens were planted, the beach was kept clean and a new, permanent fish receiving platform was constructed. Moreover, a schoolteacher began teaching the younger children in the community. Due to increased self-confidence and independence, a small intervention changed the entire picture of the fishing community in a short time. The solution was not in the outboard motor itself, it was in the fact that the problem was acknowledged at the community level and that a solution was proposed from within the community.
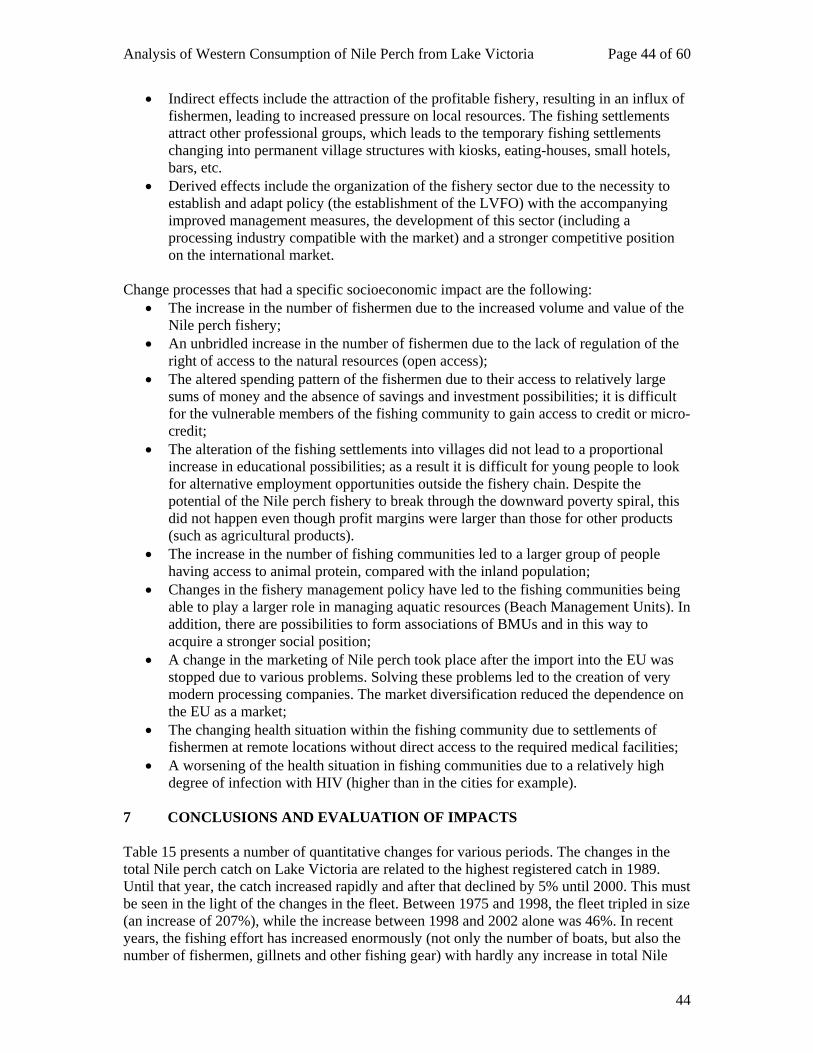
Analysis of Western Consumption of Nile Perch from Lake Victoria Page 44 of 60
44
• Indirect effects include the attraction of the profitable fishery, resulting in an influx of fishermen, leading to increased pressure on local resources. The fishing settlements attract other professional groups, which leads to the temporary fishing settlements changing into permanent village structures with kiosks, eating-houses, small hotels, bars, etc.
• Derived effects include the organization of the fishery sector due to the necessity to establish and adapt policy (the establishment of the LVFO) with the accompanying improved management measures, the development of this sector (including a processing industry compatible with the market) and a stronger competitive position on the international market.
Change processes that had a specific socioeconomic impact are the following:
• The increase in the number of fishermen due to the increased volume and value of the Nile perch fishery;
• An unbridled increase in the number of fishermen due to the lack of regulation of the right of access to the natural resources (open access);
• The altered spending pattern of the fishermen due to their access to relatively large sums of money and the absence of savings and investment possibilities; it is difficult for the vulnerable members of the fishing community to gain access to credit or micro-credit;
• The alteration of the fishing settlements into villages did not lead to a proportional increase in educational possibilities; as a result it is difficult for young people to look for alternative employment opportunities outside the fishery chain. Despite the potential of the Nile perch fishery to break through the downward poverty spiral, this did not happen even though profit margins were larger than those for other products (such as agricultural products).
• The increase in the number of fishing communities led to a larger group of people having access to animal protein, compared with the inland population;
• Changes in the fishery management policy have led to the fishing communities being able to play a larger role in managing aquatic resources (Beach Management Units). In addition, there are possibilities to form associations of BMUs and in this way to acquire a stronger social position;
• A change in the marketing of Nile perch took place after the import into the EU was stopped due to various problems. Solving these problems led to the creation of very modern processing companies. The market diversification reduced the dependence on the EU as a market;
• The changing health situation within the fishing community due to settlements of fishermen at remote locations without direct access to the required medical facilities;
• A worsening of the health situation in fishing communities due to a relatively high degree of infection with HIV (higher than in the cities for example).
7 CONCLUSIONS AND EVALUATION OF IMPACTS Table 15 presents a number of quantitative changes for various periods. The changes in the total Nile perch catch on Lake Victoria are related to the highest registered catch in 1989. Until that year, the catch increased rapidly and after that declined by 5% until 2000. This must be seen in the light of the changes in the fleet. Between 1975 and 1998, the fleet tripled in size (an increase of 207%), while the increase between 1998 and 2002 alone was 46%. In recent years, the fishing effort has increased enormously (not only the number of boats, but also the number of fishermen, gillnets and other fishing gear) with hardly any increase in total Nile
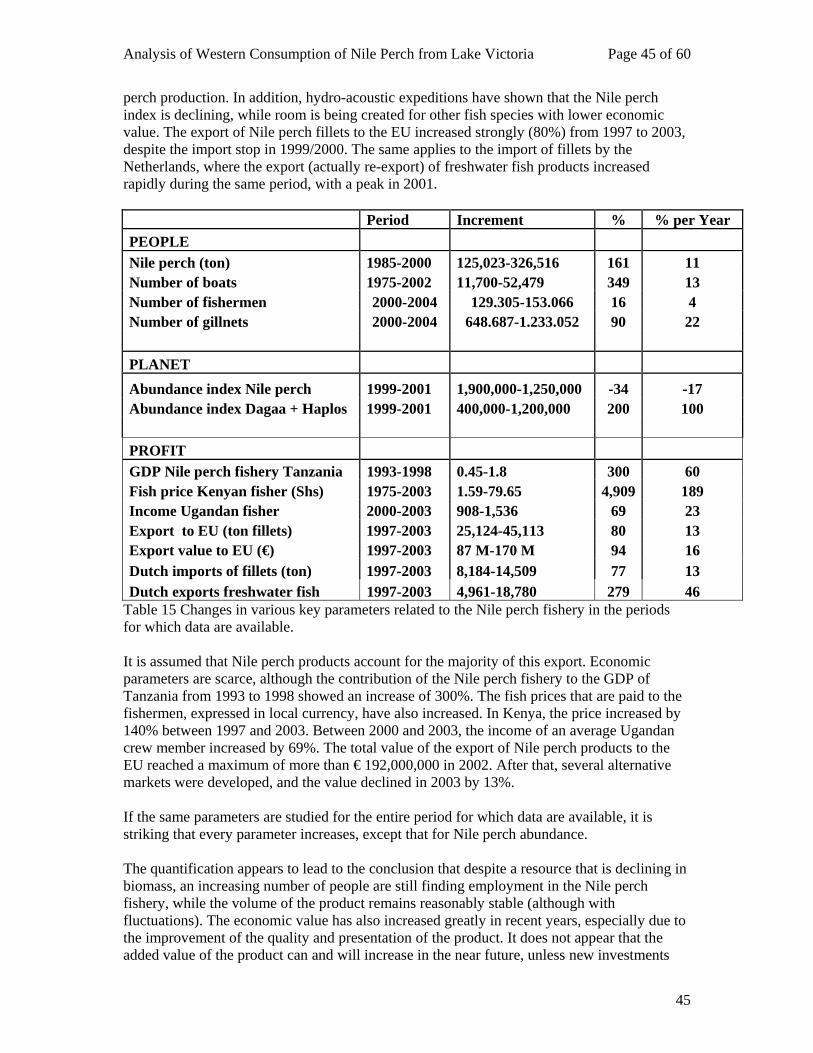
Analysis of Western Consumption of Nile Perch from Lake Victoria Page 45 of 60
45
perch production. In addition, hydro-acoustic expeditions have shown that the Nile perch index is declining, while room is being created for other fish species with lower economic value. The export of Nile perch fillets to the EU increased strongly (80%) from 1997 to 2003, despite the import stop in 1999/2000. The same applies to the import of fillets by the Netherlands, where the export (actually re-export) of freshwater fish products increased rapidly during the same period, with a peak in 2001. Period Increment % % per Year PEOPLE Nile perch (ton) 1985-2000 125,023-326,516 161 11 Number of boats 1975-2002 11,700-52,479 349 13 Number of fishermen 2000-2004 129.305-153.066 16 4 Number of gillnets 2000-2004 648.687-1.233.052 90 22 PLANET Abundance index Nile perch 1999-2001 1,900,000-1,250,000 -34 -17 Abundance index Dagaa + Haplos 1999-2001 400,000-1,200,000 200 100 PROFIT GDP Nile perch fishery Tanzania 1993-1998 0.45-1.8 300 60 Fish price Kenyan fisher (Shs) 1975-2003 1.59-79.65 4,909 189 Income Ugandan fisher 2000-2003 908-1,536 69 23 Export to EU (ton fillets) 1997-2003 25,124-45,113 80 13 Export value to EU (€) 1997-2003 87 M-170 M 94 16 Dutch imports of fillets (ton) 1997-2003 8,184-14,509 77 13 Dutch exports freshwater fish 1997-2003 4,961-18,780 279 46
Table 15 Changes in various key parameters related to the Nile perch fishery in the periods for which data are available. It is assumed that Nile perch products account for the majority of this export. Economic parameters are scarce, although the contribution of the Nile perch fishery to the GDP of Tanzania from 1993 to 1998 showed an increase of 300%. The fish prices that are paid to the fishermen, expressed in local currency, have also increased. In Kenya, the price increased by 140% between 1997 and 2003. Between 2000 and 2003, the income of an average Ugandan crew member increased by 69%. The total value of the export of Nile perch products to the EU reached a maximum of more than € 192,000,000 in 2002. After that, several alternative markets were developed, and the value declined in 2003 by 13%. If the same parameters are studied for the entire period for which data are available, it is striking that every parameter increases, except that for Nile perch abundance. The quantification appears to lead to the conclusion that despite a resource that is declining in biomass, an increasing number of people are still finding employment in the Nile perch fishery, while the volume of the product remains reasonably stable (although with fluctuations). The economic value has also increased greatly in recent years, especially due to the improvement of the quality and presentation of the product. It does not appear that the added value of the product can and will increase in the near future, unless new investments
Analysis of Western Consumption of Nile Perch from Lake Victoria Page 46 of 60
46
are made in the processing industry in East Africa – to manufacture convenience products, for example. Despite the support of the processing industry by a FAO/COMESA project, few new products have come onto the market. The Nile perch product on the European market was attractive due to its strong competitive position with respect to European fish products that cost much more to produce. With the arrival of cheaper fish products on the same market from Vietnam, the market position of Nile perch fillets could begin to erode. The market position could also be affected if the Nile perch could be cultured outside of East Africa and still marketed as a Nile perch product. If the added value of Nile perch cannot be increased much further, cost reduction is still a possibility. First of all, this could take place to the detriment of the fish prices paid to the fishermen. Secondly, costs could be reduced if the interim stop in Belgium and the Netherlands could be eliminated during the air transport from Africa to Europe. If the product was flown directly from Africa to Italy, for example, the savings could be significant (if there are sufficient market possibilities). The fishermen and other parties who are active in the production chain should not get the worst of it as part of a possible reorganization of the marketing sector. The three producing countries have already taken precautionary measures by introducing a fishery management formula by means of the BMUs. These Beach Management Units have the possibility of organizing themselves into marketing associations and in this way to achieve a stronger negotiating position with respect to the middlemen and agents. This programme is just getting started; due to in part to a NOVIB project, the first 13 BMUs in Uganda were established in cooperation with the UFFCA (Uganda Fisheries and Fish Conservation Association). Recently, the EU-financed Fisheries Management Plan Implementation Project established more than 200 additional BMUs. However, there is still a long way to go before the planned total of 1,800 BMUs around Lake Victoria become active.
Analysis of Western Consumption of Nile Perch from Lake Victoria Page 47 of 60
47
8 RECOMMENDATIONS According to Hannesson (1999), the demand for fish (as a scarce commodity) will increase in step with growing trade. The ever-increasing fishing pressure will have to be brought to a halt at some point. In addition, the fishing communities, which already have access to the fishery resources, will have to be provided with certain facilities. 8.1 Socioeconomic (People) The following recommendations are made in this area:
• To improve the conditions in the fishery communities to such an extent that the community members acquire access to training with the aim of seeking alternative forms of employment and education to strengthen their social position.
• To provide fishing communities with minimum levels of essential medical facilities. • To assist the BMUs in forming marketing associations. • To create the possibilities to allow fishing communities to place their earnings safely
in a bank account instead of spending them immediately. This also implies that credit provision would be made possible.
8.2 Natural resources (Planet) It is advisable to prevent straining the resiliency of the aquatic environment to such an extent that the Nile perch populations threaten to collapse. Continuing research and monitoring the stocks must therefore be a priority. 8.3 Economic (Profit) It is advisable to consider generating more value from the same quantity of raw materials by means of product diversification. It is also advisable to establish a distribution formula for the maximum number of fish processing companies around the lake. The overcapacity should be reduced as quickly as possible. In addition, it is advisable to calculate the GDP data for the Mara, Mwanza and Kagera regions in Tanzania to acquire a definitive answer about the impact of the Nile perch industry on fishing communities. 9 REFERENCES AND FURTHER READING Asila, A.A. and M. van der Knaap, in preparation. Catch statistics and management options for Lake Victoria fisheries, MS. Bishop-Sambrook, C. and N. Tanzarn, 2003. The susceptibility and vulnerability of small-scale fishing communities to HIV/AIDS in Uganda. Sector project funded by Policy Advice for Sustainable Fisheries, Deutsche Gesellschaft für Technische Zusammenarbeit (GTZ) GmbH and undertaken by FAO HIV/AIDS Programme, Rome Bwathondi, P.O.J., R. Ogutu-Ohwayo and J. Ogari, 2001. Lake Victoria Fisheries Research Project. Technical Document no. 16. Fisheries Management Plan. LVFRP/TECH/01/16. Cowx, I.G., M. van der Knaap and L. Muhoozi, 2003. Improving fishery catch statistics for Lake Victoria. Aquatic Ecosystem Health Management. EPZA, 2005. Export Processing Zones Authority, Kenya. Newsletter.
Analysis of Western Consumption of Nile Perch from Lake Victoria Page 48 of 60
48
FIRRI, 2003. Survey of the regional fish trade: Draft report by Socio-economic Sub-program, Fisheries Resources Research Institute, Jinja, April 2003 Globefish, 2005. FIN Newsletter, Nile perch market report, April 2005. GoU/MoFPED (2002) Uganda Participatory Poverty Assessment Process, Second Participatory Poverty Assessment Report: Deepening the Understanding of Poverty, Kampala Hannesson, H., 1999. Distribution of benefits from international trade of fish products. Proceedings of the FAO E-mail conference on Fish Trade and Food Security, 19 October-12 December 1998. Food and Agriculture Organization of the United Nations, Fish Utilization and Marketing Service, March 1999, pp 13-19. Ikiara. M., 1999. "Sustainability, Livelihoods, Production and Effort Supply in a Declining Fishery: The case of Kenya's Lake Victoria fisheries". Thela Thesis: Amsterdam. 1999. Ikwaput-Nyeko, J. 2004. Co-management and value chains: the role of the Nile perch exports in poverty eradication in Lake Victoria fishing communities. United Nations University Fisheries Training Programme, Reykjavik, Iceland. Kopicki, R., 2006. Fish Supply Chain Development in Tanzania. Mimeo. Kulindwa, K., 2002 The contribution of Lake Victoria fisheries to the Economy of Tanzania. Lake Victoria Environmental Management Programme. Regional Scientific Conference in Kisumu, Kenya from 12-16 November 2001, 27 p. Ligtvoet, W., O.C. Mkumbo, P.J. Mous and P.C. Goudswaard, 1995. Monitoring fish stocks from survey data. In: F. Witte and W.L.T. van Densen (eds) Fish stocks and Fisheries of Lake Victoria: A handbook for field observations. Samara Publishing Limited, pp. 119-134. NAADS (2003) The Impacts of HIV/AIDS on the Agricultural Sector in Uganda, Baseline survey report, Rome: FAO Integrated Programme SEDAWOG, 1999. Lake Victoria Fisheries Research Project, Socio-Economic Working Group. Technical Document no. 2. Marketing Study. LVFRP/TECH/99/02. Reynolds, J.E. and D. Greboval, 1995. Thirty years on: The development of the Nile perch fishery in Lake Victoria. In: T.J. Pitcher and P.J.B. Hart (Eds). The impact of species change in African Lakes, pp. 181-214. London, Chapman and Hall. RIVM-MNP, 2004. Kwaliteit en Toekomst. Verkenning van Duurzaamheid. Bilthoven. Van der Knaap, M., J. Ntiba and I.G. Cowx, 2002. Key Elements of Fisheries Management on Lake Victoria. Aquatic Ecosystem Health & Management, 2002. Wackernagel, M., L. Onisto, A.C. Linares, I. S. López Falfán, J. M. García, A. I. Suárez Guerrero, M. G. Suárez Guerrero, 1987. Ecological Footprints of Nations. How Much Nature Do They Use? -- How Much Nature Do They Have?
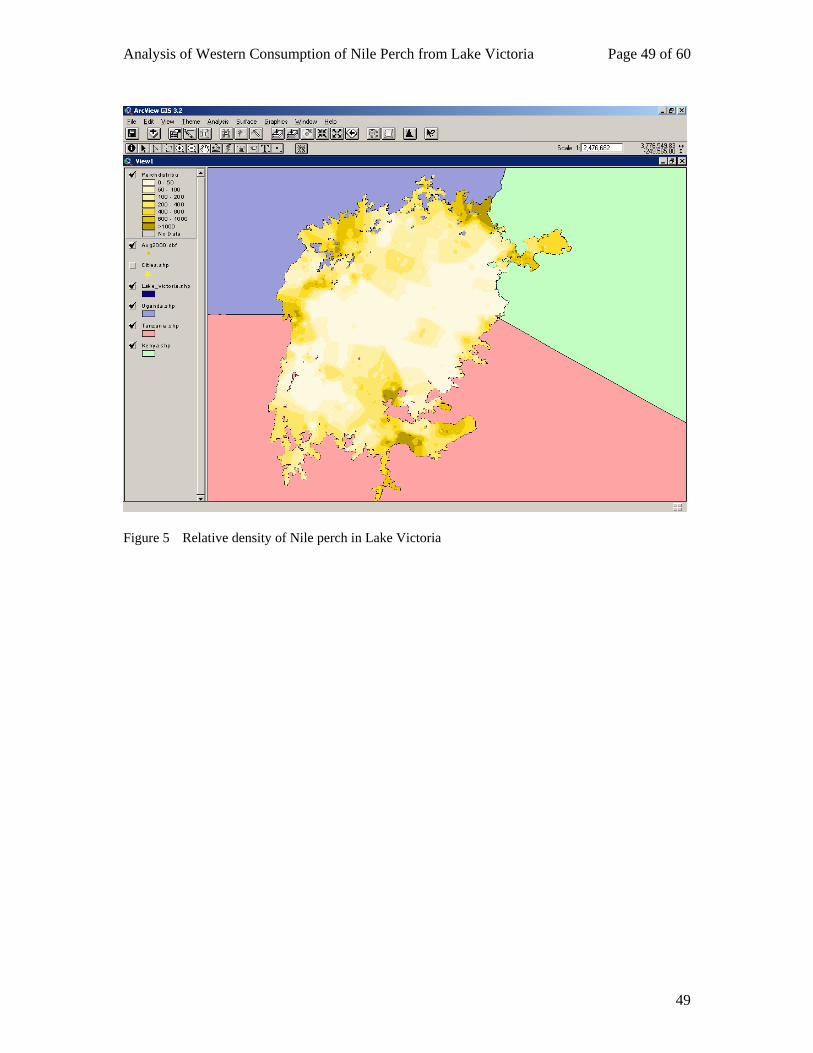
Analysis of Western Consumption of Nile Perch from Lake Victoria Page 49 of 60
49
Figure 5 Relative density of Nile perch in Lake Victoria
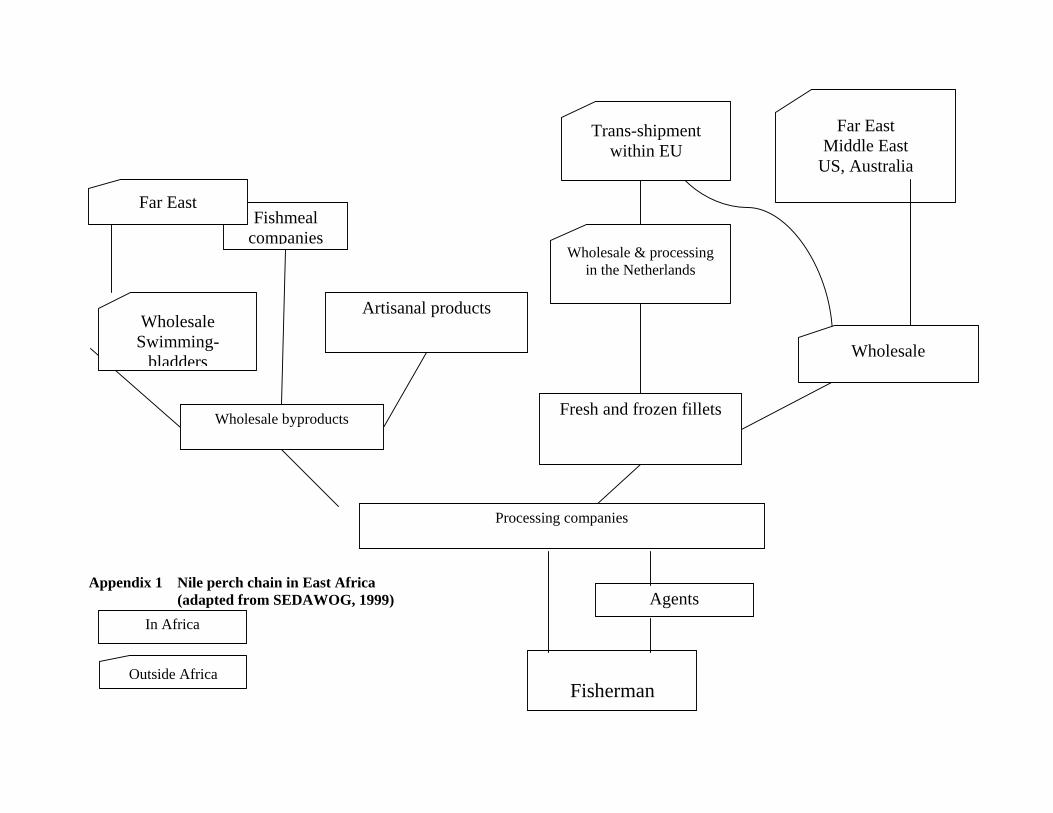
Appendix 1 Nile perch chain in East Africa
(adapted from SEDAWOG, 1999)
Wholesale & processing in the Netherlands
Artisanal products
Fishmeal companies
Wholesale byproducts Fresh and frozen fillets
Far East
Fisherman
Agents
Far East Middle East
US, Australia
Wholesale
Trans-shipment within EU
Wholesale Swimming-
bladders
Processing companies
In Africa
Outside Africa
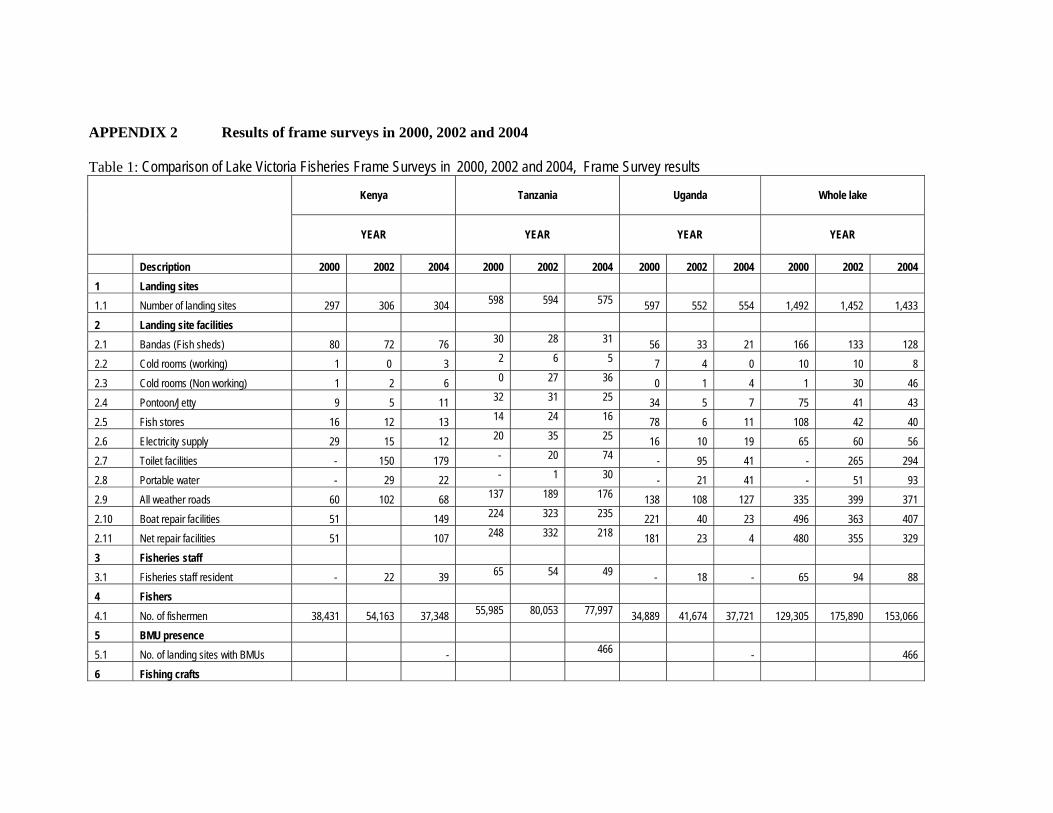
APPENDIX 2 Results of frame surveys in 2000, 2002 and 2004 Table 1: Comparison of Lake Victoria Fisheries Frame Surveys in 2000, 2002 and 2004, Frame Survey results
Kenya
Tanzania
Uganda
Whole lake
YEAR
YEAR
YEAR
YEAR
Description 2000 2002 2004 2000 2002 2004 2000 2002 2004 2000 2002 2004 1 Landing sites 1.1 Number of landing sites 297 306 304 598 594 575 597 552 554 1,492 1,452 1,433 2 Landing site facilities 2.1 Bandas (Fish sheds) 80 72 76 30 28 31 56 33 21 166 133 128 2.2 Cold rooms (working) 1 0 3 2 6 5 7 4 0 10 10 8 2.3 Cold rooms (Non working) 1 2 6 0 27 36 0 1 4 1 30 46 2.4 Pontoon/Jetty 9 5 11 32 31 25 34 5 7 75 41 43 2.5 Fish stores 16 12 13 14 24 16 78 6 11 108 42 40 2.6 Electricity supply 29 15 12 20 35 25 16 10 19 65 60 56 2.7 Toilet facilities - 150 179 - 20 74 - 95 41 - 265 294 2.8 Portable water - 29 22 - 1 30 - 21 41 - 51 93 2.9 All weather roads 60 102 68 137 189 176 138 108 127 335 399 371 2.10 Boat repair facilities 51 149 224 323 235 221 40 23 496 363 407 2.11 Net repair facilities 51 107 248 332 218 181 23 4 480 355 329 3 Fisheries staff 3.1 Fisheries staff resident - 22 39 65 54 49 - 18 - 65 94 88 4 Fishers 4.1 No. of fishermen 38,431 54,163 37,348 55,985 80,053 77,997 34,889 41,674 37,721 129,305 175,890 153,066 5 BMU presence 5.1 No. of landing sites with BMUs - 466 - 466 6 Fishing crafts
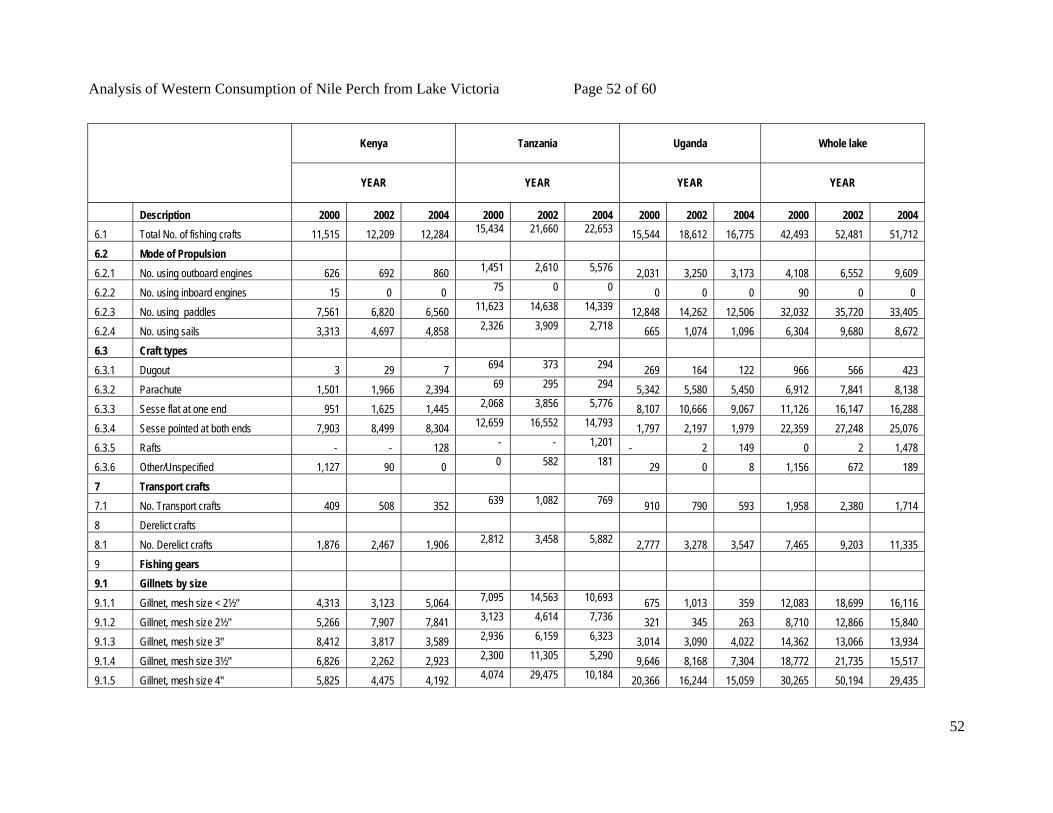
Analysis of Western Consumption of Nile Perch from Lake Victoria Page 52 of 60
52
Kenya
Tanzania
Uganda
Whole lake
YEAR
YEAR
YEAR
YEAR
Description 2000 2002 2004 2000 2002 2004 2000 2002 2004 2000 2002 2004 6.1 Total No. of fishing crafts 11,515 12,209 12,284 15,434 21,660 22,653 15,544 18,612 16,775 42,493 52,481 51,712 6.2 Mode of Propulsion 6.2.1 No. using outboard engines 626 692 860 1,451 2,610 5,576 2,031 3,250 3,173 4,108 6,552 9,609 6.2.2 No. using inboard engines 15 0 0 75 0 0 0 0 0 90 0 0 6.2.3 No. using paddles 7,561 6,820 6,560 11,623 14,638 14,339 12,848 14,262 12,506 32,032 35,720 33,405 6.2.4 No. using sails 3,313 4,697 4,858 2,326 3,909 2,718 665 1,074 1,096 6,304 9,680 8,672 6.3 Craft types 6.3.1 Dugout 3 29 7 694 373 294 269 164 122 966 566 423 6.3.2 Parachute 1,501 1,966 2,394 69 295 294 5,342 5,580 5,450 6,912 7,841 8,138 6.3.3 Sesse flat at one end 951 1,625 1,445 2,068 3,856 5,776 8,107 10,666 9,067 11,126 16,147 16,288 6.3.4 Sesse pointed at both ends 7,903 8,499 8,304 12,659 16,552 14,793 1,797 2,197 1,979 22,359 27,248 25,076 6.3.5 Rafts - - 128 - - 1,201 - 2 149 0 2 1,478 6.3.6 Other/Unspecified 1,127 90 0 0 582 181 29 0 8 1,156 672 189 7 Transport crafts 7.1 No. Transport crafts 409 508 352 639 1,082 769 910 790 593 1,958 2,380 1,714 8 Derelict crafts 8.1 No. Derelict crafts 1,876 2,467 1,906 2,812 3,458 5,882 2,777 3,278 3,547 7,465 9,203 11,335 9 Fishing gears 9.1 Gillnets by size 9.1.1 Gillnet, mesh size < 2½" 4,313 3,123 5,064 7,095 14,563 10,693 675 1,013 359 12,083 18,699 16,116 9.1.2 Gillnet, mesh size 2½" 5,266 7,907 7,841 3,123 4,614 7,736 321 345 263 8,710 12,866 15,840 9.1.3 Gillnet, mesh size 3" 8,412 3,817 3,589 2,936 6,159 6,323 3,014 3,090 4,022 14,362 13,066 13,934 9.1.4 Gillnet, mesh size 3½" 6,826 2,262 2,923 2,300 11,305 5,290 9,646 8,168 7,304 18,772 21,735 15,517 9.1.5 Gillnet, mesh size 4" 5,825 4,475 4,192 4,074 29,475 10,184 20,366 16,244 15,059 30,265 50,194 29,435
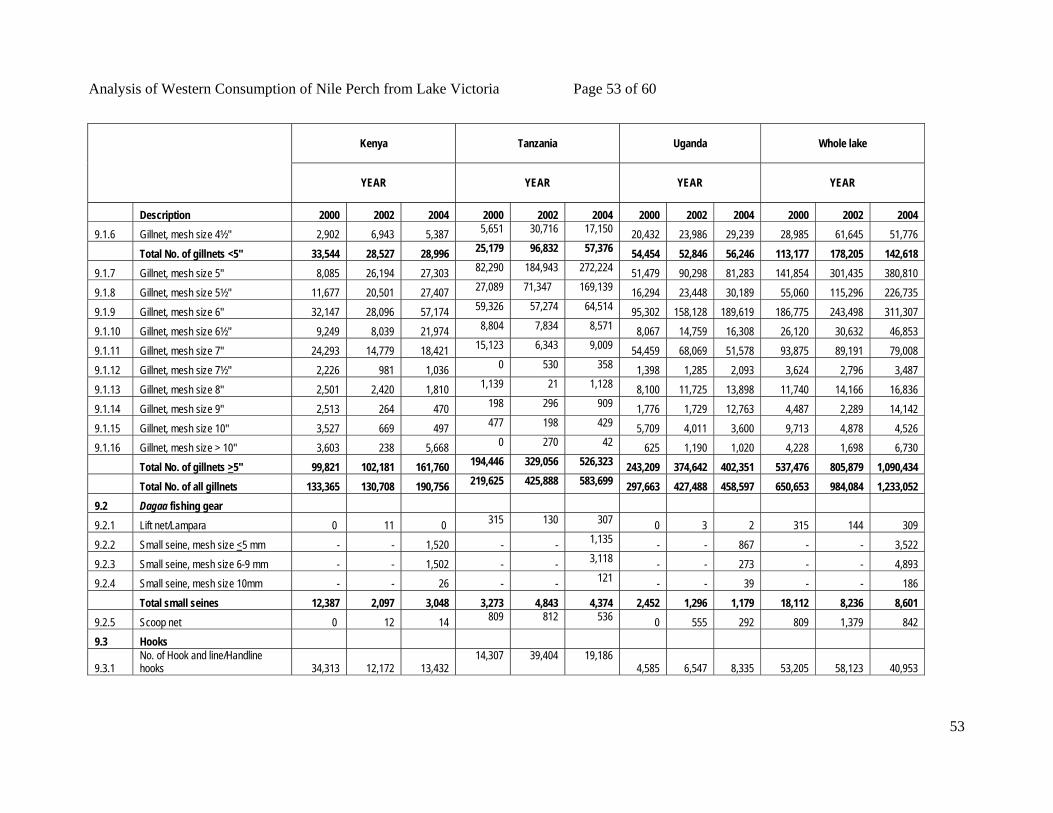
Analysis of Western Consumption of Nile Perch from Lake Victoria Page 53 of 60
53
Kenya
Tanzania
Uganda
Whole lake
YEAR
YEAR
YEAR
YEAR
Description 2000 2002 2004 2000 2002 2004 2000 2002 2004 2000 2002 2004 9.1.6 Gillnet, mesh size 4½" 2,902 6,943 5,387 5,651 30,716 17,150 20,432 23,986 29,239 28,985 61,645 51,776 Total No. of gillnets <5" 33,544 28,527 28,996 25,179 96,832 57,376 54,454 52,846 56,246 113,177 178,205 142,618 9.1.7 Gillnet, mesh size 5" 8,085 26,194 27,303 82,290 184,943 272,224 51,479 90,298 81,283 141,854 301,435 380,810 9.1.8 Gillnet, mesh size 5½" 11,677 20,501 27,407 27,089 71,347 169,139 16,294 23,448 30,189 55,060 115,296 226,735 9.1.9 Gillnet, mesh size 6" 32,147 28,096 57,174 59,326 57,274 64,514 95,302 158,128 189,619 186,775 243,498 311,307 9.1.10 Gillnet, mesh size 6½" 9,249 8,039 21,974 8,804 7,834 8,571 8,067 14,759 16,308 26,120 30,632 46,853 9.1.11 Gillnet, mesh size 7" 24,293 14,779 18,421 15,123 6,343 9,009 54,459 68,069 51,578 93,875 89,191 79,008 9.1.12 Gillnet, mesh size 7½" 2,226 981 1,036 0 530 358 1,398 1,285 2,093 3,624 2,796 3,487 9.1.13 Gillnet, mesh size 8" 2,501 2,420 1,810 1,139 21 1,128 8,100 11,725 13,898 11,740 14,166 16,836 9.1.14 Gillnet, mesh size 9" 2,513 264 470 198 296 909 1,776 1,729 12,763 4,487 2,289 14,142 9.1.15 Gillnet, mesh size 10" 3,527 669 497 477 198 429 5,709 4,011 3,600 9,713 4,878 4,526 9.1.16 Gillnet, mesh size > 10" 3,603 238 5,668 0 270 42 625 1,190 1,020 4,228 1,698 6,730 Total No. of gillnets >5" 99,821 102,181 161,760 194,446 329,056 526,323 243,209 374,642 402,351 537,476 805,879 1,090,434 Total No. of all gillnets 133,365 130,708 190,756 219,625 425,888 583,699 297,663 427,488 458,597 650,653 984,084 1,233,052 9.2 Dagaa fishing gear 9.2.1 Lift net/Lampara 0 11 0 315 130 307 0 3 2 315 144 309 9.2.2 Small seine, mesh size <5 mm - - 1,520 - - 1,135 - - 867 - - 3,522 9.2.3 Small seine, mesh size 6-9 mm - - 1,502 - - 3,118 - - 273 - - 4,893 9.2.4 Small seine, mesh size 10mm - - 26 - - 121 - - 39 - - 186 Total small seines 12,387 2,097 3,048 3,273 4,843 4,374 2,452 1,296 1,179 18,112 8,236 8,601 9.2.5 Scoop net 0 12 14 809 812 536 0 555 292 809 1,379 842 9.3 Hooks
9.3.1 No. of Hook and line/Handline hooks 34,313 12,172 13,432
14,307 39,404 19,186 4,585 6,547 8,335 53,205 58,123 40,953
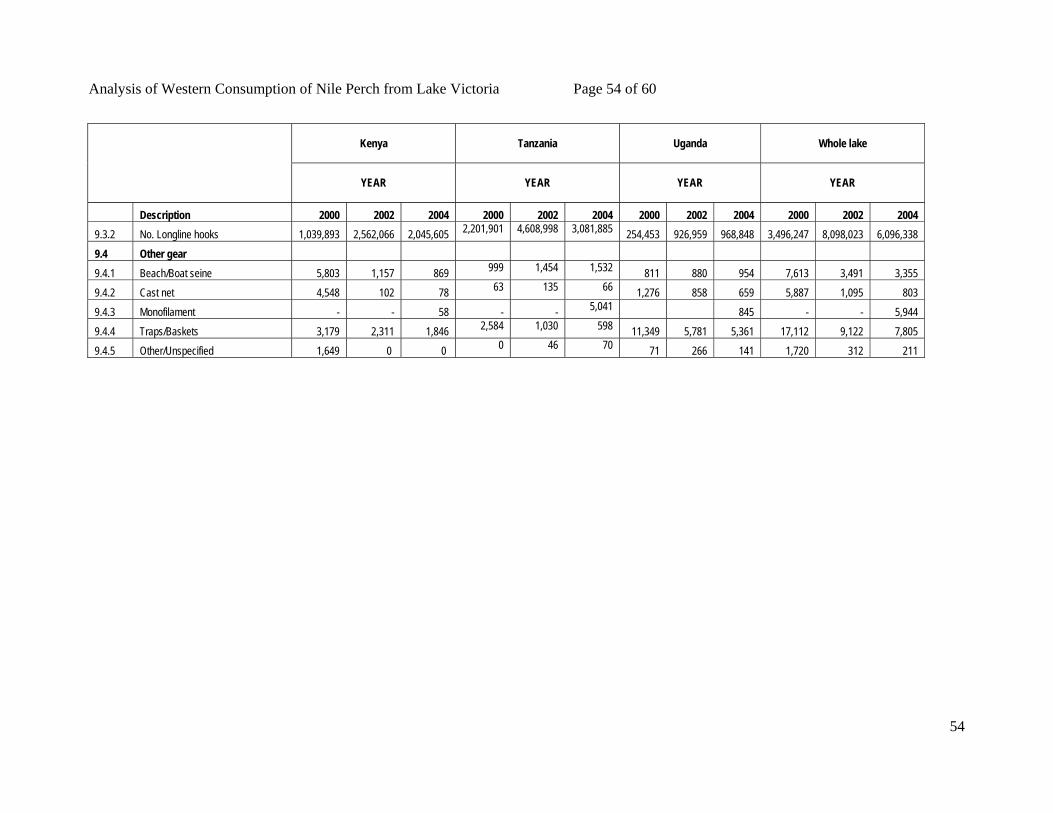
Analysis of Western Consumption of Nile Perch from Lake Victoria Page 54 of 60
54
Kenya
Tanzania
Uganda
Whole lake
YEAR
YEAR
YEAR
YEAR
Description 2000 2002 2004 2000 2002 2004 2000 2002 2004 2000 2002 2004 9.3.2 No. Longline hooks 1,039,893 2,562,066 2,045,605 2,201,901 4,608,998 3,081,885 254,453 926,959 968,848 3,496,247 8,098,023 6,096,338 9.4 Other gear 9.4.1 Beach/Boat seine 5,803 1,157 869 999 1,454 1,532 811 880 954 7,613 3,491 3,355 9.4.2 Cast net 4,548 102 78 63 135 66 1,276 858 659 5,887 1,095 803 9.4.3 Monofilament - - 58 - - 5,041 845 - - 5,944 9.4.4 Traps/Baskets 3,179 2,311 1,846 2,584 1,030 598 11,349 5,781 5,361 17,112 9,122 7,805 9.4.5 Other/Unspecified 1,649 0 0 0 46 70 71 266 141 1,720 312 211
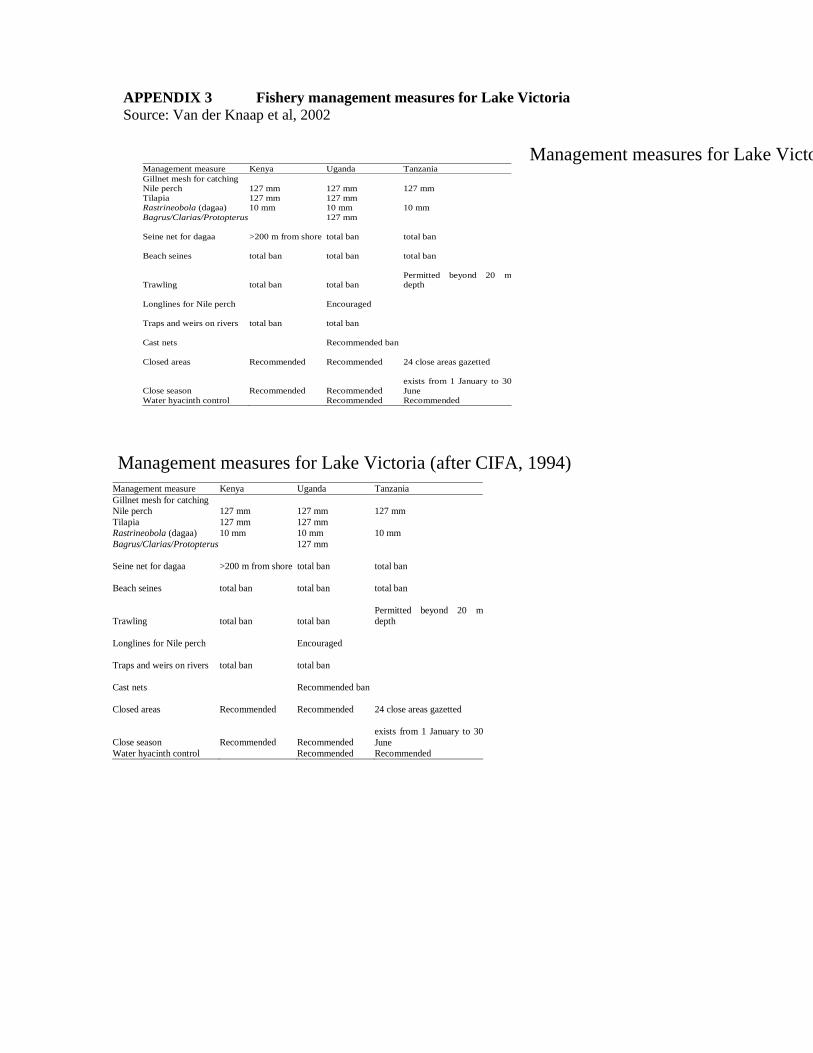
APPENDIX 3 Fishery management measures for Lake Victoria Source: Van der Knaap et al, 2002
Management measures for Lake Victo
Management measures for Lake Victoria (after CIFA, 1994) Management measure Kenya Uganda Tanzania Gillnet mesh for catching Nile perch 127 mm 127 mm 127 mm Tilapia 127 mm 127 mm Rastrineobola (dagaa) 10 mm 10 mm 10 mm Bagrus/Clarias/Protopterus 127 mm Seine net for dagaa >200 m from shore total ban total ban Beach seines total ban total ban total ban
Trawling total ban total ban Permitted beyond 20 m depth
Longlines for Nile perch Encouraged Traps and weirs on rivers total ban total ban Cast nets Recommended ban Closed areas Recommended Recommended 24 close areas gazetted
Close season Recommended Recommended exists from 1 January to 30 June
Water hyacinth control Recommended Recommended
Management measure Kenya Uganda Tanzania Gillnet mesh for catching Nile perch 127 mm 127 mm 127 mm Tilapia 127 mm 127 mm Rastrineobola (dagaa) 10 mm 10 mm 10 mm Bagrus/Clarias/Protopterus 127 mm Seine net for dagaa >200 m from shore total ban total ban Beach seines total ban total ban total ban
Trawling total ban total ban Permitted beyond 20 m depth
Longlines for Nile perch Encouraged Traps and weirs on rivers total ban total ban Cast nets Recommended ban Closed areas Recommended Recommended 24 close areas gazetted
Close season Recommended Recommended exists from 1 January to 30 June
Water hyacinth control Recommended Recommended
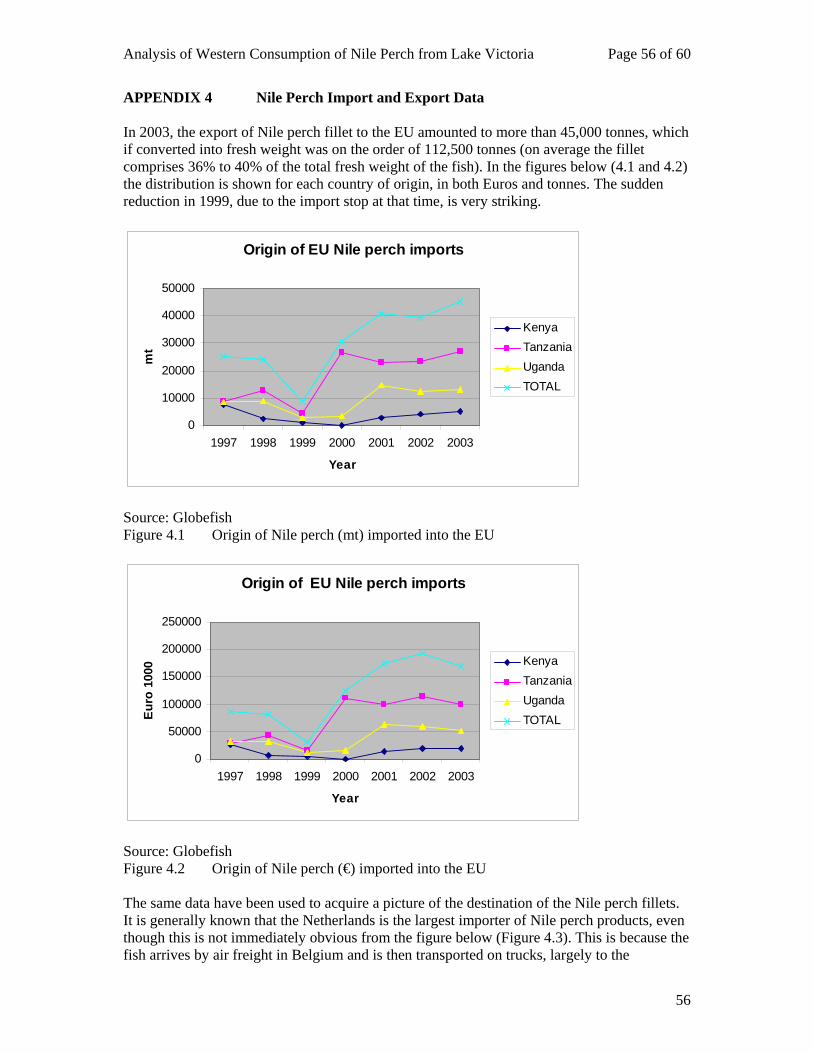
Analysis of Western Consumption of Nile Perch from Lake Victoria Page 56 of 60
56
APPENDIX 4 Nile Perch Import and Export Data In 2003, the export of Nile perch fillet to the EU amounted to more than 45,000 tonnes, which if converted into fresh weight was on the order of 112,500 tonnes (on average the fillet comprises 36% to 40% of the total fresh weight of the fish). In the figures below (4.1 and 4.2) the distribution is shown for each country of origin, in both Euros and tonnes. The sudden reduction in 1999, due to the import stop at that time, is very striking.
Origin of EU Nile perch imports
0
10000
20000
30000
40000
50000
1997 1998 1999 2000 2001 2002 2003
Year
mt
KenyaTanzaniaUgandaTOTAL
Source: Globefish Figure 4.1 Origin of Nile perch (mt) imported into the EU
Origin of EU Nile perch imports
0
50000
100000
150000
200000
250000
1997 1998 1999 2000 2001 2002 2003
Year
Eur
o 10
00
KenyaTanzaniaUgandaTOTAL
Source: Globefish Figure 4.2 Origin of Nile perch (€) imported into the EU The same data have been used to acquire a picture of the destination of the Nile perch fillets. It is generally known that the Netherlands is the largest importer of Nile perch products, even though this is not immediately obvious from the figure below (Figure 4.3). This is because the fish arrives by air freight in Belgium and is then transported on trucks, largely to the
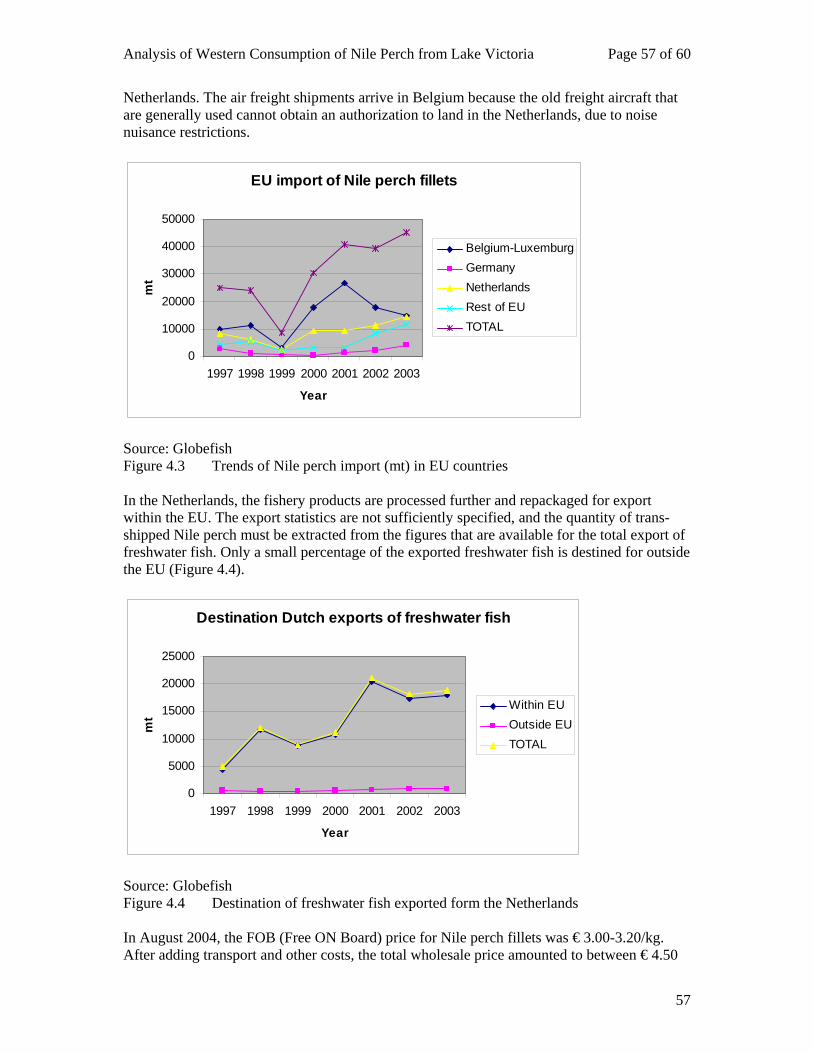
Analysis of Western Consumption of Nile Perch from Lake Victoria Page 57 of 60
57
Netherlands. The air freight shipments arrive in Belgium because the old freight aircraft that are generally used cannot obtain an authorization to land in the Netherlands, due to noise nuisance restrictions.
EU import of Nile perch fillets
0
10000
20000
30000
40000
50000
1997 1998 1999 2000 2001 2002 2003
Year
mt
Belgium-LuxemburgGermanyNetherlandsRest of EUTOTAL
Source: Globefish Figure 4.3 Trends of Nile perch import (mt) in EU countries In the Netherlands, the fishery products are processed further and repackaged for export within the EU. The export statistics are not sufficiently specified, and the quantity of trans-shipped Nile perch must be extracted from the figures that are available for the total export of freshwater fish. Only a small percentage of the exported freshwater fish is destined for outside the EU (Figure 4.4).
Destination Dutch exports of freshwater fish
0
5000
10000
15000
20000
25000
1997 1998 1999 2000 2001 2002 2003
Year
mt
Within EUOutside EUTOTAL
Source: Globefish Figure 4.4 Destination of freshwater fish exported form the Netherlands In August 2004, the FOB (Free ON Board) price for Nile perch fillets was € 3.00-3.20/kg. After adding transport and other costs, the total wholesale price amounted to between € 4.50
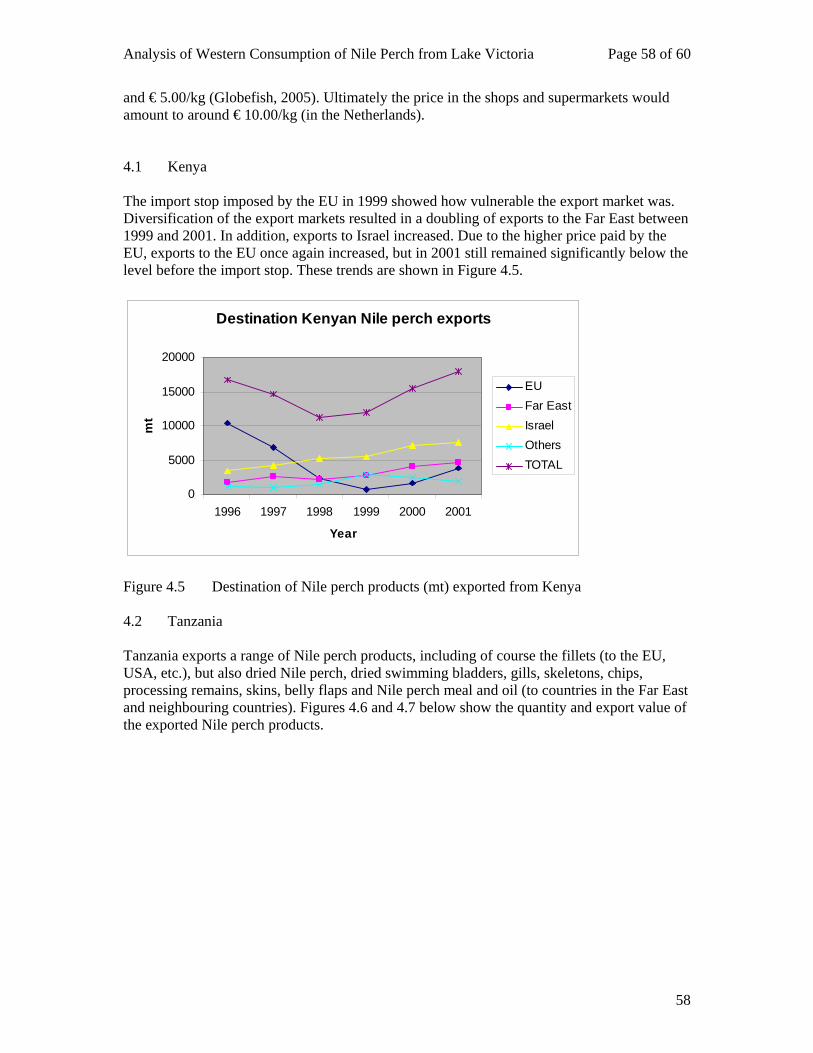
Analysis of Western Consumption of Nile Perch from Lake Victoria Page 58 of 60
58
and € 5.00/kg (Globefish, 2005). Ultimately the price in the shops and supermarkets would amount to around € 10.00/kg (in the Netherlands). 4.1 Kenya The import stop imposed by the EU in 1999 showed how vulnerable the export market was. Diversification of the export markets resulted in a doubling of exports to the Far East between 1999 and 2001. In addition, exports to Israel increased. Due to the higher price paid by the EU, exports to the EU once again increased, but in 2001 still remained significantly below the level before the import stop. These trends are shown in Figure 4.5.
Destination Kenyan Nile perch exports
0
5000
10000
15000
20000
1996 1997 1998 1999 2000 2001
Year
mt
EUFar EastIsraelOthersTOTAL
Figure 4.5 Destination of Nile perch products (mt) exported from Kenya 4.2 Tanzania Tanzania exports a range of Nile perch products, including of course the fillets (to the EU, USA, etc.), but also dried Nile perch, dried swimming bladders, gills, skeletons, chips, processing remains, skins, belly flaps and Nile perch meal and oil (to countries in the Far East and neighbouring countries). Figures 4.6 and 4.7 below show the quantity and export value of the exported Nile perch products.
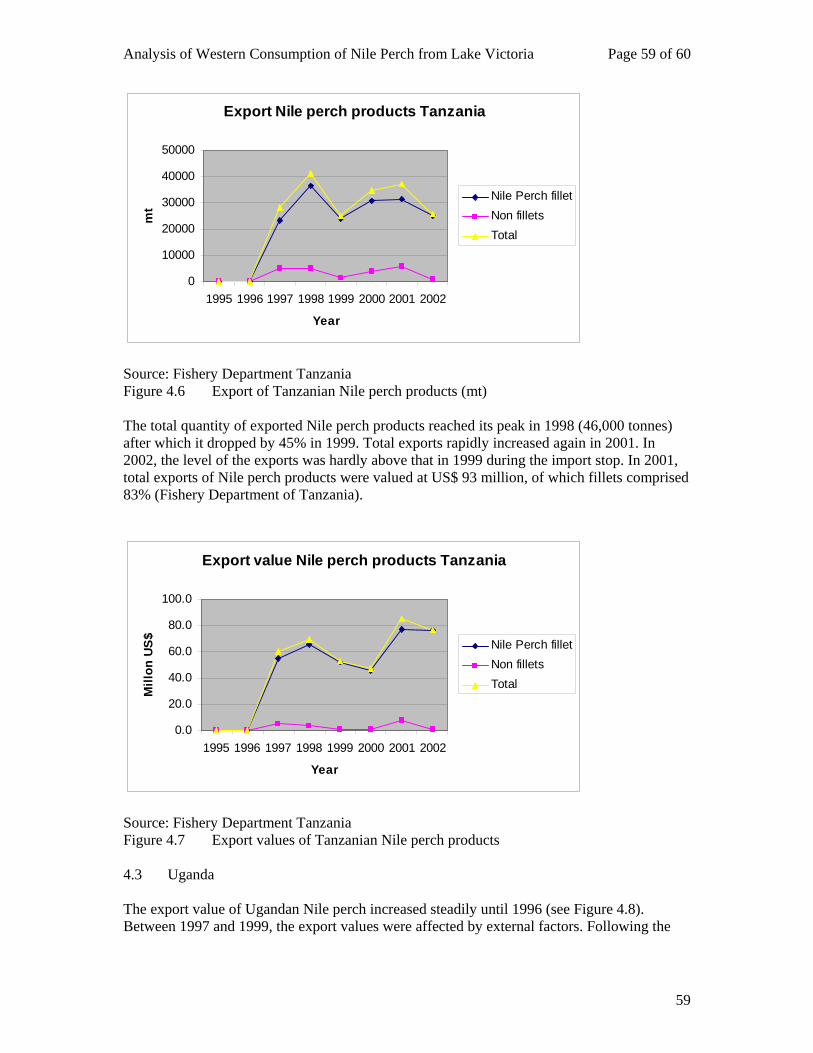
Analysis of Western Consumption of Nile Perch from Lake Victoria Page 59 of 60
59
Export Nile perch products Tanzania
0
10000
20000
30000
40000
50000
1995 1996 1997 1998 1999 2000 2001 2002
Year
mt
Nile Perch filletNon filletsTotal
Source: Fishery Department Tanzania Figure 4.6 Export of Tanzanian Nile perch products (mt) The total quantity of exported Nile perch products reached its peak in 1998 (46,000 tonnes) after which it dropped by 45% in 1999. Total exports rapidly increased again in 2001. In 2002, the level of the exports was hardly above that in 1999 during the import stop. In 2001, total exports of Nile perch products were valued at US$ 93 million, of which fillets comprised 83% (Fishery Department of Tanzania).
Export value Nile perch products Tanzania
0.0
20.0
40.0
60.0
80.0
100.0
1995 1996 1997 1998 1999 2000 2001 2002
Year
Mill
on U
S$
Nile Perch filletNon filletsTotal
Source: Fishery Department Tanzania Figure 4.7 Export values of Tanzanian Nile perch products 4.3 Uganda The export value of Ugandan Nile perch increased steadily until 1996 (see Figure 4.8). Between 1997 and 1999, the export values were affected by external factors. Following the
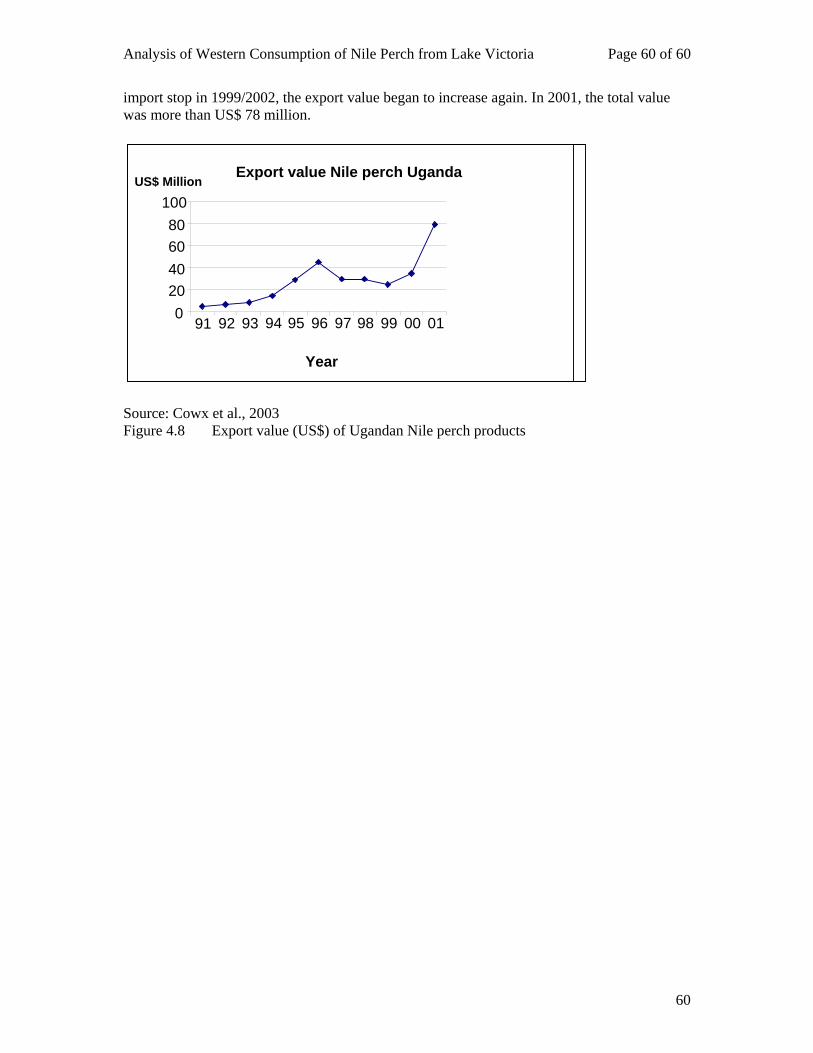
Analysis of Western Consumption of Nile Perch from Lake Victoria Page 60 of 60
60
import stop in 1999/2002, the export value began to increase again. In 2001, the total value was more than US$ 78 million.
Source: Cowx et al., 2003 Figure 4.8 Export value (US$) of Ugandan Nile perch products
Export value Nile perch Uganda
020406080
100
91 92 93 94 95 96 97 98 99 00 01
Year
US$ Million
Related Documents


