An Analysis of the Economic Development Opportunities Associated with the Green Economy in Newfoundland & Labrador FINAL REPORT September 2011 in partnership with

Welcome message from author
This document is posted to help you gain knowledge. Please leave a comment to let me know what you think about it! Share it to your friends and learn new things together.
Transcript
An Analysis of the Economic Development Opportunities Associated
with the Green Economy in Newfoundland & Labrador
FINAL REPORT
September 2011
in partnership with
1
An Analysis of the Economic Development Opportunities Associated with the Green Economy in NL
GLOBE Advisors, a subsidiary of the Vancouver-based not-for-profit GLOBE Foundation, was
established in 2005 in response to an increasing demand for project-based consulting services in the environmental business sector.
Our vast networks and extensive experience in the areas of international project management and consulting, partnership development, and market research makes us well-positioned to undertake a number of endeavours to further the business of the environment.
For more information on GLOBE Advisors, please visit our website at:
www.globeadvisors.ca
For more information on this study, please contact:
Paul Shorthouse GLOBE Advisors World Trade Centre 578 – 999 Canada Place Vancouver, BC Canada V6C 3E1
Tel: 604.695.5001 Fax: 604.695.5019 Email: [email protected]
2
An Analysis of the Economic Development Opportunities Associated with the Green Economy in NL
This document has been prepared for the
Government of Newfoundland & Labrador
Department of Innovation, Trade & Rural Development & the
Office of Climate Change, Energy Efficiency & Emissions Trading
by
in partnership with

3
An Analysis of the Economic Development Opportunities Associated with the Green Economy in NL
This page blank in original document.
i
An Analysis of the Economic Development Opportunities Associated with the Green Economy in NL
Executive Summary
Greening the economy is a concept that is gaining considerable public interest and political attention
around the globe as business and government leaders seek new opportunities in a carbon- and resource-
constrained world. Many factors are driving the global shift toward a greener economy, most notably the
need to address the impacts of climate change and reduce greenhouse gas (GHG) emissions, to better
manage scarce resources, to weather fluctuations in commodity, fuel, and food prices, and to generate
new economic and employment opportunities.
With this in mind, the Department of Innovation, Trade, and Rural Development and the Office of Climate
Change, Energy Efficiency, and Emissions Trading within the Government of Newfoundland and
Labrador (NL) engaged GLOBE Advisors, in partnership with AMEC Earth & Environmental in St. John’s,
to carry out a study to identify the economic development, trade, and employment opportunities
associated with greening the economy in NL.
About this Study
This report provides a comprehensive analysis of the current and potential future green economy
opportunities in NL and is based on a review of global developments and outlooks for key green sectors,
an analysis of current green activities in the Province of NL, and consultations with more than 75
stakeholders from various organizations across the province (i.e., businesses, governments, NGOs,
industry associations, and academia).
The report also considers current labour market trends in NL, as well as labour demand and supply
related to the province’s green economy, including a review of relevant post-secondary education and
training programs in the province.
For the purposes of this report, the “green economy” is defined as “an economic development model that
focuses on the promotion of sustainable economic growth, and the prevention of environmental pollution,
global warming, resource depletion, and ecological degradation.” In short, the green economy
encompasses activities, products, or systems that reduce non-renewable energy and raw materials
consumption and reduce or eliminate harmful emissions / discharges and their impact on the
environment.
The Green Economy in NL
In 2010, the green economy in NL was estimated to employ approximately 10,300 people1 in 1,100
private sector and public sector organizations2, not including employees of governments engaged in
green economy activities for which reliable employment data were unavailable.
The green economy in NL, as defined in this study, comprises nine key sectors that are responsible for
supplying the bulk of the green products and services in the province. These nine sectors are described
below.
1 Equal to 4.0 percent of the NL labour force, based on the March 2011 labour force estimate of 252,100, published by the
Government of NL (see: http://www.economics.gov.nl.ca/EB-labour.asp) 2 Logging, commercial fishing, fish and food processing, and some elements of the transportation sector were excluded at the
request of the Government of NL.
ii
An Analysis of the Economic Development Opportunities Associated with the Green Economy in NL
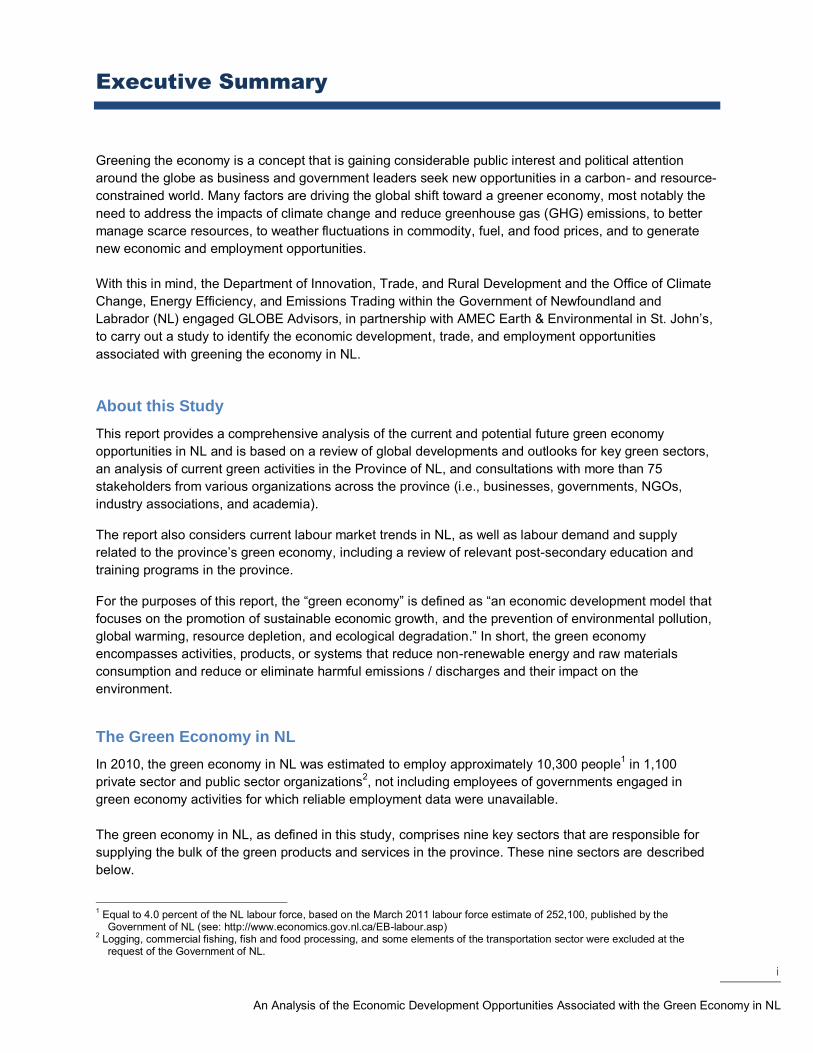
Sustainable Resource
Management includes
agriculture, aquaculture, and
forestry. Agriculture accounts
for two-thirds of the
employment in this sector.
Green Energy Supply is
energy derived from renewable
sources. In NL, hydro power
dominates this sector. Wood
pellets and other forms of bio-
energy, along with wind, geo-
exchange systems, and solar
systems, account for 5 percent
of employment in this sector.
Green Building includes the
design and construction of
buildings and all associated
systems and components
required.
Green Transportation is focused on GHG emissions reduction and includes all forms of energy-efficient
transportation and transportation systems for the movement of goods and people.
Environmental Protection includes the measurement, control, and reduction of toxic discharges and
their impacts on the environment.
Waste Management and Recycling includes the collection, sorting, processing, and distribution of
recyclable materials up to, but not including, manufacturing of recycled products or green products with
recycled content.
Sustainable Tourism is tourism that “results in a net benefit for the social, economic, natural, and
cultural environments of the area in which it takes place”. Sustainable Tourism encompasses low-impact
transportation, the stewardship of parks and protected areas, environmentally-friendly lodging facilities,
and a broad range of community and locally-based activities that generate sustainable economic benefits
from tourism.
Energy Efficiency and Conservation involves the deployment of energy use reduction technologies.
Green Knowledge and Support crosses all other sectors of the green economy. It includes the human
resources and skills required for the generation and commercialization of green economy innovations,
together with the necessary education and skills training and information communications technologies.
The sector also includes public sector programs and services (including regulation) relating to all areas of
the green economy and in particular, to environmental protection, waste management, recycling, energy
supply, and resource management (although job counts in this sector are not included in the employment
estimates in this report).
Sustainable Resource
Management
24%
Green Energy Supply
19%
Green Building 16%
Environmental Protection
13%
Sustainable Tourism
11%
Waste Management & Recycling
9%
Green Knowledge & Support
4%
Energy Efficiency & Conservation
2%
Green Transport 2%
NL Green Economy Jobs by Sector in 2010
iii
An Analysis of the Economic Development Opportunities Associated with the Green Economy in NL
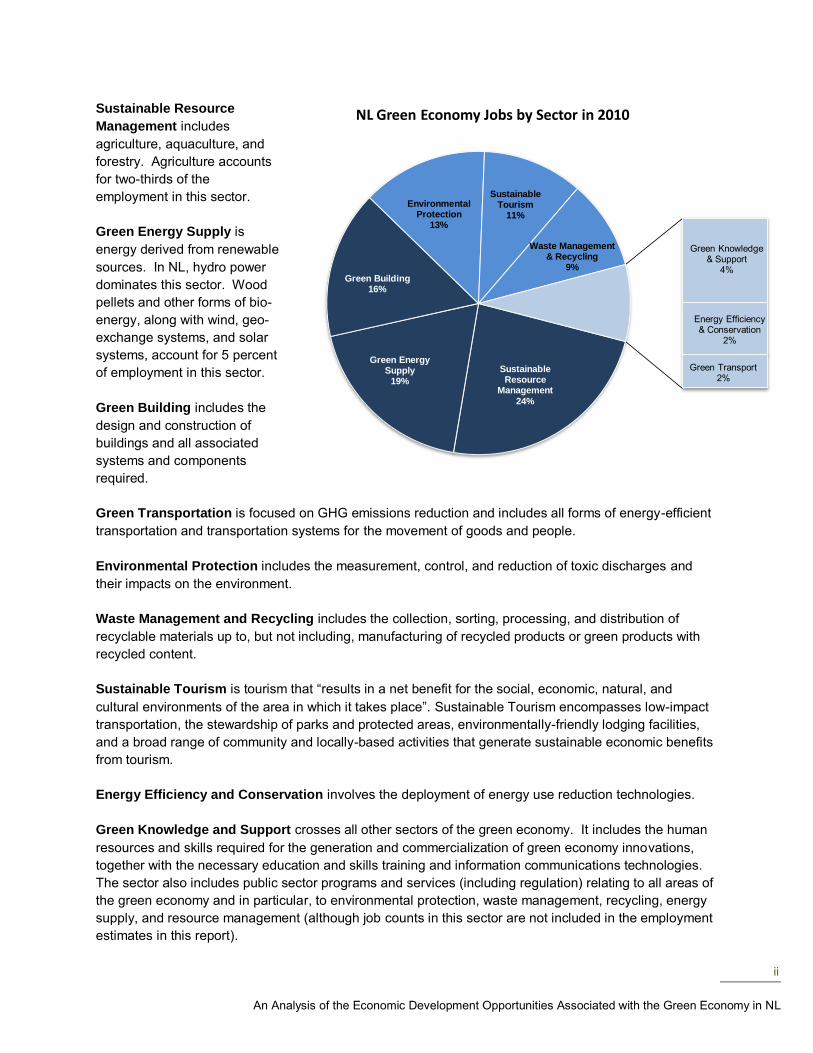
Opportunities in NL’s Green Economy
A range of opportunities were identified within each segment of NL’s green economy. Opportunities were
identified through stakeholder consultations and by considering green activities within each sector and
segment using the Opportunity Matrix below.
GREEN ECONOMY SECTORS
1 2 3 4 5 6 7 8 9
Check marks indicate opportunity areas within each sector of the green economy.
For example, every sector engages in marketing and every sector requires skills training
and education. Su
stainab
le Reso
urce
Man
agemen
t
Green
Energy Su
pp
ly
Green
Bu
ildin
g
Green
Transp
ortatio
n
Enviro
nm
ental P
rotectio
n
Waste M
anagem
ent &
Recyclin
g
Sustain
able To
urism
Green
Kn
ow
ledge &
Sup
po
rt
Energy Efficien
cy & C
on
servatio
n
OPPORTUNITY AREAS
Design and Construction of Buildings & Infrastructure
Developing New Green Technologies
Employing Green Technologies and Practices
Marketing and Branding
Green Economy Skills Training & Education
Green Energy Utilization (Fossil Fuel Replacement)
Installing Green Technologies
Manufacturing Green Products from Green Commodities
Manufacturing Green Purposed Products or Technologies
Expanding / Diversifying Green Commodities Production
Reducing Environmental Impact of Travelling and Touring
Reducing Environmental Impact of Goods Transport
Maintenance and Repair of Technologies and Systems
Each identified opportunity was then considered in context of a number of factors including the availability
of critical inputs, the stage of development, the engagement of local entrepreneurs and investors, and the
status of the business case. Recommendations were then made based on these assessments.
iv
An Analysis of the Economic Development Opportunities Associated with the Green Economy in NL
In many cases, NL is already engaged in investigating and / or exploiting the opportunities identified. In
these cases, the report simply confirms the importance already attached to those opportunities. The
reader is cautioned that the opportunities identified do not preclude or exclude other opportunities that
may be under consideration in NL.
Based on the identified opportunities and recommendations, two employment growth scenarios for NL’s
green economy in 2020 are presented – specifically a “Business as Usual” (BAU) and a “Higher Growth”
scenario.
Business as Usual Scenario
The “Business as Usual” (BAU) growth scenario assumes trends in each sector and segment established
over the period 2000 through 2010 continue to 2020 and results in a corresponding amount of
employment growth. For example, volumes of farmed fish and shell fish rose from around 5,000 tonnes
in 2000 to over 15,000 tonnes in 2010. Taking account of productivity improvements, employment in
2020 was projected to increase by nearly 40 percent over 2010. Similar projections were made for other
goods producing sectors and segments.
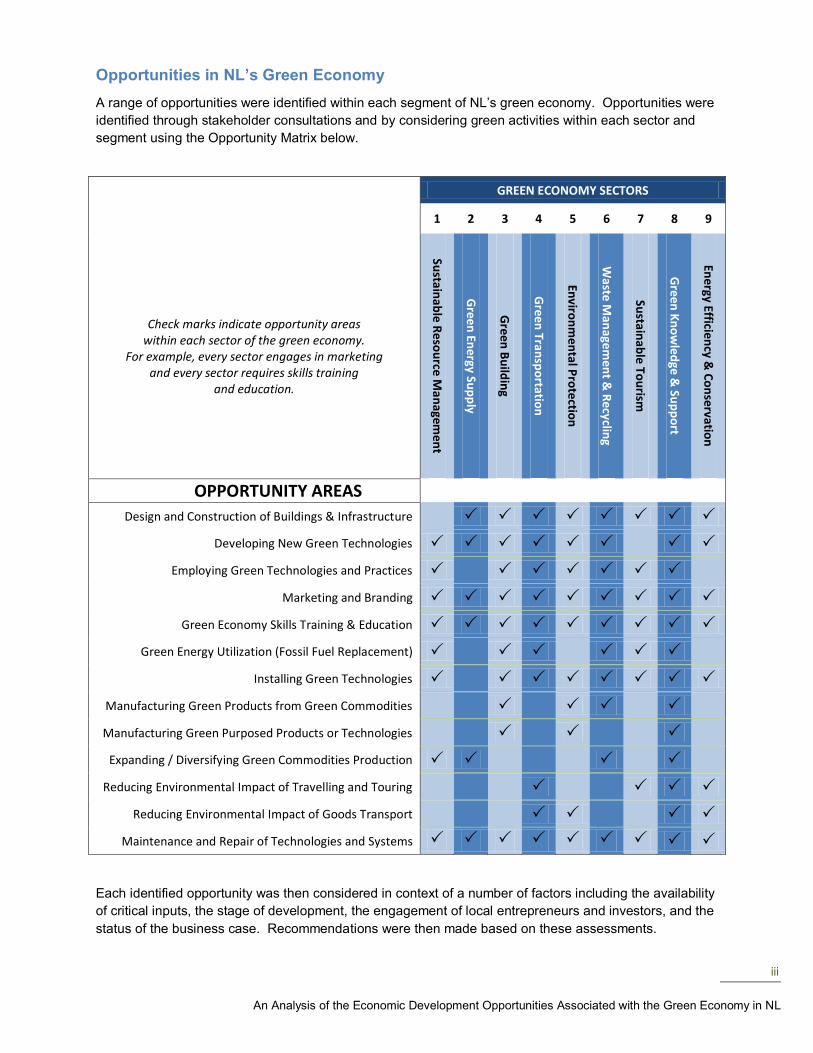
Looking ahead to 2020, if current trends continue, total employment would rise to 12,000 (not including
employees of governments).
The highest growth sector in the BAU
scenario is green energy, driven by
large scale investments in hydro
electric power expansion and growth in
wood pellet production.
410 new jobs are projected for the
sector.
Green building construction is projected
to continue to gain market share,
generating some 260 new jobs.
Aquaculture and green agriculture
together are projected to generate
some 260 new jobs in sustainable
resource management.
Sustainable tourism employment is
projected to increase by 230 new jobs
reflecting increased market share of
nature tourism and expanding local
economic opportunities derived from tourism spending. Employment in recycling operations is also
expected to expand by some 200 new jobs reflecting increased collection and utilization of waste
streams.
Environmental protection, green knowledge and support services, energy efficiency systems and
deployments, and green transportation are projected to generate another 270 new jobs by 2020.
Sustainable Resource
Management 310
Green Energy Supply
410
Green Building 260
Environmental Protection
140
Sustainable Tourism
230
Waste Management & Recycling
200
Green Knowledge & Support
70
Energy Efficiency & Conservation
40
Green Transport 20
NL Employment Growth by Sector to 2020, "Business as Usual" Scenario
v
An Analysis of the Economic Development Opportunities Associated with the Green Economy in NL
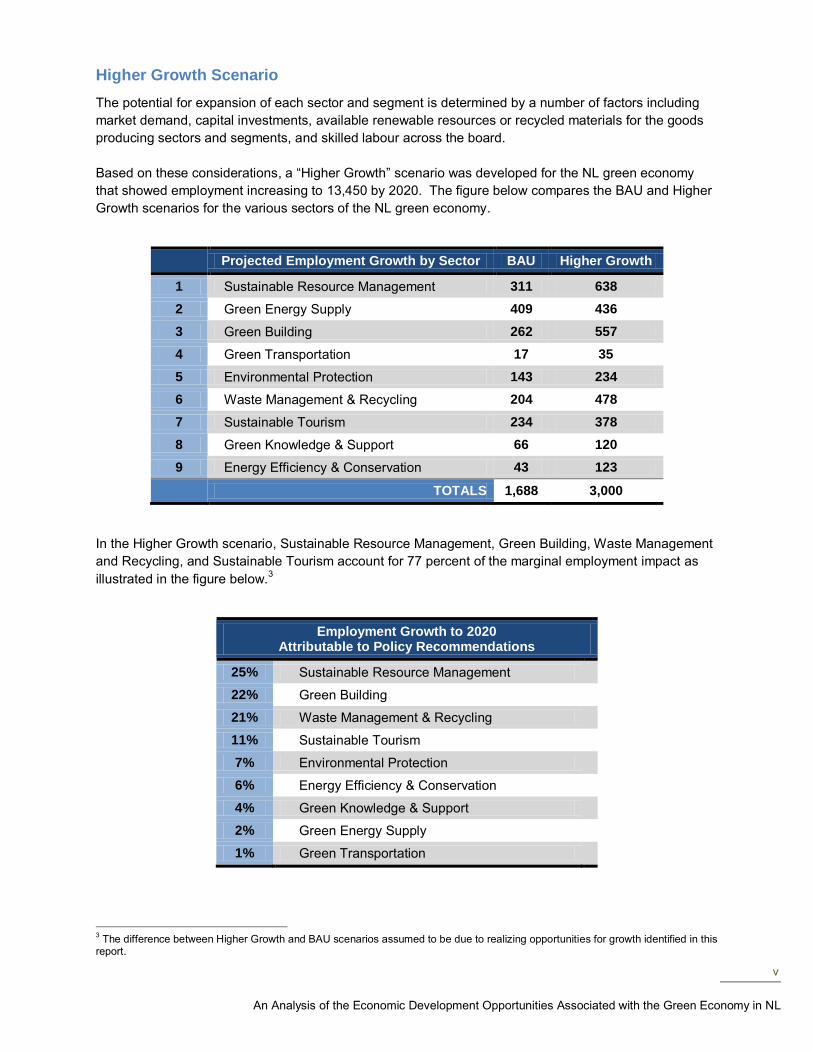
Higher Growth Scenario
The potential for expansion of each sector and segment is determined by a number of factors including
market demand, capital investments, available renewable resources or recycled materials for the goods
producing sectors and segments, and skilled labour across the board.
Based on these considerations, a “Higher Growth” scenario was developed for the NL green economy
that showed employment increasing to 13,450 by 2020. The figure below compares the BAU and Higher
Growth scenarios for the various sectors of the NL green economy.
Projected Employment Growth by Sector BAU Higher Growth
1 Sustainable Resource Management 311 638
2 Green Energy Supply 409 436
3 Green Building 262 557
4 Green Transportation 17 35
5 Environmental Protection 143 234
6 Waste Management & Recycling 204 478
7 Sustainable Tourism 234 378
8 Green Knowledge & Support 66 120
9 Energy Efficiency & Conservation 43 123
TOTALS 1,688 3,000
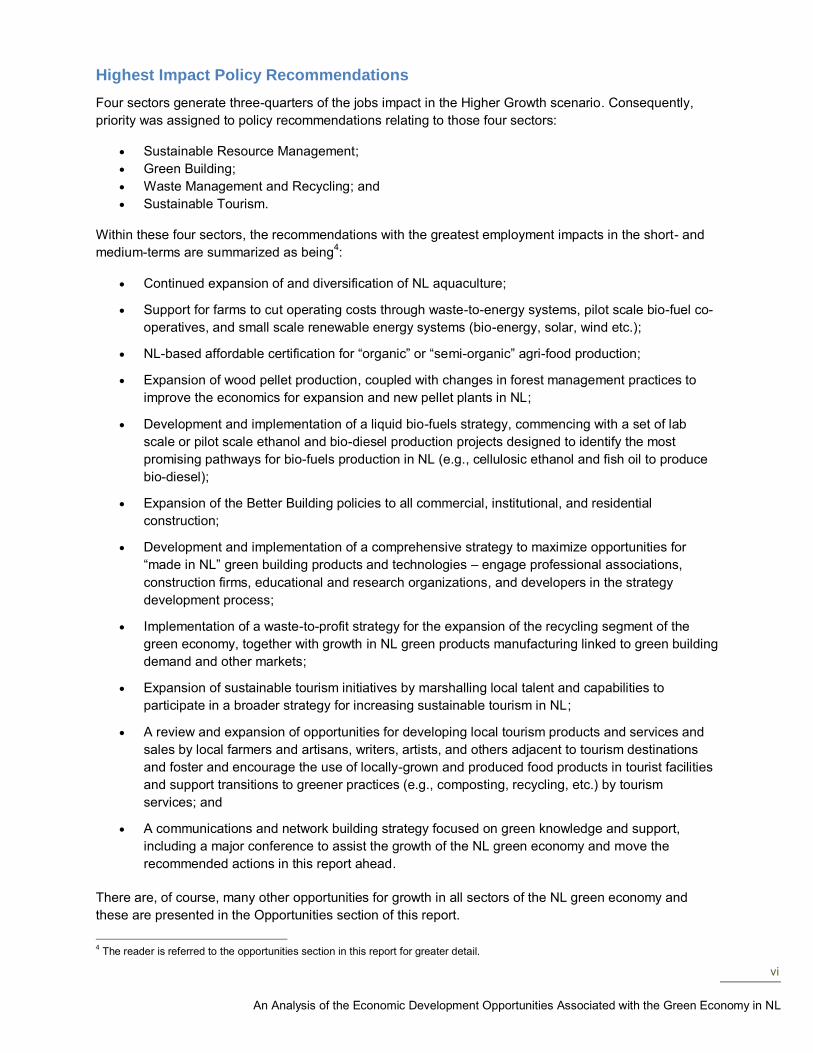
In the Higher Growth scenario, Sustainable Resource Management, Green Building, Waste Management
and Recycling, and Sustainable Tourism account for 77 percent of the marginal employment impact as
illustrated in the figure below.3
Employment Growth to 2020 Attributable to Policy Recommendations
25% Sustainable Resource Management
22% Green Building
21% Waste Management & Recycling
11% Sustainable Tourism
7% Environmental Protection
6% Energy Efficiency & Conservation
4% Green Knowledge & Support
2% Green Energy Supply
1% Green Transportation
3 The difference between Higher Growth and BAU scenarios assumed to be due to realizing opportunities for growth identified in this
report.
vi
An Analysis of the Economic Development Opportunities Associated with the Green Economy in NL
Highest Impact Policy Recommendations
Four sectors generate three-quarters of the jobs impact in the Higher Growth scenario. Consequently,
priority was assigned to policy recommendations relating to those four sectors:
Sustainable Resource Management;
Green Building;
Waste Management and Recycling; and
Sustainable Tourism.
Within these four sectors, the recommendations with the greatest employment impacts in the short- and
medium-terms are summarized as being4:
Continued expansion of and diversification of NL aquaculture;
Support for farms to cut operating costs through waste-to-energy systems, pilot scale bio-fuel co-
operatives, and small scale renewable energy systems (bio-energy, solar, wind etc.);
NL-based affordable certification for “organic” or “semi-organic” agri-food production;
Expansion of wood pellet production, coupled with changes in forest management practices to
improve the economics for expansion and new pellet plants in NL;
Development and implementation of a liquid bio-fuels strategy, commencing with a set of lab
scale or pilot scale ethanol and bio-diesel production projects designed to identify the most
promising pathways for bio-fuels production in NL (e.g., cellulosic ethanol and fish oil to produce
bio-diesel);
Expansion of the Better Building policies to all commercial, institutional, and residential
construction;
Development and implementation of a comprehensive strategy to maximize opportunities for
“made in NL” green building products and technologies – engage professional associations,
construction firms, educational and research organizations, and developers in the strategy
development process;
Implementation of a waste-to-profit strategy for the expansion of the recycling segment of the
green economy, together with growth in NL green products manufacturing linked to green building
demand and other markets;
Expansion of sustainable tourism initiatives by marshalling local talent and capabilities to
participate in a broader strategy for increasing sustainable tourism in NL;
A review and expansion of opportunities for developing local tourism products and services and
sales by local farmers and artisans, writers, artists, and others adjacent to tourism destinations
and foster and encourage the use of locally-grown and produced food products in tourist facilities
and support transitions to greener practices (e.g., composting, recycling, etc.) by tourism
services; and
A communications and network building strategy focused on green knowledge and support,
including a major conference to assist the growth of the NL green economy and move the
recommended actions in this report ahead.
There are, of course, many other opportunities for growth in all sectors of the NL green economy and
these are presented in the Opportunities section of this report.
4 The reader is referred to the opportunities section in this report for greater detail.
vii
An Analysis of the Economic Development Opportunities Associated with the Green Economy in NL
Exports and Imports Replacement
The majority of green economy opportunities identified focus on local market demand. However, as the
green economy expands, sales to international and inter-provincial markets would also expand. The
main opportunities for export sales were identified as:
Renewable electrical energy;
Aquaculture;
Sustainable tourism;
Wood pellets and other bio-fuels;
Specialized services and technologies in environmental protection; and
Ocean technologies relating to the green economy.
In addition to the trade opportunities, green economy growth would also replace some imports with local
products and services including:
Local food and food products;
NL-based testing and certification services (various sectors); and
Preferred use of NL wood products and other green products and systems for green building.
Institutional Recommendations
Important institutional initiatives include the establishment of:
NL-based testing and certification capacities that are affordable and appropriate for the scale of
the NL green economy;
A NL energy efficiency central coordinating office or agency which addresses both electricity and
fossil fuels reduction; and
Programs to allow NL green initiatives to gain the benefit of highly-skilled public servants working
directly on building the NL green economy.
Biggest GHG Impacts
Beyond GHG emission reductions accruing from the Muskrat Falls / Lower Churchill project, the greatest
impacts in GHG emission reductions would accrue from opportunities in:
Bio-fuels utilization for green transportation and energy supply;
Energy efficiency and energy saving in all sectors; and
Green building.
Labour Market Implications
Demand is expected to grow over the next several years for workers in the Sustainable Resource
Management, Green Building, Sustainable Tourism, Energy Efficiency and Conservation, Environmental
Protection, and Waste Management and Recycling sectors (e.g., consultants, workers in aquaculture and
agriculture, experts in remediation, and professionals in waste management / recycling, water, and
wastewater treatment).
viii
An Analysis of the Economic Development Opportunities Associated with the Green Economy in NL
The greatest pressure for green workers in the short-term is projected to felt in the engineering and skilled
construction trades as a result of the number of major projects coming online over the next several years.
It will be important to ensure that labour supply (i.e., new workforce entrants and existing workers) is
aligned with labour demand (i.e., based on industry / market needs and the direction of public policy /
regulations) and education and training must provide the skills for both present and emerging practices
and technologies.
Along with relevant educational and training programming will come a need for appropriate facilities (i.e.,
laboratories, demonstration projects, etc.), as well as for qualified instructors, such as those familiar with
emerging technologies in district or unit scale renewable energy, bio-fuel production, energy
management, and “smart” technologies.
A Provincial Skills Task Force has been established to help NL remain competitive with new and
emerging practices and industry needs and the Province will need to continue to work closely with the
university, the public and private colleges, other private sector players, the Federation of Labour and
labour unions, various industry associations and NGOs, and other tertiary educators in the province.
Finally, in order to seize the economic and employment opportunities in NL’s green economy and address
the projected shortages in skilled workers over the next decade, action will be needed to increase
productivity levels within the labour force; to attract foreign workers, as well as retain existing workers and
new graduates, for the province’s green sectors; to train and up-skill workers from traditional industries;
and to increase the participation rates among under-employed segments of NL’s population.
In Conclusion
NL has a wide range of potential green economy opportunities that can generate significant economic
impacts within the 2020 time horizon of this project. Most of these opportunities will require additional
studies and assessments to define the business cases to capitalize on them and set the stage for
investment in a bright green future for the NL economy.
1
An Analysis of the Economic Development Opportunities Associated with the Green Economy in NL
Table of Contents
Executive Summary ................................................................................................................................... i
Introduction ............................................................................................................................................... 2
Scope of the Green Economy in NL ........................................................................................................ 4
Review of Green Sectors in NL ................................................................................................................ 5
SECTOR 1 – Sustainable Resource Management ................................................................................. 7
SECTOR 2 – Green Energy Supply ...................................................................................................... 11
SECTOR 3 – Green Building ................................................................................................................ 15
SECTOR 4 – Green Transportation ...................................................................................................... 19
SECTOR 5 – Environmental Protection ................................................................................................ 23
SECTOR 6 – Waste Management & Recycling .................................................................................... 26
SECTOR 7 – Sustainable Tourism........................................................................................................ 29
SECTOR 8 – Green Knowledge & Support ........................................................................................... 31
SECTOR 9 – Energy Efficiency & Conservation ................................................................................... 36
Opportunities in the NL Green Economy .............................................................................................. 37
SECTOR 1 OPPORTUNITIES – Sustainable Resource Management ................................................. 39
SECTOR 2 OPPORTUNITIES – Green Energy Supply ........................................................................ 43
SECTOR 3 OPPORTUNITIES – Green Building .................................................................................. 46
SECTOR 4 OPPORTUNITIES – Green Transportation ........................................................................ 48
SECTOR 5 OPPORTUNITIES – Environmental Protection .................................................................. 50
SECTOR 6 OPPORTUNITIES – Waste Management & Recycling ...................................................... 51
SECTOR 7 OPPORTUNITIES – Sustainable Tourism ......................................................................... 52
SECTOR 8 OPPORTUNITIES – Green Knowledge & Support ............................................................ 53
SECTOR 9 OPPORTUNITIES – Energy Efficiency & Conservation ..................................................... 54
Growth Scenarios ................................................................................................................................... 55
Policy Recommendations – Summary & Rankings ............................................................................. 57
Conclusions ............................................................................................................................................ 62
2
An Analysis of the Economic Development Opportunities Associated with the Green Economy in NL
Introduction
The Department of Innovation, Trade, and Rural Development and the Office of Climate Change, Energy
Efficiency, and Emissions Trading, Government of Newfoundland and Labrador (NL) engaged GLOBE
Advisors, in partnership with AMEC Earth & Environmental in St. John’s, to carry out a study to identify
the economic development opportunities associated with the green economy for NL. The purposes of
this commission were to obtain:
A comprehensive review of the sectors that make up the green economy in NL, including a
dynamic analysis of the strengths, weaknesses, opportunities, and threats which these sectors
currently face;
A detailed understanding of:
o The growth trends in existing or potential export markets for the sectors that make up the
green economy;
o Possible growth scenarios for the period up to 2020; and
o Which export opportunities would be a good fit with local skills and capacity; and
Prioritized recommendations on how best NL can increase and sustain growth and employment
in the sectors that comprise the green economy.
This report provides a comprehensive analysis of the current and potential future green economy
opportunities in NL. Work for this study included:
A detailed analysis of current establishment counts and employment associated with green
economy activities in NL using Statistics Canada datasets in combination with a wide range of
reports, directories, and other data published by generally accepted sources;5
A review of the facts and trends for each sector based on the Government of NL’s reports and
datasets, along with specialized reports from GLOBE’s extensive reference database;
A review of global developments and outlooks for each sector, drawing on extensive reference
materials and a database of more than 400 reports on the green economy;
Consultations with more than 75 key stakeholders from various organizations (business,
government, NGOs, industry associations, and academia) through in-depth interviews to
determine perceived strengths, weaknesses, opportunities, and threats for green economy
activities.6 The consultative process also included two focus group meetings held in St. John’s;
A review of current labour market trends in NL, as well as labour demand and supply related to
the green economy – including a review of relevant post-secondary education and training
programs that exist in the province; and
An analysis of NL’s trade in green commodities for the period 2001 to 2010 using Statistics
Canada trade data.7
5 See Appendix A for the detailed methodology applied in estimating current employment and the number of establishments in NL’s green economy.
6 See Appendix B for a list of individuals and organizations consulted during the study.
7 See Appendix A for the methodology applied in estimating NL’s trade in green commodities.
3
An Analysis of the Economic Development Opportunities Associated with the Green Economy in NL
The report comprises three documents: the main report (this document), an Appendices document that
includes the report methodology, and a Companion document that includes a review of global trends for
the sectors covered in the report, results from the consultative process, labour market trends, and trade in
green commodities.
Two employment growth scenarios for the NL green economy in 2020 are presented in this report –
specifically a “Business as Usual” (BAU) and a “Higher Growth” scenario. The BAU scenario assumes
current trends continue, while the Higher Growth scenario assumes that plans are developed and
implemented to capitalize on the many opportunities that exist for greening NL’s economy.
It is hoped that this report and its companion documents will stimulate discussion among all stakeholders
and encourage collaboration to capitalize on the opportunities presented.
4
An Analysis of the Economic Development Opportunities Associated with the Green Economy in NL
Scope of the Green Economy in NL
Definition of “Green”
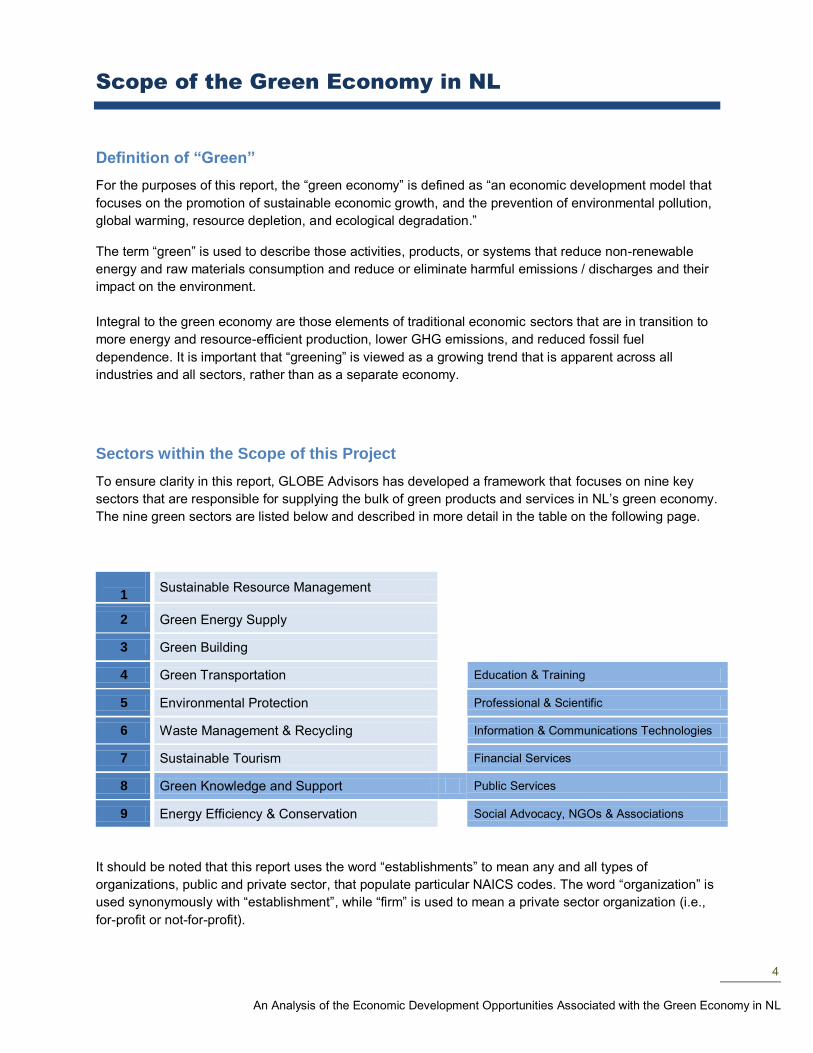
For the purposes of this report, the “green economy” is defined as “an economic development model that
focuses on the promotion of sustainable economic growth, and the prevention of environmental pollution,
global warming, resource depletion, and ecological degradation.”
The term “green” is used to describe those activities, products, or systems that reduce non-renewable
energy and raw materials consumption and reduce or eliminate harmful emissions / discharges and their
impact on the environment.
Integral to the green economy are those elements of traditional economic sectors that are in transition to
more energy and resource-efficient production, lower GHG emissions, and reduced fossil fuel
dependence. It is important that “greening” is viewed as a growing trend that is apparent across all
industries and all sectors, rather than as a separate economy.
Sectors within the Scope of this Project
To ensure clarity in this report, GLOBE Advisors has developed a framework that focuses on nine key
sectors that are responsible for supplying the bulk of green products and services in NL’s green economy.
The nine green sectors are listed below and described in more detail in the table on the following page.
1
Sustainable Resource Management
2 Green Energy Supply
3 Green Building
4 Green Transportation Education & Training
5 Environmental Protection Professional & Scientific
6 Waste Management & Recycling Information & Communications Technologies
7 Sustainable Tourism Financial Services
8 Green Knowledge and Support Public Services
9 Energy Efficiency & Conservation Social Advocacy, NGOs & Associations
It should be noted that this report uses the word “establishments” to mean any and all types of
organizations, public and private sector, that populate particular NAICS codes. The word “organization” is
used synonymously with “establishment”, while “firm” is used to mean a private sector organization (i.e.,
for-profit or not-for-profit).
5
An Analysis of the Economic Development Opportunities Associated with the Green Economy in NL
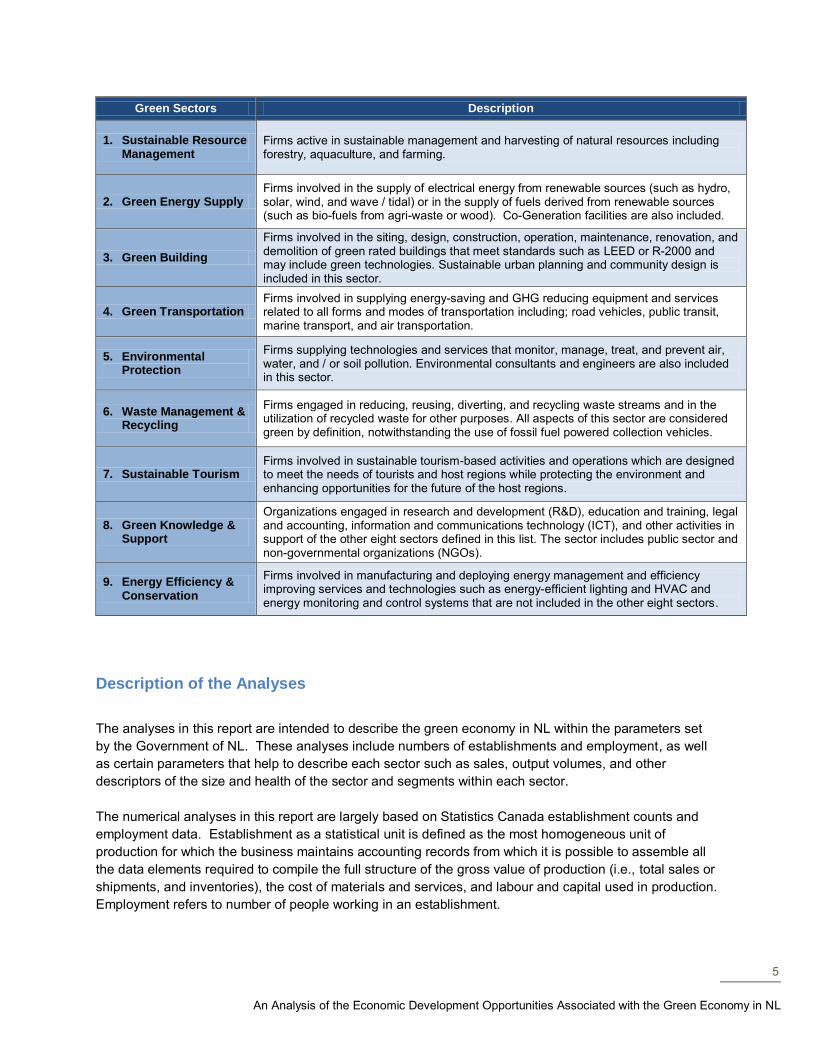
Green Sectors Description
1. Sustainable Resource Management
Firms active in sustainable management and harvesting of natural resources including forestry, aquaculture, and farming.
2. Green Energy Supply Firms involved in the supply of electrical energy from renewable sources (such as hydro, solar, wind, and wave / tidal) or in the supply of fuels derived from renewable sources (such as bio-fuels from agri-waste or wood). Co-Generation facilities are also included.
3. Green Building
Firms involved in the siting, design, construction, operation, maintenance, renovation, and demolition of green rated buildings that meet standards such as LEED or R-2000 and may include green technologies. Sustainable urban planning and community design is included in this sector.
4. Green Transportation Firms involved in supplying energy-saving and GHG reducing equipment and services related to all forms and modes of transportation including; road vehicles, public transit, marine transport, and air transportation.
5. Environmental Protection
Firms supplying technologies and services that monitor, manage, treat, and prevent air, water, and / or soil pollution. Environmental consultants and engineers are also included in this sector.
6. Waste Management & Recycling
Firms engaged in reducing, reusing, diverting, and recycling waste streams and in the utilization of recycled waste for other purposes. All aspects of this sector are considered green by definition, notwithstanding the use of fossil fuel powered collection vehicles.
7. Sustainable Tourism Firms involved in sustainable tourism-based activities and operations which are designed to meet the needs of tourists and host regions while protecting the environment and enhancing opportunities for the future of the host regions.
8. Green Knowledge & Support
Organizations engaged in research and development (R&D), education and training, legal and accounting, information and communications technology (ICT), and other activities in support of the other eight sectors defined in this list. The sector includes public sector and non-governmental organizations (NGOs).
9. Energy Efficiency & Conservation
Firms involved in manufacturing and deploying energy management and efficiency improving services and technologies such as energy-efficient lighting and HVAC and energy monitoring and control systems that are not included in the other eight sectors.
Description of the Analyses
The analyses in this report are intended to describe the green economy in NL within the parameters set
by the Government of NL. These analyses include numbers of establishments and employment, as well
as certain parameters that help to describe each sector such as sales, output volumes, and other
descriptors of the size and health of the sector and segments within each sector.
The numerical analyses in this report are largely based on Statistics Canada establishment counts and
employment data. Establishment as a statistical unit is defined as the most homogeneous unit of
production for which the business maintains accounting records from which it is possible to assemble all
the data elements required to compile the full structure of the gross value of production (i.e., total sales or
shipments, and inventories), the cost of materials and services, and labour and capital used in production.
Employment refers to number of people working in an establishment.
6
An Analysis of the Economic Development Opportunities Associated with the Green Economy in NL
Establishments within each sector were defined by a set of North American Industry Classification System
codes (NAICS codes). NAICS was developed by the statistical agencies of Canada, Mexico, and the
United States to provide common definitions of the industries within the three countries and a common
statistical framework for analyzing statistical data relating to industry and the economy. Described by
Statistics Canada as "a comprehensive system encompassing all economic activities", NAICS has a
hierarchical structure, dividing the economy into 20 sectors at its highest level. The system assigns
NAICS codes to industry sectors and specific industries which can then be used to identify them.
Consideration of green activities associated with each sector led to the identification of opportunities for
NL. These opportunities are considered in the context of the business cases for realizing those
opportunities in the NL green economy and presented in terms of policy recommendations taking due
account of strengths, weaknesses, and threats.
The report concludes with two scenarios for the growth of each green segment. The first scenario was
developed on the basis that trends from the year 2000 through 2010 continue until 2020, taking due
account of any significant projected developments, and a second, higher growth scenario is offered on
the basis that the various opportunities presented in this report are exploited.
It should be noted that many of the opportunities identified in this report require further assessments or
studies so that business cases and action plans to capitalize on the opportunities can be prepared and
implemented.
7
An Analysis of the Economic Development Opportunities Associated with the Green Economy in NL
Review of Green Sectors in NL
The following section defines the segments that comprise each sector and provides an estimate of
current employment and the number of establishments by sector in the province.
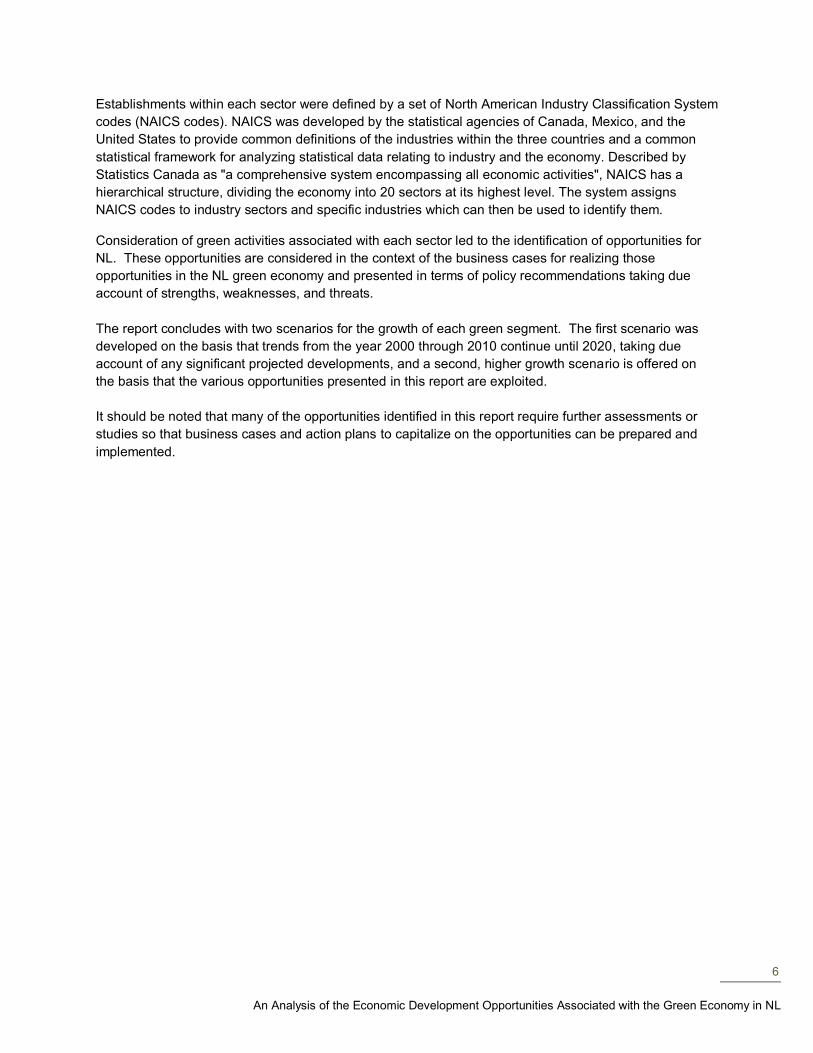
SECTOR 1 – SUSTAINABLE RESOURCE MANAGEMENT
This sector is focused on green commodity supply and includes: fish, timber, and farming; crops and
livestock. It includes the management and harvesting of fish stocks, forestry management, silviculture and
logging, and agriculture (crop and animal farming) within the following NAICS codes:
NAICS Classification
1111 Oilseed and Grain Farming
1112 Vegetable Farming
1113 Fruit and Tree Nut Farming
1114 Greenhouse, Nursery and Floriculture Production
1119 Other Crop Farming
1121 Cattle Ranching and Farming
1122 Hog and Pig Farming
1123 Poultry and Egg Production
1125 Aquaculture
1129 Other Animal Production
1132 Forest Nurseries and Gathering of Forest Products
1133 Logging
1141 Aquaculture and Commercial Fishing
NAICS codes 1133 (Logging) and 114113 (Salt Water Fishing) are not included in this report.
1.1 – Aquaculture Segment
There were some 28 production establishments (NAICS code 112510) employing an estimated 340
people in 2010 (Statistics Canada data). The industry produces mainly salmon and shellfish.
Development efforts are focussed predominantly on Atlantic salmon, with smaller quantities of steelhead
trout, blue mussels and Atlantic cod.
Considerable investments have been made in research and development on “new” species aquaculture,
infrastructure, and services for the industry, in addition to new hatcheries and facilities expansions.
These investments are catalogued in the Inventory of Major Capital Projects published annually by the NL
Government.
8
An Analysis of the Economic Development Opportunities Associated with the Green Economy in NL
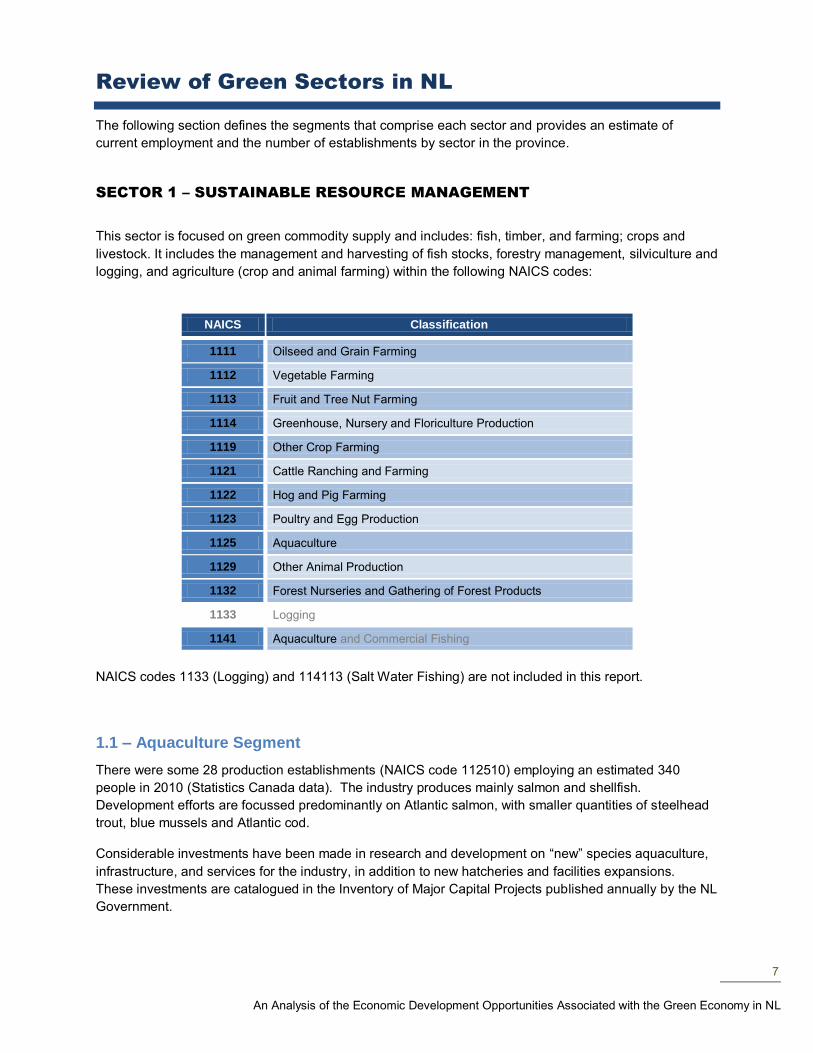
Aquaculture production in 1999 totalled
4,300 tonnes. By 2005, total production
exceeded 8,100 tonnes and in 2010,
production reached 15,300 tonnes.8
Total industry employment (including
processing) rose from 370 in 2005 to
684 in 2010.
In 2010, there were 140 aquaculture
licenses. The water area covered by the
licenses increased from 5,480 hectares
in 2006 to 5,932 in 2010.
The market value of production
increased from $15.9 million in 2003 to
$116 million in 2010.9
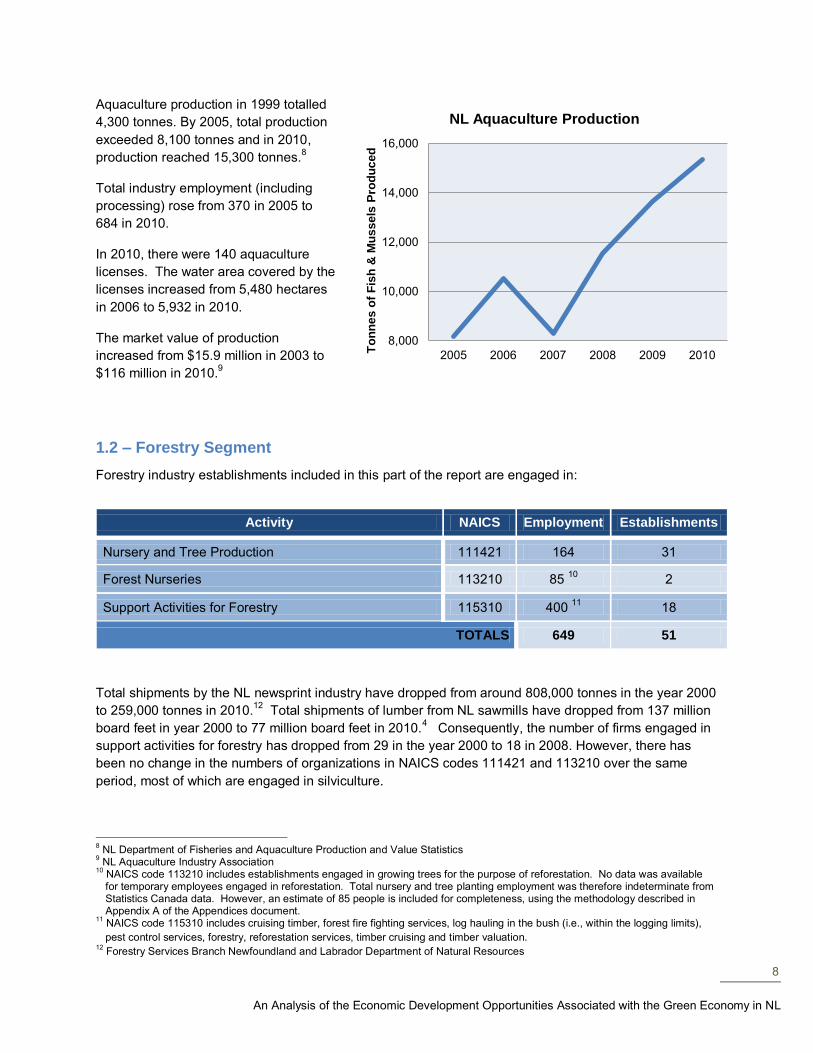
1.2 – Forestry Segment
Forestry industry establishments included in this part of the report are engaged in:
Activity NAICS Employment Establishments
Nursery and Tree Production 111421 164 31
Forest Nurseries 113210 85 10
2
Support Activities for Forestry 115310 400 11
18
TOTALS 649 51
Total shipments by the NL newsprint industry have dropped from around 808,000 tonnes in the year 2000
to 259,000 tonnes in 2010.12
Total shipments of lumber from NL sawmills have dropped from 137 million
board feet in year 2000 to 77 million board feet in 2010.4 Consequently, the number of firms engaged in
support activities for forestry has dropped from 29 in the year 2000 to 18 in 2008. However, there has
been no change in the numbers of organizations in NAICS codes 111421 and 113210 over the same
period, most of which are engaged in silviculture.
8 NL Department of Fisheries and Aquaculture Production and Value Statistics
9 NL Aquaculture Industry Association
10 NAICS code 113210 includes establishments engaged in growing trees for the purpose of reforestation. No data was available for temporary employees engaged in reforestation. Total nursery and tree planting employment was therefore indeterminate from Statistics Canada data. However, an estimate of 85 people is included for completeness, using the methodology described in Appendix A of the Appendices document.
11 NAICS code 115310 includes cruising timber, forest fire fighting services, log hauling in the bush (i.e., within the logging limits),
pest control services, forestry, reforestation services, timber cruising and timber valuation. 12
Forestry Services Branch Newfoundland and Labrador Department of Natural Resources
8,000
10,000
12,000
14,000
16,000
2005 2006 2007 2008 2009 2010
To
nn
es
of
Fis
h &
Mu
ss
els
Pro
du
ce
d
NL Aquaculture Production
9
An Analysis of the Economic Development Opportunities Associated with the Green Economy in NL
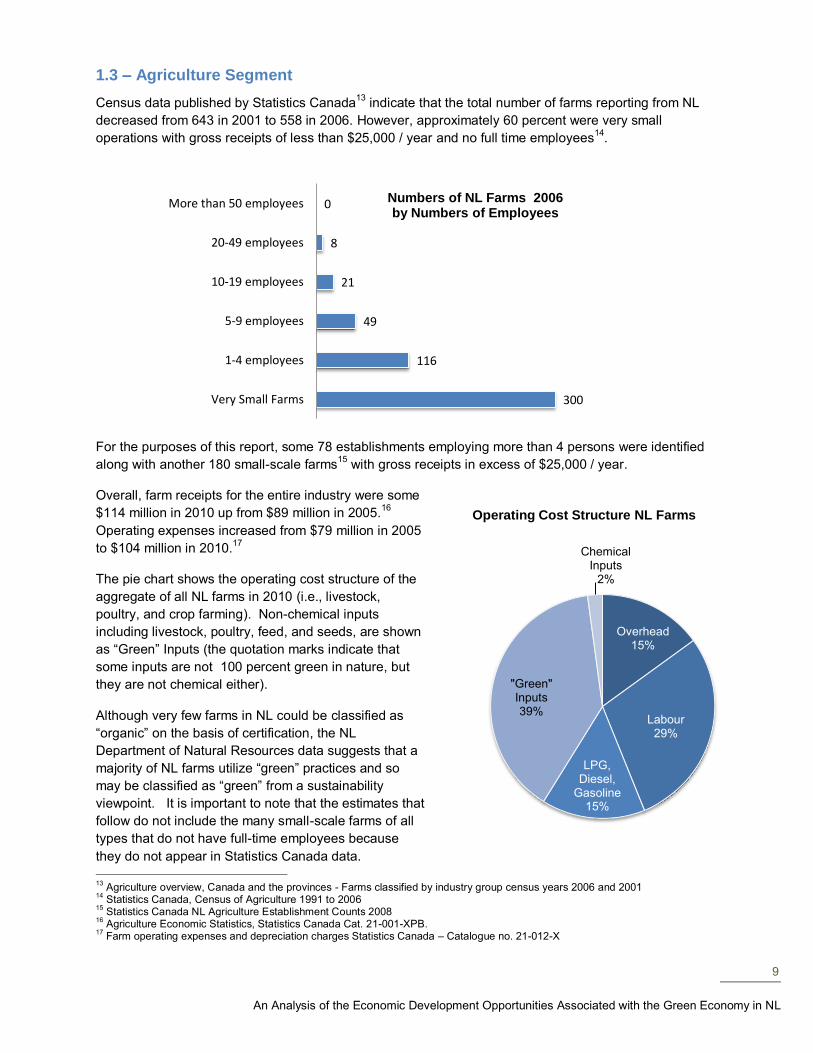
1.3 – Agriculture Segment
Census data published by Statistics Canada13
indicate that the total number of farms reporting from NL
decreased from 643 in 2001 to 558 in 2006. However, approximately 60 percent were very small
operations with gross receipts of less than $25,000 / year and no full time employees14
.
For the purposes of this report, some 78 establishments employing more than 4 persons were identified
along with another 180 small-scale farms15
with gross receipts in excess of $25,000 / year.
Overall, farm receipts for the entire industry were some
$114 million in 2010 up from $89 million in 2005.16
Operating expenses increased from $79 million in 2005
to $104 million in 2010.17
The pie chart shows the operating cost structure of the
aggregate of all NL farms in 2010 (i.e., livestock,
poultry, and crop farming). Non-chemical inputs
including livestock, poultry, feed, and seeds, are shown
as “Green” Inputs (the quotation marks indicate that
some inputs are not 100 percent green in nature, but
they are not chemical either).
Although very few farms in NL could be classified as
“organic” on the basis of certification, the NL
Department of Natural Resources data suggests that a
majority of NL farms utilize “green” practices and so
may be classified as “green” from a sustainability
viewpoint. It is important to note that the estimates that
follow do not include the many small-scale farms of all
types that do not have full-time employees because
they do not appear in Statistics Canada data.
13
Agriculture overview, Canada and the provinces - Farms classified by industry group census years 2006 and 2001 14
Statistics Canada, Census of Agriculture 1991 to 2006 15
Statistics Canada NL Agriculture Establishment Counts 2008 16
Agriculture Economic Statistics, Statistics Canada Cat. 21-001-XPB. 17
Farm operating expenses and depreciation charges Statistics Canada – Catalogue no. 21-012-X
300
116
49
21
8
0
Very Small Farms
1-4 employees
5-9 employees
10-19 employees
20-49 employees
More than 50 employees Numbers of NL Farms 2006 by Numbers of Employees
Overhead 15%
Labour 29%
LPG, Diesel,
Gasoline 15%
"Green" Inputs 39%
Chemical Inputs
2%
Operating Cost Structure NL Farms
10
An Analysis of the Economic Development Opportunities Associated with the Green Economy in NL
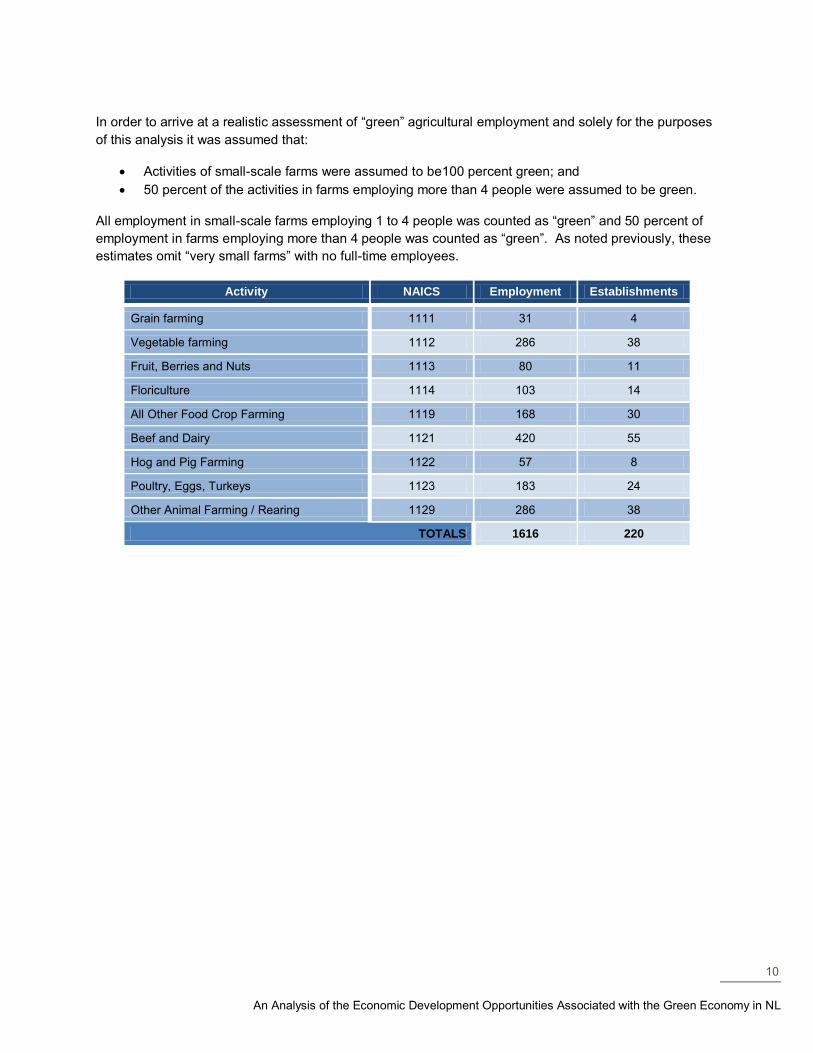
In order to arrive at a realistic assessment of “green” agricultural employment and solely for the purposes
of this analysis it was assumed that:
Activities of small-scale farms were assumed to be100 percent green; and
50 percent of the activities in farms employing more than 4 people were assumed to be green.
All employment in small-scale farms employing 1 to 4 people was counted as “green” and 50 percent of
employment in farms employing more than 4 people was counted as “green”. As noted previously, these
estimates omit “very small farms” with no full-time employees.
Activity NAICS Employment Establishments
Grain farming 1111 31 4
Vegetable farming 1112 286 38
Fruit, Berries and Nuts 1113 80 11
Floriculture 1114 103 14
All Other Food Crop Farming 1119 168 30
Beef and Dairy 1121 420 55
Hog and Pig Farming 1122 57 8
Poultry, Eggs, Turkeys 1123 183 24
Other Animal Farming / Rearing 1129 286 38
TOTALS 1616 220

11
An Analysis of the Economic Development Opportunities Associated with the Green Economy in NL
SECTOR 2 – GREEN ENERGY SUPPLY
NL energy consumption averaged
136,000 TJ per year over the period 2005
through 2009. Of the energy consumed,
69 percent was from refined petroleum
products and 30 percent from electricity18
.
The pie chart shows the relative
consumption for each major sector of the
NL economy.
Electricity consumption totalled close to
38,600 TJ in 2009, approximately 38,000
TJ of which was grid hydro-electric power
and some 4,300 TJ was supplied by
thermal and diesel-powered generation.
Fuel oil used for space heating and
industrial activities totalled approximately
38,000 TJ. Gasoline and diesel for road
vehicles totalled 35,900 TJ and some
10,400 TJ19
was used for marine transport
(ferries, fishing vessels, and cargo vessels of all types). Air transport consumed some 12,700 TJ in 2009.
Additionally a certain amount of wood is used for space heating; survey data20
indicates that NL
households consumed a total of 3,200 TJ of wood for heating purposes in 2009. For the purposes of this
report, two segments are considered and include electric power supply from renewable sources and bio-
fuels within the NAICS codes listed below.
NAICS Classification
2123 Non-Metallic Mineral Mining & Quarrying
2211 Electric Power Generation, Transmission and Distribution
2371 Power Line Construction
3112 Grain & Oilseed Milling
3116 Rendering Plants
3219 Other Wood Product Manufacturing
18
Data provided by Government of NL together with analysis of energy consumption data for residential, commercial / institutional and industry supplemented by Statistics Canada data on sales of fuel used for road motor vehicles, by province and territory
19 Data provided by Government of NL together with analyses of data from the Department of Fisheries and Oceans Canada on the NL fishing fleet population and operating costs together with Newfoundland Labrador Transportation and Works annual reports and Marine Atlantic fleet operating data
20 2009 data from Government of NL and 2007 Survey of Household Energy Use by NRCan
Residential 14%
Commercial & Institutional
12%
Road Vehicle Transport
28%
Aviation & Marine 14%
Industry 32%
NL Energy Consumption by Sector
12
An Analysis of the Economic Development Opportunities Associated with the Green Economy in NL
For analytical purposes, green energy supply and utilization was divided into three categories:
A. Utility-scale systems, such as major hydro-electric plants, wind farms, and large scale bio-refineries.
B. District-scale systems supplying energy to specific locales or even whole communities. These would
include power generation in off-grid communities, co-generation facilities at newsprint mills,
municipal waste-to-energy systems, small-scale bio-fuel production, and district heating systems.
Micro-grid technologies would also fall into this category.
C. Unit-scale systems supplying energy to individual buildings and / or individual energy conversion
devices, such as internal combustion engines, electrical appliances, and industrial machinery and
equipment. Unit scale systems include technologies such as solar hot water, geo-exchange, and
building integrated solar panels and small wind turbines.
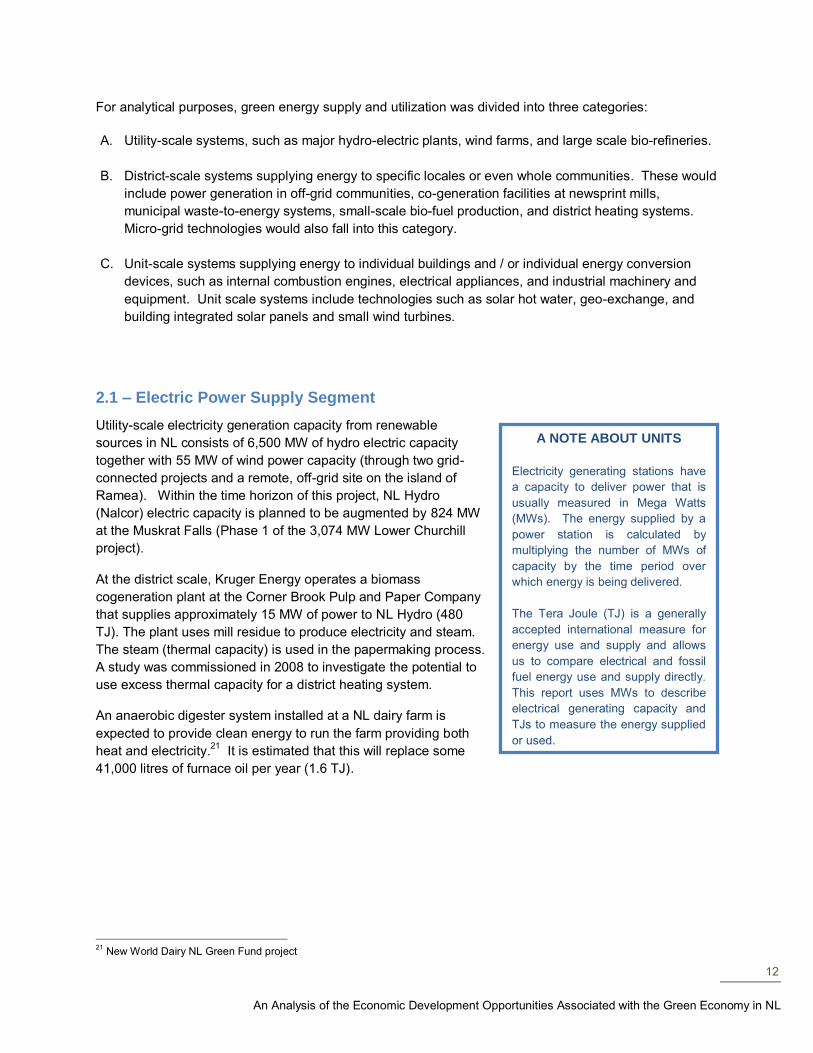
2.1 – Electric Power Supply Segment
Utility-scale electricity generation capacity from renewable
sources in NL consists of 6,500 MW of hydro electric capacity
together with 55 MW of wind power capacity (through two grid-
connected projects and a remote, off-grid site on the island of
Ramea). Within the time horizon of this project, NL Hydro
(Nalcor) electric capacity is planned to be augmented by 824 MW
at the Muskrat Falls (Phase 1 of the 3,074 MW Lower Churchill
project).
At the district scale, Kruger Energy operates a biomass
cogeneration plant at the Corner Brook Pulp and Paper Company
that supplies approximately 15 MW of power to NL Hydro (480
TJ). The plant uses mill residue to produce electricity and steam.
The steam (thermal capacity) is used in the papermaking process.
A study was commissioned in 2008 to investigate the potential to
use excess thermal capacity for a district heating system.
An anaerobic digester system installed at a NL dairy farm is
expected to provide clean energy to run the farm providing both
heat and electricity.21
It is estimated that this will replace some
41,000 litres of furnace oil per year (1.6 TJ).
21
New World Dairy NL Green Fund project
A NOTE ABOUT UNITS
Electricity generating stations have
a capacity to deliver power that is
usually measured in Mega Watts
(MWs). The energy supplied by a
power station is calculated by
multiplying the number of MWs of
capacity by the time period over
which energy is being delivered.
The Tera Joule (TJ) is a generally
accepted international measure for
energy use and supply and allows
us to compare electrical and fossil
fuel energy use and supply directly.
This report uses MWs to describe
electrical generating capacity and
TJs to measure the energy supplied
or used.
13
An Analysis of the Economic Development Opportunities Associated with the Green Economy in NL
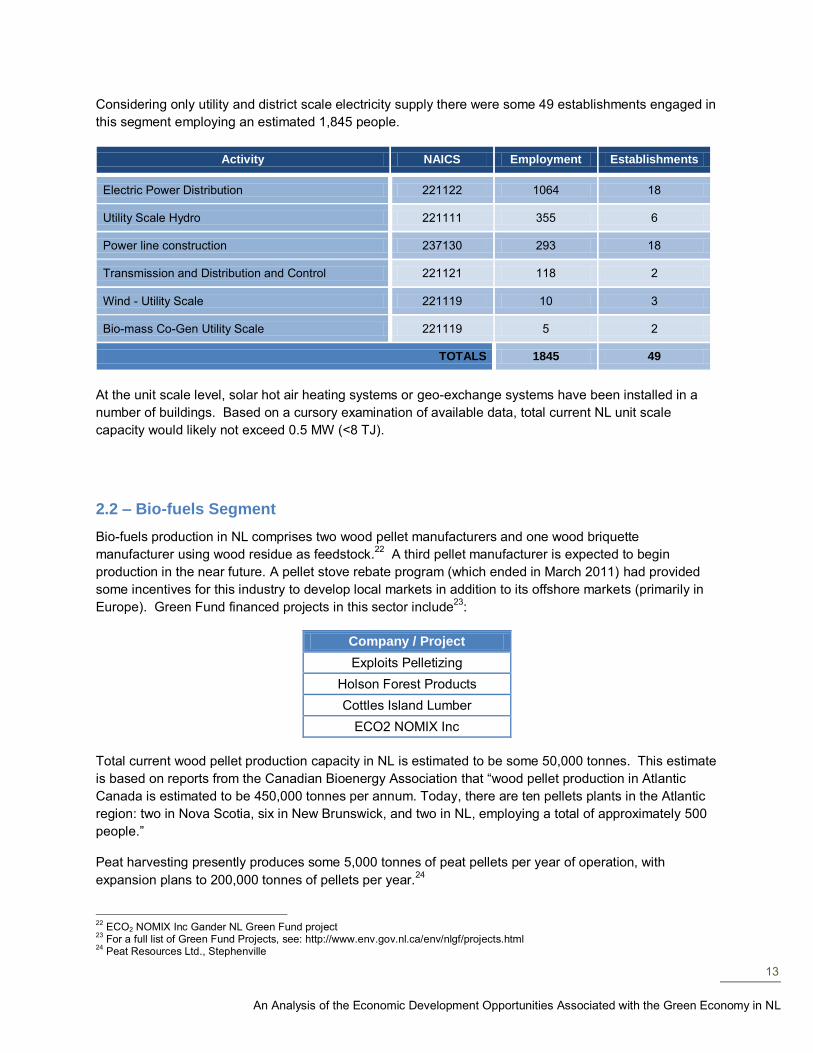
Considering only utility and district scale electricity supply there were some 49 establishments engaged in
this segment employing an estimated 1,845 people.
Activity NAICS Employment Establishments
Electric Power Distribution 221122 1064 18
Utility Scale Hydro 221111 355 6
Power line construction 237130 293 18
Transmission and Distribution and Control 221121 118 2
Wind - Utility Scale 221119 10 3
Bio-mass Co-Gen Utility Scale 221119 5 2
TOTALS 1845 49
At the unit scale level, solar hot air heating systems or geo-exchange systems have been installed in a
number of buildings. Based on a cursory examination of available data, total current NL unit scale
capacity would likely not exceed 0.5 MW (<8 TJ).
2.2 – Bio-fuels Segment
Bio-fuels production in NL comprises two wood pellet manufacturers and one wood briquette
manufacturer using wood residue as feedstock.22
A third pellet manufacturer is expected to begin
production in the near future. A pellet stove rebate program (which ended in March 2011) had provided
some incentives for this industry to develop local markets in addition to its offshore markets (primarily in
Europe). Green Fund financed projects in this sector include23
:
Company / Project
Exploits Pelletizing
Holson Forest Products
Cottles Island Lumber
ECO2 NOMIX Inc
Total current wood pellet production capacity in NL is estimated to be some 50,000 tonnes. This estimate
is based on reports from the Canadian Bioenergy Association that “wood pellet production in Atlantic
Canada is estimated to be 450,000 tonnes per annum. Today, there are ten pellets plants in the Atlantic
region: two in Nova Scotia, six in New Brunswick, and two in NL, employing a total of approximately 500
people.”
Peat harvesting presently produces some 5,000 tonnes of peat pellets per year of operation, with
expansion plans to 200,000 tonnes of pellets per year.24
22
ECO2 NOMIX Inc Gander NL Green Fund project 23
For a full list of Green Fund Projects, see: http://www.env.gov.nl.ca/env/nlgf/projects.html 24
Peat Resources Ltd., Stephenville
14
An Analysis of the Economic Development Opportunities Associated with the Green Economy in NL
Green Fund projects such as a Methane capture for energy supply purposes at the district scale
comprises a pilot project Landfill Gas Collecting and Flaring System (LGCFS) at the St. John’s landfill and
the planned dairy farm facility mentioned previously in Segment 2.1. also fall in this segment.
Waste-to-energy system developments include collection and refining of waste cooking oil from food
preparation for biodiesel manufacturing. It is estimated that approximately 1,700 tonnes of waste cooking
oil is produced in NL each year.25
Additionally, developmental work is in progress on the utilization of
fish waste to produce fish oil as a fuel source, either directly mixed with diesel fuel, or possibly as a
feedstock for biodiesel production.26
Phase 1 of a project to investigate the feasibility of developing a “biomass conversion to bio-fuels / bio-
chemicals facility” in NL as a sustainable way of diversifying the forestry industry was recently
completed.27
The Phase 1 report provides a thorough inventory of forest biomass residues in NL,
including construction wood waste together with detailed data on each biomass pool and the physical and
chemical properties of each pool.
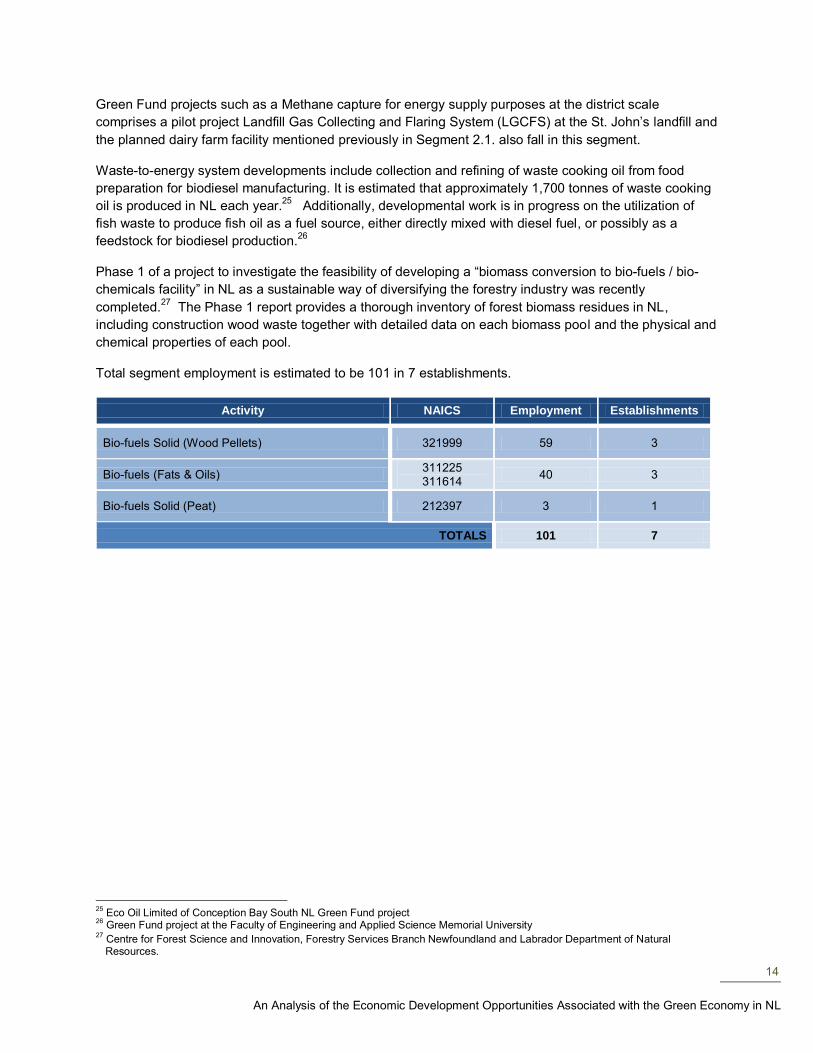
Total segment employment is estimated to be 101 in 7 establishments.
Activity NAICS Employment Establishments
Bio-fuels Solid (Wood Pellets) 321999 59 3
Bio-fuels (Fats & Oils) 311225 311614
40 3
Bio-fuels Solid (Peat) 212397 3 1
TOTALS 101 7
25
Eco Oil Limited of Conception Bay South NL Green Fund project 26
Green Fund project at the Faculty of Engineering and Applied Science Memorial University 27
Centre for Forest Science and Innovation, Forestry Services Branch Newfoundland and Labrador Department of Natural Resources.
15
An Analysis of the Economic Development Opportunities Associated with the Green Economy in NL
SECTOR 3 – GREEN BUILDING
Green building involves the design and construction and retrofitting of residential and non-residential
buildings together with the supply and installation of systems and services that:
Reduce energy consumption;
Protect occupant health and improve employee productivity; and
Reduce waste, pollution, and environmental degradation.
The main rating systems used across Canada for green building are:
Leadership in Energy and Environmental Design (LEED) Green Building Rating System;
EnerGuide Rating System (ERS);
R-2000 cost-effective energy-efficient building practices and technologies; and
Building Owners and Managers Association (BOMA) BESt (Building Environmental Standards).
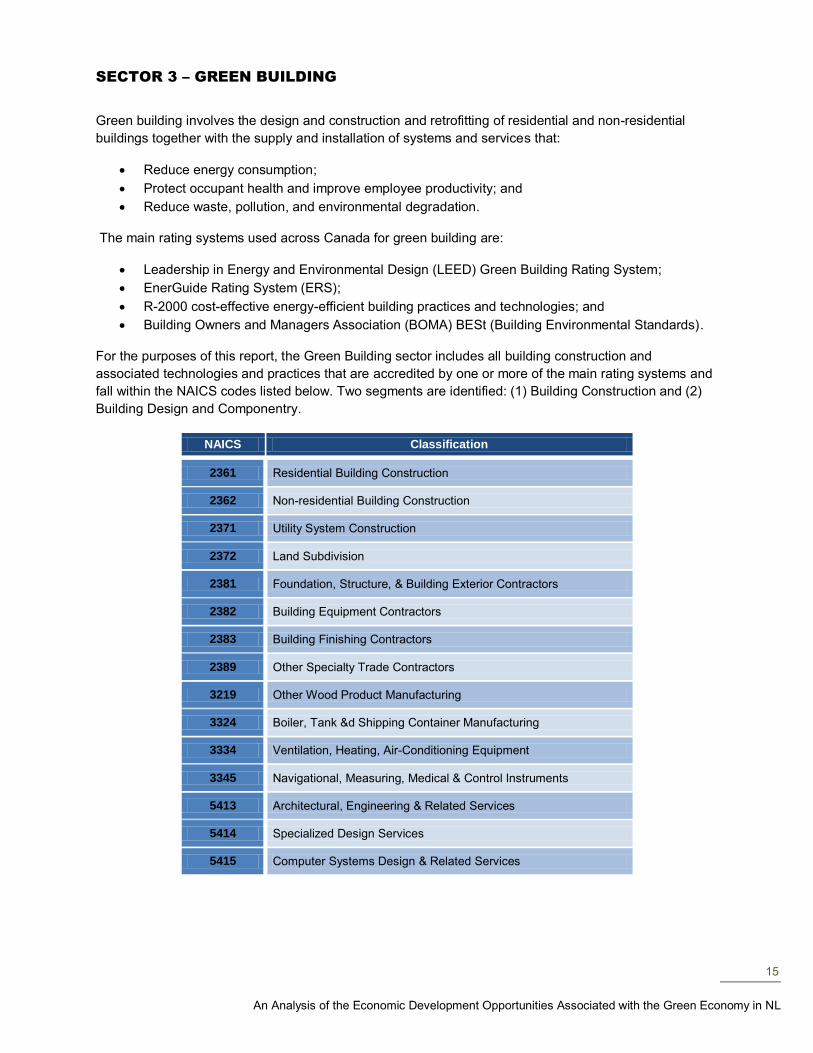
For the purposes of this report, the Green Building sector includes all building construction and
associated technologies and practices that are accredited by one or more of the main rating systems and
fall within the NAICS codes listed below. Two segments are identified: (1) Building Construction and (2)
Building Design and Componentry.
NAICS Classification
2361 Residential Building Construction
2362 Non-residential Building Construction
2371 Utility System Construction
2372 Land Subdivision
2381 Foundation, Structure, & Building Exterior Contractors
2382 Building Equipment Contractors
2383 Building Finishing Contractors
2389 Other Specialty Trade Contractors
3219 Other Wood Product Manufacturing
3324 Boiler, Tank &d Shipping Container Manufacturing
3334 Ventilation, Heating, Air-Conditioning Equipment
3345 Navigational, Measuring, Medical & Control Instruments
5413 Architectural, Engineering & Related Services
5414 Specialized Design Services
5415 Computer Systems Design & Related Services
16
An Analysis of the Economic Development Opportunities Associated with the Green Economy in NL
Green Building Market Share
A review of data concerning homes labelled under NRCan Rating System showed that across Canada:
The number of new green, energy efficient homes built in 2009 was equal to ~15 percent of the market
28;
884,000 homes have been “energy” rated or labelled in Canada between 1998 and 201029
;
587,000 homes received ERS ratings from the ecoENERGY Retrofit program from 2007 to 2010;
272,174 existing homes received ERS ratings from the EnerGuide for Homes program to 201030
;
20,499 new homes were rated under the EnerGuide Rating System (EGNH) before 2010;
A total of 12,808 new homes were certified R2000 before 2010; and
Energy savings on existing homes averaged 50 GJ / year / dwelling.
Data for NL from Canada Mortgage and Housing Corporation (CMHC)31
indicated that 2,419 (7 percent of
total) St. John’s home renovations in 2009 were for energy efficiency purposes and 56 percent of these
renovations used contract labour. Renovations accounted for approximately $319 million of residential
construction expenditures in 2009.22
There were some 1,970 mortgage loan approvals for new homes in NL in 200832
and 2008 housing starts
in NL totalled 3,261, of which those in St. John’s totalled 1,863.33
The value of mortgages for new
residential construction in 2009 was $453 million, while expenditures on residential construction (including
renovations), totalled $1,432 million.34
There are some 200,000 occupied dwelling units in NL, 74 percent
of which are single family dwellings (approximately 2 percent of the total Canadian housing stock). 35
Non-residential building construction has averaged 18 percent of total building construction expenditures
in NL from 2005 through 2009.36
A total of 36 LEED construction projects were registered for NL37
representing a total of some 380,000M2. An analysis of Major Capital Projects inventoried in the 2011
economic review showed that the LEED-registered projects are presently accounting for approximately
$140 million per year of non-residential building construction expenditure.
Taking these data into consideration, it is estimated that green building presently represents between 15
percent and 20 percent of total building construction expenditures in NL.
Assessment of the size of the green building design and componentry segment was addressed by a
review of various trade and association directories in the context of green building construction
expenditure estimates above.
In total, the Green Building sector is estimated to employ approximately 1,600 persons in 255
establishments.
28
Green New Home Labels – a discussion prepared for Canadian Home Builders’ Association October, 2010 29
NRCan, “Next Generation of the EnerGuide Rating System” 2010 presentation 30
NRCan report to CHBA 2009 31
Canada Mortgage and Housing Corporation Renovation and Home Purchase detailed tables 2010 32
Statistics Canada Mortgage loan approvals, new residential construction... by province and territory 33
St. Johns Annual Report 2008 34
Statistics Canada Capital expenditures for construction by sector, by province and territory 35
Canada Mortgage and Housing Corporation “Canadian Housing Observer” 36
Statistics Canada, Investment in non-residential building construction, by type of building and province 37
Canada Green Building Council 2011 inventory of LEED projects
17
An Analysis of the Economic Development Opportunities Associated with the Green Economy in NL
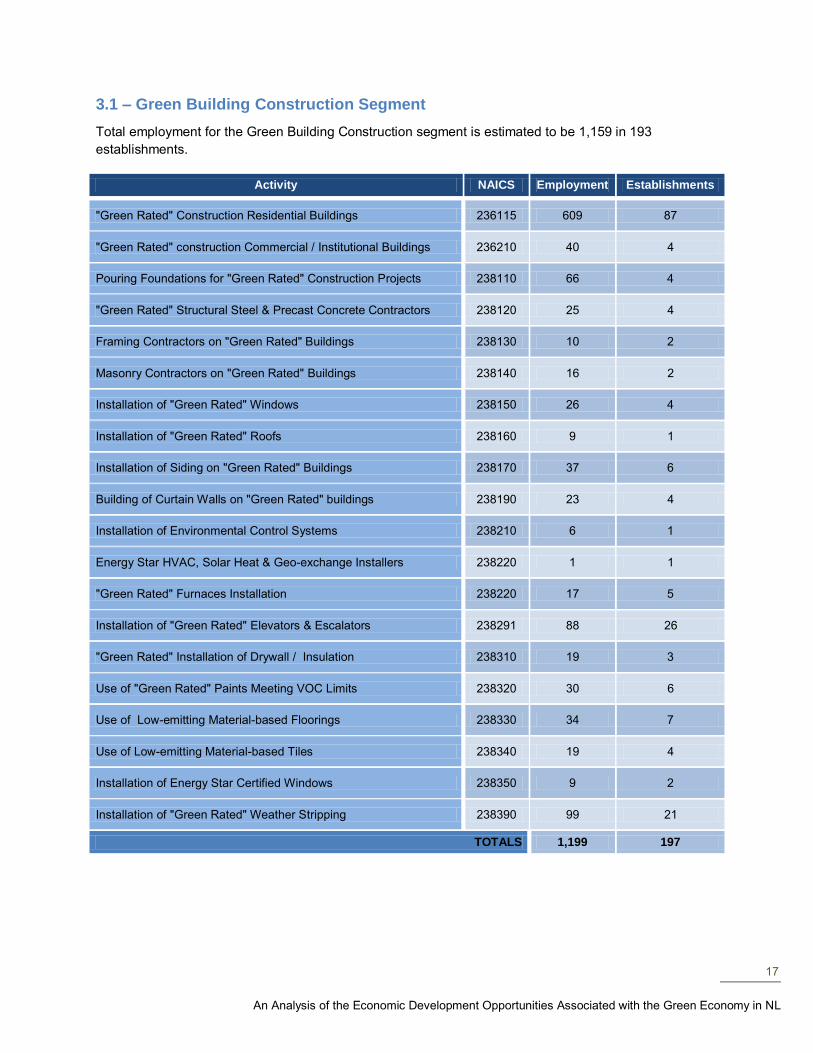
3.1 – Green Building Construction Segment
Total employment for the Green Building Construction segment is estimated to be 1,159 in 193
establishments.
Activity NAICS Employment Establishments
"Green Rated" Construction Residential Buildings 236115 609 87
"Green Rated" construction Commercial / Institutional Buildings 236210 40 4
Pouring Foundations for "Green Rated" Construction Projects 238110 66 4
"Green Rated" Structural Steel & Precast Concrete Contractors 238120 25 4
Framing Contractors on "Green Rated" Buildings 238130 10 2
Masonry Contractors on "Green Rated" Buildings 238140 16 2
Installation of "Green Rated" Windows 238150 26 4
Installation of "Green Rated" Roofs 238160 9 1
Installation of Siding on "Green Rated" Buildings 238170 37 6
Building of Curtain Walls on "Green Rated" buildings 238190 23 4
Installation of Environmental Control Systems 238210 6 1
Energy Star HVAC, Solar Heat & Geo-exchange Installers 238220 1 1
"Green Rated" Furnaces Installation 238220 17 5
Installation of "Green Rated" Elevators & Escalators 238291 88 26
"Green Rated" Installation of Drywall / Insulation 238310 19 3
Use of "Green Rated" Paints Meeting VOC Limits 238320 30 6
Use of Low-emitting Material-based Floorings 238330 34 7
Use of Low-emitting Material-based Tiles 238340 19 4
Installation of Energy Star Certified Windows 238350 9 2
Installation of "Green Rated" Weather Stripping 238390 99 21
TOTALS 1,199 197
18
An Analysis of the Economic Development Opportunities Associated with the Green Economy in NL
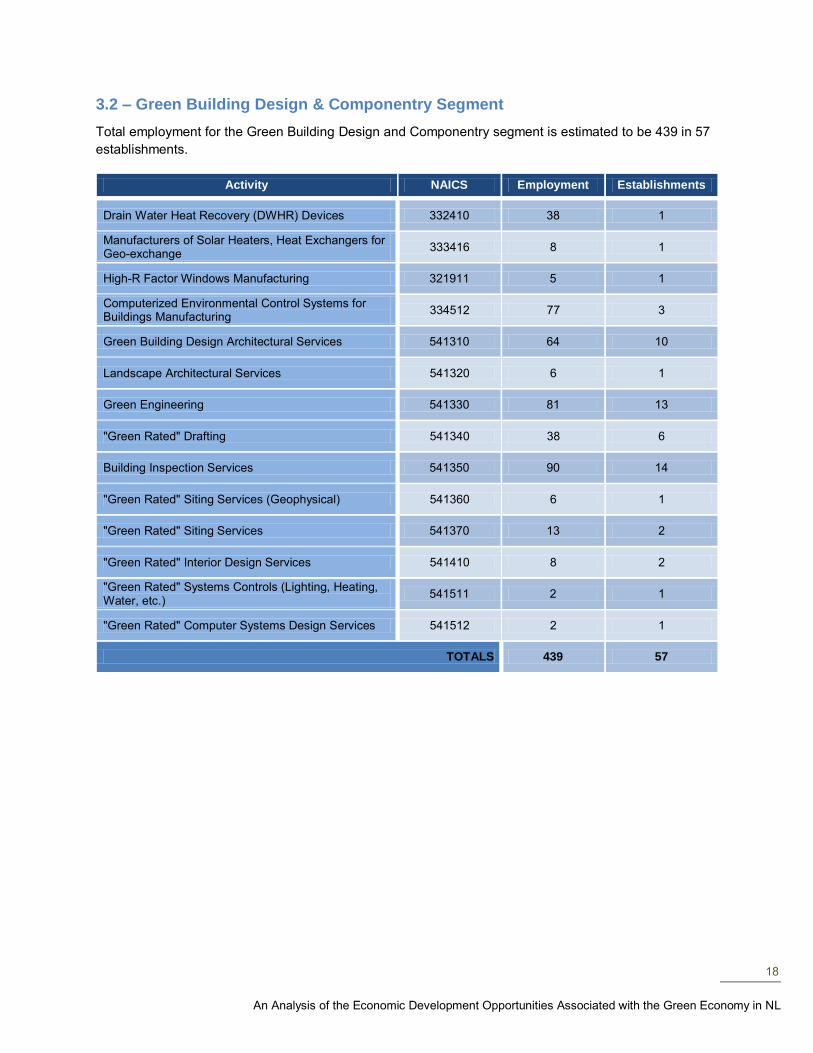
3.2 – Green Building Design & Componentry Segment
Total employment for the Green Building Design and Componentry segment is estimated to be 439 in 57
establishments.
Activity NAICS Employment Establishments
Drain Water Heat Recovery (DWHR) Devices 332410 38 1
Manufacturers of Solar Heaters, Heat Exchangers for Geo-exchange
333416 8 1
High-R Factor Windows Manufacturing 321911 5 1
Computerized Environmental Control Systems for Buildings Manufacturing
334512 77 3
Green Building Design Architectural Services 541310 64 10
Landscape Architectural Services 541320 6 1
Green Engineering 541330 81 13
"Green Rated" Drafting 541340 38 6
Building Inspection Services 541350 90 14
"Green Rated" Siting Services (Geophysical) 541360 6 1
"Green Rated" Siting Services 541370 13 2
"Green Rated" Interior Design Services 541410 8 2
"Green Rated" Systems Controls (Lighting, Heating, Water, etc.)
541511 2 1
"Green Rated" Computer Systems Design Services 541512 2 1
TOTALS 439 57
19
An Analysis of the Economic Development Opportunities Associated with the Green Economy in NL
SECTOR 4 – GREEN TRANSPORTATION
Green transportation relates to the reduction of emissions from the movement of goods and people and
includes two segments as described below.
1. Vehicle and vessel improvements:
Improved energy efficiency of individual vehicles (all types and all modes);
Utilization of bio-fuels, natural gas, or hydrogen in place of gasoline and diesel;
Replacement of Internal Combustion Engines (ICE’s) with electric motors (e.g., PHEV’s, hybrids,
etc.)
2. Systems improvements:
Improved fleet operations and more efficient fleet vehicles to reduce energy consumption;
Intelligent Transportation Systems;
Utilization of lower energy consumption transportation modes (e.g., buses and bicycles);
Efficient infrastructure and community planning to foster reduced energy consumption;
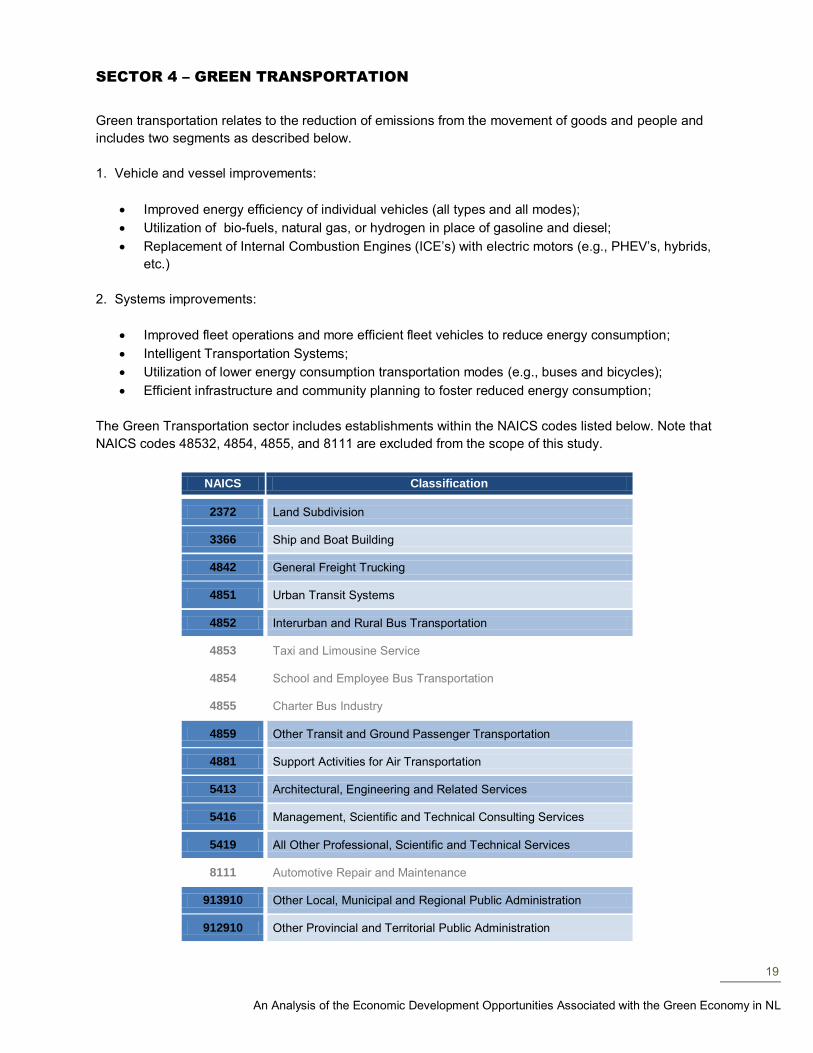
The Green Transportation sector includes establishments within the NAICS codes listed below. Note that
NAICS codes 48532, 4854, 4855, and 8111 are excluded from the scope of this study.
NAICS Classification
2372 Land Subdivision
3366 Ship and Boat Building
4842 General Freight Trucking
4851 Urban Transit Systems
4852 Interurban and Rural Bus Transportation
4853 Taxi and Limousine Service
4854 School and Employee Bus Transportation
4855 Charter Bus Industry
4859 Other Transit and Ground Passenger Transportation
4881 Support Activities for Air Transportation
5413 Architectural, Engineering and Related Services
5416 Management, Scientific and Technical Consulting Services
5419 All Other Professional, Scientific and Technical Services
8111 Automotive Repair and Maintenance
913910 Other Local, Municipal and Regional Public Administration
912910 Other Provincial and Territorial Public Administration
20
An Analysis of the Economic Development Opportunities Associated with the Green Economy in NL
According to Transport Canada, total transportation energy consumption in NL has increased from 43,000
TJ in 1999 to 56,000 TJ in 2009, a rate of approximately 1,245 TJ per year.38
Sixty-four percent of
transportation energy consumption in 2009 was for road vehicle transportation. Marine transportation
accounted for 15 percent and aviation for 21 percent. Road transportation accounted for 77 percent of
the increase in energy consumption.
4.1 – Vehicle & Vessel Improvements
The NL vehicle fleet consisted of approximately 480,000 vehicles in 2009, up from 340,000 in 199939
which is equivalent to a 41 percent increase in the fleet over that period. Cars, SUVs, and light trucks
made up 56 percent of the fleet, while off-road vehicles made up approximately 32 percent.
In 2009, the NL vehicle fleet consumed 24,800 TJ of gasoline and some 11,100 TJ of diesel fuel.40
Analysis of these data indicates that average annual energy consumption per vehicle has declined at the
rate of approximately 2 percent per year over the period 2005 through 2009. This trend mirrors a general
improvement in new vehicle fuel efficiency – as older vehicles are retired, newer, more fuel-efficient ones
take their places.
Initiatives to accelerate this trend include hybrid vehicle acquisitions for public sector vehicle fleets. For
example, 60 hybrid vehicles have been acquired by the provincial government.41
In addition, 5 hybrid
vehicles were acquired by the City of St. John’s for parking enforcement on the basis of annual saving of
2,350 litres of fuel and 28,200 kilograms of carbon dioxide.42
Considering improvements to bus fleets within the scope of this report, St. John’s Transportation
Commission (Metrobus) is utilizing a “mini-hybrid” thermal system on six buses. The systems replace
hydraulic fans and alternators that cut fuel consumption.43
With respect to marine vessels, the NL ferry fleets include Marine Atlantic44
, NL Government-operated
vessels45
, CAI Nunatsiavut Marine Inc., and Labrador Marine Inc., that in total are estimated to consume
approximately 3,000 TJ of diesel fuel per year.
The NL fishing fleet consisted of 3,577 vessels in 200446
, spending $29.5 million on an estimated 2700 TJ
of diesel fuel. In total, marine vessel fuel consumption in 2009 was 10,400 TJ.47
Transport Canada data
shows total marine fuel consumption has been trending downwards at the rate of approximately 170 TJ
per year from 1999 through 2009.
Projects to reduce energy consumption in marine transportation include a recent two-year study through
Memorial University of NL’s (MUN) Ocean Engineering Research Centre (OERC) to replace fishing
vessel bows with more energy efficient (bulbous) designs and fit them with anti-roll tanks, which has
potential to reduce energy consumption in the NL fishing fleet.48
38
Transportation in Canada Appendix P36 – Transport Canada 39
Statistics Canada, CANSIM Table 405-0004 40
NL Government data and Sales of fuel used for road motor vehicles, by province and territory – Statistics Canada 41
NL Department of Transportation and Works news release April 2011 “Green Vehicle Targets Exceeded” 42
City of St. John’s news release 2007 “City Fleet Starts Going Green!” 43
EMP Corp. News Release, June 2010 44
Marine Atlantic Inc. 45
NL Department of Transportation and Works Annual reports and 2006 Vessel Replacement Strategy Report by BMT Fleet Technology commissioned by the Department of Transportation and Works Annual
46 Fisheries and Oceans Canada Commercial Fisheries Publications 2004 Costs and Earnings Survey, Atlantic Region
47 Government of NL figures and Transportation in Canada Appendix P37 – Transport Canada
48 Friis, Dag, Don Bass, Wei Qiu, Christian Knapp, Robert McGrath, Stephen Lane, and Alex Gardner (2010), An Overview of Fishing Vessel Energy Efficiency Work in Newfoundland and Labrador, Canada.
21
An Analysis of the Economic Development Opportunities Associated with the Green Economy in NL
For aviation, total energy consumption in 2009 was reported by Transport Canada as 12,000 TJ. Total
aviation fuel consumption has been growing at an average rate of 460 TJ per year from 1999 through
2009. Total aircraft movement in NL averaged some 140,000 per year (2006 through 2009). Three
airports (i.e., St. John’s International, Gander International, and Goose Bay) accounted for an average of
approximately 112,000 movements over the period 2006 through 2010.49
Total movements through these
three airports fluctuated from a high of 125,000 in 2007 to a low of 95,000 in 2009. These data suggest
increasing movements of larger aircraft that individually consume more fuel, which is supported by
information from St. John’s International Airport that reports that since 1998, passenger traffic has
increased by more than 80 percent, with 2010 passenger numbers reaching 1.3 million.
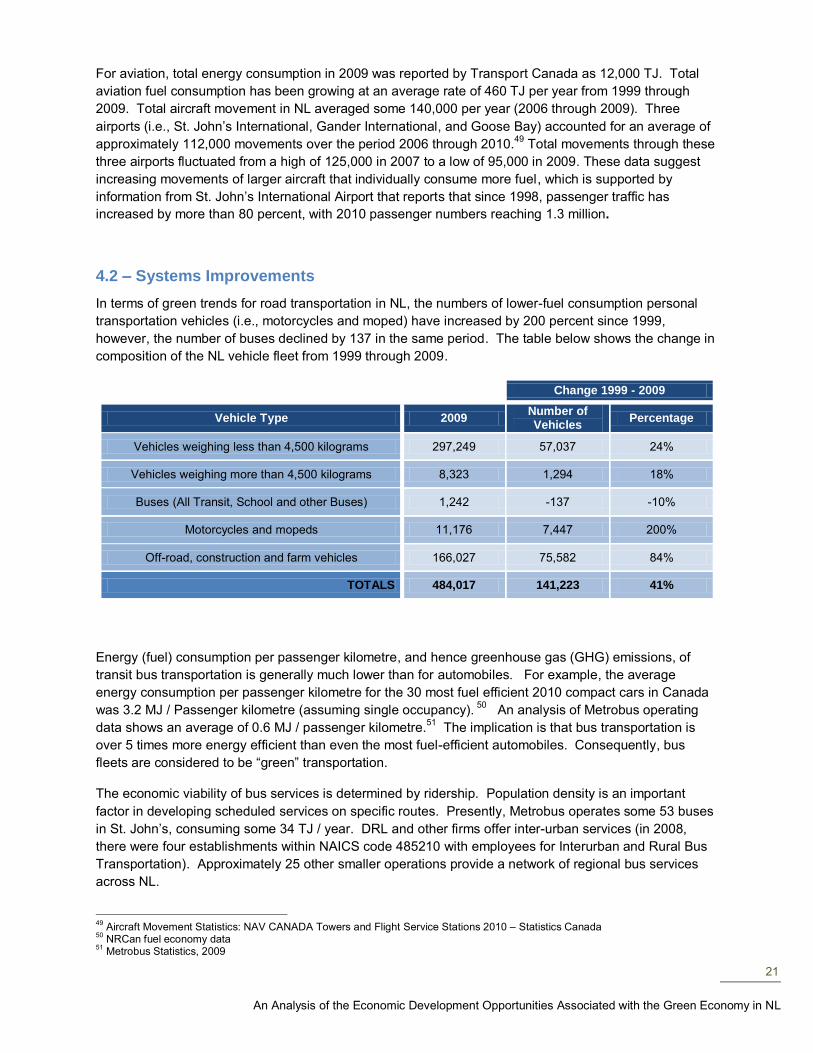
4.2 – Systems Improvements
In terms of green trends for road transportation in NL, the numbers of lower-fuel consumption personal
transportation vehicles (i.e., motorcycles and moped) have increased by 200 percent since 1999,
however, the number of buses declined by 137 in the same period. The table below shows the change in
composition of the NL vehicle fleet from 1999 through 2009.
Change 1999 - 2009
Vehicle Type 2009 Number of Vehicles
Percentage
Vehicles weighing less than 4,500 kilograms 297,249 57,037 24%
Vehicles weighing more than 4,500 kilograms 8,323 1,294 18%
Buses (All Transit, School and other Buses) 1,242 -137 -10%
Motorcycles and mopeds 11,176 7,447 200%
Off-road, construction and farm vehicles 166,027 75,582 84%
TOTALS 484,017 141,223 41%
Energy (fuel) consumption per passenger kilometre, and hence greenhouse gas (GHG) emissions, of
transit bus transportation is generally much lower than for automobiles. For example, the average
energy consumption per passenger kilometre for the 30 most fuel efficient 2010 compact cars in Canada
was 3.2 MJ / Passenger kilometre (assuming single occupancy). 50
An analysis of Metrobus operating
data shows an average of 0.6 MJ / passenger kilometre.51
The implication is that bus transportation is
over 5 times more energy efficient than even the most fuel-efficient automobiles. Consequently, bus
fleets are considered to be “green” transportation.
The economic viability of bus services is determined by ridership. Population density is an important
factor in developing scheduled services on specific routes. Presently, Metrobus operates some 53 buses
in St. John’s, consuming some 34 TJ / year. DRL and other firms offer inter-urban services (in 2008,
there were four establishments within NAICS code 485210 with employees for Interurban and Rural Bus
Transportation). Approximately 25 other smaller operations provide a network of regional bus services
across NL.
49
Aircraft Movement Statistics: NAV CANADA Towers and Flight Service Stations 2010 – Statistics Canada 50
NRCan fuel economy data 51
Metrobus Statistics, 2009
22
An Analysis of the Economic Development Opportunities Associated with the Green Economy in NL
Other road system developments include the St. John's Cycling Master Plan that involves a network of
cycle routes and new infrastructure to improve the safety and convenience of using bicycles for personal
transportation within the city.
With regard to marine operations, utilization of “smart buoys” for marine weather forecasting is expected
to improve weather forecasting and so improve logistics and safety for marine vessel operators. To those
ends, the Canadian Centre for Marine Communications has initiated smart buoy deployments in the
Placentia Bay region.52
With regard to air transportation, the Gander International Airport Authority (GIAA) has set a goal of
reducing its carbon emissions by 33 percent by 2020. GIAA has a carbon emissions reduction program
that involves a number of infrastructure and employee initiatives as well as the purchase of carbon
offsets. GIAA recently announced it had become the first carbon neutral airport in the world.53
Other
green initiatives include a 45,000 square meter Central De-icing Facility at St. John’s International Airport
that captures and controls the release of effluent remaining after an aircraft has been de-iced.
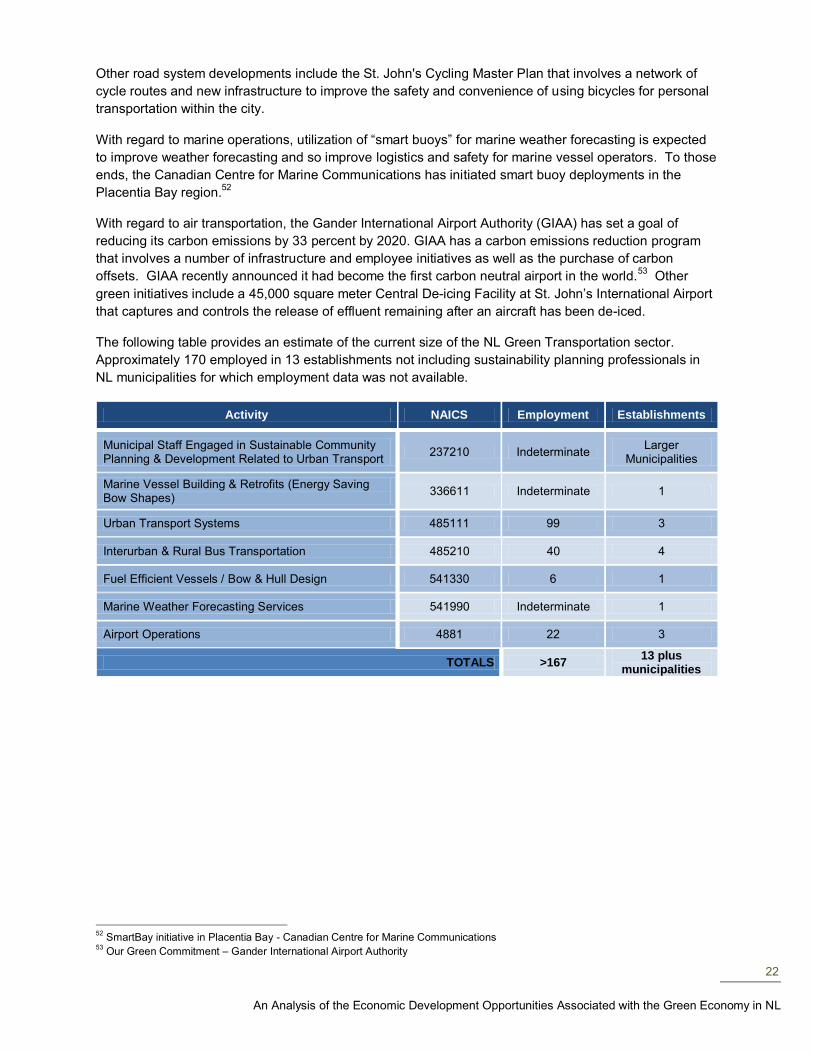
The following table provides an estimate of the current size of the NL Green Transportation sector.
Approximately 170 employed in 13 establishments not including sustainability planning professionals in
NL municipalities for which employment data was not available.
Activity NAICS Employment Establishments
Municipal Staff Engaged in Sustainable Community Planning & Development Related to Urban Transport
237210 Indeterminate Larger
Municipalities
Marine Vessel Building & Retrofits (Energy Saving Bow Shapes)
336611 Indeterminate 1
Urban Transport Systems 485111 99 3
Interurban & Rural Bus Transportation 485210 40 4
Fuel Efficient Vessels / Bow & Hull Design 541330 6 1
Marine Weather Forecasting Services 541990 Indeterminate 1
Airport Operations 4881 22 3
TOTALS >167 13 plus
municipalities
52
SmartBay initiative in Placentia Bay - Canadian Centre for Marine Communications 53
Our Green Commitment – Gander International Airport Authority
23
An Analysis of the Economic Development Opportunities Associated with the Green Economy in NL
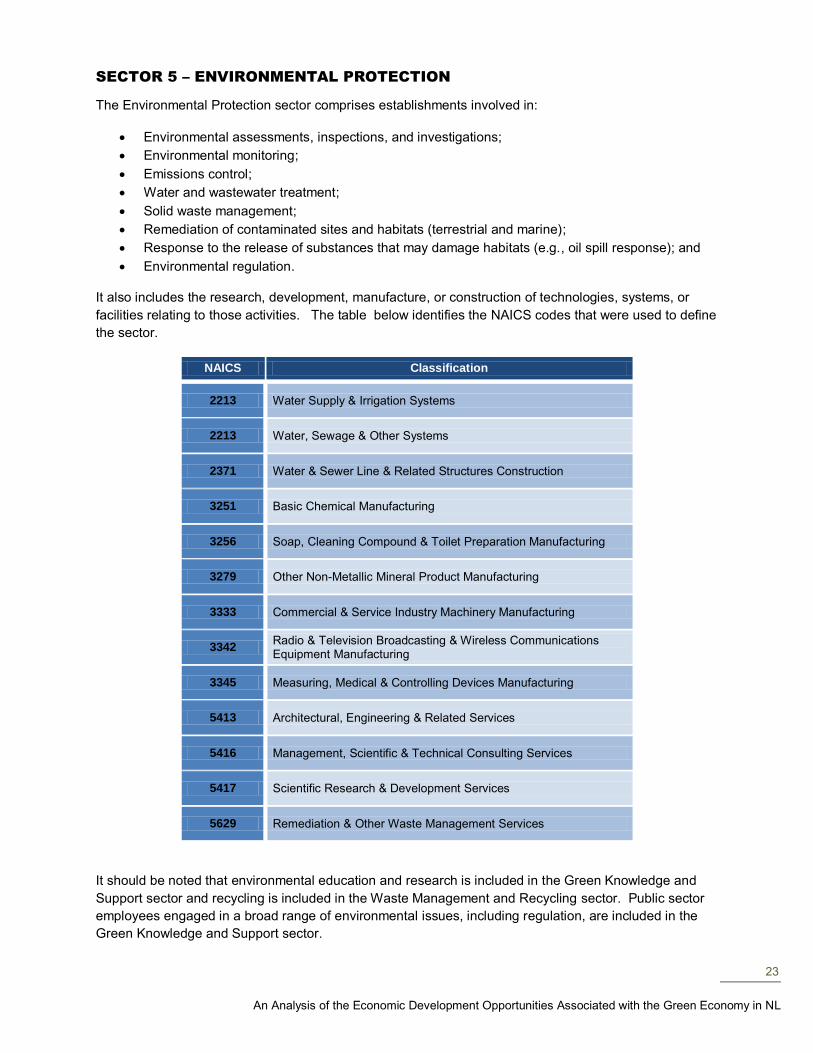
SECTOR 5 – ENVIRONMENTAL PROTECTION
The Environmental Protection sector comprises establishments involved in:
Environmental assessments, inspections, and investigations;
Environmental monitoring;
Emissions control;
Water and wastewater treatment;
Solid waste management;
Remediation of contaminated sites and habitats (terrestrial and marine);
Response to the release of substances that may damage habitats (e.g., oil spill response); and
Environmental regulation.
It also includes the research, development, manufacture, or construction of technologies, systems, or
facilities relating to those activities. The table below identifies the NAICS codes that were used to define
the sector.
NAICS Classification
2213 Water Supply & Irrigation Systems
2213 Water, Sewage & Other Systems
2371 Water & Sewer Line & Related Structures Construction
3251 Basic Chemical Manufacturing
3256 Soap, Cleaning Compound & Toilet Preparation Manufacturing
3279 Other Non-Metallic Mineral Product Manufacturing
3333 Commercial & Service Industry Machinery Manufacturing
3342 Radio & Television Broadcasting & Wireless Communications Equipment Manufacturing
3345 Measuring, Medical & Controlling Devices Manufacturing
5413 Architectural, Engineering & Related Services
5416 Management, Scientific & Technical Consulting Services
5417 Scientific Research & Development Services
5629 Remediation & Other Waste Management Services
It should be noted that environmental education and research is included in the Green Knowledge and
Support sector and recycling is included in the Waste Management and Recycling sector. Public sector
employees engaged in a broad range of environmental issues, including regulation, are included in the
Green Knowledge and Support sector.
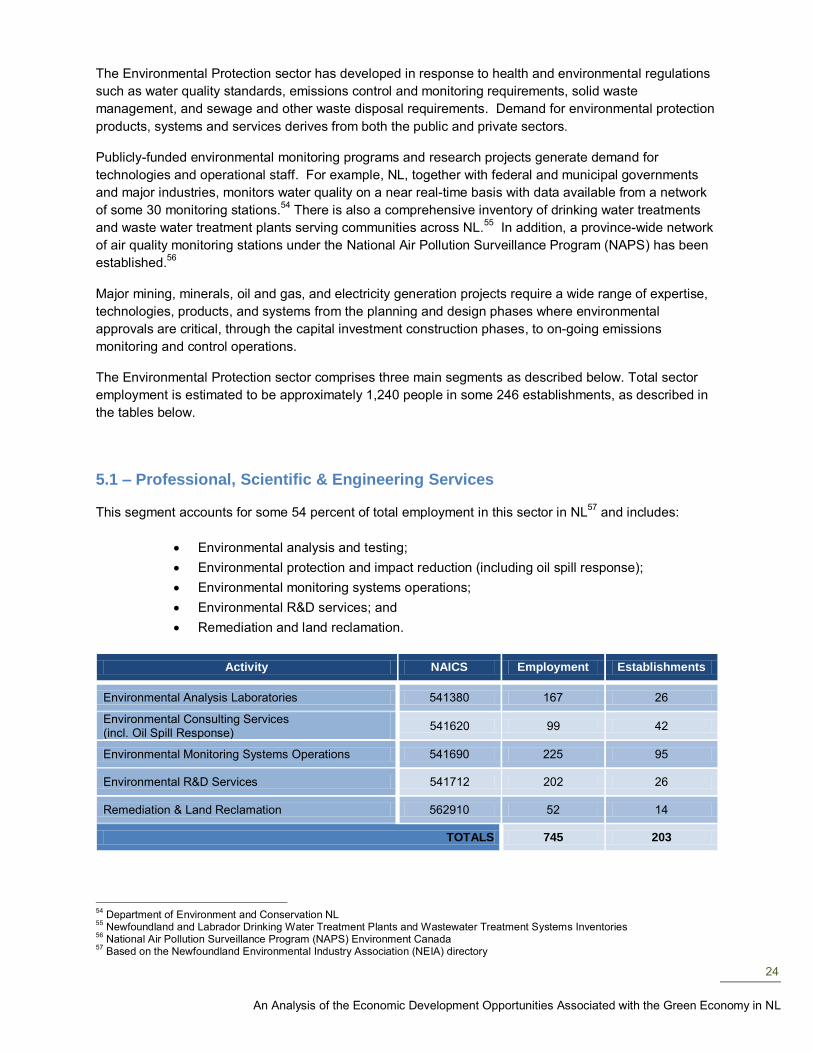
24
An Analysis of the Economic Development Opportunities Associated with the Green Economy in NL
The Environmental Protection sector has developed in response to health and environmental regulations
such as water quality standards, emissions control and monitoring requirements, solid waste
management, and sewage and other waste disposal requirements. Demand for environmental protection
products, systems and services derives from both the public and private sectors.
Publicly-funded environmental monitoring programs and research projects generate demand for
technologies and operational staff. For example, NL, together with federal and municipal governments
and major industries, monitors water quality on a near real-time basis with data available from a network
of some 30 monitoring stations.54
There is also a comprehensive inventory of drinking water treatments
and waste water treatment plants serving communities across NL.55
In addition, a province-wide network
of air quality monitoring stations under the National Air Pollution Surveillance Program (NAPS) has been
established.56
Major mining, minerals, oil and gas, and electricity generation projects require a wide range of expertise,
technologies, products, and systems from the planning and design phases where environmental
approvals are critical, through the capital investment construction phases, to on-going emissions
monitoring and control operations.
The Environmental Protection sector comprises three main segments as described below. Total sector
employment is estimated to be approximately 1,240 people in some 246 establishments, as described in
the tables below.
5.1 – Professional, Scientific & Engineering Services
This segment accounts for some 54 percent of total employment in this sector in NL57
and includes:
Environmental analysis and testing;
Environmental protection and impact reduction (including oil spill response);
Environmental monitoring systems operations;
Environmental R&D services; and
Remediation and land reclamation.
Activity NAICS Employment Establishments
Environmental Analysis Laboratories 541380 167 26
Environmental Consulting Services (incl. Oil Spill Response)
541620 99 42
Environmental Monitoring Systems Operations 541690 225 95
Environmental R&D Services 541712 202 26
Remediation & Land Reclamation 562910 52 14
TOTALS 745 203
54
Department of Environment and Conservation NL 55
Newfoundland and Labrador Drinking Water Treatment Plants and Wastewater Treatment Systems Inventories 56
National Air Pollution Surveillance Program (NAPS) Environment Canada 57
Based on the Newfoundland Environmental Industry Association (NEIA) directory
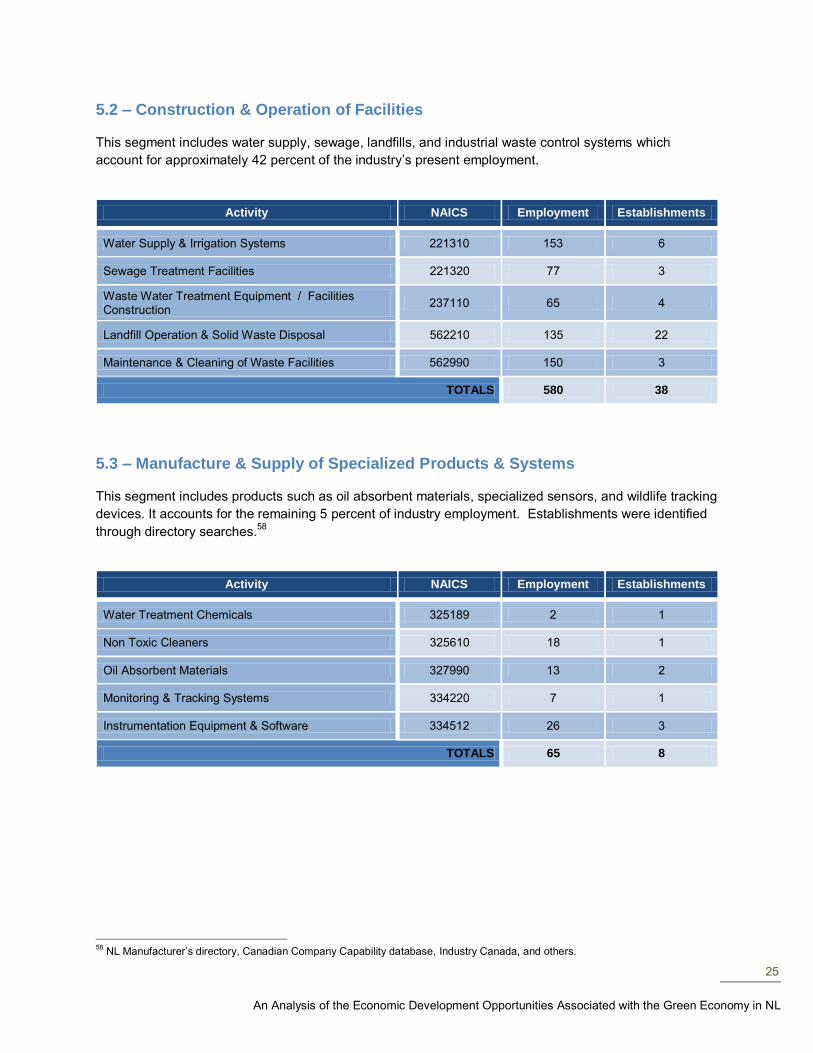
25
An Analysis of the Economic Development Opportunities Associated with the Green Economy in NL
5.2 – Construction & Operation of Facilities
This segment includes water supply, sewage, landfills, and industrial waste control systems which
account for approximately 42 percent of the industry’s present employment.
Activity NAICS Employment Establishments
Water Supply & Irrigation Systems 221310 153 6
Sewage Treatment Facilities 221320 77 3
Waste Water Treatment Equipment / Facilities Construction
237110 65 4
Landfill Operation & Solid Waste Disposal 562210 135 22
Maintenance & Cleaning of Waste Facilities 562990 150 3
TOTALS 580 38
5.3 – Manufacture & Supply of Specialized Products & Systems
This segment includes products such as oil absorbent materials, specialized sensors, and wildlife tracking
devices. It accounts for the remaining 5 percent of industry employment. Establishments were identified
through directory searches.58
Activity NAICS Employment Establishments
Water Treatment Chemicals 325189 2 1
Non Toxic Cleaners 325610 18 1
Oil Absorbent Materials 327990 13 2
Monitoring & Tracking Systems 334220 7 1
Instrumentation Equipment & Software 334512 26 3
TOTALS 65 8
58
NL Manufacturer’s directory, Canadian Company Capability database, Industry Canada, and others.
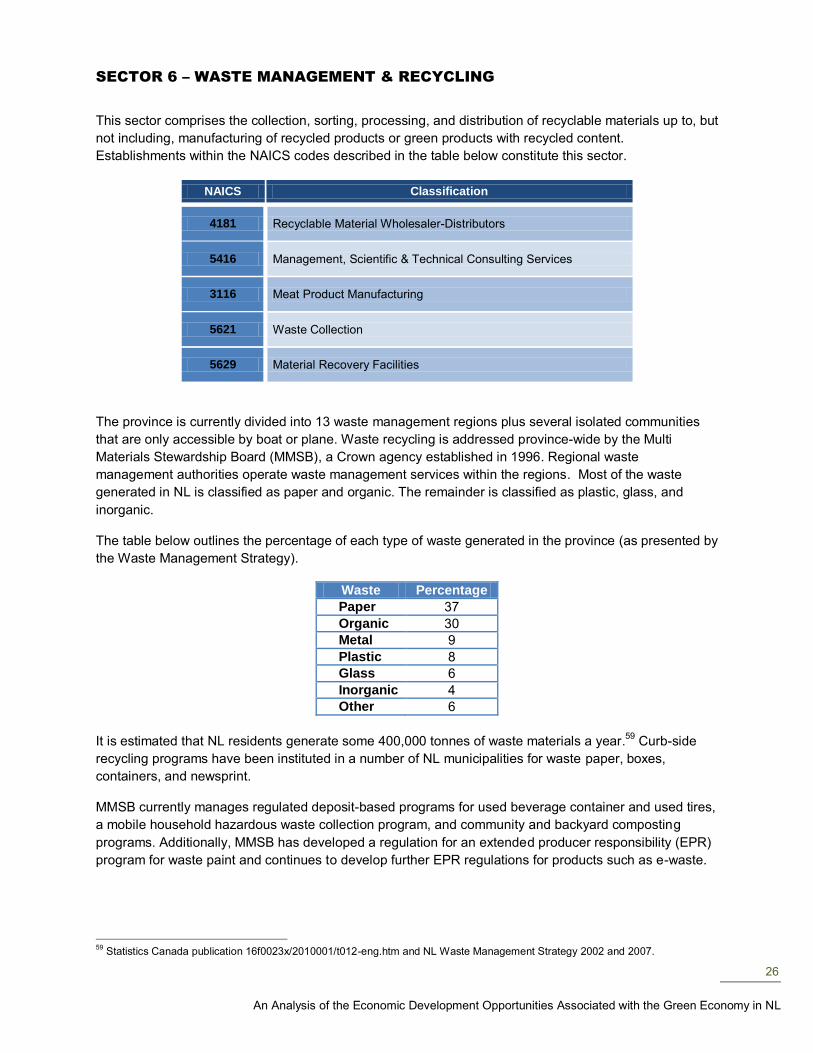
26
An Analysis of the Economic Development Opportunities Associated with the Green Economy in NL
SECTOR 6 – WASTE MANAGEMENT & RECYCLING
This sector comprises the collection, sorting, processing, and distribution of recyclable materials up to, but
not including, manufacturing of recycled products or green products with recycled content.
Establishments within the NAICS codes described in the table below constitute this sector.
NAICS Classification
4181 Recyclable Material Wholesaler-Distributors
5416 Management, Scientific & Technical Consulting Services
3116 Meat Product Manufacturing
5621 Waste Collection
5629 Material Recovery Facilities
The province is currently divided into 13 waste management regions plus several isolated communities
that are only accessible by boat or plane. Waste recycling is addressed province-wide by the Multi
Materials Stewardship Board (MMSB), a Crown agency established in 1996. Regional waste
management authorities operate waste management services within the regions. Most of the waste
generated in NL is classified as paper and organic. The remainder is classified as plastic, glass, and
inorganic.
The table below outlines the percentage of each type of waste generated in the province (as presented by
the Waste Management Strategy).
Waste Percentage
Paper 37
Organic 30
Metal 9
Plastic 8
Glass 6
Inorganic 4
Other 6
It is estimated that NL residents generate some 400,000 tonnes of waste materials a year.59
Curb-side
recycling programs have been instituted in a number of NL municipalities for waste paper, boxes,
containers, and newsprint.
MMSB currently manages regulated deposit-based programs for used beverage container and used tires,
a mobile household hazardous waste collection program, and community and backyard composting
programs. Additionally, MMSB has developed a regulation for an extended producer responsibility (EPR)
program for waste paint and continues to develop further EPR regulations for products such as e-waste.
59
Statistics Canada publication 16f0023x/2010001/t012-eng.htm and NL Waste Management Strategy 2002 and 2007.
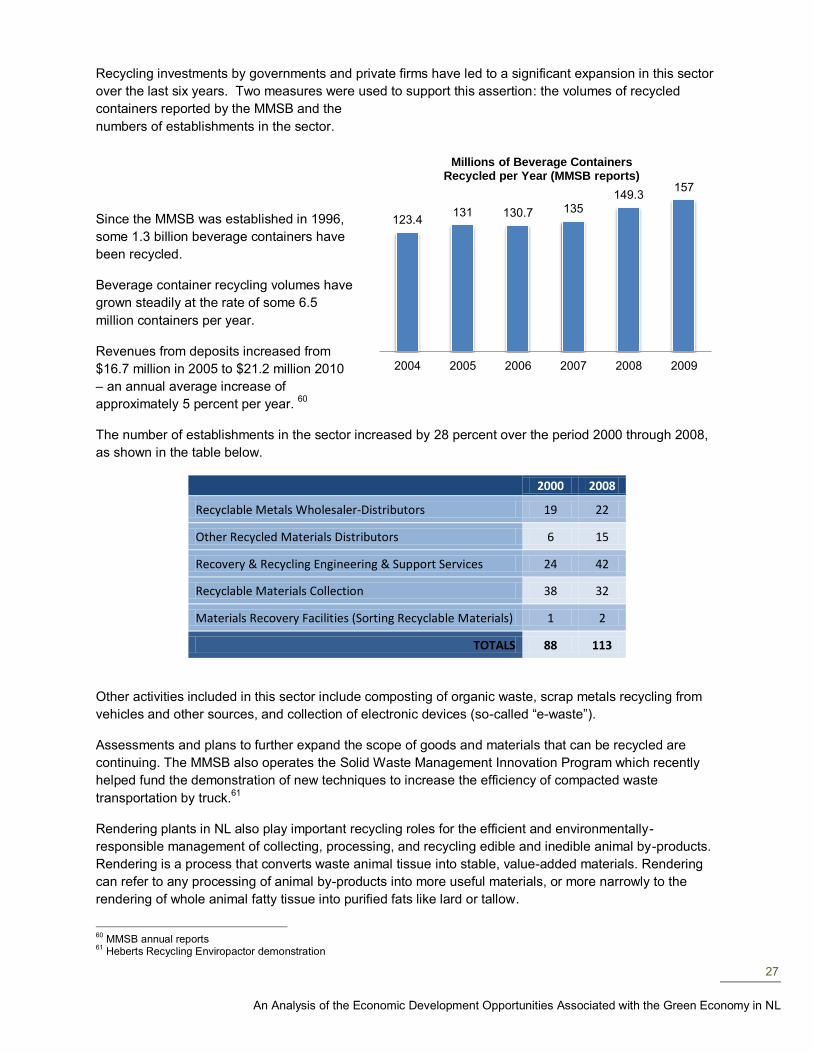
27
An Analysis of the Economic Development Opportunities Associated with the Green Economy in NL
Recycling investments by governments and private firms have led to a significant expansion in this sector
over the last six years. Two measures were used to support this assertion: the volumes of recycled
containers reported by the MMSB and the
numbers of establishments in the sector.
Since the MMSB was established in 1996,
some 1.3 billion beverage containers have
been recycled.
Beverage container recycling volumes have
grown steadily at the rate of some 6.5
million containers per year.
Revenues from deposits increased from
$16.7 million in 2005 to $21.2 million 2010
– an annual average increase of
approximately 5 percent per year. 60
The number of establishments in the sector increased by 28 percent over the period 2000 through 2008,
as shown in the table below.
2000 2008
Recyclable Metals Wholesaler-Distributors 19 22
Other Recycled Materials Distributors 6 15
Recovery & Recycling Engineering & Support Services 24 42
Recyclable Materials Collection 38 32
Materials Recovery Facilities (Sorting Recyclable Materials) 1 2
TOTALS 88 113
Other activities included in this sector include composting of organic waste, scrap metals recycling from
vehicles and other sources, and collection of electronic devices (so-called “e-waste”).
Assessments and plans to further expand the scope of goods and materials that can be recycled are
continuing. The MMSB also operates the Solid Waste Management Innovation Program which recently
helped fund the demonstration of new techniques to increase the efficiency of compacted waste
transportation by truck.61
Rendering plants in NL also play important recycling roles for the efficient and environmentally-
responsible management of collecting, processing, and recycling edible and inedible animal by-products.
Rendering is a process that converts waste animal tissue into stable, value-added materials. Rendering
can refer to any processing of animal by-products into more useful materials, or more narrowly to the
rendering of whole animal fatty tissue into purified fats like lard or tallow.
60
MMSB annual reports 61
Heberts Recycling Enviropactor demonstration
123.4 131 130.7 135
149.3 157
2004 2005 2006 2007 2008 2009
Millions of Beverage Containers Recycled per Year (MMSB reports)
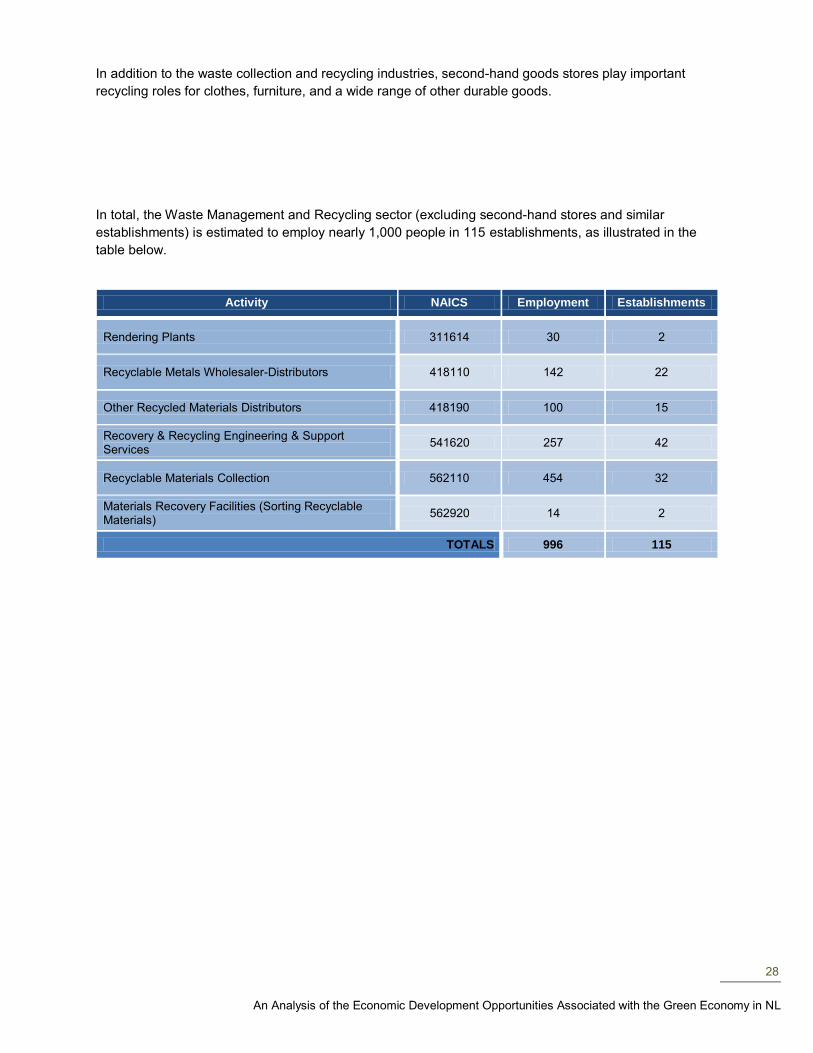
28
An Analysis of the Economic Development Opportunities Associated with the Green Economy in NL
In addition to the waste collection and recycling industries, second-hand goods stores play important
recycling roles for clothes, furniture, and a wide range of other durable goods.
In total, the Waste Management and Recycling sector (excluding second-hand stores and similar
establishments) is estimated to employ nearly 1,000 people in 115 establishments, as illustrated in the
table below.
Activity NAICS Employment Establishments
Rendering Plants 311614 30 2
Recyclable Metals Wholesaler-Distributors 418110 142 22
Other Recycled Materials Distributors 418190 100 15
Recovery & Recycling Engineering & Support Services
541620 257 42
Recyclable Materials Collection 562110 454 32
Materials Recovery Facilities (Sorting Recyclable Materials)
562920 14 2
TOTALS 996 115
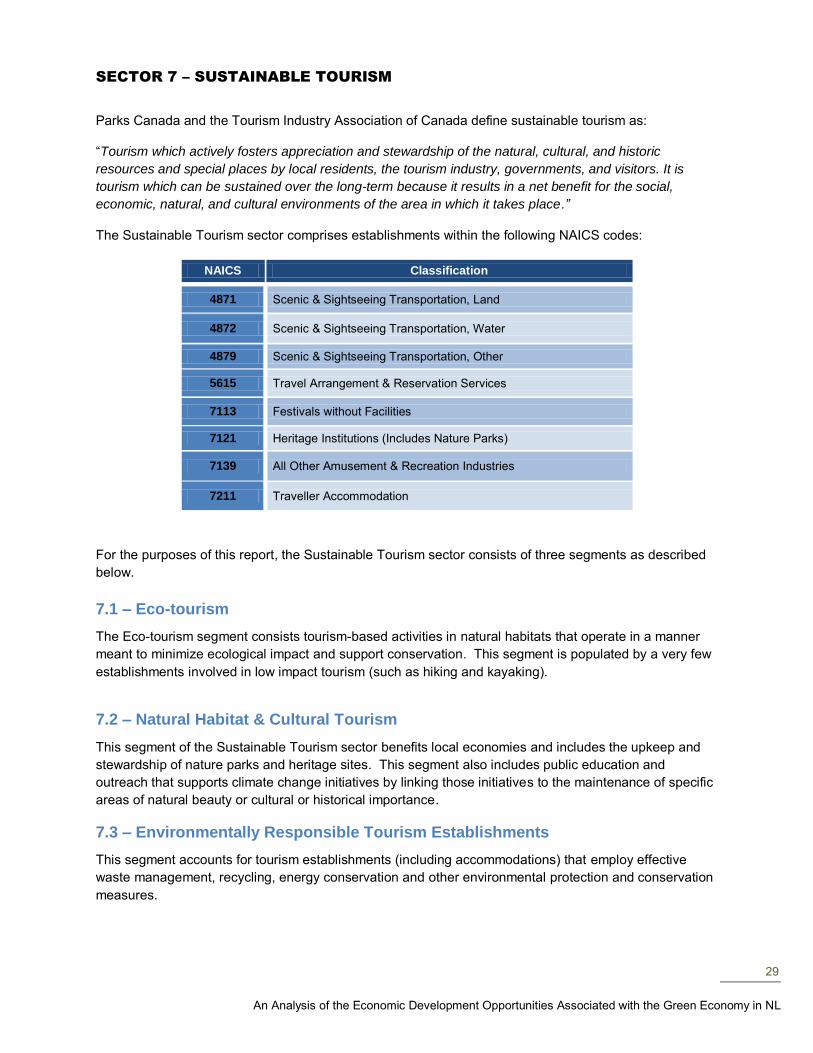
29
An Analysis of the Economic Development Opportunities Associated with the Green Economy in NL
SECTOR 7 – SUSTAINABLE TOURISM
Parks Canada and the Tourism Industry Association of Canada define sustainable tourism as:
“Tourism which actively fosters appreciation and stewardship of the natural, cultural, and historic
resources and special places by local residents, the tourism industry, governments, and visitors. It is
tourism which can be sustained over the long-term because it results in a net benefit for the social,
economic, natural, and cultural environments of the area in which it takes place.”
The Sustainable Tourism sector comprises establishments within the following NAICS codes:
NAICS Classification
4871 Scenic & Sightseeing Transportation, Land
4872 Scenic & Sightseeing Transportation, Water
4879 Scenic & Sightseeing Transportation, Other
5615 Travel Arrangement & Reservation Services
7113 Festivals without Facilities
7121 Heritage Institutions (Includes Nature Parks)
7139 All Other Amusement & Recreation Industries
7211 Traveller Accommodation
For the purposes of this report, the Sustainable Tourism sector consists of three segments as described
below.
7.1 – Eco-tourism
The Eco-tourism segment consists tourism-based activities in natural habitats that operate in a manner
meant to minimize ecological impact and support conservation. This segment is populated by a very few
establishments involved in low impact tourism (such as hiking and kayaking).
7.2 – Natural Habitat & Cultural Tourism
This segment of the Sustainable Tourism sector benefits local economies and includes the upkeep and
stewardship of nature parks and heritage sites. This segment also includes public education and
outreach that supports climate change initiatives by linking those initiatives to the maintenance of specific
areas of natural beauty or cultural or historical importance.
7.3 – Environmentally Responsible Tourism Establishments
This segment accounts for tourism establishments (including accommodations) that employ effective
waste management, recycling, energy conservation and other environmental protection and conservation
measures.
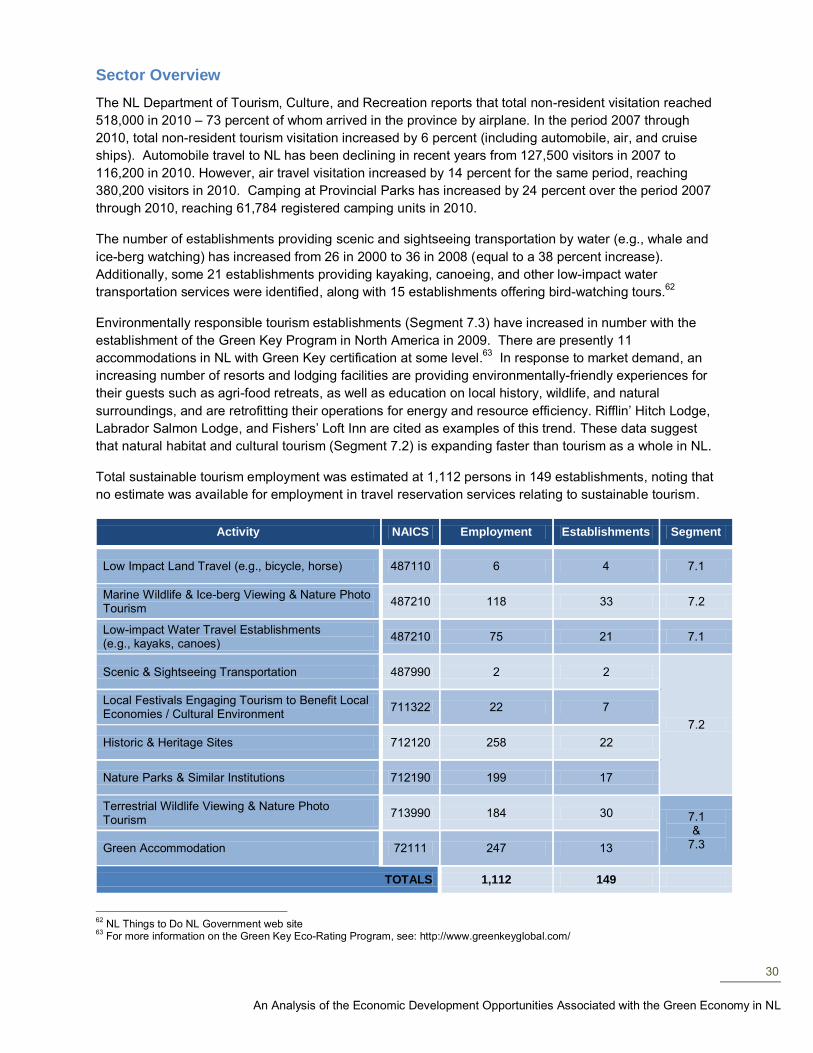
30
An Analysis of the Economic Development Opportunities Associated with the Green Economy in NL
Sector Overview
The NL Department of Tourism, Culture, and Recreation reports that total non-resident visitation reached
518,000 in 2010 – 73 percent of whom arrived in the province by airplane. In the period 2007 through
2010, total non-resident tourism visitation increased by 6 percent (including automobile, air, and cruise
ships). Automobile travel to NL has been declining in recent years from 127,500 visitors in 2007 to
116,200 in 2010. However, air travel visitation increased by 14 percent for the same period, reaching
380,200 visitors in 2010. Camping at Provincial Parks has increased by 24 percent over the period 2007
through 2010, reaching 61,784 registered camping units in 2010.
The number of establishments providing scenic and sightseeing transportation by water (e.g., whale and
ice-berg watching) has increased from 26 in 2000 to 36 in 2008 (equal to a 38 percent increase).
Additionally, some 21 establishments providing kayaking, canoeing, and other low-impact water
transportation services were identified, along with 15 establishments offering bird-watching tours.62
Environmentally responsible tourism establishments (Segment 7.3) have increased in number with the
establishment of the Green Key Program in North America in 2009. There are presently 11
accommodations in NL with Green Key certification at some level.63
In response to market demand, an
increasing number of resorts and lodging facilities are providing environmentally-friendly experiences for
their guests such as agri-food retreats, as well as education on local history, wildlife, and natural
surroundings, and are retrofitting their operations for energy and resource efficiency. Rifflin’ Hitch Lodge,
Labrador Salmon Lodge, and Fishers’ Loft Inn are cited as examples of this trend. These data suggest
that natural habitat and cultural tourism (Segment 7.2) is expanding faster than tourism as a whole in NL.
Total sustainable tourism employment was estimated at 1,112 persons in 149 establishments, noting that
no estimate was available for employment in travel reservation services relating to sustainable tourism.
Activity NAICS Employment Establishments Segment
Low Impact Land Travel (e.g., bicycle, horse) 487110 6 4 7.1
Marine Wildlife & Ice-berg Viewing & Nature Photo Tourism
487210 118 33 7.2
Low-impact Water Travel Establishments (e.g., kayaks, canoes)
487210 75 21 7.1
Scenic & Sightseeing Transportation 487990 2 2
7.2
Local Festivals Engaging Tourism to Benefit Local Economies / Cultural Environment
711322 22 7
Historic & Heritage Sites 712120 258 22
Nature Parks & Similar Institutions 712190 199 17
Terrestrial Wildlife Viewing & Nature Photo Tourism
713990 184 30 7.1 &
7.3 Green Accommodation 72111 247 13
TOTALS 1,112 149
62
NL Things to Do NL Government web site 63
For more information on the Green Key Eco-Rating Program, see: http://www.greenkeyglobal.com/
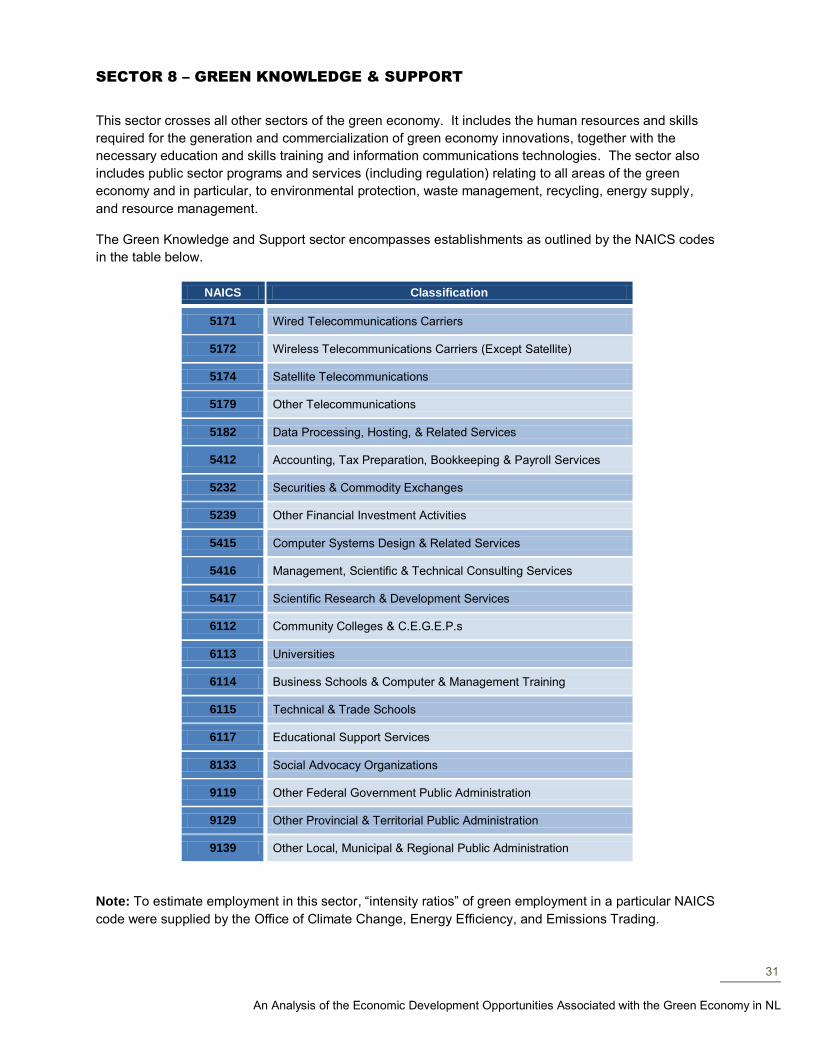
31
An Analysis of the Economic Development Opportunities Associated with the Green Economy in NL
SECTOR 8 – GREEN KNOWLEDGE & SUPPORT
This sector crosses all other sectors of the green economy. It includes the human resources and skills
required for the generation and commercialization of green economy innovations, together with the
necessary education and skills training and information communications technologies. The sector also
includes public sector programs and services (including regulation) relating to all areas of the green
economy and in particular, to environmental protection, waste management, recycling, energy supply,
and resource management.
The Green Knowledge and Support sector encompasses establishments as outlined by the NAICS codes
in the table below.
NAICS Classification
5171 Wired Telecommunications Carriers
5172 Wireless Telecommunications Carriers (Except Satellite)
5174 Satellite Telecommunications
5179 Other Telecommunications
5182 Data Processing, Hosting, & Related Services
5412 Accounting, Tax Preparation, Bookkeeping & Payroll Services
5232 Securities & Commodity Exchanges
5239 Other Financial Investment Activities
5415 Computer Systems Design & Related Services
5416 Management, Scientific & Technical Consulting Services
5417 Scientific Research & Development Services
6112 Community Colleges & C.E.G.E.P.s
6113 Universities
6114 Business Schools & Computer & Management Training
6115 Technical & Trade Schools
6117 Educational Support Services
8133 Social Advocacy Organizations
9119 Other Federal Government Public Administration
9129 Other Provincial & Territorial Public Administration
9139 Other Local, Municipal & Regional Public Administration
Note: To estimate employment in this sector, “intensity ratios” of green employment in a particular NAICS
code were supplied by the Office of Climate Change, Energy Efficiency, and Emissions Trading.
32
An Analysis of the Economic Development Opportunities Associated with the Green Economy in NL
For the purposes of this report, the Green Knowledge and Support sector is divided into four segments as
described below.
8.1 – Education & Training
The NL Department of Education supports education and trades and apprenticeship training for all
aspects of the NL economy, including inter-provincial trades (“Red Seal” certification permitting the
qualified tradesperson to move and work in other provinces / territories without having to write any further
examinations) and certification for Provincial trades.64
The Department also deals directly with MUN on budgetary and policy matters and with the College of the
North Atlantic (CNA) to develop and enforce legislation; provide necessary resources, leadership,
direction, and support through the development of clear policies and priorities; and to implement
provincial strategies.
MUN and CNA are NL’s largest education and training institutions. Trades training establishments also a
variety of other institutions including the Carpenters Millwrights College, Academy Canada, and Keyin
College. In total there are some 15 post-secondary education and training establishments with a total of
36 campuses across NL. More detail on this segment is provided in the Companion document.
8.2 – Research, Development & Commercialization
The NL Research and Development Corporation (RDC) receives $25 million annually to invest in projects
of strategic importance for NL. RDC is focused on projects related to improving the environmental
performance of extraction industries in the province, as well as providing support to the growing ocean
technology sector.
The National Research Council’s (NRC) Institute of Ocean Technology wave and ice tanks are also
important for the NL ocean technology sector.
MUN’s research and development (R&D) capacity is significant:
Researchers at MUN, both at the Marine Institute and the main campus in St. John’s, have
developed unique expertise in instrumentation, controls, robotics, sensing / automation, and
autonomous systems for land, air, and water environments. Unique studies on fish waste for
biodiesel is creating some excitement.
C-CORE, a separately incorporated research and development corporation of MUN, provides
innovative engineering solutions to clients in the natural resource sectors and government
markets.
MUN’s Faculty of Engineering (through its Industrial Outreach Program) and its Office of
Research work together to advance R&D opportunities for entrepreneurs and have resulted in a
number of successful business spin-offs, such as Cathexis, IDBLUE, and Verafin.
The CNA has an Office of Applied Research, which is currently working on a number of projects related to
the green economy, including a wave-powered pumping project, geospatial research, agrifoods and
value-added agricultural products.
64
See the Companion document for more detailed information on education and training in NL relevant to the green economy. In addition, for a list of relevant university programs offered in the province, refer to Appendix D and for a list of relevant college programs, refer to Appendix E.
33
An Analysis of the Economic Development Opportunities Associated with the Green Economy in NL
A number of private sector players provide R&D support to the other green economy sectors; such as
Maxxam Analytics testing laboratories that support environmental protection and remediation services.
Research capacity also exists at the Centre of Environmental Excellence in the Corner Brook region
which is presently focused on forestry research.
The Genesis Centre at MUN serves as an incubation facility that provides support for technology-based
ventures with high-growth potential seeking business guidance and capital.
With regard to green investment capital, there are presently no private sector establishments engaged in
green technology investments in NL or carbon trading organizations resident in NL. However, it was
considered reasonable to assume that a number of financial professionals in NL must be engaged in
transactions relating to green economic growth.
8.3 – Information Communications Technologies (ICT)
ICT wireless, GPS, radar, satellite, and tracking technologies are being developed for a variety of
purposes in NL. Examples include DyMOCOM’s wireless water metering and Lotek Wireless’s
technology for fish and wildlife monitoring.
ICT technologies are also being developed and used for weather forecasting. Examples include:
AMEC Earth & Environmental use of ICT to develop expertise in weather forecasting and climate
modeling in order to improve the efficiency of road salting and snow plowing; and
Ocean observation and sea-state forecasting by the SmartBay initiative in Placentia, managed by
the Marine Institute at MUN.
In addition, using ICT to create virtual products through the digitization of print materials and other
products, such as e-commerce and digital media, can provide benefits in terms of reduced energy
consumption and lowered GHG emissions. In addition, achieving universal, affordable access to open
broadband networks and services is seen as critically important to green economy development,
specifically around the promotion of digital literacy and building the capacities people need to use ICT to
access information, communicate, share knowledge and experience, generate and produce content, and
innovate in the digitally-based, greener economy.
8.4 – Public Sector Services, Regulatory Agencies & Supporting Organizations
Note that Crown agencies with important sectoral roles were included in the appropriate green economy
sectors. For example, Nalcor was included in the Green Energy Supply sector and the MMSB in the
Waste Management and Recycling sector.
The public sector (municipal, provincial, and federal) makes up approximately 30 percent of employment
in NL, which also includes education, healthcare, and the full range of public services at all levels.
At the federal level, agencies such as Agriculture and Agri-Food Canada, the National Research Council,
Transport Canada, Department of Foreign Affairs and International Trade (DFAIT), Environment Canada,
DFO, and Atlantic Canada Opportunities Agency (ACOA) are involved in policy development and
program management that relates to the province’s green economy.
34
An Analysis of the Economic Development Opportunities Associated with the Green Economy in NL
Provincial Departments whose mandates cover green economy activities include:
The Department of Environment and Conservation is responsible for the protection and
enhancement of the environment, management of the province’s wildlife, inland fish, water, parks,
and Crown land resources. The Department is also provides standards and regulations for the
Province’s Waste Management Strategy and its response to climate change and the Sustainable
Development initiatives.
The Department of Municipal Affairs strives to ensure NL residents live in safe and sustainable
communities and are served by open, effective, and accountable local governments. The
Department also administers the Province’s Waste Management Strategy.
The Department of Business promotes the province nationally and internationally as a preferred
investment destination for new and expanding businesses; manages NL’s branding strategy that
highlights the province as an exciting place to live, work, visit and do business; and guides the
ongoing initiative to improve the province’s regulatory environment, making it easier for
businesses and people who rely on government services, information, and regulation.
The Department of Natural Resources, through the Mines and Energy Branches and the Forestry
and Agrifoods Agencies delivers programs and services relating to several segments of the NL
green economy.
The Department of Innovation, Trade, and Rural Development supports regional development
and economic diversification. Their lines of business include micro, small and medium-sized
enterprise development, industrial diversification, innovation, investment, economic intelligence,
and advanced technology development.
The Department of Transportation and Works is responsible for the provision of the provincial ferry services; the management of the provincial government fleet of light vehicles and heavy equipment; and the construction and management of provincial government buildings.
The Department of Education is responsible for the K-12 system and post-secondary education and skills training – essential components for developing the skilled and qualified work force ofthe future green economy in NL.
The Department of Tourism, Culture, and Recreation is committed to supporting the development of sustainable economic growth in the tourism and cultural industries and preserving the province’s cultural heritage and historic resources by recognizing their importance to the green economy.
The Department of Human Resources, Labour, and Employment supports employers in the province’s green economy with recruiting and retaining skilled workers and works with organizations to develop leadership opportunities for youth.
The Office of Climate Change, Energy Efficiency, and Emissions Trading (CCEEET) has lead
responsibility within Government for strategy and policy development on climate change, energy
efficiency, and emissions trading.
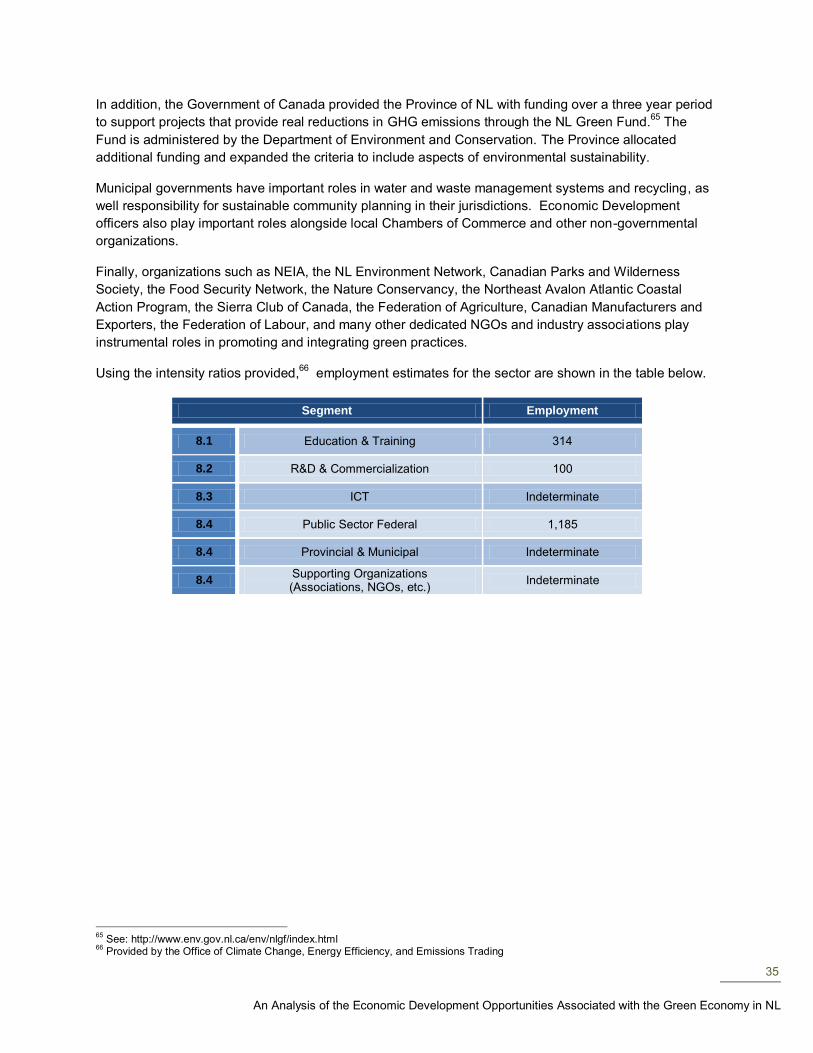
35
An Analysis of the Economic Development Opportunities Associated with the Green Economy in NL
In addition, the Government of Canada provided the Province of NL with funding over a three year period
to support projects that provide real reductions in GHG emissions through the NL Green Fund.65
The
Fund is administered by the Department of Environment and Conservation. The Province allocated
additional funding and expanded the criteria to include aspects of environmental sustainability.
Municipal governments have important roles in water and waste management systems and recycling, as
well responsibility for sustainable community planning in their jurisdictions. Economic Development
officers also play important roles alongside local Chambers of Commerce and other non-governmental
organizations.
Finally, organizations such as NEIA, the NL Environment Network, Canadian Parks and Wilderness
Society, the Food Security Network, the Nature Conservancy, the Northeast Avalon Atlantic Coastal
Action Program, the Sierra Club of Canada, the Federation of Agriculture, Canadian Manufacturers and
Exporters, the Federation of Labour, and many other dedicated NGOs and industry associations play
instrumental roles in promoting and integrating green practices.
Using the intensity ratios provided,66
employment estimates for the sector are shown in the table below.
Segment Employment
8.1 Education & Training 314
8.2 R&D & Commercialization 100
8.3 ICT Indeterminate
8.4 Public Sector Federal 1,185
8.4 Provincial & Municipal Indeterminate
8.4 Supporting Organizations (Associations, NGOs, etc.)
Indeterminate
65
See: http://www.env.gov.nl.ca/env/nlgf/index.html 66
Provided by the Office of Climate Change, Energy Efficiency, and Emissions Trading
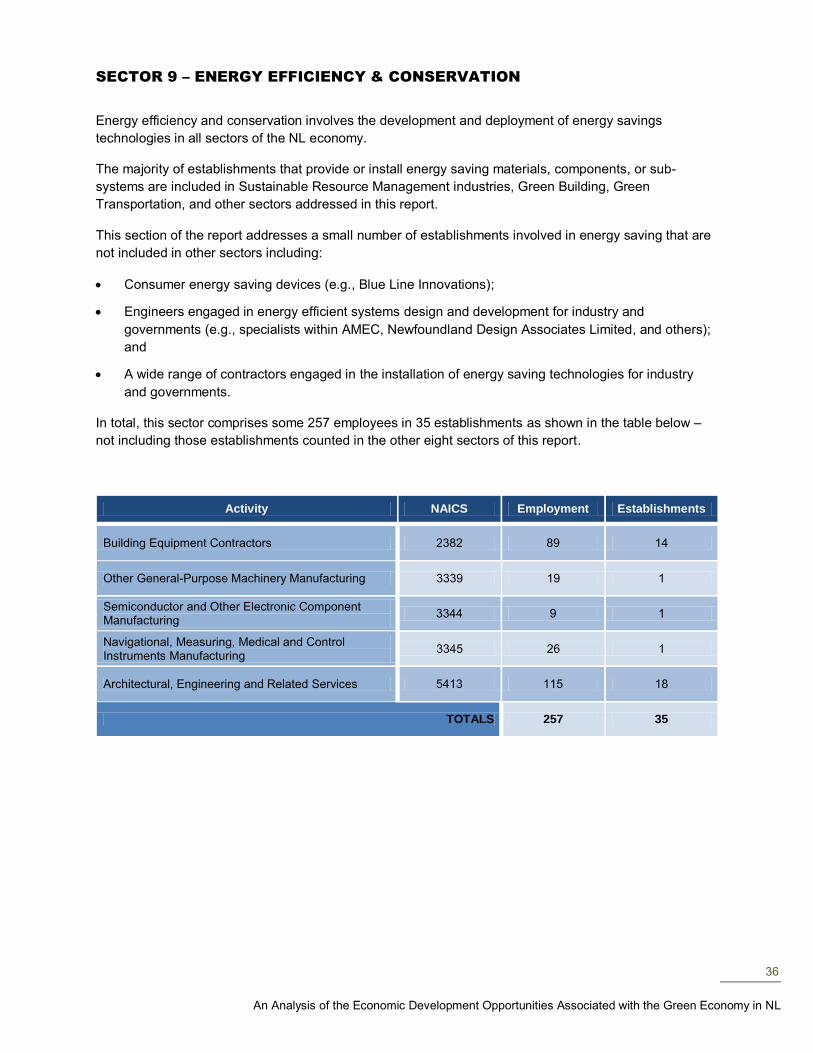
36
An Analysis of the Economic Development Opportunities Associated with the Green Economy in NL
SECTOR 9 – ENERGY EFFICIENCY & CONSERVATION
Energy efficiency and conservation involves the development and deployment of energy savings
technologies in all sectors of the NL economy.
The majority of establishments that provide or install energy saving materials, components, or sub-
systems are included in Sustainable Resource Management industries, Green Building, Green
Transportation, and other sectors addressed in this report.
This section of the report addresses a small number of establishments involved in energy saving that are
not included in other sectors including:
Consumer energy saving devices (e.g., Blue Line Innovations);
Engineers engaged in energy efficient systems design and development for industry and
governments (e.g., specialists within AMEC, Newfoundland Design Associates Limited, and others);
and
A wide range of contractors engaged in the installation of energy saving technologies for industry
and governments.
In total, this sector comprises some 257 employees in 35 establishments as shown in the table below –
not including those establishments counted in the other eight sectors of this report.
Activity NAICS Employment Establishments
Building Equipment Contractors 2382 89 14
Other General-Purpose Machinery Manufacturing 3339 19 1
Semiconductor and Other Electronic Component Manufacturing
3344 9 1
Navigational, Measuring, Medical and Control Instruments Manufacturing
3345 26 1
Architectural, Engineering and Related Services 5413 115 18
TOTALS 257 35
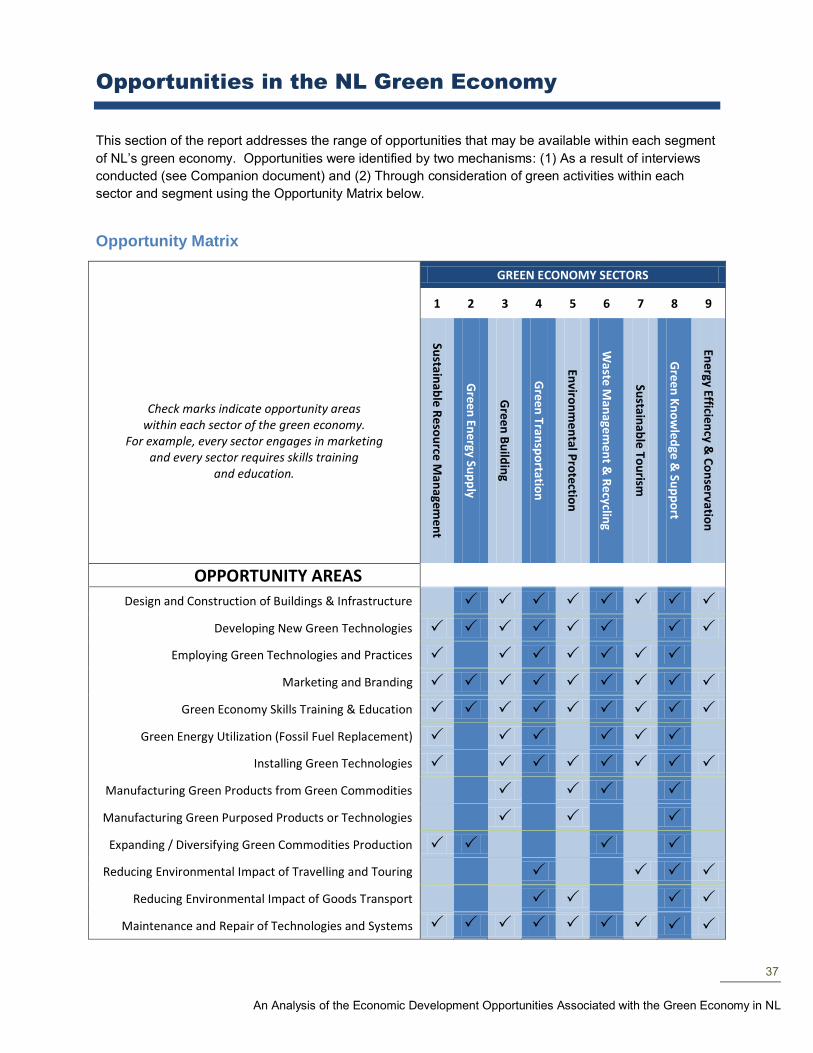
37
An Analysis of the Economic Development Opportunities Associated with the Green Economy in NL
Opportunities in the NL Green Economy
This section of the report addresses the range of opportunities that may be available within each segment
of NL’s green economy. Opportunities were identified by two mechanisms: (1) As a result of interviews
conducted (see Companion document) and (2) Through consideration of green activities within each
sector and segment using the Opportunity Matrix below.
Opportunity Matrix
GREEN ECONOMY SECTORS
1 2 3 4 5 6 7 8 9
Check marks indicate opportunity areas within each sector of the green economy.
For example, every sector engages in marketing and every sector requires skills training
and education.
Sustain
able R
esou
rce M
anagem
ent
Green
Energy Su
pp
ly
Green
Bu
ildin
g
Green
Transp
ortatio
n
Enviro
nm
ental P
rotectio
n
Waste M
anagem
ent &
Recyclin
g
Sustain
able To
urism
Green
Kn
ow
ledge &
Sup
po
rt
Energy Efficien
cy & C
on
servatio
n
OPPORTUNITY AREAS
Design and Construction of Buildings & Infrastructure
Developing New Green Technologies
Employing Green Technologies and Practices
Marketing and Branding
Green Economy Skills Training & Education
Green Energy Utilization (Fossil Fuel Replacement)
Installing Green Technologies
Manufacturing Green Products from Green Commodities
Manufacturing Green Purposed Products or Technologies
Expanding / Diversifying Green Commodities Production
Reducing Environmental Impact of Travelling and Touring
Reducing Environmental Impact of Goods Transport
Maintenance and Repair of Technologies and Systems
38
An Analysis of the Economic Development Opportunities Associated with the Green Economy in NL
Each identified opportunity was then considered in context of a number of factors including: the
availability of critical inputs, the stage of development, the engagement of local entrepreneurs and
investors, and the status of the business case. Recommendations were then made based on these
assessments.
Recommendations are identified by segment number. For example, Segment 1.1 (Aquaculture) has
recommendations labelled 1.1.1, 1.1.2, and so on.
The majority of the recommendations are for studies, assessments, or plans since data on which to make
business cases was not readily available and therefore recommendations to capitalize on those
opportunities require more detailed analyses that could be obtained by studies that are outside of the
scope of this commission.
IMPORTANT NOTES
In many cases, NL is already engaged in investigating and / or exploiting the opportunities
identified. In these cases, the report simply confirms the importance already attached to
those opportunities.
The reader is cautioned that the opportunities identified do not preclude or exclude other
opportunities that may be under consideration in NL.
Only numbered paragraphs are defined as opportunities. The lists of opportunities that
follow include descriptive paragraphs which are NOT in themselves opportunities. These
paragraphs are not numbered.
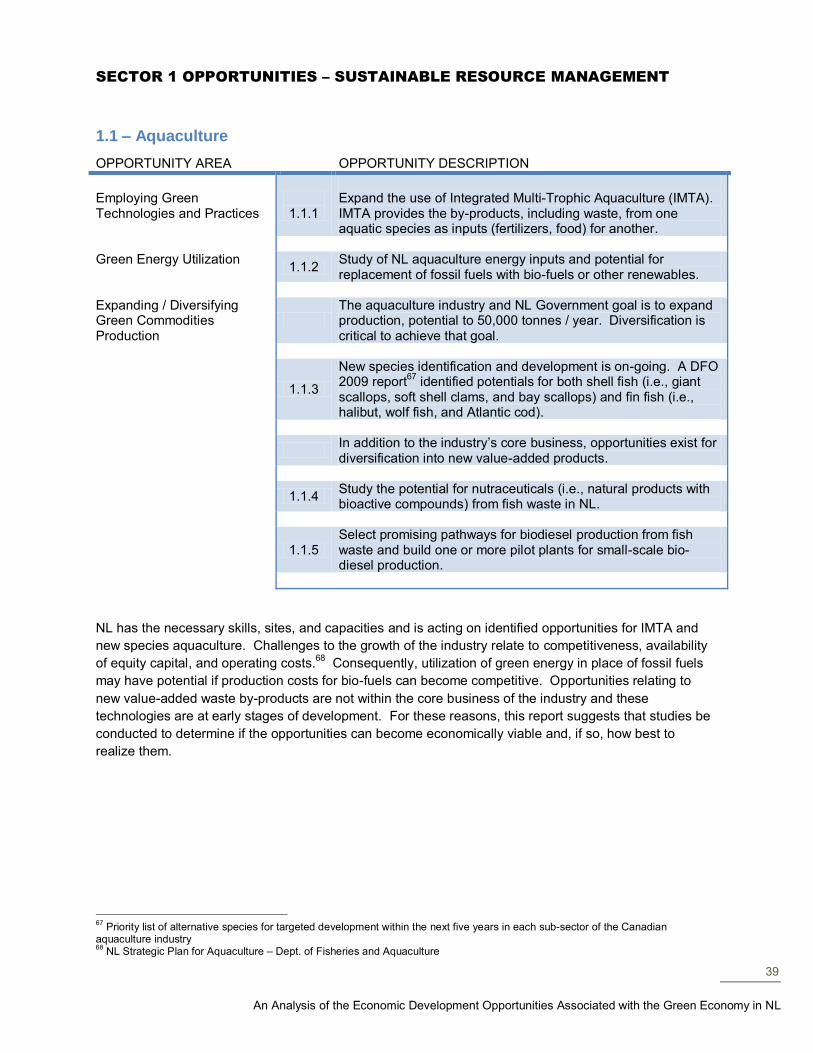
39
An Analysis of the Economic Development Opportunities Associated with the Green Economy in NL
SECTOR 1 OPPORTUNITIES – SUSTAINABLE RESOURCE MANAGEMENT
1.1 – Aquaculture
OPPORTUNITY AREA OPPORTUNITY DESCRIPTION
Employing Green Technologies and Practices
1.1.1
Expand the use of Integrated Multi-Trophic Aquaculture (IMTA). IMTA provides the by-products, including waste, from one aquatic species as inputs (fertilizers, food) for another.
Green Energy Utilization
1.1.2 Study of NL aquaculture energy inputs and potential for replacement of fossil fuels with bio-fuels or other renewables.
Expanding / Diversifying Green Commodities Production
The aquaculture industry and NL Government goal is to expand production, potential to 50,000 tonnes / year. Diversification is critical to achieve that goal.
1.1.3
New species identification and development is on-going. A DFO 2009 report
67 identified potentials for both shell fish (i.e., giant
scallops, soft shell clams, and bay scallops) and fin fish (i.e., halibut, wolf fish, and Atlantic cod).
In addition to the industry’s core business, opportunities exist for diversification into new value-added products.
1.1.4 Study the potential for nutraceuticals (i.e., natural products with bioactive compounds) from fish waste in NL.
1.1.5 Select promising pathways for biodiesel production from fish waste and build one or more pilot plants for small-scale bio-diesel production.
NL has the necessary skills, sites, and capacities and is acting on identified opportunities for IMTA and
new species aquaculture. Challenges to the growth of the industry relate to competitiveness, availability
of equity capital, and operating costs.68
Consequently, utilization of green energy in place of fossil fuels
may have potential if production costs for bio-fuels can become competitive. Opportunities relating to
new value-added waste by-products are not within the core business of the industry and these
technologies are at early stages of development. For these reasons, this report suggests that studies be
conducted to determine if the opportunities can become economically viable and, if so, how best to
realize them.
67
Priority list of alternative species for targeted development within the next five years in each sub-sector of the Canadian aquaculture industry 68
NL Strategic Plan for Aquaculture – Dept. of Fisheries and Aquaculture
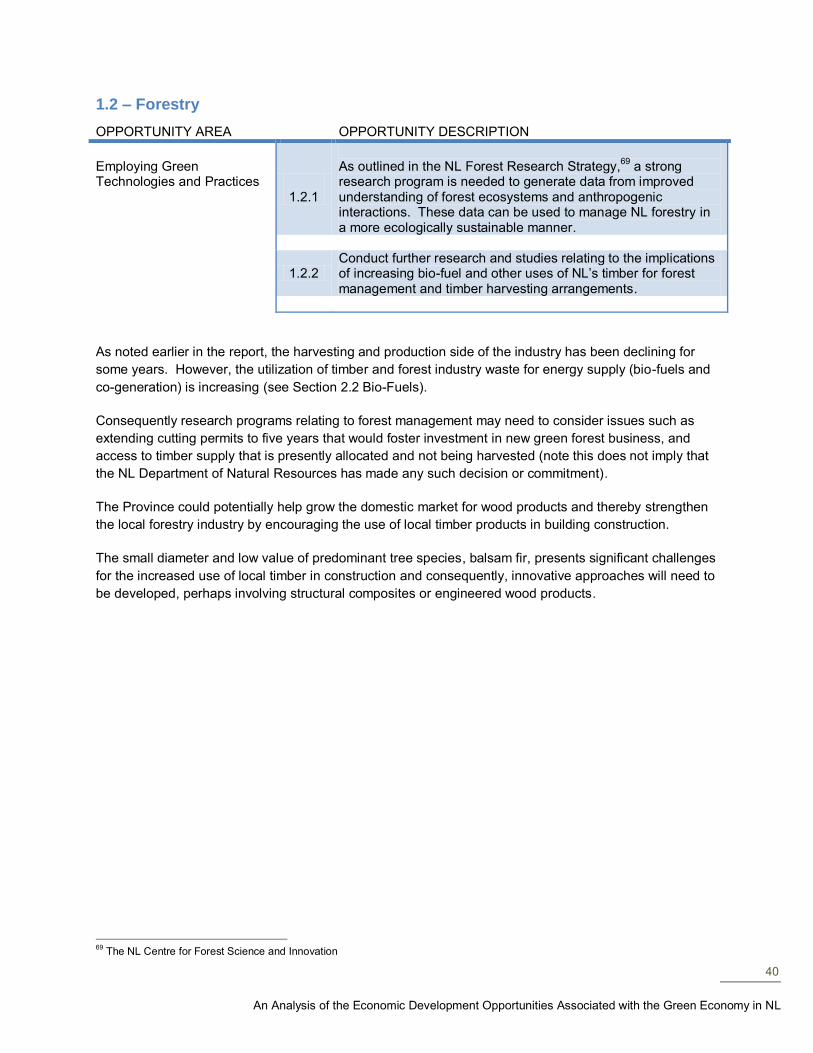
40
An Analysis of the Economic Development Opportunities Associated with the Green Economy in NL
1.2 – Forestry
OPPORTUNITY AREA OPPORTUNITY DESCRIPTION
Employing Green Technologies and Practices
1.2.1
As outlined in the NL Forest Research Strategy,
69 a strong
research program is needed to generate data from improved understanding of forest ecosystems and anthropogenic interactions. These data can be used to manage NL forestry in a more ecologically sustainable manner.
1.2.2 Conduct further research and studies relating to the implications of increasing bio-fuel and other uses of NL’s timber for forest management and timber harvesting arrangements.
As noted earlier in the report, the harvesting and production side of the industry has been declining for
some years. However, the utilization of timber and forest industry waste for energy supply (bio-fuels and
co-generation) is increasing (see Section 2.2 Bio-Fuels).
Consequently research programs relating to forest management may need to consider issues such as
extending cutting permits to five years that would foster investment in new green forest business, and
access to timber supply that is presently allocated and not being harvested (note this does not imply that
the NL Department of Natural Resources has made any such decision or commitment).
The Province could potentially help grow the domestic market for wood products and thereby strengthen
the local forestry industry by encouraging the use of local timber products in building construction.
The small diameter and low value of predominant tree species, balsam fir, presents significant challenges
for the increased use of local timber in construction and consequently, innovative approaches will need to
be developed, perhaps involving structural composites or engineered wood products.
69
The NL Centre for Forest Science and Innovation
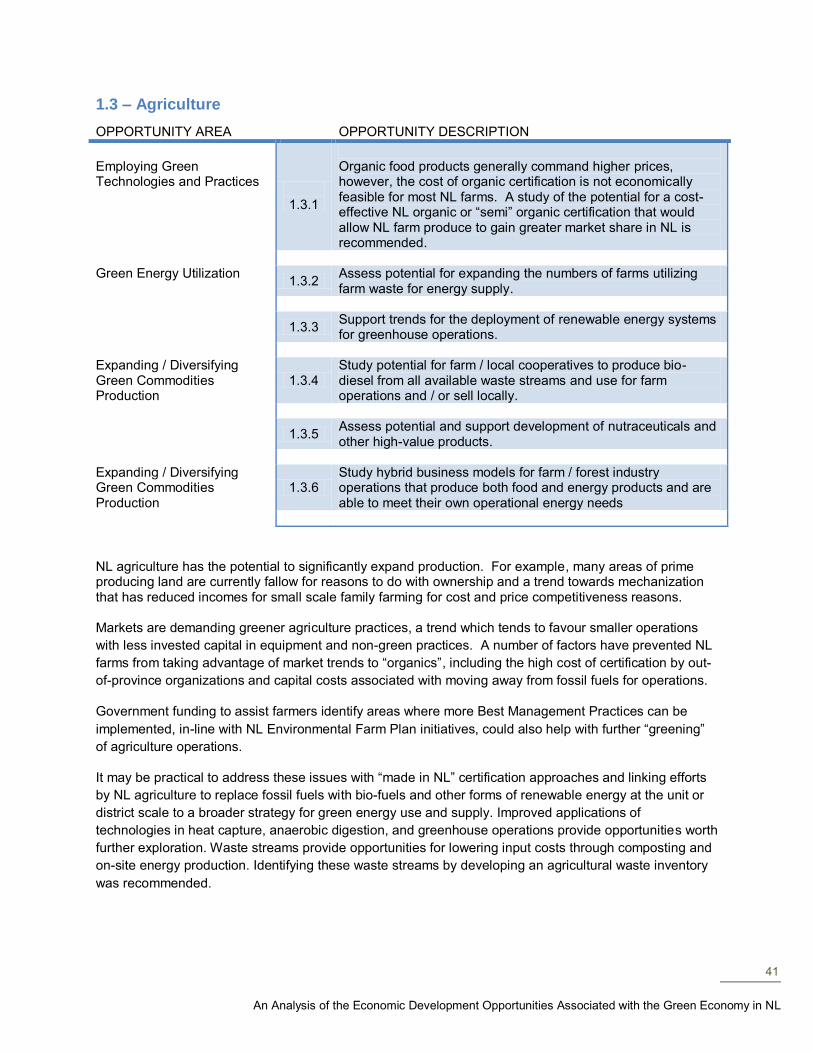
41
An Analysis of the Economic Development Opportunities Associated with the Green Economy in NL
1.3 – Agriculture
OPPORTUNITY AREA OPPORTUNITY DESCRIPTION
Employing Green Technologies and Practices
1.3.1
Organic food products generally command higher prices, however, the cost of organic certification is not economically feasible for most NL farms. A study of the potential for a cost-effective NL organic or “semi” organic certification that would allow NL farm produce to gain greater market share in NL is recommended.
Green Energy Utilization
1.3.2 Assess potential for expanding the numbers of farms utilizing farm waste for energy supply.
1.3.3 Support trends for the deployment of renewable energy systems for greenhouse operations.
Expanding / Diversifying Green Commodities Production
1.3.4 Study potential for farm / local cooperatives to produce bio-diesel from all available waste streams and use for farm operations and / or sell locally.
1.3.5 Assess potential and support development of nutraceuticals and other high-value products.
Expanding / Diversifying Green Commodities Production
1.3.6 Study hybrid business models for farm / forest industry operations that produce both food and energy products and are able to meet their own operational energy needs
NL agriculture has the potential to significantly expand production. For example, many areas of prime producing land are currently fallow for reasons to do with ownership and a trend towards mechanization that has reduced incomes for small scale family farming for cost and price competitiveness reasons. Markets are demanding greener agriculture practices, a trend which tends to favour smaller operations
with less invested capital in equipment and non-green practices. A number of factors have prevented NL
farms from taking advantage of market trends to “organics”, including the high cost of certification by out-
of-province organizations and capital costs associated with moving away from fossil fuels for operations.
Government funding to assist farmers identify areas where more Best Management Practices can be
implemented, in-line with NL Environmental Farm Plan initiatives, could also help with further “greening”
of agriculture operations.
It may be practical to address these issues with “made in NL” certification approaches and linking efforts
by NL agriculture to replace fossil fuels with bio-fuels and other forms of renewable energy at the unit or
district scale to a broader strategy for green energy use and supply. Improved applications of
technologies in heat capture, anaerobic digestion, and greenhouse operations provide opportunities worth
further exploration. Waste streams provide opportunities for lowering input costs through composting and
on-site energy production. Identifying these waste streams by developing an agricultural waste inventory
was recommended.
42
An Analysis of the Economic Development Opportunities Associated with the Green Economy in NL
It was suggested that the Provincial Government could assist local farmers by providing a technology
expert and / or engineer with green agriculture expertise who could help farmers with the adoption and
implementation of these technologies.
Additionally, new business models may be possible for hybrid farm / forest industry operations that
produce food, wood products, and energy while meeting their own requirements for energy supply from
renewables.
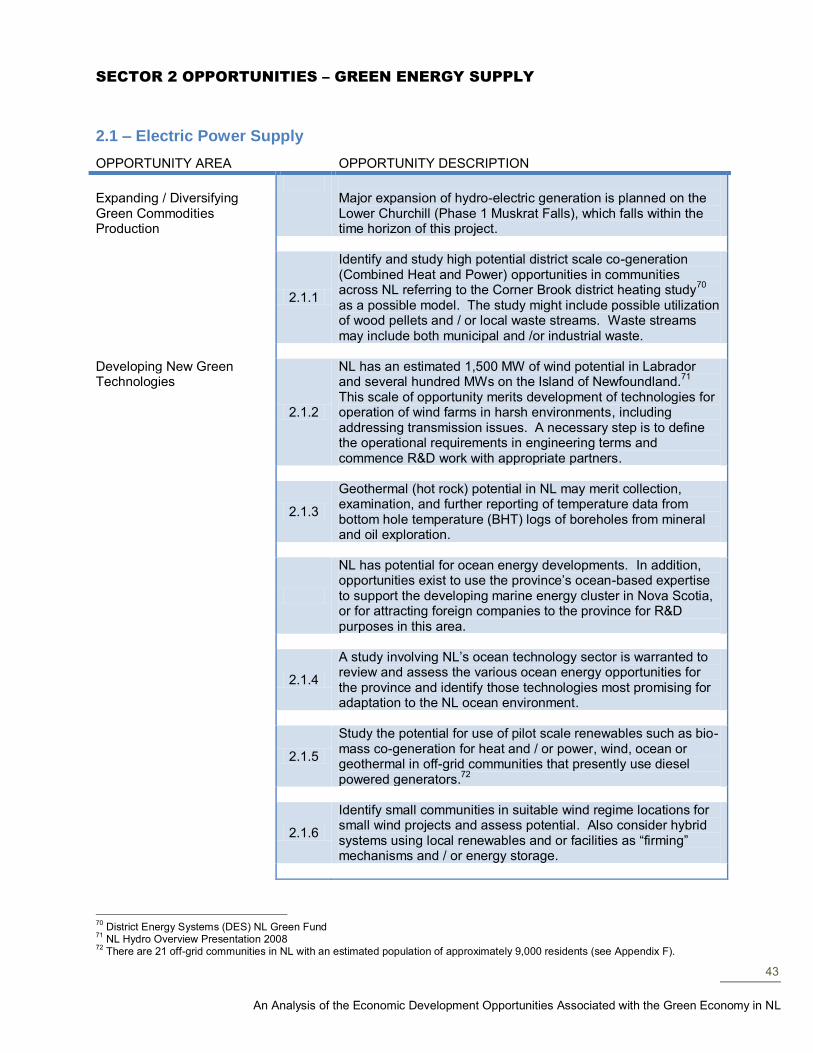
43
An Analysis of the Economic Development Opportunities Associated with the Green Economy in NL
SECTOR 2 OPPORTUNITIES – GREEN ENERGY SUPPLY
2.1 – Electric Power Supply
OPPORTUNITY AREA OPPORTUNITY DESCRIPTION
Expanding / Diversifying Green Commodities Production
Major expansion of hydro-electric generation is planned on the Lower Churchill (Phase 1 Muskrat Falls), which falls within the time horizon of this project.
2.1.1
Identify and study high potential district scale co-generation (Combined Heat and Power) opportunities in communities across NL referring to the Corner Brook district heating study
70
as a possible model. The study might include possible utilization of wood pellets and / or local waste streams. Waste streams may include both municipal and /or industrial waste.
Developing New Green Technologies
2.1.2
NL has an estimated 1,500 MW of wind potential in Labrador and several hundred MWs on the Island of Newfoundland.
71
This scale of opportunity merits development of technologies for operation of wind farms in harsh environments, including addressing transmission issues. A necessary step is to define the operational requirements in engineering terms and commence R&D work with appropriate partners.
2.1.3
Geothermal (hot rock) potential in NL may merit collection, examination, and further reporting of temperature data from bottom hole temperature (BHT) logs of boreholes from mineral and oil exploration.
NL has potential for ocean energy developments. In addition, opportunities exist to use the province’s ocean-based expertise to support the developing marine energy cluster in Nova Scotia, or for attracting foreign companies to the province for R&D purposes in this area.
2.1.4
A study involving NL’s ocean technology sector is warranted to review and assess the various ocean energy opportunities for the province and identify those technologies most promising for adaptation to the NL ocean environment.
2.1.5
Study the potential for use of pilot scale renewables such as bio-mass co-generation for heat and / or power, wind, ocean or geothermal in off-grid communities that presently use diesel powered generators.
72
2.1.6
Identify small communities in suitable wind regime locations for small wind projects and assess potential. Also consider hybrid systems using local renewables and or facilities as “firming” mechanisms and / or energy storage.
70
District Energy Systems (DES) NL Green Fund 71
NL Hydro Overview Presentation 2008 72
There are 21 off-grid communities in NL with an estimated population of approximately 9,000 residents (see Appendix F).
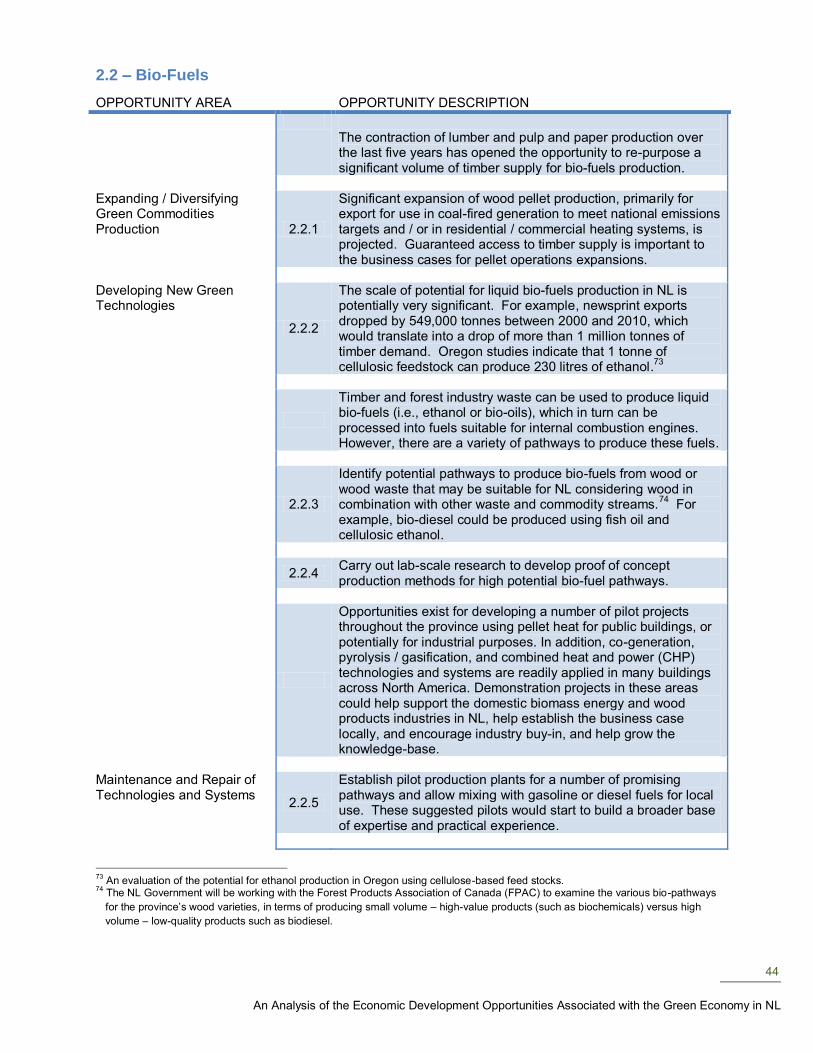
44
An Analysis of the Economic Development Opportunities Associated with the Green Economy in NL
2.2 – Bio-Fuels
OPPORTUNITY AREA OPPORTUNITY DESCRIPTION
The contraction of lumber and pulp and paper production over the last five years has opened the opportunity to re-purpose a significant volume of timber supply for bio-fuels production.
Expanding / Diversifying Green Commodities Production 2.2.1
Significant expansion of wood pellet production, primarily for export for use in coal-fired generation to meet national emissions targets and / or in residential / commercial heating systems, is projected. Guaranteed access to timber supply is important to the business cases for pellet operations expansions.
Developing New Green Technologies
2.2.2
The scale of potential for liquid bio-fuels production in NL is potentially very significant. For example, newsprint exports dropped by 549,000 tonnes between 2000 and 2010, which would translate into a drop of more than 1 million tonnes of timber demand. Oregon studies indicate that 1 tonne of cellulosic feedstock can produce 230 litres of ethanol.
73
Timber and forest industry waste can be used to produce liquid bio-fuels (i.e., ethanol or bio-oils), which in turn can be processed into fuels suitable for internal combustion engines. However, there are a variety of pathways to produce these fuels.
2.2.3
Identify potential pathways to produce bio-fuels from wood or wood waste that may be suitable for NL considering wood in combination with other waste and commodity streams.
74 For
example, bio-diesel could be produced using fish oil and cellulosic ethanol.
2.2.4 Carry out lab-scale research to develop proof of concept production methods for high potential bio-fuel pathways.
Opportunities exist for developing a number of pilot projects throughout the province using pellet heat for public buildings, or potentially for industrial purposes. In addition, co-generation, pyrolysis / gasification, and combined heat and power (CHP) technologies and systems are readily applied in many buildings across North America. Demonstration projects in these areas could help support the domestic biomass energy and wood products industries in NL, help establish the business case locally, and encourage industry buy-in, and help grow the knowledge-base.
Maintenance and Repair of Technologies and Systems
2.2.5
Establish pilot production plants for a number of promising pathways and allow mixing with gasoline or diesel fuels for local use. These suggested pilots would start to build a broader base of expertise and practical experience.
73
An evaluation of the potential for ethanol production in Oregon using cellulose-based feed stocks. 74
The NL Government will be working with the Forest Products Association of Canada (FPAC) to examine the various bio-pathways
for the province’s wood varieties, in terms of producing small volume – high-value products (such as biochemicals) versus high
volume – low-quality products such as biodiesel.
45
An Analysis of the Economic Development Opportunities Associated with the Green Economy in NL
While many clean and renewable energy opportunities show potential for NL, a number of issues must be
addressed in each case. These include:
The availability of feed stocks, and in some cases, related transportation costs of both feed
stocks and energy products (such as wood pellets and bio-fuels) over long distances to
production facilities and potential markets;
The scale of operations – either as small-scale, community-based plants or larger, export-focused
operations;
In the context of the planned Lower Churchill developments, the ability of new energy projects to
meet Provincial requirements for both affordable and reliable power for residents; and
The access to existing expertise, capacity, and appetite for developing, operating, and potentially
commercializing new green energy technologies in the province.
For electricity supply, NL has the necessary skills and resources to carry out the studies and projects
suggested. The data from the studies would then inform the business cases for potentially realizing the
various opportunities. The pilot projects suggested serve many purposes including the development of
NL based expertise on which to base plans for green economy growth.
This is particularly necessary for bio-fuels development. NL lacks the experience base and the
technologies have to be adapted to the province’s realities before business cases could be prepared.
The scale of opportunity is large and probably sufficient to justify the investments in 2.2.3 and 2.2.4.
It will be important for government, academia, and the private sector to work together in order to establish
which green energy technologies are the best fits for the province.
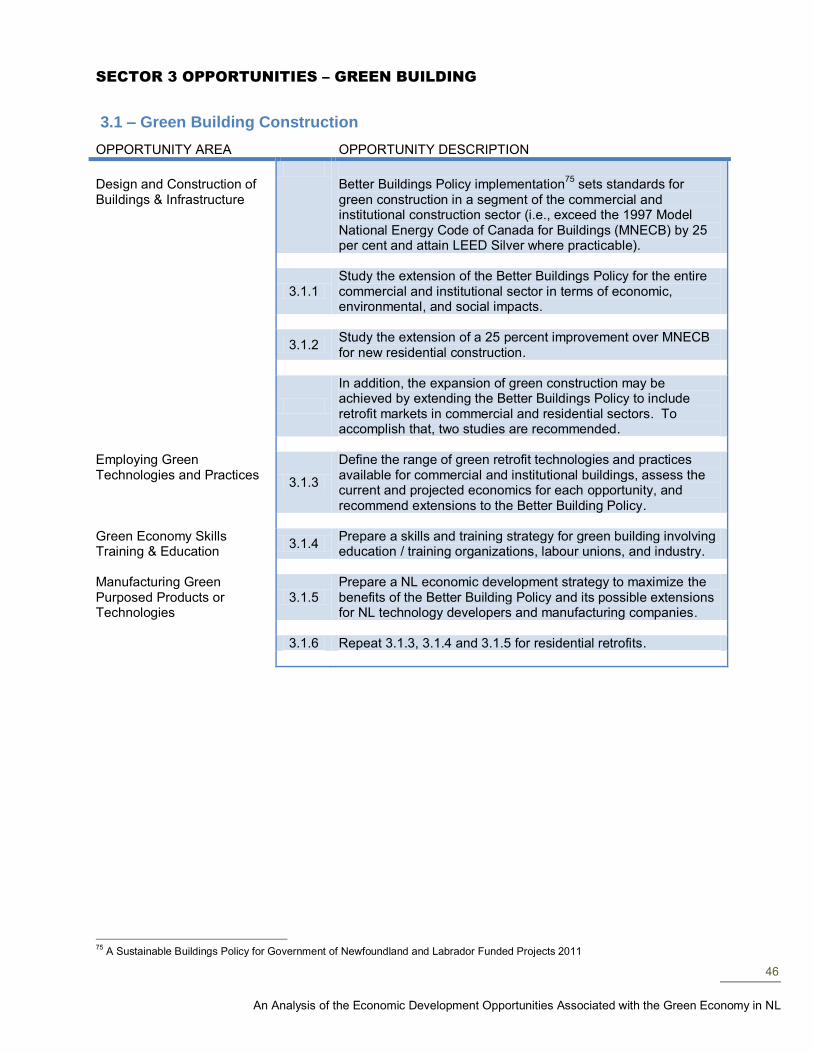
46
An Analysis of the Economic Development Opportunities Associated with the Green Economy in NL
SECTOR 3 OPPORTUNITIES – GREEN BUILDING
3.1 – Green Building Construction
OPPORTUNITY AREA OPPORTUNITY DESCRIPTION
Design and Construction of Buildings & Infrastructure
Better Buildings Policy implementation
75 sets standards for
green construction in a segment of the commercial and institutional construction sector (i.e., exceed the 1997 Model National Energy Code of Canada for Buildings (MNECB) by 25 per cent and attain LEED Silver where practicable).
3.1.1 Study the extension of the Better Buildings Policy for the entire commercial and institutional sector in terms of economic, environmental, and social impacts.
3.1.2 Study the extension of a 25 percent improvement over MNECB for new residential construction.
In addition, the expansion of green construction may be achieved by extending the Better Buildings Policy to include retrofit markets in commercial and residential sectors. To accomplish that, two studies are recommended.
Employing Green Technologies and Practices
3.1.3
Define the range of green retrofit technologies and practices available for commercial and institutional buildings, assess the current and projected economics for each opportunity, and recommend extensions to the Better Building Policy.
Green Economy Skills Training & Education
3.1.4 Prepare a skills and training strategy for green building involving education / training organizations, labour unions, and industry.
Manufacturing Green Purposed Products or Technologies
3.1.5 Prepare a NL economic development strategy to maximize the benefits of the Better Building Policy and its possible extensions for NL technology developers and manufacturing companies.
3.1.6 Repeat 3.1.3, 3.1.4 and 3.1.5 for residential retrofits.
75
A Sustainable Buildings Policy for Government of Newfoundland and Labrador Funded Projects 2011
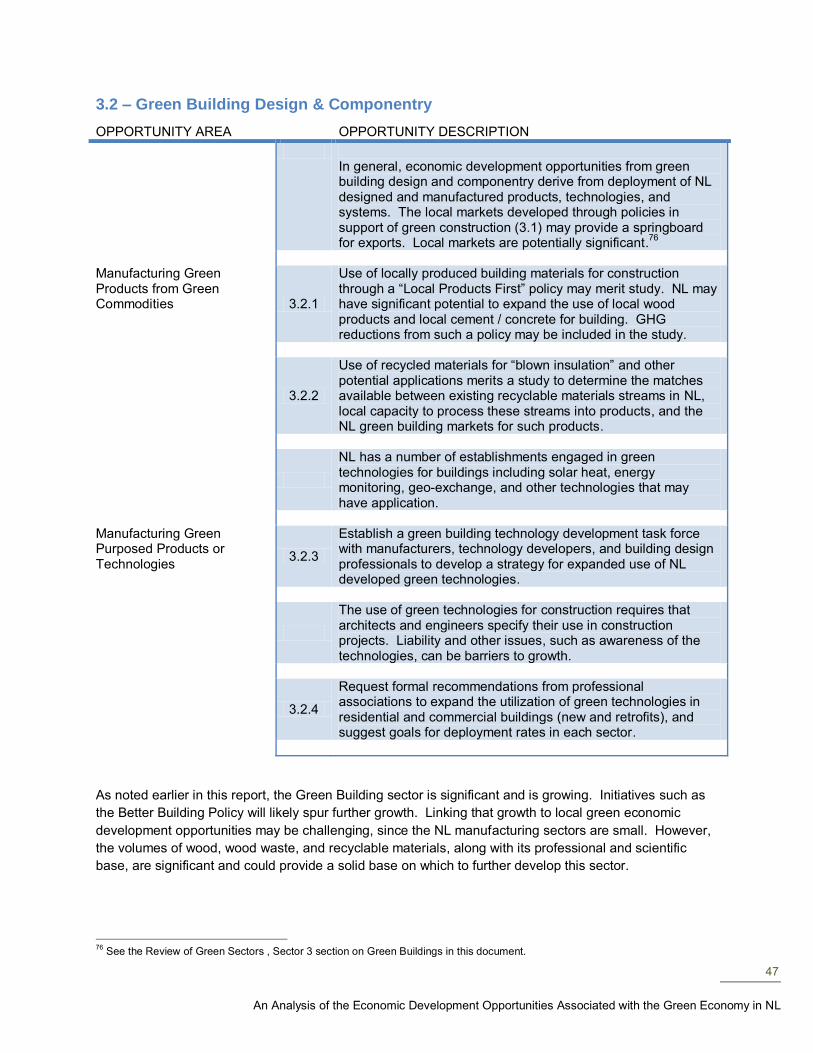
47
An Analysis of the Economic Development Opportunities Associated with the Green Economy in NL
3.2 – Green Building Design & Componentry
OPPORTUNITY AREA OPPORTUNITY DESCRIPTION
In general, economic development opportunities from green building design and componentry derive from deployment of NL designed and manufactured products, technologies, and systems. The local markets developed through policies in support of green construction (3.1) may provide a springboard for exports. Local markets are potentially significant.
76
Manufacturing Green Products from Green Commodities 3.2.1
Use of locally produced building materials for construction through a “Local Products First” policy may merit study. NL may have significant potential to expand the use of local wood products and local cement / concrete for building. GHG reductions from such a policy may be included in the study.
3.2.2
Use of recycled materials for “blown insulation” and other potential applications merits a study to determine the matches available between existing recyclable materials streams in NL, local capacity to process these streams into products, and the NL green building markets for such products.
NL has a number of establishments engaged in green technologies for buildings including solar heat, energy monitoring, geo-exchange, and other technologies that may have application.
Manufacturing Green Purposed Products or Technologies
3.2.3
Establish a green building technology development task force with manufacturers, technology developers, and building design professionals to develop a strategy for expanded use of NL developed green technologies.
The use of green technologies for construction requires that architects and engineers specify their use in construction projects. Liability and other issues, such as awareness of the technologies, can be barriers to growth.
3.2.4
Request formal recommendations from professional associations to expand the utilization of green technologies in residential and commercial buildings (new and retrofits), and suggest goals for deployment rates in each sector.
As noted earlier in this report, the Green Building sector is significant and is growing. Initiatives such as
the Better Building Policy will likely spur further growth. Linking that growth to local green economic
development opportunities may be challenging, since the NL manufacturing sectors are small. However,
the volumes of wood, wood waste, and recyclable materials, along with its professional and scientific
base, are significant and could provide a solid base on which to further develop this sector.
76
See the Review of Green Sectors , Sector 3 section on Green Buildings in this document.
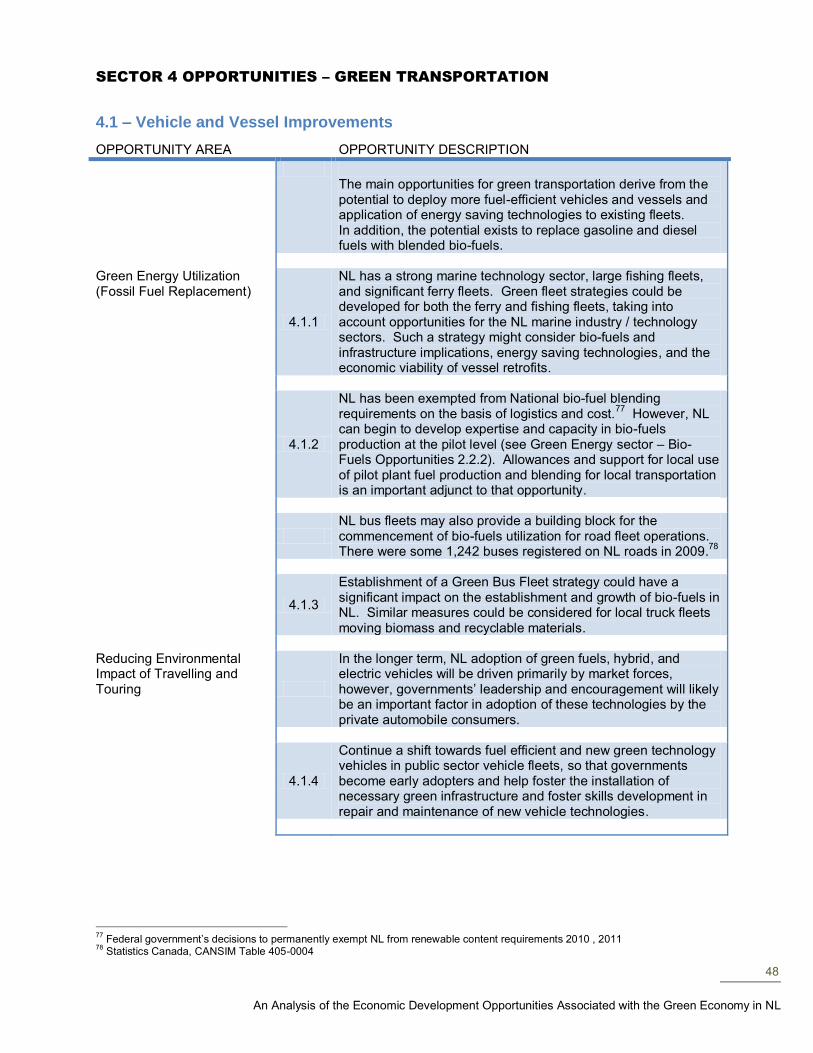
48
An Analysis of the Economic Development Opportunities Associated with the Green Economy in NL
SECTOR 4 OPPORTUNITIES – GREEN TRANSPORTATION
4.1 – Vehicle and Vessel Improvements
OPPORTUNITY AREA OPPORTUNITY DESCRIPTION
The main opportunities for green transportation derive from the potential to deploy more fuel-efficient vehicles and vessels and application of energy saving technologies to existing fleets. In addition, the potential exists to replace gasoline and diesel fuels with blended bio-fuels.
Green Energy Utilization (Fossil Fuel Replacement)
4.1.1
NL has a strong marine technology sector, large fishing fleets, and significant ferry fleets. Green fleet strategies could be developed for both the ferry and fishing fleets, taking into account opportunities for the NL marine industry / technology sectors. Such a strategy might consider bio-fuels and infrastructure implications, energy saving technologies, and the economic viability of vessel retrofits.
4.1.2
NL has been exempted from National bio-fuel blending requirements on the basis of logistics and cost.
77 However, NL
can begin to develop expertise and capacity in bio-fuels production at the pilot level (see Green Energy sector – Bio-Fuels Opportunities 2.2.2). Allowances and support for local use of pilot plant fuel production and blending for local transportation is an important adjunct to that opportunity.
NL bus fleets may also provide a building block for the commencement of bio-fuels utilization for road fleet operations. There were some 1,242 buses registered on NL roads in 2009.
78
4.1.3
Establishment of a Green Bus Fleet strategy could have a significant impact on the establishment and growth of bio-fuels in NL. Similar measures could be considered for local truck fleets moving biomass and recyclable materials.
Reducing Environmental Impact of Travelling and Touring
In the longer term, NL adoption of green fuels, hybrid, and electric vehicles will be driven primarily by market forces, however, governments’ leadership and encouragement will likely be an important factor in adoption of these technologies by the private automobile consumers.
4.1.4
Continue a shift towards fuel efficient and new green technology vehicles in public sector vehicle fleets, so that governments become early adopters and help foster the installation of necessary green infrastructure and foster skills development in repair and maintenance of new vehicle technologies.
77
Federal government’s decisions to permanently exempt NL from renewable content requirements 2010 , 2011 78
Statistics Canada, CANSIM Table 405-0004
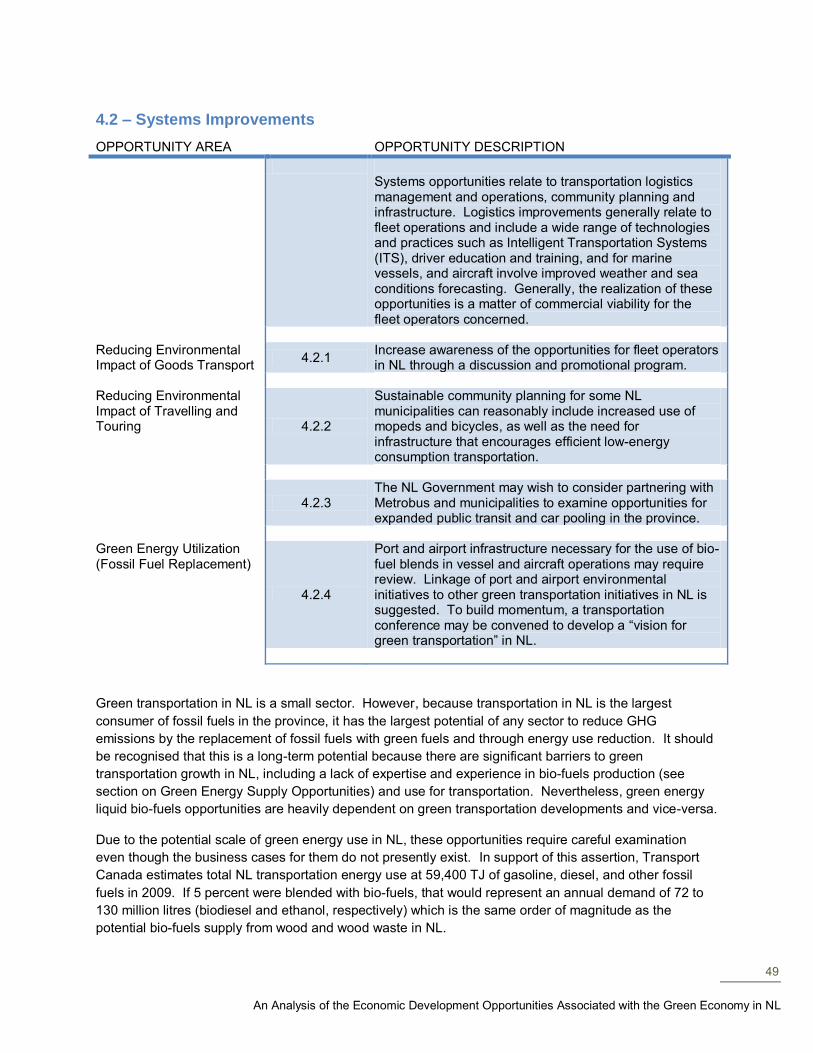
49
An Analysis of the Economic Development Opportunities Associated with the Green Economy in NL
4.2 – Systems Improvements
OPPORTUNITY AREA OPPORTUNITY DESCRIPTION
Systems opportunities relate to transportation logistics management and operations, community planning and infrastructure. Logistics improvements generally relate to fleet operations and include a wide range of technologies and practices such as Intelligent Transportation Systems (ITS), driver education and training, and for marine vessels, and aircraft involve improved weather and sea conditions forecasting. Generally, the realization of these opportunities is a matter of commercial viability for the fleet operators concerned.
Reducing Environmental Impact of Goods Transport
4.2.1 Increase awareness of the opportunities for fleet operators in NL through a discussion and promotional program.
Reducing Environmental Impact of Travelling and Touring 4.2.2
Sustainable community planning for some NL municipalities can reasonably include increased use of mopeds and bicycles, as well as the need for infrastructure that encourages efficient low-energy consumption transportation.
4.2.3 The NL Government may wish to consider partnering with Metrobus and municipalities to examine opportunities for expanded public transit and car pooling in the province.
Green Energy Utilization (Fossil Fuel Replacement)
4.2.4
Port and airport infrastructure necessary for the use of bio-fuel blends in vessel and aircraft operations may require review. Linkage of port and airport environmental initiatives to other green transportation initiatives in NL is suggested. To build momentum, a transportation conference may be convened to develop a “vision for green transportation” in NL.
Green transportation in NL is a small sector. However, because transportation in NL is the largest
consumer of fossil fuels in the province, it has the largest potential of any sector to reduce GHG
emissions by the replacement of fossil fuels with green fuels and through energy use reduction. It should
be recognised that this is a long-term potential because there are significant barriers to green
transportation growth in NL, including a lack of expertise and experience in bio-fuels production (see
section on Green Energy Supply Opportunities) and use for transportation. Nevertheless, green energy
liquid bio-fuels opportunities are heavily dependent on green transportation developments and vice-versa.
Due to the potential scale of green energy use in NL, these opportunities require careful examination
even though the business cases for them do not presently exist. In support of this assertion, Transport
Canada estimates total NL transportation energy use at 59,400 TJ of gasoline, diesel, and other fossil
fuels in 2009. If 5 percent were blended with bio-fuels, that would represent an annual demand of 72 to
130 million litres (biodiesel and ethanol, respectively) which is the same order of magnitude as the
potential bio-fuels supply from wood and wood waste in NL.
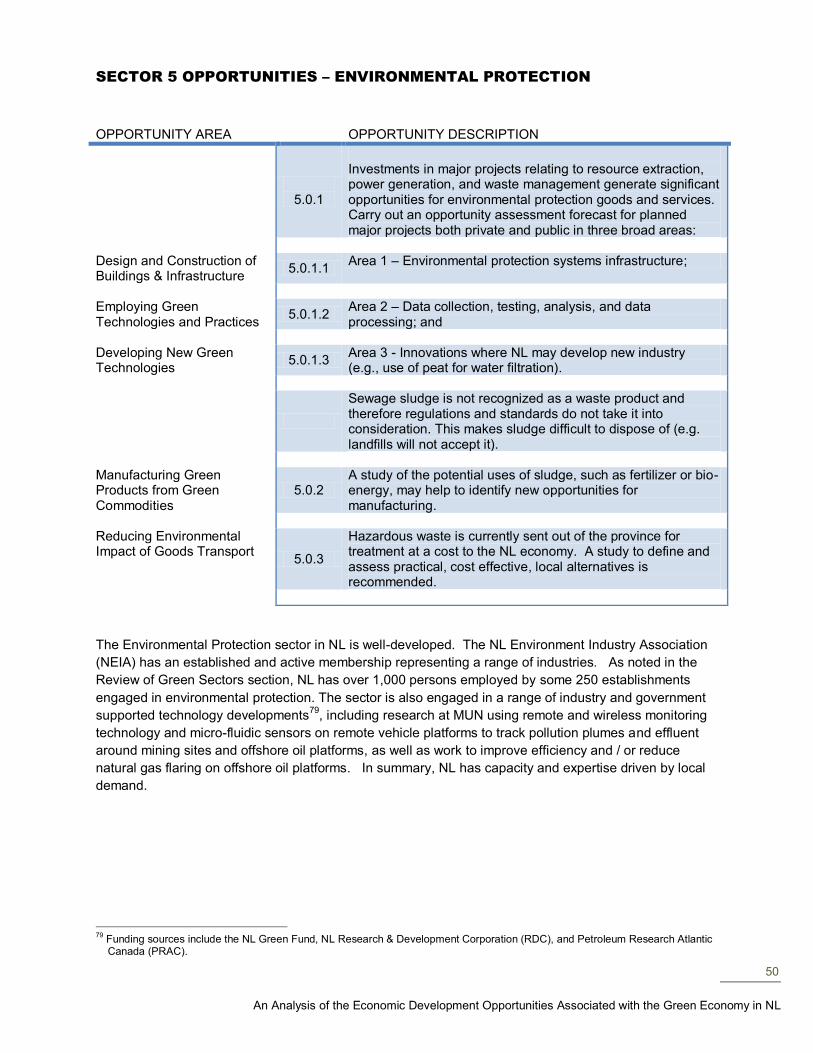
50
An Analysis of the Economic Development Opportunities Associated with the Green Economy in NL
SECTOR 5 OPPORTUNITIES – ENVIRONMENTAL PROTECTION
OPPORTUNITY AREA OPPORTUNITY DESCRIPTION
5.0.1
Investments in major projects relating to resource extraction, power generation, and waste management generate significant opportunities for environmental protection goods and services. Carry out an opportunity assessment forecast for planned major projects both private and public in three broad areas:
Design and Construction of Buildings & Infrastructure
5.0.1.1 Area 1 – Environmental protection systems infrastructure;
Employing Green Technologies and Practices
5.0.1.2 Area 2 – Data collection, testing, analysis, and data processing; and
Developing New Green Technologies
5.0.1.3 Area 3 - Innovations where NL may develop new industry (e.g., use of peat for water filtration).
Sewage sludge is not recognized as a waste product and therefore regulations and standards do not take it into consideration. This makes sludge difficult to dispose of (e.g. landfills will not accept it).
Manufacturing Green Products from Green Commodities
5.0.2 A study of the potential uses of sludge, such as fertilizer or bio-energy, may help to identify new opportunities for manufacturing.
Reducing Environmental Impact of Goods Transport
5.0.3
Hazardous waste is currently sent out of the province for treatment at a cost to the NL economy. A study to define and assess practical, cost effective, local alternatives is recommended.
The Environmental Protection sector in NL is well-developed. The NL Environment Industry Association
(NEIA) has an established and active membership representing a range of industries. As noted in the
Review of Green Sectors section, NL has over 1,000 persons employed by some 250 establishments
engaged in environmental protection. The sector is also engaged in a range of industry and government
supported technology developments79
, including research at MUN using remote and wireless monitoring
technology and micro-fluidic sensors on remote vehicle platforms to track pollution plumes and effluent
around mining sites and offshore oil platforms, as well as work to improve efficiency and / or reduce
natural gas flaring on offshore oil platforms. In summary, NL has capacity and expertise driven by local
demand.
79
Funding sources include the NL Green Fund, NL Research & Development Corporation (RDC), and Petroleum Research Atlantic Canada (PRAC).
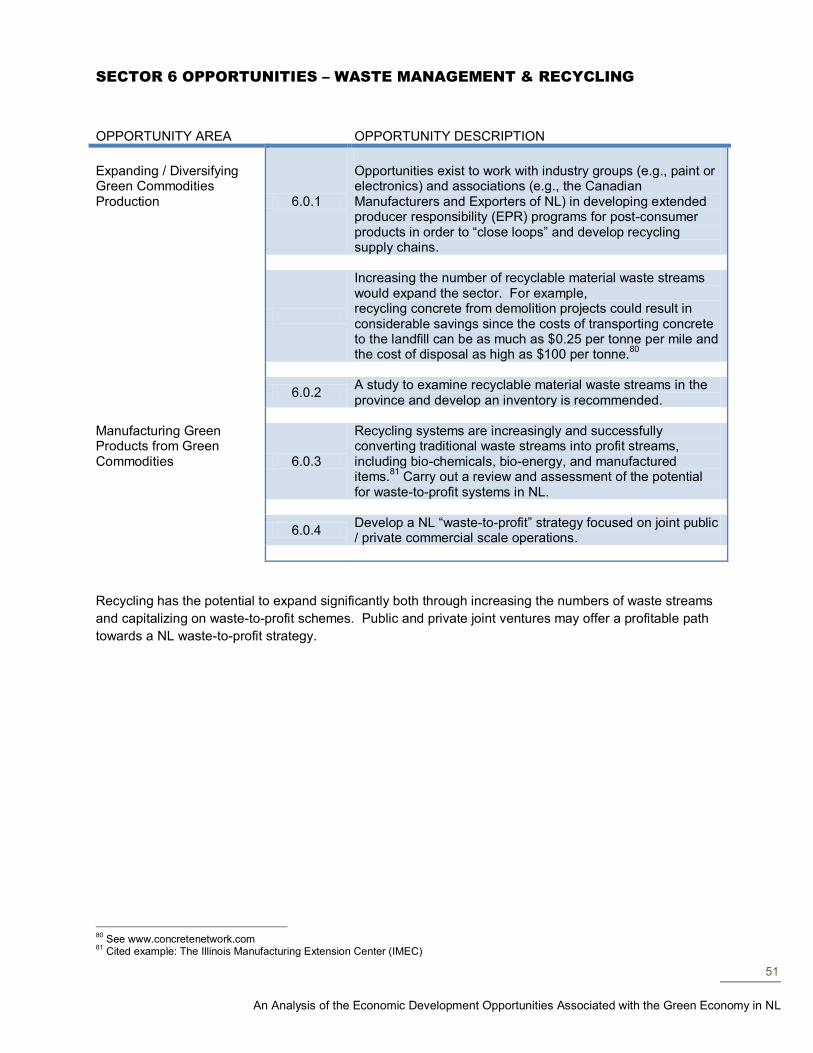
51
An Analysis of the Economic Development Opportunities Associated with the Green Economy in NL
SECTOR 6 OPPORTUNITIES – WASTE MANAGEMENT & RECYCLING
OPPORTUNITY AREA OPPORTUNITY DESCRIPTION
Expanding / Diversifying Green Commodities Production 6.0.1
Opportunities exist to work with industry groups (e.g., paint or electronics) and associations (e.g., the Canadian Manufacturers and Exporters of NL) in developing extended producer responsibility (EPR) programs for post-consumer products in order to “close loops” and develop recycling supply chains.
Increasing the number of recyclable material waste streams would expand the sector. For example, recycling concrete from demolition projects could result in considerable savings since the costs of transporting concrete to the landfill can be as much as $0.25 per tonne per mile and the cost of disposal as high as $100 per tonne.
80
6.0.2 A study to examine recyclable material waste streams in the province and develop an inventory is recommended.
Manufacturing Green Products from Green Commodities 6.0.3
Recycling systems are increasingly and successfully converting traditional waste streams into profit streams, including bio-chemicals, bio-energy, and manufactured items.
81 Carry out a review and assessment of the potential
for waste-to-profit systems in NL.
6.0.4 Develop a NL “waste-to-profit” strategy focused on joint public / private commercial scale operations.
Recycling has the potential to expand significantly both through increasing the numbers of waste streams
and capitalizing on waste-to-profit schemes. Public and private joint ventures may offer a profitable path
towards a NL waste-to-profit strategy.
80
See www.concretenetwork.com 81
Cited example: The Illinois Manufacturing Extension Center (IMEC)
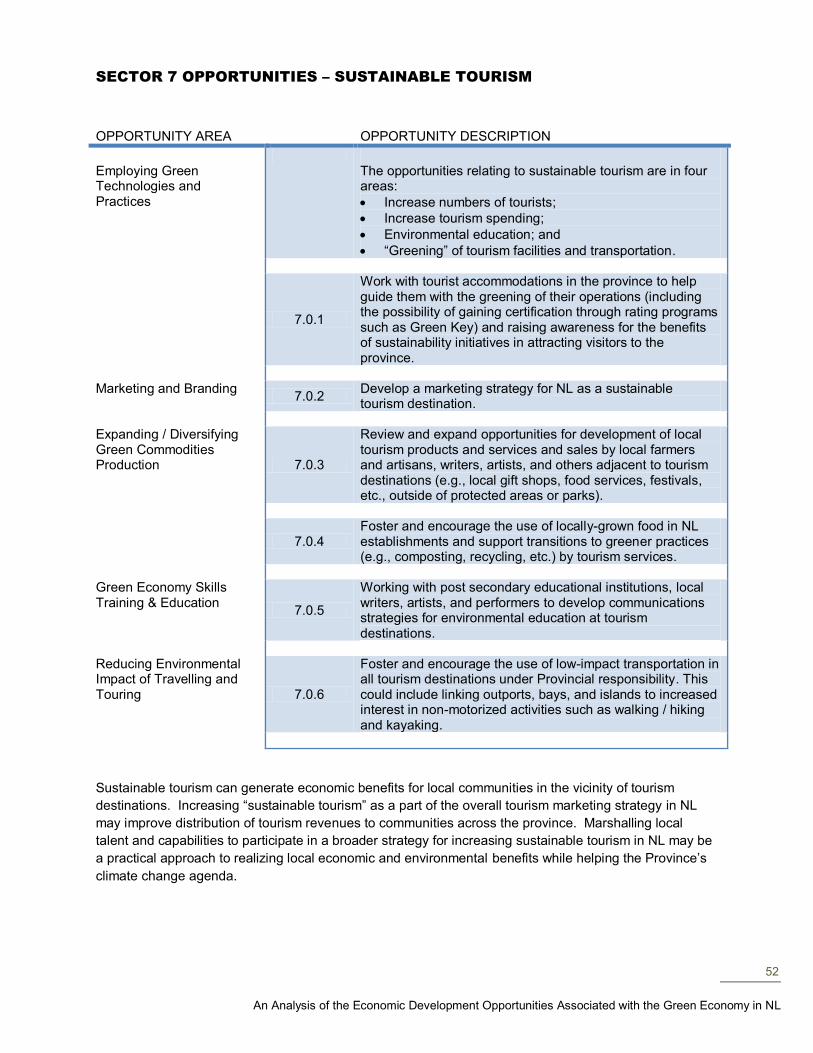
52
An Analysis of the Economic Development Opportunities Associated with the Green Economy in NL
SECTOR 7 OPPORTUNITIES – SUSTAINABLE TOURISM
OPPORTUNITY AREA OPPORTUNITY DESCRIPTION
Employing Green Technologies and Practices
The opportunities relating to sustainable tourism are in four areas:
Increase numbers of tourists;
Increase tourism spending;
Environmental education; and
“Greening” of tourism facilities and transportation.
7.0.1
Work with tourist accommodations in the province to help guide them with the greening of their operations (including the possibility of gaining certification through rating programs such as Green Key) and raising awareness for the benefits of sustainability initiatives in attracting visitors to the province.
Marketing and Branding
7.0.2 Develop a marketing strategy for NL as a sustainable tourism destination.
Expanding / Diversifying Green Commodities Production 7.0.3
Review and expand opportunities for development of local tourism products and services and sales by local farmers and artisans, writers, artists, and others adjacent to tourism destinations (e.g., local gift shops, food services, festivals, etc., outside of protected areas or parks).
7.0.4 Foster and encourage the use of locally-grown food in NL establishments and support transitions to greener practices (e.g., composting, recycling, etc.) by tourism services.
Green Economy Skills Training & Education
7.0.5
Working with post secondary educational institutions, local writers, artists, and performers to develop communications strategies for environmental education at tourism destinations.
Reducing Environmental Impact of Travelling and Touring 7.0.6
Foster and encourage the use of low-impact transportation in all tourism destinations under Provincial responsibility. This could include linking outports, bays, and islands to increased interest in non-motorized activities such as walking / hiking and kayaking.
Sustainable tourism can generate economic benefits for local communities in the vicinity of tourism
destinations. Increasing “sustainable tourism” as a part of the overall tourism marketing strategy in NL
may improve distribution of tourism revenues to communities across the province. Marshalling local
talent and capabilities to participate in a broader strategy for increasing sustainable tourism in NL may be
a practical approach to realizing local economic and environmental benefits while helping the Province’s
climate change agenda.
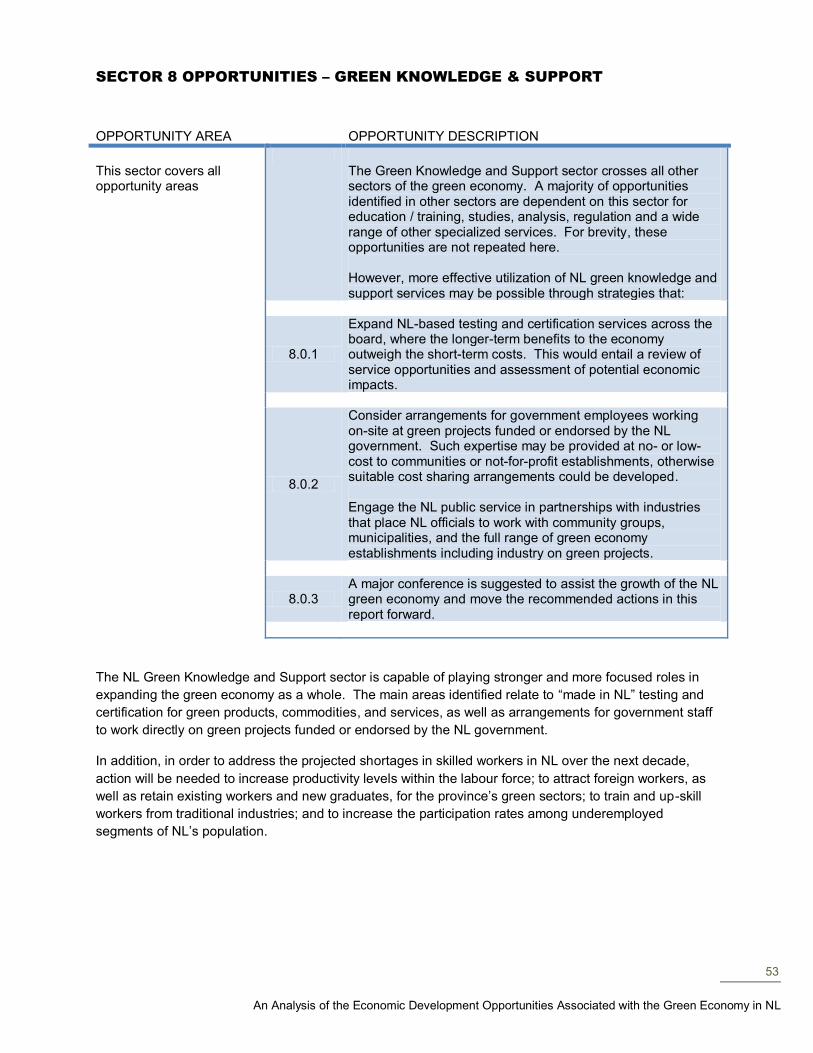
53
An Analysis of the Economic Development Opportunities Associated with the Green Economy in NL
SECTOR 8 OPPORTUNITIES – GREEN KNOWLEDGE & SUPPORT
OPPORTUNITY AREA OPPORTUNITY DESCRIPTION
This sector covers all opportunity areas
The Green Knowledge and Support sector crosses all other sectors of the green economy. A majority of opportunities identified in other sectors are dependent on this sector for education / training, studies, analysis, regulation and a wide range of other specialized services. For brevity, these opportunities are not repeated here. However, more effective utilization of NL green knowledge and support services may be possible through strategies that:
8.0.1
Expand NL-based testing and certification services across the board, where the longer-term benefits to the economy outweigh the short-term costs. This would entail a review of service opportunities and assessment of potential economic impacts.
8.0.2
Consider arrangements for government employees working on-site at green projects funded or endorsed by the NL government. Such expertise may be provided at no- or low-cost to communities or not-for-profit establishments, otherwise suitable cost sharing arrangements could be developed. Engage the NL public service in partnerships with industries that place NL officials to work with community groups, municipalities, and the full range of green economy establishments including industry on green projects.
8.0.3 A major conference is suggested to assist the growth of the NL green economy and move the recommended actions in this report forward.
The NL Green Knowledge and Support sector is capable of playing stronger and more focused roles in
expanding the green economy as a whole. The main areas identified relate to “made in NL” testing and
certification for green products, commodities, and services, as well as arrangements for government staff
to work directly on green projects funded or endorsed by the NL government.
In addition, in order to address the projected shortages in skilled workers in NL over the next decade,
action will be needed to increase productivity levels within the labour force; to attract foreign workers, as
well as retain existing workers and new graduates, for the province’s green sectors; to train and up-skill
workers from traditional industries; and to increase the participation rates among underemployed
segments of NL’s population.
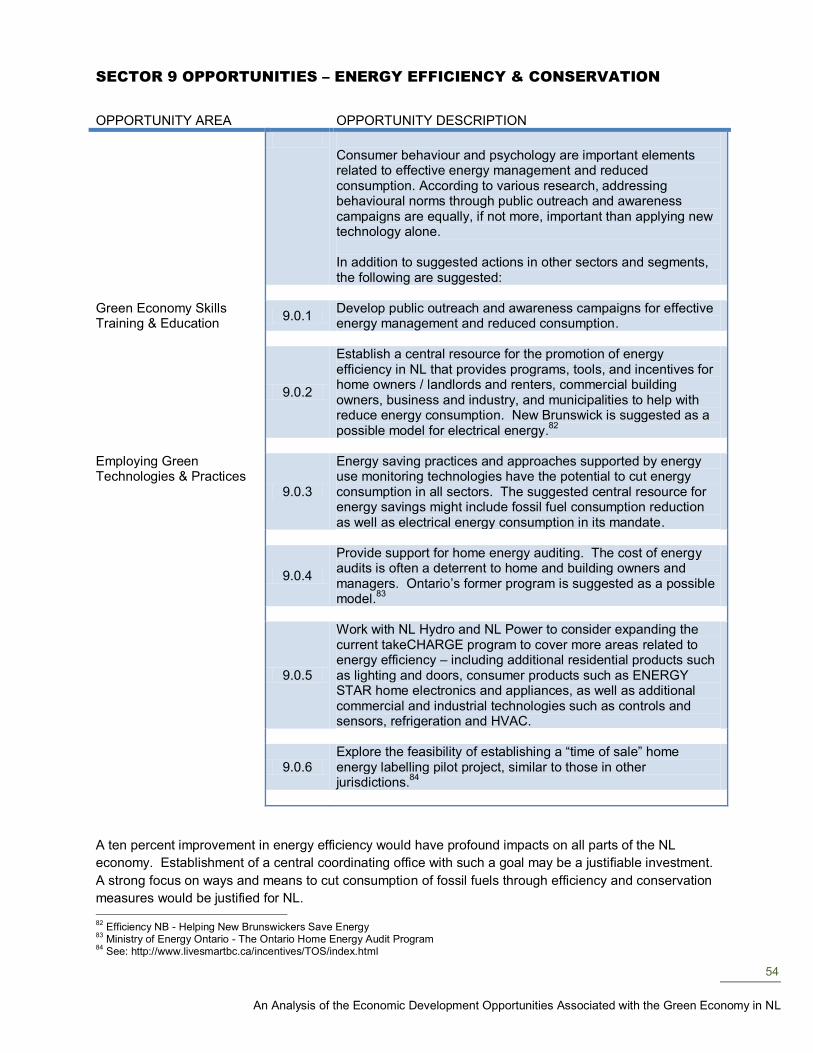
54
An Analysis of the Economic Development Opportunities Associated with the Green Economy in NL
SECTOR 9 OPPORTUNITIES – ENERGY EFFICIENCY & CONSERVATION
OPPORTUNITY AREA OPPORTUNITY DESCRIPTION
Consumer behaviour and psychology are important elements related to effective energy management and reduced consumption. According to various research, addressing behavioural norms through public outreach and awareness campaigns are equally, if not more, important than applying new technology alone. In addition to suggested actions in other sectors and segments, the following are suggested:
Green Economy Skills Training & Education
9.0.1 Develop public outreach and awareness campaigns for effective energy management and reduced consumption.
9.0.2
Establish a central resource for the promotion of energy efficiency in NL that provides programs, tools, and incentives for home owners / landlords and renters, commercial building owners, business and industry, and municipalities to help with reduce energy consumption. New Brunswick is suggested as a possible model for electrical energy.
82
Employing Green Technologies & Practices
9.0.3
Energy saving practices and approaches supported by energy use monitoring technologies have the potential to cut energy consumption in all sectors. The suggested central resource for energy savings might include fossil fuel consumption reduction as well as electrical energy consumption in its mandate.
9.0.4
Provide support for home energy auditing. The cost of energy audits is often a deterrent to home and building owners and managers. Ontario’s former program is suggested as a possible model.
83
9.0.5
Work with NL Hydro and NL Power to consider expanding the current takeCHARGE program to cover more areas related to energy efficiency – including additional residential products such as lighting and doors, consumer products such as ENERGY STAR home electronics and appliances, as well as additional commercial and industrial technologies such as controls and sensors, refrigeration and HVAC.
9.0.6 Explore the feasibility of establishing a “time of sale” home energy labelling pilot project, similar to those in other jurisdictions.
84
A ten percent improvement in energy efficiency would have profound impacts on all parts of the NL
economy. Establishment of a central coordinating office with such a goal may be a justifiable investment.
A strong focus on ways and means to cut consumption of fossil fuels through efficiency and conservation
measures would be justified for NL. 82
Efficiency NB - Helping New Brunswickers Save Energy 83
Ministry of Energy Ontario - The Ontario Home Energy Audit Program 84
See: http://www.livesmartbc.ca/incentives/TOS/index.html
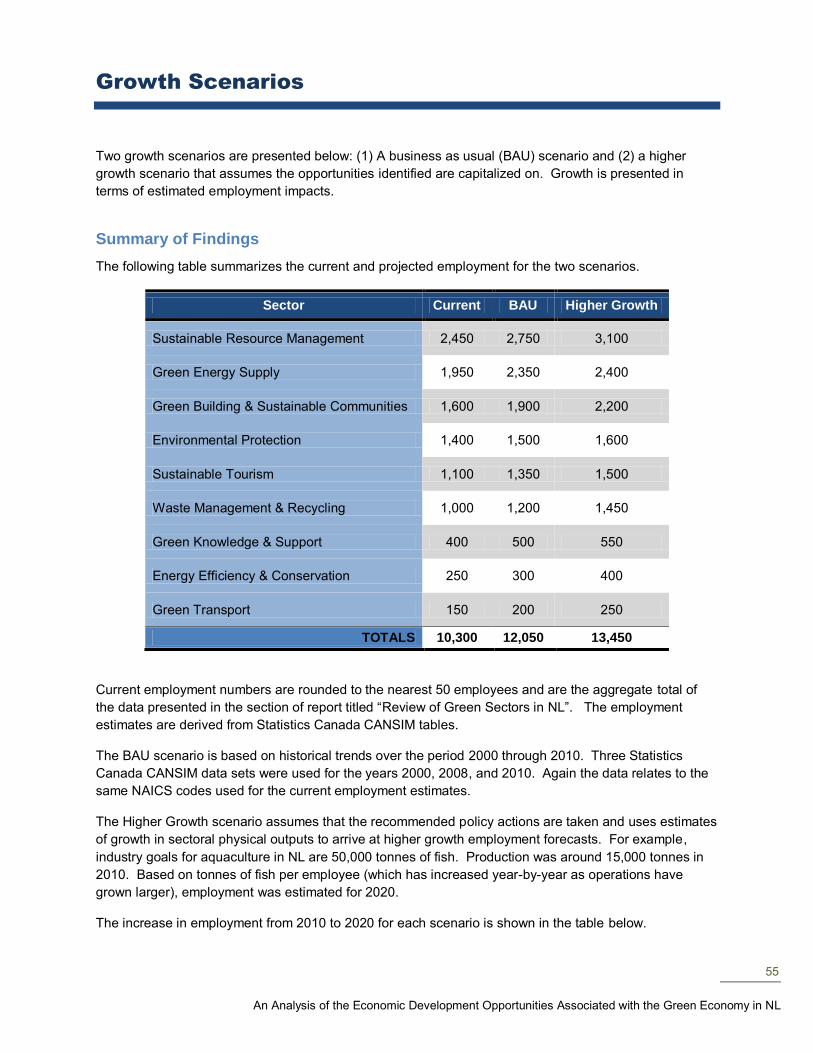
55
An Analysis of the Economic Development Opportunities Associated with the Green Economy in NL
Growth Scenarios
Two growth scenarios are presented below: (1) A business as usual (BAU) scenario and (2) a higher
growth scenario that assumes the opportunities identified are capitalized on. Growth is presented in
terms of estimated employment impacts.
Summary of Findings
The following table summarizes the current and projected employment for the two scenarios.
Sector Current BAU Higher Growth
Sustainable Resource Management 2,450 2,750 3,100
Green Energy Supply 1,950 2,350 2,400
Green Building & Sustainable Communities 1,600 1,900 2,200
Environmental Protection 1,400 1,500 1,600
Sustainable Tourism 1,100 1,350 1,500
Waste Management & Recycling 1,000 1,200 1,450
Green Knowledge & Support 400 500 550
Energy Efficiency & Conservation 250 300 400
Green Transport 150 200 250
TOTALS 10,300 12,050 13,450
Current employment numbers are rounded to the nearest 50 employees and are the aggregate total of
the data presented in the section of report titled “Review of Green Sectors in NL”. The employment
estimates are derived from Statistics Canada CANSIM tables.
The BAU scenario is based on historical trends over the period 2000 through 2010. Three Statistics
Canada CANSIM data sets were used for the years 2000, 2008, and 2010. Again the data relates to the
same NAICS codes used for the current employment estimates.
The Higher Growth scenario assumes that the recommended policy actions are taken and uses estimates
of growth in sectoral physical outputs to arrive at higher growth employment forecasts. For example,
industry goals for aquaculture in NL are 50,000 tonnes of fish. Production was around 15,000 tonnes in
2010. Based on tonnes of fish per employee (which has increased year-by-year as operations have
grown larger), employment was estimated for 2020.
The increase in employment from 2010 to 2020 for each scenario is shown in the table below.
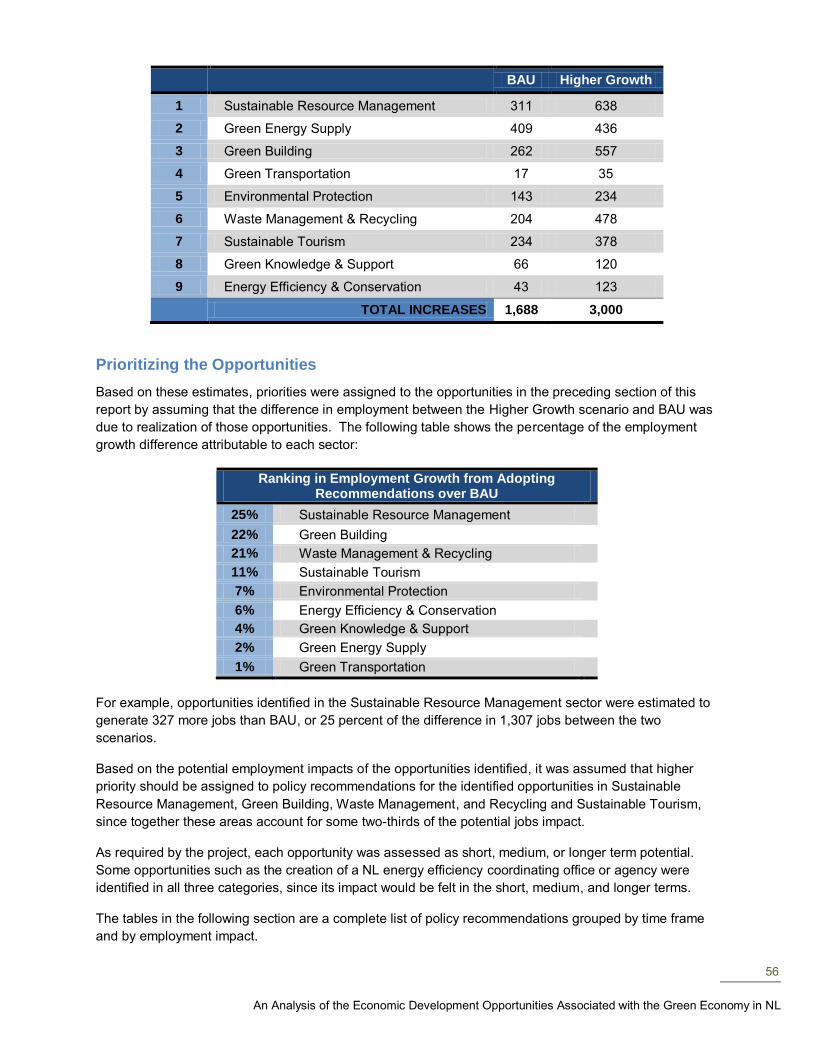
56
An Analysis of the Economic Development Opportunities Associated with the Green Economy in NL
BAU Higher Growth
1 Sustainable Resource Management 311 638
2 Green Energy Supply 409 436
3 Green Building 262 557
4 Green Transportation 17 35
5 Environmental Protection 143 234
6 Waste Management & Recycling 204 478
7 Sustainable Tourism 234 378
8 Green Knowledge & Support 66 120
9 Energy Efficiency & Conservation 43 123
TOTAL INCREASES 1,688 3,000
Prioritizing the Opportunities
Based on these estimates, priorities were assigned to the opportunities in the preceding section of this
report by assuming that the difference in employment between the Higher Growth scenario and BAU was
due to realization of those opportunities. The following table shows the percentage of the employment
growth difference attributable to each sector:
Ranking in Employment Growth from Adopting Recommendations over BAU
25% Sustainable Resource Management
22% Green Building
21% Waste Management & Recycling
11% Sustainable Tourism
7% Environmental Protection
6% Energy Efficiency & Conservation
4% Green Knowledge & Support
2% Green Energy Supply
1% Green Transportation
For example, opportunities identified in the Sustainable Resource Management sector were estimated to
generate 327 more jobs than BAU, or 25 percent of the difference in 1,307 jobs between the two
scenarios.
Based on the potential employment impacts of the opportunities identified, it was assumed that higher
priority should be assigned to policy recommendations for the identified opportunities in Sustainable
Resource Management, Green Building, Waste Management, and Recycling and Sustainable Tourism,
since together these areas account for some two-thirds of the potential jobs impact.
As required by the project, each opportunity was assessed as short, medium, or longer term potential.
Some opportunities such as the creation of a NL energy efficiency coordinating office or agency were
identified in all three categories, since its impact would be felt in the short, medium, and longer terms.
The tables in the following section are a complete list of policy recommendations grouped by time frame
and by employment impact.
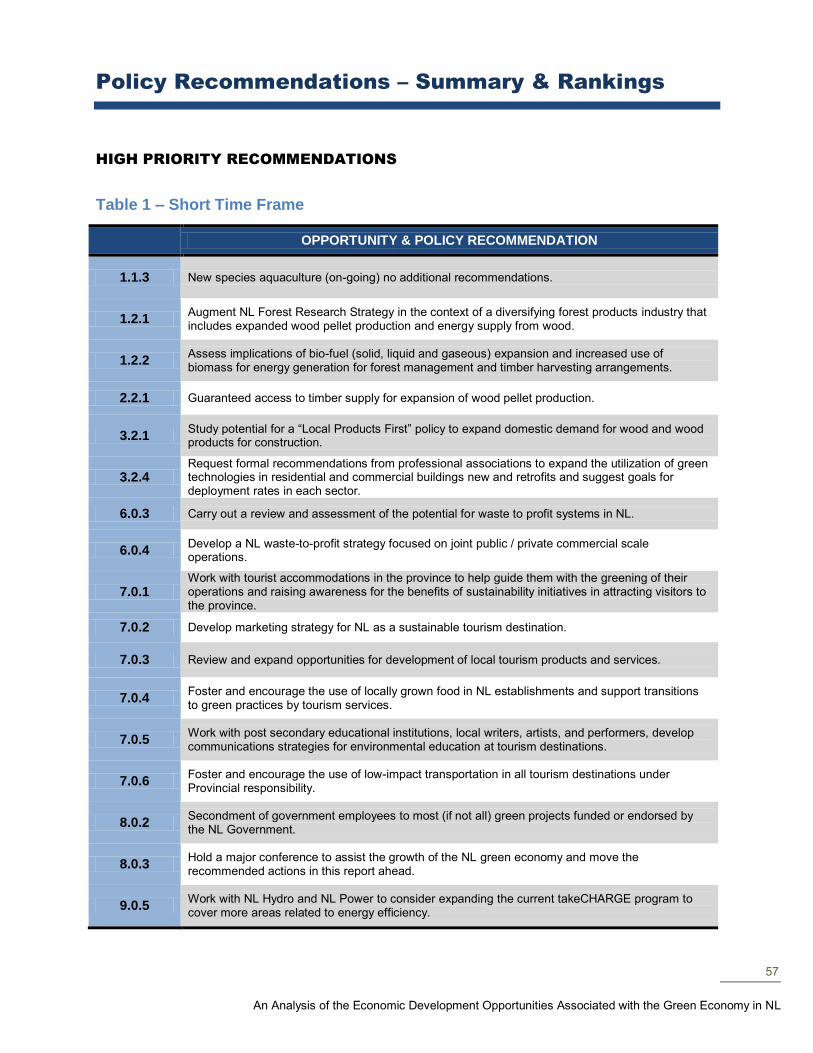
57
An Analysis of the Economic Development Opportunities Associated with the Green Economy in NL
Policy Recommendations – Summary & Rankings
HIGH PRIORITY RECOMMENDATIONS
Table 1 – Short Time Frame
OPPORTUNITY & POLICY RECOMMENDATION
1.1.3 New species aquaculture (on-going) no additional recommendations.
1.2.1 Augment NL Forest Research Strategy in the context of a diversifying forest products industry that includes expanded wood pellet production and energy supply from wood.
1.2.2 Assess implications of bio-fuel (solid, liquid and gaseous) expansion and increased use of biomass for energy generation for forest management and timber harvesting arrangements.
2.2.1 Guaranteed access to timber supply for expansion of wood pellet production.
3.2.1 Study potential for a “Local Products First” policy to expand domestic demand for wood and wood products for construction.
3.2.4 Request formal recommendations from professional associations to expand the utilization of green technologies in residential and commercial buildings new and retrofits and suggest goals for deployment rates in each sector.
6.0.3 Carry out a review and assessment of the potential for waste to profit systems in NL.
6.0.4 Develop a NL waste-to-profit strategy focused on joint public / private commercial scale operations.
7.0.1 Work with tourist accommodations in the province to help guide them with the greening of their operations and raising awareness for the benefits of sustainability initiatives in attracting visitors to the province.
7.0.2 Develop marketing strategy for NL as a sustainable tourism destination.
7.0.3 Review and expand opportunities for development of local tourism products and services.
7.0.4 Foster and encourage the use of locally grown food in NL establishments and support transitions to green practices by tourism services.
7.0.5 Work with post secondary educational institutions, local writers, artists, and performers, develop communications strategies for environmental education at tourism destinations.
7.0.6 Foster and encourage the use of low-impact transportation in all tourism destinations under Provincial responsibility.
8.0.2 Secondment of government employees to most (if not all) green projects funded or endorsed by the NL Government.
8.0.3 Hold a major conference to assist the growth of the NL green economy and move the recommended actions in this report ahead.
9.0.5 Work with NL Hydro and NL Power to consider expanding the current takeCHARGE program to cover more areas related to energy efficiency.

58
An Analysis of the Economic Development Opportunities Associated with the Green Economy in NL
Table 2 – Medium Time Frame
OPPORTUNITY & POLICY RECOMMENDATION
1.1.1 Expand the use of Integrated Multi-Trophic Aquaculture (IMTA).
1.1.2 Study of NL aquaculture energy inputs and potential for replacement of fossil fuels with bio-fuels or other renewable.
1.1.5 Select promising pathways for biodiesel production from fish waste and build pilot plants for small scale bio-diesel production.
1.3.1 Study potential for a cost effective NL organic or “semi” organic farm certification.
1.3.2 Assess potential for expanding the numbers of farms utilizing farm waste for energy supply.
1.3.3 Support deployment of renewable energy systems for green house operations.
2.1.2 Define the operational requirements in engineering terms for NL wind development and commence R&D work.
2.2.2 Identify potential pathways to produce bio-fuels from identified waste and commodity streams.
2.2.3 Carry out lab-scale research to develop proof-of-concept production methods for high potential bio-fuel pathways.
2.2.4 Establish pilot production plants for a number of promising pathways and allow mixing with gasoline or diesel fuels for local use.
3.1.1 Study the extension of the Better Buildings Policy for the entire commercial and institutional sector.
3.1.2 Study the extension of a 25 percent improvement over MNECB for new residential construction.
3.1.3 Define the range of green retrofit technologies and practices available for commercial and institutional buildings, assess the current and projected economics for each opportunity, and recommend extensions to the Better Building Policy.
3.1.4 Prepare a skills and training strategy for green building involving education / training organizations, labour unions, and industry.
3.1.5 Prepare a NL economic development strategy to maximize benefits of the Better Building Policy and its possible extensions for NL technology developers and manufacturers.
3.1.6 Repeat 3.1.3, 3.1.4 and 3.1.5 for residential retrofits.
3.2.2 Determine the matches available between existing recyclable materials streams in NL, local capacity to process these streams into products, and the NL green building markets for such products.
3.2.3 Establish a green building technology development task force with manufacturers, technology developers, and building design professionals to develop a strategy for expanded use of NL developed green technologies.
4.2.3 Partner with Metrobus and municipalities to examine opportunities for expanded bus services in the province.
6.0.1 Work with industry groups (e.g., paint, electronics, etc.) and associations (e.g., CME-NL) in developing EPR programs for post-consumer products in order to “close loops” and develop recycling supply chains.
6.0.2 Increase the number of recyclable materials waste streams.
8.0.1 Expand NL-based testing and certification services.
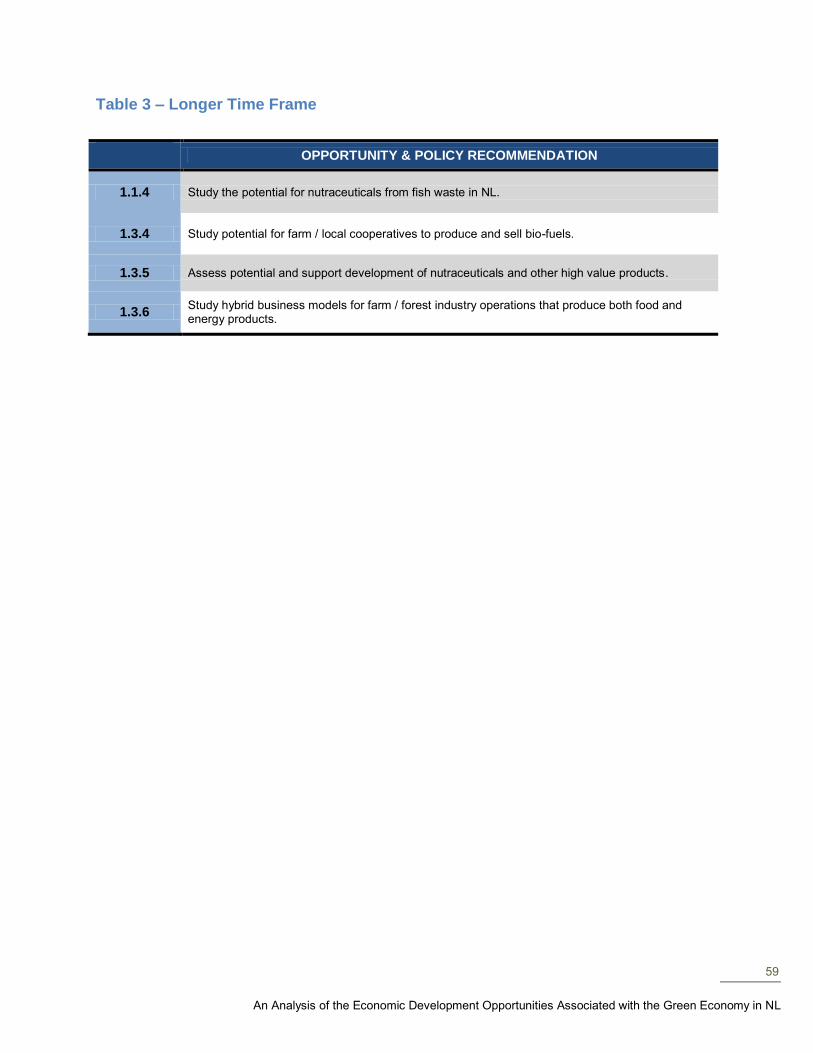
59
An Analysis of the Economic Development Opportunities Associated with the Green Economy in NL
Table 3 – Longer Time Frame
OPPORTUNITY & POLICY RECOMMENDATION
1.1.4 Study the potential for nutraceuticals from fish waste in NL.
1.3.4 Study potential for farm / local cooperatives to produce and sell bio-fuels.
1.3.5 Assess potential and support development of nutraceuticals and other high value products.
1.3.6 Study hybrid business models for farm / forest industry operations that produce both food and energy products.
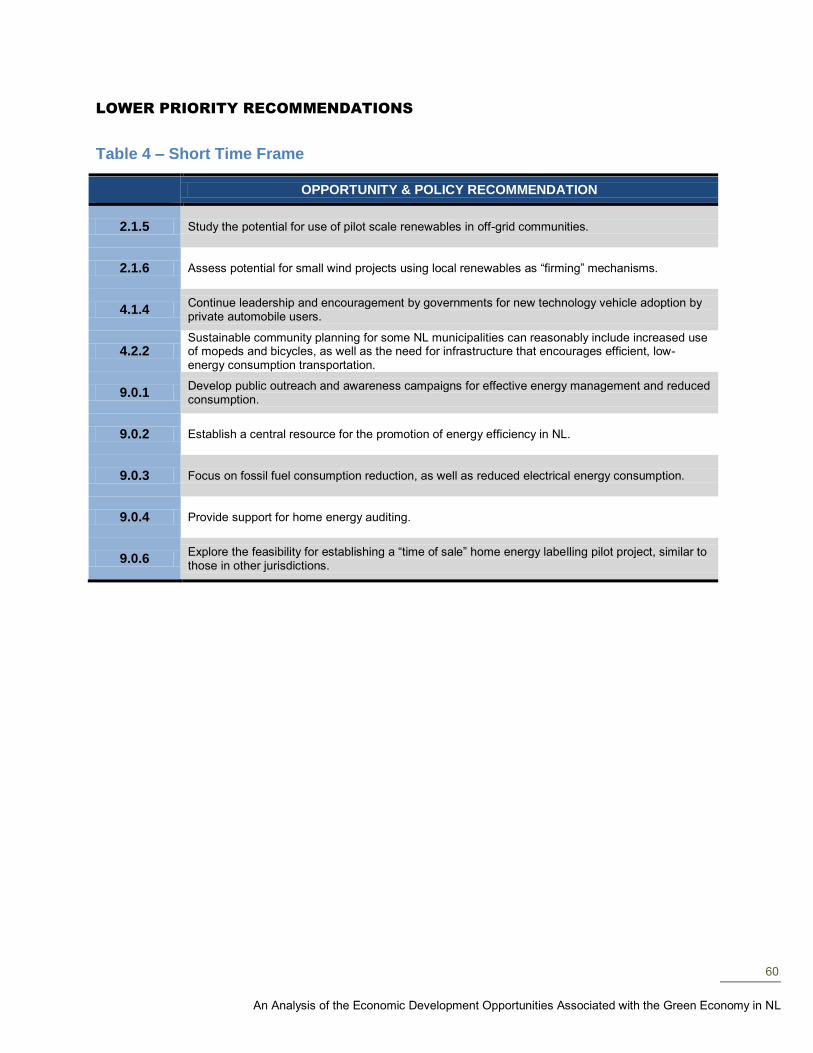
60
An Analysis of the Economic Development Opportunities Associated with the Green Economy in NL
LOWER PRIORITY RECOMMENDATIONS
Table 4 – Short Time Frame
OPPORTUNITY & POLICY RECOMMENDATION
2.1.5 Study the potential for use of pilot scale renewables in off-grid communities.
2.1.6 Assess potential for small wind projects using local renewables as “firming” mechanisms.
4.1.4 Continue leadership and encouragement by governments for new technology vehicle adoption by private automobile users.
4.2.2 Sustainable community planning for some NL municipalities can reasonably include increased use of mopeds and bicycles, as well as the need for infrastructure that encourages efficient, low-energy consumption transportation.
9.0.1 Develop public outreach and awareness campaigns for effective energy management and reduced consumption.
9.0.2 Establish a central resource for the promotion of energy efficiency in NL.
9.0.3 Focus on fossil fuel consumption reduction, as well as reduced electrical energy consumption.
9.0.4 Provide support for home energy auditing.
9.0.6 Explore the feasibility for establishing a “time of sale” home energy labelling pilot project, similar to those in other jurisdictions.
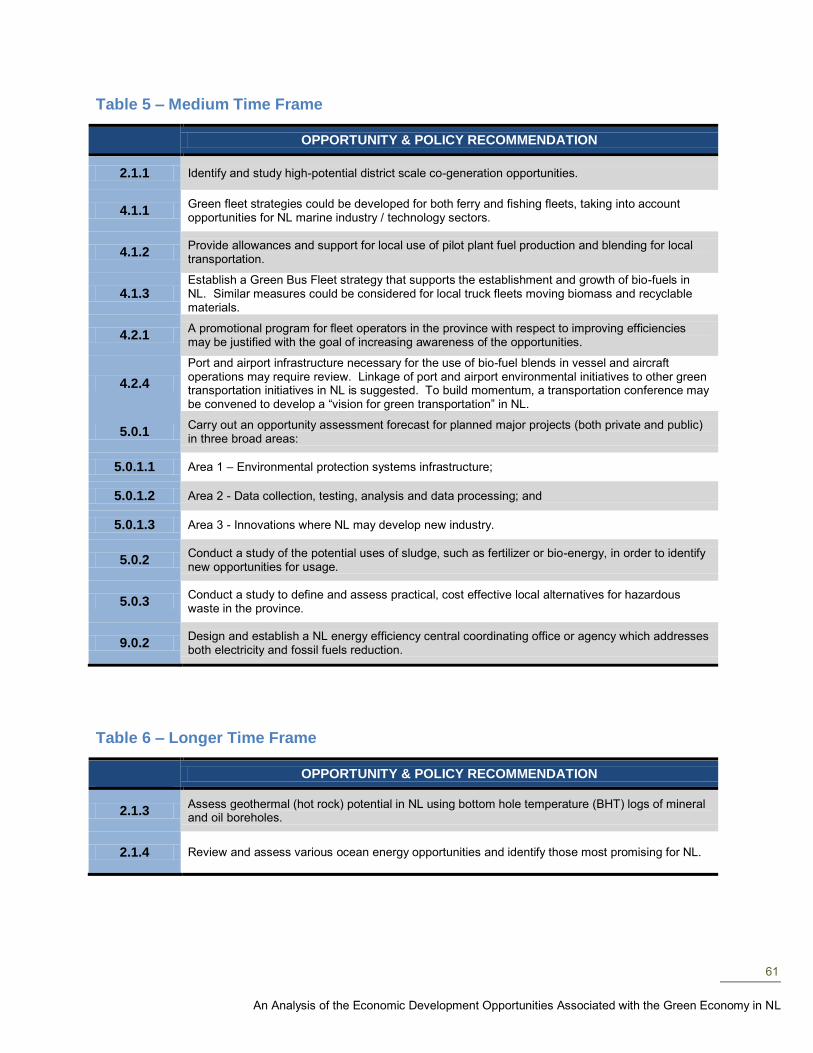
61
An Analysis of the Economic Development Opportunities Associated with the Green Economy in NL
Table 5 – Medium Time Frame
OPPORTUNITY & POLICY RECOMMENDATION
2.1.1 Identify and study high-potential district scale co-generation opportunities.
4.1.1 Green fleet strategies could be developed for both ferry and fishing fleets, taking into account opportunities for NL marine industry / technology sectors.
4.1.2 Provide allowances and support for local use of pilot plant fuel production and blending for local transportation.
4.1.3 Establish a Green Bus Fleet strategy that supports the establishment and growth of bio-fuels in NL. Similar measures could be considered for local truck fleets moving biomass and recyclable materials.
4.2.1 A promotional program for fleet operators in the province with respect to improving efficiencies may be justified with the goal of increasing awareness of the opportunities.
4.2.4
Port and airport infrastructure necessary for the use of bio-fuel blends in vessel and aircraft operations may require review. Linkage of port and airport environmental initiatives to other green transportation initiatives in NL is suggested. To build momentum, a transportation conference may be convened to develop a “vision for green transportation” in NL.
5.0.1 Carry out an opportunity assessment forecast for planned major projects (both private and public) in three broad areas:
5.0.1.1 Area 1 – Environmental protection systems infrastructure;
5.0.1.2 Area 2 - Data collection, testing, analysis and data processing; and
5.0.1.3 Area 3 - Innovations where NL may develop new industry.
5.0.2 Conduct a study of the potential uses of sludge, such as fertilizer or bio-energy, in order to identify new opportunities for usage.
5.0.3 Conduct a study to define and assess practical, cost effective local alternatives for hazardous waste in the province.
9.0.2 Design and establish a NL energy efficiency central coordinating office or agency which addresses both electricity and fossil fuels reduction.
Table 6 – Longer Time Frame
OPPORTUNITY & POLICY RECOMMENDATION
2.1.3 Assess geothermal (hot rock) potential in NL using bottom hole temperature (BHT) logs of mineral and oil boreholes.
2.1.4 Review and assess various ocean energy opportunities and identify those most promising for NL.
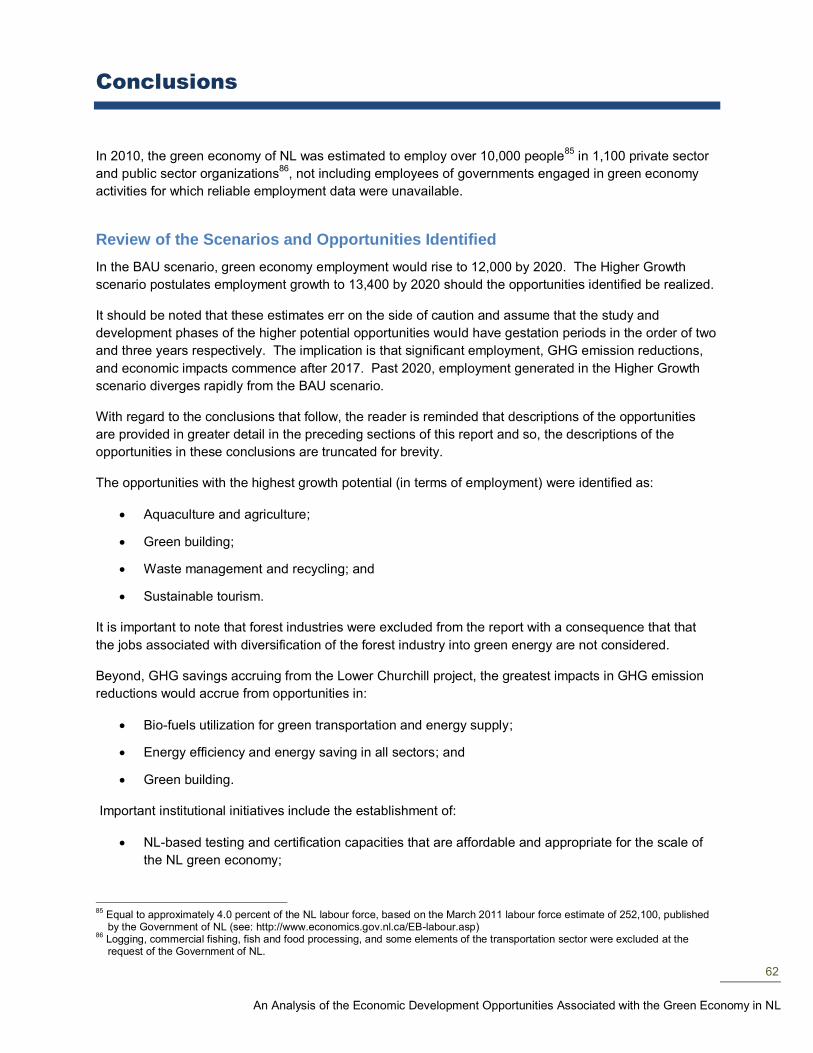
62
An Analysis of the Economic Development Opportunities Associated with the Green Economy in NL
Conclusions
In 2010, the green economy of NL was estimated to employ over 10,000 people
85 in 1,100 private sector
and public sector organizations86
, not including employees of governments engaged in green economy
activities for which reliable employment data were unavailable.
Review of the Scenarios and Opportunities Identified
In the BAU scenario, green economy employment would rise to 12,000 by 2020. The Higher Growth
scenario postulates employment growth to 13,400 by 2020 should the opportunities identified be realized.
It should be noted that these estimates err on the side of caution and assume that the study and
development phases of the higher potential opportunities would have gestation periods in the order of two
and three years respectively. The implication is that significant employment, GHG emission reductions,
and economic impacts commence after 2017. Past 2020, employment generated in the Higher Growth
scenario diverges rapidly from the BAU scenario.
With regard to the conclusions that follow, the reader is reminded that descriptions of the opportunities
are provided in greater detail in the preceding sections of this report and so, the descriptions of the
opportunities in these conclusions are truncated for brevity.
The opportunities with the highest growth potential (in terms of employment) were identified as:
Aquaculture and agriculture;
Green building;
Waste management and recycling; and
Sustainable tourism.
It is important to note that forest industries were excluded from the report with a consequence that that
the jobs associated with diversification of the forest industry into green energy are not considered.
Beyond, GHG savings accruing from the Lower Churchill project, the greatest impacts in GHG emission
reductions would accrue from opportunities in:
Bio-fuels utilization for green transportation and energy supply;
Energy efficiency and energy saving in all sectors; and
Green building.
Important institutional initiatives include the establishment of:
NL-based testing and certification capacities that are affordable and appropriate for the scale of
the NL green economy;
85
Equal to approximately 4.0 percent of the NL labour force, based on the March 2011 labour force estimate of 252,100, published by the Government of NL (see: http://www.economics.gov.nl.ca/EB-labour.asp)
86 Logging, commercial fishing, fish and food processing, and some elements of the transportation sector were excluded at the request of the Government of NL.
63
An Analysis of the Economic Development Opportunities Associated with the Green Economy in NL
A NL energy efficiency central coordinating office or agency which addresses both electricity and
fossil fuels reduction; and
Programs to allow NL green initiatives to gain the benefit of highly skilled public servants working
directly on building the NL green economy.
The single highest potential growth areas for long-term permanent employment generation in the green
economy identified in this report are in the:
Continued expansion of and diversification of NL aquaculture;
Support for farms to cut operating costs through waste to energy systems, pilot scale bio-fuel co-
operatives and small scale renewable energy systems (bio-energy, solar, wind etc.);
Development of a NL-based, affordable certification for “organic” or “semi-organic” agri-food
production;
Expansion of wood pellet production coupled with changes in forest management practices to
improve the economics for expansion and new pellet plants in NL;
Development and implementation of a liquid bio-fuels strategy commencing with a set of lab scale
or pilot scale ethanol and bio-diesel production projects designed to identify the most promising
pathways for bio-fuels production in NL (e.g., cellulosic ethanol and fish oil to produce bio-diesel);
Expansion of the Better Building policies to all commercial, institutional, and residential
construction;
Development and implementation a comprehensive strategy to maximize opportunities for “made
in NL” building products and technologies – engage professional associations, construction firms,
educational and research organizations and developers in the strategy development process;
Implementation of a waste-to-profit strategy for the expansion of the recycling segment of the
green economy, together with growth in NL green products manufacturing linked to green building
demand and other markets;
Expansion of sustainable tourism initiatives by marshalling local talent and capabilities to
participate in a broader strategy for increasing sustainable tourism in NL;
Review and expand opportunities for development of local tourism products and services and
sales by local farmers and artisans, writers, artists, and others adjacent to tourism destinations
and foster and encourage the use of locally-grown and produced food products in tourist facilities
and support transitions to greener practices (e.g., composting, recycling, etc.) by tourism
services; and
A communications and network building strategy focused on green knowledge and support,
including a major conference to assist the growth of the NL green economy and move the
recommended actions in this report ahead.
The great majority of green economy opportunities identified address local market demand. However, as
the green economy expands, sales to international and inter-provincial markets would also expand. The
main opportunities for export sales were identified as:
Renewable electrical energy;
Aquaculture;
Sustainable tourism;
64
An Analysis of the Economic Development Opportunities Associated with the Green Economy in NL
Wood pellets and other bio-fuels;
Specialized services and technologies in environmental protection; and
Ocean technologies relating to the green economy.
In addition to the trade opportunities, green economy growth would also replace some imports with local
products and services including:
Local food and food products;
NL-based testing and certification; and
Use of NL wood products and other green products and systems for green building.
In summary, NL has a wide range of potential green economy opportunities that can generate significant
economic impacts within the time horizon of this project. Most require studies and assessments to define
the business cases and set the stage for investment in a bright green future for the NL economy.
Related Documents