ISSN: 1466-0814 AN ANALYSIS OF SUBJECTIVE VIEWS OF JOB INSECURITY Francis Green, Andrew Dickerson, Alan Carruth and David Campbell April 2001 Abstract In the 1997 and 1998 waves of the British Household Panel Survey, workers are asked to assess their level of job security in terms of the probability of becoming unemployed within the next year. We examine whether these perceptions of insecurity are purely subjective or are systematically related to certain characteristics of the worker and their current job. The responses offered by workers suggest that around 10% are in fear of becoming unemployed, and this fear is not persistently confined to the same workers or to particular occupational groups. Individuals with a history of unemployment and those holding short-term employment contracts are found to report the greatest levels of insecurity. Finally, we find that workers’ perceptions of unemployment are strong predictors of actual unemployment experiences occurring in the subsequent year. We therefore conclude that such subjective measures of insecurity do convey useful information that may be used in further analyses of the workings of the labour market. JEL Classification: J28, C21, C23 Keywords: unemployment expectations, job satisfaction, cross-section models, panel data. Acknowledgements: We thank the Leverhulme Trust who have funded this research under grant number FD/00236B. Material from the BHPS is Crown Copyright; it has been made available by the Office for National Statistics through the Data Archive and has been used by permission. Address for Correspondence: Francis Green, Department of Economics, Keynes College, University of Kent at Canterbury, Canterbury, Kent, CT2 7NP, UK. Tel: +44 (0)1227 827305, Fax: +44 (0)1227 827784; email: [email protected].

Welcome message from author
This document is posted to help you gain knowledge. Please leave a comment to let me know what you think about it! Share it to your friends and learn new things together.
Transcript
ISSN: 1466-0814
AN ANALYSIS OF SUBJECTIVE VIEWS OF JOB INSECURITY
Francis Green, Andrew Dickerson, Alan Carruth and David Campbell
April 2001
Abstract In the 1997 and 1998 waves of the British Household Panel Survey, workers are asked to assess their level of job security in terms of the probability of becoming unemployed within the next year. We examine whether these perceptions of insecurity are purely subjective or are systematically related to certain characteristics of the worker and their current job. The responses offered by workers suggest that around 10% are in fear of becoming unemployed, and this fear is not persistently confined to the same workers or to particular occupational groups. Individuals with a history of unemployment and those holding short-term employment contracts are found to report the greatest levels of insecurity. Finally, we find that workers’ perceptions of unemployment are strong predictors of actual unemployment experiences occurring in the subsequent year. We therefore conclude that such subjective measures of insecurity do convey useful information that may be used in further analyses of the workings of the labour market.
JEL Classification: J28, C21, C23 Keywords: unemployment expectations, job satisfaction, cross-section models, panel data. Acknowledgements: We thank the Leverhulme Trust who have funded this research under grant number FD/00236B. Material from the BHPS is Crown Copyright; it has been made available by the Office for National Statistics through the Data Archive and has been used by permission. Address for Correspondence: Francis Green, Department of Economics, Keynes College, University of Kent at Canterbury, Canterbury, Kent, CT2 7NP, UK. Tel: +44 (0)1227 827305, Fax: +44 (0)1227 827784; email: [email protected].
1
AN ANALYSIS OF SUBJECTIVE VIEWS OF JOB INSECURITY
1. Introduction
The aim of this paper is to investigate whether workers’ perceptions of job insecurity are
purely subjective or correlate with objective economic characteristics of workers and their
working environments. In other words, are workers’ perceived fears of job loss based on job
market realities? The objective nature of job insecurity perceptions may be of interest for
theories of wage determination offered by labour economists and may also be relevant to
macroeconomic questions surrounding the source of the inward shift of the Phillips curve,
which has been observed on both sides of the Atlantic in recent years. This latter issue is
investigated in detail in a companion paper (Campbell et al, 2001).
What drives perceived job insecurity deserves investigation in its own right. There is a
growing literature at the interface of economics and psychology which investigates subjective
measures of well-being, happiness and stress; what determines these variables and how they
change over time (Oswald, 1997; Rabin, 1998). There is mounting evidence that perceptions
of worker insecurity have undergone an upward shift since earlier decades. In Britain, Green
et al (2000) show that, although the overall perception of insecurity was fairly stable between
1996 and 1997, it did rise relative to the overall level of unemployment which was
considerably lower in 1997 than in 1996.1 In the US, Aaronson and Sullivan (1998) identify a
similar upward movement in perceived insecurity during the 1990s as measured in the
General Social Survey (GSS), despite falling unemployment. Further evidence of rising
1 The distribution of insecurity, however, changed substantially with those in higher skilled groups and key industries like finance suffering rises in insecurity.
2
perceptions of insecurity in Britain and a number of other countries, after conditioning on
unemployment, is provided in section 2 below. There is additional evidence that the cost of
losing a job may have increased over the last two decades. For example, Gregg and
Wadsworth (1996) find that the relative wages of entry-level jobs have fallen. Nickell et al
(2000), using the merged NES/JUVOS data set, find that for men, the loss of hourly earnings
resulting from a spell of unemployment rose by around 30% from the early 1980s to the
1990s. Dickens et al (1999) found that older workers experienced the largest rise in the wage
penalty associated with job loss.
There is now a plausible picture emerging from research that job insecurity is deleterious for
the welfare, including the mental health, of employees and their families (see the review in
Green et al, 2000). Consistent evidence also exists that more secure workers record higher
levels of job satisfaction (Blanchflower and Oswald, 1999).
In this paper, we focus on a subjective measure of job insecurity which is available in two
recent waves of the British Household Panel Survey (BHPS). We attempt to ascertain whether
perceptions of possible job loss have a concrete basis linked to individuals’ characteristics and
their experiences in the labour market, rather than being simply a random answer to a question
that an individual did not really understand, or believed to be irrelevant. We find that, firstly,
current expectations of unemployment are partly explained by a plausible set of contemporary
characteristics and prior experiences of unemployment. Secondly, such expectations are only
in part persistent, suggesting that the circumstances of individuals change in ways that are
unobserved within typical data sets. Finally, we find that the expectations of unemployment
reported by workers are broadly consistent with their subsequent unemployment experience.
3
The remainder of this paper describes the subjective measure of job insecurity offered by the
BHPS and presents the results obtained from estimating ordered probit models designed to
analyse the determinants of this insecurity. These results highlight the importance of past
unemployment experiences and characteristics of the current job for the responses given by
individuals to the question on job insecurity. We continue by analysing the extent to which the
expectation of unemployment is persistent from one year to the next, and also explore whether
these expectations are consistent with actual unemployment experienced in the future. We
contrast our findings from the BHPS with measures of job insecurity given in other data sets
and consider the evidence relating to rising insecurity in a range of other countries. Section 3
offers conclusions.
2. Subjective Measures of Job Insecurity: Trends and Validity
2.1 Data Sources and Insecurity Measures
The main source of data used within this study is taken from the British Household Panel
Survey (BHPS) which is a continuing longitudinal survey of a nationally representative
sample of adults within around 5,500 households. The first wave of the BHPS was undertaken
in 1991, with subsequent interviews being held every year since. Our measure of job
insecurity refers to a specific question which was asked in waves 6 and 7 (1996 and 1997) of
the BHPS. In these two waves, individuals who are currently either in employment or self-
employment are asked:
“In the next twelve months how likely do you think it is that you will
become unemployed?”
Individuals are required to respond on a four-point scale, ranging from “very likely” to “very
unlikely”. The frequencies of responses on the four-point scale for each of the two waves are

4
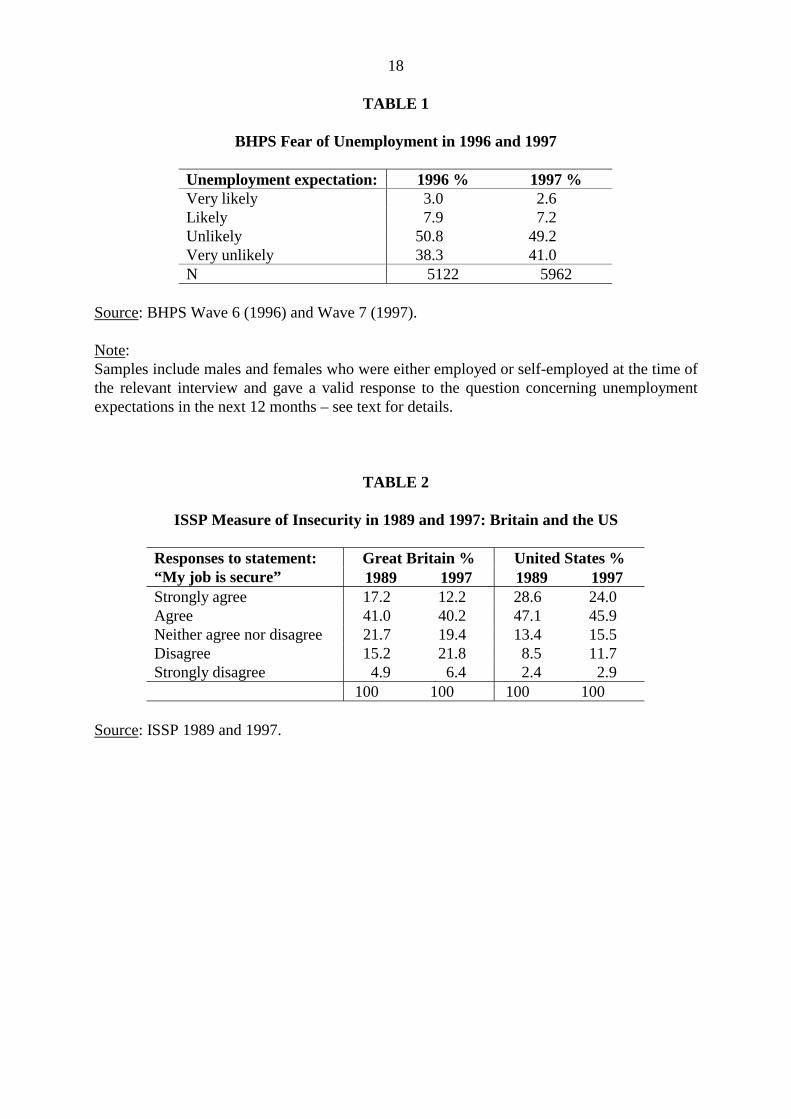
presented in Table 1. It may be seen that approximately 11% of workers in 1996 thought that
it was either “likely” or “very likely” that they would become unemployed in the following
year, while in 1997, this figure declined to around 10%.2 This slight fall is in line with a
similarly small decrease in the aggregate unemployment rate between these two years from
8% to 7%.
For the purposes of this study, we concentrate on the BHPS measure of insecurity, which is
derived from asking individuals to assess the chances of them becoming unemployed within
the subsequent twelve months. In alternative data sets, however, the issue of job security is
often raised in a more general manner. For example, in the International Social Survey
Programme (ISSP), respondents are asked whether they agree with the statement: “My job is
secure”, using a five-point scale. This type of question does not specifically link insecurity to
unemployment expectations, which may lead to respondents considering the wider
implications of insecurity, such as the stability of their employment conditions (Burchell et al,
1999), though clearly there may be some overlap. Table 2 presents the responses given by
British and American workers to the ISSP question relating to insecurity.3 Although five
different responses are possible, we consider a worker as being insecure if they disagreed or
strongly disagreed with the statement that their job was secure. Using this classification, it
may be seen that 20.1% of British workers viewed their job as being insecure in 1989, while
in 1997 this proportion had increased to 28.2%. The significance of this rising perception of
2 These figures are roughly comparable with responses to a similar but not identical question posed in The Skills Survey in Britain in 1997 (Green et al, 2000). In that survey, approximately 16% of employed persons felt that the chances of becoming unemployed within the following year were evens or greater than evens. 3 Data supplied by Zentralarchiv für Empirische Sozialforschung (Koln). We thank Rolf Uher for his assistance in providing the 1997 data.

5
insecurity is that it is set against a background of slightly declining aggregate unemployment
(7.3% in 1989, to 7.0% in 1997) and improving economic performance. This shift in
perceptions of insecurity is consistent with the findings reported in Green et al (2000), where
insecurity is measured in terms of unemployment expectations. In the US, the proportion of
insecure workers also increased slightly, from 10.9% in 1989 to 14.6% in 1997, with
unemployment also falling in this time (5.3% in 1989, to 4.9% in 1997). This finding is
similar to that of Aaronson and Sullivan (1998) who report that the proportion of US workers
who perceived that they were “not at all likely” to lose their jobs fell from 1991, despite
decreasing overall unemployment.4
2.2 An Upward Shift in Job Insecurity: Some Further International Evidence
The figures presented in Table 2, combined with data on aggregate unemployment, suggest
that in both Great Britain and the US, there has been an upward shift in the relationship
between unemployment and insecurity. It would generally be expected that there exists a
positive relationship between these variables, with workers feeling more insecure the greater
the level of aggregate unemployment in the country. For Britain and the US, however, this
relationship appears to have shifted upwards, since, with the rate of unemployment remaining
fairly constant between 1989 and 1997, insecurity has risen in both countries. In order to
examine the relationship between unemployment and insecurity more closely, in Figure 1a we
plot the proportion of individuals who were insecure in 1989 against the ILO measure of the
national unemployment rate for a range of countries. The regression line is also included,
which indicates that there exists a loose but significant positive relationship between
4 The ISSP data also indicate increasing insecurity between 1989 and 1997 in West Germany, The Netherlands and (unsurprisingly) Hungary, while the picture in Italy is mixed and in Norway workers were feeling more secure.
6
insecurity and aggregate unemployment. Figure 1b repeats the analysis for the larger available
sample of countries in 1997.
Casual inspection of Figures 1a and 1b suggest that the relationship between insecurity and
unemployment shifted upwards between 1989 and 1997. To investigate this more formally,
we pool the data for 1989 and 1997 and estimate the following regression that relates the
proportion of workers who are insecure (PI) to the unemployment rate (U) and a dummy
variable for 1997 (D97):
6.24 1.04 6.09 97
(2.50) (4.24) (2.98)PI U D= + +
(1)
2 0.466 (2,30) 14.97R F= =
Equation (1) implies that the positive relationship between insecurity and unemployment
shifted upwards by just over 6 percentage points between 1989 and 1997. Unfortunately, the
number of countries for which data are available for both years is limited to only seven.
Equation (1) was re-estimated with the sample being restricted to these seven countries, but
although the pattern was similar, the coefficients were statistically insignificant meaning that
it was not possible to detect an upward shift in the relationship.
2.3 The Persistence and Determinants of Unemployment Expectations
In the remainder of this paper, we focus on the job security variable contained within the
BHPS, which measures workers’ insecurity in terms of their unemployment expectations for
the subsequent year. We consider the extent to which an individual’s insecurity is persistent
from one year to the next, the factors determining the reported value of insecurity, and the
extent to which expectations of unemployment are realised in the following year.

7
The first of these issues is important because if a high level of job insecurity is confined to a
relatively small and static proportion of the population, the economic effects of fear of
unemployment would be limited to this minority group, and have little relevance to the
aggregate economy. If, however, a fear of unemployment is held by different workers from
one year to the next, then the wider impact on the aggregate economy could be greater.
Table 3 presents evidence on the degree to which the fear of unemployment is persistent
between 1996 and 1997 (the only two years for which the job insecurity variable is available
in the BHPS). Although four levels of fear may be reported (see Table 1), we define workers
as being associated with “high fear” if they believe unemployment is “likely” or “very likely”,
and “low fear” if unemployment is believed to be “unlikely” or “very unlikely” within the next
12 months. The figures presented in Table 3 suggest that there is a degree of persistence in
unemployment expectations. Of those reporting high fear in 1996, 32% also report having
high fear in the following 1997 interview. For those with low fear in 1996, 94% retain their
low fear status in 1997. However, the non-zero off-diagonal elements in Table 3 suggest that
there is a substantial transition from one state of fear to another between 1996 and 1997. For
example, 68% of those reporting high fear in the first year switch to having low fear a year
later.
The important conclusion to be drawn from Table 3 is that the fear of unemployment is not
simply confined to a small and constant proportion of workers. In any given year, a relatively
high proportion of workers are fearful of becoming unemployed and there exists a degree of
movement from one state of fear to another across years. With these dynamics, insecurity
appears to be an issue that is potentially relevant to a considerable proportion of workers in
the labour force. It remains possible, however, that insecurity is most common in particular
industries or occupations, and that the transition of workers from one state of fear to the other
8
observed in Table 3 simply reflects mobility across these industries or occupations. Under
these circumstances, any analyses of the effects of insecurity on labour market outcomes may
be more relevant to certain sectors of the economy, rather than to the economy as a whole. In
order to investigate this possibility, we looked at the distribution of “high fear” and “low fear”
workers across industry and occupational groups, as well as across various job characteristics
and personal characteristics. In doing this, we found no evidence that high fear workers were
disproportionately represented in any particular occupations or industries, relative to low fear
workers. In addition, the incidence of fear is found to be similar according to firm size,
gender, age, and educational attainment. There is some evidence, however, that workers
fearing unemployment are located within jobs involving seasonal or fixed term contracts. For
example, 23% of high fear workers do not hold permanent contracts, compared to only 5%
among the group of low fear workers.5
Our subjective measure of job insecurity may be regarded as being more reliable if it is found
to be related to certain personal experiences and objective characteristics in the expected way.
Hence, the second issue we address is the factors that may be important in determining the
level of unemployment fear reported by individuals in the 1996 and 1997 waves of the BHPS.
The analysis in section 2.2, linking insecurity to aggregate unemployment is a step in this
direction. Similarly, Green et al (2000) report the existence of a link between individual
unemployment fear and regional unemployment rates. In this section, we seek to explain
contemporaneous levels of the fear of unemployment in terms of the unemployment history of
individuals since 1991 and that of other members of their household in the previous year, as
5 These figures were produced by pooling the responses given in the 1996 and 1997 waves of the BHPS and examining the proportion of workers in the high and low fear categories associated with a range of job and personal characteristics.

9
well as a set of variables capturing the characteristics of the job currently held. Table 4
presents ordered probit estimates of the factors determining the fear of unemployment, where
the dependent variable ranges from the value 1 (very unlikely) to 4 (very likely).
The first three variables included within the equation relate to past unemployment experiences
and the rate of unemployment in the individual’s region at the date of interview. Using the
information contained within the BHPS waves prior to 1996 and 1997, it is possible to
calculate the total number of weeks each individual has spent in unemployment from 1991
until the time at which they report their unemployment expectations. This variable, denoted by
WEEKUP, is found to raise the level of fear reported by workers in both waves, although the
effect is only significant for men. We also tested whether more recent experience of
unemployment has a greater impact on perceptions of insecurity than a more distant
experience. The point estimate of the impact of a week’s unemployment in the last year was
greater than the estimated impact of a week’s unemployment in any prior year since 1991.
However, the difference in the magnitude of the impacts was not statistically significant.6
That previous experience of unemployment should raise the subjective perception of
unemployment risk is consistent with received psychological theories relating to how
individuals compute subjective probabilities (Tversky and Kahneman, 1982). Previous
personal experiences of an event are one of the factors that may be thought to heighten the
“availability” of that option to the individual. Similarly, other close experiences of an event,
such as via family or friends, are also found to raise perceptions of risk. In one example, a
6 For example, in predicting the level of fear given by men in 1996, each week of unemployment between 1991 and 1995 increased the index by 0.002 (t = 2.013), and each week of unemployment between 1995 and 1996 raised the index by 0.007 (t = 1.387).

10
person’s estimate of the chances of having a motor-cycle accident is found to be greater, other
things being equal, if a friend has recently been involved in an accident (Rutter et al, 1998).
To investigate the analogous response in the case of unemployment risk, we calculated the
number of weeks that other members of each individual’s household spent in unemployment
in the year prior to interview, denoted by HOUSEUP. This variable is likely only to be a rough
proxy of the extent to which a worker comes into contact with unemployment experiences
other than his or her own - the data do not furnish any estimates of the extent of friends’ or
other social contacts’ unemployment experiences. In Table 4, it may be seen that recent
household unemployment exerted a positive effect on fear for men (significant at the 10%
level) in the 1996 wave, but for men in 1997 and for women in both years, the effect is
insignificant. A higher rate of regional unemployment (REGUNEMP) at the time of interview
is generally found to raise fear, which we interpret as individuals taking into consideration
local labour market conditions when assessing their chances of unemployment.
Table 4 also reveals that several variables capturing the characteristics of the job currently
held affect the level of insecurity reported by individuals. Those on fixed contracts
(CONTRACT) and seasonal workers (SEASONAL) are associated with higher levels of fear.
For females, private sector workers (PRIVATE) and those working part-time (PART-TIME)
are more insecure than their public sector and full-time counterparts, but these differences are
insignificant for males. The coefficient attached to job tenure has the expected negative sign,
but is not significant in general.
Along with age and sets of dummy variables indicating establishment size (SIZE) and
educational attainment (QUAL), the ordered probits reported in Table 4 include two attitudinal
variables. Firstly, respondents were asked in 1996 to what extent they were concerned about
11
unemployment in society generally, using a four-point scale. The variable CONCERN is set
equal to one if the individual’s response was in either of the top two categories. It is
hypothesised that respondents who are concerned about unemployment in general may be
more aware of their own personal risk of unemployment. The causation could, however, run
in the opposite direction in that the fear of personal unemployment extends to a general
concern regarding unemployment. It may be seen that the variable CONCERN does exert a
positive effect on unemployment fear, although it is only significant for males in 1996. A
second attitudinal variable included is whether the individual is satisfied with their job
security. The variable JOBDISSAT is set equal to one if the respondent replied in the lower
half of a seven-point scale, and zero otherwise. This variable is strongly associated with
unemployment fear in all of the regressions. We do, however, recognise that dissatisfaction
with security could be both the cause and consequence of higher unemployment fears.
Excluding this variable from the estimations does not alter the pattern of results for the other
reported coefficients.
When analysing the factors determining fear in the 1997 wave of the BHPS, we also include a
set of dummy variables capturing the individual’s level of fear given in the previous wave, i.e.
in 1996. The estimated coefficients reveal that, for males and females, fear of unemployment
in 1996 is associated with significantly higher fear in 1997. For women, the effect is
monotonic - the greater the fear in 1996, the greater the fear in 1997. These findings reinforce
the evidence presented in Table 3, where the fear of unemployment is, to an extent, persistent.
2.4 Are Unemployment Expectations Warranted?
In section 2.3, it was shown that unemployment fear is linked to past (individual)
unemployment experiences and to the type of job characteristics usually associated with
12
fragile employment in the predicted manner. However, the results also indicate that there
remains considerable variation in unemployment fear that is unexplained. This unexplained
variation is presumably linked either to private information held by individuals relating to
their job, or to unmeasured variations in workers’ subjective responses to given job situations.
For the next stage of the analysis, we assess the reliability of the respondents’ unemployment
fears by examining whether such responses are consistent with actual unemployment
experiences occurring in the subsequent year.
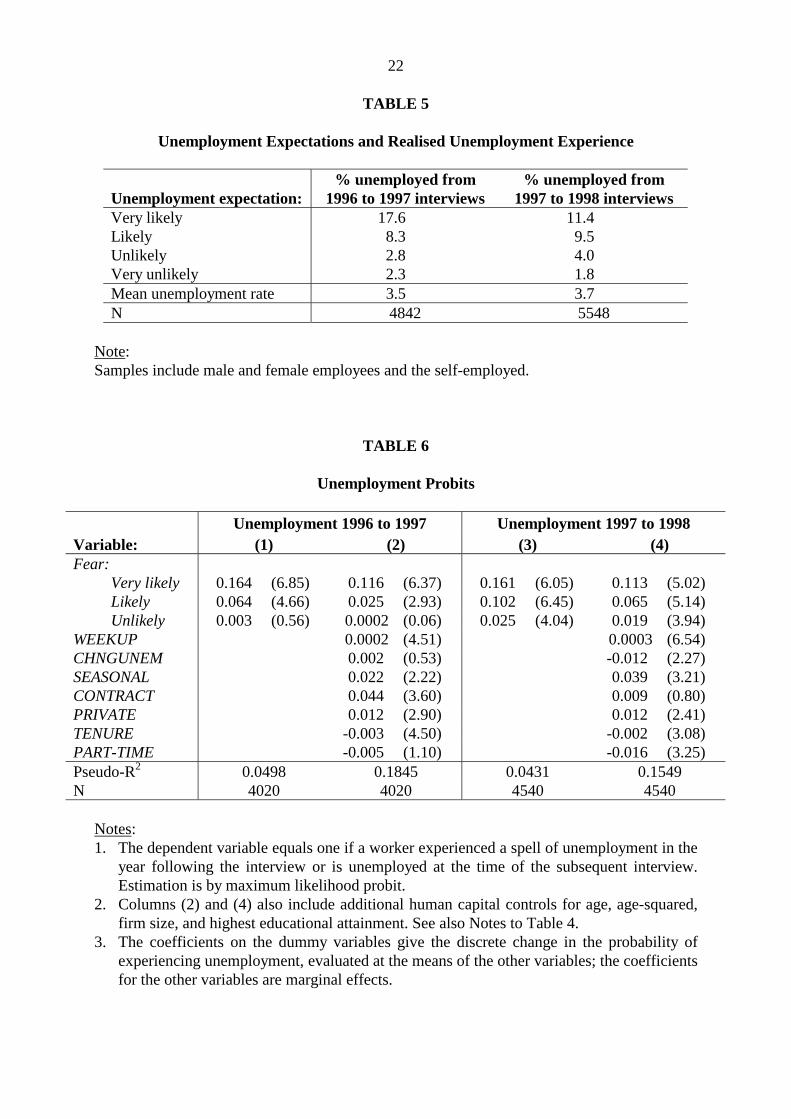
The first column in Table 5 reports the percentage of workers who experienced a spell of
unemployment between their 1996 and 1997 interviews, or who are currently unemployed at
the time of the 1997 interview, according to the level of fear expressed at the time of their
1996 interview. The second column presents the corresponding figures for actual
unemployment experiences between the 1997 and 1998 interviews.7 It can be seen that
subsequent unemployment experience is monotonically related to the level of reported fear in
both years. For example, approximately 18% of workers claiming to be “very likely” to
become unemployed at the time of their 1996 interview actually experienced unemployment
by the time of their interview in 1997. This compares to only 2% of workers in the “very
unlikely” category who actually went on to experience unemployment between their 1996 and
1997 interviews. From this, we conclude that respondents do possess useful information
7 This analysis is slightly inconsistent with the responses given by individuals to the insecurity question. Individuals are asked to express the chances of becoming unemployed within the next 12 months. The time between interviews, however, is not exactly 12 months for all individuals. As a check, we repeated the analysis in Table 5, calculating the proportions becoming unemployed within 12 months of the relevant interview date, but this made little difference to the results. We therefore interpret the insecurity question as the chances of becoming unemployed by the time of the next interview.
13
concerning their own unemployment prospects.8 Nevertheless, in normal language one might
take the response “very likely” to indicate at least an above-evens chance of the event
happening. Since in practice the chances are much less, we may infer that workers are prone to
overestimate the unemployment risks they face. It is of interest that for several other types of
risk there is known to be a tendency to underestimate risk. An important factor, however, is
said to be the “illusion of control”, which allows individuals to downplay their chances of
experiencing, say, a traffic accident (Rutter et al, 1998). A possible inference, therefore, is that
individuals feel that they have little control over their chances of becoming unemployed.
From Table 5, it would appear that workers are able to arrive at a reasonable prediction
concerning their chances of becoming unemployed. It could be argued, however, that a
researcher could be equally proficient at predicting subsequent unemployment experiences
given an appropriate set of objective indicators about the worker’s previous unemployment
history and current job characteristics. An issue that remains is therefore whether the
subjective measure of job insecurity reported by workers is a useful additional variable when
attempting to predict subsequent unemployment. If such measures of insecurity capture
private information held by workers relating to their job prospects, the inclusion of the
subjective insecurity variable may be justified.
In order to test whether self-reported insecurity contains useful information relating to the
probability of becoming unemployed in the subsequent year, we estimate various probit
8 As an additional validity check, expectations of unemployment are also quite closely correlated with expectations about future financial position. For example, in 1996, 32% of those who thought unemployment was “very likely” also expected their financial situation to deteriorate, compared with only 7% of those who thought unemployment was “very unlikely”.
14
models for unemployment. The results are presented in Table 6. The dependent variable
equals one if a worker experienced a spell of unemployment in the year following the
interview. Columns (2) and (4) also include additional human capital controls for age, age-
squared, firm size, and highest educational attainment. For the dummy variables, the
coefficients give the discrete change in the probability of experiencing unemployment as a
dummy variable switches from 0 to 1. Marginal effects are reported for the continuous
variables. The figures in parentheses provide the test for the coefficient being equal to zero.
The results shown in columns (1) and (3) of Table 6 indicate that, for each of the two years,
the level of fear is positively and significantly correlated with actual unemployment
experience over the subsequent year. The effect is also found to be monotonic, such that the
estimated coefficients increase with the level of fear. These findings are therefore consistent
with those shown in Table 5. Columns (2) and (4) report the results obtained from including
an additional set of control variables along with the level of fear expressed by the individual.
These variables relate to unemployment experiences since 1991, the change in regional
unemployment over the subsequent year, and characteristics of the job held at the time that the
worker reports their level of fear. The main finding is that the dummy variables capturing fear
remain highly significant determinants of subsequent unemployment, although the magnitude
of the effect is diminished. In testing the models represented by (2) and (4) against the
restricted versions that do not include the fear dummies, the F statistics reveal that including
the fear dummies does significantly raise the explanatory power of the model. This suggests
that the workers’ perceptions of insecurity do contain useful private information for predicting
future unemployment, which are not otherwise available to the researcher.

15
Table 6 also shows that the probability of becoming unemployed in the following year is
positively related to the total number of weeks spent in unemployment since 1991
(WEEKUP), seasonal contracts (SEASONAL), fixed term contracts (CONTRACT) and being in
the private sector (PRIVATE). Longer job tenure (TENURE) and working part-time (PART-
TIME) lowers the chances of becoming unemployed, although the latter effect is insignificant
for unemployment between 1996 and 1997. These variables were shown in Table 4 to be
important determinants of the level of unemployment fear and so may be seen as having both
a direct effect on unemployment experience and an indirect effect operating through
unemployment expectations. Finally, the change in the regional unemployment rate between
1997 and 1998 exerts a small impact on unemployment experiences occurring within that
period.9
3. Conclusions
In 1995, a senior British politician referred to job insecurity as a “state of mind”. In this paper,
we have investigated whether workers’ perceptions of unemployment risk are more than this
state of mind and, in reality, are associated with a set of objectively measured variables. In
addition, we attempt to determine whether such subjective measures of unemployment risk
convey additional information for predicting whether workers actually experience
unemployment in the future.
The first key finding of this paper is that the level of unemployment fear reported by workers
9 Controls for gender and for the level of unemployment were insignificantly different from zero and the other coefficients in Table 6 are robust to their exclusion.
16
is related to a set of plausible objective variables. These variables include past experiences of
unemployment and certain characteristics of the job currently held which are typically
associated with fragile employment. Despite this, there remains significant variation in the
fear of unemployment that is not explained by past unemployment and characteristics of the
present job. This unexplained variation could be entirely attributable to an unpredictable “state
of mind” effect, or it could reflect the fact that individuals hold private information relating to
their chances of becoming unemployed in the future that is not available to researchers. Some
evidence was found to support the latter interpretation since the probability of becoming
unemployed in the subsequent period was found to be significantly greater for those reporting
the highest levels of insecurity. This result held even after controlling for a wide range of
conventional variables predicting unemployment. It would seem, therefore, that workers do
possess valuable private information relating to the probability of becoming unemployed and
this information is partly captured by their reported perceptions of unemployment.
A further implication of our findings is that subjective labour market indicators could be of
substantial value for labour market analysis. It is disappointing that the series of BHPS
questions on unemployment expectations was curtailed after just two waves. Nevertheless we
believe that the same question could be asked in the Quarterly Labour Force Survey with little
cost and great benefit, either in every survey or, if not, annually. The information could
provide an additional forward-looking indicator both for macroeconomic policy purposes and
for labour market analysts (see Campbell et al, 2001). The results in this paper suggest that the
information would be additional to that recorded in objective measures, and that this
information would carry substantive implications about subsequent economic experience.
Clearly, subjective perceptions of future labour market outcomes are based in the reality of
individuals’ experiences.

17
REFERENCES
Aaronson, D. and D.G. Sullivan (1998). “The decline of job security in the 1990s: Displacement, anxiety, and their effect on wage growth.” Federal Reserve Bank of Chicago. Economic Perspectives (First Quarter): 17-43.
Blanchflower, D, and A.J. Oswald (1999). “Well being, insecurity and the decline of American job satisfaction”, mimeo, University of Warwick, July.
Burchell, B.J., D. Day, M. Hudson, D. Ladipo, R. Mankelow, J. Nolan, H. Reed, I. Wichert and Wilkinson, F. (1999). Job Insecurity and work intensification; flexibility and the changing boundaries of work. Joseph Rowntree Foundation report.
Campbell, D., A. Carruth, A. Dickerson and F. Green (2001). Job Insecurity and Wage Outcomes in the BHPS, Department of Economics, University of Kent, Studies in Economics No. 01/09, April.
Dickens, R., P. Gregg and M. Leonardi (1999). Wage and Employment Dynamics in the UK 1978-1995, London School of Economics, Centre for Economic Performance, Working Paper No. 1019.
Green, F., A. Felstead and B. Burchell (2000). “Job Insecurity and the Difficulty of Regaining Employment: An Empirical Study of Unemployment Expectations”, Oxford Bulletin of Economics and Statistics, 62, December, 857-885.
Gregg, P. and J. Wadsworth (1996). Mind the Gap, Please? The Changing Nature of Entry Jobs in Britain, London School of Economics, Centre for Economic Performance, Working Paper No. 796.
Nickell, S., T. Jones and G. Quintini (2000). A Picture of the Job Insecurity Facing British Men, London School of Economics, Centre for Economic Performance, Discussion Paper No. 479.
Oswald, A.J. (1997). “Happiness and Economic Performance”, Economic Journal, 107, Nov, 1815-1831.
Rabin, M. (1998). “Psychology and Economics”, Journal of Economic Literature, 36(1), 11-46.
Rutter, D.R., L. Quine and I.P. Albery (1998). “Perceptions of risk in motorcyclists: Unrealistic optimism, relative realism and predictions of behaviour”, British Journal of Psychology, 89, 681-696.
Tversky, A. and D. Kahneman (1982). “Chapter One” in A. Tversky and D. Kahneman (eds.) Judgement under Uncertainty: Heuristics and Biases, Cambridge: Cambridge University Press.
18
TABLE 1
BHPS Fear of Unemployment in 1996 and 1997
Unemployment expectation: 1996 % 1997 % Very likely 3.0 2.6 Likely 7.9 7.2 Unlikely 50.8 49.2 Very unlikely 38.3 41.0 N 5122 5962
Source: BHPS Wave 6 (1996) and Wave 7 (1997). Note: Samples include males and females who were either employed or self-employed at the time of the relevant interview and gave a valid response to the question concerning unemployment expectations in the next 12 months – see text for details.
TABLE 2
ISSP Measure of Insecurity in 1989 and 1997: Britain and the US
Great Britain % United States % Responses to statement: “My job is secure” 1989 1997 1989 1997 Strongly agree 17.2 12.2 28.6 24.0 Agree 41.0 40.2 47.1 45.9 Neither agree nor disagree 21.7 19.4 13.4 15.5 Disagree 15.2 21.8 8.5 11.7 Strongly disagree 4.9 6.4 2.4 2.9 100 100 100 100
Source: ISSP 1989 and 1997.

19
TABLE 3
The Persistence of Unemployment Expectations
1997 Wave High Fear % Low Fear %
High Fear 32.1 67.9 (420) (135) (285)
Low Fear 5.9 94.1
1996 Wave
(4015) (237) (3778) Source: BHPS Wave 6 (1996) and Wave 7 (1997). Notes: 1. High Fear indicates that the respondent answered “likely” or “very likely” to becoming
unemployed within the next 12 months, while Low Fear denotes respondent answered “unlikely” or “very unlikely”.
2. Row percentages are reported. The figures in parentheses give the total number of individuals within each category. Individuals are only included if they were employed at the time of both waves and if they offered valid responses to the question relating to job security in both waves.

20
TABLE 4
The Factors Determining the Fear of Unemployment
1996 Wave 1997 Wave Variable: Men Women Men Women WEEKUP 0.003 (2.644) 0.002 (0.920) 0.002 (1.984) 0.002 (1.168) HOUSEUP 0.005 (1.713) -0.002 (0.655) -0.003 (0.738) 0.001 (0.461) REGUNEMP 0.042 (2.249) 0.010 (0.518) 0.032 (1.574) 0.036 (1.786) SEASONAL 0.375 (2.052) 0.653 (4.907) 0.738 (2.989) 0.131 (0.819) CONTRACT 0.498 (3.464) 0.053 (0.360) 0.289 (1.633) 0.075 (0.676) PRIVATE 0.002 (0.019) 0.174 (1.932) 0.095 (0.853) 0.171 (1.736) TENURE -0.008 (1.670) -0.005 (0.804) -0.003 (0.521) -0.006 (1.005) PART-TIME 0.156 (1.094) 0.220 (3.777) 0.077 (0.469) 0.184 (2.849) AGE 0.008 (2.880) 0.011 (3.897) 0.007 (2.590) 0.014 (4.378) QUAL1 (highest) -0.171 (1.626) -0.174 (1.593) -0.118 (1.024) -0.023 (0.189) QUAL2 -0.030 (0.329) -0.038 (0.413) -0.044 (0.446) -0.060 (0.592) QUAL3 0.042 (0.409) 0.029 (0.277) 0.054 (0.478) -0.072 (0.605) QUAL4 0.028 (0.285) -0.084 (0.950) -0.093 (0.853) 0.023 (0.230) QUAL5 (lowest) 0.086 (0.734) -0.023 (0.217) 0.092 (0.726) -0.059 (0.489) SIZE2 0.027 (0.433) -0.062 (1.079) 0.003 (0.041) 0.020 (0.319) SIZE3 (largest) -0.031 (0.382) -0.243 (2.932) -0.046 (0.532) 0.040 (0.460) JOBDISSAT 0.951 (15.76) 0.928 (14.20) 0.992 (13.89) 0.835 (11.53) CONCERN 0.278 (3.762) 0.114 (1.171) 0.110 (1.381) 0.075 (0.676) 1996 Fear: Very likely - - 0.643 (3.424) 1.545 (8.821) Likely - - 1.054 (9.061) 0.960 (8.386) Unlikely - - 0.570 (9.062) 0.601 (9.687) cut 1 1.017 (3.390) 0.565 (1.305) 0.682 (2.193) 1.091 (2.398) cut 2 2.863 (9.387) 2.369 (5.433) 2.681 (8.457) 3.077 (6.704) cut 3 3.544 (11.47) 3.120 (7.107) 3.593 (11.09) 3.904 (8.414) Pseudo-R2 0.0960 0.0796 0.1467 0.1241 N 2024 2055 1862 1829
21
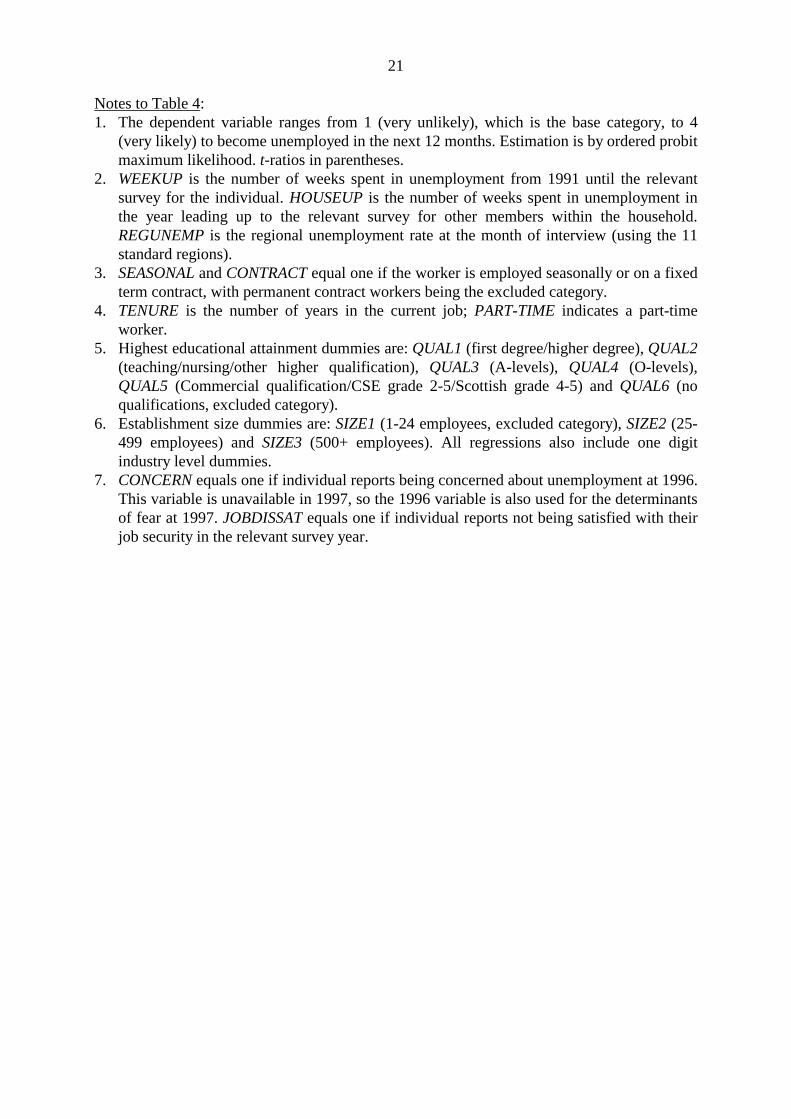
Notes to Table 4: 1. The dependent variable ranges from 1 (very unlikely), which is the base category, to 4
(very likely) to become unemployed in the next 12 months. Estimation is by ordered probit maximum likelihood. t-ratios in parentheses.
2. WEEKUP is the number of weeks spent in unemployment from 1991 until the relevant survey for the individual. HOUSEUP is the number of weeks spent in unemployment in the year leading up to the relevant survey for other members within the household. REGUNEMP is the regional unemployment rate at the month of interview (using the 11 standard regions).
3. SEASONAL and CONTRACT equal one if the worker is employed seasonally or on a fixed term contract, with permanent contract workers being the excluded category.
4. TENURE is the number of years in the current job; PART-TIME indicates a part-time worker.
5. Highest educational attainment dummies are: QUAL1 (first degree/higher degree), QUAL2 (teaching/nursing/other higher qualification), QUAL3 (A-levels), QUAL4 (O-levels), QUAL5 (Commercial qualification/CSE grade 2-5/Scottish grade 4-5) and QUAL6 (no qualifications, excluded category).
6. Establishment size dummies are: SIZE1 (1-24 employees, excluded category), SIZE2 (25-499 employees) and SIZE3 (500+ employees). All regressions also include one digit industry level dummies.
7. CONCERN equals one if individual reports being concerned about unemployment at 1996. This variable is unavailable in 1997, so the 1996 variable is also used for the determinants of fear at 1997. JOBDISSAT equals one if individual reports not being satisfied with their job security in the relevant survey year.
22
TABLE 5
Unemployment Expectations and Realised Unemployment Experience
Unemployment expectation: % unemployed from
1996 to 1997 interviews % unemployed from
1997 to 1998 interviews Very likely 17.6 11.4 Likely 8.3 9.5 Unlikely 2.8 4.0 Very unlikely 2.3 1.8 Mean unemployment rate 3.5 3.7 N 4842 5548
Note: Samples include male and female employees and the self-employed.
TABLE 6
Unemployment Probits
Unemployment 1996 to 1997 Unemployment 1997 to 1998 Variable: (1) (2) (3) (4) Fear: Very likely 0.164 (6.85) 0.116 (6.37) 0.161 (6.05) 0.113 (5.02) Likely 0.064 (4.66) 0.025 (2.93) 0.102 (6.45) 0.065 (5.14) Unlikely 0.003 (0.56) 0.0002 (0.06) 0.025 (4.04) 0.019 (3.94) WEEKUP 0.0002 (4.51) 0.0003 (6.54) CHNGUNEM 0.002 (0.53) -0.012 (2.27) SEASONAL 0.022 (2.22) 0.039 (3.21) CONTRACT 0.044 (3.60) 0.009 (0.80) PRIVATE 0.012 (2.90) 0.012 (2.41) TENURE -0.003 (4.50) -0.002 (3.08) PART-TIME -0.005 (1.10) -0.016 (3.25) Pseudo-R2 0.0498 0.1845 0.0431 0.1549 N 4020 4020 4540 4540
Notes: 1. The dependent variable equals one if a worker experienced a spell of unemployment in the
year following the interview or is unemployed at the time of the subsequent interview. Estimation is by maximum likelihood probit.
2. Columns (2) and (4) also include additional human capital controls for age, age-squared, firm size, and highest educational attainment. See also Notes to Table 4.
3. The coefficients on the dummy variables give the discrete change in the probability of experiencing unemployment, evaluated at the means of the other variables; the coefficients for the other variables are marginal effects.

23
FIGURE 1
Insecurity and Unemployment: International Evidence from the ISSP
Figure 1a Insecurity and Unemployment in 1989
Inse
curit
y (%
)
Aggregate Unemployment Rate (%)2 4 6 8 10 12 14 16 18 20
5
10
15
20
25
30
35
GermanyAustria
NetherlaUSA
ItalyIsraelNorwayEire
Great Br
Figure 1b Insecurity and Unemployment in 1997
Inse
curity
(%
)
Aggregate Unemployment Rate (%)2 4 6 8 10 12 14 16 18 20
5
10
15
20
25
30
35
DenmarkNorway
NetherlaUSA Philippi Germany IsraelSloveniaSwitzerlJapan Italy
Cyprus SwedenCzech Re
PolandNew Zeal HungaryCanada
PortugalGreat Br Spain
Russia
France
Bulgaria
Related Documents