1 An Analysis of Sports Facility Costs and Development from 1989-2009 The intention of the following report is to provide some insight into the changes in facility construction costs among the five major professional sports leagues based in the United States. The report begins with an overall comparison among the leagues, and later contains information related to each individual league. There are currently 137 teams participating in Major League Baseball (MLB), the National Basketball Association (NBA), the National Football League (NFL), the National Hockey League (NHL), or Major League Soccer (MLS). With venues such as Madison Square Garden, Giants Stadium, and the Staples Center being home to multiple teams, 118 different venues constitute the home addresses for these teams. All information was obtained from recent issues of Sports Facility Reports, Ballparks.com, or from team websites. For the MLB, NBA, NFL, and NHL all information begins with the 1989 season, however, MLS information does not start until 1996, the league’s inaugural season. Comparing the Leagues (1989 through 2009)

Welcome message from author
This document is posted to help you gain knowledge. Please leave a comment to let me know what you think about it! Share it to your friends and learn new things together.
Transcript
1
An Analysis of Sports Facility Costs and Development from 1989-2009
The intention of the following report is to provide some insight into the changes in facility construction costs among the five major professional sports leagues based in the United States. The report begins with an overall comparison among the leagues, and later contains information related to each individual league. There are currently 137 teams participating in Major League Baseball (MLB), the National Basketball Association (NBA), the National Football League (NFL), the National Hockey League (NHL), or Major League Soccer (MLS). With venues such as Madison Square Garden, Giants Stadium, and the Staples Center being home to multiple teams, 118 different venues constitute the home addresses for these teams. All information was obtained from recent issues of Sports Facility Reports, Ballparks.com, or from team websites. For the MLB, NBA, NFL, and NHL all information begins with the 1989 season, however, MLS information does not start until 1996, the league’s inaugural season.
Comparing the Leagues (1989 through 2009)

2
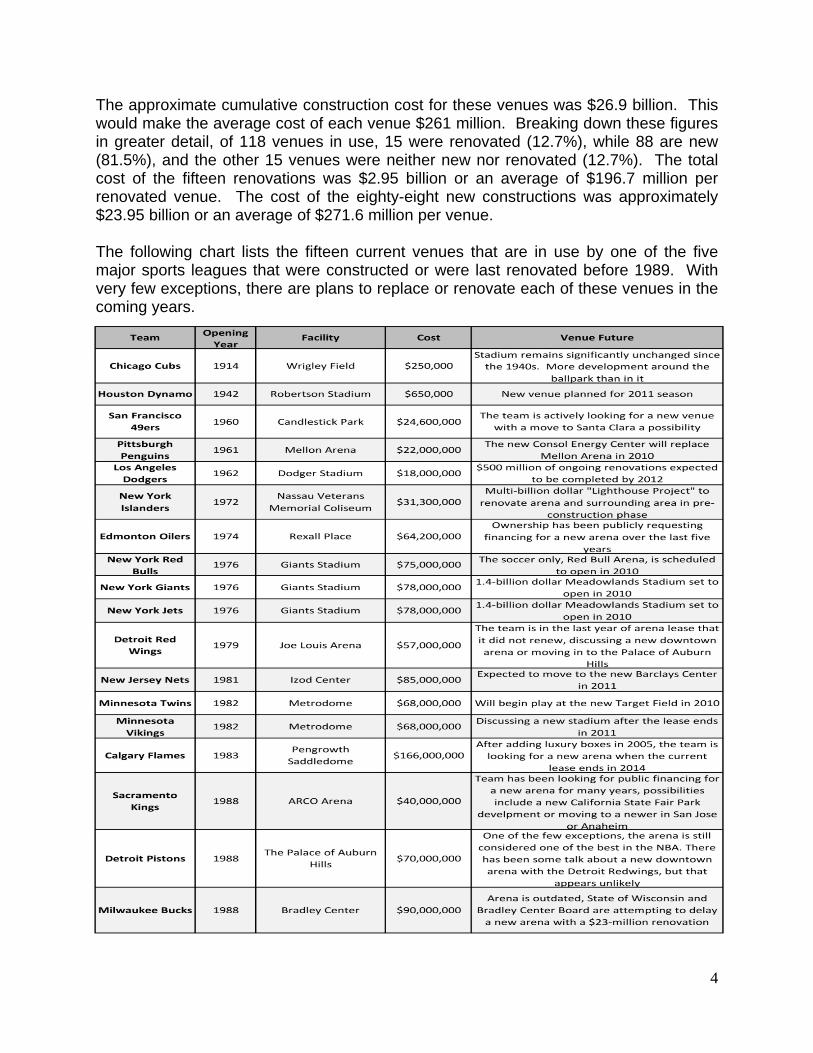
The graph above looks at the total cost of constructing a venue organized by league. Of the 118 venues currently in use by one of the 5 major sports leagues, 103, or approximately 87%, have been built or have gone through a major renovation since 1989. At least seven other venues are scheduled to be replaced in the next five years. It is clear that the NFL and MLB have spent a much larger amount of money on venue construction than the other three leagues. Baseball has experienced the most steady growth pattern. In most seasons, at least one MLB club has constructed a new venue. In the NBA and NHL, venue constructions seem to be on a similar pace. This would make sense as the two leagues routinely share the same venue in a city. At first glance, it may appear that MLS has spent significantly less capital on venue construction; however, the league has half the amount of teams of any other league and it is still in its infancy. The following chart shows the cumulative dollar figures spent by each league on venue construction from 1989-2009. If a venue hosts more than one team it was included separately for each individual team. For example, the Staples Center counted twice towards the NBA total (Clippers and Lakers) and once for the NHL (Kings).

3
The following chart shows a listing of the 103 new or renovated venues over the past twenty years. The chart lists each venue once, regardless of the amount of tenants that call the venue home. Along with the listing of the venue name is the opening year and the costs to construct or renovate the facility.
4
The approximate cumulative construction cost for these venues was $26.9 billion. This would make the average cost of each venue $261 million. Breaking down these figures in greater detail, of 118 venues in use, 15 were renovated (12.7%), while 88 are new (81.5%), and the other 15 venues were neither new nor renovated (12.7%). The total cost of the fifteen renovations was $2.95 billion or an average of $196.7 million per renovated venue. The cost of the eighty-eight new constructions was approximately $23.95 billion or an average of $271.6 million per venue. The following chart lists the fifteen current venues that are in use by one of the five major sports leagues that were constructed or were last renovated before 1989. With very few exceptions, there are plans to replace or renovate each of these venues in the coming years.
5
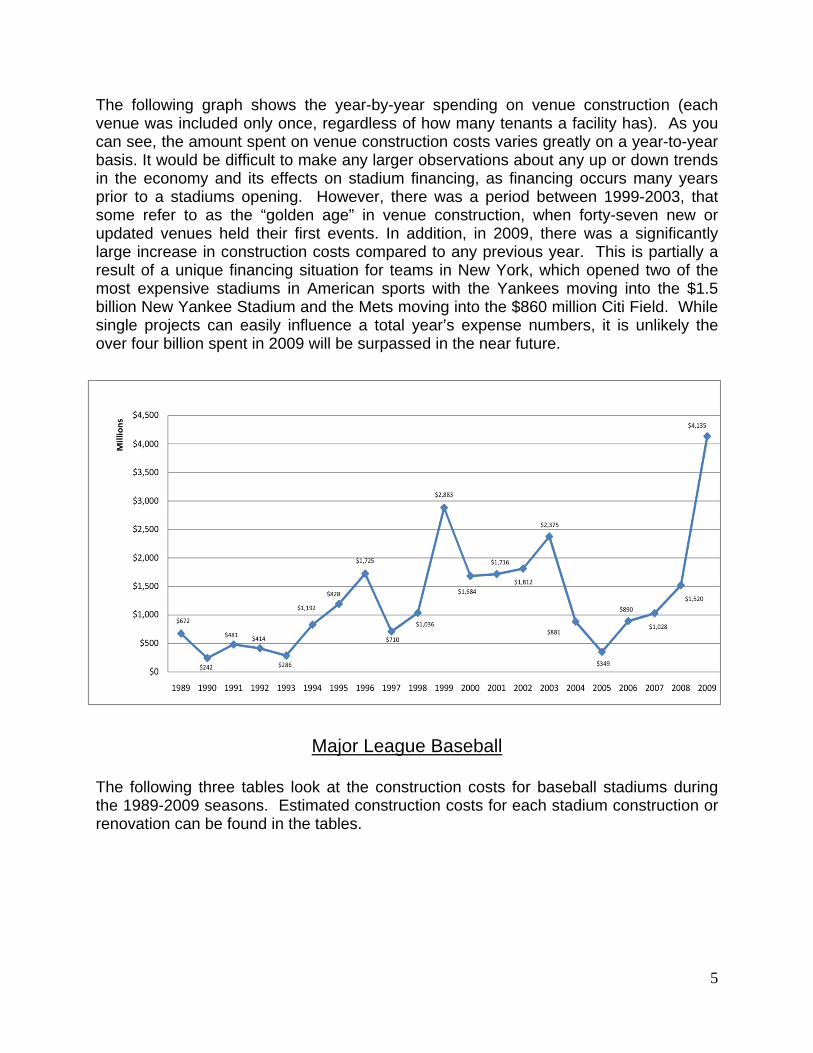
The following graph shows the year-by-year spending on venue construction (each venue was included only once, regardless of how many tenants a facility has). As you can see, the amount spent on venue construction costs varies greatly on a year-to-year basis. It would be difficult to make any larger observations about any up or down trends in the economy and its effects on stadium financing, as financing occurs many years prior to a stadiums opening. However, there was a period between 1999-2003, that some refer to as the “golden age” in venue construction, when forty-seven new or updated venues held their first events. In addition, in 2009, there was a significantly large increase in construction costs compared to any previous year. This is partially a result of a unique financing situation for teams in New York, which opened two of the most expensive stadiums in American sports with the Yankees moving into the $1.5 billion New Yankee Stadium and the Mets moving into the $860 million Citi Field. While single projects can easily influence a total year’s expense numbers, it is unlikely the over four billion spent in 2009 will be surpassed in the near future.
Major League Baseball The following three tables look at the construction costs for baseball stadiums during the 1989-2009 seasons. Estimated construction costs for each stadium construction or renovation can be found in the tables.

6
7
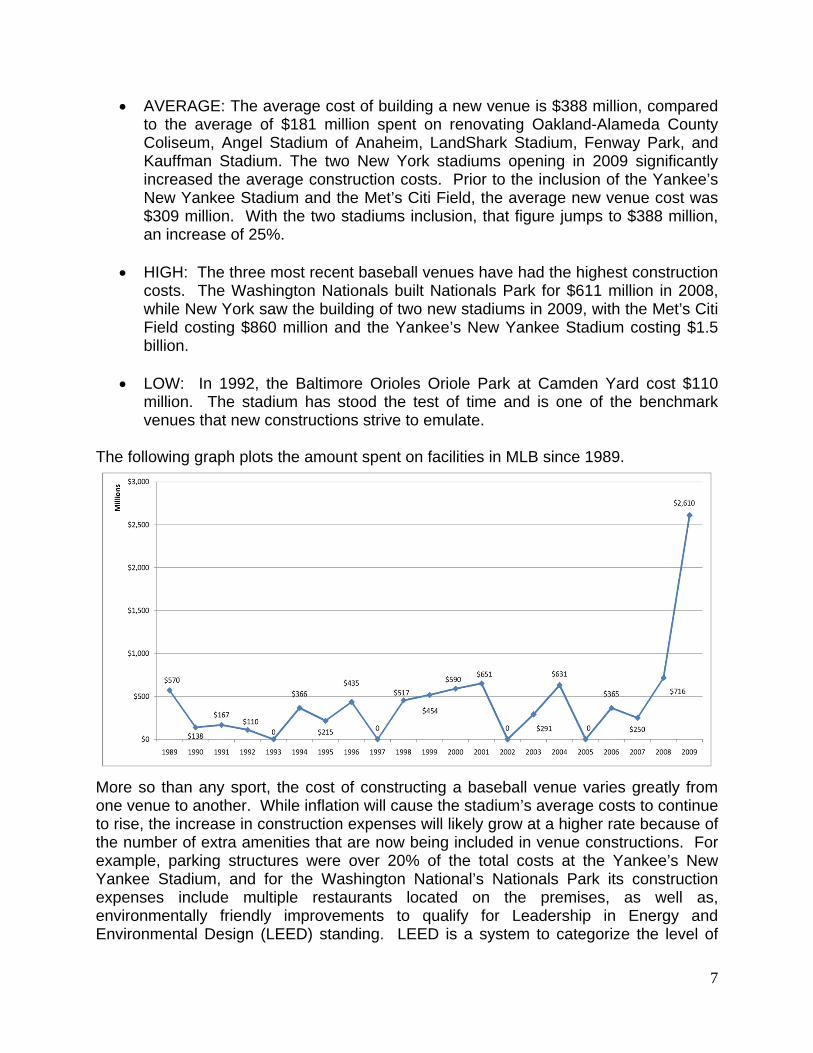
• AVERAGE: The average cost of building a new venue is $388 million, compared to the average of $181 million spent on renovating Oakland-Alameda County Coliseum, Angel Stadium of Anaheim, LandShark Stadium, Fenway Park, and Kauffman Stadium. The two New York stadiums opening in 2009 significantly increased the average construction costs. Prior to the inclusion of the Yankee’s New Yankee Stadium and the Met’s Citi Field, the average new venue cost was $309 million. With the two stadiums inclusion, that figure jumps to $388 million, an increase of 25%.
• HIGH: The three most recent baseball venues have had the highest construction costs. The Washington Nationals built Nationals Park for $611 million in 2008, while New York saw the building of two new stadiums in 2009, with the Met’s Citi Field costing $860 million and the Yankee’s New Yankee Stadium costing $1.5 billion.
• LOW: In 1992, the Baltimore Orioles Oriole Park at Camden Yard cost $110
million. The stadium has stood the test of time and is one of the benchmark venues that new constructions strive to emulate.
The following graph plots the amount spent on facilities in MLB since 1989.
More so than any sport, the cost of constructing a baseball venue varies greatly from one venue to another. While inflation will cause the stadium’s average costs to continue to rise, the increase in construction expenses will likely grow at a higher rate because of the number of extra amenities that are now being included in venue constructions. For example, parking structures were over 20% of the total costs at the Yankee’s New Yankee Stadium, and for the Washington National’s Nationals Park its construction expenses include multiple restaurants located on the premises, as well as, environmentally friendly improvements to qualify for Leadership in Energy and Environmental Design (LEED) standing. LEED is a system to categorize the level of
8
environmentally sustainable construction in sustainable buildings that many new venues are incorporating into their construction plans.
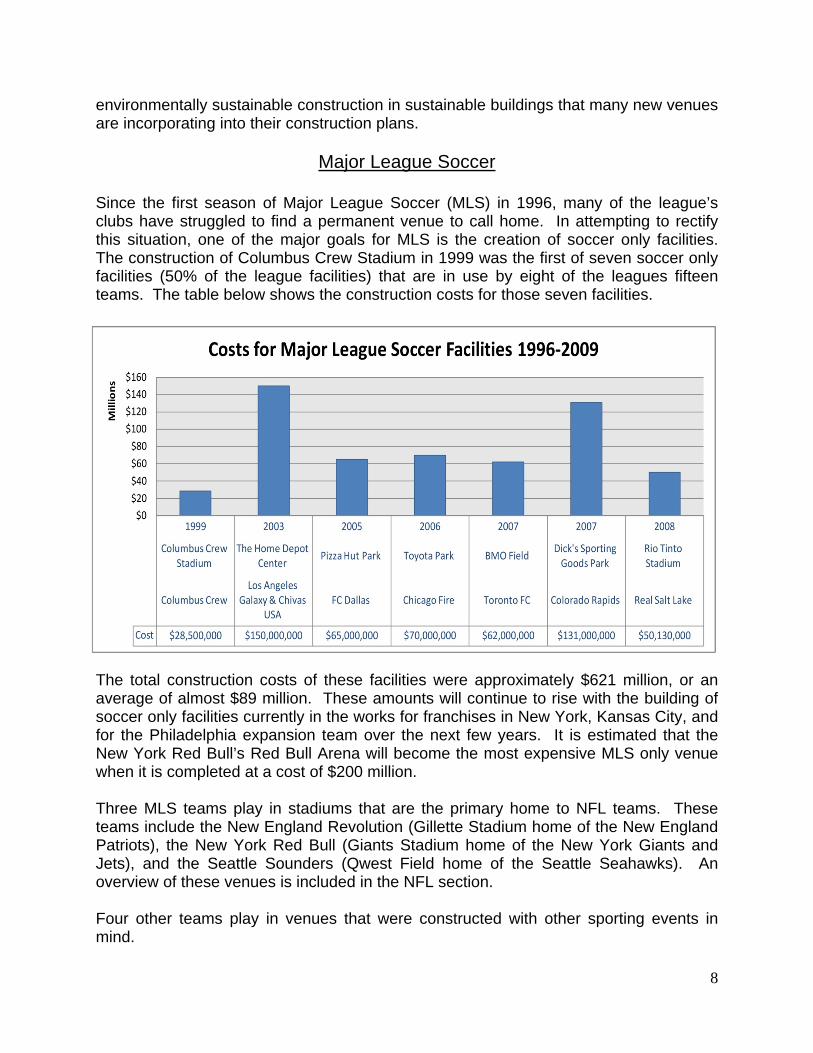
Major League Soccer Since the first season of Major League Soccer (MLS) in 1996, many of the league’s clubs have struggled to find a permanent venue to call home. In attempting to rectify this situation, one of the major goals for MLS is the creation of soccer only facilities. The construction of Columbus Crew Stadium in 1999 was the first of seven soccer only facilities (50% of the league facilities) that are in use by eight of the leagues fifteen teams. The table below shows the construction costs for those seven facilities.
The total construction costs of these facilities were approximately $621 million, or an average of almost $89 million. These amounts will continue to rise with the building of soccer only facilities currently in the works for franchises in New York, Kansas City, and for the Philadelphia expansion team over the next few years. It is estimated that the New York Red Bull’s Red Bull Arena will become the most expensive MLS only venue when it is completed at a cost of $200 million. Three MLS teams play in stadiums that are the primary home to NFL teams. These teams include the New England Revolution (Gillette Stadium home of the New England Patriots), the New York Red Bull (Giants Stadium home of the New York Giants and Jets), and the Seattle Sounders (Qwest Field home of the Seattle Seahawks). An overview of these venues is included in the NFL section. Four other teams play in venues that were constructed with other sporting events in mind.
9
• The San Jose Earthquake has been attempting to build a soccer only facility
since the team’s rebirth in 2008. In the meantime, the club is splitting its matches between Buck Shaw Stadium and the Oakland-Alameda County Coliseum. The club spent about $4 million in upgrading Buck Shaw Stadium to MLS standards in 2008.
• The Kansas City Wizards are playing in CommunityAmerica Ballpark, the home of the Independent Northern League Baseball Kansas City T-Bones ballclub, while construction of its new soccer only facility continues. The Wizards agreed to pay for the addition of bleachers in left field as part of the agreement to use the ballpark.
• The Houston Dynamo plays at Robertson Stadium, which is home to the University of Houston. The stadium went through a $48 million renovation in 1998 to get the facility up to Division-1 standards and the Dynamo have contributed a few million dollars to upgrade the electrical equipment over the last few years. The Dynamo is another MLS club exploring its option to build a soccer only facility.
• D.C. United is like many of the other clubs that do not have a soccer only venue. D.C. United is looking to build its own facility so that the club can move from RFK Stadium. RFK stadium underwent a $19 million renovation in 2005 to prepare the stadium for the Washington Nationals, but is still not up to MLS venue standards.
As MLS continues to grow, the teams listed above who do not currently play in a soccer specific venue will look to construct new facilities. With the rising expectations fans have for their stadium experience, a larger group of MLS investors, and expansion into more cities, the cost of creating these facilities may truly rival the four established professional leagues.
National Basketball Association The following two tables look at the construction costs of NBA arenas from 1989-2009. Estimated construction costs for each stadium construction or renovation can be found in the tables.

10
• AVERAGE: The average construction cost of the twenty-three new facilities is $205 million. The renovation costs of Oracle Arena and Madison Square Garden average $171 million. Overall, the twenty-five arenas spent an average of $203 million.

11
• HIGH: The $420 million construction cost for American Airlines Center in Dallas has clearly been the most expensive basketball arena built in the last two decades. While the City of Dallas capped arena spending at $125 million, Mark Cuban (Dallas Mavericks owner) and Tom Hicks (Dallas Stars owner) contributed the rest of the funding. The venue had an unusually high budget to incorporate technology, art work, and other fan conveniences into the building, helping to make it one of the premier venues in American sports.
• LOW: Ford Center in Oklahoma City was built for $89 million in 2002. The arena was built with a smaller budget, as at the time, the city did not have an NBA franchise. Over the course of the 2009-2011 seasons, the venue will undergo over $60 million in renovations to improve the fan experience and put the venue on a similar level of other professional basketball arenas.
The following graph plots the amount spent on facilities in the NBA since 1989.
Since 2005, there has been a lack of new construction in the NBA, as almost every team that wanted an updated arena got their wish at some point over the previous twenty years. Many of the teams that did not receive new arenas, as well as those who did so in the early years of this report, are currently exploring options to build new arenas or are already undergoing the process. These teams include the Orlando Magic, Detroit Pistons, Milwaukee Bucks, Sacramento Kings, and the New Jersey Nets. At the highpoint, the 1999-2000 basketball season saw a total of seven arenas constructed for eight different teams (the Los Angeles Lakers and Clippers share the Staples Center). Similar to baseball stadiums, NBA arenas now include many auxiliary options for eating and shopping in an attempt to increase team revenues.
12
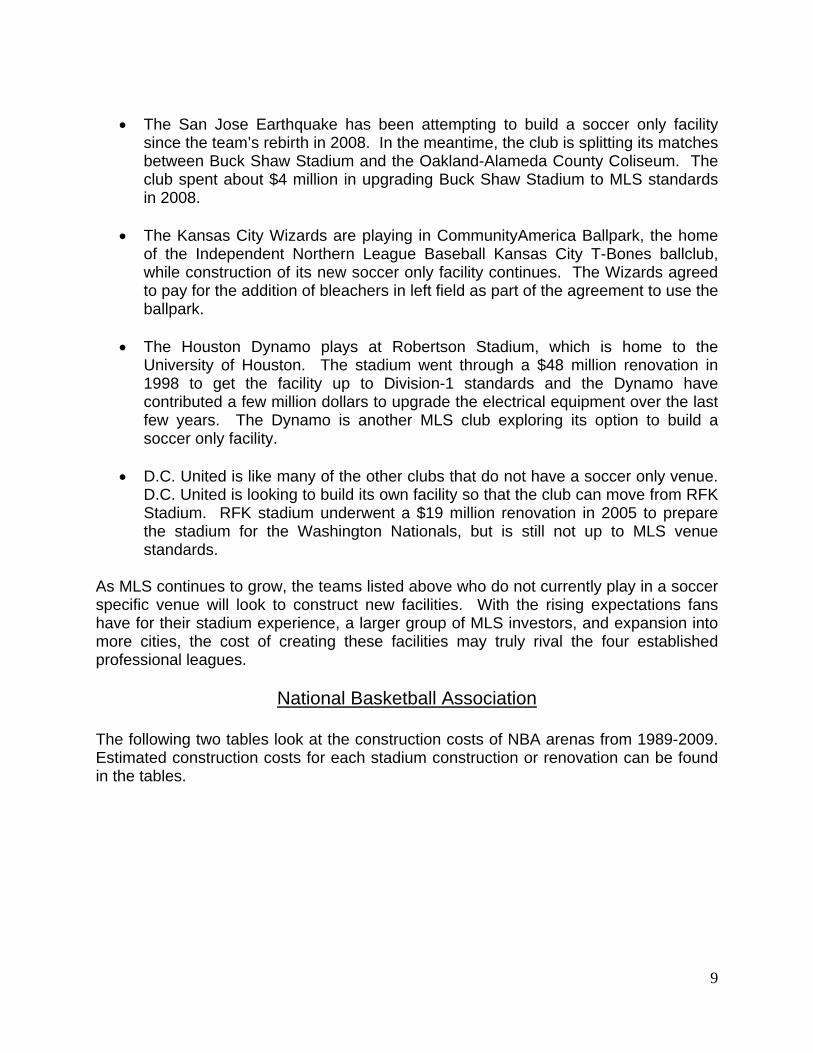
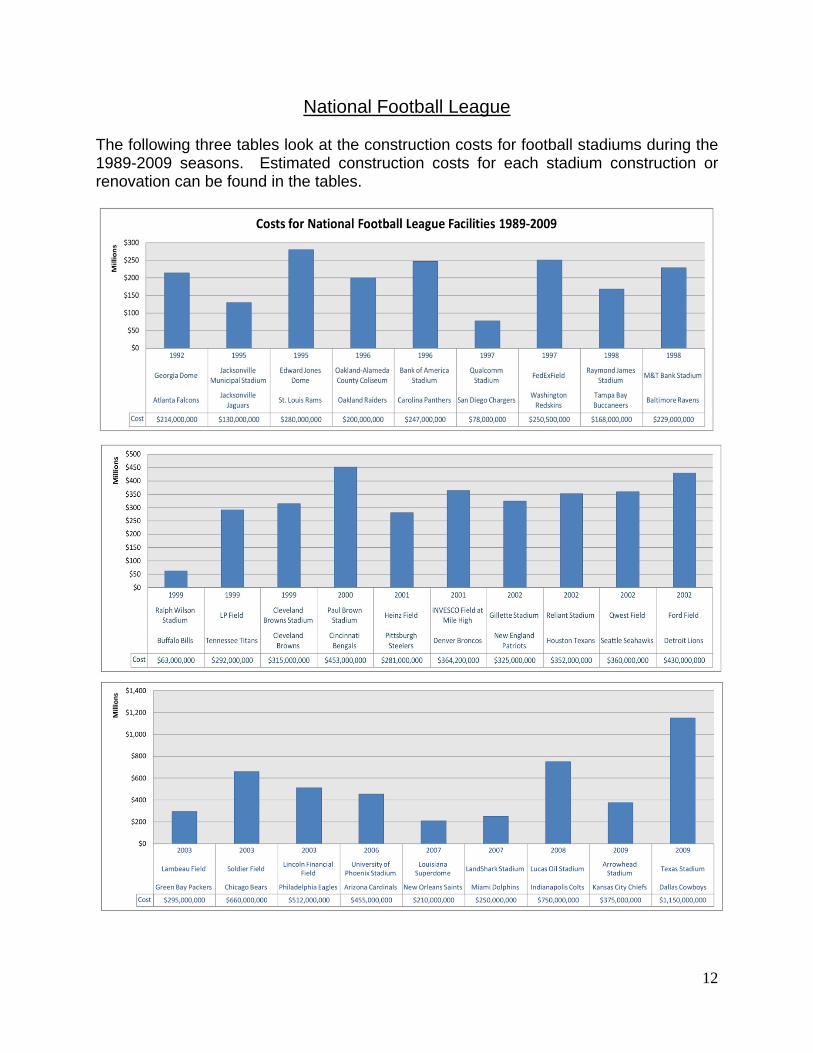
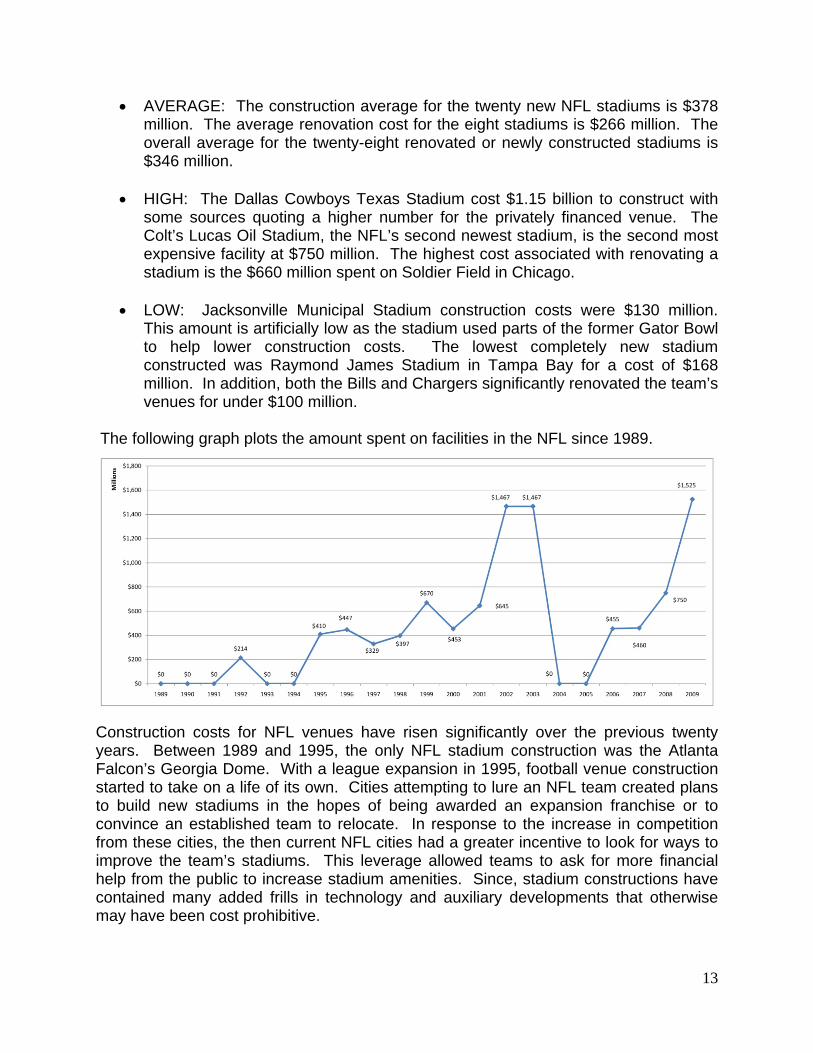
National Football League The following three tables look at the construction costs for football stadiums during the 1989-2009 seasons. Estimated construction costs for each stadium construction or renovation can be found in the tables.
13
• AVERAGE: The construction average for the twenty new NFL stadiums is $378 million. The average renovation cost for the eight stadiums is $266 million. The overall average for the twenty-eight renovated or newly constructed stadiums is $346 million.
• HIGH: The Dallas Cowboys Texas Stadium cost $1.15 billion to construct with some sources quoting a higher number for the privately financed venue. The Colt’s Lucas Oil Stadium, the NFL’s second newest stadium, is the second most expensive facility at $750 million. The highest cost associated with renovating a stadium is the $660 million spent on Soldier Field in Chicago.
• LOW: Jacksonville Municipal Stadium construction costs were $130 million.
This amount is artificially low as the stadium used parts of the former Gator Bowl to help lower construction costs. The lowest completely new stadium constructed was Raymond James Stadium in Tampa Bay for a cost of $168 million. In addition, both the Bills and Chargers significantly renovated the team’s venues for under $100 million.
The following graph plots the amount spent on facilities in the NFL since 1989.
Construction costs for NFL venues have risen significantly over the previous twenty years. Between 1989 and 1995, the only NFL stadium construction was the Atlanta Falcon’s Georgia Dome. With a league expansion in 1995, football venue construction started to take on a life of its own. Cities attempting to lure an NFL team created plans to build new stadiums in the hopes of being awarded an expansion franchise or to convince an established team to relocate. In response to the increase in competition from these cities, the then current NFL cities had a greater incentive to look for ways to improve the team’s stadiums. This leverage allowed teams to ask for more financial help from the public to increase stadium amenities. Since, stadium constructions have contained many added frills in technology and auxiliary developments that otherwise may have been cost prohibitive.
14
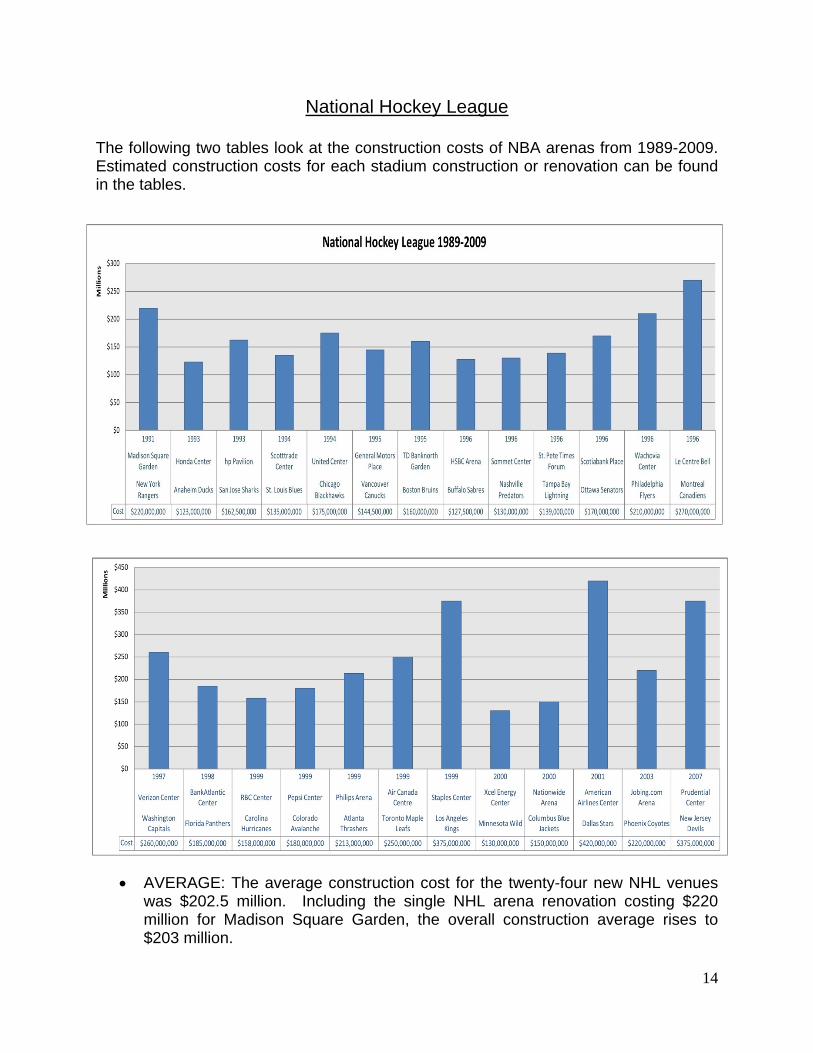
National Hockey League The following two tables look at the construction costs of NBA arenas from 1989-2009. Estimated construction costs for each stadium construction or renovation can be found in the tables.
• AVERAGE: The average construction cost for the twenty-four new NHL venues was $202.5 million. Including the single NHL arena renovation costing $220 million for Madison Square Garden, the overall construction average rises to $203 million.
15
• HIGH: As is the case with the NBA, the $420 million construction cost for
American Airlines Center in Dallas is the most expensive hockey venue built in the last two decades. However, the arena shares time with the NBA Dallas Mavericks, which helped the Stars pick up some of the construction costs. The arena with the highest price tag, while not also hosting a NBA team is the Devil’s Prudential Center in New Jersey costing $375 million to construct in 2007.
• LOW: The Honda Center in Anaheim, California, cost $123 million to construct in
1993. It has been the home arena to the Anaheim Ducks for the teams’ entire existence. “The Pond” as it often referred to hosts occasional NBA games and the arena owners hope to attract a permanent NBA tenant.
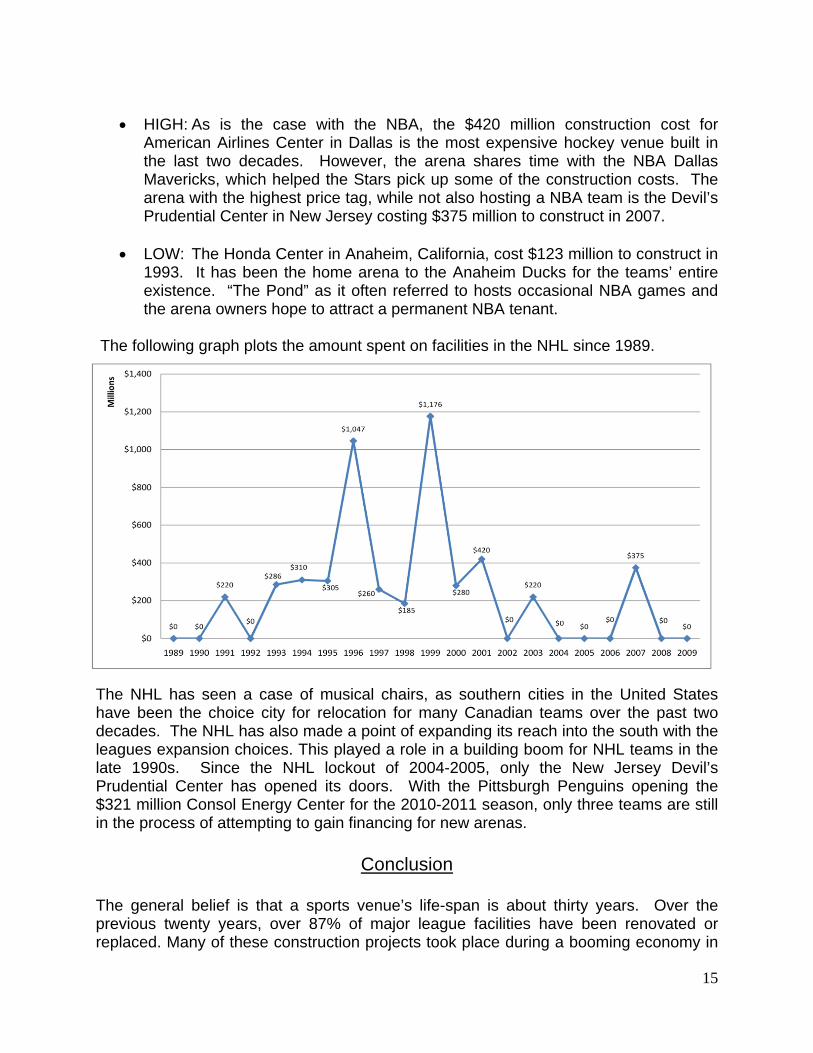
The following graph plots the amount spent on facilities in the NHL since 1989.
The NHL has seen a case of musical chairs, as southern cities in the United States have been the choice city for relocation for many Canadian teams over the past two decades. The NHL has also made a point of expanding its reach into the south with the leagues expansion choices. This played a role in a building boom for NHL teams in the late 1990s. Since the NHL lockout of 2004-2005, only the New Jersey Devil’s Prudential Center has opened its doors. With the Pittsburgh Penguins opening the $321 million Consol Energy Center for the 2010-2011 season, only three teams are still in the process of attempting to gain financing for new arenas.
Conclusion
The general belief is that a sports venue’s life-span is about thirty years. Over the previous twenty years, over 87% of major league facilities have been renovated or replaced. Many of these construction projects took place during a booming economy in
16
the mid-to-late 1990s and early 2000s. As the economy started to decline in the mid-2000s, sports venue construction projects have also significantly declined. This has affected a handful of teams who had yet to see its venue replaced as financing options have become more limited. As the economy makes a recovery, and the venues constructed over the previous twenty years continue to age, it will be interesting to see how communities and sports leagues will work together in once again replacing the venues. © Copyright 2009 - National Sports Law Institute of Marquette University Law School. Report drafted by
Nick Rieder (L'10), NSLI Research Assistant.
Related Documents


