An Analysis of Relationships among Climate Forcing and Time-Integrated NDVI of Grasslands over the U.S. Northern and Central Great Plains Limin Yang,* Bruce K. Wylie, Larry L. Tieszen, ‡ and Bradley C. Reed Time-integrated normalized difference vegetation index marily C 4 grassland) were predominantly influenced by spring and summer precipitation. Grassland land cover (TI NDVI) derived from the multitemporal satellite imag- ery (1989–1993) was used as a surrogate for primary classes associated with sandy soils also demonstrated a strong relationship between TI NDVI and growing season production to investigate climate impacts on grassland performance for central and northern Great Plains grass- rainfall. Significant impact of interannual climate variabil- ity on the TI NDVI–climate relationship was also ob- lands. Results suggest that spatial and temporal variability in growing season precipitation, potential evapotranspira- served. The study suggests an integrated approach involv- ing numerical models, satellite remote sensing, and field tion, and growing degree days are the most important con- trols on grassland performance and productivity. When TI observations to monitor grassland ecosystem dynamics on a regional scale. Elsevier Science Inc., 1998 NDVI and climate data of all grassland land cover classes were examined as a whole, a statistical model showed sig- nificant positive correlation between the TI NDVI and ac- cumulated spring and summer precipitation, and a nega- INTRODUCTION tive correlation between TI NDVI and spring potential Reflectance data from most land surfaces measured from evapotranspiration. The coefficient of determination (R 2 ) satellite based sensors can now be obtained in a consis- of the general model was 0.45. When the TI NDVI-cli- tent manner at time resolutions as short as 1 day, and at mate relationship was examined by individual land cover spatial resolutions ranging from a few meters to kilome- type, the relationship was generally better defined in terms ters in various spectral bands. Some acquisitions are of the variance accounted for by class-specific models available globally and provide an opportunity to charac- (R 2 50.39–0.94). The photosynthetic pathway is an impor- terize land cover over large areas through classification tant determinant of grassland performance with northern of time series spectral data (Tucker et al., 1985; Town- mixed prairie (mixture of C 3 and C 4 grassland) TI NDVI shend et al., 1987; Loveland et al., 1991). At a spatial scale affected by both thermal and moisture conditions during of kilometers, large geographic areas can be monitored the growing season while southern plains grasslands (pri- for land cover changes, and issues concerning the geo- graphic extent of forests, grasslands, deserts, and other ecosystems can be more objectively resolved. Hence, real * Center for Advanced Land Management Information Technolo- gies, Conservation and Survey Division, University of Nebraska-Lin- time monitoring of land cover is now possible, and we coln, Lincoln are approaching an ability to quantify types and rates of Hughes STX Corporation, EROS Data Center, Sioux Falls, land cover change occurring regionally and globally. South Dakota ‡ Department of Biology, Augustana College, Sioux Falls, South In addition to land cover characterization, satellite Dakota spectral data and transformations of these data (e.g., veg- Address correspondence to: Limin Yang, Hughes STX Corpora- etation indices) have been utilized to study vegetation dy- tion, EROS Data Center, Sioux Falls, SD 57198. E-mail:lyang@edcmail. namics and to derive various plant canopy functional and cr.usgs.gov Received 23 June 1997; revised 3 December 1997. biophysical attributes (Tucker, 1979; Jackson, 1983; Gut- REMOTE SENS. ENVIRON. 65:25–37 (1998) Elsevier Science Inc., 1998 0034-4257/98/$19.00 655 Avenue of the Americas, New York, NY 10010 PII S0034-4257(98)00012-1

Welcome message from author
This document is posted to help you gain knowledge. Please leave a comment to let me know what you think about it! Share it to your friends and learn new things together.
Transcript
An Analysis of Relationships among ClimateForcing and Time-Integrated NDVI ofGrasslands over the U.S. Northern andCentral Great Plains
Limin Yang,* Bruce K. Wylie,† Larry L. Tieszen,‡ and Bradley C. Reed†
Time-integrated normalized difference vegetation index marily C4 grassland) were predominantly influenced byspring and summer precipitation. Grassland land cover(TI NDVI) derived from the multitemporal satellite imag-
ery (1989–1993) was used as a surrogate for primary classes associated with sandy soils also demonstrated astrong relationship between TI NDVI and growing seasonproduction to investigate climate impacts on grassland
performance for central and northern Great Plains grass- rainfall. Significant impact of interannual climate variabil-ity on the TI NDVI–climate relationship was also ob-lands. Results suggest that spatial and temporal variability
in growing season precipitation, potential evapotranspira- served. The study suggests an integrated approach involv-ing numerical models, satellite remote sensing, and fieldtion, and growing degree days are the most important con-
trols on grassland performance and productivity. When TI observations to monitor grassland ecosystem dynamics ona regional scale. Elsevier Science Inc., 1998NDVI and climate data of all grassland land cover classes
were examined as a whole, a statistical model showed sig-nificant positive correlation between the TI NDVI and ac-cumulated spring and summer precipitation, and a nega- INTRODUCTIONtive correlation between TI NDVI and spring potential Reflectance data from most land surfaces measured fromevapotranspiration. The coefficient of determination (R2) satellite based sensors can now be obtained in a consis-of the general model was 0.45. When the TI NDVI-cli- tent manner at time resolutions as short as 1 day, and atmate relationship was examined by individual land cover spatial resolutions ranging from a few meters to kilome-type, the relationship was generally better defined in terms ters in various spectral bands. Some acquisitions areof the variance accounted for by class-specific models available globally and provide an opportunity to charac-(R250.39–0.94). The photosynthetic pathway is an impor- terize land cover over large areas through classificationtant determinant of grassland performance with northern of time series spectral data (Tucker et al., 1985; Town-mixed prairie (mixture of C3 and C4 grassland) TI NDVI shend et al., 1987; Loveland et al., 1991). At a spatial scaleaffected by both thermal and moisture conditions during of kilometers, large geographic areas can be monitoredthe growing season while southern plains grasslands (pri- for land cover changes, and issues concerning the geo-
graphic extent of forests, grasslands, deserts, and otherecosystems can be more objectively resolved. Hence, real* Center for Advanced Land Management Information Technolo-
gies, Conservation and Survey Division, University of Nebraska-Lin- time monitoring of land cover is now possible, and wecoln, Lincoln are approaching an ability to quantify types and rates of
† Hughes STX Corporation, EROS Data Center, Sioux Falls,land cover change occurring regionally and globally.South Dakota
‡ Department of Biology, Augustana College, Sioux Falls, South In addition to land cover characterization, satelliteDakota spectral data and transformations of these data (e.g., veg-
Address correspondence to: Limin Yang, Hughes STX Corpora- etation indices) have been utilized to study vegetation dy-tion, EROS Data Center, Sioux Falls, SD 57198. E-mail:lyang@edcmail.
namics and to derive various plant canopy functional andcr.usgs.govReceived 23 June 1997; revised 3 December 1997. biophysical attributes (Tucker, 1979; Jackson, 1983; Gut-
REMOTE SENS. ENVIRON. 65:25–37 (1998)Elsevier Science Inc., 1998 0034-4257/98/$19.00655 Avenue of the Americas, New York, NY 10010 PII S0034-4257(98)00012-1
26 Yang et al.
man, 1991; Qi et al., 1994; Sellers et al., 1994; Hall et Di et al. (1994) attempted to predict relationships be-tween the normalized difference vegetation index (NDVI)al., 1995; 1996). The primary attributes of interests in-
clude leaf area index (LAI) (Curran, 1983; Sellers, 1989; and precipitation for Nebraska Sandhills grassland andestablished the importance of lag periods in grasslandSpanner et al., 1990; Friedl et al., 1994; Gong et al.,
1995), plant net primary production and biomass (Go- performance in response to rainfall events. Tieszen et al.(1997) documented substantial reductions in time inte-ward et al., 1985; Tucker and Sellers, 1986; Everitt et
al., 1989; Turner et al., 1992; Anderson et al., 1993; El- grated NDVI (TI NDVI) in grasslands of U.S. GreatPlains during dry years and significant effects associatedliot and Regan, 1993; Merrill et al., 1993; Sellers et al.,
1995; Wylie et al., 1996), the fraction of absorbed photo- with changes in the beginning of the growing season.They also interpreted the differences in TI NDVI as dif-synthetically active radiation (fPAR) (Wiegand et al.,
1986; Demetriades-Shah et al., 1992; Sellers et al., 1992; ferences in net primary production, and reasonable R2
values between TI NDVI and independent estimates ofMyneni and Williams, 1994; Sellers et al., 1995), andphotosynthesis and chlorophyll concentration (Running long-term production were obtained. More directly, Par-
uelo and Lauenroth (1995) established a relationship be-and Nemani, 1988; Bracher and Murtha, 1994; Yoderand Waring, 1994). In combination with an understand- tween NDVI and primary production at selected sites for
the North American grasslands and shrublands.ing of plant physiological processes, it is now possible tosimulate regional photosynthesis, evapotranspiration, and Although there is little doubt that grassland perfor-
mance and production are largely under climate control,biomass using satellite-derived vegetation indices (e.g.,Running and Coughlan, 1988; Potter et al., 1993; Sellers the exact and quantitative nature of this control is not
yet well understood and is the subject of current investi-et al., 1995; 1997). In addition, vegetation index dataobserved over entire growing seasons have been utilized gation. Research was undertaken to examine the response
of grassland ecosystems to climate in the north and cen-to characterize vegetation dynamics and productivitythrough identification of the distinct phenological events tral Great Plains by use of satellite time series spectral
data and concurrent ground meteorological data. The ob-(e.g., onset of greenness and peak greenness) and bycomputing total greenness accumulated over a growing jective of the study was to better understand the rela-
tionships between climatic forcing and satellite-derivedseason (Goward et al., 1985; Malingreau, 1986; Lloyd,1990; Reed et al., 1994; 1996). The seasonal characteris- TI NDVI as a surrogate for grassland net primary pro-
duction, and to examine possible causes by which climatetics and the performance of vegetation are clearly underclimate control (Gallo and Heddinghaus, 1989). Goward affects grassland performance. It is understood that the
linkage between TI NDVI and grassland primary pro-and Prince (1995), for instance, pointed out the relation-ships among patterns of vegetation greenness and gener- duction could vary in time and space, hence impacting
the strength of relationship of TI NDVI and climate vari-ally accepted biogeographic zones. They also indicatedthat climate impacts these patterns with certain time lags ables. Nevertheless, the usage of satellite-derived TI NDVI
as a surrogate for grassland net primary production isin the response.Studies of grassland ecosystems suggest that the per- necessary because of the large geographical regions the
study dealt with and the desired future monitoring capa-formance and productivity of grasslands are quite re-sponsive to changes in climate. Perennial grasslands grow bility of grasslands dynamics. Specific issues addressed
by this research included: 1) What is the general rela-in areas with distinct seasonality (Tieszen and Dellting,1983) and their growth is largely influenced by the bio- tionship between grassland TI NDVI and the growing
season climate conditions from 1989–1993? 2) Are thereclimatic environment. Lauenroth (1979) identified pre-cipitation as the single most important factor controlling significant interannual variations in the TI NDVI–climate
relationship of the grasslands, and to what extent can thegrassland production in North America. Sala et al. (1988)also confirmed the importance of precipitation in relation variability be accounted for by the interannual variability
of climate? 3) Are there significant differences in TIto spatial and interannual variations in grassland produc-tion at a regional scale. Burke et al. (1991) and Seastedt NDVI–climate relationship among different grassland
types, and what climate controls are important for theet al. (1994) assessed the sensitivity of a central GreatPlains grassland using the CENTURY biogeochemical performance of a specific grassland type? 4) Are there
significant differences in the TI NDVI–climate relation-model (Parton et al., 1987) and concluded that the mostimportant variable controlling production was precipita- ship between C3- and C4-dominated grasslands?tion. In addition to precipitation, other climate variablesand their interactions with fire season, fire frequency, STUDY AREAnutrient cycling, photosynthetic type, soil properties, andterrain also affect grassland performance over various To ensure that climatic effects on vegetation were mini-
mally confounded with intensive agricultural and grazingspatial and temporal scales. Research designed to quantifysuch complex processes using satellite data has recently management, we restricted our analysis to the northern
and central Great Plains grasslands. Nine grassland landbeen reported (Sala et al., 1988; Briggs and Knapp, 1995).
Climate Forcing and Time-Integrated NDVI of U.S. Grasslands 27
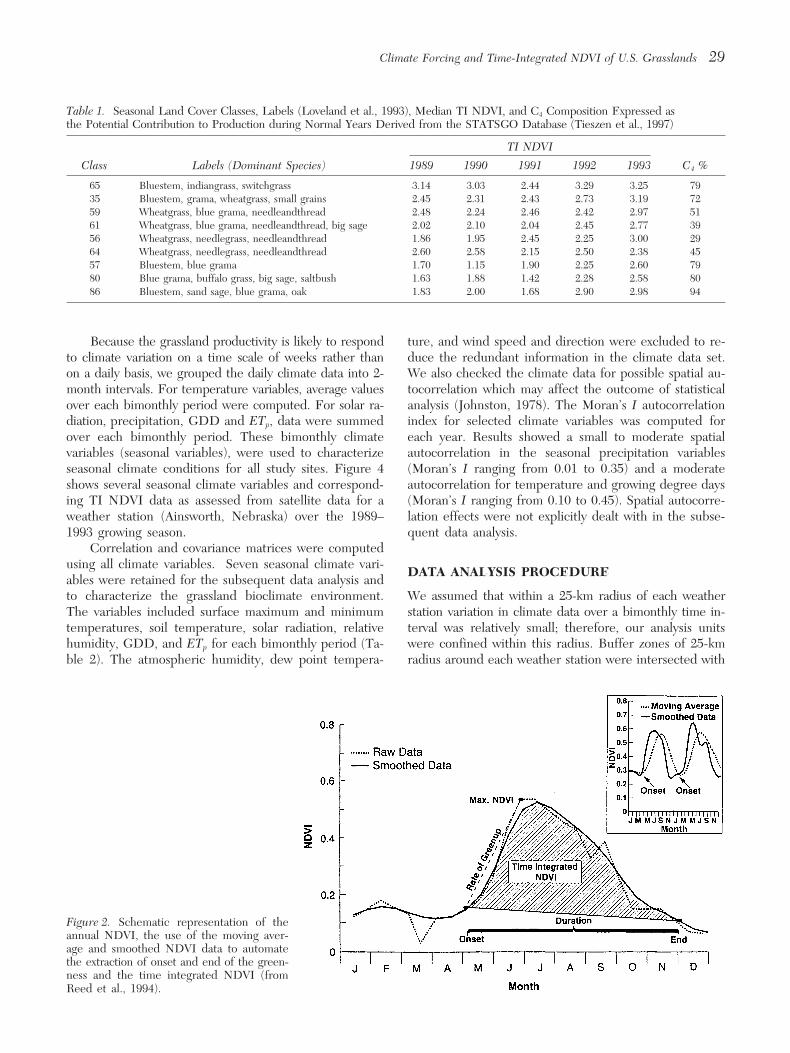
cover classes from the 1990 conterminous United States for some of the effects, we utilized an approach developedby Reed et al. (1994) to quantify grasslands seasonal char-land cover characteristics data base with spatial resolu-
tion of 1 km (Loveland et al., 1991; 1993) were used to acteristics and performance based on NDVI time series.This method applied an upwardly biased compound-run-identify grassland areas (Fig. 1 and Table 1). Tieszen et
al. (1997) proposed that these land cover classes represent ning-median line-smoothing technique to the originalNDVI composite data to further reduce cloud impact.a rich diversity of species along environmental gradients
that reflect ecosystem performance rather than equivalent The smoothed data were compared to a moving averageof the original NDVI time series to identify two cross-species composition, and they often consist of varying mix-
tures of C3 and C4 species, species with different climatic over points between the two data sets (Fig. 2). Thesecrossover points signify distinctive departures of the ob-responses. In our study area, eastern grassland land
cover classes dominated by C4 species include classes 65 served NDVI data from a trend established by the mov-ing average. Accordingly, the time of onset of greennessand 35. Class 65 largely represents the remnants of the
tallgrass prairie region, capturing the Flint Hills of Kan- was defined as the time period in which the value ofsmoothed NDVI data exceeded that of the moving aver-sas and a small portion of the Prairie Coteau in Southage. The end-of-season was determined in a similar man-Dakota. Characteristic species include big bluestem (An-ner only with the moving average applied to the NDVIdropogon gerardi Vitman), switch grass (Panicum virga-time series in reverse chronological order. Once the on-tum L.), and Indian grass (Sorghastrum nutans L.).set and end of season were identified, the TI NDVI wasHowever, the small area in central South Dakota proba-computed as the summation of NDVI of each biweeklybly has significant components of the northern mixedperiod from the point of onset to that of end of season.prairie. The Sand Hills of Nebraska were largely repre-The TI NDVI can be expressed assented by classes 35 and 59. These two classes, occurring
from southeastern Wyoming into the northern Missouri TI NDVI5RNDVIi,basin, contain bluestems (Andropogon spp.), grama grasseswhere i is the ith biweekly interval ranging from period(Bouteloua spp.), and wheatgrass (Agropyron spp.).of onset to that of end of season. Figure 3 depicts spatialThe northwest portion of the study area was domi-distribution of TI NDVI computed for each 1-km2 pixelnated by classes containing primarily C3 grasslands withover a large portion of the U.S. Great Plains from 1989wheatgrass (Agropyron spp.), and tended to have a north-to 1993. Table 1 lists the average median TI NDVI fromwest to southeast orientation. The grassland classes, 59, 61,1989 to 1993 of the nine grassland land cover classes.56, and 64, contain varying elements of stipa and grama
grasses with class 61 encompassing shrub elements ofsage (Artemisia spp.) and greasewood (Covillez spp., Climate DataAtriplex spp.). Grassland classes occurring in the south- Climate data were collected from 72 automated weatherern portion of the study area include C4 dominated stations across the northern and central Great Plains overclasses, 57, 80, and 86, with blue grama and some shrub the period 1989–1993 (Fig. 3). For each weather station,components. These southern grassland classes were dis- the data set contains hourly measurements of solar radia-tributed from north to south. tion, surface air temperature, soil temperature at 10 cm
below the surface, atmospheric humidity, wind speedand direction, and precipitation. In addition, several cli-DATAmate variables were derived from the measured data,
Satellite Data including growing degree days (GDDs) and potentialevapotranspiration (ETp). GDD was determined by sub-The spectral data used in this study was acquired by thetracting a base temperature from the daily average tem-advanced very high resolution radiometer (AVHRR) onperature. The base temperature of 108C is used in thisboard the National Oceanic and Atmospheric Adminis-study to compute GDD. The potential evapotranspira-tration polar orbital meteorological satellite. Time inte-tion (ETp) was calculated through the Penman combina-grated NDVI was derived from a time series of NDVItion equation expressed as:composites for 1989–1993 at a nominal 1-km spatial res-
olution. The NDVI composites were generated by select-qw Lv ETp5[D(Rn2G)1g f (U)(e*2ea)]/(D1g), (1)
ing pixels with the highest NDVI value over each biweeklyperiod in order to reduce the effect of cloud contamina- where Rn is net all-wave radiation, G substrate heat flux,
f (U) wind function, qw density of liquid water, Lv the la-tion. Because of the inherent nature in AVHRR data ac-quisition and processing due to satellite viewing geome- tent heat of vaporization, D the slope of the saturation
vapor/temperature curve at the mean air and surfacetry (Goward et al., 1991), atmospheric haze and cloud,and temporal data compositing (Holben, 1986), the bi- temperature, c the psychometric constant, and e* and ea
are the saturation vapor pressure and actual vapor pres-weekly NDVI composites can be biased. Many of theseeffects result in reduced NDVI values. To compensate sure of air, respectively.
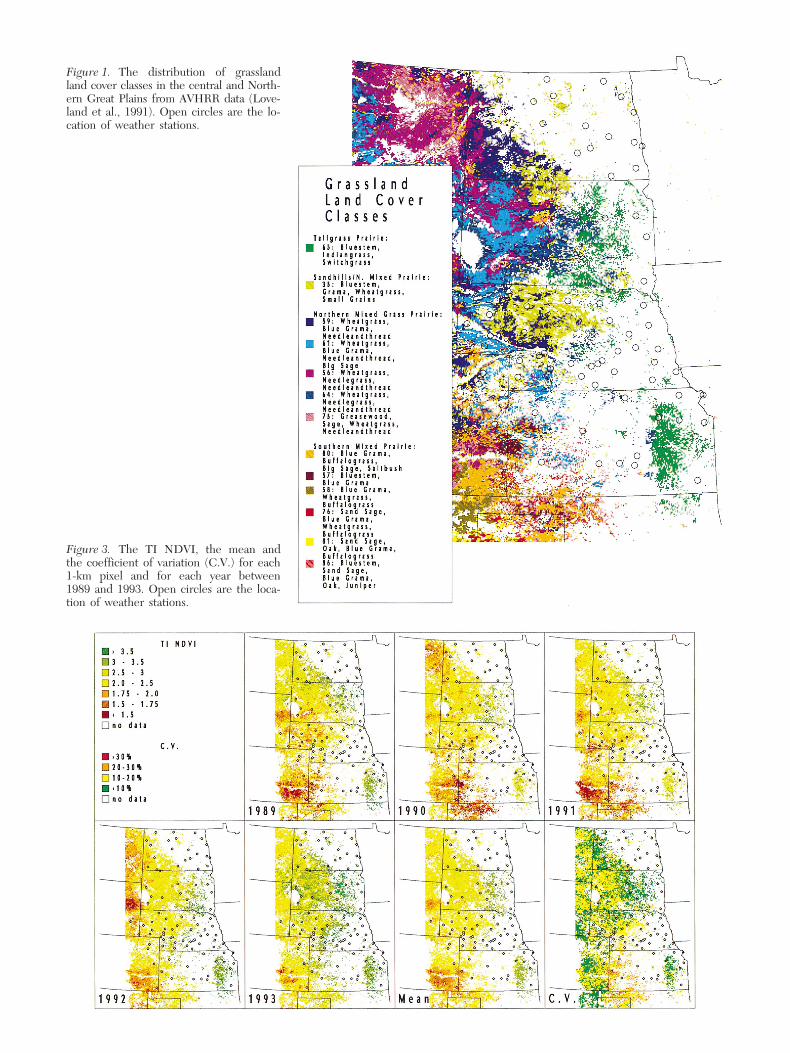
Figure 1. The distribution of grasslandland cover classes in the central and North-ern Great Plains from AVHRR data (Love-land et al., 1991). Open circles are the lo-cation of weather stations.
Figure 3. The TI NDVI, the mean andthe coefficient of variation (C.V.) for each1-km pixel and for each year between1989 and 1993. Open circles are the loca-tion of weather stations.
Climate Forcing and Time-Integrated NDVI of U.S. Grasslands 29
Table 1. Seasonal Land Cover Classes, Labels (Loveland et al., 1993), Median TI NDVI, and C4 Composition Expressed asthe Potential Contribution to Production during Normal Years Derived from the STATSGO Database (Tieszen et al., 1997)
TI NDVI
Class Labels (Dominant Species) 1989 1990 1991 1992 1993 C4 %
65 Bluestem, indiangrass, switchgrass 3.14 3.03 2.44 3.29 3.25 7935 Bluestem, grama, wheatgrass, small grains 2.45 2.31 2.43 2.73 3.19 7259 Wheatgrass, blue grama, needleandthread 2.48 2.24 2.46 2.42 2.97 5161 Wheatgrass, blue grama, needleandthread, big sage 2.02 2.10 2.04 2.45 2.77 3956 Wheatgrass, needlegrass, needleandthread 1.86 1.95 2.45 2.25 3.00 2964 Wheatgrass, needlegrass, needleandthread 2.60 2.58 2.15 2.50 2.38 4557 Bluestem, blue grama 1.70 1.15 1.90 2.25 2.60 7980 Blue grama, buffalo grass, big sage, saltbush 1.63 1.88 1.42 2.28 2.58 8086 Bluestem, sand sage, blue grama, oak 1.83 2.00 1.68 2.90 2.98 94
Because the grassland productivity is likely to respond ture, and wind speed and direction were excluded to re-duce the redundant information in the climate data set.to climate variation on a time scale of weeks rather than
on a daily basis, we grouped the daily climate data into 2- We also checked the climate data for possible spatial au-tocorrelation which may affect the outcome of statisticalmonth intervals. For temperature variables, average values
over each bimonthly period were computed. For solar ra- analysis (Johnston, 1978). The Moran’s I autocorrelationindex for selected climate variables was computed fordiation, precipitation, GDD and ETp, data were summed
over each bimonthly period. These bimonthly climate each year. Results showed a small to moderate spatialautocorrelation in the seasonal precipitation variablesvariables (seasonal variables), were used to characterize
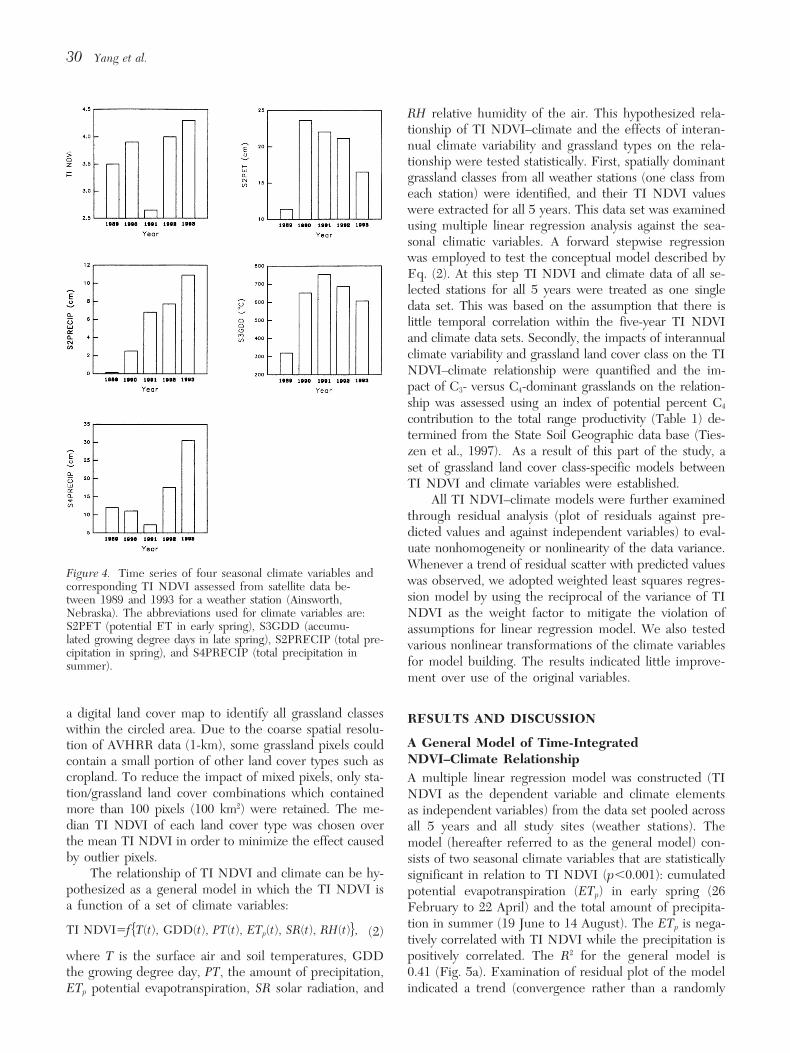
seasonal climate conditions for all study sites. Figure 4 (Moran’s I ranging from 0.01 to 0.35) and a moderateautocorrelation for temperature and growing degree daysshows several seasonal climate variables and correspond-
ing TI NDVI data as assessed from satellite data for a (Moran’s I ranging from 0.10 to 0.45). Spatial autocorre-lation effects were not explicitly dealt with in the subse-weather station (Ainsworth, Nebraska) over the 1989–
1993 growing season. quent data analysis.Correlation and covariance matrices were computed
using all climate variables. Seven seasonal climate vari- DATA ANALYSIS PROCEDUREables were retained for the subsequent data analysis andto characterize the grassland bioclimate environment. We assumed that within a 25-km radius of each weather
station variation in climate data over a bimonthly time in-The variables included surface maximum and minimumtemperatures, soil temperature, solar radiation, relative terval was relatively small; therefore, our analysis units
were confined within this radius. Buffer zones of 25-kmhumidity, GDD, and ETp for each bimonthly period (Ta-ble 2). The atmospheric humidity, dew point tempera- radius around each weather station were intersected with
Figure 2. Schematic representation of theannual NDVI, the use of the moving aver-age and smoothed NDVI data to automatethe extraction of onset and end of the green-ness and the time integrated NDVI (fromReed et al., 1994).
30 Yang et al.
RH relative humidity of the air. This hypothesized rela-tionship of TI NDVI–climate and the effects of interan-nual climate variability and grassland types on the rela-tionship were tested statistically. First, spatially dominantgrassland classes from all weather stations (one class fromeach station) were identified, and their TI NDVI valueswere extracted for all 5 years. This data set was examinedusing multiple linear regression analysis against the sea-sonal climatic variables. A forward stepwise regressionwas employed to test the conceptual model described byEq. (2). At this step TI NDVI and climate data of all se-lected stations for all 5 years were treated as one singledata set. This was based on the assumption that there islittle temporal correlation within the five-year TI NDVIand climate data sets. Secondly, the impacts of interannualclimate variability and grassland land cover class on the TINDVI–climate relationship were quantified and the im-pact of C3- versus C4-dominant grasslands on the relation-ship was assessed using an index of potential percent C4
contribution to the total range productivity (Table 1) de-termined from the State Soil Geographic data base (Ties-zen et al., 1997). As a result of this part of the study, aset of grassland land cover class-specific models betweenTI NDVI and climate variables were established.
All TI NDVI–climate models were further examinedthrough residual analysis (plot of residuals against pre-dicted values and against independent variables) to eval-uate nonhomogeneity or nonlinearity of the data variance.Whenever a trend of residual scatter with predicted values
Figure 4. Time series of four seasonal climate variables and was observed, we adopted weighted least squares regres-corresponding TI NDVI assessed from satellite data be-sion model by using the reciprocal of the variance of TItween 1989 and 1993 for a weather station (Ainsworth,
Nebraska). The abbreviations used for climate variables are: NDVI as the weight factor to mitigate the violation ofS2PET (potential ET in early spring), S3GDD (accumu- assumptions for linear regression model. We also testedlated growing degree days in late spring), S2PRECIP (total pre- various nonlinear transformations of the climate variablescipitation in spring), and S4PRECIP (total precipitation in
for model building. The results indicated little improve-summer).ment over use of the original variables.
a digital land cover map to identify all grassland classes RESULTS AND DISCUSSIONwithin the circled area. Due to the coarse spatial resolu-
A General Model of Time-Integratedtion of AVHRR data (1-km), some grassland pixels couldNDVI–Climate Relationshipcontain a small portion of other land cover types such as
cropland. To reduce the impact of mixed pixels, only sta- A multiple linear regression model was constructed (TItion/grassland land cover combinations which contained NDVI as the dependent variable and climate elementsmore than 100 pixels (100 km2) were retained. The me- as independent variables) from the data set pooled acrossdian TI NDVI of each land cover type was chosen over all 5 years and all study sites (weather stations). Thethe mean TI NDVI in order to minimize the effect caused model (hereafter referred to as the general model) con-by outlier pixels. sists of two seasonal climate variables that are statistically
The relationship of TI NDVI and climate can be hy- significant in relation to TI NDVI (p,0.001): cumulatedpothesized as a general model in which the TI NDVI is potential evapotranspiration (ETp) in early spring (26a function of a set of climate variables: February to 22 April) and the total amount of precipita-
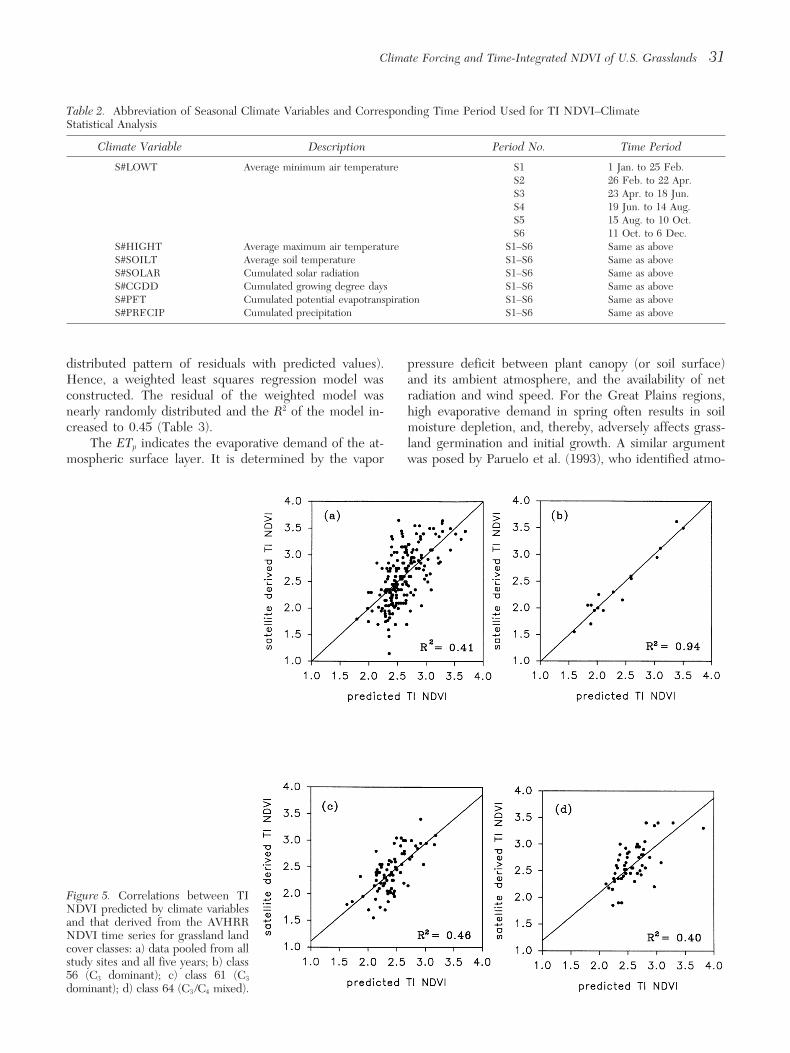
tion in summer (19 June to 14 August). The ETp is nega-TI NDVI5f hT(t), GDD(t), PT(t), ETp(t), SR(t), RH(t)j, (2) tively correlated with TI NDVI while the precipitation ispositively correlated. The R2 for the general model iswhere T is the surface air and soil temperatures, GDD0.41 (Fig. 5a). Examination of residual plot of the modelthe growing degree day, PT, the amount of precipitation,
ETp potential evapotranspiration, SR solar radiation, and indicated a trend (convergence rather than a randomly
Climate Forcing and Time-Integrated NDVI of U.S. Grasslands 31
Table 2. Abbreviation of Seasonal Climate Variables and Corresponding Time Period Used for TI NDVI–ClimateStatistical Analysis
Climate Variable Description Period No. Time Period
S#LOWT Average minimum air temperature S1 1 Jan. to 25 Feb.S2 26 Feb. to 22 Apr.S3 23 Apr. to 18 Jun.S4 19 Jun. to 14 Aug.S5 15 Aug. to 10 Oct.S6 11 Oct. to 6 Dec.
S#HIGHT Average maximum air temperature S1–S6 Same as aboveS#SOILT Average soil temperature S1–S6 Same as aboveS#SOLAR Cumulated solar radiation S1–S6 Same as aboveS#CGDD Cumulated growing degree days S1–S6 Same as aboveS#PET Cumulated potential evapotranspiration S1–S6 Same as aboveS#PRECIP Cumulated precipitation S1–S6 Same as above
distributed pattern of residuals with predicted values). pressure deficit between plant canopy (or soil surface)and its ambient atmosphere, and the availability of netHence, a weighted least squares regression model was
constructed. The residual of the weighted model was radiation and wind speed. For the Great Plains regions,high evaporative demand in spring often results in soilnearly randomly distributed and the R2 of the model in-
creased to 0.45 (Table 3). moisture depletion, and, thereby, adversely affects grass-land germination and initial growth. A similar argumentThe ETp indicates the evaporative demand of the at-
mospheric surface layer. It is determined by the vapor was posed by Paruelo et al. (1993), who identified atmo-
Figure 5. Correlations between TINDVI predicted by climate variablesand that derived from the AVHRRNDVI time series for grassland landcover classes: a) data pooled from allstudy sites and all five years; b) class56 (C3 dominant); c) class 61 (C3
dominant); d) class 64 (C3 /C4 mixed).
32 Yang et al.
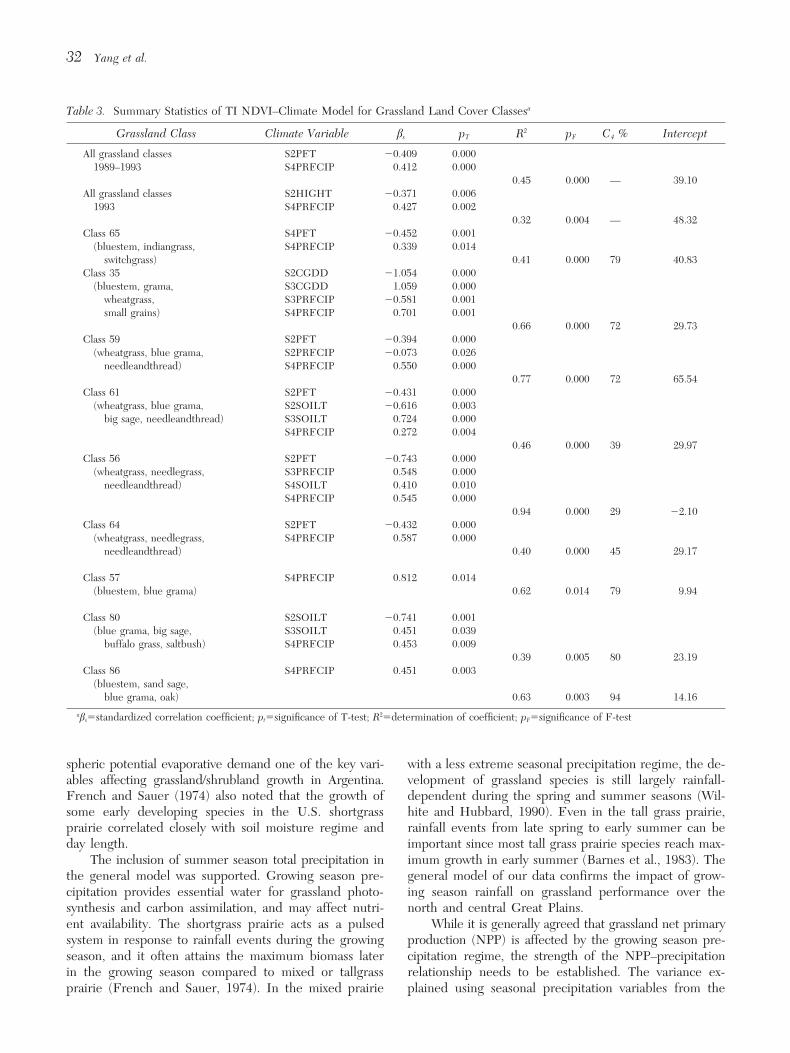
Table 3. Summary Statistics of TI NDVI–Climate Model for Grassland Land Cover Classesa
Grassland Class Climate Variable bs pT R2 pF C4 % Intercept
All grassland classes S2PET 20.409 0.0001989–1993 S4PRECIP 0.412 0.000
0.45 0.000 — 39.10All grassland classes S2HIGHT 20.371 0.006
1993 S4PRECIP 0.427 0.0020.32 0.004 — 48.32
Class 65 S4PET 20.452 0.001(bluestem, indiangrass, S4PRECIP 0.339 0.014
switchgrass) 0.41 0.000 79 40.83Class 35 S2CGDD 21.054 0.000
(bluestem, grama, S3CGDD 1.059 0.000wheatgrass, S3PRECIP 20.581 0.001small grains) S4PRECIP 0.701 0.001
0.66 0.000 72 29.73Class 59 S2PET 20.394 0.000
(wheatgrass, blue grama, S2PRECIP 20.073 0.026needleandthread) S4PRECIP 0.550 0.000
0.77 0.000 72 65.54Class 61 S2PET 20.431 0.000
(wheatgrass, blue grama, S2SOILT 20.616 0.003big sage, needleandthread) S3SOILT 0.724 0.000
S4PRECIP 0.272 0.0040.46 0.000 39 29.97
Class 56 S2PET 20.743 0.000(wheatgrass, needlegrass, S3PRECIP 0.548 0.000
needleandthread) S4SOILT 0.410 0.010S4PRECIP 0.545 0.000
0.94 0.000 29 22.10Class 64 S2PET 20.432 0.000
(wheatgrass, needlegrass, S4PRECIP 0.587 0.000needleandthread) 0.40 0.000 45 29.17
Class 57 S4PRECIP 0.812 0.014(bluestem, blue grama) 0.62 0.014 79 9.94
Class 80 S2SOILT 20.741 0.001(blue grama, big sage, S3SOILT 0.451 0.039
buffalo grass, saltbush) S4PRECIP 0.453 0.0090.39 0.005 80 23.19
Class 86 S4PRECIP 0.451 0.003(bluestem, sand sage,
blue grama, oak) 0.63 0.003 94 14.16
abs5standardized correlation coefficient; pt5significance of T-test; R25determination of coefficient; pF5significance of F-test
spheric potential evaporative demand one of the key vari- with a less extreme seasonal precipitation regime, the de-velopment of grassland species is still largely rainfall-ables affecting grassland/shrubland growth in Argentina.
French and Sauer (1974) also noted that the growth of dependent during the spring and summer seasons (Wil-hite and Hubbard, 1990). Even in the tall grass prairie,some early developing species in the U.S. shortgrass
prairie correlated closely with soil moisture regime and rainfall events from late spring to early summer can beimportant since most tall grass prairie species reach max-day length.
The inclusion of summer season total precipitation in imum growth in early summer (Barnes et al., 1983). Thegeneral model of our data confirms the impact of grow-the general model was supported. Growing season pre-
cipitation provides essential water for grassland photo- ing season rainfall on grassland performance over thenorth and central Great Plains.synthesis and carbon assimilation, and may affect nutri-
ent availability. The shortgrass prairie acts as a pulsed While it is generally agreed that grassland net primaryproduction (NPP) is affected by the growing season pre-system in response to rainfall events during the growing
season, and it often attains the maximum biomass later cipitation regime, the strength of the NPP–precipitationrelationship needs to be established. The variance ex-in the growing season compared to mixed or tallgrass
prairie (French and Sauer, 1974). In the mixed prairie plained using seasonal precipitation variables from the
Climate Forcing and Time-Integrated NDVI of U.S. Grasslands 33
present study was higher than that of the small scale, group with relatively homogenous land cover, distinctseasonal characteristics, and a common level of produc-site-specific investigation [e.g., Briggs and Knapp (1995)
tall grass in Konza Prairie], yet lower than those obtained tivity (Tieszen et al., 1997; Loveland et al., 1995). Theresponse to climate of a given grassland class may differfrom the large scale North America and U.S. studies
(e.g., Paruelo and Lauenroth, 1995; Sala et al., 1988). In from the other classes. Therefore, we further examinedTI NDVI–climate relationship for each grassland landother words, the strength of NPP–precipitation associa-
tion is probably scale-dependent. cover class and established a set of class-specific models.The TI NDVI–climate model of class 35 (bluestem,No temperature variables were statistically signifi-
cant for the general TI NDVI–climate model. The lack grama, wheatgrass) includes four seasonal climate vari-ables: spring and summer precipitation, and spring andof significance may be due to differences in grassland
types and their responses to different temperature re- summer growing degree days. The four-variable modelaccounted for 66% of the total variance in observed TIgimes across the study area. For instance, C3- dominant
shortgrass and mixed grass prairie in the northern plains NDVI compared to only 45% of the general model (Ta-ble 3). Besides rainfall, influence of the thermal regimemay initiate growth as early as the C4-dominant grass-
lands in central and southern plains (Tieszen et al., (GDD) suggested by class 35 model was probably attribut-1997). In addition, productivity of mixed prairie in cen- able to the large latitudinal extension of the class as welltral and northern plains often exceeds that of semiarid as the interannual variability in spring and summer tem-grassland/shrubland in the southern plains where mois- perature. Several previous studies in Nebraska Sandhillture supply is often limited and unreliable. grassland identified that the growing season change in
NDVI is significantly affected by the timing and intensitySignificance of Interannual Variability of Climate of the rainfall events (Di et al., 1994; Yang et al., 1997).on TI NDVI–Climate General Model In contrast to class 35, for which the distribution was
primarily along the central and western Great Plains,We tested whether the interannual climate variabilityclass 65 (bluestem, indian grass, switchgrass) was mostlywould significantly alter the TI NDVI–climate relation-distributed in the Flint Hills (tall grass prairie in easternship general model by using the year of observation as aKansas). The class 65 model included only two variables:dummy variable in the regression analysis. The resultsspring and summer rainfall; and the R2 of the model wassuggest only one dummy variable (year 1993) was statisti-lower (0.41; Table 3). The variance explained for class 65cally significant (P,0.001); hence a separate TI NDVI–was similar to that reported by Briggs and Knapp (1995).climate model was established using 1993 data only. Al-They concluded that climate data alone are not adequatethough this model contains similar climate variables asto account for spatial and temporal variabilities of grass-the general model, its intercept is higher (Table 3). Thisland productivity in Konza tall grass prairie.difference in intercept is most likely attributable to the
Rather distinct differences in TI NDVI–climate rela-excessive rainfall in the northern and central Great Plainstionships were observed between the grassland classes inthroughout the 1993 growing season, which resulted in
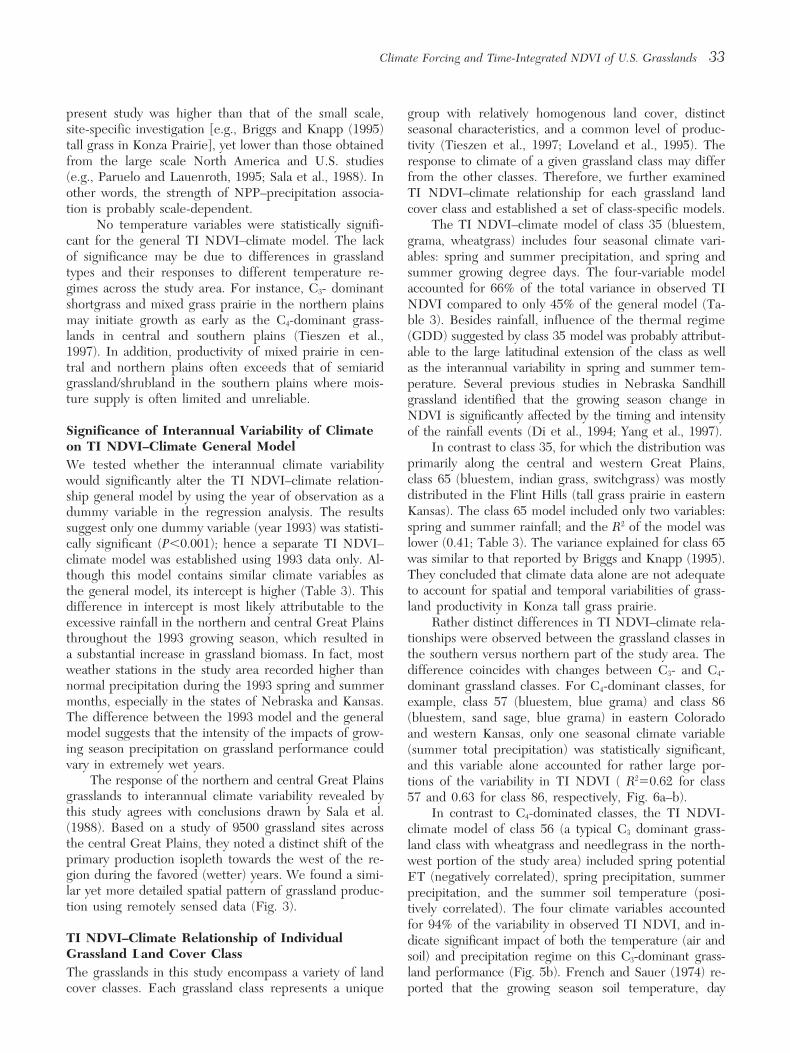
a substantial increase in grassland biomass. In fact, most the southern versus northern part of the study area. Theweather stations in the study area recorded higher than difference coincides with changes between C3- and C4-normal precipitation during the 1993 spring and summer dominant grassland classes. For C4-dominant classes, formonths, especially in the states of Nebraska and Kansas. example, class 57 (bluestem, blue grama) and class 86The difference between the 1993 model and the general (bluestem, sand sage, blue grama) in eastern Coloradomodel suggests that the intensity of the impacts of grow- and western Kansas, only one seasonal climate variableing season precipitation on grassland performance could (summer total precipitation) was statistically significant,vary in extremely wet years. and this variable alone accounted for rather large por-
The response of the northern and central Great Plains tions of the variability in TI NDVI ( R250.62 for classgrasslands to interannual climate variability revealed by 57 and 0.63 for class 86, respectively, Fig. 6a–b).this study agrees with conclusions drawn by Sala et al. In contrast to C4-dominated classes, the TI NDVI-(1988). Based on a study of 9500 grassland sites across climate model of class 56 (a typical C3 dominant grass-the central Great Plains, they noted a distinct shift of the land class with wheatgrass and needlegrass in the north-primary production isopleth towards the west of the re- west portion of the study area) included spring potentialgion during the favored (wetter) years. We found a simi- ET (negatively correlated), spring precipitation, summerlar yet more detailed spatial pattern of grassland produc- precipitation, and the summer soil temperature (posi-tion using remotely sensed data (Fig. 3). tively correlated). The four climate variables accounted
for 94% of the variability in observed TI NDVI, and in-TI NDVI–Climate Relationship of Individual dicate significant impact of both the temperature (air andGrassland Land Cover Class soil) and precipitation regime on this C3-dominant grass-
land performance (Fig. 5b). French and Sauer (1974) re-The grasslands in this study encompass a variety of landcover classes. Each grassland class represents a unique ported that the growing season soil temperature, day
34 Yang et al.
that temperature impacts C3 species differently than C4
species, as C3 species are more active in the cool springseason and C4 species are more active in midsummer(Ode et al., 1980). Even within the C4-dominant grass-land classes, differences in response to climate still exist,possibly because of the variation in species compositionand in local ecological conditions. This argument is sup-ported by different TI NDVI-climate relationship be-tween class 57 and class 80 (Table 3) and between class57, 86 and 65 (Fig. 6).
CONCLUSIONS
The present study demonstrated that time-integratedNDVI derived from AVHRR time series data providesa sensible metric for gauging and monitoring grasslandecosystem performance at regional scales, provided thatthe satellite data are properly calibrated and the TI NDVIis objectively defined. The study showed that the domi-nant climate control on grassland productivity in the U.S.central and northern Great Plains was the summer andspring precipitation, rather than the total annual precipi-tation. Besides precipitation, potential evapotranspirationin spring was also correlated with grassland production.The significance of the climate controls varied amonggrassland types and geographical location. In addition,interannual climate variability in temperature and precip-itation also affected grassland productivity over the entirecentral and northern Great Plains, as was shown by a sig-nificant increase of 1993 TI NDVI.
This research also established TI NDVI–climate rela-tionship for each individual grassland land cover class.Rather distinct differences in the TI NDVI–climate rela-tionship was observed. The differences appeared to berelated to disparate photosynthetic pathways and physio-logical characteristics of C3 and C4 species. The perfor-mance of grassland classes in the northern short prairie(C3-dominant) and mixed prairie (C3/C4 mixed) were af-fected by both thermal and moisture conditions duringthe growing season. In contrast, development of C4-dom-Figure 6. Simple correlations between TI NDVI and summer
precipitation for grassland land cover classes: a) class 57 inant grassland/shrubland in the southern and western ar-(C4 dominant); b) class 86 (C4 dominant); c) class 65 (C4 eas was predominantly influenced by the spring–summerdominant). precipitation.
The TI NDVI–climate relationships established bythe land cover specific models indicate that the impact
length, and moisture availability were closely correlated of climate variability can be monitored by observing thewith the phenological development of shortgrass prairie real-time growing season TI NDVI. In addition, the es-in the United States. tablished TI NDVI–climate models can be utilized for
TI NDVI–climate models for classes with a mixture predicting annual grassland productivity over the Greatof C3/C4 species (class 61, 64, and 59) included variables Plains by using weather data of the early and mid-grow-of both summer rainfall and growing degree days. Spa- ing season. The models also provide critical informationtially, these C3/C4 mixed grasslands extend in north–south for development of parameterizations needed by moreand east–west directions across the Great Plains. In addi- sophisticated ecosystem models in order to better under-tion to impact of precipitation, differences in temperature stand grassland ecosystem dynamics over a variety of spa-and the length of growing season due to latitudinal change tial and temporal scales.
While climatic control is important to grassland per-could affect grassland development. It should be noted
Climate Forcing and Time-Integrated NDVI of U.S. Grasslands 35
tionships between NDVI and precipitation during vegetativeformance and productivity in the Great Plains, other abi-growth cycles. Int. J. Remote Sens. 15:2121–2136.otic and biotic factors should not be overlooked. The un-
Elliot, G. A., and Regan, K. L. (1993), Use of reflectance mea-explained variance associated with either the general orsurements to estimate early cereal biomass production onclass-specific TI NDVI–climate models indicated thesandplain soils. Austr. J. Exp. Agric. 33:179–183.need to examine those factors. The abiotic factors which
Everitt, J. H., Escobar, D. E., and Richardson, A. J. (1989),were not explicitly dealt with in our study include the Estimating grassland phytomass production with near-infra-soil properties and soil moisture content, topography, fire red and mid-infrared spectral variables. Remote Sens. Envi-occurrence, and grazing management, all of which can ron. 30:257–261.be important in affecting grassland performance at the French, N., and Sauer, R. (1974), Phenological studies andsite-specific level. Biotic factors of relevance include the modeling in grasslands. In Phenology and Seasonality Mod-
eling (H. Lieth, Ed.), Springer-Verlag, New York, Newresponse to climate of individual species, and competi-York, pp. 227–236.tion and adaptation to the biological environment among
Friedl, M. A., Michaelsen, J., Davis, F. W., Walker, H. andgrassland species.Schimel, D. S. (1994), Estimating grassland biomass andleaf area index using ground and satellite data. Int. J. Re-
This research was supported by grant from the National Aero- mote Sens. 15:1401–1420.nautics and Space Administration (Grant NAGW-3940). Work Gallo, K. P., and Heddinghaus, T. K. (1989), The use of satel-conducted by Bruce Wylie and Larry Tieszen was supported lite-derived vegetation indices as indicators of climatic vari-by the Department of Energy through the Great Plains NIGEC
ability. In Proceedings of the Sixth Conference on AppliedProgram (LWT 62-123-06505), The Nature Conservency (TNC-Climatology, Charleston, SC, American Meteorological Soci-Mellon Program), the U.S. Geological Survey (Cooperativeety, pp. 244–247.Agreement No. 1434-CR-96-AG-00777), and the National Science
Gong, P. G., Pu, R., and Miller, J. R. (1995), Coniferous forestFoundation (BSR-8819532). We acknowledge the assistance ofleaf area index estimation along the Oregon transect usingthe High Plains Climate Center at the University of Nebraska-
Lincoln in preparing climate data. In addition, Dr. James Mer- compact airborne spectrographic imager data. Photogramm.chant at the University of Nebraska-Lincoln provided support Eng. Remote Sens. 61:1107–1117.that initiated and sustained this research. Eugene Fosnight at the Goward, S. N., and Prince, S. D. (1995), Transient effects ofUSGS EROS Data Center consulted on statistical analysis. We climate on vegetation dynamics: satellite observations. J.thank three anonymous reviewers for their constructive and criti- Biogeogr. 22:549–563.cal comments on an earlier draft of the manuscript. Goward, S. N., Tucker, C. J., and Dye, D. G. (1985), North
American vegetation patterns observed with NOAA-7 ad-vanced very high resolution radiometer. Vegetatio 64:3–14.REFERENCES
Goward, S. N., Markham, B., Dye, D. G., Dulaney, W., andYang, J. (1991), Normalized difference vegetation index
Anderson, G. L., Hanson, J. D., and Haas, R. H. (1993), Evalu- measurements from the advanced very high resolution radi-ating Landsat Thematic Mapper derived vegetation indices ometer. Remote Sens. Environ. 35:257–277.for estimating above-ground biomass on semiarid range- Gutman, G. G., (1991), Vegetation indices from AVHRR: an up-lands. Remote Sens. Environ. 45:165–175. date and future prospects. Remote Sens. Environ. 35:121–136.
Barnes, P. W., Tieszen, L. L., and Ode, D. J. (1983), Distribu- Hall, F. G., Townshend, J. R. G., and Engman, E. T. (1995),tion, production, and diversity of C3 and C4 dominated Status of remote sensing algorithms for estimation of landcommunities in a mixed prairie. Can. J. Bot. 61:741–751. surface state parameters. Remote Sens. Environ. 151:138–
Bracher, G. A., and Murtha, P. A. (1994), Estimation of foliar 156.macro-nutrients and chlorophyll in Douglas-fir seedlings by Hall, F. G., Peddle, D. R., and Ledrew, E. F. (1996), Remoteleaf reflectance. Can. J. Remote Sens. 20:102–115. sensing of biophysical variables in boreal forest stands of Pi-
Briggs, J. M., and Knapp, A. K. (1995), Interannual variability cea mariana. Int. J. Remote Sens. 15:3077–3081.in primary production in tallgrass prairie: climate, soil mois- Holben, B. N. (1986), Characteristics of maximum-value com-ture, topographic position, and fire as determinants of posite images from temporal AVHRR data. Int. J. Remoteaboveground biomass. Am. J. Bot. 82(8):1024–1030. Sens. 7:1417–1434.
Burke, I. C., Kittle, T. G. F., Lauenroth, W. K., Snook, P., Jackson, R. D. (1983), Spectral indices in n-space. Remote Sens.Yonker, C. M., and Parton, W. J. (1991), Regional analysis Environ. 13:409–421.of the central Great Plains. Bioscience 41:685–692. Johnston, R. J. (1978), Multivariate Statistical Analysis in Ge-
Curran, P. J. (1983), Multispectral remote sensing for the esti- ography, Longman, New York.mation of green leaf area index. Phil. Trans. Roy. Soc. Lauenroth, W. K. (1979), Grassland primary production: NorthLond. 309:257–270. America grasslands in perspective. In Perspectives in Grass-
Demitriades-Shah, T. H., Kanemasu, E. T., Flitcroft, I. D., and land Ecology (N. R. French, Ed.), Springer-Verlag, NewSu, H. (1992), Comparison of ground- and satellite-based York, pp. 3–24.measurements of the fraction of photosynthetically active ra- Lloyd, D. (1990), A phenological classification of terrestrial
vegetation cover using shortwave vegetation index imagery.diation intercepted by Tallgrass prairie. Int. J. RemoteSens. 97:18,497–18,950. Int. J. Remote Sens. 52:534–544.
Loveland, T. R., Merchant, J. W., Ohlen, D. O., and Brown,Di, L., Rundquist, D. C., and Han, L. (1994), Modelling rela-
36 Yang et al.
J. F. (1991), Development of a land-cover characteristics da- Sala, O. E., Parson, W. J., Joyce, L. A., and Lauenroth, W. K.(1988), Primary production of the central grassland regiontabase for the conterminous U.S. Photogramm. Eng. Remoteof the United States: spatial pattern and major controls.Sens. 57:1453–1463.Ecology 69:40–45.Loveland, T. R., Ohlen, D. O., Brown, J. F., Reed, B. C., Mer-
Seastedt, T. R., Coxwell, C. C., Ojima, D. S., and Parton, W. J.chant, J. W. and Steyaert, L. T. (1993), Prototype 1990 Con-(1994), Controls of plant and soil carbon in a semihumidterminous United States land cover characteristics data set,temperate grassland. Ecol. Appl. 4:344–353.CD ROM, USGS CD-ROM set 9307, U.S. Geological Sur-
Sellers, P. J. (1989), Vegetation-canopy spectral reflectance andvey, Washington, DC.biophysical processes. In Theory and Applications of RemoteLoveland, T. R., Merchant, J. W., Brown, J. F., et al. (1995),Sensing (G. Asrar, Ed.), Wiley, New York.Seasonal land-cover regions of the United States. Ann.
Sellers, P. J., Heiser, M. D., and Hall, F. G. (1992), RelationsAssoc. Am. Geogr. Map Suppl. 85:339–355.between surface conductance and spectral vegetation indi-Malingreau, J. P. (1986), Global vegetation in dynamics, satel-ces at intermediate (100 m2 to 15 km2) length scales. J. Geo-lite observation over Asia. Int. J. Remote Sens. 7:1121–1146.phys. Res. 97:19,033–19,059.Merril, E. H., Bramble-Brodahl, M. K., Marrs, R. W., and
Sellers, P. J., Los, S. O., Tucker, C. J., et al. (1994), A globalBoyce, M. S. (1993), Estimation of green herbaceous phyto-18318 NDVI data set for climate studies. Part 2: The gener-mass from Landsat MSS data in Yellowstone National Park.ation of global fields of terrestrial biophysical parameters
J. Range Manage. 46:151–157. from NDVI. Int. J. Remote Sens. 15:3519–3545.Myneni, R. B., and Williams, D. L. (1994), On the relationship Sellers, P. J., Meeson, B. W., Halls, F. G., et al. (1995), Re-
between FAPAR and NDVI. Remote Sens. Environ. 50: mote sensing of the land surface for studies of global200–211. change: models-algorithms-experiments. Remote Sens. Envi-
Ode, D., Tieszen, L. L., and Lerman, J. C. (1980), The sea- ron. 51:3–26.sonal contribution of C3 and C4 plant species to primary pro- Sellers, P. J., Dickinson, R. E., Randall, D. A., et al. (1997),duction in a mixed prairie. Ecology 61:1304–1311. Modeling the exchanges of energy, water, and carbon be-
Parton, W. J., Schimel, D. S., Cole, C. V., and Ojima, D. S. tween continents and the atmosphere. Science 275:502–509.(1987), Analysis of factors controlling soil organic matter Spanner, M. A., Pierce, L. L., Running, S. W., and Peterson,levels in Great Plains grasslands. Soil Sci. Soc. Am. J. 51: D. L. (1990). The seasonality of AVHRR data of temperate1173–1179. coniferous forests: relationships with leaf area index. Remote
Paruelo, J. M., and Lauenroth, W. K. (1995), Regional patterns Sens. Environ. 33:97–112.of normalized difference vegetation index in North Ameri- SPSS (1988), ISPSS/PC1 V2.0 Base Manual, SPSS Inc., Chicago.can shrublands and grasslands. Ecology 76(6):1888–1898. Teiszen, L. L., and Dellting, J. (1983), Productivity of grassland
and tundra. In Encyclopedia of Plant Physiology (O. L.Paruelo, J. M., Aguiar, M. R., Golluscio, R. A., Leon, R. J. C.,Lange, P. S. Nobel, C. B. Osmond, and H. Ziegler, Eds.)and Pujol, G. (1993), Environmental controls of NDVI dy-Springer-Verlag, Berlin, pp. 173–203.namics in Patagonia based on NOAA-AVHRR satellite data.
Teiszen, L. L., Reed, B. C., Bliss, N. B., Wylie, B. K. and De-J. Veg. Sci. 4:425–428.jong, D. D. (1997), NDVI, C3 and C4 production, and distri-Potter, C. S., Randerson, J. T., Field, C. B., et al. (1993), Ter-butions in Great Plains grassland land cover classes. Ecol.restrial ecosystem production: a process model based onAppl. 7:59–78.global satellite and surface data. Global Biogeochem. Cy-
Townshend, J. R. G., Justice, C. O., and Kalb, V. T. (1987),cles 4:811–841.Characterization and classification of South American landQi, J., Chehbouni, A., Huete, A. R., Kerr, Y. H., and Soroos-cover types using satellite data. Int. J. Remote Sens. 8:hian, S. (1994), A modified soil adjusted vegetation index.1189–1207.Remote Sens. Environ. 48:199–126.
Tucker, C. J. (1979), Red and photographic infrared linearReed, B. C., Brown, J. F., VanderZee, D., Loveland, T. R.,combination for monitoring vegetation. Remote Sens. Envi-Merchant, J. W., and Ohlen, D. O. (1994), Variability ofron. 8:127–150.land cover phenology in the United States. J. Veg. Sci.
Tucker, C. J., and Sellers, P. J. (1986), Satellite remote sensing5:703–714. of primary production. Int. J. Remote Sens. 7:1395–1416.
Reed, B. C., Loveland, T. R., and Tieszen, L. L. (1996), An Tucker, C. J., Townshend, J. R. G., and Goff, T. E. (1985),approach for using AVHRR data to monitor U.S. Great Africa land-cover classification using satellite data. SciencePlains grasslands. Geocarto Int. 11(3):1–10. 227:369–375.
Rosenberg, N. J., Blad, B. L., and Verma, S. B. (1983), Micro- Turner, C. L., Seastedt, T. R., Dyer, M. I., Kittel, T. G. F.,climate: The Biological Environment, Wiley, New York. and Schimel, D. S. (1992), Effects of management and to-
Running, S. W., and Coughlan, J. C. (1988), A general model pography on the radiometric response of a Tallgrass prairie.of forest ecosystem processes for regional applications. I. J. Geophys. Res. 97:18,855–18,866.Hydrologic balance, canopy gas exchange and primary pro- Wiegand, C. L., Richardson, A. J., and Nixon, P. R. (1986),duction processes. Ecol. Model. 42:125–154. Spectral components analysis: a bridge between spectral ob-
Running, S. W., and Nemani, R. R. (1988), Relating seasonal servations and agrometeorological crop models. IEEE Trans.patterns of the AVHRR vegetation index to simulated pho- Geosci. Remote Sens. GE-24(1):83–89.tosynthesis and transpiration of forests in different climates. Wilhite, D. A., and Hubbard, K. G. (1990), Climate. In An
Atlas of the Sand Hills, Resource Atlas No. 5a (A. Bleed andRemote Sens. Environ. 23:347–367.

Climate Forcing and Time-Integrated NDVI of U.S. Grasslands 37
C. Flowerday, Eds.), Conservation and Survey Division, In- Yang, W., Yang, L., and Merchant, J. W. (1997), An assessmentof AVHRR/NDVI-ecoclimatological relations in Nebraska,stitute of Agriculture and Natural Resources, University of
Nebraska, Lincoln), pp. 17–28. U.S.A. Int. J. Remote Sens. 10:2161–2180.Yoder, B. J. and Waring, R. H. (1994), The normalized differ-Wylie, B. K., DeJong, D. D., Tieszen, L. L., and Biondini,
M. E. (1996), Grassland canopy parameters and their rela- ence vegetation index of small Douglas-fur canopies withvarying chlorophyll concentrations. Remote Sens. Environ.tionship to remotely sensed vegetation indices in the Ne-
braska Sand Hills. Geocarto Int. 11(3):39–52. 49:81–91.
Related Documents