Chapter 5 An Analysis of Financial Performance RONW and Intra Company Comparison MVA and Intra Company Comparison EVA and Intra Company Comparison Inter-Company Analysis with RONW, MVA and EVA RONW and Inter Company Comparison MVA and Inter Company Comparison EVA and Inter Company Comparison Industry wise Classification and Analysis with RONW, MVA and EVA • RONW and Inter Industry Analysis • MVA and Inter Industry Analysis • EVA and Inter Industry Analysis Intra-Industry Analysis with RONW, MVA and EVA • Observations • Regression Analysis Conclusions

Welcome message from author
This document is posted to help you gain knowledge. Please leave a comment to let me know what you think about it! Share it to your friends and learn new things together.
Transcript

Chapter 5
An Analysis of Financial Performance
RONW and Intra Company Comparison
MVA and Intra Company Comparison
EVA and Intra Company Comparison
Inter-Company Analysis with RONW, MVA and EVA
RONW and Inter Company Comparison
MVA and Inter Company Comparison
EVA and Inter Company Comparison
Industry wise Classification and Analysis with RONW, MVA and EVA
· RONW and Inter Industry Analysis
· MVA and Inter Industry Analysis
· EVA and Inter Industry Analysis
Intra-Industry Analysis with RONW, MVA and EVA
· Observations
· Regression Analysis
Conclusions

This chapter deals with the analysis of companies and at industry
level using tools like RONW, MVA and EVA for selected companies of
post and pre merger period is given in Table 5.1.
1. RONW AND INTRA COMPANY COMPARISON
The technique of cluster analysis has been followed for the next
measure of value addition, RONW for different group of companies.
Group I
A set off sixteen companies in this case have shown improvement
in profitability in terms of RONW in the four post merger years. The
companies which have shown marked improvement include NLC Nalco
India limited, Jindal Poly Films Limited, and Jubilant Organosys
Limited.
There are other companies which have shown an increasing trend,
though not very significant. These include Emami Paper Mills Limited.
Group II
Twelve companies get categories in this group showing decrease in
profits according to the traditional measure of value addition in the four
post merger years. Companies have shown significant deterioration in
profitability in post-merger period includes BPL Limited, Dharamsi
Morarji Chemicals Co Limited, and DLF Limited.
320
Some other companies’ shows decrease in profitability over the
post merger years which is however; not very significant includes B&A
Limited, Shyam Telecom Limited and Tata Coffee Limited.
Group III
A majority of Twenty eight belongs to this group indicating no
impact of mergers on profitability in subsequent post-merger years.
Some companies have shown marked improvement in profitability from
first to second year which gets lost in the third year. To name a few
companies all belong to this category. TRF Limited, Bayer Crop Science
Limited PSL Limited.
Further, there are few companies which have shown no trend in
post merger years thus signifying no effect, whatsoever of mergers on
profitability.
2. MVA AND INTRA COMPANY COMPARISON
The observations with this measure of value addition are given in
Table 5.2.
Group I
This group includes only six companies indicate an increase in
value addition to shareholders in terms of their market’s assessment but
increase in most cases is very significant. Companies like all add
positive value to shareholders which has increased subsequently in post
merger years. In a grup remaining companies shows value addition in
324

first post-merger years in negative but has decreased each year
indicating an improvement in value addition. This group includes
Twilight Ii-taka pharma Limited, Matrix Laborites, Hindustan Unilever
Limited, Roto Pumps Limited, Rossell Tea Limited.
Group II
This group has Ten companies again exhibit the same trend. Few
companies started with positive value in first year which reduced
subsequently. Some companies started with negative values which
increased in post-merger years. This group includes companies like Dr
Reddys Laboratories, Tata Coffee Limited, Today’s Writing Products
Limited.
Group III
The last group with maximum number of twenty three companies
shows that mergers have no effect on market’s assessment of company’s
value thus not showing any clear increasing or even decreasing trend in
post- merger years. The companies included in this list are GMR
Industries Limited, Sical Logis,tics Limited, Bright Brothers Limited,
Zenith Computers.
3. EVA AND INTRA COMPANY COMPARISON
EVA has been computed for all sample companies for three post
merger years to see whether shareholder value has improved in the
328

post-merger period i.e. has shareholder value addition improved in each
passing year after the merger since it is generally believed that it takes a
year or to start getting these benefits. The year-wise analysis has been
summarized in Table 5.3.
Group I
The set of twelve companies belonging to this group show an
increasing trend of shareholder value addition in the post-merger period
by showing decreased value erosion from first post-merger year to the
forth indicating an improvement in value addition in the subsequent
years. like Zenith Infotech Limited, Arvind Products Limited, NLC
Nalco India Limited, IFGL Refractories.
Group II
In this group of ten companies indicating decrease in v~lue addition
from first postmerger year or increase in negative value of EVA in
subsequent years of merger. Khaitan Fertilizer Limited, Hindustan
Organic Chemicals Limited, Gulf Oil Corporation Limited.
Group III
Sample companies in this group, indicating no influence of mergers
on shareholders’ value addition has the maximum number of thirty four
companies belonging to it. There are companies which have shown
significant deterioration in the second post merger year itself with
329

improvement in the third year. Companies includes in this group are
Ratnamani Metal & Tubes Limited, Max India Limited, Balaramapur
Chini Mills Limited, Finolex Cables Limited.
Table 5.4
Intra Company Analysis with Value Added Metrics: Summary of Results
Group RONW MVA EVA
No. ofCompanies
% No. ofCompanies
% No. ofCompanies
%
Group I 16 28.27 23 41.07 12 21.43
Group II 12 21.43 10 17.86 10 17.86
Group III 28 50.00 23 41.07 34 60.71
Total 56 100 56 100 56 100
Inter-Company Analysis with RONW, MVA and EVA
After post-merger assessment of value addition within companies,
an investigation has been conducted to measure variations across
companies for all the three value added metrics for average post merger
period. In this case also, technique of cluster analysis has been applied
by:
(1) Ranking the companies by all three value added metrics
separately in descending order.
(2) Classifying companies with similar values into broad clusters
or groups.
(3) Examining these groups and explaining them.
333

The table 5.5 gives the average value addition in the post merger
period by all three value added metrics, namely EVA, RONW and MVA
along with their respective rankings. A perusal of the rankings in the
table reveals the following groups:
Group I : Companies with Value Addition in Post-Merger Years
This group consists of with positive values indicating that such
companies have added to shareholders value in the post merger period.
Group II : Companies with Value Erosion in Post-Merger Years
This group consists of companies with negative value indicating
that these companies have eroded value in the post-merger period.
334

RONW and Inter Company Comparison
This empirical analysis study has been done with the traditional
measure of profitability (RONW) and the following observations are
made.
Group I
Grouping companies according to traditional measure of
shareholder wealth creation (RONW) resulted in 43 companies (rank
1-43) falling in the first group with the range of 218.70 crores (by
Pidilite Industries, which got the first rank) to 0.88 crores (by ION
Exchange Co. Ltd. with 43 rank). In between, again there are companies
like Dr. Reddy’s Laboratories Ltd., Gulf Oil Corporation Ltd., Hindustan
Unilever Ltd., Hindustan Organic Chemicals Ltd. All showed positive
returns to shareholders.
Group II
13 companies (from 44 to 56) belonged to this group which
revealed negative value for average post merger period ranging from
-0.30 crores (by carol Info Services) to 308.08 crores (by Bhilwara
Spinners). In between, there were companies like Arvind Products. Ltd.,
Bright Brothers Ltd., Rossell Tea Ltd, Roto Pumps Ltd. all of which has
resulted in loses for their shareholders in the post merger period.
339
MVA and Inter Company Comparison
This measure of market’s assessment of value addition to
shareholders in the post merger period has again grouped sample
companies into following two categories:
Group I
18 Companies from rank 1 to 18 belong to this group with positive
shareholder value addition ranging from 1151.94 crores ( by Hindustan
Unilever Ltd.getting the first rank) to 0.16 crores (by Shayam Telecom
Ltd.). Some other companies which have added to shareholder value
include NLC Nalco Limited, Bayer crposcience Ltd., Tata Infotech Ltd. (
merged),Matrix Laboratories Ltd., etc.
Group II
From 19 to 56 fall in this category of value erosion as a result of
merger as per market’s assessment in post merger period. The values
range from -0.67crores (by Hindustan Organic Chemicals Ltd.) to -86.71
crores (by Arvind Products Ltd.) companies like Areva T&D India Ltd.,
Rossell Tea Ltd., SRHHL Industries Ltd., DLF Ltd., etc all fall in this
category.
EVA and Inter Company Comparison
340

Average economic value added (EVA) has been computed for the
post merger period for all selected companies to see which companies
have added value for their shareholders after mergers and which have
destroyed it. Following classification has been done based on empirical
results.
Group I
This group consists of only 8 companies (by rank 1 to 8) only out
of the companies selected which have revealed positive value addition in
terms of EVA. The shareholder value addition .has been in the range of
29.42 crores (by Hindustan Unilever Ltd., which got first rank) to 1.08
crores (by Jubilant Organosys Ltd., which got 8 rank). In between, there
were other companies like Matrix Laboratories Ltd., Sun Pharmaceutical
Industry Ltd., Gulf Oil Corporation Ltd., Gujarat Perstorp Elctronics
Ltd., etc.
Group II
All rest of the companies from rank 9 to 56 belong to this group
with the negative value addition in the post merger period. The range of
value erosion has been from -0.41 crores to (By berger paints Ltd.) to
tune of -1080.89 crores (by Emami Paper Mills Ltd.). In between there
are companies like B&A Ltd., BPL Ltd., NHN Corporation Ltd., Dr.
Reddy’s Laboratories Ltd., etc. which have resulted in value erosion in
the post merger period.
341

The summary of results of inter company analysis with these value
added metrics is presented below in Table 5.6.
Table 5.6
Inter Company Analysis with Added Metrics; Summary of Results
Industry wise Classification and Analysis with RONW, MVA and
EVA
An attempt has been made to make inter industry comparison of
post merger performance of selected companies in terms of value added
metrics: RONW, MVA and EVA. Industry wise classification has been
done by all fifty six companies into ten sub groups. Measuring and
analyzing performance of merged companies at industry level gives
useful insight. The industrial variations in value added metrics has also
been analyzed using cluster analysis by:
1. Ranking industries by all these metrics in descending order.
2. Classifying industries with similar values into broad groups.
3. Examining these groups and explaining them.
342

The below table gives the average aggregate value addition in the
post merger period by all the industries by all three value added metrics,
namely RONWS, MVA and EVA along with their respective ranking.
Perusals of ranking in Table 5.7 reveal the following two distinct groups.
RONW and Inter Industry Analysis
Same analysis has been carried out with this traditional measure of
profitability and the following observations have been made.
Group I
With this traditional measure of profitability of shareholder value
addition (RONW), 9 industries (from rank l to 9) get categorized in this
group with positive values ranging from 73.72 crores (by Tading
Industries, With first rank) to 1.33 crores (by Tea-coffee Industries) other
industries includes Chemicals and Petrochemicals, Electric, Electronics,
Computer-hardware all have resulted in gains for shareholders in post
merger period.
Group II
The only remaining industry is Textiles with losses of -114.06
crores in post merger period get categorized in this group.
MVA and Inter Industry Analysis
This measure of market’s assessment of value addition to
shareholders has again grouped all industries in to following two
categories.
344

Group I
5 Industries (from rank 1 to 5) gets qualified in this group with
positive shareholder value addition in the post merger period ranging
from 160.36 crores (by Pharmaceutical Industries, with the first rank) to
20.00 crores (by Fertilizers Industries) Than there are other industries
adding to shareholder value which includes Chemicals &
petrochemicals, Trading, etc.
Group II
Remaining 5 industries resulted in negative values for shareholders.
The range of value erosion is -4.88 crores (by packing industry) to
-42.06 crores (by textile industry).
EVA and Inter Industry Analysis
Average EVA has been calculated for for each industry after
grouping all selected companies into - groups to see which industries
have resulted in value addition to their shareholders after mergers and
which have destroyed it. The following results have emerged.
Group I
This group consists of only one industry namely pharmaceutical.
The positive shareholder value addition in the average post merger
period is 0.80 crores.
Group II
345
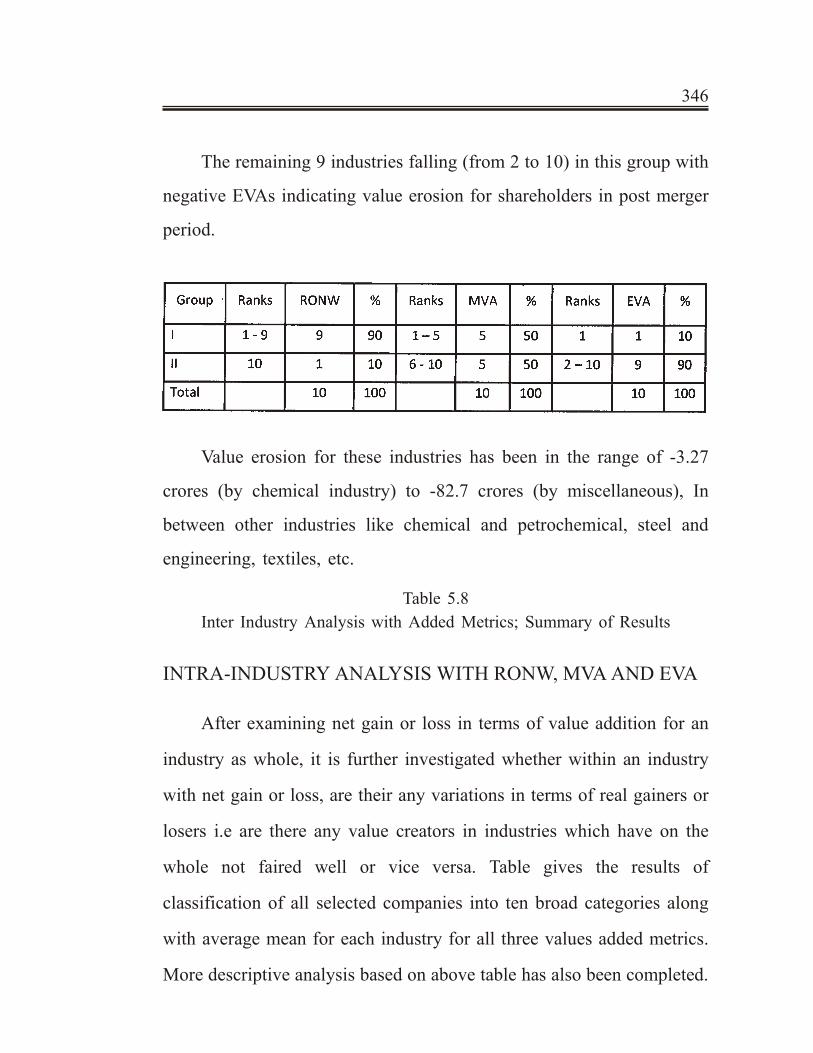
The remaining 9 industries falling (from 2 to 10) in this group with
negative EVAs indicating value erosion for shareholders in post merger
period.
Value erosion for these industries has been in the range of -3.27
crores (by chemical industry) to -82.7 crores (by miscellaneous), In
between other industries like chemical and petrochemical, steel and
engineering, textiles, etc.
Table 5.8
Inter Industry Analysis with Added Metrics; Summary of Results
INTRA-INDUSTRY ANALYSIS WITH RONW, MVA AND EVA
After examining net gain or loss in terms of value addition for an
industry as whole, it is further investigated whether within an industry
with net gain or loss, are their any variations in terms of real gainers or
losers i.e are there any value creators in industries which have on the
whole not faired well or vice versa. Table gives the results of
classification of all selected companies into ten broad categories along
with average mean for each industry for all three values added metrics.
More descriptive analysis based on above table has also been completed.
346

For this purpose correlation analysis has been used to establish the
relationship between these three values added metrics within industry to
get an insight into the variation in the performance vis-a-vis three
metrics. Results of correlation between various values added metrics
RONW, MVA and EVA for all industries are summarized in Table 5.9:
OBSERVATIONS
Chemicals and Petrochemicals
Out of the sample companies selected for the study there are eight
companies has undergone for merger during 99-00 in Chemicals and
Petrochemicals industries. In respect of traditional measure RONW in
this industry are relatively stable with average 42.57 with few extreme
gainers or losers.
In respect of value addition in terms of market assessment most of
the companies in this industry have been gainers in post merger period
with an average of 51.15 crores. The average value addition in terms of
EVA for all the companies in post merger period is resulted in value
erosion with on an average -3.27 crores. However, companies like
Hindustan Fluoro Carbans Ltd.and Jubilant Organosys Ltd. in post
merger period with contribution of 10.05 crores and 1.08 crores
respectively.
The correlation coefficients of this between RONW and MVA is
0.27 and 0.22 for post and pre merger period, while that of between
351

MVA and EVA 0.67 & 0.47 and between RONW and EVA is 0.12 and
0.41.
Electric, Electronics, Com puter- Hardware
Out of the sample companies selected for the study there are nine
companies has undergone for merger during 99-00 in electric,
electronics and computer-hardware industries. In respect of traditional
measure RONW in this industry are relatively positive with average 4.59
with few extreme losers.
In respect of value addition in terms of market assessment most of
the companies in this industry have been losers in post merger period
with an average of -17.11 crores. The average value addition in terms of
EVA for all the companies in post merger period is resulted in value
erosion with on an average -104.76 crores.
The correlation coefficients of this between RONW and MVA is
0.59 and 0.32 for post and pre merger period, while that of between
MVA and EVA 0.54 and -0.01 and between RONW and EVA is 0.91 and
-0.31.
Fertilizers, Pesticides
There are three companies has undergone for merger during 99-00
in fertilizers and pesticides industries. In respect of traditional measure
RONW in this industry are relatively positive with average 3.49.
353

In respect of value addition in terms of market assessment all the
companies in this industry have been gainers in post merger period with
an average of 20.00 crores. The average value addition in terms of EVA
for all the companies in post merger period is resulted in value erosion
with on an average -7.71 crores.
The correlation coefficients of this between RONW and MVA is
0.98 and -0.70 for post and pre merger period, while that of between
MVA and EVA 0.91 and 0.53 and between RONW and EVA is 0.80 and
0.24.
Packaging
There are four companies has undergone for merger during 99-00
in packaging industries. In respect of traditional measure RONW in this
industry are relatively poor with average 5.44.
In respect of value addition in terms of market assessment all the
companies in this industry have been losers in post merger period with
an average of -4.88 crores. The average value addition in terms of EVA
for all the companies in post merger period is resulted in value erosion
with on an average -11.42 crores.
The correlation coefficients of this between RONW and MVA is
0.60 and 0.39 for post and pre merger period, while that of between
MVA and EVA 0.85 and 0.33 and between RONW and EVA is 0.91 and
0.61.
354
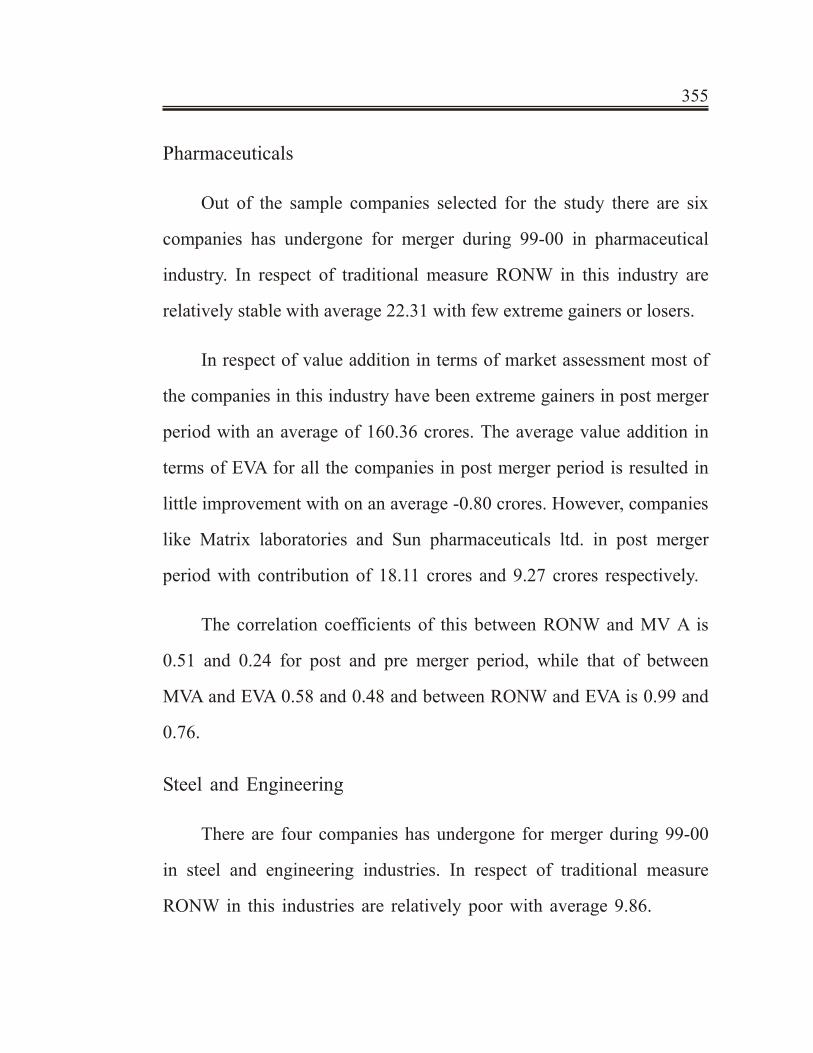
Pharmaceuticals
Out of the sample companies selected for the study there are six
companies has undergone for merger during 99-00 in pharmaceutical
industry. In respect of traditional measure RONW in this industry are
relatively stable with average 22.31 with few extreme gainers or losers.
In respect of value addition in terms of market assessment most of
the companies in this industry have been extreme gainers in post merger
period with an average of 160.36 crores. The average value addition in
terms of EVA for all the companies in post merger period is resulted in
little improvement with on an average -0.80 crores. However, companies
like Matrix laboratories and Sun pharmaceuticals ltd. in post merger
period with contribution of 18.11 crores and 9.27 crores respectively.
The correlation coefficients of this between RONW and MV A is
0.51 and 0.24 for post and pre merger period, while that of between
MVA and EVA 0.58 and 0.48 and between RONW and EVA is 0.99 and
0.76.
Steel and Engineering
There are four companies has undergone for merger during 99-00
in steel and engineering industries. In respect of traditional measure
RONW in this industries are relatively poor with average 9.86.
355

In respect of value addition in terms of market assessment all the
companies in this industry have been without major change in post
merger period with an average of -32.61 crores. The average value
addition in terms of EVA for all the companies in post merger period is
resulted in value erosion with on an average -6.83 crores.
The correlation coefficients of this between RONW and MVA is
0.77 and 0.88 for post and pre merger period, while that of between MV
A and EVA 0.96 and 0.86 and between RONW and EVA is 0.84 and
0.99.
Textiles
There are three companies have undergone for merger during 99-00
in Textile industry. In respect of traditional measure RONW in this
industry is negative with average -114.06 In respect of value addition in
terms of market assessment most of the companies in this industry have
been extreme losers in post merger period with an average of -42.06
crores. The average value addition in terms of EVA for all the companies
in post merger period is resulted in value erosion with on an average
-7.67 crores.
The correlation coefficients of this between RONW and MVA is
-0.71 and 0.34 for post and pre merger period, while that of between
MVA and EVA 0.75 and -0.46 and between RONW and EVA is -0.06
and 0.68.
Tea-Coffee
356

There are three companies have undergone for merger during 99-00
in Tea-coffee industry. In respect of traditional measure RONW in this
industry is relatively stable with average 9.86. In respect of value
addition in terms of market assessment most of the companies in this
industry have been without major change in post merger period with an
average of 32.61 crores. The average value addition in terms of EVA for
all the companies in post merger period is resulted in value erosion with
on an average -6.83 crores.
The correlation coefficients of this between RONW and MVA is
0.79 and 0.44 for post and pre merger period, while that of between
MVA and EVA 0.90 and 0.84 and between RONW and EVA is 0.98 and
0.85.
Trading
There are two companies undergone for merger during 99-00 in
trading industry. In respect of traditional measure RONW and market
assessment in terms of MVA in this industry is relatively good positive
with average 73.72 and 32.78 respectively. The average value addition in
terms of EVA for all the companies in post merger period is resulted in
value erosion with on an average -29.78 crores.
The correlation coefficients of this between RONW and MVA is
1.00 and 1.00 for post and pre merger period, while that of between
MVA and EVA -1.00 and 1.00 and between RONW and EVA is -1.00
and 1.00.
357

Miscellaneous
There are fourteen companies undergone for merger during 99-00
in various industry like sugar, construction etc. In respect of traditional
measure RONW and market assessment in terms of MVA in this industry
is relatively positive with average 9.99 and 51.48 respectively. The
average value addition in terms of EVA for all the companies in post
merger period is resulted in value erosion with on an average -82.70
crores.
The correlation coefficient of this between RONW and MVA is
0.84 and 0.71 for post and pre merger period, while that of between
MVA and EVA 0.13 and 0.11 and between RONW and EVA is 0.18 and
0.26.
REGRESSION ANALYSIS
In order to analyze data of post and pre merger period a statistical
tool is useful and provides better understanding. To study the impact of
merger on shareholders value creation we have carried out the regression
analysis on Indian corporate sector.
Pre-Merger Model:
EVA = a b b b b bi i t i t i t i t i tDE CR GR OE PM+ + + + + +1 2 3 4 5, , , , ,
+ b b b b b e5 6 7 8 9ROCE ER RONW SG BIFRi t i t i t i t, , , ,+ + + + +
Post-Merger Model:
EVA = a b b b b bi i t i t i t i t i tDE CR GR OE PM+ + + + + +1 2 3 4 5, , , , ,
+ b b b b b e5 6 7 8 9ROCE ER RONW SG BIFRi t i t i t i t, , , ,+ + + + +
358

Where,
DE = Debt Equity Ratio
CR = Current ratio
GR = Gearing Ratio
OE = Operating Expense
PM = Profit Margin
ROCE = Return on Capital Employed
ER = Expense Ratio
RONW = Return on Net Worth
SG = Firm Acquired by Same Group
BIFR = Acquired firm was under BIFR
T = Period
a is intercept, b b1 2and are regression coefficients and e is the error.
359

Table 5.11
Independent and Dependent Variables
360
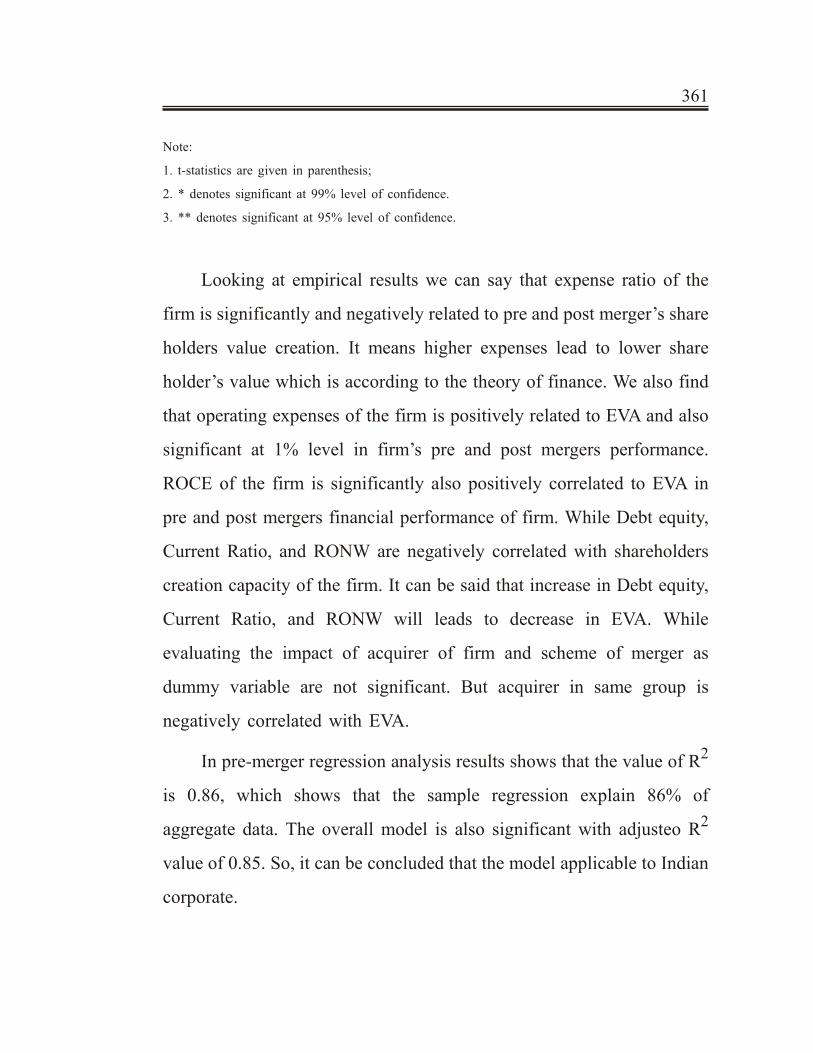
Note:
1. t-statistics are given in parenthesis;
2. * denotes significant at 99% level of confidence.
3. ** denotes significant at 95% level of confidence.
Looking at empirical results we can say that expense ratio of the
firm is significantly and negatively related to pre and post merger’s share
holders value creation. It means higher expenses lead to lower share
holder’s value which is according to the theory of finance. We also find
that operating expenses of the firm is positively related to EVA and also
significant at 1% level in firm’s pre and post mergers performance.
ROCE of the firm is significantly also positively correlated to EVA in
pre and post mergers financial performance of firm. While Debt equity,
Current Ratio, and RONW are negatively correlated with shareholders
creation capacity of the firm. It can be said that increase in Debt equity,
Current Ratio, and RONW will leads to decrease in EVA. While
evaluating the impact of acquirer of firm and scheme of merger as
dummy variable are not significant. But acquirer in same group is
negatively correlated with EVA.
In pre-merger regression analysis results shows that the value of R2
is 0.86, which shows that the sample regression explain 86% of
aggregate data. The overall model is also significant with adjusteo R2
value of 0.85. So, it can be concluded that the model applicable to Indian
corporate.
361

Regression result of post merger indicates the vale of R2 and
adjusted R2 value are 0.87 and 0.86 which is significant at 1% level. So
model is fit for study.
The classical finance theory said that firm’s shareholders value
creation is based on firms earning ability and firms return on its net
worth. On the basis of our regression research we have proved that the
firm’s shareholders value creation is highly dependent on Operating
expenses, Profit market, ROCE and Expense ratio.
CONCLUSIONS
In case of any business shareholders value maximization being
recognized as the most important goal, performance evaluation of fifty
six selected companies which have undergone mergers during the
2005-06 has been done using value added metrics EVA and MVA and the
traditional value added measure metric RONW. The following
conclusions have been drawn based on empirical results and their
analysis:
1. From the analysis of companies for four cross sectional post
merger years, it was found that 81 % of companies resulted in value
erosIon in terms of EVA with decreasing or no trend over the four
merger years. Only 19% of sample companies revealed positive value
addition with increasing trend in post merger years.
2. The traditional measure of estimation of value for shareholders,
namely RONW revealed results with EVA. Only 28% companies
362

showed increasing trend of value in post merger period. The remaining
72% of companies failed to deliver value after mergers.
3. With regards to market’s assessment of company’s value in post
merger period, 67% of companies revealed positive post merger values
in the first year indicating that companies gained from mergers in terms
of appreciation in their stock value. Only 14% of these companies
however, exhibited an increasing trend over four years which was very
significant. Number of companies benefited maximum in terms of share
holder value appreciation in the post merger period. But in most of the
companies, however, appreciation in stock value gained immediately
after mergers was lost in the subsequent years.
4. Inter companies analysis carried on with average post merger
computed values of EVA revealed value erosion in case of 81 % of
companies. Only 19% of companies gained values for their shareholders,
the important ones being Berger paints Ltd, Emami Paper Mills Ltd.,
B&A Ltd., BPL Ltd., NHN Corporation LTD., Dr. Reddy’s Laboratories
Ltd., etc. which have resulted in value erosion in the post merger period.
This indicates that the null hypothesis that mergers do not result in value
agdition to shareholders has been accepted and alternate hypothesis that
merger result in value addition to shareholders has been rejected. As
regards the other measure of value addition, i.e. MVA, the result was
almost 50%.
5. The result of inter company analysis with RONW showed all
most opposite findings. As per this measure, 77% of companies added
363

value for their shareholders after mergers indicating that mergers are
profitable. Only 23% of companies resulted in value erosion.
6. Results of inter industry analysis revealed that most of industries
on the whole (9 out of 10) lost shareholder value in the post merger
period in terms of EVA. Only one industry gained positive value for
their shareholders. However in terms of other value added metrics, MVA
and traditional measure RONW, the results were reverse Pharmaceutical
Industries, Fertilizers Industries and other industries adding to
shareholder value which includes Chemicals & petrochemicals, Trading,
etc. industries gained value in terms of appreciation in post merger
period.
7. Merger has been spread over various industries. Over all, as
compared to other industry groups, companies in chemicals,
petrochemicals, electric and electronics have had relatively higher
involvement in merger activity.
8. These results are also corroborated by correlation co-efficient
calculated between these measures for all industries separately. In
industries like steel, engineering, tea and coffee shows significantly high
correlation has been revealed between the new values added metric EVA
and traditional metric RONW. For other industries this relationship is
low and insignificant As far as association between economic efficiency
of industry and its market assessment is concerned, in case of industries
like chemical, petrochemicals, electric, electronics and computer
industries it has emerged significant. For the rest of the industries
364

economic performance does not seem to drive market value. However,
no significant correlation was observed between MVA and RONW in
most of the industries.
9. Thus, in this chapter, post-merger performance of sample merged
companies has been evaluated in terms of shareholders value additions.
*****
365
Related Documents