An analysis of cloud-to-ground (CG) strokes in China during 2010-2013 and the spatial distribution of CG with severe thunderstorm wind LAC S Xin-Lin Yang and Jian- Hua Sun

An analysis of cloud-to-ground (CG) strokes in China during 2010-2013 and the spatial distribution of CG with severe thunderstorm wind LAC S Laboratory.
Dec 19, 2015
Welcome message from author
This document is posted to help you gain knowledge. Please leave a comment to let me know what you think about it! Share it to your friends and learn new things together.
Transcript

An analysis of cloud-to-ground (CG) strokes in China during 2010-2013 and the spatial
distribution of CG with severe thunderstorm wind
LACS
Xin-Lin Yang and Jian-Hua Sun
Contents
Introduction Introduce Chinese CG Lightning
Detection Network Variation of CG lightning
frequency and spatial density distribution
Spatial distribution of CG days and daily CG density
Spatial distribution of CG with severe thunderstorm wind
Conclusions
LACS

In USA the highest annual densities is along the Gulf of Mexico coast (Orville et al., 2011),but the largest density in per thunderstorm day is in the mid Amercia (Mäkelä et al., 2011).
Orville et al., 2011
Mäkelä et al., 2011
In China there are some research on the spatial of lightning (including CG and cloud-to-cloud lightning) from satellite (Ma et al.,2005;2007), while a few papers referring to the climatological CG lightning for the whole China has been found.
Contents
Introduction Introduce Chinese CG
Lightning Detection Network Variation of CG lightning
frequency and spatial density distribution
Spatial distribution of CG days and daily CG density
Spatial distribution of CG with severe thunderstorm wind
Conclusions
LACS
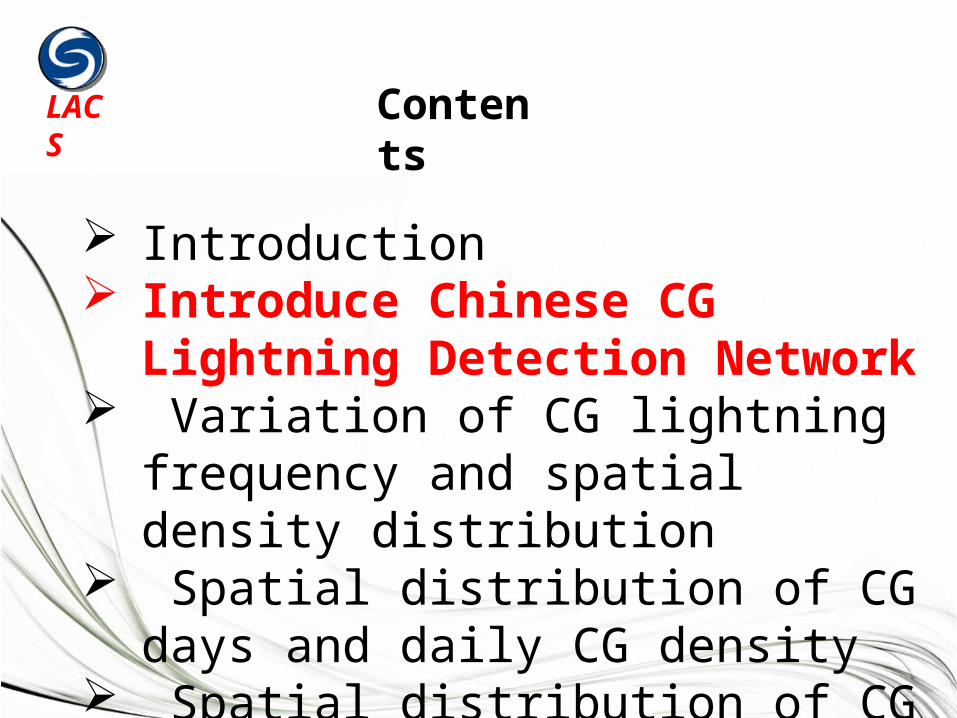
The network is consist of 357 sensors ( gray dots) and contributes a detection efficiency between 80% to 90% . The shading area is defined by any flashes locating within 300 km.
Chinese CG Lightning Detection Network
Yang Xinlin and Sun Jianhua, An analysis of cloud-to-ground lightning in China during 2010-2013 , Wea. Forecasting, submitted.
Contents
Introduction Introduce Chinese CG Lightning
Detection Network Variation of CG lightning
frequency and spatial density distribution
Spatial distribution of CG days and daily CG density
Spatial distribution of CG with severe thunderstorm wind
Conclusions
LACS

Annual variation of CG (PCG 、 NCG) frequency and PPCG
NCG: negative CG; PCG: positive CG; PPCG: percentage of PCG
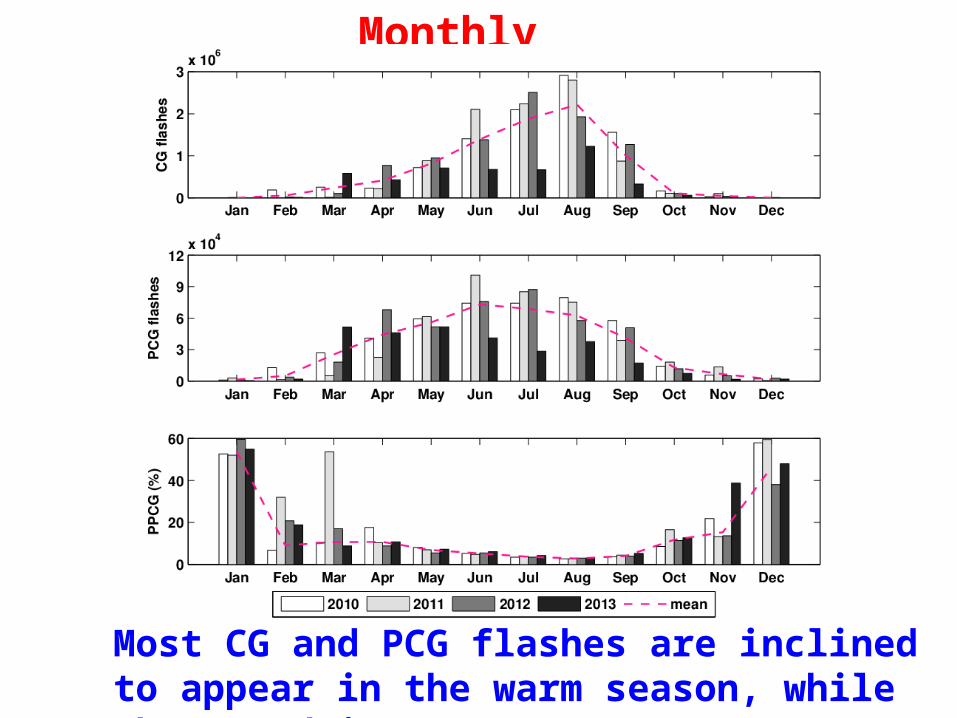
Monthly variation
Most CG and PCG flashes are inclined to appear in the warm season, while the trend is contrary to PPCG

Spatial distribution of the average CG density for each season.Units: flasheskm-
2per three months.
Spring (Mar.-May)
Summer (Jun.-Aug.)
Autumn (Sep.-Nov.)
Winter (Dec.-Feb.)
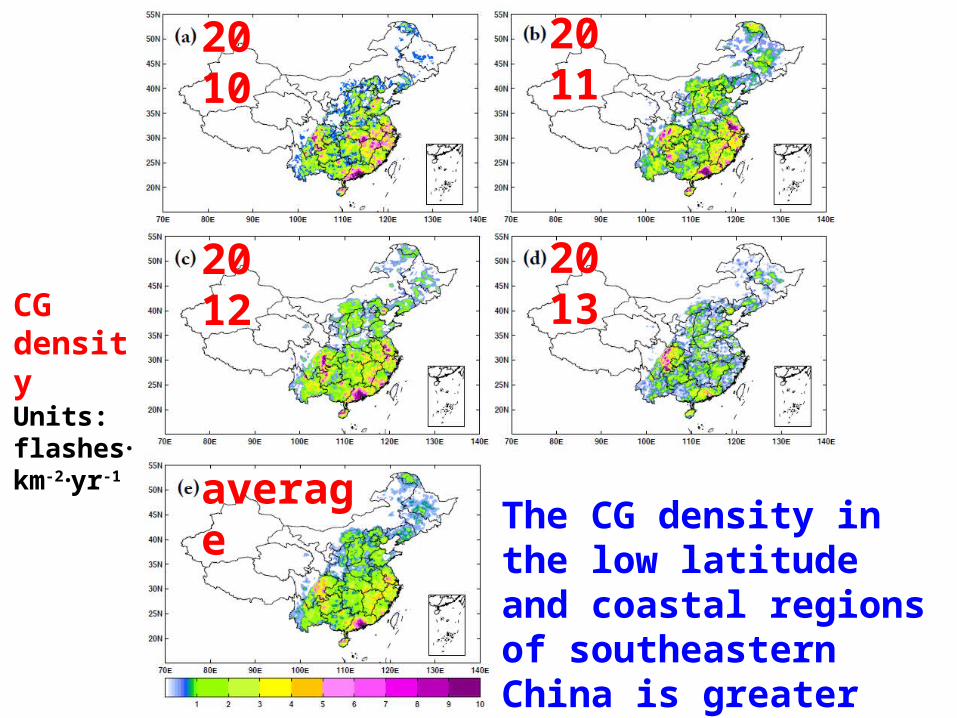
CG density Units: flasheskm-2yr-1
2010
2011
2012
2013
average
The CG density in the low latitude and coastal regions of southeastern China is greater than that in the high latitude and arid regions of northwestern China.

PCG density Units: flasheskm-2yr-1
2010
2011
2012
2013
average The spatial patterns
are similar to CG density, but the values are very different. CG density appears to be an order of magnitude larger than PCG density.
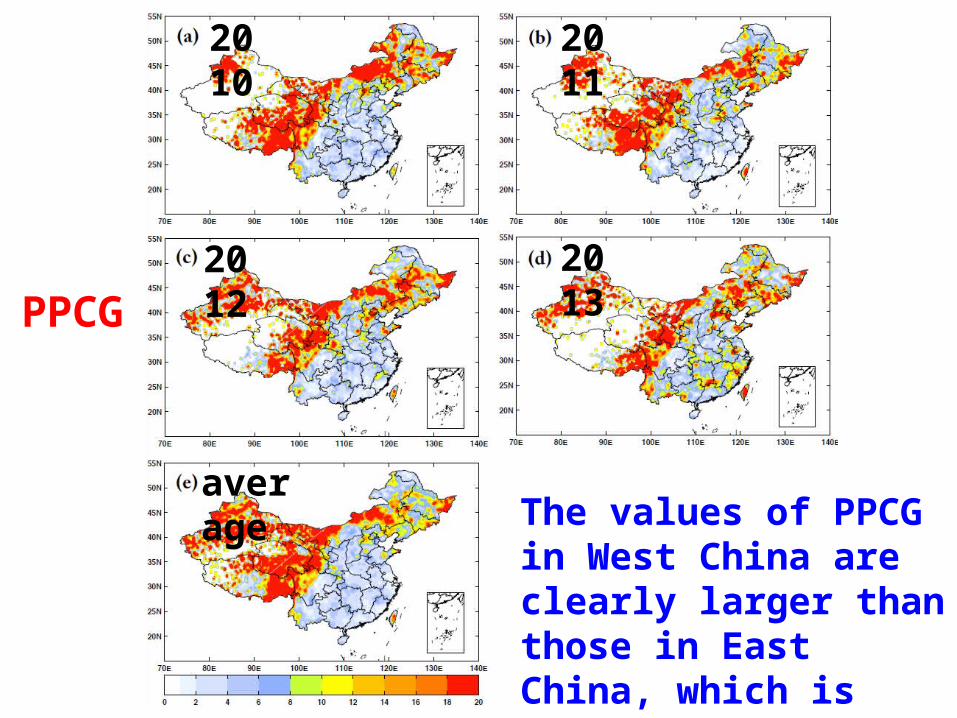
PPCG
2010
2011
2012
2013
average The values of PPCG
in West China are clearly larger than those in East China, which is different from the pattern found for CG density and PCG density
Why PPCG in plateau is larger?• Qie et al. (2002) indicated that weak
convective storms are beneficial for the generation of PCG flashes, because the Cloud-to-Cloud lightning generally happens at the bottom of thunderstorms in the Tibetan Plateau and the negative charge in the middle of storms neutralizes the positive charge at the bottom.
• The instrumentation effects perhaps contribute to high PPCG being recorded at the edge of the network.
LACS

Contents
Introduction Introduce Chinese CG Lightning
Detection Network Variation of CG lightning
frequency and spatial density distribution
Spatial distribution of CG days and daily CG density
Spatial distribution of CG with severe thunderstorm wind
Conclusions
LACS

Some definitions
A CG lightning day is a day during which at least a CG flash is detected. while thunderstorm day means that one heard or saw the lightning at a reporting station, but the lightning may be cloud-to-cloud (CC) or intra-cloud, not the CG lightning.
Daily CG density is defined as the number of CG lightning in per CG lightning day over per square kilometer.
LACS

CG lightning days Units: day
2010
2011
2012
2013
average CG lightning days
in southeastern China are more frequent than in northwestern China.

daily CG density Units:flasheskm-2day1.
2010
2011
2012
2013
average
The daily CG density in eastern China is larger than in western China, but the daily gap between southern China and northern China is less than that for the mean annual CG density.

Contents
Introduction Introduce Chinese CG Lightning
Detection Network Variation of CG lightning
frequency and spatial density distribution
Spatial distribution of CG days and daily CG density
Spatial distribution of CG with severe thunderstorm wind
Conclusions
LACS

1
2
Region 1: North China(861 cases)Region 2: South China(331 cases)
Spatial distribution of severe thunderstorm wind (STW>=17m/s)
Yang, X.-L., and J.-H. Sun, 2014: The characteristics of cloud-to-ground lightning activity with severe thunderstorm wind in South and North China, Atmos. Oceanic. Sci. Lett., 7, 571–576, doi:10.3878/AOSL20140046.
(a)
(b)

The position of severe thunderstorm wind
Cloud-to-ground lighting
Pick out the CG in the 2o×2o box whose center located where the STW happened from half an hour before STW occurring to half an hour after STW appearing .

The CG data is divided into six periods. It means that every period includes a ten-minute CG data.
-30 -10 10-20 20 30
The time of STW happening
30 minutes 30 minutes

The spatial distribution of CG (shaded) and PCG density (black line) with STW during six periods in North China (units: flashes km-2 per 10 minutes). The black dots represent the position of the STW
-30
3020
-10-20
10
(units f.km-2.per 10 mins)

(units f.km-2.per 10 mins)
-30
20 30
-10-20
10
The spatial distribution of CG (shaded) and PCG density (black line) with STW during six periods in South China (units: flashes km-2 per 10 minutes). The black dots represent the position of the STW

• The total number of CG flashes and PPCG show no obvious change during 2010–2012, but a distinct decrease occurs in 2013. PPCG is clearly higher in 2013 than other three years. Most CG and PCG flashes are inclined to appear in the warm season, while PPCG in the cold season is considerably larger than in the warm season.
• The CG density in the low latitude and coastal regions of southeastern China is greater than that in the high latitude and arid regions of northwestern China. The spatial patterns for PCG are similar to CG density, but the values are very different. So is the pattern for daily CG density, while the daily gap between southern China and northern China is less than that for the mean annual CG density.
• The values of PPCG in West China are clearly larger than those in East China, which is different from the pattern found for CG density and PCG density. CG lightning days in southeastern China are more frequent than in northwestern China.
• The severe thunderstorm wind (STW) happen near the high value of CG and PCG . The CG’s high value with North China’s STW moves much faster than that in South China, while contrary to the growth of CG’s intensity .
Conclusions

Thank you!
LACS

Why PPCG in the cold season is considerably larger than in the warm season?• Thunderstorms principally occurring under synoptic-scale weather systems in the cold season are associated with high PPCG (Bentaey and Stallins, 2005; Zajac and Rutledge, 2001).
• The strong shear transforms the distribution of charge in the thundercloud, which causes a tendency for PCG flashes to occur in winter thunderstorms (Rakov and Uman, 2003; Williams, 2001).
LACS

Methods is used to select SWT from the serious weather reports • Select the wind with speed be larger 17 m/s;
• Then choose the wind whose occurrence is associated with CG lightning;
• Third, delete the wind without a strongest radar echo being less than 45 dBz.
• Finally, delete the wind being affected by Typhoon.
LACS
Related Documents