96 IEEE ANTENNAS & PROPAGATION MAGAZINE APRIL 2017 1045-9243/17©2017IEEE Digital Object Identifier 10.1109/MAP.2017.2655574 Date of publication: 21 February 2017 T hree-dimensional (3-D) printing is finding applications across many areas and may be a useful technology for antenna fabrication for cube satellites (CubeSats). How- ever, the quality of an antenna produced using 3-D print- ing must be considered if this technology can be relied upon. We present gain and far-field pattern results for the feed horn of the radiometer payload of the CubeSat PolarCube. The corrugated feed horn is constructed from AlSi10Mg alloy and fabricated using powder bead fusion (PBF). Measurements were performed at the atmospheric oxygen line of 118.7503 GHz with the National Institute of Standards and Technology (NIST) Configurable Robotic Millimeter-Wave Antenna (CROMMA) Joshua A. Gordon, David R. Novotny, Michael H. Francis, Ronald C. Wittmann, Miranda L. Butler, Alexandra E. Curtin, Jeffery R. Guerrieri, Lavanya Periasamy, and Albin J. Gasiewski An All-Metal, 3-D-Printed CubeSat Feed Horn An assessment of performance conducted at 118.7503 GHz using a robotic antenna range. BACKGROUND IMAGE—©GRAPHIC STOCK

Welcome message from author
This document is posted to help you gain knowledge. Please leave a comment to let me know what you think about it! Share it to your friends and learn new things together.
Transcript

96 IEEE AntEnnAs & ProPAgAtIon MAgAzInE a p r i l 2 0 1 71045-9243/17©2017IEEE
Digital Object Identifier 10.1109/MAP.2017.2655574Date of publication: 21 February 2017
Three-dimensional (3-D) printing is finding applications across many areas and may be a useful technology for antenna fabrication for cube satellites (CubeSats). How-ever, the quality of an antenna produced using 3-D print-
ing must be considered if this technology can be relied upon. We present gain and far-field pattern results for the feed horn of the radiometer payload of the CubeSat PolarCube. The corrugated feed horn is constructed from AlSi10Mg alloy and fabricated using powder bead fusion (PBF). Measurements were performed at the atmospheric oxygen line of 118.7503 GHz with the National Institute of Standards and Technology (NIST) Configurable Robotic Millimeter-Wave Antenna (CROMMA)
Joshua A. Gordon, David R. Novotny, Michael H. Francis, Ronald C. Wittmann, Miranda L. Butler, Alexandra E. Curtin, Jeffery R. Guerrieri, Lavanya Periasamy, and Albin J. Gasiewski
An All-Metal, 3-D-Printed CubeSat Feed Horn An assessment of performance conducted at 118.7503 GHz using a robotic antenna range.
ba
ck
gr
ou
nd
ima
ge
—©
gr
ap
hic
sto
ck

97IEEE AntEnnAs & ProPAgAtIon MAgAzInE a p r i l 2 0 1 7
facility in Boulder, Colorado. A comparison of these measure-ments to theoretical predictions provides an assessment of the performance of the feed horn.
CubeSat OVERVIEWCubeSats offer an accessible and effective platform for a wide variety of space-based applications. Many off-the-shelf com-ponents are allowing fast prototyping of CubeSats and subsys-tems. Space-based applications benefit from millimeter waves (mm-waves) because shorter wavelengths allow for low dif-fraction, high bandwidth, and small form factor. Radiometers rely on mm-waves due to the ubiquity of passive blackbody emissions and the existence of atmospheric spectral features. Emerging applications, such as global Internet [1], are projected to use constellations of more than 1,000 CubeSats operating above 100 GHz for satellite-to-satellite and satellite-to-ground communications. Instrumentation and scientific needs often drive antenna designs that are not available off the shelf, as opposed to many other CubeSat components. Therefore, anten-nas must be designed on a case-by-case basis to achieve desired performance characteristics, such as gain and sidelobe level.
The ability to quickly prototype, fabricate, and test mm-wave antennas with the same ease as obtaining other off-the-shelf com-ponents would allow CubeSats to be used more readily. Recent advances in 3-D printing could enable antennas to be quickly cus-tom fabricated with complex structure to meet specific application needs. However, the quality and performance of printed antennas is not as well established as more traditional fabrication tech-niques, such as machining and electroforming. Fabrication toler-ances become more precise at high mm-wave frequencies. Edge fidelity of apertures, corrugated features, and so forth, can be challenging to reproduce because 3-D printing creates inherently rough surfaces. This could impact antenna performance. Depend-ing on the performance requirements, tradeoffs in antenna per-formance may be offset by the conveniences of 3-D printing. In this article, we present a comparison between the measured and theoretical gain and far-field pattern at 118.7503 GHz of an all-metal 3-D-printed conical corrugated feed horn antenna that will be used in the radiometer payload of the PolarCube CubeSat.
PolarCube SatEllItEPolarCube is a three-unit CubeSat satellite with a payload composed of an eight-channel, double-sideband 118.75-GHz scanning passive microwave temperature sounder, MiniRad [2], [3]. Radiometric observations near the 118.7503-GHz oxygen line are used to profile atmospheric temperature [4], [5]. The radiometer payload is made up of a spinning offset paraboloi-dal main reflector and a stationary conical corrugated feed horn. The main reflector is an off-axis ellipse with a projected circular aperture of 8 cm. The feed horn + reflector combina-tion is intended to have a gain of 38.03 dB. Figure 1 shows a cross-sectional view of the PolarCube optical front end with corrugated feed horn and deployable parabolic reflector shown in yellow. The feed horn couples radiation from the main reflec-tor to the radiometer receiver electronics. The spinning reflector configuration allows for maximum aperture area resulting in a
3-dB footprint size of 16 km for nadir observation. The reflector is supported by a single strut that minimizes sidelobe scattering and antenna temperature uncertainty.
FEEd HORn
3-D PRINTINGIn recent years, 3-D printing in plastic has led to the investiga-tion of dielectric microwave structures, such as reflectarrays [6] and bandgap materials [7]. Metal-coated 3-D-printed plastic antennas [8] have also been demonstrated for use in mm-wave and terahertz applications. The structural integrity offered by solid metal construction is advantageous, however, and 3-D printing of pure metal alloys is also being investigated for con-structing antennas. 3-D printing using metal alloys has many of the same advantages as polymer printing, with added structural integrity and possibly better longevity. It is not clear whether the fidelity obtainable with current metal printing technology is adequate for fabricating mm-wave antennas and what tradeoffs may need to be considered.
The PolarCube feed horn, shown in Figure 2, was made from the aluminum alloy AlSi10Mg and fabricated using PBF (colloquially referred to as metal 3-D printing). AlSi10Mg is optimized for the PBF process and was chosen for its strength, hardness, and because its structural integrity is maintained even when formed into thin and complex shapes. Furthermore, this alloy can be machined and polished after the PBF process with-out loss of structural integrity. No supports were needed during the fabrication of the feed horn, as the build direction was set such that the horn cone axis was aligned with gravity. After PBF, the horn was finished with a glass bead blast to reduce surface roughness from an Ra of in300 n to .in125 n The waveguide flange screw holes were made using a standard tap.
ANTENNA DESIGNThe horn was designed per [9] to support an HE11 hybrid mode that is well matched to the main reflector. The horn is fed by
Reflector
Feed Horn
FIGURE 1. A cross-sectional view of the optical train front end of the PolarCube CubeSat radiometer. The parabolic reflector and 3-D-printed metal feed horn are highlighted in yellow.

98 IEEE AntEnnAs & ProPAgAtIon MAgAzInE a p r i l 2 0 1 7
a rectangular WR-08 waveguide that transitions to a circular cross section into the conical flare. This transition is further complicated in that it includes the necessary tilt angle of 17° used to angle the feed horn toward the main reflector. The
feed horn was designed with a circular diameter aperture of . ,D 13 91mm= cone angle hi = 24.5°, and length (aperture-
to-cone apex) .L 32 mm= The corrugations were optimized to a depth of .0 28. m with a spacing of /3. m and given a cham-fer angle of . 30° to provide proper mode conversion from the circular waveguide into the cone section. The horn, therefore, has many submillimeter and intricate mechanical features that make 3-D printing worth investigating as a fabrication option.
MEaSUREMEnt SEtUP
ROBOTIC ANTENNA RANGEMeasurements were performed using the CROMMA [10]–[13] at NIST. The use of robotics allows multiple-scan geometries to be executed autonomously using a single antenna alignment and electrical calibration. This capability allows for rapid antenna characterization because both near-field and in situ extrapola-tion measurements could be made without the need to change setups, realign antennas, or recalibrate. With CROMMA, near-field measurements are achieved by using the robotic arm (see Figure 3) to scan a 1!n = probe antenna [14] over a surface about the antenna under test (AUT). The AUT sits atop a six-axis hexapod and rotator. To perform spherical scanning, the robot arm is moved along an arc (i direction) while the AUT can be rotated (z direction), creating a spherical geometry. Extrapolation scans are performed by scanning the probe along a linear path bore-sight between the AUT and probe antennas. A laser tracker and 6 degrees of freedom (6DoF) optical targets are used to provide spatial metrology of the coordinate frames of the probe antenna, AUT, robot, hexapod, and rotator. Spatial metrology software was used to capture and manipulate laser tracker data for the align-ment of the probe and AUT during measurements. The robotic arm can reconfigure itself based on this spatial metrology feed-back with an accuracy of ,25 m1 n which enables autonomous changes between near-field and extrapolation scan geometries [10], [15]. This was used to perform in situ extrapolation measurements in series with the near-field measurement. This sped up antenna characterization and allowed the extrapolation data to be used as diagnostics to optimize the near-field measurement (discussed in the “Extrapolation Measurements” section).
The 1!n = probe antenna and feed horn apertures were directly measured with a laser tracker and Pixel Probe [16] (a machine-vision-based touchless laser tracker probe). Images of the feed horn from the Pixel Probe during the alignment pro-cess are shown in Figure 4. The corrugations and surface rough-ness resulting from the 3-D printing process are clearly visible. In Figure 4(c), the white arrow points to a measurement location on the aperture where the active pixel (highlighted blue) of the Pixel Probe was placed. The size of the blue pixel corresponds to the effective spatial resolution (i.e., pixel footprint). For this alignment, the Pixel Probe resolution used was 30 m. n (m/85 at 118 GHz). A series of measurements around the aper-ture perimeter were taken to construct the aperture geometry (see Figure 5) and pose of the feed horn after the initial setup. Fitting a circle to these measurements produced an aper-ture radius of 13.98 mm. This is consistent with the intended
Rotator
Hexapod
RobotArm
TestAntenna
ProbeAntenna
FIGURE 3. The CROMMA facility. The main system components are shown: robotic arm, hexapod, rotator table, probe, and test antenna locations. (Photo courtesy of Curt Suplee, NIST.)
17°
24.5°
13.91 mm
32 mm
5°
32 m
(a) (b)
FIGURE 2. (a) The 3-D-printed metal AlSi10Mg feed horn. (b) A schematic showing the dimension of the feed horn conical section. (Photo courtesy of Josh Gordon, NIST.)
99IEEE AntEnnAs & ProPAgAtIon MAgAzInE a p r i l 2 0 1 7
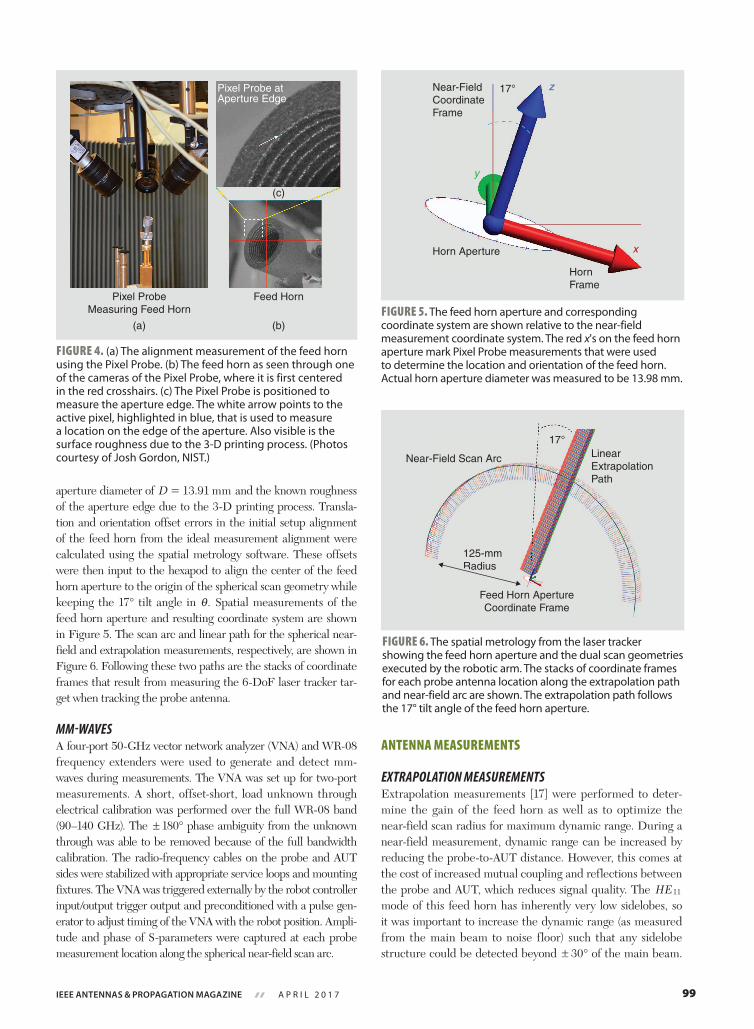
aperture diameter of .D 13 91mm= and the known roughness of the aperture edge due to the 3-D printing process. Transla-tion and orientation offset errors in the initial setup alignment of the feed horn from the ideal measurement alignment were calculated using the spatial metrology software. These offsets were then input to the hexapod to align the center of the feed horn aperture to the origin of the spherical scan geometry while keeping the 17° tilt angle in .i Spatial measurements of the feed horn aperture and resulting coordinate system are shown in Figure 5. The scan arc and linear path for the spherical near-field and extrapolation measurements, respectively, are shown in Figure 6. Following these two paths are the stacks of coordinate frames that result from measuring the 6-DoF laser tracker tar-get when tracking the probe antenna.
MM-WAVESA four-port 50-GHz vector network analyzer (VNA) and WR-08 frequency extenders were used to generate and detect mm-waves during measurements. The VNA was set up for two-port measurements. A short, offset-short, load unknown through electrical calibration was performed over the full WR-08 band (90–140 GHz). The !180° phase ambiguity from the unknown through was able to be removed because of the full bandwidth calibration. The radio-frequency cables on the probe and AUT sides were stabilized with appropriate service loops and mounting fixtures. The VNA was triggered externally by the robot controller input/output trigger output and preconditioned with a pulse gen-erator to adjust timing of the VNA with the robot position. Ampli-tude and phase of S-parameters were captured at each probe measurement location along the spherical near-field scan arc.
antEnna MEaSUREMEntS
EXTRAPOLATION MEASUREMENTSExtrapolation measurements [17] were performed to deter-mine the gain of the feed horn as well as to optimize the near-field scan radius for maximum dynamic range. During a near-field measurement, dynamic range can be increased by reducing the probe-to-AUT distance. However, this comes at the cost of increased mutual coupling and reflections between the probe and AUT, which reduces signal quality. The HE11 mode of this feed horn has inherently very low sidelobes, so it was important to increase the dynamic range (as measured from the main beam to noise floor) such that any sidelobe structure could be detected beyond ! 30° of the main beam.
Pixel Probe atAperture Edge
Feed HornPixel ProbeMeasuring Feed Horn
(a) (b)
(c)
FIGURE 4. (a) The alignment measurement of the feed horn using the Pixel Probe. (b) The feed horn as seen through one of the cameras of the Pixel Probe, where it is first centered in the red crosshairs. (c) The Pixel Probe is positioned to measure the aperture edge. The white arrow points to the active pixel, highlighted in blue, that is used to measure a location on the edge of the aperture. Also visible is the surface roughness due to the 3-D printing process. (Photos courtesy of Josh Gordon, NIST.)
Near-FieldCoordinateFrame
17°
Horn Aperture
HornFrame
z
y
x
FIGURE 5. The feed horn aperture and corresponding coordinate system are shown relative to the near-field measurement coordinate system. The red x's on the feed horn aperture mark Pixel Probe measurements that were used to determine the location and orientation of the feed horn. Actual horn aperture diameter was measured to be 13.98 mm.
17°
Near-Field Scan Arc LinearExtrapolationPath
125-mmRadius
Feed Horn ApertureCoordinate Frame
FIGURE 6. The spatial metrology from the laser tracker showing the feed horn aperture and the dual scan geometries executed by the robotic arm. The stacks of coordinate frames for each probe antenna location along the extrapolation path and near-field arc are shown. The extrapolation path follows the 17° tilt angle of the feed horn aperture.

100 IEEE AntEnnAs & ProPAgAtIon MAgAzInE a p r i l 2 0 1 7
Mutual coupling strength was determined from observing the oscillations in | |S11 in the extrapolation measurement. This is shown in Figure 7.
Data were taken every 400 mn ( / .at6 118 7503. m GHz) as the probe was translated over a distance ranging from 15 to 400 mm to the feed horn aperture. The separation distance at which these oscillations dropped to | |S11 #D 0.1 dB (peak to peak) was taken as the closest radius usable for the near-field
measurement. This turned out to be at a distance of 125 mm. The gain of the feed horn as determined from the extrapolation measurement was .G 20 32 dBextrap = . .0 5 dB!
SPHERICAL NEAR-FIELD MEASUREMENTSThe far-field pattern of the feed horn was also measured (see Table 1). Beam spillover and sources of leakage into the optical train can affect radiometer calibration, so it was important to characterize as much of the off-axis beam as possible. For Polar-Cube, the angle subtended by the main reflector as seen by the feed horn is .35°. Knowledge of the energy spillover outside this region is taken into account during radiometer calibration. Therefore, spherical near-field measurements were performed
Mutual Coupling
Separation Distance (mm)0 50 100 150 200 250 300 350 400
Str
ong
Cou
plin
g R
egim
e
–20
–25
–30
–35
|S11
| (dB
)
FIGURE 7. The | |S11 in decibels plotted over the horn-to-probe separation distance. Oscillations show reflections caused by the mutual coupling between the probe and feed horn. The edge of the strong coupling regime (shading) at a distance of 125 mm is where the mutual coupling is reduced to | |S11 #D 0.1 dB (peak to peak).
–5
–35
–35 –30–25 –20
–15
–35
–45–40
–45
–50
–55
–45
–50
–50–55
–65–60
–60 –55–50
–50–55
–50
–50
–55
–45
–45–40
–40 –3
5
–35–30
–25–20–15
–10
–60
–55
–60
–65
–45–40 –35
–30–25–20
–30–35 –45–40
–30–35 –4
0–45
–50
–40–40–45
–50
–50
–5
0 20 40 60
–45
80 0 20
–10–20
–50–55
–45
–55–60
–50
–50
–50–50–50
–40 –45
–25
–30 –35
40 60
–45
–50
800
45
90
135
180
225
270
315
0
45
90
135
180
225
270
315
(a) (b)
FIGURE 8. The far-field patterns of the magnitude of the total electric field over the front hemisphere of the feed horn. Patterns are normalized to the peak value. (a) The measured pattern. (b) The simulated pattern.
TABLE 1. MEASUREMENT PARAMETERS.
Scan Type Spherical Scan
i range ! 90°
z range ! 360°
iD 1°
zD 1°
Operating frequency 118.7503 GHz
Wavelength 2.54 mm
Measurement radius 125 mm
Positional accuracy (root mean square)
/100 25 m1m n^ h
Dynamic range (from main beam peak to noise floor)
70 dB

101IEEE AntEnnAs & ProPAgAtIon MAgAzInE a p r i l 2 0 1 7
as opposed to planar [18] measurements to provide large sol-id-angle coverage. With CROMMA, the front hemisphere (0 # #i +90°, 0 # #z 360°) was able to be covered, which allowed off-axis beam performance to be measured directly.
The far-field antenna pattern was obtained using the spherical near-field-to-far-field transform described in [14] and [19]–[21]. The 125-mm scan radius determined via the extrapolation measurement was used for the spherical near-field scan. The effective radius, r0 (as defined in ch. 19 of [14]), of the volume enclosing the feed horn was taken to be 20 mm. This fully encom-passed the feed horn and angled waveguide feed transition. Using this and the expression , / [ ( ) ]kr360 2 10 10#i zD D + + (given in [14, Ch. 19]), an upper limit on the angular sam-pling step sizes over the scan arc was determined to be
, #i zD D 3.0°. An actual step size of i zD D= = 1° was used, which is within the sampling criteria. The measured far-field pattern normalized to the peak for the front hemisphere (0 # #i + 90°, 0 # #z 360°) for the total field | |Etot is shown in Figure 8(a).
FEEd HORn SIMUlatIOnNumerical simulations were performed to determine the theo-retical gain and pattern of the feed horn. The ideal horn geome-try was used. The finite-element software package Ansys HFSS was used for this (mention of this product is not an endorsement but only serves to clarify what was done). The horn was mod-eled as being made from aluminum, and perfectly matched layer radiation boundary conditions were used. Mesh optimi-zation was also performed within regions containing critical structures, such as inside the horn (including corrugations) and around the throat and aperture. The simulation was optimized until the change of | |S11 at the input port of the feed horn was reduced to | | .S 0 00311 1D between iterations. The gain was determined to be .G 22 18sim = dB from the simulation. The theoretical far-field pattern normalized to the peak for the front hemisphere (0 # #i + 90°, 0 # #z 360°) for the total field | |Etot is shown in Figure 8(b).
dISCUSSIOnComparing the simulated and measured gain and far-field pat-terns provides a measure of the antenna performance obtained using 3-D printing. A comparison reveals a reduction in the gain between the simulated and actual feed horn. The gain deter-mined from the simulation was 22.18 dB, whereas the measured gain was 20.32 dB.
Figure 9 shows the decibel difference between the mea-sured and simulated far-field patterns. The patterns themselves show good agreement within the first ! 20° centered on the main beam where the difference straddles the 0-dB level. The inflection in the difference appears at i = 17° near where the peaks overlap as they should. Larger differences between the two patterns appear beyond about !30° from the main beam due to more local structure and increased energy in the sid-elobes in the actual pattern versus the simulated pattern. This is indicative of roughness and imperfections in horn geometry imparting phase and amplitude errors across the aperture. A
consequence of energy spreading into the sidelobes is the reduction in the gain from the simulated performance. As the simulated pattern has circular symmetry about the main beam (as it should for an HE11 mode), this local structure shows up as more drastic differences between the two patterns in excess of 10 dB in some places. Differences become dominated by simulation noise beyond about i = 70°. However, averaging the difference within the 35° cone centered on the main beam (i.e., the angular subtense by the main reflector) shows an average agreement of . .1 1 dB. Having good agreement (i.e., close to 0 dB) between the measured and simulated performance within the −3 dB beamwidth from the main beam was most important for this application. These results show that this is indeed the case, and that 3-D printing the feed horn out of aluminum is a viable option for this CubeSat application.
COnClUSIOnSWe presented a comparison of the measured and theoretical performance of a corrugated conical feed horn 3-D printed from the solid aluminum alloy AlSi10Mg using the PBF process. The feed horn was designed for the radiometer payload of the CubeSat PolarCube and operates at the atmospheric oxygen line of 118.7503 GHz. Spherical near-field and gain extrapola-tion measurements were performed at the CROMMA facility at NIST in Boulder, Colorado. The far-field antenna pattern over the front hemisphere of the feed horn was obtained using the spherical near-field to far-field transform.
In situ S11 extrapolation data were used to determine the optimum near-field scan radius to maximize dynamic range. This allowed sidelobe structure in the feed horn pattern to be detect-ed up to 70 dB below the main beam peak while keeping mutual coupling between the probe antenna and feed horn to | |S11 #D 0.1 dB (peak to peak). Numerical simulations of the feed horn were used to determine theoretical performance (pattern and
–22–20–18–16–14–12–10–8–6–4–202468101214161820
0
45
90
135
180
225
270
315
0 20 40 60 80
(dB)
FIGURE 9. The decibel difference between the measured and the simulated normalized far-field patterns.

102 IEEE AntEnnAs & ProPAgAtIon MAgAzInE a p r i l 2 0 1 7
gain). From these measurements, it was determined that the gain of the 3-D printed horn was 20.32 dB . ,0 5 dB! whereas the simulated gain was 22.18 dB. The far-field patterns showed good agreement within !30° of the main beam. The average dif-ference within the 35° cone centered on the main beam (i.e., the angular subtense by the main reflector) shows agreement of .1.1 dB. Within the −3 dB beamwidth from the main beam, agree-ment hovered around 0 dB, which was most important for this application. These results show that 3-D printing the feed horn out of aluminum is a viable option for this CubeSat application.
aCKnOWlEdGMEntSSpecial thanks goes to Glenda Alvarenga, Brian Sanders, and the PolarCube team at the University of Colorado Space Grant Consortium for providing the feed horn, support on the sys-tems and designs for PolarCube, and many helpful discussions.
aUtHOR InFORMatIOnJoshua A. Gordon ([email protected]) is a physicist in the Electromagnetics Division at the National Institute of Standards and Technology in Boulder, Colorado. His current research areas investigate new technologies for electric-field measure-ments. He is a Senior Member of the IEEE.
David R. Novotny ([email protected]) is an electrical engineer in the Electromagnetics Division at the National Insti-tute of Standards and Technology in Boulder, Colorado. His cur-rent research areas are electromagnetic studies of antennas, propagation, and high-performance calibrations.
Michael H. Francis ([email protected]) is a physicist in the Electromagnetics Division at the National Institute of Standards and Technology in Boulder, Colorado. His current research areas are in the theory and practice of near-field mea-surements. He is a Senior Member of the IEEE.
Ronald C. Wittmann ([email protected]) is a physicist in the Electromagnetics Division at the National Institute of Stan-dards and Technology in Boulder, Colorado. His current research areas are in extending the applicability of near-field theory and mea-surement techniques. He is a Senior Member of the IEEE.
Miranda L. Butler ([email protected]) is an under-graduate guest researcher at the National Institute of Standards and Technology in Boulder, Colorado. Her focus is on helping with the measurements and calibrations of radio frequency antennas.
Alexandra E. Curtin ([email protected]) is a physi-cist in the Electromagnetics Division at the National Institute of Standards and Technology in Boulder, Colorado. Her current research focuses on antenna measurement optimization.
Jeffery R. Guerrieri ([email protected]) is an elec-trical engineer in the Electromagnetics Division at the National Institute of Standards and Technology in Boulder, Colorado. His research areas include antenna metrology and near-field mea-surements. He is a Member of the IEEE.
Lavanya Periasamy ([email protected]) is currently pursuing her Ph.D. degree in electrical engineering at the University of Colorado, Boulder. She is a recipient of the NASA Earth and Space Science Fellowship in 2015 and 2016. She is a Student Member of the IEEE.
Albin J. Gasiewski ([email protected]) is a professor of electrical and computer engineering at the University of Colo-rado (CU), Boulder, and director of the CU Center for Environ-mental Technology. He has developed and taught courses and guided research on electromagnetics, remote sensing, instrumen-tation, and wave propagation theory. He is a Fellow of the IEEE.
REFEREnCES[1] F. Khan. (2015, Aug.). Mobile Internet from the heavens. [Online]. Avail-able: https://arXiv:1508.02383 [2] L. Periasamy and A. J. Gasiewski, “Prelaunch antenna calibration of CubeSat MMW/SMMW radiometers with application to the PolarCube 3U temperature sounding mission,” in Proc. 2016 IEEE Int. Symp. Antennas and Propagation and U.S. National Committee for the Int. Union for Radio Science Nat. Radio Science Meeting, pp. 5565–5568.[3] L. Periasamy and A. J. Gasiewski, “Precision design, analysis and manu-facturing of quasi-optic lens/reflector antenna systems for CubeSat MMMW/SMMW radiometers,” in Proc. 2015 U.S. National Committee for the Int. Union for Radio Science Meeting (Joint with AP-S Symp.), Vancouver, Canada, p. 265.[4] A. J. Gasiewski and J. T. Johnson, “Statistical temperature profile retrievals in clear-air using passive 118-GHz O2 observations,” IEEE Trans. Geosci. Remote Sens., vol. 31, no. 1, pp. 106–115, Jan. 1993. [5] M. Klein and A. J. Gasiewski, “Nadir sensitivity of passive millimeter and submillimeter wave channels to clear air temperature and water vapor varia-tions,” J. Geophy. Res., vol. 105, no. D13, pp. 17,481–17,511, July 2000. [6] P. Nayeri, M. Liang, R. A. Sabory-Garc, M. Tuo, F. Yang, M. Gehm, H. Xin, and A. Z. Elsherbeni, “3D printed dielectric reflect arrays: Low-cost high-gain antennas at sub-millimeter waves,” IEEE Trans. Antennas Propag., vol. 62, no. 4, pp. 2000–2008, 2014. [7] Z. Wu, J. Kinast, M. E. Gehm, and H. Xin, “Rapid and inexpensive fabrica-tion of terahertz electromagnetic bandgap structures,” Opt. Express, vol. 16, no. 21, pp. 16,442–16,451, 2008. [8] A. Macor, E. de Rijk, S. Alberti, T. Goodman, and J.-P. Ansermet, “Note: Three-dimensional stereolithography for millimeter wave and terahertz applica-tions,” Rev. Sci. Instrum., vol. 83, no. 4, p. 46,103, 2012.[9] P. J. B. Clarricoats and A. D. Olver, Corrugated Horns for Microwave Anten-nas, (IEE Electromagnetic Waves Series 18). Stevenage, U.K.: Peregrinus, 1984.[10] J. A. Gordon, D. R. Novotny, M. H. Francis, R. C. Wittmann, M. L. Butler, A. E. Curtin, and J. R. Guerrieri, “Millimeter-wave near-field measurements using coordinated robotics,” IEEE Trans. Antennas Propag., vol. 63, no. 12, pp. 5351–5362, 2015. [11] J. A. Gordon, D. R. Novotny, J. B. Coder, J. R. Guerrieri, and B. Stillwell, “Robotically controlled mm-wave near-field pattern range,” in Proc. Antenna Mea-surement Techniques Association Annu. Meeting Symp., 2012, vol. 34, pp. 384–389.[12] J. A. Gordon, D. Novotny, M. Francis, R. Wittmann, and J. Guerrieri, “The CROMMA Facility at NIST Boulder: A unified coordinated metrology space for millimeter-wave antenna characterization,” in Proc. Antenna Measurement Tech-niques Association Annu. Meeting Symp., 2014, vol. 36, pp. 351–356.[13] M. H. Francis, R. C. Wittmann, D. R. Novotny, and J. A. Gordon, “Spheri-cal near-field measurement results at millimeter-wave frequencies using robotic positioning,” in Proc. Antenna Measurement Techniques Association Annu. Meeting Symp., 2014, vol. 36, pp. 231–234.[14] C. A. Balanis, Modern Antenna Handbook. Hoboken, NJ: Wiley, 2008.[15] D. R. Novotny, J. A. Gordon, M. Francis, R. Wittmann, A. E. Curtin, and J. R. Guerrieri, “Antenna measurement implementations and dynamic position-al validation using a six axis robot,” in Proc. Antenna Measurement Techniques Association Annu. Meeting Symp., 2015, vol. 37, pp. 15–20.[16] J. A. Gordon, D. R. Novotny, and A. E. Curtin, “A single pixel touchless laser tracker probe,” J. CMSC, vol. 10, no. 2, pp. 12–21, 2015.[17] A. C. Newell, R. C. Baird, and P. F. Wacker, “Accurate measurement of antenna gain and polarization at reduced distances by an extrapolation tech-nique,” IEEE Trans. Antennas Propag., vol. 21, no. 4, pp. 418–421, 1973. [18] D. M. Kerns and E. S. Dayhoff, “Theory of diffraction in microwave inter-ferometry,” J. Res. Natl. Bur. Stand, vol. 64B, no. 1, pp. 1–13, 1960. [19] P. F. Wacker, “Non-planar near-field measurements: Spherical scanning,” National Bureau of Standards, Boulder, Co, NBSIR 75-809, June 1975.[20] J. E. Hansen, Spherical Near-Field Antenna Measurements. Stevenage, U.K.: Peregrinius, 1988.[21] R. C. Wittmann and C. F. Stubenrauch, “Spherical near-field scanning: Experimental and theoretical studies,” National Institute of Standards and Tech-nology, Boulder, CO, Internal Report NISTIR 3955, 1990.
Related Documents