An Advanced Model of Coal Devolatilization Based on Chemical Structure A Thesis Presented to the Department of Chemical Engineering Brigham Young University In Partial Fulfillment of the Requirement for the Degree Master of Science Dominic B. Genetti April 1999

Welcome message from author
This document is posted to help you gain knowledge. Please leave a comment to let me know what you think about it! Share it to your friends and learn new things together.
Transcript
An Advanced Model of Coal DevolatilizationBased on Chemical Structure
A Thesis
Presented to the
Department of Chemical Engineering
Brigham Young University
In Partial Fulfillment
of the Requirement for the Degree
Master of Science
Dominic B. Genetti
April 1999
BRIGHAM YOUNG UNIVERSITY
GRADUATE COMMITTEE APPROVAL
of a thesis submitted by
Dominic B. Genetti
This thesis has been read by each member of the following committee and by majorityvote has been found to be satisfactory.
______________________________ _______________________________Date Thomas H. Fletcher, Chair
______________________________ _______________________________Date Ronald J. Pugmire
______________________________ _______________________________Date John N. Harb
BRIGHAM YOUNG UNIVERSITY
As chair of the candidate’s graduate committee, I have read the thesis of Dominic B.Genetti in its final form and have found that (1) its format, citations, and bibliographicalstyle are consistent and acceptable and fulfill the university and department stylerequirements; (2) its illustrative materials including figures, tables, and charts are in place;and (3) the final manuscript is satisfactory to the graduate committee and is ready forsubmission to the university library.
__________________________ _____________________________________Date Thomas H. Fletcher
Chair, Graduate Committee
Approved for the Department
_____________________________________Kenneth A. SolenDepartment Chair
Approved for the College
_____________________________________Douglas M. ChabriesDean, College of Engineering and Technology

ABSTRACT
An Advanced Model of Coal DevolatilizationBased on Chemical Structure
Dominic B. Genetti
Department of Chemical Engineering
Master of Science
A model that predicts the quantity and form of nitrogen released during coal
devolatilization has been developed and coupled with the Chemical Percolation
Devolatilization (CPD) model. Based on the Chemical Structure of coal, the model
predicts the fraction of coal nitrogen evolved with the tar and, subsequently, released as
HCN at sufficiently high temperatures during primary devolatilization. The volatile
nitrogen release model also predicts the nitrogen content of the char. This work
represents the first time that a volatile nitrogen release model has been developed based
on the chemical structure of coal as determined by 13C NMR spectroscopy. It also
represents the first time that a volatile nitrogen model has been validated by comparing
model predictions with the chemical structure of char (as well as with light gas and tar
yields). Predictions of nitrogen release during devolatilization compared well with
nitrogen release measurements from various coals and pyrolysis conditions.

In order to make the CPD model more generally applicable, a non-linear
correlation was developed that predicts the chemical structure parameters of both U.S.
and non-U.S. coals generally measured by 13C NMR spectroscopy. The chemical
structure parameters correlated include: (i) the average molecular weight per side chain
(Mδ); (ii) the average molecular weight per aromatic cluster (Mcl); (iii) the ratio of bridges
to total attachments (p0); and (iv) the total attachments per cluster (σ+1). The correlation
is based on ultimate and proximate analysis, which are generally known for most coals.
13C NMR data from 30 coals were used to develop this correlation. The correlation was
used to estimate the chemical structure parameters generally obtained directly from 13C
NMR measurements, and then applied to coal devolatilization predictions using the CPD
model. The predicted tar and total volatiles yields compared well with measured yields
for most coals.
In addition, a correlation of light gas pyrolysis product composition was
developed based on coal type and the extent of light gas release. Estimations of light gas
composition using the correlation compared well with measured light gas compositions
from low and high heating rate pyrolysis experiments.
The nitrogen release model, 13C NMR correlation, and light gas composition
correlation have been coupled with the Chemical Percolation Devolatilization (CPD)
model. These modifications enhance the industrial applicability of the CPD model. It is
anticipated that the modified CPD model will be coupled with comprehensive combustion
codes, and therefore may help screen new low NOx technology.


ACKNOWLEDGMENTS
I would like to express gratitude to Dr. Thomas H. Fletcher for consistent and
useful advice and support throughout my undergraduate and graduate career at Brigham
Young University. I have learned a great deal from him academically and from his
example. I would like to thank Dr. Ronald Pugmire and Dr. Mark Solum of the
University of Utah for their contributions of NMR data and technical advice. I am also
grateful for the funding that was received from the Advanced Combustion Engineering
Research Center and from the Department of Energy, grant number DE-FG22-
95PC95215.
I would like to thank Mary Goodman, Paul Goodman, and Michael Busse for
their assistance in performing experiments and analyses. I would also like to thank Eric
Hambly, Steve Perry, Alex Brown, and Josh Wong for many useful discussions about
coal pyrolysis and other topics.
I would like to thank my Mother, Sandra L. Genetti, and my parents by marriage,
Ross and Debbie Miller, for their support and encouragement. I would also like to thank
my late Father, William E. Genetti, who was a professor of Chemical Engineering for 22
years. His memory has been a constant source of inspiration in my life. I would like to
recognize as well each of my five siblings, Berlin, Opal, Andy, Vincent and Teressa, for
their support. Particular thanks should be given to Berlin, who is also a Chemical
Engineer, for many useful conversations about this project. Finally, I would like to
express special gratitude to my wife, Mckenzie, for her love, support, and
encouragement.


vii
Table of Contents
List of Figures.....................................................................................................................xi
List of Tables...................................................................................................................xvii
Nomenclature....................................................................................................................xix
1. Introduction.....................................................................................................................1
2. Background......................................................................................................................5
Coal Structure...........................................................................................................5
Nitrogen in Coal.......................................................................................................8
Coal Pyrolysis..........................................................................................................8
Nitrogen Release During Pyrolysis........................................................................11
Modeling Devolatilization......................................................................................15
The FG-DVC Model..................................................................................16
The FLASHCHAIN Model.......................................................................17
The CPD Model.........................................................................................17
Modeling Volatile Nitrogen Release.......................................................................18
Summary................................................................................................................21
3. Objectives and Approach..............................................................................................23
4. 13C NMR Correlation....................................................................................................25
Evaluation of Linear Correlations...........................................................................26
Correlation Development.......................................................................................27
Experimental Data......................................................................................27
Procedure....................................................................................................27
Example Case for p0 ...................................................................................31
Final NMR Correlation..............................................................................32
viii
Estimation of the Fraction of Stable Bridges..............................................37
Implications of 13C NMR Correlation...................................................................38
Application of Correlated Parameters in CPD Model...........................................40
Discussion of NMR Correlation............................................................................43
5. Modeling Volatile Nitrogen Release..............................................................................45
Evaluation of Nitrogen Release Data......................................................................45
Rank and Temperature Dependence..........................................................48
Time Dependence.......................................................................................50
Model Theory and Development...........................................................................52
Light Gas Nitrogen.....................................................................................53
Nitrogen Released with Tar........................................................................56
Fraction of Stable Nitrogen........................................................................56
Nitrogen Model Parameters.......................................................................57
Application of Nitrogen Model.............................................................................59
Description of Test Cases..........................................................................59
Comparisons with Data from Fletcher and Hardesty................................60
Comparisons with Data Reported by Chen...............................................64
Comparisons with Data Reported by Hambly and Genetti......................66
Discussion of Volatile Nitrogen Release Model.....................................................70
6. Predicting Light Gas Composition................................................................................73
Background.............................................................................................................73
Analysis of Light Gas Release Data.......................................................................75
TG-FTIR Experiments...............................................................................75
Light Gas Data From a Radiantly Heated Reactor.....................................76
Pyrolysis Experiments at Various Heating Rates......................................76
Conclusions from Data Analysis...............................................................77
Correlation of Light Gas Composition...................................................................77
ix
Interpolation for Coal Type.......................................................................78
Interpolation for Extent of Light Gas Release............................................79
Application of Light Gas Correlation....................................................................81
Discussion of Light Gas Correlation......................................................................84
7. Conclusions...................................................................................................................87
Correlations to Estimate Coal Structure.................................................................87
Volatile Nitrogen Release Model............................................................................88
Light Gas Submodel...............................................................................................89
Impact of this Work...............................................................................................90
8. Recommendations for Future Work..............................................................................91
NMR Correlation...................................................................................................91
Volatile Nitrogen Modeling....................................................................................91
Light Gas Correlations...........................................................................................92
References..........................................................................................................................93
Appendix A: Correlated Structural Parameters.................................................................99
Appendix B: Sample CPD Model Input Files................................................................101
Appendix C: Sample CPD Model Input File..................................................................105
Appendix D: Tabulated Mass and Tar Release..............................................................107
Appendix E: Nitrogen Release Comparisons..................................................................109
Nsite and Nchar Comparisons..................................................................................110
Mass and Nitrogen Release Comparisons............................................................114
Appendix F: Particle Temperature Profiles of Radiantly Heated Reactor......................123
Appendix G: Coal Pyrolyzed in BYU FFB....................................................................129
Appendix H: Velocity and Temperature Profiles of FFB...............................................131
Appendix I: Analysis of Light Gas Data........................................................................133
Introduction..........................................................................................................133
TG-FTIR Analysis of Pyrolysis Products..........................................................134

x
Light Gas Data from a Radiantly Heated Reactor................................................140
Light Gas Data from Currie Point Pyrolyzer.......................................................147
Conclusions..........................................................................................................150
Appendix J: Light Gas Look-Up Table..........................................................................151
xi
List of Figures
Figure 2.1. A hypothetical coal macromolecule.............................................................6
Figure 2.2. Hypothetical coal pyrolysis reaction...........................................................9
Figure 2.3. Tar and total volatile yields from devolatilization as a function of the
carbon content of the parent coal...............................................................10
Figure 2.4. Nitrogen volatiles release versus rank........................................................13
Figure 2.5 Distribution of nitrogen volatiles versus rank............................................14
Figure 4.1. Coalification chart of 30 coals used in NMR correlation...........................31
Figure 4.2. Plots of chemical structure parameters versus elemental composition and
ASTM volatile matter content...................................................................33
Figure 4.3. Plots of estimated chemical structure parameters versus the parameters
derived from 13C NMR analyses................................................................36
Figure 4.4. Comparison of model CPD predictions with measured mass release........41
Figure 4.5. Comparison of CPD model predictions with measured mass and tar release
....................................................................................................................43
Figure 5.1. Hypothetical nitrogen release steps...........................................................46
Figure 5.2. Comparison of Nsite decay in various chars during pyrolysis....................49
Figure 5.3. Comparison of Nsite decay in various chars during pyrolysis....................49
Figure 5.4. Comparison of Nsite decay in various chars during pyrolysis at two heating
rates............................................................................................................51

xii
Figure 5.5. Comparison of total mass release from various coals during pyrolysis at
two heating rates........................................................................................51
Figure 5.6. Comparison of predicted and measured Nsite and Nchar of versus time during
pyrolysis....................................................................................................62
Figure 5.7. Comparison of predicted and measured Nsite and Nchar of versus time during
pyrolysis....................................................................................................62
Figure 5.8. Comparison of predicted and measured mass and nitrogen release versus
time during pyrolysis.................................................................................63
Figure 5.9. Comparison of predicted and measured mass and nitrogen release versus
time during pyrolysis.................................................................................63
Figure 5.10. Comparison of predicted and measured mass and nitrogen release versus
rank.............................................................................................................64
Figure 5.11. Comparison of predicted and measured tar nitrogen and light gas nitrogen
release versus time......................................................................................65
Figure 5.12. Comparison of predicted and measured tar nitrogen and light gas nitrogen
release versus time......................................................................................66
Figure 5.13. Predicted char nitrogen content versus measured char nitrogen
content .......................................................................................................67
Figure 5.14. Comparison of predicted and measured mass and nitrogen release versus
rank.............................................................................................................67
Figure 5.15. Comparison of predicted and measured mass release versus rank.............69
Figure 5.16. Comparison of predicted and measured nitrogen release versus rank........69
Figure 6.1. Interpolation mesh on a coalification chart................................................80
Figure 6.2. Comparison of predicted and measured light gas composition
versus rank.................................................................................................82

xiii
Figure 6.3. Comparison of predicted and measured light gas composition
versus rank.................................................................................................83
Figure E.1. Comparison of predicted and measured values of Nchar ...........................110
Figure E.2. Comparison of predicted and measured values of Nsite and Nchar .............110
Figure E.3. Comparison of predicted and measured values of Nchar ...........................111
Figure E.4. Comparison of predicted and measured values of Nsite and Nchar .............111
Figure E.5. Comparison of predicted and measured values of Nchar ...........................112
Figure E.6. Comparison of predicted and measured values of Nsite and Nchar .............112
Figure E.7. Comparison of predicted and measured values of Nsite and Nchar .............113
Figure E.8. Comparison of predicted and measured values of Nsite and Nchar .............113
Figure E.9. Comparison of predicted and measured mass and nitrogen release..........114
Figure E.10. Comparison of predicted and measured mass and nitrogen release..........114
Figure E.11. Comparison of predicted and measured mass and nitrogen release..........114
Figure E.12. Comparison of predicted and measured mass and nitrogen release..........114
Figure E.13. Comparison of predicted and measured mass and nitrogen release..........116
Figure E.14. Comparison of predicted and measured mass and nitrogen release..........116
Figure E.15. Comparison of predicted and measured mass and nitrogen release..........117
Figure E.16. Comparison of predicted and measured mass and nitrogen release..........117
Figure E.17. Comparison of predicted and measured mass and nitrogen release versus
rank...........................................................................................................118
Figure E.18. Comparison of predicted and measured mass and nitrogen release versus
rank...........................................................................................................119

xiv
Figure E.19. Comparison of predicted and measured mass and tar release
versus time...............................................................................................119
Figure E.20. Comparison of predicted and measured mass and tar release
versus time...............................................................................................120
Figure E.21. Comparison of predicted and measured mass and tar release
versus time...............................................................................................120
Figure E.22. Comparison of predicted and measured mass and tar release
versus time...............................................................................................121
Figure E.23. Comparison of predicted and measured total and light gas nitrogen release
versus time...............................................................................................121
Figure E.24. Comparison of predicted and measured total and light gas nitrogen release
versus time...............................................................................................122
Figure I.1. Light gas release of Argonne Premium coals............................................135
Figure I.2. H2O content of light gas pyrolysis products...........................................137
Figure I.3. CO2 content of light gas pyrolysis products...........................................137
Figure I.4. CO content of light gas pyrolysis products.............................................137
Figure I.5. CH4 content of light gas pyrolysis products...........................................138
Figure I.6. C2H4 content of light gas pyrolysis products..........................................139
Figure I.7. Light gas release of PETC coals...............................................................142
Figure I.8. H2O content of light gas pyrolysis products...........................................143
Figure I.9. CO2 content of light gas pyrolysis products...........................................143
Figure I.10. CO content of light gas pyrolysis products.............................................144
Figure I.11. CH4 content of light gas pyrolysis products...........................................145
Figure I.12. C2H4 content of light gas pyrolysis products..........................................146

xv
Figure I.13. Content of other light gas pyrolysis products.........................................146
Figure I.14. Light gas release of various coals versus rank..........................................147
Figure I.15. H2O, CO2, and CO content of light gas pyrolysis products....................148
Figure I.16. H2 and CH4 content of light gas pyrolysis products...............................148
Figure I.17. C2 Hydrocarbon content of light gas pyrolysis products........................149
Figure I.18. C3 Hydrocarbon content of light gas pyrolysis products........................149

xvi

xvii
List of Tables
Table 4.1. List of Coals Used in 13C NMR Correlation..............................................28
Table 4.2. Properties of Coals Used in 13C NMR Correlation...................................29
Table 4.3. 13C NMR Chemical Structure Parameters of Coals Used in
Correlation..................................................................................................30
Table 4.4. Outliers Removed From 13C NMR Correlation.........................................34
Table 4.5. Coefficients of Modified Quadratic Correlations.......................................35
Table 4.6. Range of Values Used in 13C NMR Correlations.......................................39
Table 4.7. Properties of Coals Studied by Xu and Tomita.........................................42
Table 5.1. List of Pyrolysis Experiments Examined for Nitrogen Release Trends.....48
Table 5.2. Rate Parameters Used in Nitrogen Model..................................................58
Table 5.3. Description of Data Used to Validate Nitrogen Release Model................60
Table 6.1. Kinetic Rate Coefficients in FG Submodel................................................74
Table 6.2. Composition and Elemental Ratios of Coals Used to Create Triangular
Interpolation Mesh....................................................................................79
Table A.1. Correlated Chemical Structure of Coals Used in 13C NMR Correlation....99
Table D.1. Predicted and Measured Mass and Tar Yields.........................................107
Table F.1. Particle Temperature Profile of 56 ms Condition....................................123
Table F.2. Particle Temperature Profile of 61 ms Condition....................................124
Table F.3. Particle Temperature Profile of 66 ms Condition....................................124

xviii
Table F.4. Particle Temperature Profile of 72 ms Condition....................................125
Table F.5. Particle Temperature Profile of 77 ms Condition....................................125
Table F.6. Particle Temperature Profile of 83 ms Condition....................................126
Table F.7. Particle Temperature Profile of 87 ms Condition....................................126
Table F.8. Particle Temperature Profile of 89 ms Condition....................................127
Table G.1. Elemental Composition of Coals Pyrolyzed in FFB...............................129
Table H.1. Gas Velocity Profile of 18 ms FFB Condition.........................................131
Table H.2. Gas Temperature Profile of 18 ms FFB Condition..................................131
Table H.3. Gas Velocity Profile of 78 ms FFB Condition.........................................132
Table H.4. Gas Temperature Profile of 78 ms FFB Condition..................................132
Table I.1. Moisture Content of Argonne Premium Coals........................................135
Table I.2. Ultimate Analysis of Coals Studied by Chen..........................................141
Table J.1. Reference Coals Used in Look-Up Table.................................................151
Table J.2. Extent of Total Light Gas Release............................................................152
Table J.3. Mass Fraction H2O..................................................................................152
Table J.4. Mass Fraction CO2 ..................................................................................153
Table J.5. Mass Fraction CH4 ..................................................................................153
Table J.6. Mass Fraction CO....................................................................................154
xix
Nomenclature
AFR Advanced Fuel Research
ACERC Advanced Combustion Engineering Research Center
ANL Argonne National Laboratories
ASTM American Society of Testing and Materials
an anthracite coal
B.L. bridges and loops per cluster
CCl aromatic carbons per cluster
c0 fraction of bridges that are stable
CPD Chemical Percolation Devolatilization
daf dry, ash free
DECS Department of Energy Coal Sample
E activation energy
fa total percent of sp2-hybridized carbon
fa’ percent of aromatic carbon
faB percent of bridgehead aromatic carbon
faC percent of carbonyl carbon
faH percent of aromatic carbon with proton attachment
faN percent of nonprotonated aromatic carbon
faP percent of phenolic or phenolic ether aromatic carbon
faS percent of alkylated aromatic carbon
fal total percent aliphatic carbon
fal* percent aliphatic carbon that is nonprotonated or CH3
falH percent aliphatic carbon that is CH or CH2

xx
falO percent aliphatic carbon that is bound to oxygen
FFB methane air flat-flame burner
FG functional group
FTIR fourier transform infrared spectroscopy
fchar char yield
fst fraction of stable nitrogen
gasnit fraction of coal nitrogen released as light gas
H/C hydrogen to carbon molar ratio
HCN hydrogen cyanide
hvAb high volatile A bituminous coal
hvBb high volatile B bituminous coal
hvCb high volatile C bituminous coal
ICP inductively coupled plasma
K Kelvin
kHCN first order rate constant for HCN release in FLASHCHAIN
ligA lignite A
lvb low volatile bituminous coal
mcoal mass of original coal
mchar char yield
mvb medium volatile bituminous coal
MCl average molecular weight per cluster
Mδ average molecular weight of the cluster attachments
Msite average molecular weight of the aromatic sites
η the change in the average moles of nitrogen per mole of
aromatic clusters in FLASHCHAIN
Ncoal daf mass fraction of nitrogen in parent coal
Nchar daf mass fraction of nitrogen in char

xxi
Nsite daf mass fraction of nitrogen on an aromatic site basis
Ntar daf mass fraction of nitrogen in tar
NCSS Number Cruncher Statistical Software
NMR nuclear magnetic resonance spectroscopy
NOX nitrogen oxides (NO, NO2 and N2O)
NR fraction of original nitrogen released during pyrolysis
O/C oxygen to carbon molar ratio
p0 fraction of attachments that are bridges
PCGC - 3 Pulverized Coal Gasification and Combustion code (3
dimensions)
PETC Pittsburgh Energy and Technology Center
PSOC Penn State Office of Coal Research
py-MS pyrolysis mass spectroscopy
r2 coefficient of determination
R universal gas constant
s second
sa semi-anthracite coal
subA subbituminous A coal
subB subbituminous B coal
subC subbituminous C coal
T temperature
t time
tarnit mass on nitrogen transported with tar
TG-FTIR thermogravimetric fourier transform infrared spectroscopy
XPS X-ray photoelectron spectroscopy
YHCN molar yield of HCN
δ refers to a differential change
xxii
σ+1 total attachments per cluster
σ standard deviation
δ fraction of initial attachments that are side chains
l fraction of labile bridges
x inverse of area under normal distribution curve
χb fraction of bridgehead carbons
XC daf percent carbon in parent coal
XH daf percent hydrogen in parent coal
XN daf percent nitrogen in parent coal
XO daf percent oxygen in parent coal
XVM ASTM volatile matter content of parent coal expressed as a
percent
Xgas the ratio of light gas released to the maximum light gas yield

1
1. Introduction
As environmental regulations on industrial emissions have increased, the focus of
coal research has shifted more and more to understanding and reducing harmful pollutants
such as nitrogen oxides (NOx). During coal combustion, the majority of nitrogen oxide
pollution comes from nitrogen found in the coal.1, 2 Nitrogen in the coal is released in two
stages during the combustion of coal. During the first stage, known as devolatilization (or
pyrolysis), nitrogen is released with tar or light gas. Tar is defined as the volatiles
released that condense at room temperature. Nitrogen released during devolatilization is
referred to as volatile nitrogen. As the tar and light gases combust in the presence of O2,
the nitrogen may be oxidized to form NOx pollutants. The second stage of nitrogen
release occurs during char oxidation. Char is the solid portion of coal remaining after the
tar and light gas species have been released during devolatilization. As the char combusts
heterogeneously, nitrogen bound in the char is oxidized directly to NOx. It has been
shown that volatile nitrogen may contribute as much as 60 to 80 percent of the total NOx
produced during coal combustion.3
Common methods of reducing NOx emissions during coal combustion include
staged combustion and selective catalytic and selective non-catalytic reduction using
ammonia or urea. The objective of these methods is to assure that nitrogen is emitted as
N2 rather than NOx. Staged combustors have achieved moderate success in reducing the
amount on volatile nitrogen that is converted to NOx. However, because the nitrogen in
the char is released by heterogeneous oxidation, staged combustion methods have little
effect on NOx formed from nitrogen in the char.2 Although selective catalytic and non-
catalytic reduction can be very effective in reducing NOx species to N2, selective
reduction is a relatively expensive alternative. Recently, advanced staged combustors,

2
known as low-NOx burners, have been developed. Low-NOx burners reduce NOx
emissions by creating locally fuel-rich regions with sufficient residence time and
appropriate temperatures in which volatile nitrogen is converted to N2 rather than NOx.
Low-NOx burners have the potential to significantly reduce NOx emissions from coal
combustion facilities and are currently the most economically favorable alternative.
Current low-NOx burners are designed with empirical relationships to describe
nitrogen evolution during devolatilization. In order to design more efficient low-NOx
burners it is important to understand the chemistry and reaction mechanisms of
devolatilization and volatile nitrogen release. Of equal importance is the development of
accurate predictive models of devolatilization and nitrogen release that can be used in the
design of more effective low-NOx burners.
The primary objective of this study was to develop a model which predicts the
amount and form of nitrogen released during primary devolatilization based on the
chemical structure of coal, and to incorporate the model into a devolatilization model (the
Chemical Percolation Devolatilization Model).4 Existing experimental data on nitrogen
release and the chemical structure of coal, char, and tar were used in developing this
nitrogen release model. This work represents the first volatile nitrogen release model
based on the chemical structure of coal as measured directly by 13C NMR analyses. This
research also represents the first time that nitrogen model predictions have been compared
to the chemical structure of char.
This study also sought to enhance the industrial usefulness of the CPD model.
The accuracy of predicted tar and total volatiles yields was improved by developing an
empirical relationship between c0, the initial fraction of char bridges, and the oxygen and
carbon content of coal. Before this work, the applicability of the CPD model was limited
by the availability of 13C NMR data on parent coals. At the start of this project, such
NMR data were only available for about 15 coals. Therefore, in order to increase the
applicability of the CPD model to many coals, a correlation was developed between

3
chemical structural input parameters, normally obtained by 13C NMR analysis, and the
elemental composition and volatile matter content of coal. Also, an algorithm was
developed and coupled with the CPD model that distributes the light gas released during
devolatilization into CO, CO2, CH4, H2O, and other light hydrocarbons. It is expected
that with these additional features, the CPD model will be very useful in improving low-
NOx burner technology and in other coal combustion modeling applications.

4

5
2. Background
The background given here describes the current state of coal pyrolysis research.
Special emphasis is given to coal pyrolysis modeling and the release of nitrogen during
pyrolysis. First, a brief general description of the current understanding of the structure
of coal will be given, including a discussion on the structure of nitrogen forms in coal.
The process of coal pyrolysis will be addressed, and the composition of light gas released
during pyrolysis will be examined. Several advanced pyrolysis models that have been
developed in the past decade will be discussed, including approaches taken to predict
nitrogen release. Finally, a summary of pyrolysis modeling will be given that addresses
the industrial importance of this study.
Coal Structure
Coal is thought to consist of (i) a large matrix of aromatic clusters connected by
aliphatic bridges, (ii) aliphatic and carbonyl side chain attachments to the aromatic
clusters , and (iii) some weakly bonded components sometimes referred to as the mobile
phase.5, 6 The aromatic clusters consist largely of carbon, but also contain heteroatoms
such as oxygen, sulfur and nitrogen. The bridges which connect the aromatic clusters are
believed to be almost exclusively composed of aliphatic functional groups, but may also
contain atoms such as oxygen and sulfur.7, 8 Bridges containing oxygen as ethers have
relatively weak bond strengths. Some bridges, known as char links, consist of a single
bond between aromatic clusters. Char links are thought to be relatively stable. Because
bridges are composed of a wide variety of functional groups, there is a large distribution in
bond strengths. Attachments to the aromatic clusters that do not “bridge” to another
aromatic cluster are called side chains. The mobile phase consists of smaller molecular

6
structures that are not strongly bonded to the matrix.9, 10 Figure 2.1 is a schematic
illustrating these important structural components of coal.
Pyrrolic Nitrogen
Pyridinic Nitrogen
Bridge Structures
SideChain
Loop Structure
Aromatic Cluster
Mobile Phase Group
Bi-aryl Bridge
H
C
H2
HO C
H2
N
R
C
R
O
H
SH2
OH
C
H2
H2 OH
H2
OH
CH2
O
O
CH3
C OH
O
R
C
H2
NH
HH
H
HH
H2
H2
H2
OH2
OCH3
C
H
H2O
H
H2
C
HH
HH
Figure 2.1. Schematic of hypothetical coal molecule. Modified from Solomon et al.11
A fundamental knowledge of coal structure is important to fully understand and
model the devolatilization and combustion behavior of coal. Due to the complex nature of
coal, several different characterization techniques are commonly used to determine coal
structure. Most coal characterization techniques, such as Pyrolysis Mass Spectroscopy
and solvent extraction, either heat the coal or dissolve a portion of the coal with solvents,
and then analyze the gas or liquid products. Since these techniques disrupt the network
structure of the coal, the results are often a poor representation of the original coal
structure. 13C NMR spectroscopy is one of the few non-destructive characterization
techniques available to determine coal structure.
Solid-state 13C NMR spectroscopy has been shown to be an important tool in the
characterization of coal structure. 13C NMR spectroscopy has been used to quantify the
average carbon skeletal structure of a given coal with 12 parameters that describe the

7
aromatic and aliphatic regions of the coal matrix.12, 13 The value of fa is the total fraction
of aromatic, carboxyl and carbonyl carbons. This value is subdivided into faC, which is
the fraction of carbonyl and carboxyl carbons, and fa’, which is the fraction of sp2-
hybridized carbons present in aromatic rings. The value of fa’ is subdivided into
protonated (faH) and non-protonated (fa
N) aromatic carbons. The non-protonated
aromatic carbons are further subdivided into the fractions of phenolic (faP), alkylated (fa
S)
and bridgehead (faB) carbons. The fraction of aliphatic carbons is labeled fal. This value is
divided into the fraction of CH and CH2 groups (falH) and the fraction of CH3 groups
(fal*). The aliphatic carbons that are bonded to oxygen are labeled as fal
O.
From the twelve structural parameters, combined with an empirical relationship
between bridgehead carbons and aromatic carbons per cluster, a description of the lattice
structure of coal can be obtained.12 Some of the useful structural parameters determined
from these analyses include: the number of carbons per cluster (Ccl), the number of
attachments per cluster (coordination number, σ +1), the number of bridges and loops
(B.L.), the ratio of bridges to total attachments (p0), the average aromatic cluster molecular
weight (Mcl), and the average side chain molecular weight (Mδ).
13C NMR analyses of matching sets of coals, tars, and chars have been used to
study the change in the chemical structure resulting from coal devolatilization.14 For
example, Watt15 and Hambly16 performed pyrolysis experiments at a number of different
conditions on six coals of various rank to provide matching sets of char and tar that were
pyrolyzed to different degrees. 13C NMR analysis of these matching samples provided
important data for comparison of the coals as a function of both rank and degree of
pyrolysis. Coal lattice structure parameters derived from 13C NMR also provide
important input parameters for coal conversion and combustion models.
13C NMR studies of coal are limited by the time and expense involved in
performing the analyses. The fact that 13C NMR structural parameters have only been
obtained for about 35 coals at the present time illustrates this weakness.

8
Nitrogen in Coal
Coal generally contains 1 to 2 percent nitrogen by weight.17 The nitrogen content
is a weak function of coal type. Coals with about 85 wt % carbon seem to contain the
largest amount of nitrogen.18 There seems to be a general consensus that nitrogen in coal
is present primarily in two different heterocyclic forms: 5-membered (pyrrolic), and 6-
membered (pyridinic) nitrogen functional groups (see Figure 2.1).15, 18-22 Some evidence
also indicates the presence of a small amount of quaternary nitrogen functional groups.20-
22
It has also been shown that 50 to 60% of the total coal nitrogen is in the form of
pyrrolic nitrogen, while pyridinic nitrogen accounts for 30 to 40%.20, 21 Several studies
have shown that the relative amounts of the different nitrogen functionalities found in coal
vary slightly with rank.20, 21, 23 It appears that the relative amounts of pyridinic and
pyrrolic nitrogen increase slightly with increasing coal rank corresponding to a decrease in
the relative amount of quaternary nitrogen.
Coal Pyrolysis
The mechanisms and variables which control coal devolatilization are discussed in
detail by Smith, et al.5 Only a brief description of coal devolatilization is given here.
Devolatilization (or pyrolysis) is the first stage in coal combustion. Devolatilization
occurs as the raw coal is heated in an inert or oxidizing atmosphere. As the temperature
of the coal increases, the bridges linking the aromatic clusters break, resulting in finite-size
fragments that are detached from the macromolecule.5
The bridges consist of a distribution of different types of functional groups, and
the weakest bond strengths are broken first. The fragments are commonly referred to as
metaplast. The metaplast then either (i) vaporizes and escapes the coal particle, or (ii)
crosslinks back into the macromolecular structure. The metaplast which vaporizes
consists mainly of the lower molecular weight fragments and becomes what is referred to

9
as tar. As stated earlier tar is defined as the gaseous pyrolysis products that condense at
room temperature. The relationship between tar release and bridge scission is highly non-
linear. Side chains and the broken bridge material are released as light gas in the form of
light hydrocarbons and oxides. The portion of the coal particle remaining after
devolatilization is called char. Figure 2.2 is a schematic of a hypothetical coal pyrolysis
reaction.
H
N
R
OH
C
CH3
H2
H2
H2
R
CH3
H
O
C HH
CH3
SO
C
CH3
O
H2 OH
H2
H2
H2
N
CH3
HH
Tar
R
CO2
H2O
H2O
CO2
CH3
Tar
Figure 2.2. Schematic of pyrolysis reaction. Modified from Solomon et al.11
The pyrolysis behavior of coal is affected by temperature, heating rate, pressure,
particle size, and coal type among other variables.24-27 Higher mass release during
devolatilization generally occurs at higher temperatures. As temperature increases, the

10
bridge and side chain breaking rates increase, more light gas is released, and more tar is
released due to higher metaplast vapor pressures. The heating rate has the following two
effects on devolatilization behavior: (i) as heating rate increases, the temperature at which
volatiles are released increases; and (ii) generally, as heating rate increases, the overall
volatiles yield increases.5, 26, 27 Higher pressures lead to lower overall mass release
during devolatilization because of vapor pressure considerations.5
Devolatilization behavior is largely dependent on coal type.28 Low rank coals
(lignites and subbituminous coals) release a relatively large amount of light gases and less
tar. Bituminous coals release much more tar than lower rank coals and moderate amounts
of light gas. The highest rank coals release only small amounts of tar and even lower
amounts of light gas. Figure 2.3 illustrates these trends where percent carbon in the coal
is used as a rank indicator.
70
60
50
40
30
20
10
0
Yie
ld (
% o
f daf
coa
l)
95908580757065
% Carbon of Parent Coal (daf)
Total Volatiles Tar
Figure 2.3. Volatiles yields from devolatilization experiments as a function of coalrank (adapted from Fletcher, et al.4) Solid lines are quadratic curve fits tothe data, and are shown only for illustrative purposes.
Light gas released during devolatilization consists mainly of methane, carbon
dioxide, carbon monoxide, and water.25, 27, 29-31 Other constituents include low

11
molecular weight hydrocarbons such as olefins, nitrogen species and sulfur species.
Saxena studied light gas release at atmospheric pressures and low heating rates (1
K/sec).27 Occluded carbon dioxide and methane were released at about 473 K. Above
473 K, condensation reactions resulted in the evolution of carbon dioxide and water.
Between 473 K and 773 K, methane and small amounts of olefins began to evolve. Also
in the range 473-773 K nitrogen structures and organic sulfur species began to decompose.
Hydrogen began to evolve around 673 K. At higher temperatures (773-973 K) the
volume of hydrogen, carbon dioxide, and methane increased relative to other hydrocarbon
species.
In general, increasing the heating rate increases the temperature at which various
gas species are evolved. Suuberg, et al.25 studied the devolatilization behavior of a lignite
at a heating rate of 1000 K/sec. Carbon dioxide evolution was observed to begin at about
723 K. Chemically formed water and carbon dioxide were evolved in the range of 773-973
K. Between 973 K and 1173 K, hydrogen and hydrocarbon gases were released. At
higher temperatures the formation of additional carbon oxides were observed.
The composition of the light gas evolved during devolatilization is a function of
coal rank.31 Light gas released from lignites contains a relatively large amount of carbon
dioxide and carbon monoxide, but contains only a small amount of methane. Light gas
evolved from bituminous coals during devolatilization contains a smaller fraction of
carbon dioxide and carbon monoxide and a larger fraction of methane compared to light gas
evolved from lignites. The variations in the species distribution of light gas as a function
of rank is believed to be the result of variations in the composition of the aliphatic side
chains.
Nitrogen Release During Pyrolysis
Baxter et al.1 studied the relationship between N-release, carbon release, and total
mass release during devolatilization and char oxidation of 15 coals. Baxter found that for

12
coals with low carbon content (or low rank coals) the rate of nitrogen release during early
devolatilization is much less than the rate of total mass release. However, during late
devolatilization and early oxidation, nitrogen is released at a faster rate than total mass is
released. A similar, but more pronounced, trend was found when the rate of nitrogen
release was compared to carbon release.
Coals with higher carbon content (higher rank) followed a different trend when
compared with the release rates of carbon and total mass. Nitrogen release in high rank
coals was faster compared to carbon and total mass release during devolatilization, with
the ratios decreasing to about unity by the time oxidation began.1
The observed trends of nitrogen release rates during devolatilization appear to be
in good agreement with the nitrogen functional group studies mentioned earlier. Low rank
coals generally have a large proportion of volatile, mostly aliphatic, attachments, bridges,
and independent components.5 The aliphatic constituents are not believed to contain
significant amounts of nitrogen. Higher rank coals, on the other hand, contain a relatively
small amount of aliphatic material. This is in agreement with the relative nitrogen release
trends for the low and higher rank coals. Since the aliphatic constituents are the most
volatile part of the coal, they are released first with virtually no nitrogen. As the particles
get hotter, the heterocyclic pyrrolic and pyridinic nitrogen functional groups begin to
vaporize with the tar.
The nitrogen release rate trends in higher rank coals are similar to low rank coals,
except that the high rank coals do not have an initial release of nitrogen-poor light gases
(fewer aliphatics). The volatile matter in higher rank coals is dominated by aromatics, and
this results in the preferential loss of nitrogen throughout devolatilization, since it is
believed that the aromatic portion of coal contains the majority of the nitrogen found in
coal.1
Nitrogen release during coal devolatilization has also been observed to be a
function of temperature. In an investigation conducted by Blair et al.32 it was shown that
13
as the pyrolysis temperature increased, nitrogen release increased proportionately and at
a faster rate than total mass release. In heated grid devolatilization experiments using a
subbituminous and two bituminous coals at temperatures of 570 and 1270 K, Solomon
and Colket33 found that initial nitrogen release was approximately proportional to the tar
release. As mentioned previously, light gas release in most coals occurs before or
concurrent with tar release. Since the light gas does not generally contain nitrogen,
nitrogen release lags mass release early in devolatilization.
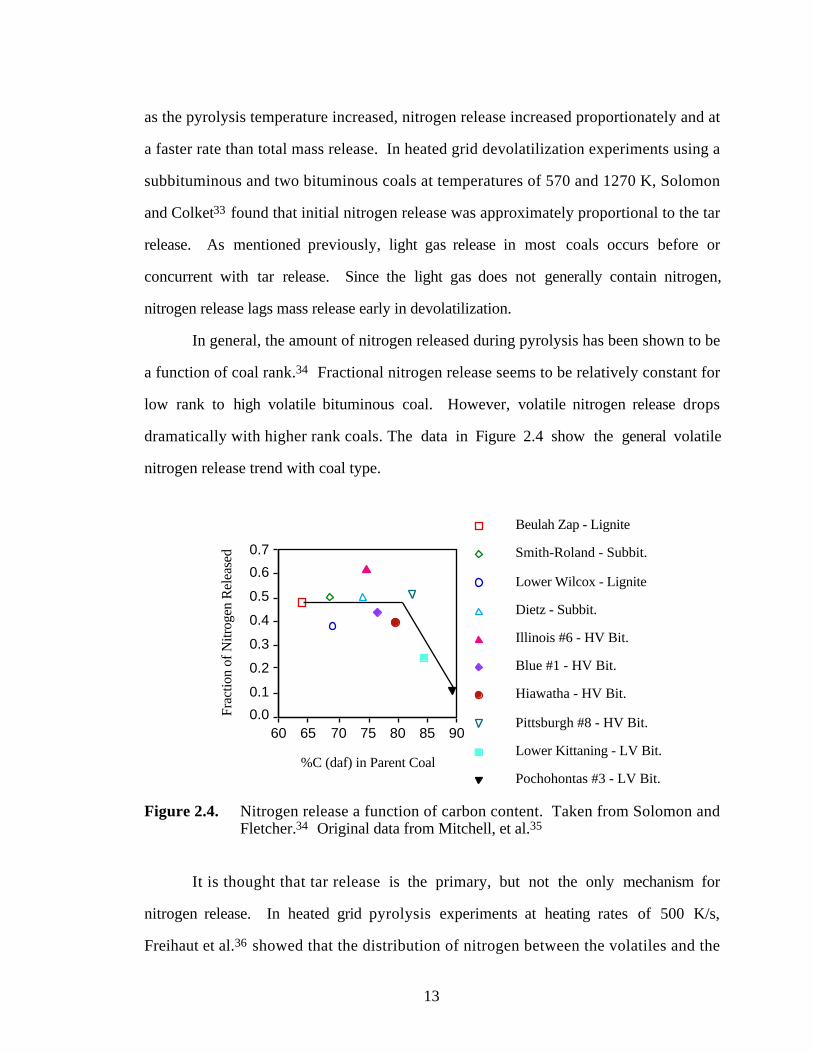
In general, the amount of nitrogen released during pyrolysis has been shown to be
a function of coal rank.34 Fractional nitrogen release seems to be relatively constant for
low rank to high volatile bituminous coal. However, volatile nitrogen release drops
dramatically with higher rank coals. The data in Figure 2.4 show the general volatile
nitrogen release trend with coal type.
0.0
0.1
0.2
0.3
0.4
0.5
0.6
0.7
Frac
tion
of N
itrog
en R
elea
sed
60 65 70 75 80 85 90
%C (daf) in Parent CoalPochohontas #3 - LV Bit.
Lower Kittaning - LV Bit.
Pittsburgh #8 - HV Bit.
Hiawatha - HV Bit.
Blue #1 - HV Bit.
Illinois #6 - HV Bit.
Dietz - Subbit.
Lower Wilcox - Lignite
Smith-Roland - Subbit.
Beulah Zap - Lignite
Figure 2.4. Nitrogen release a function of carbon content. Taken from Solomon andFletcher.34 Original data from Mitchell, et al.35
It is thought that tar release is the primary, but not the only mechanism for
nitrogen release. In heated grid pyrolysis experiments at heating rates of 500 K/s,
Freihaut et al.36 showed that the distribution of nitrogen between the volatiles and the

14
char, and hence the release mechanism, is a function of coal rank. Results indicated that at
the moderate conditions of the experiments, low rank coals preferentially release nitrogen
as HCN (or light gas nitrogen), while the bituminous coals release more nitrogen with the
tar. High rank coals were shown to release only small amounts of nitrogen as tar and
HCN. These results are summarized in Figure 2.5.
1.0
0.8
0.6
0.4
0.2
065 70 75 80 85 90 95
Char N
Total volatiles
HCN
Tar N
% C (daf)
Mas
s fr
act.
coal
N in
pro
duc
ts
Figure 2.5. The distribution of nitrogen volatiles versus carbon content. Taken fromFreihaut et al.3 6
Light gas nitrogen release (believed to be HCN and NH3) is thought to come from
two sources: (i) ring opening reactions in the char and (ii) ring opening reactions in the tar.
These two processes can occur simultaneously after the tar has been released. In a heated
grid experiment conducted by Freihaut and coworkers at 500 K/s to 1243 K, it was
shown that tar release occurred at 900-1100 K, followed by HCN release at temperatures
above 1100 K.37 It is thought that heterocyclic (i.e., pyrrolic and pyridinic) ring rupture
in chars of low rank coals occurs more easily than in chars of higher rank coals.17 This
would explain why nitrogen released as HCN is greater in low rank coals, and why
nitrogen release generally follows total mass release instead of tar release.
15
Modeling Devolatilization
Early devolatilization models were based on simple single-reactions to describe
total volatiles yields. Later, two-step models, which accounted for the competing effects
of bridge-scission and cross-linking, emerged. These simple empirical models did not rely
on the chemical structure of the original coal, and were generally based on empirical, rather
than mechanistic, approaches.5 As a result, the predictive capabilities of such models are
limited to the experimental range used to curve-fit the kinetic parameters of the particular
model. Many of these early devolatilization models are reviewed extensively by
Howard.38
More recently, Ko et al.39 presented a correlation relating maximum tar yield from
rapid pyrolysis to coal type and pressure. Ko’s correlation seems to accurately predict
the maximum tar yield for many coals. The correlation, however, does not predict tar
release as a function of time or temperature, nor does it treat light gas release.
In the last decade, as sophisticated coal characterization techniques have advanced
the understanding of coal structure and devolatilization, network devolatilization models
based on quantitative measurements of the chemical structure of coal have been
developed. These models have been successful in predicting total volatiles and tar yields
as a function of heating rate, temperature, pressure, and coal type.5 Three such
devolatilization models are the FG-DVC model,40 FLASHCHAIN,41 and the CPD
model.4 These devolatilization models have the following features in common: (i) the
parent coal is described using coal-dependent structural parameters, generally derived
from NMR spectroscopy, TG-FTIR, py-MS, and/or other techniques; (ii) a statistical
network model is used to describe the highly non-linear relationship between bridge
scission and tar release; (iii) first order rate expressions with distributed activation
energies are used to model the depolymerization of the infinite matrix, crosslinking of the
metaplast with the matrix, and light gas formation; and (iv) a correlation of vapor pressure
with tar molecular weight is used to help model tar vaporization. The network
16
devolatilization models are advantageous because they take a mechanistic approach, as
opposed to a mere empirical curve-fitting approach, resulting in greater predictive
capability and a wider range of applicability. A detailed summary of network
devolatilization models is given by Smith, et al.5
Industrial interest in devolatilization of coals has led to a number of attempts to
model structural input parameters (such as 13C NMR structural parameters) of coal based
on simple linear correlations with the ultimate analysis of the coal. Only a brief
description of the correlations between chemical structural features and the ultimate
analysis used in the FG-DVC and FLASHCHAIN devolatilization models is given here.
A brief summary of the CPD model is also included since it was used extensively in this
project.
The FG-DVC Model
In the FG-DVC model40 coal is represented as a two-dimensional Bethe lattice of
aromatic clusters linked by aliphatic bridges. Various experimental techniques including
TG-FTIR, solvent swelling and extraction, NMR, and FIMS must be employed to
provide the needed input parameters for the FG-DVC which describe the coal structure
and evolution kinetics. For coals where no such experimental data are available, Serio, et
al.42 proposed a two-dimensional linear interpolation technique based on coal rank to
estimate the input parameters for the FG-DVC model of coal devolatilization. The
oxygen/carbon and hydrogen/carbon molar ratios were used as indicators of rank. The
elemental ratios of nine well-studied reference coals (6 from the Argonne Premium Coal
Sample Program and 3 from the Penn State Coal Sample Bank) were used to form a two-
dimensional triangular mesh on a H/C vs. O/C coalification diagram. Each triangle was
composed of three nodes (i.e. reference coals). For an unknown coal, the elemental
composition determined the appropriate triangle, and the structural parameters of the
unknown coal were interpolated from the parameters corresponding to the three nodes.

17
This triangular interpolation scheme was used for all of the model parameters for the FG-
DVC model based only on the elemental composition of the coal.
FLASHCHAIN
FLASHCHAIN41 uses a linear chain model to represent coal structure, and several
input parameters to describe the parent coal structure. Among these are the fraction of
intact bridges (p0) as determined through pyridine extract yields, carbon aromaticity (fa’),
proton aromaticity (Hfa’), and aromatic carbons per cluster (AC/Cl). These last three
parameters are tuned to empirically match devolatilization data, and then compared with
solid-state 13C NMR spectroscopy of the coal (on those coals for which data exist). To
extend FLASHCHAIN’s ability to predict ultimate yields where only the ultimate
analysis is available, simple (mainly linear) correlations were developed to estimate the
input parameters as a function of the ultimate analysis alone (mainly percent carbon).43
For example, in FLASHCHAIN, the carbon aromaticity, fa’, is estimated using a simple
linear correlation. Data reported by Gerstein44 were used to correlate fa’ with the carbon
content resulting in the following correlation:
fa' = 0.0159(%C,daf) − 0.564. (2.1)
In FLASHCHAIN p0, Hfa’, and AC/Cl are also estimated using simple linear correlations
with the carbon content.41
The CPD Model
In the CPD (Chemical Percolation Devolatilization) model4 coal is represented as
a two-dimensional Bethe lattice of aromatic clusters linked by aliphatic bridges. The CPD
model distributes devolatilization products into char, tar, and light gas fractions. It does
not distribute light gas into individual components such as CO2, CO, H2O, H2, and light
18
hydrocarbons. Percolation statistics are used to describe the network decomposition.
The CPD model is composed of five key elements: (i) a description of the parent coal
based on quantitative 13C NMR measurements of chemical structure; (ii) a bridge reaction
mechanism with associated kinetics; (iii) percolation lattice statistics to determine the
relationship between bridge breaking and detached fragments which are tar precursors; (iv)
a vapor-liquid equilibrium mechanism to determine the fraction of liquids that vaporize;
and (v) a cross-linking mechanism for high molecular weight tar precursors to reattach to
the char.4 Four of the parameters derived from 13C NMR analyses that describe the
structure of the parent coal are used directly as input parameters to the CPD model.4, 12
These include Mcl (the average molecular weight per aromatic cluster), Mδ (the average
side-chain molecular weight), σ+1 (the average number of attachments per cluster), and p0
(the fraction of intact bridges). The CPD model is unique because the majority of the
model input parameters are taken directly from NMR data; other models use these
parameters as empirical fitting coefficients. This helps justify the CPD model on a
mechanistic rather than on an empirical basis.
Modeling Volatile Nitrogen Release
It is thought that nitrogen is released during primary devolatilization in two
ways:17, 45 (i) nitrogen contained in the aromatic clusters is transported away as large
aromatic tar molecules escape the coal matrix (this is often the primary mode of nitrogen
release during devolatilization); and (ii) additional nitrogen can be released as HCN and
NH3 (light gas nitrogen) after the rupture of aromatic rings containing nitrogen
heteroatoms. The detailed chemistry of HCN and NH3 formation has not yet been
determined. However, it is believed that nitrogen is first released as HCN. NH3 is then
formed from subsequent reactions with hydrogen.45
Nitrogen release models have been developed and incorporated into the FG-
DVC45 and FLASHCHAIN17 devolatilization models. Several simplifying assumptions
19
are made in these models: (i) nitrogen atoms are randomly distributed throughout the
aromatic clusters of the coal; (ii) nitrogen atoms contained in the aromatic clusters of the
metaplast are transported from the coal matrix during tar evolution; and (iii) opening and
condensation reactions of rings containing nitrogen heteroatoms do not significantly affect
aromatic cluster molecular weight (since the nitrogen content is low). Both models use
first order kinetics to describe the rate of release of nitrogen from the char.
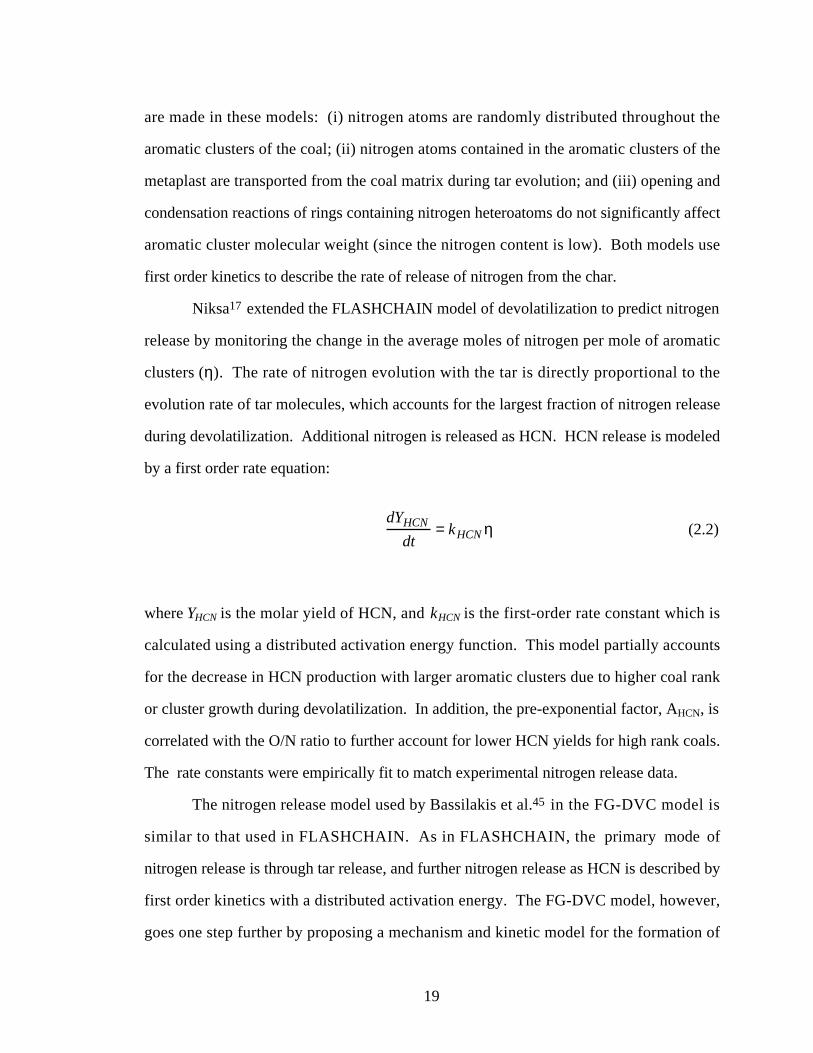
Niksa17 extended the FLASHCHAIN model of devolatilization to predict nitrogen
release by monitoring the change in the average moles of nitrogen per mole of aromatic
clusters (η). The rate of nitrogen evolution with the tar is directly proportional to the
evolution rate of tar molecules, which accounts for the largest fraction of nitrogen release
during devolatilization. Additional nitrogen is released as HCN. HCN release is modeled
by a first order rate equation:
dYHCN
dt= kHCN η (2.2)
where YHCN is the molar yield of HCN, and kHCN is the first-order rate constant which is
calculated using a distributed activation energy function. This model partially accounts
for the decrease in HCN production with larger aromatic clusters due to higher coal rank
or cluster growth during devolatilization. In addition, the pre-exponential factor, AHCN, is
correlated with the O/N ratio to further account for lower HCN yields for high rank coals.
The rate constants were empirically fit to match experimental nitrogen release data.
The nitrogen release model used by Bassilakis et al.45 in the FG-DVC model is
similar to that used in FLASHCHAIN. As in FLASHCHAIN, the primary mode of
nitrogen release is through tar release, and further nitrogen release as HCN is described by
first order kinetics with a distributed activation energy. The FG-DVC model, however,
goes one step further by proposing a mechanism and kinetic model for the formation of

20
NH3. Bassilakis, et al.45 noted three important nitrogen release trends pertaining to HCN
and NH3 release during devolatilization: (i) lower rank coals release a larger fraction of
their nitrogen as HCN and NH3; (ii) in slow heating rate experiments (30 K/s) conducted
on the Argonne premium coals, it was observed that HCN release generally preceded NH3
release; and (iii) in a comparison of slow heating rate data with rapid heating rate nitrogen
release data it was observed that only in the slow heating rate experiment was a significant
amount of nitrogen released as NH3.
Bassilakis proposed a simple mechanism to explain the second two observations.
First, HCN evolves directly from the char.45 Then, as the gas exits the particle though
the pore structure of the char, gaseous HCN reacts heterogeneously with coal hydrogen to
form NH3, as depicted below:
N(char) +C(char)+ H(char)→ HCN + H(char) → HCN +NH 3. (2.3)
Since residence times within the pore structure are much longer at slow heating rates, this
mechanism could explain why NH3 was only observed at slower heating rates. This
phenomena was modeled in the FG-DVC model by using a simplified single cell structure
to estimate residence time and a swelling model to estimate the swelling ratio. The HCN
evolution rate was corrected to account for conversion to NH3 based on the residence time
in the pore.
The model developed in this thesis will differ from the volatile nitrogen release
models developed for FLASHCHAIN and the FG-DVC model in that nitrogen release
will be based on the chemical structure of coal as measured by 13C NMR spectroscopy.
This will allow model predictions to be compared not only with nitrogen release data, but
also with structural characteristics derived from available 13C NMR measurements of char
structure.
21
Summary
Significant progress has been made during the last decade in understanding the
structure and reaction processes of coal. Solid-state analysis techniques such as 13C
NMR spectroscopy have led to a better awareness of how the chemical structure of coal
evolves during pyrolysis. Extensive devolatilization experiments have led to increased
knowledge of the dependence of pyrolysis on temperature, heating rate, pressure, and
coal type. Increased regulation of NOx emissions in recent years has led to pryolysis
research that has substantially increased the understanding of the functionality of nitrogen
in coal and the chemistry of nitrogen release. Increased understanding of coal structure
and reaction processes has led to the development of advanced devolatilization models
that predict tar and total volatiles yields and the composition of light gas as a function of
coal type, temperature, pressure, and heating rate. The time and expense involved in
performing coal specific analyses required to measure the input parameters for
devolatilization models makes it difficult to apply the models to coals that have not
already been well characterized. Therefore, correlations have been developed to estimate
structural input parameters for the FG-DVC and FLASHCHAIN models of
devolatilization based on more easily obtained data such as the elemental composition.
Also, in just the last few years, submodels that predict the quantity of nitrogen released
with the tar and as light gas have been incorporated into the FG-DVC and
FLASHCHAIN models.
The following are several features that set the CPD model apart from other
devolatilization models and attract a great deal of industrial interest: (i) the description of
the coal structure is accurately determined from solid-state 13C NMR analysis of the
parent coal; (ii) the CPD model is truly predictive (based only on a given pressure,
temperature profile, and parent coal structure, total volatiles and tar yields are predicted);
(iii) the CPD model features very rapid convergence (low computer time requirements);
(iv) the CPD model has been successfully implemented into comprehensive coal models

22
such as PCGC-3;3 and (v) the CPD model is available free of charge. The CPD model,
however, does not currently treat nitrogen release or light gas composition. Furthermore,
unlike the FG-DVC and FLASHCHAIN models, there is no alternative method to
estimate the original structure of the parent coal when 13C NMR data are not available.
23
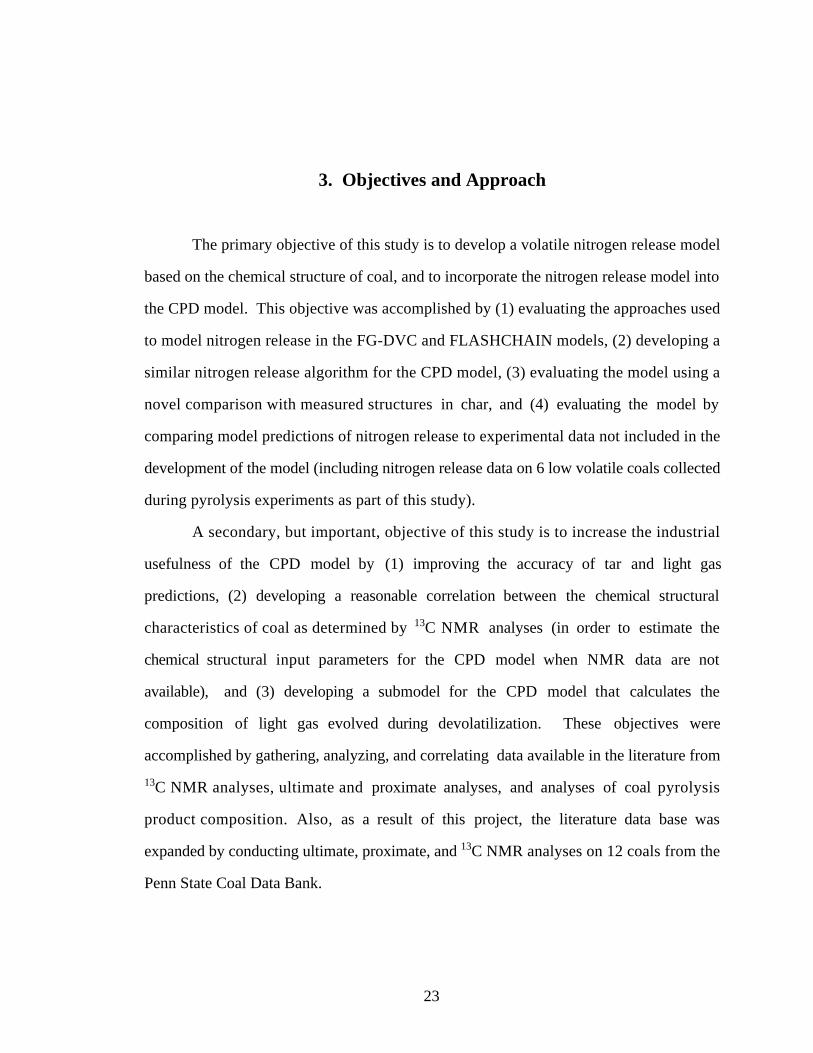
3. Objectives and Approach
The primary objective of this study is to develop a volatile nitrogen release model
based on the chemical structure of coal, and to incorporate the nitrogen release model into
the CPD model. This objective was accomplished by (1) evaluating the approaches used
to model nitrogen release in the FG-DVC and FLASHCHAIN models, (2) developing a
similar nitrogen release algorithm for the CPD model, (3) evaluating the model using a
novel comparison with measured structures in char, and (4) evaluating the model by
comparing model predictions of nitrogen release to experimental data not included in the
development of the model (including nitrogen release data on 6 low volatile coals collected
during pyrolysis experiments as part of this study).
A secondary, but important, objective of this study is to increase the industrial
usefulness of the CPD model by (1) improving the accuracy of tar and light gas
predictions, (2) developing a reasonable correlation between the chemical structural
characteristics of coal as determined by 13C NMR analyses (in order to estimate the
chemical structural input parameters for the CPD model when NMR data are not
available), and (3) developing a submodel for the CPD model that calculates the
composition of light gas evolved during devolatilization. These objectives were
accomplished by gathering, analyzing, and correlating data available in the literature from
13C NMR analyses, ultimate and proximate analyses, and analyses of coal pyrolysis
product composition. Also, as a result of this project, the literature data base was
expanded by conducting ultimate, proximate, and 13C NMR analyses on 12 coals from the
Penn State Coal Data Bank.

24
The correlation of 13C NMR parameters will be discussed first (Chapter 4) since
that correlation was used to help evaluate the nitrogen release model. The nitrogen release
model will then be discussed in Chapter 5, followed by the method to calculate the
composition of light gas (Chapter 6).

25
Chapter 4. 13C NMR Correlation
13C NMR spectroscopy has been shown to be an important tool in the
characterization of coal structure.5 Important quantitative information about the carbon
skeletal structure is obtained through 13C NMR spectral analysis of coal. Solid-state 13C
NMR analysis techniques have progressed beyond the mere determination of aromaticity,
and can now describe features such as the number of aromatic carbons per cluster and the
number of attachments per aromatic cluster. These 13C NMR data have been used to
better understand the complicated structure of coal, to compare structural differences in
coal, tar, and char, and to model coal devolatilization.
Unfortunately, due to the expense of the process, extensive 13C NMR data are not
available for most coals. A non-linear correlation was therefore developed that predicts
the chemical structure parameters of both U.S. and non-U.S. coals measured by 13C NMR
and often required for advanced devolatilization models. The chemical structure
parameters correlated include: (i) the average molecular weight per side chain (Mδ); (ii) the
average molecular weight per aromatic cluster (Mcl); (iii) the ratio of bridges to total
attachments (p0); and (iv) the total attachments per cluster (σ+1). The correlation is
based on the elemental and volatile matter content, which are generally known for most
coals. 13C NMR data from 30 coals were used to develop this correlation. Before this
project, 13C NMR data of this type were only available for 18 coals. As part of this
project, proximate, ultimate, and 13C NMR analyses were conducted on 12 additional
coals to expand the data set to 30 coals. The correlation was used to estimate the
chemical structure parameters obtained from 13C NMR measurements, and then applied
to coal devolatilization predictions using the CPD model. It will be shown that the
predicted yields compare well with measured yields for most coals.

26
Evaluation of Linear Correlations
An extensive statistical analysis was performed previously to determine the
validity of linearly correlating the 13C NMR structural parameters with the ultimate
analysis and ASTM volatile matter content.46 A data base including the elemental
composition, ASTM volatile matter content, and the four 13C NMR structural parameters
for 30 coals of varying rank was used in the analysis (see Tables 4.1, 4.2 and 4.3).
Preliminary results indicated that linear correlations of most 13C NMR parameters versus
elemental composition and/or volatiles content were not acceptable. This preliminary
work suggested that non-linear correlations may prove to be of more value.
The previously mentioned database was re-examined using NCSS, a software
package for statistical data analysis.47 A linear correlation matrix was calculated between
the 13C NMR structural parameters and the ultimate analysis data. From the correlation
matrix, the strengths of relationships between the individual elements and the derived
parameters were easily determined. The 13C NMR structural parameters were also
examined for relationships among themselves. Multi-variate linear regression was then
performed to derive the best possible linear combinations to predict each of the
parameters as a function of the elemental composition and ASTM volatile matter content.
The coefficient of determination, r2, which is an indication of the relative strength of
correlation, was determined for each relationship (r2=1 would be a perfect correlation).
The r2 values for the linear correlations, as determined by NCSS, ranged from 0.12
for σ+1 to 0.60 for p0 (r2= 0.56 and 0.13 for Mδ and Mcl, respectively). With the
possible exceptions of Mδ and p0, these are very weak correlations. As a result of this
study, it was reaffirmed that correlations based on linear regressions of the ultimate
analysis data are generally not suitable to accurately predict the structural parameters.
The purpose of the current investigation is to develop non-linear correlations that
might be used to estimate the structural parameters for the network devolatilization
models when 13C NMR data are not available. Although one of the principal motives for

27
this study has been the estimation of the input parameters for the CPD model, the
estimated structural parameters should be useful in other applications, and a similar
approach could be used to develop predictive models for other structural parameters.
Correlation Development
Experimental Data
Tables 4.1, 4.2, and 4.3 show the database of 30 coals used in this study, including
the ultimate analysis and the four chemical structure parameters derived from 13C NMR
analysis. The first eight coals are Argonne premium coals, coals 9-11 were studied at the
Advanced Combustion Engineering Research Center (ACERC), coals 12-16 were studied
at Sandia National Laboratories (selected from the Penn State Coal Bank), coals 17-18
were studied at Advanced Fuel Research, and coals 19-30 were selected from the Penn
State Coal Bank to expand the database for this study. As part of this project coals 19-
30 were ground and sieved, and the 53-75 µm size fraction was examined using solid-state
13C NMR analyses.12, 48 A Leco CHNS-932 elemental analyzer was used to determine
the elemental composition of coals 19-30 (oxygen was obtained by difference).49 Also,
for coals 19-30, proximate analysis was performed according to ASTM procedures to
determine ash and volatile matter content. The 30 coals in Table 4.1 vary widely in rank
as shown in the coalification chart in Figure 4.1
Procedure
As a first step, each of the 13C NMR parameters was plotted versus each
independent variable (i.e. elemental composition and ASTM volatile matter content).
This permitted a first order screening to determine the relative dependence on each
independent variable, and allowed a visual inspection of correlation patterns. Secondly, a
separate non-linear (i.e., a polynomial) correlation was made for each independent
variable, and a pseudo r2 value was calculated to determine the strength of each

28
correlation. A variety of equation forms were examined, and experience showed that a
cubic polynomial generally resulted in the best fit for most parameters. Finally, from the
individual polynomial correlations, the form of the correlation was derived between each
13C NMR parameter and the combination of all of the independent variables.
Table 4.1
List of Coals Used in 13C NMR Correlation
# Source Seam ASTM Rank Location
1 PSOC 1507 (AR) Beulah-Zap ligA Mercer Co., ND2 PSOC-1520 (AR) Wyodak subC Campbell Co., WY3 PSOC-1502 (AR) Blind Canyon hvBb Emery Co., UT4 PSOC-1493 (AR) Illinois #6 hvCb St. Clair Co., IL5 PSOC-1451 (AR) Pittsburgh #8 hvAb Green Co., PA6 ANL (AR) Stockton hvAb Kanawha Co., WV7 ANL (AR) Upper Freeport mvb Indiana Co., PA8 PSOC-1508 (AR) Pocahontas #3 lvb McDowell Co., WV9 PSOC-1443 (ACERC) Lower Wilcox ligA Titus Co., TX10 PSOC-1488 (ACERC) Dietz subB Bighorn Co., WY11 PSOC-1468 (ACERC) Buck Mountain an Luzerne Co., PA12 PSOC-1445D (Sandia) Blue #1 hvCb Mckinley Co., NM13 PSOC-1451D (Sandia) Pittsburg #8 hvAb Green Co., PA14 PSOC-1493D (Sandia) Illinois #6 hvab St. Clair Co., IL15 PSOC-1507D (Sandia) Beulah-Zap ligA Mercer Co., ND16 PSOC-1508D (Sandia) Pocahontas #3 mvb McDowell Co., WV17 Goudey A (AFR) not named hvb -----18 Goudey B (AFR) not named lvb -----19 DECS-1 (BYU) Bottom subC Freestone Co., TX20 DECS-7 (BYU) Adaville #1 hvCb Lincoln Co., WY21 DECS-11 (BYU) Beulah-Zap ligA Mercer Co., ND22 DECS-13 (BYU) Sewell mvb Greenbrier Co., WV23 DECS-18 (BYU) Kentucky #9 hvBb Union Co., KY24 DECS-20 (BYU) Elkhorn #3 hvAb Floyd Co., KY25 DECS-21 (BYU) Lykens Valley #2 an Columbia Co., PA26 DECS-27 (BYU) Deadman subA Sweetwater Co., WY27 PSOC-1515 (BYU) Penna. Semian. C sa Sullivan Co., PA28 PSOC-1516 (BYU) Lower Kittanning lvb Somerset Co., PA29 PSOC-1520 (BYU) Smith-Roland subC Cambell Co., WY30 PSOC-1521 (BYU) Lower Hartshorne lvb Sebastian Co., AR

29
Table 4.2
Properties of Coals Used in 13C NMR Correlation
# Source % C(daf)
% H(daf)
% O(daf)
% N(daf)
% S(daf)
ASTM VM(daf)
1 PSOC 1507 (AR) 72.9 4.83 20.34 1.15 0.70 49.82 PSOC-1520 (AR) 75.0 5.35 18.02 1.12 0.47 49.03 PSOC-1502 (AR) 80.7 5.76 11.58 1.57 0.37 48.14 PSOC-1493 (AR) 77.7 5.00 13.51 1.37 2.38 47.45 PSOC-1451 (AR) 83.2 5.32 8.83 1.64 0.89 41.76 ANL (AR) 82.6 5.25 9.83 1.56 0.65 37.67 ANL (AR) 85.5 4.70 7.51 1.55 0.74 31.68 PSOC-1508 (AR) 91.1 4.44 2.47 1.33 0.50 19.59 PSOC-1443 (ACERC) 72.3 5.21 20.11 1.35 0.94 78.710 PSOC-1488 (ACERC) 76.0 5.23 17.27 0.94 0.53 44.211 PSOC-1468 (ACERC) 95.4 1.38 1.86 0.84 0.53 3.912 PSOC-1445D (Sandia) 75.6 5.26 17.33 1.32 0.49 48.213 PSOC-1451D (Sandia) 84.2 5.54 7.56 1.65 1.01 38.714 PSOC-1493D (Sandia) 74.1 4.96 13.18 1.45 6.29 43.415 PSOC-1507D (Sandia) 66.6 4.26 25.16 1.12 2.89 49.616 PSOC-1508D (Sandia) 88.8 4.37 5.14 1.06 0.60 17.217 Goudey A (AFR) 87.9 3.77 4.65 1.31 2.37 36.918 Goudey B (AFR) 88.5 4.94 1.40 na 1.75 19.319 DECS-1 (BYU) 70.7 5.83 20.83 1.47 1.18 53.620 DECS-7 (BYU) 72.5 5.22 20.09 1.17 1.04 45.621 DECS-11 (BYU) 68.5 4.94 24.96 1.00 0.64 61.722 DECS-13 (BYU) 85.5 4.91 7.12 1.72 0.72 33.223 DECS-18 (BYU) 79.4 5.62 8.57 1.74 4.71 44.624 DECS-20 (BYU) 82.7 5.73 8.76 1.78 0.99 40.525 DECS-21 (BYU) 93.8 2.72 1.96 0.92 0.62 5.126 DECS-27 (BYU) 76.5 5.24 15.95 1.53 0.76 40.627 PSOC-1515 (BYU) 88.4 4.02 5.47 1.24 0.86 11.828 PSOC-1516 (BYU) 86.2 4.86 4.64 1.81 2.45 21.629 PSOC-1520 (BYU) 67.4 5.37 24.39 1.00 1.84 53.430 PSOC-1521 (BYU) 91.2 4.56 1.53 1.82 0.89 23.5
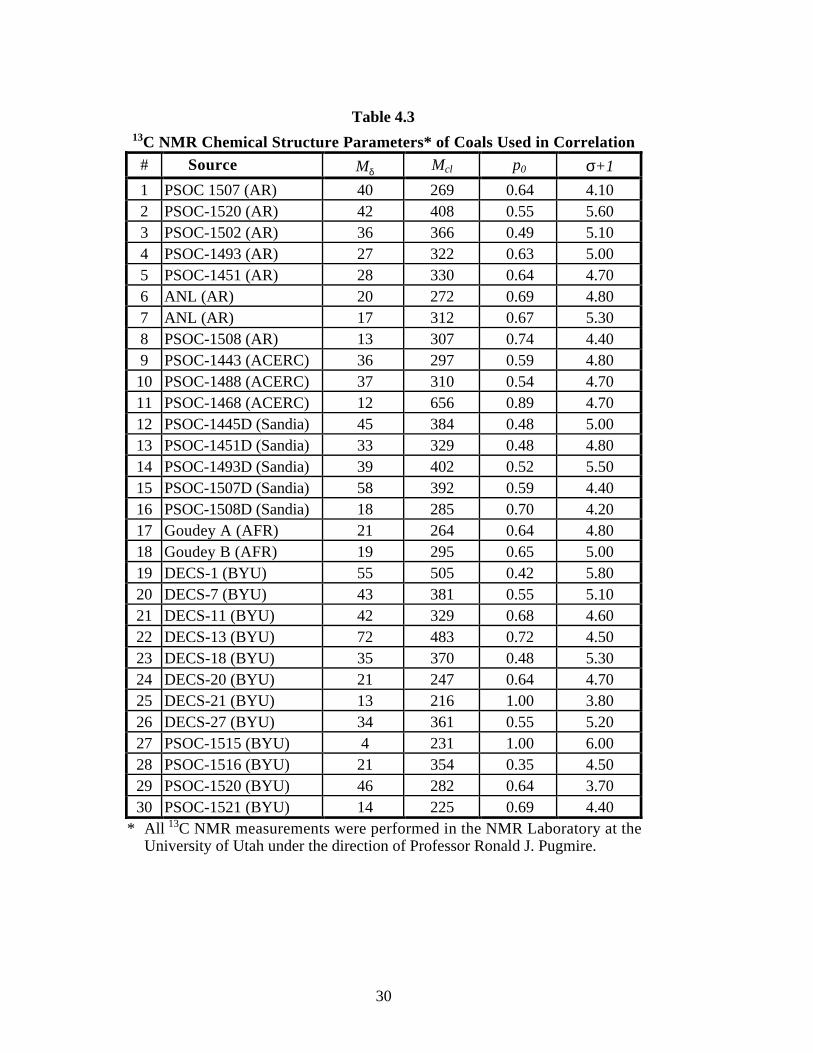
30
Table 4.313C NMR Chemical Structure Parameters* of Coals Used in Correlation
# Source Mδ Mcl p0 σ+1
1 PSOC 1507 (AR) 40 269 0.64 4.102 PSOC-1520 (AR) 42 408 0.55 5.603 PSOC-1502 (AR) 36 366 0.49 5.104 PSOC-1493 (AR) 27 322 0.63 5.005 PSOC-1451 (AR) 28 330 0.64 4.706 ANL (AR) 20 272 0.69 4.807 ANL (AR) 17 312 0.67 5.308 PSOC-1508 (AR) 13 307 0.74 4.409 PSOC-1443 (ACERC) 36 297 0.59 4.8010 PSOC-1488 (ACERC) 37 310 0.54 4.7011 PSOC-1468 (ACERC) 12 656 0.89 4.7012 PSOC-1445D (Sandia) 45 384 0.48 5.0013 PSOC-1451D (Sandia) 33 329 0.48 4.8014 PSOC-1493D (Sandia) 39 402 0.52 5.5015 PSOC-1507D (Sandia) 58 392 0.59 4.4016 PSOC-1508D (Sandia) 18 285 0.70 4.2017 Goudey A (AFR) 21 264 0.64 4.8018 Goudey B (AFR) 19 295 0.65 5.0019 DECS-1 (BYU) 55 505 0.42 5.8020 DECS-7 (BYU) 43 381 0.55 5.1021 DECS-11 (BYU) 42 329 0.68 4.6022 DECS-13 (BYU) 72 483 0.72 4.5023 DECS-18 (BYU) 35 370 0.48 5.3024 DECS-20 (BYU) 21 247 0.64 4.7025 DECS-21 (BYU) 13 216 1.00 3.8026 DECS-27 (BYU) 34 361 0.55 5.2027 PSOC-1515 (BYU) 4 231 1.00 6.0028 PSOC-1516 (BYU) 21 354 0.35 4.5029 PSOC-1520 (BYU) 46 282 0.64 3.7030 PSOC-1521 (BYU) 14 225 0.69 4.40
* All 13C NMR measurements were performed in the NMR Laboratory at theUniversity of Utah under the direction of Professor Ronald J. Pugmire.
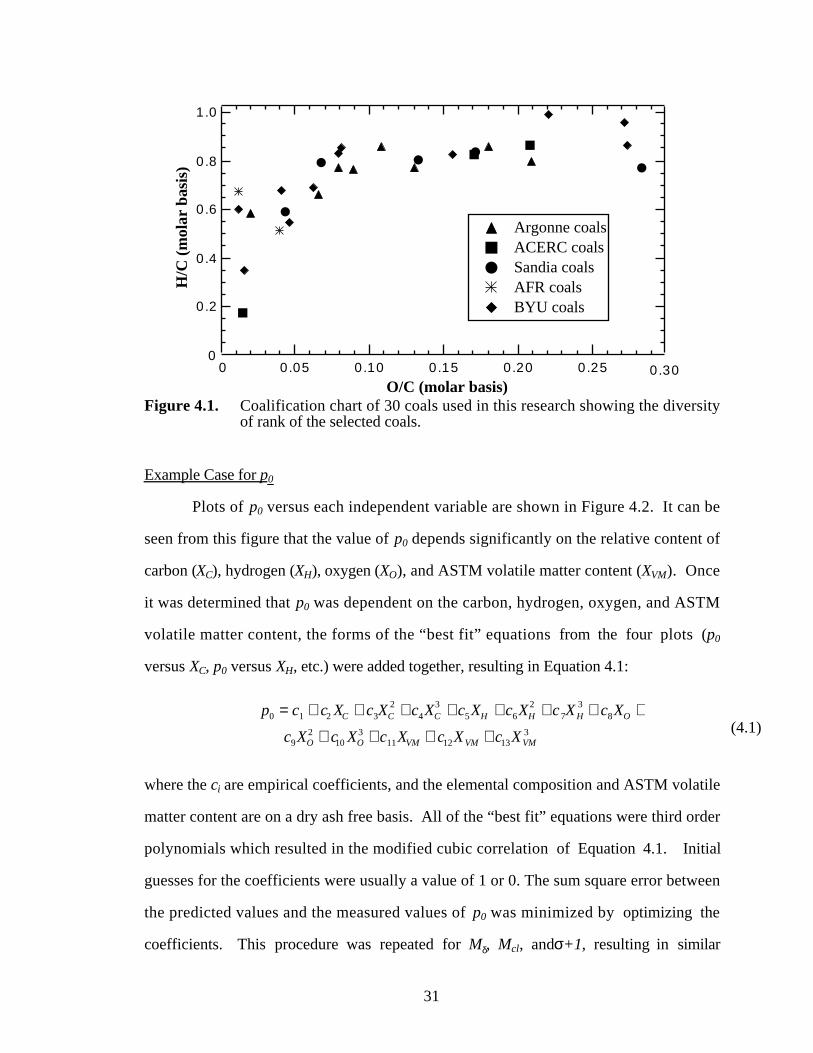
31
1.0
0.8
0.6
0.4
0.2
H/C
(m
olar
bas
is)
0.250.200.150.100.05O/C (molar basis)
Argonne coals ACERC coals Sandia coals AFR coals BYU coals
00.300
Figure 4.1. Coalification chart of 30 coals used in this research showing the diversityof rank of the selected coals.
Example Case for p 0
Plots of p0 versus each independent variable are shown in Figure 4.2. It can be
seen from this figure that the value of p0 depends significantly on the relative content of
carbon (XC), hydrogen (XH), oxygen (XO), and ASTM volatile matter content (XVM). Once
it was determined that p0 was dependent on the carbon, hydrogen, oxygen, and ASTM
volatile matter content, the forms of the “best fit” equations from the four plots (p0
versus XC, p0 versus XH, etc.) were added together, resulting in Equation 4.1:
p0 = c1 + c2 XC + c3XC2 + c4XC
3 + c5XH + c6XH2 + c7XH
3 + c8XO +
c9XO2 + c10 XO
3 + c11XVM + c12XVM + c13XVM3 (4.1)
where the ci are empirical coefficients, and the elemental composition and ASTM volatile
matter content are on a dry ash free basis. All of the “best fit” equations were third order
polynomials which resulted in the modified cubic correlation of Equation 4.1. Initial
guesses for the coefficients were usually a value of 1 or 0. The sum square error between
the predicted values and the measured values of p0 was minimized by optimizing the
coefficients. This procedure was repeated for Mδ, Mcl, andσ+1, resulting in similar

32
equations. Through this study it was determined that the chemical structural parameters
have little dependence on the relative content of sulfur and nitrogen (see Figure 4.2).
Therefore, sulfur and nitrogen were omitted from the correlations.
Final NMR Correlation
During the course of this research, while applying this modified cubic correlation
to additional sets of NMR data for other coals, it was found that unrealistic values for Mcl
and σ+1 were obtained for low rank coals (XO > 0.25) and high rank coals (VM < 0.10).
For example, some predicted values of Mcl were less than 100 daltons; the lowest NMR
measurement for any coal was ~200 daltons. These unrealistic predicted values seemed to
be the result of extrapolations of the cubic curve beyond the original data set. Therefore,
the curve-fitting procedure was repeated for a quadratic set of equations, as shown below:
y = c1 + c2 XC + c3XC2 + c4 XH + c5XH
2 + c6XO + c7 XO2 + c8XVM + c9XVM
2 (4.2)
where y = Mδ , Mcl, σ+1, and p0. By using the quadratic correlation rather than the cubic,
the number of coefficients were reduced, with a small corresponding penalty in the value
of r2. The extrapolated values of the quadratic correlation seemed more reasonable for
low and high rank coals.
To further improve the correlations, NCSS (Number Cruncher Statistical
Software) was used to examine the data set for outliers and cross-correlations.47 A factor
analysis was performed to determine the optimum number of independent variables to be
used in each correlation. Based on this analysis, it was determined that Equation 4.2 is a
suitable correlation. The data set was screened with the aid of NCSS for outliers by
examining the normal probability plots of the residuals (a plot of the inverse of the
standard normal curve versus the ordered observations) of each dependent variable (Mcl,
Mδ , σ+1, and p0). Stragglers at either end of the normal probability plot indicate outliers.

33
1.0
0.9
0.8
0.7
0.6
0.5
0.4
p 0
1.81.61.41.21.0% nitrogen (daf)
1.0
0.9
0.8
0.7
0.6
0.5
0.4
� p 0
959085807570
% carbon (daf)
1.0
0.9
0.8
0.7
0.6
0.5
0.4
p 0
5432
% hydrogen (daf)
1.0
0.9
0.8
0.7
0.6
0.5
0.4
p 0
252015105% oxygen (daf)
a b
c d
r2 = 0.499 r2 = 0.563
r2 = 0.314 r2 = 0.230
1.0
0.9
0.8
0.7
0.6
0.5
0.4
p 0
604020% ASTM volatile matter (daf)
1.0
0.9
0.8
0.7
0.6
0.5
0.4
p 0
654321% sulfur (daf)
r2 = 0.546r2 = 0.119e f
Figure 4.2. Plots of p0 versus (a) % carbon (daf), (b) % hydrogen (daf), (c) % oxygen(daf), (d) % nitrogen, (e) % sulfur, and (f) % ASTM volatile mattercontent.

34
It was observed that the residuals of all of the dependent variables were normally
distributed with the exception of a few stragglers. Further examination of the stragglers
by comparing the stragglers with values of the same parameter from similar coals
confirmed that some of these data were non-representative. These non-representative
data points were removed from each correlation (see Table 4.4), which substantially
increased the r2 value in some cases.
Table 4.4
Outliers Removed from Correlations
NMR parameter data points removed
Mδ 6, 7, 22, 24, 27
Mcl 22, 24
P0 6, 24, 27, 28
σ+1 1, 19, 27
During the course of this research, it was observed that the measured structural
parameters, Mδ and p0, of the two separate Pittsburgh #8 and of the two separate Illinois
#6 samples (ANL and Sandia) are remarkably different. Further examination of the 13C
NMR data base revealed that the values of Mδ of the ANL Pittsburgh #8, ANL Illinois #6,
and ANL Stockton coals were small compared to other hv-bituminous coals of similar
composition, and that the values of p0 for the same coals were large compared to other hv-
bituminous coals. The unusual values of Mδ and p0 of these three ANL coals are likely due
to the fact that, unlike the other coals in the data base, the ANL coals have never been
exposed to oxygen. Because these values of Mδ and p0 appear to be non-representative of
coals that have been exposed to oxygen, the values of Mδ and p0 for the ANL Pittsburgh
#8, ANL Illinois #6, and ANL Stockton coals were omitted when deriving the correlations.
It is hoped that future research can be conducted to verify if the cause of the differences
in these parameters is actually due to weathering.

35
The non-linear curve fitting package in NCSS was used to determine the
coefficients corresponding to each equation. NCSS estimates the parameters of the non-
linear models using the Levenberg-Marquardt non-linear least squares algorithm.50 The
coefficients resulting from this curve fit are listed in Table 4.5.
Table 4.5
Coefficients of Modified Quadratic Correlations
Mδ Mcl P0 σ +1
c1 4.220E+2 1.301E+3 4.898E-1 -5.2105E+1
c2 -8.647E+0 1.639E+1 -9.816E-3 1.6387E+0
c3 4.639E-2 -1.875E-1 1.330E-4 -1.0755E-2
c4 -8.473E+0 -4.548E+2 1.555E-1 -1.2369E+0
c5 1.182E+0 5.171E+1 -2.439E-2 9.3194E-2
c6 1.154E+0 -1.007E+1 7.052E-3 -1.6567E-1
c7 -4.340E-2 7.608E-2 2.192E-4 4.0956E-3
c8 5.568E-1 1.360E+0 -1.105E-2 9.2610E-3
c9 -6.546E-3 -3.136E-2 1.009E-4 -8.2672E-5
The coefficients of determination, r2,were 0.94, 0.72, 0.88, and 0.62 for the
quadratic correlations of Mδ, Mcl, p0 and, σ+1, respectively. There is no direct r2 defined
for non-linear regression. The r2 value calculated by NCSS and reported here is a pseudo
r2 value constructed to approximate the r2 value used in multiple regression. The version
of r2 used for non-linear regression indicates how well the model performs after removing
the influence of the mean of the dependent variable. For example, an r2 value of 0.72 for
Mcl means that approximately 72% of the variance of Mcl can be explained by the non-
linear relationship between Mcl and the independent variables (i.e. elemental composition
and ASTM volatile matter content). Only about 62%, however, of the variance of σ+1 is
explained by the correlation. The chemical structure parameters estimated by the
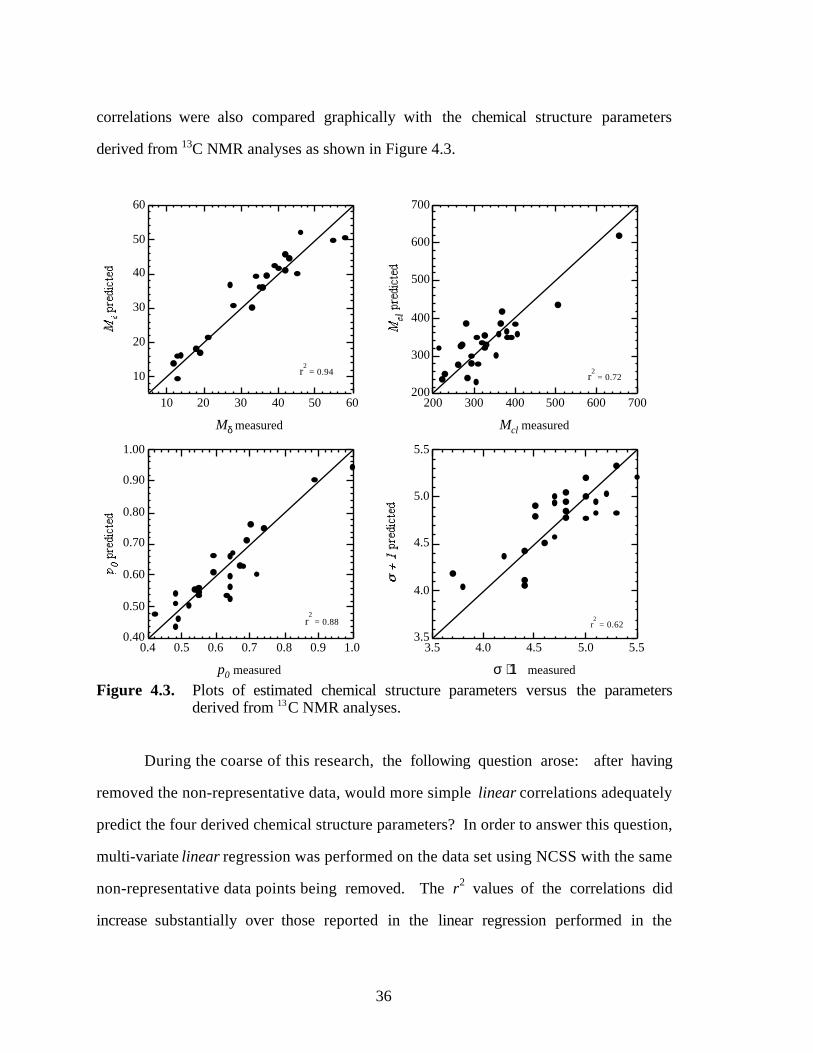
36
correlations were also compared graphically with the chemical structure parameters
derived from 13C NMR analyses as shown in Figure 4.3.
60
50
40
30
20
10
605040302010
Mδ measured
r2 = 0.94
700
600
500
400
300
200700600500400300200
Mcl measured
r2 = 0.72
1.00
0.90
0.80
0.70
0.60
0.50
0.401.00.90.80.70.60.50.4
p0 measured
r2 = 0.88
5.5
5.0
4.5
4.0
3.55.55.04.54.03.5
σ + 1 measured
r2 = 0.62
Figure 4.3. Plots of estimated chemical structure parameters versus the parametersderived from 13C NMR analyses.
During the coarse of this research, the following question arose: after having
removed the non-representative data, would more simple linear correlations adequately
predict the four derived chemical structure parameters? In order to answer this question,
multi-variate linear regression was performed on the data set using NCSS with the same
non-representative data points being removed. The r2 values of the correlations did
increase substantially over those reported in the linear regression performed in the

37
preliminary studies where no data points were removed. The r2 values of the new multi-
variate linear correlations were 0.9, 0.22, 0.75. and 0.24 for Mδ, Mcl, p0 and, σ+1,
respectively. Further examination of the relationship between Mδ and the elemental
composition showed that with the non-representative data omitted, the value of r2 for
the linear correlation of Mδ with the carbon content alone is 0.89. Experience in applying
the simple linear correlation of Mδ with carbon content resulted in consistent under-
predictions of Mδ for coals with carbon content between 82 and 86%. Even though the
modified quadratic correlation of Mδ only resulted in a slightly larger r2 value (0.94), the
under-prediction problem was partially alleviated by using the quadratic correlation. The
r2 values of the modified quadratic correlations of Mcl and σ+1 are much larger than are
those of the corresponding multi-variate linear correlations. The r2 value of the quadratic
correlation of p0 is also larger that that of the multi-variate linear correlation. In general, it
appears that the non-linear correlations are more adequate in predicting the chemical
structural parameters than multi-variate linear correlations.
Estimation of the Fraction of Stable Bridges
Each of the three devolatilization models mentioned previously require an
estimation of the number of stable bridges existing in the parent coal or that are formed
early in the pyrolysis process for low rank coals. In the CPD model, this parameter is c0.
This parameter has generally been used to represent stable bridgehead and bi-aryl type
linkages in low volatile bituminous coals, and to represent early crosslinking in lignites. In
the past, c0 has been used as a tuning parameter for these types of coals, and had to be
changed as a function of heating rate, since crosslinking occurs at different rates as a
function of heating rate. Based on drop tube and flat flame burner pyrolysis experiments
performed by Watt15 at heating rates greater than 104 K/s, and pyrolysis experiments
conducted by Fletcher and Hardesty48 at Sandia National Laboratories, a rough
correlation for c0 was developed. For low rank coals, oxygen content in the parent coal

38
was used, since this correlates well with early crosslinking. For high rank coals, carbon
content was used, since this may correlate well with the bi-aryl type linkages. The
correlation for c0 used for high heating rates was:
c0 = min[0.36, max{(0.118 XC - 10.1), 0.0}]
+ min[0.15, max{(0.014 XO - 0.175), 0.0}] (4.3)
where XC and XO are the percent carbon and oxygen, respectively, on a dry ash free basis.
Equation 4.3 was used in the CPD model for all predictions that used the correlated (and
measured) chemical structure parameters.
Implications of 13C NMR Correlation
The correlations work well for most coals, but significant discrepancies may occur
for some unusual coals since the correlations only describe the average variance of the 13C
NMR parameters as a function of elemental composition and ASTM volatile matter
content. It is important to emphasize that the correlations are not an adequate
replacement of 13C NMR analysis of coal, but are intended to give reasonable estimates of
the structural parameters of most coals when 13C NMR data are not available. The
advantage of using the actual chemical structural parameters derived from 13C NMR
analysis is better accuracy of the structural parameters, particularly for unusual coals.
It is also important to note the boundaries of the correlation when applying the
correlations to coals not included in the original data set. As mentioned previously, a
broad variety of coals were included in the correlation. Of the coals included, XC ranged
from a minimum of 66.6 % to a maximum of 95.4 % (daf). A complete list of the
boundaries for each independent variable is given in Table 4.6. Due to the quadratic
nature of the correlations, extrapolation beyond the original data set may result in large
discrepancies.

39
Table 4.6
Range of Values Used in Correlations
Constituent(daf)
Minimum Maximum
XC 66.6 95.4
XH 1.38 5.84
XO 1.40 24.16
XN 0.84 3.42
XS 0.37 6.29
ASTM VM 3.92 78.67
It is well documented that coal structure and reactivity are not only related to coal
rank, but also to the origin and maceral content of coal.5 For example, a study conducted
by Carr and Williamson on 130 coals showed that the aromaticity of coal, fa, was not only
related to coal rank (or degree of maturation) but also to the maceral/lithotype content of
the coal.51 The carbon content of coal is often used as a rank indicator. Of the four
chemical structural parameters derived from 13C NMR analysis studied here, only Mδ ,
the average molecular weight per side chain, correlates well with carbon content. This is
further evidence that the chemical structure of coal is dependent on other factors besides
coal rank. It is not possible to conclude from this study exactly why the non-linear
correlations between elemental composition and the derived chemical structure parameters
exist. Perhaps the correlations presented in this study exist because there is a relationship
between the elemental composition, the ASTM volatile matter content of coal, and
maceral/lithotype composition that the quadratic correlations are able to describe. A
study examining the elemental composition and volatile matter content of macerals at
various stages of maturation would be useful in confirming or discounting this hypothesis.

40
Application of Correlated Parameters in the CPD Model
Two sets of test cases were used to evaluate the reliability of using correlated
structural parameters in the CPD model to predict total volatiles and tar yields. The first
test case was a series of flat flame burner devolatilization experiments reported by
Fletcher and Hardesty.48 Predictions were made by the CPD model using (a) the actual
NMR structural parameters and (b) the structural parameters estimated by the
correlations (see Appendices B and C). The five coals used in this test case were part of
the database used in the correlations. Predictions are compared with measurements in
Figure 4.4. It can be seen that the use of the estimated structural parameters from the
correlation gives predictions of total mass release that are as good as the actual NMR data
in most cases. The average relative error between the predicted total volatiles yield and
the measured total volatiles yield was 6.8% using the actual NMR structural parameters
and 3.8% using the correlated parameters. For this set of test cases, using the correlated
NMR parameters instead of the measured NMR parameters actually resulted in more
accurate predictions of total mass release. It is anticipated, however, that for some
unusual coals actual structural parameters derived from actual 13C NMR analysis will be
needed to achieve reliable predictions of volatiles yields by the CPD model.
The second set of test cases consisted of total volatiles and tar yields for 17 coals
used in devolatilization experiments by Xu and Tomita.28 Xu and Tomita used a Curie-
point pyrolyser to heat samples at 3000 K/s to 1037 K with a 4 second residence time at
that temperature. NMR data are not available for this set of coals. Table 4.7 lists the
coals used by Xu and Tomita, the corresponding ultimate analysis data, and the four
structural parameters estimated by the correlations.
None of the structural parameters estimated by the correlations seem unreasonable
(e.g., values of Mcl fell within known limits for all coals studied). Figure 4.5 shows the
predicted and measured mass and tar release versus percent carbon in the parent coal.
Appendix D lists the measured and predicted values of mass release and tar yields for the

41
17 coals used by Xu and Tomita. The predicted mass release and tar yields compare well
with the values and trends of the corresponding measured yields for most of the coals
tested. Average relative errors between the predicted values and the measured values
were 13% for mass release and 20% for tar release. Overall, there does not appear to be a
positive or negative bias in the error.
70
60
50
40
30
20
10
0
% M
ass
Rel
ease
(da
f)
Beulah Zap Blue #1 Illinois #6 Pittsburgh #8 Pocahontas #3
Measured Correlations
13
C NMR
Figure 4.4. Comparison of CPD predictions with measured total mass release. Themeasured values refer to flat flame burner experiments conducted at Sandia, NMR values refer to CPD predictions of mass release using actual NMRstructural parameters, and the correlation values correspond to CPDpredictions of mass release using the correlated structural parameters.
The CPD model, however, over-predicted total mass release for coals in the range
of 80 % to 84 % dry-ash free carbon content (Hunter Valley, Liddell, Newvale). The
mass release measured by Xu and Tomita for the coals in this range seem low compared
to total volatiles yields measured by other investigators for similar coals and similar
conditions.1, 15, 16, 48, 52 This suggests that the Hunter Valley, Liddel, and Newvale
samples are particularly unusual coals, or there was some error in the experimental

Table 4.7
Elemental Composition and Correlated Chemical Structure of Coals Used in Pyrolysis Experiments
Conducted by Xu and Tomita28
coal % C(daf)
% H(daf)
% O(daf)
% N(daf)
% S(daf)
ASTM VM(daf)
Mδ Mcl P0 σ + 1
Yallourn 65.4 4.9 28.8 0.6 0.3 54 50 340 0.68 4.1Rhein Braun 65.8 5.5 27.6 0.8 0.3 56 52 388 0.60 4.0Morwell 67.4 5.0 26.8 0.5 0.3 53 48 343 0.64 4.4Velva 69.1 4.8 23.9 1.4 0.6 52 47 335 0.62 4.6Soyakoishi 70.2 5.2 22.4 1.8 0.2 46 47 369 0.58 4.6South Beulah 71.8 4.7 19.2 1.4 2.9 45 44 349 0.59 4.9Colowyo 74.0 5.0 18.6 1.9 0.4 39 41 351 0.59 5.0Taiheiyo 76.0 6.5 16.0 1.2 0.3 56 46 529 0.36 4.9Millmerran 76.9 6.6 15.4 0.5 0.6 55 45 547 0.34 4.9Wandoan 78.5 5.8 14.4 0.9 0.4 50 39 395 0.47 4.9Hunter Valley 80.3 5.0 12.2 2.0 0.4 37 33 323 0.57 5.1Liddell 83.5 5.4 8.4 2.1 0.6 38 30 342 0.53 4.9Newvale 84.2 5.0 8.9 1.4 0.5 34 28 297 0.59 4.8Yubari Shinko 86.9 5.6 5.2 1.9 0.3 41 27 338 0.51 4.6Vicary Creek 87.8 4.7 5.0 2.1 0.4 25 21 266 0.67 4.6Keystone 89.4 4.4 3.2 2.2 0.8 17 16 251 0.76 4.4Hongay 93.8 3.0 1.4 1.3 0.5 8 10 285 0.92 4.0

43
determination of the total volatiles yields for these coals in the study conducted by Xu
and Tomita. Recently, an investigator conducted a pyrolysis experiment on a Hunter
Valley coal at conditions similar to those used by Xu and Tomita, and measured a total
volatiles yield of 48% (daf).53
60
50
40
30
20
10
0
% Y
ield
(d
af)
95908580757065
% Carbon (daf)
limit of data used to make correlations
CPD mass release measured mass release CPD tar yield measured tar yield
Figure 4.5 Comparison of CPD predictions with measured total mass release and taryields. The measured values refer to the Curie-point pyrolyserexperiments performed by Xu and Tomita.28 CPD mass release and CPDtar yield refer to the CPD predictions using structural parametersestimated by the correlations developed in this research. The dotted line at66.6 % C (daf) shows the lower boundary of the original data set. Theupper bound is 95.4 % C (daf).
Discussion of NMR Correlation
Non-linear correlations were developed to model the average structural
characteristics of coal as a function of elemental composition and ASTM volatile matter
content. The coefficient of determination, r2, is a measure of how well the correlation
explains the variation in the dependent variable as a function of the independent variables.
The r2 values for these correlations were 0.94, 0.72, 0.88. and 0.62 for Mδ, Mcl, p0, and
44
σ+1,respectively. Reasonable estimations of 13C NMR structural parameters for most
coals can be expected using the correlation. However, it is expected that these
correlations, just like any correlation, will not work well for some unusual coals.
The non-linear modified quadratic correlation of 13C NMR measurements of coal
structure with ultimate analysis and volatile matter content seems to be an appropriate
method to estimate the coal structure input parameters for network devolatilization
models, such as the CPD model. The correlation, combined with the CPD model, appears
to work well in predicting total volatiles and tar yields for low to high rank coals.
Although one of the principal motives for this study has been the estimation of the input
parameters for the CPD model, the estimated structural parameters should be useful in
other applications, and a similar approach could be used to develop predictive models for
other structural parameters.

45
Chapter 5. Modeling Volatile Nitrogen Release
Currently, low-NOx burners are designed using empirical relationships to describe
the amount of nitrogen released during devolatilization. Comprehensive coal combustion
models that calculate the amount of NOx present during coal combustion, such as PCGC-
3 (Pulverized Coal Gasification and Combustion, 3-dimensional), currently require the
user to specify of the amount of nitrogen released during devolatilization.54 In order to
design more efficient low-NOx burners and to improve the accuracy of the NOx
concentration predictions by comprehensive combustion codes, it will be necessary to
accurately model the amount and form of nitrogen released during coal pyrolysis.
A model that predicts the amount and distribution between tar and light gas of
nitrogen released during devolatilization has been developed and incorporated into the
Chemical Percolation Devolatilization (CPD) model.4 The model is limited to nitrogen
release during primary pyrolysis, and assumes that all light gas nitrogen is HCN. Model
predictions of nitrogen release compared well with measured values for most coals and
devolatilization conditions tested.
Evaluation of Nitrogen Release Data
A number of investigators have conducted pyrolysis experiments in an effort to
characterize the temperature, time, and rank dependence of volatile nitrogen release. Of
particular interest to this study are experiments in which the chemical structure of
matching sets of coal and char were determined by 13C NMR spectral analyses. Studies
examining the chemical structure of matching sets of coal and char samples using 13C
NMR analyses have been conducted by Fletcher and Hardesty,48 Watt,15 and Hambly.16
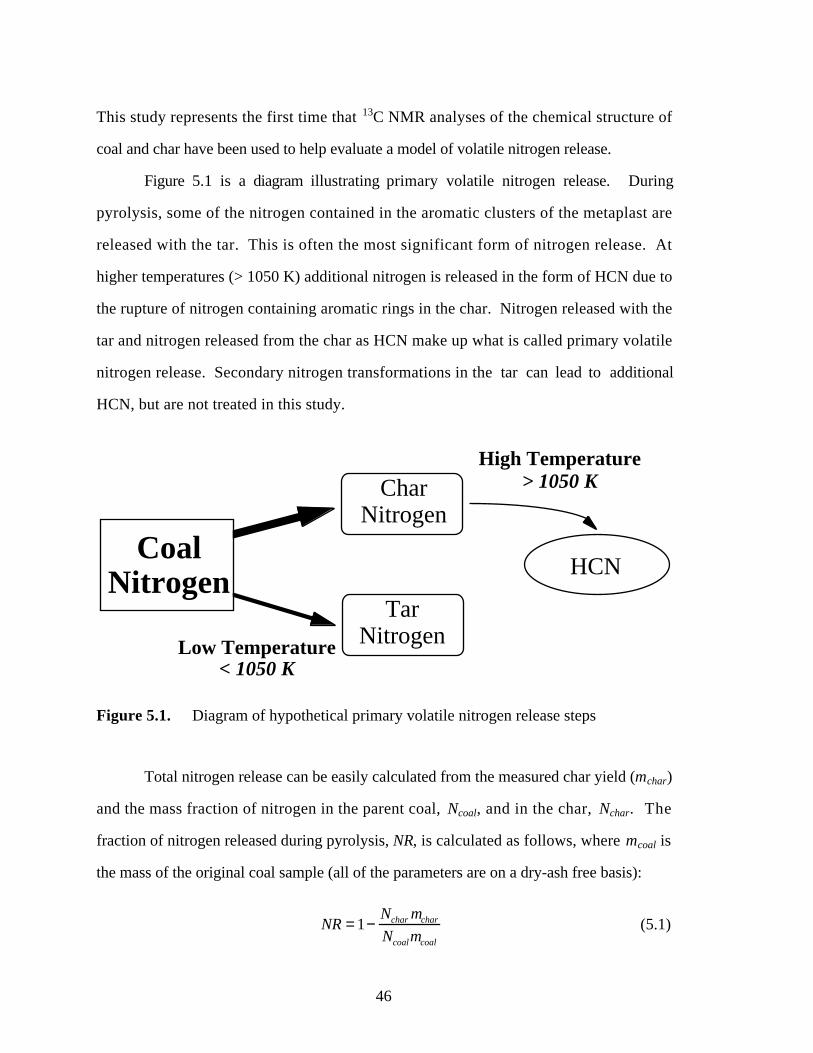
46
This study represents the first time that 13C NMR analyses of the chemical structure of
coal and char have been used to help evaluate a model of volatile nitrogen release.
Figure 5.1 is a diagram illustrating primary volatile nitrogen release. During
pyrolysis, some of the nitrogen contained in the aromatic clusters of the metaplast are
released with the tar. This is often the most significant form of nitrogen release. At
higher temperatures (> 1050 K) additional nitrogen is released in the form of HCN due to
the rupture of nitrogen containing aromatic rings in the char. Nitrogen released with the
tar and nitrogen released from the char as HCN make up what is called primary volatile
nitrogen release. Secondary nitrogen transformations in the tar can lead to additional
HCN, but are not treated in this study.
HCN
Low Temperature < 1050 K
Coal Nitrogen
Char Nitrogen
Tar Nitrogen
High Temperature > 1050 K
Figure 5.1. Diagram of hypothetical primary volatile nitrogen release steps
Total nitrogen release can be easily calculated from the measured char yield (mchar)
and the mass fraction of nitrogen in the parent coal, Ncoal, and in the char, Nchar. The
fraction of nitrogen released during pyrolysis, NR, is calculated as follows, where mcoal is
the mass of the original coal sample (all of the parameters are on a dry-ash free basis):
NR = 1−Nchar mchar
Ncoalmcoal
(5.1)

47
It is useful to define an aromatic site as an aromatic cluster minus the aliphatic side
chains and bridge materials. By assuming that the molecular weight per aromatic site,
Msite, is constant during pyrolysis, the amount of nitrogen released from the char as light
gas can be determined. Nsite is the average mass fraction of nitrogen per aromatic site, and
is calculated from the mass fraction of nitrogen in the char (Nchar) and 13C NMR spectral
analysis of the char :
Nsite = Nchar
Mcl
Msite
(5.2)
where Mcl is the measured molecular weight per cluster in the char. Msite is calculated by
subtracting the aliphatic material from the cluster as follows:
Msite = Mcl − (σ + 1)Mδ (5.3)
where Mδ is the average molecular weight per side chain in the char, and σ+1 is the number
of attachments per cluster.
Nsite decays during high temperature pyrolysis as nitrogen atoms are released from
the char. By comparing the value of Nsite in the coal and char, the mass of nitrogen
released as light gas can be determined. The mass of nitrogen transported from the coal
with the tar during primary pyrolysis is the difference between total nitrogen release and
light gas nitrogen release. Secondary pyrolysis reactions of the tar make it difficult to
determine directly the amount of nitrogen released with the tar.
Nitrogen release trends from pyrolysis experiments in which 13C NMR analyses
were conducted on matching sets of coal and char were analyzed in this study. Table 5.1
lists the investigators who have compared coal and char chemical structure using 13C
NMR spectroscopy. Table 5.1 also lists the coals that were pyrolyzed and the pyrolysis
conditions.

48
Table 5.1
List of Pyrolysis Experiments Examined for Nitrogen Release Trends
Set Investigator(s) Coals (rank)Reactor; residence time;
peak gas temp;approximate heating rate
1*Fletcher andHardesty48
Beulah Zap (lig), Blue #1(subB), Illinois #6 (hvbB),Pittsburgh #8 (hvaB),Pocahontas #3 (lvbB)
adrop tube; 250 ms; 1050K; 104 K/sbdrop tube; 240 ms; 1250K; 104 K/scFFB (flat-flame burner);47 ms; 1600 K; 105 K/s
2Hambly16 Beulah Zap(lig), Blue #1
(subB), Illinois #6 (hvbB),Pittsburgh #8 (hvaB),Pocahontas #3 (lvbB)
drop tube; 280 ms; 1080 K;104 K/s
* A number of papers have been published on this set of data.1, 14, 55-57 The reportpublished by Fletcher and Hardesty48 represents a convenient compilation of this dataset, and therefore was referenced throughout this project.
Rank and Temperature Dependence
Some investigators have reported a weak rank dependence of light gas nitrogen
release.17, 30, 45 Low rank coals are thought to release nitrogen from the char as HCN
more readily than high rank coals. Figure 5.2 compares the percent Nsite decay that
occurred in the chars during the pyrolysis experiments conducted by Fletcher and
Hardesty in a drop-tube reactor (sets 1a & 1b). The percent decay of Nsite is an indicator
of the quantity of HCN (or light gas nitrogen) that has evolved during pyrolysis. The
decay of Nsite during the experiments of Fletcher and Hardesty does not seem to correlate
with rank. Figure 5.3 Compares the percent decay of Nsite in the chars pyrolyzed by
Hambly (set 2). The decay of Nsite in the chars collected by Hambly indicate that the
decay of Nsite is similar in lignites and bituminous coals. However, the decay of Nsite in the
Pocahontas #3 char, a low volatile bituminous coal, was significantly less than in the other
chars.

49
35
30
25
20
15
10
5
0
% D
ecay
of
Nsi
te
Beulah Zap Blue #1 Illinois #6 Pittsburgh #8 Pocahontas #3
No
Dat
a
No
Dat
a
No
Dat
a
1250 K 1050 K
No
Dec
ay
Figure 5.2. Comparison of the percent decay of Nsite calculated from experimentalpyrolysis data collected by Fletcher and Hardesty (sets 1a & 1b) and 13CNMR analyses of the chemical structure of the matching sets of coals andchars. 13C NMR analyses were not conducted on the Beulah Zap, Illinois#6, and Pittsburgh #8 chars. No change in Nsite was observed in the Blue#1 char at the 1050 K condition.
35
30
25
20
15
10
5
0
% D
ecay
of
Nsi
te
Beulah Zap Blue #1 Illinois #6 Pittsburgh #8 Pocahontas #3
Figure 5.3. Comparison of the percent decay of Nsite calculated from experimentalpyrolysis data collected by Hambly (set 2) and 13C NMR analyses of thechemical structure of the matching sets of coals and chars.

50
Nsite decay trends in the chars produced by Fletcher and Hardesty (Figure 5.2) also
indicate some temperature dependence. Unfortunately, 13C NMR analysis was only
performed on two of the char samples from the 1050 K drop tube condition. Regardless,
the comparison of Nsite decay in the two chars (Blue #1 and Pocahontas #3) from the 1050
K and 1250 K drop tube conditions is useful since both conditions had approximately the
same residence time. Both chars produced at the 1050 K condition had much less Nsite
decay than at the 1250 K condition, indicating that as the temperature increases, Nsite
decay generally increases.
Time Dependence
Figure 5.4 compares Nsite decay in the chars produced by Fletcher and Hardesty in
a drop tube reactor at 1250 K (set 1a) and in a FFB with a peak gas temperature of about
1600 K (set 1c). Figure 5.5 compares the total mass release of the five coals pyrolyzed in
the drop tube and FFB reactors. Total mass release was slightly higher in the FFB than in
the drop tube reactor for all but one of the coals studied. It is interesting to note that in
each case for which data exists, Nsite decay was considerably lower in the FFB than in the
drop tube reactor. This is puzzling since drop tube conditions are less severe than in the
FFB. A possible explanation for this trend is the difference in residence times of the drop
tube experiments (~240 ms) and the FFB experiment (~ 47 ms). It appears that at the
temperatures being considered here (1250 K - 1600 K), Nsite decay occurs on a much
slower time scale than total mass release. It is reasonable to believe that if the residence
time of the FFB experiment were increased, Nsite decay would approach or surpass the
levels attained in the 1250 K drop tube experiments.

51
35
30
25
20
15
10
5
0
% D
ecay
of
Nsi
te
Beulah Zap Blue #1 Illinois #6 Pittsburgh #8 Pocahontas #3
No
Dec
ay
~ 104
K/sec ~ 105
K/sec
Figure 5.4. Comparison of the percent decay of Nsite calculated from experimentalpyrolysis data collected by Fletcher and Hardesty48 in a drop tube reactor with a peaktemperature of 1250 K and a FFB with a peak temperature of 1600 K (set 1).
60
50
40
30
20
10
0
% M
ass
Rel
ease
(daf
)
Beulah Zap Blue #1 Illinois #6 Pittsburgh #8 Pocahontas #3
Drop Tube (1250 K) FFB (1600 K)
Figure 5.5. Comparison of total mass release from the five coals pyrolyzed byFletcher and Hardesty48 in a drop tube reactor with a peak temperature of1250 K and a FFB with a peak temperature of 1600 K (set 1).

52
Model Theory and Development
It is thought that nitrogen is released during primary devolatilization in two ways
(refer to Figure 5.1):17, 45 (i) nitrogen contained in the aromatic clusters is transported
away as tar molecules escape the infinite matrix (this is often the primary mode of
nitrogen release during devolatilization); and (ii) additional nitrogen can be released as light
gas at high temperatures (thought to be primarily HCN) from the thermal rupture of
aromatic rings containing nitrogen heteroatoms
In this work, a volatile nitrogen release model was developed and incorporated
into the CPD model. The model developed in this study is based on the same
assumptions used in the FG-DVC and FLASHCHAIN nitrogen release models as
discussed in Chapter 2. This study, however, represents the first time that detailed
chemical structural data produced by solid-state 13C NMR spectral analyses of the
chemical structure of coal have been used to develop and evaluate a volatile nitrogen
release model. The model predicts the amount of nitrogen released with tar, the amount
of nitrogen released as light gas by the rupture of aromatic rings, and the nitrogen content
of the char. Nitrogen which is released with tar was modeled by developing a simple
scheme to account for the nitrogen transported from the coal matrix with the tar.
Nitrogen released with the tar is the dominant mechanism of nitrogen release for many
coals and devolatilization conditions. Additional nitrogen release, in the form of light gas,
which results from the thermal rupture of aromatic rings containing nitrogen heteroatoms,
was modeled by a first order Arrhenius rate equation with a distributed activation energy.
In addition to the assumptions already made in the CPD model, the following
assumptions regarding the chemical structure of coal, char, and tar were made throughout
the nitrogen release model development process:
1. Nitrogen atoms are randomly distributed throughout the aromatic sites
in the coal.

53
2. Ring opening reactions have a negligible effect on average cluster size
(aromatic site molecular weight is constant) since nitrogen content is
small.
3. The average chemical structural parameters and composition of the tar
released at a given time is identical in chemical structure and
composition to the char.
4. At any instant, the mass of nitrogen per site, Nsite, in the evolving tar is
equal to the mass of nitrogen per cluster in the char. Combining
assumptions 3 and 4 indicates that δNtar = δNchar at any instant in time.
The nitrogen release model developed in this study is limited to describing
primary nitrogen release (refer to Figure 5.1). In this work, primary nitrogen release
refers to (i) nitrogen transported from the macromolecule with the tar, and (ii) nitrogen
released as light gas (HCN) from the char due to the thermal rupture of nitrogen
containing aromatic rings. Secondary nitrogen transformations are not treated in the
current study.
Light Gas Nitrogen
Nitrogen released as light gas originates from the thermal rupture of nitrogen-
containing aromatic rings in the char. The exact mechanism by which thermal rupture of
nitrogen containing rings occurs has not yet been established. It has been shown that
there are a number of different nitrogen functional groups in coal.15, 18-22 Furthermore,
the sizes of the aromatic clusters in a given coal vary greatly. The stability of a nitrogen
atom is likely affected by the size of the cluster in which it is located, due to electron
resonance structural considerations. Therefore, it is reasonable to assume that a
distribution of activation energies will be necessary to describe light gas nitrogen release
from the char. It is proposed that the decay of nitrogen contained in the aromatic sites of

54
the char (believed to result in HCN) at each time step can be described by a simple first
order Arrhenius rate expression with a distributed activation energy:
dN site
dt= Aexp
−E
RT
Nsite (5.4)
where Nsite is the mass fraction of nitrogen in an aromatic site, E is the activation energy, R
is the universal gas constant, and T the absolute temperature. E is distributed according to
a normal distribution as follows:
E = Eo + xσ E (5.5)
where Eo is the mean activation energy and σ is the standard deviation of the activation
energy. The term x is the inverse of the area under the normal distribution curve which is
calculated using a tabulated error function solution based on the conversion of Nsite.4 The
kinetic parameters, A, EO, and σΕ, were empirically fit to best match the experimental data
on nitrogen release and Nsite decay during pyrolysis as reported by Fletcher and
Hardesty.48
In order to model nitrogen release in the manner just described, it is critical that
Nsite be accurately calculated. Determination of the initial value of Nsite is dependent on
13C NMR measurements of the chemical structure of coal according to:
Nsite0= Ncoal
Mcl0
Msite
(5.6)
where Ncoal is the dry, ash, free nitrogen content of the coal, Msite is the molecular weight
per site (which is constant), Mcl0 is the initial average molecular weight per cluster in the
coal as determined by 13C NMR analysis. Msite is calculated using measurements of coal
structure as determined by 13C NMR data according to equation 5.3.
55
At sufficiently high pyrolysis temperatures, Nsite begins to decay. Nsite is
calculated by integrating equation 5.4 over time in the CPD model using a modified
Eulerian approach, including a predictor-corrector. Since aliphatic side chains and bridges
are cleaved throughout devolatilization, a new Mcl must be calculated at each time step
(specified below by the subscript i). The CPD model already keeps track of the number
of side chains and bridges that still contain a significant amount of aliphatic material;
therefore, Mcl can be calculated by the following simple equation:
Mcli= Msite + (c0 + li + δi )(σ + 1)Mδ (5.7)
where c0 is the fraction of initial attachments per cluster that are stable bridges, l is the
fraction of labile bridges, and δ is the fraction of initial attachments that are side chains.
The nitrogen content of the char can be calculated by converting Nsite to a per cluster basis
as follows:
Nchari= N sitei
Msite
Mcli
, (5.8)
and since it is assumed that the nitrogen is evenly distributed among the aromatic sites
and that the chemical structure of the metaplast and char are equal at any given moment
during devolatilization, Ntari= Nchari
.
In order to determine the total amount of nitrogen released as light gas during
devolatilization, the quantity of nitrogen released at each time step must be determined.
The mass of nitrogen released from the char as light gas at each time step is proportional
to the char yield, according to:
δgasniti= fchari
δNchari(5.9)
56
where δgasniti is the differential fraction of coal nitrogen released as light gas during time
step i, and fchari is char yield. The total fraction of coal nitrogen released as light gas up to
time step i is determined by integrating equation 5.9 over time.
Nitrogen Released with Tar
The nitrogen transported away from the infinite matrix with the tar during time
step i is calculated as follows:
δtarniti= Ntari
δtari (5.10)
where δtarniti is the mass of nitrogen transported with the tar during time step i, Ntari
equals Nchari, and δtari is the mass of tar released during time step i. The total mass of
nitrogen transported with the tar is calculated by integrating equation 5.10 .
Fraction of Stable Nitrogen
During the course of this modeling effort, it became apparent that the temperature
and time dependence of nitrogen release in the form of light gas would be difficult to
model with simple first order kinetics as described above. A broad range of kinetic
parameters (A, E0, and σΕ) was tested. It was easy to fit the kinetic parameters such that
the nitrogen release model predictions matched the experimental data for one set of coals
at one condition. However, it proved difficult, if not impossible, to adjust the kinetic
parameters so that the model gave accurate predictions at different pyrolysis conditions,
for example, heating rates of 104 K/s and 105 K/s.
The data on nitrogen release during devolatilization discussed previously suggest
that the rate of light gas nitrogen release from the char has a slight rank dependence, which
becomes more pronounced for high rank coals. Lignites seem to have a slightly greater
propensity for light gas nitrogen release than bituminous coals. Low volatile bituminous
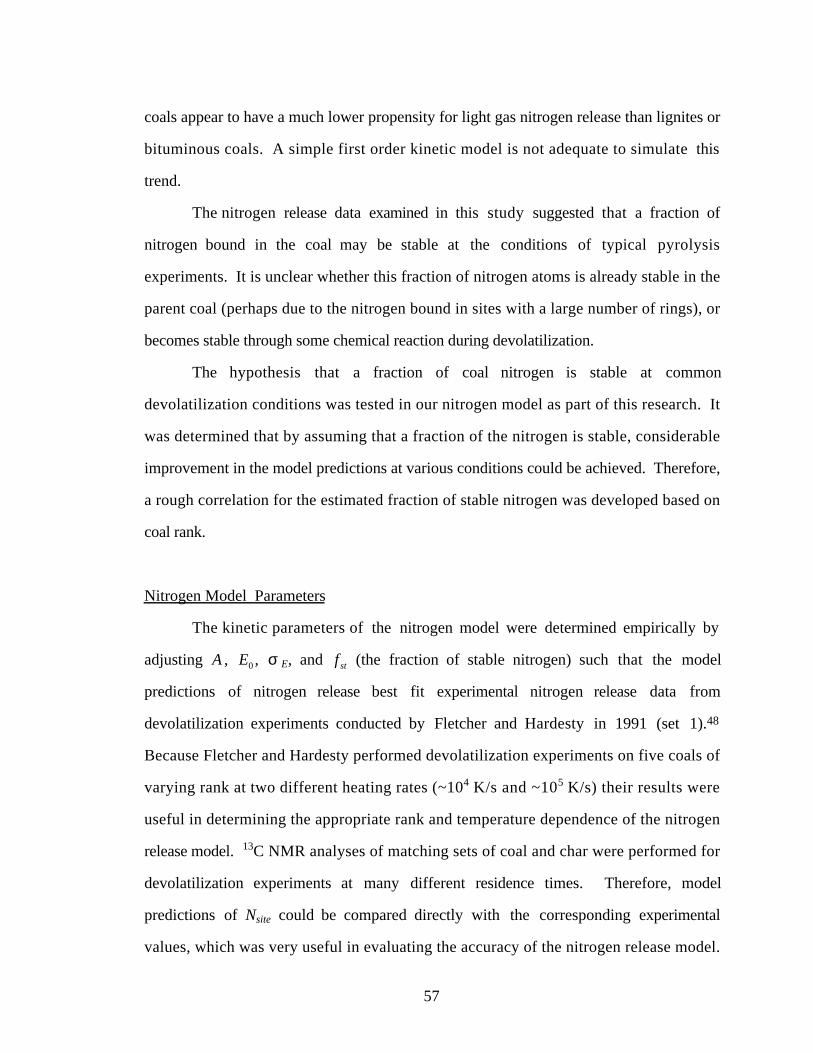
57
coals appear to have a much lower propensity for light gas nitrogen release than lignites or
bituminous coals. A simple first order kinetic model is not adequate to simulate this
trend.
The nitrogen release data examined in this study suggested that a fraction of
nitrogen bound in the coal may be stable at the conditions of typical pyrolysis
experiments. It is unclear whether this fraction of nitrogen atoms is already stable in the
parent coal (perhaps due to the nitrogen bound in sites with a large number of rings), or
becomes stable through some chemical reaction during devolatilization.
The hypothesis that a fraction of coal nitrogen is stable at common
devolatilization conditions was tested in our nitrogen model as part of this research. It
was determined that by assuming that a fraction of the nitrogen is stable, considerable
improvement in the model predictions at various conditions could be achieved. Therefore,
a rough correlation for the estimated fraction of stable nitrogen was developed based on
coal rank.
Nitrogen Model Parameters
The kinetic parameters of the nitrogen model were determined empirically by
adjusting A , E0 , σ E, and f st (the fraction of stable nitrogen) such that the model
predictions of nitrogen release best fit experimental nitrogen release data from
devolatilization experiments conducted by Fletcher and Hardesty in 1991 (set 1).48
Because Fletcher and Hardesty performed devolatilization experiments on five coals of
varying rank at two different heating rates (~104 K/s and ~105 K/s) their results were
useful in determining the appropriate rank and temperature dependence of the nitrogen
release model. 13C NMR analyses of matching sets of coal and char were performed for
devolatilization experiments at many different residence times. Therefore, model
predictions of Nsite could be compared directly with the corresponding experimental
values, which was very useful in evaluating the accuracy of the nitrogen release model.
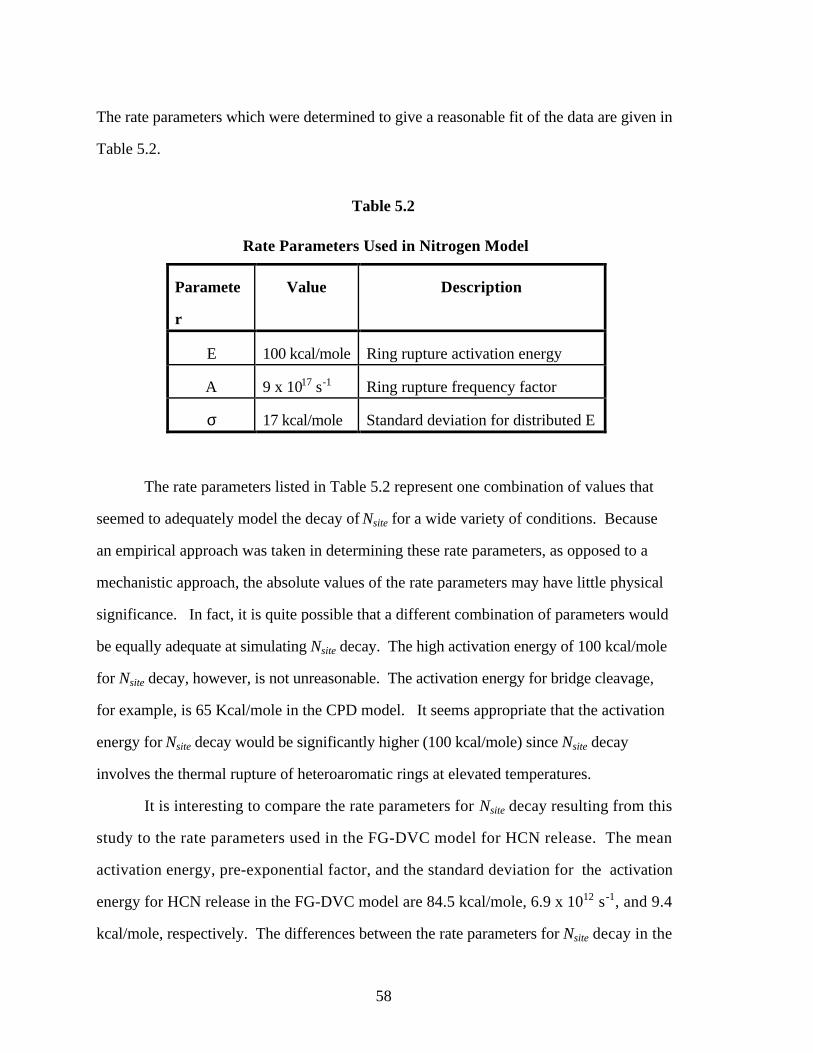
58
The rate parameters which were determined to give a reasonable fit of the data are given in
Table 5.2.
Table 5.2
Rate Parameters Used in Nitrogen Model
Paramete
r
Value Description
E 100 kcal/mole Ring rupture activation energy
A 9 x 10¹⁷ s-1 Ring rupture frequency factor
σ 17 kcal/mole Standard deviation for distributed E
The rate parameters listed in Table 5.2 represent one combination of values that
seemed to adequately model the decay of Nsite for a wide variety of conditions. Because
an empirical approach was taken in determining these rate parameters, as opposed to a
mechanistic approach, the absolute values of the rate parameters may have little physical
significance. In fact, it is quite possible that a different combination of parameters would
be equally adequate at simulating Nsite decay. The high activation energy of 100 kcal/mole
for Nsite decay, however, is not unreasonable. The activation energy for bridge cleavage,
for example, is 65 Kcal/mole in the CPD model. It seems appropriate that the activation
energy for Nsite decay would be significantly higher (100 kcal/mole) since Nsite decay
involves the thermal rupture of heteroaromatic rings at elevated temperatures.
It is interesting to compare the rate parameters for Nsite decay resulting from this
study to the rate parameters used in the FG-DVC model for HCN release. The mean
activation energy, pre-exponential factor, and the standard deviation for the activation
energy for HCN release in the FG-DVC model are 84.5 kcal/mole, 6.9 x 10¹² s-1, and 9.4
kcal/mole, respectively. The differences between the rate parameters for Nsite decay in the

59
CPD model and HCN release in the FG-DVC model do not seem unreasonable since the
approaches used to model HCN release in the two devolatilization models are
significantly different.
The fraction of stable nitrogen, f st , was correlated with rank, using the dry, ash
free carbon content as an indicator of rank resulting in Equation 5.12 where C is the dry,
f st = max 0.5,0.018(%C, daf) − 1.062{ } (5.11)
ash, free percent carbon of the coal. For low and medium rank coals f st is constant at
0.5. For higher rank coals, f st increases linearly with carbon content. This is consistent
with the experimental data on the decay of Nsite, which suggests that Nsite decays similarly
in low and medium rank coals, but decays significantly less in high rank coals.
Application of Nitrogen Release Model
Description of Test Cases
The CPD model was used to predict the nitrogen release of several different coals
during devolatilization at several different experimental conditions. Table 5.3 lists the
researchers who conducted the experiments, the coals used, and the conditions of the
experiments. CPD model predictions of total mass release, tar release, nitrogen release,
Nchar, and Nsite were compared with experimental results for test sets 1 through 3. Due to
the large number of test cases examined, only a brief summary of the most important
results will be given here. Figures summarizing the results of test cases 1-3 that are not
included in the main body are given in Appendix E.

60
Table 5.3.
Description of Sets of Test Cases Used in Model Evaluation
Set Researcher(s) Coals (rank)Reactor; residence time;
peak gas temp;approximate heating rate
1 Fletcher andHardesty48
Beulah Zap (lig), Blue #1(subB), Illinois #6 (hvbB),Pittsburgh #8 (hvaB),Pocahontas #3 (lvbB)
adrop tube; 250 ms; 1050K; 104 K/s.bdrop tube; 240 ms; 1250K; 104 K/s.cFFB (flat-flame burner); 47ms; 1600 K; 105 K/s.
2 Chen52 Dietz (subB), Illinois #6 (hvaB),Pittsburgh #8 (hvaB), LowerKittaning (lvB)
drop tube; 56, 61, 66,72,77, 83, 86.5, and 89 ms;radiantly heated particles(1840 K wall temperature);104 K/s.
3 Hambly16 Beulah Zap (lig), Blue #1(subB), Illinois #6 (hvbB),Pittsburgh #8 (hvaB),Pocahontas #3 (lvbB)
adrop tube; 170 ms; 820 K;104 K/s.bdrop tube; 280 ms; 1080K; 104 K/s.cdrop tube; 410 ms; 1220K; 104 K/s.dFFB; 18 ms; 1560 K, 105
K/s.
Comparisons with Data From Fletcher and Hardesty48
In general, the predictions of Nsite and Nchar compared well with the experimental
data collected by Fletcher and Hardesty.48 Figure 5.6 is an example of a Blue #1 coal
pyrolyzed in a drop tube reactor by Fletcher and Hardesty with a peak temperature of
1050 K (set 1a). The experimental data suggest that there is little or no Nsite decay at this
condition. Only a small amount of Nsite decay is predicted by the model. Predictions of
Nchar compare well with the measured values. The increase in Nchar is due to the loss of
aliphatic side chain material which does not contain nitrogen. Figure 5.7 is an example of
a Blue #1 coal pyrolyzed in a drop tube reactor with a peak temperature of 1250 K (set

61
1b). Predictions of Nsite and Nchar compare well with the experimental values at this
condition. Notice that by using a distributed activation energy function, the diminishing
rate of Nsite decay during late pyrolysis is accurately modeled. It is also important to note
that the model is able to predict the trend of increasing Nsite decay with increasing
temperature. Similar agreement was achieved with data from other coals examined by
Fletcher and Hardesty (see Appendix E, Figures E.1-E.8).
This work represents the first time that a nitrogen release model has been
evaluated by comparing model predictions with the detailed chemical structure of char as
determined by 13C NMR analysis. As described previously, Nsite is determined
experimentally based on the nitrogen content of the char and the chemical structure of the
char from 13C NMR spectral analysis. By comparing predicted and measured Nsite values,
the ability of the model to predict HCN release is evaluated directly, and the ability of the
model to accurately simulate changes in the chemical structure of the char during
pyrolysis is implied.
Figures 5.8 and 5.9 compare model predictions of total mass and nitrogen release
with experimental data for a Blue #1 coal pyrolyzed by Fletcher and Hardesty in a drop
tube reactor with peak temperatures of 1050 K and 1250 K (sets 1a & 1b). Similar
agreement was achieved with data from other coals examined by Fletcher and Hardesty
(see Appendix E, Figures E.9-E.16).
It was observed that when the CPD model predictions of total mass release
compared well with experimental data, model predictions of nitrogen release also
compared well. When the CPD model over-predicted or under-predicted mass release,
nitrogen release was also under or over-predicted by about the same amount. This is an
indication that the model describing nitrogen release at the conditions of these experiments
is mechanistically correct.
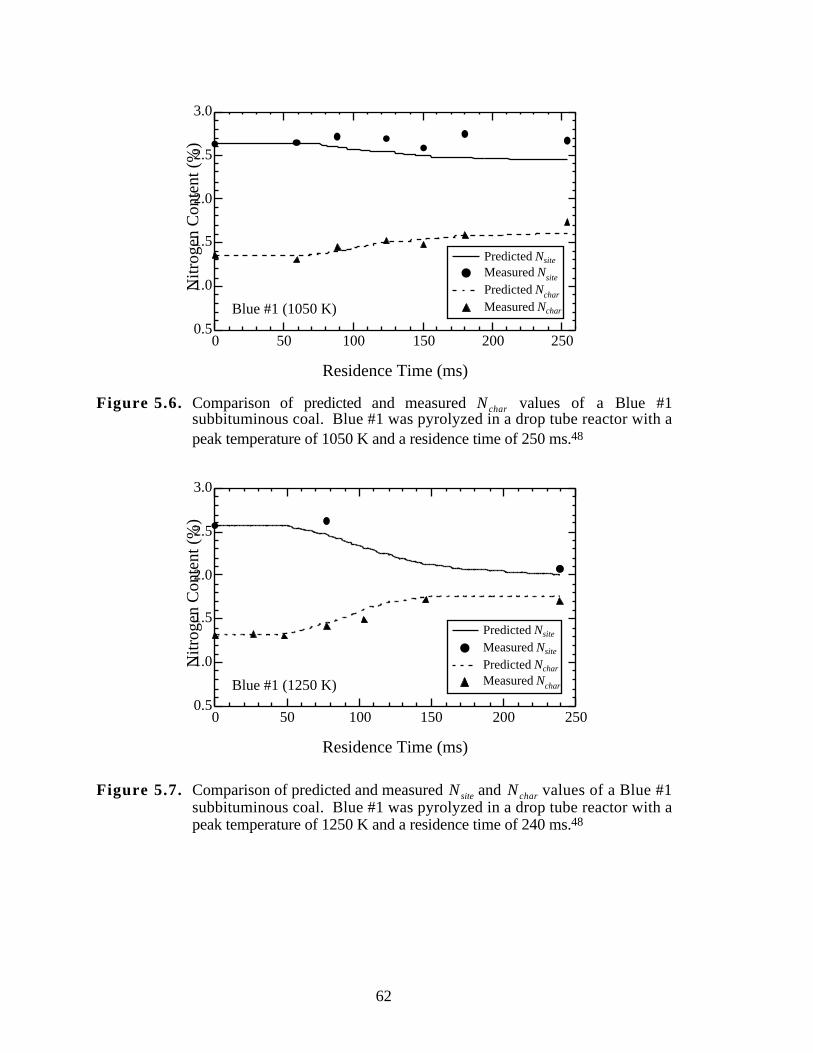
62
3.0
2.5
2.0
1.5
1.0
0.5
Nitr
ogen
Con
tent
(%)
250200150100500
Residence Time (ms)
Blue #1 (1050 K)
Predicted Nsite
Measured Nsite
Predicted Nchar
Measured Nchar
Figure 5.6. Comparison of predicted and measured N char values of a Blue #1subbituminous coal. Blue #1 was pyrolyzed in a drop tube reactor with apeak temperature of 1050 K and a residence time of 250 ms.48
3.0
2.5
2.0
1.5
1.0
0.5
Nitr
ogen
Con
tent
(%)
250200150100500
Residence Time (ms)
Blue #1 (1250 K)
Predicted Nsite
Measured Nsite
Predicted Nchar
Measured Nchar
Figure 5.7. Comparison of predicted and measured N site and N char values of a Blue #1subbituminous coal. Blue #1 was pyrolyzed in a drop tube reactor with apeak temperature of 1250 K and a residence time of 240 ms.48

63
0.60
0.50
0.40
0.30
0.20
0.10
0.00
Frac
tion
Rel
ease
d (d
af)
300250200150100500
Residence Time (ms)
Blue #1 (1050 K)
Predicted Mass Release Predicted Nitrogen Release Measured Mass Release Measured Nitrogen Release
Figure 5.8. Comparison of predicted and measured fractional mass and nitrogen releaseof a Blue #1 high volatile bituminous coal. Blue #1 was pyrolyzed in adrop tube reactor with a peak temperature of 1050 K and a residence time of250 ms.
0.60
0.50
0.40
0.30
0.20
0.10
0.00
Frac
tion
Rel
ease
d (d
af)
300250200150100500
Residence Time (ms)
Blue #1 (1250 K)
Predicted Mass Release Measured Mass Release Predicted Nitrogen Release Measured Nitrogen Release
Figure 5.9. Comparison of predicted and measured fractional mass and nitrogen releaseof a Blue #1 high volatile bituminous coal. Blue #1 was pyrolyzed in adrop tube reactor with a peak temperature of 1250 K and a residence time of240 ms.

64
Fletcher and Hardesty conducted pyrolysis experiments on five coals in a flat-
flame burner with a heating rate of about 105 K/sec and a peak gas temperature of about
1600 K (set 1c). Figure 5.10 compares CPD model predictions of fractional mass and
nitrogen release with experimental data obtained in the flat-flame burner. With the
exception of Pocahontas #3, model predictions of mass and nitrogen release compared
well with experimental data. Figure 5.10 is important because it shows the nitrogen
model is able to pick up variations in nitrogen release due to differences in temperature
and heating rate.
0.6
0.5
0.4
0.3
0.2
0.1
0.0
Frac
tion
Rel
ease
d (d
af)
90858075706560
% Carbon (daf)
Blue #1
Illinois #6 Pittsburgh #8
Pocahontas #3
Measured mass release Predicted mass release Measured nitrogen release Predicted nitrogen release
Beulah Zap
Figure 5.10. Comparison of CPD model predictions of mass and nitrogen release withexperimental data for coals pyrolyzed in a flat-flame burner by Fletcherand Hardesty.48 Carbon content is used as a rank indicator.
Comparisons with Data Reported by Chen
Chen52 pyrolyzed four coals to various degrees in a radiatively heated drop tube
reactor (set 2). Since careful measurements of tar and light gas release were taken in
Chen’s experiments, CPD model predictions of tar and light gas nitrogen were compared
directly with experimental data. This set of char data is particularly important in
65
evaluating this nitrogen model since it was not included in the regression of the model
parameters. 13C NMR data are not available for the coals studied by Chen. The NMR
correlation described in Chapter 4 was used to estimate the chemical structure input
parameters for the CPD model. Also, accurate particle temperature profiles were not
available, since particles were heated radiantly. Therefore, CPD model predictions were
performed by adjusting the temperature profile to match total mass release given for the
Dietz coal and then using the same temperature profile for the remaining coals (see
Appendix F). Figures 5.11 and 5.12 are comparisons of CPD model predictions of
nitrogen released with the tar and light gas nitrogen with experimental data for Dietz and
Pittsburgh #8 coals, respectively.
As shown in Figures 5.11 and 5.12, model predictions compared well with
experimental measurements of total, tar, and light gas nitrogen release reported by Chen.
Similar results were obtained for the other two coals studied by Chen (see Appendix E).
0.5
0.4
0.3
0.2
0.1
0.0
Frac
tion
Rel
ease
d
9080706050
Residence Time (ms)
tar nitrogen
Measured Nitrogen Release Predicted Nitrogen Release Measured Light Gas Nitrogen Predicted Light Gas Nitrogen
Figure 5.11. Comparison of predictions of total, tar, and light gas nitrogen withexperimental data from experiments conducted by Chen52 on a Dietzsubbituminous coal.

66
0.5
0.4
0.3
0.2
0.1
0.0
Frac
tion
Rel
ease
d
9080706050
Residence Time (ms)
tar nitrogen
Measured Nitrogen Release Predicted Nitrogen Release Measured Light Gas Nitrogen Predicted Light Gas Nitrogen
Figure 5.12. Comparison of predictions of total, tar, and light gas nitrogen withexperimental data from experiments conducted by Chen52 on a Pittsburgh#8 high volatile A bituminous coal.
Comparisons with Data Reported by Hambly and Genetti
Hambly16 pyrolyzed five coals in a drop tube reactor at BYU at three different
peak temperatures (sets 3a, 3b, & 3c). Figure 5.13 compares model predictions of Nchar
with the experimental Nchar data from Hambly’s experiments. The measured and
predicted values of Nchar compare well at all three conditions (r2 = 0.976).
Figure 5.14 compares model predictions of mass and nitrogen with the
experimental mass and nitrogen release data from Hambly’s experiments with a peak gas
temperature of 1220 K. The measured and predicted values of nitrogen release generally
compare as well as the measured and predicted mass release. The largest disagreement
seems to be for the lignite (Beulah Zap). Figures comparing model predictions with
experimental mass and nitrogen release at the other two pyrolysis conditions used by
Hambly are given in Appendix E.

67
2.5
2.0
1.5
1.0
0.5
Pred
icte
d %
Nitr
ogen
in C
har (
daf)
2.52.01.51.00.5
Measured % Nitrogen in Char (daf)
820 K condition 1080 K condition 1220 K condition
Figure 5.13. Comparison of predicted and measured Nchar values of five coalspyrolyzed by Hambly in a drop tube reactor at Brigham Young Universitywith peak temperatures of 820, 1080, and 1220 K (r2 = 0.976).
0.6
0.5
0.4
0.3
0.2
0.1
0.0
Frac
tion
Rel
ease
d
9590858075706560
% Carbon (daf)
Beulah Zap
Poc. #3
Pitt. #8Illinois #6
Blue #1
Measured Mass Release Predicted Mass Release Measured Nitrogen Release Predicted Nitrogen Release
Figure 5.14. Comparison of predicted and measured mass and nitrogen release data offive coals pyrolyzed by Hambly in a drop tube reactor at Brigham YoungUniversity with peak temperature of 1220 K.

68
Hambly16 also conducted pyrolysis experiments on 11 coals in a flat-flame burner
at Brigham Young University (set 3d). A list of the coals is given in Appendix G. The
residence time was approximately 18 ms, and the peak gas temperature was about 1641
K. Mass release was determined by a mass balance on the char. The mass release of
several of the coals pyrolyzed seemed unusually high for several low volatile coals.
Therefore, as part of this thesis project, the experiments were repeated for the coals with
suspiciously high mass release. It was discovered that a significant amount of char was
being trapped in the separation system of the flat-flame burner apparatus. Therefore, the
mass release calculated by Hambly using a mass balance on the char was too high. Care
was taken in the this study to collect the char trapped in the separation system after each
coal was pyrolyzed. The new results seem to be consistent with the expected mass
release based on coal type.
During the repeat experiments water flow problems in the collection probe of the
flat-flame burner caused the probe tip to overheat at the 18 ms condition. To solve this
problem, the repeat experiments were conducted at a condition which places the probe tip
downstream of the hottest gases. The residence time of the experiments of this study
was about 78 ms, and the peak gas temperature was the same as the 18 ms condition
(1641 K). The flat-flame burner collection system and gas temperature and velocity
profiles are described in detail by Ma.58 Temperature and velocity profiles of the 18 ms
and 78 ms conditions are given in Appendix H.
Figure 5.15 compares the CPD model predictions of total mass release with the
measured mass release determined by Hambly and during the repeat experiments of this
study. In general, the CPD model predictions of mass release compare well with the
experiment data.
Figure 5.16 compares CPD model predictions of the total fraction of nitrogen
release with the measured nitrogen release. Model predictions of nitrogen release for coals
with carbon content between 67 and 80 percent compare well with the experimental data.

69
0.8
0.6
0.4
0.2
0.0
Frac
tion
Rel
ease
d
95908580757065
% Carbon (daf)
Measured Mass Release (Hambly) Predicted Mass Release (Hambly) Measured Mass Release (This Study) Predicted Mass Release (This Study)
Figure 5.15. Comparison of CPD model predictions of mass release with experimentaldata for coals pyrolyzed in a flat-flame burner by Hambly16 and duringthis study. Carbon content is used as a rank indicator.
0.8
0.6
0.4
0.2
0.0
Frac
tion
Rel
ease
d
95908580757065
% Carbon (daf)
Measured Nitrogen Release (Hambly) Predicted Nitrogen Release (Hambly) Measured Nitrogen Release (This Study) Predicted Nitrogen Release (This Study)
Figure 5.16. Comparison of CPD model predictions of nitrogen release withexperimental data for coals pyrolyzed in a flat-flame burner by Hambly16
and during this study. Carbon content is used as a rank indicator.
For the higher rank coals (coals with greater than 80 % carbon) pyrolyzed in this
study nitrogen release was over-predicted by the model by as much as 20 percent
absolute. The model prediction of nitrogen release for the coal with 85.5 percent carbon

70
pyrolyzed by Hambly at the 18 ms condition, however, compares well with the
experimental nitrogen release (designated with a circle in Figure 5.16). It appears that the
nitrogen model developed in this study over-predicts nitrogen release that occurs at severe
pyrolysis conditions (such as a methane flat-flame burner) and at extended residence
times. The over-predictions for high rank coals result from over-predictions of light gas
nitrogen, suggesting that a simple first order rate expression with a distributed activation
energy may not be adequate to describe light gas nitrogen release at all pyrolysis
conditions, particularly for high rank coals.
Discussion of Volatile Nitrogen Release Model
The volatile nitrogen release model developed in this study and incorporated into
the CPD model appears to adequately model average nitrogen release behavior for a wide
variety of coals and experimental conditions. This work represents the first volatile
nitrogen release model developed based on 13C NMR measurements of coal structure.
This work also represents the first volatile nitrogen release model evaluated by comparing
model predictions with chemical structural features of the char (determined by 13C NMR
spectral analyses).
Experimental conditions that have been simulated using the volatile nitrogen
release model include high heating rates ranging from 104 K/s to 105 K/s, gas temperature
ranging from 820 K to 1641 K, and residence times ranging from 18 to 400 ms. The
model seems to accurately describe the volatile nitrogen release of many coals and
pyrolysis conditions. Model predictions seemed particularly good for the four coals
pyrolyzed by Chen at the 104 K/s heating rate condition.
It is apparent that the model over-predicted nitrogen release for some high rank
coals pyrolyzed in the flat-flame burner (severe pyrolysis) at Brigham Young University
with a residence time of 78 ms. This suggests that the simple first order kinetics used in
this modeling effort may not be adequate to accurately describe nitrogen release at all

71
pyrolysis conditions. The correlation for the fraction of stable nitrogen, fst, seems to
adequately describe the decrease in Nsite decay in high rank coals under most conditions.
However, at severe pyrolysis conditions with relatively long residence times, Nsite decay
is still over-predicted. Further studies of the chemical structure of pyrolysis products
from a wide variety of coals and conditions using solid-state 13C NMR spectroscopy will
be necessary to more fully understand the mechanism of light gas nitrogen release and
develop a more robust model. For most pyrolysis conditions, however, reasonable
predictions of volatile nitrogen release can be expected.
The nitrogen model developed in this study is similar to the nitrogen release
models in the FG-DVC and FLASHCHAIN models in that (i) similar assumptions were
made regarding the functionality of nitrogen in coal and how nitrogen is released during
primary pyrolysis; and (ii) a first order rate expression with a distributed activation
energy model was used to model nitrogen released from the char as HCN (Nsite decay).
However, unlike the other models, the nitrogen release model developed in this work is
linked directly to the chemical structure of coal and the change in the chemical structure of
char during pyrolysis. This is an important step towards developing a mechanistic model
of nitrogen release to accurately determine the quantity of nitrogen released as HCN and
tar.

72

73
Chapter 6. Predicting Light Gas Composition
Comprehensive coal combustion codes such as PCGC-3 are important tools in
screening new technologies for improved combustion efficiency and emissions reduction
strategies. In order to accurately model coal combustion, comprehensive combustion
codes require that the quantity and product distribution of pyrolysis species be specified.
The CPD model has been successfully used in PCGC-3 to calculate the quantity of char,
tar, and light gas products during pyrolysis. Before this work, the distribution of light gas
pyrolysis products (CH4, CO2, CO, H2O, and other light gas species), however, had to be
specified by the user.
A submodel has been developed in this work that efficiently predicts the
distribution of light gas pyrolysis products. This model is based on coal type and a
correlation between the light gas products and the extent of light gas release. Model
predictions have been shown to compare well with measured quantities of water,
methane, carbon dioxide, carbon monoxide, and other light gas species (calculated by
difference) released during pyrolysis experiments conducted on a variety of coals at slow
and high heating rates.
Background
The FG (functional group) submodel of the FG-DVC model of coal devolatilization
describes the kinetics of individual species evolution at high-temperature and high-heating
rate conditions.11 The FG submodel solves 20 differential rate equations that are first
order in individual functional group concentration. The functional group composition
parameters (the initial fraction of the component in the parent coal) are generally
determined from TG-FTIR pyrolysis experiments. In other words, the maximum yield of

74
each light gas component must be specified, and then each individual differential equation
is solved to give the light gas composition as a function of time and temperature. In
addition, distributed activation energies are used, which adds significant complexity.
Table 6.1 lists the rank independent rate coefficients for the main light gas species of the
FG submodel and species composition parameters for a bituminous coal and a lignite.
Table 6.1
Kinetic Rate Coefficients and Species Composition Parameters for FG Submodel
GasFunctional
GroupSource
Rate Equation*PittsburghhvAb coal
BeulahZap
lignite
CO2 extra loose Carboxyl k = 0.81E + 13 exp(-(22500 ± 1500)/T) 0.000 0.065CO2 loose Carboxyl k = 0.65E + 13 exp(-(33850 ± 1500)/T) 0.007 0.030CO2 light k = 0.11E + 13 exp(-(38315 ± 2000)/T) 0.005 0.005H2O loose Hydroxyl k = 0.22E + 13 exp(-(30000 ± 1500)/T) 0.012 0.062H2O tight Hydroxyl k = 0.17E + 13 exp(-(32700 ± 1500)/T) 0.012 0.033CO ether loose k = 0.14E + 13 exp(-(40000 ± 6000)/T) 0.050 0.060CO ether tight Ether O k = 0.15E + 13 exp(-(40500 ± 1500)/T) 0.021 0.038CO extra tight Ether O k = 0.20E + 13 exp(-(45500 ± 1500)/T) 0.020 0.090CH4 extra loose Methoxy k = 0.84E + 13 exp(-(30000 ± 1500)/T) 0.000 0.000CH4 loose Methyl k = 0.75E + 13 exp(-(30000 ± 2000)/T) 0.020 0.017CH4 tight Methyl k = 0.34E + 13 exp(-(30000 ± 2000)/T) 0.015 0.009* The rate equation is of the form k = k0 exp(-(E/R ± σ/R)/T), with k0 in s-1, E/R in K,and σ/R in K. σ designates the spread in the activation energies in a Gaussiandistribution. Adapted from Solomon.11
For coals where TG-FTIR experimental data are unavailable, Serio, et al.42
proposed a two-dimensional linear interpolation technique based on coal rank to estimate
the functional group parameters for the FG submodel. This interpolation scheme was
discussed in Chapter 2. Since TG-FTIR data are not available for most coals, the
interpolation method is used to estimate the functional group composition parameters for
most coals.
75
In the current work, a submodel was developed that predicts the composition of
light gas released during devolatilization without solving species continuity equations for
each functional group. Using light gas evolution data reported by Solomon et al.31 and
Chen52 , a look-up table of light gas composition versus the extent of light gas release was
created and used to develop a correlation to estimate the light gas pyrolysis product
composition for any coal.
Analysis of Light Gas Release Data
A number of studies addressing the composition and kinetics of light gas species
evolution have been conducted.25, 28, 29, 31, 52, 59, 60 The general implications of these
studies are discussed in detail by Smith.5 Full analysis of the experimental light gas data
conducted during this study is given in Appendix I; only a brief discussion of the
conclusions is given here.
TG-FTIR Experiments
Solomon et al.31 developed a TG-FTIR instrument that combines
thermogravametric analysis with evolved gas product analysis by Fourier Transform
infrared spectroscopy. This instrument was used to analyze the devolatilization
products of the eight Argonne Premium Coals. The TG-FTIR analysis determined the
relative amounts of H2O, CO2, CO, CH4, and several other less significant gas species
evolved during pyrolysis as a function of time. A correlation was developed to relate tar
yield to the FTIR as well. The coal samples were heated to 900 °C at 30 °C/min, and
then immediately cooled to 250 °C over a period of 20 minutes.
Analysis of the composition of light gas as measured by TG-FTIR analyses of the
eight coals indicated that the quantity of light gas released during devolatilization at a
given condition decreases with increasing coal rank.31 Furthermore, it was evident that
the composition of light gas varies with rank. The light gas products of low rank coals

76
contain a larger fraction of CO and CO2 relative to high rank coals. Light gas evolved from
high rank coals appears to contain more CH4 and other light hydrocarbons than light gas
evolved from lower rank coals. The TG-FTIR study also indicated that the composition
of light gas varies with the extent of light gas release. Finally, the TG-FTIR data
suggested that the composition of light gas is similar for coals of similar rank.
Light Gas Data From a Radiantly-Heated Reactor
Chen30 conducted pyrolysis experiments on four coals using a radiantly heated
flow reactor. The coal particles were radiantly heated to temperatures of approximately
600 K to 1300 K at about 104 K/s. The wall temperature of the reactor was 1840 K. The
carrier gas remained relatively cool, minimizing secondary tar reactions, but complicating
interpretation of particle temperatures. Each coal was pyrolyzed in the radiantly-heated
reactor at eight different residence times. Peak particle temperature increased with
increasing residence time. The effluent non-condensable gases were quantified using non-
dispersive infrared (NDIR) analysis, chemiluminescence, and gas chromatography.
Careful inspection of the light gas data collected by Chen also indicated that the
quantity and composition of light gas are rank dependent, and that the light gas pyrolysis
products of coals of similar rank have similar compositions. Comparing the light gas data
from the high heating rate experiments conducted by Chen to the TG-FTIR data (slow
heating rate) suggested that the composition of light gas is mainly dependent on the extent
of light gas release and is relatively insensitive to heating rate. However, light gas formed
under high heating rate conditions does have a larger fraction of light hydrocarbon species
such as C2H4 and C2H6. This may be due to high temperature secondary reactions
Pyrolysis Experiments at Various Heating Rates
Suuberg et al.25 conducted pyrolysis experiments at various heating rates on a
Montana lignite and a Pittsburgh no. 8 bituminous coal. Heating rates varied from about
77
300 K/s to 104 K/s. The results of his experiments indicated that the composition of light
gas was insensitive to heating rate, but did vary with coal type and the extent of light gas
release.
Conclusions from Data Analysis
The following important conclusions were drawn from these studies: (i) light gas
from coal pyrolysis is primarily composed of water, carbon dioxide, carbon monoxide,
and methane; (ii) other minor constituents include hydrogen, nitrogen and sulfur
containing gases, and low molecular weight olefins and paraffins; (iii) the composition of
light gas is a function of rank (low rank coals contain more carbon oxides while high rank
coals contain more hydrocarbons); (iv) the evolution rates of individual species are
relatively insensitive to coal type when normalized by the coal dependent yield; and (v)
the composition of light gas seems to correlate well with the extent of light gas release,
and is relatively insensitive to heating rate. Based on these conclusions, it appears that
using a correlation based on coal type and the extent of light gas release to estimate light
gas composition would be appropriate.
Correlation of Light Gas Composition
A correlation of light gas composition was developed in this study based on coal
type and the extent of light gas release. A look-up table was created using light gas data
collected on twelve coals studied by Solomon et al.31 and by Chen and Niksa.30 The
look-up table is given in Appendix J. The table gives the composition of light gas (H2O,
CO2, CO, CH4, and other light gases) as a function of the extent of total light gas release
for each of the twelve coals. The extent of light gas release is defined as, Xgas, the ratio of
the light gas yield to the maximum light gas yield.
One motivation in developing a model for light gas species release is to retain the
tie to chemical structure through the CPD model. In the CPD model, a series of reactions

78
are used to model the cleavage of bridges and side chains to form light gas. The sum of
aliphatic bridges ( l ) and aliphatic side chains (δ) represent the total quantity of light gas
precursors. The initial distribution of attachments between bridges and side chains is
determined by 13C NMR spectral analysis of the parent coal. As light gas is evolved, l
and δ approach zero in the CPD model, which represents the maximum light gas release
possible. In this work, the composition of light gas was correlated with the extent of light
gas release. The extent of light gas release (Xgas) was normalized in the CPD model by the
initial amount of light gas precursors and ranges from 0 (no light gas release) to 1
(complete light gas release), as follows:
Xgas = 1 −
δ /2 + lδ / 2 + l( )
0
(6.1)
where the “0” represents the structure of the parent coal. δ is divided by 2 because in the
CPD model it is assumed that side chains are half the molecular weight of bridges.
In order to estimate the composition of the light gas pyrolysis products of any
coal as a function of the extent of devolatilization, a submodel was developed for the CPD
model that uses a double interpolation correlation. One interpolation is used for coal
type, and the other for the extent of total light gas release based on three reference coals.
Interpolation for Coal Type
As discussed in Chapter 2, Serio et al.42 proposed a two-dimensional method
based on coal rank to estimate the input parameters for the FG-DVC model. The O/C
and H/C molar ratios were used as indicators of rank. The elemental ratios of several well
studied coals were used to form a two-dimensional triangular mesh on a H/C vs. O/C
coalification diagram. Each triangle was composed of three nodes (i.e. reference coals).
For an unknown coal, the elemental composition determined the appropriate triangle, and
the structural parameters of the unknown coal were interpolated from the parameters
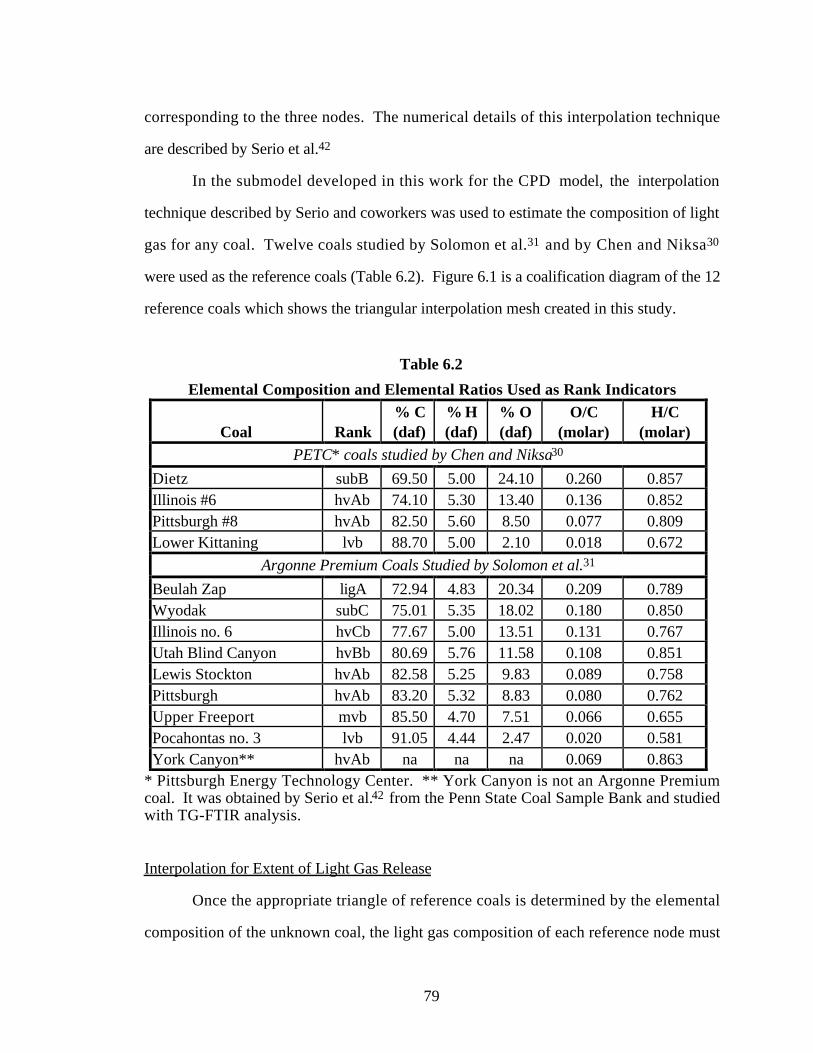
79
corresponding to the three nodes. The numerical details of this interpolation technique
are described by Serio et al.42
In the submodel developed in this work for the CPD model, the interpolation
technique described by Serio and coworkers was used to estimate the composition of light
gas for any coal. Twelve coals studied by Solomon et al.31 and by Chen and Niksa30
were used as the reference coals (Table 6.2). Figure 6.1 is a coalification diagram of the 12
reference coals which shows the triangular interpolation mesh created in this study.
Table 6.2
Elemental Composition and Elemental Ratios Used as Rank Indicators
Coal Rank% C(daf)
% H(daf)
% O(daf)
O/C(molar)
H/C(molar)
PETC* coals studied by Chen and Niksa30
Dietz subB 69.50 5.00 24.10 0.260 0.857Illinois #6 hvAb 74.10 5.30 13.40 0.136 0.852Pittsburgh #8 hvAb 82.50 5.60 8.50 0.077 0.809Lower Kittaning lvb 88.70 5.00 2.10 0.018 0.672
Argonne Premium Coals Studied by Solomon et al.31
Beulah Zap ligA 72.94 4.83 20.34 0.209 0.789Wyodak subC 75.01 5.35 18.02 0.180 0.850Illinois no. 6 hvCb 77.67 5.00 13.51 0.131 0.767Utah Blind Canyon hvBb 80.69 5.76 11.58 0.108 0.851Lewis Stockton hvAb 82.58 5.25 9.83 0.089 0.758Pittsburgh hvAb 83.20 5.32 8.83 0.080 0.762Upper Freeport mvb 85.50 4.70 7.51 0.066 0.655Pocahontas no. 3 lvb 91.05 4.44 2.47 0.020 0.581York Canyon** hvAb na na na 0.069 0.863
* Pittsburgh Energy Technology Center. ** York Canyon is not an Argonne Premiumcoal. It was obtained by Serio et al.42 from the Penn State Coal Sample Bank and studiedwith TG-FTIR analysis.
Interpolation for Extent of Light Gas Release
Once the appropriate triangle of reference coals is determined by the elemental
composition of the unknown coal, the light gas composition of each reference node must
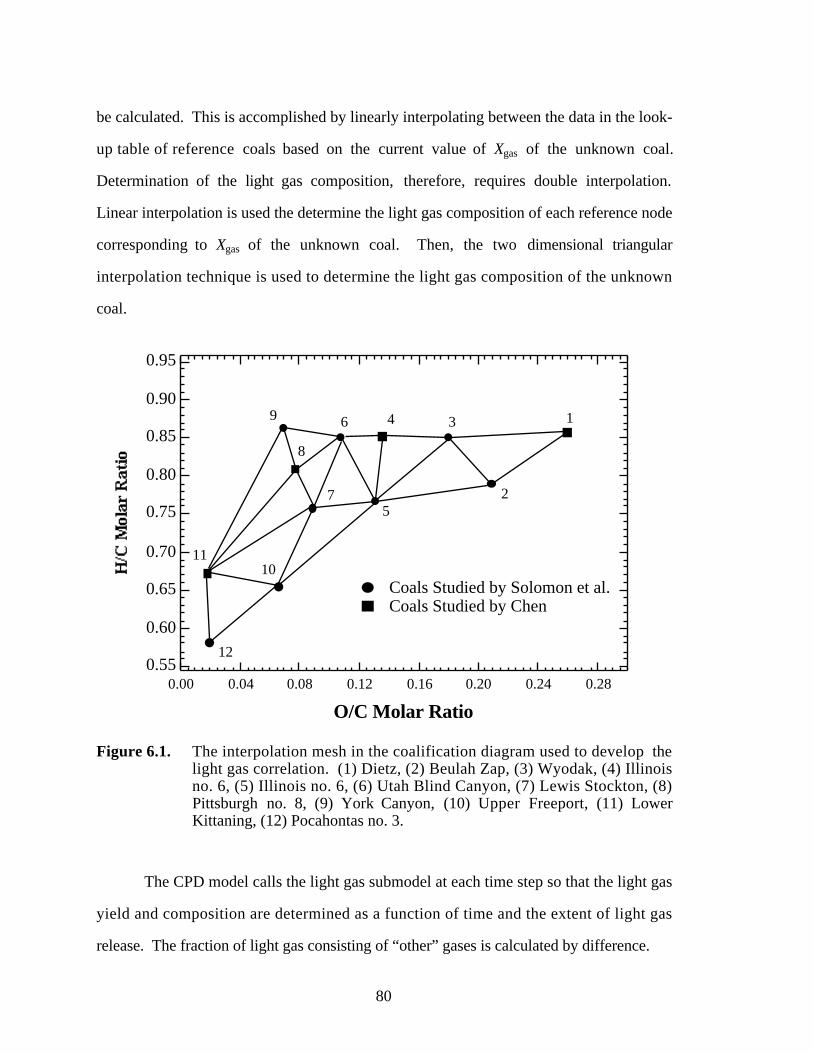
80
be calculated. This is accomplished by linearly interpolating between the data in the look-
up table of reference coals based on the current value of Xgas of the unknown coal.
Determination of the light gas composition, therefore, requires double interpolation.
Linear interpolation is used the determine the light gas composition of each reference node
corresponding to Xgas of the unknown coal. Then, the two dimensional triangular
interpolation technique is used to determine the light gas composition of the unknown
coal.
0.95
0.90
0.85
0.80
0.75
0.70
0.65
0.60
0.550.280.240.200.160.120.080.040.00
O/C Molar Ratio
1
2
10
6
8
39
75
4
12
11
Coals Studied by Solomon et al. Coals Studied by Chen
Figure 6.1. The interpolation mesh in the coalification diagram used to develop thelight gas correlation. (1) Dietz, (2) Beulah Zap, (3) Wyodak, (4) Illinoisno. 6, (5) Illinois no. 6, (6) Utah Blind Canyon, (7) Lewis Stockton, (8)Pittsburgh no. 8, (9) York Canyon, (10) Upper Freeport, (11) LowerKittaning, (12) Pocahontas no. 3.
The CPD model calls the light gas submodel at each time step so that the light gas
yield and composition are determined as a function of time and the extent of light gas
release. The fraction of light gas consisting of “other” gases is calculated by difference.
81
yother = 1− yi∑ (6.2)
The fractions of original coal mass released as H2O, CO2, CO, CH4, and other light gases
are also calculated.
During the course of the development of this submodel, while applying the light
gas correlation to unknown coals, it was determined that a small fraction of coals do not
fall within the triangular mesh of reference nodes. A crude method of estimating the light
gas composition of such coals was developed. For most coals whose elemental
composition does not correspond to a triangle within the mesh, the light gas distribution
is estimated by the nearest node on the coalification diagram. The light gas composition
of extremely high rank coals was estimated based on the measured light gas composition
of the pyrolysis products of an anthracite coal, known as Hongay, reported by Xu and
Tomita.28 The light gas composition of extremely low rank coals was estimated based on
data on a lignite, known as Rhein Braun, also reported by Xu and Tomita.
Application of Light Gas Correlation
CPD model predictions of light gas composition determined using the light gas
composition correlation were compared with measured light gas data from low and high
heating rate pyrolysis experiments on coals not used to develop the correlation. The
correlated light gas compositions compared well with the measured data for most of the
coals tested.
As previously discussed, Xu an Tomita28 conducted devolatilization experiments
on 17 coals in a Curie-point pyrolyzer which heated samples to 1037 K at 3000 K/s (see
Table 4.7). CPD model predictions (see Appendix C) of light gas composition and the
measured composition are compared in Figure 6.2. Xgas was about 0.87 in each case. For
several individual cases large discrepancies between model predictions and the

82
experimental data exist (such as at 77% C). However, the general trends of the variation
in light gas composition with coal type are well predicted.
1.0
0.8
0.6
0.4
0.2
0.0
Lig
ht G
as C
ompo
sitio
n
95908580757065
Percent Carbon in Parent Coal (daf)
Water
Carbon dioxideMethane
Carbon monoxide
Other gases
Figure 6.2. Comparison of CPD model predictions of light gas composition using thecorrelation with the light gas composition measured by Xu and Tomita.28
The solid symbols represent the measured data and the open symbolsrepresent the CPD model estimations.
Burnham et al.60 conducted slow heating rate pyrolysis experiments (about 60
K/sec) on the Argonne premium coal suite using a Rock-eval apparatus. Based on the
heating rate and peak temperature reported by Burnham, a particle temperature profile
was estimated and used in the CPD model to predict tar and light gas yields. The coal
samples studied by Burnham are identical to those examined by Solomon et al.31 using
TG-FTIR analyses (coals 1-8, Tables 4.1, 4.2, and 4.3). The measured NMR parameters
listed in Table 4.3 were used in the CPD model. CPD model predictions of light gas
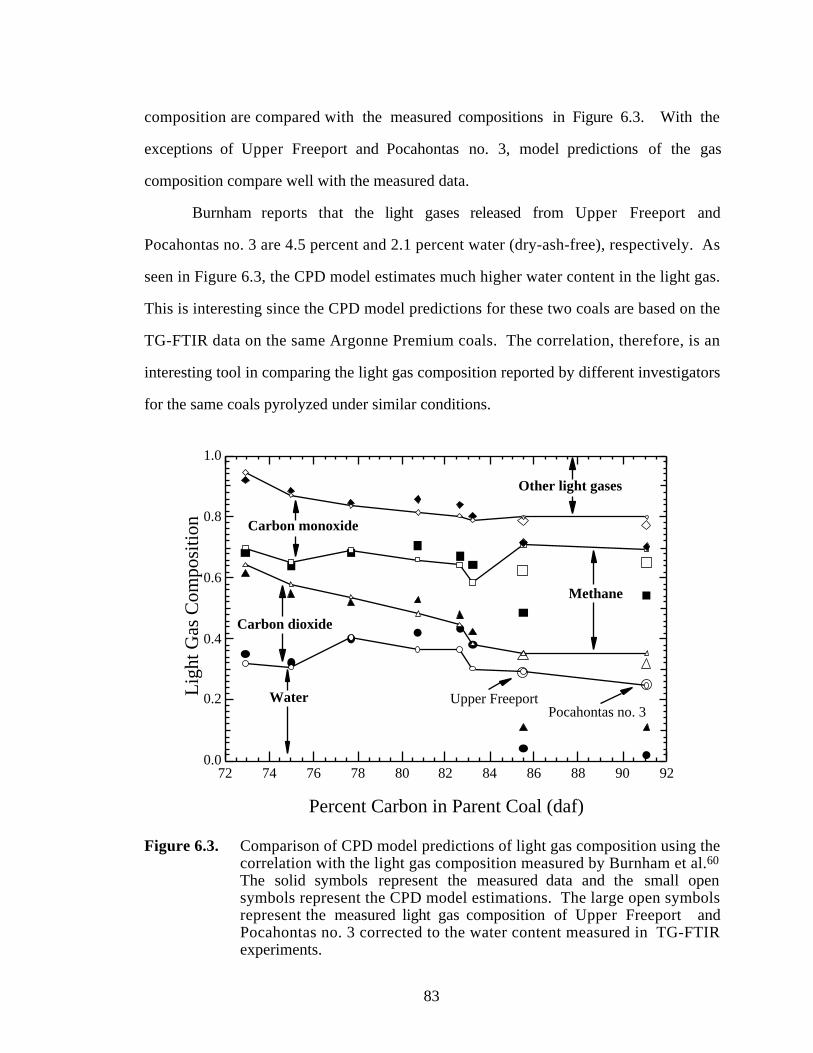
83
composition are compared with the measured compositions in Figure 6.3. With the
exceptions of Upper Freeport and Pocahontas no. 3, model predictions of the gas
composition compare well with the measured data.
Burnham reports that the light gases released from Upper Freeport and
Pocahontas no. 3 are 4.5 percent and 2.1 percent water (dry-ash-free), respectively. As
seen in Figure 6.3, the CPD model estimates much higher water content in the light gas.
This is interesting since the CPD model predictions for these two coals are based on the
TG-FTIR data on the same Argonne Premium coals. The correlation, therefore, is an
interesting tool in comparing the light gas composition reported by different investigators
for the same coals pyrolyzed under similar conditions.
1.0
0.8
0.6
0.4
0.2
0.0
Lig
ht G
as C
ompo
sitio
n
9290888684828078767472
Percent Carbon in Parent Coal (daf)
Water
Carbon monoxide
Carbon dioxide
Other light gases
Methane
Upper FreeportPocahontas no. 3
Figure 6.3. Comparison of CPD model predictions of light gas composition using thecorrelation with the light gas composition measured by Burnham et al.60
The solid symbols represent the measured data and the small opensymbols represent the CPD model estimations. The large open symbolsrepresent the measured light gas composition of Upper Freeport andPocahontas no. 3 corrected to the water content measured in TG-FTIRexperiments.
84
The compositions of the light gas pyrolysis products of Upper Freeport and
Pocahontas no. 3 reported by Burnham and coworkers were corrected to the water
content determined by the TG-FTIR experiments conducted by Solomon and coworkers.
This correction cannot be completely justified; however, light gas data from similar coals
generated by various investigators is consistent with the TG-FTIR water content data25,
28, 30 and may indicate experimental error in the Rock-eval process. This correction is
represented in Figure 6.3 by the large open symbols. With this correction, the relative
content of CO2, CO, CH4, and other gases reported by Burnham compare well with the
TG-FTIR data. The correction makes it evident that the only large discrepancy between
the light gas data reported by Burnham and by Solomon is in the light gas water content
of the pyrolysis products of Upper Freeport and Pocahontas no. 3.
Discussion of Light Gas Correlation
Experimental data collected during the pyrolysis experiments conducted by
Solomon et al.,31 Chen and Niksa,30 and Burnham et al.60 suggest that the composition of
light gas released during coal pyrolysis is insensitive to heating rate but varies with the
extent of light gas release and coal type. Therefore a correlation of light gas composition
based on coal type and the extent of light gas release was developed in this study. This is
a viable alternative to using a large set of differential rate equations to describe the
evolution of each light gas species. Since no numerical solutions to differential equations
must be performed when using the correlation, the correlation is expected to be a very
rapid method of estimating the light gas composition of pyrolysis products. It is
anticipated that the correlation can be implemented in comprehensive coal combustion
codes such as PCGC-3 without a significant increase in run time.
As mentioned previously, the maximum yield of each light gas species must be
specified in the FG submodel of the FG-DVC model. This is the equivalent of the light
gas composition when Xgas equals one in the light gas correlation developed in this study.

85
The maximum yields are estimated in the FG-DVC model using the two-dimensional
triangular interpolation technique based on Argonne Premium coals analyzed by TG-
FTIR. Therefore, the accuracy (or inaccuracy) of the two approaches are similar.
The light gas composition correlation presented here offers several additional
advantages over the differential equation approach used in the FG-DVC model.
Estimations of light gas composition are interpolated directly from experimental data as a
function of Xgas as opposed to using differential rate equations. The empirically derived
rate constants used in the FG-DVC model to solve for the yields of each species as a
function of time likely introduce additional error. Also, the light gas data reported by
Chen was used in this study to expand the triangular mesh of reference coals so that the
correlation will be applicable to a larger range of coals. Another advantage of the look-up
table approach is that the light gas submodel can used as a post-processing device to
estimate the composition of light gas after complete devolatilization (or as it enters and
leaves a grid cell) instead of calculating the composition at each time step.

86

87
Chapter 7. Conclusions
The primary objective of this project was to develop a primary volatile nitrogen
release model based on the chemical structure of coal, and to incorporate the model into
the CPD model. A secondary, but equally important, objective of this project was to
increase the industrial usefulness of the CPD model. These objectives were successfully
achieved through the following accomplishments:
• A reasonable correlation was developed to estimate the chemical
structure of coal based on elemental composition and volatile matter
content.
• A volatile nitrogen release model was developed based on the chemical
structure of coal, and evaluated using gas, char, and tar nitrogen release
yields.
• The volatile nitrogen release model developed in this study was further
evaluated in a novel manner by comparing model predictions to the
chemical structure of char as determined by 13C NMR spectral
analyses.
• A submodel was developed and coupled with the CPD model to
estimate the composition of light gas released during devolatilization.
Correlations to Estimate Coal Structure
Non-linear correlations were developed to model the average structural
characteristics of coal as a function of elemental composition and ASTM volatile matter
content. Reasonable estimations of 13C NMR structural parameters for most coals can be
88
expected using the correlation. However, it is expected that these correlations, just like
any correlation, will not work well for some unusual coals.
The non-linear modified quadratic correlation of 13C NMR measurements of coal
structure with ultimate analysis and volatile matter content seems to be an appropriate
method to estimate the coal structure input parameters for network devolatilization
models, such as the CPD model. The correlation, combined with the CPD model, appears
to work well in predicting total volatiles and tar yields for low to high rank coals.
Although one of the principal motives for this study was the estimation of the input
parameters for the CPD model, the estimated structural parameters should be useful in
other applications, and a similar approach could be used to develop predictive models for
other structural parameters.
The accuracy of CPD model predictions of tar and light gas were enhanced by
developing a correlation to estimate the initial fraction of stable bridges, c0, based on the
elemental composition of coal. The correlation seems to give reasonable estimates of c0
for a wide range of coals.
Volatile Nitrogen Release Model
A volatile nitrogen release model was developed in this study by (1) modeling the
release of nitrogen from the char as HCN with a first order rate expression with a
distributed activation energy model, (2) modifying the CPD model to calculate the
quantity of nitrogen released with the tar at each time step, and (3) evaluating the model
by comparing model predictions of nitrogen release to experimental data not included in
the regression of model parameters. Model predictions of nitrogen release compared well
with experimental nitrogen release data for most coals and pyrolysis conditions. The
model, therefore, seems to represent an appropriate and accurate method of predicting
volatile nitrogen release for most coals during pyrolyis.

89
In order to satisfy the shortage of available nitrogen release data for low volatile
coals, six high rank coals were pyrolyzed in a flat-flame burner as part of this study.
Comparison of volatile nitrogen release predictions with the measured nitrogen release
data obtained for the six high rank coals confirmed that the volatile nitrogen release model
developed in this study over-predicts nitrogen release from some low volatile coals
pyrolyzed under severe pyrolysis conditions. The experimental data collected in this
study on high rank coals will be very important in developing and evaluating advanced
nitrogen release models in the future.
The volatile nitrogen release model developed in this work represents the first
volatile nitrogen release model evaluated by comparing model predictions with the
chemical structure of char (as measured by 13C NMR analyses). Model predictions of
Nsite were compared to measured values of Nsite (determined from 13C NMR spectral
analyses of the chars) determined from the pyrolysis experiments conducted by Fletcher
and coworkers1, 14, 55-57, 48 and by Hambly.16 Predictions of Nsite compared well with
measured values for most coals.
Evaluation of the model based on the chemical structure of the char is significant
because (i) it confirms that nitrogen is released not only with the tar, but also as HCN
from the char due to the thermal rupture of pyrrolic and pyridinic nitrogen forms; and (ii)
it quantifies the accuracy of the predicted distribution of nitrogen between char, tar, and
HCN (as opposed to only comparing model predictions with total nitrogen release).
Other models have primarily been evaluated based on comparing model predictions with
measured total nitrogen release. The evaluation based on the chemical structure of char
seems to indicate that the volatile nitrogen release model developed in this study not only
accurately predicts total nitrogen release for most coals and conditions, but also
accurately describes the distribution of nitrogen between char, tar, and HCN which may
be important in developing advanced low NOx technology.
90
Light Gas Submodel
A submodel was created and coupled with the CPD model that estimates the
composition of light gas evolved during pyrolysis. The model includes a look-up table of
measured light gas composition for 12 coals of various rank as a function of the extent of
devolatilization. A double interpolation method was developed in order to estimate the
composition of light gas pyrolysis products of an unknown coal. CPD model predictions
of light gas composition compared well with experimental data collected in low and high
heating rate pyrolysis experiments that were not included in the look-up table. It is
anticipated that the look-up table approach used in this modeling effort will not add any
significant run-time when coupled with comprehensive coal combustion codes such as
PCGC-3. It seems, therefore, that the look-up table approach to estimating light gas
composition is a valuable alternative to solving a continuity equation for each species.
Impact of This Work
The modifications made in this study to the CPD model enhance its industrial
usefulness. The volatile nitrogen release model is an important step toward more
accurately modeling the formation of NOx precursors in comprehensive coal combustion
codes which provide an important screening tool of new low NOx technology. Due to the
reliable method of estimating the chemical structure input parameters of any coal
developed in this study, and the creation of a computationally simple method to estimate
light gas pyrolysis product compositions, the CPD model will be a more useful addition
to comprehensive combustion models. It is anticipated that the modified CPD model
will be coupled with PCGC-3 in the near future, and therefore will significantly increase
the accuracy and applicability of PCGC-3, including improving the accuracy of NOx
predictions.
91
Chapter 8. Recommendations for Future Work
Significant progress in modeling volatile nitrogen release and enhancing the
industrial usefulness of the CPD Model has been made in this thesis project. Like most
research, however, this project represents a work in progress. During the course of this
project, a number of ideas to further improve this work were conceived.
Recommendations regarding work that might be conducted to continue this project are
given below.
NMR Correlation
It is not know why the correlations between the chemical structural parameters
and the elemental composition and volatile matter content exist. It was suggested in
Chapter 4 that perhaps the correlations exist because there is a relationship between the
elemental composition and the maceral content that the quadratic correlations are able to
describe. It would be useful to examine the elemental composition and volatile matter
content of macerals at various stages of maturation in order to confirm or discount this
hypothesis. Such a study of maceral content would not only be useful in improving the
NMR correlations, but may also be helpful in improving CPD Model predictions of tar
and light gas release.
Volatile Nitrogen Modeling
The actual mechanism of light gas nitrogen release during pyrolysis is still
unknown. Further studies of the chemical structure of pyrolysis products from a wide
variety of coals and conditions using 13C NMR spectroscopy will be necessary to more
fully understand the mechanism of light gas nitrogen release. Determining the actual

92
mechanism of light gas nitrogen release will undoubtedly lead to a more accurate model. It
may also be possible to continue improving the model using an empirical approach. For
example, perhaps two individual rate expressions could be used to describe the decay of
the stable nitrogen and the less stable nitrogen. Another possibility would be to correlate
fst with pyrolysis conditions such as temperature and heating rate. These approaches
may help to model Nsite decay in low volatile coals during severe pyrolysis.
Light Gas Correlation
It would be interesting to do a mass balance on coal using the light gas correlation
and compare the predicted elemental composition of chars with measured compositions.
Being able to determine the composition of char would be useful in determining char
burnout rates in coal combustion models. A mass balance on coal was not conducted in
this study because the composition of the fraction of light gas called “other” light gas is
not known. In the future, perhaps a correlation could be developed between the
composition of “other” light gases (thought to be olefins and paraffins) and coal rank.
Such a correlation would be useful in closing a mass balance.

93
References
1. Baxter, L. L., R. E. Mitchell, T. H. Fletcher and R. H. Hurt, Energy & Fuels, 10 ,188-196 (1996).
2. Cai, H. Y., A. J. Guell, D. R. Dugwell and R. Kandiyoto, Fuel, 72, 321-327(1993).
3. Smoot, L. D. and P. J. Smith, Coal Combustion and Gasification, Plenum Press,New York (1985).
4. Fletcher, T. H., A. R. Kerstein, R. J. Pugmire and D. M. Grant, Energy and Fuels,6, 414-431 (1992).
5. Smith, K. L., L. D. Smoot, T. H. Fletcher and R. J. Pugmire, The Structure andReaction Processes of Coal, Plenum Press, New York (1994).
6. Krevelen, D. W. v., Coal: Typology, Chemistry, Physics, and Constitution,Elsevier, New York (1981).
7. Spiro, C. L. and P. G. Kosky, Fuel, 61, 1080-1084 (1982).
8. Solomon, P. R., Coal Structure and Thermal Decomposition, In New Approachesin Coal Chemistry, B. D. Blaustein, B. C. Bockrath and S. Friedman, Ed.,American Chemical Society, Washington, D.C., Vol. 169, pp 61-71 (1981).
9. Marzec, A. and H. R. Schulten, Preprint, American Chemical Society, Division ofFuel Chemistry, 34, 3, 668-675 (1989).
10. Given, P. H., A. Marzec, W. A. Barton, L. J. Lynch and B. C. Gerstein, Fuel, 65 ,155-163 (1986).
11. Solomon, P. R., D. G. Hamblen, R. M. Carangelo, M. A. Serio and G. V.Deshpande, Energy and Fuels, 2, 405-422 (1988).
12. Solum, M. S., R. J. Pugmire and D. M. Grant, Energy and Fuels, 3 , 187-193(1989).
13. Orendt, A. M., M. S. Solum, N. K. Sethi, R. J. Pugmire and D. M. Grant, 13CNMR Techniques for Structural Studies of Coals and Coal Chars, In Advances inCoal Spectroscopy, H. L. C. Meuzelaar, Ed., Plenum Press, New York, pp 215-254 (1992).
94
14. Fletcher, T. H., M. S. Solum, D. M. Grant, S. Critchfield and R. J. Pugmire, 23rdSymposium (Int.) on Combustion; The Combustion Institute, Pittsburgh, PA, pp1231 (1990).
15. Watt, M., “The Chemical Structure of Coal Tar and Char DuringDevolatilization,” M.S. Thesis, Chemical Engineering Department, Brigham YoungUniversity (1996).
16. Hambly, E., “The Chemical Structure of Coal Tar and Char DuringDevolatilization,” M.S. Thesis, Chemical Engineering Department, Brigham YoungUniversity (1998).
17. Niksa, S., Energy and Fuels, 9, 467-478 (1995).
18. Burchill, P. and L. S. Welch, Fuel, 68, 100 (1989).
19. Bartle, K. D., D. L. Perry and S. Wallace, Fuel Processing Technology, 15, 351-361 (1987).
20. Wojtowicz, M. A., J. R. Pels and J. A. Moulijn, Fuel, 74, 507-515 (1995).
21. Kelemen, S. R., M. L. Gorbaty and P. J. Kwiatek, Energy & Fuels, 8, 896 (1994).
22. Wallace, S., K. D. Bartle and D. L. Perry, Fuel, 68, 1450-1455 (1989).
23. Kelemen, S. R., M. L. Gorbaty, S. N. Vaughn and P. J. Kwiatek, ACS Division ofFuel Chemistry Preprints, 38, 2, 384 (1993).
24. Anthony, D. B., J. B. Howard, H. C. Hottel and H. P. Meissner, 15th Symposium(Int.) on Combustion; The Combustion Institute, Pittsburgh, PA, pp 1303-1317(1974).
25. Suuberg, E. M., W. A. Peters and J. B. Howard, 17th Symposium (Int.) onCombustion; The Combustion Institute, Pittsburgh, PA, pp 117-130 (1978).
26. Gibbins, J. and R. Kandiyoti, Energy & Fuels, 3, 670-677 (1989).
27. Saxena, S. C., Progress in Energy and Combustion Sciences, 16, 55-94 (1990).
28. Xu, W. and A. Tomita, Fuel, 66, 627-631 (1987).
29. Serio, M. A., D. G. Hamblen, J. R. Markham and P. R. Solomon, Energy & Fuels,1, 138-52 (1987).
30. Chen, J. C. and S. Niksa, Energy & Fuels, 6, 254-264 (1992).
31. Solomon, P. R., M. A. Serio, R. M. Carangelo and R. Bassilakis, Energy & Fuels,4, 319-333 (1990).

95
32. Blair, D. W., J. O. L. Wendt and W. Bartok, 16th Symposium (Int.) onCombustion; The Combustion Institute, Pittsburgh, PA, pp 475 (1977).
33. Solomon, P. R. and M. B. Colket, Fuel, 57, 749-755 (1978).
34. Solomon, P. R. and T. H. Fletcher, 25th Symposium (Int.) on Combustion; TheCombustion Institute, Pittsburgh, PA, pp 463 (1994).
35. Mitchell, R. E., R. H. Hurt, L. L. Baxter and D. R. Hardesty, Milestone Report,Sandia Report SAND92-8208, (1992).
36. Freihaut, J. D., W. Proscia, N. Knight, A. Vranos, H. Kollick and K. Wicks“Combustion Properties of Micronized Coal for High Intensity CombustionApplications,” Final Report for DOE/PETC Contract DE-AC22-85PC80263(1989).
37. Freihaut, J. D., W. M. Proscia and J. C. Mackie, Combustion Science andTechnology, 93, 323 (1993).
38. Howard, J. B., Fundamentals of Coal Pyrolysis and Hydropyrolysis, In Chemistryof Coal Utilization, M. A. Elliot, Ed., Wiley, New York, pp 665-784 (1981).
39. Ko, G. H., W. A. Peters and J. B. Howard, Fuel, 66, 1118-1122 (1987).
40. Solomon, P. R., D. G. Hamblen, M. A. Serio, Z.-Z. Yu and S. Charpenay, Fuel,72, 4, 469-488 (1993).
41. Niksa, S., Energy and Fuels, 5, 673-683 (1991).
42. Serio, M., A., P. R. Solomon and Y. Zhao, 25th Symposium (Int.) on Combustion;The Combustion Institute, Pittsburgh, PA, pp 553-560 (1994).
43. Niksa, S., Energy and Fuels, 8, 659-670 (1994).
44. Gerstien, B. C. M., P. D.;and Ryan, L. M., Coal Structure, Academic Press, NewYork, (1982).
45. Bassilakis, R., Y. Zhao, P. R. Solomon and M. A. Serio, Energy & Fuels, 7 , 710-720 (1993).
46. Genetti, D. B., T. H. Fletcher and R. J. Pugmire, Coal Science: Proceedings of the8th International Conference on Coal Science; Elsevier, Oviedo, Spain, (1995).
47. Hintze, J., NCSS Statistical Software, Kaysville, UT, pp (1997).
48. Fletcher, T. H. and D. R. Hardesty “Milestone Report for DOE's PittsburghEnergy Technology Center,” contract FWP 0709, Sandia Report No. SAND92-8209, available NTIS (1992).

96
49. LECO, CHNS-932 Elemental Analyzer Instruction Manual, (1993).
50. Nash, J. C., Nonlinear Parameter Estimation, Marcel Dekker, Inc., New York,NY, (1987).
51. Carr, A. D. and J. E. Williamson, Organic Geochemistry, 16, 313-330 (1983).
52. Chen, J. C. “Effect of Secondary Reactions on Product Distribution and NitrogenEvolution from Rapid Coal Pyrolysis,” Ph.D. Dissertation, Stanford University(1991).
53. Perry, S., "Modeling Nitrogen Release During Devolatilization Based on theChemical Structure of Coal", Ph.D. Dissertation in Progress, Brigham YoungUniverisity (1998).
54. Hill, S., Research Professor, Brigham Young University, Personal Communication(1998).
55. Fletcher, T. H., Combustion and Flame, 78, 223 (1989).
56. Pugmire, R. J., M. S. Solum, D. M. Grant, S. Critchfield and T. H. Fletcher,Fuel, 70, 414 (1991).
57. Fletcher, T. H., M. S. Solum, D. M. Grant and R. J. Pugmire, Energy and Fuels, 6 ,643-650 (1992).
58. Ma, J., “Soot Formation During Coal Pyrolysis,” Ph. D. Dissertation, ChemicalEngineering Department, Brigham Young University (1996).
59. Solomon, P. R. and M. B. Colket, 17th Symposium (Int.) on Combustion; TheCombustion Institute, Pittsburgh, PA, 131-143 (1978).
60. Burnham, A. K., S. O. Myongsook and R. W. Crawford, Energy & Fuels, 3, 42-55(1988).

97
Appendices

98

99
Appendix A: Correlated Structural Parameters
Table A.1
Structural Parameters for Coals in Data base Calculated Using the Correlation
# Source Seam Mδ Mcl p0 σ + 1 c0
1 PSOC 1507 (AR) Beulah-Zap 42 326 0.60 5.0 0.112 PSOC-1520 (AR) Wyodak 41 357 0.54 5.0 0.083 PSOC-1502 (AR) Blind Canyon 36 386 0.46 5.0 0.004 PSOC-1493 (AR) Illinois #6 37 334 0.54 5.2 0.015 PSOC-1451 (AR) Pittsburgh #8 31 330 0.53 4.9 0.006 ANL (AR) Stockton 31 329 0.55 5.0 0.007 ANL (AR) Upper Freeport 25 277 0.63 4.8 0.008 PSOC-1508 (AR) Pocahontas #3 16 230 0.75 4.1 0.369 PSOC-1443 (ACERC) Lower Wilcox 36 281 0.61 4.8 0.1110 PSOC-1488 (ACERC) Dietz 40 347 0.55 5.0 0.0711 PSOC-1468 (ACERC) Buck Mountain 14 616 0.90 4.6 0.3612 PSOC-1445D (Sandia) Blue #1 40 348 0.54 5.0 0.0713 PSOC-1451D (Sandia) Pittsburg #8 30 353 0.51 4.8 0.0014 PSOC-1493D (Sandia) Illinois #6 42 383 0.51 5.2 0.0115 PSOC-1507D (Sandia) Beulah-Zap 50 348 0.66 4.4 0.1516 PSOC-1508D (Sandia) Pocahontas #3 18 242 0.76 4.4 0.3617 Goudey A (AFR) not named 21 276 0.66 5.1 0.2718 Goudey B (AFR) not named 17 299 0.67 4.8 0.3419 DECS-1 (BYU) Bottom 50 436 0.48 4.5 0.1220 DECS-7 (BYU) Adaville #1 44 365 0.56 4.8 0.1121 DECS-11 (BYU) Beulah-Zap 46 320 0.63 4.5 0.1522 DECS-13 (BYU) Sewell 26 288 0.61 4.8 0.0023 DECS-18 (BYU) Kentucky #9 36 416 0.44 5.3 0.0024 DECS-20 (BYU) Elkhorn #3 33 387 0.48 4.9 0.0025 DECS-21 (BYU) Lykens Valley #2 9 321 0.94 4.0 0.3626 DECS-27 (BYU) Deadman 39 357 0.55 5.0 0.0527 PSOC-1515 (BYU) Penna. Semian. C 16 251 0.82 4.6 0.3328 PSOC-1516 (BYU) Lower Kittanning 21 301 0.66 4.9 0.0829 PSOC-1520 (BYU) Smith-Roland 52 386 0.56 4.2 0.1530 PSOC-1521 (BYU) Lower Hartshorne 16 237 0.71 4.1 0.36

100
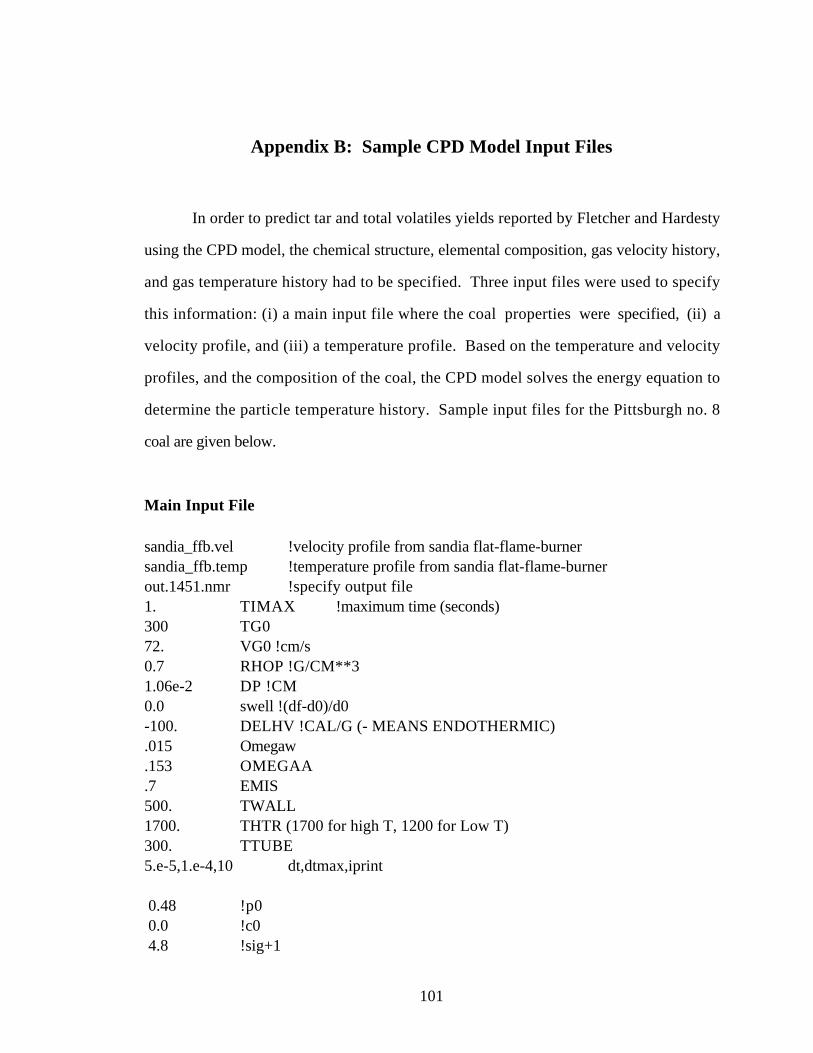
101
Appendix B: Sample CPD Model Input Files
In order to predict tar and total volatiles yields reported by Fletcher and Hardesty
using the CPD model, the chemical structure, elemental composition, gas velocity history,
and gas temperature history had to be specified. Three input files were used to specify
this information: (i) a main input file where the coal properties were specified, (ii) a
velocity profile, and (iii) a temperature profile. Based on the temperature and velocity
profiles, and the composition of the coal, the CPD model solves the energy equation to
determine the particle temperature history. Sample input files for the Pittsburgh no. 8
coal are given below.
Main Input File
sandia_ffb.vel !velocity profile from sandia flat-flame-burnersandia_ffb.temp !temperature profile from sandia flat-flame-burnerout.1451.nmr !specify output file1. TIMAX !maximum time (seconds)300 TG072. VG0 !cm/s0.7 RHOP !G/CM**31.06e-2 DP !CM0.0 swell !(df-d0)/d0-100. DELHV !CAL/G (- MEANS ENDOTHERMIC).015 Omegaw.153 OMEGAA.7 EMIS500. TWALL1700. THTR (1700 for high T, 1200 for Low T)300. TTUBE5.e-5,1.e-4,10 dt,dtmax,iprint
0.48 !p0 0.0 !c0 4.8 !sig+1

102
329 !mw(solum) 33 !mdel(solum) 2.602e15 !ab 55400 !eb 1800 !ebsig 0.9 !ac=rho 0 !ec 3.e15 !ag 69000 !eg 8100 !egsig 3.e15 !Acr (pre-exponential factor for crosslinking rate) 65000 !Ecr (Activation energy for crosslinking rate) 1.0 !pressure (atm)
.8423 %Carbon (DAF)
.0554 %H
.0165 %N
.0756 %O
.0101 %S
Velocity Profile
c velocity profile of sandia flat-flame burnerc z(mm) vp (cm/s)
0 382.5 715 1047.5 13713 17625 18938 19964 216
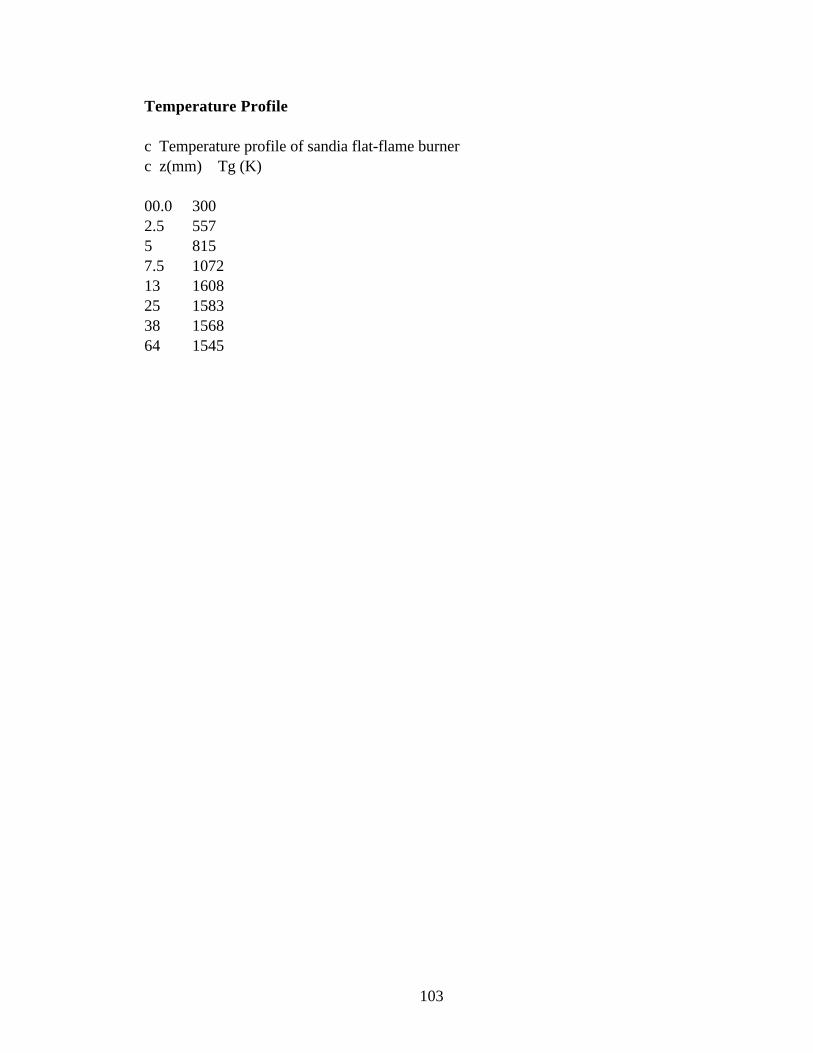
103
Temperature Profile
c Temperature profile of sandia flat-flame burnerc z(mm) Tg (K)
00.0 3002.5 5575 8157.5 107213 160825 158338 156864 1545

104

105
Appendix C: Sample CPD Model Input File
The NMR correlation was used to estimate the chemical structure of 17 coals
studied by Xu and Tomita. The CPD model was then used to predict tar and total
volatiles yields based on the estimated chemical structure. Because a velocity profile was
not reported by Xu and Tomita, a particle temperature history was estimated based on
the reported heating rate and peak temperature. A sample input file for a Yallourn coal is
given below. The same particle temperature profile was used for each coal.
Sample Input File
0.68 !p0 .15 !c0 4.1 !sig+1 340 !mw 50 !mdel
2.602e15 !ab 55400 !eb 1800 !ebsig 0.9 !ac=rho 0 !ec 3.e15 !ag 69000 !eg 8100 !egsig 3.e15 !Acr (pre-exponential factor for crosslinking rate) 65000 !Ecr (Activation energy for crosslinking rate)
1.0 !pressure (atm)
6 !number of time points 0,300 !time(ms),particle temp(K)100,600200,900

106
246,1037300,10374246,103

107
Appendix D: Tabulated Mass and Tar Release
Table D.1
Predicted and Measured Mass and Tar Yields Reported by Xu and Tomita
% mass release % tar yield
coal experimental CPD experimental CPD
Yallourn 51.0 51.2 19.9 15.8Rhein Braun 52.5 48.6 22.1 18.4Morwell 55.5 51.1 25.6 14.8Velva 48.5 53.0 17.9 15.0Soyakoishi 49.0 50.5 20.9 16.6South Beulah 47.0 54.2 16.8 17.0Colowyo 41.5 50.2 19.3 16.2Taiheiyo 53.0 47.7 29.6 24.6Millmerran 51.5 46.4 29.8 24.4Wandoan 52.0 51.0 27.9 25.5Hunter Valley 38.0 50.1 21.9 22.0Liddell 39.5 47.5 22.2 26.0Newvale 35.5 46.8 19.4 24.2Yubari Shinko 38.0 37.6 22 20.8Vicary Creek 24.5 23.5 11.7 8.0Keystone 17.0 12.8 8.1 3.7Hongay 6.0 4.4 2.6 2.1

108

109
Appendix E: Nitrogen Release Comparisons
Comparisons of CPD model predictions of Nsite, Nchar, fractional nitrogen release,
and mass release that were not included in chapter 5 are given in this appendix. For
reference, Table 5.3 is also repeated below.
Table 5.3.
Description of Sets of Test Cases Used in Model Evaluation
Set Researcher(s) Coals (rank)Reactor; residence time;
peak gas temp;approximate heating rate
1 Fletcher andHardesty48
Beulah Zap (lig), Blue #1(subB), Illinois #6 (hvbB),Pittsburgh #8 (hvaB),Pocahontas #3 (lvbB)
adrop tube; 250 ms; 1050K; 104 K/s.bdrop tube; 240 ms; 1250K; 104 K/s.cFFB (flat-flame burner); 47ms; 1600 K; 105 K/s.
2 Chen52 Dietz (subB), Illinois #6 (hvaB),Pittsburgh #8 (hvaB), LowerKittaning (lvB)
drop tube; 56, 61, 66,72,77, 83, 86.5, and 89 ms;radiantly heated particles(1840 K wall temperature);104 K/s.
3 Hambly16 Beulah Zap (lig), Blue #1(subB), Illinois #6 (hvbB),Pittsburgh #8 (hvaB),Pocahontas #3 (lvbB)
adrop tube; 170 ms; 820 K;104 K/s.bdrop tube; 280 ms; 1080K; 104 K/s.cdrop tube; 410 ms; 1220K; 104 K/s.dFFB; 18 ms; 1560 K, 105
K/s.
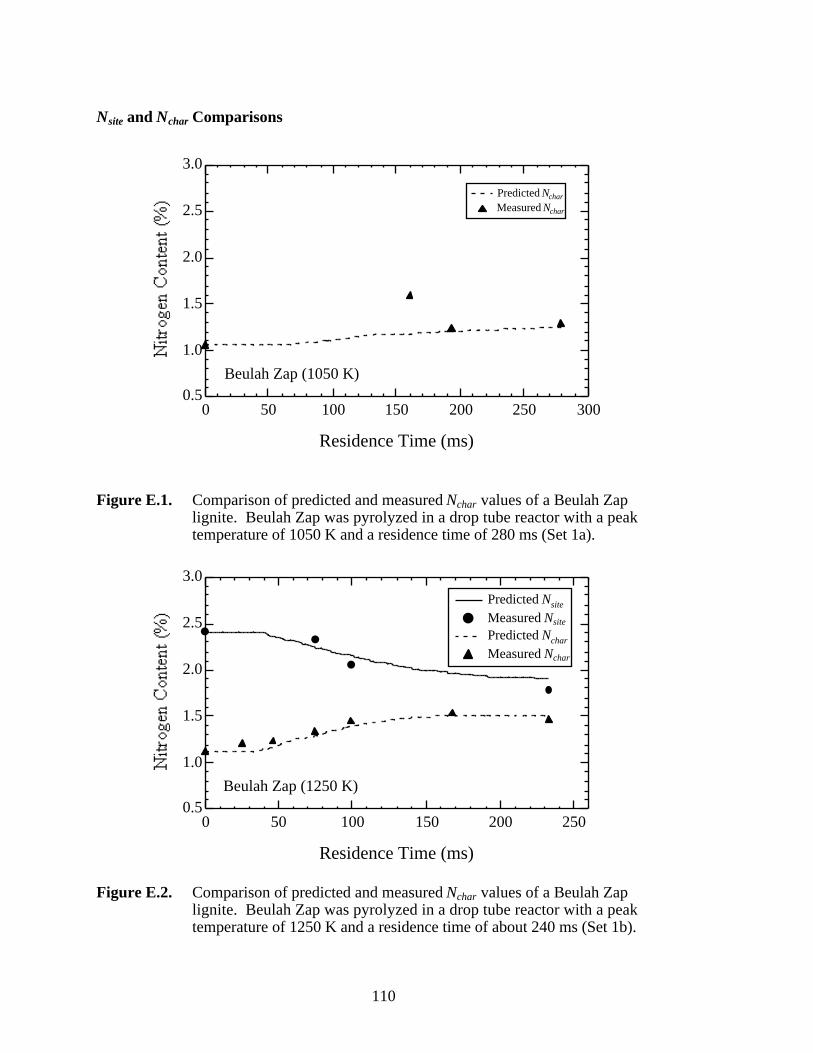
110
Nsite and Nchar Comparisons
3.0
2.5
2.0
1.5
1.0
0.5300250200150100500
Residence Time (ms)
Predicted Nchar
Measured Nchar
Beulah Zap (1050 K)
Figure E.1. Comparison of predicted and measured Nchar values of a Beulah Zaplignite. Beulah Zap was pyrolyzed in a drop tube reactor with a peaktemperature of 1050 K and a residence time of 280 ms (Set 1a).
3.0
2.5
2.0
1.5
1.0
0.5250200150100500
Residence Time (ms)
Predicted Nsite
Measured Nsite
Predicted Nchar
Measured Nchar
Beulah Zap (1250 K)
Figure E.2. Comparison of predicted and measured Nchar values of a Beulah Zaplignite. Beulah Zap was pyrolyzed in a drop tube reactor with a peaktemperature of 1250 K and a residence time of about 240 ms (Set 1b).

111
3.0
2.5
2.0
1.5
1.0
0.5300250200150100500
Residence Time (ms)
Illinois #6 (1050 K)
Predicted Nsite
Measured Nsite
Figure E.3. Comparison of predicted and measured Nchar values of a Illinois no. 6 highvolatile bituminous coal. Illinois no. 6 was pyrolyzed in a drop tubereactor with a peak temperature of 1050 K and a residence time of about260 ms (Set 1a).
3.0
2.5
2.0
1.5
1.0
0.5250200150100500
Residence Time (ms)
Illinois #6 (1250 K)
Predicted Nsite
Measured Nsite
Predicted Nchar
Measured Nchar
Figure E.4. Comparison of predicted and measured Nchar values of a Illinois no. 6 highvolatile bituminous coal. Illinois no. 6 was pyrolyzed in a drop tubereactor with a peak temperature of 1250 K and a residence time of about240 ms (Set 1b).
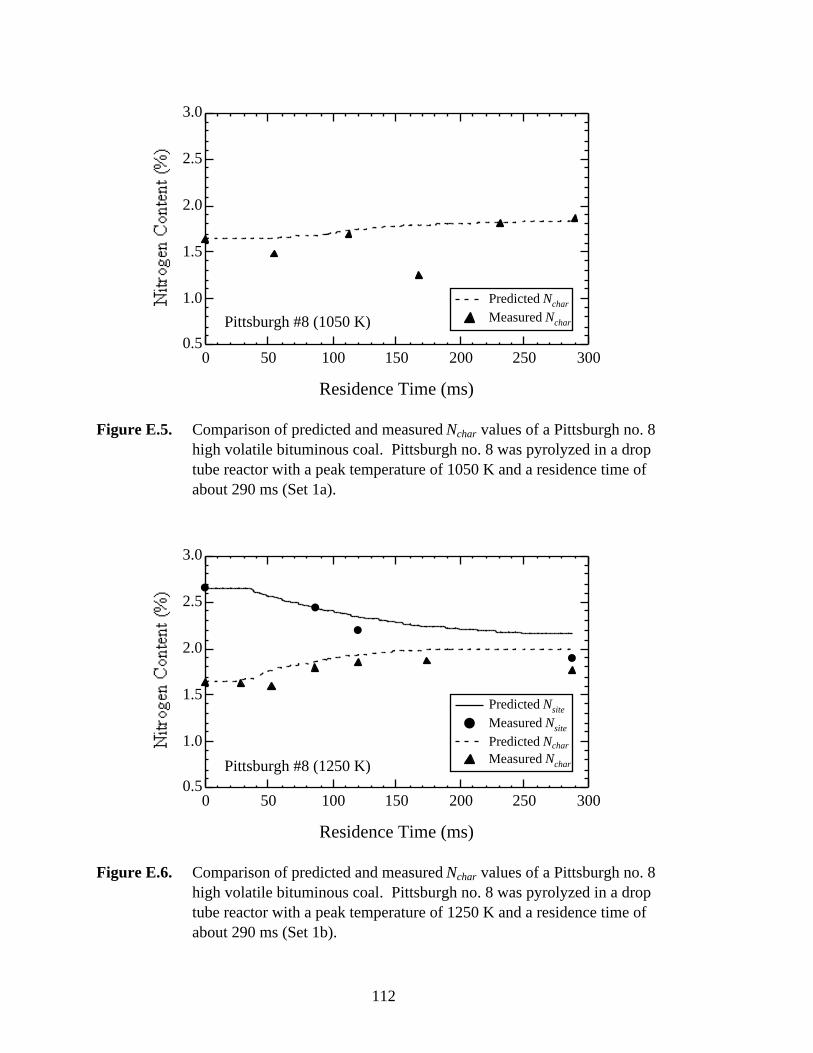
112
3.0
2.5
2.0
1.5
1.0
0.5300250200150100500
Residence Time (ms)
Pittsburgh #8 (1050 K)
Predicted Nchar
Measured Nchar
Figure E.5. Comparison of predicted and measured Nchar values of a Pittsburgh no. 8high volatile bituminous coal. Pittsburgh no. 8 was pyrolyzed in a droptube reactor with a peak temperature of 1050 K and a residence time ofabout 290 ms (Set 1a).
3.0
2.5
2.0
1.5
1.0
0.5300250200150100500
Residence Time (ms)
Pittsburgh #8 (1250 K)
Predicted Nsite
Measured Nsite
Predicted Nchar
Measured Nchar
Figure E.6. Comparison of predicted and measured Nchar values of a Pittsburgh no. 8high volatile bituminous coal. Pittsburgh no. 8 was pyrolyzed in a droptube reactor with a peak temperature of 1250 K and a residence time ofabout 290 ms (Set 1b).

113
3.0
2.5
2.0
1.5
1.0
0.5300250200150100500
Residence Time (ms)
Pochahontas #3 (1050 K)
Predicted Nsite
Measured Nsite
Predicted Nchar
Measured Nchar
Figure E.7. Comparison of predicted and measured Nchar values of a Pocahontas no. 3low volatile bituminous coal. Pocahontas no. 3 was pyrolyzed in a droptube reactor with a peak temperature of 1050 K and a residence time ofabout 270 ms (Set 1a).
3.0
2.5
2.0
1.5
1.0
0.5250200150100500
Residence Time (ms)
Pocahontas #3 (1250 K)
Predicted Nsite
Measured Nsite
Predicted Nchar
Measured Nchar
Figure E.8. Comparison of predicted and measured Nchar values of a Pocahontas no. 3low volatile bituminous coal. Pocahontas no. 3 was pyrolyzed in a droptube reactor with a peak temperature of 1250 K and a residence time ofabout 240 ms (Set 1b).

114
Mass and Nitrogen Release Comparisons
0.60
0.50
0.40
0.30
0.20
0.10
0.00
Frac
tion
Rel
ease
d
300250200150100500
Residence Time (ms)
Beulah Zap (1050 K)
Predicted mass release Measured mass release Predicted nitrogen release Measured nitrogen release
Figure E.9. Comparison of predicted and measured mass and nitrogen release of aBeulah Zap coal. Beulah Zap was pyrolyzed in a drop tube reactor with apeak temperature of 1050 K and a residence time of 280 ms (Set 1a).
0.60
0.50
0.40
0.30
0.20
0.10
0.00250200150100500
Residence Time (ms)
Beulah Zap (1250 K)
Predicted Mass Release Measured Mass Release Predicted Nitrogen Release Measured Nitrogen Release
Figure E.10. Comparison of predicted and measured mass and nitrogen release of aBeulah Zap coal. Beulah Zap was pyrolyzed in a drop tube reactor with apeak temperature of 1250 K and a residence time of 240 ms (Set 1b).

115
0.60
0.50
0.40
0.30
0.20
0.10
0.00300250200150100500
Residence Time (ms)
Illinois #6 (1050 K)
Predicted Mass Release Measured Mass Release Predicted Nitrogen Release Measured Nitrogen Release
Figure E.11. Comparison of predicted and measured mass and nitrogen release of aIllinois no. 6 coal. Illinois no. 6 was pyrolyzed in a drop tube reactor witha peak temperature of 1050 K and a residence time of 260 ms (Set 1a).
0.60
0.50
0.40
0.30
0.20
0.10
0.00250200150100500
Residence Time (ms)
Illinois #6 (1250)
Predicted Mass Release Measured Mass Release Predicted Nitrogen Release Measured Nitrogen Release
Figure E.12. Comparison of predicted and measured mass and nitrogen release of aIllinois no. 6 coal. Illinois no. 6 was pyrolyzed in a drop tube reactor witha peak temperature of 1250 K and a residence time of 240 ms (Set 1b).

116
0.60
0.50
0.40
0.30
0.20
0.10
0.00300250200150100500
Residence Time (ms)
Pittsburgh #8 (1050 K)
Predicted Mass Release Measured Mass Release Predicted Nitrogen Release Measured Nitrogen Release
Figure E.13. Comparison of predicted and measured mass and nitrogen release of aPittsburgh no. 8 coal. The coal was pyrolyzed in a drop tube reactor witha peak temperature of 1050 K and a residence time of 290 ms (Set 1a).
0.60
0.50
0.40
0.30
0.20
0.10
0.00300250200150100500
Residence Time (ms)
Pittsburgh #8 (1250 K)
Predicted Mass Release Measured Mass Release Predicted Nitrogen Release Measured Mass Release
Figure E.14. Comparison of predicted and measured mass and nitrogen release of aPittsburgh no. 8 coal. The coal was pyrolyzed in a drop tube reactor witha peak temperature of 1250 K and a residence time of 290 ms (Set 1b).
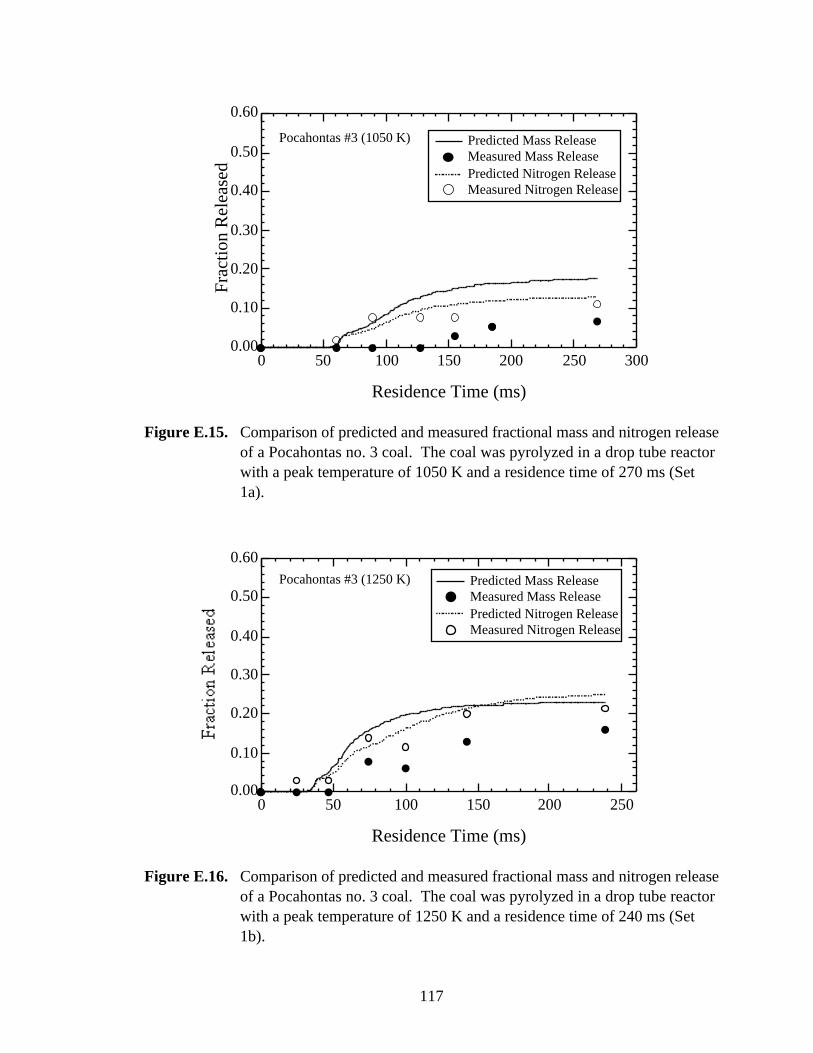
117
0.60
0.50
0.40
0.30
0.20
0.10
0.00
Frac
tion
Rel
ease
d
300250200150100500
Residence Time (ms)
Pocahontas #3 (1050 K) Predicted Mass Release Measured Mass Release Predicted Nitrogen Release Measured Nitrogen Release
Figure E.15. Comparison of predicted and measured fractional mass and nitrogen releaseof a Pocahontas no. 3 coal. The coal was pyrolyzed in a drop tube reactorwith a peak temperature of 1050 K and a residence time of 270 ms (Set1a).
0.60
0.50
0.40
0.30
0.20
0.10
0.00250200150100500
Residence Time (ms)
Pocahontas #3 (1250 K) Predicted Mass Release Measured Mass Release Predicted Nitrogen Release Measured Nitrogen Release
Figure E.16. Comparison of predicted and measured fractional mass and nitrogen releaseof a Pocahontas no. 3 coal. The coal was pyrolyzed in a drop tube reactorwith a peak temperature of 1250 K and a residence time of 240 ms (Set1b).

118
Due to wall effects in the drop tube reactor used to conduct the pyrolysis
experiments of sets 5, 6, and 7, the reported centerline gas temperature profiles reported
by Eric Hambly and used in the CPD model likely under-estimate the severity of the 820
K and 1080 K pyrolysis conditions. This may explain some of the large discrepancies
between predicted and measured mass release as shown in Figures D.17 and D.18.
0.30
0.25
0.20
0.15
0.10
0.05
0.009590858075706560
% Carbon (daf)
Beulah ZapBlue #1 Illinois #6
Pittsburgh #8Pocahontas #3
820 K Measured Mass Release Predicted Mass Release Measured Nitrogen Release Predicted Nitrogen Release
Figure E.17 Comparison of predicted and measured mass and nitrogen release of fivecoals pyrolyzed by Hambly at the 820 K drop tube condtion (Set 3a).
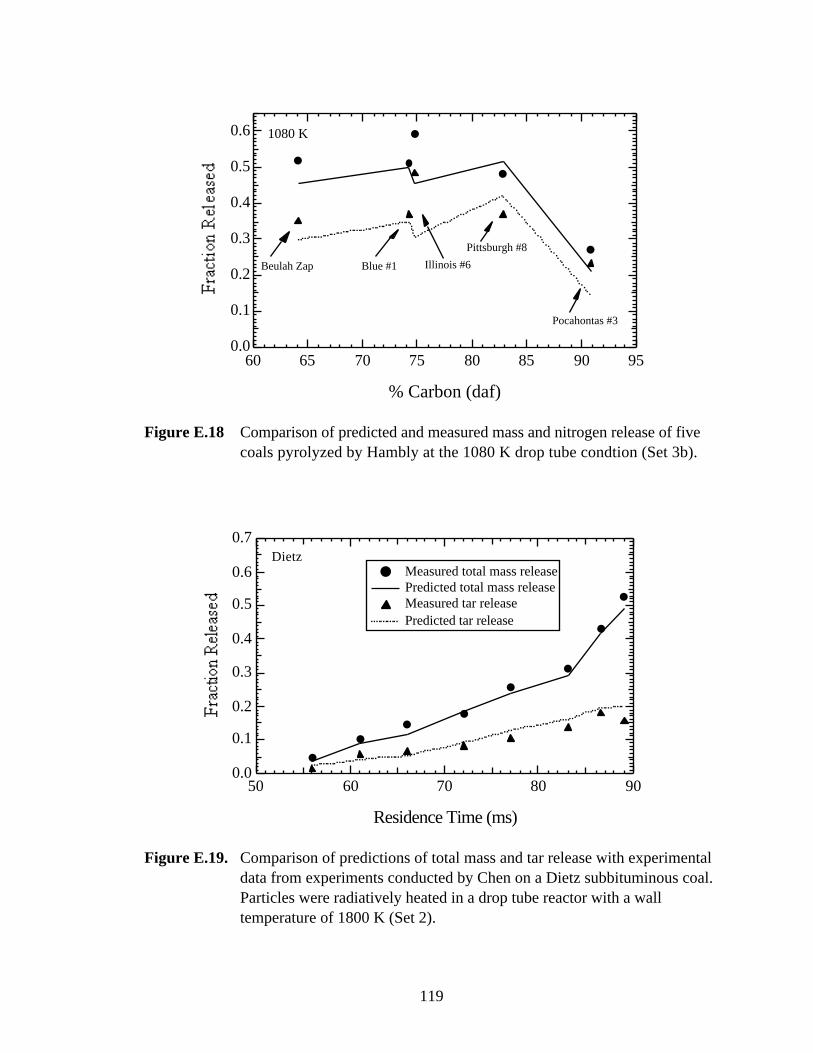
119
0.6
0.5
0.4
0.3
0.2
0.1
0.09590858075706560
% Carbon (daf)
Beulah Zap Blue #1 Illinois #6
Pittsburgh #8
Pocahontas #3
1080 K
Figure E.18 Comparison of predicted and measured mass and nitrogen release of fivecoals pyrolyzed by Hambly at the 1080 K drop tube condtion (Set 3b).
0.7
0.6
0.5
0.4
0.3
0.2
0.1
0.09080706050
Residence Time (ms)
Measured total mass release Predicted total mass release Measured tar release Predicted tar release
Dietz
Figure E.19. Comparison of predictions of total mass and tar release with experimentaldata from experiments conducted by Chen on a Dietz subbituminous coal.Particles were radiatively heated in a drop tube reactor with a walltemperature of 1800 K (Set 2).

120
0.7
0.6
0.5
0.4
0.3
0.2
0.1
0.09080706050
Residence Time (ms)
Illinois #6 Measured mass release Predicted mass release Measured tar release Predicted tar yield
Figure E.20. Comparison of predictions of total mass and tar release with experimentaldata from experiments conducted by Chen on a Illinois no. 6 bituminouscoal. Particles were radiatively heated in a drop tube reactor with a walltemperature of 1800 K (Set 2).
0.7
0.6
0.5
0.4
0.3
0.2
0.1
0.09080706050
Residence Time (ms)
Pittsburgh #8 Total mass release Predicted mass release Measured tar release Predicted tar release
Figure E.21. Comparison of predictions of total mass and tar release with experimentaldata from experiments conducted by Chen on a Pittsburgh no. 8bituminous coal. Particles were radiatively heated in a drop tube reactorwith a wall temperature of 1800 K (Set 2).
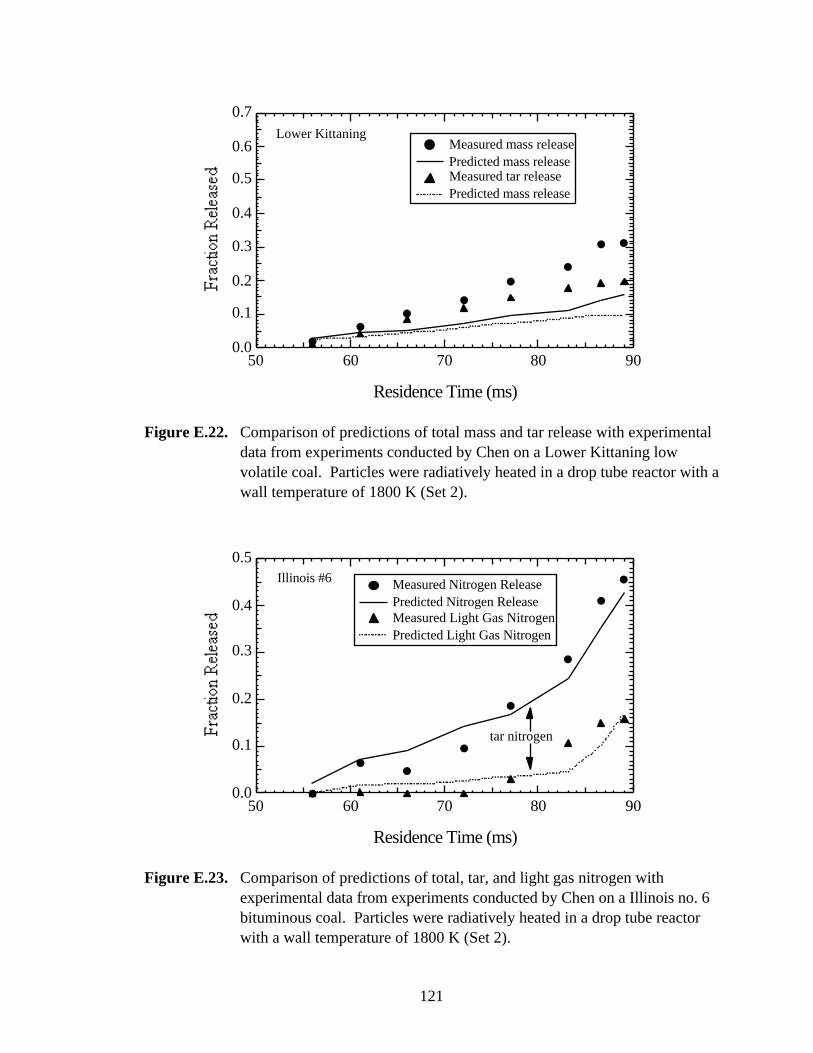
121
0.7
0.6
0.5
0.4
0.3
0.2
0.1
0.09080706050
Residence Time (ms)
Lower Kittaning Measured mass release Predicted mass release Measured tar release Predicted mass release
Figure E.22. Comparison of predictions of total mass and tar release with experimentaldata from experiments conducted by Chen on a Lower Kittaning lowvolatile coal. Particles were radiatively heated in a drop tube reactor with awall temperature of 1800 K (Set 2).
0.5
0.4
0.3
0.2
0.1
0.09080706050
Residence Time (ms)
tar nitrogen
Illinois #6 Measured Nitrogen Release Predicted Nitrogen Release Measured Light Gas Nitrogen Predicted Light Gas Nitrogen
Figure E.23. Comparison of predictions of total, tar, and light gas nitrogen withexperimental data from experiments conducted by Chen on a Illinois no. 6bituminous coal. Particles were radiatively heated in a drop tube reactorwith a wall temperature of 1800 K (Set 2).

122
0.5
0.4
0.3
0.2
0.1
0.09080706050
Residence Time (ms)
Lower Kittaning Measured Nitrogen Release Predicted Nitrogen Release Measured Light Gas Nitrogen Predicted Light Gas Nitrogen
Figure E.24. Comparison of predictions of total, tar, and light gas nitrogen withexperimental data from experiments conducted by Chen on a LowerKittaning low volatile coal. Particles were radiatively heated in a drop tubereactor with a wall temperature of 1800 K (Set 2).
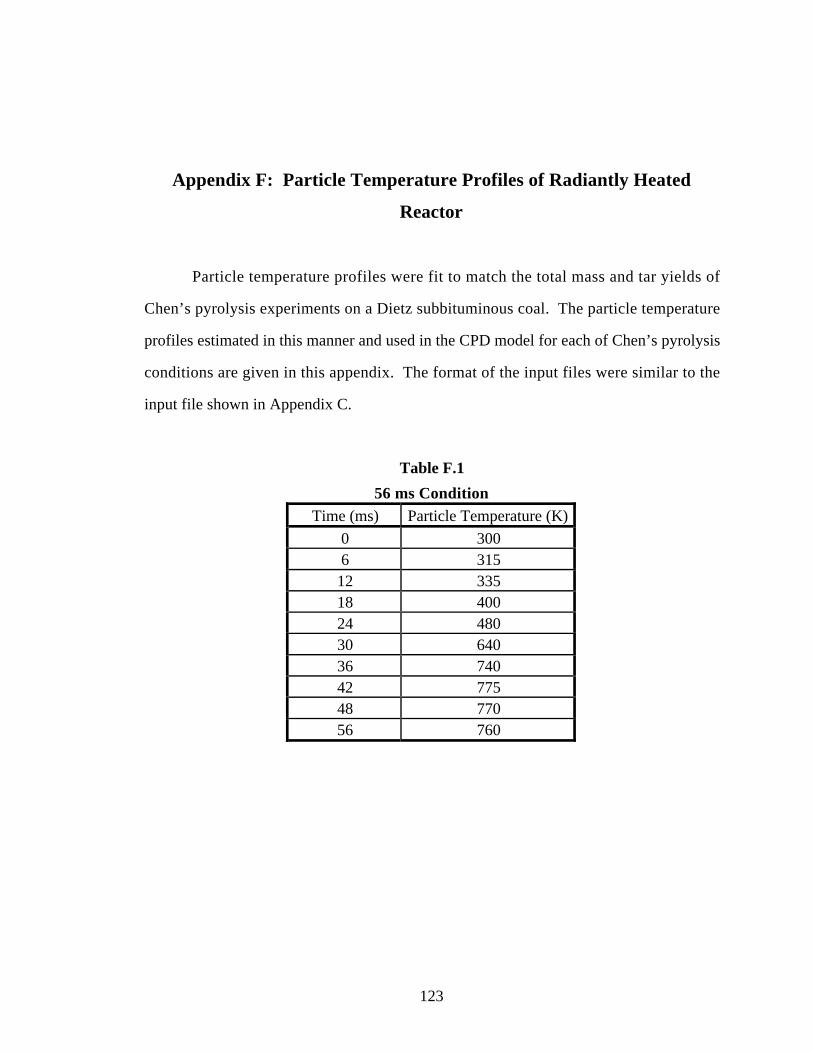
123
Appendix F: Particle Temperature Profiles of Radiantly Heated
Reactor
Particle temperature profiles were fit to match the total mass and tar yields of
Chen’s pyrolysis experiments on a Dietz subbituminous coal. The particle temperature
profiles estimated in this manner and used in the CPD model for each of Chen’s pyrolysis
conditions are given in this appendix. The format of the input files were similar to the
input file shown in Appendix C.
Table F.1
56 ms Condition
Time (ms) Particle Temperature (K)0 3006 31512 33518 40024 48030 64036 74042 77548 77056 760
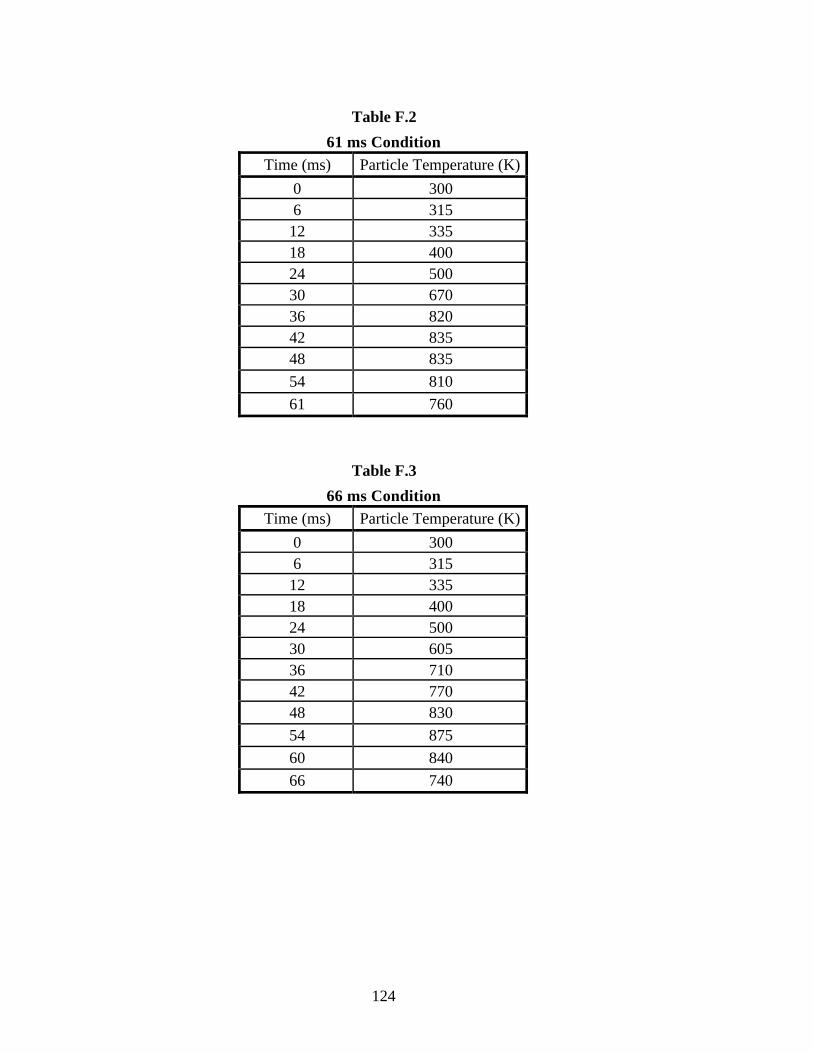
124
Table F.2
61 ms Condition
Time (ms) Particle Temperature (K)
0 3006 31512 33518 40024 50030 67036 82042 83548 83554 81061 760
Table F.3
66 ms Condition
Time (ms) Particle Temperature (K)
0 3006 31512 33518 40024 50030 60536 71042 77048 83054 87560 84066 740

125
Table F.4
72 ms Condition
Time (ms) Particle Temperature (K)
0 30010 33020 34530 42540 56050 77058 91070 87072 735
Table F.5
77 ms Condition
Time (ms) Particle Temperature (K)
0 30010 33520 35030 43040 55550 77060 95070 89077 770

126
Table F.6
83 ms Condition
Time (ms) Particle Temperature (K)
0 30010 33520 36030 45040 58050 80060 98070 96080 82083 790
Table F.7
87 ms Condition
Time (ms) Particle Temperature (K)
0 30010 33520 38030 41540 61050 80060 105070 114080 1040
86.5 940

127
Table F.8
89 ms Condition
Time (ms) Particle Temperature (K)
0 30010 34020 40030 46040 66050 70060 113070 127080 117089 1070

128

129
Appendix G: Coals Pyrolyzed in BYU FFB
A list of the coals pyrolyzed in the BYU flat-flame burner by Hambly and in this
study is given this appendix. The coals listed here correspond to coals 19 to 30 given in
Tables 4.1, 4.2, and 4.3. The chemical structure input parameters were taken directly
from the 13C NMR data listed in Table 4.3 except for the Lykens Valley #2 coal. The
correlation described in Chapter 4 was used to estimate the structural parameters for the
Lykens Valley #2 coal.
Table G.1
Elemental Composition of Coals Pyrolyzed in FFB
Seam ASTM Rank % C(daf)
% H(daf)
% O(daf)
% N(daf)
% S(daf)
Smith-Roland subC 67.4 5.37 24.39 1.00 1.84Beulah-Zap ligA 68.5 4.94 24.96 1.00 0.64Bottom subC 70.7 5.83 20.83 1.47 1.18Adaville #1 hvCb 72.5 5.22 20.09 1.17 1.04Deadman subA 76.5 5.24 15.95 1.53 0.76Kentucky #9 hvBb 79.4 5.62 8.57 1.74 4.71Elkhorn #3 hvAb 82.7 5.73 8.76 1.78 0.99Sewell mvb 85.5 4.91 7.12 1.72 0.72Lower Kittanning lvb 86.2 4.86 4.64 1.81 2.45Penna. Semian. C sa 88.4 4.02 5.47 1.24 0.86Lower Hartshorne lvb 91.2 4.56 1.53 1.82 0.89Lykens Valley #2 an 93.8 2.72 1.96 0.92 0.62

130

131
Appendix H: Velocity and Temperature Profiles of FFB
The velocity and temperature profiles of the flat-flame burner experiments
conducted by Hambly (18 ms) and in this Study (78 ms) are given in this appendix.
Table H.1
Gas Velocity Profile for 18 ms FFB Condition
Position (mm) Gas Velocity (cm/s)0 3.4
0.02 130.33 491.04 882.33 1284.66 1687.56 19710.01 21213.07 22318.8 23325.4 23333 233
Table H.2
Gas Temperature Profile for 18 ms FFB Condition
Position (mm) Gas Temperature (K)
0 3006.4 159112.7 162519.1 163625.4 164131.8 164133 1639

132
Table H.3
Gas Velocity Profile for 78 ms FFB Condition
Position (mm) Gas Velocity (cm/s)0 23
6.4 18312.7 21019.1 22425.4 25031.8 25038.1 25050.8 25063.5 25076.2 25088.9 250102 250127 250152 250178 250
Table H.4
Gas Temperature Profile for 78 ms FFB Condition
Position (mm) Gas Temperature (K)0 300
6.4 159112.7 162519.1 163625.4 164131.8 164138.1 163850.8 163363.5 162476.2 161988.9 1609102 1598127 1579152 1552178 1528
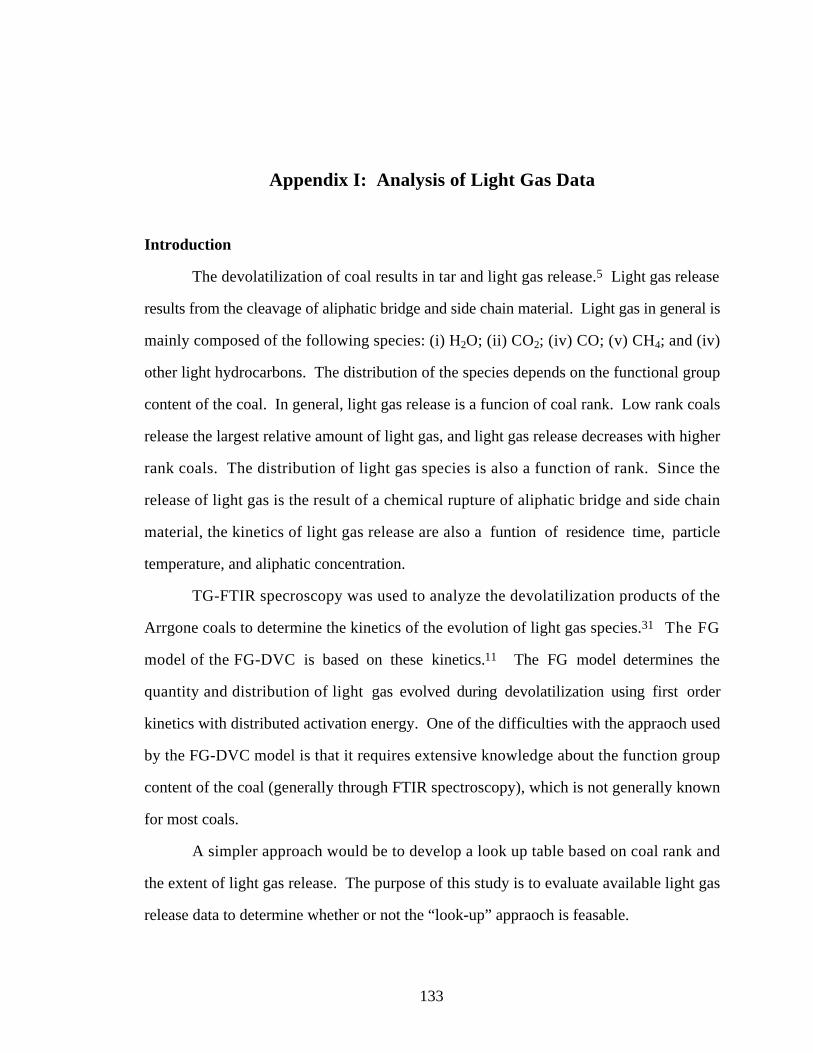
133
Appendix I: Analysis of Light Gas Data
Introduction
The devolatilization of coal results in tar and light gas release.5 Light gas release
results from the cleavage of aliphatic bridge and side chain material. Light gas in general is
mainly composed of the following species: (i) H2O; (ii) CO2; (iv) CO; (v) CH4; and (iv)
other light hydrocarbons. The distribution of the species depends on the functional group
content of the coal. In general, light gas release is a funcion of coal rank. Low rank coals
release the largest relative amount of light gas, and light gas release decreases with higher
rank coals. The distribution of light gas species is also a function of rank. Since the
release of light gas is the result of a chemical rupture of aliphatic bridge and side chain
material, the kinetics of light gas release are also a funtion of residence time, particle
temperature, and aliphatic concentration.
TG-FTIR specroscopy was used to analyze the devolatilization products of the
Arrgone coals to determine the kinetics of the evolution of light gas species.31 The FG
model of the FG-DVC is based on these kinetics.11 The FG model determines the
quantity and distribution of light gas evolved during devolatilization using first order
kinetics with distributed activation energy. One of the difficulties with the appraoch used
by the FG-DVC model is that it requires extensive knowledge about the function group
content of the coal (generally through FTIR spectroscopy), which is not generally known
for most coals.
A simpler approach would be to develop a look up table based on coal rank and
the extent of light gas release. The purpose of this study is to evaluate available light gas
release data to determine whether or not the “look-up” appraoch is feasable.

134
TG-FTIR Analysis of Pyrolysis Products
Solomon et. al. developed a TG-FTIR instrument that combines
thermogravametric analysis with evolved gaseous product analysis by Fourier transform
infrared spectroscopy.31 This instrument was used to anlayse the devolatilization
products of the eight Arrgone premium coals. The analysis gave the relative amounts of
the following species evolved during pyrolsis: tar, H2O, CO, CO2, CH4, SO2, NH3, C2H4,
and COS. The samples were heated up to 900 °C at a heating rate of 30 °C/min, and then
immediately cooled to 250 °C over a period of 20 minutes.
Eight coals were selected for the Argonne National Laboratory’s Premium Coal
Sample Program. The coals selected were well charactarized and represented a large
variation on coal rank. The elemental composition and the chemical structure parameters
derived from 13C NMR analyses of the Argonne Premium Coals are given in Tables 4.1,
4.2, and 4.3. The Argonne suite of coals vary from a lignite to a low volatile bituminous
coal.
Figure H.1 compares the light gas release of the Argonne suite of coals during
Solomon’s experiments as a function of residence time (temperature profiles were nearly
identical for each coal pyrolyzed). The light gas release data illustrate several important
trends. First and foremost, Figure H.1 shows that coals close in rank release light gas at
nearly the same rate. This is an important trend because it shows that modeling of total
light gas release can likely be accomplished based on rank with out knowing the functional
group composition of each coal. Also, the data show that the initial fraction of light gas
released is water which correlates directly with moisture content of the unpyrolyzed coal
(Table E.1). Furthermore, it appears that additional light gas release begins to occur
between 15 and 18 minutes regardless of coal rank.

135
0.50
0.40
0.30
0.20
0.10
0.00
light
gas
frac
tion
403020100
time (min)
Zap Wyodak Ill. #6 Blind Canyon Stockton Pitt. Upper Free. Poc.
Figure I.1. Comparison of the light gas release of Argonne suite of coals studied usingTG-FTIR analysis.
Table I.1
As-Recieved Moisture Content of Argonne Suite of Coals*
Coal Moisture (% as recieved)
Beulah Zap 32.24
Wyodak 28.09
Illinois #6 7.97
Blind Canyon 4.63
Lewis Stockton 2.42
Pittsburgh 1.65
Upper Freeport 1.13
Pocahontas #3 0.65
* data obtained from Smith5

136
Figures H.2 through H.6 compare the fractional release (fraction of light gas
released) on a dry basis of H20, CO2, CO, CH4, and C2H4, respectively. As with total gas
release, coals, two of which are lower rank coals (Illinois #6 and Lewis Stockton) and two
of which are high rank coals (Upper Freeport and Pocahontas #3) is has an H2O content
of about 70%, then the H2O content gradually decreases as further light gas is evolved
reaching a content of about 30% in the last stages of devolatilization. There is not a clear
correlation between the H2O content of the light gas and coal rank. As light gas release
increases, however, one trend is apparent. The H2O content of all the light gases
converges to a value between 35 and 45% by the end of devolatilization.
The CO2 content of the lowest rank coals (Beulah Zap and is initially very high,
and then gradually decreases to about 30% by the end of devolatilization (Figure H.3).
The rest of the coals have a wide variety of CO2 contents intitial, but by the time 30% of
light gas has been released, it is observed that the CO2 contents converge to similar values.
The variation in CO2 content of the initial light gas does not seem to follow any particular
trend with rank.

137
1.00
0.75
0.50
0.25
0.00
frac
tion
of g
as
1.00.80.60.40.20.0
fractional gas release
Zap Wyodak Ill. #6 Blind Canyon Stockton Pitt. Upper Free. Poc.
Figure I.2. Fractional release of H2O of Argonne suite of coals studied using TG-FTIR analysis.
1.00
0.75
0.50
0.25
0.00
frac
tion
of g
as
1.00.80.60.40.20.0
fractional gas release
Zap Stockton Wyodak Pitt. Ill. #6 Upper Free. Blind Canyon Poc.
Figure I.3. Fractional release of CO2 of Argonne suite of coals studied using TG-FTIRanalysis.
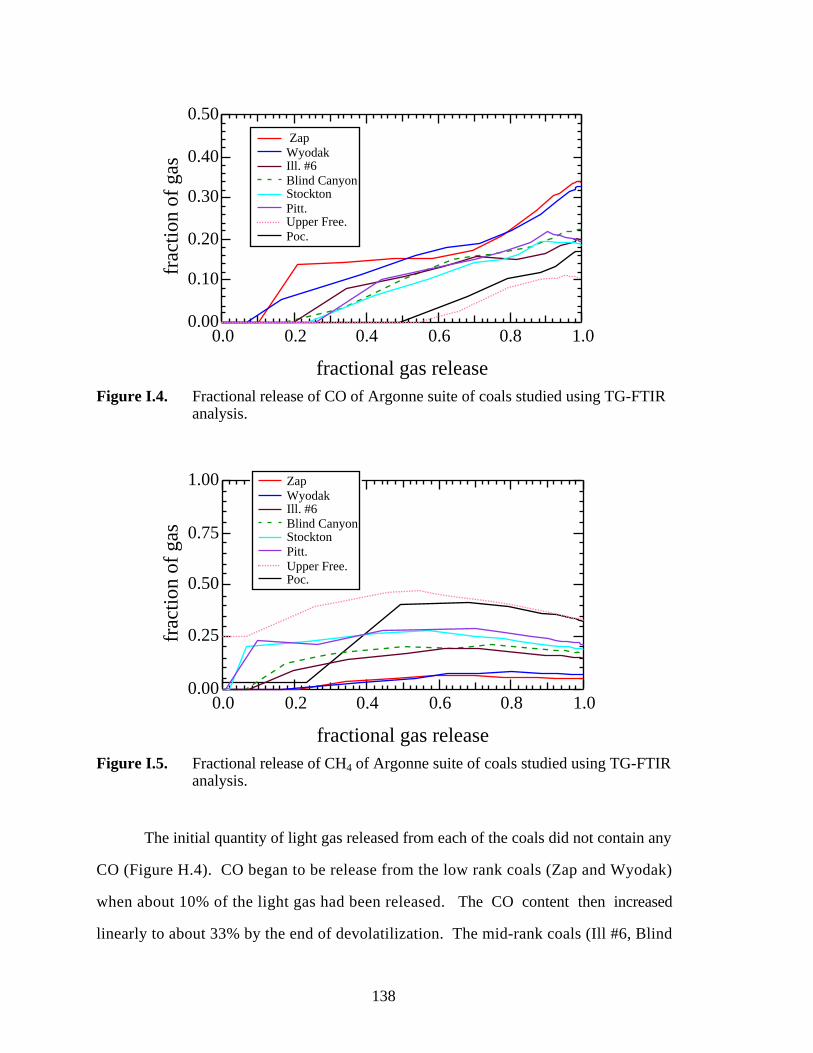
138
0.50
0.40
0.30
0.20
0.10
0.00
frac
tion
of g
as
1.00.80.60.40.20.0
fractional gas release
Zap Wyodak Ill. #6 Blind Canyon Stockton Pitt. Upper Free. Poc.
Figure I.4. Fractional release of CO of Argonne suite of coals studied using TG-FTIRanalysis.
1.00
0.75
0.50
0.25
0.00
frac
tion
of g
as
1.00.80.60.40.20.0
fractional gas release
Zap Wyodak Ill. #6 Blind Canyon Stockton Pitt. Upper Free. Poc.
Figure I.5. Fractional release of CH4 of Argonne suite of coals studied using TG-FTIRanalysis.
The initial quantity of light gas released from each of the coals did not contain any
CO (Figure H.4). CO began to be release from the low rank coals (Zap and Wyodak)
when about 10% of the light gas had been released. The CO content then increased
linearly to about 33% by the end of devolatilization. The mid-rank coals (Ill #6, Blind

139
Canyon, Stockton, and Pittsburgh) began to release CO after about 25% of the total light
gas had been released. The CO content of the light gas from the mid-rank coals also
increased linearly to 20% at the final stage of devolatilization. Upper Freeport and
Pocahontas #3 did not begin to release CO until more that 50% of the total light gas had
been released. The CO content of the light gas in each case increased linear with about the
same slope. However, the delay in CO release differed with coal rank, with high rank
coals having the greatest delay.
The CH4 content of light gas in general seems to follow a parabolic pattern (Figure
H.5). At the onset of light gas release the CH4 content is low, reaches a maximum when
about 50% of the light gas has been release, then declines as light gas release comes to
completion. The CH4 content of light gas also appears to follow a definate trend in
relation to coal rank. Low rank coals have the lowest relative CH4 content, and CH4
content increases with coals rank. The CH4 content ranged from 5% in the light gas of the
lowest rank coal to nearly 35% in the light gas of the highest rank coal at the end of light
gas release.
100x10-3
75
50
25
0
frac
tion
of g
as
1.00.80.60.40.20.0
fractional gas release
Zap Wyodak Ill. #6 Blind Canyon Stockton Pitt. Upper Free. Poc.
Figure I.6. Fractional release of C2H4 of Argonne suite of coals studied using TG-FTIR analysis.

140
C2H4 content of light gas has a rank dependence similar to that of CH4. That is,
low rank coals have a lower relative C2H4 content than do higher rank coals. For most of
the coals tested, C2H4 release is delay until 10 to 20% of the light gas has been released.
Then, the C2H4 content increases sharply after which it begins to gradually decline. The
C2H4 content ranged from 0.7% in the light gas of the lowest rank coal to 3.0% in the light
gas of the highest rank coal at the end of light gas release.
Conclusions based on TG-FTIR data. A light gas distribution model would be
feasable based on the data given by Solomon. For most light gas species, a rank and
degree of light gas release is readily evident. For the H2O and CO2 light gas content, two
of the main constituents of light gas, a trend with rank is not readily evident. However,
the light gas contents of these two species seem to follow similar patterns for similar
coals which makes the look up table idea feasible.
Light Gas Data From a Radiantly Heated Reactor
Chen conducted pyrolysis experiments on Four PETC coals using a radiant coal
flow reactor (Table H.2).52 In the radiant flow reactor, the coal particles were heated to
temperatures of 600 to 1300 K without significant heating of the carrier gas. This
eliminated secondary reactions from occuring. Different particle temepature profiles were
obtained by varying particle residence time. A weaknesss of the experiments conducted
by Chen is that particle temperatures were not measured directly, but rather estimated
using an energy balance. Therefore, it is expected that there is significant error in Chen’s
reported particle temperature histories.
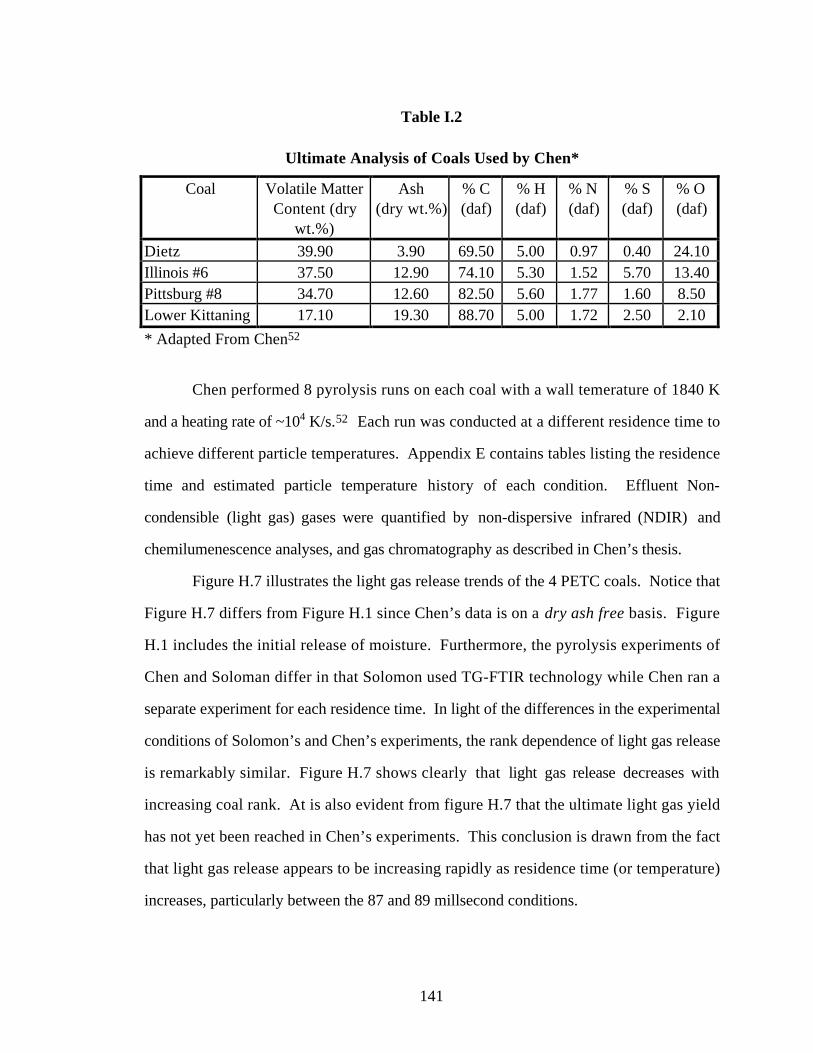
141
Table I.2
Ultimate Analysis of Coals Used by Chen*
Coal Volatile MatterContent (dry
wt.%)
Ash(dry wt.%)
% C(daf)
% H(daf)
% N(daf)
% S(daf)
% O(daf)
Dietz 39.90 3.90 69.50 5.00 0.97 0.40 24.10Illinois #6 37.50 12.90 74.10 5.30 1.52 5.70 13.40Pittsburg #8 34.70 12.60 82.50 5.60 1.77 1.60 8.50Lower Kittaning 17.10 19.30 88.70 5.00 1.72 2.50 2.10
* Adapted From Chen52
Chen performed 8 pyrolysis runs on each coal with a wall temerature of 1840 K
and a heating rate of ~104 K/s.52 Each run was conducted at a different residence time to
achieve different particle temperatures. Appendix E contains tables listing the residence
time and estimated particle temperature history of each condition. Effluent Non-
condensible (light gas) gases were quantified by non-dispersive infrared (NDIR) and
chemilumenescence analyses, and gas chromatography as described in Chen’s thesis.
Figure H.7 illustrates the light gas release trends of the 4 PETC coals. Notice that
Figure H.7 differs from Figure H.1 since Chen’s data is on a dry ash free basis. Figure
H.1 includes the initial release of moisture. Furthermore, the pyrolysis experiments of
Chen and Soloman differ in that Solomon used TG-FTIR technology while Chen ran a
separate experiment for each residence time. In light of the differences in the experimental
conditions of Solomon’s and Chen’s experiments, the rank dependence of light gas release
is remarkably similar. Figure H.7 shows clearly that light gas release decreases with
increasing coal rank. At is also evident from figure H.7 that the ultimate light gas yield
has not yet been reached in Chen’s experiments. This conclusion is drawn from the fact
that light gas release appears to be increasing rapidly as residence time (or temperature)
increases, particularly between the 87 and 89 millsecond conditions.
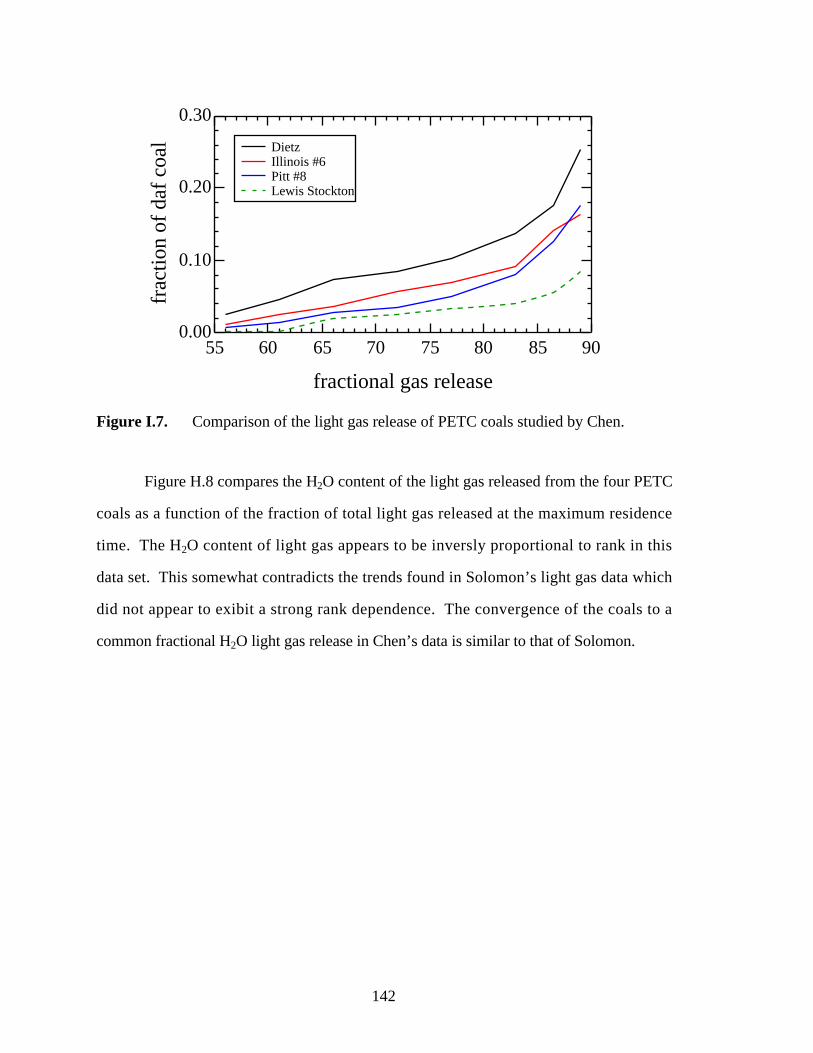
142
0.30
0.20
0.10
0.00
frac
tion
of d
af c
oal
9085807570656055
fractional gas release
Dietz Illinois #6 Pitt #8 Lewis Stockton
Figure I.7. Comparison of the light gas release of PETC coals studied by Chen.
Figure H.8 compares the H2O content of the light gas released from the four PETC
coals as a function of the fraction of total light gas released at the maximum residence
time. The H2O content of light gas appears to be inversly proportional to rank in this
data set. This somewhat contradicts the trends found in Solomon’s light gas data which
did not appear to exibit a strong rank dependence. The convergence of the coals to a
common fractional H2O light gas release in Chen’s data is similar to that of Solomon.
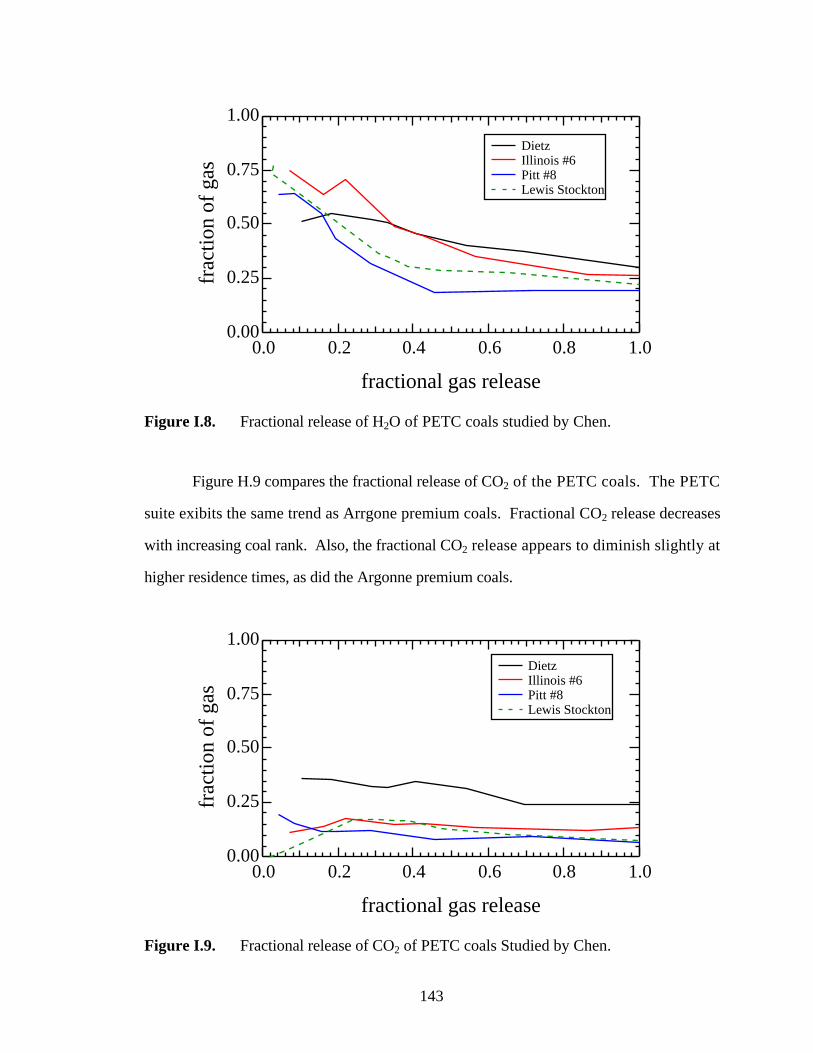
143
1.00
0.75
0.50
0.25
0.00
frac
tion
of g
as
1.00.80.60.40.20.0
fractional gas release
Dietz Illinois #6 Pitt #8 Lewis Stockton
Figure I.8. Fractional release of H2O of PETC coals studied by Chen.
Figure H.9 compares the fractional release of CO2 of the PETC coals. The PETC
suite exibits the same trend as Arrgone premium coals. Fractional CO2 release decreases
with increasing coal rank. Also, the fractional CO2 release appears to diminish slightly at
higher residence times, as did the Argonne premium coals.
1.00
0.75
0.50
0.25
0.00
frac
tion
of g
as
1.00.80.60.40.20.0
fractional gas release
Dietz Illinois #6 Pitt #8 Lewis Stockton
Figure I.9. Fractional release of CO2 of PETC coals Studied by Chen.

144
Figure H.10 is a comparison of the fractional light gas release of CO. Fractional
CO release generally appears to decrease with increasing coals rank as it did in the
experiments conducted by Solomon on the Argonne preumium coal suite. Fractional CO
release generally increases with increasing light gas yield, but reaches a maximum at when
reaching 65% of the light gas yield at the maximum residence time.
1.00
0.75
0.50
0.25
0.00
frac
tion
of g
as
1.00.80.60.40.20.0
fractional gas release
Dietz Illinois #6 Pitt #8 Lewis Stockton
Figure I.10. Fractional release of CO of PETC coals studied by Chen.
The trend illustrated in Figure H.11 for the fractional release of CH4 is remarkably
similar to that of fractial CH4 release of the Argonne premium coals (Figure H.5).
Fractional CH4 release increases with increasing coal rank.

145
1.00
0.75
0.50
0.25
0.00
frac
tion
of g
as
1.00.80.60.40.20.0
fractional gas release
Dietz Illinois #6 Pitt. #8 Lower Kittaning
Figure I.11. Fractional release of CH4 of PETC coals studied by Chen.
Figure H.12 compares the fractional release of C2H4 of the 4 PETC coals.
Although the fractional release of C2H4 of the PETC coals exibited the same rank
dependence as the Argonne coals (higher rank, higher C2H4), an order of magnitude larger
fractional release of C2H4 was observed in the pyrolysis experiments conducted on the
PETC coals.

146
0.25
0.20
0.15
0.10
0.05
0.00
frac
tion
of g
as
1.00.80.60.40.20.0
fractional gas release
Dietz Illinois #6 Pitt #8 Lewis Stockton
Figure I.12. Fractional release of C2H4 of PETC coals studied by Chen.
Small amounts of other light hydrocarbons gases are also released during
devolatilization. The fractional release of the other light hydrocarbons is compared in
Figure 13. It appears that a light gas released from higher rank coals contains a larger
fracton of “other light hydrocarbons” than lower rank coals.
1.00
0.75
0.50
0.25
0.00
frac
tion
of g
as
1.00.80.60.40.20.0
fractional gas release
Dietz Illinois #6 Pitt #8 Lewis Stockton
Figure I.13. Fractional release of other light hydrocarbons of PETC coals Studied byChen.
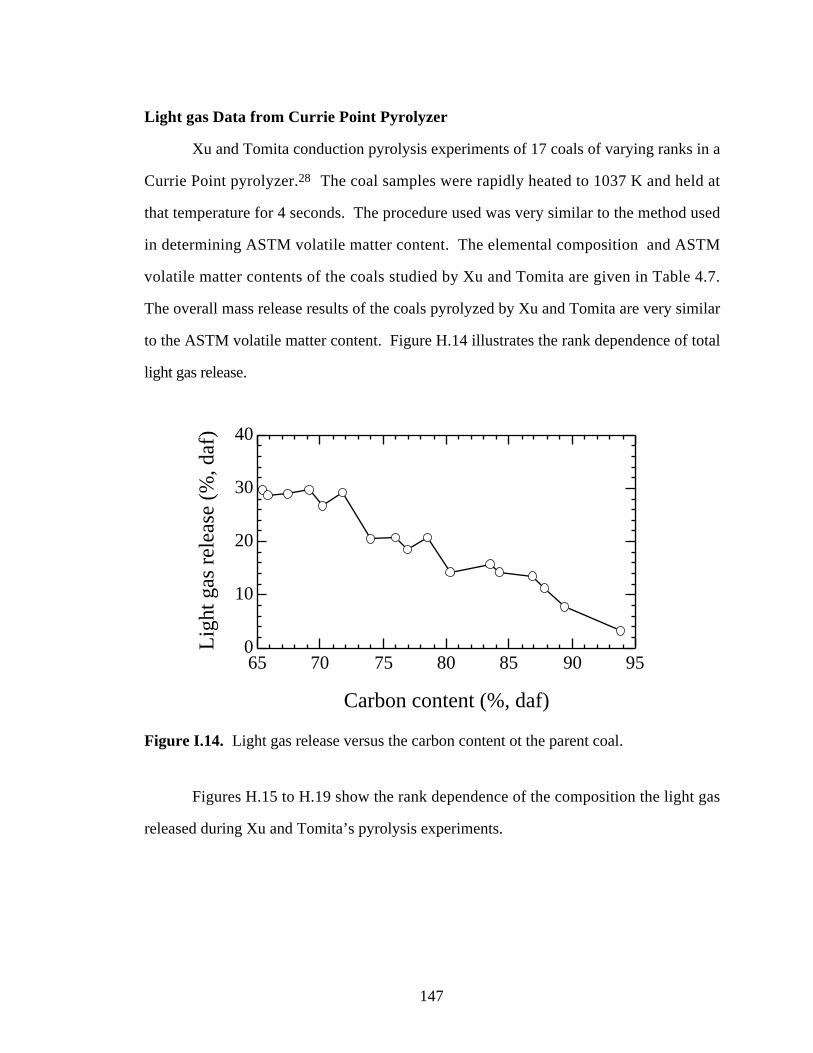
147
Light gas Data from Currie Point Pyrolyzer
Xu and Tomita conduction pyrolysis experiments of 17 coals of varying ranks in a
Currie Point pyrolyzer.28 The coal samples were rapidly heated to 1037 K and held at
that temperature for 4 seconds. The procedure used was very similar to the method used
in determining ASTM volatile matter content. The elemental composition and ASTM
volatile matter contents of the coals studied by Xu and Tomita are given in Table 4.7.
The overall mass release results of the coals pyrolyzed by Xu and Tomita are very similar
to the ASTM volatile matter content. Figure H.14 illustrates the rank dependence of total
light gas release.
40
30
20
10
0Lig
ht g
as re
leas
e (%
, daf
)
95908580757065
Carbon content (%, daf)
Figure I.14. Light gas release versus the carbon content ot the parent coal.
Figures H.15 to H.19 show the rank dependence of the composition the light gas
released during Xu and Tomita’s pyrolysis experiments.

148
0.50
0.40
0.30
0.20
0.10
0.00
frac
tion
of g
as
95908580757065
Carbon content (%, daf)
H2O CO2
CO
Figure I.15. Comparison of H2O, CO2, and CO fractional light gas release of coalsstudied by Xu and Tomita.
0.50
0.40
0.30
0.20
0.10
0.00
frac
tion
of g
as
95908580757065
Carbon content (%, daf)
H2
CH4
Figure I.16. Comparison of H2 and CH4 fractional light gas release of coals of variousrank.

149
0.15
0.10
0.05
0.00
frac
tion
of g
as
95908580757065
Carbon content (%, daf)
C2H4
C2H6
Figure I.17. Comparison of C2 hydrocarbon fractional light gas release of coals ofvarious rank.
0.15
0.10
0.05
0.00
frac
tion
of g
as
95908580757065
Carbon content (%, daf)
C3H6
C3H8
Figure I.18. Comparison of C3 hydrocarbon fractional light gas release of coals of
various rank
In general, the light gas composition of pyrolysis products of Xu and Tomita’s
experiments compare well with the final light gas composition of the experiments
conducted by Chen and Solomon. A few discrepencies exist between Xu’s results and

150
Somolon’s work. The same discrepencies exist between the work of Chen and Solomon
as well. Two possible explanation for the discrepencies are: (i) Solomon’s data have not
been corrected appropriatly to a dry, ash, free basis; (ii) the Argonne premium coals used
by Solomon have never been exposed to oxygen as the other coal suites have.
Conclusions
The following important conclusions were drawn from this analysis: (i) light gas is
primarily composed of water, carbon dioxide, carbon monoxide, and methane; (ii) other
minor constituents include hydrogen, nitrogen and sulfur containing gases, and low
molecular weight olifins and parrifins; (iii) the composition of light gas is a function of
rank (low rank coals contain more carbon oxides while high rank coal contain more
hydrocarbons); (iv) the evolution rates of individual species are relatively insensitive to
coal type; and (v) the composition of light gas seems to correlate well with the extent of
light gas release, and is relatively insensitive to heating rate. Based on these conclusions,
it appears that using a look-up table to estimate light gas composition would be
appropriate.
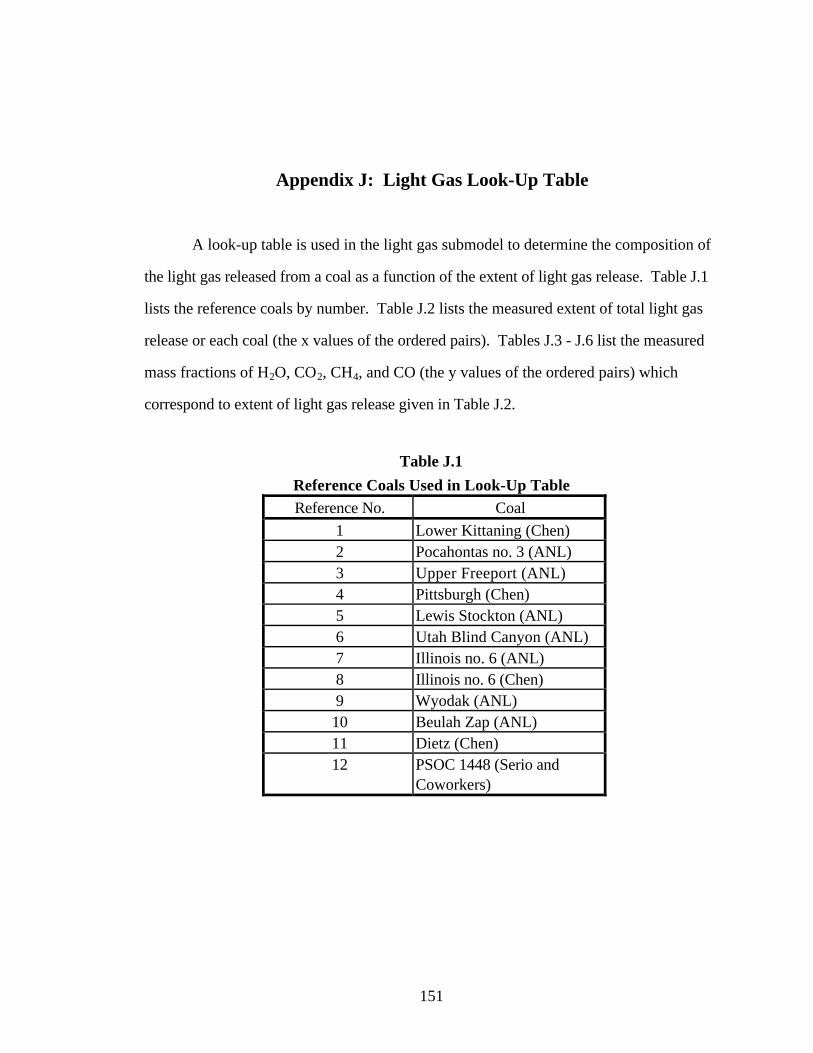
151
Appendix J: Light Gas Look-Up Table
A look-up table is used in the light gas submodel to determine the composition of
the light gas released from a coal as a function of the extent of light gas release. Table J.1
lists the reference coals by number. Table J.2 lists the measured extent of total light gas
release or each coal (the x values of the ordered pairs). Tables J.3 - J.6 list the measured
mass fractions of H2O, CO2, CH4, and CO (the y values of the ordered pairs) which
correspond to extent of light gas release given in Table J.2.
Table J.1
Reference Coals Used in Look-Up Table
Reference No. Coal1 Lower Kittaning (Chen)2 Pocahontas no. 3 (ANL)3 Upper Freeport (ANL)4 Pittsburgh (Chen)5 Lewis Stockton (ANL)6 Utah Blind Canyon (ANL)7 Illinois no. 6 (ANL)8 Illinois no. 6 (Chen)9 Wyodak (ANL)10 Beulah Zap (ANL)11 Dietz (Chen)12 PSOC 1448 (Serio and
Coworkers)

152
Table J.2
Extent of Total Light Gas Release
Ref. No. 1 2 3 4 5 6 7 8 9 10 11 121 0.000 0.040 0.110 0.140 0.210 0.270 0.340 0.675 0.900 1.000 0.000 0.0002 0.000 0.161 0.442 0.663 0.777 0.874 0.921 0.967 1.000 0.000 0.000 0.0003 0.000 0.022 0.200 0.430 0.526 0.640 0.787 0.875 0.927 0.955 1.000 0.0004 0.000 0.040 0.120 0.150 0.230 0.290 0.360 0.680 0.900 1.000 0.000 0.0005 0.000 0.018 0.058 0.210 0.417 0.572 0.696 0.778 0.821 0.883 0.932 1.0006 0.000 0.052 0.144 0.291 0.498 0.639 0.746 0.859 0.925 0.949 0.966 1.0007 0.000 0.063 0.178 0.330 0.506 0.612 0.706 0.813 0.895 0.940 1.000 0.0008 0.000 0.040 0.120 0.150 0.230 0.290 0.360 0.680 0.900 1.000 0.000 0.0009 0.000 0.061 0.146 0.374 0.535 0.622 0.714 0.800 0.883 0.931 0.964 1.00010 0.000 0.034 0.087 0.179 0.316 0.472 0.585 0.694 0.777 0.872 0.935 1.00011 0.000 0.040 0.120 0.160 0.250 0.310 0.370 0.680 0.900 1.000 0.000 0.00012 0.000 0.020 0.055 0.170 0.313 0.434 0.546 0.716 0.874 0.935 0.973 1.000
Table J.3
Mass Fraction H2O
Ref. No. 1 2 3 4 5 6 7 8 9 10 11 121 0.772 0.772 0.738 0.455 0.371 0.304 0.290 0.273 0.218 0.218 0.000 0.0002 0.699 0.632 0.299 0.269 0.247 0.249 0.236 0.225 0.226 0.000 0.000 0.0003 0.000 0.000 0.350 0.297 0.301 0.299 0.284 0.291 0.306 0.297 0.283 0.0004 0.636 0.636 0.646 0.550 0.436 0.320 0.186 0.199 0.195 0.195 0.000 0.0005 1.000 0.983 0.754 0.488 0.413 0.385 0.373 0.382 0.377 0.362 0.367 0.3486 0.665 0.636 0.604 0.508 0.435 0.409 0.383 0.362 0.351 0.343 0.342 0.3397 0.763 0.737 0.698 0.572 0.527 0.470 0.438 0.411 0.411 0.396 0.378 0.0008 0.748 0.748 0.637 0.704 0.490 0.446 0.348 0.268 0.266 0.266 0.000 0.0009 0.000 0.000 0.385 0.461 0.396 0.369 0.344 0.323 0.292 0.277 0.266 0.25710 0.000 0.000 0.197 0.267 0.260 0.333 0.361 0.369 0.346 0.306 0.285 0.26711 0.521 0.521 0.550 0.523 0.511 0.460 0.414 0.388 0.313 0.313 0.000 0.00012 0.000 0.000 0.291 0.335 0.264 0.271 0.261 0.211 0.171 0.160 0.153 0.149

153
Table J.4
Mass Fraction CO2
Ref. No. 1 2 3 4 5 6 7 8 9 10 11 121 0.000 0.000 0.000 0.174 0.174 0.167 0.129 0.102 0.071 0.071 0.000 0.0002 0.259 0.234 0.113 0.086 0.097 0.109 0.116 0.118 0.122 0.000 0.000 0.0003 0.333 0.327 0.070 0.052 0.057 0.060 0.059 0.062 0.066 0.080 0.115 0.0004 0.194 0.194 0.152 0.117 0.116 0.122 0.081 0.092 0.065 0.065 0.000 0.0005 0.000 0.000 0.000 0.122 0.103 0.086 0.083 0.082 0.085 0.086 0.093 0.1286 0.332 0.318 0.165 0.141 0.120 0.108 0.105 0.119 0.120 0.122 0.125 0.1307 0.229 0.221 0.125 0.090 0.070 0.073 0.083 0.133 0.132 0.130 0.147 0.0008 0.111 0.111 0.142 0.175 0.149 0.155 0.136 0.122 0.133 0.133 0.000 0.0009 0.980 0.984 0.550 0.345 0.317 0.285 0.286 0.277 0.273 0.264 0.254 0.25510 0.993 0.989 0.786 0.572 0.519 0.416 0.375 0.345 0.335 0.320 0.303 0.29911 0.363 0.363 0.353 0.325 0.321 0.350 0.318 0.251 0.249 0.249 0.000 0.00012 1.000 0.983 0.448 0.179 0.104 0.090 0.104 0.151 0.166 0.160 0.158 0.154
Table J.5
Mass Fraction CH4
Ref. No. 1 2 3 4 5 6 7 8 9 10 11 121 0.203 0.203 0.078 0.160 0.180 0.219 0.258 0.294 0.320 0.320 0.000 0.0002 0.041 0.037 0.388 0.389 0.359 0.332 0.323 0.307 0.299 0.000 0.000 0.0003 0.667 0.655 0.420 0.454 0.444 0.419 0.382 0.353 0.331 0.321 0.306 0.0004 0.055 0.055 0.073 0.088 0.116 0.124 0.170 0.150 0.189 0.189 0.000 0.0005 0.000 0.000 0.188 0.195 0.234 0.243 0.224 0.210 0.200 0.186 0.177 0.1676 0.000 0.000 0.110 0.155 0.176 0.172 0.185 0.173 0.163 0.159 0.156 0.1517 0.000 0.000 0.075 0.136 0.159 0.178 0.174 0.157 0.143 0.141 0.132 0.0008 0.020 0.020 0.026 0.042 0.045 0.049 0.064 0.100 0.128 0.128 0.000 0.0009 0.000 0.000 0.000 0.029 0.048 0.067 0.069 0.072 0.069 0.066 0.063 0.06110 0.000 0.000 0.000 0.000 0.035 0.050 0.061 0.058 0.057 0.053 0.049 0.04611 0.010 0.010 0.011 0.016 0.011 0.021 0.023 0.035 0.060 0.060 0.000 0.00012 0.000 0.000 0.216 0.262 0.362 0.327 0.307 0.250 0.203 0.189 0.182 0.177

154
Table J.6Mass Fraction CO
Ref. No. 1 2 3 4 5 6 7 8 9 10 11 121 0.000 0.000 0.157 0.121 0.141 0.112 0.139 0.085 0.145 0.145 0.000 0.0002 0.000 0.000 0.000 0.057 0.097 0.109 0.124 0.150 0.153 0.000 0.000 0.0003 0.000 0.000 0.000 0.000 0.000 0.024 0.078 0.097 0.099 0.104 0.099 0.0004 0.083 0.083 0.038 0.066 0.032 0.168 0.286 0.324 0.313 0.313 0.000 0.0005 0.000 0.000 0.000 0.000 0.055 0.091 0.124 0.131 0.142 0.171 0.168 0.1626 0.000 0.000 0.000 0.028 0.093 0.129 0.142 0.162 0.181 0.191 0.193 0.1957 0.000 0.000 0.000 0.075 0.099 0.122 0.139 0.133 0.148 0.167 0.177 0.0008 0.101 0.101 0.173 0.054 0.219 0.247 0.335 0.349 0.280 0.280 0.000 0.0009 0.000 0.000 0.055 0.115 0.151 0.168 0.172 0.200 0.236 0.264 0.287 0.29810 0.000 0.000 0.000 0.133 0.142 0.150 0.150 0.173 0.206 0.265 0.307 0.33111 0.096 0.096 0.066 0.113 0.123 0.130 0.200 0.281 0.334 0.334 0.000 0.00012 0.000 0.000 0.000 0.084 0.078 0.115 0.130 0.191 0.262 0.294 0.311 0.322

155
Related Documents