An adaptable mesocosm platform for performing integrated assessments of nanomaterial risk in complex environmental systems Me ´lanie Auffan 1,2,3 , Marie Tella 1,2 , Catherine Santaella 2,4 , Lenka Brousset 2,5 , Christine Paille `s 1,2 , Mohamed Barakat 2,4 , Benjamin Espinasse 2,3 , Ester Artells 2,5 , Julien Issartel 2,5 , Armand Masion 1,2 , Je ´ro ˆme Rose 1,2,3 , Mark R. Wiesner 2,3 , Wafa Achouak 2,4 , Alain Thie ´ry 2,5 & Jean-Yves Bottero 1,2,3 1 CNRS, Aix-Marseille Universite ´, CEREGE UM34, UMR 7330, 13545 Aix en Provence, France, 2 International Consortium for the Environmental Implications of Nanotechnology iCEINT, CNRS-Duke University, Aix en Provence, France, 3 Center for the Environmental Implications of NanoTechnology CEINT, Duke University, Durham, North Carolina 27707, USA, 4 CNRS, Aix-Marseille Universite ´, CEA Cadarache DSV/IBEB/SBVME, Lab Ecol Microb Rhizosphere & Environ Extrem (LEMiRE), UMR 7265, Saint Paul lez Durance, France, 5 CNRS, Aix-Marseille Universite ´, CNRS, Institut Me ´diterrane ´en de Biodiversite ´ et d’Ecologie marine et continentale (IMBE), UMR 7263, Marseille, France. Physical-chemists, (micro)biologists, and ecologists need to conduct meaningful experiments to study the environmental risk of engineered nanomaterials with access to relevant mechanistic data across several spatial and temporal scales. Indoor aquatic mesocosms (60L) that can be tailored to virtually mimic any ecosystem appear as a particularly well-suited device. Here, this concept is illustrated by a pilot study aimed at assessing the distribution of a CeO 2 -based nanomaterial within our system at low concentration (1.5 mg/ L). Physico-chemical as well as microbiological parameters took two weeks to equilibrate. These parameters were found to be reproducible across the 9-mesocosm setup over a 45-day period of time. Recovery mass balances of 115 6 18% and 60 6 30% of the Ce were obtained for the pulse dosing and the chronic dosing, respectively. This demonstrated the relevance of our experimental approach that allows for adequately monitoring the fate and impact of a given nanomaterial. E ngineered nanomaterials (ENMs) have become a fast growing economic sector. As a consequence of the many debates concerning their safety, efforts are developed at international and national levels to develop a code of ethics for a safe and responsible development of ENMs 1 . A sustained growth of the nanotechnology industry will rely heavily on the characterization of risks to the environment (water and soil resources, trophic transfers, biodiversity) and human health that may be posed by ENMs. To date, investigation of the roles of nano- scale objects in the context of evolutionary change, environmental disturbance, ecosystem structure and function are limited 2,3 . Moreover, current strategies to assess the environmental safety of ENMs are based on classical ecotoxicology approaches 4 , which are not always adequate for ENMs. Indeed, while the hazard is extensively investigated, little attention is paid to the exposure to ENMs despite its pivotal role in understanding their environmental risks. Extent and mode of exposure to ENMs is controlled by a number of parameters including aggregation state and sorption of (in)organic substances, redox as well as ecological factors such ecological feeding type and trophic transfer potential 5 . There is an abundant literature about the effects of all these parameters taken separately. However, for a robust characterization of the exposure, the complex interplay between these para- meters in real ecosystems needs to be considered. Mesocosms are experimental systems designed to simulate ecosystems 6 and are an invaluable tool for addres- sing the complex issue of exposure during nano-ecotoxicological testing. This experimental strategy has already been used to study the behavior or impacts of ENMs 7–10 . A broad diversity of mesocosms design exists in term of dimension, location (indoor, outdoor) and ecosystem simulation type (estuarine, aquatic freshwater, and ter- restrial) 11–14 . A common factor of all these studies is that mesocosms are considered as a small portion of the natural environment that is brought under controlled conditions. In our study we define a mesocosm as an experimental design which is (i) self-sustaining once set-up and acclimation without any additional input of OPEN SUBJECT AREAS: ENVIRONMENTAL MONITORING BIOGEOCHEMISTRY ENVIRONMENTAL CHEMISTRY Received 20 February 2014 Accepted 12 June 2014 Published 8 July 2014 Correspondence and requests for materials should be addressed to M.A. (auffan@cerege. fr) SCIENTIFIC REPORTS | 4 : 5608 | DOI: 10.1038/srep05608 1

Welcome message from author
This document is posted to help you gain knowledge. Please leave a comment to let me know what you think about it! Share it to your friends and learn new things together.
Transcript
An adaptable mesocosm platform forperforming integrated assessments ofnanomaterial risk in complexenvironmental systemsMelanie Auffan1,2,3, Marie Tella1,2, Catherine Santaella2,4, Lenka Brousset2,5, Christine Pailles1,2,Mohamed Barakat2,4, Benjamin Espinasse2,3, Ester Artells2,5, Julien Issartel2,5, Armand Masion1,2,Jerome Rose1,2,3, Mark R. Wiesner2,3, Wafa Achouak2,4, Alain Thiery2,5 & Jean-Yves Bottero1,2,3
1CNRS, Aix-Marseille Universite, CEREGE UM34, UMR 7330, 13545 Aix en Provence, France, 2International Consortium for theEnvironmental Implications of Nanotechnology iCEINT, CNRS-Duke University, Aix en Provence, France, 3Center for theEnvironmental Implications of NanoTechnology CEINT, Duke University, Durham, North Carolina 27707, USA, 4CNRS,Aix-Marseille Universite, CEA Cadarache DSV/IBEB/SBVME, Lab Ecol Microb Rhizosphere & Environ Extrem (LEMiRE), UMR 7265,Saint Paul lez Durance, France, 5CNRS, Aix-Marseille Universite, CNRS, Institut Mediterraneen de Biodiversite et d’Ecologie marineet continentale (IMBE), UMR 7263, Marseille, France.
Physical-chemists, (micro)biologists, and ecologists need to conduct meaningful experiments to study theenvironmental risk of engineered nanomaterials with access to relevant mechanistic data across severalspatial and temporal scales. Indoor aquatic mesocosms (60L) that can be tailored to virtually mimic anyecosystem appear as a particularly well-suited device. Here, this concept is illustrated by a pilot study aimedat assessing the distribution of a CeO2-based nanomaterial within our system at low concentration (1.5 mg/L). Physico-chemical as well as microbiological parameters took two weeks to equilibrate. These parameterswere found to be reproducible across the 9-mesocosm setup over a 45-day period of time. Recovery massbalances of 115 6 18% and 60 6 30% of the Ce were obtained for the pulse dosing and the chronic dosing,respectively. This demonstrated the relevance of our experimental approach that allows for adequatelymonitoring the fate and impact of a given nanomaterial.
Engineered nanomaterials (ENMs) have become a fast growing economic sector. As a consequence of themany debates concerning their safety, efforts are developed at international and national levels to develop acode of ethics for a safe and responsible development of ENMs1. A sustained growth of the nanotechnology
industry will rely heavily on the characterization of risks to the environment (water and soil resources, trophictransfers, biodiversity) and human health that may be posed by ENMs. To date, investigation of the roles of nano-scale objects in the context of evolutionary change, environmental disturbance, ecosystem structure and functionare limited2,3. Moreover, current strategies to assess the environmental safety of ENMs are based on classicalecotoxicology approaches4, which are not always adequate for ENMs. Indeed, while the hazard is extensivelyinvestigated, little attention is paid to the exposure to ENMs despite its pivotal role in understanding theirenvironmental risks. Extent and mode of exposure to ENMs is controlled by a number of parameters includingaggregation state and sorption of (in)organic substances, redox as well as ecological factors such ecological feedingtype and trophic transfer potential5. There is an abundant literature about the effects of all these parameters takenseparately. However, for a robust characterization of the exposure, the complex interplay between these para-meters in real ecosystems needs to be considered.
Mesocosms are experimental systems designed to simulate ecosystems6 and are an invaluable tool for addres-sing the complex issue of exposure during nano-ecotoxicological testing. This experimental strategy has alreadybeen used to study the behavior or impacts of ENMs7–10. A broad diversity of mesocosms design exists in term ofdimension, location (indoor, outdoor) and ecosystem simulation type (estuarine, aquatic freshwater, and ter-restrial)11–14. A common factor of all these studies is that mesocosms are considered as a small portion of thenatural environment that is brought under controlled conditions. In our study we define a mesocosm as anexperimental design which is (i) self-sustaining once set-up and acclimation without any additional input of
OPEN
SUBJECT AREAS:ENVIRONMENTAL
MONITORING
BIOGEOCHEMISTRY
ENVIRONMENTAL CHEMISTRY
Received20 February 2014
Accepted12 June 2014
Published8 July 2014
Correspondence andrequests for materials
should be addressed toM.A. (auffan@cerege.
fr)
SCIENTIFIC REPORTS | 4 : 5608 | DOI: 10.1038/srep05608 1
nutrients or resources, and (ii) that allows controlling all (or themaximum of) input and output parameters to draw a real-life massbalance whatever its dimension or location. Mesocosms has alreadybeen applied to trace the transfer of gold ENMs from the watercolumn in an estuarine food web7. The authors modeled the edgeof a tidal marsh creek using 366 L-indoor mesocosms maintained for12 days. Clams and biofilms were observed to accumulate most ofgold on a per mass basis. The long-term (18 month) distribution andtransformation of silver ENMs was also studied in outdoor meso-cosms mimicking freshwater emergent wetlands10. Silver sulfidationwas demonstrated in the terrestrial soils and subaquatic sedimentsand a high body burden of Ag was measured in mosquito fish andchironomids10. Another study used indoor estuarine mesocosms tomonitor the leaching of Ag from consumer products incorporatingENMs over 60 days. The investigations described in the literatureinvolve rather large facilities (tank size 120 L and above), to repro-duce the assimilative capabilities of a larger natural system. However,the need for multiple replicas in biological studies limits the practic-ality of large mesocosms due to obvious limitations in space and cost.The challenge is thus downsizing for larger setups while avoiding theartifacts of in vitro and high throughput studies (e.g.15–17), which donot simulate adequately the complexities and important ecologicalinteractions within an ecosystem. Moreover, there is a need foradaptable and versatile exposure system to allow different real wordexposure scenarios to be contrasted (e.g. ENMs runoff rain or ventloading, or a continuous point source discharge as wastewater treat-ment plant or industrial discharge).
In this study, we conceived a laboratory-scale mesocosm facility toserve as a platform for investigating ENM exposure and impacts. Weopted for modular, small size (60 L), indoor mesocosms. Our experi-mental system allows the simultaneous monitoring of a number ofparameters (e.g. aggregation, settling, mass balance, trophic transfer,biotransformation, oxidative stress, microbial diversity) under envir-onmentally meaningful conditions. This experimental design canaccommodate several types of ecosystems such as lotic, lentic, estu-arine, or lagoon environments, without requiring expensive and/orcumbersome infrastructures. This versatile tool can then be used by alarge community of physical-chemists, (micro)biologists, and ecol-ogists to study the exposure and impacts of ENMs (low doses,chronic contamination) as well as the mechanistic concepts at vari-ous temporal and spatial scales. Here we show that, with the adequatemethodology, using small sized mesocosms is an approach as robustas using large(r) systems.
Mesocosm DescriptionDesign. An experiment performed in this platform involves 2 phases:the acclimation and equilibration of the mesocosms, and theexposure phase of the experiment, per se. The initial setup consistsin introducing the sediment and filling the tank (750 3 200 3
600 mm) with water. The water and the sediment are chosen to beclose to the solution chemistry of the natural ecosystem of interest.Macro- and micro-organisms are collected from the same naturalenvironment.
During phase I, the particles suspended by the addition of waterare given time to settle, the pH, conductivity, O2, and redox potentialstabilize, and the primary producers develop. The duration of thisphase depends on the target values (and variations around them)defined for each key parameter (e.g. DpH, DT, turbidity, ammonia).Then the organisms are allowed to acclimatize (e.g. primary, second-ary consumers) and the water pumps are turned on. The selectedorganisms are involved in a real food web and have different habitatsand ecological functions in the ecosystems. The density of organismsis adjusted as a function of the natural environment. The duration ofthe acclimation depends on biological features of the species asgrowth rate, metabolism activity, life cycle duration.
Phase II corresponds to the ENMs exposure period and ecotoxicitytest. It can be either a single pulse or multiple dosing experiments.The treatments are distributed between each mesocosm as a functionof the picoplankton and algal abundances. To avoid any variation interm of primary production, the triplicates are selected to have aver-age concentrations of picoplankton and algae as close as possiblebetween the different treatments.
Sampling and analyses. Several physico-chemical, microbial, andbiological analyses can be performed to assess both the exposureand impacts of ENMs on a designated trophic link. A number ofparameters can be monitored continuously with the appropriateprobe (e.g. pH, temperature, Eh). Other parameters (e.g. metalconcentration, number of colloids, picoplankton and algaeconcentrations) require sampling. Using a small mesocosm setup,water, superficial sediments, cores, picoplankton, algae, and macro-invertebrates can be sampled with any desired periodicity. Duringsampling, special attention must be given (i) to avoid disturbing thesediment and water column properties, and (ii) to keep micro-organism densities and ENMs concentrations constant.
The distribution of the ENMs or their degradation by-products isassessed by measuring their concentration in the water, sediment,biota, etc. using conventional analytical methods (e.g. ICP-MS orICP-AES). When necessary, the dissolution of ENMs can be mea-sured separately by placing sealed dialysis bags in the mesocosms.
A thorough characterization of the speciation, (bio)transforma-tion, bio(distribution) of the ENMs in the water, sediment, or biotacan be performed using X-ray, IR, Raman spectroscopies, Nuclearmagnetic resonance, as well as electron- or X ray-based microscopyand tomography. Such an experimental design also allows monitor-ing the mechanisms of toxicity at the sub-individual scale on themicro-, macro-organisms as well as on microbial communities. Forinstance, oxidative stress18 can be assessed using ecotoxicologicalmarkers and ecophysiological processes19–22.
Pilot Study Using CeO2 ENMsDesign. A pilot study was conducted to assess the evolution of thedistribution of a CeO2-based ENM that is included on the OECD listfor ENMs requiring (eco)toxicological testing23. Citrate-coated CeO2
nanoparticles (8 nm of hydrodynamic diameter) sold (Nanobyk3810, BykH24) as long-term UV-stabilizers were used in this work25.
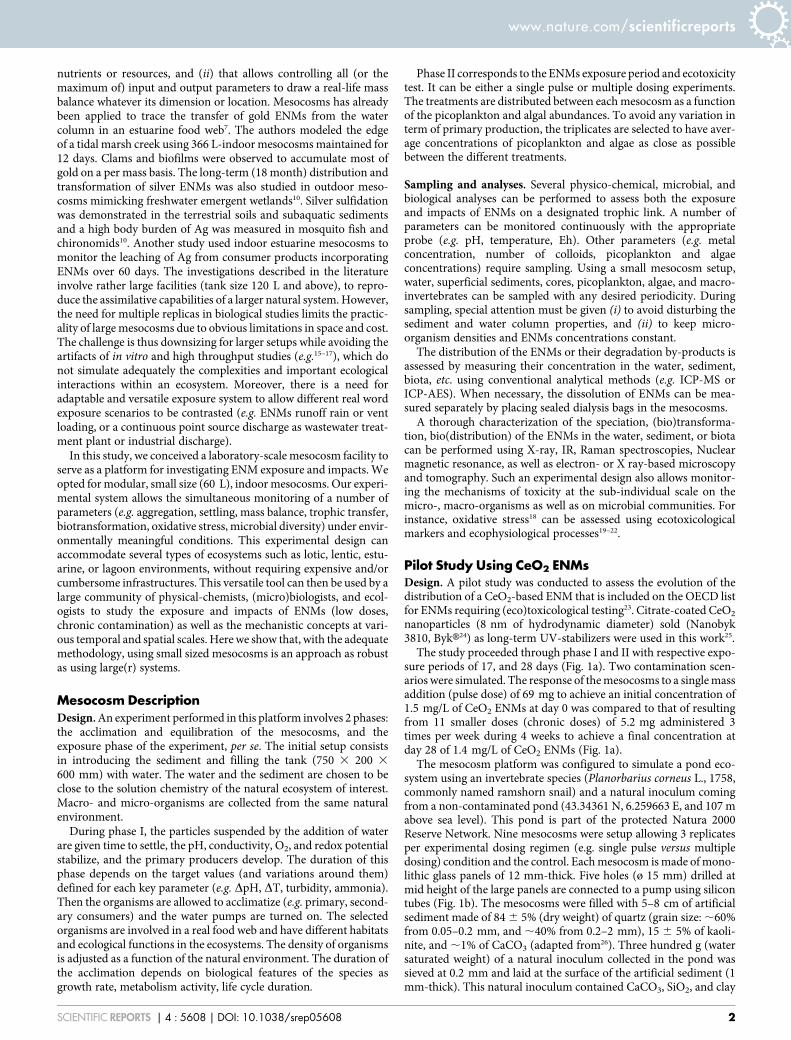
The study proceeded through phase I and II with respective expo-sure periods of 17, and 28 days (Fig. 1a). Two contamination scen-arios were simulated. The response of the mesocosms to a single massaddition (pulse dose) of 69 mg to achieve an initial concentration of1.5 mg/L of CeO2 ENMs at day 0 was compared to that of resultingfrom 11 smaller doses (chronic doses) of 5.2 mg administered 3times per week during 4 weeks to achieve a final concentration atday 28 of 1.4 mg/L of CeO2 ENMs (Fig. 1a).
The mesocosm platform was configured to simulate a pond eco-system using an invertebrate species (Planorbarius corneus L., 1758,commonly named ramshorn snail) and a natural inoculum comingfrom a non-contaminated pond (43.34361 N, 6.259663 E, and 107 mabove sea level). This pond is part of the protected Natura 2000Reserve Network. Nine mesocosms were setup allowing 3 replicatesper experimental dosing regimen (e.g. single pulse versus multipledosing) condition and the control. Each mesocosm is made of mono-lithic glass panels of 12 mm-thick. Five holes (ø 15 mm) drilled atmid height of the large panels are connected to a pump using silicontubes (Fig. 1b). The mesocosms were filled with 5–8 cm of artificialsediment made of 84 6 5% (dry weight) of quartz (grain size: ,60%from 0.05–0.2 mm, and ,40% from 0.2–2 mm), 15 6 5% of kaoli-nite, and ,1% of CaCO3 (adapted from26). Three hundred g (watersaturated weight) of a natural inoculum collected in the pond wassieved at 0.2 mm and laid at the surface of the artificial sediment (1mm-thick). This natural inoculum contained CaCO3, SiO2, and clay
www.nature.com/scientificreports
SCIENTIFIC REPORTS | 4 : 5608 | DOI: 10.1038/srep05608 2
minerals (see supporting information) and introduced the primaryproducers into the mesocosms. Each mesocosm contained 55 L ofthe commercialized natural VolvicH, and eleven adults P. corneus (36 1 cm of diameter). VolvicH is a French commercialized naturalwater with the following composition: pH 7, 11.5 mg/L Ca21,13.5 mg/L Cl2, 71 mg/L HCO3
2, 8 mg/L Mg21, 6.3 mg/L NO32,
6.2 mg/L K1, 11.6 mg/L Na1. The mesocosms were operated 4 daysto acclimate the invertebrates to the experimental conditions beforethe introduction of the CeO2 ENMs suspensions. This few days ofacclimation period were based on previous studies working withmicro- and macro-invertebrates in mesocosms27–29.
Temperature, pH, conductivity, redox potential, and dissolved O2
were measured every 5 min at mid height of the water column usingmulti-parameter probes (OdeonH Open X) and at the water/sedi-ment interface (up to 10 mm below surficial sediment) and midheight of the sediment using platinum-tipped redox probes10,30. Aday/night cycle of 10 h/14 h was applied using full spectrum light(VivaH light T8 tubes 18 W), and room temperature was keptconstant.
All data were analyzed for normality and homoscedasticity usingthe Kolmogorov-Smirnov test and Levene test31. In low sample sizecomparisons, differences between groups were analyzed using aMann-Whtiney U test31. When assumptions were met, One-wayANOVA using General Linear Model followed by Tukey HonestSignificant Difference test were performed using STATGRAPHICSCenturion XVI.II (Sigma Plus, France) or Statistica 6 (StatSoft Inc.,Tulsa, USA)32.
Phase I: acclimation and equilibration. During this phase of accli-mation and equilibration, values for each key parameter (pH,conductivity, and dissolved O2 concentration) and their associatedvariance between the 9 mesocosms were recorded and calculated.The condition that was set for ending phase I (equilibration) wasthe reduction by ,50% (compared to the beginning of phase I) of thestandard deviation corresponding to the average pH, conductivity,
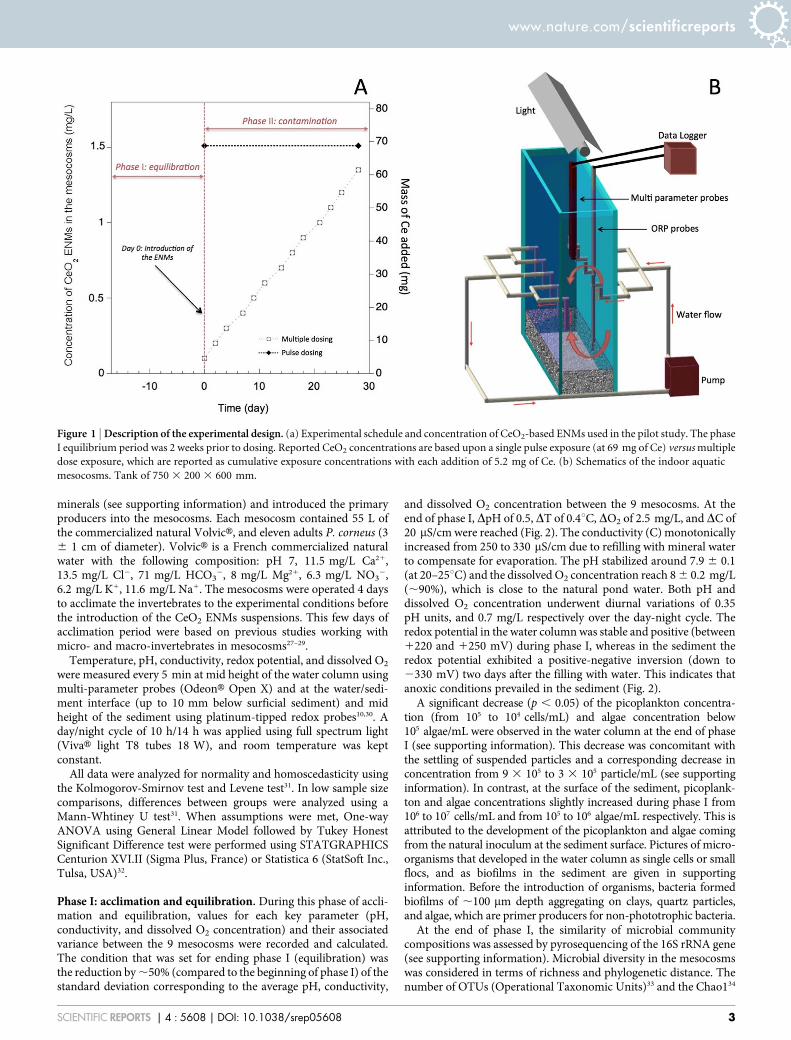
and dissolved O2 concentration between the 9 mesocosms. At theend of phase I, DpH of 0.5, DT of 0.4uC, DO2 of 2.5 mg/L, and DC of20 mS/cm were reached (Fig. 2). The conductivity (C) monotonicallyincreased from 250 to 330 mS/cm due to refilling with mineral waterto compensate for evaporation. The pH stabilized around 7.9 6 0.1(at 20–25uC) and the dissolved O2 concentration reach 8 6 0.2 mg/L(,90%), which is close to the natural pond water. Both pH anddissolved O2 concentration underwent diurnal variations of 0.35pH units, and 0.7 mg/L respectively over the day-night cycle. Theredox potential in the water column was stable and positive (between1220 and 1250 mV) during phase I, whereas in the sediment theredox potential exhibited a positive-negative inversion (down to2330 mV) two days after the filling with water. This indicates thatanoxic conditions prevailed in the sediment (Fig. 2).
A significant decrease (p , 0.05) of the picoplankton concentra-tion (from 105 to 104 cells/mL) and algae concentration below105 algae/mL were observed in the water column at the end of phaseI (see supporting information). This decrease was concomitant withthe settling of suspended particles and a corresponding decrease inconcentration from 9 3 105 to 3 3 105 particle/mL (see supportinginformation). In contrast, at the surface of the sediment, picoplank-ton and algae concentrations slightly increased during phase I from106 to 107 cells/mL and from 105 to 106 algae/mL respectively. This isattributed to the development of the picoplankton and algae comingfrom the natural inoculum at the sediment surface. Pictures of micro-organisms that developed in the water column as single cells or smallflocs, and as biofilms in the sediment are given in supportinginformation. Before the introduction of organisms, bacteria formedbiofilms of ,100 mm depth aggregating on clays, quartz particles,and algae, which are primer producers for non-phototrophic bacteria.
At the end of phase I, the similarity of microbial communitycompositions was assessed by pyrosequencing of the 16S rRNA gene(see supporting information). Microbial diversity in the mesocosmswas considered in terms of richness and phylogenetic distance. Thenumber of OTUs (Operational Taxonomic Units)33 and the Chao134
Figure 1 | Description of the experimental design. (a) Experimental schedule and concentration of CeO2-based ENMs used in the pilot study. The phase
I equilibrium period was 2 weeks prior to dosing. Reported CeO2 concentrations are based upon a single pulse exposure (at 69 mg of Ce) versus multiple
dose exposure, which are reported as cumulative exposure concentrations with each addition of 5.2 mg of Ce. (b) Schematics of the indoor aquatic
mesocosms. Tank of 750 3 200 3 600 mm.
www.nature.com/scientificreports
SCIENTIFIC REPORTS | 4 : 5608 | DOI: 10.1038/srep05608 3
estimator best characterize the microbial richness, while the Bray-Curtis dissimilarity describes the phylogenetic distance between twosamples. Table 1 summarizes diversity indices that describe waterand benthic compartments of the mesocosms at the end of phase II.Based on Kruskall-Wallis test, there was no significant difference(p . 0.05) among the medians of observed OTUs and Chao1 metricsbetween A, B, and C in the water column or in the sediment. Thus therichness values for the limnetic or the sediment compartments of thethree sets of mesocosms were not statistically different. Microbialphylogenetic diversity was examined at the phylum level. Fig. 3shows the percentage distribution of OTUs in phyla, whichaccounted for more than 1%. The Bray-Curtis dissimilarity indiceswere low (,0.3) showing that the diversity of the mesocosms was
similar. Proteobacteria, dominated in the water column (86%), withb-Proteobacteria as main class (76%), followed by the Actinobacteria(3.8%). Both of them often prevail in freshwater microbial com-munities35,36. As expected, the diversity in sediment was higher thanin the water column37. Sequences assigned to Proteobacteria weremore abundant in water column (.80%) than in sediments (46%)while sequences assigned to Actinobacteria were more abundant insediment (14%) than in water column (3.8%). Low-abundance phylaincluded Acidobacteria (5.9%) and Cyanobacteria (5.4%), Chloroflexi(3.7%), Firmicutes (3%), Bactereoidetes (2.6%), Planctomycetes(1.6%), and Nitrospira (1.1%). These phyla are generally enrichedin freshwater sediments38 and pond freshwater sediments39. All con-cluded that prior to addition of ENMs, the mesocosms were reas-
Figure 2 | Evolution of the physico-chemical parameters. Redox potential in the sediment (A) and in the water column (B), dissolved oxygen (C), pH
(D), total organic carbon (E), and conductivity (F) were measured during phases I and II of the pilot study. The grey surface is defined by the
maximum and minimum values of each parameter, and the dark line corresponds to the average values of the 9 mesocosms. One measurement was
performed every 5 min.
www.nature.com/scientificreports
SCIENTIFIC REPORTS | 4 : 5608 | DOI: 10.1038/srep05608 4
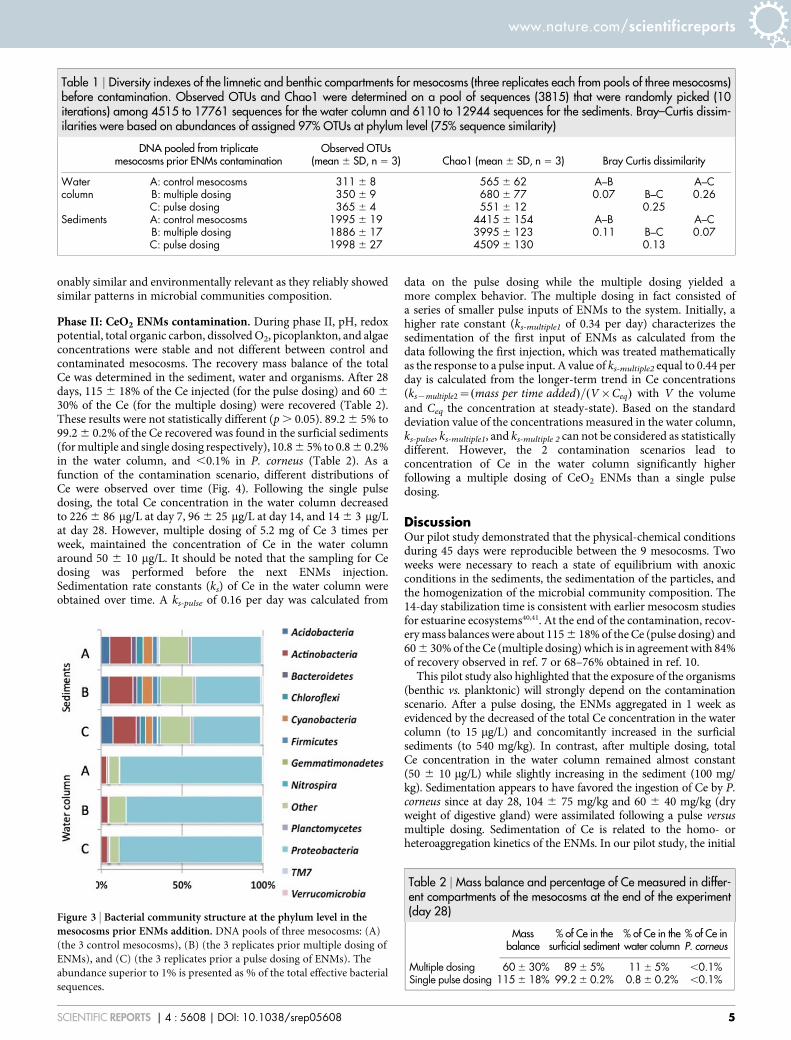
onably similar and environmentally relevant as they reliably showedsimilar patterns in microbial communities composition.
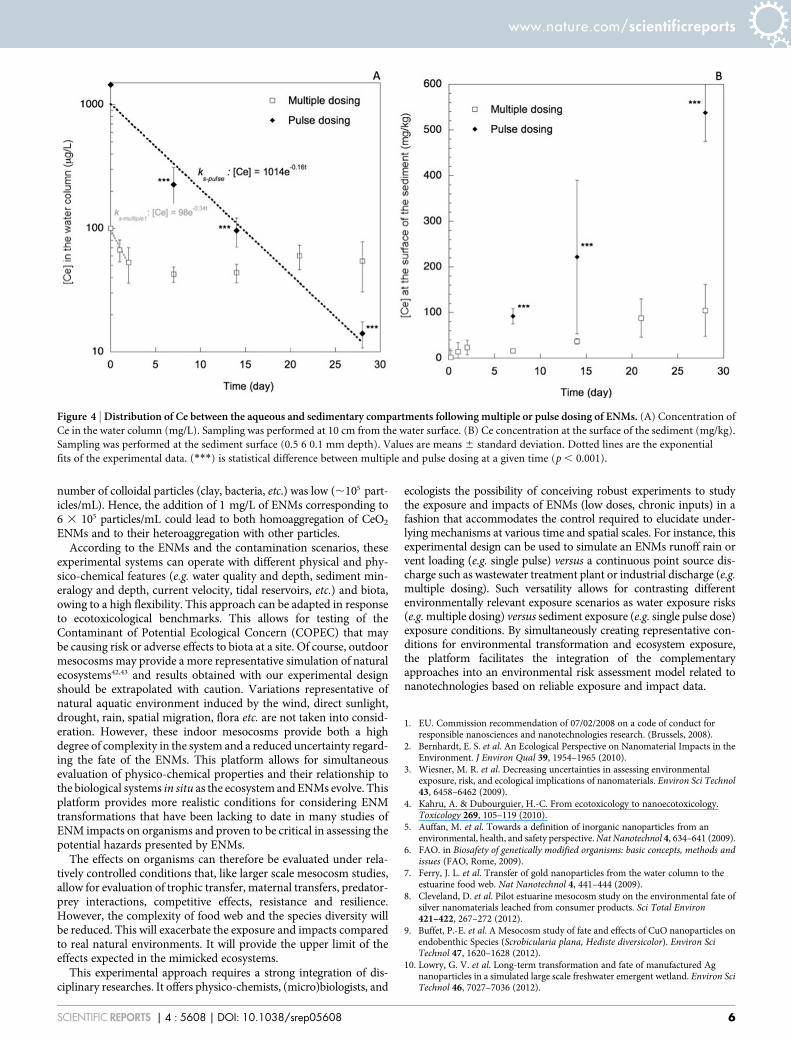
Phase II: CeO2 ENMs contamination. During phase II, pH, redoxpotential, total organic carbon, dissolved O2, picoplankton, and algaeconcentrations were stable and not different between control andcontaminated mesocosms. The recovery mass balance of the totalCe was determined in the sediment, water and organisms. After 28days, 115 6 18% of the Ce injected (for the pulse dosing) and 60 630% of the Ce (for the multiple dosing) were recovered (Table 2).These results were not statistically different (p . 0.05). 89.2 6 5% to99.2 6 0.2% of the Ce recovered was found in the surficial sediments(for multiple and single dosing respectively), 10.8 6 5% to 0.8 6 0.2%in the water column, and ,0.1% in P. corneus (Table 2). As afunction of the contamination scenario, different distributions ofCe were observed over time (Fig. 4). Following the single pulsedosing, the total Ce concentration in the water column decreasedto 226 6 86 mg/L at day 7, 96 6 25 mg/L at day 14, and 14 6 3 mg/Lat day 28. However, multiple dosing of 5.2 mg of Ce 3 times perweek, maintained the concentration of Ce in the water columnaround 50 6 10 mg/L. It should be noted that the sampling for Cedosing was performed before the next ENMs injection.Sedimentation rate constants (ks) of Ce in the water column wereobtained over time. A ks-pulse of 0.16 per day was calculated from
data on the pulse dosing while the multiple dosing yielded amore complex behavior. The multiple dosing in fact consisted ofa series of smaller pulse inputs of ENMs to the system. Initially, ahigher rate constant (ks-multiple1 of 0.34 per day) characterizes thesedimentation of the first input of ENMs as calculated from thedata following the first injection, which was treated mathematicallyas the response to a pulse input. A value of ks-multiple2 equal to 0.44 perday is calculated from the longer-term trend in Ce concentrations(ks{multiple2~(mass per time added)=(V|Ceq) with V the volumeand Ceq the concentration at steady-state). Based on the standarddeviation value of the concentrations measured in the water column,ks-pulse, ks-multiple1, and ks-multiple 2 can not be considered as statisticallydifferent. However, the 2 contamination scenarios lead toconcentration of Ce in the water column significantly higherfollowing a multiple dosing of CeO2 ENMs than a single pulsedosing.
DiscussionOur pilot study demonstrated that the physical-chemical conditionsduring 45 days were reproducible between the 9 mesocosms. Twoweeks were necessary to reach a state of equilibrium with anoxicconditions in the sediments, the sedimentation of the particles, andthe homogenization of the microbial community composition. The14-day stabilization time is consistent with earlier mesocosm studiesfor estuarine ecosystems40,41. At the end of the contamination, recov-ery mass balances were about 115 6 18% of the Ce (pulse dosing) and60 6 30% of the Ce (multiple dosing) which is in agreement with 84%of recovery observed in ref. 7 or 68–76% obtained in ref. 10.
This pilot study also highlighted that the exposure of the organisms(benthic vs. planktonic) will strongly depend on the contaminationscenario. After a pulse dosing, the ENMs aggregated in 1 week asevidenced by the decreased of the total Ce concentration in the watercolumn (to 15 mg/L) and concomitantly increased in the surficialsediments (to 540 mg/kg). In contrast, after multiple dosing, totalCe concentration in the water column remained almost constant(50 6 10 mg/L) while slightly increasing in the sediment (100 mg/kg). Sedimentation appears to have favored the ingestion of Ce by P.corneus since at day 28, 104 6 75 mg/kg and 60 6 40 mg/kg (dryweight of digestive gland) were assimilated following a pulse versusmultiple dosing. Sedimentation of Ce is related to the homo- orheteroaggregation kinetics of the ENMs. In our pilot study, the initial
Table 1 | Diversity indexes of the limnetic and benthic compartments for mesocosms (three replicates each from pools of three mesocosms)before contamination. Observed OTUs and Chao1 were determined on a pool of sequences (3815) that were randomly picked (10iterations) among 4515 to 17761 sequences for the water column and 6110 to 12944 sequences for the sediments. Bray–Curtis dissim-ilarities were based on abundances of assigned 97% OTUs at phylum level (75% sequence similarity)
DNA pooled from triplicatemesocosms prior ENMs contamination
Observed OTUs(mean 6 SD, n 5 3) Chao1 (mean 6 SD, n 5 3) Bray Curtis dissimilarity
Watercolumn
A: control mesocosms 311 6 8 565 6 62 A–B0.07
A–C0.26B: multiple dosing 350 6 9 680 6 77 B–C
0.25C: pulse dosing 365 6 4 551 6 12Sediments A: control mesocosms 1995 6 19 4415 6 154 A–B
0.11A–C0.07B: multiple dosing 1886 6 17 3995 6 123 B–C
0.13C: pulse dosing 1998 6 27 4509 6 130
Figure 3 | Bacterial community structure at the phylum level in themesocosms prior ENMs addition. DNA pools of three mesocosms: (A)
(the 3 control mesocosms), (B) (the 3 replicates prior multiple dosing of
ENMs), and (C) (the 3 replicates prior a pulse dosing of ENMs). The
abundance superior to 1% is presented as % of the total effective bacterial
sequences.
Table 2 | Mass balance and percentage of Ce measured in differ-ent compartments of the mesocosms at the end of the experiment(day 28)
Massbalance
% of Ce in thesurficial sediment
% of Ce in thewater column
% of Ce inP. corneus
Multiple dosing 60 6 30% 89 6 5% 11 6 5% ,0.1%Single pulse dosing 115 6 18% 99.2 6 0.2% 0.8 6 0.2% ,0.1%
www.nature.com/scientificreports
SCIENTIFIC REPORTS | 4 : 5608 | DOI: 10.1038/srep05608 5
number of colloidal particles (clay, bacteria, etc.) was low (,105 part-icles/mL). Hence, the addition of 1 mg/L of ENMs corresponding to6 3 105 particles/mL could lead to both homoaggregation of CeO2
ENMs and to their heteroaggregation with other particles.According to the ENMs and the contamination scenarios, these
experimental systems can operate with different physical and phy-sico-chemical features (e.g. water quality and depth, sediment min-eralogy and depth, current velocity, tidal reservoirs, etc.) and biota,owing to a high flexibility. This approach can be adapted in responseto ecotoxicological benchmarks. This allows for testing of theContaminant of Potential Ecological Concern (COPEC) that maybe causing risk or adverse effects to biota at a site. Of course, outdoormesocosms may provide a more representative simulation of naturalecosystems42,43 and results obtained with our experimental designshould be extrapolated with caution. Variations representative ofnatural aquatic environment induced by the wind, direct sunlight,drought, rain, spatial migration, flora etc. are not taken into consid-eration. However, these indoor mesocosms provide both a highdegree of complexity in the system and a reduced uncertainty regard-ing the fate of the ENMs. This platform allows for simultaneousevaluation of physico-chemical properties and their relationship tothe biological systems in situ as the ecosystem and ENMs evolve. Thisplatform provides more realistic conditions for considering ENMtransformations that have been lacking to date in many studies ofENM impacts on organisms and proven to be critical in assessing thepotential hazards presented by ENMs.
The effects on organisms can therefore be evaluated under rela-tively controlled conditions that, like larger scale mesocosm studies,allow for evaluation of trophic transfer, maternal transfers, predator-prey interactions, competitive effects, resistance and resilience.However, the complexity of food web and the species diversity willbe reduced. This will exacerbate the exposure and impacts comparedto real natural environments. It will provide the upper limit of theeffects expected in the mimicked ecosystems.
This experimental approach requires a strong integration of dis-ciplinary researches. It offers physico-chemists, (micro)biologists, and
ecologists the possibility of conceiving robust experiments to studythe exposure and impacts of ENMs (low doses, chronic inputs) in afashion that accommodates the control required to elucidate under-lying mechanisms at various time and spatial scales. For instance, thisexperimental design can be used to simulate an ENMs runoff rain orvent loading (e.g. single pulse) versus a continuous point source dis-charge such as wastewater treatment plant or industrial discharge (e.g.multiple dosing). Such versatility allows for contrasting differentenvironmentally relevant exposure scenarios as water exposure risks(e.g. multiple dosing) versus sediment exposure (e.g. single pulse dose)exposure conditions. By simultaneously creating representative con-ditions for environmental transformation and ecosystem exposure,the platform facilitates the integration of the complementaryapproaches into an environmental risk assessment model related tonanotechnologies based on reliable exposure and impact data.
1. EU. Commission recommendation of 07/02/2008 on a code of conduct forresponsible nanosciences and nanotechnologies research. (Brussels, 2008).
2. Bernhardt, E. S. et al. An Ecological Perspective on Nanomaterial Impacts in theEnvironment. J Environ Qual 39, 1954–1965 (2010).
3. Wiesner, M. R. et al. Decreasing uncertainties in assessing environmentalexposure, risk, and ecological implications of nanomaterials. Environ Sci Technol43, 6458–6462 (2009).
4. Kahru, A. & Dubourguier, H.-C. From ecotoxicology to nanoecotoxicology.Toxicology 269, 105–119 (2010).
5. Auffan, M. et al. Towards a definition of inorganic nanoparticles from anenvironmental, health, and safety perspective. Nat Nanotechnol 4, 634–641 (2009).
6. FAO. in Biosafety of genetically modified organisms: basic concepts, methods andissues (FAO, Rome, 2009).
7. Ferry, J. L. et al. Transfer of gold nanoparticles from the water column to theestuarine food web. Nat Nanotechnol 4, 441–444 (2009).
8. Cleveland, D. et al. Pilot estuarine mesocosm study on the environmental fate ofsilver nanomaterials leached from consumer products. Sci Total Environ421–422, 267–272 (2012).
9. Buffet, P.-E. et al. A Mesocosm study of fate and effects of CuO nanoparticles onendobenthic Species (Scrobicularia plana, Hediste diversicolor). Environ SciTechnol 47, 1620–1628 (2012).
10. Lowry, G. V. et al. Long-term transformation and fate of manufactured Agnanoparticles in a simulated large scale freshwater emergent wetland. Environ SciTechnol 46, 7027–7036 (2012).
Figure 4 | Distribution of Ce between the aqueous and sedimentary compartments following multiple or pulse dosing of ENMs. (A) Concentration of
Ce in the water column (mg/L). Sampling was performed at 10 cm from the water surface. (B) Ce concentration at the surface of the sediment (mg/kg).
Sampling was performed at the sediment surface (0.5 6 0.1 mm depth). Values are means 6 standard deviation. Dotted lines are the exponential
fits of the experimental data. (***) is statistical difference between multiple and pulse dosing at a given time (p , 0.001).
www.nature.com/scientificreports
SCIENTIFIC REPORTS | 4 : 5608 | DOI: 10.1038/srep05608 6

11. Shriner, C., Gregory, T. & Brocksen, R. W. Use of artificial streams fortoxicological research. Crit Rev Toxicol 13, 253–281 (1984).
12. Crossland, N. O. & La Point, T. W. The design of mesocosm experiments. EnvironToxicol Chem 11, 1–4 (1992).
13. Sommer, U. et al. An indoor mesocosm system to study the effect of climatechange on the late winter and spring succession of Baltic Sea phyto- andzooplankton. Oecologia 150, 655–667 (2007).
14. Mohr, S. et al. Enhanced Experimental Flexibility and Control in EcotoxicologicalMesocosm Experiments: A new outdoor and indoor pond and stream system.Environ Sci Pollut R 12, 5–7 (2005).
15. Bone, A. J. et al. Biotic and abiotic interactions in aquatic microcosms determinefate and toxicity of Ag nanoparticles: part 2–toxicity and Ag speciation. EnvironSci Technol 46, 6925–6933 (2012).
16. Unrine, J. M., Colman, B. P., Bone, A. J., Gondikas, A. P. & Matson, C. W. Bioticand abiotic interactions in aquatic microcosms determine fate and toxicity of Agnanoparticles. part 1. aggregation and dissolution. Environ Sci Technol 46,6915–6924 (2012).
17. Thomas, C. R. et al. Nanomaterials in the environment: from materials to high-throughput screening to organisms. ACS Nano 5, 13–20 (2011).
18. Xia, T. et al. Comparison of the abilities of ambient and manufacturednanoparticles to induce cellular toxicity according to an oxidative stress paradigm.Nano Lett 6, 1794–1807 (2006).
19. Fan, W. et al. Bioaccumulation and biomarker responses of cubic and octahedralCu2O micro/nanocrystals in Daphnia magna. Water Res 46, 5981–5988 (2012).
20. Buffet, P. E. et al. Behavioural and biochemical responses of two marineinvertebrates Scrobicularia plana and Hediste diversicolor to copper oxidenanoparticles. Chemosphere 84, 166–174 (2011).
21. Zhu, S., Oberdorster, E. & Haasch, M. L. Toxicity of an engineered nanoparticle(fullerene, C60) in two aquatic species, Daphnia and fathead minnow. MarEnviron Res 62, Supplement 1, S5–S9 (2006).
22. Chae, Y. J. et al. Evaluation of the toxic impact of silver nanoparticles on Japanesemedaka (Oryzias latipes). Aquat Toxicol 94, 320–327 (2009).
23. OECD. in Series on the Safety of Manufactured Nanomaterials No. 6(Organization for Economic Cooperation and Development, Paris, France, 2008).
24. BYK. Nanobyk-3810 Nanoparticle dispersion for long-term UV-stability ofwater-borne systems. Data Sheet E207 03/10.
25. Auffan, M. et al. Long-term aging of a CeO2 based nanocomposite used for woodprotection. Environ Pollut 188, 1–7 (2014).
26. OECD. in Sediment-water Lumbricus toxicity test using spiked sediment(Organization for Economic Cooperation and Development, Paris, France, 2006).
27. Hickey, C. W., Golding, L. A., Martin, M. L. & Croker, G. F. Chronic Toxicity ofAmmonia to New Zealand Freshwater Invertebrates: A Mesocosm Study. ArchEnviron Contam Toxicol 37, 338–351 (1999).
28. Sellami, B. et al. Variation temporelle de l’activite catalase chez la palourdeRuditapes decussatus Linnaeus, 1758 contaminee par la permethrine (etude enmesocosme). Bull Inst Sci 34, 137–144 (2012).
29. Kefford, B. J., Salter, J., Clay, C., Dunlop, J. E. & Dayanthi, N. Freshwaterinvertebrates’ response to gradients of salinity and turbidity: using preference as arapid sub-lethal test. Australas J Ecotoxicol 13, 131–142 (2007).
30. Wafer, C. C., Richards, J. B. & Osmond, D. L. Construction of platinum-tippedredox probes for determining soil redox potential. J Environ Qual 33, 2375–2379(2004).
31. Kobayashi, K., Pillai, K. S., Sakuratani, Y., Suzuki, M. & Jie, W. Do we need toexamine the quantitative data obtained from toxicity studies for both normalityand homogeneity of variance? J Environ Biol 29, 47–52 (2008).
32. O’Brien, R. G. A General ANOVA Method for robust tests of additive models forvariances. J Am Stat Assoc 74, 877–880 (1979).
33. Blaxter, M. et al. Defining operational taxonomic units using DNA barcode data.Philos Trans R Soc Lond B Biol Sci 360, 1935–1943 (2005).
34. Chao, A. Non-parametric estimation of the number of classes in a population.Scand J Stat 11, 265–270 (1984).
35. Nold, S. C. & Zwart, G. Patterns and governing forces in aquatic microbialcommunities. Aquat Ecol 32, 17–35 (1998).
36. Newton, R. J., Jones, S. E., Eiler, A., McMahon, K. D. & Bertilsson, S. A Guide to thenatural history of freshwater lake bacteria. Microbiol Mol Biol R 75, 14–49 (2011).
37. Zinger, L. et al. Global patterns of bacterial beta-diversity in seafloor and seawaterecosystems. PLoS ONE 6, e24570 (2011).
38. Wang, Y. et al. Comparison of the levels of bacterial diversity in freshwater,intertidal wetland, and marine sediments by using millions of illumina tags. ApplEnviron Microbiol 78, 8264–8271 (2012).
39. Briee, C., Moreira, D. & Lopez-Garcia, P. Archaeal and bacterial communitycomposition of sediment and plankton from a suboxic freshwater pond. ResMicrobiol 158, 213–227 (2007).
40. Lauth, J. R., Cherry, D. S., Buikema, A. L. & Scott, G. I. A modular estuarinemesocosm. Environ Toxicol Chem 15, 630–637 (1996).
41. Graney, R. L., Kennedy, J. H. & Rodgers, J. H. Aquatic Mesocosm Studies inEcological Risk Assessment. (CRC Press Inc, 1993).
42. Heinlaan, M. et al. Changes in the Daphnia magna midgut upon ingestion ofcopper oxide nanoparticles: a transmission electron microscopy study. Wat Res45, 179–190 (2011).
43. SETAC, Guidance document on testing procedures for pesticides in freshwatermesocosms. Proceedings of the workshop ‘‘A meeting of experts on guidelines forstatic field mesocosm tests’’, Monks Wood Experimental Station, Abbots Ripton,Huntington, UK (July 1991), p. 46.
AcknowledgmentsThe authors thank the CNRS for funding the GDRi-iCEINT, the FrenchANR-10-NANO-0006/MESONNET, and the CEINT center supported by the NSF and theEPA under NSF Cooperative Agreement EF-0830093. Any opinions, findings, conclusionsor recommendations expressed in this material are those of the author(s) and do notnecessarily reflect the views of the NSF, or the EPA. This work has not been subjected toEPA review and no official endorsement should be inferred.
Author contributionsM.A. and A.T. conceived the experiment; M.T. and L.B. run the experiment and collected allthe samples; M.T. analyzed the physico-chemical behavior of the ENMs; C.P. and L.B.analyzed the picoplankton and algae; C.S. and M.B. analyzed the bacterial diversity; B.E.designed the redox probes; A.T., M.A., L.B., C.P., E.A., M.T., J.I. collected sampled in thepond, M.A. wrote the manuscript with input and approval from all coauthors; J-Y.B., A.T.,M.A., C.S., J.R., A.M., M.R.W., W.A. supervised the work.
Additional informationSupplementary information accompanies this paper at http://www.nature.com/scientificreports
Competing financial interests: The authors declare no competing financial interests.
How to cite this article: Auffan, M. et al. An adaptable mesocosm platform for performingintegrated assessments of nanomaterial risk in complex environmental systems. Sci. Rep. 4,5608; DOI:10.1038/srep05608 (2014).
This work is licensed under a Creative Commons Attribution-NonCommercial-NoDerivs 4.0 International License. The images or other third party material inthis article are included in the article’s Creative Commons license, unless indicatedotherwise in the credit line; if the material is not included under the CreativeCommons license, users will need to obtain permission from the license holderin order to reproduce the material. To view a copy of this license, visit http://creativecommons.org/licenses/by-nc-nd/4.0/
www.nature.com/scientificreports
SCIENTIFIC REPORTS | 4 : 5608 | DOI: 10.1038/srep05608 7
Related Documents