Amplitude-Integrated EEG Assists in Detecting Cerebral Dysfunction in the Newborn Divyen K Shah University College, London PhD Thesis Student registration number: 979036110 Supervisors: Dr Nikki Robertson, University College, London. Dr Terrie E Inder, Washington University, St Louis, MO, USA. Address for Correspondence: Neonatal Unit, 2 nd Floor, Garden House, Royal London Hospital, Whitechapel, Lonodon E1 1BB. Email: [email protected] Thesis ~ 36,500 words. 1

Amplitude integrated eeg assists in detecting cerebral dysfunction in the newborn
Aug 08, 2015
Welcome message from author
This document is posted to help you gain knowledge. Please leave a comment to let me know what you think about it! Share it to your friends and learn new things together.
Transcript
Amplitude-Integrated EEG Assists in Detecting Cerebral
Dysfunction in the Newborn
Divyen K Shah
University College, London
PhD Thesis
Student registration number: 979036110
Supervisors: Dr Nikki Robertson, University College, London.
Dr Terrie E Inder, Washington University, St Louis, MO, USA.
Address for Correspondence: Neonatal Unit, 2nd Floor, Garden House, Royal London Hospital,
Whitechapel, Lonodon E1 1BB.
Email: [email protected]
Thesis ~ 36,500 words.
1

Declaration
I, Divyen K Shah, confirm that the work presented in this thesis is my own. Where information has
been derived from other sources, I confirm that this has been indicated in the thesis.
2
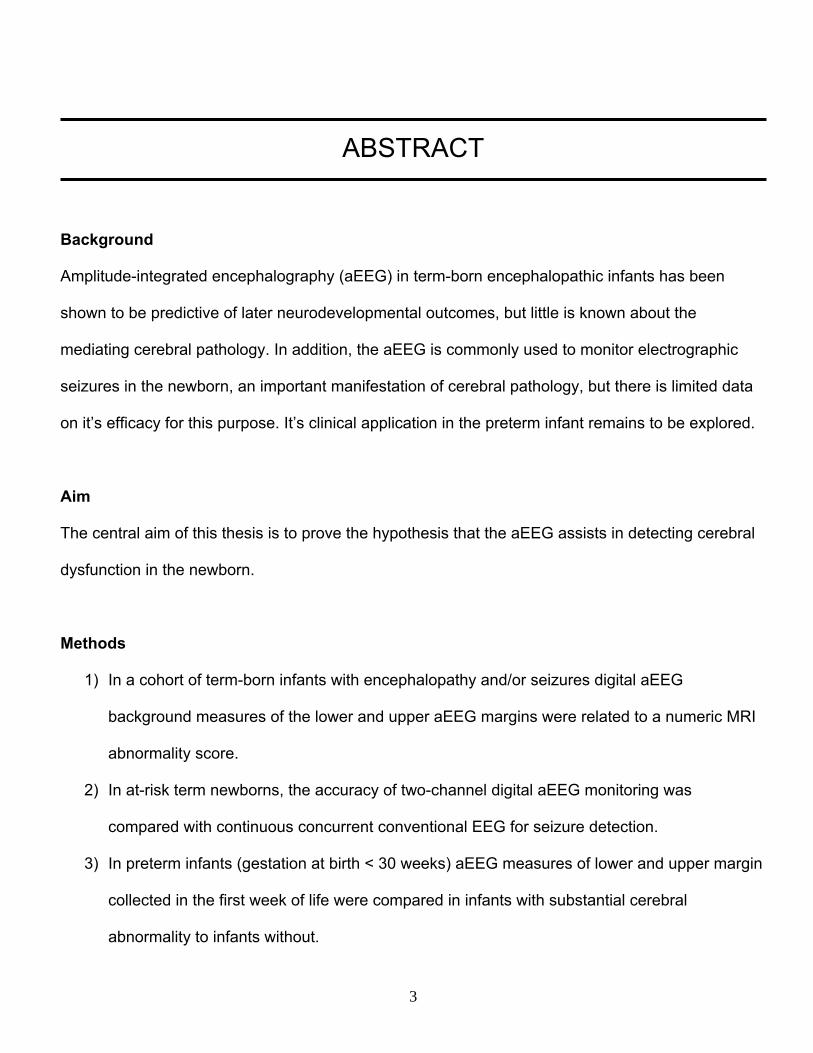
ABSTRACT
Background
Amplitude-integrated encephalography (aEEG) in term-born encephalopathic infants has been
shown to be predictive of later neurodevelopmental outcomes, but little is known about the
mediating cerebral pathology. In addition, the aEEG is commonly used to monitor electrographic
seizures in the newborn, an important manifestation of cerebral pathology, but there is limited data
on it’s efficacy for this purpose. It’s clinical application in the preterm infant remains to be explored.
Aim
The central aim of this thesis is to prove the hypothesis that the aEEG assists in detecting cerebral
dysfunction in the newborn.
Methods
1) In a cohort of term-born infants with encephalopathy and/or seizures digital aEEG
background measures of the lower and upper aEEG margins were related to a numeric MRI
abnormality score.
2) In at-risk term newborns, the accuracy of two-channel digital aEEG monitoring was
compared with continuous concurrent conventional EEG for seizure detection.
3) In preterm infants (gestation at birth < 30 weeks) aEEG measures of lower and upper margin
collected in the first week of life were compared in infants with substantial cerebral
abnormality to infants without.
3

Results
1) For all infants in the term cohort, the severity of abnormality of aEEG background was
strongly related to severity of abnormality seen on cerebral MRI.
2) Using the aEEG pattern with the raw EEG signal, 76% of electrographic seizures were
correctly identified in the term infants.
3) In the preterm cohort, the lower and upper aEEG amplitude margins increased significantly
during the first week of life. In the presence of substantial cerebral abnormality, these
margins were significantly depressed. Seizures were noted in the smaller and sicker, infants.
Conclusion
The central hypothesis of this thesis, that the aEEG assists in detecting cerebral dysfunction in the
newborn was proved.
4

Acknowledgments
I am grateful to Dr Nikki Robertson for helping facilitate this study and introducing me to my co-supervisor. I
am grateful for her long distance mentorship throughout this process and her supervision. I am grateful to Dr
Terrie Inder for her supervision and for facilitating all the many aspects of this study. I am also grateful to her
for giving me the opportunities to learn in the multiple fora and environments that I was exposed to while
working with her.
I would like to thank Professor Ray Noble for his very helpful suggestions and assistance. I am indebted to
Professor John Wyatt who started me on the path of electrophysiology in the newborn. I would like to thank
Professor Lex Doyle for teaching me about the research process and about analyzing and presenting
research findings. I would like to thank Ms Shelly Lavery for teaching me all the practicalities about bedside
aEEG monitoring. I would also like to thank Ms Connie Wong, Ms Merilyn Bear, Dr Peter McDougall, Dr Mark
Mackay, Dr Simon Harvey and Ms Sue Watson for their assistance with the research studies in Melbourne. I
am grateful to Dr John Zempel, Dr Sessions Cole, Ms Jocelyn Wagman, Ms Jennifer Walker, Ms Karen
Lukas, Mr Tony Barton, Ms Jayne Siccard, Dr Amit Mathur and all the nursing and medical staff at St Louis
Children’s Hospital for their kindness and assistance with the research studies there. I am grateful to Ms
Jingnan Mao for statistical help, particularly with using mixed models. I would like to thank Gordon McDonald
and the staff at BrainZ Instruments, New Zealand for their assistance over the years. Thanks to Liz Woods
for assistance with formatting the contents pages of this thesis!
Through this thesis, I wish to pay tribute to all the great teachers including Professors John Wyatt, Lena
Hellstrom-Westas, Pierre Gressens, Joseph Volpe and Linda de Vries. Most of all I am grateful to the
families who consented to take part in the research studies.
5

Dedication
This thesis is dedicated, with love, to Trushna, Veer and Ammee who shared the journey. Words
cannot express.
6

Abbreviations
AED – anti-epileptic drug
aEEG – amplitude integrated EEG
ASA – acute stage abnormalities
BE – base excess
Bic – bicarbonate
Bpm – beats per minute
BS – burst suppression
ccEEG – continuous conventional EEG
CFM – cerebral function monitor
CI – confidence intervals
CLV – continuous low voltage
CNV – continuous normal voltage
CP – cerebral palsy
CUS – cranial ultrasound scan
DNV – discontinuous normal voltage
ECG - electrocardiograph
EEG – electroencephalogram
EMG - electromyogram
ESA – electrographic seizure activity
FT – flat trace
GM-IVH – germinal matrix – intraventricular haemorrhage
HR – heart rate
7

IBI – interburst interval
IVH – intraventricular haemorrhage
LR – likelihood ratio
MRI – magnetic resonance image
NPV – negative predictive value
P5 value – percent of time the lower aEEG margin spends below 5µV
PPHN – primary pulmonary hypertension in the newborn
PPV – positive predictive value
PVL – periventricular leukomalacia
REM – rapid eye movement
RR – respiratory rate
SE – status epilepticus
TEA – term equivalent age
8

CONTENTS Contents................................................................................................................................... Page Declaration ................................................................................................................................... 2 Abstract ........................................................................................................................................ 3 Acknowledgements ...................................................................................................................... 5 Dedication .................................................................................................................................... 6 Abbreviations ............................................................................................................................... 7 Contents....................................................................................................................................... 9 Content of Figures and Illustrations.............................................................................................. 15 Content of Tables......................................................................................................................... 17 Quotation...................................................................................................................................... 18
Chapter 1 Introduction; Aim and Hypothesis .......................................................................... 20
1.1 Introduction and Aim ..................................................................................................... 21 1.2 Hypotheses ................................................................................................................... 21
Chapter 2 Literature Review and Scope of Thesis .................................................................. 23
2.1 Summary ................................................................................................................... 24 2.2 Principles of Electro-encephalography (EEG) ........................................................... 24
2.2.1 Historical Background.................................................................................... 24 2.2.2 Basic Principles of EEG................................................................................. 24 2.2.3 The Origins of EEG Waveforms......................................................................25
2.3 Conventional EEG in the Newborn............................................................................ 25 2.3.1 EEG and Cerebral Maturation........................................................................ 25 2.3.2 The Interburst Interval (IBI) ............................................................................ 26 2.3.3 Specific EEG Features Related to Maturation ............................................... 27 2.3.4 Inter-hemispheric EEG Synchrony................................................................. 27 2.3.5 Sleep State Changes..................................................................................... 27 2.3.6 Specific EEG Abnormalities, Periventricular Leukomalacia (PVL) and
Neurologic Outcome in Preterm Infants.......................................................... 28 2.3.7 EEG, Neonatal Encephalopathy and Outcome in the Term-Born Infant ........ 29
2.4 Amplitude-Integrated EEG......................................................................................... 30 2.4.1 Historical Perspectives of Amplitude-Integrated EEG.................................... 30 2.4.2 Monitoring Cerebral Function......................................................................... 31
2.5 General Principles of aEEG....................................................................................... 31 2.5.1 The Number and Position of Electrodes ........................................................ 31 2.5.2 The Frequency Filter...................................................................................... 32 2.5.3 Amplitude Range and Output......................................................................... 32
2.6 aEEG and the Term Newborn ................................................................................... 33 2.6.1 Introduction .................................................................................................... 33 2.6.2 aEEG and Hypoxic Ischemic Encephalopathy............................................... 34 2.6.3 Evolution of aEEG Pattern in the First 72 Hours and
Relationship to Outcome ................................................................................ 35
9
2.7 aEEG and Electroencephalographic Seizures........................................................... 36 2.8 aEEG in Preterm Infants............................................................................................ 38
2.8.1 aEEG Pattern with Increasing Gestation........................................................ 38 2.8.2 aEEG Pattern Changes in Relation to Cerebral Oxygenation and Perfusion
Changes in the Preterm Infant ..................................................................... 38 2.8.3 aEEG, Cerebral Injury and Neurodevelopmental Outcome in the Preterm Infant .............................................................................................. 39
2.9 Encephalopathy in Term-Born Infants ....................................................................... 40 2.10 Cerebral Injury in Term Infants with Hypoxic-Ischaemic Encephalopathy ................. 40
2.10.1 Mechanisms of Cerebral Injury .................................................................... 40 2.10.2 Complimentary Models of Cerebral Injury; Neurotoxic Cascade.................. 41 2.10.3 Two Models of Cell Death; Necrosis and Apoptosis .................................... 41 2.10.4 Inflammation and Brain Injury ...................................................................... 42 2.10.5 Patterns of Cerebral Injury in Experimental Models of Hypoxia-Ischaemia
Related to Timing and Severity of Insult....................................................... 42 2.10.6 Cerebral Injury as Seen on MR Imaging in Term Infant with HIE and
Neurodevelopmental Outcomes................................................................... 43 2.11 Seizures and Cerebral Injury in the Term Infant ........................................................ 44 2.12 Incidence and Consequences of Preterm Birth ......................................................... 44 2.13 Cerebral Pathology in the Preterm Infant .................................................................. 45
2.13.1 Germinal Matrix-Intraventricular Haemorrhage............................................ 45 2.13.2 Post-haemorrhagic Hydrocephalus.............................................................. 46 2.13.3 Long-term Neurologic Sequelae after GM-IVH ............................................ 47 2.13.4 Periventricular Leukomalacia and White Matter Injury ................................. 47 2.13.5 Pathogenesis and Neurodevelopmental Consequences of PVL.................. 48 2.13.6 Cerebral Injury on MR images in Preterm Infants and Neurodevelopmental
Outcomes..................................................................................................... 48 2.14 Scope of Thesis .............................................................................................. 50
Chapter 3 Amplitude-Integrated EEG Measures and Patterns in Term Infants with Seizures
and/or Encephalopathy Related to Cerebral Abnormalities on MRI; Methods .......... 51
3.1 Summary ................................................................................................................... 52 3.2 Patient Population ..................................................................................................... 52 3.3 Diagnoses ................................................................................................................. 52 3.4 Bedside aEEG Monitoring ......................................................................................... 53 3.5 EEG Analysis ............................................................................................................ 53 3.6 EEG Pattern .............................................................................................................. 54 3.7 MR Image Acquisition Method................................................................................... 54 3.8 MR Image Analysis ................................................................................................... 55 3.9 Statistical Analysis of Results.................................................................................... 57
Chapter 4 Amplitude-Integrated EEG Measures and Patterns in Term Infants with Seizures
and/or Encephalopathy Related to Cerebral Abnormalities on MRI; Results.......... 58
4.1 Summary ................................................................................................................... 59 4.2 Patient Population ..................................................................................................... 59 4.3 Encephalopathic infants..............................................................................................62
10
4.3.1 Quantitative Amplitude in Relation to Severity of MRI ................................... 62 4.3.2 Qualitative Background Pattern in Relation to MRI........................................ 65 4.3.3 Relationship of Timing of aEEG and MRI ...................................................... 66
4.4 Pattern of MRI Abnormality ....................................................................................... 67 4.5 Infants with HIE ......................................................................................................... 67 4.6 Infants with Diagnoses other than HIE ...................................................................... 69 4.7 Infants Monitored after the First 24 Hours of Life ...................................................... 70 4.8 Infants with Seizures ................................................................................................. 70 4.9 Effect of Anticonvulsants ........................................................................................... 70 4.10 Diagnostic Accuracy of EEG for More Severe Cerebral Abnormality in Infants with
HIE ............................................................................................................................72 4.11 Diagnostic Accuracy of EEG for More Severe Cerebral Abnormality in Infants
Monitored after the First Twenty-Four Hours of Life .................................................. 73 Chapter 5 The Accuracy of Bedside aEEG Monitors for Seizure Detection; Methods......... 74
5.1 Summary ................................................................................................................... 75 5.2 Patient Population ..................................................................................................... 75 5.3 Bedside EEG Monitoring and Continuous Conventional EEG................................... 75 5.4 Off-line Analysis ........................................................................................................ 76
5.4.1 Criteria for Seizures ....................................................................................... 76 5.4.2 ccEEG............................................................................................................ 76 5.4.3 aEEG plus 2-channel EEG ............................................................................ 76 5.4.4 aEEG .............................................................................................................76 5.5 Data Analysis.................................................................................................... 77
Chapter 6 The Accuracy of Bedside aEEG Monitors for Seizure Detection; Results .......... 79
6.1 Summary ................................................................................................................... 80 6.2 Patient Population ..................................................................................................... 80 6.3 ccEEG Seizures ........................................................................................................ 82 6.4 aEEG plus 2-channel EEG........................................................................................ 82 6.5 Seizures not Detected using aEEG plus 2-channel EEG .......................................... 84 6.6 False Positives .......................................................................................................... 84 6.7 Clinical Course of Infants in Relation to Monitoring and Anticonvulsant
Administration............................................................................................................ 85 6.8 “Error” patients .......................................................................................................... 88 6.9 Patients with no ccEEG seizure activity..................................................................... 88 6.10 The duration of seizures on the bedside monitor compared with the duration on ccEEG ..................................................................................................................89 6.11 aEEG Tracing Alone.................................................................................................. 90 6.12 Seizures not detected using single or two-channel aEEG......................................... 90 6.13 Infant Outcomes ........................................................................................................ 91
11

Chapter 7 aEEG Background, the Presence of Electrographic Seizures and Quantifiable aEEG Measures in Preterm Infants in the First Week of Life Assists in Detecting Cerebral Abnormality; Methods........................................................................................ 92
7.1 Summary ................................................................................................................... 93 7.2 Study Population ....................................................................................................... 93 7.3 aEEG Monitoring ....................................................................................................... 93 7.4 aEEG Analysis .......................................................................................................... 94 7.5 aEEG Monitor Function and Manual aEEG Data Analysis ........................................ 94 7.6 The Use of Sedation in this Cohort............................................................................ 95 7.7 Visual Analysis of aEEG Pattern ............................................................................... 96 7.8 Visual Analysis of EEG with aEEG for Electrographic Seizure Activity ..................... 96 7.9 Physiological “Vital Signs” Download ........................................................................ 96 7.10 Correlation of aEEG with Physiologic Parameters in Infants with Seizures............... 97 7.11 Neuroimaging ............................................................................................................ 97
7.11.1 Cranial Ultrasound .......................................................................................97 7.11.2 MR Imaging ................................................................................................. 98
7.12 Classification of Cerebral Injury-Related Outcomes .................................................. 98 7.13 Data Analysis ............................................................................................................ 98
Chapter 8 aEEG in Preterm Infants Assists in Detecting Cerebral Abnormality; aEEG
Background and Quantifiable aEEG Measures Results............................................... 100
8.1 Summary ................................................................................................................... 101 8.2 Study Population ....................................................................................................... 101 8.3 The Use of Sedation in the Cohort ............................................................................ 102 8.4 Cerebral Injury-Related Outcomes ............................................................................ 103 8.5 Trends of aEEG Measures in Infants with Normal Outcomes ................................... 105 8.6 Trends of aEEG Measures in Infants with Normal Outcomes Compared to Those in Infants with Abnormal Outcomes ................................................................ 107 8.7 aEEG Pattern Variability............................................................................................ 107 8.8 Regression in aEEG Variability ................................................................................. 109 8.9 aEEG Pattern Maturation .......................................................................................... 110 8.10 aEEG Pattern in Infants with Post-Natal Grade 3 or 4 IVH........................................ 111
Chapter 9 aEEG in Preterm Assists in Detecting Cerebral Abnormality; Seizure Activity
Results ............................................................................................................................. 114
9.1 Summary ................................................................................................................... 115 9.2 Electrographic Seizure Activity .................................................................................. 115 9.3 Seizures, aEEG and Autonomic Changes................................................................. 117 9.4 Analysis of aEEG, Seizures and Autonomic Changes .............................................. 122 9.5 Findings in Infants with Seizures and Autonomic Changes ....................................... 124 9.6 Outcomes in Preterm Infants with Seizures............................................................... 124 9.7 Seizures and Grade 3/4 IVH...................................................................................... 125 9.8 Seizures and Death of Preterm Infants...................................................................... 125
12

Chapter 10 Discussion: aEEG in Term Infants with Seizures and/or Encephalopathy Assists in Detecting Cerebral Abnormality...................................................................... 126
10.1 Summary ...................................................................................................................127 10.2 Key Findings from this Study..................................................................................... 127 10.3 What is already Known and What our Study Adds .................................................... 127 10.4 Strengths and Weaknesses of this Study .................................................................. 128 10.5 Clinical Applications for this Work ............................................................................. 129 10.6 Future Directions for this Work .................................................................................. 130
Chapter 11 Discussion; The Accuracy of Bedside aEEG Monitors for Seizure Detection .. 132
11.1 Summary ...................................................................................................................133 11.2 Key Findings from this Study..................................................................................... 133 11.3 Factors Contributing to Electrographic Seizure Detection; Duration, Focus and
Morphology................................................................................................................ 134 11.4 “False Positives”........................................................................................................ 134 11.5 Seizure Detection and aEEG Background................................................................. 135 11.6 Seizure Detection after Treatment with Anticonvulsants ........................................... 135 11.7 Review of Studies on the use of aEEG for Seizure Detection in the Newborn .......... 136 11.8 Conclusions...............................................................................................................138 11.9 Clinical Applications of this Work............................................................................... 138 11.10 Future Directions ....................................................................................................... 139
Chapter 12 Discussion; aEEG Measures in Relation to Cerebral Abnormality-Related
Outcomes in Preterm Infants ............................................................................................ 141
12.1 Summary ...................................................................................................................142 12.2 Important Findings from this Study............................................................................ 142 12.3 How These Findings Relate to Other Studies............................................................ 143 12.4 Difficulties Encountered During this Study................................................................. 144 12.5 Strengths and Weaknesses of this Study .................................................................. 145 12.6 Relevance of Study Findings to Clinical Practice and Future Directions for this Work ................................................................................................................... 145
Chapter 13 Discussion for Electrographic Seizure Activity Related to Cerebral Abnormality-Related Outcomes in Preterm Infants ........................................................ 147
13.1 Summary ...................................................................................................................148 13.2 Key Findings from this Study..................................................................................... 148 13.3 Electrographic Seizures in Preterm Infants ............................................................... 148 13.4 What is Already Known About Seizures in Preterm Infants and the aEEG ............... 149 13.5 Seizures and Autonomic Changes ............................................................................ 149 13.6 Seizure Morphology in Preterm Infants ..................................................................... 150 13.7 Weaknesses and Strengths of this Study .................................................................. 151 13.8 Conclusion................................................................................................................. 152 13.9 Further Work in this Area........................................................................................... 152
13

Chapter 14 Overall Conclusion and Implications of the Findings from this Thesis............. 154
14.1 Conclusion................................................................................................................. 155 14.2 Cerebral Abnormality................................................................................................. 155 14.3 Assessing Neurology and Monitoring Cerebral Function........................................... 156 14.4 Imaging and the Newborn Brain ................................................................................ 156 14.5 Clinical Investigations of the Preterm Brain ............................................................... 157 14.6 Clinical Investigation of the Term-Born Infant Brain .................................................. 158 14.7 Amplitude-Integrated EEG......................................................................................... 159 14.8 aEEG Background in the Term Newborn Infant and Findings from this Thesis......... 160 14.9 aEEG Background and Term Infants; Future Work in this Area ................................ 161 14.10 The Accuracy of the aEEG Monitor for Seizure Detection......................................... 162 14.11 aEEG Monitors and Seizure Detection; Future Work ............................................... 163 14.12 aEEG and the Preterm Infant .................................................................................... 164 14.13 aEEG Monitoring and the Preterm Infant; Future Work............................................. 166 14.14 Electrographic Seizures on aEEG Monitoring in Preterm Infants .............................. 166 14.15 Future Work in Electrographic Seizures in Preterm Infants ...................................... 167 14.16 The Present Thesis, its Limitations and My Contribution and Involvement in the Work ..........................................................................................................................168 14.17 The Implications of the Findings from this Thesis...................................................... 170
Bibliography ............................................................................................................................... 172 Appendices and Supplementary Material ................................................................................ 191 Appendix 1 Function of the BrainZ BRM2 and BRM3 Monitors.................................................... 192 Appendix 2 Populations Studied in the Thesis ............................................................................. 193 Supplementary Material List of Publications Derived from this Work List of Publications Related to this Work Invited Speaker at International Meetings in Relation to this Work List of Abstracts Presented at Meetings from this Work Study Consent Form Parent Information Sheet Publications Derived from this Work
14

FIGURES AND ILLUSTRATIONS CONTENT Figure ..................................................................................................................................….Page Figure 2.1 Decreasing IBI with increasing gestation in extremely preterm infants ....................... 26
Figure 2.2 Schema showing how the aEEG trace is obtained from the raw EEG signal.............. 33
Figure 2.3 Showing the placement of gel electrodes in the C3, P3, C4, P4 positions (left)
(when two channels are used) during continuous monitoring of a newborn infant. Ongoing digital aEEG monitoring produces minimal disturbance in the neonate (right) .... 34
Figure 3.1 T2-weighted MR images of three infants with corresponding BRM2 traces underneath. Left - an infant with MRAS 4 with a corresponding normal aEEG trace, centre – an infant with MRAS 9 with aEEG showing a discontinuous (moderately abnormal) trace with a seizure on the raw EEG and right an infant with MRAS 15 with a severely abnormal trace ................................................................................................. 56
Figure 4.1. Scatter plot of MRAS against minimum amplitude for left hemisphere for all patients with a linear regression line.................................................................................. 63
Figure 4.2. aEEG background pattern related to MRAS (left) ...................................................... 65
Figure 4.3 Age at EEG monitoring related to minimum amplitude (μV – left) and MRAS (left)..... 66
Figure 4.4 Minimum amplitudes (left) related to Sarnat stage for infants with HIE....................... 68
Figure 4.5 Severity of encephalopathy (Sarnat stage) related to severity of abnormality on brain MRI (MRAS – left hemisphere) for infants with HIE.................................................. 69
Figure 6.1 ccEEG (left) and bedside monitor (right) images of slow sharp wave seizure predominantly in the left occipital area (arrow) not clearly detected by the bedside monitor (Patient D) ............................................................................................................ 86
Figure 6.2 Examples of false positives on the bedside monitor (left images) as seen on ccEEG (arrows - right images) related to electrode artefact .............................................. 86
Figure 6.3 Duration of seizures on the raw trace of the bedside EEG monitor as compared to the duration on ccEEG ...................................................................................................... 89
Figure 8.1 The first aEEG measure for infants with Normal outcomes correlated to gestational age .................................................................................................................. 106
Figure 8.2 Repeated aEEG measures related to age in hours in first week of life for infants
with normal outcomes........................................................................................................ 106
15

Figure 8.3 aEEG traces from patient Q recorded at 25, 29 and 30 weeks left to right. Some variability appears at 29 weeks (centre) but is lost at 30 weeks when the infant develops NEC ...................................................................................................................109
Figure 8.4a aEEG patterns from infant M born at 24 weeks gestation, carried out at 24, 27 and 41 weeks from left to right. At 24 weeks there is a lack of variability of lower margin. At 27 weeks there is greater variability of the trace and at term a mature pattern is observed............................................................................................................110
Figure 8.4b aEEG pattern of a 27 week gestation infant delivered by emergency Caesarian section for maternal eclamptic seizure born with Apgars of 2 and 6 at 1 and 5 minutes. She was ventilated for two hours and required CPAP for 6 days. She had no IVH and had a normal MRI. Her first aEEG at 35 hours of age showed regular variability (left) and her aEEG at 29 weeks, 6 days shows variability and changes in keeping with sleep-state changes ................................................................................................... 111 Figure 8.5 aEEG traces from patients C, D, O and P showing deterioration (arrow) in aEEG
background trace with severe IVH..................................................................................... 112
Figure 9.1 Electrographic seizures as seen in patients B (panel A) and D (panel B) ................... 117 Figure 9.2 Low frequency seizure activity captured on conventional EEG (left), predominantly
at the central channels for patient E. The aEEG monitoring (right) shows a severely depressed background with frequent seizures on the aEEG (below) as well as the raw EEG (above).The gap in the aEEG recording represents application of conventional EEG. ................................................................................................................................. 117
Figure 9.3 Left panels represent infant E and right panels represent infant I. Lower parts of panels A and B represent the left and right hemisphere aEEG. The arrows on the aEEG correspond to the raw EEG signals above. The raw EEG signal. Panel A shows low frequency sharp wave seizure from both hemispheres. Panel B shows low frequency sharp wave seizure from the left hemisphere (upper trace). Panels C and D show the aEEG trace (upper segment) with corresponding changes in heart (centre segment) and respiratory (lower segment) rate. Panel C shows a rise in heart rate (HR) and a decrease in respiratory rate (RR) corresponding to seizures on the aEEG. Panel D shows changes in heart rate corresponding to seizures on aEEG. Panels E and F represent the relationship between aEEG (green) with HR (red) and RR (blue) for the first five consecutive seizures for infants E (panel E) and infant I (panel F). Panel F shows that patient I has drops prior to the rise in HR with no clear relationship between aEEG and RR .....................................................................................................123
16

TABLES CONTENT Table.......................................................................................................................................Page Table 3.1 Qualitative scores of MR-related cerebral abnormality................................................. 55
Table 4.1 Characteristics of the 86 infants studied....................................................................... 61
Table 4.2 Characteristics of 40 infants diagnosed with HIE ......................................................... 62
Table 4.3 Analysis of bedside EEG amplitude (μV) results with respect to MRAS....................... 63
Table 4.4a and b. Diagnostic accuracy of differing minimal amplitude cut-offs in left
hemisphere for more severe cerebral abnormality (MRAS ≥8) for infants with HIE........... 72
Table 6.1 Patient characteristics .................................................................................................. 81
Table 6.2 Characteristics of detected and missed electrical seizures .......................................... 83
Table 6.3 The Sensitivity, Specificity and Predictive Value of Bedside Monitoring with Respect to ccEEG ............................................................................................................. 84
Table 6.4 Clinical course of infants in relation to EEG monitoring................................................ 87
Table 8.1 Characteristics of infants who underwent aEEG monitoring in the first week of life ..... 102
Table 8.2 Characteristics of the 17 Infants with abnormal outcomes ........................................... 104
Table 8.3 Infants with abnormal cerebral injury-related outcomes compared with those without ............................................................................................................................... 105
Table 8.4 Trends in aEEG measures for infants with normal outcomes in the first week of life as well as through the neonatal period .............................................................................. 106
Table 8.5 A comparison of trends in repeated aEEG measures between infants with abnormal (n=17) and normal (n=34) outcomes ................................................................. 108
Table 8.6 Characteristics of infants who suffered postnatal grade 3 or 4 IVH.............................. 113
Table 9.1 Characteristics of preterm infants with seizures compared to those without ................ 119
Table 9.2 Characteristics of seizures in the preterm infants......................................................... 120
Table 9.3 Clinical characteristics of infants with seizures............................................................. 121 Table 11.1 Review of studies that compared the use of bedside monitoring with conventional
EEG for seizure detection in newborn infants.................................................................... 137
17

“…Beware of its Unintended Consequences…”
John M. Freeman, MD. Pediatrics 2007;119(3):615-7.
18

THESIS
19

CHAPTER ONE
Introduction; Aim and Hypotheses
20

1.1 Introduction and Aim
The amplitude-integrated EEG (aEEG) pattern obtained within the first six hours of life from term-
born infants who have suffered hypoxia-ischaemia has been shown to be useful for predicting
neurodevelopmental outcome at two years. Hence it may be useful for early identification of infants
at risk of neurological disability and selecting infants for neuroprotective interventions. Background
abnormalities detected in term infants on the aEEG may reflect severity of encephalopathy and in
turn the extent of brain injury in this group of infants. The aim of this thesis is to prove the
hypothesis that the aEEG assists in detecting cerebral dysfunction in the newborn.
Let us consider three applications of the aEEG in the newborn. Firstly, the clinical use of the aEEG
background pattern in term infants to predict neurodevelopmental outcomes has increased over the
last 20 years, more so since it has been used in selecting infants for trials of therapeutic
hypothermia. Secondly, aEEG monitors are commonly used to monitor electrographic seizures in
at-risk infants, particularly in centres with limited availability of conventional EEG. However it’s
efficacy for this purpose is not clear. Thirdly, its clinical application and use in preterm infants
remains to be defined. In attempting to prove our central hypothesis that the aEEG assists in
detecting cerebral dysfunction in the newborn, the following hypotheses will be tested:
1.2 Hypotheses
i. In the term-born infant with encephalopathy and/or seizures, the aEEG pattern and 2-
channel EEG measures of amplitude detects cerebral abnormality as defined by qualitative
MR abnormality scores on T1 and T2-weighted MR images.
ii. In the preterm infant, the variability of the aEEG background pattern, the presence of
electrographic seizures and quantifiable aEEG amplitude measures reflect cerebral
21

iii. The digital bedside aEEG monitor is sensitive and accurate for electrical seizure detection
when compared to simultaneous continuous conventional EEG.
22

CHAPTER TWO
Literature Review and Scope of Thesis
23

2.1 Summary
In this chapter, the basic principles of EEG and aEEG will be described, with their use in term and
preterm infants. The use of aEEG for electrographic seizure detection will also be summarized.
Finally cerebral abnormality, the term used broadly in the context of this thesis, as applied to
preterm and term infants in terms of neuropathology, imaging and neurodevelopmental outcomes
will be reviewed.
2.2 Principles of Electro-encephalography (EEG)
2.2.1 Historical Background
In the 1870s Richard Caton, a physiologist in Liverpool, discovered that the animal brain has
spontaneous electrical activity (1). Hans Berger obtained EEG recordings from the scalp as well as
from the surface of the brain via scalp defects of human subjects in the 1920s (2). Initially using just
two large silver foil electrodes, over the frontal and occipital areas (3), Berger was able to
characterize a number of EEG features; (i) beta and alpha waves arising from the cortex, (ii) the
disappearance of alpha waves and appearance of beta waves on eye opening, (iii) the presence of
EEG activity in newborns, children and the elderly, (iv) the iso-electric EEG seen during cerebral
depression, (v) the EEG in epilepsy, (vi) EEG changes with intracranial haemorrhage and (vii) the
effect of narcotics on the EEG (4).
2.2.2 Basic Principles of EEG
EEG activity detected at the scalp is the result of post-synaptic potentials from cortical pyramidal
cells closest to the electrode. These cells receive input from cells in other regions of the brain with
additional excitatory and inhibitory modification from glial cells (5). Each EEG channel represents
the voltage potential difference between adjacent electrodes as recorded at the scalp. The voltage
24

fluctuation (y-axis) in relation to time (x-axis) have been depicted as EEG waveforms. Conventional
EEG commonly uses the 10-20 system of electrode placement on the scalp.
2.2.3 The Origins of EEG Waveforms
The alpha rhythm (8-13Hz) is thought to be of cortical origin with possible thalamic pacemaker cell
input (6). These waves are best seen in the adult EEG acquired at the occipital area, with eyes
closed, under conditions of physical relaxation and mental inactivity. Beta activity (>13Hz) is
encountered most prominently at the frontal and central regions of most adults. Berger recognized
that these waves occur in relation to mental activity (6). However their origins at a cellular level are
not well understood. Delta activity associated with deep sleep is thought to originate from the
thalamus as are sleep spindles. Sleep spindles are thought to be driven by repetitive burst
depolarisations from the reticular nuclei of the thalamus. Other important waveform types include
theta (3-6Hz) and delta (<3 Hz) waves.
2.3 Conventional EEG in the Newborn
2.3.1 EEG and Cerebral Maturation
The EEG pattern of the newborn infant predominantly reflects degree of cerebral maturation. An
important feature is discontinuity or trace discontinue whereby short bursts of electrical activity are
interspersed with longer periods of quiescence or low voltage activity (7). “Continuity” of EEG
activity has been measured in terms of the duration of bursts, the duration of periods between
bursts as well as the voltage amplitude of the bursts in preterm infants (8).
25

2.3.2 The Interburst Interval (IBI)
The inter-burst interval is a measure of the duration of the quiescent periods between bursts.
Measurements of the interburst interval depend upon the definitions used in terms of duration and
voltage threshold as well as methods used for measurement (8). In a small group of extremely
preterm infants divided into three groups of gestation (21-22, 23-24 and 25-26 weeks), Hayakawa et
al (9) found a significant decrease in IBI and increase in burst duration with increasing PCA (Figure
2.1). Connell et al (10) describe an increase in percentage continuity with increasing gestational age
from 26 weeks until term. With increasing gestation, there is increasing “continuity” in the EEG
background (7), with conversely decreasing inter-burst intervals (11).
Figure 2.1
Decreasing IBI with increasing gestation in extremely preterm infants. From Hayakawa, M et al. Arch. Dis. Child. Fetal Neonatal Ed. 2001;84:163-F167
26
2.3.3 Specific EEG Features Related to Maturation
EEG activity in the newborn consists of a combination of frequencies but high amplitude (50 to
250μV) rhythmic, low frequency (0.3 – 1.5 Hz) delta waves predominate (12). These large low
frequency, high amplitude waves often have higher frequency waves of 10-20 Hz superimposed
upon them and then have been described as delta bursts, delta brushes or delta-beta complexes.
These can be seen on the EEG of preterm infants as early as 24 weeks gestation. Similarly bursts
of high amplitude theta activity may also be seen in preterm infants before 28 weeks gestation (12).
2.3.4 Inter-Hemispheric EEG Synchrony
The discontinuous traces in infants under 28 weeks gestation demonstrate a high degree of
interhemispheric synchrony (13). In the following weeks, there is a decrease in synchronous
activity, thought to be in relation to growth and increasing complexity of the lobes. Synchronous
interhemispheric activity subsequently increases in late prematurity to term gestation. The high
degree of synchrony in extreme prematurity is not clearly understood. The increasing synchronous
EEG activity with approach to near-term gestation may be related to increasing myelination of the
white matter.
2.3.5 Sleep State Changes
The normal EEG of the full term infant comprises of an elaborate pattern of sleep state changes
(12). This has conveniently been simplified into quiet (non-REM) sleep, active (REM) sleep and
awake. In order to differentiate between the sleep states, other information including EMG, eye
movements, respiration, body movements and ECG need to be obtained. Sleep state differentiation
begins at 28 to 30 weeks gestation. By 32 to 34 weeks this is more established. By 34 to 36 weeks,
clear distinction between REM and non-REM sleep can be made.
27
2.3.6 Specific EEG Abnormalities, Periventricular Leukomalacia (PVL) and Neurologic Outcome in
Preterm Infants
EEG obtained from preterm infants is characterized by the appearance of specific features at
specific gestations and locations and act as EEG developmental landmarks (8). However
persistence of these features beyond the specified period or at unusual locations may be abnormal.
Likewise, the presence of other features may be indicative of specific pathology. The presence of
positive rolandic sharp wave activity has been associated with periventricular leukomalacia (PVL)
(14) and adverse neurological outcomes in premature infants (15), with the EEG findings often
preceding the cranial US appearance of PVL (16). The presence of frontal and occipital sharp
transients may also be associated with PVL in preterm infants(17).
Using features including prolonged inter-burst interval and voltage attenuation Maruyama et al (18)
graded acute stage abnormalities (ASA) in the first week of life in a cohort of 295 infants born
between 27 and 32 weeks gestation, and related them to the presence and severity of cerebral
palsy (CP). Forty-six infants in their cohort suffered CP at 18 months. Most infants had spastic
diplegia CP related to PVL. The strongest correlation between maximum grade of ASA and severity
of cerebral palsy occurred on EEGs recorded on the second and third days of life. The same group
of workers also reported that chronic stage abnormalities in EEGs of preterm infants who have
gone on to develop cystic as well as non-cystic PVL were commonest and most severe between
days 5 and 14 and resolved within one to two months in all infants (19).
28
2.3.7 EEG, Neonatal Encephalopathy and Outcome in the Term-Born Infant
It has been recognized that EEG activity is depressed in term infants who suffer encephalopathy
due to hypoxia-ischaemia. In a study of term-born infants who had suffered neonatal
encephalopathy, Sarnat and Sarnat (20) observed three stages of encephalopathy which were
related to neurological outcomes in later infancy. Stage 1 was characterized by hyperalertness,
uninhibited Moro and stretch reflexes, increased sympathetic effects and a normal outcome. This
was accompanied by a normal EEG. Infants who entered stage two were lethargic or obtunded, had
overactive stretch reflexes and increased parasympathetic activity. The EEG activity in the early
period of stage two was characterized by voltage depression in the low frequency (delta and low
theta) range with a paucity of the higher frequency (alpha and upper theta) activity. A “periodic”
pattern was present in established stage 2 consisting of high voltage polymorphic slow and sharp
wave activity lasting one to three seconds, alternating with low amplitude delta and theta activity
lasting three to six seconds. The third stage of encephalopathy was characterized by a further
depression in level of consciousness to stupor, with flaccid tone, absent stretch and Moro
responses. The EEG showed increased inter-burst interval of 6 to 12 seconds in the early part of
stage 3. With progression of stage 3, there was a regression of the EEG pattern to isopotential.
Infants who did not enter stage 3 and who had stage 2 encephalopathy for less than five days had a
“normal” outcome (20). Persistence of stage 2 for more than seven days or failure of the EEG to
revert to normal was associated with neurological impairment or death. They were able to show that
these observed stages of encephalopathy paralleled worsening EEG background patterns and also
related to outcome in early infancy.
29
Holmes et al (21) demonstrated that conventional EEG background activity in 38 term newborn
infants who had suffered “asphyxia” was highly correlated with neurological and developmental
outcome at 2 years. They showed that infants with normal EEG and maturational delay were more
likely to have normal outcomes and infants who had low voltage, electrocerebral inactivity and burst
suppression backgrounds were highly predictive of abnormal outcomes. Similar findings have been
described by other groups (12). In a recent study, Murray et al (22) looked at the predictive value of
early EEG at 6, 12, 24 and 48 hours of life in term infants with HIE. Their data suggest that best
predictive value was at six hours of life; for many infants the EEG shows improvement by 48 hours.
In a group of term infants who showed excessive EEG discontinuity Menache et al (23) showed that
those who had IBIs greater than 30s were more likely to have adverse neurologic outcomes. In a
cohort of term infants with neonatal encephalopathy who had EEG and MR imaging, Biagioni et al
(24) were able to show that infants with normal MR imaging had normal EEG backgrounds and
normal outcomes, whereas infants with severely abnormal spectrum of MR abnormalities, had
abnormal EEG backgrounds and worse outcomes. In a more recent study, Leijser et al (25) showed
that the predictive value of early EEG in a small group of infants was enhance by the addition of
neuroimaging findings, particularly MRI.
2.4 Amplitude-Integrated EEG
2.4.1 Historical Perspectives of Amplitude-Integrated EEG
The aEEG was devised by Douglas Maynard and its clinical potential was tested by Pamela Prior in
the 1960s in adult patients requiring intensive care and undergoing cardiac by-pass at the London
Hospital (26, 27). A “cerebral function monitor” (CFM) was described that could be useful for
continuous monitoring of cerebral activity when the cerebral circulation was “vulnerable” such as
30

during cardiac surgery and to monitor recovery or deterioration in patients with brain injury or coma
at a time when improved intensive care management allowed close monitoring of respiratory rate,
heart rate, oxygen saturations and blood pressure but as yet continuous cerebral function
monitoring in a practical way was not possible.
2.4.2 Monitoring Cerebral Function
In their first monograph on the use of the CFM, Prior and Maynard (28) set out some simple
requirements for any practical cerebral monitoring system. It should be simple to use, reliable, non-
invasive, have a wide applicability, inexpensive and importantly give immediate information about
cerebral function. The single channel was deemed acceptable for monitoring “diffuse” cerebral
function and the device was more concerned with signal voltage and variability rather than
frequency of cerebral electrical activity.
The aEEG was devised to complement conventional EEG, and not to replace it (27). For continuous
monitoring, conventional analog EEG was regarded as costly. With its faster recording speed at
1080 cm/hour, it produced a large output of recorded paper (300 – 600 metres during a single
cardiac operation!) and also required greater expertise for interpretation.
2.5 General Principles of aEEG
2.5.1 The Number and Position of Electrodes
The CFM trace resulted from the voltage potential difference between two parietal electrodes (P3-
P4 in the 10-20 system) (26). It was felt that recordings from this region would
31
1) be least affected by artefacts from muscle (facial and jaw movements) activity, eye
movement and sweating. Also it was felt that these would least interfere with patient care and
be of greatest comfort to the adult patient,
2) provide maximum amplitude of cerebral activity from awake, sleeping, anaesthetized and
comatose patients and
3) overlie the site of greatest vulnerability to ischemia as it was a watershed region for arterial
blood supplies between anterior, middle and posterior cerebral artery territories.
2.5.2 The Frequency Filter
Frequencies less than 2 Hz were cut out in order to reject artefact such as that caused by low
frequency fluctuations due to sweating (28). The signal was then amplified and filtered so that very
high and low frequencies were attenuated. Frequencies greater than 15 Hz were rejected with a
high degree of rejection of frequencies as high as 50Hz in order to minimize interference from
electrical mains.
2.5.3 Amplitude Range and Output
The amplitude was semi-log compressed so that a high “output” was produced for signals in the
range of one to 10 μV in order to focus on depressed cerebral activity, but the system should also
be able to detect high levels of activity such as during an epileptiform seizure as well as normal
levels of activity. Hence, the output was designed to be linear for signals up to 6μV, semi-
logarithmic between 8 and 20 μV and logarithmic above 25μV. This would also avoid the need for
gain control and range switching. Since this original system, various commercial devices providing a
trace that either reproduces the aEEG in a similar fashion, if not exactly the same, are available.
Typically, the y-axis scale may vary slightly (29).
32
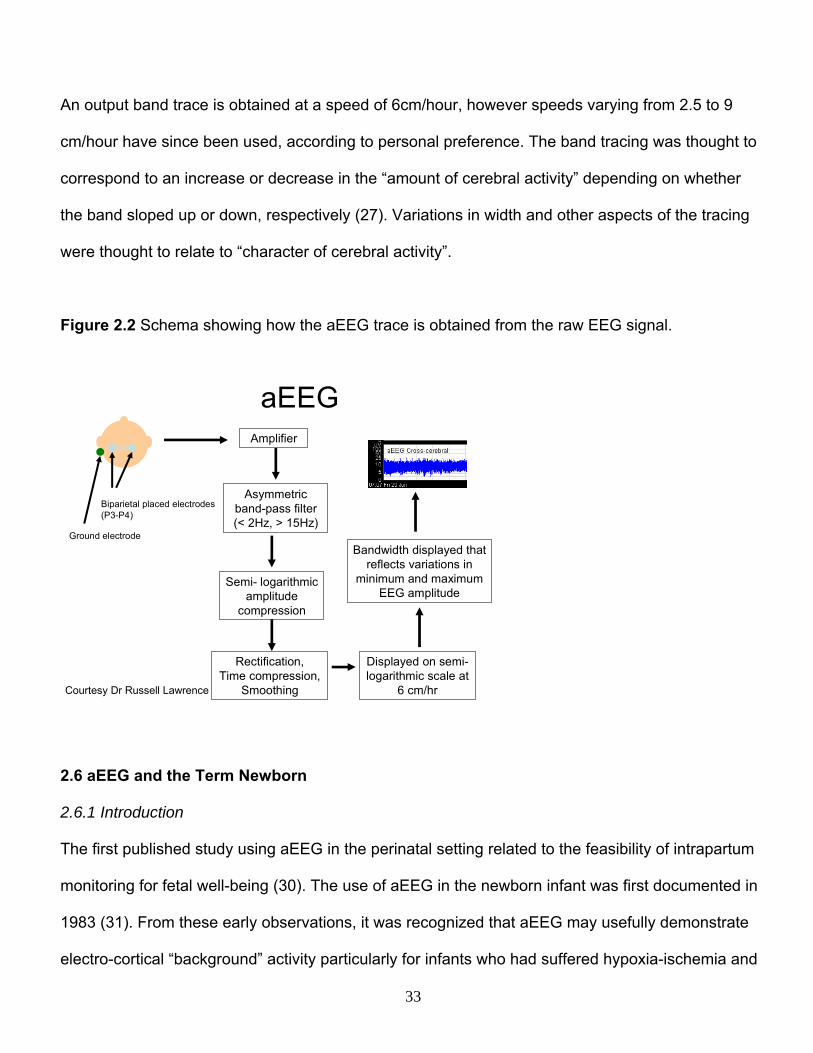
An output band trace is obtained at a speed of 6cm/hour, however speeds varying from 2.5 to 9
cm/hour have since been used, according to personal preference. The band tracing was thought to
correspond to an increase or decrease in the “amount of cerebral activity” depending on whether
the band sloped up or down, respectively (27). Variations in width and other aspects of the tracing
were thought to relate to “character of cerebral activity”.
Figure 2.2 Schema showing how the aEEG trace is obtained from the raw EEG signal.
aEEG
Biparietal placed electrodes (P3-P4)
Ground electrode
Amplifier
Asymmetric band-pass filter (< 2Hz, > 15Hz)
Semi- logarithmic amplitude
compression
Rectification, Time compression,
Smoothing
Displayed on semi-logarithmic scale at
6 cm/hr
Bandwidth displayed that reflects variations in
minimum and maximum EEG amplitude
Courtesy Dr Russell Lawrence
2.6 aEEG and the Term Newborn
2.6.1 Introduction
The first published study using aEEG in the perinatal setting related to the feasibility of intrapartum
monitoring for fetal well-being (30). The use of aEEG in the newborn infant was first documented in
1983 (31). From these early observations, it was recognized that aEEG may usefully demonstrate
electro-cortical “background” activity particularly for infants who had suffered hypoxia-ischemia and
33

also for electrical seizure activity (32). Greisen also noted that, “lack of knowledge of when and how
to intervene, rather than technical problems, puts a limit to the usefulness” of the aEEG.
Figure 2.3 Showing the placement of gel electrodes in the C3, P3, C4, P4 positions (left) (when two channels are used) during continuous monitoring of a newborn infant. Ongoing digital aEEG monitoring produces minimal disturbance in the neonate (right). (Photographs with permission).
2.6.2 aEEG and Hypoxic Ischemic Encephalopathy
Bjerre et al (31) carried out a study on the potential usefulness of the aEEG in the asphyxiated
newborn infant. They were able to show a good concordance in the aEEG background pattern with
conventional EEG background in 35 infants, the majority of the aEEG recordings having been
carried out in close temporal proximity to the conventional EEG.
Hellstrom-Westas et al (33) found that the aEEG background obtained from term asphyxiated
infants within the first six hours of life was predictive of neurological outcome at follow-up, when it
was classified into normal and abnormal (burst suppression (BS), continuous extremely low voltage
(CLV) and flat trace (FT)) patterns. Toet et al (34) clarified the background patterns obtained from
this group of infants into continuous normal voltage (CNV), discontinuous normal voltage (DNV),
34

BS, CLV and FT. They found that the sensitivity and positive predictive value (PPV) increased from
85% and 78% respectively at three hours to 91% and 86% respectively at six hours.
Using a semi-quantitative approach, Al Naqeeb et al (35) classified the background patterns by
measuring the level of the lower and upper margins, into normal (lower margin > 5mcV, upper
margin > 10mcV), moderately abnormal (lower margin < 5mcV, upper margin > 10mcV) and
severely abnormal (lower margin < 5mcV, upper margin < 10mcV). Using this system, they obtained
similar values for sensitivity, specificity, PPV and negative predictive value. They extended the
predictive value of the aEEG background to infants with encephalopathy due to causes other than
hypoxia-ischaemia and also to infants monitored outside the first 24 hours of life. The high
predictive value of aEEG in the term-born infant has been born out by a number of studies (36-38).
2.6.3 Evolution of aEEG Pattern in the First 72 Hours and Relationship to Outcome
Ter Horst et al (37) demonstrated that in term newborn infants who had continuous aEEG
monitoring in the first 72 hours of life, the more rapidly the aEEG pattern returned to normal, the
more likely the infant had a better outcome at two years of age. The positive likelihood ratio (LR) of
the abnormal patterns to be predictive of abnormal outcome at two years was greatest between 24
and 36 hours (+LR 19 [95%CI 2.8 – 128]).
In a large cohort of term infants with neonatal encephalopathy, Van Rooij et al (38) demonstrated
that some infants with severely abnormal traces had a normal outcome at two years if they showed
improvement in the aEEG background in the first 24 hours of life. These two studies (37, 38)
showed that outcome for infants depended not only the aEEG background pattern in the first six
hours of life, but also on how quickly the pattern improved during the first 72 hours of life. There has
35
been much interest in the potential value of a tool that can predict outcomes in at-risk newborn
infants in the first few hours of life as neuroprotective interventions are being investigated (39).
2.7 aEEG and Electroencephalographic Seizures
Seizure activity in the newborn is also an important manifestation of cerebral abnormality or injury
(40). It is difficult to obtain accurate figures on the incidence of seizures in the newborn. There are
no data available on the true incidence of electrographic seizures in the newborn. Epidemiologic
studies estimate the incidence of clinical seizures in the newborn at between 1-3 per 1000 live
births (40-43) with a greater incidence in preterm and low birth weight infants. In an epidemiologic
study, Glass et al (42) found the incidence of seizures in infants born at 36 weeks or greater to be
0.95 per 1000 live births from 1998 to 2000 over a Californian cohort of 2.3 million children. There
was a higher risk of seizures in infants born to nulliparous women over 40 years of age, diabetic
women, infants born at a gestation of 42 weeks and above and infants born to women with
intrapartum fever or infection.
The overall electro-cortical activity is seen to increase during an electrical seizure, as observed with
rhythmic and repetitive spike and wave activity on EEG traces. This in turn may bring about a
distinct rise in the lower and upper aEEG band margins, as was observed by Prior et al (44). This
was later confirmed by other workers (45, 46). Hence the aEEG is sometimes used by clinicians to
monitor for electrographic seizure activity in at-risk newborns. However until recently there have
been limited data on its efficacy and accuracy for this purpose.
Many studies have used the aEEG tracing without the benefit of the raw EEG obtained on modern
digital systems for testing the accuracy of the aEEG monitor for seizure detection. Hellstrom-
36

Westas (46) compared simultaneously recorded analog aEEG traces with multi-channel EEG tape
recordings from sick newborns. She showed that the aEEG missed short electrical seizures up to
half a minute long. Toet et al (47) demonstrated high inter-observer agreement, sensitivity,
specificity and predictive values for aEEG when it was compared to conventional EEG recordings of
30 minutes duration. Rennie et al (48) found poor inter-observer agreement and sensitivity for
seizure detection for selected aEEG traces in comparison with EEG-video. However, they used
variable aEEG speeds and inexperienced aEEG raters who had received relatively little (three to
five hours) training.
Also when just one or two channels of EEG are used, focal seizures originating at a site distant to
the electrodes may not be detected. Of 851 neonatal seizures captured on conventional EEG on
125 EEGs from infants who were 34 to 50 weeks post-conceptional age, Shellhaas et al (49)
showed that 78% appeared in the “cross-cerebral” C3-C4 channel. Using the aEEG obtained from a
single channel, neonatologists with varying expertise in aEEG use were able to correctly identify
only 12 - 38% of individual seizures from 22 – 57% of the 125 records.
In a study comparing multichannel aEEG to multichannel conventional EEG, 121 seizures in 12
infants with HIE were reviewed (50). Sixty-eight percent of the seizures occured over the centro-
temporal regions and although the overall seizure detection rate using aEEG was low, all patients
with seizures of one pattern were identified using multichannel aEEG whereas all but one patient
was identified using a single channel of aEEG across the C3-C4 cross-cerebral channel.
37
2.8 aEEG in Preterm Infants
2.8.1 aEEG Pattern with Increasing Gestation
Unlike aEEG patterns in term infants, aEEG patterns in preterm infants are less well characterized.
Like conventional EEG, the aEEG pattern is in a continuous state of evolution reflecting increasing
EEG signal continuity with advancing post-conceptional age. Thornberg and Thiringer (51)
measured the lower and upper margin levels in microvolts of a minimum epoch of 10 minutes of the
broadest as well as the narrowest amplitude band in infants born at 26 to 37 weeks gestation
recorded at post-conceptional ages of 30 weeks onwards. They documented a rise in the lower as
well as the upper aEEG margin with increasing gestation of the broad as well as the narrow
sections of tracing.
Olischar et al (52) studied infants who had had no IVH, PVL or evidence of birth asphyxia from a
cohort of infants born at <30 weeks gestation. They classified the aEEGs into periods of (i)
continuous, (ii) high voltage discontinuous and (iii) low voltage discontinuous patterns. They found
an overall increase in the continuous and high voltage discontinuous patterns with increasing
gestation. For infants born at all these gestational ages, they were also able to show that there was
an increase in continuity with chronological age (53). Other groups have demonstrated a similar
increase in electro-cortical activity with increasing gestation (54).
2.8.2 aEEG Pattern Changes in Relation to Cerebral Oxygenation and Perfusion Changes in the
Preterm Infant
As well as reflecting cerebral maturation, the aEEG pattern from the preterm infant may also be
affected by changes in cerebral oxygenation and perfusion. Hellstrom-Westas et al (55)
demonstrated a depression in the aEEG pattern that occurred with a significant transient drop in
38

mean arterial blood pressure in association with surfactant administration in preterm infants. In a
related study, Skov et al (56) demonstrated that, in association with the transient (~ 10 minutes)
depression in the aEEG pattern during surfactant administration, there was systemic hypoxia as
evidenced by a drop in oxygen saturations as well as a drop in systemic blood pressure. They
demonstrated a drop in cerebral oxyhaemoglobin concentration with no drop in total cerebral
haemoglobin concentration accompanying the systemic hypotension from which they deduced that
cerebral blood flow and volume were maintained and that the depression in the aEEG pattern was
related to hypoxia. They observed an improvement in cerebral oxygen in nearly all the patients in
the few minutes following the surfactant administration.
2.8.3 aEEG, Cerebral Injury and Neurodevelopmental Outcome in the Preterm Infant
With the continuously evolving EEG in the preterm infant, it has been difficult to classify the aEEG
patterns from this group into convenient categories in the way that had been carried out in term
infants with HIE. There is limited data in preterm infant relating the aEEG pattern to cerebral injury
and neurologic outcome. In a small preterm cohort study, Hellstrom-Westas et al (57) obtained
aEEGs from 31 preterm infants between 23 and 33 weeks gestation in the first week of life and
related them to later outcomes. All the infants were under one kilogram birth weight and twenty of
these (less than two-thirds) survived to two years. Of the 11 who had developed “continuous”
activity only one developed neurologic handicap at 2-years. A significantly larger proportion of
infants who developed cyclicity or variability of the trace which they described as “sleep-wake
cycling”, survived without neurologic handicap. Seventy-five percent (15/20) of infants with IVH had
seizures compared to none of the 11 who had no IVH. However they had used analog aEEG in the
absence of the raw EEG trace.
39

The same group also showed that preterm survivors of IVH grade 3 or 4 had more bursts (>10mcV)
in an hour epoch/24 hour period over the first four days, as compared to infants with same grade
IVH who died (58). The temporal relationship between evolution of IVH and aEEG recordings was
not examined in this retrospective study.
2.9 Encephalopathy in Term-Born Infants
Data on the incidence of neonatal encephalopathy in the term born infant is not easily available,
with varying definitions of encephalopathy and probably substantial under-reporting. Badawi et al
(59, 60) reported a prevalence of 3.8 per 1000 live births in Western Australia and Pierrat et al (61)
reported a prevalence of 1.6 per 1000 live births in a region of northern France of newborn infants
with moderate or severe encephalopathy. At least half the cases reported in the latter study were
thought to be related to primary hypoxia-ischemia.
2.10 Cerebral Injury in Term Infants with Hypoxic-Ischaemic Encephalopathy
There are several complimentary models of brain injury in the term-born infant who has suffered
hypoxia-ischaemia. Below are outlined some of these.
2.10.1 Mechanisms of Cerebral Injury
Glucose and oxygen are the principal substrates for oxidative energy metabolism in the perinatal
brain. In acute and severe hypoxia-ischaemia the supply of these substrates to the brain is
presumably interrupted leading to a depletion of high energy phosphates in the brain cells. This may
be thought of as a “primary” energy failure (62, 63). Phosphorus spectra on magnetic resonance
spectroscopy (MRS) are seen to “normalize” for a few hours after resuscitation. However over the
next 12 to 24 hours there is a gradual decline in the phosphocreatine/inorganic phosphate ratio. In
40

severely affected infants, the ATP signal is also seen to decrease. The cerebral energetics are most
deranged at between 48 and 72 hours of life and these derangements are associated with abnormal
outcomes in survivors (64). This more gradual depletion of mitochondrial oxidative phosphorylation
is regarded as secondary energy failure.
2.10.2 Complimentary Models of Cerebral Injury; Neurotoxic Cascade
Coupled with the energy failure is the biochemical neurotoxic cascade thought to bring about the
clinical picture of encephalopathy (65). There is dysfunction of the synaptic connections between
neurones with an extracellular accumulation of the excitatory neurotransmitter glutamate. Increased
activation of the NMDA receptors, an excitatory amino acid receptor is important in mediating the
brain injury. Calcium accumulation within mitochondria is thought to play an important role in this
neurotoxic cascade. Mitochondrial dysfunction secondary to calcium overload may lead to rapid cell
death by way of necrosis whereas increased nitric oxide synthase, nitric oxide and oxygen free
radicals mediate neuronal injury over a longer period of time either by way of necrosis or apoptosis.
2.10.3 Two Models of Cell Death; Necrosis and Apoptosis
Necrosis refers to cell death following cell swelling, cell membrane breakdown, cell rupture and
release of intracellular contents. Hence an inflammatory response is evoked and phagocytosis
occurs. This mode of cell death may typically occur early in mature cells in the nervous system after
a brief intense hypoxic-ischaemic insult leading to secondary energy failure (40). Apoptosis is a
more recently described mode of delayed cell death which is harder to detect, characterized by
condensation and margination of chromatin, cell shrinkage and the apparent lack of inflammation
(66). Apoptosis has been described in both the mature (67) and immature (68) rat brain following
hypoxia-ischaemia and may follow a prolonged, less intense insult.
41

2.10.4 Inflammation and Brain Injury
Hypoxia-ishcaemia elicits an acute inflammatory response in the newborn brain, associated with
increased expression of proinflammatory cytokines including chemokines (69, 70). Some studies
have shown a relationship between the presence of inflammatory markers in the newborn period
and later cerebral palsy in infants with neonatal encephalopathy (71, 72). Also there is evidence of
increased risk of CP in the presence of chorioamnionitis (73). However the exact relationship
between HIE, inflammation and adverse neurologic development remains to be clarified.
2.10.5 Patterns of Cerebral Injury in Experimental Models of Hypoxia-Ischaemia Related to Timing
and Severity of Insult
Experiments on primate models by Ronald Myers demonstrated that specific patterns of cerebral
injury were observed in relation to the severity and period of the asphyxial insult (74). Term monkey
fetuses had total asphyxia for up to 25 minutes by smothering the head with a saline filled sac and
clamping the umbilical cord at surgical delivery. These infants displayed cortical injury in the
paracentral areas, the thalami and brainstem structures. There appeared to be a specific pattern of
asphyxial injury and Myers attributed this to regions with a greater blood supply and metabolic rate
rendering them more vulnerable. Prolonged (up to several hours) partial asphyxia predisposed the
monkey to swelling of the hemisphere, which was not seen with total asphyxia. If the animal
survived the insult, later findings included sclerotic as well as atrophic changes of the white matter
as well as the cortex and basal ganglia. Myers also describes cerebral pathology findings in a term
monkey fetus inadvertently asphyxiated in-utero for 50 minutes which survived to 12 days age (75).
Injurious changes affected the paracentral regions of the cortex, underlying white matter and basal
ganglia.
42

From experiments such as these, it has been recognized that the pattern of cerebral injury may be
related to the timing and severity of insult to the brain. It was deduced that a severe acute hypoxic-
ischemic insult would have a great impact on regions with a high metabolic requirement, such as
the deep nuclear grey matter structures infants. With subacute, chronic or repetitive insults blood
may preferentially be diverted from watershed regions to regions with high metabolic demands such
as the deep nuclear grey matter. Hence these sort of insults would primarily bring about a diffuse
white matter abnormality.
2.10.6 Cerebral Injury as Seen on MR Imaging in Term Infant with HIE and
Neurodevelopmental Outcomes
MR images of the newborn brain have been acquired since the 1980s. Barkovich et al (76)
described findings on T1 and T2 weighted MR images acquired in the first ten days of life from 20
newborns with known intrapartum or postnatal asphyxial episodes. They noted that the majority of
infants in this small study had had predominantly deep nuclear grey matter abnormality on MR
imaging and that these infants had had an acute, severe asphyxial insult.
In another study Barkovich et al (77) described a system of classifying cerebral injury, as seen on
MR images of infants who had suffered HIE , into patterns of basal ganglia and thalamus
predominant (which in its most severe form includes the peri-rolandic cortex) or watershed
predominant which in its severe form includes cortex and adjacent white matter involvement. Using
this classification system, Miller et al (78) related MRI appearances from term-born infants with
suspected HIE acquired at a median six days of age to neurodevelopmental outcome at 30 months
of age. They found that infants who had the basal ganglia-predominant pattern had worse
neuromotor as well as cognitive outcomes.
43

Rutherford et al (79) reported that abnormal signal intensity in the poster limb of the internal capsule
in term infants with HIE were more likely to have abnormal neurodevelopmental outcomes.
2.11 Seizures and Cerebral Injury in the Term Infant
Seizures are a common and important manifestation of cerebral pathology in the newborn (80). The
impact of seizures on the newborn brain remains to be defined. In an immature rodent model,
seizures have been shown to exacerbate cerebral injury caused by hypoxia-ischemia (81). In the
asphyxiated human term born infant, Miller et al demonstrated that seizure severity was related to
lactate/choline ratios independent of potential confounders and hence may be independently
associated with cerebral injury (82). Preliminary data also suggests that there may be a relationship
between electrographic seizure activity in the newborn and later neurodevelopment (83). There is
limited data on the pathogenesis and impact of seizures in the preterm brain.
2.12 Incidence and Consequences of Preterm Birth
The proportion of live births of infants under 1500g has increased in the UK, USA as well as
Australia over the last three decades (40, 84-86). In the UK the percentage of live under 1500g
infants has increased from 0.84% in 1983 to 1.25% in 2002 (84). This rise in live births has been
paralleled by an increased survival making this an important group as far as health, education and
support service implications are concerned.
Not only are infants born preterm vulnerable to the cause of the premature birth, such as perinatal
infection, they are also predisposed to morbidities affecting multiple systems as well as the effect of
therapies whilst they undergo neonatal intensive care (87). Hence brain development (ex-utero) in
the premature infant differs in comparison to that in the “normal” development of the fetus in-utero
44

that gives rise to the uncomplicated term-born infant. Preterm infants are known to suffer adverse
long term neurodevelopmental outcomes. Perinatal factors associated with these adverse outcomes
include chorioamnionitis , sepsis (88), necrotizing enterocolitis (NEC) (89) and bronchopulmonary
dysplasia (90).
2.13 Cerebral Pathology in the Preterm Infant
2.13.1 Germinal Matrix-Intraventricular Haemorrhage
Ultrasound has been used since the seventies to visualize cerebral pathologies in the premature
newborn (91) commonly using the anterior fontanelle as a window. The importance of detecting
germinal matrix - intraventricular haemorrhage (GM-IVH) in the newborn period in order to
prognosticate neurodevelopmental outcome in preterm infant survivors was appreciated from an
early stage (92).
GM-IVH is the commonest cerebral abnormality apparent in the preterm infant during the first
fortnight of life (40). The incidence of GM-IVH is directly related to the degree of prematurity. Over
the last two decades, its incidence is thought to have decreased and up to 25% of infants under 1.5
kg will have GM-IVH.
The neuropathology of GM-IVH in the preterm infant is elegantly described by Volpe (40) using the
site of the origin of the bleed, the sub-ependymal germinal matrix, as the starting base. This region
represents the ventricular/subventricular zone, a highly cellular area with active cell proliferation,
and as such is highly vascular with a rich arterial blood supply feeding the capillary bed. Between
10 and 20 weeks gestation, this zone is an important source of neuronal precursors and during the
45

last trimester, a source of glial precursors that become oligodendroglia and astroglia. Through the
last trimester, the germinal matrix becomes much less prominent.
Bleeding from the germinal matrix, in many cases allows blood to enter the lateral ventricles and
throughout the ventricular system. The consequences of GM-IVH include destruction of the
germinal matrix, periventricular haemorrhagic infarction, posthaemorrhagic hydrocephalus and
death in the most severe cases. The destruction of the germinal matrix, being an important site of
neuronal and glial precursors, may be speculated to have substantial consequences on subsequent
brain development.
In up to 15% of cases, a large GM-IVH is accompanied by pathologic involvement of adjacent
periventricular brain parenchyma (40). This is significantly related to the degree of prematurity and
with low birth weight. Volpe (40) proposes that the GM-IVH leads to periventricular venous
congestion which in turn leads to periventricular ischaemia and then periventricular haemorrhagic
infarction as the pathogenetic mechanism rather than simply an extension of the GM-IVH into the
adjacent brain parenchyma.
2.13.2 Post-Haemorrhagic Hydrocephalus
Another serious consequence of GM-IVH is hydrocephalus and this is thought to be related to
impaired CSF absorption by organizing blood clot affecting the arachnoid granulations. The
likelihood of this occurring seems to be directly related to the size of the GM-IVH.
46
2.13.3 Long-term Neurologic Sequelae after GM-IVH
In the absence of associated periventricular haemorrhagic infarction, up to 50% of surviving preterm
infants with severe GM-IVH will be left with definite neurologic sequelae (40). In the presence of
periventricular haemorrhagic infarction, between 50 and 87% of surviving infants will have major
motor deficits (40, 93).
2.13.4 Periventricular Leukomalacia (PVL) and White Matter Injury
PVL describes softening and necrosis of white matter. Cystic PVL refers to lesions clearly visualized
by cranial ultrasound as well defined echolucencies, typically appearing between the first and third
weeks of life in preterm infants. These cysts may be preceded by echodensities. Indeed
periventricular echodensities observed during the first week of life may resolve or evolve into cystic
echolucencies on follow-up scans. The incidence of cystic PVL accounts for less than 5% in
preterm infants (40, 94). Over a period of one to three months, the echolucencies “disappear” with a
relative dilatation of the lateral ventricles.
Cystic PVL represents one part of the spectrum of white matter injury in preterm infants. This is
thought to result from softening and necrosis of white matter. More commonly noted in
neuropathology studies is a more diffuse non-cystic PVL representing microscopic necrosis, loss of
oligodendroglia and astroglial scarring on histology (40). This pattern of white matter injury has
been seen in 25 – 75% of post mortem cases, however the more diffuse and subtle nature of the
abnormality means that it is not detected as reliably on imaging in-vivo. Preliminary work using
diffusion-weighted imaging and apparent diffusion coefficient (ADC) measurements in preterm
infants at term-corrected shows increased ADC values in infants with overt white matter pathology
as well as infants with diffuse excessive high signal abnormality on T2 as compared to infants with
47

normal appearance of the white matter (95, 96). Volumetric studies using post MR-acquisition
processing show a reduction in volumes of various regions of the brain in preterm infants as well as
abnormal outcomes of various measures including neurodevelopment (97-100).
2.13.5 Pathogenesis and Neurodevelopmental Consequences of PVL
Multiple factors have been implicated in the pathogenesis of PVL including cerebral ischaemia,
impaired cerebrovascular autoregulation, infection and inflammation (80). These factors are thought
to affect the vulnerable myelin-forming preoligodendrocytes. As well as being susceptible to
ischemia, inflammation and infection, the preoligidendrocytes are susceptible to free radical attack
as well as excitotoxicity (101).
Important long term consequences of cystic PVL include spastic diplegia, other motor deficits,
impairment of cognition and vision as well as behavioural disturbances. The motor and visual
disturbances are thought to result from abnormalities in the descending motor fibres, optic
radiations and associated fibres. Although cystic PVL has primarily been described as a disease of
the deep white matter, MRI studies suggest that areas of cortical gray matter may be affected (102).
Accompanying derangement of the myelinated white matter is damage and loss of underlying
neurons and axons, hence infants with cystic PVL may also have related derangements in the
thalami, basal nuclei as well as the cerebral cortex (103) which may contribute to the non-motor
features such as impaired cognition.
2.13.6 Cerebral Injury on MR images in Preterm Infants and Neurodevelopmental Outcomes
In contrast to term infants who suffer acute hypoxia-ischemia where the commonest pattern of
cerebral injury, as seen on MR imaging is that to the basal ganglia and thalami (104), one of the
48

most important patterns of cerebral injury in preterm infants is that to the myelinating white matter
(101). Researchers have made comparisons of MR images from preterm infants at TEA to those
carried out in term-born infants at similar gestation and related findings on MR images to
neurodevelopmental outcomes. Miller et al (105) focused predominantly on T1-weighted MRI
studies from preterm infants. They equated T1-hyperintensities on cerebral MR images in the
absence of T2-hypointensities with foci of gliotic white matter injury. They considered the presence
of low intensity lesions on T1 weighted images as areas of cavitation. In their relatively small
number of infants, they found a relationship between ventricular dilatation and intraventricular
haemorrhage on MRI scans carried out prior to discharging the infant home, with adverse
neurodevelopment at 18 months. They also observed a trend for white matter injury related to
outcome.
In a large cohort preterm MRI study, Dyet et al (74) noted diffuse excessive high signal abnormality
(DEHSI), ventricular dilatation, punctate white matter lesions, ventricular dilatation, extracerebral
space widening, basal ganglia and thalamic abnormalities, haemorrhagic parenchymal infarcts, PVL
and germinal layer haemorrhages as abnormalities. They found that the presence of DEHSI or post-
hemorrhagic ventricular dilatation on MR scans at term correlated with poorer developmental
quotients at two years of age.
From an MRI cohort, Woodward et al (94) assessing signal abnormality, white matter volume, cystic
abnormality, ventricular dilatation and the corpus callosum as fields of white matter abnormality on
T1 and T2 – weighted images acquired at TEA in preterm infants found that moderate or severe
white matter abnormalities were predictive of cognitive, motor and neurosensory impairments as
well as cerebral palsy at two years.
49

2.14 Scope of Thesis
In order to test the hypothesis that the aEEG assists in detecting cerebral abnormality in the
newborn, three studies will be conducted:
1) aEEG and the term infant with seizures and/or encephalopathy related to MR imaging
findings: Term infants referred to a tertiary centre with encephalopathy and/or seizures who
have digital aEEG monitoring and MR imaging will be studied. The earliest two hour seizure-
free period of aEEG recording obtained from two channels (C3-P3, C4-P4) will be analyzed
for median values of minimum, mean and maximum amplitude. The MR images will be
qualitatively scored for cerebral abnormality including abnormalities of cortex, white matter,
deep nuclear grey matter and the posterior limbs of the internal capsule and a composite MR
abnormality score (MRAS) will be obtained. The amplitudes will be related to the MRAS.
2) aEEG monitoring in the preterm infant in the first week of life, related to cerebral abnormality:
Infants under 30 weeks gestation will have aEEG monitoring for 72 hours commencing in the
first 72 hours of life. These infants will also have MR-imaging at term equivalent age (TEA).
As part of their routine care, they will also have serial cranial ultrasounds. The aEEG will be
related to cerebral abnormalities as defined by grade 3 or 4 IVH and/or moderate or severe
white matter injury on MRI and/or death during their stay on the neonatal unit.
3) The accuracy of aEEG monitoring for electrical seizure detection in the newborn: Infants
referred to tertiary centre with seizures will have continuous conventional EEG
simultaneously with bedside aEEG monitoring with shared electrodes.
50

CHAPTER THREE
Amplitude-Integrated EEG Measures and Patterns in Term Infants
with Seizures and/or Encephalopathy Related to Cerebral
Abnormalities on MRI; Methods.
51
3.1 Summary
This chapter presents the first part of the study. The aim is to prove the hypothesis that aEEG
patterns and quantified aEEG measures in term infants with seizures and/or encephalopathy assists
in detecting cerebral abnormality as seen on MR imaging. Term-born infants who presented with a
diagnosis of seizures and/or encephalopathy who had aEEG monitoring and MR imaging were
studied retrospectively. This chapter describes the methods.
3.2 Patient Population
Infants admitted to the tertiary neonatal intensive care units at the Royal Children’s and Royal
Women’s Hospitals, Melbourne, Australia with newborn encephalopathy and/or seizures between
November 2001 and November 2004 who had aEEG monitoring as part of their clinical care were
studied. All infants who underwent a period of at least 4 hours of continuous bedside aEEG
monitoring with the two channel EEG with aEEG bedside monitor, the BRM2 (BrainZ Instruments,
Auckland, New Zealand) and had brain MR imaging were included.
3.3 Diagnoses
Diagnoses were made on clinical grounds by the attending physician. The diagnosis of hypoxic
ischemic encephalopathy (HIE) was based upon history and examination findings, including
features of perinatal distress such as diminished fetal movements, cardiotocograph abnormalities,
fetal acidosis, meconium staining of liquor, low Apgar scores and the need for neonatal
resuscitation.
The stage of encephalopathy was graded for all infants with hypoxic-ischemic encephalopathy
using a modified Sarnat clinical classification (20) with maximum score within 72 hours of admission
52
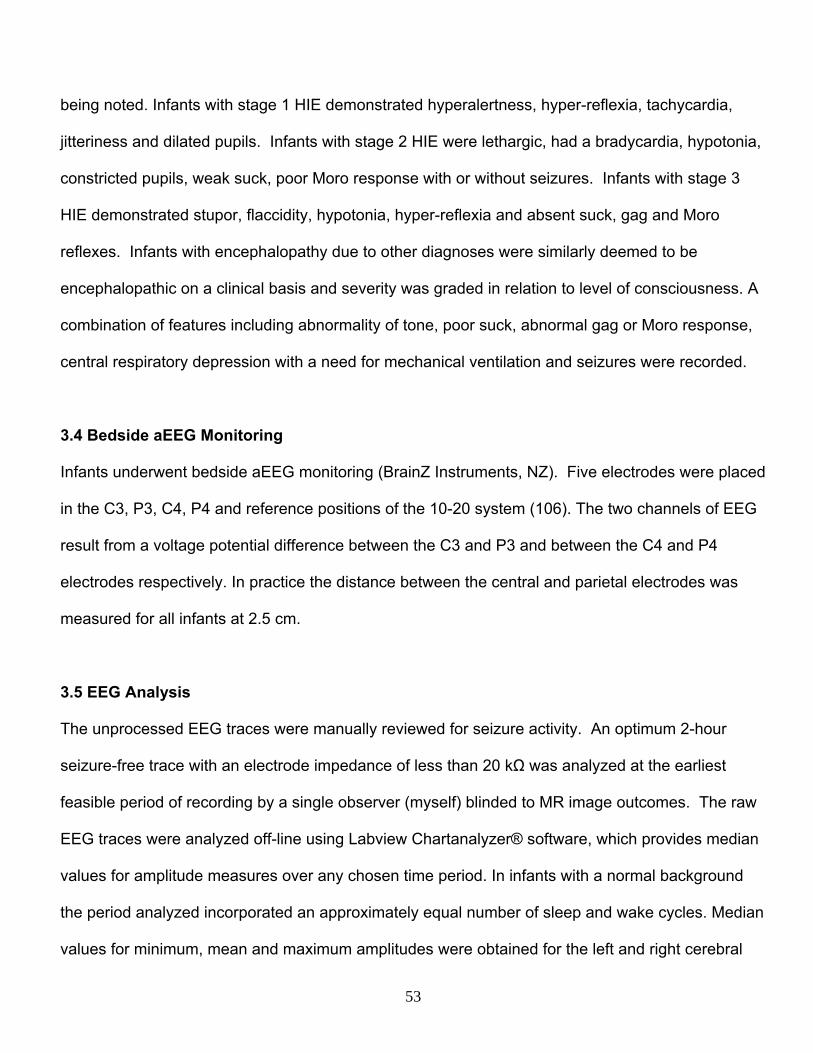
being noted. Infants with stage 1 HIE demonstrated hyperalertness, hyper-reflexia, tachycardia,
jitteriness and dilated pupils. Infants with stage 2 HIE were lethargic, had a bradycardia, hypotonia,
constricted pupils, weak suck, poor Moro response with or without seizures. Infants with stage 3
HIE demonstrated stupor, flaccidity, hypotonia, hyper-reflexia and absent suck, gag and Moro
reflexes. Infants with encephalopathy due to other diagnoses were similarly deemed to be
encephalopathic on a clinical basis and severity was graded in relation to level of consciousness. A
combination of features including abnormality of tone, poor suck, abnormal gag or Moro response,
central respiratory depression with a need for mechanical ventilation and seizures were recorded.
3.4 Bedside aEEG Monitoring
Infants underwent bedside aEEG monitoring (BrainZ Instruments, NZ). Five electrodes were placed
in the C3, P3, C4, P4 and reference positions of the 10-20 system (106). The two channels of EEG
result from a voltage potential difference between the C3 and P3 and between the C4 and P4
electrodes respectively. In practice the distance between the central and parietal electrodes was
measured for all infants at 2.5 cm.
3.5 EEG Analysis
The unprocessed EEG traces were manually reviewed for seizure activity. An optimum 2-hour
seizure-free trace with an electrode impedance of less than 20 kΩ was analyzed at the earliest
feasible period of recording by a single observer (myself) blinded to MR image outcomes. The raw
EEG traces were analyzed off-line using Labview Chartanalyzer® software, which provides median
values for amplitude measures over any chosen time period. In infants with a normal background
the period analyzed incorporated an approximately equal number of sleep and wake cycles. Median
values for minimum, mean and maximum amplitudes were obtained for the left and right cerebral
53

hemispheres separately. The minimum and maximum amplitudes represent the lower and upper
aEEG margins.
3.6 aEEG Pattern
The aEEG was also classified into three groups of background patterns; normal (minimum
amplitude > 4μV, maximum amplitude > 9μV), moderately abnormal (minimum amplitude < 4μV,
maximum amplitude > 9μV) and severely abnormal (minimum amplitude < 4μV, maximum
amplitude < 9μV). The limits of 4 and 9 μV were chosen instead of 5 and 10 μV used by Al Naqeeb
et al (35) because the smaller distance of 2.5cm between the central and parietal electrodes
compared to the inter-electrode distance used with single “cross-head” method would lower all
amplitude measures obtained. These lower amplitudes from a shorter inter-electrode distance are
thought to result from a greater proportion of the lead currents flowing within skin tissue; decreasing
the signal sensitivity to the brain tissue and increasing the noise (107). The choice of 4 and 9 μV
thresholds was not based on experimental work. In choosing thresholds, the trade-off between
higher specificities at low voltage cut-offs versus higher sensitivities at higher cut-offs had to be
considered. In the Results section of this part of the study (Chapter 4), Tables 4.4 shows that a
lower margin threshold of 4 μV achieves an acceptable specificity (80%) with sacrificing a small
proportion of sensitivity (72% compared with 92% at the higher threshold of 6 μV).
3.7 MR Image Acquisition Method
Ninety-three infants underwent MR imaging. The MR protocol used a standard transmit receive
head coil (GE Healthcare) including T1 weighted images (TR/TE 1300/9.4, ETL 220 kHz, B/W
3.5/0.01, 3 averages, 256x224 matrix), T2 weighted images (TR/TE 3600/16, ETL 18, BW 20.83
kHz, FOV 18 cm, slice thickness 3.0 mm, 256 x 224 matrix, 3 averages) and diffusion-weighted
54

sequences (3-directions, b = 1 ms/µm2, TR/TE 10000/104, BW +/- 100kHz, FOV 25 cm, slice
thickness 4.0mm,192 x 128 matrix, 2 averages).
3.8 MR Image Analysis
The MR images were analyzed qualitatively by a single rater (Dr Terrie Inder), blinded to the EEG
recording, using a scoring system in which the cortex, the white matter signal (including ventricular
size), deep nuclear gray matter and posterior limbs of the internal capsule (PLIC) were graded and
a cumulative magnetic resonance image abnormality score (MRAS) from 4-15 was obtained for
each cerebral hemisphere (Table 3.1, Figure 3.1).
Table 3.1 Qualitative scores of MR-related cerebral abnormality. A higher score indicates more severe abnormality.
Region Score range
Deep nuclear gray matter 1-4a
Posterior limb of internal capsule 1-3b
White matter 1-4a
Cortex 1-4a
a Score1 = normal b Score 1= present
2 = mildly abnormal 2 = impaired
3 = moderately abnormal 3 = absent
4 = severely abnormal
55

Figure 3.1 T2-weighted MR images of three infants with corresponding BRM2 traces underneath. Left - an infant with MRAS 4 with a corresponding normal aEEG trace, centre – an infant with MRAS 9 with aEEG showing a discontinuous (moderately abnormal) trace with a seizure on the raw EEG and right an infant with MRAS 15 with a severely abnormal trace.
After assessment of the white matter, cortex and deep nuclear gray matter on MRI, a score of 1 was
awarded if the tissue was normal; score of 2 for up to 2 small focal regions of abnormality; score of
3 for foci involving up to half the region within the hemisphere, and a score of 4 if more than half the
region within the hemisphere was involved. Mild ventricular dilatation would be awarded a score of
2, moderate dilatation a score of 3 and severe dilatation a score of 4 for the white matter domain. If
myelination of the PLIC was present and normal, a score of 1 was awarded, if myelination was
present but impaired, a score of 2 was awarded and if absent a score of 3 was awarded.
56
An MRAS of 8 or above demonstrated the presence of cerebral abnormalities of a severe nature in
one region or moderate nature in more than one region. This cut-off was used to define the groups
of infants with normal-mild versus moderate-severe cerebral abnormality. One out of every ten MR
images was re-scored and the intra-observer variability was 5%.
3.9 Statistical Analysis of Results
Data analysis was carried out using SPSS version 11.5, SPSS Inc. Chicago, Illinois statistics
software package. Linear regression was used to relate the amplitude outcomes to the MRAS.
57

CHAPTER FOUR
Amplitude-Integrated EEG Measures and Patterns in Term Infants
with Seizures and/or Encephalopathy Related to Cerebral
Abnormalities on MRI; Results
58

4.1 Summary
In this chapter, the results of the retrospective study of the relationship between quantifiable aEEG
measures and patterns from term-born infants who presented with seizures and/or encephalopathy
and severity of cerebral abnormality as scored on MRI are presented.
4.2 Patient Population
Between November 2001 and November 2004, 235 term-born infants were cared for with a
diagnosis of HIE and/or seizures between the two neonatal units. Ninety-five of these infants (40%)
had bedside aEEG monitoring. Of these 95 infants, 93 had MR imaging and two died before MR
imaging was undertaken. Seven infants had continuous or frequent seizures (more than three
seizures an hour) throughout the entire recording period elevating the aEEG background. These
infants were excluded as the EEG voltage in these cases reflects seizure activity rather than
encephalopathy. Thus, eighty-six infants had EEG amplitude measures related to qualitative MR
image analysis. There was a small difference in the infants selected for monitoring in relation to use
of anticonvulsants (monitored 66%, not monitored 70%) and mortality (monitored 19%, not
monitored 15%).
Clinical characteristics of the infants are detailed in Table 4.1. Seventy-four percent of the infants
were out-born, and there were more male infants. Two-thirds of the infants were treated with
anticonvulsants for clinical and/or electroencephalographic seizures. The infants received
phenytoin, phenobarbitone, diazepam, clonazepam or midazolam. Nineteen percent of the infants
died prior to discharge. HIE was the commonest diagnosis; the clinical characteristics of these
infants are shown in Table 4.2. The median age at aEEG monitoring for all infants was 2.2 days
(range 0-14 days).
59

Only 13 of the infants had aEEG monitoring carried out in the first 12 hours of life. MR imaging was
carried out at a median time of 4 days after the bedside aEEG monitoring (range – 2 days prior to
monitoring to 55 days after monitoring, n=93).
60

Table 4.1 Characteristics of the 86 infants studied
Male: Female 50:36 Inborn:outborn 22:64 Gestational age at birth, median (range) 39 (36-42) weeks Birth weight, median (range) 3312 (2215-5440) grams
Diagnoses 40 HIE, 10 infection
- 8 bacterial meningitis 9 cerebral vascular diagnoses
- 5 haemorrhage including IVH, SAH - 2 arterial infarcts - 2 venous thrombosis - 1 arterio-venous malformation
8 seizures of undetermined cause 5 respiratory diagnoses
- 2 hyaline membrane disease - 1 meconium aspiration - 1 pulmonary haemorrhage - 1 non-specific
5 maternal drug use - 3 SSRI use - 2 narcotic use
4 metabolic diagnoses - 2 hypoglycaemia
- 2 non-ketotic hyperglycinaemia 3 syndromal
- 1 Opitz syndrome - 1 incontinentia pigmenti - 1 multiple congenital abnormalities
2 encephalopathy of undetermined cause Infants with clinical seizures 59 (69%) Infants given anticonvulsants 57 (66%) Infants requiring mechanical ventilation 55 (64%) Period of EEG analysed n=77, 120 mins;
n=9 60-120 mins Infants with frequent seizures on BRM 4 Age at bedside EEG monitoring, median (range)
2.2 (0-14) days
Age at MRI, median (range) 6.3 (0-62) days Number of infants who died prior to discharge
16 (19%)
Age at death, median (range) 8 (0-28) days
61

Table 4.2 Characteristics of 40 infants diagnosed with HIE
Male: Female 23:17 n=40
Gestational Age at birth, median (range) 39 (36-42) weeks
Birth weight, median (range) 3395 (2215-4730) g
Classification of Sarnat stage of HIE
Stage 1
Stage 2
Stage 3
6 (15%)
18 (45%)
16 (40%)
Infants with 5 minute Apgars ≤5 25 (62%)
Number of infants with first pH≤7.1 10 (25%)
Number of infants with first base deficit ≤-12 22 (55%)
Number of infants with clinical seizures 29 (72%)
Number of infants given anticonvulsants 28 (70%)
Number of infants requiring mechanical
ventilation
34 (85%)
Age at bedside EEG monitoring, median
(range)
22 hours (0-5 days)
Age at MRI, median (range) 5.2 (0-13) days
Number of infants who died 9 (22%)
4.3 Encephalopathic infants
4.3.1 Quantitative Amplitude in Relation to Severity of MRI Abnormality: On linear regression there
was a significant negative relationship between all aEEG amplitudes (lower margin, upper margin
62

and mean) in both hemispheres and MR scores (Table 4.3). For every unit increase in MRAS there
was a mean drop of 0.41 µv in minimum amplitude (95% CI -0.29 to -0.53 µv), P<0.001, 35% of
variance explained, for the left cerebral hemisphere (Figure 4.1) and 0.36 µv (95% CI -0.23 to -0.49
µv) for the right cerebral hemisphere. A subgroup analysis of the patients who died showed that all
infants except one had minimum amplitudes under 5 μV (minimum amplitudes (μV); median
(range); left 1.8 (0.8-7.1); right 2.0 (0.8-7.5), n=16). The exception was an infant who had Opitz
syndrome who died of causes not related to encephalopathy.
Figure 4.1. Scatter plot of MRAS against minimum amplitude for left hemisphere for all patients with a linear regression line.
MR Abnormality Score
2 4 6 8 10 12 14 16
Min
imum
Am
plit
ude
(mcV
)
0
2
4
6
8
10
63

Table 4.3 Analysis of bedside EEG amplitude (μV) results with respect to MRAS
Linear regression of amplitudes for all patients with MRAS
Right Beta* 95% CI
% variance
explained p-value
Minimum Amplitude -0.36 -0.49, -0.23 27 <0.001
Mean Amplitude -0.42 -0.60, -0.23 20 <0.001
Maximum Amplitude -0.47 -0.80, -0.13 9 0.007
Left
Minimum Amplitude -0.41 -0.29, -0.53 35 <0.001
Mean Amplitude -0.52 -0.67, -0.36 34 <0.001
Maximum Amplitude -0.55 -0.82, -0.29 17 <0.001
Linear regression of amplitudes for HIE patients (n=40) with MRAS
Right
Minimum Amplitude -0.40 -0.53, -0.26 49 <0.001
Mean Amplitude -0.50 -0.69, -0.31 42 <0.001
Maximum Amplitude -0.64 -1.00, -0.29 25 0.001
Left
Minimum Amplitude -0.41 -0.56, -0.26 44 <0.001
Mean Amplitude -0.59 -0.78, -0.40 49 <0.001
Maximum Amplitude -0.71 -1.03, -0.39 34 <0.001
* change in amplitude for one unit increase in MRAS
64

Figure 4.2. aEEG background pattern related to MRAS (left)
191750N =
aEEG background
SAMANormal
MR
AS
(le
ft)
14
12
10
8
6
4
191750N = 191750N =
aEEG background
SAMANormal
MR
AS
(le
ft)
14
12
10
8
6
4
14
12
10
8
6
4
4.3.2 Qualitative Background Pattern in Relation to MRI Abnormality: On analysis of variance,
infants with moderately abnormal (MA) and severely abnormal (SA) background patterns had
significantly greater MRAS than infants with a normal background EEG pattern (normal v. MA v. SA;
n (50 v. 17 v. 19); mean (95% CI); 6.7 (6.0-7.4) v. 9.2 (7.7 – 10.7) v. 10.9 (9.3 – 12.5); p<0.001)
(Figure 4.2).
65

Figure 4.3 Age at aEEG monitoring related to minimum amplitude (μV – left) and MRAS (left)
Age at EEG monitoring (days)
0 2 4 6 8 10 12 14 16
0
2
4
6
8
10
12
14
16
Age at EEG monitoring vs Left minimum amplitude (mcV)
Age at EEG monitoging vs MRAS (left) 4.3.3 Relationship of Timing of aEEG and MRI: For all infants, there was a broad scatter of
minimum amplitudes in relation to the age at which bedside monitoring was carried out (Figure 4.3).
This may be due to the fact that the cohort of infants consisted of babies with various diagnoses
including sepsis, metabolic abnormalities and seizures of unknown cause and not just HIE. In many
cases of HIE, the aEEG background pattern shows recovery if the infant survives. However in case
of a progressive insult, such as non-ketotic hyperglycinaemia the trace may be expected to show
continued deterioration reflecting progression in the infant’s condition. Similarly there was no
relationship between MRAS and timing of aEEG monitoring (Figure 4.3) or the time interval
66

between aEEG monitoring and MR image acquisition. At all ages, there was a marked scatter of
MRAS values.
4.4 Pattern of MRI Abnormality
Fifteen infants had a pattern of predominantly severe deep nuclear gray matter (DNGM) injury
(DNGM score 3 or 4 with WMAS 1 or 2) and 18 had a pattern of predominantly severe WMI (WMAS
3 or 4 with DNGM 1 or 2). On analysis of variance, increasing severity of DNGM injury resulted in
decreasing minimum amplitudes (score 1 v 2 v 3 v 4; (n) 32 v 19 v 25 v 10; mean (SD) μV; 5.5 (2.0)
v 4.7 (2.2) v 4.0 (2.1) v 2.3 (1.5); p<0.001 – left hemisphere). For infants with isolated severe DNGM
injury there was a negative relationship between minimum amplitude and MRAS. For every unit
increase in MRAS, there was a mean decrease of 0.72μV in minimum amplitude (95% CI –1.2 to -
0.2 μV), p=0.009, 39% variance explained. These measures do not represent absolute voltages.
They represent the change in measure of voltage (y-axis) predicted by unit change in MRI
abnormality score (x-axis) in this statistical model of linear regression helping to assess the
relationship between the aEEG voltage and MRI abnormality. The absolute lower margin voltages
vary from almost zero to 10 μV (see Figure 4.1).
Five of the eighty-six infants (6%) had markedly asymmetric brain injury (a difference in MRAS ≥ 3
between the two hemispheres), which was reflected in the recording channel.
4.5 Infants with HIE
A sub-group analysis was carried out for the 40 infants who were diagnosed to have HIE (Table
4.3). A similar but stronger relationship was observed between all the amplitude measures and
MRAS. For every unit increase in MRAS there was a mean drop of 0.41 µv in minimum amplitude
67

(95% CI -0.26 to -0.56 µv), P<0.001, 44% of variance explained for the left cerebral hemisphere and
0.40 µv (95% CI -0.26 to -0.53 µv) for the right cerebral hemisphere, P<0.001, 49% of variance
explained (Table 4.3). Infants with stage 2 or 3 HIE (modified Sarnat classification (20)) were more
likely to have a lower minimum amplitude than those with stage 1 (Figure 4.4). For all the infants
that died who had an analyzable trace, the median value for the minimum amplitude was 1.8µv
(range 0.8 – 6.3µv, n=18). Similarly, infants with more severe encephalopathy were more likely to
have more higher MRAS (Figure 4.5).
Figure 4.4 Minimum amplitudes (left) related to Sarnat stage for infants with HIE. Circle indicates outlier and asterisk indicates extreme value.
68

Figure 4.5 Severity of encephalopathy (Sarnat stage) related to severity of abnormality on brain MRI (MRAS – left hemisphere) for infants with HIE
Sarnat stage encephalopathy321
MR
AS
(le
ft)
14
12
10
8
6
4
4.6 Infants with Diagnoses other than HIE
On carrying out a subgroup analysis for the 46 infants with encephalopathy due to causes other
than HIE a direct relationship persisted between minimum amplitude and MRAS. For every unit
increase in MRAS there was a drop in minimum amplitude by 0.31µv (left hemisphere), (95% CI –
0.5 to -0.1 μV) P=0.005, with 17% variance explained. For this group of infants the median age at
EEG monitoring was 3 days (range 0-14 days) and the median age at MRI was 10 days (range 1-63
days).
69

4.7 Infants Monitored after the First 24 Hours of Life
Fifty-eight of the 86 infants were monitored after the first 24 hours of life. The median age of
monitoring was 2.9 days (range 1 – 14 days). Sub-group analysis for this group of infants showed a
direct relationship between MRAS and minimum amplitude. For every unit increase in MRAS there
was a drop in minimum amplitude by 0.35µv (left hemisphere), (95% CI –0.51 to -0.20 μV) P<0.001,
with 27% variance explained.
4.8 Infants with Seizures
The seven infants whose traces could not be analyzed due to frequent seizures had a median
MRAS close to the severely abnormal end of the spectrum; six had scores ranging from 12 to 15 for
each hemisphere and only one infant had a normal MRAS (4 for each hemisphere). The infant with
the normal MRAS had a relatively short period of monitoring with no 60-minute seizure-free period.
Between seizures the aEEG background was discontinuous (moderately abnormal) for this infant.
4.9 Effect of Anticonvulsants
On adding the use of anticonvulsants as a predictor in the linear regression model, no significant
effect was observed (regression coefficient –0.05, 95% CI –0.92 to 0.81, p=0.90 for the right
cerebral hemisphere; regression coefficient 0.04, 95% CI –0.80 to 0.88, p=0.93 for the left cerebral
hemisphere). This statistical finding does not imply that anticonvulsants would not have an impact
on EEG measures in individual babies. Indeed for seven patients, amplitude measures immediately
prior to and half an hour following anticonvulsant administration were obtained. Three infants had
received 5 mg/kg maintenance doses of phenobarbitone, one had received 10 mg/kg
phenobarbitone, two had received loading doses of 20 mg/kg phenobarbitone and one had received
15 mg/kg phenytoin. The amplitude measures from the two hemispheres were analyzed together.
70

A related-samples t-test showed that the amplitude measures decreased significantly in the
minimum amplitude (mean difference -0.86 μV, 95% CI -1.31, -0.42 μV, p=0.001), and mean
amplitude (mean difference -1.06 μV, 95% CI -1.77, -0.36 μV, p=0.007), but not the maximum
amplitude (mean difference -1.12 μV, 95% CI -2.77, 0.52 μV, p=0.16).
But the use of anticonvulsants did not have a statistically significant effect on the relationship
between the MRI abnormality score and the EEG measure in our regression model. This can be the
case if a competing factor, the MR abnormality score in this case, has a great impact rendering
other factors less significant. Hence we did not adjust for an anticonvulsant effect. Furthermore,
when the analysis was confined to infants who had received anticonvulsants (n=63) the relationship
between minimum amplitude and MRAS persisted. For every unit increase in MRAS there was a
mean drop of 0.36 µv in minimum amplitude (95% CI -0.21 to -0.51 µv), P<0.001, 30% of variance
explained for the left cerebral hemisphere and 0.31 µv (95% CI -0.13 to -0.48 µv) for the right
cerebral hemisphere, P=0.001, 19% of variance explained.
For 36 of the 63 infants who had received anticonvulsants (57%) accurate records of the time
interval between the last anticonvulsant dose and EEG monitoring were available. This ranged from
40 minutes to 135 hours. On linear regression between the minimum amplitude (left) and the time
interval between the last dose of anticonvulsant and EEG monitoring, there was a marked scatter of
values with no significant relationship between the time of the last anticonvulsant dose and the
minimum amplitude (regression coefficient =0.02, 95% CI –0.01 to 0.05, p=0.18).
71

4.10 Diagnostic Accuracy of EEG for More Severe Cerebral Abnormality in Infants with HIE
For the 40 infants with HIE, using an MRAS cut-off at eight or higher as abnormal, a minimum EEG
amplitude of 4 μV or less provided good specificity (e.g., sensitivity 72%, specificity 80%, positive
predictive value (PPV) 86%, negative predictive value (NPV) 63% - left hemisphere; sensitivity 75%,
specificity 66%, PPV 78%, NPV 63% - right hemisphere), whereas a minimum amplitude of 6 μV or
less showed a higher sensitivity (e.g., sensitivity 92%, specificity 33%, PPV 70%, NPV 71% - left
hemisphere; sensitivity 100%, specificity 13%, PPV 65%, NPV 100% - right hemisphere) (Table
4.4). The value of 4 µV was chosen on the basis of an ROC plot. There were no substantial
differences in diagnostic accuracy between hemispheres (data for right hemisphere not shown).
Table 4.4a and b. Diagnostic accuracy of differing minimal amplitude cut-offs in left hemisphere for more severe cerebral abnormality (MRAS ≥8) for infants with HIE.
4.4a Minimum amplitude ≤4 μV vs. >4μV
MRAS
≥ 8
<8
≤4 μV 18 3
Min
imum
am
plitu
de
>4 μV 7
12
sensitivity = 72%, specificity = 80%, PPV=86%, NPV=63%
4.4b Minimum amplitude ≤6 μV vs. >6μV
MRAS
≥ 8
<8
≤6 μV 23 10
Min
imum
am
plitu
de
>6 μV 2
5
sensitivity = 92%, specificity = 33%, PPV=70%, NPV=71%
72

4.11 Diagnostic Accuracy of EEG for More Severe Cerebral Abnormality in Infants Monitored
after the First Twenty-Four Hours of Life
Using a similar process for the 58 infants who were monitored after the first 24 hours of life, similar
results were obtained (minimum EEG amplitude of 4 μV; sensitivity 50%, specificity 72%, PPV 62%,
NPV 64% - left hemisphere; sensitivity 42%, specificity 69%, PPV 52%, NPV 59% - right
hemisphere; minimum EEG amplitude of 6 μV; sensitivity 85%, specificity 41%, PPV 54%, NPV
76% - left hemisphere; sensitivity 81%, specificity 44%, PPV 54%, NPV 74% - right hemisphere).
73

CHAPTER FIVE
The Accuracy of Bedside aEEG Monitors for Seizure Detection;
Methods
74

5.1 Summary
In the term cohort of infants, seizures were noted to be a common manifestation of cerebral
pathology. aEEG is commonly used to monitor electroencephalographic seizure activity in at-risk
patients in the NICU. Given that seizure activity is an important and common manifestation of
cerebral pathology, it would be important to test the accuracy of aEEG for electroencephalographic
seizure detection as another aspect of the hypothesis that the aEEG assists in detecting cerebral
abnormality in the newborn. The methods for this part of the study are described in this chapter.
5.2 Patient Population
Infants with clinical seizures referred to a tertiary centre, the Royal Children’s Hospital, Melbourne,
Australia were prospectively recruited between April 2004 and October 2005. Infant recruitment and
the duration of recording relied on the availability of continuous conventional EEG (ccEEG). The
study had received prior approval from the institutional research and ethics committee and informed
consent was obtained from the parents of each patient.
5.3 Bedside aEEG Monitoring and Continuous Conventional EEG
Infants had ccEEG monitoring concurrent with bedside EEG monitoring using the BRM2 (BrainZ
Instrument, New Zealand). EEG-video monitoring was not available for this study. Infants had
ccEEG, with 11 standard gold disc electrodes applied using the 10-20 international system at the
following locations – Fp2; Fp1; T4; T3; C4; Cz; C3; P4; P3; O2; O1; 1 ground; 1 reference electrode
and an ECG electrode. The C3, P3, C4 and P4 electrodes were shared by both conventional EEG
(Siesta, Compumedics, Melbourne, Australia) and by the digital BRM2 aEEG monitor with split
leads. BRM2 and ccEEG traces were simultaneously recorded. The input signal gain was not
altered when electrodes were shared between the two systems.
75

5.4 Off-line Analysis
5.4.1 Criteria for Seizures
The diagnostic criteria for electrical seizure activity on ccEEG were rhythmic, repetitive stereotypic
waveforms with an evolution of morphology, amplitude or electric field (108, 109), lasting at least 10
seconds. Status epilepticus (SE) was defined as recurrent seizure activity lasting at least 50% of the
time for a minimum duration of one hour (108).
5.4.2 ccEEG
The ccEEG recordings were reviewed independently off-line by two neurologists with expertise in
EEG (Dr Mark Mackay and Dr A Simon Harvey).
5.4.3 aEEG plus 2-Channel EEG
Two neonatal raters (Ms Shelly Lavery and myself) who had three years experience each but no
specific training, independently reviewed the 2-channel aEEG in combination with the raw traces
(aEEG plus 2-channel EEG) off-line for electrical seizures, in a blinded fashion. Where there was
disagreement between the two raters, a consensus was reached so that a meaningful comparison
could be made between the two-channel bedside aEEG tool and multi-channel conventional EEG.
5.4.4 aEEG
Two aEEG users (Dr Amit Mathur and Dr John Zempel), who also had three years experience each
but no specific training, independently reviewed the cross-cerebral (P3-P4) aEEG traces and the 2-
channel (C3-P3, C4-P4) aEEG traces, with a three month interval between reviews. They were
blinded to patient information and the raw EEG trace. They were asked to point out areas of
76

“definite” electrical seizure activity on the aEEG trace as would be constituted by a distinct rise in
the lower and upper margins of the aEEG trace above “baseline”.
5.5 Data Analysis
In order to be able to report specificity and negative predictive values a model was used with the
assumption that the number of ictal periods was equal to the number of inter-ictal periods (i.e. the
period immediately adjacent to an electrical seizure).
Ictal Inter-ictal
The ictal periods consist of true positives plus false negatives. The inter-ictal periods consist of false
positives plus true negatives.
Number of ictal episodes = Number of adjacent inter-ictal episodes
True positives + False negatives = False positives + True negatives
Hence knowing values for true positives, false positives and false negatives it was possible to
calculate values for “true negatives” for each patient. This allowed 2x2 tables to be created.
77

Seizure-free epochs were not used to model “true negatives” as the prolonged periods of recording
provided very high kappa scores for all modalities of monitoring hence limiting the discrimination
between tests.
The kappa statistic was obtained for each pair of independent reviewers for each modality of
bedside monitoring assessed. Sensitivity, specificity, positive predictive value and negative
predictive values were calculated for all modalities with respect to ccEEG. Analysis was carried out
using SPSS version 15 (SPSS Inc., Chicago, Illinois).
78

CHAPTER SIX
The Accuracy of Bedside aEEG Monitors for Seizure Detection;
Results
79

6.1 Summary
In this chapter, the results of the accuracy of the three digital aEEG modalities (1-channel aEEG, 2-
channel aEEG and aEEG with raw EEG) compared with continuous conventional EEG are reported.
6.2 Patient Population
Between April 2004 and October 2005, 21 term infants referred with clinical seizures were enrolled.
During this time period, a total of 53 infants were admitted to the NICU with a diagnosis of seizures.
Three families refused consent and the remaining infants could not be enrolled in the study due to
restricted availability of ccEEG, which was available only during office hours. Preterm infants were
included in the study if they were term-corrected post-conceptional age. Table 6.1 shows the
characteristics of the infants entered into the study.
The commonest diagnoses were hypoxic-ischemic encephalopathy and intracranial haemorrhage.
The majority of the infants (19/21) had been treated with anticonvulsants prior to study entry with up
to 5 different anticonvulsants being used. Phenobarbitone and phenytoin were the most commonly
used anticonvulsants. Nineteen infants (90%) required mechanical endotracheal ventilation in
relation to the severity of seizures with a need for airway protection.
80
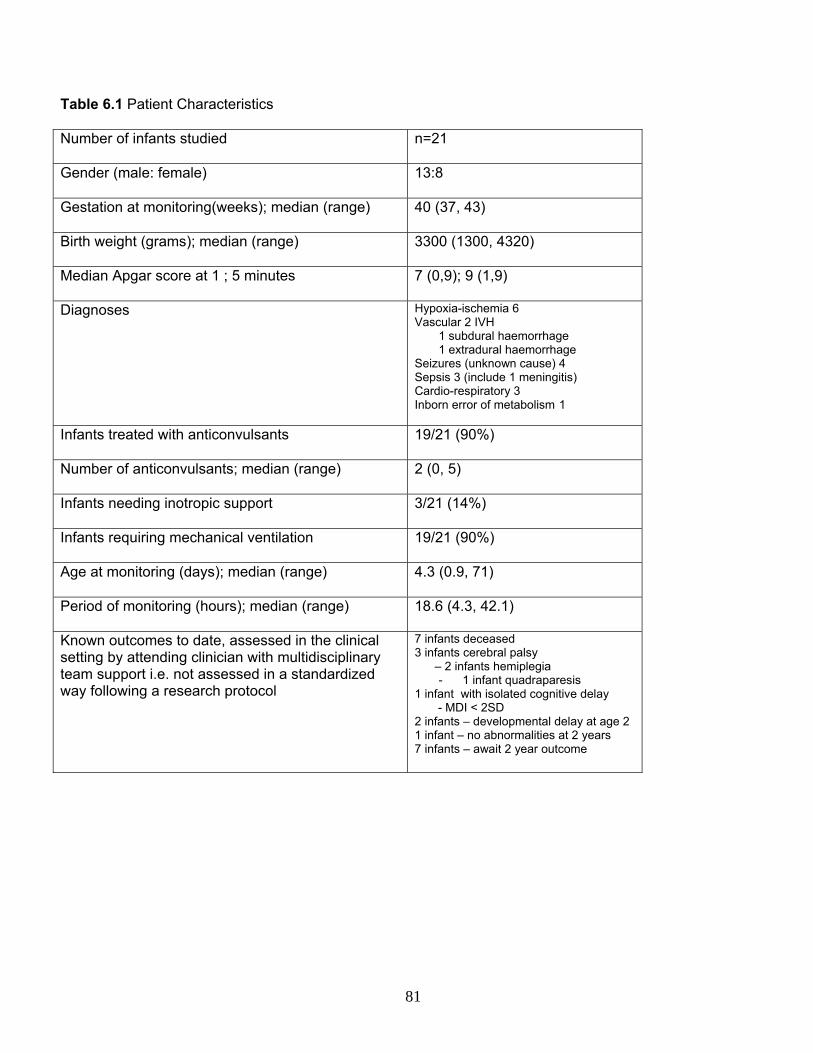
Table 6.1 Patient Characteristics
Number of infants studied n=21
Gender (male: female) 13:8
Gestation at monitoring(weeks); median (range) 40 (37, 43)
Birth weight (grams); median (range) 3300 (1300, 4320)
Median Apgar score at 1 ; 5 minutes 7 (0,9); 9 (1,9)
Diagnoses Hypoxia-ischemia 6 Vascular 2 IVH
1 subdural haemorrhage 1 extradural haemorrhage
Seizures (unknown cause) 4 Sepsis 3 (include 1 meningitis) Cardio-respiratory 3 Inborn error of metabolism 1
Infants treated with anticonvulsants 19/21 (90%)
Number of anticonvulsants; median (range) 2 (0, 5)
Infants needing inotropic support 3/21 (14%)
Infants requiring mechanical ventilation 19/21 (90%)
Age at monitoring (days); median (range) 4.3 (0.9, 71)
Period of monitoring (hours); median (range) 18.6 (4.3, 42.1)
Known outcomes to date, assessed in the clinical setting by attending clinician with multidisciplinary team support i.e. not assessed in a standardized way following a research protocol
7 infants deceased 3 infants cerebral palsy – 2 infants hemiplegia
- 1 infant quadraparesis 1 infant with isolated cognitive delay - MDI < 2SD 2 infants – developmental delay at age 2 1 infant – no abnormalities at 2 years 7 infants – await 2 year outcome
81

82
6.3 ccEEG Seizures
Infants were monitored for a median period of 18.6 hours with 351 hours of data obtained. Seven
infants had electrical seizures captured on ccEEG (Table 6.2), one of whom (patient E, Table 6.2)
had SE. A total of 41 non-status seizures were detected. The inter-observer agreement kappa for
the ccEEG review was 0.84 (p<0.001) consistent with a high level of agreement.
6.4 aEEG plus 2-Channel EEG
Seizures were correctly identified in 6/7 patients using the aEEG in combination with the raw trace
on two channels of the bedside monitor (Table 6.2). SE in patient E was also correctly identified.
The duration of seizures identified ranged from 12 to 300 seconds (median 89 seconds). A short
single seizure (11 seconds duration) in patient G was not detected using the aEEG plus 2-channel
EEG. The seizures were recorded from within 5-24 hours after commencing monitoring. Using the
aEEG plus 2-channel EEG 31/41 (76%) non-status seizures were identified (sensitivity 76%,
specificity 78%, positive predictive value (PPV) 78%, negative predictive value (NPV) 78%) (Table
6.3). The inter-observer agreement Cohen’s kappa was 0.67, p<0.001 consistent with a substantial
level of agreement. As can be seen in Table 6.2, the morphology of the detected seizures was
variable. The detected seizures were often of low amplitude with a focus predominantly at a site
distant to the electrodes, such as temporal or occipital regions on conventional EEG. The focus
spread to nearby regions with time making detection by the aEEG monitor possible.
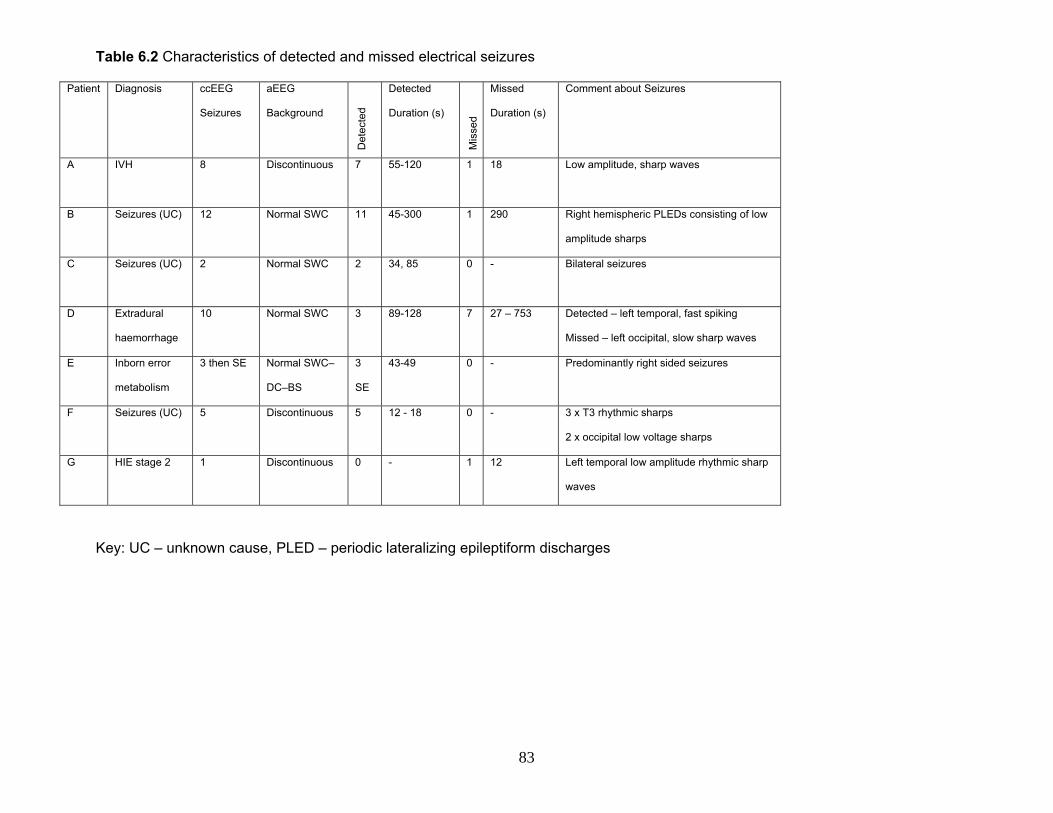
Table 6.2 Characteristics of detected and missed electrical seizures
Patient
Diagnosis ccEEG
Seizures
aEEG
Background
Det
ecte
d
Detected
Duration (s)
Mis
sed
Missed
Duration (s)
Comment about Seizures
A
IVH 8 Discontinuous 7 55-120 1 18 Low amplitude, sharp waves
B Seizures (UC) 12 Normal SWC 11 45-300 1 290 Right hemispheric PLEDs consisting of low
amplitude sharps
C Seizures (UC)
2 Normal SWC 2 34, 85 0 - Bilateral seizures
D Extradural
haemorrhage
10 Normal SWC 3 89-128 7 27 – 753 Detected – left temporal, fast spiking
Missed – left occipital, slow sharp waves
E Inborn error
metabolism
3 then SE Normal SWC–
DC–BS
3
SE
43-49 0 - Predominantly right sided seizures
F Seizures (UC) 5 Discontinuous 5 12 - 18 0 - 3 x T3 rhythmic sharps
2 x occipital low voltage sharps
G
HIE stage 2 1 Discontinuous 0 - 1 12 Left temporal low amplitude rhythmic sharp
waves
Key: UC – unknown cause, PLED – periodic lateralizing epileptiform discharges
83

Table 6.3 The sensitivity, specificity and predictive value of bedside monitoring with respect to ccEEG Sensitivity Specificity PPV NPV Kappa P
aEEG plus raw signal
Agreed seizures
76% 78% 78% 78% 0.67 <0.001
Rater A 56% 85% 79% 85% 1 channel aEEG
Rater B 41% 66% 55% 66%
0.29 0.03
Rater A 27% 98% 92% 98% 2 channel aEEG
Rater B 44% 83% 72% 83%
0.31 0.01
6.5 Seizures not Detected using aEEG plus 2-channel EEG
The duration of seizures missed using the aEEG plus 2-channel EEG ranged from 11
to 753 seconds (median 170 seconds). The majority of the undetected seizures (7/10)
were from patient D. Six of these seizures consisted of unilateral occipital slow sharp
wave activity (Figure 6.1).
6.6 False Positives
There were nine false positives (FP) over 351 hours of recording (1 FP/39 hours).
These were obtained from four patients. Seven episodes were obtained from two
patients who had had no electrical seizures on ccEEG. These were thought to be
related to the electrodes, patting or muscle artefact (Figure 6.2). In the absence of
EEG-video, the cause of the artefact could not be confirmed.
84

6.7 Clinical Course of Infants in Relation to Monitoring and Anticonvulsant
Administration
Table 6.4 shows the clinical course of the infants who had ccEEG seizures (patients A
to G) and the “error” patients. Six of the seven patients who had seizures on ccEEG
(patients A to F) had clinical correlates with the electrical seizures although they
occurred in only 20-50% of individual ccEEG confirmed seizures. All clinical seizures
had true positives noted on aEEG plus 2-channel EEG. In addition 23/38 non-status
seizures on ccEEG and 16/31 non-status seizures on aEEG plus 2-channel EEG did
not have a clinical correlate noted.
The most common clinical correlate was apnea and desaturation which was noted in
all six infants. Other signs included clonic jerking, posturing, increase in heart rate and
abnormal respiratory pattern. The seventh patient (patient G) who had had a single
short seizure did not have a clinical correlate, and was also missed by all modes of
bedside monitoring.
Of the nine infants in Table 6.4, eight had received anticonvulsants prior to
commencing monitoring. In seven infants ccEEG seizures occurred within 1-12 hours
of a dose of anticonvulsant. In two infants, seizures were noted within one hour of
giving anticonvulsants and in one infant (patient E) who was thought to have an
undiagnosed inborn error of metabolism, an increase in electrical seizures frequency
(with clinical correlates) was noted to coincide with the administration of phenytoin.
85

Figure 6.1 ccEEG (left) and bedside monitor (right) images of slow sharp wave seizure predominantly in the left occipital area (arrow) not clearly detected by the bedside monitor (Patient D).
Figure 6.2 Examples of false positives on the bedside monitor (left images) as seen on ccEEG (arrows - right images) related to electrode artefact.
86

Table 6.4 Clinical course of infants in relation to EEG monitoring
Patient
Diagnosis ccEEG Seizures
Clinical seizure correlates
Signs of Clinical Seizures
AEDs prior to monitoring
Time of EEG Seizure after AED
Clinical Course Number of AEDs
Infant Outcome
A
IVH 8 4 A&D, jerking, increases in HR.
PB 80mg/kg PHY 40mg/kg CLZ 0.5mg/kg
Within 1 hour of loading PB. Further loading dose improved control.
Encephalopathic, intubated during monitoring. AED reduced frequency of electrical seizures.
3 Died at 29 days age.
B Seizures (UC)
12 4 A&D, focal limb jerking, contralateral to EEG seizure.
PB 20mg/kg 5 hours – infant given loading PHY with improvement in electrical seizure activity.
Infant intubated for apneas. 2 Mild developmental delay at 2 years
C
Seizures (UC)
2 1 A&D, clonic limb jerking, mouthing, eye flickering.
PB 40mg/kg 12 hours after maintenance PB
Not intubated, sucking oral feeds during hospital course.
3 Normal neurology at 19 months
D Extradural haemorrhage
10 2 A&D PB 20mg/kg Within 1 hour of maintenance PB
Infant extubated immediately prior to monitoring. Neurology normalised and sucking soon after.
1 No neurologic abnormalities noted at 1 year.
E Inborn error metabolism
3 then SE
Multiple A&D, clonic limb jerking.
PB 40mg/kg PHY 20mg/kg
Increased frequency to SE after commencing PHY load. Required further PB load for better control.
Infant with very difficult seizure control – intubated during course of monitoring.
3 Developmental delay at 2 years
F Seizures (UC)
5 1 A&D, posturing, abnormal respiration pattern, increases in HR.
PB 6mg/kg PHY 20mg/kg
Within 4 hours of maintenance PHY.
Infant’s seizure control worsened after monitoring ceased, requiring intubation and ventilation.
4 Died at 4 months age.
G
HIE stage 2
1 No No PB 40mg/kg PHY 15mg/kg CLZ 0.5mg/kg
6 hours Infant had been pretreated with AEDs, monitored on third day of life.
3 Diplegic cerebral palsy at 2 years.
H HIE stage 3 No 1 apnea correlated with false positive
A&D requiring bag and mask oxygen
PB 40mg/kg - Infant did not require intubation and ventilation for A&Ds.
1 Normal
I
Bronchiolitis
No No No None - Intubated and ventilated for cardio-respiratory support.
1 Alive
Key UC- unknown cause, A&D – apnea and desaturation, AED – antiepileptic drug, HR – hear rate, SE – status epilepticus, PB -
phenobarbitone, PHY – phenytoin, CLZ - clonazepam
87

6.8 “Error” Patients
Seven of 21 infants had either false positives or seizures not detected on aEEG
plus 2-channel EEG. Three out of the four infants who had seizures missed had
some “true positive” electrical seizures detected using aEEG plus 2-channel EEG
(7/8, 11/12 and 3/10 seizures) (Table 6.2). The fourth infant (patient G) had an
isolated, short (12 second) seizure that was not detected using aEEG plus 2-
channel EEG. For all four patients, clinical management was not changed as a
result of conventional EEG findings.
Four of these seven “error” patients had false positive seizure episodes on aEEG
plus 2-channel EEG. Two infants (patients D and F) had single false positives but
also had true positives (five and ten electrical seizures on ccEEG). Patients H
and I had five and two false positives respectively, neither of whom had had any
true positives. One such episode in patient H coincided with an apnea for which
the patient received bag and mask ventilation. In the absence of EEG-video, it
cannot be ascertained whether the electrode artefact was related to the apnea or
to the resuscitation process.
6.9 Patients with no ccEEG Seizure Activity
Of the 14 patients who did not have seizures on ccEEG, two infants were noted
to have apneas, desaturations and abnormal limb movements. Both infants had
already received loading doses of anticonvulsant treatment. Another two infants
were noted to have apneas and desaturations only.
88
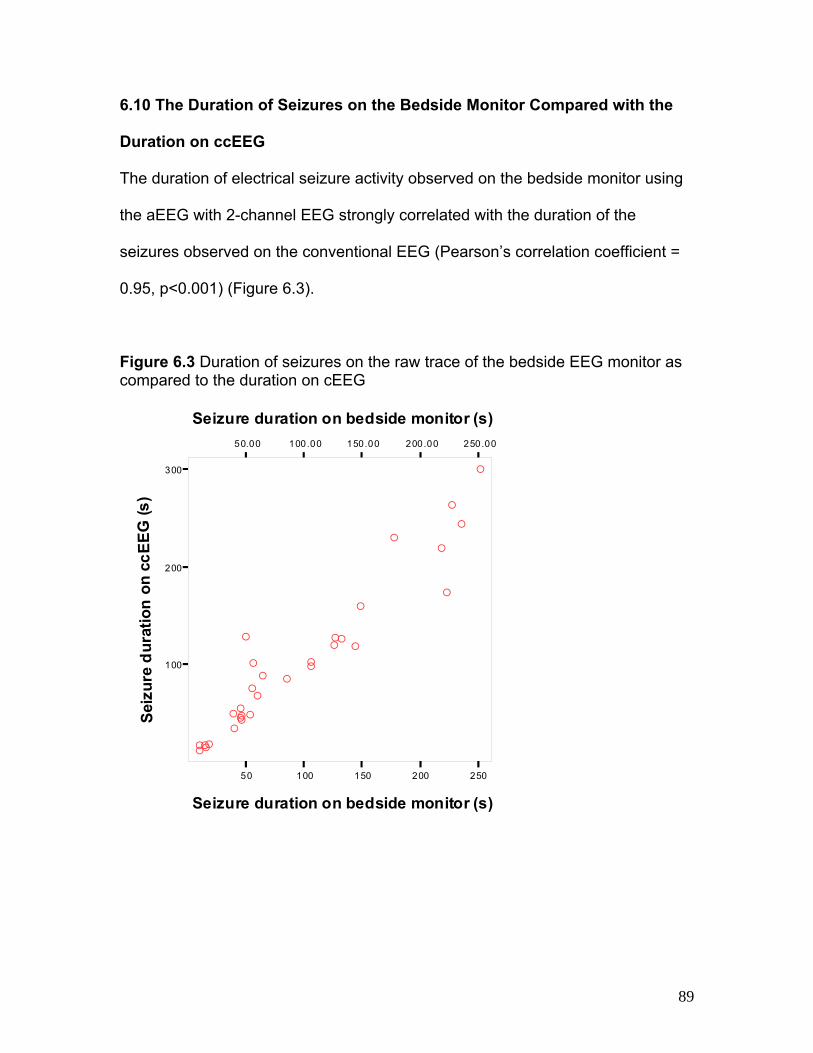
6.10 The Duration of Seizures on the Bedside Monitor Compared with the
Duration on ccEEG
The duration of electrical seizure activity observed on the bedside monitor using
the aEEG with 2-channel EEG strongly correlated with the duration of the
seizures observed on the conventional EEG (Pearson’s correlation coefficient =
0.95, p<0.001) (Figure 6.3).
Figure 6.3 Duration of seizures on the raw trace of the bedside EEG monitor as compared to the duration on cEEG
50 100 150 200 250
Seizure duration on bedside monitor (s)
100
200
300
Sei
zure
du
rati
on
on
cc
EE
G (
s)
50.00 100.00 150.00 200.00 250.00
Seizure duration on bedside monitor (s)
A
AA
A
A
A
AA
A
A
A
A
A
A
A
A
A
A
A
A
A
AA
AAA
AAAAA
89

6.11 aEEG Tracing Alone
On single channel aEEG, 23/41 (56%) seizures were identified in 4/7 infants
with electrical seizures on ccEEG by one or both raters. Between the two raters
14 false positive seizures were identified. On two channel aEEG alone, 18/41
(44%) seizures were correctly identified in 5/7 infants by one or both raters.
Between the two raters, 10 false positives were obtained. The inter-observer
agreement kappa for aEEG tracing alone was 0.29-0.31 (p<0.05) consistent with
a fair degree of agreement.
6.12 Seizures not Detected using Single or Two-Channel aEEG
Thirteen seizures were missed by both raters using both single and two-channel
aEEG alone. These included the same six seizures from patient D as were
missed using aEEG plus 2-channel EEG i.e. unilateral occipital slow sharp waves
which were moderately long (range 27 – 753 seconds, median 184 seconds). All
five seizures missed in another patient (patient F, Table 2) were short (range 10-
18 seconds, median 17 seconds). These were all diagnosed with the aEEG in
combination with the raw trace. On post-hoc review, it was noted that there was
no distinct rise in the lower and upper aEEG band margins for 8/13 of the missed
seizures. It was also observed that six of these had a discontinuous background
and seven had a normal but “spiky” background.
90

6.13 Infant Outcomes
To date, 2-year outcome information is available for 12/21 infants (Table 1). The
follow-up was not carried out as part of a standardized research protocol, due to
lack of resources, but as part of clinical follow-up by attending neonatologist at
the Royal Children’s Hospital in Melbourne or by local paediatricians for infants
who had been discharged to the care of the local services. Where possible I
attended follow-up but otherwise, the clinician notes were reviewed for these
infants. Outcome was assess with informal neurologic examination in most cases
with Bayley assessment available for only one patient.
Seven of the 21 infants (33%) have died and three infants have cerebral palsy.
Of the seven infants who died, three infants had HIE, two had cardio-respiratory
problems, one had intraventricular haemorrhage and one had seizures of
undetermined cause. Only two of these infants had electrical seizures detected
on ccEEG.
91

CHAPTER SEVEN
aEEG Background, the Presence of Electrographic
Seizures and Quantifiable aEEG Measures in Preterm
Infants in the First Week of Life Assists in Detecting
Cerebral Abnormality; Methods.
92

7.1 Summary
In the previous chapters, testing of the hypothesis that the aEEG in term infants
assists in detecting cerebral abnormality was described. In this part of the study,
the hypothesis that the aEEG in preterm infants also assists in detecting cerebral
abnormality using not only the aEEG background trace and quantifiable aEEG
measures (upper, lower and mean aEEG margins) but also the presence of
electrographic seizure activity is tested. The methods are described in this
chapter.
7.2 Study Population
Between April 2007 and June 2008, infants under 30 weeks gestation referred to
the St Louis Children’s Hospital Neonatal Intensive Care Unit (NICU) were
recruited within the first week of life to a prospective cohort study with informed
consent from the families. Prior approval to carry out this study had been
obtained from the Institutional Research Board.
7.3 aEEG Monitoring
Infants were monitored continuously with 2-channel (C3-P3, C4-P4) aEEG with
EEG in the first week of life with the BRM2 (BrainZ Instruments, New Zealand).
Subsequently infants had a shorter period of follow-up monitoring at intervals at
30 weeks, 34 weeks and term PCA. Gel electrodes were used for this purpose.
Monitoring was limited by the infants’ clinical condition and availability of
monitors. Follow-up monitoring was limited by death of the infant, transfer of
93

infant to another hospital, availability of equipment and occasionally by technical
difficulties.
7.4 aEEG Analysis
aEEG analysis was carried out off-line using Analyze (BrainZ Instruments, NZ).
The earliest four-hour epoch with acceptable impedance (<15 kΩ at each
electrode) was chosen for aEEG analysis every 24 hours for recordings in the
first week of life. This epoch was chosen to include any changing sleep states as
well as periods of handling the infant. Periods of acute changes in the aEEG
related to specific events such as pulmonary haemorrhage, giving surfactant,
profound desaturation or bradycardia, electrographic seizure activity or overt
artefact of aEEG were excluded from analysis.
7.5 aEEG Monitor Function and Manual aEEG Data Analysis
For each 4-second epoch the minimum, mean and maximum values of the aEEG
are calculated by in-built software while the aEEG is being recorded by the
BrainZ monitor (See Appendix). The median over a minute epoch are stored and
displayed by the commercial software as the minimum and maximum integrated
amplitudes every minute and represent the lower and upper aEEG margins.
For this study, the median values of the minimum, maximum and mean
integrated amplitudes (lower and upper aEEG margins) were calculated for the 4
hour epoch. In addition, the percentage of time the lower aEEG margin was
94

below 5μV was also calculated manually. This was carried out to avoid losing
information when averages or median values are calculated over long epochs. A
threshold of 5μV was used as studies in term-born encephalopathic infants
showed that the lower (as well as upper margins) below this level this cut-off was
predictive for abnormal neurodevelopmental outcome (35). This process was
carried out for 4-hour epochs every twenty-four hours, and also for recordings
carried out during subsequent weeks.
aEEG amplitudes obtained were those for the “cross-cerebral” P3-P4 channel.
The cross-cerebral channel was chosen as we had previously noticed that with
loss of oedema and natural change in shape of infant head in the first few days of
life, the electrodes had a tendency to migrate closer together and lower the C-P
channel amplitudes due to reduced inter-electrode distance.
7.6 The Use of Sedation in the Cohort
Intubated infants on the NICU at the St Louis Children’s Hospital were not
routinely sedated. However infants deemed to require sedation for agitation or to
assist with smooth ventilation were given boluses of morphine, fentanyl or
midazolam as per local clinical guidelines. Sedation was rarely used within the
first three days of life and where it was used aEEG traces were not analyzed
within six hours of the infant receiving it.
95

7.7 Visual Analysis of aEEG Pattern
The earliest aEEG pattern recorded for each patient was assessed for variability
of the lower aEEG margin. The earliest age at recording when regular aEEG
pattern variabililty with what has been termed as sleep-wake cycling (narrowing
and broadening of the aEEG band thought to represent sleep state changes) as
observed was also assessed.
7.8 Visual Analysis of EEG with aEEG for Electrographic Seizure Activity
The 2-channel EEG traces with aEEG recordings were visually inspected for
electrographic seizures using the aEEG with the raw EEG by myself and
confirmed by a neurologist with expertise in neurophysiology (Dr John Zempel).
Seizures were defined as a minimum 10 second period of rhythmic, repetitive
activity. Seizure morphology was described in terms of the frequency of the
rhythmic activity, as well as nature of the waveforms based on commonly used
clinical descriptions (spikes, sharp waves, spike and wave, polyspike and wave,
sharp and wave) (110).
7.9 Physiological “Vital Signs” Download
In cases where the infants’ “vital signs” physiologic monitor was compatible with
the aEEG monitor, the physiological parameters were downloaded to the aEEG
monitor in real time, in order to be able to synchronize the EEG measures with
physiological signs at any given time point. These included heart rate (HR),
respiratory rate (RR), oxygen saturations and blood pressure. This was done via
96

an RS232 port on the physiologic monitor and facilitated by software from BrainZ
Instruments, NZ.
7.10 Correlation of aEEG with Physiologic Parameters in Infants with
Seizures
For each infant with seizures on the aEEG monitor for whom physiologic data
was downloaded, an attempt was made to identify the relationship between the
change in EEG activity with HR and RR. aEEG segments for the first five
seizures from each infant were digitally filtered (Chebyshev) and down sampled
(from 8 to 0.4 Hz) using Matlab 7 (Natick, MA) to the base frequency of the
respiratory rate and heart rate data. Onset of change (if any) in the respiratory
rate and heart rate, time and magnitude of peak change, and return to baseline
of the physiologic data were determined. This was carried out with the assistance
of Dr John Zempel.
7.11 Neuroimaging
7.11.1 Cranial Ultrasound
Infants had routine cranial ultrasounds as per local clinical practice at the St
Louis Children’s Hospital, first on day 1-3, then at 1 week, 2 weeks and 4 weeks
or more frequently as clinically indicated. IVH was defined according to the
Papille classification (111).
97

7.11.2 MR Imaging
Surviving infants underwent MR imaging at term corrected with conventional T1
and T2 imaging sequences.
7.12 Classification of Cerebral Abnormality-Related Outcomes
Infants were grossly classified as having abnormal outcomes if they had suffered
a grade 3/4 IVH and/or had moderate or severe white matter abnormalities on
MRI as previously defined by Woodward et al (94) and/or they died for any
reason. The remaining infants who had no IVH or had grade 1 or 2 IVH with
complete resolution and or normal or mildly abnormal brain MRI were classified
in the “normal” category.
7.13 Data Analysis
SPSS (version 15, Chicago, IL) and SAS were used to carry out statistical
analyses. Proportions were compared using Fisher’s Exact test and Pearson’s
Chi-squared statistic when the denominator was less than 50. Means were
compared using the Student t-test for independent samples. If Levene’s test
yielded a p<0.05 then un-equal variance in the samples was assumed. In order
to compare samples where the data was not normally distributed, such as Apgar
score, the Mann Whitney U statistic or Wilcoxon’s Rank Sums tests were used.
In order to assess the trend of aEEG measures throughout the neonatal period
i.e. the “follow-up” recordings, only the first recording in the first week of life in
98

combination with all recordings in subsequent weeks was used. In order to
assess trends in multiple measurements taken from each patient at varying time
points, mixed models were used with the help of Ms Jingnan Mao, statistician at
Washington University. Mixed models were also used to compare trends of
repeated measurements between two groups. A logistic regression model was
used to calculate odds ratios with a covariate.
99

CHAPTER EIGHT
aEEG in Preterm Assists in Detecting Cerebral
Abnormality; aEEG Background and Quantifiable aEEG
Measures Results
100

8.1 Summary
Cerebral abnormality-related outcomes are defined in the context of this small
cohort of preterm infants. Preterm infants with “normal” or “mildly abnormal”
outcomes are first identified. Using this group of infants, normal aEEG maturation
patterns during the first and subsequent weeks of life are defined. A comparison
is made with the maturation of aEEG measures and patterns of infants with
abnormal outcomes. The evolution or regression of the aEEG pattern in the
context of grade 3/4 IVH is also explored.
8.2 Study Population
Fifty-seven of 121 (47%) eligible infants who came through the NICU during this
time period were recruited. Infant recruitment was limited by parental refusal and
availability of monitoring equipment. The characteristics of the infants recruited
were similar to those of the 64 not recruited. The infants not recruited were of
26.9 (SD 1.4) weeks mean gestation; eight (11%) had grade 3/4 IVH and nine
(14%) died.
Of the 57 infants recruited, the families of four withdrew consent, one infant died
prior to the recording being commenced and the recording for one infant was not
available for analysis. Recordings for 51 infants < 30 weeks gestation at birth
were analyzed. Their characteristics are shown in Table 8.1. aEEG recording
was commenced at a median age of 24 (range 3-117; up to day 5 of life) hours
for a median period of 74 (range 12-140) hours.
101

Table 8.1 Characteristics of Infants who underwent aEEG Monitoring in the First Week of Life Male 22/51 (43%)
Gestation (weeks); Median (range) 26.7 (23, 29)
Age recording commenced (hours); Median (range) 24 (3, 117)
Duration of recording (hours); Median (range) 74 (12, 140)
Number of epochs analyzed; Median (range) 3 (1, 7)
Duration of epochs analyzed; Median (range) 4 (0.5, 4.5)
Infants with IVH grade ¾ 8/51 (16%)
Infants who died 7/51 (14%)
Infants with abnormal outcomes 17/51 (33%)
Infants with electrographic seizures 11/51 (22%)
8.3 The Use of Sedation in the Cohort
There was no significant difference in the proportion of infants given boluses of
sedation in the cerebral abnormality group compared to no abnormality (56% v.
41%; χ2 =0.04, p=0.84) (Table 8.3). Similarly when the number of boluses of
sedation given in the first week of life were compared between abnormal group
(median 2, range 0-4) and the normal group (median 1, range 0-3), there was no
statistically significant difference (χ2 linear trend = 2.51, p=0.11) although the
abnormal group had received more boluses of sedation.
102

8.4 Cerebral Abnormality-Related Outcomes
Seventeen of the 51 infants (33%) had abnormal outcomes. The characteristics
of these infants are shown in Table 8.2. Eight of these infants had grade 3 or 4
IVH and seven of them died. Nine of these infants displayed electrographic
seizure activity. Comparison of characteristics of infants with abnormal and
normal outcomes was made in Table 8.3. Infants with abnormal outcomes were
more likely to be of lower gestation and lower birth weight. They were also more
likely to have had lower Apgars and seizures.
103
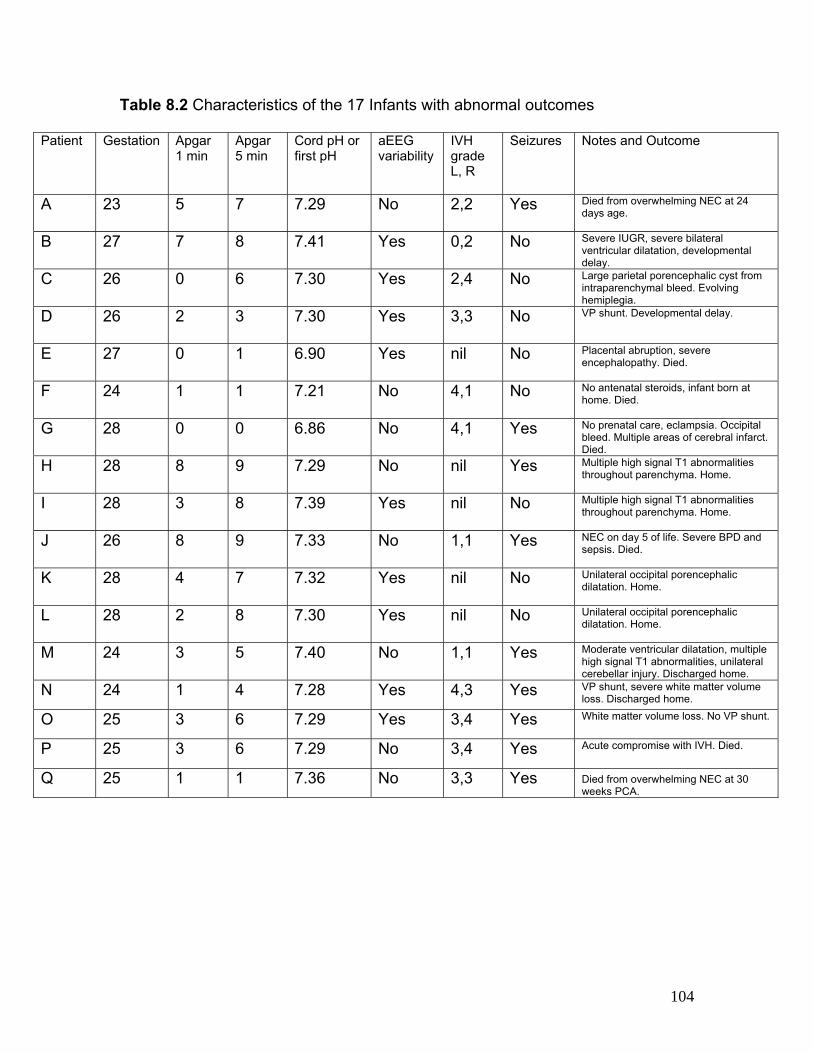
Table 8.2 Characteristics of the 17 Infants with abnormal outcomes
Patient Gestation Apgar 1 min
Apgar 5 min
Cord pH or first pH
aEEG variability
IVH grade L, R
Seizures Notes and Outcome
A 23 5 7 7.29 No 2,2 Yes Died from overwhelming NEC at 24 days age.
B 27 7 8 7.41 Yes 0,2 No Severe IUGR, severe bilateral ventricular dilatation, developmental delay.
C 26 0 6 7.30 Yes 2,4 No Large parietal porencephalic cyst from intraparenchymal bleed. Evolving hemiplegia.
D 26 2 3 7.30 Yes 3,3 No VP shunt. Developmental delay.
E 27 0 1 6.90 Yes nil No Placental abruption, severe encephalopathy. Died.
F 24 1 1 7.21 No 4,1 No No antenatal steroids, infant born at home. Died.
G 28 0 0 6.86 No 4,1 Yes No prenatal care, eclampsia. Occipital bleed. Multiple areas of cerebral infarct. Died.
H 28 8 9 7.29 No nil Yes Multiple high signal T1 abnormalities throughout parenchyma. Home.
I 28 3 8 7.39 Yes nil No Multiple high signal T1 abnormalities throughout parenchyma. Home.
J 26 8 9 7.33 No 1,1 Yes NEC on day 5 of life. Severe BPD and sepsis. Died.
K 28 4 7 7.32 Yes nil No Unilateral occipital porencephalic dilatation. Home.
L 28 2 8 7.30 Yes nil No Unilateral occipital porencephalic dilatation. Home.
M 24 3 5 7.40 No 1,1 Yes Moderate ventricular dilatation, multiple high signal T1 abnormalities, unilateral cerebellar injury. Discharged home.
N 24 1 4 7.28 Yes 4,3 Yes VP shunt, severe white matter volume loss. Discharged home.
O 25 3 6 7.29 Yes 3,4 Yes White matter volume loss. No VP shunt.
P 25 3 6 7.29 No 3,4 Yes Acute compromise with IVH. Died.
Q 25 1 1 7.36 No 3,3 Yes Died from overwhelming NEC at 30 weeks PCA.
104

Table 8.3 Infants with abnormal cerebral outcomes compared to those without
Abnormal outcome
Normal outcome Statistic p-value
Male 9/17 (53%) 13/34 (38%) χ2=1.0 p=0.38
Gestation (weeks); mean (SD) 26.0 (1.0) 26.9 (1.5) 0.9 (0, 1.8)* p=0.04
Birth weight (grams); mean (SD) 941 (222) 782 (156) 159 (50, 267)* p=0.005
Apgar 5 minutes; median (range) 5.5 (0,9) 7 (1,9) Z=-2.1 p=0.04
Seizures 9/17 (53%) 2/34 (6%) χ2 =14.8 p<0.001
Poor variability on initial aEEG 7/16 (44%) 5/34 (15%) χ2 =5.0 p=0.03
Use of sedation during first week 7/17 (41%) 19/34 (56%) χ2 =0.04 p=0.84 * mean difference (95% confidence interval)
8.5 Trends of aEEG Measures in Infants with Normal Outcomes
For the first recording during the first week of life for the 34 infants with normal
outcomes, the lower aEEG margin showed a significant positive correlation with
gestational age at birth, and the upper margin showed a trend towards a positive
correlation (Table 8.4, Figure 8.1). Hence conversely, the percent of the epoch
that the lower margin spent below 5µV (P5 value) showed significant negative
correlation.
Repeated measures for the 4 hour epochs at 24 hour intervals in the first week of
life (117 observations in 34 infants, maximum of 5 observations per patient)
showed a significant increase in the lower, mean and upper aEEG margin during
the first week of life, and conversely a significant decrease in the P5 value (Table
8.4, Figure 8.2). Also using the first measure in the first week and serial
105
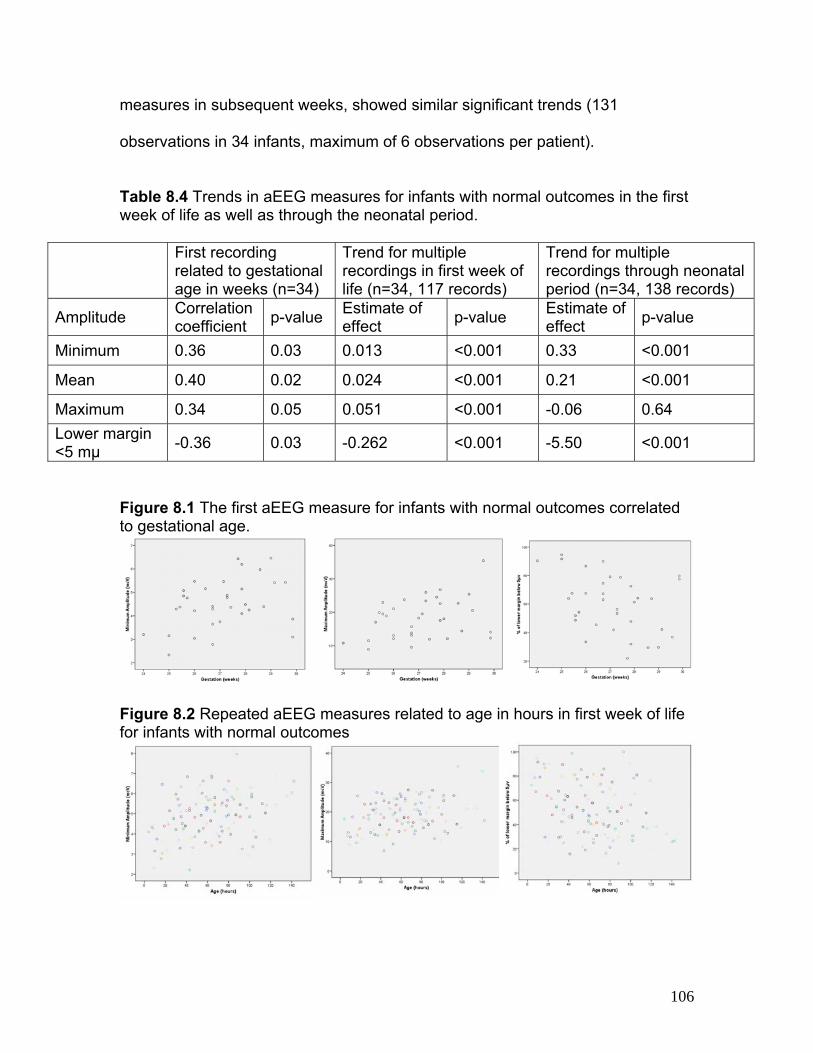
measures in subsequent weeks, showed similar significant trends (131
observations in 34 infants, maximum of 6 observations per patient).
Table 8.4 Trends in aEEG measures for infants with normal outcomes in the first week of life as well as through the neonatal period.
First recording related to gestational age in weeks (n=34)
Trend for multiple recordings in first week of life (n=34, 117 records)
Trend for multiple recordings through neonatal period (n=34, 138 records)
Amplitude Correlation coefficient
p-value Estimate of effect
p-value Estimate of effect
p-value
Minimum 0.36 0.03 0.013 <0.001 0.33 <0.001
Mean 0.40 0.02 0.024 <0.001 0.21 <0.001
Maximum 0.34 0.05 0.051 <0.001 -0.06 0.64
Lower margin <5 mμ
-0.36 0.03 -0.262 <0.001 -5.50 <0.001
Figure 8.1 The first aEEG measure for infants with normal outcomes correlated to gestational age.
Figure 8.2 Repeated aEEG measures related to age in hours in first week of life for infants with normal outcomes
106

8.6 Trends of aEEG Measures in Infants with Normal Outcomes Compared
to Those in Infants with Abnormal Outcomes
The aEEG margins during the first week of life in infants with abnormal outcomes
were significantly lower than in infants with normal outcomes, and the P5 value
(percent of time the lower margin spends below 5µV) was significantly higher
(175 observations among the 51 infants) (Table 8.5). This significance persisted
despite adjusting for gestational age at birth. Similarly, for infants with abnormal
outcomes, the aEEG margins of the first recording in the first week put together
with the aEEG recordings of subsequent weeks were significant lower than those
of infants with normal outcomes. This trend also persisted despite adjusting for
gestational age (183 observations among the 51 infants).
8.7 aEEG Pattern Variability
Twelve of 51 infants (24%) showed a lack of variability of the aEEG lower margin
on their earliest recording (Table 8.3). For one infant, the lower aEEG margin
was difficult to assess due to seizure-like activity causing frequent rises in the
lower aEEG margin. Infants with lack of variability were more likely to be more
premature compared to infants who showed variability (mean (SD); 25(1.3) v.
27(1.2); mean difference (95%CI); 2.2 (1.4, 3.0); p<0.001). Significantly more
infants who died as well as all infants with abnormal outcomes displayed a lack
of variability compared with infants with normal outcomes (Table 8.3).
107
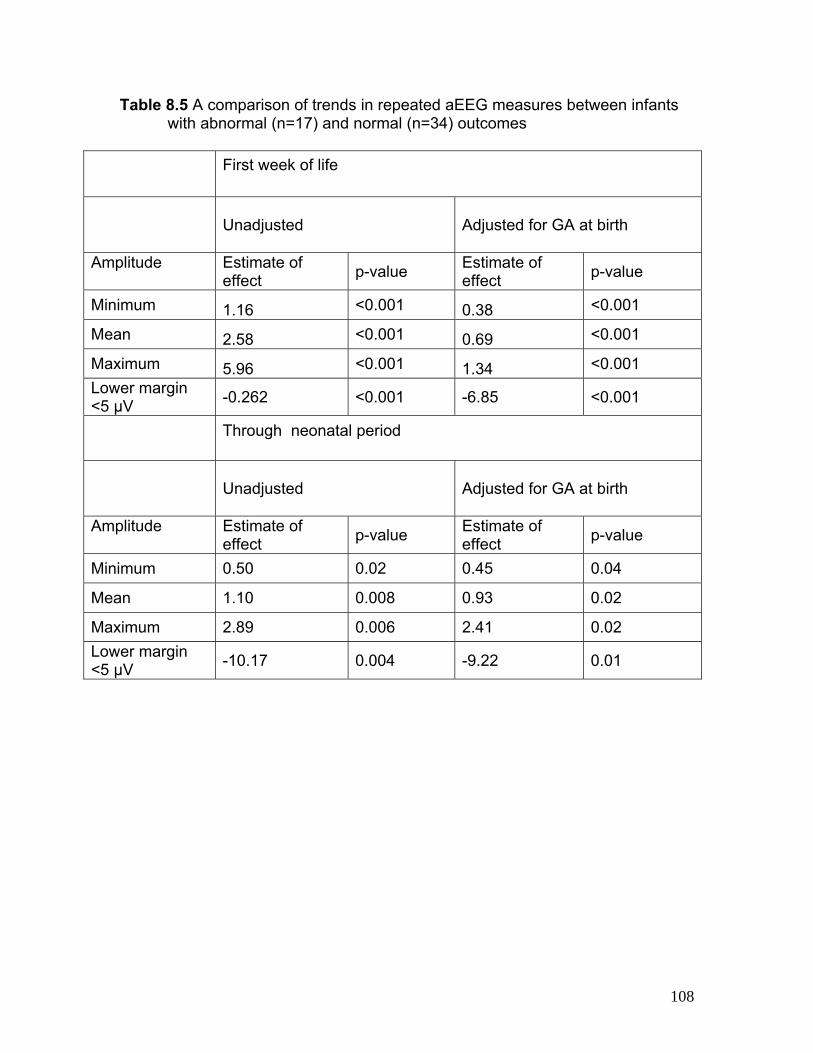
Table 8.5 A comparison of trends in repeated aEEG measures between infants with abnormal (n=17) and normal (n=34) outcomes
First week of life
Unadjusted
Adjusted for GA at birth
Amplitude Estimate of effect
p-value Estimate of effect
p-value
Minimum 1.16 <0.001 0.38 <0.001
Mean 2.58 <0.001 0.69 <0.001
Maximum 5.96 <0.001 1.34 <0.001
Lower margin <5 μV
-0.262 <0.001 -6.85 <0.001
Through neonatal period
Unadjusted
Adjusted for GA at birth
Amplitude Estimate of effect
p-value Estimate of effect
p-value
Minimum 0.50 0.02 0.45 0.04
Mean 1.10 0.008 0.93 0.02
Maximum 2.89 0.006 2.41 0.02
Lower margin <5 μV
-10.17 0.004 -9.22 0.01
108

8.8 Regression in aEEG Variability
A sustained regression in the variability in the lower aEEG margin, from a prior
period of tracing showing variability, was observed in a further seven infants in
the cohort, all of whom were in the abnormal outcome group. In 6/7 of these, this
occurred during the first week of life. Four infants (infants C,D,O and P) suffered
postnatal grade 3/4 IVH, one (patient E) had suffered acute hypoxia-ischemia
due to placental abruption and one (infant J) underwent clinical deterioration
related to NEC, requiring escalation of respiratory support. Infant Q, who was
born at 25 weeks gestation, developed NEC at 30 weeks gestation and showed
loss of variability of the aEEG at this time (Figure 8.3).
Sedation may theoretically bring about depression in the EEG. In this cohort, use
of sedation was relatively low. (See section 8.3 above). Also in cases where
sedation was used, we ensured that the aEEG was not analyzed for a period of
six hours after a bolus.
Figure 8.3 aEEG traces from patient Q recorded at 25, 29 and 30 weeks left to right. Some variability appears at 29 weeks (centre) but is lost at 30 weeks when the infant develops NEC.
109

8.9 aEEG Pattern Maturation
For 27/34 infants with normal outcomes and 11/17 with abnormal outcomes,
sequential intermittent recordings were available until the aEEG pattern showed
regular variability with changes that can be described as sleep-state changes
was seen on visual analysis (Figure 8.4a and b). The earliest age of regular
variability of the aEEG pattern for infants with normal outcomes was earlier
compared to infants with abnormal outcomes at a median PCA at 33 4/7 (range
29 6/7 to 41 1/7) weeks compared to 34 4/7 (range 32 4/7 to 42 1/7), which
trended towards statistical significance (Wilcoxon Rank Sums, Z=0.08, p=0.08).
Figure 8.4a aEEG patterns from infant M born at 24 weeks gestation, carried out at 24, 27 and 41 weeks from left to right. At 24 weeks there is a lack of variability of lower margin. At 27 weeks there is greater variability of the trace and at term a mature pattern is observed.
110
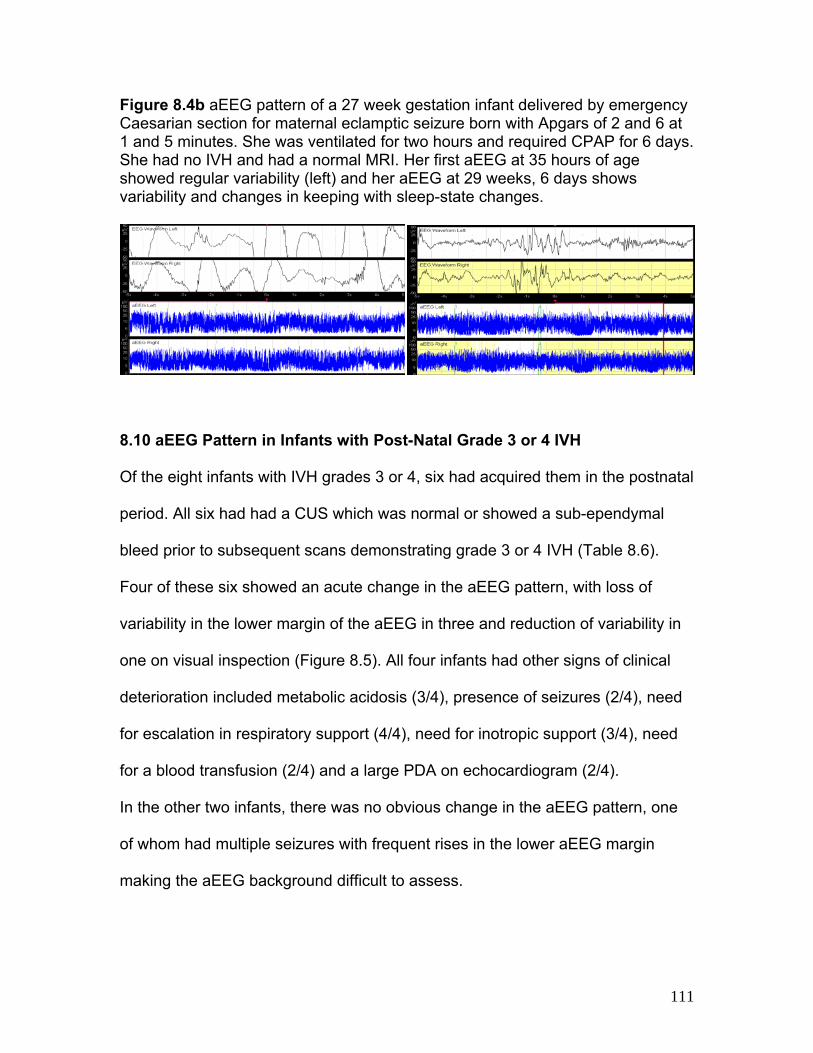
Figure 8.4b aEEG pattern of a 27 week gestation infant delivered by emergency Caesarian section for maternal eclamptic seizure born with Apgars of 2 and 6 at 1 and 5 minutes. She was ventilated for two hours and required CPAP for 6 days. She had no IVH and had a normal MRI. Her first aEEG at 35 hours of age showed regular variability (left) and her aEEG at 29 weeks, 6 days shows variability and changes in keeping with sleep-state changes.
8.10 aEEG Pattern in Infants with Post-Natal Grade 3 or 4 IVH
Of the eight infants with IVH grades 3 or 4, six had acquired them in the postnatal
period. All six had had a CUS which was normal or showed a sub-ependymal
bleed prior to subsequent scans demonstrating grade 3 or 4 IVH (Table 8.6).
Four of these six showed an acute change in the aEEG pattern, with loss of
variability in the lower margin of the aEEG in three and reduction of variability in
one on visual inspection (Figure 8.5). All four infants had other signs of clinical
deterioration included metabolic acidosis (3/4), presence of seizures (2/4), need
for escalation in respiratory support (4/4), need for inotropic support (3/4), need
for a blood transfusion (2/4) and a large PDA on echocardiogram (2/4).
In the other two infants, there was no obvious change in the aEEG pattern, one
of whom had multiple seizures with frequent rises in the lower aEEG margin
making the aEEG background difficult to assess.
111

Figure 8.5 aEEG traces from patients C, D, O and P showing deterioration (arrow) in aEEG background trace with severe IVH.
PO
D C
112

Table 8.6 Characteristics of infants who suffered postnatal grade 3 or 4 IVH
Patient IVH Grade (L, R)
Change in aEEG pattern
seizures Metabolic Acidosis
BE/bic Respiratory Support Escalation
Inotropic Support
Blood Transfusion
Other Note
D 3,3 Loss of variability
No Yes bic 14 Required re-intubation
Yes Yes large PDA
Apneas at time of change in aEEG. Clinical deterioration followed 24 hours later.
C 2,4 decreased variability
No No - CPAP to SiPAP
No No - Apneas commenced with change in aEEG.
O 3,3 significant deterioration
Yes Yes bic14, BE -23
Required re-intubation
Yes No large PDA
-
P 3,4 significant deterioration
Yes Yes bic -25 Required re-intubation
Yes Yes -
N 4,3 No Yes Yes BE -13 No No Yes - Multiple seizures – aEEG background difficult to classify
Q 3,3 No Yes No - CPAP to SiPAP
No No large PDA
-
Key: bic – bicarbonate, BE – base excess
113

CHAPTER NINE
aEEG in Preterm Infants Assists in Detecting Cerebral
Abnormality; Seizure Activity Results
114
9.1 Summary
In the previous chapter, results for quantifiable and qualitative aEEG measures
during the first week and follow-up aEEG recordings were presented for the <30
week cohort of preterm infants. The infants were divided into those with abnormal
and normal cerebral abnormality-related outcomes. To test the hypothesis that
the aEEG assists in detecting cerebral abnormality in the preterm population, the
measures were compared between these two groups. Finally aEEG patterns
were described for infants with postnatal grade 3 or 4 IVH in the context of their
clinical condition, to further confirm the hypothesis.
In this chapter, infants in this cohort displaying electrographic seizure activity on
aEEG monitoring in the first week of life are described. In order to further prove
the hypothesis that the aEEG assists in detecting cerebral abnormality in the
preterm infant, the potential use for aEEG monitors to detect electrographic
seizures in preterm infants will be explored. In this cohort (a) the proportion of
infants who had electrographic seizure activity will be identified, (b) the seizure
burden, morphology and relationship with HR and RR will be characterized and
(c) the relationship between the seizures and cerebral pathology such as IVH will
be investigated.
9.2 Electrographic Seizure Activity
Eleven of the 51 (22%) preterm infants displayed seizures. Figure 9.1 shows
examples of seizures in two infants in the cohort. Table 9.1 compares the
115

characteristics of infants who had seizures with the remaining cohort. Seizures
were first noted at a median age of 26 (range 6-72) hours of life (Table 9.2). All
infants displayed onset of seizures at or before 72 hours of age. The duration of
seizure activity ranged from less than 15 minutes to 4 hours and status
epilepticus. In infants with poor variability or deterioration in the aEEG
background pattern (infants D,E,G and J) the seizures were concentrated in the
early part of the aEEG trace. In the other infants, seizures were found
intermittently throughout the whole recording.
Only two of the 11 infants with seizures (Table 9.2, infants E and G) displayed
clinical seizure activity. These infants had an EEG-video study which confirmed
seizure activity and the infants were treated with anticonvulsant medications (See
Figure 9.2). This brought about attenuation of seizures on aEEG monitoring.
Treatment for seizures was carried out at the discretion of the attending clinician,
and not on the basis of findings from the study. Ten of the 11 infants had
seizures of low frequency (≤ 1 Hz) and one infant (Infant J) displayed a rapid
spiking rhythm of ~ 5Hz.
116

Figure 9.1 Electrographic seizures seen in the aEEG recordings for patients B (panel A) and D (panel B). In both patients, at the rise in the lower margin of the aEEG (arrows) there is polyspike activity between 0.5 - 1 Hz on the raw EEG traces.
Figure 9.2 Low frequency seizure activity captured on conventional EEG (left), predominantly at the central channels for patient E. The aEEG monitoring (right) shows a severely depressed background with frequent seizures on the aEEG (below) as well as the raw EEG (above).The gap in the aEEG recording represents application of conventional EEG.
A B
9.3 Seizures, aEEG and Autonomic Changes
Physiologic parameters were downloaded for 18/51 (35%) infants. Four of these
infants displayed seizure activity on the 2-channel EEG with aEEG recordings.
Three of these four (infants E, I and J) displayed seizures with distinct rises in the
lower aEEG border with accompanying autonomic changes (rise in heart rate) on
visual inspection. Two of these four (infants E and I) displayed frequent seizures
117
(> 1 episode/hour) with accompanying aEEG and autonomic changes (Figure
9.3), whereas the third infant (infant J) displayed one such episode but also had
more seizures without accompanying autonomic changes.
Infant E had suffered perinatal hypoxia-ischemia. His aEEG background showed
depressed lower and upper margins with burst-suppression and a lack of
variability. Multiple seizures were clearly seen with distinct rises in the lower and
upper aEEG margins and low frequency sharp wave activity on the raw EEG
traces. This subsequently evolved into status epilepticus (>50% seizure
activity/hour). This infant had clinical seizures and a simultaneous conventional
EEG-video study, ordered on a clinical basis, revealed frequent seizure activity
(Figure 9.2). He displayed multiple rises in heart rate (15 ± 4%) and drops in
respiratory rate (69 ± 4%) coinciding with the onset of seizure activity as was
clearly demonstrated off-line (Figure 9.3).
Infant I born at 24 weeks gestation, had multiple episodes of low frequency
seizures which preceded the CUS finding of grade 3/4 IVH. This infant did not
demonstrate clinical seizures but did have rises in heart rate concurrent with the
seizures (Figure 9.3). Infant J had multiple seizures, but on only one occasion
was there a coincidental rise in the lower aEEG margin and heart rate which rose
from 127 to 220 bpm.
118

119
Table 9.1 Characteristics of preterm infants with seizures compared to those without
Seizures No seizures Statistic p-value
Male 7/11 (64%) 15/40 (38%) χ2=2.4 p=0.11
Gestation (weeks); mean (SD) 25.5 (1.5) 26.9 (1.4) 1.4 (0.4, 2.4)* p=0.006
Birth weight (grams); mean (SD) 755 (130) 925 (220) 170 (62, 277)* p=0.003
Apgar 5 minutes; median (range) 7 (0,9) 6 (1,9) Z=-1.32 p=0.20
No IVH 3/11 (27%) 31/40 (77%) χ2 =9.8 p=0.002
IVH grade3/4 5/11 (45%) 3/40 (7%) χ2 =9.4 p=0.008
Abnormal Outcome 9/11 (82%) 8/40 (20%) χ2 =14.8 p<0.001
Died 5/11 (45%) 2/40 (5%) χ2 =11.9 p=0.003
* Mean difference (95% confidence intervals), SD standard deviation
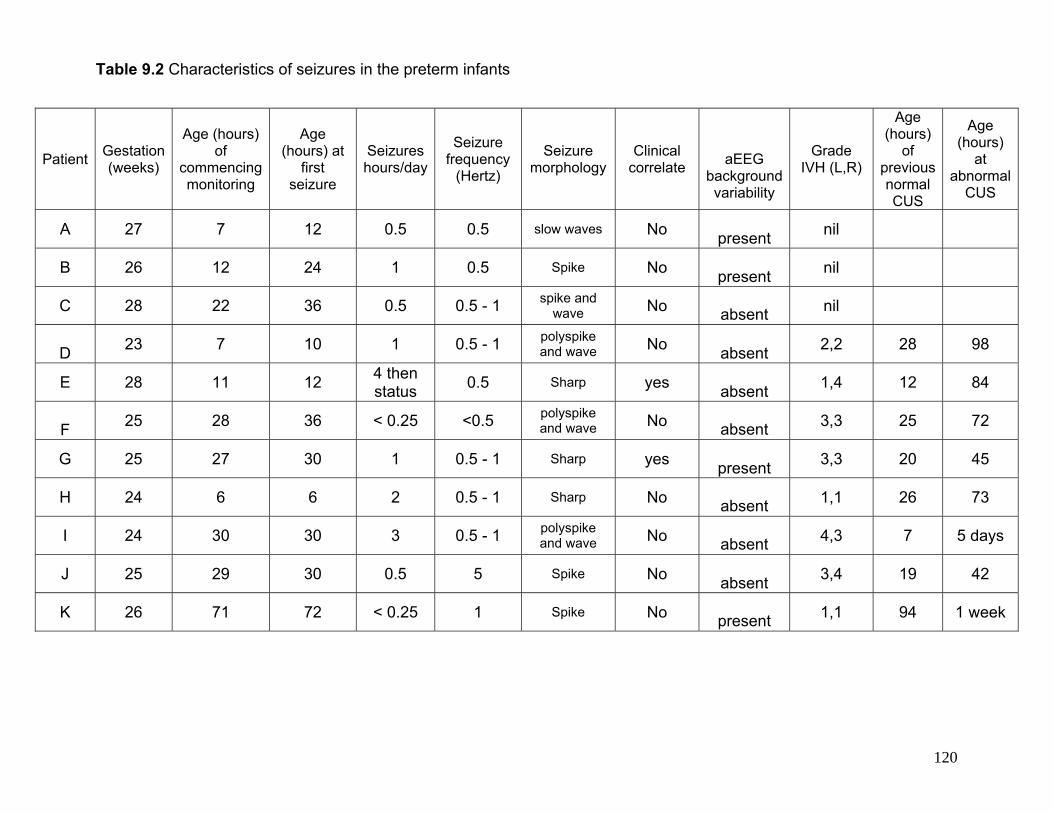
Table 9.2 Characteristics of seizures in the preterm infants
Patient Gestation (weeks)
Age (hours) of
commencing monitoring
Age (hours) at
first seizure
Seizures hours/day
Seizure frequency
(Hertz)
Seizure morphology
Clinical correlate
aEEG background variability
Grade IVH (L,R)
Age (hours)
of previous normal CUS
Age (hours)
at abnormal
CUS
A 27 7 12 0.5 0.5 slow waves No
present nil
B 26 12 24 1 0.5 Spike No
present nil
C 28 22 36 0.5 0.5 - 1 spike and wave No
absent nil
D
23 7 10 1 0.5 - 1 polyspike and wave No
absent
2,2 28 98
E 28 11 12 4 then status
0.5 Sharp yes
absent 1,4 12 84
F
25 28 36 < 0.25 <0.5 polyspike and wave No
absent 3,3 25 72
G 25 27 30 1 0.5 - 1 Sharp yes
present 3,3 20 45
H 24 6 6 2 0.5 - 1 Sharp No
absent 1,1 26 73
I 24 30 30 3 0.5 - 1 polyspike and wave No
absent 4,3 7 5 days
J 25 29 30 0.5 5 Spike No
absent 3,4 19 42
K 26 71 72 < 0.25 1 Spike No
present 1,1 94 1 week
120

121
Table 9.3 Clinical characteristics of infants with seizures
Patient Gestation (weeks)
Apars 1,5 minutes First pH First pCO2 Surfactant
Respiratory support during monitoring
Other clinical details
Details Discharge
A 27 8, 9 7.34 48 No
CPAP Chorioamnionitis
Normal/mild WMA home
B 26 2, 7 7.54 20 Yes
CPAP
Normal/mild WMA
home
C 28 8, 9 7.38 44
Yes
CPAP Multiple high signal T1
abnormalities throughout parenchyma
home
D 23 5, 7 7.41 32
Yes
IPPV
Overwhelming NEC at 24
days age died
E 28 0, 0 6.86 48
Yes
IPPV
Eclampsia, Apgars 0,0,2. Multiple cerebral infarcts. died
F 25 1, 1 7.36 32
Yes
IPPV
Died from overwhelming NEC at 30 weeks PCA died
G 25 3, 6 7.29 45
Yes
IPPV
No VP shunt
home
H 24 3, 5 7.20 55
Yes
IPPV Choriomanionitis,
inotropes
Multiple high signal T1 abnormalities throughout
parenchyma
home
I 24 1, 4 7.19 64
Yes
IPPV
Porencephalic cyst, VP shunt
home
J 25 3, 6 7.29 45
Yes
IPPV
Acute compromise from overwhelming IVH died
K 26 8, 9 7.33 41
Yes CPAP +
IPPV Inotropes
NEC on day 5 of life. Severe BPD and sepsis. died
Key: IPPV- intermittent positive pressure ventilation, CPAP – continuous positive airway pressure
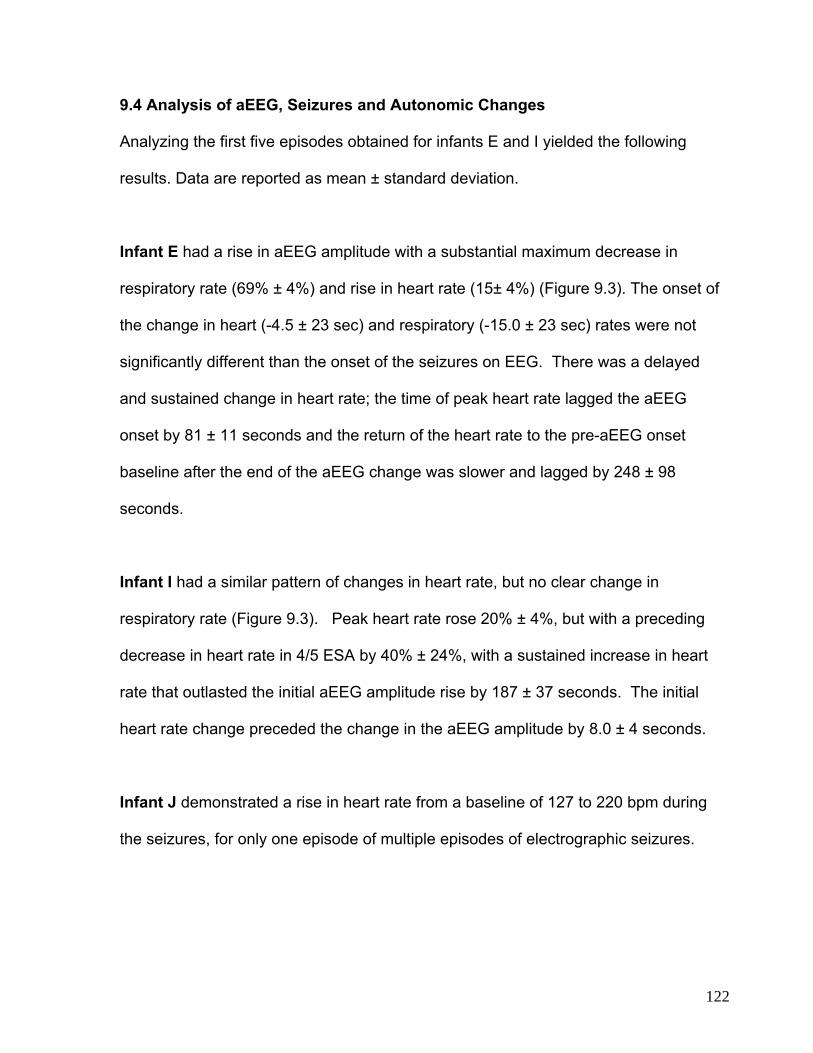
9.4 Analysis of aEEG, Seizures and Autonomic Changes
Analyzing the first five episodes obtained for infants E and I yielded the following
results. Data are reported as mean ± standard deviation.
Infant E had a rise in aEEG amplitude with a substantial maximum decrease in
respiratory rate (69% ± 4%) and rise in heart rate (15± 4%) (Figure 9.3). The onset of
the change in heart (-4.5 ± 23 sec) and respiratory (-15.0 ± 23 sec) rates were not
significantly different than the onset of the seizures on EEG. There was a delayed
and sustained change in heart rate; the time of peak heart rate lagged the aEEG
onset by 81 ± 11 seconds and the return of the heart rate to the pre-aEEG onset
baseline after the end of the aEEG change was slower and lagged by 248 ± 98
seconds.
Infant I had a similar pattern of changes in heart rate, but no clear change in
respiratory rate (Figure 9.3). Peak heart rate rose 20% ± 4%, but with a preceding
decrease in heart rate in 4/5 ESA by 40% ± 24%, with a sustained increase in heart
rate that outlasted the initial aEEG amplitude rise by 187 ± 37 seconds. The initial
heart rate change preceded the change in the aEEG amplitude by 8.0 ± 4 seconds.
Infant J demonstrated a rise in heart rate from a baseline of 127 to 220 bpm during
the seizures, for only one episode of multiple episodes of electrographic seizures.
122

Figure 9.3. Left panels represent infant E and right panels represent infant I. Lower parts of panels A and B represent the left and right hemisphere aEEG. The arrows on the aEEG correspond to the raw EEG signals above. The raw EEG signal. Panel A shows low frequency sharp wave seizure from both hemispheres. Panel B shows low frequency sharp wave seizure from the left hemisphere (upper trace). Panels C and D show the aEEG trace (upper segment) with corresponding changes in heart (centre segment) and respiratory (lower segment)rate. Panel C shows a rise in heart rate (HR) and a decrease in respiratory rate (RR) corresponding to seizures on the aEEG. Panel D shows changes in heart rate corresponding to seizures on aEEG. Panels E and F represent the relationship between aEEG (green) with HR (red) and RR (blue) for the first five consecutive seizures for infants E (panel E) and infant I (panel F). Panel F shows that patient I has drops prior to the rise in HR with no clear relationship between aEEG and RR.
Time (seconds)
-100 0 100 200 300
rate
(p
er m
inu
te)
or a
EE
G a
mpl
itude
0
50
100
150
200
Time (seconds)
-100 0 100 200 300
rate
(pe
r m
inu
te)
or
aE
EG
am
plitu
de
0
50
100
150
200
HR HR
RR RR
A B
C D
FE
123

9.5 Findings in Infants with Seizures and Autonomic Changes
Table 9.3 shows the clinical characteristics of the preterm infants who had seizures.
Infant E had suffered perinatal hypoxia-ischemia. His aEEG background showed
depressed lower and upper margins with burst-suppression and a lack of variability.
Multiple seizures were clearly seen with distinct rises in the lower and upper aEEG
margins and low frequency sharp wave activity on the raw EEG traces. Multiple rises
in heart rate and drops in respiratory rate coinciding with the seizures were captured.
This subsequently evolved into status epilepticus (>50% seizure activity/hour). This
infant had clinical seizures and a simultaneous conventional EEG-video study
revealed frequent seizure activity (Figure 9.2).
Infant I born at 24 weeks gestation, had multiple low frequency seizures which
preceded the CUS finding of grade 3/4 IVH. This infant did not demonstrate clinical
seizures.
9.6 Outcomes in Preterm Infants with Seizures
Infants with seizures had an odds ratio of 18 (95% CI 3-100) for developing an
abnormal outcome. On controlling for gestational age, the odds ratio was 14 (95% CI
2-86) per week of gestational age. Nine of 11 (82%) infants with seizures had
abnormal outcomes, compared to only 8/40 (20%) in the no seizure group (Fisher’s
Exact Test, χ2 =14.8, p<0.001).
124

9.7 Seizures and Grade 3/4 IVH
Five of eight infants who had grade 3/4 IVH had seizures (Table 9.1). Infant E had
suffered perinatal hypoxia-ischemia and the IVH was noted on the first CUS within 24
hours of birth (Table 9.2). In the remaining four infants seizures were noted prior to
high grade IVH detected on CUS, with the infants already having had a normal CUS
(See Table 9.2).
9.8 Seizures and Death of Preterm Infants
Five of the 11 infants (45%) with seizures died compared to 2/40 (5%) of those without
seizures (Fisher’s Exact Test, χ2 =11.9, p=0.003) (Table 9.2). Of the five infants who
died, one had catastrophic IVH (infant J), one had suffered severe hypoxia-ischemia
(infant E) and two died of fulminant NEC in the ensuing weeks (infants D and F). One
infant (infant K) had suffered NEC in the first week of life requiring insertion of an
abdominal drain, but died of end-stage respiratory failure and sepsis later.
125

CHAPTER TEN
Discussion: aEEG in Term Infants with Seizures and/or
Encephalopathy Assists in Detecting Cerebral Abnormality
126

10.1 Summary
We have proved the hypothesis that the aEEG in term infants with seizures and/or
encephalopathy assists in detecting cerebral abnormality as represented by
abnormalities scored on cerebral MRI. The findings of this study are discussed in this
chapter.
10.2 Key Findings from this Study
The median values of the minimum, maximum and mean amplitude which are
measures of the lower, upper and mean margins of the aEEG pattern were inversely
related to the severity of abnormality on MRI for term infants with encephalopathy
and/or seizures. This relationship was upheld when subgroups of infants including
those who had a diagnosis of HIE, infants with diagnoses other than HIE, infants
monitored outside the first 24 hours of life and infants treated with anticonvulsants
were studied.
10.3 What is Already Known and what our Study Adds
Previous studies have described the predictive value of the severity of abnormality of
the aEEG pattern in the first six hours of life from term infants with hypoxia-ischemia
(33, 34) related to longer term outcomes. This predictive value has been extended to
infants with diagnoses other than HIE as well those who were monitored outside the
first 6 hours of life (35). The key and very important finding from our study is that the
aEEG background patterns and measures in these patients are directly related to the
extent of cerebral abnormality as seen on MRI.
127

Studies using conventional EEG have been able to demonstrate a relationship
between severity of encephalopathy and EEG background abnormality in term-born
infants with HIE (20). Our data demonstrates that these findings also hold true for the
aEEG background, in that the aEEG background is directly related to severity of
encephalopathy whether pattern classification or quantified aEEG margin measures
are used. Our study also shows that two channels (central-parietal) can be used in a
similar manner to the previously described single cross-cerebral (parietal-parietal) (34,
35) for this purpose.
We also demonstrated that the relationship between the aEEG measures and MR
abnormality scores also holds in a subgroup of infants who had already received
anticonvulsants. In a small group of patients we were able to demonstrate the
depressing effect of administering anticonvulsants on aEEG amplitudes.
10.4 Strengths and Weaknesses of this Study
This was a retrospective study and as such, these studies are subject to error. The
infants that fulfilled the study criteria were representative of all admissions to the unit.
aEEG monitoring and neuro-imaging were carried out at the discretion of the attending
clinician and hence representative of the local clinical setting. The clinicians were not
blinded to the results and MRI and aEEG findings may have contributed to clinical
decision making.
128

MRI is a tool in a continuous process of evolution. It’s place in the neurological
evaluation of the newborn remains to be defined. And as such there are no universally
accepted acquisition protocols or methods of qualitatively assessing abnormality of
the newborn brain. Within the MR scoring system that we devised and used, there are
qualitative components that are open to subjectivity. We have tried to address
intraobserver variability by rescoring every 10th scan. Longer term
neurodevelopmental outcomes, to confirm the MRI outcomes, were not available for
this cohort. This was due to limited resources as well as the infants coming from a
vast geographical catchment area. To date this is the largest cohort of term infants
reported who have received aEEG monitoring and MR imaging.
10.5 Clinical Applications for this Work
This part of the study further reinforces the use of digital aEEG monitoring as an aid to
clinical neurological assessment. In cases where the clinical examination shows
features of encephalopathy, the aEEG may provide confirmatory bedside evidence
and provides evidence that the severity of abnormality of aEEG trace is related to
extent of cerebral pathology. The aEEG is also useful in infants who are difficult to
assess, such as those who are sedated or muscle relaxed. Some of these infants may
have multiple pathologies e.g. infants with meconium aspiration syndrome or PPHN
may have suffered hypoxia-ischemia. Our study shows that the severity of the
abnormality of the aEEG tracing is related to the extent of cerebral abnormalities as
seen on MRI. Our hypothesis, that the aEEG assists in detecting cerebral abnormality
is proved.
129

aEEG monitoring provides objective bedside clinical evidence of abnormalities of
“electrocerebral well-being”. Hence it has been used for recruiting infants with HIE to
study therapeutic hypothermia (39) and may be valuable in selecting patients in the
future as new methods of neuronal rescue and protection are being tested. Care must
be taken with interpreting the aEEG with respect to artefacts (112) and drift of aEEG
baseline (113).
10.6 Future Directions for this Work
To further assess the robustness of our findings, a study that relates aEEG
background measures to MRI findings as well as later neurodevelopmental outcomes
would be important. This would assist in validating the use of MR scoring as a
“biomarker” for cerebral injury as well as longer term neurodevelopment in the term-
born encephalopathic infant.
The aEEG excludes a relatively large band of frequencies. Very low and high
frequencies may yield additional information. The relationship between novel EEG
techniques such as those using low frequency bands or power spectra and patterns of
cerebral injury requires study.
Now that therapeutic hypothermia is a standard of care in many centres, the
modification of the aEEG background as well as pattern of cerebral abnormality as
130

seen on MRI needs further study. In the presence of hypothermia, the predictive value
of the aEEG background as well as MRI may be altered.
Concurrent studies using bedside modalities such as near-infrared spectroscopy or
optical tomography with the aEEG in infants with HIE may yield pathophysiological
information regarding the effects of cerebral perfusion and oxygenation on producing
aEEG background abnormalities and adverse neurodevelopmental outcome.
In essence the potential for further studies is enormous.
131

CHAPTER ELEVEN
Discussion; The Accuracy of Bedside aEEG Monitors for
Seizure Detection
132

11.1 Summary
In chapter 6 we have shown that using the aEEG with two channels of raw EEG
signals, 76% of electrographic seizures were detected when compared to continuous
multichannel EEG. Hence the aEEG when used with the raw EEG signal reflects an
important manifestation of cerebral injury i.e. seizures. The findings are discussed in
this chapter.
11.2 Key Findings from this Study
From this study, 2-channel bedside monitoring using the aEEG and raw signal
identified electrical seizures off-line in six of seven infants with seizures on ccEEG .
Seventy-six percent of all non-status seizures were identified. The same six patients
had clinical seizures that correlated with electrical seizures, as observed at the
bedside, although clinical correlates were noted in only 37% of all non-status electrical
seizures. The single infant that was missed had a short isolated seizure, the clinical
significance of which may be questionable. The duration of seizures detected using
the aEEG plus 2-channel EEG strongly correlated with the duration of electrical
seizures on the ccEEG.
Ten seizure episodes were not detected with aEEG plus 2-channel EEG. Seven were
in one patient who had focal occipital slow sharp wave seizure activity. The missed
seizures were not brief, with a longer median duration greater than the detected
electrical seizures.
133
11.3 Factors Contributing to Electrographic Seizure Detection; Duration, Focus
and Morphology.
Electrical seizures in newborn infants tend to be predominantly focal or multifocal (80).
Limited channel bedside aEEG monitoring may miss focal seizures remote from the
centro-parietal region, as demonstrated in our study, with focal occipital seizures.
Limited channels also limit visualization of spatial evolution compared to multiple
channels. Our findings suggest that as well as the duration and focus of the seizures,
other important factors that may contribute to seizure detection by limited-channel
bedside aEEG monitoring include the amplitude, frequency and morphology of the
seizure waves.
11.4 “False Positives”
False positives are important as there would be concerns about unnecessary
treatment of infants and the potential harm this can do in the clinical environment.
Over 351 hours, nine false positives were obtained using the aEEG with 2-channel
EEG combination. These false positives were thought to be related to cup electrode
artefact but the exact nature could not be defined without direct observation or EEG-
video. Of the seven “error” patients, four patients had true seizures on ccEEG. Of the
remaining three, one had a short isolated electrical seizure not detected using aEEG
with 2-channel EEG and the other two infants had seven false positive seizure
episodes between them. These three patients had been on anticonvulsant treatment
prior to monitoring and no changes were made in clinical decision making on the basis
of monitoring findings.
134

11.5 Seizure Detection and aEEG Background
Using aEEG alone, there was no substantial difference between one or two channels
for seizure detection although using aEEG alone was clearly less accurate than using
the aEEG plus 2-channel EEG combination. Using aEEG alone, all five seizures in
one infant were missed. On post-hoc review of the aEEG trace, there was no distinct
discernible rise in the lower and upper aEEG margin and these seizures were all less
than 20 seconds duration and were predominantly from infants with normal or
discontinuous aEEG backgrounds.
The time compression in aEEG assists in monitoring background and its evolution
following onset of encephalopathy (34, 37). However for seizure detection on aEEG
alone, time compression necessitates a longer duration of seizure. Hence the ability to
identify seizures using aEEG alone relies not only on experience and expertise of the
users (48) but appears to be related to the duration of the seizures (46) and the aEEG
background.
11.6 Seizure Detection after Treatment with Anticonvulsants
The present study comprised of critically ill infants with a heterogenous group of
diagnoses who had already been treated with substantial doses and multiple
anticonvulsants. This may account for why only one third of this high risk group had
electrical seizures. Anticonvulsants may bring about a quantifiable reduction in EEG
amplitude, as has been shown in the first part of this thesis, and hence suppress
135
136
aEEG background (114). This may potentially affect electrical seizure detection in this
group when compared to infants with no previous anticonvulsant treatment.
11.7 Review of Studies on the use of aEEG for Seizure Detection in the Newborn
Previous studies have made direct comparisons between analog, not digital, aEEG
and conventional EEG for seizure detection in the newborn (46-48) (Table 11.1).
Hellstrom-Westas showed that seizures of short duration (< half a minute) may be
missed by aEEG (46). Toet et al (47) demonstrated high inter-observer agreement,
sensitivity, specificity and predictive values for aEEG when compared to conventional
EEG recordings of 30 minutes duration. Rennie et al (48) found poor inter-observer
agreement and sensitivity for seizure detection for selected aEEG traces in
comparison with EEG-video. However, they used variable aEEG speeds and
inexperienced aEEG raters who had received three to five hours of training. Shellhaas
et al (49) found a very low sensitivity (12 – 38% of 851 individual seizures but 22 –
57% of 125 records) for seizure detection among experienced raters.
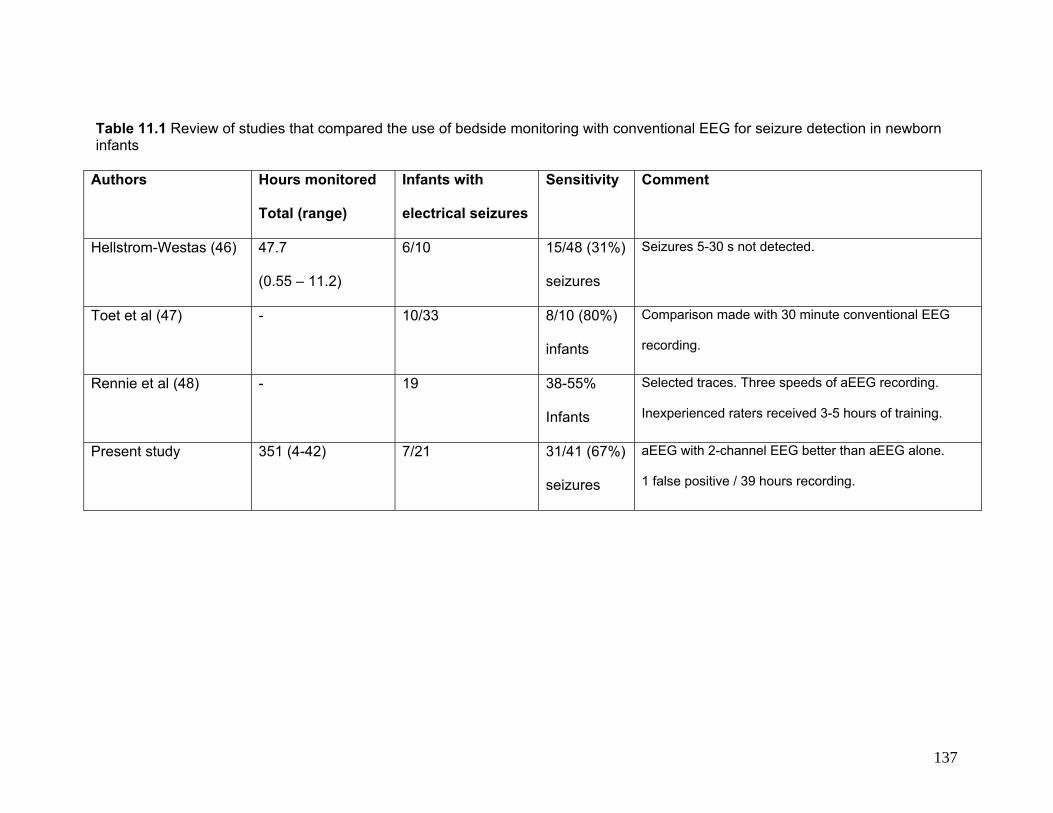
Table 11.1 Review of studies that compared the use of bedside monitoring with conventional EEG for seizure detection in newborn infants
Authors Hours monitored
Total (range)
Infants with
electrical seizures
Sensitivity Comment
Hellstrom-Westas (46) 47.7
(0.55 – 11.2)
6/10 15/48 (31%)
seizures
Seizures 5-30 s not detected.
Toet et al (47) - 10/33 8/10 (80%)
infants
Comparison made with 30 minute conventional EEG
recording.
Rennie et al (48) - 19 38-55%
Infants
Selected traces. Three speeds of aEEG recording.
Inexperienced raters received 3-5 hours of training.
Present study
351 (4-42) 7/21 31/41 (67%)
seizures
aEEG with 2-channel EEG better than aEEG alone.
1 false positive / 39 hours recording.
137

11.8 Conclusions
In this part of the study, we have shown that the digital aEEG monitor using the
aEEG pattern with the raw EEG signal detects 76% of electrographic seizure
activity. Efficacious detection of electrographic seizure activity, which is an
important manifestation of cerebral pathology, contributes to our hypothesis that
the aEEG assists in detecting cerebral abnormality in the newborn.
11.9 Clinical Applications for this Work
The significance and management of electrical seizures in the newborn remains
controversial. However preliminary work suggests that repeated seizures may
exacerbate ischemic injury or lead to direct injury from the seizures per se (80-
82). Given that a substantial proportion of seizures in the newborn are sub-
clinical (115, 116) accurate methods for detecting electrical seizures and simple
methods for quantifying seizure burden is important and as yet not available.
Continuous multiple-channel EEG-video is the gold standard for detection of
electrographic seizure activity; it allows better distinction between seizure activity
and artefact and allows detection of focal seizures that may be missed by limited
channels. However continuous video-EEG monitoring is not available in most
centres. Continuous surveillance for electrographic seizures is labour and
resource intensive and requires trained personnel, particularly to give on-line 24
hour feedback for seizure management.
138

Our study shows that bedside aEEG monitoring using the aEEG in combination
with the unprocessed EEG signal, reviewed off-line by skilled operators provides
acceptable sensitivity, specificity, positive and negative predictive values as
compared with simultaneous continuous conventional EEG. Our preliminary data
confirms that the use of limited-channel bedside aEEG monitor may be effective
in screening at-risk term infants for electrical seizure activity. Electrical seizures
detected on the bedside monitor should be confirmed with conventional EEG or
EEG-video, where available.
11.10 Future Directions
A larger study with bedside EEG monitoring used “on-line” by less experienced
neonatal clinicians around-the-clock is required to assess the feasibility of
monitoring for electrical seizures in the neonatal intensive care unit. Real-time
seizure detection with limited-channel bedside monitors may provide a more
practical alternative to EEG-video and multi-channel EEG monitoring particularly
when reliable, computerized seizure detection algorithms (117) have been
developed and validated for use in newborns.
Further work needs to be carried out to relate seizure morphology and
quantifiable seizure burden to cerebral pathology as well as long term outcomes.
Once it is shown that seizure burden in the newborn has a direct impact on
neurodevelopmental outcomes, independent of underlying pathology, then we
can start optimizing treatment of seizures in the newborn. There is emerging
evidence that the rapidly developing newborn brain may not respond to
139

anticonvulsants in the same way as an older child’s or adult’s brain. In the
perinatal period, gamma amino butyric acid (GABA) activation is associated with
chloride efflux and excitation, rather than influx and inhibition as occurs after
GABA activation of the major GABA-A receptor in the mature neuron (40). Many
anticonvulsants are thought to act by facilitating GABA activation. Clearly much
research is required to develop anticonvulsants targeted at the developmental
stage of the newborn brain.
140

CHAPTER TWELVE
Discussion; aEEG Measures in Relation to Cerebral
Abnormality Outcomes in Preterm Infants
141

12.1 Summary
In chapter 8, we showed that preterm infants with abnormal cerebral abnormality-
related outcomes had significantly depressed quantifiable aEEG measures and
less lower margin aEEG variability on visual assessment compared to preterm
infants with normal outcomes. Hence we have proved our hypothesis that the
aEEG assists in detecting cerebral abnormality in preterm infants. These findings
are discussed in this chapter.
12.2 Important Findings from this Study
Our study demonstrates that during the first week of life, aEEG amplitude
measures representing the lower and upper margins and their mean increase
significantly in preterm infants < 30 weeks gestation, in infants with normal
outcomes. Conversely the period of time the lower margin spends below 5µV
decreases. This trend continues through the neonatal period. These aEEG
measures are significantly lower in preterm infants with abnormal outcomes
when compared to preterm infants with normal outcomes and conversely the
infants with abnormal outcomes have significantly greater P5 values. These
findings persist even after controlling for gestational age at birth.
On visual analysis of the aEEG background pattern, infants who had poor
variability of the lower aEEG margin were more like to be immature and also
more likely to have an abnormal outcome. On intermittent recordings throughout
the neonatal period, an aEEG pattern with regular variability and findings
consistent with sleep state changes was seen as early as 29 weeks PCA (See
142
Figure 8.4b). Infants with abnormal outcomes showed a trend towards delay in
this appearance (34 v. 33 weeks PCA).
Seven of the 51 infants showed a regression in the aEEG background pattern. All
seven had abnormal outcomes. The regression in the aEEG background was
related to severe IVH in four, NEC in two and general deterioration after perinatal
hypoxia-ischemia in one.
12.3 How These Findings Relate to Other Studies
Our work complements other studies which have shown progressive changes in
various EEG measures in preterm infants during the first week of life, in the
absence of substantial cerebral abnormality. Victor et al (118) demonstrated an
increase in the relative power of delta on spectral analysis as well as a decrease
in the inter-burst interval in the first four days of life in preterm infants under 30
weeks gestation recorded for a period of 75 minutes each day. In a group of 63
infants under 32 weeks gestation, West et al (119) showed increasing continuity
at 25 and 50μV thresholds as well as median amplitude in the first week of life
over 60 minute epochs. We chose a relatively longer epoch of 4 hours to analyze
so that multiple sleep state changes as well as general movements would be
incorporated.
The progression in measures we have observed during the first week of life may
represent rapid adaptation of the brain to ex-utero life as well as cerebral
maturation. EEG studies also show maturational changes in the EEG
143

background in preterm infants with increasing PCA, such as increasing burst
frequency and decreasing interburst interval (9). Our study demonstrates a rise in
aEEG amplitudes with increasing gestation as well as PCA.
Few studies have made comparisons of aEEG measures between preterm
infants with cerebral abnormality to those without. Hellstrom-Westas et al (57)
demonstrated, in a small cohort of sick preterm infants, that more continuous
aEEG background activity was predictive of more favourable outcomes. In six of
their 21 monitored infants the aEEG showed “electrocerebral inactivity”. Five of
these infants died and one infant survived with severe neurologic handicap. In a
separate study Hellstrom-Westas et al (58) demonstrated that among infants with
severe grades of IVH, those with lower burst frequencies had poorer outcomes.
Conversely we have shown that infants with abnormal outcomes had lower
aEEG measures and had greater periods with the lower aEEG margin below 5μV
in the first week of life as well as through the neonatal period.
12.4 Difficulties Encountered During this Study
The aim of this study had been to commence aEEG monitoring in preterm infants
as soon after birth as possible. Delays were encountered in obtaining post-natal
consent often due to time needed for decision making as well as fitness for
consent. Once consent was obtained, application of EEG took a lower priority to
necessary clinical procedures. Monitoring for infants who were sick and did not
tolerate handling was postponed. Obtaining adequate electrode impedance
144

provided challenges, particularly with changes to skin maturity for follow-up
recordings and at other times related to rogue batches of electrodes.
12.5 Strengths and Weaknesses of this Study
This was a clinical observational pilot study. Because the numbers were small,
information from CUS, MRI and survival outcome data was used in combination
as part of the outcome. With these small numbers we were not able to relate
more subtle abnormalities to aEEG patterns. Longer term neurodevelopmental
outcome data was not available for this study and the study was not powered to
detect differences in neurodevelopmental outcomes in surviving infants. However
one of the strengths of the study was that the infants recruited were
representative of the general NICU admissions.
12.6 Relevance of Study Findings to Clinical Practice and Future Directions
for this Work
Our study shows that there is scope to extrapolate aEEG findings from the term
encephalopathic infant studies to the preterm infant, however the situation is
much more complicated due to the different stages of cerebral maturity, the
variable clinical course of the preterm infant and the often longer and more
variable time course of events.
Our work shows that preterm infants with poor variability of the lower margin of
the aEEG are more likely to have worse outcomes. Preterm infants who had
suffered documented acute perinatal hypoxic-ischemic events showed markedly
145

poor variability of the aEEG trace. Also sustained regression of the aEEG
pattern, at any stage, is an ominous sign and in our cohort was associated with
the infant suffering severe IVH or NEC. The aEEG may be a useful monitoring
tool in preterm infants in order to study interventions or therapies for IVH and
NEC or to study neuroprotective interventions. Larger cohorts are required in
order to study the relationship between aEEG measures in the neonatal period
and neurodevelopmental outcomes.
aEEG studies with near-infrared spectroscopy (NIRS) and heart rate, respiratory
rate, oxygen saturation and blood pressure data with neurodevelopmental
outcomes may provide information about cerebral oxygenation and perfusion
changes that bring about the EEG changes. They may provide further
information about cerebral autoregulation and relationship to later outcomes. All
this information may assist inform the clinical care of our infants.
146

CHAPTER THIRTEEN
Discussion for Electrographic Seizure Activity Related
to Cerebral Abnormality Outcomes in Preterm Infants
147
13.1 Summary
In chapter 9, we showed that digital aEEG monitoring in preterm infants,
particularly those with abnormal outcomes, may detect electrographic seizure
activity within the first 72 hours of life. In this chapter, the prevalence of electrical
seizures in the preterm cohort, the relationship with autonomic changes and
outcomes are discussed.
13.2 Key Findings from the Study
Twenty-two percent of infants under 30 weeks gestation in this cohort displayed
seizures on digital 2-channel aEEG with raw EEG monitoring in the first week of
life. Infants who had seizures were more likely to be immature and were at
greater risk for poor outcomes than those who did not, even after adjusting for
gestational age. Hence, seizures were more commonly seen in the small very
sick preterm infants in the first 48 hours of life who had cerebral abnormality
including high grade IVH. Although not studied in this thesis, it is important to be
aware that seizures may occur later with any acute illness.
13.3 Electrographic Seizures in Preterm Infants
Electrographic seizure activity on conventional EEG has been recognized in the
preterm infant in association with intraventricular haemorrhage (120) and
adverse neurologic sequela (121). Epidemiological data suggest that seizures
are more common in infants of low birth weight (40, 41). Scher et al (122)
described 92 newborns with electrographic seizures, recorded over a four year
period at a single centre. Two-thirds were preterm and almost one half of these
148

displayed electrographic seizures in the first 48 hours of life. Most of the preterm
infants had cerebral lesions, with half having IVH with either ventricular dilatation
or intraparenchymal extension (grade 3 or 4). In a cohort of 275 preterm and
term infants, Connell et al (123) found electrographic seizures in 55, mostly in
association with serious cerebral pathology.
13.4 What is Already Known About Seizures in Preterm Infants and the
aEEG
Using analog aEEG without the raw EEG trace, Hellstrom-Westas et al described
activity thought to represent electrographic seizure activity in three quarters of a
group of preterm infants under one kilogram at birth, who had IVH (57). A more
recent study, also using aEEG alone, described increasing likelihood of
suspected seizures on the aEEG with worsening grade of IVH in preterm infants
during the first two weeks of life (124). However this data must be interpreted
with caution as we have shown that using the aEEG trace alone is not reliable for
seizure detection. In the present cohort, using digital aEEG with raw EEG, five of
the eight infants with grade 3/4 IVH were noted to have seizures. In four of the
five, seizures were noted prior to an abnormal CUS, the infants previously having
had a normal CUS. Thus seizures may represent a marker of an evolving
cerebral insult and/or cerebral irritability from the intraventricular haemorrhage.
13.5 Seizures and Autonomic Changes
The amygdala, insular cortex and the hippocampus are thought to be important
structures for the autonomic regulation of heart rate and rhythm (125). Hence
149

ictal tachycardia commonly accompanies temporal lobe epileptic seizures, and in
a substantial proportion of epileptic patients precedes the electrographic seizure
detected at the scalp (126). Importantly, experimental studies demonstrate that
autonomic changes accompanying seizures may be an adaptation response to
increased metabolic demands during seizures (127). Boylan et al (128)
demonstrated an increase in cerebral blood flow in a small group of infants
undergoing seizures.
However data on autonomic activity associated with seizures in newborns are
more limited. An EEG study of seizures in 14 severely asphyxiated neonates
found a change in heart rate accompanied only 12% of individual seizures but
occurred in 8/14 (57%) infants (129). In their NICU based EEG study Scher et al
(122) reported that a larger proportion of preterm infants had autonomic changes
accompanying seizure activity compared to term infants [7/19 (37%) versus 1/16
(6%)]. Our data in a more limited number of infants (n=4) remain consistent with
these observations. The temporal relationship of autonomic changes to the onset
of seizures is unclear, other than a delayed and sustained rise in heart rate,
especially given the difficulty of determining seizure onset precisely with the
limited number of EEG channels.
13.6 Seizure Morphology in Preterm Infants
Although the wave forms of seizures detected in our cohort span the varieties of
waveforms observed in electrographic seizure activity, all but one infant
displayed low frequency rhythmicity. A more complete characterization of
150

morphology would require multiple channels of EEG in a larger cohort. A study of
characteristics of EEG ictal activity in newborn infants reports that rhythmic delta
activity was the most common form of seizure morphology reported in preterm
infants (130).
13.7 Weaknesses and Strengths of this Study
aEEG monitors are commonly used in the NICU as a monitoring tool for
electrographic seizures in the full term newborn. In the early part of this thesis,
we have shown that using digital aEEG with the raw EEG, 76% of electrographic
seizures may be detected in term infants, when used off-line by experienced
raters. One or two channels cannot detect all the electrographic seizure activity
detected using multiple channels as short and focal seizures will be missed (46)
thus the seizures detected in the present study is likely to be an under-
representation of total seizure activity.
Our study has additional limitations. This is a relatively small cohort study which
is not powered to study the impact of seizures on longer term outcomes in
survivors. In this study, monitoring was only commenced after informed consent
was obtained after the birth of the infant. The median age at commencing aEEG
recording was just prior to median age at first detecting seizure activity, hence
seizure activity prior to commencing monitoring may have been missed. The
attending physicians were not “blinded” to the monitoring and the possibility that
management of infants was affected cannot be discounted. It is also possible that
clinical seizure activity was not detected as video monitoring was not used as
151

part of the study. Many infants in the cohort did not have physiologic data
available. Also, the assessment of seizures and its relationship to autonomic
changes was carried out off-line.
However, the infants studied were representative of admissions to the NICU and
had similar characteristics to infants not recruited. The relatively high incidence
(16%) of severe IVH in this group of infants may reflect that the recruitment
centre is a tertiary referral centre serving a large geographic catchment and
population.
13.8 Conclusion
Our data show that in a representative group of very preterm infant
electrographic seizure activity is not uncommon and is associated with adverse
outcomes. The presence of seizures may be a marker for evolution of severe
IVH. The association with autonomic changes in three infants in our study as well
as clinical seizure activity in two infants supports that this is true electrographic
seizure activity. Further studies with larger cohorts of preterm infants are required
to gain a better understanding of the significance of seizures in the preterm
infant.
13.9 Further Work in this Area
Larger cohort studies are required to gain a better understanding of the
significance of seizures in the preterm infant. Our study shows that
electrographic seizures as detected by continuous aEEG with 2-channel EEG
152

signal monitoring often precedes detection of cerebral pathology using other
modalities such as CUS. The use of continuous aEEG monitoring may in future
be used to alert clinicians of impending pathology; the seizures may represent
evolving neuronal/cerebral injury. Hence such monitoring may assist selection of
patients for neuronal rescue therapies when such treatments become available in
the future, before injury becomes established.
Our study suggests that spontaneously recurring sustained changes in heart
and/or respiratory rate in preterm infants may be an indication that an aEEG or
EEG study should be performed to detect seizures. Physiologic parameters
aligned with digital aEEG monitoring, as carried out in this study, may provide a
simple aid for seizure detection. The relationship between seizure morphology as
well as burden and cerebral pathology as well as neurodevelopment in preterm
infants requires further study.
As with term infants with seizures, studies using NIRS, aEEG, MR imaging and
autonomic changes may provide a better understanding of changes in cerebral
perfusion, evolution of cerebral injury and neurodevelopment.
153

CHAPTER FORTEEN
Overall Conclusion and Implications of the Findings
from this Thesis
154

14.1 Conclusion
It can be argued that the central hypothesis of this thesis, that the aEEG assists
in detecting cerebral dysfunction in the newborn was proved. In term-born infants
referred with seizures and/or encephalopathy, depressed aEEG measures and
severity of abnormality of aEEG trace were found to be directly related to severity
of abnormality on MRI as measured by MR abnormality scores. Preterm infants
under 30 weeks gestation, infants who had substantial cerebral abnormality as
defined by high grade IVH on CUS and/or moderate or severe white matter injury
on MRI at term and/or death for any reason had depressed aEEG measures
compared to the rest of the cohort, in the first week of life and on follow up
monitoring through the neonatal period. Infants who had initial poor variability of
the aEEG background pattern or who reverted to a poor variability pattern also
had worse outcomes. Seizures, an important sign of cerebral abnormality in the
newborn, were detected in the first 72 hours in preterm infants, and were noted
to often precede severe IVH and were also associated with worse outcomes. In
three patients, seizures were accompanied by autonomic changes, providing
evidence for true electrographic seizure activity in small, sick preterm infants.
When compared to conventional EEG, digital bedside aEEG monitoring in term
infants was found to have a sensitivity of 76% for electrographic seizure
detection.
14.2 Cerebral Abnormality
Clearly there are a number of caveats and provisos that need to be considered
before the hypothesis is accepted as proven. Cerebral abnormalities, in the
155

context of this thesis, broadly covered abnormalities seen on imaging as well as
abnormal neurologic function as represented by electrographic seizure activity.
For pragmatic reasons, in the case of preterm infants, the subjects were included
in the abnormal outcome group if they died for any reason even if it was due to
NEC at a later time, even though death may not have been directly related to
cerebral abnormality as such.
14.3 Assessing Neurology and Monitoring Cerebral Function
There are various methods of assessing the neurologic function of the newborn
infant. The time tested clinical examination remains one of the most sensitive
means of assessing the neurologic state of the newborn infant at the bedside
(131). However in the sick preterm infant who does not tolerate handling or is
under the effect of sedation, it’s value is limited. Likewise many term infants who
have HIE, often have coexisting morbidities such as meconium aspiration
syndrome and persistent pulmonary hypertension and may be muscle relaxed. In
these infants clinical examination is of limited use.
14.4 Imaging and the Newborn Brain
Cranial ultrasound remains the primary bedside imaging modality. Despite
providing images of limited resolution, it remains an excellent bedside resource
particularly for imaging germinal matrix - intraventricular haemorrhage in preterm
infants. In experienced hands it provides much more information including
abnormalities in the posterior fossa as well as cerebral white and deep nuclear
grey matter abnormality.
156

Other modalities of imaging including CT and MRI entail taking the infant to the
scanner. CT imaging is readily available in many centres but entails high dose x-
radiation and provides low resolution images but with rapid sequences. It is
commonly used clinically to image traumatic brain injury, particularly extra-axial
bleeds or in the cases where MRI is not available. MR provides high resolution
images but image acquisition time is longer, and obtaining motion and artefact-
free images remains a constant challenge.
14.5 Clinical Investigations of the Preterm Brain
In-vivo brain images provide a “snap shot” at a given moment in time. Cranial
ultrasounds are typically carried out at regular periods in the preterm infants
according to local protocols or in response to clinical need when it arises. High
grade IVH remains an important early pathology in the preterm infant with a
substantial mortality as well as acute and chronic morbidity. The incipient
haemorrhage into the cranium may be associated with haemodynamic
compromise with hypotension and the need for inotropic support, acidosis and
anaemia. In this scenario, repeated cranial ultrasounds show evolving IVH. MR
cerebral imaging is increasingly used in the preterm infant but its place in the
clinical setting remains to be defined.
Serial conventional EEG studies in preterm infants have been used in clinical
practice particularly in centres in France and Japan (132, 133). They have been
useful in studying normal brain maturation during a phase of rapid growth and
157
change. They have been shown to be useful in the early diagnosis of
presymptomatic or subclinical but serious cerebral pathology as in the case of
positive rolandic sharp waves and periventricular leukomalacia and adverse
neurodevelopment (17). White matter injury represents an important constellation
of cerebral abnormality in this group. In this context they have been found to be a
useful adjunct to cranial ultrasound.
Infants born prematurely are at a substantial risk of adverse neurodevelopmental
outcomes including cerebral palsy (134, 135). Infants undergo various therapies
and are also subject to various morbidities while they receive neonatal intensive
care (87). Despite all the advances, as yet there are no simple or effective
methods for monitoring cerebral function or well-being continuously in the
preterm infant population who require intensive care.
14.6 Clinical Investigation of the Term-Born Infant Brain
In the term-born infant, the situation is somewhat different. Unlike preterm
infants, the majority of term-born infants do not require intensive care. They
come to our attention when there are signs of fetal “distress” or compromise in
the antenatal or perinatal period or a baby is born requiring resuscitation or is
noted to have abnormal feeding or behaviour in the neonatal period. The context
and time course of hypoxia-ischaemia affecting multiple systems is usually
different to the morbidities affecting the preterm infant requiring intensive care.
The full term infant is at a more advanced stage of neurologic development and
cerebral maturation than the preterm infant. In this group, basal ganglia and
158

thalami injury represents a particularly important pattern of cerebral abnormality,
particularly after severe acute hypoxic-ischaemic insults such as those seen after
placental abruption and uterine rupture (104).
In term-born infants, cranial ultrasound is of more limited value. MR imaging is
used much more commonly in tertiary centres. Conventional multichannel EEG is
commonly used and the EEG background provides a strong correlation with the
severity of encephalopathy and neurodevelopmental outcome, particularly when
used early (22, 25). In most centres, a relatively short period of recording is
obtained, providing a “snap shot”. Continuous multichannel video-EEG is used in
some centres, particularly to monitor for electrographic seizure activity. This
modality is extremely resource intensive and is not available to most centres.
14.7 Amplitude-Integrated EEG
The aEEG was created and used in the early 1960s at the London Hospital out of
a need to monitor cerebral function practically and simply in adults undergoing
anaesthesia for cardiac by-pass and intensive care at a time when advances in
intensive care management allowed for easier monitoring of cardiovascular and
respiratory function. As such it was created as a monitoring tool.
The aEEG is essentially a summary trace created from one or two channels of
raw EEG. A typical aEEG trace will display an hour of recording over 6cm. Very
high and very low frequencies will be excluded. As such much
159
electrophysiological information will be lost. So from the time of its inception, the
limitations of such a technology have been all too apparent.
14.8 aEEG Background in the Term Newborn Infant and Findings from this
Thesis
However despite these limitations, the application of this technology as early as
the first three hours of life applied to the newborn with HIE has been convincingly
shown to be predictive of neurodevelopmental outcome (34) and as such the
value of such a tool with an early predictive value to assist selecting patients for
neuroprotective strategies is apparent (39, 136).
The relationship between the CFM patterns in the newborn with HIE and the
associated later neurodevelopmental outcomes have been well described (34-
38), however the mediating cerebral abnormality, as seen on neuroimaging, has
not been well described until recently. In our retrospective study relating the
aEEG margins to the MR images we were able to show a relationship between
the severity of encephalopathy and aEEG depression. We also showed a strong
relationship between the severity of lower aEEG margin depression and the
severity of abnormality of cerebral MRI.
In the current available literature there are no studies as large as ours directly
relating the aEEG background to degree of cerebral abnormalities on MRI. In a
study of infants selected for therapeutic hypothermia, Sarkar et al (113)
correlated aEEG findings in the first six hours of life with short term outcomes of
160

early death related to HIE or MRI findings consistent with HIE for 46 infants. They
found a low sensitivity and a low predictive value when using the aEEG
background classification proposed by al Naqeeb et al (35). They had not used a
quantified MR abnormality score. Also they had not accounted for CFM baseline
drift, which may introduce error when using the al Naqeeb scoring method.
14.9 aEEG Background and Term Infants; Future Work in this Area
Bedside equipment that is simple to apply and allows continuous monitoring for
prolonged periods of time providing trends in cerebral function is potentially very
valuable and powerful. The use of the aEEG to date has focused in the setting of
global hypoxia-ischaemia. It is intriguing to know whether using more than one
aEEG channel providing a separate trace from each hemisphere may allow
detection of unilateral cerebral or focal abnormalities. There is some preliminary
work, carried out by our team (137), as well as a more recent study by van Rooij
et al (138) in this area. This latter study suggested that although there was no
significant difference between the single cross-hemisphere channel compared to
two channels, in a few cases, two channel aEEG did provide additional
information with respect to focal abnormalities in terms of seizures and difference
in aEEG background. It would be of great interest to know what type of focal
injuries may be detected with more than one channel and what is the optimum
position of electrode placement.
Similarly more work needs to be carried out to assess whether EEG measures
are particularly more helpful in predicting specific patterns of cerebral injury as
161
seen on MRI. The white matter-predominant water-shed distribution
abnormalities seen in term infants thought to have had sub-acute insults,
presumably due to preferential redistribution of blood to regions of higher
metabolic requirement (74, 75) may be expected to demonstrate less severe
EEG abnormality than the case of severe acute hypoxic – ischemic insults that
produce the cortical and deep nuclear grey matter abnormalities.
A substantial proportion of infants in many institutions are now treated with
therapeutic hypothermia. The effect of hypothermia on modification of the EEG
and altering the predictive value of the aEEG during the cooling process requires
study. Observational studies show that the cooling process itself produces some
depression in the EEG (139). This would suggest that the predictive value of the
CFM during cooling may be reduced. This area is currently under study (140,
141) but more information is required.
Modifying the aEEG to include low (<2 Hz) and high frequencies that are
excluded by the CFM, as provided by the so-called full band EEG (142) requires
further study as this may yield more useful information.
14.10 The Accuracy of the aEEG Monitor for Seizure Detection
The efficacy and accuracy of aEEG monitoring for electrographic seizure
detection and its place in monitoring the newborn infant is being increasingly
studied. Our study confirms the finding of others that using the aEEG trace alone
for seizure detection is not effective (48, 49). We showed that when using the
162

aEEG trace with the raw EEG on the modern digital aEEG monitors, three
quarters of seizures were detected off-line by experienced raters.
14.11 aEEG Monitors and Seizure Detection; Future Work
Despite much experience in treating newborn infants with seizures, we still have
a very limited understanding of the importance of seizures and the need for
effective treatment in the newborn. Using MRS, Miller et al (82) demonstrated
that seizures were independently associated with increased lactate/choline ratios
in newborns with HIE. McBride et al (83) showed that later neurodevelopment
was related to seizure burden. Studies are required that can sensitively identify
newborns who have electrographic seizures, accurately calculate the burden of
seizures and relate them to later neurodevelopmental outcomes. Once this
question of the importance of seizures has been addressed, we can then get on
with the task of defining the groups of infants and underlying pathologies where
seizure treatment is required and then finding the best means of treating
seizures.
Despite the small number of patients in this part of the study, we were able to
demonstrate the variety of underlying brain pathology in infants referred with
seizures. Similarly there was variation in the demographic of distribution and
morphology of electrographic seizure. In term infants, much work needs to be
carried out to relate seizure morphology to underlying brain pathology.
163
When using limited channels, optimal electrode placement is important so that
the best pick up rate is obtained. Studies show that electrode placement in the
central and temporal areas may produce higher yields (50, 143). More work
needs to be done to define the optimum number of electrodes and channels so
that the simplicity of the system is maintained but the sensitivity for seizure
detection is optimized.
Finally there is much excitement on the use of automated seizure detection
algorithms. Such an algorithm is available for use with the type of digital aEEG
monitor used in this study (117). The off-line use of this algorithm has been
tested in the setting of a prospective aEEG monitoring study in term-born infants
admitted to a NICU with encephalopathy and/or seizures (144). The algorithm
was able to detect 615/1116 (55%) seizures in the 25 of 40 patients who had true
seizure activity. The positive predictive value was 73% with a false positive rate
of one per 11 hours. Shorter seizures were more likely to be missed with a
detection rate of 19% (72/371) for seizures less than half a minute long, but
increasing to 87% (343/395) for seizures lasting one to 10 minutes. Using the
same automated system, van Rooij et al (145) studied 214 seizures in 15
patients. The algorithm detected 140/214 (65%) of the seizures, with a false
positive rate of one per 13.5 hours of recording.
14.12 aEEG and the Preterm Infant
Research on the use of aEEG in the preterm infant has been going on at least as
long as research in using the aEEG in the term infant. However the aEEG has
164

not, as yet, found a clinical niche with use in the preterm infant in the way that it
has in the term infant. This is partly due to the fact that the EEG signal in this
group is firstly subject to continuous maturation with increasing gestation. Also
although the preterm infant may suffer perinatal hypoxia-ischaemia in the same
fashion as the full term infant, the predominant patterns of cerebral abnormality
that a preterm infant suffers are different and may also be affected by therapies
and morbidities that he or she undergoes postnatally while receiving intensive
care (87).
In our study of the aEEG in the preterm infant, we showed that infants who had
abnormal outcomes were more likely to have more depressed EEG measures.
There are more and more studies using the aEEG as well as limited channel
EEG in the preterm infant (146-148) and data that may be applicable to the
clinical work place should soon be available.
We were able to demonstrate increasing continuity, as demonstrated by the
increase in lower margin, and variability of the aEEG pattern with increasing
gestation at birth and also with increasing post-conceptional age in infants with
normal outcomes. Two groups (147, 148) have recently published similar
findings. Soubasi et al (147) also show that preterm infants of younger gestation
show more rapid maturation of the aEEG pattern. This is in keeping with our
findings that some preterm infants demonstrate a very high degree of aEEG
variability as early as 29 weeks gestation post-conception.
165

In this group of infants we were able to show that those infants with abnormal
outcomes were more likely to have more depressed aEEG measures compared
to those with normal outcomes. Similar findings have recently been reported by
Bowen et al (149). We observed a distinct change in the aEEG pattern in relation
to severe IVH.
14.13 aEEG Monitoring and the Preterm Infant; Future Work
Much work needs to be done on monitoring systems for preterm infants before
they will find a place in the clinical environment. At present cerebral abnormalities
and related factors, such as high grade IVH or NEC, that impact on the
neurodevelopmental outcomes in preterm infants are still being defined. Once
these are better defined and measures to prevent or treat these abnormalities
are available then the next step will be to devise monitoring systems that will
assist in detecting these cerebral abnormalities early.
Clinical factors associated with a regression in the aEEG pattern that can be
demonstrated to be associated with adverse neurodevelopmental outcomes later
need investigation. The effect of drugs, particularly sedation needs to be taken
into account.
14.14 Electrographic Seizures on aEEG Monitoring in Preterm Infants
Surprisingly, a relatively high proportion of infants in our study had electrographic
seizure activity. Epidemiologic studies show that seizures are commoner in
preterm (43) and low birth weight infants (41) and are often associated with high
166

grade IVH as well as cerebral infarction (122). Connell et al (123) in a mixed
cohort of 275 preterm and term infants showed electrographic seizure activity in
20%, mostly in association with cerebral pathology which was detected using
four channel EEG.
Only two of the eleven infants in our cohort who had electrographic seizure
activity were noted to have clinical seizure activity. Seizures in the newborn are
not as well organized as those seen in older children or adults. Hence seizures in
the newborn tend to be frequently subtle and clinical seizures in preterm infants
are even harder to detect. We may speculate that this is related to differing
stages of brain maturation and myelination.
The electrographic seizures in this group consisted of low frequency rhythmic
discharges in most of the infants and in two infants we were able to demonstrate
associated autonomic changes concurrent with the seizure activity. The seizures
were detected in the first 72 hours of life and given that the median age at which
monitoring was commenced was 24 hours of age, our findings probably
underestimate the prevalence.
14.15 Future Work in Electrographic Seizures in Preterm Infants
Although epidemiologic data are available for clinical seizures in preterm infants,
there is very little data on the prevalence of electrographic seizures in this group
or their aetiologies. It is intriguing to speculate as to what electrographic seizure
activity in preterm infants signifies. Are seizures in preterm infants mostly a sign
167
that there is underlying pathology or can they, in some way, contribute to the
pathology? The morphology of electrographic seizures in the preterm infant and
how it relates to underlying brain pathology remains to be studied as well as how
associated autonomic changes may assist in seizure detection in this group. The
seizure burden in this group and it’s relationship to later neurologic outcome is
not known.
14.16 The Present Thesis, its Limitations and My Contribution and
Involvement in the Work
The central aim of this thesis was to test the hypothesis that the aEEG assists in
detecting cerebral abnormality in the newborn. The work was commenced with a
retrospective review of term-born infants who had presented with seizures and/or
encephalopathy to a tertiary referral centre in Victoria, Australia. Retrospective
studies are prone to various errors. These studies use data that may already be
available with, in the case of the aEEG, the technology having been used in a
clinical setting. The greatest source of error is that the aEEG would not have
been applied on the basis of any research protocol, but would rely on personal
clinician preference. Clinical decisions may also have been made on the basis of
the findings of the aEEG. Hence the research findings cannot be completely
detached from the clinical work. However as long as the limitations of such
studies are born in mind, these studies do yield important information.
I was involved in collecting together the aEEG files for all the patients from the
two hospitals and with Shelley Lavery we went through the raw EEG trace to
168

select out areas of seizure activity, so that the background pattern would not be
artificially elevated. I was involved in the aEEG analysis. With the assistance of
Professor Lex Doyle, I carried out the statistical analysis for this study and I was
also involved in the overall analysis and presentation of the findings.
The next phase of the study was to prospectively define the accuracy of the
digital aEEG when compared to conventional multichannel EEG using shared
electrodes. This study was limited by the relatively small number of patients and
the lack of availability of EEG equipment round the clock. Video-EEG was not
available for this study. With Dr Terrie Inder, I was involved in the design of this
prospective study arm involving close liaison with the neurology and
electrophysiology department as they provided the conventional EEG. I sought
informed consent and enrolled the patients into the study. This involved constant
vigilance on a virtually daily basis with Shelly Lavery to find suitable patients.
Obtaining consent at this time was difficult with many parents in a state of shock.
Shelly and I both applied the aEEG monitor while Sue Watson applied
conventional EEG. I was responsible for coordinating all the raters review of the
EEG data. I carried out the statistical analysis of the data.
The aEEG study of preterm infants was carried out at the St Louis Children’s
Hospital. I was again involved in designing the study. With the help of Karen
Lucas and Jennifer Walker, I was responsible for searching out the antenatal
wards and meeting prospective parents before preterm infants were delivered to
give them information about the study. After the infant was born, I would obtain
169

informed consent which often involved a number of visits to families. I was
responsible for the initial application of the aEEG monitor but was later helped by
Karen Lucas, Tony Barton and Sue Siccard. Although we had planned to apply
the monitor as soon after birth as possible, delays were experienced in obtaining
informed consent as the parents needed time to make up their mind whether to
join the study or not. Once consent was obtained, the monitor was applied only
after all the essential aspects of the infant management such as intubation and
line insertion were complete. Hence we were not able to commence recordings
as early as we would have liked.
I was involved in collecting and storing the data. I assisted Karen Lucas with
coordinating the follow-up monitoring. I directed the data analysis and was
helped in this by Jocelyn Wagman. Jingnan Mao assisted with the statistical
analysis.
14.17 The Implications of the Findings from this Thesis
Our findings from the thesis suggest that aEEG monitoring is a useful bedside
tool in the newborn infant, particularly when used by experienced users or those
with some expertise. In term-born infants, it may assist in the neurological
assessment for extent of brain injury in infants with encephalopathy and/or
seizures. In the absence of conventional EEG, the raw EEG signal with the
aEEG trace may be useful for monitoring electrographic seizure activity in term
infants, particularly once effective computer assisted automated algorithms have
been devised.
170

Regression of the aEEG trace in the preterm infant may provide an alert for the
physician that the infant is undergoing a significant acute event affecting the
“electro-cerebral wellbeing”, such as severe IVH or NEC. Although the lack of
variability in the early aEEG trace is more common in the more preterm infant,
this is also more likely to be associated with adverse outcome. Seizures noted on
aEEG monitoring in preterm infants may alert physicians of the possibility of
evolving IVH or cerebral irritability from already established pathology. aEEG
monitoring may in the future assist in alerting the physician of evolving severe
IVH or evolving morbidities, such as NEC, which may impact on all the systems
including the brain. As such aEEG monitoring may in the future be of use for
recruiting preterm infants for trials and therapies for neuroprotective strategies.
171
BIBLIOGRAPHY
1. Schoenberg BS. Richard Caton and the electrical activity of the brain.
Mayo Clin Proc 1974;49(7):474-81.
2. Gloor P. Hans Berger and the discovery of the electroencephalogram.
Electroencephalogr Clin Neurophysiol 1969:Suppl 28:1-36.
3. Tharp BR. Electrophysiological brain maturation in premature infants: an
historical perspective. J Clin Neurophysiol 1990;7(3):302-14.
4. Karbowski K. Sixty years of clinical electroencephalography. Eur Neurol
1990;30(3):170-5.
5. Speckmann E-J, Elgar CE. Introduction to the Neurophysiological Basis of
the EEG and DC Potentials. In: Niedermeyer E, Silva FLd, editors.
Electroencephalography. Basic Principles, Clinical Applications, and Related
Fields. Baltimore: Williams & Wilkins; 1999. p. 15-27.
6. Niedermeyer E. The Normal EEG of the Waking Adult. In: Niedermeyer E,
Silva FLd, editors. Electroencephalograpy. Basic Principles, Clinical Applications,
and Related Fields. Baltimore: Williams & Wilkins; 1999. p. 149-173.
7. Hughes JR. EEG in Clinical Practice. 2nd ed. Boston: Butterworth-
Heinemann; 1994.
8. Nguyen The Tich S, d'Allest AM, Touzery de Villepin A, de Belliscize J,
Walls-Esquivel E, Salefranque F, et al. [Pathological patterns in neonatal EEG
before 30 weeks of gestational age]. Neurophysiol Clin 2007;37(3):177-221.
9. Hayakawa M, Okumura A, Hayakawa F, Watanabe K, Ohshiro M, Kato Y,
et al. Background electroencephalographic (EEG) activities of very preterm
172

infants born at less than 27 weeks gestation: a study on the degree of continuity.
Arch Dis Child Fetal Neonatal Ed 2001;84(3):F163-7.
10. Connell JA, Oozeer R, Dubowitz V. Continuous 4-channel EEG
monitoring: a guide to interpretation, with normal values, in preterm infants.
Neuropediatrics 1987;18(3):138-45.
11. Hahn JS, Monyer H, Tharp BR. Interburst interval measurements in the
EEGs of premature infants with normal neurological outcome.
Electroencephalogr Clin Neurophysiol 1989;73(5):410-8.
12. Scher MS. Neonatal Electrography: Abnormal Features. In: Holmes GL,
Moshe SL, Jr HRJ, editors. Clinical Neurophysiology of Infancy, Childhood and
Adolescence. Philadelphia: Elsevier; 2006. p. 273-301.
13. Koszer SE, Moshe SL, Holmes GL. Visual Analysis of the Neonatal
Electroencephalogram. In: Holmes GL, Moshe SL, Jr HRJ, editors. Clinical
Neurophysiology of Infancy, Childhood and Adolescence. Philadelphia: Elsevier;
2006. p. 46-69.
14. Marret S, Parain D, Samson-Dollfus D, Jeannot E, Fessard C. Positive
rolandic sharp waves and periventricular leukomalacia in the newborn.
Neuropediatrics 1986;17(4):199-202.
15. Marret S, Parain D, Jeannot E, Eurin D, Fessard C. Positive rolandic
sharp waves in the EEG of the premature newborn: a five year prospective study.
Arch Dis Child 1992;67(7):948-51.
16. Baud O, d'Allest AM, Lacaze-Masmonteil T, Zupan V, Nedelcoux H,
Boithias C, et al. The early diagnosis of periventricular leukomalacia in premature
173

infants with positive rolandic sharp waves on serial electroencephalography. J
Pediatr 1998;132(5):813-7.
17. Okumura A, Hayakawa F, Kato T, Maruyama K, Kubota T, Suzuki M, et al.
Abnormal sharp transients on electroencephalograms in preterm infants with
periventricular leukomalacia. J Pediatr 2003;143(1):26-30.
18. Maruyama K, Okumura A, Hayakawa F, Kato T, Kuno K, Watanabe K.
Prognostic value of EEG depression in preterm infants for later development of
cerebral palsy. Neuropediatrics 2002;33(3):133-7.
19. Kidokoro H, Okumura A, Hayakawa F, Kato T, Maruyama K, Kubota T, et
al. Chronologic Changes in Neonatal EEG Findings in Periventricular
Leukomalacia. Pediatrics 2009.
20. Sarnat HB, Sarnat MS. Neonatal encephalopathy following fetal distress.
A clinical and electroencephalographic study. Arch Neurol 1976;33(10):696-705.
21. Holmes G, Rowe J, Hafford J, Schmidt R, Testa M, Zimmerman A.
Prognostic value of the electroencephalogram in neonatal asphyxia.
Electroencephalogr Clin Neurophysiol 1982;53(1):60-72.
22. Murray DM, Boylan GB, Ryan CA, Connolly S. Early EEG Findings in
Hypoxic-Ischemic Encephalopathy Predict Outcomes at 2 Years. Pediatrics
2009.
23. Menache CC, Bourgeois BF, Volpe JJ. Prognostic value of neonatal
discontinuous EEG. Pediatr Neurol 2002;27(2):93-101.
24. Biagioni E, Mercuri E, Rutherford M, Cowan F, Azzopardi D, Frisone MF,
et al. Combined use of electroencephalogram and magnetic resonance imaging
in full-term neonates with acute encephalopathy. Pediatrics 2001;107(3):461-8.
174
25. Leijser LM, Vein AA, Liauw L, Strauss T, Veen S, Wezel-Meijler G.
Prediction of short-term neurological outcome in full-term neonates with hypoxic-
ischaemic encephalopathy based on combined use of electroencephalogram and
neuro-imaging. Neuropediatrics 2007;38(5):219-27.
26. Maynard D, Prior PF, Scott DF. Device for continuous monitoring of
cerebral activity in resuscitated patients. Br Med J 1969;4(5682):545-6.
27. Prior PF, Maynard DE, Sheaff PC, Simpson BR, Strunin L, Weaver EJ, et
al. Monitoring cerebral function: clinical experience with new device for
continuous recording of electrical activity of brain. Br Med J 1971;2(5764):736-8.
28. Prior PF. Monitoring Cerebral Function. Philadelphia: J. B. Lippincott
Company; 1979.
29. Hellstrom-Westas L, De Vries LS, Rosen I. Atlas of amplitude-integrated
EEGs in the newborn. 2nd ed. London: Informa UK Ltd; 2008.
30. Maynard DE, Cohen RJ, Viniker DA. Intrapartum fetal monitoring with the
cerebral function monitor. Br J Obstet Gynaecol 1979;86(12):941-7.
31. Bjerre I, Hellstrom-Westas L, Rosen I, Svenningsen N. Monitoring of
cerebral function after severe asphyxia in infancy. Arch Dis Child
1983;58(12):997-1002.
32. Greisen G. Tape-recorded EEG and the cerebral function monitor:
amplitude-integrated, time-compressed EEG. J Perinat Med 1994;22(6):541-6.
33. Hellstrom-Westas L, Rosen I, Svenningsen NW. Predictive value of early
continuous amplitude integrated EEG recordings on outcome after severe birth
asphyxia in full term infants. Arch Dis Child Fetal Neonatal Ed 1995;72(1):F34-8.
175

34. Toet MC, Hellstrom-Westas L, Groenendaal F, Eken P, de Vries LS.
Amplitude integrated EEG 3 and 6 hours after birth in full term neonates with
hypoxic-ischaemic encephalopathy. Arch Dis Child Fetal Neonatal Ed
1999;81(1):F19-23.
35. al Naqeeb N, Edwards AD, Cowan FM, Azzopardi D. Assessment of
neonatal encephalopathy by amplitude-integrated electroencephalography.
Pediatrics 1999;103(6 Pt 1):1263-71.
36. Shany E, Goldstein E, Khvatskin S, Friger MD, Heiman N, Goldstein M, et
al. Predictive value of amplitude-integrated electroencephalography pattern and
voltage in asphyxiated term infants. Pediatr Neurol 2006;35(5):335-42.
37. ter Horst HJ, Sommer C, Bergman KA, Fock JM, van Weerden TW, Bos
AF. Prognostic significance of amplitude-integrated EEG during the first 72 hours
after birth in severely asphyxiated neonates. Pediatr Res 2004;55(6):1026-33.
38. van Rooij LG, Toet MC, Osredkar D, van Huffelen AC, Groenendaal F, de
Vries LS. Recovery of amplitude integrated electroencephalographic background
patterns within 24 hours of perinatal asphyxia. Arch Dis Child Fetal Neonatal Ed
2005;90(3):F245-51.
39. Gluckman PD, Wyatt JS, Azzopardi D, Ballard R, Edwards AD, Ferriero
DM, et al. Selective head cooling with mild systemic hypothermia after neonatal
encephalopathy: multicentre randomised trial. Lancet 2005;365(9460):663-70.
40. Volpe JJ. Neurology of the Newborn. 5th ed: W.B. Saunders; 2008.
41. Lanska MJ, Lanska DJ. Neonatal seizures in the United States: results of
the National Hospital Discharge Survey, 1980-1991. Neuroepidemiology
1996;15(3):117-25.
176

42. Glass HC, Pham TN, Danielsen B, Towner D, Glidden D, Wu YW.
Antenatal and intrapartum risk factors for seizures in term newborns: a
population-based study, California 1998-2002. J Pediatr 2009;154(1):24-28 e1.
43. Ronen GM, Penney S, Andrews W. The epidemiology of clinical neonatal
seizures in Newfoundland: a population-based study. J Pediatr 1999;134(1):71-5.
44. Prior PF, Virden RS, Maynard DE. An EEG device for monitoring seizure
discharges. Epilepsia 1973;14(4):367-72.
45. Hellstrom-Westas L, Rosen I, Swenningsen NW. Silent seizures in sick
infants in early life. Diagnosis by continuous cerebral function monitoring. Acta
Paediatr Scand 1985;74(5):741-8.
46. Hellstrom-Westas L. Comparison between tape-recorded and amplitude-
integrated EEG monitoring in sick newborn infants. Acta Paediatr
1992;81(10):812-9.
47. Toet MC, van der Meij W, de Vries LS, Uiterwaal CS, van Huffelen KC.
Comparison between simultaneously recorded amplitude integrated
electroencephalogram (cerebral function monitor) and standard
electroencephalogram in neonates. Pediatrics 2002;109(5):772-9.
48. Rennie JM, Chorley G, Boylan GB, Pressler R, Nguyen Y, Hooper R. Non-
expert use of the cerebral function monitor for neonatal seizure detection. Arch
Dis Child Fetal Neonatal Ed 2004;89(1):F37-40.
49. Shellhaas RA, Soaita AI, Clancy RR. Sensitivity of amplitude-integrated
electroencephalography for neonatal seizure detection. Pediatrics
2007;120(4):770-7.
177

50. Bourez-Swart MD, van Rooij L, Rizzo C, de Vries LS, Toet MC, Gebbink
TA, et al. Detection of subclinical electroencephalographic seizure patterns with
multichannel amplitude-integrated EEG in full-term neonates. Clin Neurophysiol
2009;120(11):1916-22.
51. Thornberg E, Thiringer K. Normal pattern of the cerebral function monitor
trace in term and preterm neonates. Acta Paediatr Scand 1990;79(1):20-5.
52. Olischar M, Klebermass K, Kuhle S, Hulek M, Kohlhauser C, Rucklinger E,
et al. Reference values for amplitude-integrated electroencephalographic activity
in preterm infants younger than 30 weeks' gestational age. Pediatrics 2004;113(1
Pt 1):e61-6.
53. Klebermass K, Kuhle S, Olischar M, Rucklinger E, Pollak A, Weninger M.
Intra- and extrauterine maturation of amplitude-integrated
electroencephalographic activity in preterm infants younger than 30 weeks of
gestation. Biol Neonate 2006;89(2):120-5.
54. Herbertz S, Pulzer F, Gebauer C, Panhofer M, Robel-Tillig E, Knupfer M.
The effect of maturation and sedation on amplitude-integrated
electroencephalogram of the preterm neonate: results of a prospective study.
Acta Paediatr 2006;95(11):1394-9.
55. Hellstrom-Westas L, Bell AH, Skov L, Greisen G, Svenningsen NW.
Cerebroelectrical depression following surfactant treatment in preterm neonates.
Pediatrics 1992;89(4 Pt 1):643-7.
56. Skov L, Hellstrom-Westas L, Jacobsen T, Greisen G, Svenningsen NW.
Acute changes in cerebral oxygenation and cerebral blood volume in preterm
infants during surfactant treatment. Neuropediatrics 1992;23(3):126-30.
178
57. Hellstrom-Westas L, Rosen I, Svenningsen NW. Cerebral function
monitoring during the first week of life in extremely small low birthweight
(ESLBW) infants. Neuropediatrics 1991;22(1):27-32.
58. Hellstrom-Westas L, Klette H, Thorngren-Jerneck K, Rosen I. Early
prediction of outcome with aEEG in preterm infants with large intraventricular
hemorrhages. Neuropediatrics 2001;32(6):319-24.
59. Badawi N, Kurinczuk JJ, Keogh JM, Alessandri LM, O'Sullivan F, Burton
PR, et al. Intrapartum risk factors for newborn encephalopathy: the Western
Australian case-control study. BMJ 1998;317(7172):1554-8.
60. Badawi N, Kurinczuk JJ, Keogh JM, Alessandri LM, O'Sullivan F, Burton
PR, et al. Antepartum risk factors for newborn encephalopathy: the Western
Australian case-control study. BMJ 1998;317(7172):1549-53.
61. Pierrat V, Haouari N, Liska A, Thomas D, Subtil D, Truffert P. Prevalence,
causes, and outcome at 2 years of age of newborn encephalopathy: population
based study. Arch Dis Child Fetal Neonatal Ed 2005;90(3):F257-61.
62. Wyatt JS, Edwards AD, Azzopardi D, Reynolds EO. Magnetic resonance
and near infrared spectroscopy for investigation of perinatal hypoxic-ischaemic
brain injury. Arch Dis Child 1989;64(7 Spec No):953-63.
63. Wyatt JS. Energy Consequences of Cerebral Hypoxia-Ischemia. In: Donn
SM, Sinha SK, Chiswick ML, editors. Birth Asphyxia and the Brain; Basic Science
and Clinical Implications. New York: Futura; 2002. p. 121-134.
64. Azzopardi D, Wyatt JS, Cady EB, Delpy DT, Baudin J, Stewart AL, et al.
Prognosis of newborn infants with hypoxic-ischemic brain injury assessed by
phosphorus magnetic resonance spectroscopy. Pediatr Res 1989;25(5):445-51.
179
65. Johnson MV, Ishida A, Nakajima W, Trescher W. The Biochemical
Neurotoxic Cascade in Hypoxic-Ischemic Injury. In: Donn SM, Sinha SK,
Chiswick ML, editors. Birth Asphyxia and the Brain; Basic Science and Clinical
Implications. New York: Futura; 2002. p. 51-71.
66. Mehmet H, Edwards AD. Apoptosis and Necrosis in Perinatal Brain Injury.
In: Donn SM, Sinha SK, Chiswick ML, editors. Birth Asphyxia and the Brain;
Basic Science and Clinical Implications. New York: Futura; 2002. p. 135-152.
67. Linnik MD, Zobrist RH, Hatfield MD. Evidence supporting a role for
programmed cell death in focal cerebral ischemia in rats. Stroke
1993;24(12):2002-8; discussion 2008-9.
68. Mehmet H, Yue X, Squier MV, Edwards AD. The relationship between
impaired cerebral energy metabolism and apoptosis in the cingulate gyrus of
newborn piglets following transient hypoxia-ischaemia. UCL/RPMS Perinatal
Brain Research Group. Biochem Soc Trans 1994;22(4):421S.
69. Hagberg H, Gilland E, Bona E, Hanson LA, Hahin-Zoric M, Blennow M, et
al. Enhanced expression of interleukin (IL)-1 and IL-6 messenger RNA and
bioactive protein after hypoxia-ischemia in neonatal rats. Pediatr Res
1996;40(4):603-9.
70. Bona E, Andersson AL, Blomgren K, Gilland E, Puka-Sundvall M,
Gustafson K, et al. Chemokine and inflammatory cell response to hypoxia-
ischemia in immature rats. Pediatr Res 1999;45(4 Pt 1):500-9.
71. Foster-Barber A, Dickens B, Ferriero DM. Human perinatal asphyxia:
correlation of neonatal cytokines with MRI and outcome. Dev Neurosci
2001;23(3):213-8.
180
72. Bartha AI, Foster-Barber A, Miller SP, Vigneron DB, Glidden DV,
Barkovich AJ, et al. Neonatal encephalopathy: association of cytokines with MR
spectroscopy and outcome. Pediatr Res 2004;56(6):960-6.
73. Wu YW, Escobar GJ, Grether JK, Croen LA, Greene JD, Newman TB.
Chorioamnionitis and cerebral palsy in term and near-term infants. JAMA
2003;290(20):2677-84.
74. Myers RE. Four patterns of perinatal brain damage and their conditions of
occurrence in primates. Adv Neurol 1975;10:223-34.
75. Myers RE. Fetal asphyxia due to umbilical cord compression. Metabolic
and brain pathologic consequences. Biol Neonate 1975;26(1-2):21-43.
76. Barkovich AJ, Westmark K, Partridge C, Sola A, Ferriero DM. Perinatal
asphyxia: MR findings in the first 10 days. AJNR Am J Neuroradiol
1995;16(3):427-38.
77. Barkovich AJ, Hajnal BL, Vigneron D, Sola A, Partridge JC, Allen F, et al.
Prediction of neuromotor outcome in perinatal asphyxia: evaluation of MR
scoring systems. AJNR Am J Neuroradiol 1998;19(1):143-9.
78. Miller SP, Ramaswamy V, Michelson D, Barkovich AJ, Holshouser B,
Wycliffe N, et al. Patterns of brain injury in term neonatal encephalopathy. J
Pediatr 2005;146(4):453-60.
79. Rutherford MA, Pennock JM, Counsell SJ, Mercuri E, Cowan FM,
Dubowitz LM, et al. Abnormal magnetic resonance signal in the internal capsule
predicts poor neurodevelopmental outcome in infants with hypoxic-ischemic
encephalopathy. Pediatrics 1998;102(2 Pt 1):323-8.
181

80. Volpe JJ. Neurology of the Newborn. 4th ed. Philadelphia: W. B. Saunders
Company; 2001.
81. Wirrell EC, Armstrong EA, Osman LD, Yager JY. Prolonged seizures
exacerbate perinatal hypoxic-ischemic brain damage. Pediatr Res
2001;50(4):445-54.
82. Miller SP, Weiss J, Barnwell A, Ferriero DM, Latal-Hajnal B, Ferrer-Rogers
A, et al. Seizure-associated brain injury in term newborns with perinatal asphyxia.
Neurology 2002;58(4):542-8.
83. McBride MC, Laroia N, Guillet R. Electrographic seizures in neonates
correlate with poor neurodevelopmental outcome. Neurology 2000;55(4):506-13.
84. Macfarlane A, Mugford M. Epidemiology (Office for National Statistics,
Mortality statistics, Series DH3). In: Rennie JM, editor. Roberton's Textbook of
Neonatology. 4th ed: Elsevier; 2005. p. 3-42.
85. Doyle LW. Evaluation of neonatal intensive care for extremely low birth
weight infants in Victoria over two decades: II. Efficiency. Pediatrics 2004;113(3
Pt 1):510-4.
86. Doyle LW. Evaluation of neonatal intensive care for extremely low birth
weight infants in Victoria over two decades: I. Effectiveness. Pediatrics
2004;113(3 Pt 1):505-9.
87. Gressens P, Rogido M, Paindaveine B, Sola A. The impact of neonatal
intensive care practices on the developing brain. J Pediatr 2002;140(6):646-53.
88. Stoll BJ, Hansen NI, Adams-Chapman I, Fanaroff AA, Hintz SR, Vohr B, et
al. Neurodevelopmental and growth impairment among extremely low-birth-
weight infants with neonatal infection. Jama 2004;292(19):2357-65.
182
89. Hintz SR, Kendrick DE, Stoll BJ, Vohr BR, Fanaroff AA, Donovan EF, et
al. Neurodevelopmental and growth outcomes of extremely low birth weight
infants after necrotizing enterocolitis. Pediatrics 2005;115(3):696-703.
90. Skidmore MD, Rivers A, Hack M. Increased risk of cerebral palsy among
very low-birthweight infants with chronic lung disease. Dev Med Child Neurol
1990;32(4):325-32.
91. Pape KE, Blackwell RJ, Cusick G, Sherwood A, Houang MT, Thorburn RJ,
et al. Ultrasound detection of brain damage in preterm infants. Lancet
1979;1(8129):1261-4.
92. Thorburn RJ, Lipscomb AP, Stewart AL, Reynolds EO, Hope PL, Pape
KE. Prediction of death and major handicap in very preterm infants by brain
ultrasound. Lancet 1981;1(8230):1119-21.
93. De Vries LS, Van Haastert IL, Rademaker KJ, Koopman C, Groenendaal
F. Ultrasound abnormalities preceding cerebral palsy in high-risk preterm infants.
J Pediatr 2004;144(6):815-20.
94. Woodward LJ, Anderson PJ, Austin NC, Howard K, Inder TE. Neonatal
MRI to predict neurodevelopmental outcomes in preterm infants. N Engl J Med
2006;355(7):685-94.
95. Counsell SJ, Allsop JM, Harrison MC, Larkman DJ, Kennea NL, Kapellou
O, et al. Diffusion-weighted imaging of the brain in preterm infants with focal and
diffuse white matter abnormality. Pediatrics 2003;112(1 Pt 1):1-7.
96. Counsell SJ, Shen Y, Boardman JP, Larkman DJ, Kapellou O, Ward P, et
al. Axial and radial diffusivity in preterm infants who have diffuse white matter
183

changes on magnetic resonance imaging at term-equivalent age. Pediatrics
2006;117(2):376-86.
97. Shah DK, Anderson PJ, Carlin JB, Pavlovic M, Howard K, Thompson DK,
et al. Reduction in cerebellar volumes in preterm infants: relationship to white
matter injury and neurodevelopment at two years of age. Pediatr Res
2006;60(1):97-102.
98. Shah DK, Guinane C, August P, Austin NC, Woodward LJ, Thompson DK,
et al. Reduced occipital regional volumes at term predict impaired visual function
in early childhood in very low birth weight infants. Invest Ophthalmol Vis Sci
2006;47(8):3366-73.
99. Thompson DK, Warfield SK, Carlin JB, Pavlovic M, Wang HX, Bear M, et
al. Perinatal risk factors altering regional brain structure in the preterm infant.
Brain 2007;130(Pt 3):667-77.
100. Thompson DK, Wood SJ, Doyle LW, Warfield SK, Lodygensky GA,
Anderson PJ, et al. Neonate hippocampal volumes: prematurity, perinatal
predictors, and 2-year outcome. Ann Neurol 2008;63(5):642-51.
101. Khwaja O, Volpe JJ. Pathogenesis of cerebral white matter injury of
prematurity. Arch Dis Child Fetal Neonatal Ed 2008;93(2):F153-61.
102. Inder TE, Huppi PS, Warfield S, Kikinis R, Zientara GP, Barnes PD, et al.
Periventricular white matter injury in the premature infant is followed by reduced
cerebral cortical gray matter volume at term. Ann Neurol 1999;46(5):755-60.
103. Volpe JJ. Brain injury in premature infants: a complex amalgam of
destructive and developmental disturbances. Lancet Neurol 2009;8(1):110-24.
184

104. Cowan F, Rutherford M, Groenendaal F, Eken P, Mercuri E, Bydder GM,
et al. Origin and timing of brain lesions in term infants with neonatal
encephalopathy. Lancet 2003;361(9359):736-42.
105. Miller SP, Ferriero DM, Leonard C, Piecuch R, Glidden DV, Partridge JC,
et al. Early brain injury in premature newborns detected with magnetic resonance
imaging is associated with adverse early neurodevelopmental outcome. J Pediatr
2005;147(5):609-16.
106. Fisch BJ. Fisch and Sphlmann's EEG Primer, Basic Principles of Digital
and Analog EEG. 3rd revised and enlarged ed. New York: Elsevier; 1999.
107. Rush S, Driscoll DA. EEG electrode sensitivity--an application of
reciprocity. IEEE Trans Biomed Eng 1969;16(1):15-22.
108. Scher MS, Hamid MY, Steppe DA, Beggarly ME, Painter MJ. Ictal and
interictal electrographic seizure durations in preterm and term neonates.
Epilepsia 1993;34(2):284-8.
109. Clancy RR, Legido A. The exact ictal and interictal duration of
electroencephalographic neonatal seizures. Epilepsia 1987;28(5):537-41.
110. Niedermeyer E, Silva FLd, editors. Electroencephalograpy. Basic
Principles, Clinical Applications, and Related Fields. Baltimore: Williams &
Wilkins; 1999.
111. Papile LA, Burstein J, Burstein R, Koffler H. Incidence and evolution of
subependymal and intraventricular hemorrhage: a study of infants with birth
weights less than 1,500 gm. J Pediatr 1978;92(4):529-34.
112. Hagmann CF, Robertson NJ, Azzopardi D. Artifacts on
electroencephalograms may influence the amplitude-integrated EEG
185
classification: a qualitative analysis in neonatal encephalopathy. Pediatrics
2006;118(6):2552-4.
113. Sarkar S, Barks JD, Donn SM. Should amplitude-integrated
electroencephalography be used to identify infants suitable for hypothermic
neuroprotection? J Perinatol 2008;28(2):117-22.
114. Shany E. The influence of phenobarbital overdose on aEEG recording.
Eur J Paediatr Neurol 2004;8(6):323-5.
115. Boylan GB, Rennie JM, Chorley G, Pressler RM, Fox GF, Farrer K, et al.
Second-line anticonvulsant treatment of neonatal seizures: a video-EEG
monitoring study. Neurology 2004;62(3):486-8.
116. Murray DM, Boylan GB, Ali I, Ryan CA, Murphy BP, Connolly S. Defining
the gap between electrographic seizure burden, clinical expression, and staff
recognition of neonatal seizures. Arch Dis Child Fetal Neonatal Ed 2007.
117. Navakatikyan MA, Colditz PB, Burke CJ, Inder TE, Richmond J, Williams
CE. Seizure detection algorithm for neonates based on wave-sequence analysis.
Clin Neurophysiol 2006;117(6):1190-203.
118. Victor S, Appleton RE, Beirne M, Marson AG, Weindling AM. Spectral
analysis of electroencephalography in premature newborn infants: normal
ranges. Pediatr Res 2005;57(3):336-41.
119. West CR, Harding JE, Williams CE, Gunning MI, Battin MR. Quantitative
electroencephalographic patterns in normal preterm infants over the first week
after birth. Early Hum Dev 2006;82(1):43-51.
186

120. Navelet Y, D'Allest AM, Ropert JC. [E.E.G. appearances in 40 newborns
with intraventricular hemorrhages (author's transl)]. Rev Electroencephalogr
Neurophysiol Clin 1980;10(1):19-20.
121. Tharp BR, Cukier F, Monod N. The prognostic value of the
electroencephalogram in premature infants. Electroencephalogr Clin
Neurophysiol 1981;51(3):219-36.
122. Scher MS, Aso K, Beggarly ME, Hamid MY, Steppe DA, Painter MJ.
Electrographic seizures in preterm and full-term neonates: clinical correlates,
associated brain lesions, and risk for neurologic sequelae. Pediatrics
1993;91(1):128-34.
123. Connell J, Oozeer R, de Vries L, Dubowitz LM, Dubowitz V. Continuous
EEG monitoring of neonatal seizures: diagnostic and prognostic considerations.
Arch Dis Child 1989;64(4 Spec No):452-8.
124. Olischar M, Klebermass K, Waldhoer T, Pollak A, Weninger M.
Background patterns and sleep-wake cycles on amplitude-integrated
electroencephalography in preterms younger than 30 weeks gestational age with
peri-/intraventricular haemorrhage. Acta Paediatr 2007;96(12):1743-50.
125. Baumgartner C, Lurger S, Leutmezer F. Autonomic symptoms during
epileptic seizures. Epileptic Disord 2001;3(3):103-16.
126. Leutmezer F, Schernthaner C, Lurger S, Potzelberger K, Baumgartner C.
Electrocardiographic changes at the onset of epileptic seizures. Epilepsia
2003;44(3):348-54.
187

127. Terndrup TE, Starr F, Fordyce WE. A piglet model of status epilepticus:
comparison of cardiorespiratory and metabolic changes with two methods of
pentylenetetrazol administration. Ann Emerg Med 1994;23(3):470-9.
128. Boylan GB, Panerai RB, Rennie JM, Evans DH, Rabe-Hesketh S, Binnie
CD. Cerebral blood flow velocity during neonatal seizures. Arch Dis Child Fetal
Neonatal Ed 1999;80(2):F105-10.
129. Cherian PJ, Blok JH, Swarte RM, Govaert P, Visser GH. Heart rate
changes are insensitive for detecting postasphyxial seizures in neonates.
Neurology 2006;67(12):2221-3.
130. Patrizi S, Holmes GL, Orzalesi M, Allemand F. Neonatal seizures:
characteristics of EEG ictal activity in preterm and fullterm infants. Brain Dev
2003;25(6):427-37.
131. Shalak LF, Laptook AR, Velaphi SC, Perlman JM. Amplitude-integrated
electroencephalography coupled with an early neurologic examination enhances
prediction of term infants at risk for persistent encephalopathy. Pediatrics
2003;111(2):351-7.
132. Dreyfus-Brisac C, Samson D, Fischgold H. [Method of recording the EEG
of premature and newborn infants.]. Electroencephalogr Clin Neurophysiol
1955;7(3):429-32.
133. Goto K, Wakayama K, Sonoda H, Ogawa T. Sequential changes in
electroencephalogram continuity in very premature infants. Electroencephalogr
Clin Neurophysiol 1992;82(3):197-202.
134. Doyle LW, Roberts G, Anderson PJ. Outcomes at age 2 years of infants <
28 weeks' gestational age born in Victoria in 2005. J Pediatr;156(1):49-53 e1.
188

135. Wood NS, Marlow N, Costeloe K, Gibson AT, Wilkinson AR. Neurologic
and developmental disability after extremely preterm birth. EPICure Study Group.
N Engl J Med 2000;343(6):378-84.
136. Azzopardi DV, Strohm B, Edwards AD, Dyet L, Halliday HL, Juszczak E,
et al. Moderate hypothermia to treat perinatal asphyxial encephalopathy. N Engl
J Med 2009;361(14):1349-58.
137. Lavery S, Shah DK, Hunt RW, Filan PM, Doyle LW, Inder TE. Single
versus bihemispheric amplitude-integrated electroencephalography in relation to
cerebral injury and outcome in the term encephalopathic infant. J Paediatr Child
Health 2008;44(5):285-90.
138. van Rooij LG, de Vries LS, van Huffelen AC, Toet MC. Additional value of
two-channel amplitude integrated EEG recording in full-term infants with
unilateral brain injury. Arch Dis Child Fetal Neonatal Ed;95(3):F160-8.
139. Hicks RG, Poole JL. Electroencephalographic changes with hypothermia
and cardiopulmonary bypass in children. J Thorac Cardiovasc Surg
1981;81(5):781-6.
140. Ancora G, Maranella E, Locatelli C, Pierantoni L, Faldella G. Changes in
cerebral hemodynamics and amplitude integrated EEG in an asphyxiated
newborn during and after cool cap treatment. Brain Dev 2009;31(6):442-4.
141. Hallberg B, Grossmann K, Bartocci M, Blennow M. The prognostic value
of early aEEG in asphyxiated infants undergoing systemic hypothermia
treatment. Acta Paediatr;99(4):531-6.
142. Vanhatalo S, Voipio J, Kaila K. Full-band EEG (fbEEG): a new standard
for clinical electroencephalography. Clin EEG Neurosci 2005;36(4):311-7.
189

143. Shellhaas RA, Clancy RR. Characterization of neonatal seizures by
conventional EEG and single-channel EEG. Clin Neurophysiol
2007;118(10):2156-61.
144. Lawrence R, Mathur A, Nguyen The Tich S, Zempel J, Inder T. A pilot
study of continuous limited-channel aEEG in term infants with encephalopathy. J
Pediatr 2009;154(6):835-41 e1.
145. van Rooij LG, de Vries LS, van Huffelen AC, Toet MC. Additional value of
2-channel amplitude integrated EEG recording in full-term infants with unilateral
brain injury. Arch Dis Child Fetal Neonatal Ed 2009.
146. Lee HJ, Kim HS, Kim SY, Sim GH, Kim ES, Choi CW, et al. Effects of
Postnatal Age and Aminophylline on the Maturation of Amplitude-Integrated
Electroencephalography Activity in Preterm Infants. Neonatology;98(3):245-253.
147. Soubasi V, Mitsakis K, Nakas CT, Petridou S, Sarafidis K, Griva M, et al.
The influence of extrauterine life on the aEEG maturation in normal preterm
infants. Early Hum Dev 2009;85(12):761-5.
148. Niemarkt HJ, Andriessen P, Peters CH, Pasman JW, Blanco CE,
Zimmermann LJ, et al. Quantitative analysis of amplitude-integrated
electroencephalogram patterns in stable preterm infants, with normal
neurological development at one year. Neonatology;97(2):175-82.
149. Bowen JR, Paradisis M, Shah D. Decreased aEEG continuity and
baseline variability in the first 48 hours of life associated with poor short-term
outcome in neonates born before 29 weeks gestation. Pediatr Res;67(5):538-44.
190

APPENDICES AND SUPPLEMENTARY
MATERIAL
191

APPENDIX 1 Function of the BrainZ BRM2 and BRM3 Monitors
Three channels of EEG data are collected from the five electrodes, with usual
placement of electrodes, typically one channel from each hemisphere (C3-P3,
C4-P4) and one cross-cerebral (C3,P3 – C4,P4) channel. The data is collected at
a sample rate of 512 Hz and is decimated to 256 Hz sample rate for the raw
EEG. The signal is processed in a manner similar to that of the CFM to produce
an aEEG trace. The raw EEG data streams are band-limited, rectified and a peak
detector is applied to emulate the frequency characteristics of the CFM. The
resulting signals are decimated to 8 Hz for display and storage.
For each four second epoch, the minimum, mean and maximum values of the
aEEG are calculated. The medians of each of these is then calculated over one
minute and are stored and displayed by the BRM2 monitor. These values provide
a measure of the lower and upper margins.
192

APPENDIX 2 Populations Studied in the Thesis
The term infants studied were recruited in Melbourne, Australia. The majority of
the population here is of white Caucasian background of European descent.
Large ethnic minority groups are represented from the south east Asia and the
Middle East. The majority of the participating families were urban dwelling.
To study the accuracy of the aEEG monitor for seizure detection, infants were
prospectively recruited from the Royal Children’s Hospital tertiary referral centre.
This was exclusively a referral centre with no in-born infants reflecting how sick
the infants referred were. Infants were referred not only from throughout the state
of Victoria but also other states including Tasmania, New South Wales and South
Australia.
To study the relationship between aEEG measures and MR imaging findings in
the term population, infants were recruited from the Royal Children’s as well as
the Royal Women’s Hospital in Melbourne. The latter is a tertiary centre neonatal
service which predominantly supports its own in-born population.
The aEEG studies in the preterm infants were carried out in the neonatal unit at
the St Louis Children’s Hospital, Missouri, USA. This tertiary centre supports a
very large in-born population as well as infants transported in from throughout the
state of Missouri as well as adjacent states. The majority population is of white
Caucasian European descent with a substantial minority of up to 40% being of
African American descent.
193
SUPPLEMENTARY MATERIAL
Publications Derived from this Work
1. Shah DK, Lavery S, Doyle LW, Wong C, McDougall P, Inder TE. Use of 2-channel bedside electroencephalogram monitoring in term-born encephalopathic infants related to cerebral injury defined by magnetic resonance imaging. Pediatrics 2006;118(1):47-55.
2. Shah DK, Mackay MT, Lavery S, Watson S, Harvey AS, Zempel
J, et al. Accuracy of bedside electroencephalographic monitoring in comparison with simultaneous continuous conventional electroencephalography for seizure detection in term infants. Pediatrics 2008;121(6):1146-54.
3. Shah DK, de Vries LS, Hellstrom-Westas L, Toet MC, Inder TE.
Amplitude-integrated electroencephalography in the newborn: a valuable tool. Pediatrics 2008;122(4):863-5.
4. Shah DK, Zempel J, Barton T, Lukas K, Inder TE.
Electrographic Seizures in Preterm Infants during the First Week of Life are Associated with Cerebral Injury. Pediatric Research 2010; 67(1):102-106.
Publications Related to this Work
1. Lavery S, Shah DK, Hunt RW, Filan PM, Doyle LW, Inder TE. Single versus bihemispheric amplitude-integrated electroencephalography in relation to cerebral injury and outcome in the term encephalopathic infant. J Paediatr Child Health 2008;44(5):285-90.
2. Shah DK, Lawrence R and Inder TE. Journal of Pediatric
Neurology. 2009; 7(1): 45-49. Novel automated algorithms for electrographic seizure detection in the newborn.
Invited Speaker at National and International Meetings in Relation to this Work 2009 4th International Conference on Brain Monitoring and Neuroprotection in the Newborn, University of South Florida, Orlando, Florida. February.
aEEG for New Users
194

2008 Newborn Brain Symposium, Washington University, St Louis. September.
(a) aEEG in Preterm Infants
(b) Interpretation of aEEG in Preterm Infants
2007 12th Neonatal Pediatric Conference, Santiago, Chile. October.
aEEG and the Term Encephalopathic Newborn
2007 NINDS Symposium on Seizures in the Newborn, Bethesda, Maryland, USA. May.
The Use of Amplitude-Integrated EEG for Seizure Detection in the Newborn
Abstracts Presented at Meetings from this Work
2009 Pediatric American Societies Annual Meeting, Baltimore, Maryland. USA.
Shah DK, Zempel J, Barton T, Lukas K and Inder TE. Electrographic Seizures in Preterm Infants on Continuous Amplitude-Integrated EEG Monitoring in the First Week of Life is Associated with Cerebral Injury
2009 The 4th International Conference on Brain Monitoring and Neuroprotection in the Newborn, Orlando, Florida, USA.
a) Shah DK, Zempel J, Barton T, Lukas K and Inder TE. Electrographic Seizures in Preterm Infants on Continuous Amplitude-Integrated EEG Monitoring in the First Week of Life is Associated with Cerebral Injury
b) Shah DK, Wagman J, Barton T, Lukas K and Inder TE. The Impact of Cerebral Injury on Amplitude-Integrated EEG Monitoring in the First Week of Life in Preterm Infants under 30 Weeks Gestation.
2008 The 3rd International Conference on Brain Monitoring and Neuroprotection in the Newborn, Vienna, Austria.
Shah DK, Mackay M, Lavery S, Watson S, Harvey AS, Zempel J, Mathur A and Inder TE. The Accuracy of Bedside EEG Monitoring Compared with Simultaneous Continuous Conventional EEG for Seizure Detection in Term Infants.
2007 Pediatric American Societies Annual Meeting, Toronto, Canada. Shah DK, Mackay M, Lavery S, Watson S, Harvey A, Zempel J, Mathur A and Inder TE. Accuracy of Bedside EEG Monitoring for Seizure Detection in Term Infants as Compared with Continuous Conventional EEG.
195

196
2005 Pediatric American Societies Annual Meeting, Washington DC, USA.
Shah DK, Lavery S, Wong C, Doyle LW, McDougall P and Inder TE. Utility of Two-Channel Bedside EEG Monitoring in Term-born Encephalopathic Infants Related to Cerebral Injury Defined by Magnetic Resonance Imaging.
2005 Perinatal Society of Australia & New Zealand Congress, Adelaide, Australia.
Shah DK, Lavery S, Wong C, Doyle LW, McDougall P and Inder TE. Utility of Two-Channel Bedside EEG Monitoring in Term-born Encephalopathic Infants Related to Cerebral Injury Defined by Magnetic Resonance Imaging.
Related Documents