Amplitude-based data selection for optimal retrospective reconstruction in micro-SPECT M Breuilly 1,2 , G Malandain 1 , J Guglielmi 2 , R Marsault 2 ,T Pourcher 2 , PR Franken 2 and J Darcourt 2 1 INRIA Sophia Antipolis - M´ editerran´ ee, Sophia Antipolis, France 2 Laboratoire TIRO, Commissariat ` a l’ ´ Energie Atomique et aux ´ Energies Alternatives (CEA) / Universit´ e de Nice Sophia Antipolis / Centre Antoine Lacassagne, Nice, France E-mail: [email protected] Abstract. Respiratory motion can blur the tomographic reconstruction of PET or SPECT images, which subsequently impair quantitative measurements, e.g. in the upper abdomen area. Respiratory signal phase-based gated reconstruction addresses this problem, but deteriorates the signal-to-noise ratio and other intensity-based quality measures. This article proposes a 3D reconstruction method dedicated to micro-SPECT imaging of mice. From a 4D acquisition, the phase images exhibiting motion are identified and the associated list-mode data are discarded, which enables the reconstruction of a 3D image without respiratory artefacts. The proposed method allows a motion-free reconstruction exhibiting both satisfactory count statistics and accuracy of measures. With respect to standard 3D reconstruction (NG3D) without breathing motion correction, an increase of 14.6% of the mean SUV has been observed, while, with respect to a gated 4D reconstruction (G4D), up to 60% less noise and an increase of up to 124% of the SNR have been demonstrated. SPECT, respiratory motion, image-based motion detection, amplitude-based gating and rodents Submitted to: Phys. Med. Biol.

Welcome message from author
This document is posted to help you gain knowledge. Please leave a comment to let me know what you think about it! Share it to your friends and learn new things together.
Transcript
Amplitude-based data selection for optimal
retrospective reconstruction in micro-SPECT
M Breuilly1,2, G Malandain1, J Guglielmi2, R Marsault2, T
Pourcher2, PR Franken2 and J Darcourt2
1 INRIA Sophia Antipolis - Mediterranee, Sophia Antipolis, France2 Laboratoire TIRO, Commissariat a l’Energie Atomique et aux EnergiesAlternatives (CEA) / Universite de Nice Sophia Antipolis / Centre AntoineLacassagne, Nice, France
E-mail: [email protected]
Abstract. Respiratory motion can blur the tomographic reconstruction of PET orSPECT images, which subsequently impair quantitative measurements, e.g. in theupper abdomen area. Respiratory signal phase-based gated reconstruction addressesthis problem, but deteriorates the signal-to-noise ratio and other intensity-basedquality measures. This article proposes a 3D reconstruction method dedicated tomicro-SPECT imaging of mice. From a 4D acquisition, the phase images exhibitingmotion are identified and the associated list-mode data are discarded, which enablesthe reconstruction of a 3D image without respiratory artefacts.
The proposed method allows a motion-free reconstruction exhibiting bothsatisfactory count statistics and accuracy of measures. With respect to standard 3Dreconstruction (NG3D) without breathing motion correction, an increase of 14.6% ofthe mean SUV has been observed, while, with respect to a gated 4D reconstruction(G4D), up to 60% less noise and an increase of up to 124% of the SNR have beendemonstrated.
SPECT, respiratory motion, image-based motion detection, amplitude-based gating and
rodents
Submitted to: Phys. Med. Biol.
Amplitude-based reconstruction in micro-SPECT 2
1. Introduction
Molecular pre-clinical imaging is a major research tool which provides non-invasive in
vivo information on cellular processes and allows longitudinal studies (Pysz et al. 2010,
Franc et al. 2008, Kang & Chung 2008). In oncology, obtaining measurements of tumour
characteristics is mandatory. Emission tomography (ET) quantification is hampered by
physically induced biases such as attenuation, scatter and partial volume effect, as well
as by motion artefacts. In clinical imaging, the physical biases can be corrected in
Positron Emission Tomography (PET) as well as in Single-Photon Emission Computed
Tomography (SPECT) (Ritt et al. 2011). However, there are few studies addressing
specifically the quantification issues in pre-clinical imaging. Concerning physical biases,
Hwang et al. (Hwang et al. 2008) showed that for technetium-99m (99mTc), attenuation
and scatter errors are reduced in small animal SPECT compared to clinical SPECT.
Therefore, respiratory motion compensation is one of the main obstacles of accurate
quantification in micro-SPECT (µ-SPECT).
Computed Tomography (CT), PET or SPECT images are produced by a
tomographic reconstruction from the projections of the object of interest, with
the implicit assumption that the imaged object remains still during the projection
acquisition. Motivated by the respiratory and cardiac motion observed in clinical
practice, a number of motion handling methods have been developed, with the goal of
reconstructing images free of motion artefacts. A trivial approach consists in controlling
the considered motion during the acquisition, by breath-holding, for example. This is
only valid for human imaging and short-time acquisition techniques such as CT or
Magnetic Resonance (MR).
Motion artefacts can also be handled by gating protocols. An additional signal,
which is considered representative of the motion of interest, is recorded and synchronised
with the data acquisition. Reconstruction is then based on a selection of the acquired
data. Such signals can be acquired by an external device and include electrocardiogram
(Livieratos et al. 2006), Real-time Position Management (Grotus et al. 2009) or
Multidimensional Respiratory Gating (Nehmeh et al. 2011), pressure sensor (chest
belt) (Chang et al. 2010, van Elmpt et al. 2011), and optical fiber (Burk et al. 2012).
These signals can also be extracted directly from the data itself, by looking for time
variation in raw projections in CT (Kyriakou & McKenzie 2011) or in ET (Bundschuh
et al. 2008, Schleyer et al. 2009).
For periodic signals, phase-based gating consists in dividing the period into several
phases of equal duration, with the assumption that the motion can be neglected within
each phase. This method is used for both cardiac (Buther et al. 2010) and respiratory
(Bettinardi et al. 2010, Bundschuh et al. 2008, Grotus et al. 2009, Livieratos et al. 2006)
gating for human imaging and allows the reconstruction of dynamic or 4D (3D+t)
images. Using only a fraction of the acquired data deteriorates the signal-to-noise ratio
(SNR) of each 3D image. Therefore, Dawood et al. propose to co-register each 3D
image and then to sum them up (Dawood et al. 2006). With this method, obtained 3D
Amplitude-based reconstruction in micro-SPECT 3
images have minimal motion artefacts and improved SNR.
Furthermore, amplitude-based gating assumes that the signal amplitude is
representative of the motion of interest. A range of amplitude values is selected, and
the associated acquired data are used for reconstruction. For instance, images at end
of exhalation or inhalation can be reconstructed by selecting either the lowest or the
highest amplitude values. In human imaging, such a method has been used for cardiac
motion in SPECT (Kovalski et al. 2007) and for respiratory motion in PET (Bettinardi
et al. 2010, Chang et al. 2010, Nehmeh et al. 2011, Schleyer et al. 2009, van Elmpt
et al. 2011).
When a motion model is available, some authors proposed to incorporate it into the
tomographic reconstruction procedure in order to take into account all the acquired data
to reconstruct a 3D still image. In human imaging, cardiac (Blondel et al. 2004) and
respiratory (Lamare et al. 2007, Reyes et al. 2007) motion models have been developed.
In addition to the difficulty in defining an accurate motion model, such methods also
imply a huge computational cost.
In human imaging, motion compensation has been studied in CT or PET (Nehmeh
& Erdi 2008, Lucignani 2009). In pre-clinical imaging, the methods are similar. For
instance, Kuntz et al. used phase-based gating (Kuntz et al. 2010). However the
literature is less abundant than in the clinical field and mostly concerns µ-CT (Guo
et al. 2011, Martiniova et al. 2010).
In this article, we propose an amplitude-based gating reconstruction method in
mice µ-SPECT. The signal obtained from an external pressure sensor is filtered and
allows the reconstruction of an intial 4D image, which is then analysed to detect the
respiratory induced motion. We take advantage of the particular breathing pattern of
anaesthetized mice to detect motion-corrupted phases, and subsequently use all raw data
corresponding to the motionless phases to reconstruct a single motionless 3D image.
2. Materials and methods
2.1. Animal model
The different methods were tested on data obtained on 3 female mice of a mouse model.
The mouse model consisted of NOD-SCID mice with intra-peritoneally injection of 1.5
million cells of rat colonic adenocarcinoma expressing the Natrium Iodide Symporter
(PROb-mNIS) in 50µL of Phosphate Buffered Saline. SPECT/CT acquisitions were
performed after 1, 2, and 3 weeks of growth, and PROb-mNIS peritoneal nodules of
NIS-transfected cells were observed. However, we considered only 8 acquisitions out of
the 9 for our study, since the Biovet pressure signal failed for one acquisition.
Animal housing and procedures were conducted according to the guidelines of the
French Agriculture Ministry and were approved by the local ethics committee.

Amplitude-based reconstruction in micro-SPECT 4
2.2. Imaging protocol
We acquired experimental animal images using a dedicated small animal SPECT/CT
scanner (eXplore speCZT CT 120, GE Healthcare Bioscience, London ON, CA).
The SPECT imaging part of this camera consists of a fixed full-ring of detectors
coupled to a rotating 7-pinhole collimator for mice. The ring of detectors is composed
of 10 panels of 4 CZT detectors. SPECT acquisitions lasted around 18 min. The output
of the camera is a list-mode record of all CZT detected events : each event consists of
the detection time (ms), the gating indices, and the properties of the detected photon.
SPECT reconstructions used data from the list-mode in the energy window from 125 to
150 keV, according to the energy of 99mTc.
Mice were injected intra-peritoneally 180 MBq in 400 µL of 99mTc-pertechnetate.
Five minutes later, the animals were anaesthetized with isoflurane (1.3% v/v) (Baxter,
France). The animals were placed prone and freely breathing (without mechanical
ventilation) on the bed and kept sedated during the whole imaging protocol, using
inhaled anaesthetic.
A monitoring system (BioVet, m2m Imaging Corporation, Newark, USA) was used
with a pneumatic pressure sensor. The pressure sensor was placed under the animal
abdomen. The pressure signal was recorded (1 ms-sampled rate) and used to monitor
the animal anaesthesia.
Body temperature was maintained at 37◦Celsius and anaesthetized gas rate was
regularly controlled to keep the respiratory rate between 60 and 100 breaths per minute.
Once a stabilized respiratory rate was reached, the SPECT acquisition started.
At the beginning of each acquisition, an amplitude threshold was arbitrarily fixed
in order to detect the falling edge of the pressure signal variation. Each time the signal
passed this threshold, a trigger was recorded in the list-mode SPECT acquisition data
to be used for reconstruction. We assumed that this trigger corresponded to the same
time in the cycle for each respiratory cycle. A respiratory cycle is then defined by the
interval between two consecutive triggers.
2.3. Reconstruction algorithm
SPECT reconstruction was done using the Ordered Subset Expectation Maximization
(OSEM) algorithm (Hudson & Larkin 1994). We used from 7 to 9 subsets and from
6 to 9 iterations, the number of EM equivalent updates ranged from 54 to 56. For a
given set of data, the number of subsets and iterations were kept constant for all the
reconstruction methods.
2.4. ”Standard” reconstruction methods
In this section, we describe the different kinds of SPECT reconstruction methods for
the list-mode, resulting in either 3D or 4D images. We start with the reconstruction

Amplitude-based reconstruction in micro-SPECT 5
that are provided by the camera and then we introduce the improvements which lead
to our final reconstruction scheme: a breath-hold like 3D image.
2.4.1. Non-gated 3D reconstruction Non-gated 3D reconstruction (NG3D) consists in
reconstructing a single 3D image using all data recorded in the list-mode within the
range of energy corresponding to the radiopharmaceutical used.
2.4.2. Gated 4D reconstruction Gated 4D reconstruction (G4D) consists in
reconstructing a temporal sequence of N 3D images. The number of phases N is set to 15
in the experiments. Using the trigger set in pressure signal, we compute the respiratory
cycle average duration, denoted by C, over the whole acquisition. The duration of each
reconstruction window is then D = C/N . Therefore the nth gating window of the ith
cycle is defined by the temporal interval [ti + (n− 1)D, ti + nD[ where ti is the time of
the ith trigger and n ∈ [1, N ]. A 3D image for each gating window is then reconstructed
from the data of the corresponding window. The raw data (list-mode) used is the same
as for NG3D reconstruction.
2.5. Proposed Method
The proposed method is a combination of three main steps that are described here:
a cycle filtering which consists in cycle pre-selection according to duration, a cycle
resampling, and an image-based motionless phase detection. This method denoted by
breath-hold like 3D reconstruction (BH3D) gives 3D images without motion artefact.
2.5.1. Cycle selection As the acquisitions are done on free-breathing mice, the
respiratory rate is linked to the level of isoflurane. Even once the steady state of narcosis
is reached, some extreme cycles lengths are observed. These outlier cycles may impair
the reconstruction by inducing a non coherent motion in images: moving structures
appear blurred. Consequently, we discarded the outlier cycles from the list-mode. The
study of the pressure signal gives the distribution of respiratory cycle duration and allows
the identification of the outlier cycles. A new list-mode data set is generated where the
corresponding outlier cycles are discarded. We experimentally set the acceptance cycle
duration window to the mean cycle duration +/- 3 standard deviations [C-3σ;C+3σ].
Figure 1 presents a typical example of the distribution of cycle durations for an
acquisition. The acceptance set to [C-3σ;C+3σ] will guarantee to keep around 99.7%
of the cycle if the distribution is Gaussian, while it will discard the outlier cycles.
After rejection of the outlier cycles, a new respiratory cycle average duration Cs is
calculated and leads to a new duration of gating window Ds = Cs/N . The nth gating
window of the ith cycle is defined by [ti + (n − 1)Ds, ti + nDs[ where ti is the time of
the ith trigger.

Amplitude-based reconstruction in micro-SPECT 6
2.5.2. Cycle resampling Obviously, even after the cycle selection step, the remaining
respiratory cycles still exhibit some length variations.
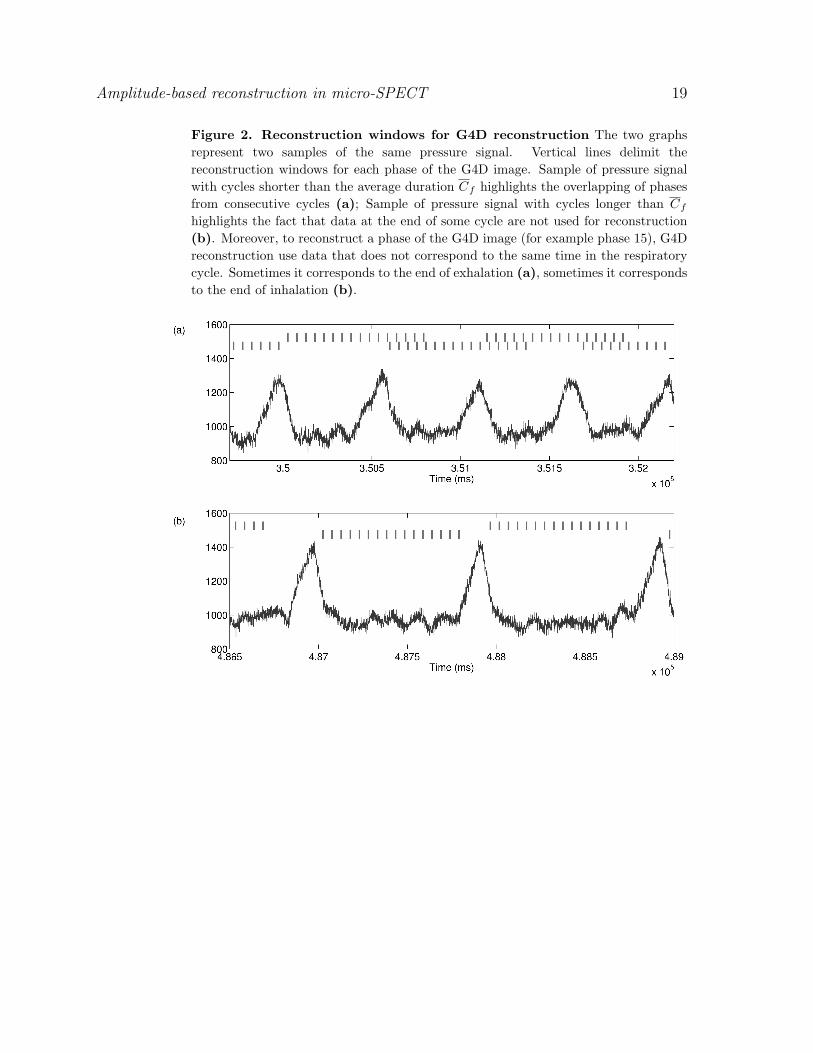
About half of the cycles are longer than Cs and their trigger time tj satisfies
tj+1 − tj > Cs. As a consequence, the counts after the last gating window of this
cycle and before the next trigger signal (i.e. in the interval [tj + Cs, tj+1[) will not be
used at all in the reconstruction process. This is illustrated by figure 2(b).
Conversely, the other half of the cycles are shorter than the average cycle duration
Cs and their trigger time tk satisfies tk+1 − tk < Cs. As a consequence, the counts of
the last gating windows defined for this cycle (in the interval [tk+1, tk +Cs[) also belong
to the first gating windows of the next cycle, meaning that those counts will be used
twice in the reconstruction process for different phase images. This is illustrated by
figure 2(a).
These observations motivate a temporal resampling of the counts so that the interval
between two trigger signals is equal to the cycle average duration Cs .This ensures that
each event will be used once and only once in the reconstruction process. Therefore
the detection time t of an event located between the trigger signals ti and ti+1 will be
changed to
t′ = (i− 1)Cs + (t− ti)Cs
ti+1 − tiwhile the trigger signals become t′i = (i− 1)Cs. This temporal normalisation results in
a new list-mode data set that enables the reconstruction of a gated 4D image, denoted
G4DSR.
2.5.3. Image-based motionless phase detection Anaesthetised mice exhibited a
particular breathing rhythm characterized by long intervals (around 2/3 of the cycle)
without respiratory motion separated by gasping breaths, as mentioned in (Cavanaugh
et al. 2004) and exemplified in the pressure signal in figure 3(a). Extracting the list-mode
data corresponding to the rest intervals will allow then to reconstruct a breath-hold like
image. However, the visual inspection of the 4D images (either G4D or G4DSR) reveals
that the observed motion is temporally shifted with respect to the observed variations of
the respiratory signal. Therefore, the latter can not be used directly for motion detection
and motivates the design of a dedicated image-based motion detection method from a
4D sequence with 15 phases (here the G4DSR images, i.e. the 4D image after cycle
selection and temporal resampling).
This method is based on the observation that, around the borders of high contrasted
areas, the time-course uptake value of a given voxel may exhibit a large variation due
to spatial displacement. It consists in the study of time-course uptake values of voxels
in the abdominal region - assuming that a spatial position in an image should always
refer to the same object along time if there is no motion.
The workflow for detecting motionless phases can be described as followed:
(i) Intensity normalisation of the 3D images In, n ∈ [1, N ] resulting from the 4D

Amplitude-based reconstruction in micro-SPECT 7
reconstruction according to the proportion of available counts that has been used
for reconstruction.
∀x : In(x) = In(x)total number of counts
number of counts used to reconstruct In
(ii) Spatial regularization with a 3D Gaussian filter (σ = 1.00) of the normalised images
In yielding In.
(iii) Volume of interest definition. Since we are interested in abdominal lesions, we
restrict the above analysis to a sub-volume containing only the abdominal area.
(iv) Generation of an amplitude image. A 3D image of intensity variation is generated
from the images In. For a given voxel x, the uptake amplitude can be simply
computed by subtracting the minimal uptake value from the maximal one, resulting
in an amplitude image A.
∀x : A(x) = max{In(x)}n∈[1,N ] −min{In(x)}n∈[1,N ]
(v) Generation of a mask M of regions of potential motion. This mask aims at isolating
voxels with large variations of time-course uptake values. This mask is obtained
by thresholding the amplitude image A at 15% of its maximum value, yielding
segmented regions with potential spatial displacement.
(vi) Detection of the gasping breaths. We observe that around 2/3 of the respiratory
cycle do not exhibit significant motion. Since N phases are reconstructed, with N =
15, this correspond to around 10 phases without motion while the motion-induced
large uptake variations are then mostly due to the other 5 phases. Therefore, for
each voxel x, we compute the amplitude after discarding every possible sequence of
5 consecutive phases. We define Sm as a sequence of 5 consecutive phases:
Sm = {k ∈ [1, N ]|∃j ∈ [0, 4] : k −m ≡ j[N ]}
The discarded sequence yielding the smallest amplitude is associated to a possible
motion under the considered voxel. This sequence is defined by its first phase m(x)
computed by:
m(x) = arg minm∈[1,N ]
(max{In(x)}n∈[1,N ]\Sm −min{In(x)}n∈[1,N ]\Sm
)We cumulate the obtained sequences Sm(x) into a histogram h.
∀n ∈ [1, N ], h(n) = card{x ∈M/n ∈ Sm(x)}
The resulting histogram is automatically thresholded using the Otsu method (Otsu
1975), yielding two groups of phases. The smallest group (typ. 5 to 6 phases)
is associated with motion state and the largest group (typ. 10 or 9 phases)
is associated with the motionless state. The first phase of the latter group is
denoted by p and the number of phase is denoted L. The results of the histogram
thresholding (table 1) confirms the visual inspection illustrated by figure 3(b) : the
phases associated with the motion state are shifted with respect to the pressure
signal peak.
Amplitude-based reconstruction in micro-SPECT 8
2.5.4. Breath-hold like 3D reconstruction (BH3D) Breath-hold like 3D reconstruction
consists in reconstructing a single 3D image using all data belonging to motionless
phases. More precisely this reconstruction method considers counts that lie in intervals
of length LDs beginning at phase p, i.e. [t′i + (p − 1)Ds, t′i + (p − 1)Ds + LDs[ in the
list-mode data set (after the temporal resampling).
2.6. Image value normalisation
Reconstructed images were converted into Standardized Uptake Values (SUV) for
comparison purpose. The conversion is divided in two steps.
First, all the reconstructed images (3D images, as BH3D, or 3D phase images from
4D images, as G4D, G4DSR) were normalised to NG3D. The values of the reconstructed
voxels depend directly on the number of counts used in the reconstruction process.
NG3D is the 3D image reconstructed with all the available counts, while all other images
only uses a fraction of them. Let us denote by Nc(I) the number of counts used for
the reconstruction of image I. By mutiplying the values of image I after reconstruction
by the ratio Nc(NG3D)/Nc(I), the resulting values are comparable with the ones of
NG3D.
Second, the values are converted into Standardized Uptake Values (SUV). Thanks
to the previous normalisation, values of all reconstructed images are comparable and
the conversion into SUV is the same for all images. Image values are first converted
into uptake values by calibration using an external known 99mTc source acquired
simultaneously with the image. SUV values are obtained by normalising the uptake
values by the total injected activity divided by the animal weight.
2.7. Image measurements
A number of measures, either image-based or lesion-based, were performed for each
reconstructed image.
A volume of interest was manually delineated in the liver with the help of both
anatomical (CT) and SPECT (NG3D) images avoiding any abnormal lesion, yielding a
volume of homogeneous SUV. Calculating the standard deviation (SD) over this region
allow the noise of the reconstructed image to be estimated.
Peritoneal metastases were localized by three experts with the help of maximum
of intensity projections (MIP), and a VOI was delineated around every identified
lesion. The maximal SUV value, SUVmax , is calculated, but was not directly used
for comparison purposes since it is sensitive to noise, especially for small lesions. The
following measurements are then made within every VOI:
• SUVpeak: the mean SUV of the 5% of highest values;
• SUVmean: the mean SUV of values over 40% of SUVmax ;
• lesion volume: volume at 40% of the SUVmax (given in mm3);
• lesion SNR: ratio of lesion SUVmean to the liver VOI SD.

Amplitude-based reconstruction in micro-SPECT 9
VOI were drawn using AMIDE software (Loening & Gambhir 2003). No correction
for partial volume effect were performed.
2.8. Statistical tools
Paired variables were compared using t-tests (Matlab R2009b; Mathworks, Natick, MA).
Image-based measures (i.e. noise), which can be considered as intrinsic, were compared
using paired t-tests. Lesion-based measures (SNR, SUVpeak, SUVmean, and volume)
were not directly comparable since they vary from lesion to lesion. Therefore they were
compared using ratio paired t-tests that correspond to paired t-tests on their logarithms
(base 10).
3. Results
3.1. Lesions distribution
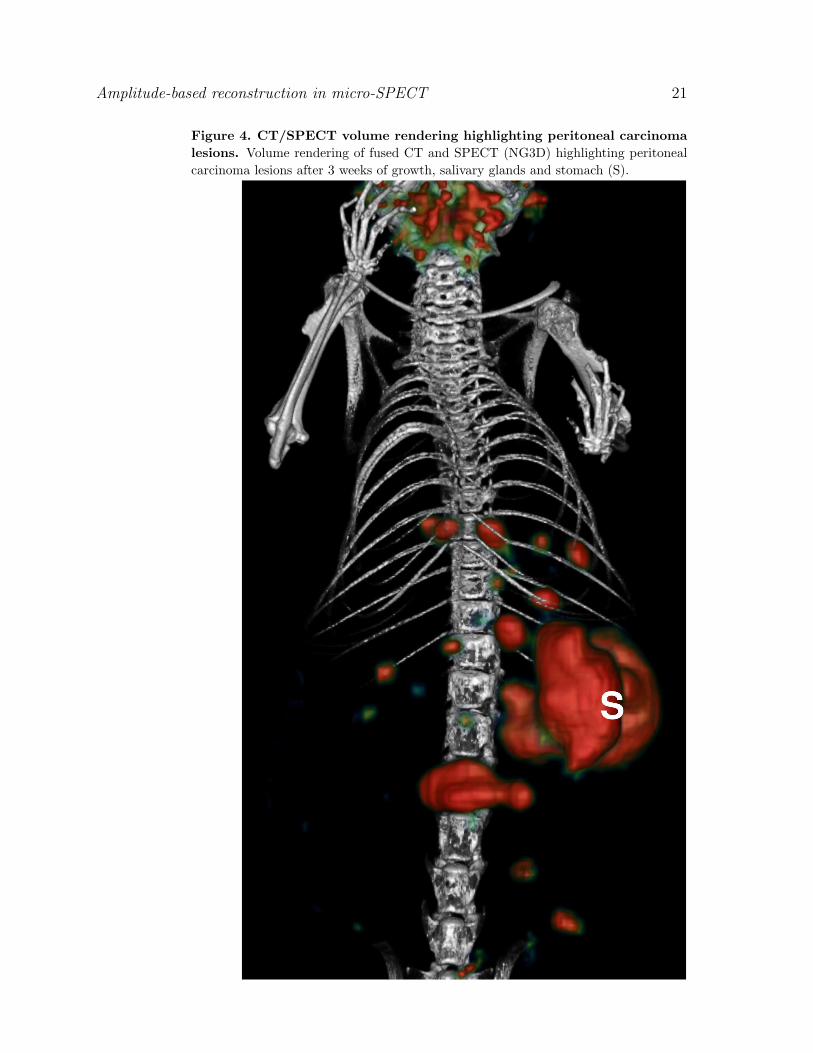
Figure 4 presents the volume rendering of fused CT and SPECT (NG3D) images
of peritoneal carcinoma lesions after 3 weeks of growth. Figure 4 illustrates both
biological and imaging challenges as there are numerous small peritoneal carcinoma
lesions, distributed throughout the abdomen.
A total of 76 foci of 99mTc-uptake were detected on the 8 acquisitions (3 to 14
lesions per acquisition). They were located in the abdomen, showing NIS-expressing
tumour tissue, and corresponded to peritoneal carcinoma nodules. These nodules were
small, their size (equivalent spherical diameter) ranged from 1.09 to 2.34 mm (average
1.55 ± 0.28 mm). Twenty-seven lesions were located in the upper abdominal area
(above the stomach), 31 were located in the middle abdominal area (at stomach level),
and 18 were located in the lower abdominal area (below the stomach).
3.2. Respiratory signal analysis
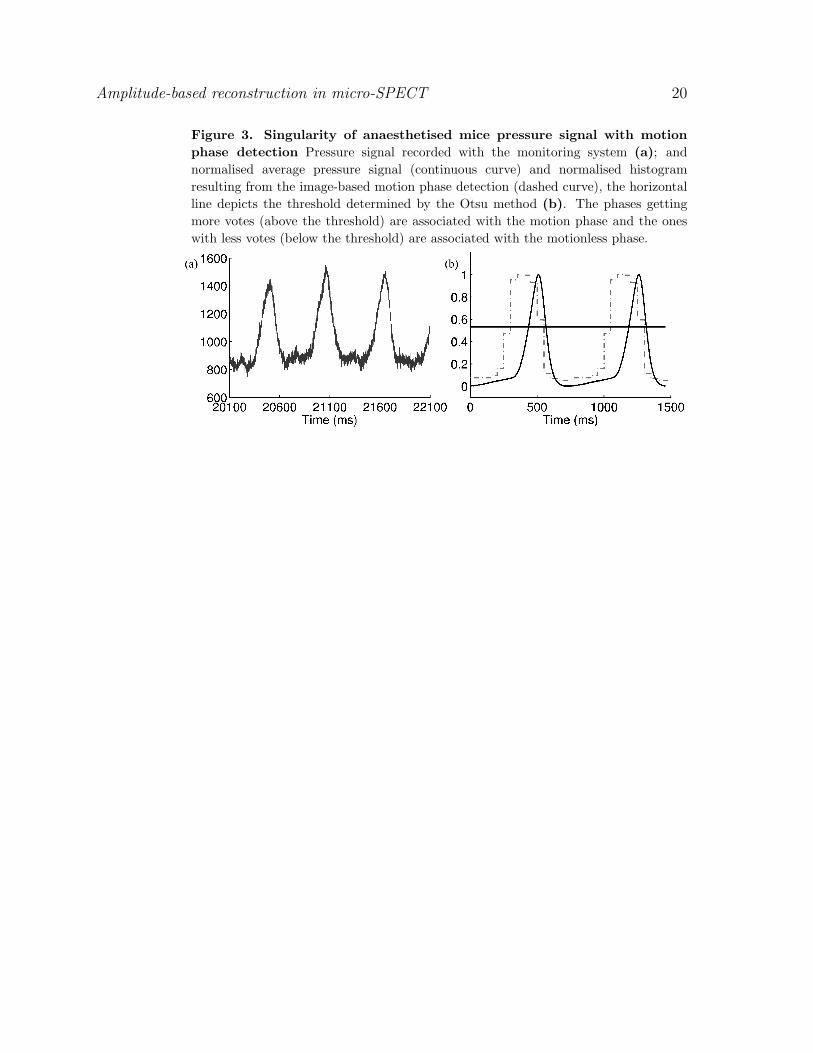
Figure 3 (a) presents a sample of pressure signal of free-breathing mice. Table 1 presents
the results of the pressure signal analysis on the 8 acquisitions. The average duration of
the respiratory cycle varies from 658 ms to 766 ms while its standard deviation ranges
from 44 to 153 ms.
This signal is characterised by a still phase at the end of exhalation. The image-
based motionless phase detection demonstrated that the shorter phase associated with
motion state lasts 5 or 6 phases out of 15 (see table 1) which corroborates our initial
observation of a duration of around 1/3 of the respiratory cycle. Moreover, it has been
detected that the motion state is time-shifted away from the pressure signal. According
to the image-based motionless phase detection, the time shift varies from 3 to 5 phases.
Figure 3 (b) presents the normalised average respiratory cycle (continuous curve)
for one acquisition, after the cycle selection and the cycle resampling steps, with the
result of the image-based motionless phase detection (dashed curve). A horizontal line
Amplitude-based reconstruction in micro-SPECT 10
represents the threshold computed by the Otsu method. This threshold separates the
phases in two groups, the ones above the threshold are associated with the motion phase,
the others (below the threshold) are associated with the motionless phase.
We did further experiments on the observed time shift between the image-
based detected motion and the pressure signal. For this purpose, one mouse has
undergone several 4D SPECT acquisitions (with different gating triggers) and one 4D
CT acquisition. The proposed image-based method has been used on all the 4D SPECT
acquisitions and on the 4D CT acquisition. Changing the trigger parameters on the
pressure signal (rising/falling edge, with/without delay) for the consecutive SPECT
acquisitions of the same animal did not change the location of the peak (data not
presented here). The peak of the motion detected in the 4D CT appeared at the same
location as in SPECT, with a temporal shift with respect to the pressure signal (figure 5).
Last, we computed the lung volume from the CT images along the phases with an ad-
hoc and simple method (Gaussian smoothing, threshold between -650 HU and -250 HU,
and morphological closing). Again, the peak of volume change appeared at the same
location. There is a discontinuity in the lung volume variations (at phase #10): the
corresponding reconstructed CT image appears to exhibit different characteristics which
explained the lung segmentation differences.
3.3. Sensitivity of the image-based motion detection with respect to noise
We investigated the ability of the proposed method to detect the motion in noisy images.
To that end, we extracted from one 4D SPECT sequence a series of 3D images containing
a moving lesion. This lesion has been thresholded, and different (white and gaussian)
noise levels have been added to the binary images. It appears from our experiments that
the image-based motion detection method is always successful in detecting the motion
phases for SNRs above 2.5.
3.4. Image statistics
The number of counts used for each reconstruction method were compared to the
total number of acquired counts. Table 2 presents the figures concerning the average
percentages on the set of 8 acquisitions. By definition, the 3D reconstruction method
NG3D used 100% of the counts.
15 3D phase images were reconstructed by the G4D method. The average
percentage of counts used for the reconstruction of each 3D phase image is then around
1/15th of the counts (6.65%). However, because of the variation of respiratory cycle
duration, 3.64% of the counts are not taken in account while 3.51% of them are used
twice (i.e. for the reconstruction of two different phases). If the total number of used
counts is defined as the sum of the number of counts used for each phase reconstruction,
it appears that this total number may exceed 100% if the number of counts used twice
is larger than the number of omitted counts. As a consequence, the average total of
counts used for the reconstruction of the 15 phases is 99.76% with a standard deviation

Amplitude-based reconstruction in micro-SPECT 11
of 2.88%. The twice used counts were not evenly distributed among phases, and are
more likely to occur in the first phases: an average of 31.44% (resp. 9.67%) of counts
used for phase 1 (resp. phase 2) were already used in a preceding phase. Twice used
counts appeared up to the 9th phase.
The cycle selection step discarded an average of 3.25% of the counts. After the
update of the average respiratory cycle duration, there were still 3.74% of omitted
counts and 2.73% of twice used counts in a 4D reconstruction without cycle resampling.
The trends in the repartition of the twice used counts among the phases were similar
to those observed for G4D: e.g. an average of 26.86% (resp. 7.61%) of counts used for
phase 1 (resp. phase 2) were already used in a preceding phase.
After cycle resampling, all the retained counts are used once and only once in the
4D reconstruction G4DSR. Each reconstructed phase of G4DSR used around 6.45% of
counts per reconstructed phase, which corresponded to a total of 96.75% counts over
the 15 phases.
For the BH3D reconstruction, the counts from the equivalent of 9 or 10 phases
have been used. On average 64% of the total number of counts have been used for the
reconstruction of one 3D image.
3.5. Qualitative comparison
Each acquisition was reconstructed using the three methods NG3D, G4D and BH3D,
that have been described in section 2.
The first comparison was a visual comparison of the lesions in images reconstructed
with the different methods. Figure 6 illustrates these reconstructions with sagittal views
showing 2 peritoneal lesions. The peritoneal location can be visualised with the CT
image (a). NG3D image (b) shows the underestimation of the lesion uptake and the
overestimation of size compared to G4D images, with a significantly improved signal-
to-noise ratio. The zoomed-in images of the G4D end-of-exhalation (c) and end-of-
inhalation (d) images show the high lesion uptake and the respiratory induced lesion
displacement, but are corrupted by a high noise level. On the BH3D reconstructed
image (e), the obtained result is a trade-off between the previous methods: the outlines
of the lesions are less blurred and the volumes are smaller than in NG3D image and
closer to G4D end-of-exhalation image, while the lesion uptake is higher than in NG3D
image with an equivalent noise level.
3.6. Quantitative comparison
NG3D, G4D and BH3D reconstruction methods were compared with respect to image-
based and lesion-based quantitative measurements. The average values of the lesions’
SUVpeak, SUVmean and volumes, noise estimation in homogeneous liver area and signal-
to-noise ratio (SNR) are presented in table 3. Here, G4D images are reconstructed with
both 6 phases and 15 phases.

Amplitude-based reconstruction in micro-SPECT 12
Image noise, measured in a homogeneous liver area, for BH3D method (see figure 7
(d)) was significantly reduced (-60.83% and -38.25%) in comparison to 15 phases-G4D
and 6 phases-G4D (p < 0.001) and closer to NG3D measured noise, although it was still
significantly higher (increase of +21.37%, p = 0.0012).
The SUVpeak and SUVmean for the BH3D method (see figure 7 (a)) show an increase
of respectively +9.67% and +14.59% with respect to NG3D reconstruction (p < 0.001),
but remained significantly lower (respectively -5.29% and -11.99%) than those obtained
by 15 phases-G4D reconstruction (p < 0.001). However, SUVpeak and SUVmean were
not significantly different to the ones for 6 phases-G4D reconstruction (slight decrease
of respectively -0.64% and -1.2%) (p = 0.9873 and p = 0.5608). Volumes measured with
BH3D method (see figure 7 (b)) were significantly lower (-14.41%) than with NG3D
(p < 0.001) and significantly higher (+12.04%) than with G4D (p < 0.001), but were
not significantly different (-1.3%) to 6 phases-G4D (p = 0.655).
Lesion SNR on BH3D images was significantly higher (+124% and +55%) (see
figure 7 (c)) than on both 15 phases- and 6 phases-G4D images (p < 0.001) and closer
to NG3D lesion SNR, while it was still significantly smaller than on NG3D (-5.40%)
(p = .0035).
4. Discussion
The motivation of this work is tumour detection and quantification in oncology small
animal SPECT imaging. Respiratory motion is a major source of impairment not only
for lung lesions but also for abdominal lesions as in our peritoneal carcinosis model.
The gating reconstruction method was able to reconstruct motionless images but at the
cost of a degraded SNR. Therefore we proposed a retrospective amplitude-based data
selection that aimed to maximise the data available for reconstruction, hence keeping a
high SNR, while suppressing respiratory motion artefacts.
The proposed method was possible thanks to the breathing rhythm particular to
anaesthetised mice, which is characterised by gasping breaths separated by long intervals
without respiratory motion. Cavanaugh et al. (Cavanaugh et al. 2004) previously
reported that this pattern, which is also depicted in (Burk et al. 2012), was induced by
isoflurane anaesthesia.
The average duration of the motionless baseline is 9.75 phases (for a 15-phases
reconstruction), which corresponds to 65% of the respiratory cycle, which indicates that
the same percentage of acquired counts may be used for the reconstruction of a motion
free image.
We observed that the true motion, as observed in the CT or SPECT respiratory
gated reconstruction (3D+t images), is not synchronised with the pressure signal, but
appeared temporally shifted. This shift represents around a fourth of the cycle length
(around 187 ms). It has been identified as a consequence of the external pneumatic
sensor system and might then depend on the length ot the air pipe. This asynchronism
motivated a dedicated image-based motion detection method that allowed to identify

Amplitude-based reconstruction in micro-SPECT 13
the respiratory phases associated with the motionless baseline.
The proposed image-based motion detection method is simpler than those proposed
in e.g. (Bundschuh et al. 2008) or (Schleyer et al. 2009). Indeed, both approaches aimed
at reconstructing a respiratory representative signal from the images while we only
focused on the detection of the phases exhibiting a motion with respect to baseline. More
precisely, (Bundschuh et al. 2008) followed the centre of mass of a (manually specified)
tumour in a 4D series and then used the measured displacement as a trigger signal.
This approach required some manual interaction and is dedicated to the reconstruction
of one single tumour. The proposed method is closer to (Schleyer et al. 2009) since we
study the variation of counts induced by an object motion. They proposed to integrate
this variation in the sinogram to get a respiratory-like signal while we simply identified
the largest variations at the voxel level. As with theirs, our method is versatile and
can deal either with emission tomography or CT data. The proposed method appears
to be quite robust with respect to noise, and is still able to detect the motion in noisy
challenging images (SNR of 2.5), noisier than the pre-clinical images (see the SNRs in
Table 3).
The average time shift between the image-based detected motion and the amplitude
peak in the pressure signal was -3.875 phases(for 15 phases-G4D), which corresponds to
25% of the respiratory cycle. Rather than using a 4D CT image for the motion detection,
that would imply a large acquisition time and a subsequent radiation dose, we rely on
a 4D SPECT image. Although the operator tried to stabilize the respiratory cycle of
the anaesthetised mice, some variation still occurred (Table 1). As a consequence, some
counts may be skipped from the reconstruction of gated images and others will be used
twice, mostly in the first phases to be reconstructed. This motivated the equalization
(done by resampling) of all respiratory cycles before reconstruction.
The proposed data selection allowed to retain 64% of all detected counts to
reconstruct one single 3D image (BH3D). These counts correspond to the motionless
baseline, hence the proposed reconstruction method simulated a breath-hold acquisition.
Using all acquired counts in the reconstruction would have required to either co-
register all 3D phase image and then average them (e.g. (Dawood et al. 2006)), or to
incorporate a motion model into the reconstruction process (e.g. (Reyes et al. 2007)).
This would then either rely on some non-linear registration method, whose validation
for such noisy data is challenging, or on the calculation of a personnalized respiratory
motion model. 4D CT may offer a means for such computation, but will still depends
on the used registration algorithm and at the cost of a high radiation dose of the mice.
Therefore, the proposed method offers a means toward the reconstruction of a still
image, while not requiring the validation of any registration method.
Measures of image noise (figure 7d) and lesion signal-to-noise ratio (figure 7c)
demonstrated that BH3D is of better quality than a 3D phase image extracted from
a 4D reconstruction (G4D, 6 and 15 phases reconstruction have been tested), and even
suggested that it is of similar quality to the 3D image reconstructed with all the available
counts (NG3D). Measures of SUVmean are significantly larger in BH3D than in NG3D,

Amplitude-based reconstruction in micro-SPECT 14
and close to the ones from the phase image (G4D). Similarly, volume measures are
smaller in BH3D than in NG3D, and close to G4D. These figures suggested that the
blurring effect due to the respiratory motion has been compensated for. As expected,
using less phases in G4D reconstruction yielded better quality images. The advantage
of the proposed method is to discard prospectively the motion impaired data before
reconstruction, while one has to identify retrospectively (possibly with a monitoring
system) the motionless phases in G4D reconstruction. Last, the “optimal” G4D will
reconstruct 2 phases, each of them from 50% of the data, assuming only one of them is
impaired with motion, while our method used 64% of the data.
More thorough validation could be conducted with simulations. First, one would
have to animate a numerical mouse phantom with the same particular respiratory
pattern that has been observed (gasps followed by a rest period). Such a model has not
been identified. The MOBY phantom (Segars et al. 2004) implemented a respiratory
motion similar to humans, and would not be adequate. Moreover, we have no indication
whether such a model may produce the same time shift as we observe between the
pressure signal and the abdominal motion. Second the acquisition can be simulated
(e.g. with the GATE software (Sakellios et al. 2006)), but this will also require to model
our camera. Such a considerable amount of work is certainly worthwhile for a finer
characterization of the benefits of the proposed method. However, the presented figures
already suggest there is an the overall benefit.
5. Conclusion
We developed a reconstruction method dedicated to anaesthetised free-breathing
mice. It enabled the reconstruction of a breath-hold like acquisition that is
comparable to a non-gated reconstruction in terms of noise measure and signal-to-noise
ratio, and intermediary between gated and non-gated reconstruction for lesion-based
measurements (SUVpeak, SUVmean and lesion volume).
Overall, the proposed method improves the quality of pre-clinical images, and the
precision of the quantitative measurements they provide. This method is promising
for more challenging studies concerning organs or tumour affected by motion using the
emission tomography modalities in the pre-clinical research.
Acknowledgments
We thank Audrey Lamit for the supply of biological material, the planning of
experimentation, the manipulation of animals, and the support during acquisition.
References
Bettinardi V, Picchio M, Di Muzio N, Gianolli L, Gilardi M & Messa C 2010 Radiother Oncol 96(3), 311–6.
Blondel C, Vaillant R, Malandain G & Ayache N 2004 Phys Med Biol 49(11), 2197–2208.
Amplitude-based reconstruction in micro-SPECT 15
Bundschuh R, Martinez-Moller A, Essler M, Nekolla S, Ziegler S & Schwaiger M 2008 Eur J Nucl MedMol Imaging 35(11), 1981–8.
Burk L M, Lee Y Z, Wait J M, Lu J & Zhou O Z 2012 Phys Med Biol 57(18), 5749–63.Buther F, Ernst I, Dawood M, Kraxner P, Schafers M, Schober O & Schafers K 2010 Eur J Nucl Med
Mol Imaging 37(12), 2315–27.Cavanaugh D, Johnson E, Price R, Kurie J, Travis E & Cody D 2004 Mol Imaging 3(1), 55–62.Chang G, Chang T, Pan T, Clark J & Mawlawi O 2010 J Nucl Med 51(1), 16–24.Dawood M, Lang N, Jiang X & Schafers K P 2006 IEEE Trans Med Imaging 25(4), 476–485.Franc B, Acton P, Mari C & Hasegawa B 2008 J Nucl Med 49(10), 1651–63.Grotus N, Reader a J, Stute S, Rosenwald J C, Giraud P & Buvat I 2009 Phys Med Biol 54(6), 1705–21.Guo X, Johnston S, Qi Y, Johnson G & Badea C 2011 Phys Med Biol 57(1), 257–271.Hudson H M & Larkin R S 1994 IEEE Trans Med Imaging 13(4), 601–609.Hwang A, Franc B, Gullberg G & Hasegawa B 2008 Phys Med Biol 53(9), 2233–52.Kang J & Chung J K 2008 J Nucl Med 49 Suppl 2, 164.Kovalski G, Israel O, Keidar Z, Frenkel A, Sachs J & Azhari H 2007 J Nucl Med 48(4), 630–636.Kuntz J, Dinkel J, Zwick S, Bauerle T, Grasruck M, Kiessling F, Gupta R, Semmler W & Bartling S
2010 Phys Med Biol 55(7), 2069–85.Kyriakou E & McKenzie D 2011 Phys Med Biol 56(10), 2999–3013.Lamare F, Ledesma Carbayo M, Cresson T, Kontaxakis G, Santos A, Cheze Le Rest C, Reader A &
Visvikis D 2007 Phys Med Biol 52(17), 5187–204.Livieratos L, Rajappan K, Stegger L, Schafers K, Bailey D & Camici P 2006 Eur J Nucl Med Mol
Imaging 33(5), 584–8.Loening A & Gambhir S 2003 Mol Imaging 2(3), 131–7.Lucignani G 2009 Eur J Nucl Med Mol Imaging 36(2), 315–9.Martiniova L, Schimel D, Lai E, Limpuangthip A, Kvetnansky R & Pacak K 2010 Methods 50(1), 20–5.Nehmeh S & Erdi Y 2008 Semin Nucl Med 38(3), 167–76.Nehmeh S, Haj-Ali A, Qing C, Stearns C, Kalaigian H, Kohlmyer S, Schoder H, Ho A, Larson S &
Humm J 2011 Med Phys 38(1), 531–8.Otsu N 1975 IEEE Trans Syst Man Cyb C(1), 62–66.Pysz M, Gambhir S & Willmann J 2010 Clin Radiol 65(7), 500–16.Reyes M, Malandain G, Koulibaly P M, Gonzalez-Ballester M A & Darcourt J 2007 Phys Med Biol
52(12), 3579–600.Ritt P, Vija H, Hornegger J & Kuwert T 2011 Eur J Nucl Med Mol Imaging 38 Suppl 1, S69–77.Sakellios N, Rubio J, Karakatsanis N, Kontaxakis G, Loudos G, Santos A, Nikita K & Majewski S 2006
in ‘IEEE Nuclear Science Symposium Conference Record’ pp. 2000–2003.Schleyer P J, O’Doherty M J, Barrington S F & Marsden P K 2009 Phys Med Biol 54(7), 1935–50.Segars W, Tsui B, Frey E, Johnson G & Berr S 2004 Mol Imaging 6(3), 149–59.van Elmpt W, Hamill J, Jones J, De Ruysscher D, Lambin P & Ollers M 2011 Eur J Nucl Med Mol
Imaging 38(5), 843–855–855.

Amplitude-based reconstruction in micro-SPECT 16
Tables and table captions
Table 1. Respiratory signal analysis for G4D (15 phases) reconstructions.
Acquisition Cycle µ± σ Motion duration Time shift(ms) (ms/nb phases) (ms/nb phases)
0182 762.8 ± 112.9 255 (5) 153 (-3)0183 740.5 ± 152.7 294 (6) 147 (-3)0185 751.0 ± 48.9 250 (5) 200 (-4)0186 765.6 ± 43.6 255 (5) 204 (-4)0187 712.5 ± 44.6 240 (5) 192 (-4)0189 702.9 ± 100.4 282 (6) 188 (-4)0190 658.5 ± 52.1 220 (5) 220 (-5)0191 713.8 ± 59.1 240 (5) 192 (-4)
Table 2. Percentages of counts used for the different SPECT images reconstructionschemes: NG3D, G4D (15 phases) and BH3D. Values are presented as mean +/-standard deviation.
Number of counts used (%)
NG3D Total 100.00
G4D Used counts / phase 6.65 ± 0.19Total 99.76 ± 2.88Omitted counts 3.64 ± 3.14counts used twice 3.51 ± 1.55Percentages of counts used twice per phasephase 1 31.44 ± 7.11phase 2 9.67 ± 7.94phase 3 5.29 ± 7.02phase 4 3.60 ± 4.87phase 5 1.79 ± 2.48phase 6 0.46 ± 0.68phase 7 0.22 ± 0.47phase 8 0.10 ± 0.26phase 9 0.01 ± 0.04phases 10 to 15 0
G4DSR Used counts / phase 6.45 ± 0.29Total 96.75 ± 4.36
BH3D Total 63.99 ± 4.58

Amplitude-based reconstruction in micro-SPECT 17
Table 3. Quantitative results for NG3D, G4D and BH3D reconstruction methods:SUVpeak, SUVmean, lesion volume (threshold at 40% of the SUVmax value), noiseestimation in homogeneous liver area and signal-to-noise ratio (SNR). Values arepresented as mean +/- standard deviation.
Parameters NG3D G4D (15 phases)a G4D (6 phases)a BH3D
Noiseb 0.15 ± 0.04 0.47 ± 0.14 0.30 ± 0.08 0.18 ± 0.05SUVpeak 7.26 ± 5.32 8.18 ± 5.56 7.87 ± 5.46 7.87 ± 5.47SUVmean 6.90 ± 5.26 8.63 ± 6.00 7.85 ± 5.67 7.80 ± 5.65Volume (mm3) 2.14 ± 1.29 1.60 ± 0.87 1.84 ± 1.00 1.79 ± 1.02SNR (SUVmean/Noise) 48.85 ± 40.02 19.81 ± 14.98 31.82 ± 22.50 45.61 ± 35.86a G4D values are the average values of end-of-exhalation images corresponding to themotionless phases - i.e. 9 or 10 phases (resp. 4) in the case of G4D with 15 phases(resp. 6 phases).b Noise measure refers to the standard deviation in a homogeneous liver area.

Amplitude-based reconstruction in micro-SPECT 18
Figure captions
Figure 1. Histogram of cycle duration This figure presents the distribution ofcycle duration for a pressure signal record, with its Gaussian curve fit. Vertical reddotted lines indicate the average cycle duration C (middle) and the two limits C − 3σand C + 3σ that have been defined for the cycle selection. Cycle with a durationoutside the limits are discarded for following reconstruction.
Amplitude-based reconstruction in micro-SPECT 19
Figure 2. Reconstruction windows for G4D reconstruction The two graphsrepresent two samples of the same pressure signal. Vertical lines delimit thereconstruction windows for each phase of the G4D image. Sample of pressure signalwith cycles shorter than the average duration Cf highlights the overlapping of phasesfrom consecutive cycles (a); Sample of pressure signal with cycles longer than Cf
highlights the fact that data at the end of some cycle are not used for reconstruction(b). Moreover, to reconstruct a phase of the G4D image (for example phase 15), G4Dreconstruction use data that does not correspond to the same time in the respiratorycycle. Sometimes it corresponds to the end of exhalation (a), sometimes it correspondsto the end of inhalation (b).
Amplitude-based reconstruction in micro-SPECT 20
Figure 3. Singularity of anaesthetised mice pressure signal with motionphase detection Pressure signal recorded with the monitoring system (a); andnormalised average pressure signal (continuous curve) and normalised histogramresulting from the image-based motion phase detection (dashed curve), the horizontalline depicts the threshold determined by the Otsu method (b). The phases gettingmore votes (above the threshold) are associated with the motion phase and the oneswith less votes (below the threshold) are associated with the motionless phase.
Amplitude-based reconstruction in micro-SPECT 21
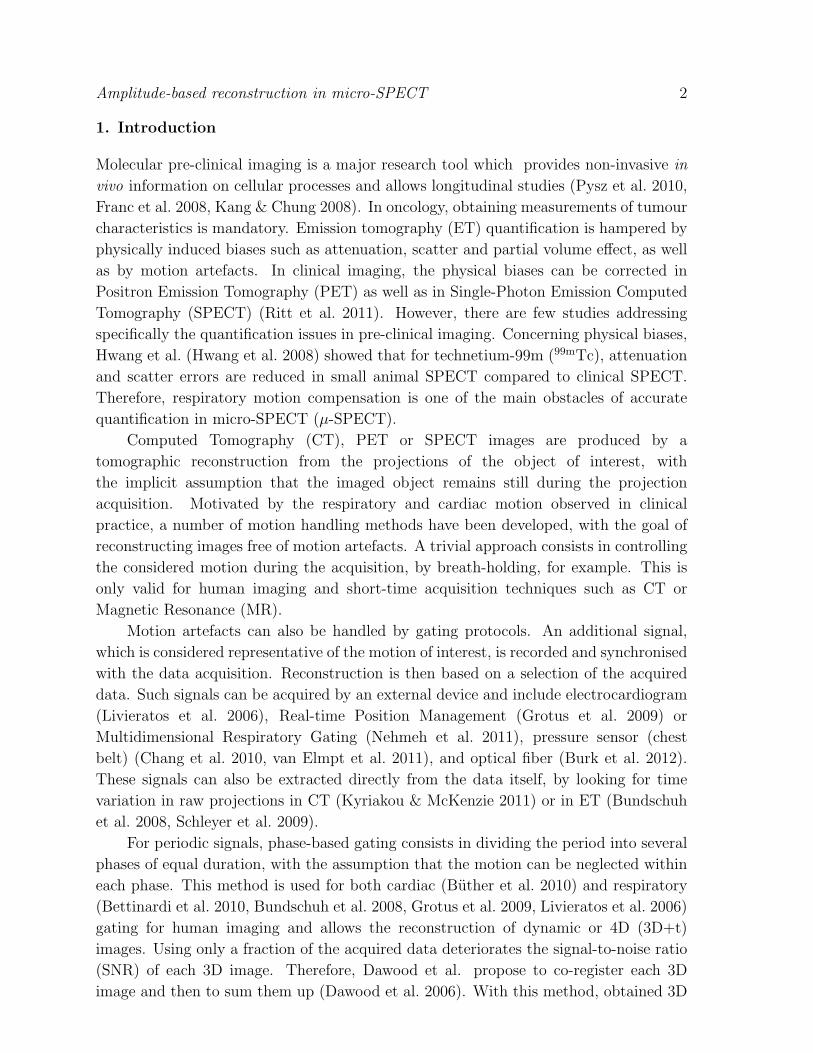
Figure 4. CT/SPECT volume rendering highlighting peritoneal carcinomalesions. Volume rendering of fused CT and SPECT (NG3D) highlighting peritonealcarcinoma lesions after 3 weeks of growth, salivary glands and stomach (S).

Amplitude-based reconstruction in micro-SPECT 22
Figure 5. Comparison between pressure signal and image-based measurescomputed on 4D-SPECT and 4D-CT. Normalised average pressure signal(continuous curve); normalised histogram h4D−SPECT (n) computed on the 4D-SPECTimage (staircase); normalised histogram h4D−CT (n) of motion phase computed on the4D-CT image (gray curve with cross-shaped markers); and lung volume (mL) measuredon the 4D-CT image (dotted curve with circle-shaped markers).

Amplitude-based reconstruction in micro-SPECT 23
Figure 6. Sagittal views from sub-diaphragmatic peritoneal lesionscomparing NG3D, G4D (15 phases), BH3D SPECT reconstructionmethods. Top row: anatomical reference CT image (a), NG3D reconstruction (b),end-of-exhalation phase from G4D reconstruction (c), end-of-inhalation phase fromG4D reconstruction (d), BH3D reconstruction (e); bottom row: zoomed-in on lesionsof interest of the SPECT images. The SUV colour map has been set up on SUVmax
values in G4D images for the selected lesion.

Amplitude-based reconstruction in micro-SPECT 24
Figure 7. Quantitative results for lesions and image characteristicsQuantitative results for lesions SUVmean (a), lesions volumes (b), signal-to-noise ratio(SNR) (c), and noise (d). Box plots show the median, upper and lower quartiles andrange; + indicate outliers. Statistical significance: ** for p < 0.01, *** for p < 0.001,p-value is given when non significant (p > 0.05).
Related Documents