1635 Incorporation of urea decreases ammonia (NH 3 ) volatilization, but field measurements are needed to better quantify the impact of placement depth. In this study, we measured the volatilization losses aſter banding of urea at depths of 0, 2.5, 5, 7.5, and 10 cm in a slightly acidic (pH 6) silt loam soil using wind tunnels. Mineral nitrogen (N) concentration and pH were measured in the top 2 cm of soil to determine the extent of urea N migration and the influence of placement depth on the availability of ammoniacal N for volatilization near the soil surface. Ammonia volatilization losses were 50% of applied N when urea was banded at the surface, and incorporation of the band decreased emissions by an average of 7% cm -1 (14% cm -1 when expressed as a percentage of losses aſter surface banding). Incorporating urea at depths >7.5 cm therefore resulted in negligible NH 3 emissions and maximum N retention. Cumulative losses increased exponentially with increasing maximum NH 4 + –N and pH values measured in the surface soil during the experiment. However, temporal variations in these soil properties were poorly related to the temporal variations in NH 3 emission rates, likely as a result of interactions with other factors (e.g., water content and NH 4 + –N adsorption) on, and fixation by, soil particles. Laboratory and field volatilization data from the literature were summarized and used to determine a relationship between NH 3 losses and depth of urea incorporation. When emissions were expressed as a percentage of losses for a surface application, the mean reduction aſter urea incorporation was approximately 12.5% cm -1 . Although we agree that the efficiency of urea incorporation to reduce NH 3 losses varies depending on several soil properties, management practices, and climatic conditions, we propose that this value represents an estimate of the mean impact of incorporation depth that could be used when site-specific information is unavailable. Ammonia Volatilization and Nitrogen Retention: How Deep to Incorporate Urea? Philippe Rochette,* Denis A. Angers, Martin H. Chantigny, Marc-Olivier Gasser, J. Douglas MacDonald, David E. Pelster, and Normand Bertrand A mmonia (NH 3 ) volatilization is the most important source of nitrogen (N) loss from many agricultural soils receiving ammonium (NH 4 + )-based synthetic fertiliz- ers (Sommer et al., 2004). In addition to its negative impacts on crop productivity and farm profitability, the emitted NH 3 results in human health problems (Künzli et al., 2000) and has a nega- tive impact on the health of natural ecosystems (Sutton et al., 1993; Erisman et al., 2008). Among synthetic fertilizers, potential NH 3 emissions are greatest for urea (Bouwman and Boumans, 2002), for which cumulative losses can reach 60% of applied N (Sommer et al., 2004; Rochette et al., 2009a). Practices recommended to lower volatilization aim at reducing the presence of NH 4 + –N near the soil surface. ey include the use of urease inhibitors (Watson, 1990), slow-release forms (Rao, 1987), and irrigation shortly aſter application (Holcomb et al., 2011). However, the most common mitigation measure remains the incorporation of the fertilizer into the soil because the resistance to the upward diffusion of ammoniacal N in the liquid and gaseous phases and the retention of NH 4 + –N on soil particles are increased when urea is placed at depth (Sommer et al., 2004). e impact of soil incorporation of urea on NH 3 losses has been quantified in laboratory/greenhouse experiments where reductions in volatilization aſter incorporation to depths ≥2.5 cm varied from 14 to 72% when urea was mixed into surface soil, from 27 to 66% when urea was placed uniformly at a given depth, and from 32 to 100% when urea was subsurface banded (Table 1). Reduction in volatilization increases with incorporation depth. For example, Ernst and Massey (1960) reported reductions of 17 and 72% compared with emissions from soil-surface application when urea was mixed into the top 0.64 and 3.8 cm, respectively. ere have been a few studies under field conditions where subsurface banding reduced volatilization losses from 25 to 84% (Table 1). Higher emissions have been reported from subsurface- banded compared with surface-applied urea when the dry soil surface was limiting urea hydrolysis (Buresh, 1987; Rochette et al., 2009b). erefore, if past research agrees that incorporating urea into surface soil reduces volatilization, it also highlights how variable the effectiveness of the measure can be. Most of P. Rochette, D.A. Angers, M.H. Chantigny, D.E. Pelster, and N. Bertrand, Agriculture and Agri-Food Canada, 2560 Hochelaga Blvd., Québec City, QC, Canada, G1V 2J3; M.-O. Gasser, Institut de recherche et développement en agroenvironnement, 2700 Einstein St., Québec City QC, Canada, G1P 3W8; J.D. MacDonald, Environment Canada, 19th floor, 351 St-Joseph Blvd., Gatineau, QC, Canada, K1A 0H3. Assigned to Associate Editor Søren Petersen. Copyright © American Society of Agronomy, Crop Science Society of America, and Soil Science Society of America. 5585 Guilford Rd., Madison, WI 53711 USA. All rights reserved. No part of this periodical may be reproduced or transmitted in any form or by any means, electronic or mechanical, including photocopying, recording, or any information storage and retrieval system, without permission in writing from the publisher. J. Environ. Qual. 42:1635–1642 (2013) doi:10.2134/jeq2013.05.0192 Received 16 May 2013. *Corresponding author ([email protected]). Journal of Environmental Quality ATMOSPHERIC POLLUTANTS AND TRACE GASES TECHNICAL REPORTS

Welcome message from author
This document is posted to help you gain knowledge. Please leave a comment to let me know what you think about it! Share it to your friends and learn new things together.
Transcript

1635
Incorporation of urea decreases ammonia (NH3) volatilization, but field measurements are needed to better quantify the impact of placement depth. In this study, we measured the volatilization losses after banding of urea at depths of 0, 2.5, 5, 7.5, and 10 cm in a slightly acidic (pH 6) silt loam soil using wind tunnels. Mineral nitrogen (N) concentration and pH were measured in the top 2 cm of soil to determine the extent of urea N migration and the influence of placement depth on the availability of ammoniacal N for volatilization near the soil surface. Ammonia volatilization losses were 50% of applied N when urea was banded at the surface, and incorporation of the band decreased emissions by an average of 7% cm-1 (14% cm-1 when expressed as a percentage of losses after surface banding). Incorporating urea at depths >7.5 cm therefore resulted in negligible NH3 emissions and maximum N retention. Cumulative losses increased exponentially with increasing maximum NH4
+–N and pH values measured in the surface soil during the experiment. However, temporal variations in these soil properties were poorly related to the temporal variations in NH3 emission rates, likely as a result of interactions with other factors (e.g., water content and NH4
+–N adsorption) on, and fixation by, soil particles. Laboratory and field volatilization data from the literature were summarized and used to determine a relationship between NH3 losses and depth of urea incorporation. When emissions were expressed as a percentage of losses for a surface application, the mean reduction after urea incorporation was approximately 12.5% cm-1. Although we agree that the efficiency of urea incorporation to reduce NH3 losses varies depending on several soil properties, management practices, and climatic conditions, we propose that this value represents an estimate of the mean impact of incorporation depth that could be used when site-specific information is unavailable.
Ammonia Volatilization and Nitrogen Retention: How Deep to Incorporate Urea?
Philippe Rochette,* Denis A. Angers, Martin H. Chantigny, Marc-Olivier Gasser, J. Douglas MacDonald, David E. Pelster, and Normand Bertrand
Ammonia (NH3) volatilization is the most important source of nitrogen (N) loss from many agricultural soils receiving ammonium (NH4
+)-based synthetic fertiliz-ers (Sommer et al., 2004). In addition to its negative impacts on crop productivity and farm profitability, the emitted NH3 results in human health problems (Künzli et al., 2000) and has a nega-tive impact on the health of natural ecosystems (Sutton et al., 1993; Erisman et al., 2008).
Among synthetic fertilizers, potential NH3 emissions are greatest for urea (Bouwman and Boumans, 2002), for which cumulative losses can reach 60% of applied N (Sommer et al., 2004; Rochette et al., 2009a). Practices recommended to lower volatilization aim at reducing the presence of NH4
+–N near the soil surface. They include the use of urease inhibitors (Watson, 1990), slow-release forms (Rao, 1987), and irrigation shortly after application (Holcomb et al., 2011). However, the most common mitigation measure remains the incorporation of the fertilizer into the soil because the resistance to the upward diffusion of ammoniacal N in the liquid and gaseous phases and the retention of NH4
+–N on soil particles are increased when urea is placed at depth (Sommer et al., 2004).
The impact of soil incorporation of urea on NH3 losses has been quantified in laboratory/greenhouse experiments where reductions in volatilization after incorporation to depths ≥2.5 cm varied from 14 to 72% when urea was mixed into surface soil, from 27 to 66% when urea was placed uniformly at a given depth, and from 32 to 100% when urea was subsurface banded (Table 1). Reduction in volatilization increases with incorporation depth. For example, Ernst and Massey (1960) reported reductions of 17 and 72% compared with emissions from soil-surface application when urea was mixed into the top 0.64 and 3.8 cm, respectively. There have been a few studies under field conditions where subsurface banding reduced volatilization losses from 25 to 84% (Table 1). Higher emissions have been reported from subsurface-banded compared with surface-applied urea when the dry soil surface was limiting urea hydrolysis (Buresh, 1987; Rochette et al., 2009b). Therefore, if past research agrees that incorporating urea into surface soil reduces volatilization, it also highlights how variable the effectiveness of the measure can be. Most of
P. Rochette, D.A. Angers, M.H. Chantigny, D.E. Pelster, and N. Bertrand, Agriculture and Agri-Food Canada, 2560 Hochelaga Blvd., Québec City, QC, Canada, G1V 2J3; M.-O. Gasser, Institut de recherche et développement en agroenvironnement, 2700 Einstein St., Québec City QC, Canada, G1P 3W8; J.D. MacDonald, Environment Canada, 19th floor, 351 St-Joseph Blvd., Gatineau, QC, Canada, K1A 0H3. Assigned to Associate Editor Søren Petersen.
Copyright © American Society of Agronomy, Crop Science Society of America, and Soil Science Society of America. 5585 Guilford Rd., Madison, WI 53711 USA. All rights reserved. No part of this periodical may be reproduced or transmitted in any form or by any means, electronic or mechanical, including photocopying, recording, or any information storage and retrieval system, without permission in writing from the publisher. J. Environ. Qual. 42:1635–1642 (2013) doi:10.2134/jeq2013.05.0192 Received 16 May 2013. *Corresponding author ([email protected]).
Journal of Environmental QualityATMOSPHERIC POLLUTANTS AND TRACE GASES
TECHNICAL REPORTS
1636 Journal of Environmental Quality
the variation between studies is likely related to differences in incorporation depth and in soil properties, such as pH, pH buffer capacity, water content, bulk density, and temperature (Kissel et al., 2008).
Although soil incorporation of urea is an important factor for reducing NH3 volatilization, few studies have assessed the impact of placement depth on NH3 volatilization regardless of incorporation mode, and none of the studies under field conditions included more than one depth (Table 1) or described the dynamics of pertinent soil properties during the emission period. Consequently, modeling the urea-N movement in soils and predicting the reduction in NH3 losses and incorporation of urea are uncertain (Nye, 1992). Incorporation depth may be
especially critical when urea is subsurface banded because emission potential is increased by higher NH4
+–N concentration and pH near the band (Rochette et al., 2009b). In this study, we report volatilization losses after banding of urea at depths of 0 to 10 cm in a slightly acidic silt loam soil. Soil mineral N concentration and pH were measured to determine how urea placement depth influenced the availability of ammoniacal N for volatilization near the soil surface. We also examined published literature to describe the response of NH3 emissions to soil incorporation of urea and propose a general relationship between the reduction in emissions and incorporation depth.
Table 1. Summary of the proportion of urea nitrogen lost as ammonia after surface broadcast, mixing into the surface soil, placement, or subsurface banding of urea (excluding paddy soils). Only studies reporting losses for surface application were included.
Volatilization losses, % of applied NSoil pH Reference/comments
Surface Mixed Placed† Banded
Laboratory/greenhouse‡12 4 (5)§ 6.1 Sigunda et al. (2002)52 20 (5) 7.7 Sigunda et al. (2002)18 15 (0.64) 6.5 Ernst and Massey (1960)18 12.5 (1.3) 6.5 Ernst and Massey (1960)18 5 (3.8) 6.5 Ernst and Massey (1960)
7 6 (2.5) 6.9–8.1 Gasser (1964) (four soils)19 17 (3.3) 14 (2.5) 6.2 Blaise et al. (1996)75 69 (0.64) 5.7 Overrein and Moe (1967) (0.1 g g-1 H2O)75 60 (1.28) 5.7 Overrein and Moe (1967) (0.1 g g-1 H2O)75 54 (1.92) 5.7 Overrein and Moe (1967) (0.1 g g-1 H2O)75 48 (2.5) 5.7 Overrein and Moe (1967) (0.1 g g-1 H2O)60 54 (0.64) 5.7 Overrein and Moe (1967) (0.2 g g-1 H2O)60 38 (1.28) 5.7 Overrein and Moe (1967) (0.2 g g-1 H2O)60 28 (1.92) 5.7 Overrein and Moe (1967) (0.2 g g-1 H2O)60 20 (2.5) 5.7 Overrein and Moe (1967) (0.2 g g-1 H2O)60 51 (1.25) 10.6 Rao and Batra (1983)60 47 (2.5) 10.6 Rao and Batra (1983)60 32 (3.75) 10.6 Rao and Batra (1983)60 16 (5.0) 10.6 Rao and Batra (1983)60 15 (6.25) 10.6 Rao and Batra (1983)60 4 (7.5) 10.6 Rao and Batra (1983)59 24 (2.5) 6–8.5 Ismail et al. (1991)59 7 (5) 6–8.5 Ismail et al. (1991)59 2 (7.5) 6–8.5 Ismail et al. (1991)59 0 (10) 6–8.5 Ismail et al. (1991)29 27 (6) 13 (6) 6.1–7.5 du Preez and Burger (1987) (five soils)21 10 (2) 5.2 Al-Kanani et al. (1994)66 45 (2.5) 7.9 Fenn and Miyamoto (1981)66 0 (5) 7.9 Fenn and Miyamoto (1981)25 3 (2.5) 7.4 Bouwmeester et al. (1985)
Field‡12.5 1.1 (6) 4.8 Fontoura and Bayer (2010)37 6 (4) 5.6 Prasertsak et al. (2002)12 9 (5) – Palma et al. (1998)
9 5 (5) – Palma et al. (1998)64 31 (5) 5.7 Rochette et al. (2009a)
† Urea was placed uniformly at a given depth.
‡ Data from Buresh (1987) and Rochette et al. (2009b) were omitted because dry soil surface conditions resulted in exceptionally low volatilization from surface-applied urea.
§ Numbers in parentheses are the soil depths (cm) into which urea was mixed or at which it was placed or banded.

www.agronomy.org • www.crops.org • www.soils.org 1637
Materials and MethodsExperimental Site and Treatments
The study was conducted at the research farm of the Institut de Recherche et de Développement en Agroenvironnement located near Quebec City, Canada (46°05¢ N,71°02¢ W; altitude, 110 m). Mean air temperature in Quebec City is 4.2°C, and annual precipitation is 1213 mm.
The soil was a Le Bras silt loam (191 g clay kg-1; 516 g silt kg-1; loamy, mixed, frigid, Typic Humaquept). Mean and standard deviation (n = 4) of other selected properties (0–20 cm) were 4.28 ± 0.10 meq Ca2+ 100 g soil-1, 1.26 ± 0.08 meq Mg2+ 100 g soil-1, 0.43 ± 0.03 meq K+ 100 g soil-1, and 0.07 ± 0.01 meq Na+ 100 g soil-1. Total bases were 6.03 ± 0.11 meq 100 g soil-1, cationic exchange capacity was 17.73 ± 1.49 meq 100 g soil-1 (Chapman, 1965), and base saturation was 34.23 ± 3.71%. Analysis of cations was made using atomic absorption (Spectra 220 FS, Varian Inc.). Soil total carbon content was 20.0 ± 4.3 g kg-1, water content at field capacity was 0.30 m3 m-3, and pH was slightly acidic (5.5). The titratable acidity determined according to Izaurralde et al. (1987) was 56 and 94 mmol OH- kg-1 soil for pH values of 8 and 9, respectively. The soil had a history of annual moldboard plowing in the fall and had been cropped to spring barley (Hordeum vulgare L.) in the year preceding the study. The soil was not plowed in fall 2009, and volatilization trials were performed on bare soil where weeds were controlled using glyphosate. The six treatments consisted of an untreated control and urea (12.3 g N m-1, corresponding to 164 kg N ha-1 with bands spaced 0.75 m apart) banded at depths of 0, 2.5, 5.0, 7.5, and 10 cm in narrow trenches (5 cm width) using hand tools. The excavated soil was sieved to 6 mm and placed back on top of the urea at the original bulk density. Soil sieving was done to avoid heterogeneous conditions above the band that would confound treatment effects. It resulted in less macroporosity and likely greater resistance to ammoniacal N diffusion than in most situations where urea is applied with field equipment.
Volatilization MeasurementsAmmonia volatilization was measured from 9 Aug. to 3
Sept. 2010 using wind tunnels (Lockyer, 1984; Rochette et al., 2001) on a series of 18 plots (six treatments, three replicates in a randomized complete block design). Each plot was completely covered by a tunnel consisting of a 0.5 m × 2 m Plexiglas dome attached to a steel duct housing a fan that drew air through the tunnel at a rate of 15 m3 min-1. Air entering and leaving the dome was sampled at 3 L min-1, with sampling points located as proposed by Loubet et al. (1999), and passed through a 100-mL, 0.005 mol L-1 H3PO4 trap to capture the NH3. Air volumes were measured with a domestic gas meter, and NH4
+ concentrations in the traps were analyzed by colorimetry (Model QuickChem 8000 FIA+, Lachat Instruments Ltd.). Air temperature and velocity under the tunnels were measured using a hot-wire sensor (Model KM 4007, Comark Ltd.). The rate of NH3 volatilization (FNH3, mg N m-2 h-1) was calculated as
3NH o i( )f
F c cA
= -
where f (L h-1) is the air flow rate through the tunnel, A (m-2) is the enclosed surface area, and ci and co (mg NH3–N L-1) are the NH3 concentrations of the air entering and leaving the tunnel. Ammonia traps were changed each hour for the first 2 h, every 2 h for 8 h, at approximately 8-h intervals until 105 h, and daily for the remainder of the experiment. Cumulative NH3 losses were obtained by summing emissions during individual periods. A meteorological station was installed at the site to record daily rainfall, solar radiation, air temperature, soil temperature at a depth of 2 cm, relative humidity, wind speed, and wind direction.
Soil Sampling and AnalysesAdjacent to the site where the tunnels were installed, 24
additional plots (0.75 × 4 m) receiving the same six treatments as the tunnels were prepared for soil sampling and covered with a clear plastic greenhouse tunnel (5.5 × 10.0 m) (Les Serres Harnois). Greenhouses were fully opened at both ends to simulate conditions under the wind tunnels. Differences in wind speed and air temperature (<2°C) occurred, but it is assumed they had minimal impact on urea N transformations and volatilization.
Soil samples consisted of nine subsamples of the 0- to 2-cm layer taken directly in the band using hand tools. Soil sampling took place daily during the first 3 d and every 3 to 6 d afterward. Samples were transported immediately to the laboratory and analyzed for water content, pH (2:1 soil:water ratio), and KCl-exchangeable mineral N (10 g of field moist soil in 40 mL of 1 mol L-1 KCl). For mineral N, soil slurries were shaken for 1 h on a reciprocal shaker, centrifuged (3000 × g for 10 min), and filtered through Whatman no. 42 filter papers prewashed with 1 mol L-1 KCl. The extracts were frozen (-20°C) and stored until analyzed for NH4
+ and NO3- + NO2
- by colorimetry with the automated analyzer described for NH3 traps.
The greenhouses and wind tunnels were kept in place throughout the experiment to prevent rainfall from interfering with treatment effects on NH3 volatilization. All plots in both sites received 5 mm of simulated rain 7, 14, and 21 d after initiation of treatments using a watering can. Each wetting event increased soil water content to a depth ≤2 cm.
Statistical AnalysesThe PROC MIXED procedure of SAS (SAS Institute, 1999)
(LSD; P ≤ 0.05) was used to compare cumulative NH3–N loss for the first, second, third, and fourth weeks after urea application and for the entire monitoring period. The same procedure was used to compare soil pH and soil NH4
+–N concentration for each sampling date.
Results and DiscussionSoil Mineral Nitrogen Content and pH in the Top 2 cm of Soil
Ammonia volatilization is largely controlled by soil NH4+–N
content, pH, and water content near the soil surface (Sommer et al., 2004). Soil NH4
+–N concentration in the top soil layer (0–2 cm) above the band remained close to zero during the experiment in the control plots (Fig. 1b). Hydrolysis had begun by approximately 4 h after urea application, as indicated by increased
1638 Journal of Environmental Quality
NH4+–N values in the 0-cm (72 mg N kg-1) and 2.5-cm (39 mg
N kg-1) treatments. Early urea hydrolysis likely occurred in the other treatments, but surface NH4
+–N concentrations remained similar to the control until 100 and 340 h after application in the 5- and 7.5-cm treatments, respectively. Such delays indicate that the upward migration rate of NH4
+–N was slow, and its mean velocity was estimated to be approximately 1 and 0.5 cm d-1 in the 5- and 7.5-cm treatments, respectively. The slower movement of NH4
+–N from deeper-placed urea can be explained by a decreasing concentration gradient with increasing distance from the urea band as a result of dilution in a greater volume of soil, adsorption on soil particles, and nitrification. Urea banding at 10 cm had no impact on the soil surface NH4
+–N concentration during the experiment, indicating that the above-mentioned processes consumed NH4
+–N at a rate greater than that at which it was diffusing out of the band.
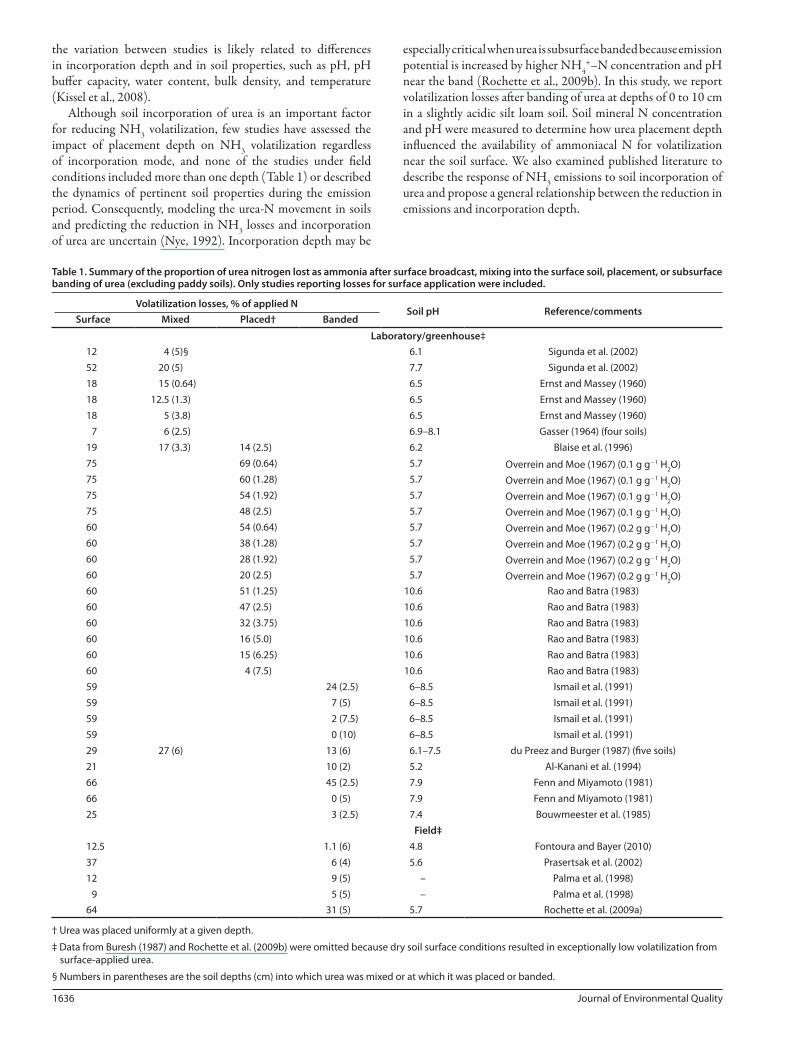
The maximum NH4+–N concentrations
in the top 2-cm soil layer measured during the experiment were inversely proportional to the placement depth, with values of 1538, 1329, 882, 392, and 14 mg N kg-1 for the 0-, 2.5-, 5.0-, 7.5-, and 10-cm treatments, respectively (Fig. 1b). For the four shallower depths, the concentration remained constant or decreased slowly after the value peaked, likely as a result of nitrification and volatilization. The fact that none of the urea N applied at 10 cm migrated to the top 2 cm of soil as NH4
+ and the moderate increase (400 mg NH4
+–N kg-1) at the end of the measurement period in the 7.5-cm treatment are in agreement with the low mobility of this ion and show that most of the released NH4
+ was retained near (£7.5 cm) the application site. There are few reports of the movement of NH4
+–N after banding of urea. Dawar et al. (2011) measured downward and lateral NH4–N migration after surface application of urea (100 kg N ha-1) to a moist, slightly acidic silt loam soil in the laboratory. The migration rate and extent of the affected soil volume were similar to those obtained for upward movement in this study. In contrast, Black et al. (1987) (silt loam) observed that urea-N moved less than 3 cm from the point of application. Similar studies after band application of anhydrous ammonia reported that the expansion of the affected zone was completed after 24 h and was limited to a radius of 5 cm (Nõmmik and Nilsson, 1963 [fine sand and clay loam]; Nõmmik and Vahtras, 1982 [loamy fine sand]) and to a radius of 4 to 8 cm (Izaurralde et al., 1990 [several soils]) when anhydrous ammonia was injected at rates up to 8.5 g N m-1. This variability is likely explained by differences in soil clay content, bulk density (Izaurralde et al., 1990), pH buffer capacity (Izaurralde et al., 1990), and water content (Nõmmik and Nilsson, 1963).
Water application had a marked impact on surface treatments. Surface-soil NH4
+–N concentration in the 0-cm treatment increased slightly during the first 2 d to 288 mg kg-1 and then remained constant until the first water application, when it increased to a high of 1538 mg kg-1 (Fig. 1b). The low early values and strong response to water application indicate that urea hydrolysis was limited by insufficient water for urea dissolution or hydrolysis on the dry soil surface. An early water limitation is in contradiction with surface soil water contents, which were highest at the time of urea application (Fig. 2). This indicates that the mean water content in the top 2 cm is not a good indicator of the conditions at the immediate soil surface. Values in the 2.5-cm treatment were similar to the 0-cm treatment during the first 2 d but reached higher values (1329 mg N kg-1) during the first week. Greater urea hydrolysis rates at shallow depth (5 cm) than at the soil surface were also observed under dry
Fig. 1. Ammonia volatilization rate (a), soil NH4+–N concentration (0–2 cm) (b), soil pH (0–2 cm)
(c), and soil NO3−–N concentration (0–2 cm) from urea banded (12.3 g N m−1) at five depths (d).
Treatments were initiated at 0930 h on Day 1. Vertical dashed lines indicate wetting events (5 mm). Vertical bars represent standard deviation of the means.

www.agronomy.org • www.crops.org • www.soils.org 1639
conditions by Rochette et al. (2009b). None of the three wetting events affected NH4
+–N concentration in the top 2 cm of soil where urea was incorporated (Fig. 1b), indicating that any positive impacts of added water on urea hydrolysis were offset by impacts on NH4
+–N diffusion rate or sinks, such as nitrification and adsorption on soil particles.
Soil pH in the top 2 cm of soil followed a pattern similar to the soil NH4
+–N concentration (Fig. 1c). The maximum increases compared with the control plots during the experiment were approximately 1 unit in the 7.5-cm treatment and 2.5 to 3 units in the 0-, 2.5-, and 5-cm treatments. The 10-cm depth application had no impact on soil surface pH, indicating that the volumes of soil in which pH and NH4
+–N concentration were affected by the urea band were of similar dimension. Nõmmik and Nilsson (1963) also observed changes in pH only where NH4
+–N had diffused after a line injection of anhydrous ammonia.
Soil NO3-–N concentration in the top 2 cm remained low
and constant on all plots until 320 h after application, when it began to increase linearly until the end of the measurement period (Fig. 1d). At the end of the experiment, NO3
-–N concentrations were greatest for the 10-cm urea placement depth and lowest for the 2.5-cm urea placement depth. High NH3 concentration and pH values can inhibit nitrification near the urea placement, and nitrification rate was found to be higher 3 and 5 cm away from the injection line of anhydrous ammonia than on the line itself (Nõmmik and Nilsson, 1963). Therefore, the increase in NO3
-, but not NH4+, concentrations in the top
2 cm of soil where urea was incorporated at 10-cm depth was likely the result of the nitrification of NH4
+ that had diffused away from the application band.
Ammonium VolatilizationTemporal Pattern
The NH3 volatilization rates after surface application were not greater than the unamended control until after the first soil wetting event (Fig. 1a). The absence of emissions despite increased soil-surface NH4 concentration (300 mg N kg-1) and pH 7.5 during this period indicates that NH3 concentration was low in the absence of sufficient water to fully solubilize ammoniacal N
(Fig. 2). After the first wetting event, emission rates reached 100 mg N m-2 h-1 on two consecutive days and then declined until another 2-d episode of increased volatilization after the second wetting event. A small rise in emissions after the last wetting event confirmed that water availability was still limiting NH3–forming processes at the soil surface 21 d after surface banding of urea.
Placing the banded urea at 2.5 cm resulted in a more rapid response of NH3 emissions than at the soil surface (Fig. 1a), in agreement with a faster hydrolysis of urea under wetter conditions (Fig. 1b). Greater emissions from shallow-incorporated, compared with surface-applied, urea have also been reported by Buresh (1987) and Rochette et al. (2009b) under similar dry soil conditions. Emissions in the 2.5-cm treatment displayed a clear temperature-driven diurnal pattern during the third and fourth days after application and remained the highest among urea-treated plots until the first wetting event when volatilization increased, but to a lesser extent than the surface treatment. Emissions were low from all treatments where incorporation depth was ≥5 cm during the measurement period.
Cumulative LossesFor analysis purposes, the measurement period was split
according to intervals between wetting events (0–7, 8–14, 15–21, and 21–25 d). Cumulative emissions from the surface, 2.5-cm, and 5-cm placement depths were greater than from the control plots (P < 0.05) during all subperiods, whereas those at the 7.5-cm depth were greater during only one subperiod (Table 2). Ammonia losses from the 10-cm depth plots were similar to the unamended controls in all subperiods. From urea application
Fig. 2. Soil maximum (open squares) and minimum (open circles) daily temperature under the wind tunnels and water content (solid circles) at 0 to 2 cm depth under the greenhouses during the experiment.
Table 2. Cumulative ammonia losses after subsurface banding of urea (12.3 g N m-1) at increasing depths in a silt loam soil.
PeriodUrea placement depth
Control†Surface 2.5 cm 5 cm 7.5 cm 10 cm
h mg NH3–N m-1 %‡ mg NH3–N m-1 % mg NH3–N m-1 % mg NH3–N m-1 % mg NH3–N m-1 % mg NH3–N m-1
0–166 325b 2.2 2326a§ 18.4 373b 2.6 61c 0.0 47c -0.1 59c167–334 3660a 29.5 1901b 15.2 425c 3.2 42d 0.1 27d -0.1 34d335–502 1893a 15.2 494b 3.8 244c 1.8 90d 0.5 41e 0.1 26e503–598 464a 3.4 161b 1.0 169b 1.0 15c -0.2 -1c -0.3 41cTotal 6342a 50.3 4882a 38.4 1211b 8.6 206c 0.4 113c -0.4 159c
† Unamended control.
‡ Percent of applied urea N corrected for the background emissions from the control.
§ Different letters within each line indicate significant differences between treatments (P £ 0.05) for a given period.
1640 Journal of Environmental Quality
to the first wetting event, the surface and 2.5-cm placement depth resulted in greater cumulative emissions than the control. The 5-cm depth also emitted more NH3 than the control during this period even though individual measurements were not statistically greater than the control. Losses for the 2.5-cm placement depth reached 2.33 g N m-1 and were approximately seven times greater than from the surface and 5-cm depth banding. During all subsequent subperiods, losses were greatest from the surface treatment.
Although it has been shown that incorporation of urea into the soil decreases NH3 volatilization losses, few studies have reported the impact of placement depth on this reduction, and none was performed under field conditions (Table 1). Total NH3 emissions after banding of urea corresponded to nearly 50% of applied N for surface application but were approximately zero when banded at depths ³7.5 cm. The decrease in cumulative losses (NH3–CL; % of applied N) with increasing incorporation depth (D; cm) was described by a second-order polynomial:
NH3–CL = 53.6 – 10.582 D + 0.5006 D2 (r2 = 0.95)
The nonlinearity of the relationship is mostly the result of equally low volatilization losses at the 7.5- and 10-cm depths, and the reduction in losses above the 7.5-cm depth can be considered linear (7% of applied N cm-1). Our results agree well with those obtained by Ismail et al. (1991) (7.6% cm-1) in the laboratory when liquid urea was injected into a loamy sand at depths down to 7.5 cm. The proportion of applied N lost as NH3 was also shown to decrease by an average of 2.6% cm-1 (Ernst and Massey, 1960) when urea was mixed into the surface soil and by 23% cm-1 (Overrein and Moe, 1967) and 7.5% cm-1 (Rao and Batra, 1983) when urea was placed at specific depths. A large variability in the mean impact of incorporation depth on volatilization among studies is expected considering the differences in soil properties, climatic conditions, mode of incorporation, and experimental methodologies.
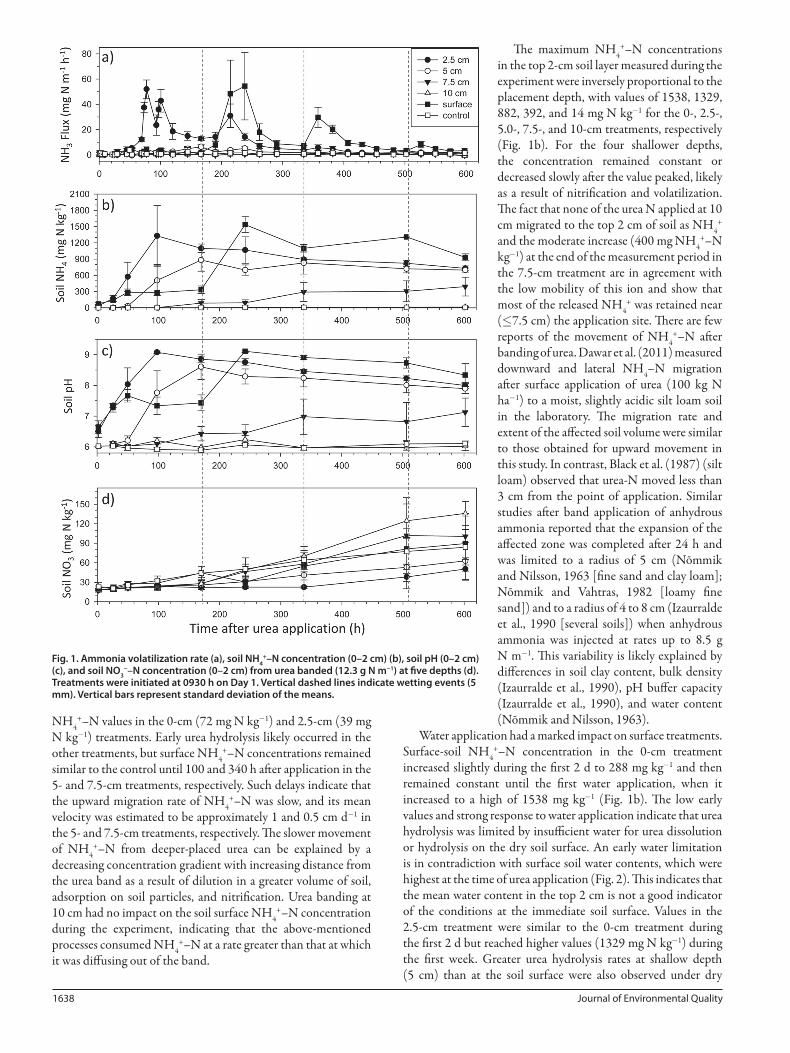
Volatilization vs. Soil-Surface PropertiesAmmonia volatilization depends on the availability of
NH3 at the soil surface, which is controlled by ammoniacal N concentration, pH, temperature, and water content. Accordingly, close nonlinear relationships were observed between cumulative NH3 losses and the maximum values of soil NH4
+–N concentration and pH in the top 2 cm of soil during the experiment (Fig. 3). Such relationships between NH3 losses and maximum pH are similar to those previously observed in the laboratory by Whitehead and Raistrick (1990) and Sommer and Ersbøll (1996) and confirm the key role played by pH near the soil surface on NH3 emissions under field conditions. All other factors influencing NH3 volatilization being constant, volatilization potential varies linearly with the NH4
+–N concentration in solution near the soil surface and nonlinearly with pH (Sommer et al., 2004). The KCl-extracted NH4
+–N overestimates the amounts of NH4+–N in solution
by including NH4+ adsorbed onto soil particles. However,
the relative overestimation (extracted/total soil NH4+–N) is
expected to decrease with increasing soil NH4+–N concentration
as adsorption sites become more saturated. Therefore, the nonlinearity found in Fig. 3a was likely not the result of increasing soil NH4
+–N availability in solution but rather was the result of
increased pH, confirming the key role of the initial soil pH and pH buffer capacity in controlling NH3 emissions after subsurface banding of urea (Nye, 1992). The pH buffer capacity of our soil as determined by the titratable acidity is in the midrange of the 36 soils tested by Stevens et al. (1989), suggesting that the results reported in this paper are representative of average agricultural situations.
Although we could relate cumulative NH3 losses to maximum changes in soil NH4
+–N and pH during the experiment, these variables could not fully explain the temporal variations in emissions. Indeed, emissions were greatest when the values of these variables were most favorable, but volatilization was also low during periods when these variables were conducive to emissions. For example, in the surface treatment, NH4
+–N and pH values remained high from the first wetting event to the end of the experiment, whereas the response of emissions to the last two wetting events was much smaller than to the first event. Similar observations can be made for the 2.5-cm placement depth. Considering the generally alkaline (pH > 8) conditions and the high soil NH4
+ concentration in the top 2 cm of soil for the surface and the 2.5- and 5-cm incorporation depths, the absence of a good correlation between NH3 emissions and these soil properties could be explained by several factors. First, increases in emissions after each wetting event for the surface-banding treatment and after the first wetting event for the 2.5-cm placement depth indicate that water content was limiting
Fig. 3. Relationships between cumulative NH3 losses after subsurface banding of urea and maximum soil NH4
+–N concentration (a) and maximum soil pH (b) during the monitoring period.

www.agronomy.org • www.crops.org • www.soils.org 1641
volatilization from these treatments. However, the fact that the magnitude of the response in emission to subsequent wettings decreased with time while NH4
+ and pH remained at similar levels indicates that water limitation alone could not explain the temporal variations in emissions. A second factor is that KCl extractions overestimate the amounts of NH4
+ that can be solubilized. Finally, in previous studies NH3 emissions were best related to the properties of a very thin soil surface layer (0.5 cm) (Sherlock and Goh, 1985; Chantigny et al., 2004; Garcia et al., 2011), and hence conditions in the top 2 cm of soil may not be a good estimator of the soil–atmosphere interface for NH3 volatilization. Our results highlight the difficulties in adequately predicting the NH3 source intensity in soils where urea is incorporated at depth.
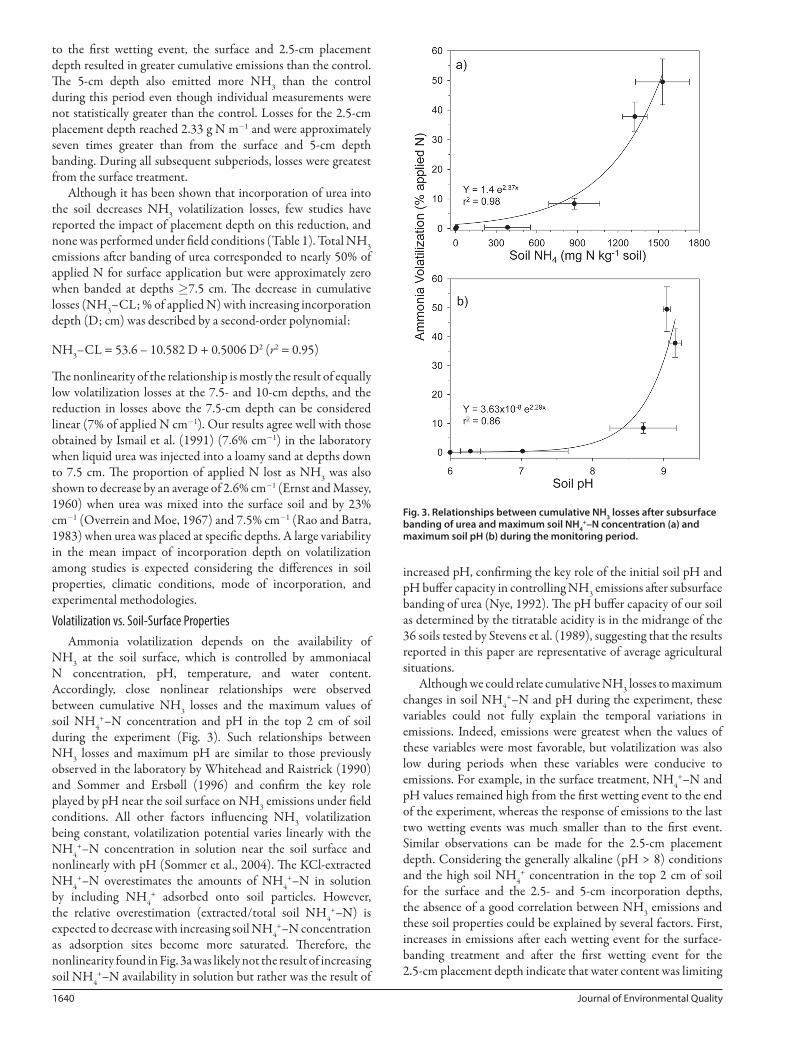
Summary of LiteratureAll experimental results agree that incorporating urea into
the soil reduces NH3 volatilization when compared with surface application (Table 1). However, the variability among studies is large, making it difficult to quantify the reduction for a given situation even when emissions are expressed as a fraction of applied N (Fig. 4a). This large variability is the result of contrasting experimental conditions in which variables, such as urea incorporation mode, soil properties (e.g., pH, pH buffer capacity, CEC, water content), methodology (field, laboratory, N rate), and climatic conditions, vary. Our efforts to reduce unaccounted-for variability by including all these factors in a statistical analysis failed, likely in part because of incomplete information available for several studies.
To partly account for conditions specific to each study, we further normalized the emissions after soil incorporation of urea to emissions after a surface application (Fig. 4b). Even after this operation, significant variability remained, as indicated by values of 20 to 70% and 40 to 100% of surface emissions for incorporation depths of 2.5 and 5.0 cm, respectively. However, the second-order polynomial equation indicates that the depth of incorporation explained 75% of the total variability. Negligible volatilization losses at incorporation depths ³7.5 cm is in agreement with results reported in the present study, by Ismail et al. (1991) for urea, and by Fenn and Kissel (1976) for ammonium sulfate and ammonium nitrate. The linear relationship (ignoring the 10-cm depth “0” values) yielded a reduction rate of 12.5% of emissions per centimeter of incorporation depth when compared with surface volatilization losses (Fig. 4b), in near-perfect agreement with the results of the present study.
ConclusionsAmmonia volatilization losses were 50% of applied N when
urea was banded at the surface of a slightly acidic silt loam soil, and incorporation of the band decreased emissions by an average of 7% cm-1, or 14% cm-1 when expressed in comparison to surface emissions. Incorporating urea at depths >7.5 cm therefore resulted in negligible NH3 emissions and maximum N retention. Cumulative losses increased exponentially with increasing maximum NH4
+–N and pH in the top 2 cm of the soil column above the urea band, in agreement with previous observations in the laboratory. However, temporal variations in soil-surface NH4
+–N concentration and pH were poorly related to the temporal variations in NH3 emission rates, likely as a result
of interactions between these factors and other soil properties, such as water content and NH4
+–N adsorption and fixation on soil particles. When data from the literature were summarized and standardized as a percentage of losses for surface application, the mean reduction in volatilization after urea incorporation was approximately 12.5% cm-1, which is close to our value of 14% cm-1. Although we agree that the efficiency of urea incorporation to reduce NH3 losses varies depending of several soil properties, management practices, and climatic conditions, we propose that this value represents an estimate of the mean impact of incorporation depth that could be used when site-specific information is unavailable.
AcknowledgmentsThis study was funded by the SAGES Initiative of Agriculture and Agri-Food Canada. The authors thank Johanne Tremblay, Nicole Bissonnette, Jean-Marie Noël, Michel Noël, Gabriel Lévesque, Simon-Pierre Parent, and Mathieu Bernier for assistance in field and laboratory work.
ReferencesAl Kanani, T., A.F. MacKenzie, J.W. Fyles, S. Ghanzala, and I.P. O’Halloran.
1994. Ammonia volatilization from urea amended with lignosulfonate and phosphoroamide. Soil Sci. Soc. Am. J. 58:244–248. doi:10.2136/sssaj1994.03615995005800010037x
Fig. 4. Summary of literature data on ammonia volatilization response to urea incorporation depth. Volatilization losses were expressed as proportion (%) of applied N (a) and proportion (%) of losses for a surface-application (b). Open squares are observations from this study. One datapoint (“x”) from Bouwmeester et al. (1985), for which water accumulation over the band artificially reduced volatilization, was not included in the analysis.

1642 Journal of Environmental Quality
Black, A.S., R.R. Sherlock, and N.P. Smith. 1987. Effect of timing of simulated rainfall on ammonia volatilization from urea, applied to soil of varying moisture content. J. Soil Sci. 38:679–687. doi:10.1111/j.1365-2389.1987.tb02165.x
Blaise, D., P.C. Tyagi, and O.P.S. Khola. 1996. Ammonia volatilization from urea as affected by the addition of iron pyrites and method of application. Nutr. Cycling Agroecosyst. 46:97–101. doi:10.1007/BF00704309
Bouwman, A.F., and L.J.M. Boumans. 2002. Estimation of global NH3 volatilization loss from synthetic fertilizers and animal manure applied to arable lands and grasslands. Global Biogeochem. Cycles 16:8-1–8-14. doi:10.1029/2000GB001389.
Bouwmeester, R.J.B., P.L.G. Vlek, and J.M. Stumpe. 1985. Effect of environmental factors on ammonia volatilization from a urea-fertilized soil. Soil Sci. Soc. Am. J. 49:376–381. doi:10.2136/sssaj1985.03615995004900020021x
Buresh, R.J. 1987. Ammonia volatilization from point-placed urea in upland, sandy soils. Fert. Res. 12:263–268. doi:10.1007/BF01315110
Chantigny, M.H., P. Rochette, D.A. Angers, D. Massé, and D. Côté. 2004. Ammonia volatilization and selected soil characteristics following application of anaerobically digested pig slurry. Soil Sci. Soc. Am. J. 68:306–312. doi:10.2136/sssaj2004.3060
Chapman, H.D. 1965. Cation-exchange capacity. In: C.A. Black et al. (ed.), Methods of soil analysis: Part 2. Agron. Monogr. 9. ASA and SSSA, Madison, WI. p. 891–901.
Dawar, K., M. Zaman, J.S. Rowarth, J. Blennerhassett, and M.H. Turnbull. 2011. Urea hydrolysis and lateral and vertical movement in the soil: Effects of urease inhibitor and irrigation. Biol. Fertil. Soils 47:139–146. doi:10.1007/s00374-010-0515-3
du Preez, C.C., and R.D.T. Burger. 1987. Effect of application methods on ammonia volatilization from soils in a controlled environment. S. Afr. J. Plant Soil 4:57–60.
Erisman, J.W., M.A. Sutton, J.N. Galloway, Z. Klimont, and W. Winiwarter. 2008. How a century of ammonia synthesis changed the world. Nat. Geosci. 1:636–639. doi:10.1038/ngeo325
Ernst, J.W., and H.F. Massey. 1960. The effect of several factors on volatilization of ammonia formed from urea in the soil. Soil Sci. Soc. Am. Proc. 24:87–90. doi:10.2136/sssaj1960.03615995002400020007x
Fenn, L.B., and D.E. Kissel. 1976. The influence of cation exchange capacity and depth of incorporation on ammonia volatilization from ammonium compounds applied to calcareous soils. Soil Sci. Soc. Am. J. 40:394–398. doi:10.2136/sssaj1976.03615995004000030026x
Fenn, L.B., and S. Miyamoto. 1981. Ammonia loss and associated reactions of urea in calcareous soils. Soil Sci. Soc. Am. J. 45:537–540. doi:10.2136/sssaj1981.03615995004500030020x
Fontoura, S.M.V., and C. Bayer. 2010. Ammonia volatilization in no-till system in the south-central region of the state of Paraná, Brazil. Rev. Bras. Cienc. Solo 34:1677–1684.
Garcia, L., C. Bedos, S. Génermont, I. Braud, and P. Cellier. 2011. Assessing the ability of mechanistic volatilization models to simulate soil surface conditions: A study with the Volt’Air model. Sci. Total Environ. 409:3980–3992. doi:10.1016/j.scitotenv.2011.05.003
Gasser, J.K.R. 1964. Urea as a fertilizer. Soils Fert. 27:175–180.Holcomb, J.C., D.M. Sullivan, D.A. Horneck, and G.H. Clough. 2011. Effect of
irrigation rate on ammonia volatilization. Soil Sci. Soc. Am. J. 75:2341–2347. doi:10.2136/sssaj2010.0446
Ismail, K.M., F.W. Wheaton, L.W. Douglass, and W. Potts. 1991. Modeling ammonia volatilization from loamy sand soil treated with liquid urea. Trans. ASAE 34:756–763.
Izaurralde, R.C., D.E. Kissel, and M.L. Cabrera. 1987. Titratable acidity to estimate ammonia retention. Soil Sci. Soc. Am. J. 51:1050–1054. doi:10.2136/sssaj1987.03615995005100040041x
Izaurralde, R.C., D.E. Kissel, and M.L. Cabrera. 1990. Simulation model of banded ammonia in soil. Soil Sci. Soc. Am. J. 54:917–922. doi:10.2136/sssaj1990.03615995005400030051x
Kissel, D.E., S. Paramasivam, and M.L. Cabrera. 2008. Ammonium, ammonia, and urea reactions in soils. In: J.S. Schepers and W.R. Raun, editors, Nitrogen in agricultural systems. Agron. Monogr. 49. ASA, SSSA, CSSA, Madison, WI. p. 101–155.
Künzli, N., R. Kaiser, S. Medina, M. Studnicka, O. Chanel, P. Filliger, M. Herry, F. Horak, V. Puybonnieux-Texier, P. Quénel, J. Schneider, R. Seethaler, J.-C. Vergnaud, and H. Sommer. 2000. Public-health impact of outdoor and traffic-related air pollution: A European assessment. Lancet 356:795–801. doi:10.1016/S0140-6736(00)02653-2
Lockyer, D.R. 1984. A system for the measurement in the field of losses of ammonia through volatilisation. J. Sci. Food Agric. 35: 837–848.
Loubet, B., P. Cellier, D. Flura, and S. Genermont. 1999. An evaluation of the wind-tunnel technique for estimating ammonia volatilization from land: Part 1. Analysis and improvement of accuracy. J. Agric. Eng. Res. 72:71–81. doi:10.1006/jaer.1998.0348
Nõmmik, H., and K. Nilsson. 1963. Nitrification and movement of anhydrous ammonia in soil. Acta Agric. Scand. 13:205–219. doi:10.1080/00015126309433095
Nõmmik, H., and K. Vahtras. 1982. Retention and fixation of ammonium and ammonia in soils. In: F.J. Stevenson, editor, Nitrogen in agricultural soils. Agron. Monogr. 22. ASA, CSSA, SSSA, Madison, WI. p. 123–171.
Nye, P.H. 1992. Towards the quantitative control of crop production and quality: II. The scientific basis for guiding fertilizer and management practice, particularly in poorer countries. J. Plant Nutr. 15:1151–1173. doi:10.1080/01904169209364387
Overrein, L.N., and P.G. Moe. 1967. Factors affecting urea hydrolysis and ammonia volatilization in soil. Soil Sci. Soc. Am. J. 31:57–61. doi:10.2136/sssaj1967.03615995003100010018x
Palma, R.M., M.I. Saubidet, M. Rímolo, and J. Utsumi. 1998. Nitrogen losses by volatilization in a corn crop with two tillage systems in the Argentine pampa. Commun. Soil Sci. Plant Anal. 29:2865–2879. doi:10.1080/00103629809370161
Prasertsak, P., J.R. Freney, O.T. Denmead, P.G. Saffigna, B.G. Grove, and J.R. Reghenzani. 2002. Effect of fertilizer placement on nitrogen loss from sugarcane in tropical Queensland. Nutr. Cycling Agroecosyst. 62:229–239. doi:10.1023/A:1021279309222
Rao, D.L.N. 1987. Slow-release urea fertilizers: Effect on floodwater chemistry, ammonia volatilization and rice growth in an alkali soil. Fert. Res. 13:209–221. doi:10.1007/BF01066445
Rao, D.L.N., and L. Batra. 1983. Ammonia volatilization from applied nitrogen in alkali soils. Plant Soil 70:219–228. doi:10.1007/BF02374782
Rochette, P., M.H. Chantigny, D.A. Angers, N. Bertrand, and D. Côté. 2001. Ammonia volatilization and soil nitrogen dynamics following fall application of pig slurry on canola crop residues. Can. J. Soil Sci. 81:515–523. doi:10.4141/S00-044
Rochette, P., D.A. Angers, M.H. Chantigny, J.D. MacDonald, M.-O. Gasser, and N. Bertrand. 2009a. Reducing ammonia volatilization in a no-till soil by incorporating urea and pig slurry in shallow bands. Nutr. Cycling Agroecosyst. 84:71–80. doi:10.1007/s10705-008-9227-6
Rochette, P., J.D. MacDonald, D.A. Angers, M.H. Chantigny, M.-O. Gasser, and N. Bertrand. 2009b. Banding of urea increased ammonia volatilization in a dry acidic soil. J. Environ. Qual. 38:1383–1390. doi:10.2134/jeq2008.0295
SAS Institute. 1999. SAS/STAT user’s guide. Version 8. SAS Inst., Cary, NC.Sherlock, R.R., and K.M. Goh. 1985. Dynamics of ammonia volatilization
from simulated urine patches and aqueous urea applied to pasture: III. Field verification of a simplified model. Fert. Res. 6:23–36. doi:10.1007/BF01058162
Sigunda, D.O., B.H. Janssen, and O.Oenema. 2002. Ammonia volatilization from vertisols. Eur. J. Soil Sci. 53: 195:202.
Sommer, S.G., and A.K. Ersbøll. 1996. Effect of air flow rate, lime amendments, and chemical soil properties on the volatilization of ammonia from fertilizers applied to sandy soils. Biol. Fertil. Soils 21:53–60. doi:10.1007/BF00335993
Sommer, S.G., K. Schjoerring, and O.T. Denmead. 2004. Ammonia emission from mineral fertilizers and fertilized crops. Adv. Agron. 82:557–622. doi:10.1016/S0065-2113(03)82008-4
Stevens, R.J., R.J. Laughlin, and D.J. Kilpatrick. 1989. Soil properties related to the dynamics of ammonia volatilization from urea applied to the surface of acidic soils. Fert. Res. 20:1–9. doi:10.1007/BF01055395
Sutton, M.A., C.E.R. Pitcairn, and D. Fowler. 1993. The exchange of ammonia between the atmosphere and plant communities. Adv. Ecol. Res. 24:301–393. doi:10.1016/S0065-2504(08)60045-8
Watson, C.J. 1990. The influence of soil properties on the effectiveness of phenylphosphorodiamidate (PPD) in reducing ammonia volatilization from surface applied urea. Fert. Res. 24:1–10. doi:10.1007/BF01073141
Whitehead, D.C., and N. Raistrick. 1990. Ammonia volatilization from five nitrogen compounds used as fertilizers following surface application to soils. J. Soil Sci. 41:387–394. doi:10.1111/j.1365-2389.1990.tb00074.x
Related Documents