AMMONIA RELEASE CHARACTERISTICS FROM COAL COMBUSTION FLY ASH Hao Wang 1 , Heng Ban 1 , Dean Golden 2 , and Ken Ladwig 2 1 University of Alabama at Birmingham 356D BEC, 1150 10 th Avenue South Birmingham, AL 35294 2 Electric Power Research Institute 3412 Hillview Avenue Palo Alto, CA 94304 Introduction Emissions of nitrogen oxides (NOx) from fossil fuel combustion into the atmosphere can have significant adverse effects on human health and the environment. Due to legislative requirements and NOx regulations in recent years, an increasing number of coal-fired facilities are installing ammonia-based deNOx technologies such as Selective Catalytic Reduction (SCR) and Selective Non-Catalytic Reduction (SNCR). Ammonia is also used for Electrostatic Precipitator (ESP) conditioning to increase the efficiency of particulate matter control. Therefore, the issue of ammoniated ash has become increasingly important due to the potential negative impact on ash utilization and disposal. In an effort to evaluate potential ammonia release from fly ash in disposal sites and the rate of ammonia release, we investigated the ammonia leaching characteristics of many power plant fly ashes 1 . These ammoniated fly ashes were collected from power plants with SCR, SNCR or ammonia ESP conditioning systems. A leaching procedure was established using water or acidic solutions. The results indicated that there was a wide range for the amount of ammonia in the fly ash that can be leached out. The ammonia release rate for all the ashes was relatively fast, in a matter of hours or days depending on the leaching procedure and condition. Ammonia has been speculated to be fixed onto the ash by adsorption/deposition onto ash surfaces, mainly in the form of ammonium salts such as (NH 4 ) 2 SO 4 and NH 4 HSO 4 when sulfur is available in the flue gas 2,3 . In a recent study sponsored by Electric Power Research Institute (ERRI), thermal gravimetric–mass spectrometry (TG-MS) was used to identify the forms of salts on fly ashes 4 . It was found that (NH 4 ) 2 SO 4 and NH 4 HSO 4 are the dominant ammonia salts deposited on fly ash. Also, two ammonia salts, (NH 4 ) 2 SO 4 and NH 4 HSO 4 was dry coated on ash surface and the samples were analyzed by TG-MS in an effort to examine differences in the form of ammonia salts. This study intended to investigate the effect of the different ammonium salts on ammonia leaching from fly ash. The purpose was to examine the differences in leaching characteristics, if any, between the two major ammonium salts, namely (NH 4 ) 2 SO 4 and NH 4 HSO 4 . The salts were dry coated on the ash by a procedure similar to that used in TG-MS studies. The samples were subjected to a sequential batch leaching procedure that was established in our previous studies to measure ammonia release. Experimental Plant personnel collected the fly ash sample from a power plant burning an eastern US bituminous coal. The pulverized coal combustion furnace was tangentially fired and the coal had a sulfur content of less than 1%. The SCR system with ammonia injection was used, resulting in ammonia adsorption on fly ash. The sample was shipped to the laboratory in a sealed container. A sequential batch leaching procedure was used to determine the rate and total amount of ammonia release from the fly ash. Parallel (5.00-gram each) samples of fly ash were weighed to 0.001g and placed in 60 mL plastic syringes. Syringes were used to serve as Zero-Head-Space (ZHS) vessels 5 , which prevent direct contact between the solution and the air to ensure no ammonia escaping to the air. 50 mL of water or acid solution was drawn into the syringes, and the syringes were capped to prevent solution in contact with air. After predetermined time intervals, 30 mL liquid was taken out for the analysis of pH and ammonia content. For sequential leaching, additional 30 mL fresh leachant was added back to the syringe to repeat the process. This process was repeated until the ammonia concentration in the extraction liquid was sufficiently low. Orion’s ammonia and pH electrodes were used to measure both pH and ammonia concentration 6 . The calculation for each extraction step in a sequential leaching process excludes the ammonia content in the residual liquid from the previous step. The procedure was experimentally verified for repeatability and tested for variables such as using a syringe filter, the amount of ash, the amount of extraction fluid, the amount of liquid taken out for analysis, and etc. The procedure was successfully applied to many eastern bituminous coal ashes with various levels of ammonia content. The fly ash was characterized for its original ammonia content. The ash was also heated in an oven to 500 o C for 30 minutes, based on the TG-MS results, to remove the ammonia. After the treatment, the ammonia on ash was determined by water leaching which showed that the residual ammonia on the treated ash was less than 1 ppm based on the ash mass. The ammonia-free ash was then mixed with ground NH 4 HSO 4 or (NH 4 ) 2 SO 4 in a ball mill for 15 hours at a determined mass ratio of the ash and the salts. The purity of ammonium salts was 98%, and the salt crystals were pre-ground manually to fine powder in a mortar and pestle. For the two salts added in this experiment, the ammonia concentrations in the ash after salt addition were at 97 ppm by mass. The stainless steel balls were about 1 cm in diameter and the ball mill diameter was about 6 cm; therefore, the ash particles were not crushed during the process. In fact, the mill was more of a mixing chamber for rubbing and coating ammonium salts to the surface of ash particles. The salts-coated ash samples were then subjected to the leaching procedure for the total amount of ammonia release and the rate of ammonia release in water. The time for each leaching step in sequential processes was selected to be 10 minutes and 30 minutes in this study. In other words, the extraction liquid was taken out and analyzed every 10 or 30 minutes, and fresh liquid was added to continue the process. Distilled water was used as extraction liquid in this experiment. Results and Discussion The pH of the ash is quite high, varying from 10.5 to 11.5, in water at 10:1 water-ash ratio. Figure 1 shows the initial variation of the pH. The pH number stayed above 11 for the first three days, and dropped to below 11 on day four and day five to 10.5. Figure 1 The pH change of the sample in the first hour. Fuel Chemistry Division Preprints 2002, 47(2), 836

Welcome message from author
This document is posted to help you gain knowledge. Please leave a comment to let me know what you think about it! Share it to your friends and learn new things together.
Transcript
AMMONIA RELEASE CHARACTERISTICS FROM COAL COMBUSTION FLY ASH
Hao Wang1, Heng Ban1, Dean Golden2, and Ken Ladwig2
1University of Alabama at Birmingham
356D BEC, 1150 10th Avenue South Birmingham, AL 35294
2 Electric Power Research Institute
3412 Hillview Avenue Palo Alto, CA 94304
Introduction
Emissions of nitrogen oxides (NOx) from fossil fuel combustion into the atmosphere can have significant adverse effects on human health and the environment. Due to legislative requirements and NOx regulations in recent years, an increasing number of coal-fired facilities are installing ammonia-based deNOx technologies such as Selective Catalytic Reduction (SCR) and Selective Non-Catalytic Reduction (SNCR). Ammonia is also used for Electrostatic Precipitator (ESP) conditioning to increase the efficiency of particulate matter control. Therefore, the issue of ammoniated ash has become increasingly important due to the potential negative impact on ash utilization and disposal.
In an effort to evaluate potential ammonia release from fly ash in disposal sites and the rate of ammonia release, we investigated the ammonia leaching characteristics of many power plant fly ashes1. These ammoniated fly ashes were collected from power plants with SCR, SNCR or ammonia ESP conditioning systems. A leaching procedure was established using water or acidic solutions. The results indicated that there was a wide range for the amount of ammonia in the fly ash that can be leached out. The ammonia release rate for all the ashes was relatively fast, in a matter of hours or days depending on the leaching procedure and condition.
Ammonia has been speculated to be fixed onto the ash by adsorption/deposition onto ash surfaces, mainly in the form of ammonium salts such as (NH4)2SO4 and NH4HSO4 when sulfur is available in the flue gas2,3. In a recent study sponsored by Electric Power Research Institute (ERRI), thermal gravimetric–mass spectrometry (TG-MS) was used to identify the forms of salts on fly ashes4. It was found that (NH4)2SO4 and NH4HSO4 are the dominant ammonia salts deposited on fly ash. Also, two ammonia salts, (NH4)2SO4 and NH4HSO4 was dry coated on ash surface and the samples were analyzed by TG-MS in an effort to examine differences in the form of ammonia salts.
This study intended to investigate the effect of the different ammonium salts on ammonia leaching from fly ash. The purpose was to examine the differences in leaching characteristics, if any, between the two major ammonium salts, namely (NH4)2SO4 and NH4HSO4. The salts were dry coated on the ash by a procedure similar to that used in TG-MS studies. The samples were subjected to a sequential batch leaching procedure that was established in our previous studies to measure ammonia release. Experimental
Plant personnel collected the fly ash sample from a power plant burning an eastern US bituminous coal. The pulverized coal combustion furnace was tangentially fired and the coal had a sulfur content of less than 1%. The SCR system with ammonia injection was used, resulting in ammonia adsorption on fly ash. The sample was shipped to the laboratory in a sealed container.
A sequential batch leaching procedure was used to determine the rate and total amount of ammonia release from the fly ash.
Parallel (5.00-gram each) samples of fly ash were weighed to 0.001g and placed in 60 mL plastic syringes. Syringes were used to serve as Zero-Head-Space (ZHS) vessels5, which prevent direct contact between the solution and the air to ensure no ammonia escaping to the air. 50 mL of water or acid solution was drawn into the syringes, and the syringes were capped to prevent solution in contact with air. After predetermined time intervals, 30 mL liquid was taken out for the analysis of pH and ammonia content. For sequential leaching, additional 30 mL fresh leachant was added back to the syringe to repeat the process. This process was repeated until the ammonia concentration in the extraction liquid was sufficiently low. Orion’s ammonia and pH electrodes were used to measure both pH and ammonia concentration6. The calculation for each extraction step in a sequential leaching process excludes the ammonia content in the residual liquid from the previous step. The procedure was experimentally verified for repeatability and tested for variables such as using a syringe filter, the amount of ash, the amount of extraction fluid, the amount of liquid taken out for analysis, and etc. The procedure was successfully applied to many eastern bituminous coal ashes with various levels of ammonia content.
The fly ash was characterized for its original ammonia content. The ash was also heated in an oven to 500 oC for 30 minutes, based on the TG-MS results, to remove the ammonia. After the treatment, the ammonia on ash was determined by water leaching which showed that the residual ammonia on the treated ash was less than 1 ppm based on the ash mass.
The ammonia-free ash was then mixed with ground NH4HSO4 or (NH4)2SO4 in a ball mill for 15 hours at a determined mass ratio of the ash and the salts. The purity of ammonium salts was 98%, and the salt crystals were pre-ground manually to fine powder in a mortar and pestle. For the two salts added in this experiment, the ammonia concentrations in the ash after salt addition were at 97 ppm by mass. The stainless steel balls were about 1 cm in diameter and the ball mill diameter was about 6 cm; therefore, the ash particles were not crushed during the process. In fact, the mill was more of a mixing chamber for rubbing and coating ammonium salts to the surface of ash particles. The salts-coated ash samples were then subjected to the leaching procedure for the total amount of ammonia release and the rate of ammonia release in water. The time for each leaching step in sequential processes was selected to be 10 minutes and 30 minutes in this study. In other words, the extraction liquid was taken out and analyzed every 10 or 30 minutes, and fresh liquid was added to continue the process. Distilled water was used as extraction liquid in this experiment. Results and Discussion
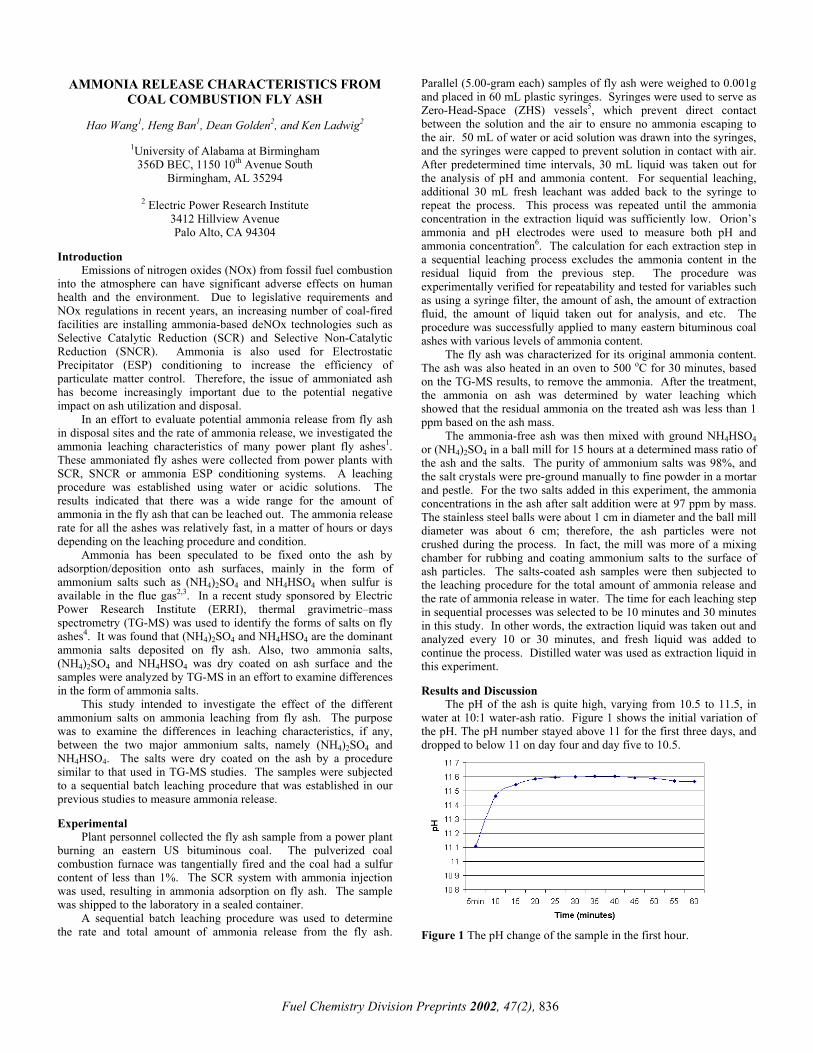
The pH of the ash is quite high, varying from 10.5 to 11.5, in water at 10:1 water-ash ratio. Figure 1 shows the initial variation of the pH. The pH number stayed above 11 for the first three days, and dropped to below 11 on day four and day five to 10.5.
Figure 1 The pH change of the sample in the first hour.
Fuel Chemistry Division Preprints 2002, 47(2), 836
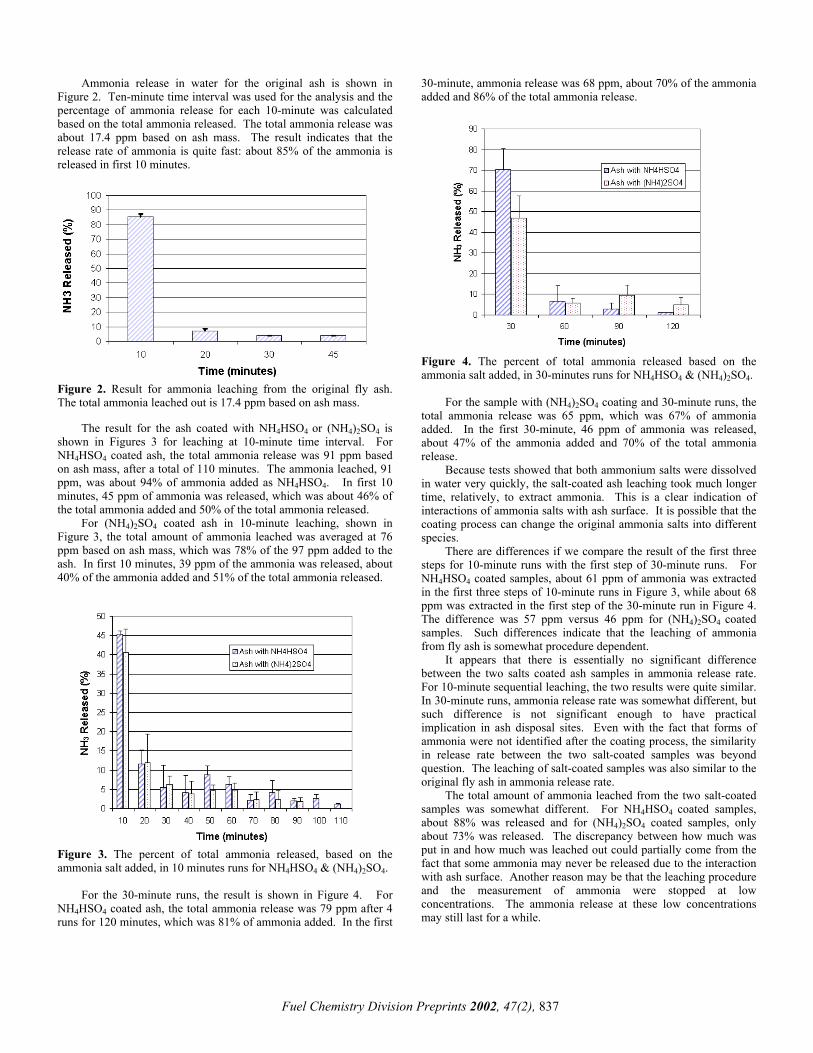
Ammonia release in water for the original ash is shown in Figure 2. Ten-minute time interval was used for the analysis and the percentage of ammonia release for each 10-minute was calculated based on the total ammonia released. The total ammonia release was about 17.4 ppm based on ash mass. The result indicates that the release rate of ammonia is quite fast: about 85% of the ammonia is released in first 10 minutes.
Figure 2. Result for ammonia leaching from the original fly ash. The total ammonia leached out is 17.4 ppm based on ash mass.
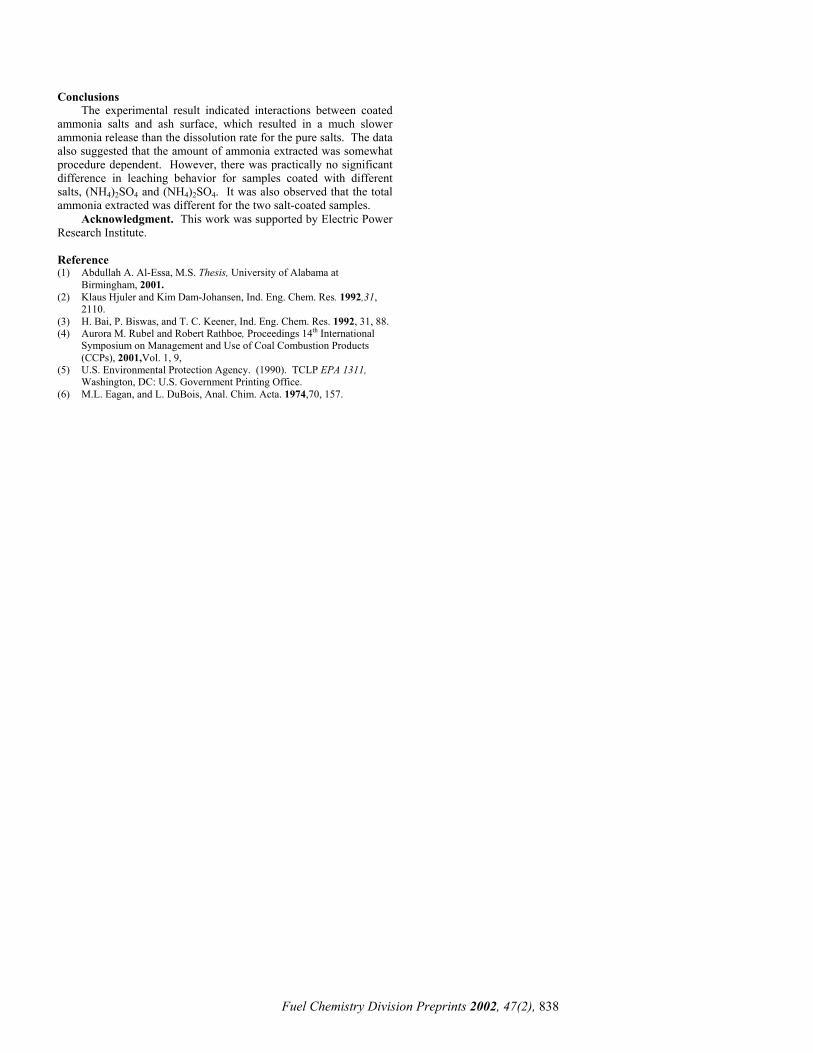
The result for the ash coated with NH4HSO4 or (NH4)2SO4 is shown in Figures 3 for leaching at 10-minute time interval. For NH4HSO4 coated ash, the total ammonia release was 91 ppm based on ash mass, after a total of 110 minutes. The ammonia leached, 91 ppm, was about 94% of ammonia added as NH4HSO4. In first 10 minutes, 45 ppm of ammonia was released, which was about 46% of the total ammonia added and 50% of the total ammonia released.
For (NH4)2SO4 coated ash in 10-minute leaching, shown in Figure 3, the total amount of ammonia leached was averaged at 76 ppm based on ash mass, which was 78% of the 97 ppm added to the ash. In first 10 minutes, 39 ppm of the ammonia was released, about 40% of the ammonia added and 51% of the total ammonia released.
Figure 3. The percent of total ammonia released, based on the ammonia salt added, in 10 minutes runs for NH4HSO4 & (NH4)2SO4.
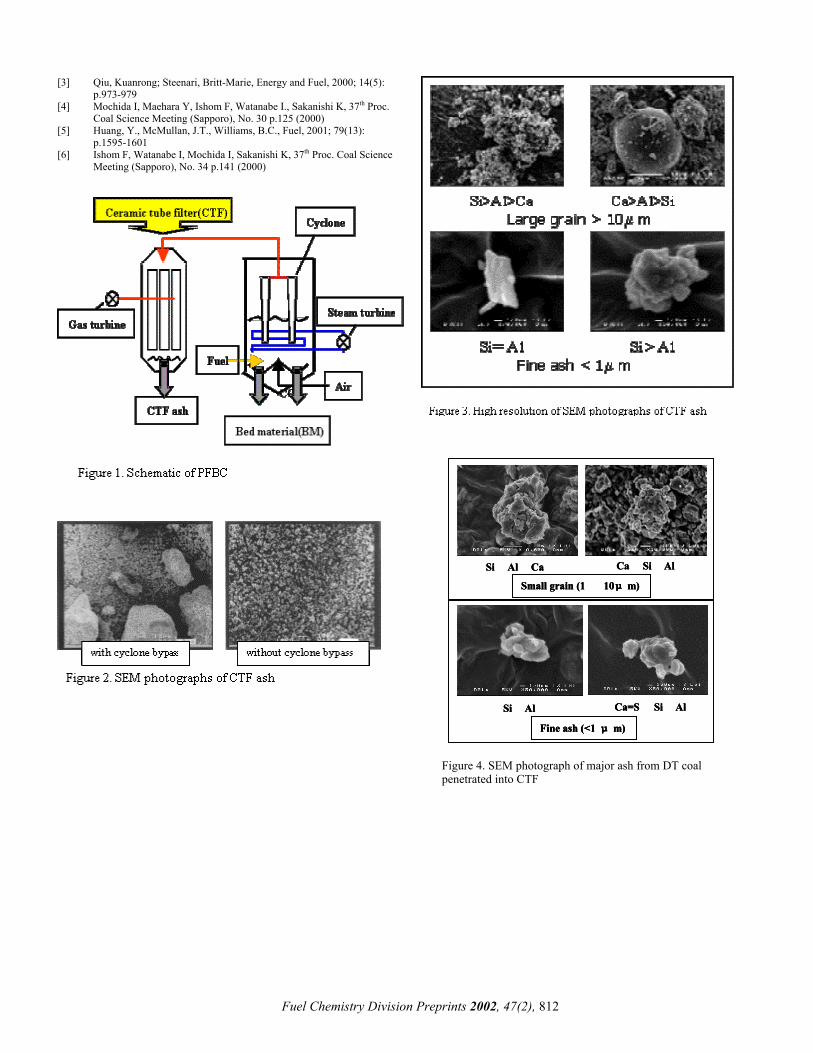
For the 30-minute runs, the result is shown in Figure 4. For
NH4HSO4 coated ash, the total ammonia release was 79 ppm after 4 runs for 120 minutes, which was 81% of ammonia added. In the first
30-minute, ammonia release was 68 ppm, about 70% of the ammonia added and 86% of the total ammonia release.
Figure 4. The percent of total ammonia released based on the ammonia salt added, in 30-minutes runs for NH4HSO4 & (NH4)2SO4.
For the sample with (NH4)2SO4 coating and 30-minute runs, the
total ammonia release was 65 ppm, which was 67% of ammonia added. In the first 30-minute, 46 ppm of ammonia was released, about 47% of the ammonia added and 70% of the total ammonia release.
Because tests showed that both ammonium salts were dissolved in water very quickly, the salt-coated ash leaching took much longer time, relatively, to extract ammonia. This is a clear indication of interactions of ammonia salts with ash surface. It is possible that the coating process can change the original ammonia salts into different species.
There are differences if we compare the result of the first three steps for 10-minute runs with the first step of 30-minute runs. For NH4HSO4 coated samples, about 61 ppm of ammonia was extracted in the first three steps of 10-minute runs in Figure 3, while about 68 ppm was extracted in the first step of the 30-minute run in Figure 4. The difference was 57 ppm versus 46 ppm for (NH4)2SO4 coated samples. Such differences indicate that the leaching of ammonia from fly ash is somewhat procedure dependent.
It appears that there is essentially no significant difference between the two salts coated ash samples in ammonia release rate. For 10-minute sequential leaching, the two results were quite similar. In 30-minute runs, ammonia release rate was somewhat different, but such difference is not significant enough to have practical implication in ash disposal sites. Even with the fact that forms of ammonia were not identified after the coating process, the similarity in release rate between the two salt-coated samples was beyond question. The leaching of salt-coated samples was also similar to the original fly ash in ammonia release rate.
The total amount of ammonia leached from the two salt-coated samples was somewhat different. For NH4HSO4 coated samples, about 88% was released and for (NH4)2SO4 coated samples, only about 73% was released. The discrepancy between how much was put in and how much was leached out could partially come from the fact that some ammonia may never be released due to the interaction with ash surface. Another reason may be that the leaching procedure and the measurement of ammonia were stopped at low concentrations. The ammonia release at these low concentrations may still last for a while.
Fuel Chemistry Division Preprints 2002, 47(2), 837
Conclusions
The experimental result indicated interactions between coated ammonia salts and ash surface, which resulted in a much slower ammonia release than the dissolution rate for the pure salts. The data also suggested that the amount of ammonia extracted was somewhat procedure dependent. However, there was practically no significant difference in leaching behavior for samples coated with different salts, (NH4)2SO4 and (NH4)2SO4. It was also observed that the total ammonia extracted was different for the two salt-coated samples.
Acknowledgment. This work was supported by Electric Power Research Institute.
Reference (1) Abdullah A. Al-Essa, M.S. Thesis, University of Alabama at
Birmingham, 2001. (2) Klaus Hjuler and Kim Dam-Johansen, Ind. Eng. Chem. Res. 1992,31,
2110. (3) H. Bai, P. Biswas, and T. C. Keener, Ind. Eng. Chem. Res. 1992, 31, 88. (4) Aurora M. Rubel and Robert Rathboe, Proceedings 14th International
Symposium on Management and Use of Coal Combustion Products (CCPs), 2001,Vol. 1, 9,
(5) U.S. Environmental Protection Agency. (1990). TCLP EPA 1311, Washington, DC: U.S. Government Printing Office.
(6) M.L. Eagan, and L. DuBois, Anal. Chim. Acta. 1974,70, 157.
Fuel Chemistry Division Preprints 2002, 47(2), 838

BEHAVIORS OF ASHES IN PRESSURIZED FLUIDIZED BED COMBUSTION OF COAL
F. Ishom, K. Iwamoto, Y. Korai, I. Mochida, *N. Misawa, **T. Harada and ***T. Aoyagi
Institute of Advanced Material Study, Kyushu University
Kasuga, Fukuoka 816-8580,JAPAN [email protected]
* Electric Power Development CO., LTD **Kyushu Electric Power CO., LTD
***Nishinippon Environmental Energy CO., LTD
1. Introduction One of advanced technologies for coal firing power generation
is a combined system based on the pressurized fluidized bed combustion (PFBC) because PFBC has been proved to promise high combustion and power generation efficiencies, use of wider range of coals, and efficient environmental protection .The development of PFBC in Japan has been initiated by Electric Power Development Co and three commercial plants have been constructed. Figure 1 illustrates the flow system of PFBC. For flue gas cleaning, cyclone and CTF are installed. In PFBC, coal grain as fuel and CaCO3 fed as desulfurization agent are fluidized in a bed to perform catalytic combustion and in-situ desulfurization. The combusted gas is sent to the gas turbine after the cleaning to remove fly ash by cyclone and/or high temperature ceramic filter. The combustion heat is recovered in the bed for steam power generation.
The coal is combusted, leaving ash in the bed of CaCO3 and CaCO3 is converted into CaO and CaSO4 by the heat and with SO2 produced from the coal combustion. The ratio of CaO/CaCO3 is influenced by the temperature and CO2 partial pressure in the bed. Such coal ash and fluidizing agent suffer the collision, adhesion, fusion, and reaction among the minerals in the bed, influencing strongly the performances in PFBC such as efficiency and operability of the ceramic filter, bed fluidization, and desulfurization.
In the present paper, the flue gas cleaning by ceramic tube filter (CTF), fluidization stability of bed materials, and desulfurization efficiency were viewed in terms of coal ash. The interactions among the coal ashes and fluidizing agent govern performances, being strongly influenced by the coal kind, more definitely ash minerals carried by coal. The fluidization stability is very critical for PFBC operation since reactions among the coal ash and CaCO3/CaO/CaSO4 may cause the adhesion, agglomeration, and slugging of the bed materials, leading finally to the emergency shut down. 2. Experimental
Ash mineral and bed materials were recovered from ceramic filter and boilers of both 71MW and 350MW demonstration and commercial PFBC plants. Blair Athol, Drayton and Nanton coals were combusted in PFBC plants. Recovered ash and bed materials were observed extensively by high resolution SEM , and analyzed by XRD. 3. Results 1) Ash recovered from ceramic tube filter
Ash minerals recovered from CTF were observed extensively by high resolution SEM to understand two observations (1) why sending lager minerals could improve operability of CTF. (2) combustion of some coals caused large pressure drop through CTF in spite of frequent back wash cleaning. Figure 2 illustrates SEM photographs of ashes which passed through cyclone or some of which by-passed the cyclone to send lager grains of ash. The fly ashes which passed through the cyclone were controlled to fine ones
which were packed compact on the filter, increasing the high pressure drop. In contrast, the presence of large grains reduced the packing density of fly ashes on the filter. Hence the pressure drop was moderated and back washing operability was improved even if the more fly ash was sent to CTF. The large ash grain was noted to carry the fine grains adhered to the surface of the large grains as shown in Figure 3. Such adhesion moderates the packing of ashes over the CTF and hence pressure drop.
Figure 4 shows the ash recovered from CTF after the back wash when Drayton coal was combusted. The very fine fly ash was recovered. Such fine ash penetrates into the pore of CTF, being difficult to be removed completely from the filter in spite of the back wash. Such ash causes the increase of stationary pressure drop through CTF. SiO2 was the major component of the fine ash in the particular coal of Drayton, being not trapped by the large grain because of its low reactivity and high softening point. Thus, behaviors and natures of the very fine ash are very critical for the CTF operation.
2) Sinter grain and agglomerate in the fluidized bed of PFBC
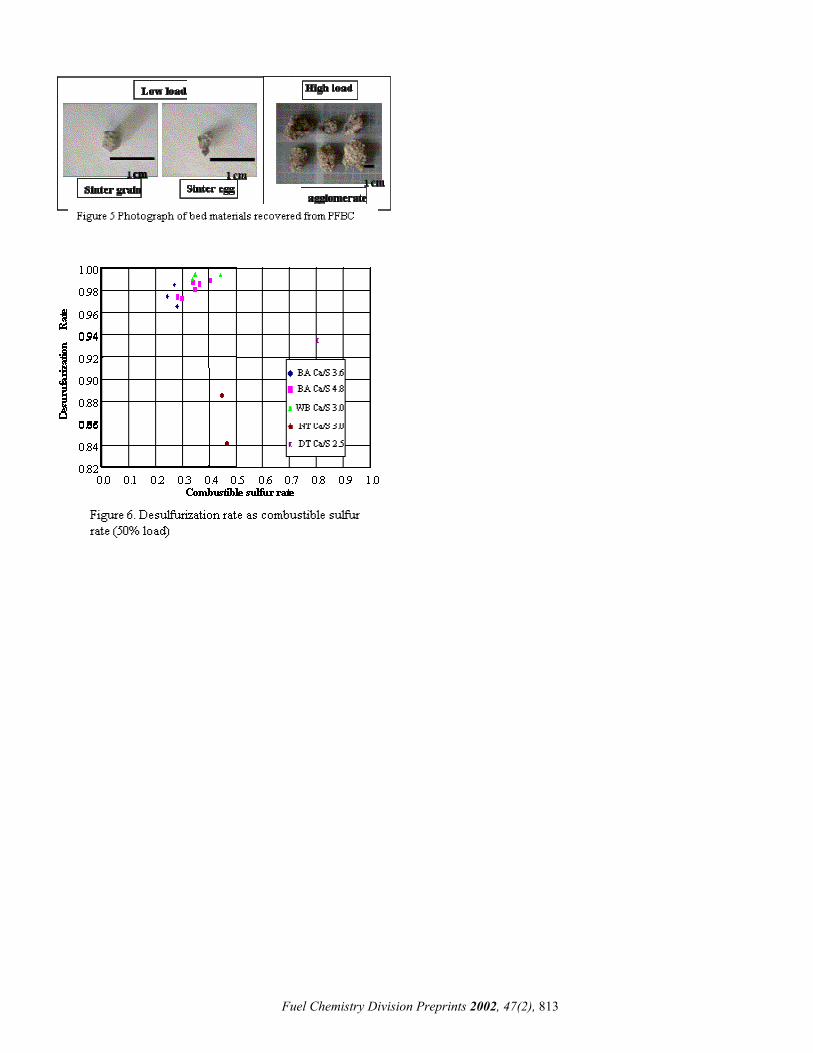
Figure 5 illustrates the photographs of larger grains observed in the bed materials recovered from PFBC boiler. Adhesion and some fusion of fine grains were certainly observed according to the coal kinds as well as the load level of coal.
SEM photographs suggest that the agglomerate consisted of three main parts, dense grains of fine particles fused densely each other, and adhered particles of Al2O3, SiO2, and CaO. Dense grain was identified as SiAlCaO7 to be formed from the reactive fine particles of SiO2, Al2O3, and CaO. An adhered ash and CaO grain surrounded the dense grain. Such agglomerate appeared to be produced below 1100� and disturbs the fluidization, triggering the slugging. The high reactivity of fine ashes and CaO is believed as the major cause of agglomeration. 3) Desulfurization efficiency according to coals to be combusted
Figure 6 summarizes the desulfurization efficiency of PFBC which is definitely influenced by the coal to be combusted in the boiler in addition to Ca/S rate. Nanton coal definitely lowered the desulfurization efficiency. Desulfurization efficiency or SO2 concentration in flue gas was governed in principle by the reaction of CaCO3(CaO) and SO2. However since Ca/S rate was always enough high in the fluidized bed, SO2 concentration in the flue gas may be determined by the following reactions of CaO � SO2 � 1/2O2 CaSO4 in the free board and transfer line. Hence, CaSO4 content and morphology of fly ash are principally concerned to govern the desulfurization extent.
4. Summary
PFBC operation is revealed to be strongly governed by the ash derived from coal. The component and particle size of ash are strongly subjective to the coal, and fine grains among a series of ash minerals appear to strongly influence the operability of PFBC through their reactions and softening temperature. Their adhesion causes the agglomerates and lower the desulfurization, while is favorable at the filtering because fine particle may not penetrate into the pore. Thus, the properties of fine ashes in the coal must be principally concerned. The behaviors and formation mechanism of fine particle ashes must be carefully characterized for the efficient operation of PFBC. References [1] Anderson, J., Anderson, L., Energy and Fuel, 1998; 39(3): p.207 [2] Abe R, Sasatsu H, Harada T, Misawa N, Saito I, Fuel, 2001; 80(1):
p.135-144.
Fuel Chemistry Division Preprints 2002, 47(2), 811
[3] Qiu, Kuanrong; Steenari, Britt-Marie, Energy and Fuel, 2000; 14(5): p.973-979
[4] Mochida I, Maehara Y, Ishom F, Watanabe I., Sakanishi K, 37th Proc. Coal Science Meeting (Sapporo), No. 30 p.125 (2000)
[5] Huang, Y., McMullan, J.T., Williams, B.C., Fuel, 2001; 79(13): p.1595-1601
[6] Ishom F, Watanabe I, Mochida I, Sakanishi K, 37th Proc. Coal Science Meeting (Sapporo), No. 34 p.141 (2000)
SiSiSi � � � AlAlAl
Fine ash (<1 Fine ash (<1 Fine ash (<1 µ µ µ m) m) m) Ca=SCa=SCa=S � � � SiSiSi��� Al Al Al
Small grain (1 Small grain (1 Small grain (1 � � � 101010µ µ µ m)m)m) � � � � � � � � � � � � Ca Ca Ca CaCaCa SiSiSi AlAlAlSiSiSi AlAlAl
Figure 4. SEM photograph of major ash from DT coal penetrated into CTF
Fuel Chemistry Division Preprints 2002, 47(2), 812
Fuel Chemistry Division Preprints 2002, 47(2), 813

DEVELOPMENTS IN FLY ASH BENEFICIATION AND THE ISSUES RELATED TO CONTINUED FLY ASH
MARKETABILITY
Due in December of 2003, a proposal by the EPA will address what actions are to be taken by Utilities to limit mercury release into the environment via flue gasses. At this time, the most efficient way of decreasing mercury stack emissions is by injecting activated carbon into the flue gas stream, preferably in front of a baghouse or COHPAC system. At many Utilities, it will be cost prohibitive to keep the activated carbon out of the fly ash collection system. Activated carbon has a much higher surface area than the typical unburned carbon found in fly ash. The impact on the adsorption of Air Entraining Agents will be significant.
Russ Majors
Boral Material Technologies Inc.
45NE Loop 410 Suite 700 San Antonio, TX. 78216
Introduction Beneficiation Since implementation of the Clean Air Act and the subsequent
installation of LNB’s, the industry has had time to develop processes whereby some, if not all of the unburned carbon can be removed from fly ash. Electrostatic and Triboelectric separation technologies work on the principal of charge separation.2, 3 These technologies have been proven in industry settings. Their efficiency is dependent on fly ash physical and chemical characteristics, therefore, a program to evaluate the economic feasibility for the application of this, or any other beneficiation technology, is required. Both of these technologies have shown to be successful at reducing the carbon content in fly ash. However, they have not shown themselves to be highly successful at removing ammonium salts or being able to reduce activated carbon levels to concentrations that would be acceptable by the ready mixed concrete market.
Coal Combustion Product (CCP) utilization reached levels over 33% in the year 2000 with fly ash leading other CCP’s at 39%.1 A continued increase in the utilization of these materials may be realized provided several detrimental issues can be resolved. The implementation of technologies in order to comply with the Clean Air Act has led to the deterioration in quality of fly ash as defined by ASTM C618. This ASTM specification provides both chemical and physical requirements that fly ash must meet before it is allowed to be used in concrete, the largest market area for CCP’s. Several enterprising research and development groups and companies have developed different technologies for alleviating the problems caused by the implementation of NOx reducing technologies, such as Low NOx Burners (LNB) that increase the unburned carbon levels in fly ash. Some of these technologies may be adaptable to address other contaminates that are finding their way into fly ash as a result of compliance with the Clean Air Act and other pending legislative actions addressing such issues as mercury removal from flue gases.
Carbon Burn Out (CBO) utilizes a heated fluidized bed to continue the combustion process thereby decreasing the carbon content.4 A minimum LOI content must be present in the fly ash to provide enough thermal energy to maintain the combustion process. Otherwise, additional energy must be added to the process (natural gas). Trials have indicated the ammonium salts are decomposed and no ammonia is released from the process. One concern is the re-volatilization of mercury from a sorbent (activated carbon). Certainly, traps may be added to the resulting flue gas stream from CBO to once again collect any volatilized mercury. CBO is a very attractive technology whose primary draw back is it’s large capital costs.
Fly Ash Many Utilities found that LNB’s would effect the reduction of NOx levels by greater than 50% at the expense of increased carbon levels in fly ash as reported by Loss On Ignition (LOI). Carbon levels in fly ash impact the ability to entrain air in concrete. Typically, concrete is required to entrain 4 to 6% air in areas where freeze-thaw cycles are experienced. Finite spherical voids in concrete as a result of air entrainment accommodate the expansion of water as it freezes. This prevents any internal pressures from becoming high enough to initiate spalling or delamination of the concrete. The carbon in fly ash acts as a sorbent for Air Entraining Agents used to entrain air in concrete. Predicting the proper dose rates to obtain 4 to 6% entrained air is made difficult with changing LOI values.
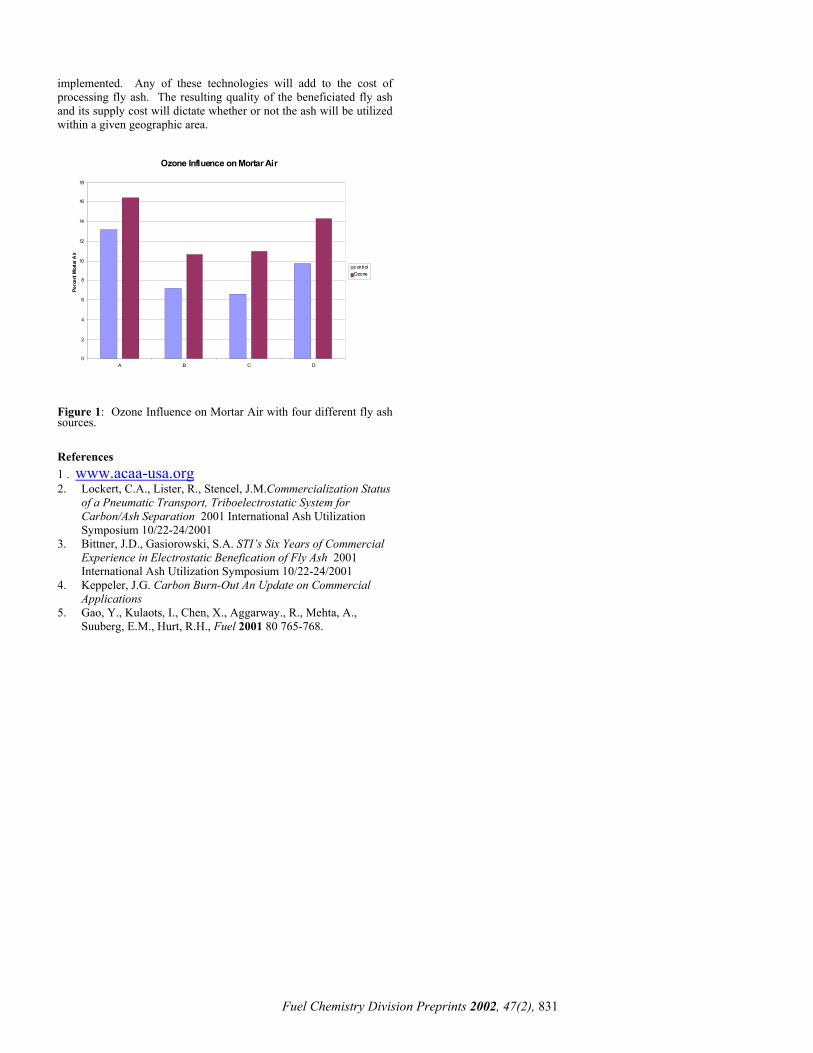
Other beneficiation technologies involve chemically treating the unburned carbon particles. The utilization of ozone is one such process.5 This process does not significantly reduce the %LOI. Instead, it works by depositing oxygen onto the surface of the unburned carbon. This modifies the surface charge of the carbon in such a way that it reduces the adsorption potential of Air Entraining Agents. Similar to other processes, the success of ozonation is dependent on the physical and chemical characteristics of fly ash. Figure one demonstrates the influence of ozone adsorption and its influence on mortar air testing. Initial testing with ammoniated fly ash indicate no significant changes to ammonium sulfate/bisulfate concentrations in the fly ash.
To reduce NOx to levels significantly below 0.2lbsNOx/MMBTU, technologies other than LNB’s are required. The most popular technology implemented today is Selective Catalytic Reduction (SCR). This process utilizes the reducing characteristics of ammonia injected into a flue gas stream across a catalyst bed. This process reduces the NOx into nitrogen and water. However, as the catalyst bed ages, an increase in ammonia slip is observed. The ammonia that slips by the catalyst bed tends to precipitate out of the flue gas stream and onto the fly ash as an ammonium sulfate/bisulfate salt. Upon introduction into a high pH environment, such as concrete, the ammonium ion forms ammonia gas and is liberated into the atmosphere, potentially exposing persons in the immediate area to ammonia gas. Ammonia is also found to contaminate fly ash where it is used for flu gas conditioning and for enhancing the efficiency of electrostatic precipitators.
Discussion There are several emerging technologies that upon implementation will result in a Utilities compliance with required emission standards but will not require subsequent beneficiation. Sorbents other than activated carbon are being evaluated for mercury sorption characteristics with limited impact on air entrainment in concrete. Several of the beneficiation technologies listed here are capable of addressing the issues of ammonia and activated carbon through modifications to their processes. Market area analysis will become increasingly important as beneficiation technologies are
Fuel Chemistry Division Preprints 20 02, 47(2), 830
implemented. Any of these technologies will add to the cost of processing fly ash. The resulting quality of the beneficiated fly ash and its supply cost will dictate whether or not the ash will be utilized within a given geographic area.
Ozone Influence on Mortar Air
0
2
4
6
8
10
12
14
16
18
A B C D
Perc
ent M
orta
r Air
controlOzone
Figure 1: Ozone Influence on Mortar Air with four different fly ash sources. References 1 . www.acaa-usa.org 2. Lockert, C.A., Lister, R., Stencel, J.M.Commercialization Status
of a Pneumatic Transport, Triboelectrostatic System for Carbon/Ash Separation 2001 International Ash Utilization Symposium 10/22-24/2001
3. Bittner, J.D., Gasiorowski, S.A. STI’s Six Years of Commercial Experience in Electrostatic Benefication of Fly Ash 2001 International Ash Utilization Symposium 10/22-24/2001
4. Keppeler, J.G. Carbon Burn-Out An Update on Commercial Applications
5. Gao, Y., Kulaots, I., Chen, X., Aggarway., R., Mehta, A., Suuberg, E.M., Hurt, R.H., Fuel 2001 80 765-768.
Fuel Chemistry Division Preprints 20 02, 47(2), 831

A DYNAMIC MODEL OF THE TRANSFORMATIONS OF ARSENIC DURING COAL COMBUSTION
Richard O. Sterling and Joseph J. Helble
University of Connecticut Storrs, CT 06269-3222
BACKGROUND It has been well established that one of the pathways by which many trace metals are released into the environment is through association with the airborne particles generated from combustion sources (1). Several studies have shown that the concentration of trace metals in airborne particles is highly dependent on the size of the particles (2-3). For trace metals such as arsenic there is an inverse relationship between particle size and concentration and it has been shown that this inverse relationship is governed by the transformation mechanisms occurring during the combustion process (4-5). Under post combustion conditions arsenic species interacting with entrained particles will either condense or react on the surface of the solids. The final concentration-size dependence is thus determined by which mechanism dominates the transformation process. Existing models assume that one process dominates, but in a real combustion environment, both mechanisms are likely to contribute. In this paper, a dynamic model for determining the concentration-size relationship is developed and used to simulate the partitioning of arsenic under typical coal combustion conditions. PARTITIONING MODEL The overall arsenic concentration distribution was determined from an equation developed for the partitioning of sodium during pulverized coal combustion (6). This approach independently considered mass apportionment and an arsenic transformation mechanism. Mass apportionment was used to evaluate the effects of unvaporized arsenic by distributing the amount of unvaporized arsenic according to the mole fraction of certain minerals or ash particles possessing some affinity for arsenic in each particle. The effects of surface reaction and condensation were then considered through arsenic transformation. Embedded in this transformation were the arsenic rate expressions for surface reaction and condensation. The concentration of arsenic in a particle was therefore expressed as: C (dp) = A+ K (dp,t)n(dp) (1) where C(dp)= concentration arsenic in particle of size dp A = the mass apportionment parameter K(dp,t)= rate of condensation and surface reaction n(dp)= the number of particles with size dp For condensation, Fick’s law for a quiescent medium was used to calculate the diffusion rate to each particle. The intrinsic rate constant extracted from gas-solid thermo-gravimetric (TGA) experiments of arsenic vapors with calcium oxide was used to determine the rate of surface reaction(7). Implicit in these equations were the effects of temperature on the magnitude of each mechanism in the overall concentration equation.
SIMULATION PROCEDURE The data for super micron fly ash particles generated from bench scale coal combustion experiments were used as inputs to the model (8). To evaluate the effects of temperature on the overall arsenic concentration profile, two temperature profiles were used. In addition, the intrinsic surface reaction rate was varied to evaluate the impact on the concentration-size relationship. The effects of arsenic vaporization were determined using 20, 60 and 100 percent vaporization with the unvaporized arsenic distributed in the larger particles according to the amount of calcium present in each particle size fraction. RESULTS Figure 1 shows the simulation results for a typical boiler temperature profile and using the intrinsic rate constant from the TGA experiments. A comparison of the simulated arsenic concentrations with the experimental results shows a similar order of magnitude for all particle sizes. At 100 percent vaporization the concentration-size relationship shows a dp-2 dependence indicative of condensation control. Comparing the 20 and 60 percent vaporization data shows no significant changes in the concentration of arsenic in each particle. A further examination of the mechanistic distribution of the vaporized arsenic shows that even at 20 percent vaporization, condensation dominates arsenic transformation. Surface reaction therefore makes an insignificant contribution to the apportionment of vaporized arsenic in the ash particles. Surface reaction therefore makes an insignificant contribution to the apportionment of vaporized arsenic in the ash particles. The results presented also show that conditions of 60 percent arsenic vaporization give the best fit to the experimental results.
-5.5
-5.0
-4.5
-4.0
-3.5
-3.0
0.0 0.2 0.4 0.6 0.8 1.log dp
log
C(d
p)
0
Figure 1: Arsenic particulate concentration-size relationship for a typical temperature profile for a boiler using measured intrinsic rate constant. actual As concentration, 20 percent vaporization, 60 percent vaporization, 100 percent vaporization, linear regression of 100 percent vaporization data, linear regression of actual As concentration. Figure 2 shows the calculated arsenic concentrations for a typical boiler temperature profile using an intrinsic surface reaction four orders of magnitude greater than the measured rate (7). A comparison of the simulated arsenic concentrations with the experimental results again shows a similar order of magnitude for all particle sizes. The results for 100 percent vaporization suggest that under these conditions surface reaction is the dominant transformation mechanism as reflected by the dp-1 dependence in the concentration-size relationship. Results obtained at conditions of 20 and 60 percent vaporization at the elevated surface reaction show no significant
Fuel Chemistry Division Preprints 2002, 47(2), 809
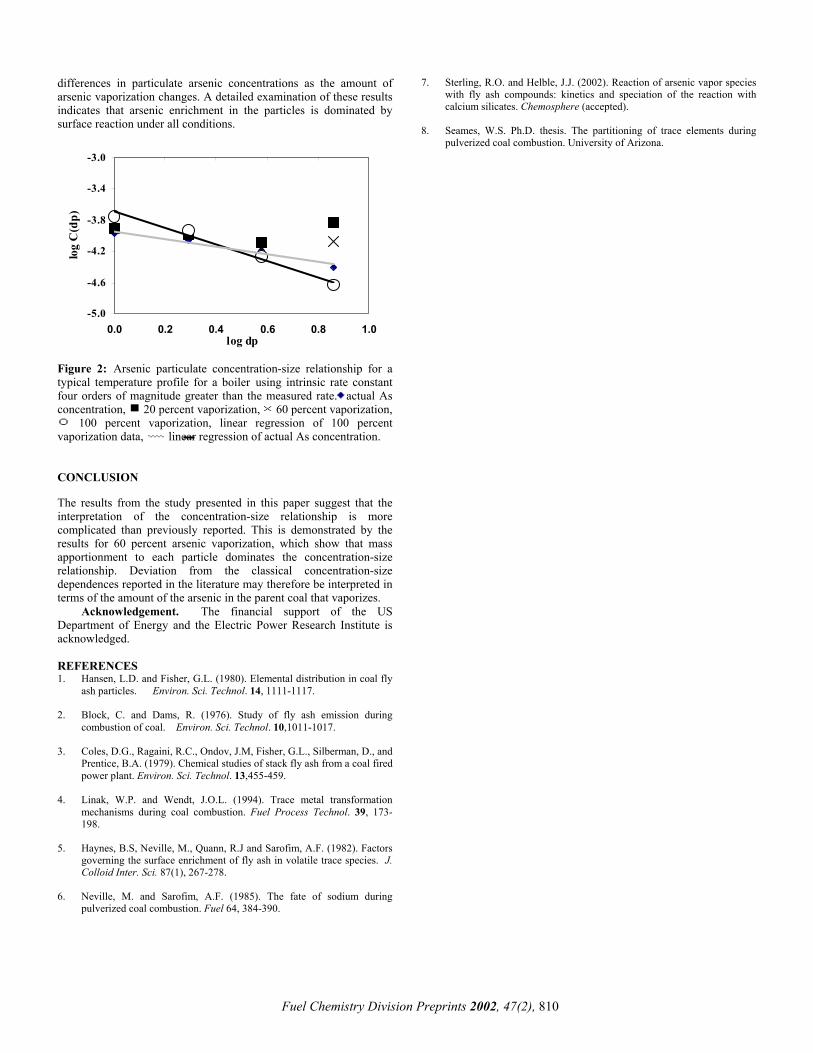
differences in particulate arsenic concentrations as the amount of arsenic vaporization changes. A detailed examination of these results indicates that arsenic enrichment in the particles is dominated by surface reaction under all conditions.
-5.0
-4.6
-4.2
-3.8
-3.4
-3.0
0.0 0.2 0.4 0.6 0.8 1.0log dp
log
C(d
p)
Figure 2: Arsenic particulate concentration-size relationship for a typical temperature profile for a boiler using intrinsic rate constant four orders of magnitude greater than the measured rate. actual As concentration, 20 percent vaporization, 60 percent vaporization,
100 percent vaporization, linear regression of 100 percent vaporization data, linear regression of actual As concentration. CONCLUSION The results from the study presented in this paper suggest that the interpretation of the concentration-size relationship is more complicated than previously reported. This is demonstrated by the results for 60 percent arsenic vaporization, which show that mass apportionment to each particle dominates the concentration-size relationship. Deviation from the classical concentration-size dependences reported in the literature may therefore be interpreted in terms of the amount of the arsenic in the parent coal that vaporizes.
Acknowledgement. The financial support of the US Department of Energy and the Electric Power Research Institute is acknowledged. REFERENCES 1. Hansen, L.D. and Fisher, G.L. (1980). Elemental distribution in coal fly
ash particles. Environ. Sci. Technol. 14, 1111-1117. 2. Block, C. and Dams, R. (1976). Study of fly ash emission during
combustion of coal. Environ. Sci. Technol. 10,1011-1017. 3. Coles, D.G., Ragaini, R.C., Ondov, J.M, Fisher, G.L., Silberman, D., and
Prentice, B.A. (1979). Chemical studies of stack fly ash from a coal fired power plant. Environ. Sci. Technol. 13,455-459.
4. Linak, W.P. and Wendt, J.O.L. (1994). Trace metal transformation
mechanisms during coal combustion. Fuel Process Technol. 39, 173-198.
5. Haynes, B.S, Neville, M., Quann, R.J and Sarofim, A.F. (1982). Factors
governing the surface enrichment of fly ash in volatile trace species. J. Colloid Inter. Sci. 87(1), 267-278.
6. Neville, M. and Sarofim, A.F. (1985). The fate of sodium during
pulverized coal combustion. Fuel 64, 384-390.
7. Sterling, R.O. and Helble, J.J. (2002). Reaction of arsenic vapor species with fly ash compounds: kinetics and speciation of the reaction with calcium silicates. Chemosphere (accepted).
8. Seames, W.S. Ph.D. thesis. The partitioning of trace elements during
pulverized coal combustion. University of Arizona.
Fuel Chemistry Division Preprints 2002, 47(2), 810
EFFECTS OF AMMONIA FROM POST-COMBUSTION NOx CONTROL ON ASH HANDLING
AND USE
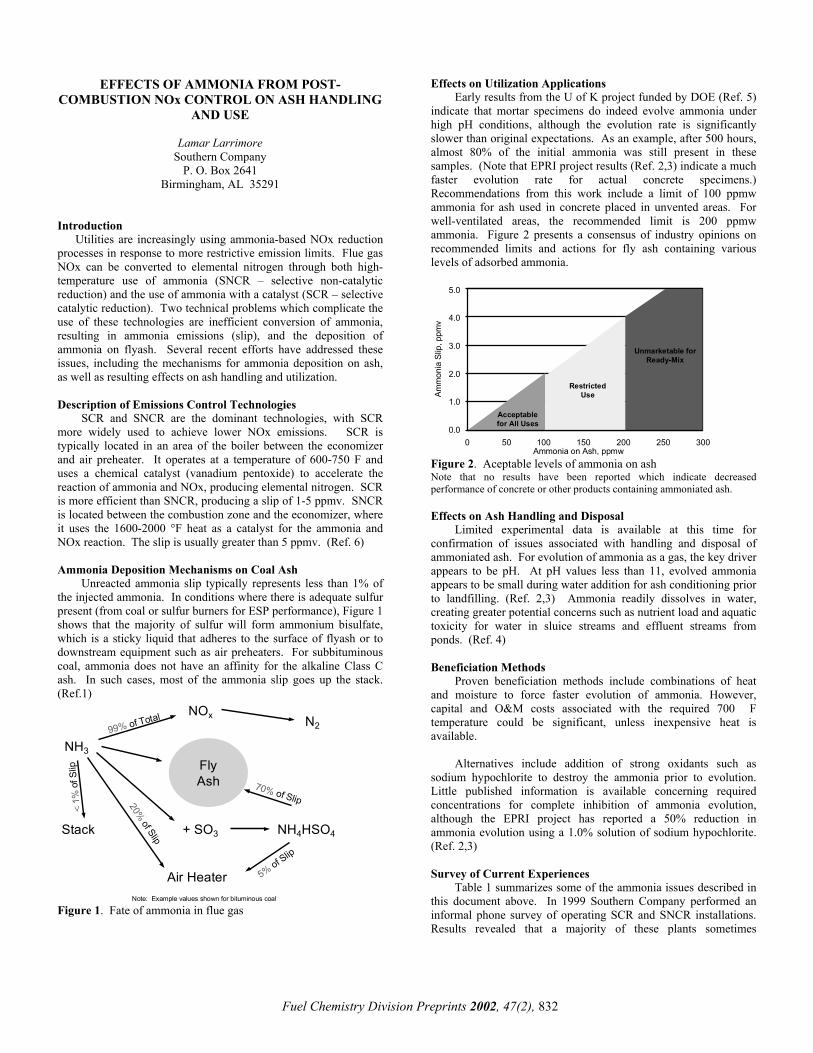
Effects on Utilization Applications Early results from the U of K project funded by DOE (Ref. 5)
indicate that mortar specimens do indeed evolve ammonia under high pH conditions, although the evolution rate is significantly slower than original expectations. As an example, after 500 hours, almost 80% of the initial ammonia was still present in these samples. (Note that EPRI project results (Ref. 2,3) indicate a much faster evolution rate for actual concrete specimens.) Recommendations from this work include a limit of 100 ppmw ammonia for ash used in concrete placed in unvented areas. For well-ventilated areas, the recommended limit is 200 ppmw ammonia. Figure 2 presents a consensus of industry opinions on recommended limits and actions for fly ash containing various levels of adsorbed ammonia.
Lamar Larrimore
Southern Company P. O. Box 2641
Birmingham, AL 35291
Introduction Utilities are increasingly using ammonia-based NOx reduction
processes in response to more restrictive emission limits. Flue gas NOx can be converted to elemental nitrogen through both high-temperature use of ammonia (SNCR – selective non-catalytic reduction) and the use of ammonia with a catalyst (SCR – selective catalytic reduction). Two technical problems which complicate the use of these technologies are inefficient conversion of ammonia, resulting in ammonia emissions (slip), and the deposition of ammonia on flyash. Several recent efforts have addressed these issues, including the mechanisms for ammonia deposition on ash, as well as resulting effects on ash handling and utilization.
Amm
onia
Slip
, ppm
v Ammonia on Ash, ppmw
Acceptablefor All Uses
RestrictedUse
Unmarketable forReady-Mix
5.0
4.0
3.0
2.0
1.0
0.00 50 100 150 200 250 300
Description of Emissions Control Technologies
SCR and SNCR are the dominant technologies, with SCR more widely used to achieve lower NOx emissions. SCR is typically located in an area of the boiler between the economizer and air preheater. It operates at a temperature of 600-750 F and uses a chemical catalyst (vanadium pentoxide) to accelerate the reaction of ammonia and NOx, producing elemental nitrogen. SCR is more efficient than SNCR, producing a slip of 1-5 ppmv. SNCR is located between the combustion zone and the economizer, where it uses the 1600-2000 °F heat as a catalyst for the ammonia and NOx reaction. The slip is usually greater than 5 ppmv. (Ref. 6)
Figure 2. Aceptable levels of ammonia on ash Note that no results have been reported which indicate decreased performance of concrete or other products containing ammoniated ash. Effects on Ash Handling and Disposal
Limited experimental data is available at this time for confirmation of issues associated with handling and disposal of ammoniated ash. For evolution of ammonia as a gas, the key driver appears to be pH. At pH values less than 11, evolved ammonia appears to be small during water addition for ash conditioning prior to landfilling. (Ref. 2,3) Ammonia readily dissolves in water, creating greater potential concerns such as nutrient load and aquatic toxicity for water in sluice streams and effluent streams from ponds. (Ref. 4)
Ammonia Deposition Mechanisms on Coal Ash
Unreacted ammonia slip typically represents less than 1% of the injected ammonia. In conditions where there is adequate sulfur present (from coal or sulfur burners for ESP performance), Figure 1 shows that the majority of sulfur will form ammonium bisulfate, which is a sticky liquid that adheres to the surface of flyash or to downstream equipment such as air preheaters. For subbituminous coal, ammonia does not have an affinity for the alkaline Class C ash. In such cases, most of the ammonia slip goes up the stack. (Ref.1)
Beneficiation Methods
Proven beneficiation methods include combinations of heat and moisture to force faster evolution of ammonia. However, capital and O&M costs associated with the required 700 F temperature could be significant, unless inexpensive heat is available.
NH3
< 1%
of S
lip
NOx
Air Heater
Stack + SO3
N2
NH4HSO4
FlyAsh
99% of Total
20% of Slip
5% of Slip
70% of Slip
Note: Example values shown for bituminous coal
Alternatives include addition of strong oxidants such as
sodium hypochlorite to destroy the ammonia prior to evolution. Little published information is available concerning required concentrations for complete inhibition of ammonia evolution, although the EPRI project has reported a 50% reduction in ammonia evolution using a 1.0% solution of sodium hypochlorite. (Ref. 2,3) Survey of Current Experiences
Table 1 summarizes some of the ammonia issues described in this document above. In 1999 Southern Company performed an informal phone survey of operating SCR and SNCR installations. Results revealed that a majority of these plants sometimes
Figure 1. Fate of ammonia in flue gas
Fuel Chemistry Division Preprints 20 02, 47(2), 832

experienced detectable ammonia odors; however, most were still able to utilize ash for beneficial purposes.
SitesAmmonia Slip 0 - 5 ppm 12
> 10 ppm 3
Ammonia on Ash 50 - 300 ppm 3
Ash Handling System Dry 15 Reinject Ash 1
Ash Disposal Method Landfill 14 Mine Reclamation 2
Ash Utilization Concrete/Flowable Fill 8 Other 4
Detectable Odor At Plant, Disposal, Uses 10_______________________________________________
Table 1. Table 1. SCR/SNCR survey resultsSCR/SNCR survey results_________________________________________________
References 1. Investigation of Ammonia Adsorption on Fly Ash and Potential
Impacts of Ammoniated Ash, Electric Power Research Institute Report TR-113777, December 1999.
2. Behavior of Ammoniated Fly Ash, EPRI Report 1003981, February 2002.
3. Impacts of Ammonia Contamination of Fly Ash on Disposal and Use, EPRI Report 1004609, October 2001.
4. Environmental Issues Associated With Ammonia, Southern Company Internal Publication, July 1999.
5. Rathbone, R. and Robl, T., A Study of the Effects of Post-Combustion Ammonia Injection on Fly Ash Quality: Characterization of Ammonia Release from Concrete and Mortars Containing Fly Ash as a Pozzolanic Admixture, University of Kentucky Technical Progress Report, Department of Energy Cooperative Agreement No. DE-FC26-00NT40908, October 2001.
6. Larrimore, L., Monroe, L., Dodgen, D., Characterization of Ammonia Effects on Ash and Evaluation of Removal Methods, American Coal Ash Symposium, Orlando FL, January 1999.
Fuel Chemistry Division Preprints 20 02, 47(2), 833

EFFECT OF PRESSURE ON ASH FORMATION DURING PULVERISED COAL COMBUSTION AND
GASIFICATION
Terry F. Wall1, Jianglong Yu1, Hongwei Wu2, Guisu Liu3, John A. Lucas1, David Harris4
1. Cooperative Research Centre for Coal in Sustainable
Development (CCSD), The University of Newcastle, Callaghan, NSW 2308, Australia
2. CRC for Clean Power from Lignite, Department of Chemical Engineering, Monash University, Clayton, VIC 3800, Australia
3. Niksa Energy Associates, 1745 Terrace Drive, Belmont, CA 94002, USA
4. CSIRO Energy Technology, Queensland Centre for Advanced Technologies, Technology Court, Pullenvale, Qld 4069, Australia
Abstract
In this paper, effects of the operating pressure on ash formation reported in the open literature have been reviewed. In particular, the recent significant advances achieved at the Cooperative Research Centre for Coal in Sustainable Development (CCSD) in Australia are highlighted. The operating pressure significantly influences the size and the chemistry of ash generated through its effects on the structure of chars generated. Previous work has shown that pressure has marked impacts on the volatile yield new work has shown that it also impacts particle swelling behaviour during devolatilisation and hence the resulting char structure and morphology. Char particles generated at elevated pressures have high porosity. These char particles experience more extensive fragmentation during the combustion and gasification, which leads to finer ash particles compared to that formed at low pressures. At high pressure, the char particles appear to burn faster. The char structure also determines the ash liberation for the different combustion stages. The PSD of ash is less sensitive to pressure during gasification process. Ongoing research in the CCSD is determining the chemistry of the char and ash generated in a Pressurised Entrained Flow Reactor (PEFR), and has developed a mechanistic model to predict char structure and hence ash properties. Introduction
Advanced clean coal technologies, including pressurised fluidised bed combustion (PFBC) and integrated gasification combined cycle (IGCC) have attracted increasing technological and scientific interests over the last decades [1]. These technologies provide several advantages over the conventional coal firing processes, including an increase in coal throughput, a reduction in pollutant emission and an enhancement in the intensity of reactions [1,2]. The recent previous work on coal pyrolysis [3-9], coal swelling [10-14] and char reactivities [7,15-31], has revealed that the operating pressure has marked impacts on coal swelling during devolatilisation, and that char reactivity is enhanced at high pressure. However, ash formation at elevated pressures has not been well understood.
Studies of mineral matter transformation are motivated by the concerns with performance of the utility boilers [32,33], such as fouling and slagging. The ash formed during the gasification process has been found to have a major effect on IGCC system design and operation, slag formation and tapping, ash deposition in gas circuit, heat exchange passes and fly ash collection equipment [1].
Fundamental knowledge of ash formation at elevated pressures is therefore essential to the development of these technologies and to the improvement of the performance of the pressurised reactors.
General mechanism of ash formation has been summarized in the literature [33-35]. Many factors are known to control the chemistry of the final ash particles during pulverised coal combustion and gasification, including mineral content, mineral distribution among pulverized coal particles, coal particle size distribution, char structure and burnout mechanism, physical properties of the ash, char fragmentation [32]. It should be pointed out that strong association exists between ash formation and the char structure related behaviour [36,47], such as char fragmentation [32,37,38] and the coalescence of the included minerals [39]. Therefore, any factors that influence char structure may impact the ash formation and chemistry.
Significant advances in the understanding of effects of the operating pressure on the ash formation has been achieved through the projects undertaken at the Cooperative Research Centre for Coal in Sustainable Development (CCSD) of Australia. In particular, it has been found that the operating pressure significantly influences the ash formation mechanism through its effect on chemistry of chars formed during the devolatilisation. In this paper, the effects of the pressure on the devolatilisation behaviour of coal and the chemistry of the final ash have been summarised. Effects of pressure on the deveolatilisation of coal
Impacts of the operating pressure on pyrolysis behaviour of coal have been extensively investigated[3-9], and documented [40-43]. In general, pressure significantly influences the volatile matter yields, coal particle swelling and the structure of the resulting char residues. This further influences the char reaction rate [36] and the ash formation mechanism [47].
Volatile matter yields A pronounced reduction of the total weight loss and tar yields at
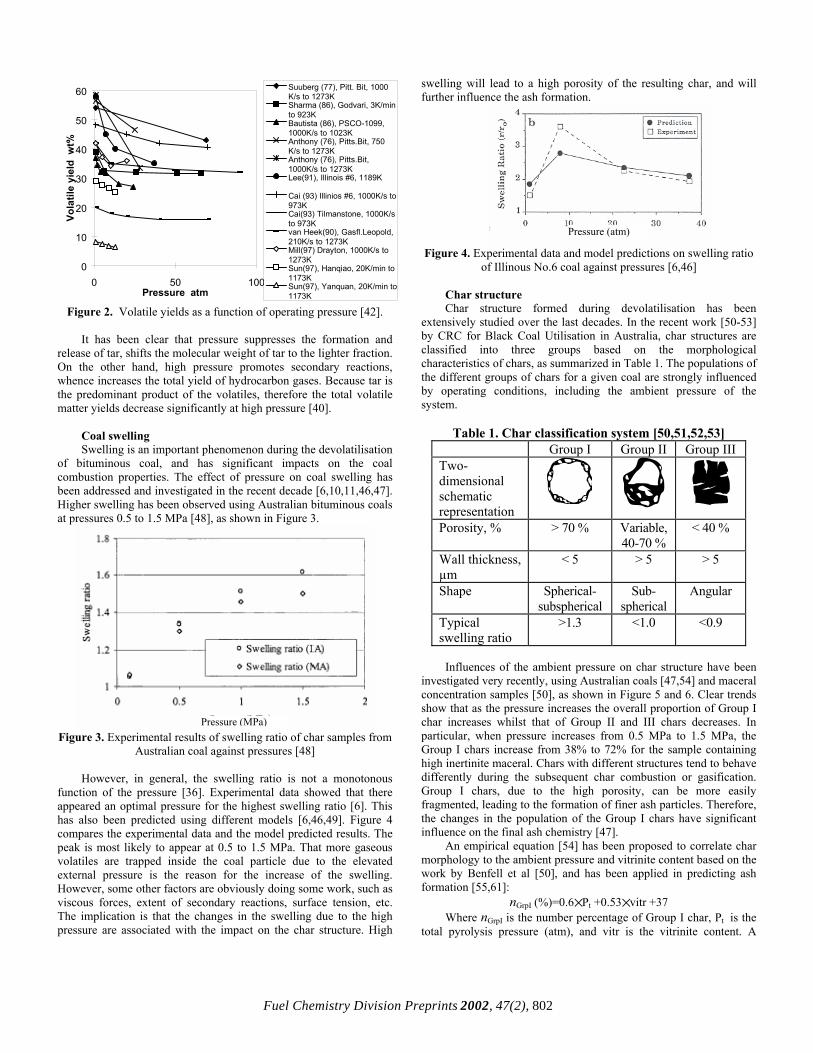
elevated pressures and temperatures has been observed using wire mesh reactors or entrained flow reactors. The early investigations carried out using Pittsburgh bituminous coal [44] showed that the total volatile matter yield decreased with increasing the operating pressure, and the effect was more distinguishable at high temperature. Measurements on Pittsburgh No.8 coal by Suuberg et al [45] revealed that as pressure increases the total volatile matter and tar yields decreases whilst total gas production increases, as shown in Fig 1. The published data at various conditions regarding the pressure effect in the open literature have been summarised in Fig 2 [42].
Total volatiles yields
Tar
Hydrocarbon gases
Figure 1. Yields of volatile products vs. pressure during pyrolysis of Pittsburgh No.8 coal at 1000°C [45]
Pressure (atm)
Fuel Chemistry Division Preprints 2002, 47(2), 801
0
10
20
30
40
50
60
0 50 100Pressure atm
Vola
tile
yiel
d w
t%
Suuberg (77), Pitt. Bit, 1000K/s to 1273KSharma (86), Godvari, 3K/minto 923KBautista (86), PSCO-1099,1000K/s to 1023KAnthony (76), Pitts.Bit, 750K/s to 1273KAnthony (76), Pitts.Bit,1000K/s to 1273KLee(91), Illinois #6, 1189K
Cai (93) Illinios #6, 1000K/s to973KCai(93) Tilmanstone, 1000K/sto 973Kvan Heek(90), Gasfl.Leopold,210K/s to 1273KMill(97) Drayton, 1000K/s to1273KSun(97), Hanqiao, 20K/min to1173KSun(97), Yanquan, 20K/min to1173K
Figure 2. Volatile yields as a function of operating pressure [42]. It has been clear that pressure suppresses the formation and
release of tar, shifts the molecular weight of tar to the lighter fraction. On the other hand, high pressure promotes secondary reactions, whence increases the total yield of hydrocarbon gases. Because tar is the predominant product of the volatiles, therefore the total volatile matter yields decrease significantly at high pressure [40].
Coal swelling Swelling is an important phenomenon during the devolatilisation
of bituminous coal, and has significant impacts on the coal combustion properties. The effect of pressure on coal swelling has been addressed and investigated in the recent decade [6,10,11,46,47]. Higher swelling has been observed using Australian bituminous coals at pressures 0.5 to 1.5 MPa [48], as shown in Figure 3.
Figure 3. Experimental results of swelling ratio of char samples from
Australian coal against pressures [48]
However, in general, the swelling ratio is not a monotonous function of the pressure [36]. Experimental data showed that there appeared an optimal pressure for the highest swelling ratio [6]. This has also been predicted using different models [6,46,49]. Figure 4 compares the experimental data and the model predicted results. The peak is most likely to appear at 0.5 to 1.5 MPa. That more gaseous volatiles are trapped inside the coal particle due to the elevated external pressure is the reason for the increase of the swelling. However, some other factors are obviously doing some work, such as viscous forces, extent of secondary reactions, surface tension, etc. The implication is that the changes in the swelling due to the high pressure are associated with the impact on the char structure. High
swelling will lead to a high porosity of the resulting char, and will further influence the ash formation.
Pressure (atm)
Figure 4. Experimental data and model predictions on swelling ratio of Illinous No.6 coal against pressures [6,46]
Char structure Char structure formed during devolatilisation has been
extensively studied over the last decades. In the recent work [50-53] by CRC for Black Coal Utilisation in Australia, char structures are classified into three groups based on the morphological characteristics of chars, as summarized in Table 1. The populations of the different groups of chars for a given coal are strongly influenced by operating conditions, including the ambient pressure of the system.
Table 1. Char classification system [50,51,52,53]
Group I Group II Group III Two-dimensional schematic representation
Porosity, % > 70 % Variable, 40-70 %
< 40 %
Wall thickness, µm
< 5 > 5 > 5
Shape Spherical- subspherical
Sub-spherical
Angular
Typical swelling ratio
>1.3 <1.0 <0.9
Influences of the ambient pressure on char structure have been
investigated very recently, using Australian coals [47,54] and maceral concentration samples [50], as shown in Figure 5 and 6. Clear trends show that as the pressure increases the overall proportion of Group I char increases whilst that of Group II and III chars decreases. In particular, when pressure increases from 0.5 MPa to 1.5 MPa, the Group I chars increase from 38% to 72% for the sample containing high inertinite maceral. Chars with different structures tend to behave differently during the subsequent char combustion or gasification. Group I chars, due to the high porosity, can be more easily fragmented, leading to the formation of finer ash particles. Therefore, the changes in the population of the Group I chars have significant influence on the final ash chemistry [47].
Pressure (MPa)
An empirical equation [54] has been proposed to correlate char morphology to the ambient pressure and vitrinite content based on the work by Benfell et al [50], and has been applied in predicting ash formation [55,61]:
nGrpI (%)=0.6✕ Pt +0.53✕ vitr +37 Where nGrpI is the number percentage of Group I char, Pt is the
total pyrolysis pressure (atm), and vitr is the vitrinite content. A
Fuel Chemistry Division Preprints 2002, 47(2), 802

similar correlation has been given based on investigations on the same maceral concentration samples to predict Group I char population at different pressures by Benfell et al [50].
Figure 5. Char characteristic of coal A (an Australian bituminous
coal) generated at different pressures [47]
Figure 6. Percentages of Group I, II and III char for inertinite-
concentration (prepared at 1300°C and indicated pressures [50])
A mechanistic char structure model has recently been developed based on bubble mechanisms [56]. The model has provided potential capacity of predicting pressure effect on swelling and char structure evolution from standard raw coal properties. An ongoing project in the CCSD, Australia, is looking at the char and ash characteristics collected in a Pressurised Entrained Flow Reactor (PEFR) at high pressures and temperatures [57]. Effect of pressure on char reactions
It has been known that char structure plays an important role in the char burnout. In general, in regime I, porous char particles (Group I) burn at a faster rate compared to the solid chars (Group III). In regime II, porous char burns at similar rate to the solid one. However, the porous char has experienced more extent of devolatilisation resulting in much high weight loss. The mass of carbon in the porous char is much less than that in the solid char. Therefore, the porous char will burn out at the earlier stage of the combustion [47]. Figure 7 shows predicted burning rates of Group I and III chars [36].
An important aspect in the char reaction is the fact that porous char particles are easily fragmented in combustion. The tendency of the fragmentation of the different chars has major impacts on the chemistry of the final ash particles (47). It has been observed that chars generated at elevated pressure have higher porosity, as shown
in Figure 8. The increased porosity results in more chance of char fragmentation during the char combustion (35,47).
0
0.2
0.4
0.6
0.8
1
0 0.5 1 1.5 2 2.5 3Residence time (second)
Cha
r m
ass
frac
tion
Cenospherical char
Dense charGroup III
Group I
Figure 7. The predicted mass fraction of remaining char vs. residence
time for Group I and Group III char particles [36].
Figure 8. The predicted mass fraction of remaining char vs. residence
time for Group I and Group III char particles [35,47].
Pressure (MPa)
The effect of pressure on the char reaction has been extensively
studied in the past a few decades, and has been reviewed by Wall et al [36]. Table 2 summarises the data for the effect of pressure on char reactions provided in the open literature.
Table 2. Summary of pressure effects on various aspects of char
reaction [Modified from 36] Aspects The effect of pressure Ref. Char combustion
Rate ↑ with increasing O2 partial pressure at a fixed total pressure
[64,65]
Char combustion
Rate first ↑ then ↓ with increasing total pressure at a fixed O2 mole fraction
[64,65]
Char temperature
↑ with increasing O2 partial pressure at a fixed total pressure
[66]
Char gasification
Rate ↑ with increasing reactant gas pressure
[30,67, 68]
Char reactivity
↓ with increasing pyrolysis pressure [10,15, 29,69]
Swelling First ↑ then ↓ with increasing pyrolysis pressure
[11,14, 35]
Bulk diffusivity
↓ with increasing total pressure [70]
Char porosity
↑ with increasing total pyrolysis [35,47, 53]
Fuel Chemistry Division Preprints 2002, 47(2), 803

Effect of pressure on ash formation
Very little data have been provided in the open literature in relation to ash formation at pressure. An increase in the system pressure results in a decrease in the vaporization of ash species [39,47,59,60]. However, the char fragmentation and the coalescence of included minerals in the char particle are the main mechanisms of ash formation during bituminous coal combustion [47]. Very recently, a number of Australian coals have been used in examining pressure effects on ash liberation [58]. Strong association has been found between the ash formation and the char structure, and the mechanism for ash formation from different char types has been proposed [47,58].
Ash liberation at high pressures The characteristics of the liberated ash particles reflect the
dominant ash formation mechanism at different burn-off levers (47). Figure 9 indicates that there was almost no change between the PSD of the liberated ash between burnoff levels of 54.3% and 35.5%. At the middle combustion stage where the burnout level is 70%, the percentage of liberated ash particles in the sample increased, and the PSD of liberated ash shows that char fragmentation was still the dominant mechanism for ash formation during combustion from 54.3% to 70.1% burnoff levels. However, the PSD shifts to a slightly larger size. The change in PSD of liberated ash implies that some coalescence of included mineral matter occurred at this burnoff level. At an 87.1% burnoff level the PSD for the liberated ash increased significantly compared to the 70.1% burnoff level. This suggests that included mineral matter experienced more significant coalescence during this stage. At the 95.6% burnoff level, the majority of the particles in the sample are presented as liberated ash (about 80%). The largest shift in the liberated ash PSD was observed indicating that the most significant extent of coalescence for included mineral matter occurred during this stage.
Figure 10. Characteristics of combustion solid residues (at 0.1 MPa) at different burn-off levels [47,58]
Coal burn-off level
However, no experimental data are available to compare the
pressure effects on the ash liberation at the same burn-off level. Although chars produced at high pressure have high porosity, whence are expected to experience more extensive fragmentation during combustion [47]. Other previous studies [62,63] have also shown that fragmentation is strongly associated with the porous char structures. Highly porous char tends to fragment frequently.
Chemistry of the high-pressure ash Wu et al [35,47] have studied the chemistry of the ash produced
during the combustion of Australian bituminous coals at four different pressures. The morphology of the ash particles examined using SEM is shown in Figure 11. The SEM images clearly show that as pressure increases from 0.1 MPa to 1.5 MPa considerably higher numbers of finer ash particles are formed.
(a). 0.1 MPa (b). 0.5 MPa
Figure 9. Characteristics of combustion solid residues (at 0.1 MPa) at different burn-off levels [47,58]
Coal burn-off level
Combustion solid residues at different burn-off levels were also
analysed under SEM [47,58]. Clear trends are presented in Figure 10 that the level of ash liberation increases with an increased level of burn-off. No apparent liberated ash particles were observed at a burn-off level of 35.5%. At a burn-off level of 54.3%, which corresponds to the early combustion stage, some free ash particles were observed. Significant char fragmentations were also observed at this burn-off level [36]. The number percentage of liberated ash particles increases from around 11% at 54.3% burn-off to 82% at 95.6% burn-off level.
(c). 1.0 MPa (d). 1.5 MPa
Figure 11. SEM image of ash particles of coal A collected at different pressures [35,47]
The results for ash particle size distribution (PSD) were
measured for the same Australian coal, and are presented in Figure 12. When pressure increases from 0.1 MPa to 1.5 MPa, the PSD of the ash shifts to smaller particle sizes, indicating that the ash formed
Fuel Chemistry Division Preprints 2002, 47(2), 804

at higher pressures has a much finer size. Sink/float analysis shows that over 70% of the mineral matter in coal is present as included species [36]. Figure 13 compared the results of PSD measurements of the ash for another two Australian coals, and the similar trends were observed. However, the PSD of the ash formed during gasification is expected to be less sensitive to the system pressure [47].
Mechanism of ash formation at high pressure A mechanism for the ash formation, as shown in Figure 14, has
been proposed very recently by Wu et al [35, 47], where the char fragmentation and the coalescence of the included minerals play the dominant role. Based on this study a comprehensive ash formation model including this char structural mechanism has been recently presented to predict ash deposition [61].
Figure 14. Proposed mechanisms for ash formation from different
char types [35,47] Particle size (um)
Figure 12. PSD of ash formed from combustion of coal A in air at pressures indicated [35,47].
From Figure 14, Group I type char particles fragment
extensively during the early and middle combustion stages and burn out early. The extent of coalescence for the included mineral particles in the Group I char is very low. Therefore, one Group I type char particle may produce a number of small ash particles, resulting in a small PSD for liberated ash. Group II type char particles fragment less compared to the Group I type char particles. Char fragmentation is still the dominant mechanism for ash formation but the included mineral particles undergo some coalescence. One Group II type char particle may produce several ash particles with a relatively larger size compared to the Group I type char particle, resulting in an increase in PSD of the liberated ash during the middle burnout stage. Group III type char particles exhibit low or no fragmentation. The included mineral particles undergo a large extent of coalescence. One Group III type particle may form only one or two ash particles of a larger size compared to Group I and II type char particles, resulting in a significant shift to larger size of the liberated ash PSD during the late combustion stage. At high pressures, larger amounts of highly porous char particles are generated. Therefore more finer ash particles are formed. This ash formation mechanism provides a mechanistic explanation for the observations under pressurised conditions.
Particle size (um)
Figure 13. PSD of ash formed from combustion of coal B in air at a gas temperature of 1300 °C and the pressure indicated [47] Char structure has been found to be a significant linkage
between pressure and ash formation [36, 47], and the char fragmentation and the coalescence of the included minerals are dominant ash formation mechanism during the bituminous coal combustion [47]. At 1.5 MPa, the char sample contains mainly Group I particles with high porosity. However, at 0.1MPa, it is dominated by the Group II and III type particles with relatively low porosity. During combustion, Group I chars will undergo extensive fragmentation, reducing the coalescence of the included minerals, and therefore producing a large number of smaller ash particles. For Group III char particles, the chance for fragmentation is much less. There is a much higher probability of coalescence for the included minerals, resulting in the formation of ash particles with larger sizes during combustion. The ash formed from Group II particles will therefore be of a size between that of Group I and III derived ash particles.
Conclusions
Recent studies have demonstrated that the operating pressure has significant impacts on ash formation during pf combustion and gasification due to its relationship with char character. At elevated pressures, more swelling and higher porosity of chars are observed, and a maximum swelling seems to occur at an optimal pressure. Larger population of Group I chars are formed at higher pressure and finer ash particles tend to be generated due to the formation of more porous chars. The formation mechanism for the finer ash during combustion results from more significant fragmentation and less coalescence of included minerals within the porous chars.
Acknowledgement. The authors wish to acknowledge the
support provided by the Cooperative Research Centre for Coal in Sustainable Development which is funded in part by the CRC program of Australia.
Fuel Chemistry Division Preprints 2002, 47(2), 805

References (1) Takematsu, T. and Maude, C., Coal Gasification for IGCC Power
Generation, IEA Coal Research, Gemini House, London, 1991 (2) Harris, D. J. and Patterson, J. H., Aust. Inst. of Energy J., 13:22 (1995) (3) Cai, H. Y., Guell, A. J., Dugwell, D. R. and Kandiyoti, R., Fuel, 72:321
(1993) (4) Green, P. D., Patrick, J. W., Thomas, K. M. and Walker, A., Fuel,
64:1431 (1985) (5) Griffin, T. P., Howard, J. B. and Peters, W. A., Fuel, 73:591 (1994) (6) Lee, C. W., Jenkins, R. G. and Schobert, H. H., Energy and Fuels, 5:547
(1991) (7) Megaritis, A., Messenbock, R. C., Chatzakis, I. N., Dugwell, D. R. and
Kandiyoti, R., Fuel, 78:871 (1999) (8) Mill, C. J., Harris, D. J. and Stubington, J. F., 8th Australian Coal
Science Conference, The Australian Institute of Energy, Sydney, Australia, p. 151 (1998)
(9) Sun, C. L., Xiong, Y. Q., Liu, Q. X. and Zhang, M. Y., Fuel, 76:79 (1997)
(10) Lee, C. W., Jenkins, R. G. and Schobert, H. H., Energy and Fuels, 6:40 (1992)
(11) Khan, M. R. and Jenkins, R. G., Fuel, 65:725 (1986) (12) Khan, M. R. and Jenkins, R. G., Int. Conf. Coal Sci., IEA, p. 1336, 1983 (13) Khan, M. R. and Jenkins, R. G., Fuel, 65:1291 (1986) (14) Lee, C. W., Scaroni, A. W. and Jenkins, R. G., Fuel, 70:957 (1991) (15) Cai, H. Y., Guell, A. J., Chatzakis, I. N., Lim, J.-Y., Dugwell, D. R. and
Kandiyoti, R., Fuel, 75:15 (1996) (16) Croiset, E., Mallet, C., Rouan, J.-P. and Richard, J.-R., 26th Symposium
(International) on Combustion (1996), The Combustion Institute, p. 3095
(17) Essenhigh, R. H. and Mescher, A. M., 26th Symposium (International) on Combustion (1996), The Combustion Institute, p. 3085
(18) Messenbock, R. C., Dugwell, D. R. and Kandiyoti, R., Fuel, 78:781 (1999)
(19) Lin, S.-Y., Suzuki, Y., Hatano, H. and Tsuchiya, K., Chemical Engineering Science, 55:43 (2000)
(20) Richard, J.-R., Majthoub, M. A., Aho, M. J. and Pirkonen, P. M., Fuel, 73:485 (1994)
(21) Joutsenoja, T., Saastamoinen, J., Aho, M. and Hernberg, R., Energy and Fuels, 13:130 (1999)
(22) Turnbull, E., Kossakowski, E. R., Davidson, J. F., Hopes, R. B., Blackshaw, H. W., and Goodyer, P. T. Y., Chem. Eng. Res. Des., 62:1217 (1984)
(23) Monson, C. R. and Germane, G. J., Energy and Fuels, 7:928 (1993) (24) Essenhigh, R. H. and Mescher, A. M., Combustion and Flame, 111:350
(1997) (25) Li, S. and Xiao, X., Fuel, 72:1351 (1993) (26) Megaritis, A., Zhuo, Y., Messenbock, R., R., D. D. and Kandiyoti, R.,
Energy and Fuels, 12:501 (1998) (27) Sha, X. Z., Chen, Y. G., Cao, J., Yang, Y. M. and Ren, D. Q., Fuel,
69:293 (1990) (28) Megaritis, A., Messenbock, R. C., Collot, A.-G., Zhuo, Y., Dugwell, D.
R. and Kandiyoti, R., Fuel, 77:1411 (1998) (29) Roberts, D. and Harris, D. J., Energy and Fuels, 14:483 (2000) (30) Blackwood, J. D. and Ingeme, A. J., Aust. J. Chem., 1958 (11), pp.16 (31) Ranish, J. M. and Walker, P. L., Carbon, 31:135 (1993) (32) Kang, S. G.; Sarofim, A. F.; Beer, J. M.. 24th Symposium (International)
on Combustion Institute (1992), The Combustion Institute, pp. 1153 (33) Couch, G. Understanding Slagging and Fouling in PF Combustion; IEA
Coal Research; London, 1994 (34) Helble, A. F.; Neville, M.; Sarofim, A. F.. 21st Symposium
(International) on Combustion (1986); The Combustion Institute; Pittsburgh, PA, pp 411-417
(35) Wu, H.; Bryant, G.; Wall, T.. Energy & Fuel, 14, pp745-750 (2000) (36) Wall, T; Liu, G.; Wu, H.; Benfell, K.; Lucas, J.; Roberts, D.; Yu, J.;
Harris, D.. Australian Combustion and Flame Day (2002), Adelaide, Australia
(37) Baxter, L. L., Combustion and Flame, 90:174 (1992) (38) Helble, J. J. and Sarofim, A. F., Combustion and Flame, 76:183 (1989) (39) Raask, E., Mineral impurities in coal combustion: behavior, problems
and remedial measures, Hemisphere Publishing Corporation (1985) (40) Gavalas, G. R.. Coal pyrolysis,. Amsterdam; Elsevier Scientific Pub. Co.
(1982) (41) Howard, J.. Chemistry of coal utilization : second supplementary
volume,. M. A. Elliott. New York, pp. 665- (1981) (42) Shan, G.. PhD Thesis. In Dept. of Chemical Engineering. University of
Newcastle. (2000) (43) Wall, T. Liu, G. Wu H. Roberts, D. Benfell, K.; Lucas J.. Progress in
Energy and Combustion Science;, 2002 (In press) (44) Anthony, D. B.; Howard, J. B.; Hottel, H. C.; Meissner, H. P.. 15th
Symposium (International) on Combustion Institute (1975), The Combustion Institute, Pittsburgh, pp. 1303
(45) Suuberg, E. M.. Sc.D Thesis, MIT (1977), USA (46) Solomon, P. R.; Fletcher, T. H.. 25th Symposium (International) on
combustion (1994), The Combustion Institute, pp. 463 (47) Wu, H., PhD thesis, The University of Newcastle, Australia (2000) (48) Wu, H. Bryant, G.; Benfell, K.; Wall, T.. Energy & Fuels, 14. pp. 282-
290 (2000) (49) Oh, M. S.;Peters, W. A; Howard, J.B.. AIChE J., 35(5), pp.775-792
(1989) (50) Benfell, K. E., PhD thesis, The University of Newcastle, Australia
(2001) (51) Bailey, J. G., Tate, A. G., Diessel, C. F. K. and Wall, T. F., Fuel, 69:225
(1990) (52) Benfell, K. E. and Bailey, J. G., 8th Australian Coal Science
Conference, p. 157 (1998) (53) Benfell, K. E., Liu, G.-S., Roberts, D., Harris, D. J., Lucas, J. A., Bailey,
J. G. and Wall, T. F., 28th Symposium (International) on Combustion (2000), The Combustion Institute
(54) Liu, G. PhD thesis, In Chemical Engineering, The University of Newcastle, Australia (1999)
(55) Yan, L. PhD thesis, In Chemical Engineering, The University of Newcastle, Australia (2000)
(56) Yu, J.; Strezov, V.; Lucas, J.; Liu, G.; Wall, T.. 29th Symposium (International) on combustion (2002), The Combustion Institute, Japan (Accepted)
(57) Harris, D. et al. CRC Report, CRC for Black Coal Utilization, Newcastle, Australia (2000/2001)
(58) Wu, H.; Wall, T.; Liu, G.; Bryant, G.. Energy & Fuels, 13, pp. 1197-1202 (1999)
(59) Mojtahedi, W.; Backman, R.. J. Inst. Energy. 62, pp. 189-196 (1989) (60) Wu, H.; Bryant, G.; Wall, T.. Proceeding of the Adelaide International
Workshop on Thermal Energy Engineering and the Environment, Adelaide, Education Technology Unit, The University of Adelaide, pp. 525-534
(61) Yan, L.; Gupta, R.; Wall, T.. Fuel, 80, pp. 1333-1340 (2001) (62) Baxter, L.L.. Combustion and Flame, 90:174 (1992) (63) Helble, F. F.; Sarofim, A. F.. Combustion and Flame; 76:183 (1989) (64) Monson, C.R.; Germane, G.J.; Blackham, A.J.; Smoot, L.D..
Combustion and Flame, 100:387 (1995) (65) Laster, T.W.; Seeker, W. R.; Meerklin, J.. 18th Symposium
(International) on combustion (1981), The Combustion Institute, pp.1257
(66) Saastamoinen, J.J.; Aho, M.J.; Hamalainen, J.P.. Energy and Fuels, 10:599(1996)
(67) Blackwook, J.D.; Ingeme, A.J.. . J., Aust. J. Chem., 13:194 (1960) (68) Muhlen, H. J.; van Heek, K. H.; Juntgen, H,.. Fuel, 64:591 (1985) (69) Robert, D.. PhD thesis; In Chemical Engineering, University of
Newcastle (2000) (70) Satterfield, C.N. Mass transfer in heterogeneous catalysis, MIT Press,
1970
Fuel Chemistry Division Preprints 2002, 47(2), 806

FLY ASH BENEFICATION WITH OZONE: MECHANISM OF ADSORPTION SUPRESSION
Xu Chen, Yuming Gao, Indrek Kulaots, Eric Suuberg, Robert Hurt
Division of Engineering, Brown University
Providence, RI, 02912 USA Introduction The largest and most lucrative market for coal combustion fly ash is as a pozzolanic additive in concrete where it serves as a partial replacement for cement1, 2. A previous paper documented the beneficial effect of ozone treatment on the air entrainment behavior of concrete made with carbon-containing fly ash3. Ozone is capable of reacting with residual carbon surfaces in ash at or near room temperature to produce surface oxides that reduce the adsorptivity of the ash toward air entraining admixtures (AEAs), the surfactant solutions used in air entrained concrete3. There have been a number of other studies of ozone reaction with various carbon materials, including graphite, carbon fibers, and carbon sorbents. In these studies the applications range from the destruction of ozone waste streams, to the depletion of atmospheric ozone, to surface treatment (of carbon fibers) for improved interfacial bonding in composite materials. The original paper on fly ash ozonation3 documented the decrease in adsorptivity following ozonation, and presented an argument that the underlying mechanism is change in surface chemistry, since the amount of bulk carbon consumed by oxidation is trivial under the conditions employed. The present paper examines the mechanism of adsorption suppression in more detail, focusing on carbon black as a model substance whose surface oxides can be characterized more readily than those on native residual carbon, which is a minority component in an solid mixture (fly ash) rich in inorganic oxides. The paper also includes data on other, well-characterized surfactants in an attempt to identify the precise mechanism through which ozone treatment suppresses adsorption from aqueous solution.
Experimental The laboratory upflow fixed bed used for ambient temperature ozonation has been described in detail the previous publication1. Controlled ozone concentrations from 500 ppm - 2 vol-% were generated in air and passed upward through fixed beds of ash or carbon black (5 - 200 gms), for fixed contact times (1 minute - 20 hrs), while outlet ozone concentration was monitored in real time. The treated carbon surfaces were examined by XPS (Evans East Laboratories), by vapor adsorption techniques, and by wetting experiments (Kruss USA) using standard liquids used to determine surface energies by application of the Owens-Wendt theory4. Adsorptivity was determined by titration using methods described previously2,3 using Darex II (anionic resin-derived AEA), SDS (a standard anionic surfactant), and Tergitol (a commercial non-ionic surfactant). Results The experimental results are presented in Tables 1-3 and Figure 1. The XPS results in Table 1 show greatly enhanced oxygen contents in the near-surface regions of carbon black samples ozonated under the same conditions used for fly ash carbon. High-resolution spectral analysis of the high-binding energy tail of the C1s peak reveals
increases in C-O, C=O, and O-C=O functionalities with only subtle differences between thermal (air) oxidation and ozonation.
Table 1. XPS results on carbon black Sample Atom-% O* Atom-% C* Untreated carbon black 1 98 air oxidized at 440 C, 8 hrs (20% weight loss) 7 92 2% ozone,180 min (600 gm-O3/kg-C) 10 89 * near-surface elemental compositions; balance sulfur Surface energy analysis in Table 2 show greatly enhanced polar contributions in carbon black samples ozonated under the same conditions used for fly ash carbon. Air oxidation at 440 C is also seen to increase surface polarity and to decrease adsorptivity, but to a lesser extent than ozonation. The dispersive component of surface energy is observed to increase as well, though only slightly, so the net effect of oxidation is a rather large increase in total surface energy (polar plus dispersive). Figure 1 shows that the effect of ozonation is similar for two model surfactants as for the for the commrecial AEA that has been used in the studies to date3.
Table 2 Surface energies* of carbon black samples oxidized under similar conditions to the fly ash carbon.
surface dispersive polar surfactant Sample energy component component adsorpt. (mJ/m2) (mJ/m2) (mJ/m2) (ml) . Untreated c arbon black 21.8 20.9 0.9 10 air oxidized a t 440 C, 8 hrs 27.0 22.7 4.3 3.5 2% ozone,90 min (430 gm-O3/kg-C) 32.4 24.4 8.1 2 * determined by Owens-Wendt theory4 using benzyl alcohol and nitromethane as standard reference liquids.
0
0.2
0.4
0.6
0.8
1
A/Ao
raw ozone,DarexAEA
ozone,SDS
ozone,Tergitol
Figure 1. Effect of ozonation on the foam index of carbon black using three different surfactants: Darex II (resin-derived AEA), SDS (commercial anionic), Tergitol (commercial non-ionic). A/Ao is the adsorptivity determined by titration divided by the adsorptivity of the sample prior to ozonation.
Fuel Chemistry Division Preprints 2002, 47(2), 843

Fuel Chemistry Division Preprints 2002, 47(2), 844
Table 3 shows the effect of ozonation on total surface area. For ash #1, total area (by N2 BET) is not materially affected by ozonation. Ash #2 shows significant area reduction, (similar to that observed by Deitz and Bitner5,6 during ozonation of charcoa), but not nearly enough to fully explain the large decreases in surfactant adsorptivity. Both surface area reduction and modification of surface chemistry are thus believed to contribute to the passivation for ash. Ozonation of carbon black produces a slight increase in area, but a similar effect on adsorptivity (see discussion).
Table 3: Properties of Raw and Ozonated Ashes Specific Surfactant Carbon Surface Ash sample Adsorptivity Area (N2 BET) (ml / gm-carbon) (m2 / gm-carbon) Ash #1, class F, from b
ituminous coal, 33% LOI 2.8 50.4
A
sh #1 ozonated 1.0 53.4
Ash #2, class F, from b
ituminous coal, 6.1% LOI 3.9 51.3
Ash #2 ozonated 0.8 38.1 A
sh #2 heavily ozonated 0.0 26.3
Ash #2 heavily ozonated 3.0 not t hen heated at 1000 oC in He measured
C
arbon black, raw 10 38
Carbon black, ozonated 2.5 40 (600 g-ozone/kg-C) Discussion At the outset of this study, there were four candidate mechanisms to explain the observed suppression of adsorptivity by ozone: 1. “pore blockage” – surface oxide formation decreases total area by physically blocking pores or pore mouths. 2. “electron withdrawal” – the addition of electronegative oxygen atoms to graphene layers withdraws electron density from the aromatic systems and reduces dispersion forces that bind the surfactant to the surface. 3. “electrostatics” – the acidic nature of most carbon surface oxides leads to a negatively charged surface in the high-pH concrete solution. The net negative surface charge repels the AEA molecules which are anionic (negatively charged) surfactants. 4. “reduction of hydrophobic forces” – introduction of oxides destroys non-polar surface area that is responsible for adsorption, leaving only polar surfaces that are hydrophilic and solvated (hydrogen bonded to water) and thus effectively unavailable for surfactant adsorption. One or more of the latter three mechanisms are often cited to explain the observed effects of surface oxidation on activated carbon adsorption from solution7. The present work allows us to evaluate these completing explanations. Mechanism 1 (pore blockage) is a likely contributor for at least some fly ash samples, since Table 3 shows a case in which ozone treatment markedly reduces total area. It is not believed to the primary mechanism, however, since carbon black exhibits the same beneficial effect of ozonation, but does not show decreases in area (see Table 3). The different area behavior of
carbon black and fly ash carbon is not surprising, since most area in carbon black is mesoporous, lying on the external surfaces of the nanoscale primary spheres, thus giving little opportunity for micropore blockage by surface oxides. Mechanism 2 (electron withdrawal) can be ruled out by the surface energy results derived from wetting studies (Table 2). Ozonation is seen to add a polar component to the surface energy without decreasing the dispersive component. Indeed the dispersive component increases slightly and the overall effect is a large increase in total surface energy. Thus we expect ozonation to slightly enhance the dispersive attractive forces for adsorption, not suppress them. Mechanism 3 (electrostatics) can be ruled out as the primary driver since the same effect of ozone is also observed when using the non-ionic surfactant Tergitol (Fig. 1). This uncharged molecule should not be greatly affected by changes in net surface charge. Mechanism 4 (reduction of hydrophobic forces) is believed to the primary mechanism, in part by process of elimination and in part from basic considerations about the nature of surfactants. Unlike other soluble organics, surfactants have a highly insoluble nonpolar part (“tail”), which is strongly driven by hydrophobic forces to leave the aqueous phase. It thus collects at the air interface, chiefly in bubble cavities, and on any other available non-polar surface. Because of its very low solubility (high hydrophobic forces) we believe the surfactant is not particularly selective about the nature of the non-polar surface and does not require strong adsorption interactions. Indeed in the case of the air interface the surfactant molecules collect by hydrophobic forces alone, with no attractive forces present between the surfactant and the interface whatsoever. We therefore believe that the adsorptivity of carbon is directly related to the fraction of its surface that is non-polar regardless of its other characteristics. Ozonation destroys this non-polar surface and replaces it with oxidic surface that is hydrophilic and capable of strong hydrogen bonding with the solvent. Since adsorption from solution is intrinsically a competitive process in which the surfactant and solvent (water) compete for sites, the water molecules have a strong advantage over the surfactant molecules on oxide-covered surfaces and the overall effect is supression of the surfactant adsorptivity.
Acknowledgments. Financial support for this work was provided by the U.S. Department of Energy's National Energy Technology Laboratory, Award DE-FC26-OONT40907 and by the Electric Power Research Institute. Any opinions, findings, conclusions, or recommendations expressed herein are those of the authors and do not necessaril7y reflect the views of the DOE. References 1 . Helmuth, R. Fly Ash in Cement and Concrete, The Dolch, W.L., in
Concrete Admixtures Handbook, Second Addition, (Ramachandran, Ed.), Noyes Publications, Park Ridge, New Jersey, 1995.
2. Freeman, E., Gao, Y.M., Hurt, R.H., Suuberg, E.M. Fuel, 1997, 76:761-765.
3. Gao, Y., Kulaots, I., Chen, X., Aggarway., R., Mehta, A., Suuberg, E.M., Hurt, R.H., Fuel 2001 80 765-768.
4. Owens, D.K.; Wendt, R.C., J. Applied Polymer Sci., 1969, 13, 1741. 5. Dietz, V.R., Bitner, J.L., Carbon 1972; 10:145-154. 6. Dietz, V.R., Bitner, J.L., Carbon 1973: 11:393-401. 7. Radovic, L.R., Moreno-Castilla, C., Rivera,Utrilla, J., in Chemistry and
Physics of Carbon, Vol. 27, Marcell Dekker: New York, 2001.

FORMS OF AMMONIA ON SCR, SNCR, AND FGC COMBUSTION ASHES
Table 1. Chemical Characterization of Study Ashes
SCR SNCR FGC ppm NH3 680 330 245 %C 0.9 32.2 6.9 %H 0.08 0.07 0.04 %N 0.01 0.5 0.06 %S 0.9 0.3 0.2 LOI 4.8 28.6 8.1
Aurora M Rubel
University of Kentucky
Center for Applied Energy Research 2540 Research Park Drive
Lexington, KY 40511 Introduction The ammonia evolution profiles from the SCR, SNCR, and FGC
ashes are shown in Figure 1. Different ammonia release patterns were found consistent with previous results from our laboratory1-3. Onset temperatures for ammonia evolution form the three ashes were 200, 260, and 300oC for SCR, FGC, and SNCR ashes respectively. In all cases, SO2, a decomposition product of sulfate, was determined by MS to be the primary gas released from the ash which was associated with ammonia.
An understanding of the forms of ammonia captured by combustion fly ash in response to selective catalytic reduction (SCR), selective non-catalytic reduction (SNCR), and flue gas conditioning (FGC) for ESP particulate separation conditions has been the focus of work at the Center for Applied Energy Research. The thermal release properties of ammonia from 8 ashes produced at power plants using SCR, SNCR, and FGC conditions were found to have widely different onset and peak evolution temperatures suggesting different forms of captured ammonia1. A study of two ashes, one produced under SCR and the other under SNCR conditions confirmed significantly different onset and peak thermal release temperatures as well as major differences in the associations between ammonia, sulfate, and residual carbon and ammonia thermal release rates2. Further work to understand the influence of SCR and SNCR in determining the form of ammonia captured by combustion ashes indicated that ammonia was primarily associated with sulfate in both SCR and SNCR ashes. The ammonia in SCR ash was less stable showing changes in its association with sulfate and thermal release properties with the length of time from combustion; whereas, ammonia in SNCR ash remained relatively unchanged 3.
T e m p e ra tu re , o C1 0 0 2 0 0 3 0 0 4 0 0 5 0 0 6 0 0
amu
17/1
8 ra
tio
0 .2 0
0 .2 5
0 .3 0
0 .3 5
0 .4 0
0 .4 5
0 .5 0
0 .5 5
S N C R
S C R
F G C
The focus of the current work was to identify the specific form of ammonia in SCR, SNCR, and FGC ashes and to investigate the influence of the ash matrix on the thermal release of the captured ammonia. Comparisons were made between ammonia released from ash, ammonium salts and salts blended with model matrices.
Figure 1. Ammonia evolution from SNCR, FGC, and SCR ashes.
Previous work suggested the two likely candidates for the ammonia storage vehicle in combustion ash is AHS or AS1-3. Therefore, these two ammonium salts and their mixtures in model matrices, alumina and ammonia-free ash, were subject to the same heating regimes as the ashes (Figure 2 and 3). The concentration of the ammonia in the blends was 500 ppm so as to be in the same concentration range as the ashes. In order to avoid problems associated with overwhelming the MS detectors and from the condensation of SO2 in the heated capillary transfer line from the TG furnace to the MS, only 2 mg of the pure salts were heated. Both these factors can affect the detected ammonia release properties. These issues and the integrity of samples of AS and AHS used in a previous study1, raised concern about the validity of our earlier results for the ammonia release temperatures for these salts. Newly acquired chemicals were, therefore, used in this study. AHS alone decomposed at a higher temperature than AS. Ammonia release started at 390oC vs 210oC for AS. This was a reversal of previous results which indicated a lower decomposition temperature for AHS and justified our concerns with the ammonium salts previously used in our laboratory. Presently, a number of ammonium sulfates from different sources are being compared.
Experimental
Materials. Three ashes were used from utilities employing either SCR, SNCR, or FGC. The ashes were kept in airtight containers from collection and throughout the study. Materials used as model substrates were alumina and ash heated to 900oC in a muffle furnace. Recently purchased 99.9% pure ammonium hydrogen sulfate (AHS) and ammonium sulfate (AS) were used alone and blended to 500 ppm NH3 with the model substrates.
Analytical Methods. The ash samples were subjected to ammonia determinations by an ion selective electrode method4. Elemental analysis for C, H, N, S and loss on ignition (LOI) determinations were done by standard procedures.
The thermal properties of ammonia release from the ashes, pure salts, and the blends were determined by thermal analysis – mass spectrometry (TG-MS) using a Netzsch Jupiter STA 449C thermal analyzer coupled to a Balzer Thermostar QMS. The sample size was 500 mg for the ashes and salt blends and 2 mg for the pure salts. Other TG conditions have been previously described1-3. Each sample was run in triplicate to confirm reproducibility.
Mass spectra were acquired every 10 seconds in multiple ion detection (MID) mode. Identification of ammonia was done by calculating the ratio of the MS signals for mass 17 (primary mass for ammonia) divided by mass 18 (primary mass for water).
Decomposition of AHS only occurred in one step both with respect to weight loss and detection of ammonia by the MS. However, blending with either alumina or ash markedly changed the
Results and Discussion
The chemical characterization of the combustion ashes is shown in Table 1.
Fuel Chemistry Division Preprints 2002, 47(2), 834
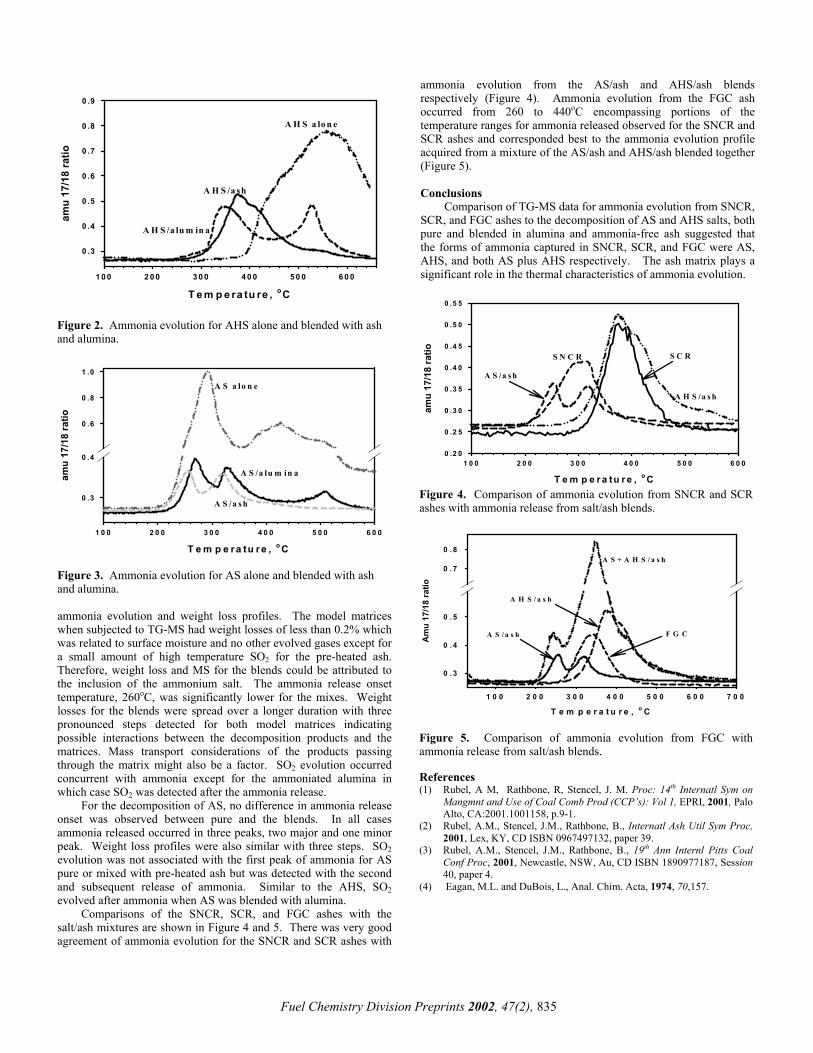
T e m p e ra tu re , oC1 0 0 2 0 0 3 0 0 4 0 0 5 0 0 6 0 0
amu
17/1
8 ra
tio
0 .3
0 .4
0 .5
0 .6
0 .7
0 .8
0 .9
A H S /a lu m in a
A H S /a sh
A H S a lo n e
Fuel Chemistry Division Preprints 2002, 47(2), 835
Figure 2. Ammonia evolution for AHS alone and blended with ash and alumina.
T e m p e ra tu r e , o C1 0 0 2 0 0 3 0 0 4 0 0 5 0 0 6 0 0
amu
17/1
8 ra
tio
0 .3
0 .4
0 .6
0 .8
1 .0
A S /a s h
A S /a lu m in a
A S a lo n e
Figure 3. Ammonia evolution for AS alone and blended with ash and alumina. ammonia evolution and weight loss profiles. The model matrices when subjected to TG-MS had weight losses of less than 0.2% which was related to surface moisture and no other evolved gases except for a small amount of high temperature SO2 for the pre-heated ash. Therefore, weight loss and MS for the blends could be attributed to the inclusion of the ammonium salt. The ammonia release onset temperature, 260oC, was significantly lower for the mixes. Weight losses for the blends were spread over a longer duration with three pronounced steps detected for both model matrices indicating possible interactions between the decomposition products and the matrices. Mass transport considerations of the products passing through the matrix might also be a factor. SO2 evolution occurred concurrent with ammonia except for the ammoniated alumina in which case SO2 was detected after the ammonia release.
For the decomposition of AS, no difference in ammonia release onset was observed between pure and the blends. In all cases ammonia released occurred in three peaks, two major and one minor peak. Weight loss profiles were also similar with three steps. SO2 evolution was not associated with the first peak of ammonia for AS pure or mixed with pre-heated ash but was detected with the second and subsequent release of ammonia. Similar to the AHS, SO2 evolved after ammonia when AS was blended with alumina.
Comparisons of the SNCR, SCR, and FGC ashes with the salt/ash mixtures are shown in Figure 4 and 5. There was very good agreement of ammonia evolution for the SNCR and SCR ashes with
ammonia evolution from the AS/ash and AHS/ash blends respectively (Figure 4). Ammonia evolution from the FGC ash occurred from 260 to 440oC encompassing portions of the temperature ranges for ammonia released observed for the SNCR and SCR ashes and corresponded best to the ammonia evolution profile acquired from a mixture of the AS/ash and AHS/ash blended together (Figure 5). Conclusions
Comparison of TG-MS data for ammonia evolution from SNCR, SCR, and FGC ashes to the decomposition of AS and AHS salts, both pure and blended in alumina and ammonia-free ash suggested that the forms of ammonia captured in SNCR, SCR, and FGC were AS, AHS, and both AS plus AHS respectively. The ash matrix plays a significant role in the thermal characteristics of ammonia evolution.
T e m p e r a tu r e , o C1 0 0 2 0 0 3 0 0 4 0 0 5 0 0 6 0 0
amu
17/1
8 ra
tio
0 .2 0
0 .2 5
0 .3 0
0 .3 5
0 .4 0
0 .4 5
0 .5 0
0 .5 5
S N C R S C R
A S /a s h
A H S /a s h
Figure 4. Comparison of ammonia evolution from SNCR and SCR ashes with ammonia release from salt/ash blends.
T e m p e r a t u r e , o C
1 0 0 2 0 0 3 0 0 4 0 0 5 0 0 6 0 0 7 0 0
Am
u 17
/18
ratio
0 . 3
0 . 4
0 . 5
0 . 7
0 . 8A S + A H S / a s h
F G C
A H S / a s h
A S / a s h
Figure 5. Comparison of ammonia evolution from FGC with ammonia release from salt/ash blends. References (1) Rubel, A M, Rathbone, R, Stencel, J. M. Proc: 14th Internatl Sym on
Mangmnt and Use of Coal Comb Prod (CCP’s): Vol 1, EPRI, 2001, Palo Alto, CA:2001.1001158, p.9-1.
(2) Rubel, A.M., Stencel, J.M., Rathbone, B., Internatl Ash Util Sym Proc, 2001, Lex, KY, CD ISBN 0967497132, paper 39.
(3) Rubel, A.M., Stencel, J.M., Rathbone, B., 19th Ann Internl Pitts Coal Conf Proc, 2001, Newcastle, NSW, Au, CD ISBN 1890977187, Session 40, paper 4.
(4) Eagan, M.L. and DuBois, L., Anal. Chim. Acta, 1974, 70,157.
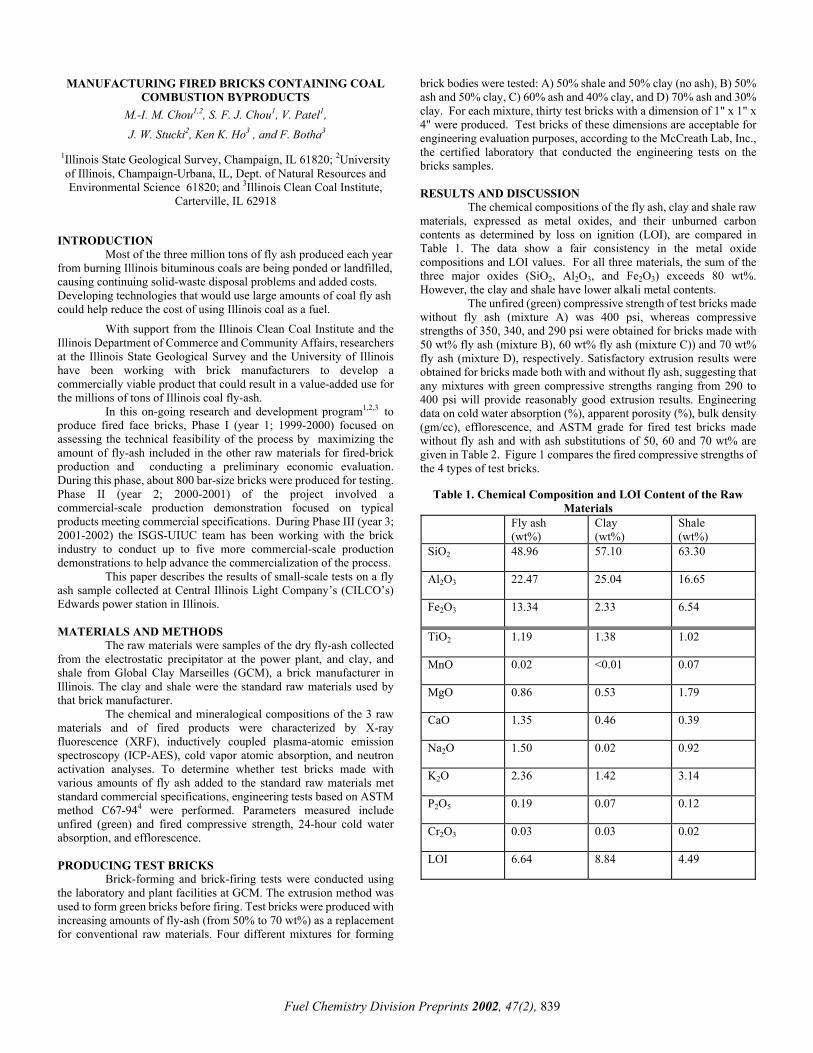
MANUFACTURING FIRED BRICKS CONTAINING COAL COMBUSTION BYPRODUCTS
M.-I. M. Chou1,2, S. F. J. Chou1, V. Patel1,
J. W. Stucki2, Ken K. Ho3 , and F. Botha3
1Illinois State Geological Survey, Champaign, IL 61820; 2University of Illinois, Champaign-Urbana, IL, Dept. of Natural Resources and Environmental Science 61820; and 3Illinois Clean Coal Institute,
Carterville, IL 62918
INTRODUCTION Most of the three million tons of fly ash produced each year from burning Illinois bituminous coals are being ponded or landfilled, causing continuing solid-waste disposal problems and added costs. Developing technologies that would use large amounts of coal fly ash could help reduce the cost of using Illinois coal as a fuel.
With support from the Illinois Clean Coal Institute and the Illinois Department of Commerce and Community Affairs, researchers at the Illinois State Geological Survey and the University of Illinois have been working with brick manufacturers to develop a commercially viable product that could result in a value-added use for the millions of tons of Illinois coal fly-ash. In this on-going research and development program1,2,3 to produce fired face bricks, Phase I (year 1; 1999-2000) focused on assessing the technical feasibility of the process by maximizing the amount of fly-ash included in the other raw materials for fired-brick production and conducting a preliminary economic evaluation. During this phase, about 800 bar-size bricks were produced for testing. Phase II (year 2; 2000-2001) of the project involved a commercial-scale production demonstration focused on typical products meeting commercial specifications. During Phase III (year 3; 2001-2002) the ISGS-UIUC team has been working with the brick industry to conduct up to five more commercial-scale production demonstrations to help advance the commercialization of the process. This paper describes the results of small-scale tests on a fly ash sample collected at Central Illinois Light Company’s (CILCO’s) Edwards power station in Illinois. MATERIALS AND METHODS The raw materials were samples of the dry fly-ash collected from the electrostatic precipitator at the power plant, and clay, and shale from Global Clay Marseilles (GCM), a brick manufacturer in Illinois. The clay and shale were the standard raw materials used by that brick manufacturer. The chemical and mineralogical compositions of the 3 raw materials and of fired products were characterized by X-ray fluorescence (XRF), inductively coupled plasma-atomic emission spectroscopy (ICP-AES), cold vapor atomic absorption, and neutron activation analyses. To determine whether test bricks made with various amounts of fly ash added to the standard raw materials met standard commercial specifications, engineering tests based on ASTM method C67-944 were performed. Parameters measured include unfired (green) and fired compressive strength, 24-hour cold water absorption, and efflorescence. PRODUCING TEST BRICKS Brick-forming and brick-firing tests were conducted using the laboratory and plant facilities at GCM. The extrusion method was used to form green bricks before firing. Test bricks were produced with increasing amounts of fly-ash (from 50% to 70 wt%) as a replacement for conventional raw materials. Four different mixtures for forming
brick bodies were tested: A) 50% shale and 50% clay (no ash), B) 50% ash and 50% clay, C) 60% ash and 40% clay, and D) 70% ash and 30% clay. For each mixture, thirty test bricks with a dimension of 1" x 1" x 4" were produced. Test bricks of these dimensions are acceptable for engineering evaluation purposes, according to the McCreath Lab, Inc., the certified laboratory that conducted the engineering tests on the bricks samples. RESULTS AND DISCUSSION The chemical compositions of the fly ash, clay and shale raw materials, expressed as metal oxides, and their unburned carbon contents as determined by loss on ignition (LOI), are compared in Table 1. The data show a fair consistency in the metal oxide compositions and LOI values. For all three materials, the sum of the three major oxides (SiO2, Al2O3, and Fe2O3) exceeds 80 wt%. However, the clay and shale have lower alkali metal contents. The unfired (green) compressive strength of test bricks made without fly ash (mixture A) was 400 psi, whereas compressive strengths of 350, 340, and 290 psi were obtained for bricks made with 50 wt% fly ash (mixture B), 60 wt% fly ash (mixture C)) and 70 wt% fly ash (mixture D), respectively. Satisfactory extrusion results were obtained for bricks made both with and without fly ash, suggesting that any mixtures with green compressive strengths ranging from 290 to 400 psi will provide reasonably good extrusion results. Engineering data on cold water absorption (%), apparent porosity (%), bulk density (gm/cc), efflorescence, and ASTM grade for fired test bricks made without fly ash and with ash substitutions of 50, 60 and 70 wt% are given in Table 2. Figure 1 compares the fired compressive strengths of the 4 types of test bricks.
Table 1. Chemical Composition and LOI Content of the Raw Materials
Fly ash (wt%)
Clay (wt%)
Shale (wt%)
SiO2 48.96 57.10 63.30
Al2O3 22.47 25.04 16.65
Fe2O3 13.34 2.33 6.54
TiO2 1.19 1.38 1.02
MnO 0.02 <0.01 0.07
MgO 0.86 0.53 1.79
CaO 1.35 0.46 0.39
Na2O 1.50 0.02 0.92
K2O 2.36 1.42 3.14
P2O5 0.19 0.07 0.12
Cr2O3 0.03 0.03 0.02
LOI 6.64 8.84 4.49
Fuel Chemistry Division Preprints 20 02, 47(2), 839
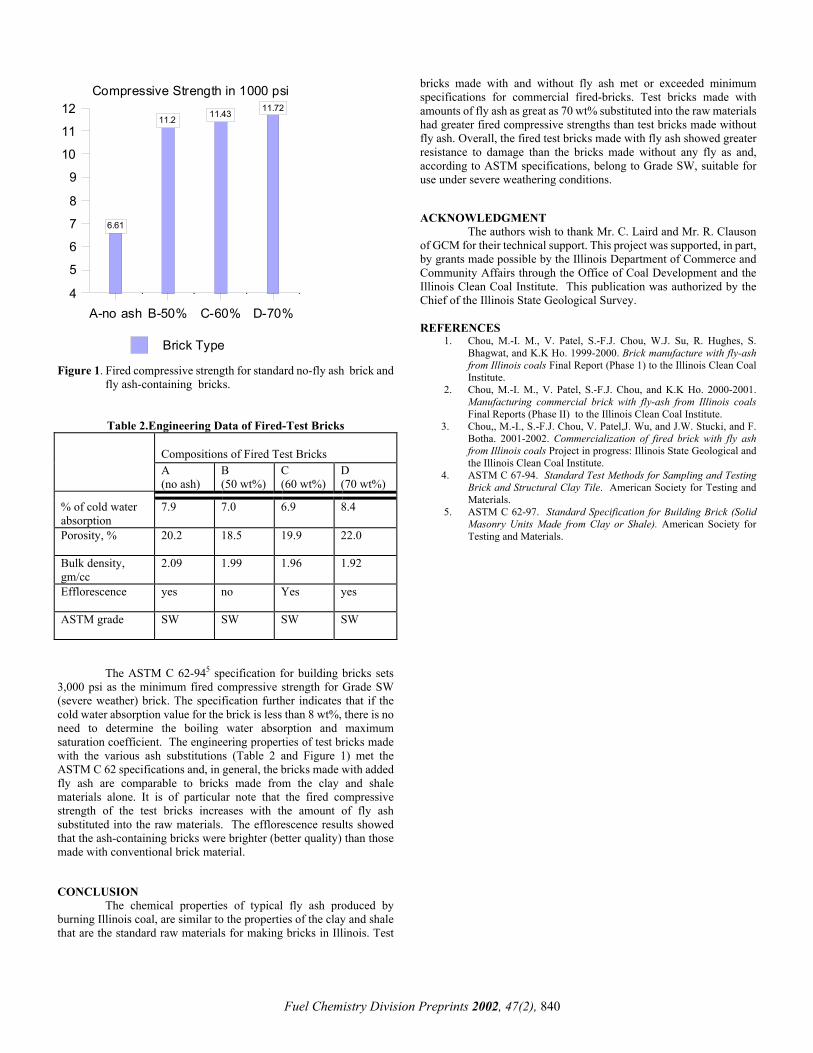
6.61
11.2 11.43 11.72
A-no ash B-50% C-60% D-70%4
5
6
7
8
9
10
11
12
Brick Type
Compressive Strength in 1000 psi
Fuel Chemistry Division Preprints 20 02, 47(2), 840
Figure 1. Fired compressive strength for standard no-fly ash brick and fly ash-containing bricks.
Table 2.Engineering Data of Fired-Test Bricks
Compositions of Fired Test Bricks
A (no ash)
B (50 wt%)
C (60 wt%)
D (70 wt%)
% of cold water absorption
7.9 7.0 6.9 8.4
Porosity, % 20.2 18.5 19.9 22.0
Bulk density, gm/cc
2.09 1.99 1.96 1.92
Efflorescence yes no Yes yes
ASTM grade SW SW SW SW
The ASTM C 62-945 specification for building bricks sets 3,000 psi as the minimum fired compressive strength for Grade SW (severe weather) brick. The specification further indicates that if the cold water absorption value for the brick is less than 8 wt%, there is no need to determine the boiling water absorption and maximum saturation coefficient. The engineering properties of test bricks made with the various ash substitutions (Table 2 and Figure 1) met the ASTM C 62 specifications and, in general, the bricks made with added fly ash are comparable to bricks made from the clay and shale materials alone. It is of particular note that the fired compressive strength of the test bricks increases with the amount of fly ash substituted into the raw materials. The efflorescence results showed that the ash-containing bricks were brighter (better quality) than those made with conventional brick material. CONCLUSION The chemical properties of typical fly ash produced by burning Illinois coal, are similar to the properties of the clay and shale that are the standard raw materials for making bricks in Illinois. Test
bricks made with and without fly ash met or exceeded minimum specifications for commercial fired-bricks. Test bricks made with amounts of fly ash as great as 70 wt% substituted into the raw materials had greater fired compressive strengths than test bricks made without fly ash. Overall, the fired test bricks made with fly ash showed greater resistance to damage than the bricks made without any fly as and, according to ASTM specifications, belong to Grade SW, suitable for use under severe weathering conditions. ACKNOWLEDGMENT The authors wish to thank Mr. C. Laird and Mr. R. Clauson of GCM for their technical support. This project was supported, in part, by grants made possible by the Illinois Department of Commerce and Community Affairs through the Office of Coal Development and the Illinois Clean Coal Institute. This publication was authorized by the Chief of the Illinois State Geological Survey. REFERENCES
1. Chou, M.-I. M., V. Patel, S.-F.J. Chou, W.J. Su, R. Hughes, S. Bhagwat, and K.K Ho. 1999-2000. Brick manufacture with fly-ash from Illinois coals Final Report (Phase 1) to the Illinois Clean Coal Institute.
2. Chou, M.-I. M., V. Patel, S.-F.J. Chou, and K.K Ho. 2000-2001. Manufacturing commercial brick with fly-ash from Illinois coals Final Reports (Phase II) to the Illinois Clean Coal Institute.
3. Chou,, M.-I., S.-F.J. Chou, V. Patel,J. Wu, and J.W. Stucki, and F. Botha. 2001-2002. Commercialization of fired brick with fly ash from Illinois coals Project in progress: Illinois State Geological and the Illinois Clean Coal Institute.
4. ASTM C 67-94. Standard Test Methods for Sampling and Testing Brick and Structural Clay Tile. American Society for Testing and Materials.
5. ASTM C 62-97. Standard Specification for Building Brick (Solid Masonry Units Made from Clay or Shale). American Society for Testing and Materials.
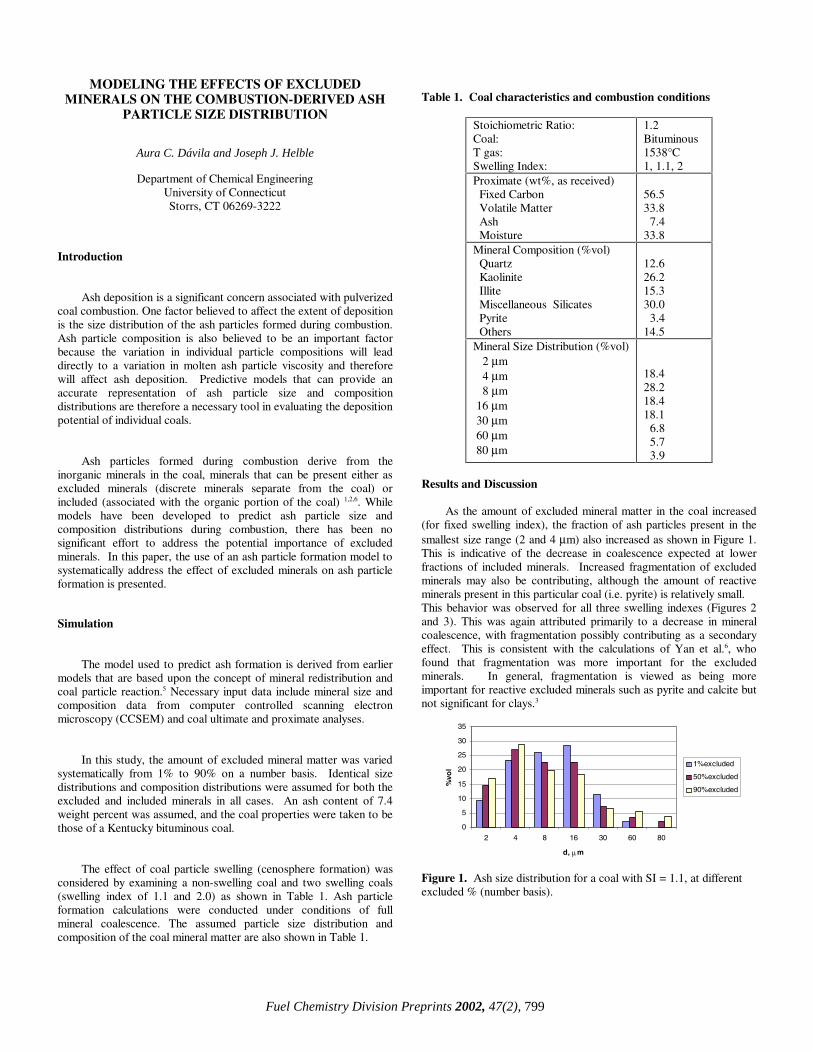
Fuel Chemistry Division Preprints 2002, 47(2), 799
MODELING THE EFFECTS OF EXCLUDED MINERALS ON THE COMBUSTION-DERIVED ASH
PARTICLE SIZE DISTRIBUTION
Aura C. Dávila and Joseph J. Helble
Department of Chemical Engineering University of Connecticut Storrs, CT 06269-3222
Introduction
Ash deposition is a significant concern associated with pulverized coal combustion. One factor believed to affect the extent of deposition is the size distribution of the ash particles formed during combustion. Ash particle composition is also believed to be an important factor because the variation in individual particle compositions will lead directly to a variation in molten ash particle viscosity and therefore will affect ash deposition. Predictive models that can provide an accurate representation of ash particle size and composition distributions are therefore a necessary tool in evaluating the deposition potential of individual coals.
Ash particles formed during combustion derive from the
inorganic minerals in the coal, minerals that can be present either as excluded minerals (discrete minerals separate from the coal) or included (associated with the organic portion of the coal) 1,2,6. While models have been developed to predict ash particle size and composition distributions during combustion, there has been no significant effort to address the potential importance of excluded minerals. In this paper, the use of an ash particle formation model to systematically address the effect of excluded minerals on ash particle formation is presented.
Simulation
The model used to predict ash formation is derived from earlier models that are based upon the concept of mineral redistribution and coal particle reaction.5 Necessary input data include mineral size and composition data from computer controlled scanning electron microscopy (CCSEM) and coal ultimate and proximate analyses.
In this study, the amount of excluded mineral matter was varied
systematically from 1% to 90% on a number basis. Identical size distributions and composition distributions were assumed for both the excluded and included minerals in all cases. An ash content of 7.4 weight percent was assumed, and the coal properties were taken to be those of a Kentucky bituminous coal.
The effect of coal particle swelling (cenosphere formation) was
considered by examining a non-swelling coal and two swelling coals (swelling index of 1.1 and 2.0) as shown in Table 1. Ash particle formation calculations were conducted under conditions of full mineral coalescence. The assumed particle size distribution and composition of the coal mineral matter are also shown in Table 1.
Table 1. Coal characteristics and combustion conditions
Stoichiometric Ratio: Coal: T gas: Swelling Index:
1.2 Bituminous 1538°C 1, 1.1, 2
Proximate (wt%, as received) Fixed Carbon Volatile Matter Ash Moisture
56.5 33.8 7.4 33.8
Mineral Composition (%vol) Quartz Kaolinite Illite Miscellaneous Silicates Pyrite Others
12.6 26.2 15.3 30.0 3.4 14.5
Mineral Size Distribution (%vol) 2 µm 4 µm 8 µm 16 µm 30 µm 60 µm 80 µm
18.4 28.2 18.4 18.1 6.8 5.7 3.9
Results and Discussion
As the amount of excluded mineral matter in the coal increased
(for fixed swelling index), the fraction of ash particles present in the smallest size range (2 and 4 µm) also increased as shown in Figure 1. This is indicative of the decrease in coalescence expected at lower fractions of included minerals. Increased fragmentation of excluded minerals may also be contributing, although the amount of reactive minerals present in this particular coal (i.e. pyrite) is relatively small. This behavior was observed for all three swelling indexes (Figures 2 and 3). This was again attributed primarily to a decrease in mineral coalescence, with fragmentation possibly contributing as a secondary effect. This is consistent with the calculations of Yan et al.6, who found that fragmentation was more important for the excluded minerals. In general, fragmentation is viewed as being more important for reactive excluded minerals such as pyrite and calcite but not significant for clays.3
0
5
10
15
20
25
30
35
2 4 8 16 30 60 80
d, µm
%vo
l
1%excluded
50%excluded
90%excluded
Figure 1. Ash size distribution for a coal with SI = 1.1, at different excluded % (number basis).

Fuel Chemistry Division Preprints 2002, 47(2), 800
0
5
10
15
20
25
30
35
2 4 8 16 30 60 80
d, µ m
%vo
l 1%excluded
90%excluded
Figure 2. Ash size distribution for a non-swelling coal (SI = 1.0), at different % excluded (number basis).
0.00
5.00
10.00
15.00
20.00
25.00
30.00
35.00
2 4 8 16 30 60 80
d, µ m
% v
ol 1% excluded
90% excluded
Figure 3. Ash particle size distribution for a swelling coal (SI = 2.0), at different % excluded (number basis).
As expected, changes in the fraction of excluded mineral matter also affected the composition distribution of the resulting ash. The aluminosilicate category (SiAl) represents aluminosilicate derived ash particles that have no third element (for example, K or Ca) present at concentrations greater than 6%. As coalescence increases, the amount of such ash particles is therefore expected to increase. Examining the data in Figure 4, there is a clear decrease in aluminosilicates (SiAl) as the fraction of excluded mineral matter increases. The higher concentrations of excluded minerals thus allows for increased retention of silicates (Si) and other associations like potassium aluminosilicates (SiAlK) and iron aluminosilicates (SiAlFe).
0
10
20
30
40
50
60
70
80
SiAl Si SiAlK SiAlFe Fe Others
%vo
l
Minerals
1%
50%
90%
Figure 4. Ash composition for a swelling coal (SI = 1.1), at different % excluded (number basis). Notes: - “Miscellaneous silicate” minerals were included as SiAlFe. - “Others” include miscellaneous carbonates, phosphates and sulfates; siderite and calcite.
Comparing the concentrations of specific ash particle types with the parent minerals (i.e., comparing illite with the SiAlK in the ash), it is clear that at higher concentrations of excluded mineral matter, the amount in the ash remains relatively constant. At an excluded mineral matter concentration of 50% the change becomes insignificant. Significant interaction between iron and aluminosilicates was observed, but this was only slightly influenced by the amount of excluded minerals.
When comparing the three swelling indexes analyzed, at a higher
swelling index, the amount of small particles (2µm) increased. The explanation for this is that the more highly swelled chars are allowed to fragment more readily.
This study varies the amount of excluded minerals, considering
the same mineral distribution for both excluded and included minerals. Some authors, however, have reported that the size distribution of the included minerals is finer than that of the excluded minerals6. Other authors have concluded the opposite4. The former study was made with an Australian high-rank coal (Newlands). The latter study was based on analysis of eighteen coals from the UK, US, South America, South Africa and Australia. Australian and South African coals showed more mineral-organic association than British and North American coals. In all of the coals from this latter study, excluded minerals were between 3 and 19 wt% of the total mineral matter, with median sizes of about 4-7 µm and top sizes of 40-70 µm. (finer size distribution than included particles). A study including the effects of these different size distributions is underway. Conclusions
The effect of the amount of excluded mineral particles on the coal-derived ash particle size was examined. As the amount of excluded mineral matter increased, an increase in the amount of the smallest ash particles was observed. This was attributed to a decrease in the extent of coalescence of the smallest minerals. As excluded mineral matter amounts increased, larger concentrations of silicates, and potassium and iron aluminosilicates were observed as a result of their lack of transformation (“dilution”) into aluminosilicate particles.
Acknowledgements. The generous financial support of the
DOE is gratefully acknowledged. References (1) Benson, S. Jones, M. Harb, J. In Fundamentals of coal combustion: for
clean and efficient use. Elsevier, 1993. pp. 299-373 (2) Rusell, N. Mendez, L. Wigley, F. Williamson, J. Fuel. 2002, 81,p. 657-
663. (3) Sarofim, A. Helble, J. In The Impact of Ash Deposition on Coal Fired
Plants. J. Williamson, and F. Wigley. 1994, ,pp. 583-597. (4) Wigley, F. Williamson, J. Gibb, W. Fuel. 1997, 76, p 1283-1288. (5) Wilemski, G. Srinivasachar, S. Proc of Eng Foundation Conference. June
1993. p 151-164. (6) Yan, L. Gupta, R. Wall, T. Fuel. 2002, 81,p. 337-344.
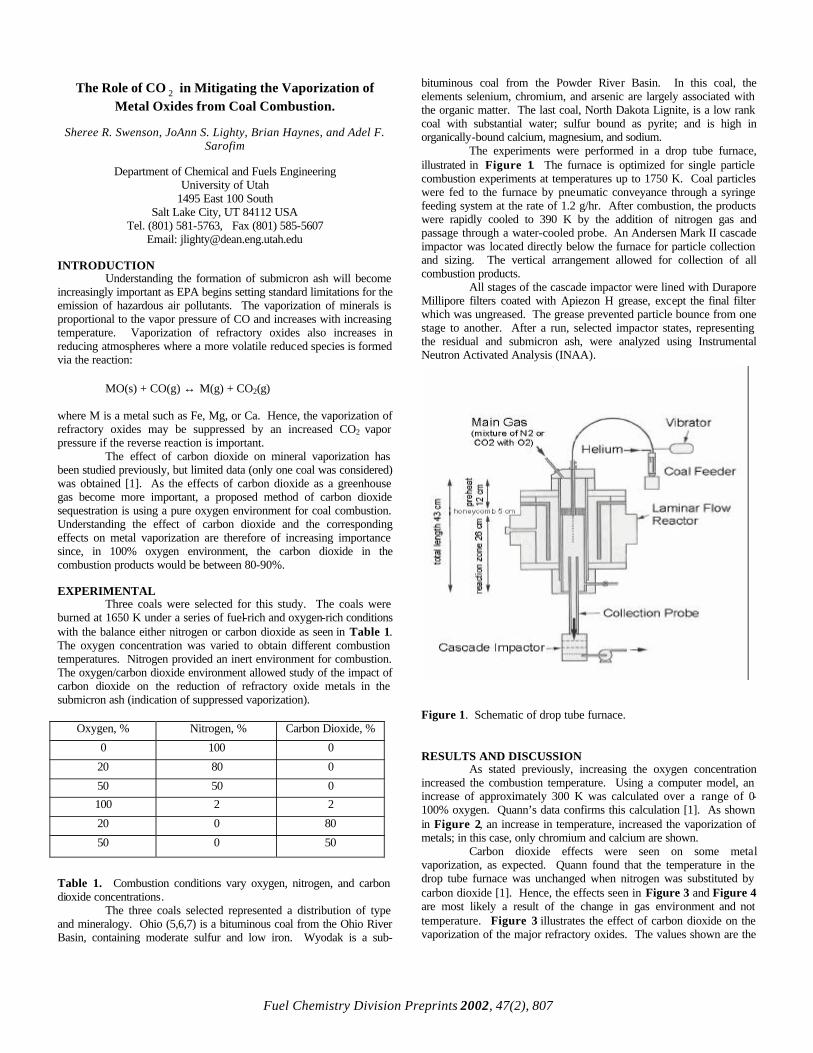
Fuel Chemistry Division Preprints 2002, 47(2), 807
The Role of CO 2 in Mitigating the Vaporization of Metal Oxides from Coal Combustion.
Sheree R. Swenson, JoAnn S. Lighty, Brian Haynes, and Adel F.
Sarofim
Department of Chemical and Fuels Engineering University of Utah
1495 East 100 South Salt Lake City, UT 84112 USA
Tel. (801) 581-5763, Fax (801) 585-5607 Email: [email protected]
INTRODUCTION
Understanding the formation of submicron ash will become increasingly important as EPA begins setting standard limitations for the emission of hazardous air pollutants. The vaporization of minerals is proportional to the vapor pressure of CO and increases with increasing temperature. Vaporization of refractory oxides also increases in reducing atmospheres where a more volatile reduced species is formed via the reaction:
MO(s) + CO(g) ↔ M(g) + CO2(g) where M is a metal such as Fe, Mg, or Ca. Hence, the vaporization of refractory oxides may be suppressed by an increased CO2 vapor pressure if the reverse reaction is important.
The effect of carbon dioxide on mineral vaporization has been studied previously, but limited data (only one coal was considered) was obtained [1]. As the effects of carbon dioxide as a greenhouse gas become more important, a proposed method of carbon dioxide sequestration is using a pure oxygen environment for coal combustion. Understanding the effect of carbon dioxide and the corresponding effects on metal vaporization are therefore of increasing importance since, in 100% oxygen environment, the carbon dioxide in the combustion products would be between 80-90%. EXPERIMENTAL
Three coals were selected for this study. The coals were burned at 1650 K under a series of fuel-rich and oxygen-rich conditions with the balance either nitrogen or carbon dioxide as seen in Table 1. The oxygen concentration was varied to obtain different combustion temperatures. Nitrogen provided an inert environment for combustion. The oxygen/carbon dioxide environment allowed study of the impact of carbon dioxide on the reduction of refractory oxide metals in the submicron ash (indication of suppressed vaporization).
Table 1. Combustion conditions vary oxygen, nitrogen, and carbon dioxide concentrations.
The three coals selected represented a distribution of type and mineralogy. Ohio (5,6,7) is a bituminous coal from the Ohio River Basin, containing moderate sulfur and low iron. Wyodak is a sub-
bituminous coal from the Powder River Basin. In this coal, the elements selenium, chromium, and arsenic are largely associated with the organic matter. The last coal, North Dakota Lignite, is a low rank coal with substantial water; sulfur bound as pyrite; and is high in organically-bound calcium, magnesium, and sodium.
The experiments were performed in a drop tube furnace, illustrated in Figure 1. The furnace is optimized for single particle combustion experiments at temperatures up to 1750 K. Coal particles were fed to the furnace by pneumatic conveyance through a syringe feeding system at the rate of 1.2 g/hr. After combustion, the products were rapidly cooled to 390 K by the addition of nitrogen gas and passage through a water-cooled probe. An Andersen Mark II cascade impactor was located directly below the furnace for particle collection and sizing. The vertical arrangement allowed for collection of all combustion products.
All stages of the cascade impactor were lined with Durapore Millipore filters coated with Apiezon H grease, except the final filter which was ungreased. The grease prevented particle bounce from one stage to another. After a run, selected impactor states, representing the residual and submicron ash, were analyzed using Instrumental Neutron Activated Analysis (INAA).
Figure 1. Schematic of drop tube furnace. RESULTS AND DISCUSSION
As stated previously, increasing the oxygen concentration increased the combustion temperature. Using a computer model, an increase of approximately 300 K was calculated over a range of 0-100% oxygen. Quann’s data confirms this calculation [1]. As shown in Figure 2, an increase in temperature, increased the vaporization of metals; in this case, only chromium and calcium are shown.
Carbon dioxide effects were seen on some metal vaporization, as expected. Quann found that the temperature in the drop tube furnace was unchanged when nitrogen was substituted by carbon dioxide [1]. Hence, the effects seen in Figure 3 and Figure 4 are most likely a result of the change in gas environment and not temperature. Figure 3 illustrates the effect of carbon dioxide on the vaporization of the major refractory oxides. The values shown are the
Oxygen, % Nitrogen, % Carbon Dioxide, %
0 100 0
20 80 0
50 50 0
100 2 2
20 0 80
50 0 50
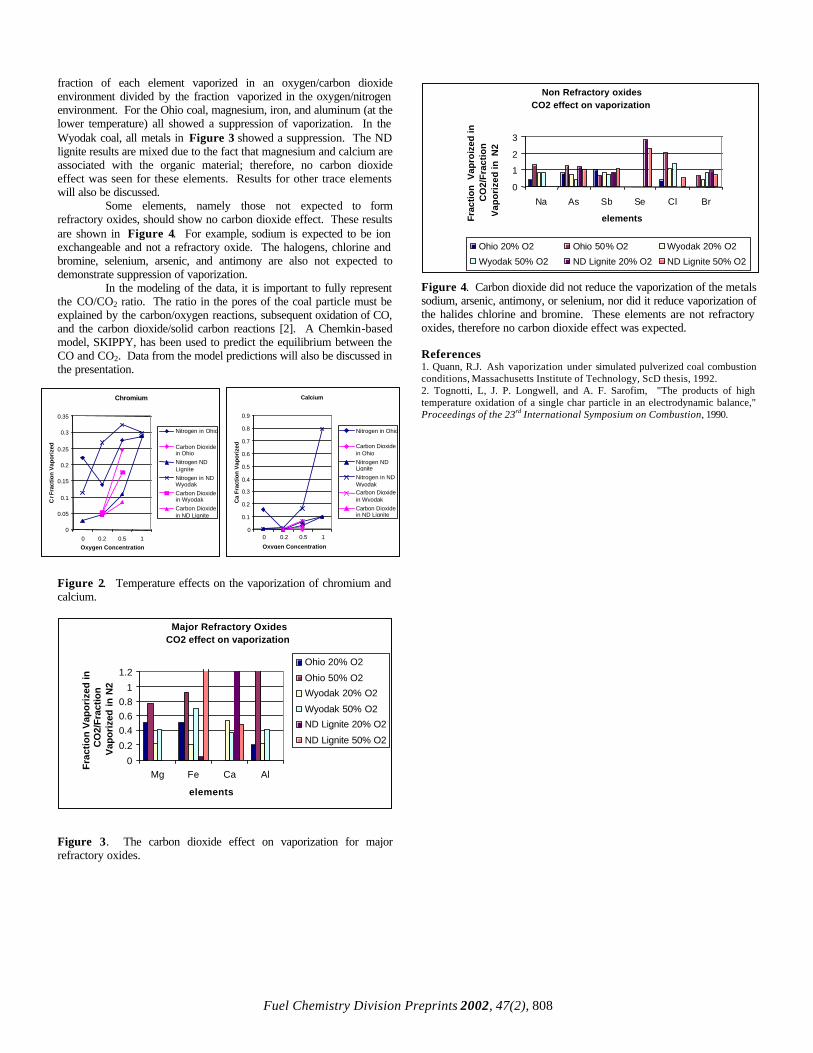
Fuel Chemistry Division Preprints 2002, 47(2), 808
fraction of each element vaporized in an oxygen/carbon dioxide environment divided by the fraction vaporized in the oxygen/nitrogen environment. For the Ohio coal, magnesium, iron, and aluminum (at the lower temperature) all showed a suppression of vaporization. In the Wyodak coal, all metals in Figure 3 showed a suppression. The ND lignite results are mixed due to the fact that magnesium and calcium are associated with the organic material; therefore, no carbon dioxide effect was seen for these elements. Results for other trace elements will also be discussed.
Some elements, namely those not expected to form refractory oxides, should show no carbon dioxide effect. These results are shown in Figure 4. For example, sodium is expected to be ion exchangeable and not a refractory oxide. The halogens, chlorine and bromine, selenium, arsenic, and antimony are also not expected to demonstrate suppression of vaporization.
In the modeling of the data, it is important to fully represent the CO/CO2 ratio. The ratio in the pores of the coal particle must be explained by the carbon/oxygen reactions, subsequent oxidation of CO, and the carbon dioxide/solid carbon reactions [2]. A Chemkin-based model, SKIPPY, has been used to predict the equilibrium between the CO and CO2. Data from the model predictions will also be discussed in the presentation.
Figure 2. Temperature effects on the vaporization of chromium and calcium.
Figure 3. The carbon dioxide effect on vaporization for major refractory oxides.
Figure 4. Carbon dioxide did not reduce the vaporization of the metals sodium, arsenic, antimony, or selenium, nor did it reduce vaporization of the halides chlorine and bromine. These elements are not refractory oxides, therefore no carbon dioxide effect was expected. References 1. Quann, R.J. Ash vaporization under simulated pulverized coal combustion conditions, Massachusetts Institute of Technology, ScD thesis, 1992. 2. Tognotti, L, J. P. Longwell, and A. F. Sarofim, "The products of high temperature oxidation of a single char particle in an electrodynamic balance," Proceedings of the 23rd International Symposium on Combustion, 1990.
Major Refractory OxidesCO2 effect on vaporization
0
0.2
0.40.60.8
1
1.2
Mg Fe Ca Al
elements
Fra
ctio
n V
apo
rize
d in
C
O2/
Frac
tion
Vap
oriz
ed in
N2
Ohio 20% O2
Ohio 50% O2
Wyodak 20% O2
Wyodak 50% O2
ND Lignite 20% O2
ND Lignite 50% O2
Chromium
0
0.05
0.1
0.15
0.2
0.25
0.3
0.35
0 0.2 0.5 1 Oxygen Concentration
Cr F
ract
ion
Vap
ori
zed
Nitrogen in Ohio
Carbon Dioxide in Ohio Nitrogen ND Lignite Nitrogen in ND Wyodak Carbon Dioxide in Wyodak Carbon Dioxide in ND Lignite
Calcium
0
0.1
0.2
0.3
0.4
0.5
0.6
0.7
0.8
0.9
0 0.2 0.5 1
Oxygen Concentration
Ca
Fra
ctio
n V
apo
rize
d
Nitrogen in Ohio
Carbon Dioxide in Ohio Nitrogen ND Lignite Nitrogen in ND Wyodak Carbon Dioxide in Wyodak Carbon Dioxide in ND Lignite
Non Refractory oxides CO2 effect on vaporization
0 1 2 3
Na As Sb Se Cl Br elements F
ract
ion
Vap
roiz
ed in
C
O2/
Fra
ctio
n
Vap
ori
zed
in N
2
Ohio 20% O2 Ohio 50% O2 Wyodak 20% O2 Wyodak 50% O2 ND Lignite 20% O2 ND Lignite 50% O2

Size Distribution of Unburned Carbon in Coal Fly Ash and its Role in Foam Index Foam Index Test
The Foam Index test is the commonly employed field test for determining the suitability of a particular fly ash as a concrete additive. The purpose of the test is to determine what is equivalent to a titration endpoint for adsorption of the AEA on a particular ash. When the ash has taken up the amount of AEA needed to fully saturate all adsorption sites, “normal” surfactant behavior can be observed, and the test solution supports a stable foam on its surface. Generally speaking, the more surfactant that is needed for titration, the poorer the performance of the ash is likely to be in the field.
Indrek Külaots, Robert H. Hurt, Eric M. Suuberg
Division of Engineering
Brown University Providence, RI 02912 USA
Tel. (401) 863-1420, Fax (401) 863-1157 Email: [email protected]
INTRODUCTION In the present work, Darex II™ from Grace Construction
Products was utilized as the AEA. The Foam Index tests involved placing two grams of fly ash, 8 grams of Portland cement and 25 ml of deionized water into a 70 ml cylindrical jar with a 40 mm I.D. The jar was capped and thoroughly shaken for one minute to completely wet the cement and ash. A 10 vol.-% aqueous solution of AEA was then added one drop (0.02 ml) at time from a pipette gun. After addition of each drop the jar was capped and shaken for approximately 15 seconds, following which the lid was removed and the liquid surface was observed. Before the endpoint of the test, the foam on the liquid surface was unstable. The endpoint was taken to occur when foam was stable on the surface at least 45 seconds. A blank value was measured using only Portland cement in water. Subtraction of the blank value from the actual test results gave the reported foam index (FI) value for the fly ash (in ml, per two grams of ash). In this study, these FI values are typically converted to specific foam index (SFI) values, which are expressed as ml AEA solution adsorbed per gram of carbon in the sample.
The American Coal Ash Association recently reported that the U.S. production of coal combustion products (CCP) was over 108 million tons, of which almost 30% was beneficially utilized (2000 figures) [1,2]. Of the total production of CCP, fly ash represented roughly 60%, and of the beneficial uses of CCP, fly ash utilization represented almost 2/3 of the total. More than half of the ash was utilized as a cement or concrete additive and this was clearly the dominant market for the ash. The utilization of fly ash in concrete permits partial replacement of Portland cement in the mix, and is beneficial to the properties of the concrete due to the pozzolanic properties of the fly ash [3,4,5]. Widespread introduction of low-NOx burners has, however, often resulted in increases in fly ash carbon contents, and in significant decreases in marketability of some ashes [6-8]. The problems derive from both the often higher levels of unburned carbon produced in the low-NOx combustion environments, as well as from the variability of the carbon content and its nature [9-21]. The problem of unburned carbon in fly ash is associated with the use of special surfactants in concrete mixtures. These surfactants impart freeze-thaw resistance to concrete by entraining air bubbles into the mixture [22]. These air entraining agents (AEAs) can, however, be adsorbed by any unburned carbon in fly ash which is added to the concrete mixture, destroying freeze-thaw resistance. There is some debate about factors other than carbon that might influence foam index results [23].
RESULTS AND DISCUSSION Representative ash size distribution data are shown in Figure 1. These data show clearly that the bulk of the ash is smaller than 100 µm in size. The results are generally similar to what has been reported in an earlier study [28]. Using the LOI values, the contribution of the different fractions to carbon content could be calculated. These results are shown in Figure 2. The generally employed field test for AEA adsorption
capacity is the so-called “foam index” test, described below. Higher AEA adsorption capacity is associated with a higher value of the foam index. Both surface area and polarity play a role in determining foam index [24].
0
10203040
506070
d<45
45<d
<106
106<
d<18
0
180<
d<35
5
d>35
5
Loss
FA21FA22FA74FA41FA66
Mas
s Pe
rcen
t
Figure 1. Fly ash mass distribution into different size fractions (in µm).
EXPERIMENTAL Samples and Their Preparation Five class F and four class C fly ash samples have been selected for testing. These samples have been obtained from utilities (or ash brokers) throughout the U.S. The samples are FA 21 (class F, 6.1% LOI), FA 22 (class F, LOI 33.6%), FA 24 (Class F, LOI 2.7%), FA 26 (class F, LOI 4.0%), FA 74 (class F, LOI 9.8%), FA 41 (class C, LOI 1.1%), FA 65 (class C, LOI 0.74%), FA 66 (class C, LOI 0.92%) and FA 75 (class C, LOI 1.3%). Fly ashes were mechanically sieved in 150 g batches. Standard U.S. testing sieves were used (ASTM E-11 specification sieves 45, 75, 140, and 325, with nominal openings of 355, 180, 106 and 45 µm, respectively). Loss-on-ignition (LOI) tests were performed on 1 gram samples of the whole ash and its fractions. The loss in mass at 740°C, in air, was the reported LOI, and this is assumed to be the weight of unburned carbon in the original sample (though there is a possibility of a small amount of contribution from some slow mineral phase decomposition reactions [26].
The results of Fig. 2 show an interesting difference between class F and class C ashes. In the case of the class C ash, there is always a bimodal distribution in carbon content. In the class F ashes, only FA 24 showed a tendency in this direction, whereas all other class F samples behaved more like FA 21.
Nitrogen adsorption at 77 K was used for determining the BET surface areas of the ashes, following standard methodology [27].
Fuel Chemistry Division Preprints 2002, 47(2), 841
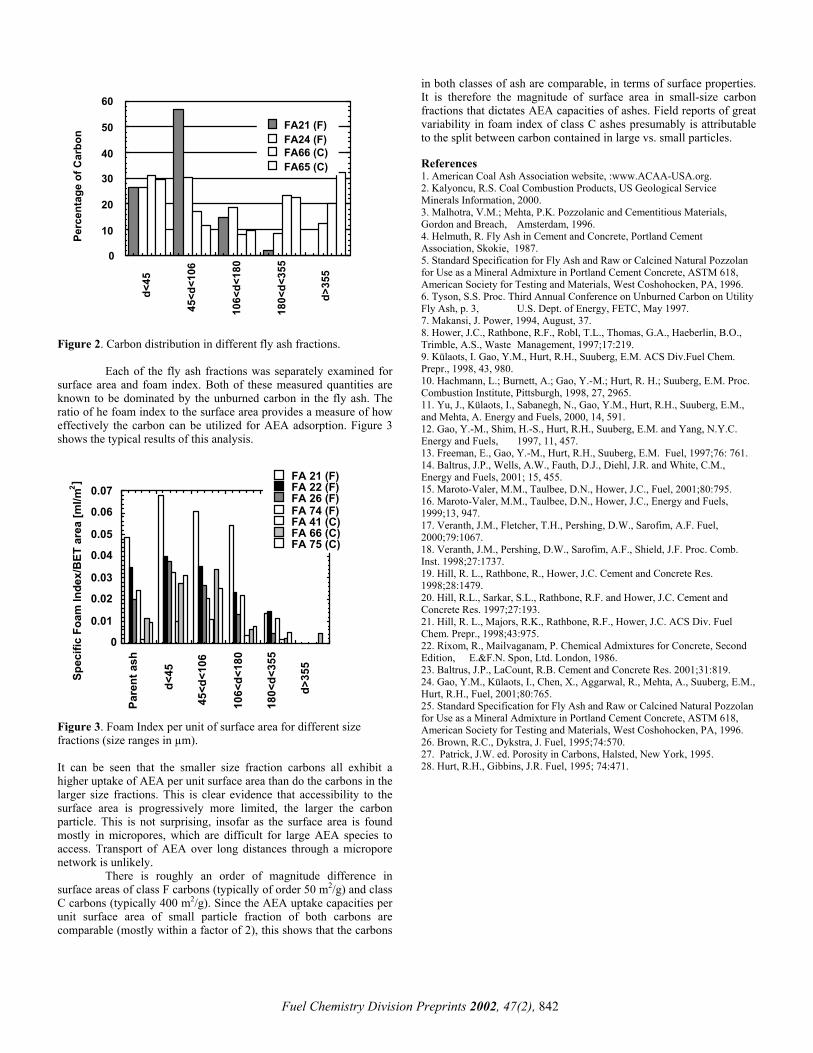
0
10
20
30
40
50
60
d<45
45<d
<106
106<
d<18
0
180<
d<35
5
d>35
5
FA21 (F)FA24 (F)FA66 (C)FA65 (C)
Perc
enta
ge o
f Car
bon
Fuel Chemistry Division Preprints 2002, 47(2), 842
Figure 2. Carbon distribution in different fly ash fractions. Each of the fly ash fractions was separately examined for surface area and foam index. Both of these measured quantities are known to be dominated by the unburned carbon in the fly ash. The ratio of he foam index to the surface area provides a measure of how effectively the carbon can be utilized for AEA adsorption. Figure 3 shows the typical results of this analysis.
0
0.01
0.02
0.03
0.04
0.05
0.06
0.07
Pare
nt a
sh
d<4
5
45<d
<106
106<
d<18
0
180<
d<35
5
d>35
5
FA 21 (F)FA 22 (F)FA 26 (F)FA 74 (F)FA 41 (C)FA 66 (C)FA 75 (C)
Spec
ific
Foam
Inde
x/B
ET a
rea
[ml/m
2 ]
Figure 3. Foam Index per unit of surface area for different size fractions (size ranges in µm). It can be seen that the smaller size fraction carbons all exhibit a higher uptake of AEA per unit surface area than do the carbons in the larger size fractions. This is clear evidence that accessibility to the surface area is progressively more limited, the larger the carbon particle. This is not surprising, insofar as the surface area is found mostly in micropores, which are difficult for large AEA species to access. Transport of AEA over long distances through a micropore network is unlikely.
There is roughly an order of magnitude difference in surface areas of class F carbons (typically of order 50 m2/g) and class C carbons (typically 400 m2/g). Since the AEA uptake capacities per unit surface area of small particle fraction of both carbons are comparable (mostly within a factor of 2), this shows that the carbons
in both classes of ash are comparable, in terms of surface properties. It is therefore the magnitude of surface area in small-size carbon fractions that dictates AEA capacities of ashes. Field reports of great variability in foam index of class C ashes presumably is attributable to the split between carbon contained in large vs. small particles. References 1. American Coal Ash Association website, :www.ACAA-USA.org. 2. Kalyoncu, R.S. Coal Combustion Products, US Geological Service Minerals Information, 2000. 3. Malhotra, V.M.; Mehta, P.K. Pozzolanic and Cementitious Materials, Gordon and Breach, Amsterdam, 1996. 4. Helmuth, R. Fly Ash in Cement and Concrete, Portland Cement Association, Skokie, 1987. 5. Standard Specification for Fly Ash and Raw or Calcined Natural Pozzolan for Use as a Mineral Admixture in Portland Cement Concrete, ASTM 618, American Society for Testing and Materials, West Coshohocken, PA, 1996. 6. Tyson, S.S. Proc. Third Annual Conference on Unburned Carbon on Utility Fly Ash, p. 3, U.S. Dept. of Energy, FETC, May 1997. 7. Makansi, J. Power, 1994, August, 37. 8. Hower, J.C., Rathbone, R.F., Robl, T.L., Thomas, G.A., Haeberlin, B.O., Trimble, A.S., Waste Management, 1997;17:219. 9. Külaots, I. Gao, Y.M., Hurt, R.H., Suuberg, E.M. ACS Div.Fuel Chem. Prepr., 1998, 43, 980. 10. Hachmann, L.; Burnett, A.; Gao, Y.-M.; Hurt, R. H.; Suuberg, E.M. Proc. Combustion Institute, Pittsburgh, 1998, 27, 2965. 11. Yu, J., Külaots, I., Sabanegh, N., Gao, Y.M., Hurt, R.H., Suuberg, E.M., and Mehta, A. Energy and Fuels, 2000, 14, 591. 12. Gao, Y.-M., Shim, H.-S., Hurt, R.H., Suuberg, E.M. and Yang, N.Y.C. Energy and Fuels, 1997, 11, 457. 13. Freeman, E., Gao, Y.-M., Hurt, R.H., Suuberg, E.M. Fuel, 1997;76: 761. 14. Baltrus, J.P., Wells, A.W., Fauth, D.J., Diehl, J.R. and White, C.M., Energy and Fuels, 2001; 15, 455. 15. Maroto-Valer, M.M., Taulbee, D.N., Hower, J.C., Fuel, 2001;80:795. 16. Maroto-Valer, M.M., Taulbee, D.N., Hower, J.C., Energy and Fuels, 1999;13, 947. 17. Veranth, J.M., Fletcher, T.H., Pershing, D.W., Sarofim, A.F. Fuel, 2000;79:1067. 18. Veranth, J.M., Pershing, D.W., Sarofim, A.F., Shield, J.F. Proc. Comb. Inst. 1998;27:1737. 19. Hill, R. L., Rathbone, R., Hower, J.C. Cement and Concrete Res. 1998;28:1479. 20. Hill, R.L., Sarkar, S.L., Rathbone, R.F. and Hower, J.C. Cement and Concrete Res. 1997;27:193. 21. Hill, R. L., Majors, R.K., Rathbone, R.F., Hower, J.C. ACS Div. Fuel Chem. Prepr., 1998;43:975. 22. Rixom, R., Mailvaganam, P. Chemical Admixtures for Concrete, Second Edition, E.&F.N. Spon, Ltd. London, 1986. 23. Baltrus, J.P., LaCount, R.B. Cement and Concrete Res. 2001;31:819. 24. Gao, Y.M., Külaots, I., Chen, X., Aggarwal, R., Mehta, A., Suuberg, E.M., Hurt, R.H., Fuel, 2001;80:765. 25. Standard Specification for Fly Ash and Raw or Calcined Natural Pozzolan for Use as a Mineral Admixture in Portland Cement Concrete, ASTM 618, American Society for Testing and Materials, West Coshohocken, PA, 1996. 26. Brown, R.C., Dykstra, J. Fuel, 1995;74:570. 27. Patrick, J.W. ed. Porosity in Carbons, Halsted, New York, 1995. 28. Hurt, R.H., Gibbins, J.R. Fuel, 1995; 74:471.
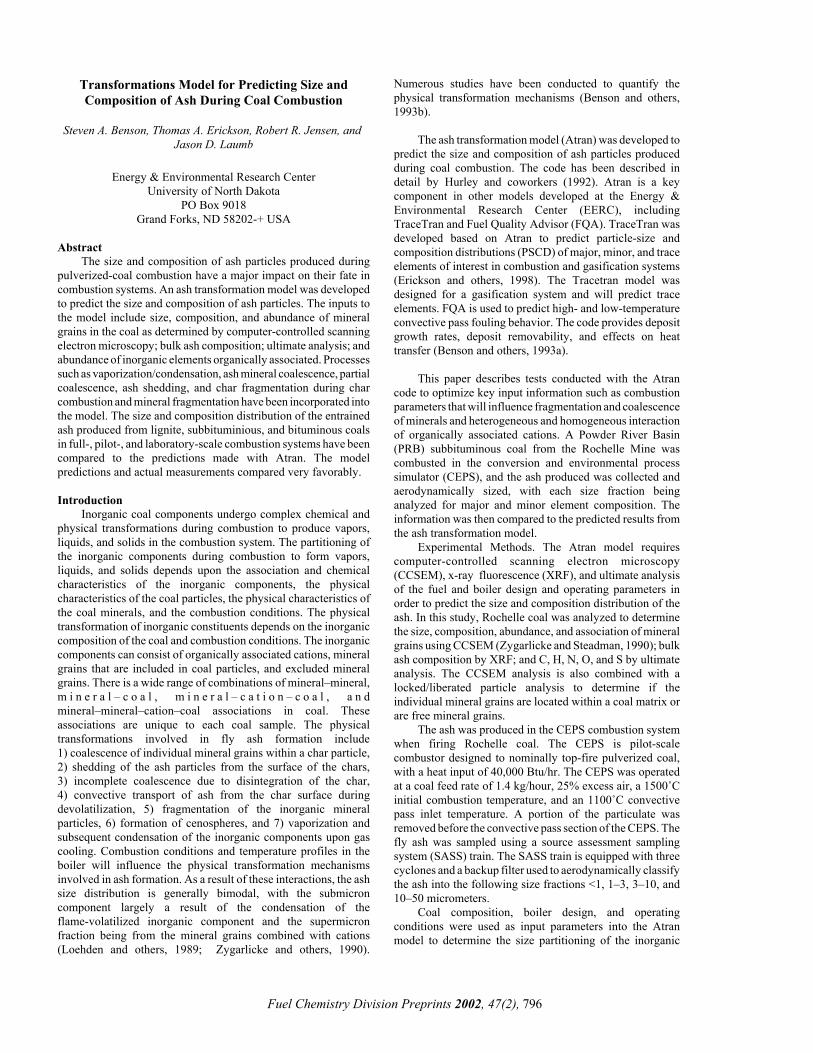
Fuel Chemistry Division Preprints 2002, 47(2), 796
Transformations Model for Predicting Size andComposition of Ash During Coal Combustion
Steven A. Benson, Thomas A. Erickson, Robert R. Jensen, and Jason D. Laumb
Energy & Environmental Research CenterUniversity of North Dakota
PO Box 9018Grand Forks, ND 58202-+ USA
AbstractThe size and composition of ash particles produced during
pulverized-coal combustion have a major impact on their fate incombustion systems. An ash transformation model was developedto predict the size and composition of ash particles. The inputs tothe model include size, composition, and abundance of mineralgrains in the coal as determined by computer-controlled scanningelectron microscopy; bulk ash composition; ultimate analysis; andabundance of inorganic elements organically associated. Processessuch as vaporization/condensation, ash mineral coalescence, partialcoalescence, ash shedding, and char fragmentation during charcombustion and mineral fragmentation have been incorporated intothe model. The size and composition distribution of the entrainedash produced from lignite, subbituminious, and bituminous coalsin full-, pilot-, and laboratory-scale combustion systems have beencompared to the predictions made with Atran. The modelpredictions and actual measurements compared very favorably.
IntroductionInorganic coal components undergo complex chemical and
physical transformations during combustion to produce vapors,liquids, and solids in the combustion system. The partitioning ofthe inorganic components during combustion to form vapors,liquids, and solids depends upon the association and chemicalcharacteristics of the inorganic components, the physicalcharacteristics of the coal particles, the physical characteristics ofthe coal minerals, and the combustion conditions. The physicaltransformation of inorganic constituents depends on the inorganiccomposition of the coal and combustion conditions. The inorganiccomponents can consist of organically associated cations, mineralgrains that are included in coal particles, and excluded mineralgrains. There is a wide range of combinations of mineral–mineral,m i n e r a l – c o a l , m i n e r a l – c a t i o n – c o a l , a n dmineral–mineral–cation–coal associations in coal. Theseassociations are unique to each coal sample. The physicaltransformations involved in fly ash formation include1) coalescence of individual mineral grains within a char particle,2) shedding of the ash particles from the surface of the chars,3) incomplete coalescence due to disintegration of the char,4) convective transport of ash from the char surface duringdevolatilization, 5) fragmentation of the inorganic mineralparticles, 6) formation of cenospheres, and 7) vaporization andsubsequent condensation of the inorganic components upon gascooling. Combustion conditions and temperature profiles in theboiler will influence the physical transformation mechanismsinvolved in ash formation. As a result of these interactions, the ashsize distribution is generally bimodal, with the submicroncomponent largely a result of the condensation of theflame-volatilized inorganic component and the supermicronfraction being from the mineral grains combined with cations(Loehden and others, 1989; Zygarlicke and others, 1990).
Numerous studies have been conducted to quantify thephysical transformation mechanisms (Benson and others,1993b).
The ash transformation model (Atran) was developed topredict the size and composition of ash particles producedduring coal combustion. The code has been described indetail by Hurley and coworkers (1992). Atran is a keycomponent in other models developed at the Energy &Environmental Research Center (EERC), includingTraceTran and Fuel Quality Advisor (FQA). TraceTran wasdeveloped based on Atran to predict particle-size andcomposition distributions (PSCD) of major, minor, and traceelements of interest in combustion and gasification systems(Erickson and others, 1998). The Tracetran model wasdesigned for a gasification system and will predict traceelements. FQA is used to predict high- and low-temperatureconvective pass fouling behavior. The code provides depositgrowth rates, deposit removability, and effects on heattransfer (Benson and others, 1993a).
This paper describes tests conducted with the Atrancode to optimize key input information such as combustionparameters that will influence fragmentation and coalescenceof minerals and heterogeneous and homogeneous interactionof organically associated cations. A Powder River Basin(PRB) subbituminous coal from the Rochelle Mine wascombusted in the conversion and environmental processsimulator (CEPS), and the ash produced was collected andaerodynamically sized, with each size fraction beinganalyzed for major and minor element composition. Theinformation was then compared to the predicted results fromthe ash transformation model.
Experimental Methods. The Atran model requirescomputer-controlled scanning electron microscopy(CCSEM), x-ray fluorescence (XRF), and ultimate analysisof the fuel and boiler design and operating parameters inorder to predict the size and composition distribution of theash. In this study, Rochelle coal was analyzed to determinethe size, composition, abundance, and association of mineralgrains using CCSEM (Zygarlicke and Steadman, 1990); bulkash composition by XRF; and C, H, N, O, and S by ultimateanalysis. The CCSEM analysis is also combined with alocked/liberated particle analysis to determine if theindividual mineral grains are located within a coal matrix orare free mineral grains.
The ash was produced in the CEPS combustion systemwhen firing Rochelle coal. The CEPS is pilot-scalecombustor designed to nominally top-fire pulverized coal,with a heat input of 40,000 Btu/hr. The CEPS was operatedat a coal feed rate of 1.4 kg/hour, 25% excess air, a 1500/Cinitial combustion temperature, and an 1100/C convectivepass inlet temperature. A portion of the particulate wasremoved before the convective pass section of the CEPS. Thefly ash was sampled using a source assessment samplingsystem (SASS) train. The SASS train is equipped with threecyclones and a backup filter used to aerodynamically classifythe ash into the following size fractions <1, 1–3, 3–10, and10–50 micrometers.
Coal composition, boiler design, and operatingconditions were used as input parameters into the Atranmodel to determine the size partitioning of the inorganic
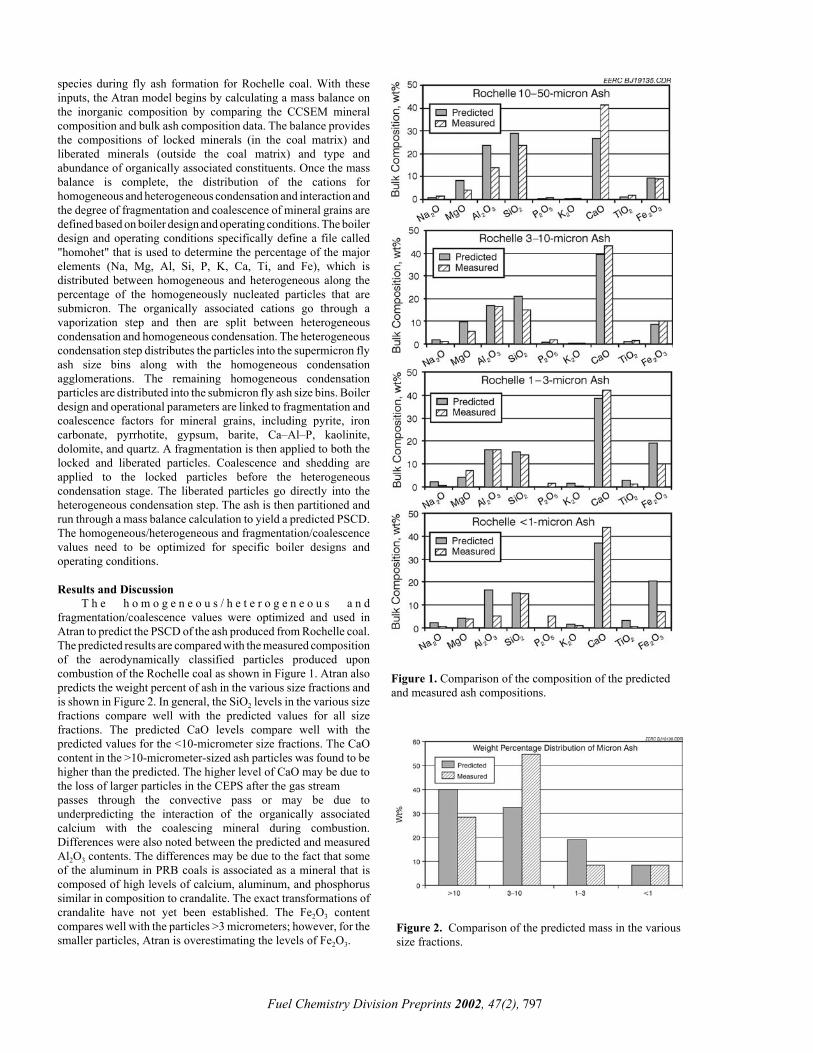
Fuel Chemistry Division Preprints 2002, 47(2), 797
Figure 2. Comparison of the predicted mass in the varioussize fractions.
Figure 1. Comparison of the composition of the predictedand measured ash compositions.
species during fly ash formation for Rochelle coal. With theseinputs, the Atran model begins by calculating a mass balance onthe inorganic composition by comparing the CCSEM mineralcomposition and bulk ash composition data. The balance providesthe compositions of locked minerals (in the coal matrix) andliberated minerals (outside the coal matrix) and type andabundance of organically associated constituents. Once the massbalance is complete, the distribution of the cations forhomogeneous and heterogeneous condensation and interaction andthe degree of fragmentation and coalescence of mineral grains aredefined based on boiler design and operating conditions. The boilerdesign and operating conditions specifically define a file called"homohet" that is used to determine the percentage of the majorelements (Na, Mg, Al, Si, P, K, Ca, Ti, and Fe), which isdistributed between homogeneous and heterogeneous along thepercentage of the homogeneously nucleated particles that aresubmicron. The organically associated cations go through avaporization step and then are split between heterogeneouscondensation and homogeneous condensation. The heterogeneouscondensation step distributes the particles into the supermicron flyash size bins along with the homogeneous condensationagglomerations. The remaining homogeneous condensationparticles are distributed into the submicron fly ash size bins. Boilerdesign and operational parameters are linked to fragmentation andcoalescence factors for mineral grains, including pyrite, ironcarbonate, pyrrhotite, gypsum, barite, Ca–Al–P, kaolinite,dolomite, and quartz. A fragmentation is then applied to both thelocked and liberated particles. Coalescence and shedding areapplied to the locked particles before the heterogeneouscondensation stage. The liberated particles go directly into theheterogeneous condensation step. The ash is then partitioned andrun through a mass balance calculation to yield a predicted PSCD.The homogeneous/heterogeneous and fragmentation/coalescencevalues need to be optimized for specific boiler designs andoperating conditions.
Results and DiscussionT h e h o m o g e n e o u s / h e t e r o g e n e o u s a n d
fragmentation/coalescence values were optimized and used inAtran to predict the PSCD of the ash produced from Rochelle coal.The predicted results are compared with the measured compositionof the aerodynamically classified particles produced uponcombustion of the Rochelle coal as shown in Figure 1. Atran alsopredicts the weight percent of ash in the various size fractions andis shown in Figure 2. In general, the SiO2 levels in the various sizefractions compare well with the predicted values for all sizefractions. The predicted CaO levels compare well with thepredicted values for the <10-micrometer size fractions. The CaOcontent in the >10-micrometer-sized ash particles was found to behigher than the predicted. The higher level of CaO may be due tothe loss of larger particles in the CEPS after the gas stream passes through the convective pass or may be due tounderpredicting the interaction of the organically associatedcalcium with the coalescing mineral during combustion.Differences were also noted between the predicted and measuredAl2O3 contents. The differences may be due to the fact that someof the aluminum in PRB coals is associated as a mineral that iscomposed of high levels of calcium, aluminum, and phosphorussimilar in composition to crandalite. The exact transformations ofcrandalite have not yet been established. The Fe2O3 contentcompares well with the particles >3 micrometers; however, for thesmaller particles, Atran is overestimating the levels of Fe2O3.
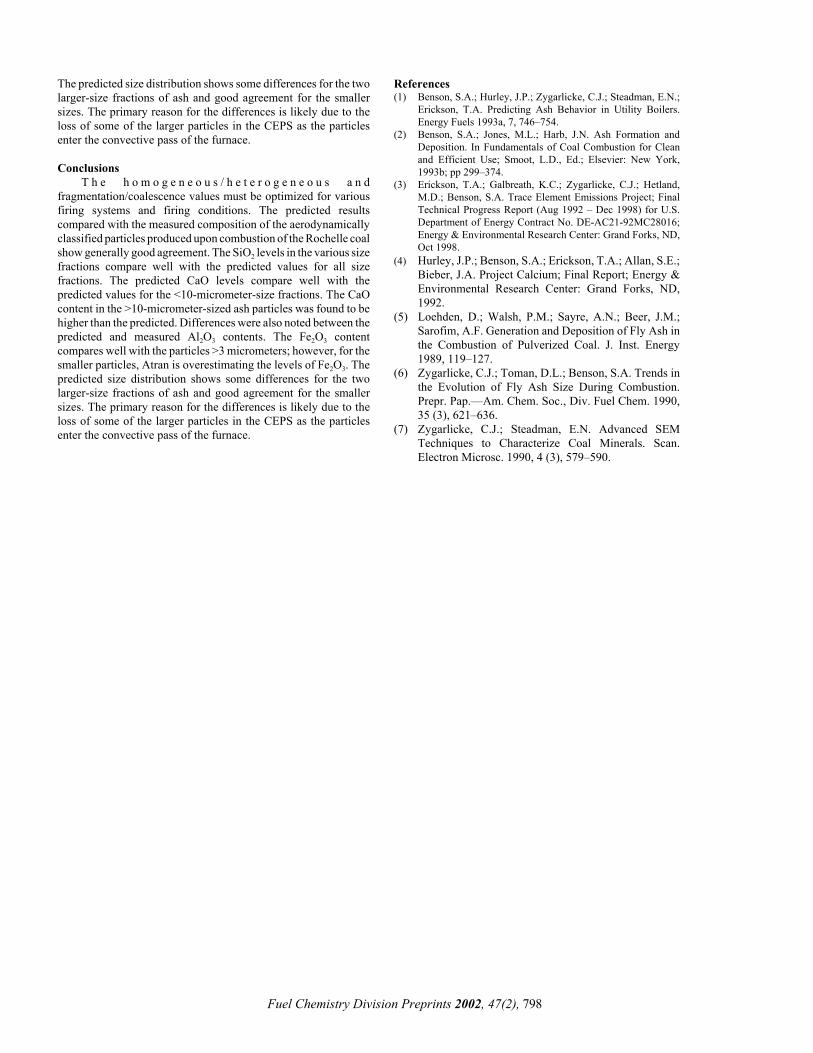
Fuel Chemistry Division Preprints 2002, 47(2), 798
The predicted size distribution shows some differences for the twolarger-size fractions of ash and good agreement for the smallersizes. The primary reason for the differences is likely due to theloss of some of the larger particles in the CEPS as the particlesenter the convective pass of the furnace.
Conclusions T h e h o m o g e n e o u s / h e t e r o g e n e o u s a n d
fragmentation/coalescence values must be optimized for variousfiring systems and firing conditions. The predicted resultscompared with the measured composition of the aerodynamicallyclassified particles produced upon combustion of the Rochelle coalshow generally good agreement. The SiO2 levels in the various sizefractions compare well with the predicted values for all sizefractions. The predicted CaO levels compare well with thepredicted values for the <10-micrometer-size fractions. The CaOcontent in the >10-micrometer-sized ash particles was found to behigher than the predicted. Differences were also noted between thepredicted and measured Al2O3 contents. The Fe2O3 contentcompares well with the particles >3 micrometers; however, for thesmaller particles, Atran is overestimating the levels of Fe2O3. Thepredicted size distribution shows some differences for the twolarger-size fractions of ash and good agreement for the smallersizes. The primary reason for the differences is likely due to theloss of some of the larger particles in the CEPS as the particlesenter the convective pass of the furnace.
References(1) Benson, S.A.; Hurley, J.P.; Zygarlicke, C.J.; Steadman, E.N.;
Erickson, T.A. Predicting Ash Behavior in Utility Boilers.Energy Fuels 1993a, 7, 746–754.
(2) Benson, S.A.; Jones, M.L.; Harb, J.N. Ash Formation andDeposition. In Fundamentals of Coal Combustion for Cleanand Efficient Use; Smoot, L.D., Ed.; Elsevier: New York,1993b; pp 299–374.
(3) Erickson, T.A.; Galbreath, K.C.; Zygarlicke, C.J.; Hetland,M.D.; Benson, S.A. Trace Element Emissions Project; FinalTechnical Progress Report (Aug 1992 – Dec 1998) for U.S.Department of Energy Contract No. DE-AC21-92MC28016;Energy & Environmental Research Center: Grand Forks, ND,Oct 1998.
(4) Hurley, J.P.; Benson, S.A.; Erickson, T.A.; Allan, S.E.;Bieber, J.A. Project Calcium; Final Report; Energy &Environmental Research Center: Grand Forks, ND,1992.
(5) Loehden, D.; Walsh, P.M.; Sayre, A.N.; Beer, J.M.;Sarofim, A.F. Generation and Deposition of Fly Ash inthe Combustion of Pulverized Coal. J. Inst. Energy1989, 119–127.
(6) Zygarlicke, C.J.; Toman, D.L.; Benson, S.A. Trends inthe Evolution of Fly Ash Size During Combustion.Prepr. Pap.—Am. Chem. Soc., Div. Fuel Chem. 1990,35 (3), 621–636.
(7) Zygarlicke, C.J.; Steadman, E.N. Advanced SEMTechniques to Characterize Coal Minerals. Scan.Electron Microsc. 1990, 4 (3), 579–590.
Related Documents