University of Cape Town Ammonia leaching as a pre-treatment for the processing of oxidised PGM ores By Research Candidate: Kabwe Musonda Supervisors: Professor Jochen Petersen Thesis submitted in partial accomplishment of the requirements of the Master of Science in Engineering degree, Centre for Bioprocess Engineering Research, Department of Chemical Engineering, University of Cape Town February 2015

Welcome message from author
This document is posted to help you gain knowledge. Please leave a comment to let me know what you think about it! Share it to your friends and learn new things together.
Transcript
Univers
ity of
Cap
e Tow
n
Ammonia leaching as a pre-treatment for the
processing of oxidised PGM ores
By Research Candidate:
Kabwe Musonda
Supervisors:
Professor Jochen Petersen
Thesis submitted in partial accomplishment of the requirements of the
Master of Science in Engineering degree,
Centre for Bioprocess Engineering Research,
Department of Chemical Engineering,
University of Cape Town
February 2015
The copyright of this thesis vests in the author. No quotation from it or information derived from it is to be published without full acknowledgement of the source. The thesis is to be used for private study or non-commercial research purposes only.
Published by the University of Cape Town (UCT) in terms of the non-exclusive license granted to UCT by the author.
Univers
ity of
Cap
e Tow
n

i
DECLARATION
I, Kabwe Musonda, hereby declare that the work on which this thesis is based is my
original work (except where acknowledgements indicate otherwise) and that neither
the whole work nor any part of it has been, is being or is to be submitted for another
degree in this or any other university. I authorise the University to reproduce for the
purpose of research either the whole or any portion of the contents in any manner
whatsoever.
Signature ___________________________ Date ________________________
ii
Dedicated to my Mother,
Gertrude Chembe Ndashye Musonda,
With all my love
iii
ABSTRACT
The exploitation of near-surface deposits has resulted in the need to adjust current
conventional mineral processing technologies for the treatment of low grade oxidised
PGM ores. The exposure of the ore to the atmosphere leads to the formation of an
oxidation layer (consisting of base metal oxides) which inhibits the flotation process
that requires a clean mineral surface to be effective.
Previous studies have shown that an acid pre-treatment could lead to a 20% PGM
recovery increase. Due to the corrosive nature of acid, such treatment would require
additional equipment and a pre-wash. Therefore, this project investigates the use of
ammonia as a pre-treatment of oxidised low grade PGM ores. Ammonia leaching has
shown success in the extraction of base metals (94% and 91% Cu and Ni extraction)
and is used as a wash reagent in an attempt to dissolve the oxidation layer and expose
a cleaner mineral surface.
Both column leaching of whole ore and batch stirred tank reactor leaching of milled ore
were investigated as pre-treatment methods for varying length of process times, and
the material was subsequently tested for its flotation behaviour. The total solids, base
metal and PGM recoveries were monitored in order to determine the effect of the
treatment.
Due to the low extraction of base metals, less than 10%, the ammonia column
treatment was unsuccessful at dissolving the oxidation layer and hence had only
modest impact on the flotation process, with an indication that leaching treatment
rather depresses gangue flotation than enhancing valuable recovery. In comparison,
the samples treated in batch stirred tank reactors showed an actual decrease in PGM
and base metal upgrade and recovery, and flotation appeared to become entirely
unselective. It is suspected this was caused by significant residual ammonia interfering
with the flotation reagents.
Complete extraction of valuable metals (base metals and PGMs) was also investigated
using a long-term ammonia and cyanide column leach of whole ore material. This
resulted in 3%, 40% and 73% total extraction of Ni, Pt and Pd, respectively.
It was postulated that Fe oxides/hydroxides (10% wt. of the ore), which were not
leached by the ammonia, inhibit effective leaching and bubble attachment in both the
extraction and pre-treatment tests. Further, the presence of naturally floating gangue
such as talc resulted in low base metal and PGM grades. Overall, this project has

iv
shown that ammonia is not a viable option as a chemical pre-treatment for the
flotation of the low grade oxidised PGM ore investigated in this study

v
ACKNOWLEDGEMENTS
‘I aimed high, I was ambitious, I seized opportunities, I made opportunities, embraced
successes and failures but most importantly, I leaned in’
Firstly, I want to thank God, without whom none of this would be possible. Thank you
for always walking by me even when I felt alone.
Jochen, thank you for all the support and the encouragement. Your technical guidance
was invaluable. Thank you for always reminding me to breathe and relax and for
assuring me of the light at the end of the tunnel.
To my dearest Papa, this one is for you, for us! Thank you for always being there and
having faith in me. To my brothers Chinsaka and Ndashe, thank you for your love,
support and patience throughout this process
Thank you South African Minerals to Metals Research Institution (SAMMRI) for all the
financial support that made this project feasible.
To, my CeBER family, thank you for all the fruitful discussions and your contributions.
You will all be missed.
vi
Contents Declaration ................................................................................................................. i
Abstract ..................................................................................................................... iii
Acknowledgements ................................................................................................... v
List of Figures............................................................................................................ ix
List of tables ............................................................................................................. xii
List of Equations ...................................................................................................... xiii
Glossary ................................................................................................................... xv
1 Introduction ........................................................................................................ 1
2 Literature review ................................................................................................. 4
2.1 Platinum Group Metal Mining in South Africa .............................................. 4
2.1.1 Association of PGMs ............................................................................ 6
2.2 Conventional Extraction Methods ................................................................ 7
2.3 Flotation ...................................................................................................... 9
2.3.1 Mechanics of flotation ........................................................................ 10
2.3.2 Bubble attachment ............................................................................. 11
2.3.3 Flotation reagents .............................................................................. 13
2.3.4 Determining success of flotation tests ................................................ 16
2.4 Weathered/Oxidised Ores ......................................................................... 16
2.4.1 Oxidation layer ................................................................................... 19
2.4.2 Case study: Main Sulphide Zone (MSZ), Great Dyke ......................... 20
2.5 Flotation of Oxidised Ores ......................................................................... 21
2.5.1 Effect of oxidation on flotation ............................................................ 21
2.5.2 Improvement techniques .................................................................... 21
2.6 Ammonia Leaching ................................................................................... 24
2.6.1 Dissolution mechanism ...................................................................... 25
2.6.2 Thermodynamics of ammonia leaching .............................................. 28
2.6.3 Leaching kinetics ............................................................................... 30
2.6.4 Advantages of ammonia leaching ...................................................... 34
vii
2.6.5 Limitations of Ammonia leaching ........................................................ 35
2.7 Cyanide Leaching of PGMs ....................................................................... 36
2.7.1 Base metal extraction prior to PGM extraction ................................... 37
2.8 Leaching techniques ................................................................................. 38
2.8.1 Different ammonia leaching techniques .............................................. 41
2.9 Research Approach .................................................................................. 43
2.9.1 Objectives of study ............................................................................. 45
3 Experimental procedure ................................................................................... 47
3.1 Materials ................................................................................................... 47
3.1.1 Sample bulk mineralogy and elemental analysis ................................ 47
3.1.2 Sample preparation ............................................................................ 48
3.1.3 Sample milling .................................................................................... 50
3.2 Methods: Ammonia pre-treatment tests ..................................................... 52
3.2.1 Column reactor leaching (coarse ore) ................................................ 53
3.2.2 Batch stirred tanks (milled ore) ........................................................... 54
3.3 Ammonia Leaching: Extraction of Valuable Metals .................................... 56
3.3.1 Ammonia column leach ...................................................................... 56
3.3.2 Cyanide column leach ........................................................................ 57
3.3.3 Ammonia batch stirred tank leach ...................................................... 58
3.4 Methods: Flotation Tests ........................................................................... 59
3.4.1 Flotation batch tests ........................................................................... 59
3.5 Analytical Techniques ............................................................................... 62
3.6 Safety, health and environment ................................................................. 63
3.6.1 Ammonia (NH3) .................................................................................. 63
3.6.2 Cyanide .............................................................................................. 64
4 Ammonia Leaching Results and discussion ..................................................... 67
4.1 Ammonia leaching: Pre-treatment ............................................................. 67
4.1.1 Column treatment tests ...................................................................... 67
4.1.2 Column treatment: Base metal extractions ......................................... 68
viii
4.1.3 Batch stirred tank treatment ............................................................... 70
4.1.4 Batch stirred tank treatment: Base metal extraction ........................... 70
4.1.5 Discussion of base metal extraction ................................................... 72
4.2 Extraction of Valuable Metals .................................................................... 74
4.2.1 Long-term column leach ..................................................................... 75
4.2.2 Long-term batch stirred tank leach ..................................................... 77
4.2.3 Discussion of results: Batch stirred tank and column treatment .......... 78
4.3 Batch stirred tank tests: Varying conditions ............................................... 78
4.3.1 Effect of Initial Copper Concentration ................................................. 79
4.3.2 Effect of pulp density .......................................................................... 80
4.3.3 Effect of Ammonia concentration ........................................................ 82
4.3.4 Effect of acid pre-leach ...................................................................... 83
4.4 Cyanide Column leach .............................................................................. 85
5 Flotation results and discussion ....................................................................... 89
5.1 Column treatment: Flotation results ........................................................... 90
5.1.1 Cumulative solids and water recovery ................................................ 90
5.1.2 Cumulative solid recovery over time: Column reactors ....................... 90
5.1.3 Base metals recovery ......................................................................... 91
5.1.4 PGM recovery: 4E analysis ................................................................ 92
5.2 Batch stirred tank treatment ...................................................................... 92
5.2.1 Cumulative solids and water recovery ................................................ 92
5.2.2 Cumulative solid recovery over time: Batch stirred tank reactors ........ 93
5.2.3 Base metal recovery .......................................................................... 94
5.2.4 PGM recovery: 4E analysis ................................................................ 94
5.3 Discussion of Column and Batch stirred tank treatment flotation ............... 95
6 Conclusions and recommendations .................................................................. 98
6.1 Conclusions .............................................................................................. 98
6.2 Recommendations .................................................................................... 99
7 Bibliography ................................................................................................... 100
ix
8 Appendices .................................................................................................... 110
8.1 Calculation of extraction curves ............................................................... 110
8.2 Calculation of flotation data ..................................................................... 110
8.2.1 Column flotation data ....................................................................... 110
8.2.2 Batch stirred tank reactor flotation tests ........................................... 112
8.3 Calculation of minimum mass required (Gy method) ............................... 113
8.4 Material Safety Data: Sodium cyanide ..................................................... 115
8.5 Material Safety Data: Ammonium hydroxide ............................................ 121
LIST OF FIGURES
Figure 1: Summary of the conventional PGM and base metal processing routes ...... 2
Figure 2: The location of the Bushveld Igneous Complex in Africa and South Africa
(Voordouw & Buekes, 2000) ...................................................................................... 4
Figure 3: Association of PGMs in feed of oxidised ore adapted from Becker et al. (2014)
.................................................................................................................................. 7
Figure 4: Summary of the conventional PGM and base metal processing routes ...... 7
Figure 5: General flow sheet for the production of PGMs and gold in South Africa
(Crundwell, et al., 1995) ............................................................................................ 8
Figure 6: Schematic that shows the set-up of a flotation cell ................................... 10
Figure 7: Selective attachment of bubbles to hydrophobic particles ......................... 10
Figure 8: Illustration of the equilibrium contact angle between air, water and solid .. 12
Figure 9: Collector adsorption on a particle surface ................................................. 13
Figure 10: Schematic showing action of the frothers (right) and bubble (left) in flotation
pulp (Wills, 1997) .................................................................................................... 14
Figure 11: Graph shows the recovery of PGMs over time for various pH values
(Muzendu, et al., 2011) ........................................................................................... 15
Figure 12: Graphs shows the recovery of base metals and varying pH levels (Muzendu,
et al., 2011) ............................................................................................................. 15
Figure 13: Schematic of the Bushveld complex showing the location and depth of the
Merensky, UG 2 and Platreef ore (Cawthorn, 2010). ............................................... 17
Figure 14: Model of ore deposit showing the oxidation of sulphide minerals near the
surface to the sulphide deeper beneath the surface (Bartlett, 1998) ........................ 18
x
Figure 15: The effect of the ultrasonic treatment on the flotation of oxidised ores
(Newell et al., 2006). ............................................................................................... 23
Figure 16: Percentage of NH3 and NH4+ as a function of pH (Illinois State Water Survey,
n.d.) ......................................................................................................................... 28
Figure 17: Eh-pH diagram for the copper-ammonia-water system at 25°C and 101.3
kPa (Takeno, 2005) ................................................................................................. 29
Figure 18: Eh-pH diagram for the Nickel-ammonia-water system at 25°C and 101.3
kPa. 1. Ni (NH3)2+ 2. Ni (NH3)23+ 3. Ni (NH3)3
2+ 4. Ni (NH3)42+ 5. Ni (NH3)5
2+ 6. Ni (NH3)62+
(Takeno, 2005) ........................................................................................................ 30
Figure 19: The effect of oxygen pressure on the rate of copper extraction (Halpern,
1953). ...................................................................................................................... 33
Figure 20 : A typical heap leaching system (Environmental Radiation Survey and Site
Execution, 2009) ..................................................................................................... 39
Figure 21: Pachuca tank used for agitated leaching (Vignes, 2011) ........................ 40
Figure 22: Classification of the different leaching techniques (Gupta, 2003) ............ 40
Figure 23: Diagrammatic representation of the extent of ore oxidation .................... 43
Figure 24: Schematic of overall experimental procedure ......................................... 46
Figure 25: Schematic of the 1 x 10kg splitter used to split ore in order to obtain
representative sample. (Anon., 2009) ...................................................................... 49
Figure 26: Schematic of splitting procedure for ammonia column leaching .............. 49
Figure 27: Particle size distribution graph of head sample ....................................... 50
Figure 28: 1kg mill used to mill head sample for flotation ........................................ 51
Figure 29: Milling curve used to obtain milling time for required size fraction. .......... 52
Figure 30: Particle size distribution of milled ore which shows that consistency was
kept throughout the leaching process ...................................................................... 52
Figure 31: Schematic of the column reactors used to simulate a heap leach ........... 53
Figure 32: Batch stirred tank reactors used to treat milled ore (picture and schematic)
................................................................................................................................ 55
Figure 33: A 3L flotation cell used in batch flotation tests ........................................ 60
Figure 34: Schematic of the experimental procedure with the ammonia and cyanide
leaching results highlighted ..................................................................................... 67
Figure 35: Extraction rates of Cu, Ni and Fe in column treatments with 7M total
ammonia, ambient temperatures. ............................................................................ 69
Figure 36: pH and ORP readings for ammonia column treatments with 7M total
ammonia, ambient temperatures. ............................................................................ 69
Figure 37: pH and ORP readings for batch stirred tank reactors with 7M total ammonia,
ambient temperatures. ............................................................................................ 70
xi
Figure 38: Extraction rates for Cu, Ni and Fe in batch stirred tank reactors with 7M total
ammonia and ambient temperatures. ...................................................................... 71
Figure 39: Graphs showing Nickel extraction in columns for 28 days, with 5M ammonia,
aerated at 80ml/min and ambient temperatures ...................................................... 75
Figure 40: pH and ORP values for 28 day column treatment with 5M ammonia, aerated
at 80ml/min and ambient temperatures ................................................................... 76
Figure 41: Graph showing the Nickel extraction in batch stirred tank reactors over 10
days, with 5M total ammonia, aerated at 80ml/min and ambient temperatures ........ 77
Figure 42: Graph showing the pH and ORP of Ni extraction in batch stirred tank, with
5M total ammonia, aerated at 80ml/min and ambient temperatures ........................ 78
Figure 43: Graphs showing comparable nickel extraction rates between 0 ppm and
500 ppm of initial copper concentration ................................................................... 79
Figure 44: Graphs showing comparable a) pH and b) ORP values between 0 ppm and
500 ppm of initial copper concentration ................................................................... 80
Figure 45: Graphs showing comparable Ni extraction rates between 5% and 15% pulp
densities (w/v) ......................................................................................................... 81
Figure 46: Graphs showing comparable a) pH and b) ORP values between 5% and
15% pulp densities (w/v) ......................................................................................... 81
Figure 47: Graphs showing comparable Ni extraction rates between 4M and 8M
ammonia tests ......................................................................................................... 82
Figure 48: Graphs showing comparable pH and ORP values for 4M and 8M ammonia
tests ........................................................................................................................ 83
Figure 49: Graphs showing comparable Ni extraction rates between ore pre-treated
with acid and untreated ore ..................................................................................... 84
Figure 50: Graphs showing comparable pH and ORP values rates between ore pre-
treated with acid and untreated ore ......................................................................... 85
Figure 51: Extraction curves for base metals (Ni) with direct sodium cyanide leach,
with 0.5M cyanide, aerated at 80ml/min at 40°C ...................................................... 86
Figure 52: Extraction curves for PGMs (Pt and Pd) with direct sodium cyanide leach,
with 0.5M cyanide, aerated at 80ml/min at 40°C ...................................................... 86
Figure 53: Extraction curves for base (Ni and Fe) with an ammonia leach followed by
a direct sodium cyanide leach, with 0.5M cyanide, aerated at 80ml/min at 40°C ..... 87
Figure 54: Extraction curves for PGMs (Pt and Pd) with an ammonia leach followed by
a direct sodium cyanide leach, with 0.5M cyanide, aerated at 80ml/min at 40°C ..... 87
Figure 55: Schematic of the experimental procedure with the flotation test results
highlighted ............................................................................................................... 89
xii
Figure 56: Total solids and water recovery for column treated ore with 30% pulp
density, impeller speed of 1200rpm and aeration of 7l/min ...................................... 90
Figure 57: Graph of solids vs time for column flotation tests with 30% pulp density,
impeller speed of 1200rpm and aeration of 7l/min ................................................... 91
Figure 58: Total solids and water recovery for batch stirred tank treated ore with 30%
pulp density, impeller speed of 250rpm and aeration of 3ml/min ............................. 92
Figure 59: Graph of solids vs time for column flotation tests with 30% pulp density,
impeller speed of 250rpm and aeration of 3ml/min .................................................. 93
Figure 60: PGM grade vs recovery (cumulative) curves at different pH levels
(Muzendu, et al., 2011) ........................................................................................... 96
LIST OF TABLES
Table 1: Summary of the world's PGM reserves in 2011, adapted from (Polinares,
2012) ......................................................................................................................... 1
Table 2: Summary of the bulk mineralogy and PGM distribution in Platreef, Merensky
and UG2 (Shamaila & O'Connor, 2008). ................................................................... 6
Table 3: Shows the effect of particle size on the rate and model of dissolution
(University of Cape Town, 2008) ............................................................................. 34
Table 4: Advantages and disadvantages of percolated and agitated leaching (U.S.
Environmental Protection Agency, 1994; Kappes, 1998; Gupta & Mukherjee, 1990;
Gupta, 2003; Bartlett, 1992) .................................................................................... 41
Table 5: Total base metal and PGM elemental analysis on ore sample ................... 47
Table 6: Mineralogy data of sample adapted from Becker, Wiese & Ramonotsi (2013).
................................................................................................................................ 48
Table 7: Details of rods used in mill ......................................................................... 51
Table 8: Summary of column leaching operating conditions .................................... 54
Table 9: Summary of Batch stirred tank leaching conditions .................................... 55
Table 10: Summary of Ammonia column leaching conditions .................................. 57
Table 11: Summary of cyanide column leaching conditions..................................... 58
Table 12: Summary of the batch stirred tank reactor operating conditions ............... 58
Table 13: Composition of plant synthetic water ....................................................... 60
Table 14: Summary of flotation reagent sequence and addition times ..................... 61
Table 15: Summary of the concentrate collection times ........................................... 61
Table 16: Summary of flotation reagent sequence and the addition times ............... 62
Table 17: Summary of the concentrate collection times ........................................... 62
xiii
Table 18: Dangers of HCN gas to human body ....................................................... 64
Table 19: Elemental analysis results for ammonia columns head sample ............... 68
Table 20: Elemental analysis results for ammonia batch head sample .................... 70
Table 21: Summary of parameters used in calculation of minimal sample size ........ 73
Table 22: Base and PGM elemental analysis for ammonia leaching columns ......... 75
Table 23: Calculation of Ni extraction rates (mg/day) at different times of leaching
process ................................................................................................................... 76
Table 24: Base and PGM elemental analysis for ammonia leaching columns ......... 77
Table 25: Table shows the experiments run with the different variables and their
respective parameters ............................................................................................. 79
Table 26: Showing the dissolution of base metals in acid pre-treatment .................. 85
Table 27: Summary of upgrade factor and total base metal recoveries of column
treatment flotation ................................................................................................... 91
Table 28: Summary of upgrade factor and total PGM recoveries of column treatment
flotation ................................................................................................................... 92
Table 29: Summary of upgrade factor and total base metal recoveries of batch stirred
tank treatment flotation ............................................................................................ 94
Table 30: Summary of upgrade factor and total PGM recoveries of batch stirred tank
treatment flotation ................................................................................................... 94
Table 31: Calculation sample of the extraction of metal ......................................... 110
Table 32: Untreated column flotation raw data ...................................................... 110
Table 33: 2 day treated column flotation raw data ................................................. 111
Table 34: 5 day treated column flotation raw data ................................................. 111
Table 35: 10 day treated column flotation raw data ............................................... 112
Table 36: Untreated batch stirred tank reactor raw data ........................................ 112
Table 37: 1 hour treated batch stirred tank reactor raw data .................................. 112
Table 38: 3 hour treated batch stirred tank reactor raw data .................................. 113
Table 39: Gy formula raw data .............................................................................. 113
LIST OF EQUATIONS
Equation 1 ............................................................................................................... 11
Equation 2 ............................................................................................................... 12
Equation 3 ............................................................................................................... 12
Equation 4 ............................................................................................................... 16
xiv
Equation 5 ............................................................................................................... 16
Equation 6 ............................................................................................................... 18
Equation 7 ............................................................................................................... 18
Equation 8 ............................................................................................................... 21
Equation 9 ............................................................................................................... 25
Equation 10 ............................................................................................................. 26
Equation 11 ............................................................................................................. 26
Equation 12 ............................................................................................................. 26
Equation 13 ............................................................................................................. 26
Equation 14 ............................................................................................................. 26
Equation 15 ............................................................................................................. 27
Equation 16 ............................................................................................................. 29
Equation 17 ............................................................................................................. 30
Equation 18 ............................................................................................................. 35
Equation 19 ............................................................................................................. 36
Equation 20 ............................................................................................................. 36
Equation 21 ............................................................................................................. 36
Equation 22 ............................................................................................................. 64
Equation 23 ............................................................................................................. 72
Equation 24 ............................................................................................................. 73
Equation 25 ............................................................................................................. 84
Equation 26 ............................................................................................................. 84
Equation 27 ............................................................................................................. 84
Equation 28 ............................................................................................................. 84
Equation 29 ............................................................................................................. 89
xv
GLOSSARY
Acronym Definition
AAS Atomic Absorption Spectroscopy
BIC Bushveld Igneous Complex
BM Base Metal
ICP Inductive Coupled Plasma
MSDS Material safety data sheet
MSZ Main Sulphide Zone
NFG Naturally floating gangue
PGE Platinum Group Element
PGM Precious Group Metal
PPM Pilanesburg Platinum Mines
SIBX Sodium Isobutyl Xanthate
UCT University of Cape Town
UG2 Upper Group 2
1
1 INTRODUCTION
Platinum group metals (PGMs) have physical and chemical properties that make them
invaluable to our society today. Platinum and palladium are the focus of this study and
play an important role in auto catalysts, industrial catalyst applications and the glass
industry (Aspola, et al., 2012).
South Africa (SA) holds the majority of the world’s PGM reserves (Liddell & Adams,
2012). PGMs are situated in several types of deposits; namely stratiform deposits,
Norite intrusions, Ni-Cu bearing sill and Placer deposits (Vermaak, 1995). PGMs in SA
are located in the Bushveld Igneous Complex (BIC), which falls under the stratiform
deposits. Table 1 below summarises the world’s leading PGM regions including SA’s
share.
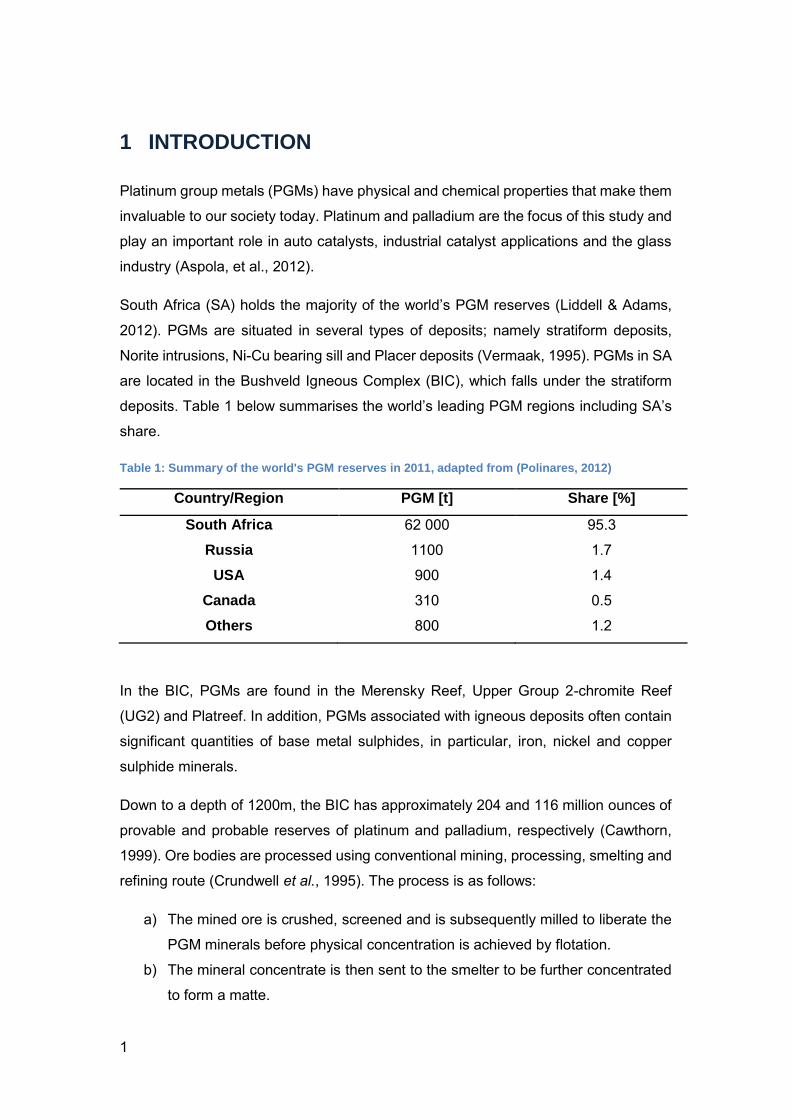
Table 1: Summary of the world's PGM reserves in 2011, adapted from (Polinares, 2012)
Country/Region PGM [t] Share [%]
South Africa 62 000 95.3
Russia 1100 1.7
USA 900 1.4
Canada 310 0.5
Others 800 1.2
In the BIC, PGMs are found in the Merensky Reef, Upper Group 2-chromite Reef
(UG2) and Platreef. In addition, PGMs associated with igneous deposits often contain
significant quantities of base metal sulphides, in particular, iron, nickel and copper
sulphide minerals.
Down to a depth of 1200m, the BIC has approximately 204 and 116 million ounces of
provable and probable reserves of platinum and palladium, respectively (Cawthorn,
1999). Ore bodies are processed using conventional mining, processing, smelting and
refining route (Crundwell et al., 1995). The process is as follows:
a) The mined ore is crushed, screened and is subsequently milled to liberate the
PGM minerals before physical concentration is achieved by flotation.
b) The mineral concentrate is then sent to the smelter to be further concentrated
to form a matte.
2
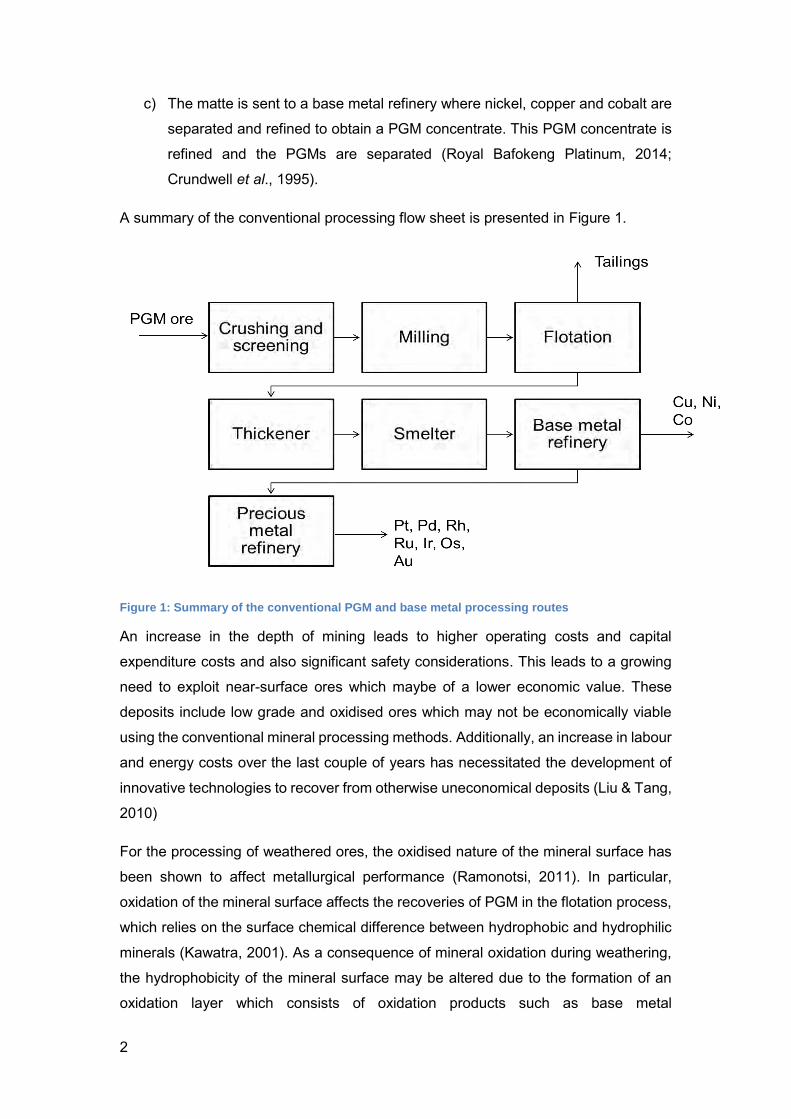
c) The matte is sent to a base metal refinery where nickel, copper and cobalt are
separated and refined to obtain a PGM concentrate. This PGM concentrate is
refined and the PGMs are separated (Royal Bafokeng Platinum, 2014;
Crundwell et al., 1995).
A summary of the conventional processing flow sheet is presented in Figure 1.
Figure 1: Summary of the conventional PGM and base metal processing routes
An increase in the depth of mining leads to higher operating costs and capital
expenditure costs and also significant safety considerations. This leads to a growing
need to exploit near-surface ores which maybe of a lower economic value. These
deposits include low grade and oxidised ores which may not be economically viable
using the conventional mineral processing methods. Additionally, an increase in labour
and energy costs over the last couple of years has necessitated the development of
innovative technologies to recover from otherwise uneconomical deposits (Liu & Tang,
2010)
For the processing of weathered ores, the oxidised nature of the mineral surface has
been shown to affect metallurgical performance (Ramonotsi, 2011). In particular,
oxidation of the mineral surface affects the recoveries of PGM in the flotation process,
which relies on the surface chemical difference between hydrophobic and hydrophilic
minerals (Kawatra, 2001). As a consequence of mineral oxidation during weathering,
the hydrophobicity of the mineral surface may be altered due to the formation of an
oxidation layer which consists of oxidation products such as base metal
3
oxides/hydroxides. This surface alteration results in a decrease in PGM mineral
recovery. In order to improve PGM recovery during the flotation of weathered ores,
Ramonotsi (2011) has suggested a chemical pre-treatment to dissolve this oxidation
layer prior to flotation. Here, the acid pre-treatment improved PGM flotation recoveries
and achieved a 20% improvement. However an acid pre-treatment requires a water
wash prior to the flotation process which operates at a high pH levels (pH>9).
Previously, a 2-stage process was investigated that included a primary acid heap
bioleach of base metals, followed by a secondary direct cyanide leach of PGMs and
achieved a high extraction of PGMs from low grade ore. This process included multiple
stages of caustic washing between the acid leach and the cyanide leach to prevent the
formation of the toxic hydrogen cyanide gas (Mwase, Petersen & Eksteen, 2012). In
an attempt to eliminate the use of caustic washing and to work in an alkaline
environment, Muzawazi (2013) explored the use of an ammonia heap leach to extract
base metals from Platreef concentrate.
Muzawazi (2013) studied the chemical feasibility and dissolution kinetics of ammonia
leaching in order to extract base metals from low grade PGMs. A successful extraction
rate (>90%) was achieved for both nickel and copper. The ability of ammonia to
dissolve base metals in solutions suggests that it could be used to dissolve base
metals oxides in the oxidation layer and therefore dissolving this layer to create a
cleaner surface for the flotation stage. This can be viewed as an alternative to
Ramonotsi’s (2011) acid treatment.
The aim of this study was to investigate the use of ammonia to enhance the recovery
of PGMs from weathered ores. To achieve this aim, ammonia was used as a chemical
pre-treatment agent for weathered PGM ores to improve flotation efficiencies. This
ammonia pre-treatment was used on both coarse ore (whole ore) and milled ore in
order to determine the most effective mode of treatment.
4
2 LITERATURE REVIEW
2.1 Platinum Group Metal Mining in South Africa
South Africa has the World’s largest known resources of platinum group metals (South
African government, 2014). Platinum group metals are mined near Rustenburg in the
BIC, in the North West Province. The BIC extends for approximately 300-400
kilometres and contains the world’s largest known deposits of platinum group metals
such as platinum, palladium, rhodium, ruthenium, iridium and osmium (Jones, 1999;
Cawthorn, 1999). The BIC contains approximately 62 816 tons of PGM reserves which
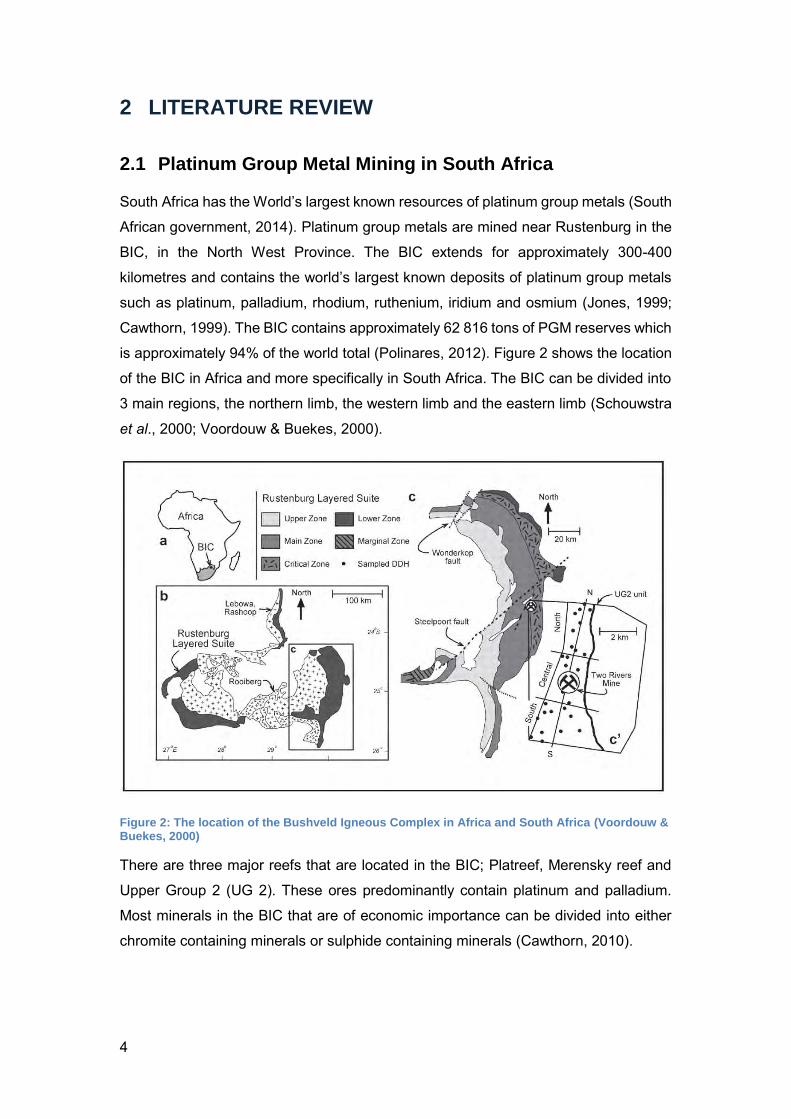
is approximately 94% of the world total (Polinares, 2012). Figure 2 shows the location
of the BIC in Africa and more specifically in South Africa. The BIC can be divided into
3 main regions, the northern limb, the western limb and the eastern limb (Schouwstra
et al., 2000; Voordouw & Buekes, 2000).
Figure 2: The location of the Bushveld Igneous Complex in Africa and South Africa (Voordouw & Buekes, 2000)
There are three major reefs that are located in the BIC; Platreef, Merensky reef and
Upper Group 2 (UG 2). These ores predominantly contain platinum and palladium.
Most minerals in the BIC that are of economic importance can be divided into either
chromite containing minerals or sulphide containing minerals (Cawthorn, 2010).
5
Merensky
Until the 1970’s, Merensky reef was the only source of platinum in South Africa
(Cawthorn, 1999). This ore is situated between two chromite layers and is located in
both the western and eastern limbs of the BIC (Cawthorn et al., 2002). In comparison
to the other ores, it contains a high PGM grade (80% of the platinum mined in South
Africa) and also higher platinum to palladium ratio (Africa, 2008). The PGM content
ranges from 4-10 g/t (Jones, 1999). Merensky ore also contains 3% base metal
sulphides which are distributed as follows: pyrrhotite (Fe1-xS, 45%), pentlandite ((Fe,
Ni)9S8, 32%), chalcopyrite (CuFeS2, 16%) and pyrite (FeS2, 2-4%) (Shamaila &
O'Connor, 2008).
UG 2
The UG 2 reef group is located consistently throughout the BIC region and is rich in
chromite containing minerals (Schouwstra et al., 2000) The UG 2 reef is approximately
0.15 – 2.5 meters thick (Jones, 1999) and lies 200m below the Merensky reef. The UG
2 reef contains 4.4 – 10.6g/t of PGMs (Jones, 1999), which makes it the reef with the
highest PGM concentration. The UG 2 ore has much lower base metal sulphides (<1%)
content than the Merensky and Platreef (Solomon, 2010).
Platreef
Platreef is located in the northern limb of the BIC and relative to the Merensky and UG
2 reef; it has low platinum to palladium ratio. Platreef contains 2-5g/t of PGMs, which
is considerably lower than Merensky and UG 2 (Fuerstenau et al., 2007). Platreef base
metal sulphides concentrations are found to be irregular in both value and distribution.
The PGMs in Platreef ores occur as Pd and Pt bismuth-telluride and arsenides, which
are slow-floating in comparison to PGM sulphides (Vermaak, 1995). Furthermore,
there is a high association of PGMs to silicate minerals in some areas, which do not
easily float. This creates a problem with using the conventional PGM extraction
methods (Schouwstra et al., 2000). Mining of this reef was discontinued in the early
1930s due to ore treatment issues; however extensive test work has been done since
to improve the use of this ore to mine platinum (Africa, 2008).
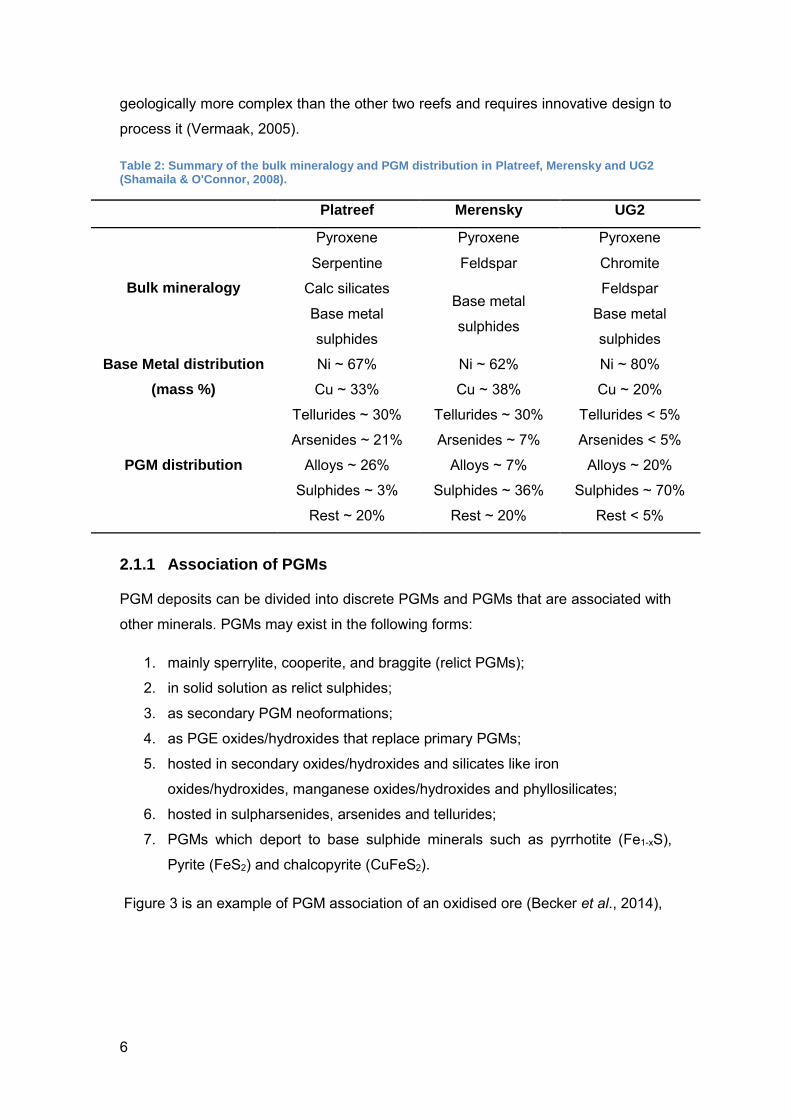
Due to the differences in mineralogical content as shown in Table 2, they have different
processing techniques. Merensky and UG 2 reefs which lie in close proximity to each
other have similar metallurgical processing routes (Dunne, 2011). The Platreef ore is
6
geologically more complex than the other two reefs and requires innovative design to
process it (Vermaak, 2005).
Table 2: Summary of the bulk mineralogy and PGM distribution in Platreef, Merensky and UG2 (Shamaila & O'Connor, 2008).
Platreef Merensky UG2
Bulk mineralogy
Pyroxene Pyroxene Pyroxene
Serpentine Feldspar Chromite
Calc silicates Base metal
sulphides
Feldspar
Base metal
sulphides
Base metal
sulphides
Base Metal distribution
(mass %)
Ni ~ 67%
Cu ~ 33%
Ni ~ 62%
Cu ~ 38%
Ni ~ 80%
Cu ~ 20%
PGM distribution
Tellurides ~ 30% Tellurides ~ 30% Tellurides < 5%
Arsenides ~ 21% Arsenides ~ 7% Arsenides < 5%
Alloys ~ 26% Alloys ~ 7% Alloys ~ 20%
Sulphides ~ 3% Sulphides ~ 36% Sulphides ~ 70%
Rest ~ 20% Rest ~ 20% Rest < 5%
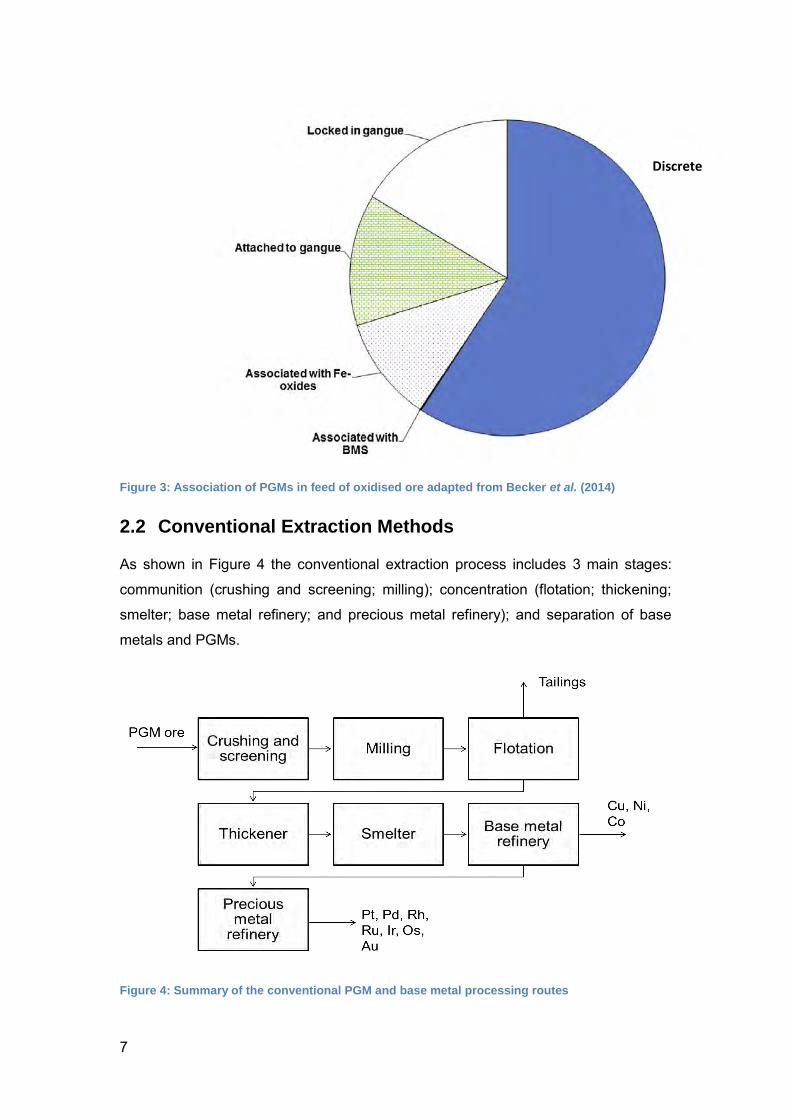
2.1.1 Association of PGMs
PGM deposits can be divided into discrete PGMs and PGMs that are associated with
other minerals. PGMs may exist in the following forms:
1. mainly sperrylite, cooperite, and braggite (relict PGMs);
2. in solid solution as relict sulphides;
3. as secondary PGM neoformations;
4. as PGE oxides/hydroxides that replace primary PGMs;
5. hosted in secondary oxides/hydroxides and silicates like iron
oxides/hydroxides, manganese oxides/hydroxides and phyllosilicates;
6. hosted in sulpharsenides, arsenides and tellurides;
7. PGMs which deport to base sulphide minerals such as pyrrhotite (Fe1-xS),
Pyrite (FeS2) and chalcopyrite (CuFeS2).
Figure 3 is an example of PGM association of an oxidised ore (Becker et al., 2014),
7
Figure 3: Association of PGMs in feed of oxidised ore adapted from Becker et al. (2014)
2.2 Conventional Extraction Methods
As shown in Figure 4 the conventional extraction process includes 3 main stages:
communition (crushing and screening; milling); concentration (flotation; thickening;
smelter; base metal refinery; and precious metal refinery); and separation of base
metals and PGMs.
Figure 4: Summary of the conventional PGM and base metal processing routes
Discrete
8
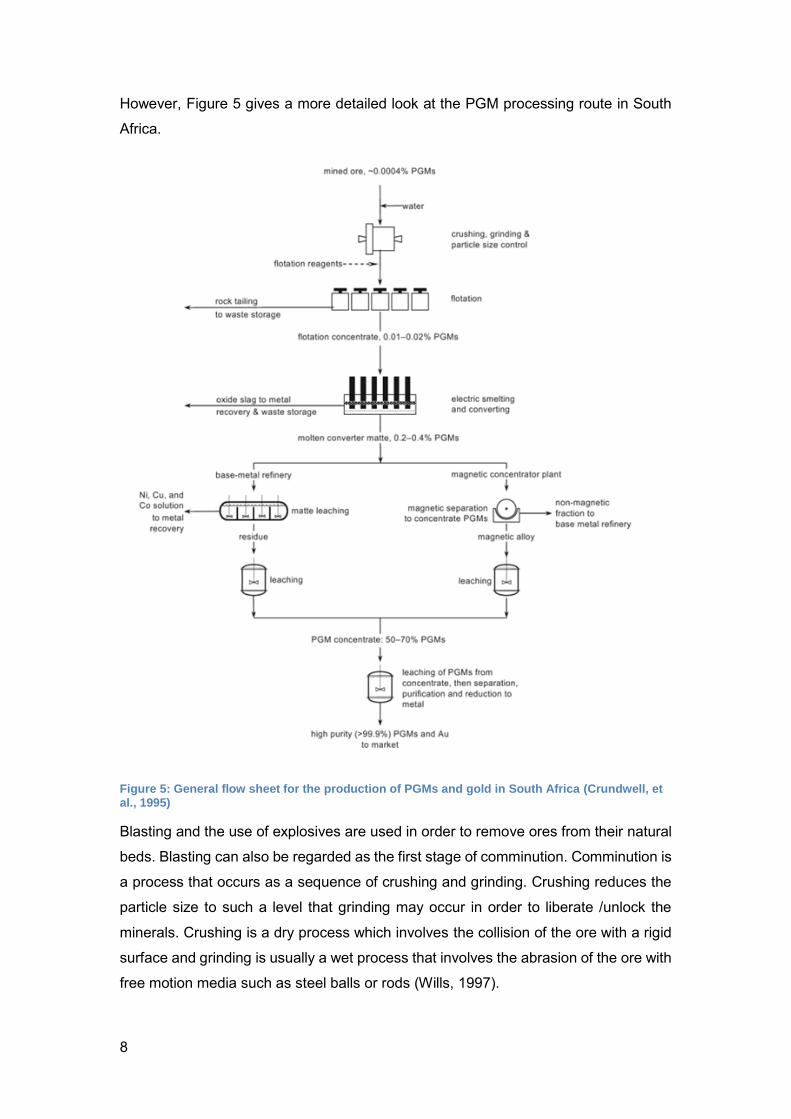
However, Figure 5 gives a more detailed look at the PGM processing route in South
Africa.
Figure 5: General flow sheet for the production of PGMs and gold in South Africa (Crundwell, et al., 1995)
Blasting and the use of explosives are used in order to remove ores from their natural
beds. Blasting can also be regarded as the first stage of comminution. Comminution is
a process that occurs as a sequence of crushing and grinding. Crushing reduces the
particle size to such a level that grinding may occur in order to liberate /unlock the
minerals. Crushing is a dry process which involves the collision of the ore with a rigid
surface and grinding is usually a wet process that involves the abrasion of the ore with
free motion media such as steel balls or rods (Wills, 1997).
9
The PGM ore is then sent to the flotation stage. Flotation is a selective process that
can be used to obtain specific separations from various ores. Flotation, which was
patented in 1906, permitted the mining of low grade and complex ores (Wills, 1997).
Flotation yields a concentrate that contains approximately 100-200g/tonne PGMs (this
is a 20 times upgrade of the ore) (Crundwell et al., 1995; Cramer, 2008). This
upgrading is as a result of isolating the minerals that contain PGMs in a small amount
of flotation concentrate and discarding the gangue that contains little to no PGMs.
The flotation concentrates are then smelted and converted to produce a PGM rich
matte. This matte has a PGM concentration of 1000-2000g/tonne, which is 10-20 times
upgrade from the flotation concentrate. The smelting process is energy intensive and
is not economical for low grade ore (Crundwell et al., 1995).
The matte is slow cooled to allow the formation of Ni alloys that collect PGMs. The
PGMs are concentrated in the Ni alloys (the PGM concentrate of the metallic alloy is
approximately 60-70%) which are then magnetically separated from the non-magnetic
matte. The non-magnetic matte is then leached and refined to recover Cu, Ni and Co
products. The magnetic separation stage is specific to the Anglo American Platinum
process, other processes leach the entire matte to recover base metals and then
recover PGMs from the residue. The base metal refinery step upgrades the ore 400
times. The base metals are then separated out.
The PGM refinery step involves primary separation which separates individual PGMs
from impurities and other PGMs. This is followed by secondary purification and the
reduction step which reduces metal salts to pure metals (>99.9% purity) (Crundwell et
al., 1995).
The flotation process described in this section is one of the most important, versatile
and complex mineral processing techniques. Manipulation of this process has led to
treatment of ores that may have been previously considered uneconomical (low grade
ores/weathered ores) (Wills, 1997). The next section will take a closer look at this
flotation process.
2.3 Flotation
Froth flotation is a method of physically separating particles based on the ability of air
bubbles to be attached to particles of a specific mineral surface in water slurry (Crozier,
1992).
10
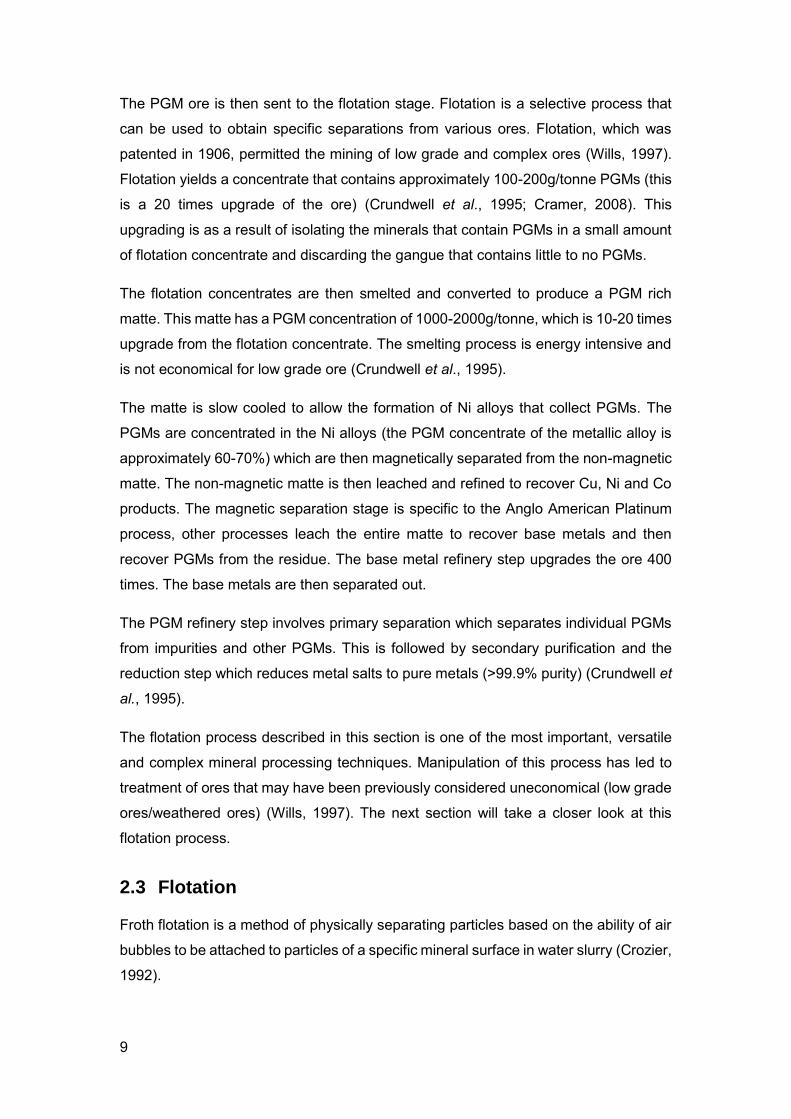
2.3.1 Mechanics of flotation
The ore that is milled is mixed with water to form a slurry/pulp. Chemicals that assist
with the flotation process such as collectors, frothers and depressants are added to
the slurry and conditioned over specific times. The slurry is then introduced to the
flotation cell and aerated to produce bubbles. The hydrophobic particles attach to the
bubbles which then float to the surface to form a froth layer which is then mechanically
collected. The hydrophilic particles remain in the pulp and form part of the tailings.
These tailings may go through several flotation scavenging stages before they are
discarded as waste. Figure 6 shows the set-up of a flotation cell.
Figure 6: Schematic that shows the set-up of a flotation cell
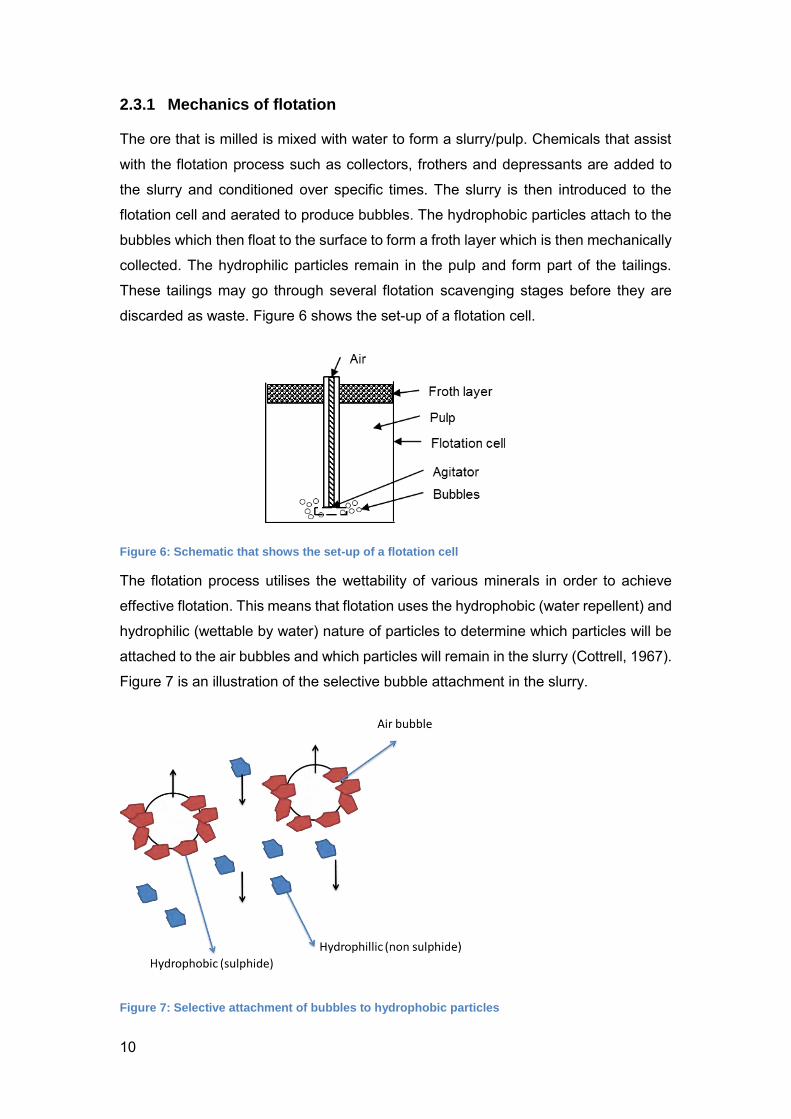
The flotation process utilises the wettability of various minerals in order to achieve
effective flotation. This means that flotation uses the hydrophobic (water repellent) and
hydrophilic (wettable by water) nature of particles to determine which particles will be
attached to the air bubbles and which particles will remain in the slurry (Cottrell, 1967).
Figure 7 is an illustration of the selective bubble attachment in the slurry.
Figure 7: Selective attachment of bubbles to hydrophobic particles
11
This segregation is based on the surface bonding properties of the minerals. Non-polar
minerals have weak molecular bonds and are difficult to hydrate (hydrophobic),
Examples of these minerals include sulphur, molybdenite, diamond, coal and talc,
which are all naturally floatable (Crozier, 1992). In the case of the flotation of sulphide
minerals, the difference lies between sulphide minerals (hydrophobic) and non-
sulphide minerals (hydrophilic). It is important to note that, any process that alters the
surface properties of the minerals affects the hydrophobic or hydrophilic nature of the
mineral and hence affects the flotation efficiency (Ross, 1997; Crozier, 1992).
2.3.2 Bubble attachment
In this process, the particles that are attached to air bubbles are carried to the surface,
whilst particles that are not attached to air bubbles remain in the water slurry (Kawatra,
1989).
The success of bubble attachment is dependent of several physical properties. The
particle and the bubble must successfully collide. Thereafter, the bubble can only stick
to the particle if it is able to displace the water surrounding the particle, this is possible
if the particle is water repellent (hydrophobic). The particle must then adhere to the
bubble surface and be stable in order to be floated to the top. In order to achieve this,
the use of flotation reagents is necessary (Crozier, 1992). However a combination of
turbulence and gravitational forces may lead to the particle being detached from the
bubble before it reaches the surface (King, 1982; Wills, 1997). In order to understand
the forces involved in this system, a closer look at bubble, particle and water interface
is necessary.
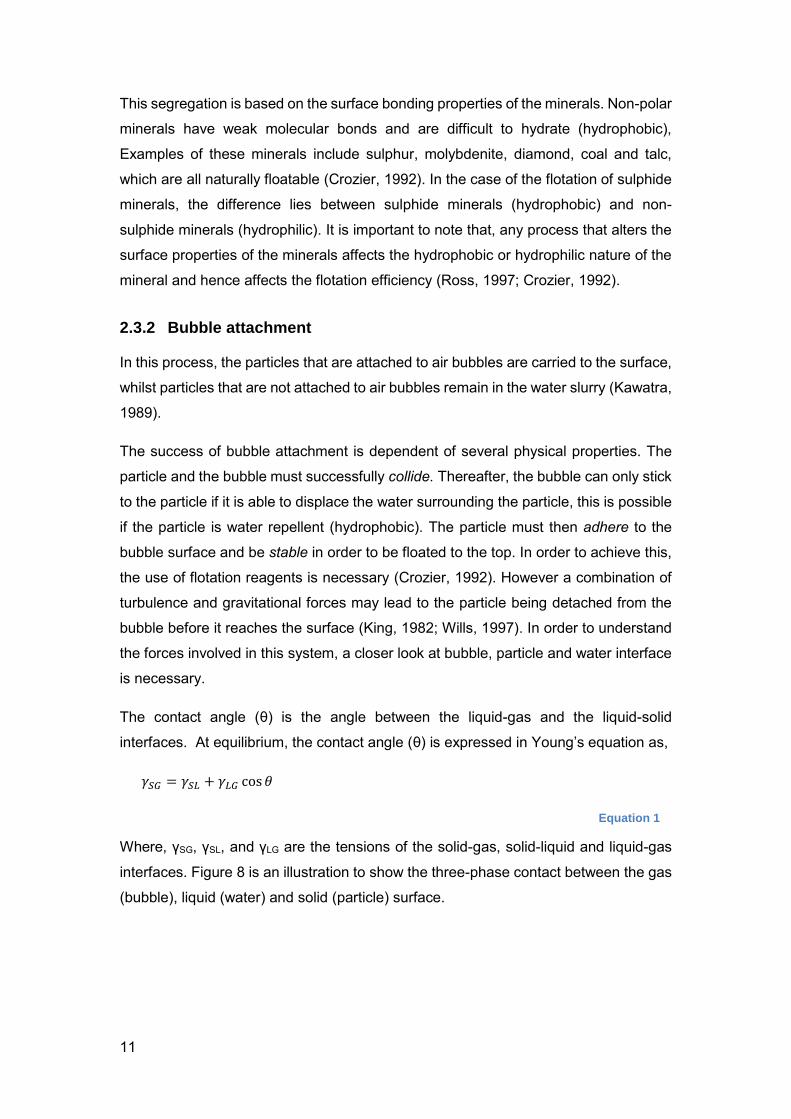
The contact angle (θ) is the angle between the liquid-gas and the liquid-solid
interfaces. At equilibrium, the contact angle (θ) is expressed in Young’s equation as,
𝛾𝑆𝐺 = 𝛾𝑆𝐿 + 𝛾𝐿𝐺 cos 𝜃
Equation 1
Where, γSG, γSL, and γLG are the tensions of the solid-gas, solid-liquid and liquid-gas
interfaces. Figure 8 is an illustration to show the three-phase contact between the gas
(bubble), liquid (water) and solid (particle) surface.
12
Figure 8: Illustration of the equilibrium contact angle between air, water and solid
The work of adhesion is defined as the force required to break the solid-gas interface.
This force is equal to the work required to separate the solid-gas interface and produce
separate liquid-gas and solid-liquid interfaces. This is shown in Equation 2
𝑊𝑆𝐺 = 𝛾𝑆𝐿 + 𝛾𝐿𝐺 − 𝛾𝑆𝐺
Equation 2
Combining Equation 1 and Equation 2 gives:
𝑊𝑆𝐺 = 𝛾𝐿𝐺(𝟏 − cos 𝜃)
Equation 3
The larger the contact angle (θ) the greater the work of adhesion between the particle
and the bubble (according to Equation 3). This means that the attachment is more
stable and hence the floatability of mineral increases as the contact angle increases.
This process can only be applied to relatively fine particles as they are light enough to
be carried upwards by the bubbles. The bubble and particle must remain attached and
float to the froth layer which overflows or is mechanically collected as concentrate
(Wills, 1997). However, very fine particles may lead operational problems such as high
froth stabilisation, high reagent consumption, non-specific collector adsorption and
rapid oxidation, all of which may affect the grade and/or recovery of the minerals (King,
1982).
The flotation process is dependent on three parameters that are highly interrelated.
These are the equipment used, the chemicals (reagents) and the entire operation
(which includes feed rate, mineralogy, particle size, pulp density and temperature)
(Kawatra, 1989; Fuerstenau, 1999). Most minerals are not naturally hydrophobic and
therefore need the addition of flotation reagents in order to improve their
hydrophobicity (Wills, 1997; Gaudin, 1939; Pryor, 1965; King, 1982).
θγSG
γLG
γSL
Liquid (water)
Gas(bubble)
Solid (particle)
13
2.3.3 Flotation reagents
Several processes make use of chemical reagents in order to alter certain particles to
make them more amenable to flotation. Flotation relies on the difference of surface
properties between various minerals in order to separate, the addition of reagents
enables these differences to become more apparent (Wills, 1997). These chemicals
include frothers, collectors, depressants, modifiers and activators (Crozier, 1992).
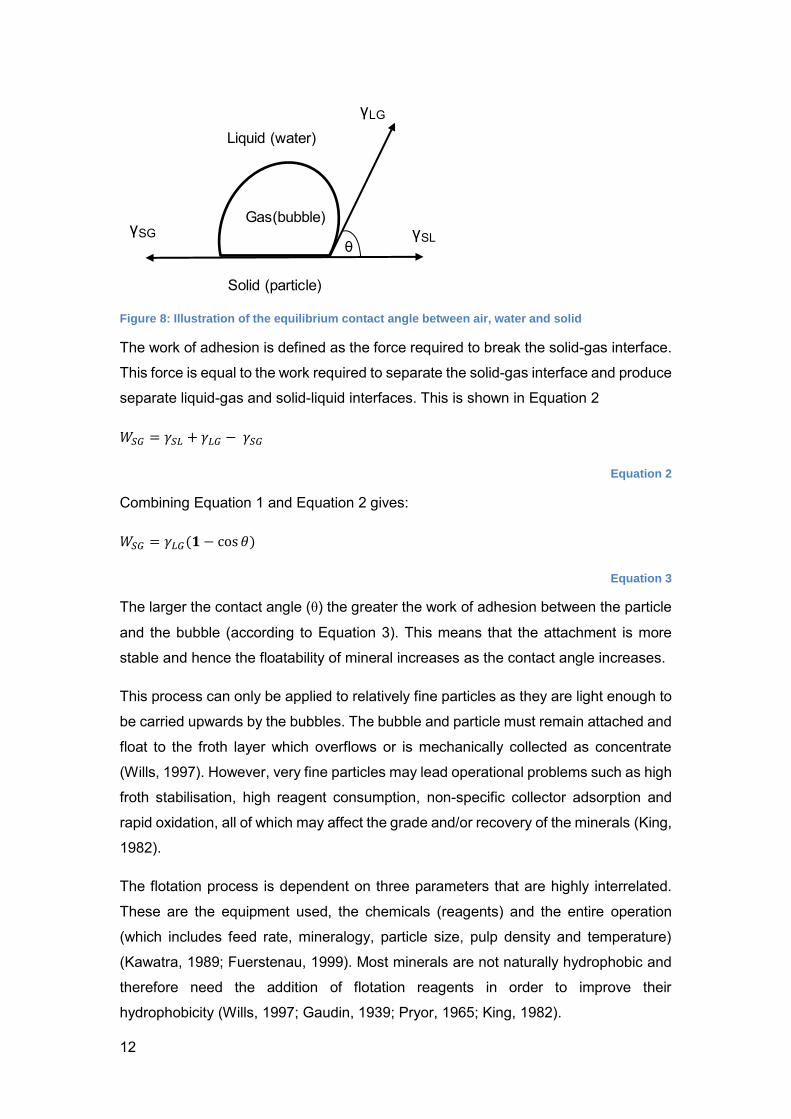
Collectors
Most minerals need surfactants such as collectors in order to make them more
hydrophobic. Collectors are chemicals that form a hydrophobic mono-layer on certain
surface of minerals which reduces the stability of the hydrated layer and therefore
enables the attachment of the particle to the bubble and also increases the bubble
contact angle.
Figure 9: Collector adsorption on a particle surface
An excessive concentration of collector may lead to collector multilayers being formed
on the surface and reducing the amount of hydrocarbons in the flotation pulp (Wills,
1997).
Collectors can be non-ionic, anionic or cationic (Crozier, 1992; Kawatra, 1989).
Examples of anionic collectors include carboxylic, sulphates, sulfonates, xanthates
and dithiophosphates (Kawatra, 1989). Depressants are chemicals that prevent the
absorption of collectors on certain minerals, by doing this they allow certain minerals
to float and prevent certain other minerals from floating (Cottrell, 1967).
Frothers
Frothers are compounds that prevent bubbles from bursting and the formation of a
stable froth layer that allows for the effective mechanical collection of the concentrate
(Kawatra, 1989). Frothers come in the form of alcohol or water soluble polymers such
as propylene glycols.
14
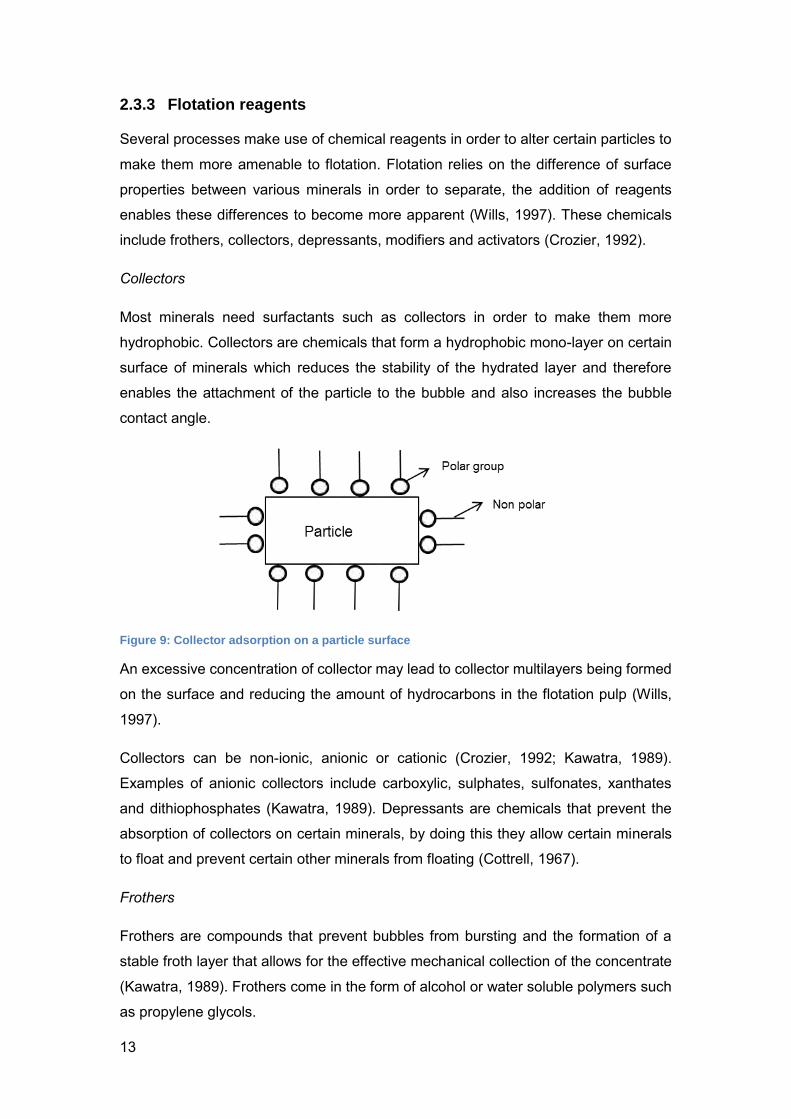
Frothers are hetero-polar surface-active molecules that are adsorbed onto the gas-
liquid interface of the bubble. The polar structure of the frother reacts with the water
dipoles and the non-polar (hydrocarbon) group is forced into the gas phase. Frothers
surround the air bubble as shown by Figure 10, and hence reduce the surface tension,
hence making the bubbles more stable.
Most flotation processes employ the use of at least two frothers in order to stabilise the
froth and to control the dynamics of the flotation process (Wills, 1997).
Effect of pH
The selectivity and therefore separation of minerals is dependent on a balance
between reagents and pH. Due to the stability of collectors in an alkaline medium,
successful flotation occurs in an alkaline medium. In mining operations, the pH is
controlled by the addition of various chemicals. In order to increase the pH, lime,
sodium hydroxide and ammonia are added to the pulp and acids such as sulphuric
acid are added to reduce the pH. Work done by Mezunda (2011) showed that in terms
of the flotation of PGMs, the highest grade was achieved at a pH of 6 and the highest
recovery was achieved at a pH of 9. This was due to the stability of the xanthate
collector in alkali conditions. However, at a pH of 11 (as shown in Figure 11), xanthate
collectors become highly stable and this reduces their collecting ability. Given these
pH ranges, balance between reagent usage and pH is vital (Muzendu et al., 2011;
Wills, 1997).
Water
Gas
Polar
Non-polar
Figure 10: Schematic showing action of the frothers (right) and bubble (left) in flotation pulp (Wills, 1997)
15
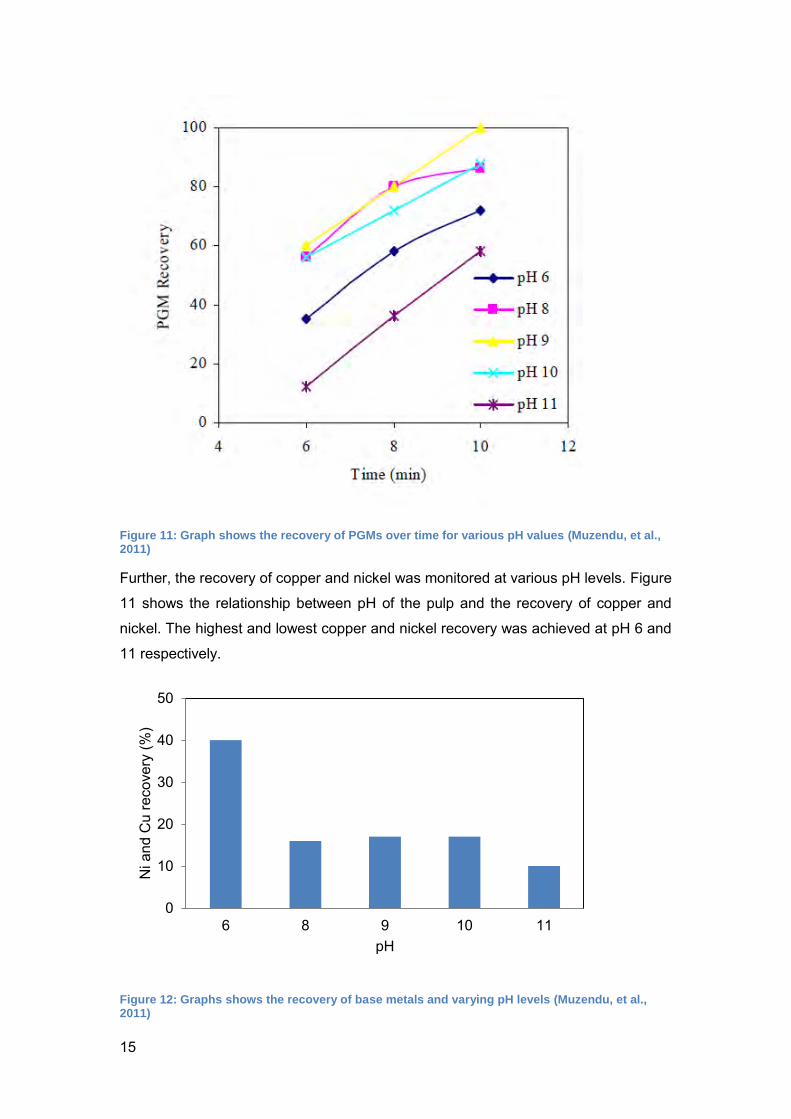
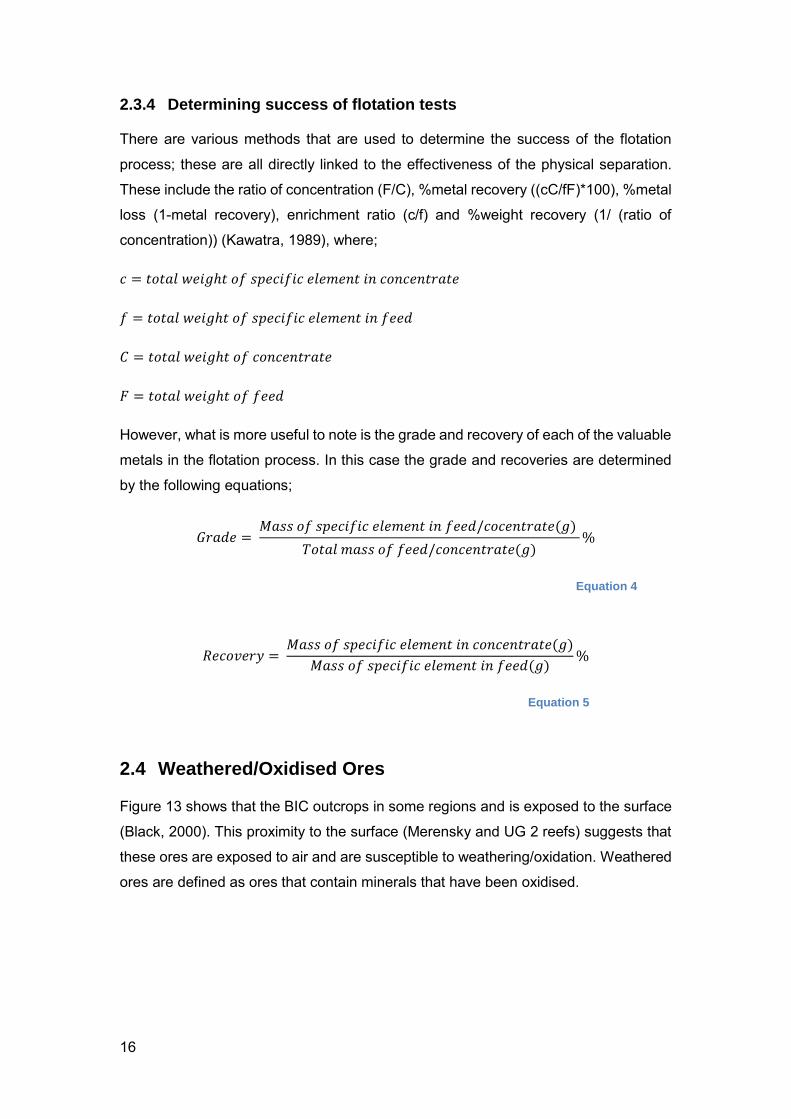
Figure 11: Graph shows the recovery of PGMs over time for various pH values (Muzendu, et al., 2011)
Further, the recovery of copper and nickel was monitored at various pH levels. Figure
11 shows the relationship between pH of the pulp and the recovery of copper and
nickel. The highest and lowest copper and nickel recovery was achieved at pH 6 and
11 respectively.
Figure 12: Graphs shows the recovery of base metals and varying pH levels (Muzendu, et al., 2011)
0
10
20
30
40
50
6 8 9 10 11
Ni a
nd C
u re
cove
ry (%
)
pH
16
2.3.4 Determining success of flotation tests
There are various methods that are used to determine the success of the flotation
process; these are all directly linked to the effectiveness of the physical separation.
These include the ratio of concentration (F/C), %metal recovery ((cC/fF)*100), %metal
loss (1-metal recovery), enrichment ratio (c/f) and %weight recovery (1/ (ratio of
concentration)) (Kawatra, 1989), where;
𝑐 = 𝑡𝑜𝑡𝑎𝑙 𝑤𝑒𝑖𝑔ℎ𝑡 𝑜𝑓 𝑠𝑝𝑒𝑐𝑖𝑓𝑖𝑐 𝑒𝑙𝑒𝑚𝑒𝑛𝑡 𝑖𝑛 𝑐𝑜𝑛𝑐𝑒𝑛𝑡𝑟𝑎𝑡𝑒
𝑓 = 𝑡𝑜𝑡𝑎𝑙 𝑤𝑒𝑖𝑔ℎ𝑡 𝑜𝑓 𝑠𝑝𝑒𝑐𝑖𝑓𝑖𝑐 𝑒𝑙𝑒𝑚𝑒𝑛𝑡 𝑖𝑛 𝑓𝑒𝑒𝑑
𝐶 = 𝑡𝑜𝑡𝑎𝑙 𝑤𝑒𝑖𝑔ℎ𝑡 𝑜𝑓 𝑐𝑜𝑛𝑐𝑒𝑛𝑡𝑟𝑎𝑡𝑒
𝐹 = 𝑡𝑜𝑡𝑎𝑙 𝑤𝑒𝑖𝑔ℎ𝑡 𝑜𝑓 𝑓𝑒𝑒𝑑
However, what is more useful to note is the grade and recovery of each of the valuable
metals in the flotation process. In this case the grade and recoveries are determined
by the following equations;
𝐺𝑟𝑎𝑑𝑒 = 𝑀𝑎𝑠𝑠 𝑜𝑓 𝑠𝑝𝑒𝑐𝑖𝑓𝑖𝑐 𝑒𝑙𝑒𝑚𝑒𝑛𝑡 𝑖𝑛 𝑓𝑒𝑒𝑑/𝑐𝑜𝑐𝑒𝑛𝑡𝑟𝑎𝑡𝑒(𝑔)
𝑇𝑜𝑡𝑎𝑙 𝑚𝑎𝑠𝑠 𝑜𝑓 𝑓𝑒𝑒𝑑/𝑐𝑜𝑛𝑐𝑒𝑛𝑡𝑟𝑎𝑡𝑒(𝑔)%
Equation 4
𝑅𝑒𝑐𝑜𝑣𝑒𝑟𝑦 = 𝑀𝑎𝑠𝑠 𝑜𝑓 𝑠𝑝𝑒𝑐𝑖𝑓𝑖𝑐 𝑒𝑙𝑒𝑚𝑒𝑛𝑡 𝑖𝑛 𝑐𝑜𝑛𝑐𝑒𝑛𝑡𝑟𝑎𝑡𝑒(𝑔)
𝑀𝑎𝑠𝑠 𝑜𝑓 𝑠𝑝𝑒𝑐𝑖𝑓𝑖𝑐 𝑒𝑙𝑒𝑚𝑒𝑛𝑡 𝑖𝑛 𝑓𝑒𝑒𝑑(𝑔)%
Equation 5
2.4 Weathered/Oxidised Ores
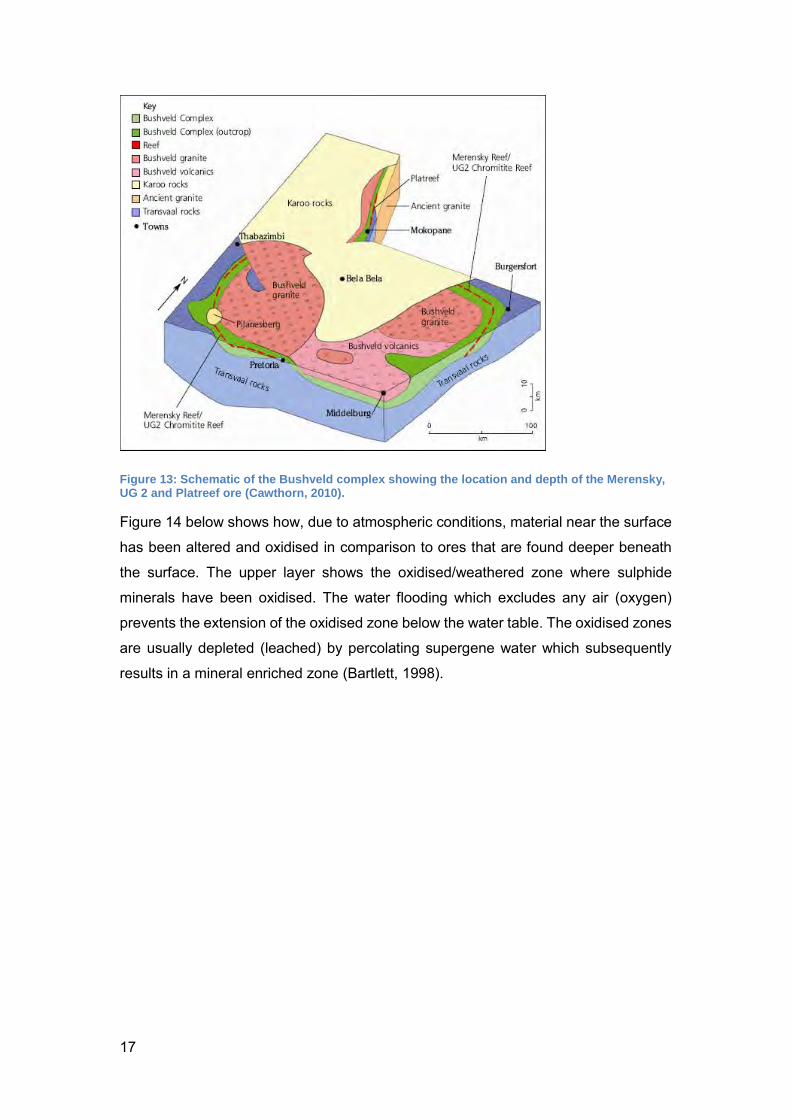
Figure 13 shows that the BIC outcrops in some regions and is exposed to the surface
(Black, 2000). This proximity to the surface (Merensky and UG 2 reefs) suggests that
these ores are exposed to air and are susceptible to weathering/oxidation. Weathered
ores are defined as ores that contain minerals that have been oxidised.
17
Figure 13: Schematic of the Bushveld complex showing the location and depth of the Merensky, UG 2 and Platreef ore (Cawthorn, 2010).
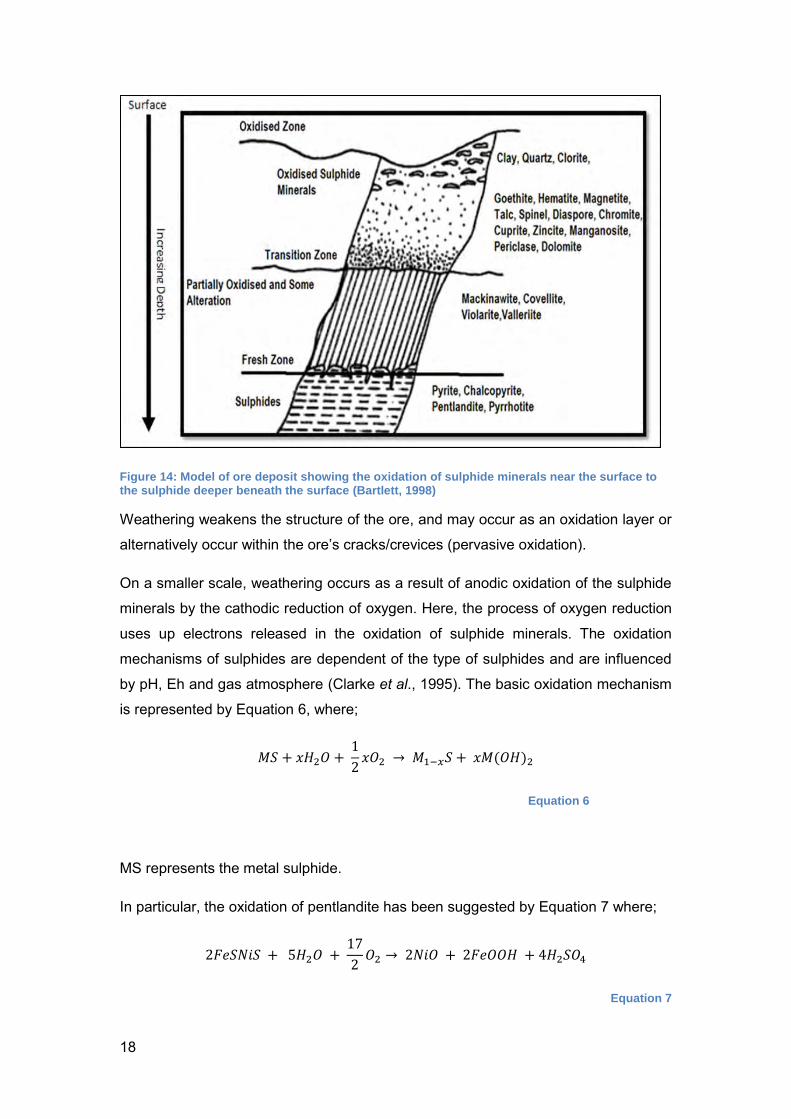
Figure 14 below shows how, due to atmospheric conditions, material near the surface
has been altered and oxidised in comparison to ores that are found deeper beneath
the surface. The upper layer shows the oxidised/weathered zone where sulphide
minerals have been oxidised. The water flooding which excludes any air (oxygen)
prevents the extension of the oxidised zone below the water table. The oxidised zones
are usually depleted (leached) by percolating supergene water which subsequently
results in a mineral enriched zone (Bartlett, 1998).
18
Figure 14: Model of ore deposit showing the oxidation of sulphide minerals near the surface to the sulphide deeper beneath the surface (Bartlett, 1998)
Weathering weakens the structure of the ore, and may occur as an oxidation layer or
alternatively occur within the ore’s cracks/crevices (pervasive oxidation).
On a smaller scale, weathering occurs as a result of anodic oxidation of the sulphide
minerals by the cathodic reduction of oxygen. Here, the process of oxygen reduction
uses up electrons released in the oxidation of sulphide minerals. The oxidation
mechanisms of sulphides are dependent of the type of sulphides and are influenced
by pH, Eh and gas atmosphere (Clarke et al., 1995). The basic oxidation mechanism
is represented by Equation 6, where;
𝑀𝑆 + 𝑥𝐻2𝑂 + 1
2𝑥𝑂2 → 𝑀1−𝑥𝑆 + 𝑥𝑀(𝑂𝐻)2
Equation 6
MS represents the metal sulphide.
In particular, the oxidation of pentlandite has been suggested by Equation 7 where;
2𝐹𝑒𝑆𝑁𝑖𝑆 + 5𝐻2𝑂 + 17
2𝑂2 → 2𝑁𝑖𝑂 + 2𝐹𝑒𝑂𝑂𝐻 + 4𝐻2𝑆𝑂4
Equation 7
19
However, Smart et al. (1996) recognise that the actual oxidation process is more
complex. The mechanisms of surface oxidation and the subsequent formation of
oxidation products can be summarised as:
1. metal deficient (sulphur rich), oxide surfaces, polysulphides and elemental
sulphur;
2. oxidised fine particles attached to larger sulphide particles;
3. colloidal metal hydroxides particles and flocs;
4. layers of hydroxides and oxides;
5. formation of sulphate and carbonate species;
6. non-uniform spatial distribution with different oxidation rates.
Several investigations into the nature and composition of the oxidation process have
been summarised in the following section.
2.4.1 Oxidation layer
Smart (1991) showed that the surfaces of oxidised sulphur minerals contained a thick
carbonaceous layer which is hydrophilic, particularly on pyrite and chalcopyrite ores.
This reduces their floatability. This study concluded that effective flotation was
dependent on the amount of clean surface of particle that was able to attach to air
bubbles.
Research conducted on the oxidation of pyrrhotite and pentlandite showed that
pyrrhotite oxidises more rapidly than other sulphide minerals such as pentlandite
(Legrand, Bancroft & Nesbitt, 2005; Koski et al., 2008). In the case of both pentlandite
and pyrrhotite, the study alludes to the formation of FeOOH on the mineral surface.
During oxidation the iron species migrate from the bulk of the mineral to the surface
and are oxidised there. Further, Ni(OH) 2 and NiSO4 were found on the pentlandite
surface. This layer hinders the flotation performance of these minerals (Legrand,
Bancroft & Nesbitt, 2005).
In terms of specific minerals, Becker (2009) shows that pyrrhotite is more susceptible
to oxidation in comparison to other sulphide minerals such as pentlandite ((Fe, Ni)9S8),
pyrite (FeS2) and chalcopyrite (CuFeS). This leads to the poor flotation of the pyrrhotite
mineral. Therefore any ore body that is dominated by pyrrhotite would be more difficult
to float.
20
Newell et al. (2006) showed that oxidation had more of an impact on finer size fractions
(especially for pyrrhotite), and therefore lower flotation recoveries of oxidised PGM are
expected with finer size particles.
2.4.2 Case study: Main Sulphide Zone (MSZ), Great Dyke
Another region in Southern Africa with an abundance of weathered/oxidised ore is the
Great Dyke region in Zimbabwe. The Great Dyke consists of the world’s second largest
PGE reserves (160-250Mt) after the South African BIC (Obethur et al., 2013). In an
attempt to compare the PGE grades of the two regions, the Merensky and UG2 grades
are typically 7-9 g/t and the Platreef generally has a grade of 3-4 g/t (Cawthorn, 2010;
Kinnaird, 2005). This is in comparison to a grade of 3.5-3.9 g/t in the MSZ region
(Obethur, et al., 2013).The Main Sulphide Zone (MSZ) of the Great Dyke Zimbabwe is
approximately 1.5-4 m wide and linearly extends over 550km NNE.
The MSZ is characterised by vertical patterns of base metal sulphides and PGE
distribution. The MSZ is further divided into a lower PGE subzone (which is further
subdivided into lower Pd>Pt zones and upper Pd<Pt zones) and an upper BMS
subzone. Pervasive oxidation is often deeper than 30m below the surface
During oxidation/weathering, the metal sulphides partly release their metals and are
replaced by iron oxides/hydroxides. This is particularly true for base metal sulphides.
In terms of PGMs, approximately 50% of Pd is lost/ transported by acidic surface
waters. Pd is evidently more mobile than Pt. PGMs are redistributed and are found as
secondary PGMs in ill-defined PGM oxides/hydroxides, Fe/Mn/Co hydroxides and
secondary silicates. These forms make it difficult to recover PGMs using the
conventional processes.
The near surface oxidised MSZ ores have large PGE potential and are a resource
worth tapping into. The early attempts to mine this ore were the Old Wedza mine and
the Hartley mine in the 1920’s and 1990’s respectively. However due to low PGE
(<<50%) recoveries achieved by conventional metallurgical methods such as
gravitational concentration and flotation, these attempts were uneconomical.
Therefore studies have been focussed on using bulk leaching (hydrometallurgical
methods) in order to recover PGMs. Success has been achieved with lixiviants such
as acid and organic complexing ligands. Higher PGM recoveries (>50%) have been
observed with single stage and multi-step hydrometallurgical processes. This work is
closely linked to the chemical and mineralogical behaviour of weathered BIC ores
(focussing on Platreef ores) (Obethur et al., 2013).
21
2.5 Flotation of Oxidised Ores
2.5.1 Effect of oxidation on flotation
Flotation recovery rapidly decreases with increasing oxidation of mineral surfaces and
leads to low PGM ore recoveries (<50%) via the conventional metallurgical method
(Obethur, et al., 2013). The efficiency of the flotation process is highly dependent on
the mineral surface and the addition of collector molecules that create a hydrophobic
effect for successful bubble-particle attachment. On a surface level, oxidised sulphide
minerals are surrounded by a surface of base metal oxides/hydroxides that inhibit
collector adsorption (Boulton, 2002; Clarke et al., 1995). However, it can also be noted
that in some cases, the role of collectors is to counteract the hydrophilic effect of metal
hydroxides rather than improve the hydrophobic nature of floating minerals (Smart et
al., 1996)
Smart et al. (1996) studied the effect of ethyl xanthate collector on an oxidised surface
layer and shed some light on the concentrations of ethyl xanthate required to achieve
effective removal of oxidative products and the surface layer. The authors work shows
that a collector such as xanthate or EDTA can function as a surface cleaning agent.
This is facilitated by the formation of iron, copper or lead hydroxyl xanthate species
and demonstrated by Equation 8
𝑃𝑏𝑆. 𝑦𝑃𝑏(𝑂𝐻)2 + 2𝑦𝐸𝑋− → 𝑃𝑏𝑆. 𝑦𝑃𝑏(𝐸𝑋)2 + 2𝑦𝑂𝐻−
Equation 8
Where the collector EX is seen to replace the OH group of the metal hydroxide group
of the metal hydroxide. Prestidge et al. (1995) discovered that xanthate concentrations
higher than the conventional flotation required concentrations were needed in order to
dissolve the surface oxidation layer.
In order to completely understand the effect of oxidation on flotation, a closer look at
the various techniques that have been established in an attempt to remove or
counteract the effect of this oxidation layer is formed on the surface.
2.5.2 Improvement techniques
There are several techniques that have been investigated in an attempt to improve the
efficiency of the flotation of oxidised ores. These include sulfidisation, ultrasonic
treatments, the use of hydroxamate collectors and an acid pre-treatment.
22
Sulfidisation of oxidised pentlandite
In general, sulfidisation involves an aqueous conversion of a non-sulphide mineral
surface to a sulphide-like mineral surface. The sulfidisation mechanism involves the
formation of base metal sulphides on the oxidised mineral surface from their
corresponding base metal species either through a conversion of base metal
hydroxides or a precipitation process (Newell & Bradshaw, 2007).
The conversion of base metals includes the adsorption of hydrosulphide ions onto the
mineral followed by the anionic exchange to create a sulphide surface (Newell &
Bradshaw, 2007). Another school of thought is that the precipitation of base metal
sulphides on the surface of the oxidised ore occurs particularly at low hydrosulphide
concentrations (Zhou & Chander, 1993). The sulfidisation process subsequently
renders the ore more amenable to flotation (Newell & Bradshaw, 2007).
The sulfidisation mechanism is dependent on the type of oxidised sulphide mineral. As
an example, oxidised chalcopyrite and pentlandite ores were sulfurized by an anionic
exchange which led to the formation of chalcocite-like surfaces. Alternatively, oxidised
pyrrhotite appeared to be sulfurized via both an anionic exchange and the precipitation
of base metals. In the case where sulfidisation of pentlandite was investigated, it was
found that the flotation of oxidised pentlandite was successfully restored, largely due
to the formation of copper and iron sulphides on the oxidised surface. In general, the
addition of base metal ions during sulfidisation provides a viable technique for the
flotation recovery of oxidised base metal and precious metal minerals (Newell &
Bradshaw, 2007).
One of the main disadvantages of sulfidisation is that in a plant scenario an optimum
result for this technique is highly dependent on reagent conditioning time, mixing
properties and other variables which lead to poor reproducibility (Castro et al., 1974).
Ultrasonic treatment
Ultrasonic treatment involves the intense shaking of mineral particles to remove the
surface oxidation layer in order to expose a cleaner surface for the flotation process.
A mineral that responds positively to the ultrasonic treatment has mainly undergone
surface level oxidation. Figure 15 shows the effect of an ultrasonic treatment on the
flotation recoveries of an oxidised Merensky type ore (Newell et al., 2006).
23
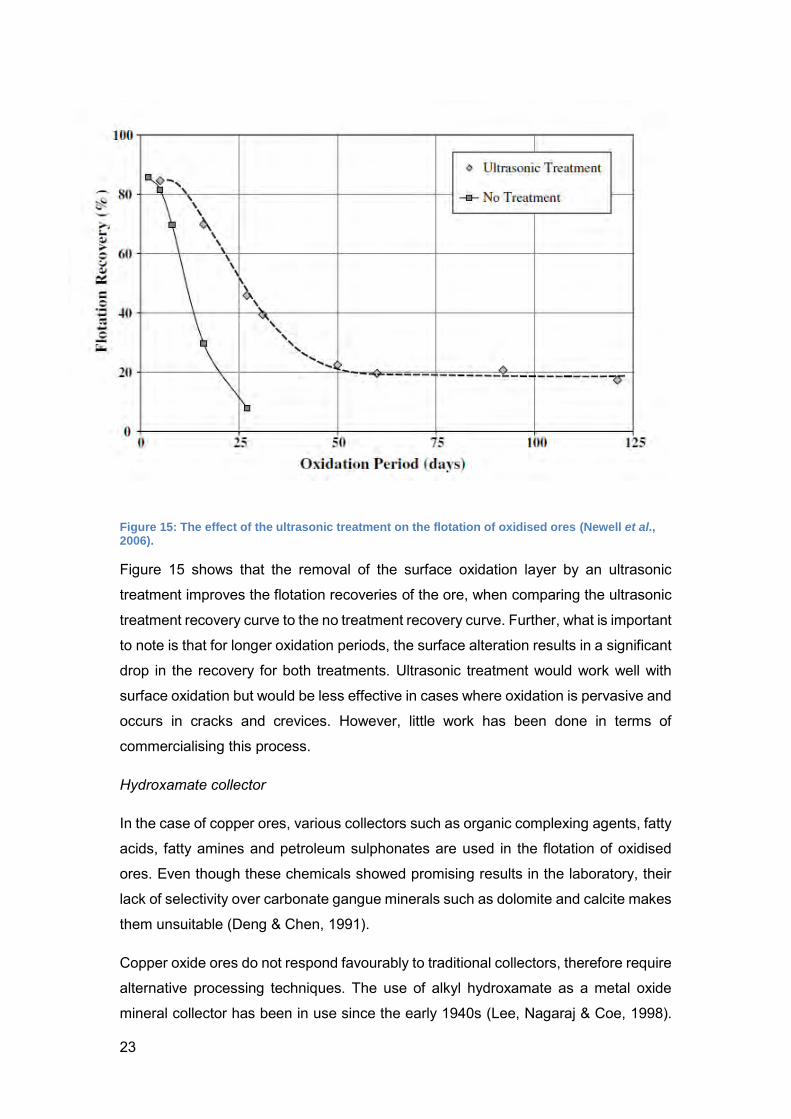
Figure 15: The effect of the ultrasonic treatment on the flotation of oxidised ores (Newell et al., 2006).
Figure 15 shows that the removal of the surface oxidation layer by an ultrasonic
treatment improves the flotation recoveries of the ore, when comparing the ultrasonic
treatment recovery curve to the no treatment recovery curve. Further, what is important
to note is that for longer oxidation periods, the surface alteration results in a significant
drop in the recovery for both treatments. Ultrasonic treatment would work well with
surface oxidation but would be less effective in cases where oxidation is pervasive and
occurs in cracks and crevices. However, little work has been done in terms of
commercialising this process.
Hydroxamate collector
In the case of copper ores, various collectors such as organic complexing agents, fatty
acids, fatty amines and petroleum sulphonates are used in the flotation of oxidised
ores. Even though these chemicals showed promising results in the laboratory, their
lack of selectivity over carbonate gangue minerals such as dolomite and calcite makes
them unsuitable (Deng & Chen, 1991).
Copper oxide ores do not respond favourably to traditional collectors, therefore require
alternative processing techniques. The use of alkyl hydroxamate as a metal oxide
mineral collector has been in use since the early 1940s (Lee, Nagaraj & Coe, 1998).
24
Today, several operations are currently using alkyl hydroxamates synthesized by
Ausmelt is supplied as an alkaline chemical. The hydroxamate collector is potassium
hydrogen n-octano hydroxamate (AM28 made by Ausmelt Limited). It is a non-
hazardous product that works best at a pH above 6. It forms a relatively thick
hydrophobic layer on mineral surfaces (Lee et al., 2009)
An investigation by Lee et al. (2009) has showed that using AM28 in conjunction with
traditional sulphide collectors such as Xanthate can successfully simultaneously
recover copper sulphides and oxides by flotation from a blend of sulphide and oxide
ores. An improvement in the recovery of base metals such as copper, would result in
an improvement in the PGMs that are associated with base metals.
However, in an investigation of the use of alkyl hydroxamate (AM28) co-collector in the
treatment of oxidised ores, Becker Wiese & Ramonotsi (2014) discovered that a 39%
improvement in PGE recoveries was due to increased froth stability and water recovery
rather than the selective action of the collector.
Acid pre-treatment
Another way of improving the flotation of oxidised sulphide mineral is to use a chemical
to dissolve the oxy/hydroxide layer, exposing a clean sulphide layer for effective
collector adsorption. The technique of using low concentrations of sulphuric acid to
digest and dissolve the layer was investigated by Ramonotsi (2011). This process,
which is called pre-leaching or non-oxidative leaching, requires the treatment of the
ore using a less-than stoichiometric amount of H2SO4. Stoichiometric amounts were
used to maintain the appropriate pH level for the flotation cell.
Results of the investigation show that the acid pre-leach improved flotation recoveries
by over 20%. However, these treatments also led to poor grade-recovery curves as
the acid was non-selective and was suspected to activate gangue minerals
(Ramonotsi, 2011). Further, due to its corrosive nature, new infrastructure would have
to be established to make this a viable option and a neutralising stage would have to
be introduced in order to raise the pH of the slurry (flotation cells are operated at a pH
of 9).
2.6 Ammonia Leaching
Leaching is defined by the process of extracting soluble minerals from a solid (ore) by
means of a solvent. This can be by either opening up of the ores to solubilize the metal
25
values or leaching easily soluble constitutes such as gangue in order to obtain a more
concentrated ore (Habashi, 1999; Gupta, 2003).
According to Habashi (1999), the choice of a leaching reagent is dependent on several
factors. The solubility of a reagent is its ability to dissolve the required mineral. For
economical purposes, not only must a lixiviant be able to dissolve the required mineral
but also be moderately selective, as this minimizes reagent usage. Another important
aspect of regeneration of a reagent is the ability to regenerate and possibly reuse a
solvent that reduces both operating costs and any environmental impacts that maybe
associated with reagent disposal.
In most cases sulphuric acid is the most common choice, however its ability to dissolve
gangue material increases the amount of acid consumption, thus a more selective
reagent is needed for such deposits (Liu & Tang, 2010).
2.6.1 Dissolution mechanism
Ammonia leaching is based on its ability of aqueous ammonia to form amine
complexes which stabilise metals in solution at alkaline pH. With the exception of
molybdenum, ammonia forms water-soluble complexes with transition metals. This
forms the chemical core of the use of ammonia in metallurgy. (Milbourne, et al., 2003;
Welham, et al., 2010; D & Madigan, 1975).
Ammonia leaching requires an oxidant to oxidize sulphide minerals. Several oxidants
such as bromates, chlorates, oxygen, peroxides and persulfates have been utilised in
the leaching of copper sulphides. Oxygen (which can be supplied as compressed air),
being the least expensive, has been widely used in the dissolution of base metal
sulphides (Bell, et al., 1995).
Ammonia can exist in several forms, and these include free ammonia (NH3),
ammonium ions (NH4+) and metal ammines. For the leaching of base metals, free
ammonia can be considered as the active complexing agent and reacts with metal ions
(Habashi, 1993). Equation 9 shows this reaction.
𝑀2+ + 6𝑁𝐻3 → [𝑀(𝑁𝐻3)4]2+
Equation 9
Ammonia is very soluble in water and the equilibrium in Equation 10 demonstrates the
solubility of ammonia in water (Osseo-Asare et al., 1983).
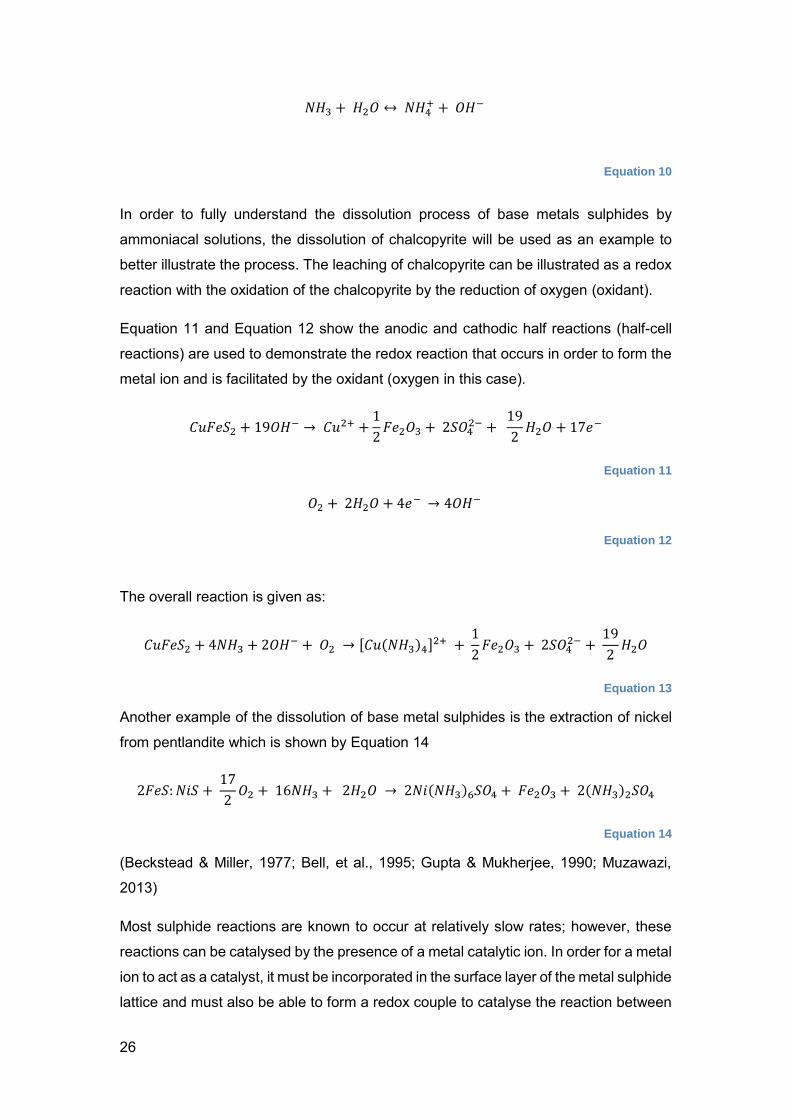
26
𝑁𝐻3 + 𝐻2𝑂 ↔ 𝑁𝐻4+ + 𝑂𝐻−
Equation 10
In order to fully understand the dissolution process of base metals sulphides by
ammoniacal solutions, the dissolution of chalcopyrite will be used as an example to
better illustrate the process. The leaching of chalcopyrite can be illustrated as a redox
reaction with the oxidation of the chalcopyrite by the reduction of oxygen (oxidant).
Equation 11 and Equation 12 show the anodic and cathodic half reactions (half-cell
reactions) are used to demonstrate the redox reaction that occurs in order to form the
metal ion and is facilitated by the oxidant (oxygen in this case).
𝐶𝑢𝐹𝑒𝑆2 + 19𝑂𝐻− → 𝐶𝑢2+ +1
2𝐹𝑒2𝑂3 + 2𝑆𝑂4
2− + 19
2𝐻2𝑂 + 17𝑒−
Equation 11
𝑂2 + 2𝐻2𝑂 + 4𝑒− → 4𝑂𝐻−
Equation 12
The overall reaction is given as:
𝐶𝑢𝐹𝑒𝑆2 + 4𝑁𝐻3 + 2𝑂𝐻− + 𝑂2 → [𝐶𝑢(𝑁𝐻3)4]2+ + 1
2𝐹𝑒2𝑂3 + 2𝑆𝑂4
2− + 19
2𝐻2𝑂
Equation 13
Another example of the dissolution of base metal sulphides is the extraction of nickel
from pentlandite which is shown by Equation 14
2𝐹𝑒𝑆: 𝑁𝑖𝑆 + 17
2𝑂2 + 16𝑁𝐻3 + 2𝐻2𝑂 → 2𝑁𝑖(𝑁𝐻3)6𝑆𝑂4 + 𝐹𝑒2𝑂3 + 2(𝑁𝐻3)2𝑆𝑂4
Equation 14
(Beckstead & Miller, 1977; Bell, et al., 1995; Gupta & Mukherjee, 1990; Muzawazi,
2013)
Most sulphide reactions are known to occur at relatively slow rates; however, these
reactions can be catalysed by the presence of a metal catalytic ion. In order for a metal
ion to act as a catalyst, it must be incorporated in the surface layer of the metal sulphide
lattice and must also be able to form a redox couple to catalyse the reaction between
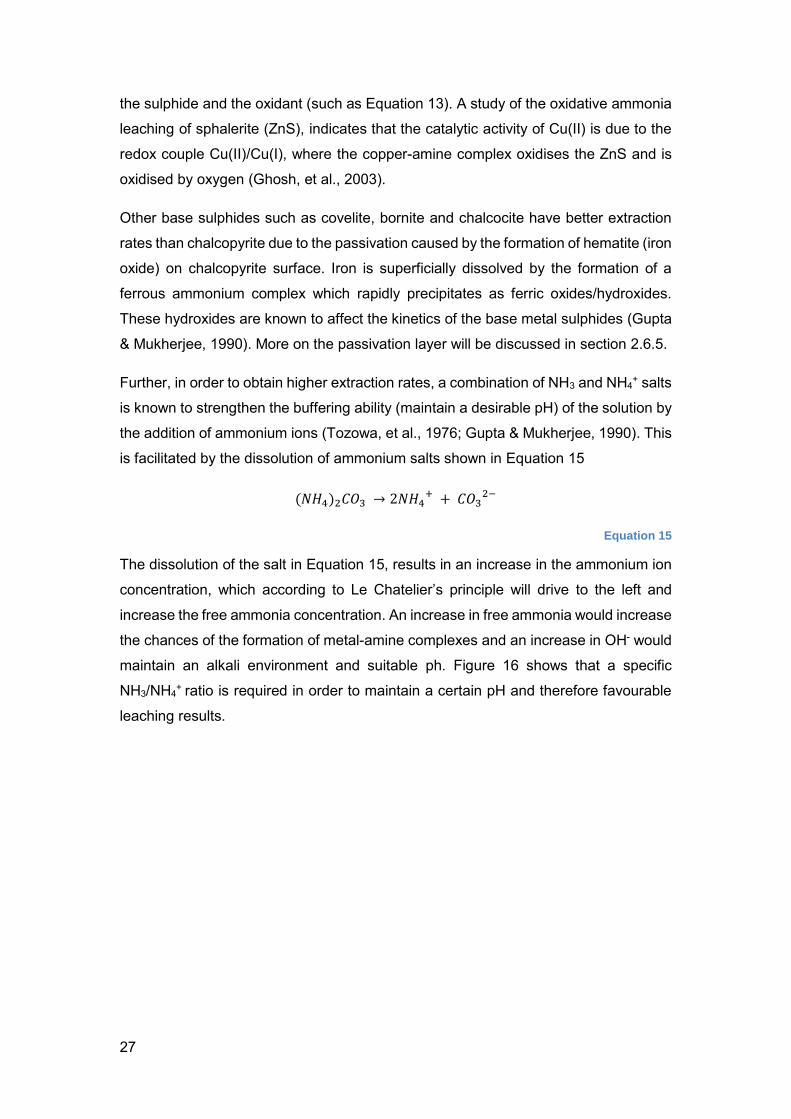
27
the sulphide and the oxidant (such as Equation 13). A study of the oxidative ammonia
leaching of sphalerite (ZnS), indicates that the catalytic activity of Cu(II) is due to the
redox couple Cu(II)/Cu(I), where the copper-amine complex oxidises the ZnS and is
oxidised by oxygen (Ghosh, et al., 2003).
Other base sulphides such as covelite, bornite and chalcocite have better extraction
rates than chalcopyrite due to the passivation caused by the formation of hematite (iron
oxide) on chalcopyrite surface. Iron is superficially dissolved by the formation of a
ferrous ammonium complex which rapidly precipitates as ferric oxides/hydroxides.
These hydroxides are known to affect the kinetics of the base metal sulphides (Gupta
& Mukherjee, 1990). More on the passivation layer will be discussed in section 2.6.5.
Further, in order to obtain higher extraction rates, a combination of NH3 and NH4+ salts
is known to strengthen the buffering ability (maintain a desirable pH) of the solution by
the addition of ammonium ions (Tozowa, et al., 1976; Gupta & Mukherjee, 1990). This
is facilitated by the dissolution of ammonium salts shown in Equation 15
(𝑁𝐻4)2𝐶𝑂3 → 2𝑁𝐻4+ + 𝐶𝑂3
2−
Equation 15
The dissolution of the salt in Equation 15, results in an increase in the ammonium ion
concentration, which according to Le Chatelier’s principle will drive to the left and
increase the free ammonia concentration. An increase in free ammonia would increase
the chances of the formation of metal-amine complexes and an increase in OH- would
maintain an alkali environment and suitable ph. Figure 16 shows that a specific
NH3/NH4+ ratio is required in order to maintain a certain pH and therefore favourable
leaching results.
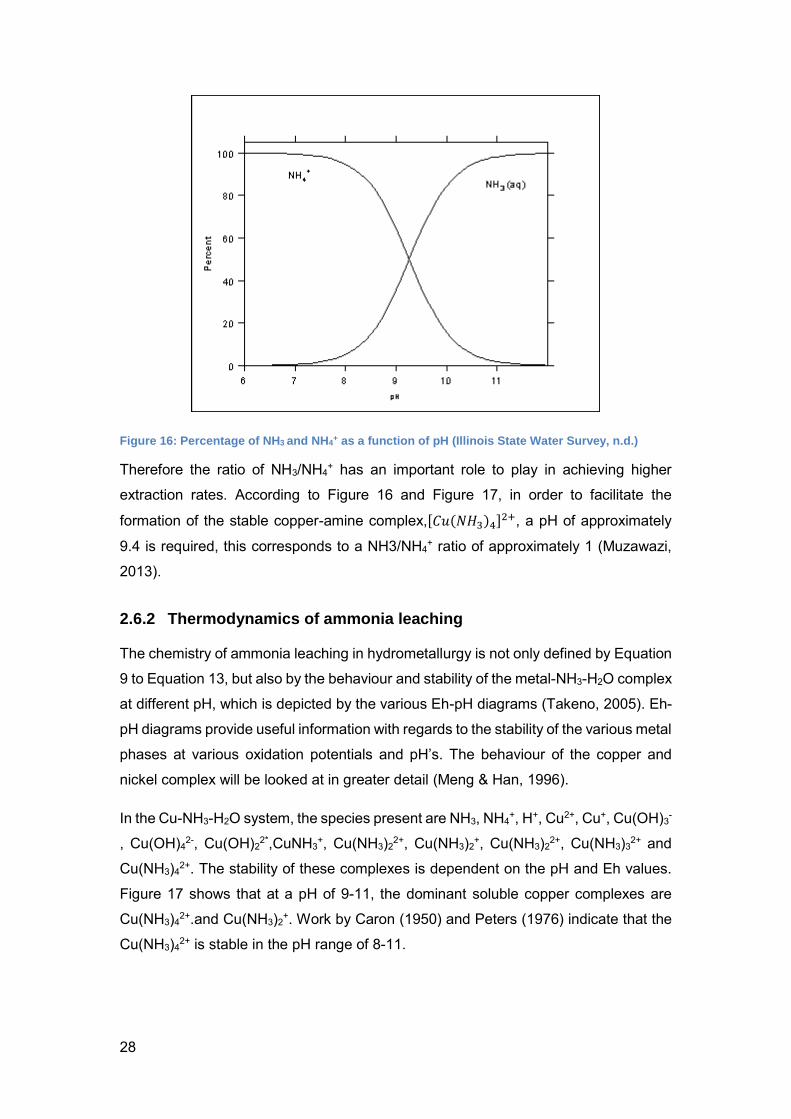
28
Figure 16: Percentage of NH3 and NH4+ as a function of pH (Illinois State Water Survey, n.d.)
Therefore the ratio of NH3/NH4+ has an important role to play in achieving higher
extraction rates. According to Figure 16 and Figure 17, in order to facilitate the
formation of the stable copper-amine complex,[𝐶𝑢(𝑁𝐻3)4]2+, a pH of approximately
9.4 is required, this corresponds to a NH3/NH4+ ratio of approximately 1 (Muzawazi,
2013).
2.6.2 Thermodynamics of ammonia leaching
The chemistry of ammonia leaching in hydrometallurgy is not only defined by Equation
9 to Equation 13, but also by the behaviour and stability of the metal-NH3-H2O complex
at different pH, which is depicted by the various Eh-pH diagrams (Takeno, 2005). Eh-
pH diagrams provide useful information with regards to the stability of the various metal
phases at various oxidation potentials and pH’s. The behaviour of the copper and
nickel complex will be looked at in greater detail (Meng & Han, 1996).
In the Cu-NH3-H2O system, the species present are NH3, NH4+, H+, Cu2+, Cu+, Cu(OH)3
-
, Cu(OH)42-, Cu(OH)2
2*,CuNH3+, Cu(NH3)2
2+, Cu(NH3)2+, Cu(NH3)2
2+, Cu(NH3)32+ and
Cu(NH3)42+. The stability of these complexes is dependent on the pH and Eh values.
Figure 17 shows that at a pH of 9-11, the dominant soluble copper complexes are
Cu(NH3)42+.and Cu(NH3)2
+. Work by Caron (1950) and Peters (1976) indicate that the
Cu(NH3)42+ is stable in the pH range of 8-11.
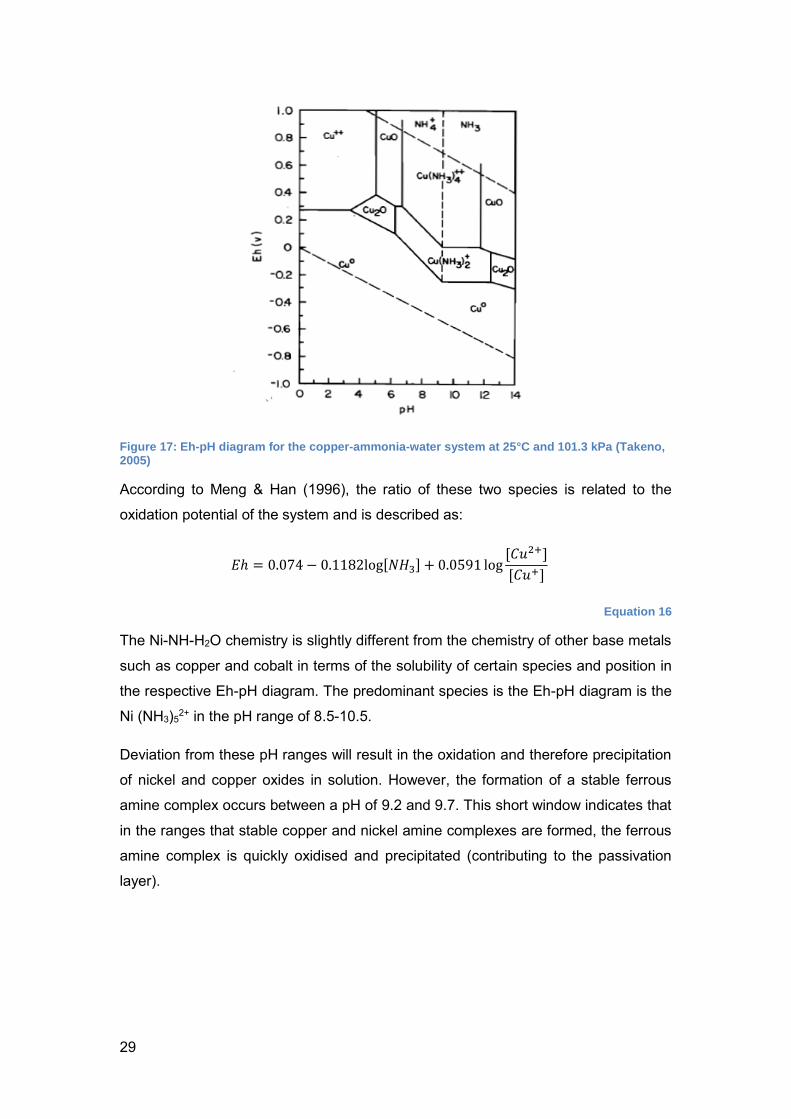
29
Figure 17: Eh-pH diagram for the copper-ammonia-water system at 25°C and 101.3 kPa (Takeno, 2005)
According to Meng & Han (1996), the ratio of these two species is related to the
oxidation potential of the system and is described as:
𝐸ℎ = 0.074 − 0.1182log[𝑁𝐻3] + 0.0591 log[𝐶𝑢2+]
[𝐶𝑢+]
Equation 16
The Ni-NH-H2O chemistry is slightly different from the chemistry of other base metals
such as copper and cobalt in terms of the solubility of certain species and position in
the respective Eh-pH diagram. The predominant species is the Eh-pH diagram is the
Ni (NH3)52+ in the pH range of 8.5-10.5.
Deviation from these pH ranges will result in the oxidation and therefore precipitation
of nickel and copper oxides in solution. However, the formation of a stable ferrous
amine complex occurs between a pH of 9.2 and 9.7. This short window indicates that
in the ranges that stable copper and nickel amine complexes are formed, the ferrous
amine complex is quickly oxidised and precipitated (contributing to the passivation
layer).
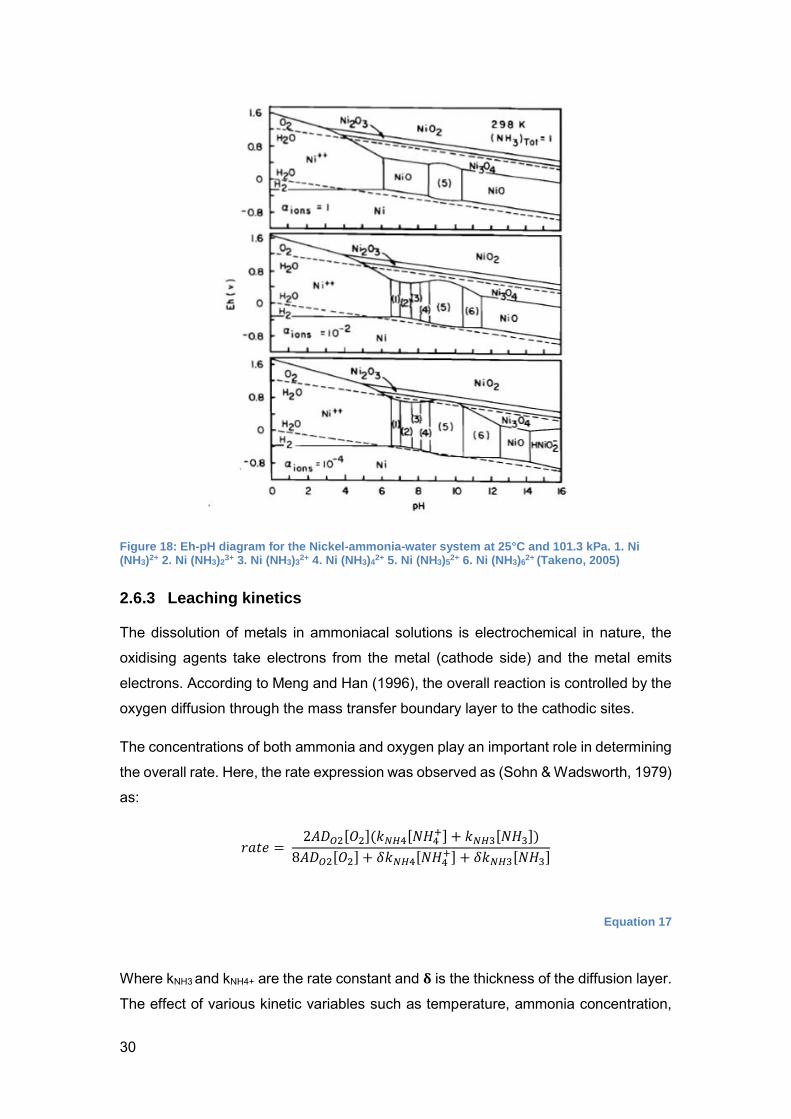
30
Figure 18: Eh-pH diagram for the Nickel-ammonia-water system at 25°C and 101.3 kPa. 1. Ni (NH3)2+ 2. Ni (NH3)2
3+ 3. Ni (NH3)32+ 4. Ni (NH3)4
2+ 5. Ni (NH3)52+ 6. Ni (NH3)6
2+ (Takeno, 2005)
2.6.3 Leaching kinetics
The dissolution of metals in ammoniacal solutions is electrochemical in nature, the
oxidising agents take electrons from the metal (cathode side) and the metal emits
electrons. According to Meng and Han (1996), the overall reaction is controlled by the
oxygen diffusion through the mass transfer boundary layer to the cathodic sites.
The concentrations of both ammonia and oxygen play an important role in determining
the overall rate. Here, the rate expression was observed as (Sohn & Wadsworth, 1979)
as:
𝑟𝑎𝑡𝑒 = 2𝐴𝐷𝑂2[𝑂2](𝑘𝑁𝐻4[𝑁𝐻4
+] + 𝑘𝑁𝐻3[𝑁𝐻3])
8𝐴𝐷𝑂2[𝑂2] + 𝛿𝑘𝑁𝐻4[𝑁𝐻4+] + 𝛿𝑘𝑁𝐻3[𝑁𝐻3]
Equation 17
Where kNH3 and kNH4+ are the rate constant and 𝛅 is the thickness of the diffusion layer.
The effect of various kinetic variables such as temperature, ammonia concentration,
31
pulp density, leaching time and particle size has been widely investigated and will be
further discussed.
Effect of temperature
Studies have shown that copper extraction is highly dependent on temperature. As
temperature increases, the rate of the reaction and hence the rate of copper extraction
increases (Bell, et al., 1995). An increased temperature leads to an increase in kinetic
energy of the particles, which leads to more collisions and hence more reactions.
Work done by Muzawazi (2013) showed an increase of Cu and Ni extractions by 19%
and 30% respectively after a 20°C increase in operating temperatures. Temperature
variable experiments were used to calculate initial rates and therefore activation
energies in work done by Beckstead and Miller (1977), Bell et al. (1995) and Muzawazi
(2013). Beckstead and Miller (1977) and Bell et al. (1995) both concluded that this
electrochemical reaction was limited by surface reaction mechanisms. However,
Muzawazi (2013) concluded that Ni extraction was diffusion controlled and Cu
extraction was both surface kinetics and diffusion controlled. Precautions must be
taken when dealing with temperatures above 50°C as ammonia losses and hydrolysis
may occur (see section 2.6.5)
Effect of ammonia concentration
An increase in ammonia concentration results in an increase in the amount of metal
extracted. Work by Lui & Tang (2010) shows an increase in Cu extracted from 20 –
65% when the total ammonia concentration was increased from 1M-3M. However,
what is interesting to note is that an increase above 3M had no impact on the extraction
rate. Muzawazi (2013) showed that below 3M, the dissolution reaction (for both Cu and
Ni) was first order with respect to ammonia concentration. However, above 3M, the
dissolution reaction was independent of the ammonia concentration. Beckstead and
Miller (1977) reported that rate of extraction was independent of the ammonia
concentration.
Effect of pulp density
The pulp density can be described as the solid/liquid ratio. A lower pulp density means
that there is more reactant available for the leaching process, therefore higher
extraction rates (Bingol, et al., 2005). Muzawazi investigated the effect of pulp density
in the ammoniacal leaching and found a marginal increase in total extraction with an
increase in pulp density from 1-5%. This was due to an increase in the [𝐶𝑢(𝑁𝐻3)4]2+
32
concentration as it acts as a catalyst. A marginal decrease in the extraction was noted
when the pulp density was increased to 20%. Overall, the effect of pulp density (1-
20%) over a 5 day leaching period between was negligible.
Effect of leaching time
Leaching investigations show that for a period of up to 4 hours, copper recoveries
increase with increasing leaching times. Initial leaching and dissolution of the ore is
very fast, approximately 40% within the first 5 minutes and after 30 minutes of leaching,
copper recovery increases at a slower rate. What is interesting to note is that under
low oxygen pressure, the dissolution of copper is a linear function of the leaching time
(Bingol et al., 2005).
Effect of oxygen partial pressure
Other factors such as partial pressure of oxidant which would be oxygen in this case
have been examined in literature. Earlier investigators found that because rate was
proportional to the stirring velocity (batch stirred tank reactors), this indicated that the
rate was partly controlled by the diffusion of oxygen through the solution. Alternatively
it was observed that due to the formation of a coating layer around the copper surface,
the rate may be determined by the diffusion of oxygen through this surface layer.
In order to investigate the role of oxygen in the chemical reaction, Halpern (1953)
maintained a high oxygen partial pressure above the solution to ensure that no coat
around the surface was formed and ensured the rapid transport of oxygen through the
solution. The results showed no dissolution occurred in the absence of oxygen.
Further, the rate was directly proportional to oxygen pressure, at low oxygen pressures
and was independent of oxygen pressures at higher oxygen pressures (>3atm). This
was illustrated by Figure 19.
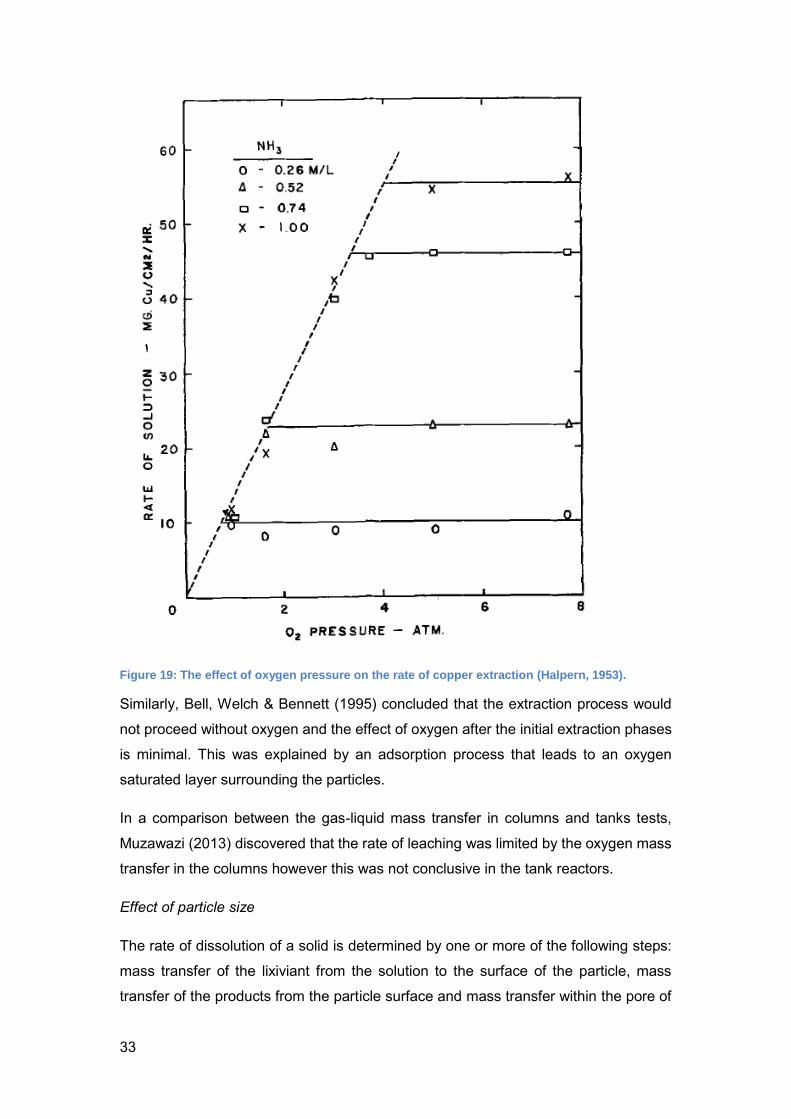
33
Figure 19: The effect of oxygen pressure on the rate of copper extraction (Halpern, 1953).
Similarly, Bell, Welch & Bennett (1995) concluded that the extraction process would
not proceed without oxygen and the effect of oxygen after the initial extraction phases
is minimal. This was explained by an adsorption process that leads to an oxygen
saturated layer surrounding the particles.
In a comparison between the gas-liquid mass transfer in columns and tanks tests,
Muzawazi (2013) discovered that the rate of leaching was limited by the oxygen mass
transfer in the columns however this was not conclusive in the tank reactors.
Effect of particle size
The rate of dissolution of a solid is determined by one or more of the following steps:
mass transfer of the lixiviant from the solution to the surface of the particle, mass
transfer of the products from the particle surface and mass transfer within the pore of
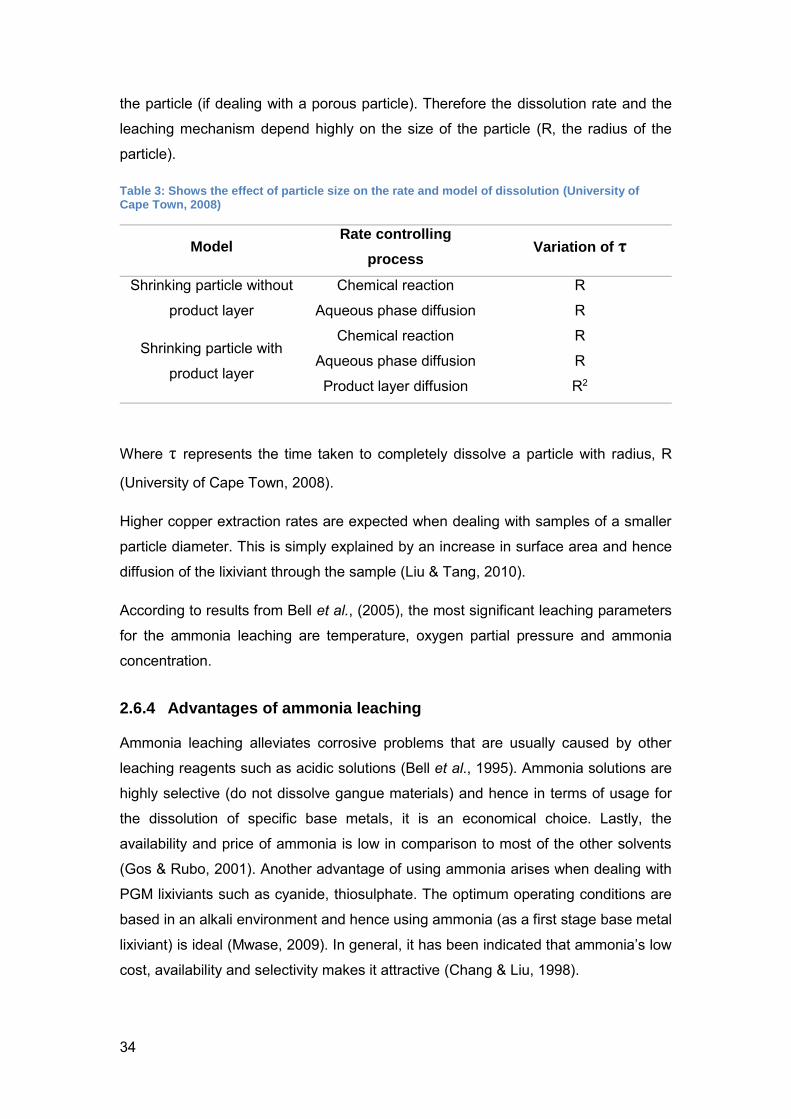
34
the particle (if dealing with a porous particle). Therefore the dissolution rate and the
leaching mechanism depend highly on the size of the particle (R, the radius of the
particle).
Table 3: Shows the effect of particle size on the rate and model of dissolution (University of Cape Town, 2008)
Model Rate controlling
process Variation of τ
Shrinking particle without
product layer
Chemical reaction R
Aqueous phase diffusion R
Shrinking particle with
product layer
Chemical reaction R
Aqueous phase diffusion R
Product layer diffusion R2
Where τ represents the time taken to completely dissolve a particle with radius, R
(University of Cape Town, 2008).
Higher copper extraction rates are expected when dealing with samples of a smaller
particle diameter. This is simply explained by an increase in surface area and hence
diffusion of the lixiviant through the sample (Liu & Tang, 2010).
According to results from Bell et al., (2005), the most significant leaching parameters
for the ammonia leaching are temperature, oxygen partial pressure and ammonia
concentration.
2.6.4 Advantages of ammonia leaching
Ammonia leaching alleviates corrosive problems that are usually caused by other
leaching reagents such as acidic solutions (Bell et al., 1995). Ammonia solutions are
highly selective (do not dissolve gangue materials) and hence in terms of usage for
the dissolution of specific base metals, it is an economical choice. Lastly, the
availability and price of ammonia is low in comparison to most of the other solvents
(Gos & Rubo, 2001). Another advantage of using ammonia arises when dealing with
PGM lixiviants such as cyanide, thiosulphate. The optimum operating conditions are
based in an alkali environment and hence using ammonia (as a first stage base metal
lixiviant) is ideal (Mwase, 2009). In general, it has been indicated that ammonia’s low
cost, availability and selectivity makes it attractive (Chang & Liu, 1998).
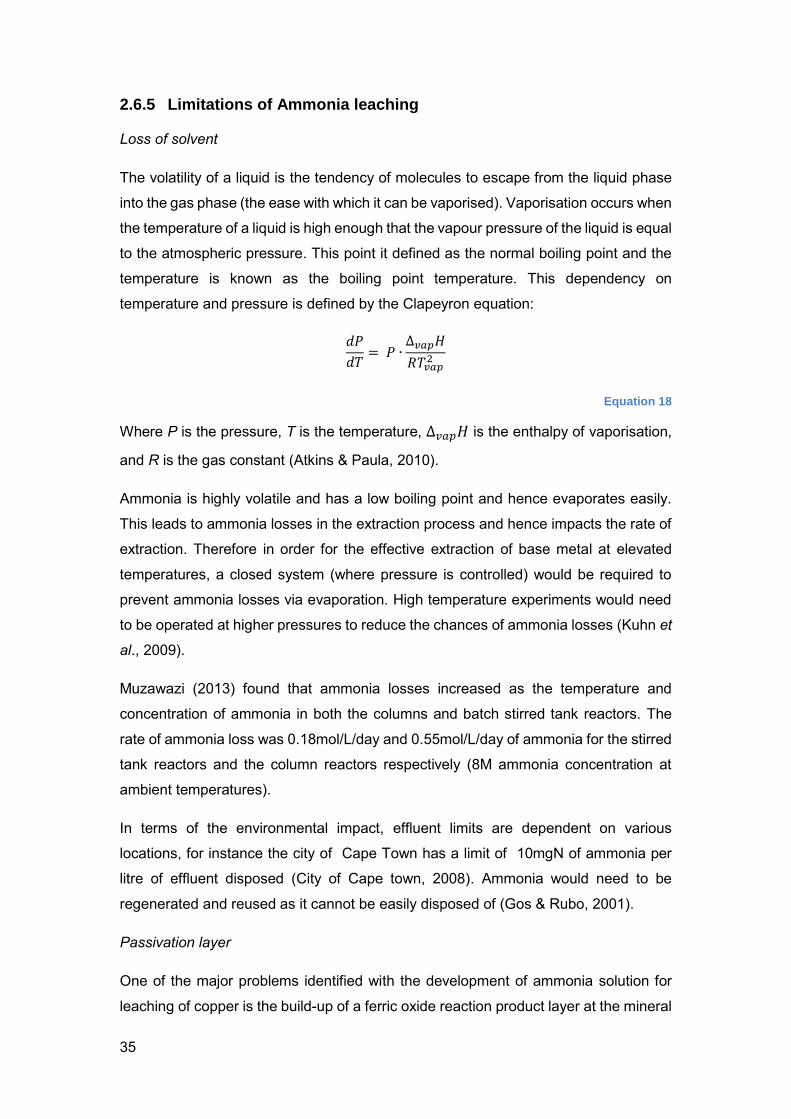
35
2.6.5 Limitations of Ammonia leaching
Loss of solvent
The volatility of a liquid is the tendency of molecules to escape from the liquid phase
into the gas phase (the ease with which it can be vaporised). Vaporisation occurs when
the temperature of a liquid is high enough that the vapour pressure of the liquid is equal
to the atmospheric pressure. This point it defined as the normal boiling point and the
temperature is known as the boiling point temperature. This dependency on
temperature and pressure is defined by the Clapeyron equation:
𝑑𝑃
𝑑𝑇= 𝑃 ∙
∆𝑣𝑎𝑝𝐻
𝑅𝑇𝑣𝑎𝑝2
Equation 18
Where P is the pressure, T is the temperature, ∆𝑣𝑎𝑝𝐻 is the enthalpy of vaporisation,
and R is the gas constant (Atkins & Paula, 2010).
Ammonia is highly volatile and has a low boiling point and hence evaporates easily.
This leads to ammonia losses in the extraction process and hence impacts the rate of
extraction. Therefore in order for the effective extraction of base metal at elevated
temperatures, a closed system (where pressure is controlled) would be required to
prevent ammonia losses via evaporation. High temperature experiments would need
to be operated at higher pressures to reduce the chances of ammonia losses (Kuhn et
al., 2009).
Muzawazi (2013) found that ammonia losses increased as the temperature and
concentration of ammonia in both the columns and batch stirred tank reactors. The
rate of ammonia loss was 0.18mol/L/day and 0.55mol/L/day of ammonia for the stirred
tank reactors and the column reactors respectively (8M ammonia concentration at
ambient temperatures).
In terms of the environmental impact, effluent limits are dependent on various
locations, for instance the city of Cape Town has a limit of 10mgN of ammonia per
litre of effluent disposed (City of Cape town, 2008). Ammonia would need to be
regenerated and reused as it cannot be easily disposed of (Gos & Rubo, 2001).
Passivation layer
One of the major problems identified with the development of ammonia solution for
leaching of copper is the build-up of a ferric oxide reaction product layer at the mineral
36
surface (Bell, et al., 1995). Due to the fact that the dissolution is an electrochemical
process, passivation is likely to occur especially when high or low pH is used (Meng &
Han, 1996). According to Dutrizac (1981), a ferric oxide product layer was shown to
inhibit the reaction and reduce the rate of the reaction.
One possible solution may lie in the addition of saccharides or other organic
compounds (such as DEPTA, EDTA) to the ammonia solution. These compounds
have the ability to dissolve iron oxides in solution. OH groups attached to long chain
molecules may act as sequestration agents which keep the iron in solution and hence
prevent the formation of ferric oxide and iron can be recovered from the leachate (Knell
& Kroll, 1954). However more research needs to be done in terms of the impact of
addition of organic compounds on the extraction rates and subsequent separation
processes.
2.7 Cyanide Leaching of PGMs
Cyanide is a general term that refers to any chemical that contains the cyano group (a
triple bond between carbon and nitrogen). Cyanide solutions have been used in the
mining industry for the past 120 years, more specifically in the gold refining industry.
Cyanide, in its dilute form (100-500ppm) is used to dilute gold and separate gold from
its ore (Fraiser Institute, 2012).
Cyanidation has been long used in the gold industry for the direct extraction of gold at
ambient conditions (Chamberlain & Pojar, 1984). In terms of PGM extraction, work by
McInnes et al. (1994) showed that process occurs in the same manner as the gold
extraction process. Further, the process proceeds via the following chemical reactions
(Chen & Huang, 2006) for the Pt, Pd and Rh:
2𝑃𝑡(𝑆) + 8𝑁𝑎𝐶𝑁(𝑎𝑞) + 𝑂2(𝐺) + 2𝐻2𝑂(𝑙) → 2𝑁𝑎2[𝑃𝑡(𝐶𝑁)4](𝑎𝑞) + 4𝑁𝑎𝑂𝐻(𝑎𝑞)
Equation 19
2𝑃𝑑(𝑆) + 8𝑁𝑎𝐶𝑁(𝑎𝑞) + 𝑂2(𝐺) + 2𝐻2𝑂(𝑙) → 2𝑁𝑎2[𝑃𝑑(𝐶𝑁)4](𝑎𝑞) + 4𝑁𝑎𝑂𝐻(𝑎𝑞)
Equation 20
2𝑅ℎ(𝑆) + 24𝑁𝑎𝐶𝑁(𝑎𝑞) + 3𝑂2(𝐺) + 6𝐻2𝑂(𝑙) → 4𝑁𝑎3[𝑅ℎ(𝐶𝑁)6](𝑎𝑞) + 12𝑁𝑎𝑂𝐻(𝑎𝑞)
Equation 21
According to work by Chen and Huang (2006), the reaction between sodium cyanide
and PGMs doesn’t occur at appreciable rates when operated at room temperatures
37
and pressures (as is the case in gold extraction). The reaction rates of the above
reactions are proposed to be controlled by the surface chemical reactions.
Further an oxidising agent is required to oxidise the Pt, Pd and Rh metal to soluble
Pt+, Pd+ and Rh+ ions in solution, hence forming aurocyanide complex ions (Grosse,
et al., 2003) dependant on the most stable form of the cations. The choice of oxidising
agents varies from pure oxygen to air.
Work by Mwase (2009) showed the successful use of sodium cyanide in the extraction
of PGMs. In his investigations, Mwase (2009) compared sodium cyanide to other
chemicals such as organic acids, sodium bisulphide and thiosulphate solutions, and
found that sodium cyanide had significantly higher PGM extractions. Cyanide was
successful in extracting 20% Pt, 87% Pd and 46% Rh in a packed bed reactor over a
period of 21 days.
In terms of Platreef, PGMs may occur as Pd and Pt bismucth-tellurides and arsenides
(Platreef) which are slow-floating in comparison to PGM sulphides minerals (Shamaila
& O'Connor, 2008; Vermaak, 1995), and further the complex PGM mineralisation (van
Wyk, 2014) renders these PGMs difficult to fully recover via the conventional
concentrate (via flotation)-smelt-refine process. Using conventional methods may lead
to an increase in smelter operating costs (low-grade), reduce smelter integrity (due to
the chromite), increase converting costs that may be associated with gas handling and
treatment of acid plants and may lead to a negative environmental impact due to the
production of SO2 gas and Fe-bearing slag (Mwase, Petersen & Eksteen, 2012).
2.7.1 Base metal extraction prior to PGM extraction
In the case of ores that contain copper, it is common practice to keep copper levels in
solution below 300-500 ppm and may note problems with gold recovery and cyanide
consumption when copper concentrations exceed this amount (Stewart & Kappes,
2012). This theory can be extended to other PGMs ores.
When copper is dissolved with adequate free cyanide, a Cu (CN) 3 2+ complex is formed
and results in the consumption of cyanide (Mwase, 2009). Further, Cu(CN)32+ complex
in a heap may cause environmental issues as these complexes end up in tailings dams
and waste material (Alymore, 2001) and will require treatment. These issues would
affect the economics of the process (Stewart & Kappes, 2012). In addition, separation
of the base metals and PGM prior to leach operations provides flexibility in designing
38
the operating conditions for both base metal and PGM dissolution stages (Adams et
al., 2011).
Further, batch tests done by Chen and Huang (2006) proved that pressure oxygen
pre-treatment was vital to obtain high PGM extractions. This is because in the pressure
oxygen pre-treatment, all the sulphides are converted to sulphates and oxides
therefore exposing any encapsulated PGMs.
Laboratory scale tests indicate extraction rates and trends during the leaching process.
Column tests and batch stirred tank reactor tests simulate heap leaching dumps and
agitation tank leaching respectively. The next section gives a closer look at large scale
leaching practices.
2.8 Leaching techniques
At present, leaching is the most essential front-end operation in hydrometallurgy. The
leaching process is grouped into 2 main categories: percolation leaching and agitation
leaching.
Percolation leaching
Percolation leaching involves the percolation of the lixiviant through a stationary ore
body. Lean lixiviant trickles through the ore by gravity and is collected at the bottom as
rich/pregnant solution. The main types of percolation leaching are in situ, heap and
dump leaching. In situ leaching involves the leaching of ore that has not been mined
or has been blasted to allow for lixiviant percolation and also uses natural oxidants
such as air. Heap leaching is similar to in situ leaching but requires the construction of
a heap to allow for optimum extractions. The heap must be constructed on a slope to
allow for easier drainage of the lixiviant. The bottom of the heap is made as waterproof
as possible to reduce the chances of ground water contamination. The lixiviant is
sprayed evenly over the heap and is allowed to drain through to the bottom as shown
in Figure 20
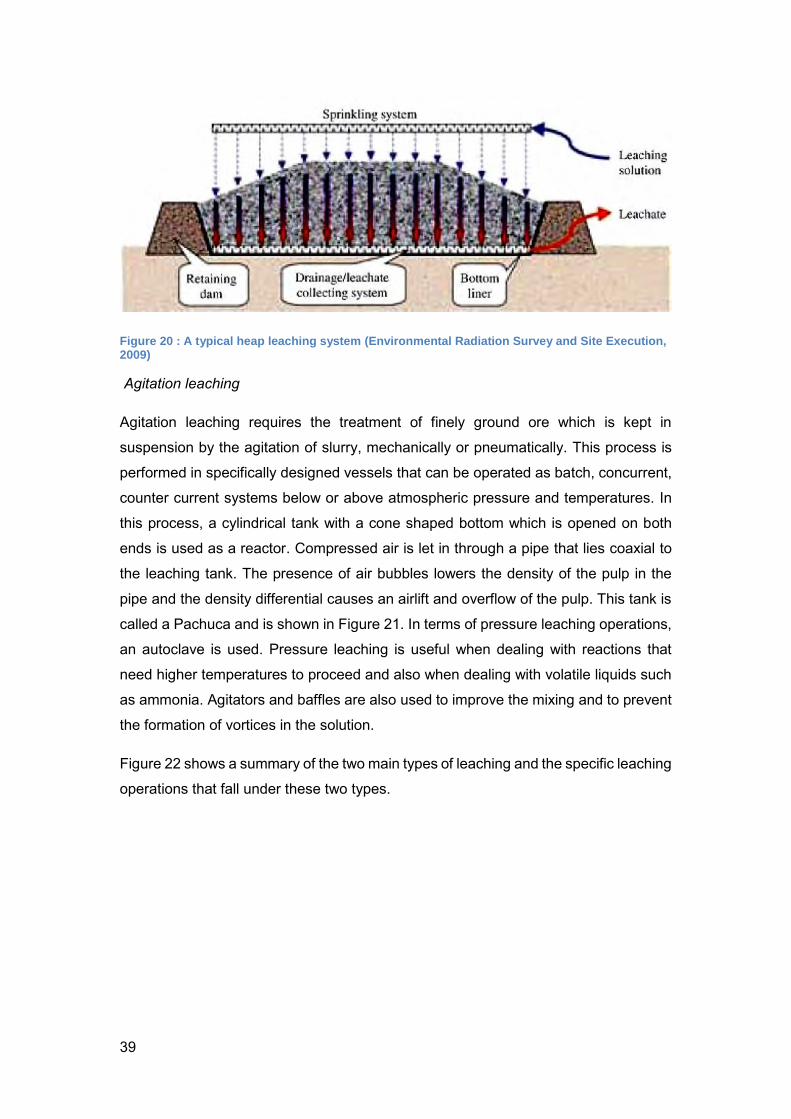
39
Figure 20 : A typical heap leaching system (Environmental Radiation Survey and Site Execution, 2009)
Agitation leaching
Agitation leaching requires the treatment of finely ground ore which is kept in
suspension by the agitation of slurry, mechanically or pneumatically. This process is
performed in specifically designed vessels that can be operated as batch, concurrent,
counter current systems below or above atmospheric pressure and temperatures. In
this process, a cylindrical tank with a cone shaped bottom which is opened on both
ends is used as a reactor. Compressed air is let in through a pipe that lies coaxial to
the leaching tank. The presence of air bubbles lowers the density of the pulp in the
pipe and the density differential causes an airlift and overflow of the pulp. This tank is
called a Pachuca and is shown in Figure 21. In terms of pressure leaching operations,
an autoclave is used. Pressure leaching is useful when dealing with reactions that
need higher temperatures to proceed and also when dealing with volatile liquids such
as ammonia. Agitators and baffles are also used to improve the mixing and to prevent
the formation of vortices in the solution.
Figure 22 shows a summary of the two main types of leaching and the specific leaching
operations that fall under these two types.
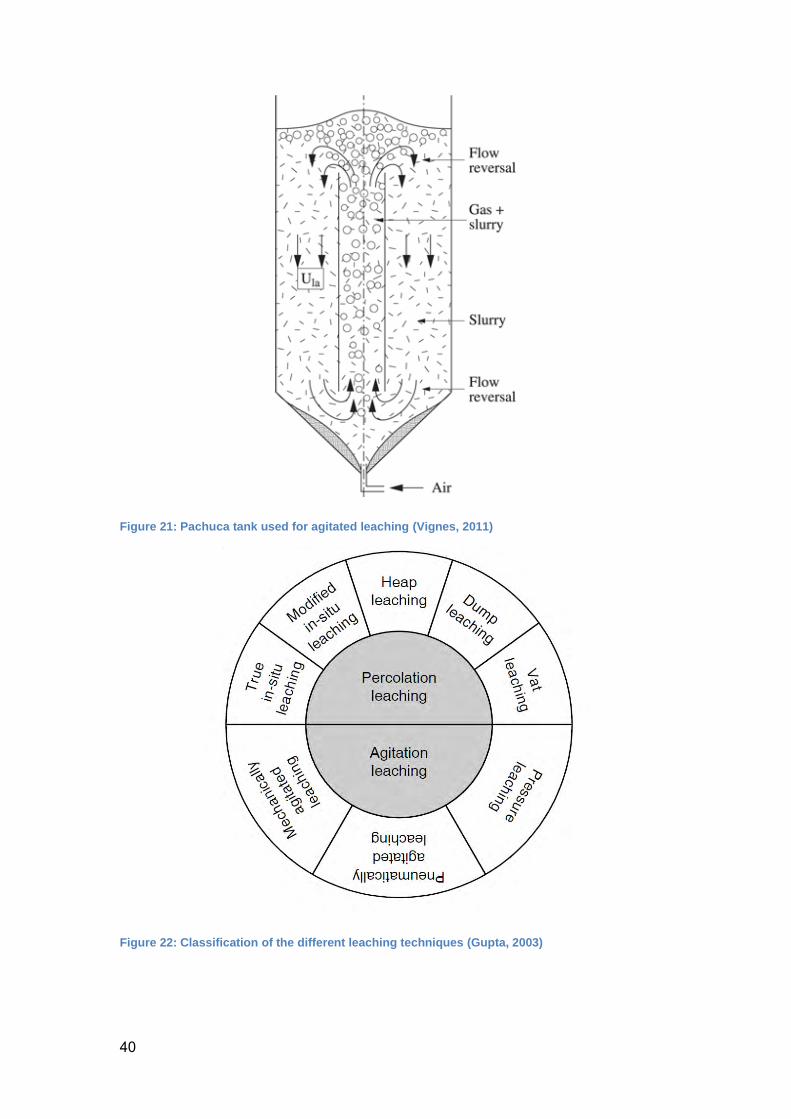
40
Figure 21: Pachuca tank used for agitated leaching (Vignes, 2011)
Figure 22: Classification of the different leaching techniques (Gupta, 2003)
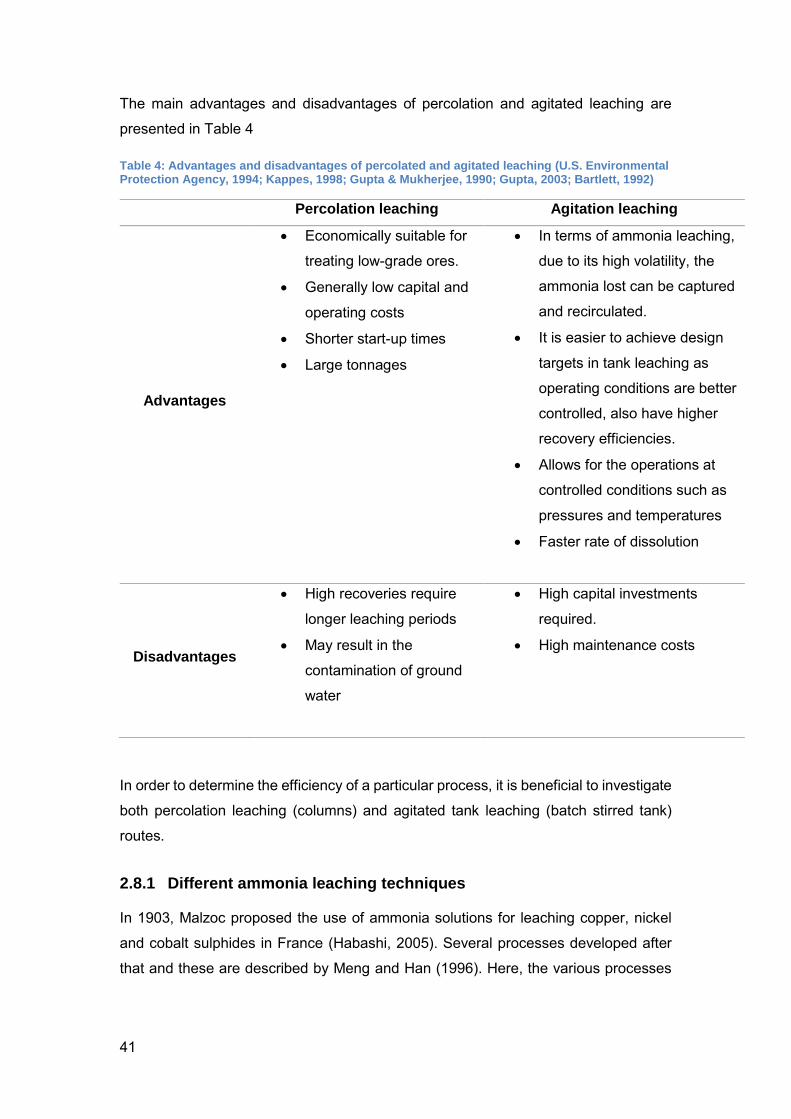
41
The main advantages and disadvantages of percolation and agitated leaching are
presented in Table 4
Table 4: Advantages and disadvantages of percolated and agitated leaching (U.S. Environmental Protection Agency, 1994; Kappes, 1998; Gupta & Mukherjee, 1990; Gupta, 2003; Bartlett, 1992)
Percolation leaching Agitation leaching
Advantages
Economically suitable for
treating low-grade ores.
Generally low capital and
operating costs
Shorter start-up times
Large tonnages
In terms of ammonia leaching,
due to its high volatility, the
ammonia lost can be captured
and recirculated.
It is easier to achieve design
targets in tank leaching as
operating conditions are better
controlled, also have higher
recovery efficiencies.
Allows for the operations at
controlled conditions such as
pressures and temperatures
Faster rate of dissolution
Disadvantages
High recoveries require
longer leaching periods
May result in the
contamination of ground
water
High capital investments
required.
High maintenance costs
In order to determine the efficiency of a particular process, it is beneficial to investigate
both percolation leaching (columns) and agitated tank leaching (batch stirred tank)
routes.
2.8.1 Different ammonia leaching techniques
In 1903, Malzoc proposed the use of ammonia solutions for leaching copper, nickel
and cobalt sulphides in France (Habashi, 2005). Several processes developed after
that and these are described by Meng and Han (1996). Here, the various processes
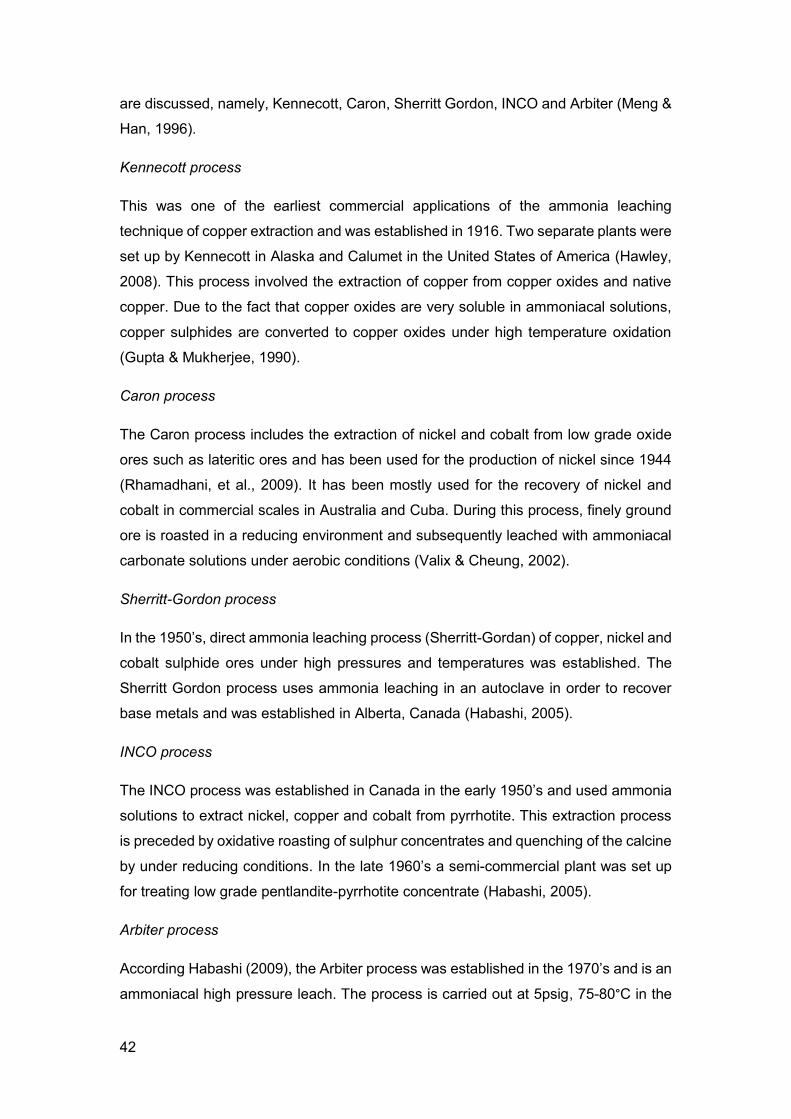
42
are discussed, namely, Kennecott, Caron, Sherritt Gordon, INCO and Arbiter (Meng &
Han, 1996).
Kennecott process
This was one of the earliest commercial applications of the ammonia leaching
technique of copper extraction and was established in 1916. Two separate plants were
set up by Kennecott in Alaska and Calumet in the United States of America (Hawley,
2008). This process involved the extraction of copper from copper oxides and native
copper. Due to the fact that copper oxides are very soluble in ammoniacal solutions,
copper sulphides are converted to copper oxides under high temperature oxidation
(Gupta & Mukherjee, 1990).
Caron process
The Caron process includes the extraction of nickel and cobalt from low grade oxide
ores such as lateritic ores and has been used for the production of nickel since 1944
(Rhamadhani, et al., 2009). It has been mostly used for the recovery of nickel and
cobalt in commercial scales in Australia and Cuba. During this process, finely ground
ore is roasted in a reducing environment and subsequently leached with ammoniacal
carbonate solutions under aerobic conditions (Valix & Cheung, 2002).
Sherritt-Gordon process
In the 1950’s, direct ammonia leaching process (Sherritt-Gordan) of copper, nickel and
cobalt sulphide ores under high pressures and temperatures was established. The
Sherritt Gordon process uses ammonia leaching in an autoclave in order to recover
base metals and was established in Alberta, Canada (Habashi, 2005).
INCO process
The INCO process was established in Canada in the early 1950’s and used ammonia
solutions to extract nickel, copper and cobalt from pyrrhotite. This extraction process
is preceded by oxidative roasting of sulphur concentrates and quenching of the calcine
by under reducing conditions. In the late 1960’s a semi-commercial plant was set up
for treating low grade pentlandite-pyrrhotite concentrate (Habashi, 2005).
Arbiter process
According Habashi (2009), the Arbiter process was established in the 1970’s and is an
ammoniacal high pressure leach. The process is carried out at 5psig, 75-80°C in the
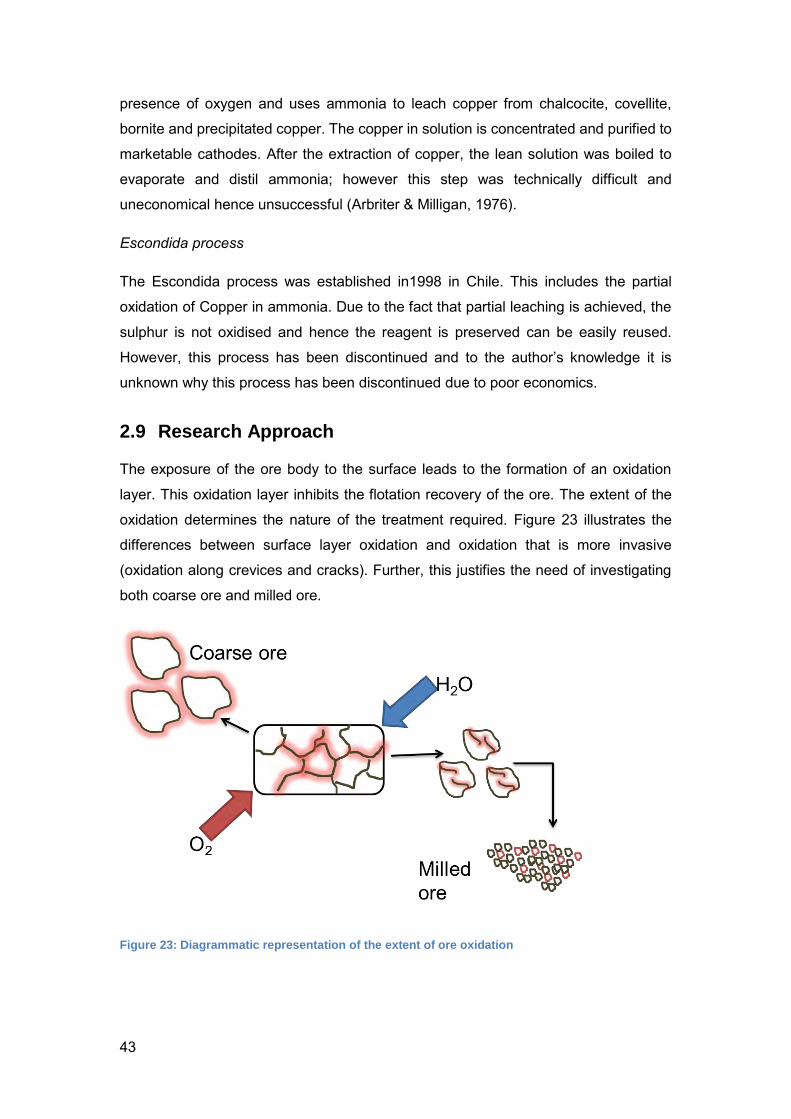
43
presence of oxygen and uses ammonia to leach copper from chalcocite, covellite,
bornite and precipitated copper. The copper in solution is concentrated and purified to
marketable cathodes. After the extraction of copper, the lean solution was boiled to
evaporate and distil ammonia; however this step was technically difficult and
uneconomical hence unsuccessful (Arbriter & Milligan, 1976).
Escondida process
The Escondida process was established in1998 in Chile. This includes the partial
oxidation of Copper in ammonia. Due to the fact that partial leaching is achieved, the
sulphur is not oxidised and hence the reagent is preserved can be easily reused.
However, this process has been discontinued and to the author’s knowledge it is
unknown why this process has been discontinued due to poor economics.
2.9 Research Approach
The exposure of the ore body to the surface leads to the formation of an oxidation
layer. This oxidation layer inhibits the flotation recovery of the ore. The extent of the
oxidation determines the nature of the treatment required. Figure 23 illustrates the
differences between surface layer oxidation and oxidation that is more invasive
(oxidation along crevices and cracks). Further, this justifies the need of investigating
both coarse ore and milled ore.
Figure 23: Diagrammatic representation of the extent of ore oxidation
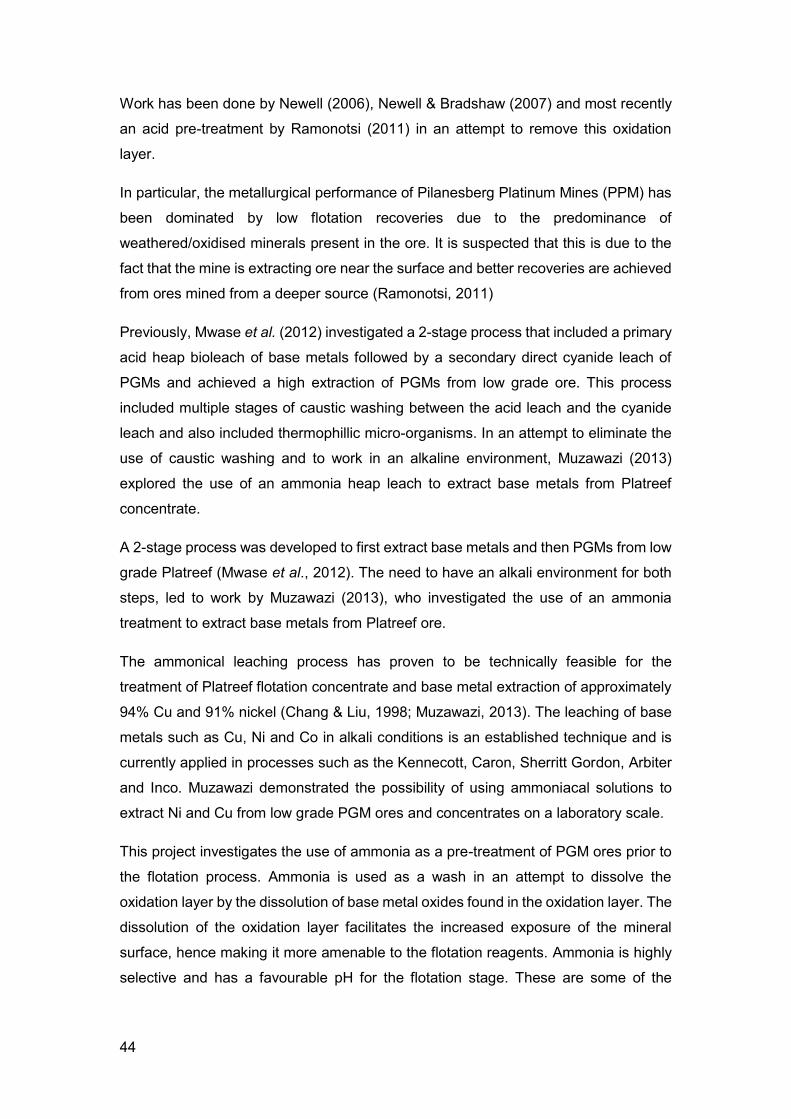
44
Work has been done by Newell (2006), Newell & Bradshaw (2007) and most recently
an acid pre-treatment by Ramonotsi (2011) in an attempt to remove this oxidation
layer.
In particular, the metallurgical performance of Pilanesberg Platinum Mines (PPM) has
been dominated by low flotation recoveries due to the predominance of
weathered/oxidised minerals present in the ore. It is suspected that this is due to the
fact that the mine is extracting ore near the surface and better recoveries are achieved
from ores mined from a deeper source (Ramonotsi, 2011)
Previously, Mwase et al. (2012) investigated a 2-stage process that included a primary
acid heap bioleach of base metals followed by a secondary direct cyanide leach of
PGMs and achieved a high extraction of PGMs from low grade ore. This process
included multiple stages of caustic washing between the acid leach and the cyanide
leach and also included thermophillic micro-organisms. In an attempt to eliminate the
use of caustic washing and to work in an alkaline environment, Muzawazi (2013)
explored the use of an ammonia heap leach to extract base metals from Platreef
concentrate.
A 2-stage process was developed to first extract base metals and then PGMs from low
grade Platreef (Mwase et al., 2012). The need to have an alkali environment for both
steps, led to work by Muzawazi (2013), who investigated the use of an ammonia
treatment to extract base metals from Platreef ore.
The ammonical leaching process has proven to be technically feasible for the
treatment of Platreef flotation concentrate and base metal extraction of approximately
94% Cu and 91% nickel (Chang & Liu, 1998; Muzawazi, 2013). The leaching of base
metals such as Cu, Ni and Co in alkali conditions is an established technique and is
currently applied in processes such as the Kennecott, Caron, Sherritt Gordon, Arbiter
and Inco. Muzawazi demonstrated the possibility of using ammoniacal solutions to
extract Ni and Cu from low grade PGM ores and concentrates on a laboratory scale.
This project investigates the use of ammonia as a pre-treatment of PGM ores prior to
the flotation process. Ammonia is used as a wash in an attempt to dissolve the
oxidation layer by the dissolution of base metal oxides found in the oxidation layer. The
dissolution of the oxidation layer facilitates the increased exposure of the mineral
surface, hence making it more amenable to the flotation reagents. Ammonia is highly
selective and has a favourable pH for the flotation stage. These are some of the
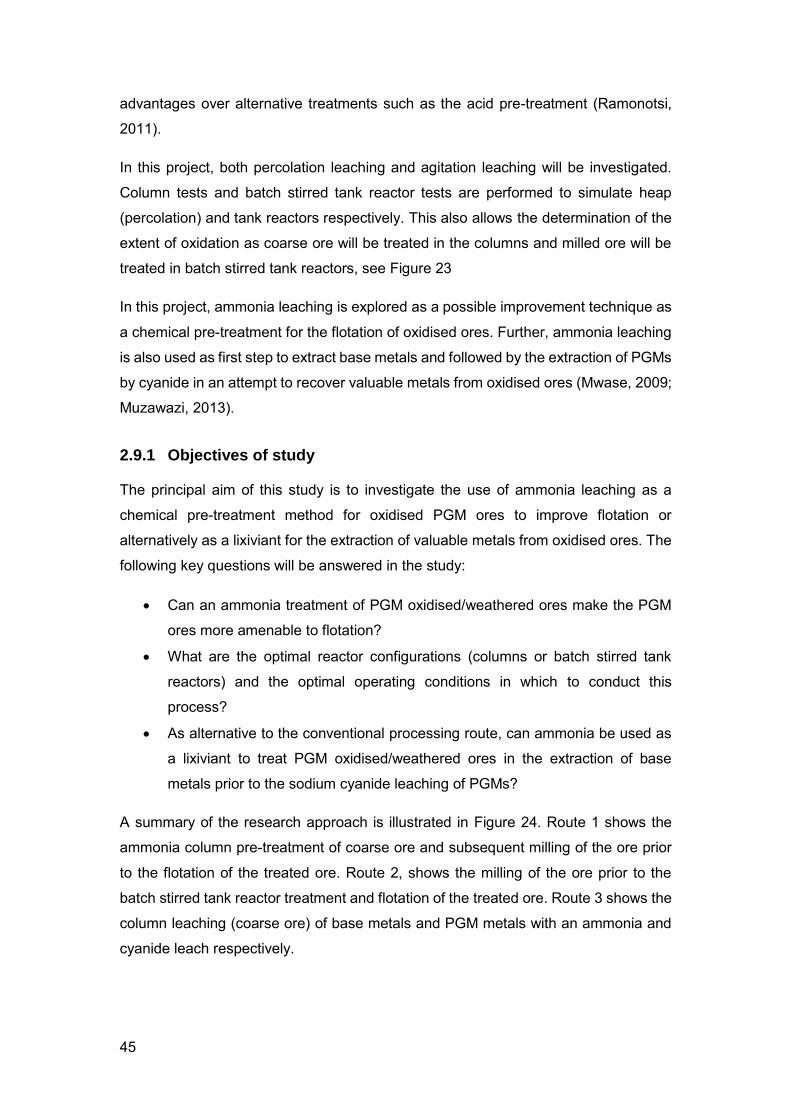
45
advantages over alternative treatments such as the acid pre-treatment (Ramonotsi,
2011).
In this project, both percolation leaching and agitation leaching will be investigated.
Column tests and batch stirred tank reactor tests are performed to simulate heap
(percolation) and tank reactors respectively. This also allows the determination of the
extent of oxidation as coarse ore will be treated in the columns and milled ore will be
treated in batch stirred tank reactors, see Figure 23
In this project, ammonia leaching is explored as a possible improvement technique as
a chemical pre-treatment for the flotation of oxidised ores. Further, ammonia leaching
is also used as first step to extract base metals and followed by the extraction of PGMs
by cyanide in an attempt to recover valuable metals from oxidised ores (Mwase, 2009;
Muzawazi, 2013).
2.9.1 Objectives of study
The principal aim of this study is to investigate the use of ammonia leaching as a
chemical pre-treatment method for oxidised PGM ores to improve flotation or
alternatively as a lixiviant for the extraction of valuable metals from oxidised ores. The
following key questions will be answered in the study:
Can an ammonia treatment of PGM oxidised/weathered ores make the PGM
ores more amenable to flotation?
What are the optimal reactor configurations (columns or batch stirred tank
reactors) and the optimal operating conditions in which to conduct this
process?
As alternative to the conventional processing route, can ammonia be used as
a lixiviant to treat PGM oxidised/weathered ores in the extraction of base
metals prior to the sodium cyanide leaching of PGMs?
A summary of the research approach is illustrated in Figure 24. Route 1 shows the
ammonia column pre-treatment of coarse ore and subsequent milling of the ore prior
to the flotation of the treated ore. Route 2, shows the milling of the ore prior to the
batch stirred tank reactor treatment and flotation of the treated ore. Route 3 shows the
column leaching (coarse ore) of base metals and PGM metals with an ammonia and
cyanide leach respectively.
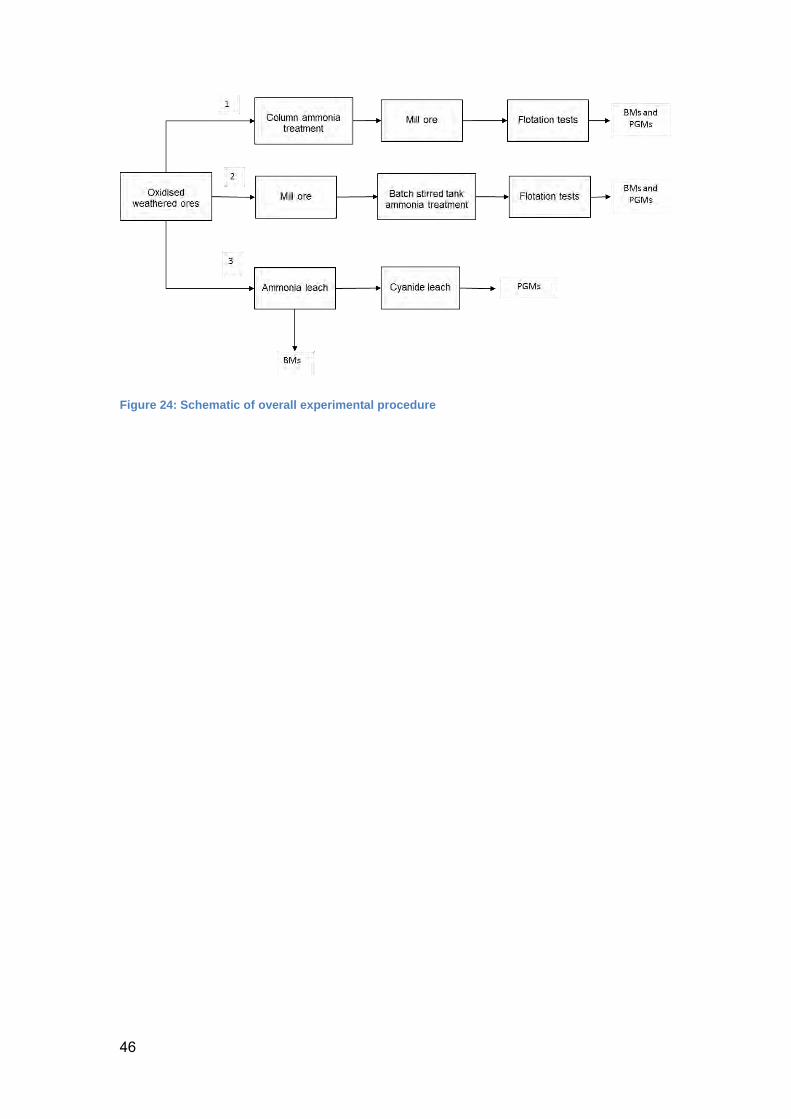
46
Figure 24: Schematic of overall experimental procedure
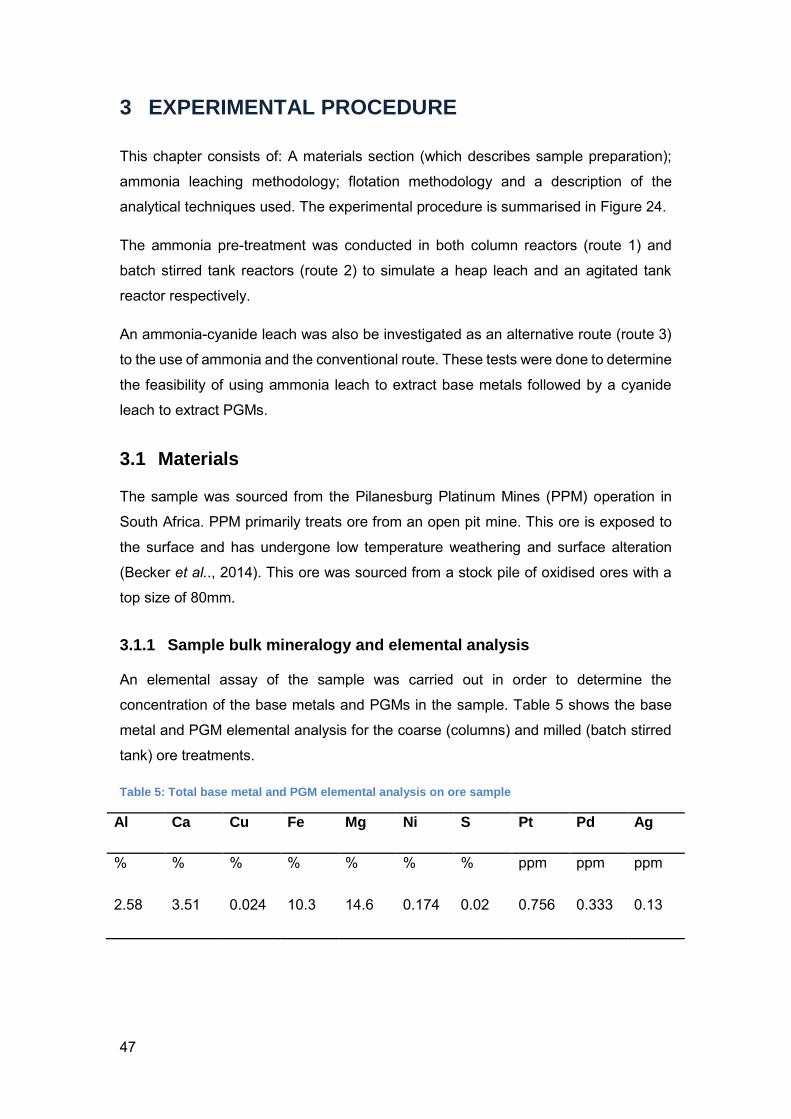
47
3 EXPERIMENTAL PROCEDURE
This chapter consists of: A materials section (which describes sample preparation);
ammonia leaching methodology; flotation methodology and a description of the
analytical techniques used. The experimental procedure is summarised in Figure 24.
The ammonia pre-treatment was conducted in both column reactors (route 1) and
batch stirred tank reactors (route 2) to simulate a heap leach and an agitated tank
reactor respectively.
An ammonia-cyanide leach was also be investigated as an alternative route (route 3)
to the use of ammonia and the conventional route. These tests were done to determine
the feasibility of using ammonia leach to extract base metals followed by a cyanide
leach to extract PGMs.
3.1 Materials
The sample was sourced from the Pilanesburg Platinum Mines (PPM) operation in
South Africa. PPM primarily treats ore from an open pit mine. This ore is exposed to
the surface and has undergone low temperature weathering and surface alteration
(Becker et al.., 2014). This ore was sourced from a stock pile of oxidised ores with a
top size of 80mm.
3.1.1 Sample bulk mineralogy and elemental analysis
An elemental assay of the sample was carried out in order to determine the
concentration of the base metals and PGMs in the sample. Table 5 shows the base
metal and PGM elemental analysis for the coarse (columns) and milled (batch stirred
tank) ore treatments.
Table 5: Total base metal and PGM elemental analysis on ore sample
Al Ca Cu Fe Mg Ni S Pt Pd Ag
% % % % % % % ppm ppm ppm
2.58 3.51 0.024 10.3 14.6 0.174 0.02 0.756 0.333 0.13
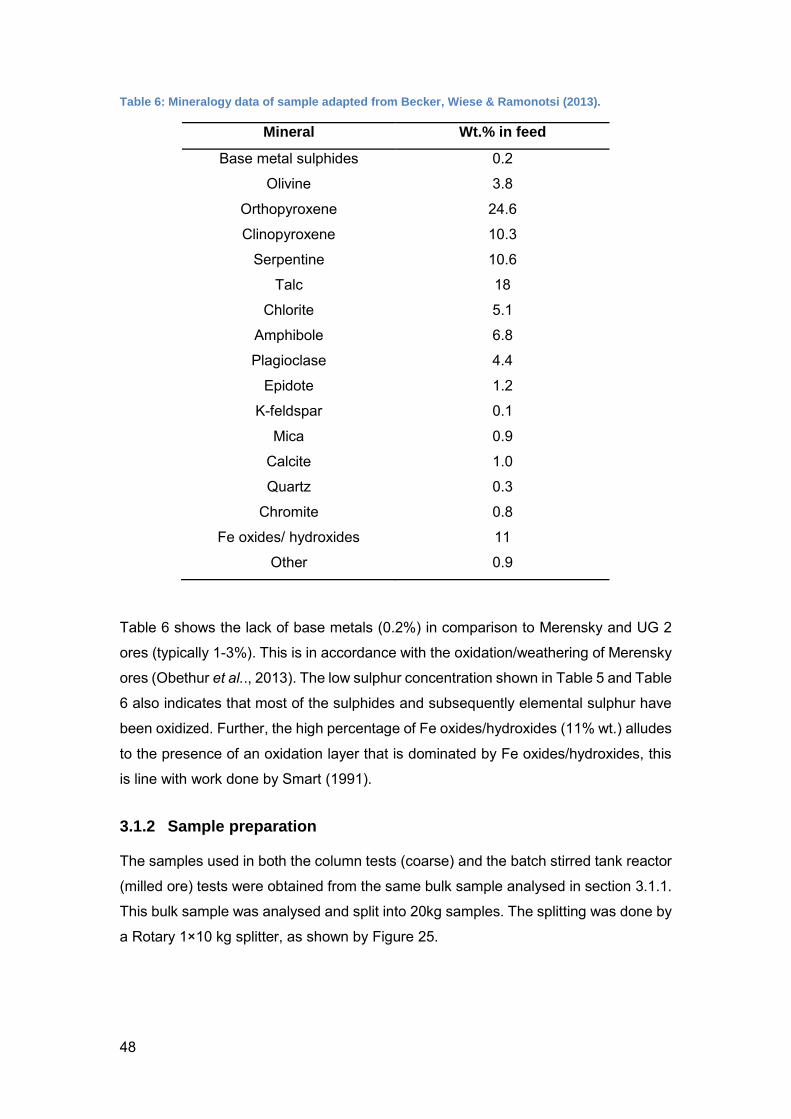
48
Table 6: Mineralogy data of sample adapted from Becker, Wiese & Ramonotsi (2013).
Mineral Wt.% in feed
Base metal sulphides 0.2
Olivine 3.8
Orthopyroxene 24.6
Clinopyroxene 10.3
Serpentine 10.6
Talc 18
Chlorite 5.1
Amphibole 6.8
Plagioclase 4.4
Epidote 1.2
K-feldspar 0.1
Mica 0.9
Calcite 1.0
Quartz 0.3
Chromite 0.8
Fe oxides/ hydroxides 11
Other 0.9
Table 6 shows the lack of base metals (0.2%) in comparison to Merensky and UG 2
ores (typically 1-3%). This is in accordance with the oxidation/weathering of Merensky
ores (Obethur et al.., 2013). The low sulphur concentration shown in Table 5 and Table
6 also indicates that most of the sulphides and subsequently elemental sulphur have
been oxidized. Further, the high percentage of Fe oxides/hydroxides (11% wt.) alludes
to the presence of an oxidation layer that is dominated by Fe oxides/hydroxides, this
is line with work done by Smart (1991).
3.1.2 Sample preparation
The samples used in both the column tests (coarse) and the batch stirred tank reactor
(milled ore) tests were obtained from the same bulk sample analysed in section 3.1.1.
This bulk sample was analysed and split into 20kg samples. The splitting was done by
a Rotary 1×10 kg splitter, as shown by Figure 25.

49
Figure 25: Schematic of the 1 x 10kg splitter used to split ore in order to obtain representative sample. (Anon., 2009)
For the column tests, in order to obtain a representative population of the ore, a 20kg
sample was split by the same Rotary 1x10 kg splitter into five 4kg samples. The 4kg
samples were further split into two 2kg sub-samples Each 2 kg sub-sample was used
to represent a specific column treatment. This is represented by Figure 26
Figure 26: Schematic of splitting procedure for ammonia column leaching
20 kg ore sample
4kg
Column 0 4kg
Column 1
4kg
Column 2
4kg
Column 3
4kg
Batch
2kg
Analytical
2kg
Column
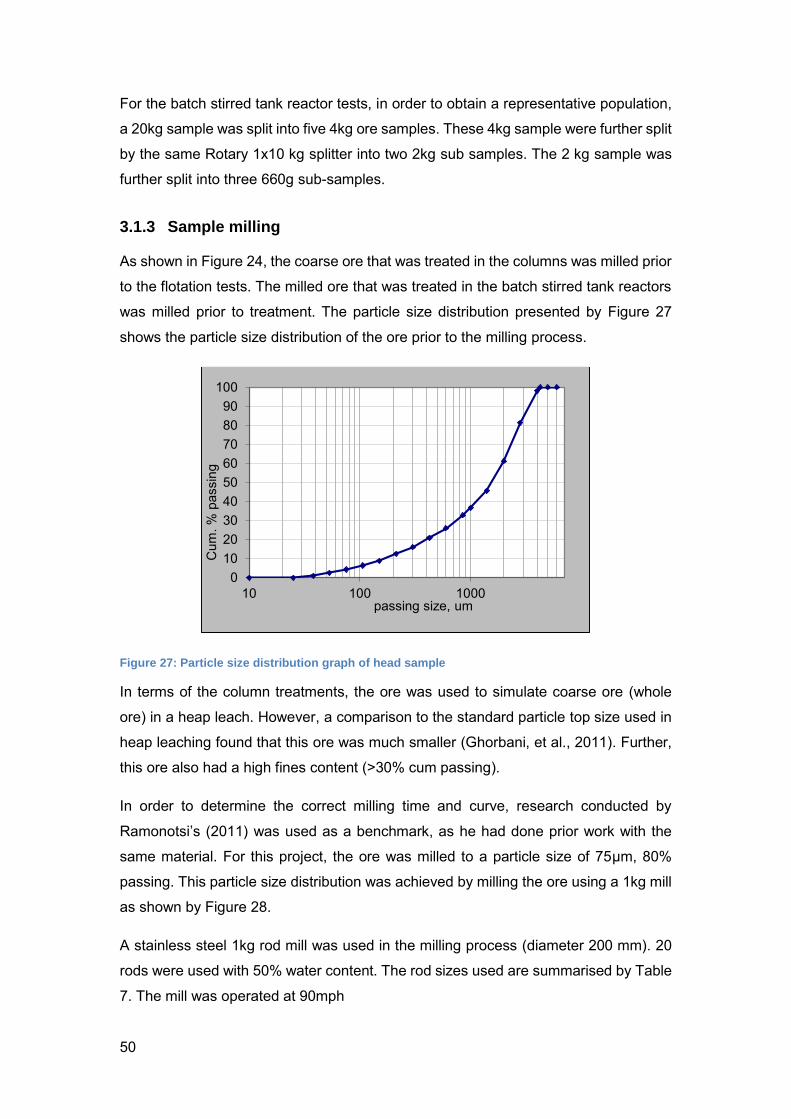
50
For the batch stirred tank reactor tests, in order to obtain a representative population,
a 20kg sample was split into five 4kg ore samples. These 4kg sample were further split
by the same Rotary 1x10 kg splitter into two 2kg sub samples. The 2 kg sample was
further split into three 660g sub-samples.
3.1.3 Sample milling
As shown in Figure 24, the coarse ore that was treated in the columns was milled prior
to the flotation tests. The milled ore that was treated in the batch stirred tank reactors
was milled prior to treatment. The particle size distribution presented by Figure 27
shows the particle size distribution of the ore prior to the milling process.
Figure 27: Particle size distribution graph of head sample
In terms of the column treatments, the ore was used to simulate coarse ore (whole
ore) in a heap leach. However, a comparison to the standard particle top size used in
heap leaching found that this ore was much smaller (Ghorbani, et al., 2011). Further,
this ore also had a high fines content (>30% cum passing).
In order to determine the correct milling time and curve, research conducted by
Ramonotsi’s (2011) was used as a benchmark, as he had done prior work with the
same material. For this project, the ore was milled to a particle size of 75μm, 80%
passing. This particle size distribution was achieved by milling the ore using a 1kg mill
as shown by Figure 28.
A stainless steel 1kg rod mill was used in the milling process (diameter 200 mm). 20
rods were used with 50% water content. The rod sizes used are summarised by Table
7. The mill was operated at 90mph
0102030405060708090
100
10 100 1000
Cum
. % p
assi
ng
passing size, um
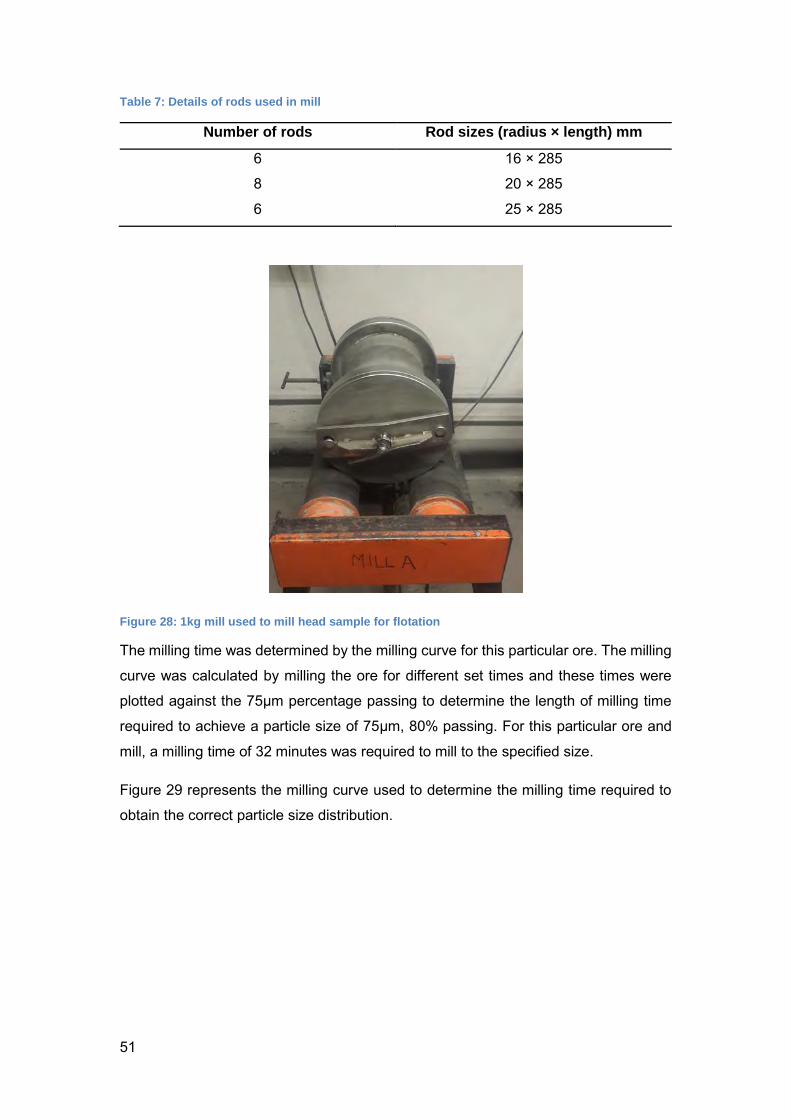
51
Table 7: Details of rods used in mill
Number of rods Rod sizes (radius × length) mm
6 16 × 285
8 20 × 285
6 25 × 285
Figure 28: 1kg mill used to mill head sample for flotation
The milling time was determined by the milling curve for this particular ore. The milling
curve was calculated by milling the ore for different set times and these times were
plotted against the 75μm percentage passing to determine the length of milling time
required to achieve a particle size of 75μm, 80% passing. For this particular ore and
mill, a milling time of 32 minutes was required to mill to the specified size.
Figure 29 represents the milling curve used to determine the milling time required to
obtain the correct particle size distribution.
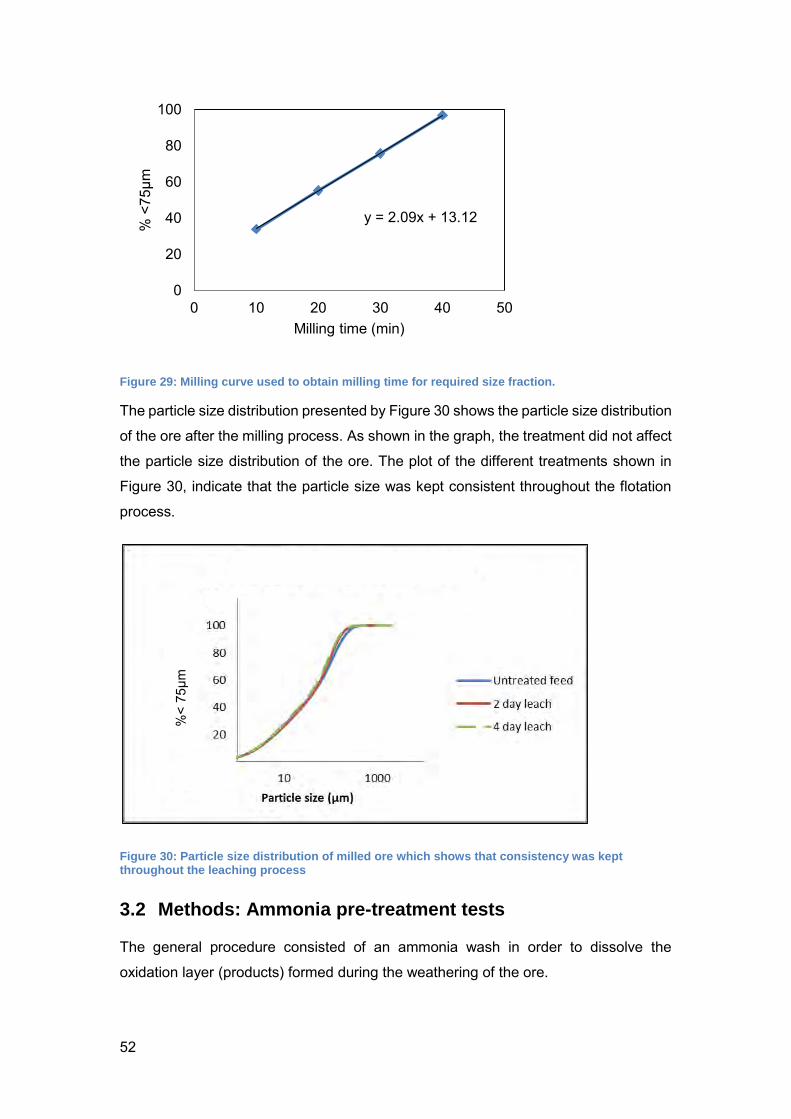
52
Figure 29: Milling curve used to obtain milling time for required size fraction.
The particle size distribution presented by Figure 30 shows the particle size distribution
of the ore after the milling process. As shown in the graph, the treatment did not affect
the particle size distribution of the ore. The plot of the different treatments shown in
Figure 30, indicate that the particle size was kept consistent throughout the flotation
process.
Figure 30: Particle size distribution of milled ore which shows that consistency was kept throughout the leaching process
3.2 Methods: Ammonia pre-treatment tests
The general procedure consisted of an ammonia wash in order to dissolve the
oxidation layer (products) formed during the weathering of the ore.
y = 2.09x + 13.12
0
20
40
60
80
100
0 10 20 30 40 50
% <
75μm
Milling time (min)
%<
75μm
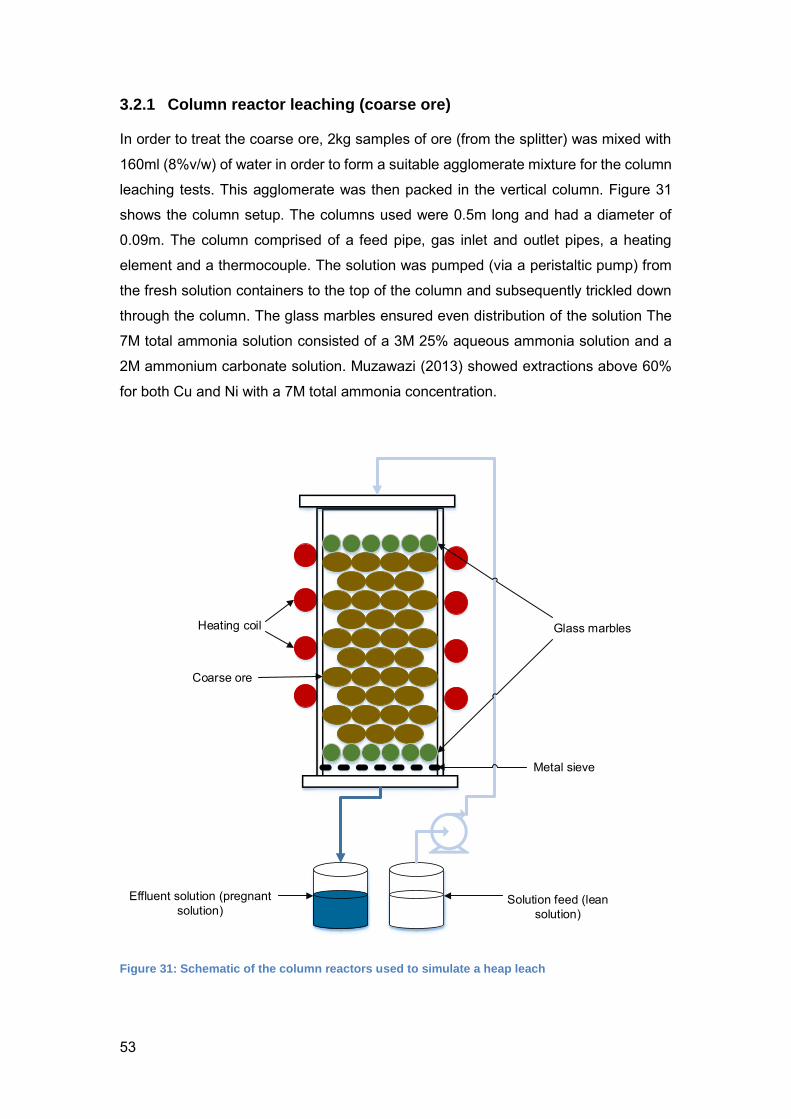
53
3.2.1 Column reactor leaching (coarse ore)
In order to treat the coarse ore, 2kg samples of ore (from the splitter) was mixed with
160ml (8%v/w) of water in order to form a suitable agglomerate mixture for the column
leaching tests. This agglomerate was then packed in the vertical column. Figure 31
shows the column setup. The columns used were 0.5m long and had a diameter of
0.09m. The column comprised of a feed pipe, gas inlet and outlet pipes, a heating
element and a thermocouple. The solution was pumped (via a peristaltic pump) from
the fresh solution containers to the top of the column and subsequently trickled down
through the column. The glass marbles ensured even distribution of the solution The
7M total ammonia solution consisted of a 3M 25% aqueous ammonia solution and a
2M ammonium carbonate solution. Muzawazi (2013) showed extractions above 60%
for both Cu and Ni with a 7M total ammonia concentration.
Coarse ore
Solution feed (lean solution)
Glass marbles
Effluent solution (pregnant solution)
Heating coil
Metal sieve
Figure 31: Schematic of the column reactors used to simulate a heap leach
54
The solution was pumped at a rate of 1000ml/day. Three columns were set-up and
each column represented a different length of treatment. Column 1 ore was treated to
a period of 2 days; while column 2 ore was treated for 5 days and column 3 was treated
for a total of 10 days. All three (3) columns were treated with the same lixiviant and
operated at ambient temperature conditions. Table 8 shows a summary of the column
operating conditions.
Table 8: Summary of column leaching operating conditions
1 2 3
NH3(as) 3M 3M 3M
(NH4)2CO3 2M 2M 2M
Temperature ambient ambient ambient
Water added 8% 8% 8%
Leaching time
(days) 2 5 10
For the ammonia leach tests, (NH4)2CO3 was used at a suitable buffering salt and
contributed to the total ammonia concentration. Results by Muzawazi (2013) show that
(NH4)2CO3 was the best option for a buffering salt as it showed the highest Cu and Ni
extractions and also maintained the most stable pH readings. (NH4)2CO3 was
compared to NH4Cl and (NH4)2SO4 (Muzawazi, 2013).
In terms of the sampling of the columns, 50ml of the column solution effluent was
obtained for every sample. The sampling of the solution effluent was done every 12
hours for the first 2 days for column 1, 2 and 3. Thereafter, sampling was done daily
for columns 2 and 3. The samples were drawn in duplicate in order to determine any
error associated with the analysis.
The treated ore was then dried and milled (see section 3.1.3) in preparation for the 3L
flotation tests.
3.2.2 Batch stirred tanks (milled ore)
The three 660g sub-samples were milled (see section 3.1.3) and used for the
untreated, 1 hour treatment and 3 hour treatments, respectively. Each of these 660g
heaps were then split into 400g for repeat tests and 200g for individual head sample
analysis.
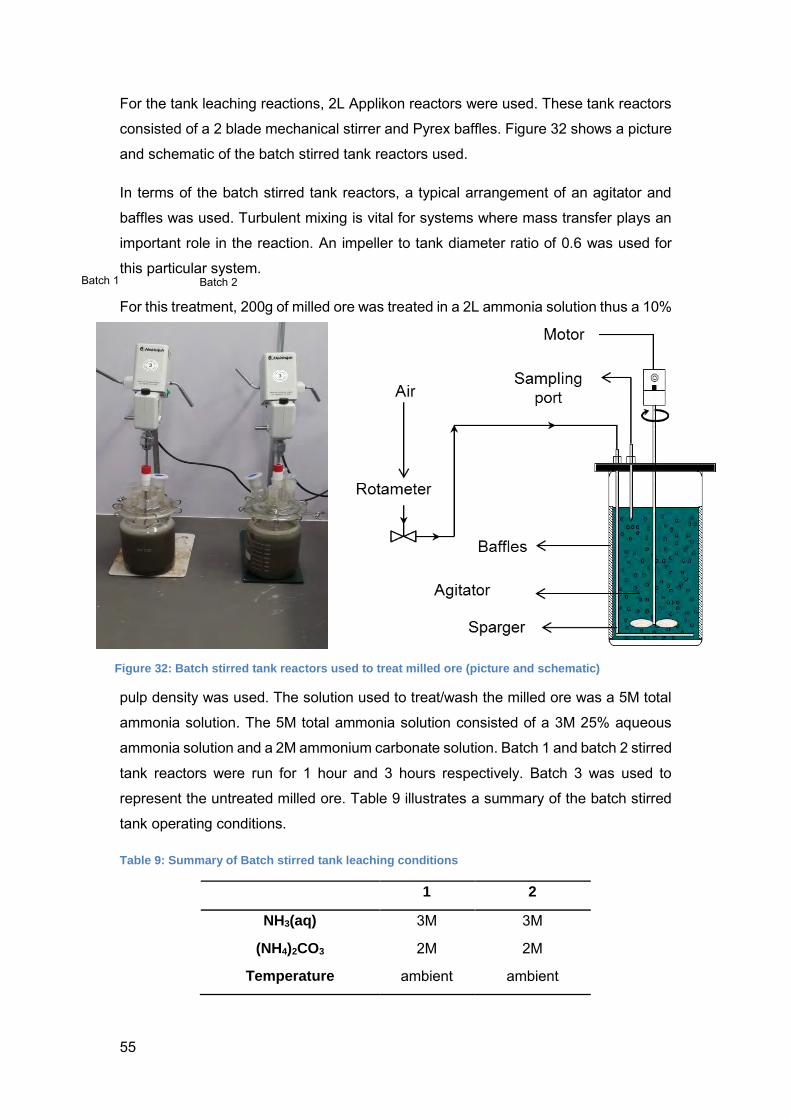
55
For the tank leaching reactions, 2L Applikon reactors were used. These tank reactors
consisted of a 2 blade mechanical stirrer and Pyrex baffles. Figure 32 shows a picture
and schematic of the batch stirred tank reactors used.
In terms of the batch stirred tank reactors, a typical arrangement of an agitator and
baffles was used. Turbulent mixing is vital for systems where mass transfer plays an
important role in the reaction. An impeller to tank diameter ratio of 0.6 was used for
this particular system.
For this treatment, 200g of milled ore was treated in a 2L ammonia solution thus a 10%
pulp density was used. The solution used to treat/wash the milled ore was a 5M total
ammonia solution. The 5M total ammonia solution consisted of a 3M 25% aqueous
ammonia solution and a 2M ammonium carbonate solution. Batch 1 and batch 2 stirred
tank reactors were run for 1 hour and 3 hours respectively. Batch 3 was used to
represent the untreated milled ore. Table 9 illustrates a summary of the batch stirred
tank operating conditions.
Table 9: Summary of Batch stirred tank leaching conditions
1 2
NH3(aq) 3M 3M
(NH4)2CO3 2M 2M
Temperature ambient ambient
Batch 1 Batch 2
Figure 32: Batch stirred tank reactors used to treat milled ore (picture and schematic)
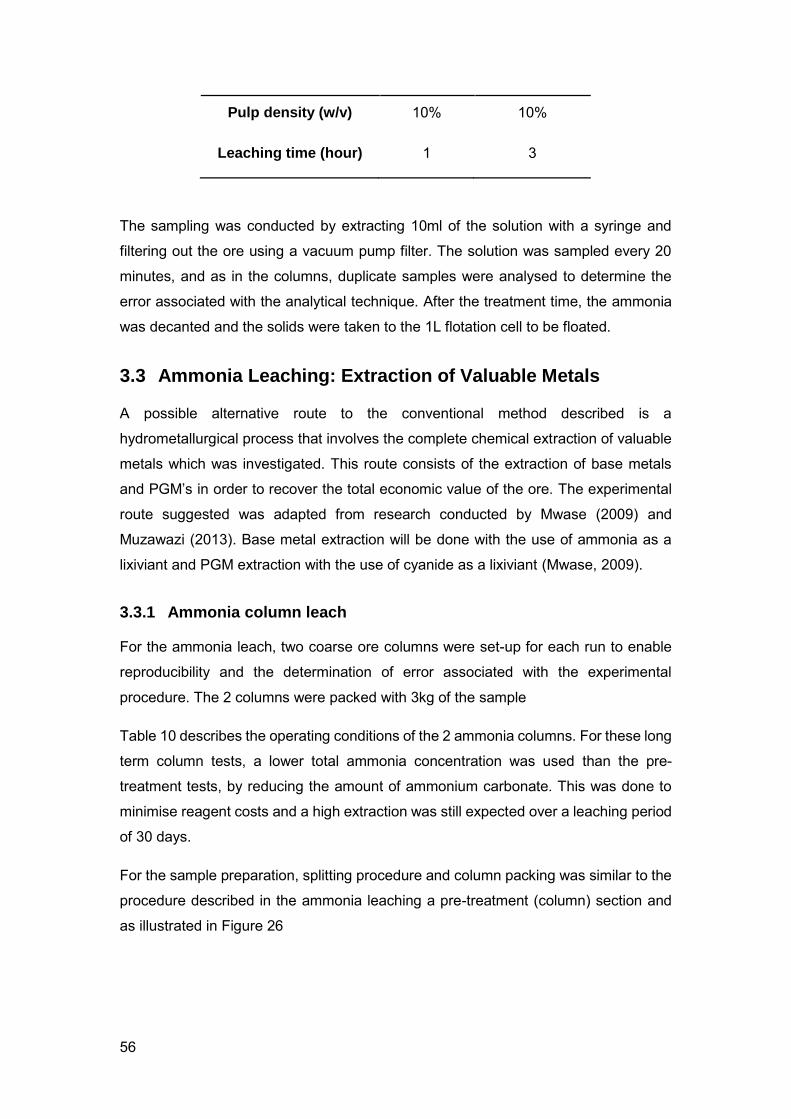
56
Pulp density (w/v) 10% 10%
Leaching time (hour) 1 3
The sampling was conducted by extracting 10ml of the solution with a syringe and
filtering out the ore using a vacuum pump filter. The solution was sampled every 20
minutes, and as in the columns, duplicate samples were analysed to determine the
error associated with the analytical technique. After the treatment time, the ammonia
was decanted and the solids were taken to the 1L flotation cell to be floated.
3.3 Ammonia Leaching: Extraction of Valuable Metals
A possible alternative route to the conventional method described is a
hydrometallurgical process that involves the complete chemical extraction of valuable
metals which was investigated. This route consists of the extraction of base metals
and PGM’s in order to recover the total economic value of the ore. The experimental
route suggested was adapted from research conducted by Mwase (2009) and
Muzawazi (2013). Base metal extraction will be done with the use of ammonia as a
lixiviant and PGM extraction with the use of cyanide as a lixiviant (Mwase, 2009).
3.3.1 Ammonia column leach
For the ammonia leach, two coarse ore columns were set-up for each run to enable
reproducibility and the determination of error associated with the experimental
procedure. The 2 columns were packed with 3kg of the sample
Table 10 describes the operating conditions of the 2 ammonia columns. For these long
term column tests, a lower total ammonia concentration was used than the pre-
treatment tests, by reducing the amount of ammonium carbonate. This was done to
minimise reagent costs and a high extraction was still expected over a leaching period
of 30 days.
For the sample preparation, splitting procedure and column packing was similar to the
procedure described in the ammonia leaching a pre-treatment (column) section and
as illustrated in Figure 26
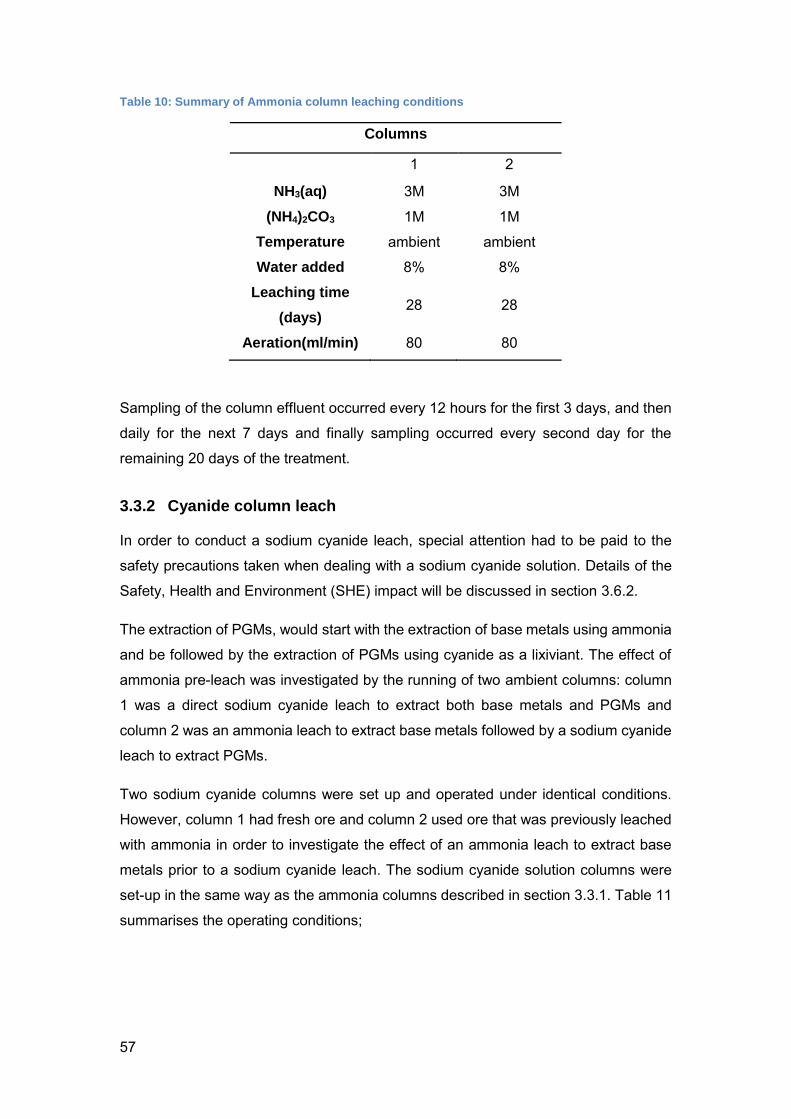
57
Table 10: Summary of Ammonia column leaching conditions
Columns
1 2
NH3(aq) 3M 3M
(NH4)2CO3 1M 1M
Temperature ambient ambient
Water added 8% 8%
Leaching time
(days) 28 28
Aeration(ml/min) 80 80
Sampling of the column effluent occurred every 12 hours for the first 3 days, and then
daily for the next 7 days and finally sampling occurred every second day for the
remaining 20 days of the treatment.
3.3.2 Cyanide column leach
In order to conduct a sodium cyanide leach, special attention had to be paid to the
safety precautions taken when dealing with a sodium cyanide solution. Details of the
Safety, Health and Environment (SHE) impact will be discussed in section 3.6.2.
The extraction of PGMs, would start with the extraction of base metals using ammonia
and be followed by the extraction of PGMs using cyanide as a lixiviant. The effect of
ammonia pre-leach was investigated by the running of two ambient columns: column
1 was a direct sodium cyanide leach to extract both base metals and PGMs and
column 2 was an ammonia leach to extract base metals followed by a sodium cyanide
leach to extract PGMs.
Two sodium cyanide columns were set up and operated under identical conditions.
However, column 1 had fresh ore and column 2 used ore that was previously leached
with ammonia in order to investigate the effect of an ammonia leach to extract base
metals prior to a sodium cyanide leach. The sodium cyanide solution columns were
set-up in the same way as the ammonia columns described in section 3.3.1. Table 11
summarises the operating conditions;
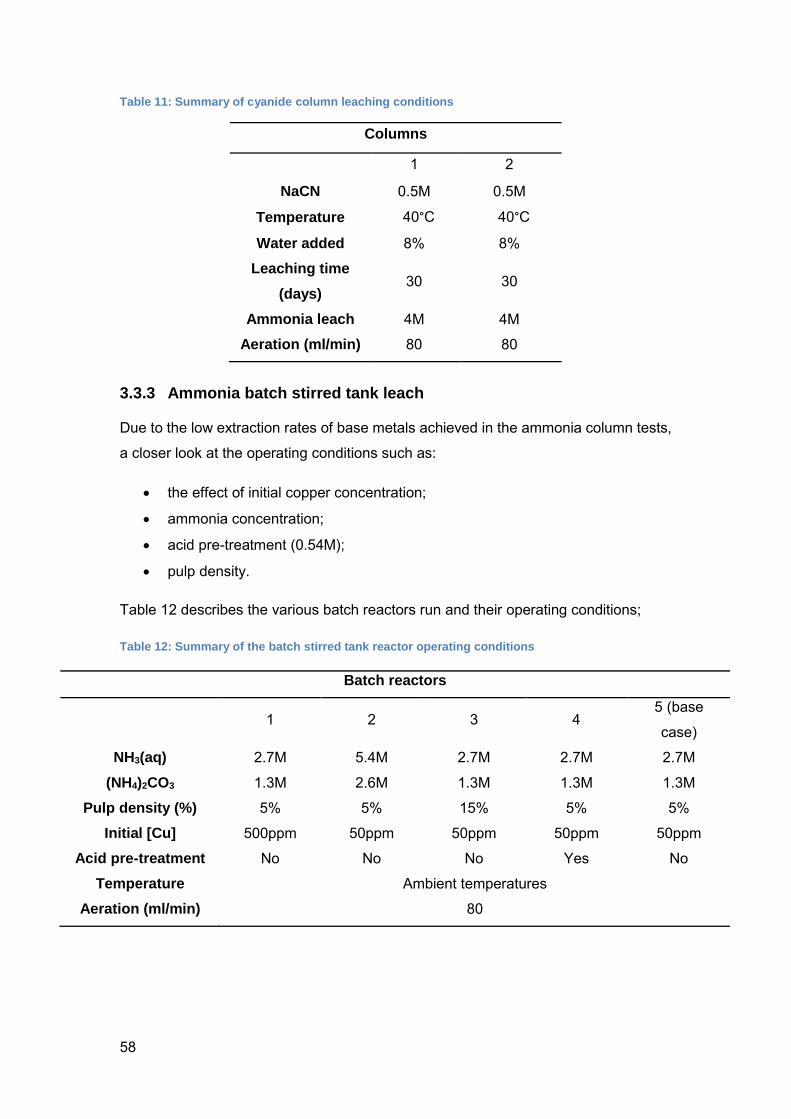
58
Table 11: Summary of cyanide column leaching conditions
Columns
1 2
NaCN 0.5M 0.5M
Temperature 40°C 40°C
Water added 8% 8%
Leaching time
(days) 30 30
Ammonia leach 4M 4M
Aeration (ml/min) 80 80
3.3.3 Ammonia batch stirred tank leach
Due to the low extraction rates of base metals achieved in the ammonia column tests,
a closer look at the operating conditions such as:
the effect of initial copper concentration;
ammonia concentration;
acid pre-treatment (0.54M);
pulp density.
Table 12 describes the various batch reactors run and their operating conditions;
Table 12: Summary of the batch stirred tank reactor operating conditions
Batch reactors
1 2 3 4 5 (base
case)
NH3(aq) 2.7M 5.4M 2.7M 2.7M 2.7M
(NH4)2CO3 1.3M 2.6M 1.3M 1.3M 1.3M
Pulp density (%) 5% 5% 15% 5% 5%
Initial [Cu] 500ppm 50ppm 50ppm 50ppm 50ppm
Acid pre-treatment No No No Yes No
Temperature Ambient temperatures
Aeration (ml/min) 80
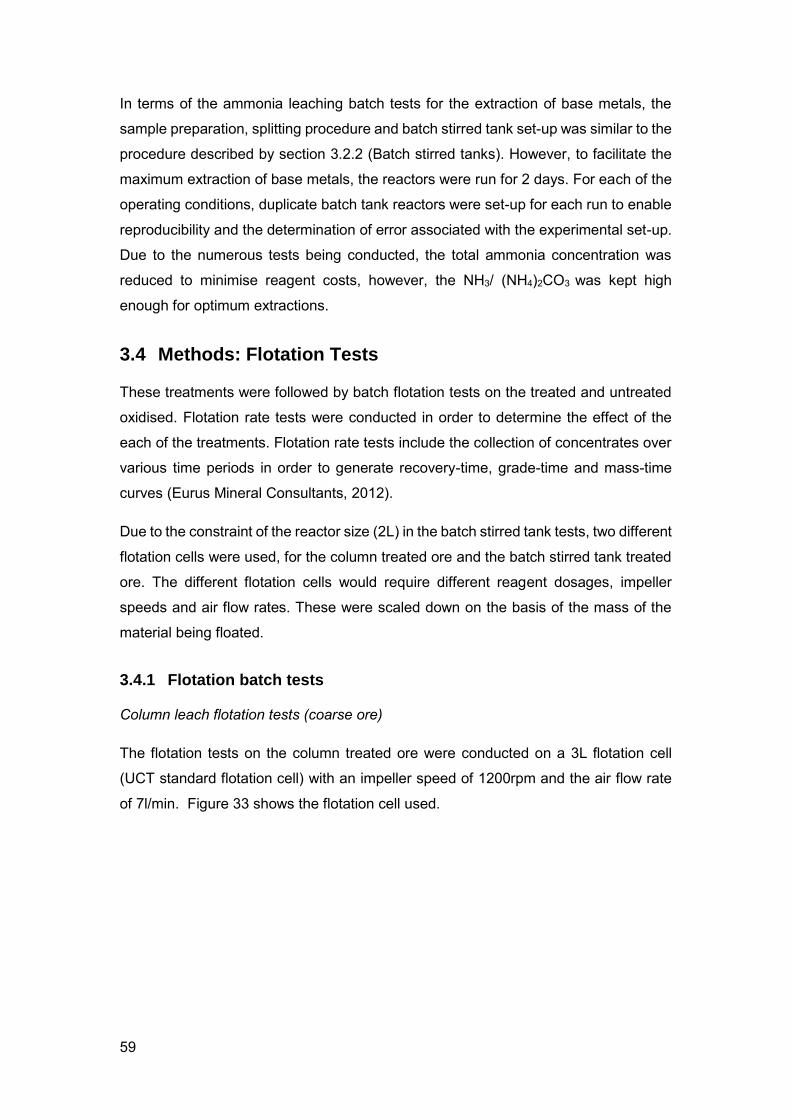
59
In terms of the ammonia leaching batch tests for the extraction of base metals, the
sample preparation, splitting procedure and batch stirred tank set-up was similar to the
procedure described by section 3.2.2 (Batch stirred tanks). However, to facilitate the
maximum extraction of base metals, the reactors were run for 2 days. For each of the
operating conditions, duplicate batch tank reactors were set-up for each run to enable
reproducibility and the determination of error associated with the experimental set-up.
Due to the numerous tests being conducted, the total ammonia concentration was
reduced to minimise reagent costs, however, the NH3/ (NH4)2CO3 was kept high
enough for optimum extractions.
3.4 Methods: Flotation Tests
These treatments were followed by batch flotation tests on the treated and untreated
oxidised. Flotation rate tests were conducted in order to determine the effect of the
each of the treatments. Flotation rate tests include the collection of concentrates over
various time periods in order to generate recovery-time, grade-time and mass-time
curves (Eurus Mineral Consultants, 2012).
Due to the constraint of the reactor size (2L) in the batch stirred tank tests, two different
flotation cells were used, for the column treated ore and the batch stirred tank treated
ore. The different flotation cells would require different reagent dosages, impeller
speeds and air flow rates. These were scaled down on the basis of the mass of the
material being floated.
3.4.1 Flotation batch tests
Column leach flotation tests (coarse ore)
The flotation tests on the column treated ore were conducted on a 3L flotation cell
(UCT standard flotation cell) with an impeller speed of 1200rpm and the air flow rate
of 7l/min. Figure 33 shows the flotation cell used.
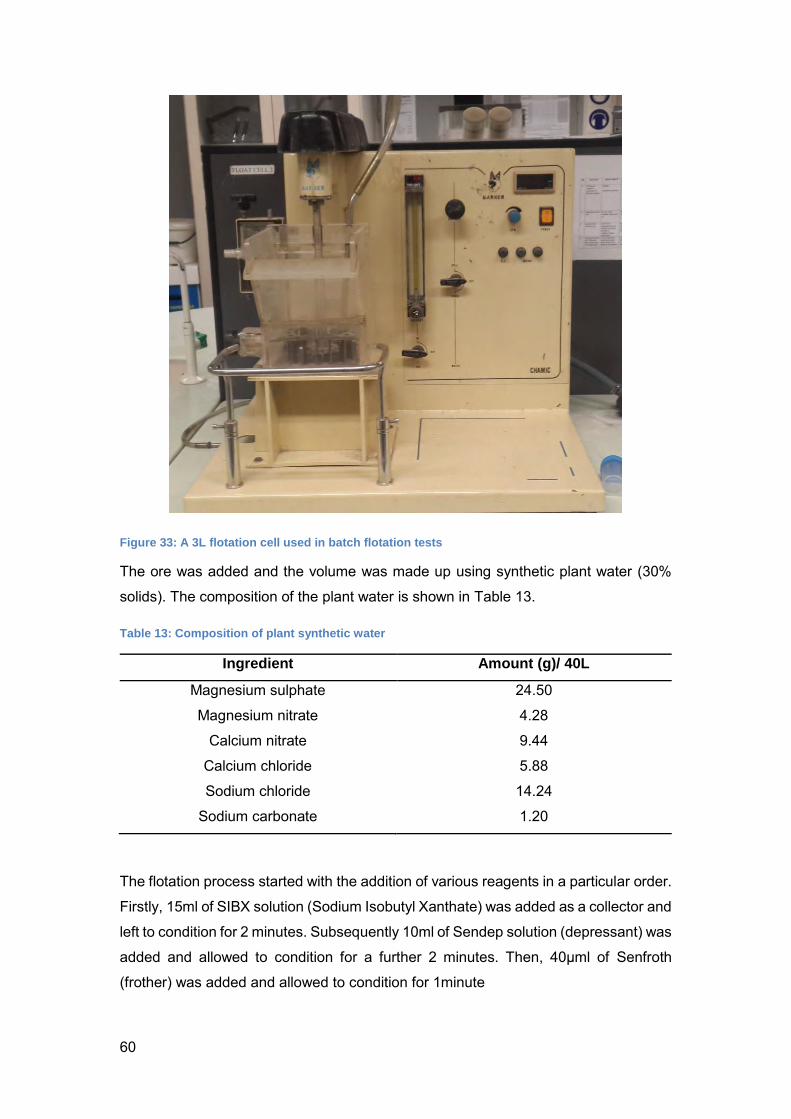
60
Figure 33: A 3L flotation cell used in batch flotation tests
The ore was added and the volume was made up using synthetic plant water (30%
solids). The composition of the plant water is shown in Table 13.
Table 13: Composition of plant synthetic water
Ingredient Amount (g)/ 40L
Magnesium sulphate 24.50
Magnesium nitrate 4.28
Calcium nitrate 9.44
Calcium chloride 5.88
Sodium chloride 14.24
Sodium carbonate 1.20
The flotation process started with the addition of various reagents in a particular order.
Firstly, 15ml of SIBX solution (Sodium Isobutyl Xanthate) was added as a collector and
left to condition for 2 minutes. Subsequently 10ml of Sendep solution (depressant) was
added and allowed to condition for a further 2 minutes. Then, 40μml of Senfroth
(frother) was added and allowed to condition for 1minute
61
Table 14: Summary of flotation reagent sequence and addition times
Reagent addition Reagent Dosage (mg/kg) Condition time
1 SIBX 150 5
2 Sendep 100 3
3 Senfroth 40 1
An air flow rate of 7L/min. was maintained throughout the flotation test. The agitation
rate was set to 1200rpm for all the flotation tests. Concentrates were collected
mechanically over the froth layer. During the first 5 minutes, the reagents are added
and conditioned (as shown in Table 14). After these initial 5 minutes, the aeration was
switched on and the first concentrate (C1) was collected over the next minute of
aeration (after 1 minute of aeration); the second concentrate (C2) was collected over
the next 3 minutes (after 4 minutes of aeration); the third concentrate (C3) was
collected over the next 3 minutes (after 7 minutes of aeration); and finally the fourth
concentrate (C4) was collected over the next 8 minutes (after 15 minutes of aeration).
The whole flotation process lasted a total of 20 minutes. This flotation procedure was
set according to the standard outlined by Wiese, Harris & Bradshaw (2005). The
concentrate collection procedure is summarised in Table 15:
Table 15: Summary of the concentrate collection times
Time (min) Concentrates
1 C1
4 C2
7 C3
15 C4
Batch stirred tank flotation tests (milled ore)
Due to the size and the appropriate pulp density of the batch stirred tank reactors (that
were used to treat the milled ore); each batch reactor could only treat at 200g at a time.
Therefore, a smaller flotation cell was used to determine the effect of the batch stirred
tank treatment of the ore. The flotation tests on the column treated ore were conducted
on a 1L flotation cell (UCT standard flotation cell).
62
Table 16: Summary of flotation reagent sequence and the addition times
Reagent addition Reagent Dosage (mg/kg) Condition time
1 SIBX 30 5
2 Sendep 25 3
3 Senfroth 8 1
The flotation tests on the milled ore were conducted on a 600ml Denver flotation cell.
Similar to the coarse ore flotation tests, the process started with the addition of various
reagents in a particular order. Firstly, 3ml of SIBX (Sodium Isobutyl Xanthate) was
added as a collector and left to condition for 2 minutes. Subsequently, 2.5ml of Sendep
(depressant) was added and allowed to condition for a further 2 minutes. Next, 8μml
of Senfroth (frother) was added and allowed to condition for 1minute.
An air flow rate of 3L/min. was maintained throughout the flotation test. The agitation
rate was set to 250rpm for all the flotation tests. The same flotation method described
in the Column leach flotation tests (coarse ore) section.
Table 17: Summary of the concentrate collection times
Time (min) Concentrates
1 C1
4 C2
7 C3
15 C4
3.5 Analytical Techniques
Head sample analysis was conducted at ALS Geochemistry in Johannesburg, South
Africa. The tests conducted were the PGM-ICP27 to determine the concentration of
the PGMs and ME-ICP81 for the base metals. For the PGM-ICP27, a 30g nominal
weight sample is analysed and Pt, Pd and Au are determined by a lead oxide collection
fire assay. For the ME-ICP81 test, the sample is digested by the ‘Four acid’ digestion
method and a 30g nominal weight sample is analysed for the base metals (ALS
Geochemistry, 2013).
To determine the base metal content in the lixiviant effluent, Atomic Absorption
Spectroscopy (AAS) was used at the UCT. AAS is a spectro-analytical test that was
used to qualitatively and quantitatively determine the elemental make up of a solution
63
(The Royal Society of Chemistry, 2010). However, the AAS test could only determine
elemental concentrations above 5ppm.
For samples with base metal or PGM concentrations less than 5ppm, the Inductive
Coupled Plasma Mass Spectrometer (ICP-MS) test was used. ICP-MS is an analytical
technique used to determine concentration of various elements (Wolf, 2005). It has a
particularly low detection limit which makes it ideal for low grade ores or samples with
low concentrations
3.6 Safety, health and environment
3.6.1 Ammonia (NH3)
Ammonia is a highly volatile compound and ammonia gas is lighter than air. Therefore,
the leaching process must occur in a closed system or alternatively in a highly
ventilated area or an area where a forced-draft has been implemented. Ammonia has
an atmospheric lifetime of a couple of days and disintegrates into nitrogen which forms
a major part of the natural environment (78% of air). However, due to the solubility of
ammonia in water, it forms an alkaline solution which causes an imbalance in pH of
surface water (ammonia solution).
The health and safety precautions in the laboratory are adapted from a recently
conducted experiment in the laboratory (Muzawazi, 2013) and information gathered
from the MSDS’s that are attached in the appendices. The following guidelines were
followed during the duration of the experiments.
Emergency shutdown procedures that are stipulated in the laboratory safety
forms in the appendix must be followed. Furthermore, these forms are located
above the reactor to ensure the safe operation of the various reactors.
Any open experiments that include ammonia such as the periodic
preparation of the ammoniacal solution must be conducted in fume hood
cupboard.
Any leaks and spills can be mopped and neutralised with water or dilute
acetic acid solutions.
Personal Protective Equipment (PPE) such as gloves, safety glasses, safety
shoes and laboratory coats must be worn at all times.
Any skin and eyes contact must be dealt with the emergency shower and
eyewash respectively which are located close to the nearest exit.
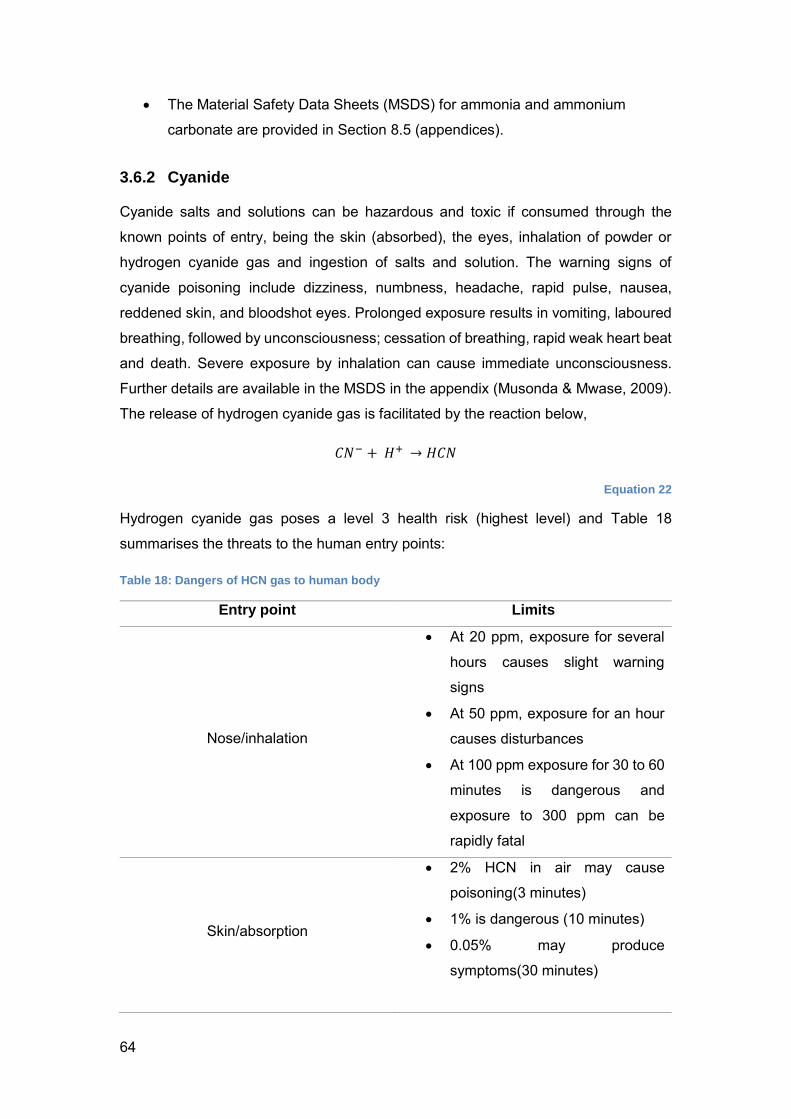
64
The Material Safety Data Sheets (MSDS) for ammonia and ammonium
carbonate are provided in Section 8.5 (appendices).
3.6.2 Cyanide
Cyanide salts and solutions can be hazardous and toxic if consumed through the
known points of entry, being the skin (absorbed), the eyes, inhalation of powder or
hydrogen cyanide gas and ingestion of salts and solution. The warning signs of
cyanide poisoning include dizziness, numbness, headache, rapid pulse, nausea,
reddened skin, and bloodshot eyes. Prolonged exposure results in vomiting, laboured
breathing, followed by unconsciousness; cessation of breathing, rapid weak heart beat
and death. Severe exposure by inhalation can cause immediate unconsciousness.
Further details are available in the MSDS in the appendix (Musonda & Mwase, 2009).
The release of hydrogen cyanide gas is facilitated by the reaction below,
𝐶𝑁− + 𝐻+ → 𝐻𝐶𝑁
Equation 22
Hydrogen cyanide gas poses a level 3 health risk (highest level) and Table 18
summarises the threats to the human entry points:
Table 18: Dangers of HCN gas to human body
Entry point Limits
Nose/inhalation
At 20 ppm, exposure for several
hours causes slight warning
signs
At 50 ppm, exposure for an hour
causes disturbances
At 100 ppm exposure for 30 to 60
minutes is dangerous and
exposure to 300 ppm can be
rapidly fatal
Skin/absorption
2% HCN in air may cause
poisoning(3 minutes)
1% is dangerous (10 minutes)
0.05% may produce
symptoms(30 minutes)
65
Mouth/ingestion 1 mg of cyanide salt per 1 kg of
body weight is fatal
Symptoms of contamination include dizziness, numbness, headache, nausea,
laboured breath and death. The following precautions were taken by the investigator
when dealing with cyanide solutions in the laboratory:
When preparing a CN solution:
Always wear correct PPE (safety glasses, gas mask and lab coat, safety shoes)
when dealing with CN solutions
Always verify your calculations
Ensure and check enough alkalinity of receiving solution (pH>10)
Weigh out and immediately close solid CN bottle
Make leaching solution with buffered water (as per Mintek standard method)
Make sure that equipment is rinsed with EDTA and bicarbonate solution before
use
Familiarise myself with cyanide anti-dote kit
When analysing CN samples:
• Any beakers/containers used must be rinsed in EDTA and bicarbonate solution
to remove metal ions and any acidic residues
• Cleaning equipment used to clean up spills must be disposed of immediately
after use
• Keep solution refrigerated
• Store in secondary containment barrier
• Label correctly with adequate warning
• Always have alkali solution available to counter any drops in pH
• Be sure to decontaminate any vessels used during experiment by placing them
in FeSO4
For people working in close proximity with cyanide experiments:
• Inform people in research group or who share lab space
• Have MSDS readily available/accessible

66
• Cyanide anti-dote kit available close to workspace
• First Aid instructions written out and accessible close to work space
In terms of waste disposal, approximately 60 litres of sodium cyanide was produced
as waste over the experimental run. This was stored in 25L containers and disposed
of appropriately. The Enviroserv waste management company was hired to transport
the waste to the Vissershok landfill where it is treated with HTH before dumping.
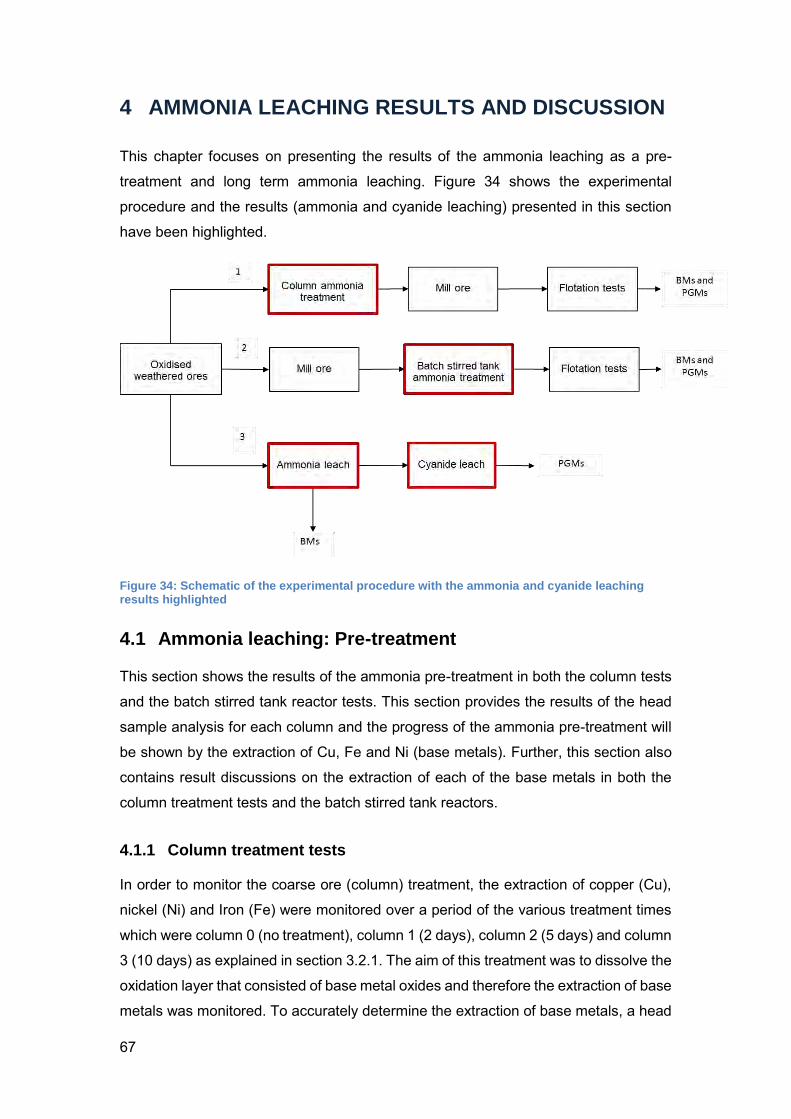
67
4 AMMONIA LEACHING RESULTS AND DISCUSSION
This chapter focuses on presenting the results of the ammonia leaching as a pre-
treatment and long term ammonia leaching. Figure 34 shows the experimental
procedure and the results (ammonia and cyanide leaching) presented in this section
have been highlighted.
Figure 34: Schematic of the experimental procedure with the ammonia and cyanide leaching results highlighted
4.1 Ammonia leaching: Pre-treatment
This section shows the results of the ammonia pre-treatment in both the column tests
and the batch stirred tank reactor tests. This section provides the results of the head
sample analysis for each column and the progress of the ammonia pre-treatment will
be shown by the extraction of Cu, Fe and Ni (base metals). Further, this section also
contains result discussions on the extraction of each of the base metals in both the
column treatment tests and the batch stirred tank reactors.
4.1.1 Column treatment tests
In order to monitor the coarse ore (column) treatment, the extraction of copper (Cu),
nickel (Ni) and Iron (Fe) were monitored over a period of the various treatment times
which were column 0 (no treatment), column 1 (2 days), column 2 (5 days) and column
3 (10 days) as explained in section 3.2.1. The aim of this treatment was to dissolve the
oxidation layer that consisted of base metal oxides and therefore the extraction of base
metals was monitored. To accurately determine the extraction of base metals, a head
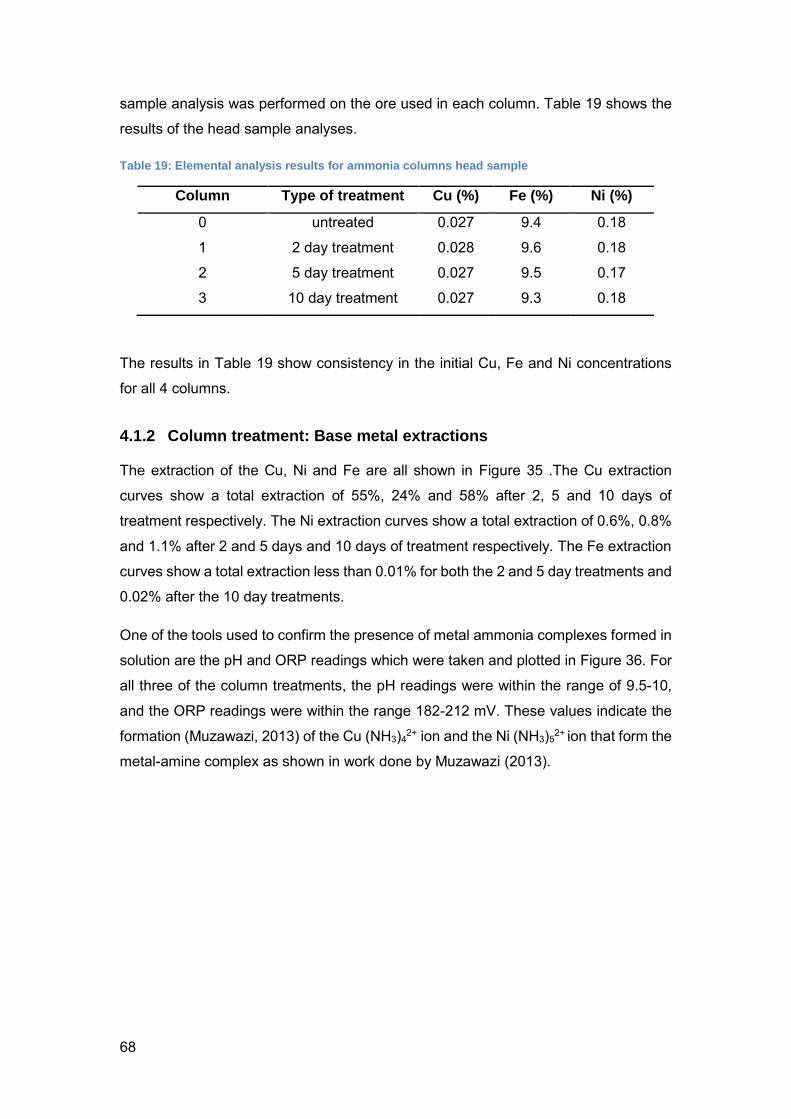
68
sample analysis was performed on the ore used in each column. Table 19 shows the
results of the head sample analyses.
Table 19: Elemental analysis results for ammonia columns head sample
Column Type of treatment Cu (%) Fe (%) Ni (%)
0 untreated 0.027 9.4 0.18
1 2 day treatment 0.028 9.6 0.18
2 5 day treatment 0.027 9.5 0.17
3 10 day treatment 0.027 9.3 0.18
The results in Table 19 show consistency in the initial Cu, Fe and Ni concentrations
for all 4 columns.
4.1.2 Column treatment: Base metal extractions
The extraction of the Cu, Ni and Fe are all shown in Figure 35 .The Cu extraction
curves show a total extraction of 55%, 24% and 58% after 2, 5 and 10 days of
treatment respectively. The Ni extraction curves show a total extraction of 0.6%, 0.8%
and 1.1% after 2 and 5 days and 10 days of treatment respectively. The Fe extraction
curves show a total extraction less than 0.01% for both the 2 and 5 day treatments and
0.02% after the 10 day treatments.
One of the tools used to confirm the presence of metal ammonia complexes formed in
solution are the pH and ORP readings which were taken and plotted in Figure 36. For
all three of the column treatments, the pH readings were within the range of 9.5-10,
and the ORP readings were within the range 182-212 mV. These values indicate the
formation (Muzawazi, 2013) of the Cu (NH3)42+ ion and the Ni (NH3)5
2+ ion that form the
metal-amine complex as shown in work done by Muzawazi (2013).
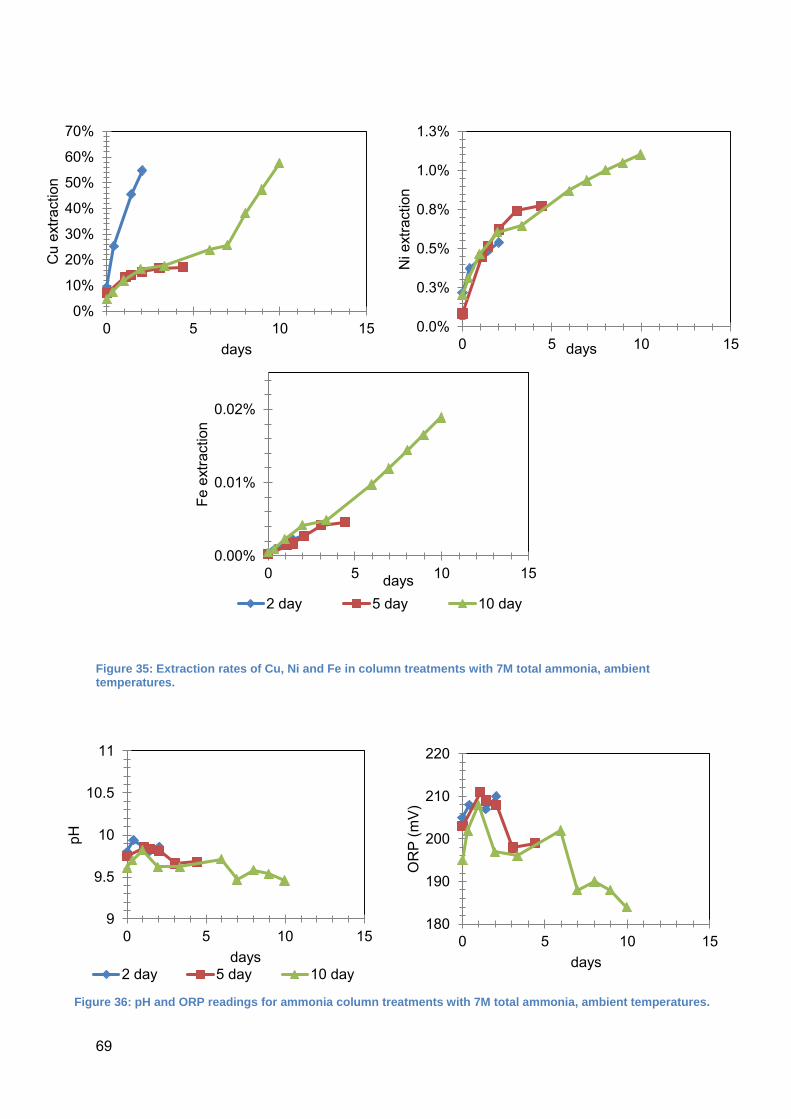
69
Figure 35: Extraction rates of Cu, Ni and Fe in column treatments with 7M total ammonia, ambient temperatures.
0%
10%
20%
30%
40%
50%
60%
70%
0 5 10 15
Cu
extra
ctio
n
days0.0%
0.3%
0.5%
0.8%
1.0%
1.3%
0 5 10 15
Ni e
xtra
ctio
n
days
0.00%
0.01%
0.02%
0 5 10 15
Fe e
xtra
ctio
n
days2 day 5 day 10 day
9
9.5
10
10.5
11
0 5 10 15
pH
days2 day 5 day 10 day
180
190
200
210
220
0 5 10 15
OR
P (m
V)
days
Figure 36: pH and ORP readings for ammonia column treatments with 7M total ammonia, ambient temperatures.
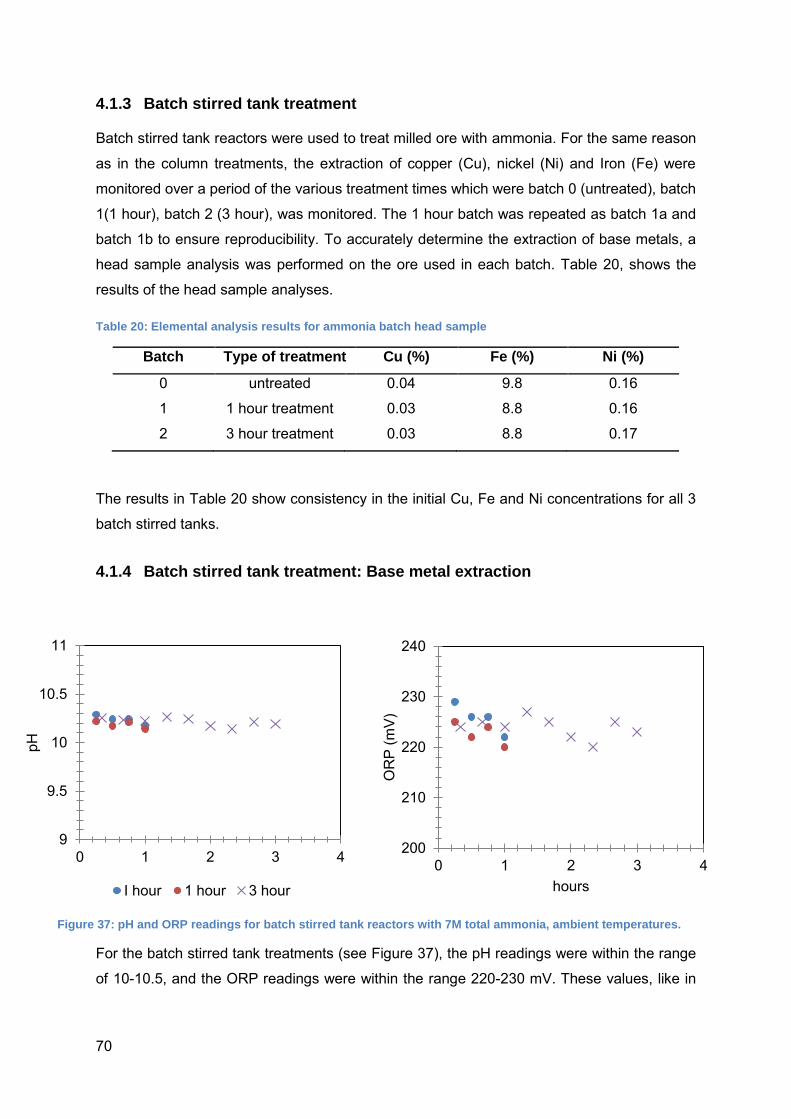
70
4.1.3 Batch stirred tank treatment
Batch stirred tank reactors were used to treat milled ore with ammonia. For the same reason
as in the column treatments, the extraction of copper (Cu), nickel (Ni) and Iron (Fe) were
monitored over a period of the various treatment times which were batch 0 (untreated), batch
1(1 hour), batch 2 (3 hour), was monitored. The 1 hour batch was repeated as batch 1a and
batch 1b to ensure reproducibility. To accurately determine the extraction of base metals, a
head sample analysis was performed on the ore used in each batch. Table 20, shows the
results of the head sample analyses.
Table 20: Elemental analysis results for ammonia batch head sample
Batch Type of treatment Cu (%) Fe (%) Ni (%)
0 untreated 0.04 9.8 0.16
1 1 hour treatment 0.03 8.8 0.16
2 3 hour treatment 0.03 8.8 0.17
The results in Table 20 show consistency in the initial Cu, Fe and Ni concentrations for all 3
batch stirred tanks.
4.1.4 Batch stirred tank treatment: Base metal extraction
For the batch stirred tank treatments (see Figure 37), the pH readings were within the range
of 10-10.5, and the ORP readings were within the range 220-230 mV. These values, like in
9
9.5
10
10.5
11
0 1 2 3 4
pH
I hour 1 hour 3 hour
200
210
220
230
240
0 1 2 3 4
OR
P (m
V)
hours
Figure 37: pH and ORP readings for batch stirred tank reactors with 7M total ammonia, ambient temperatures.
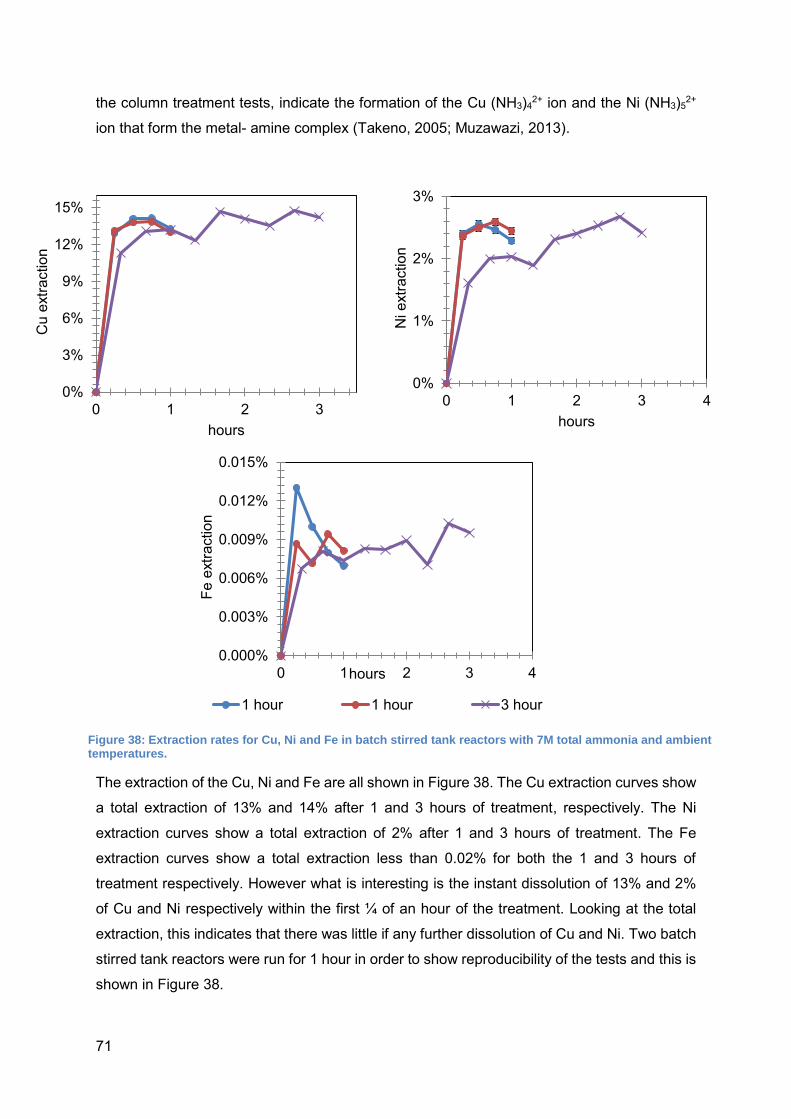
71
the column treatment tests, indicate the formation of the Cu (NH3)42+ ion and the Ni (NH3)5
2+
ion that form the metal- amine complex (Takeno, 2005; Muzawazi, 2013).
The extraction of the Cu, Ni and Fe are all shown in Figure 38. The Cu extraction curves show
a total extraction of 13% and 14% after 1 and 3 hours of treatment, respectively. The Ni
extraction curves show a total extraction of 2% after 1 and 3 hours of treatment. The Fe
extraction curves show a total extraction less than 0.02% for both the 1 and 3 hours of
treatment respectively. However what is interesting is the instant dissolution of 13% and 2%
of Cu and Ni respectively within the first ¼ of an hour of the treatment. Looking at the total
extraction, this indicates that there was little if any further dissolution of Cu and Ni. Two batch
stirred tank reactors were run for 1 hour in order to show reproducibility of the tests and this is
shown in Figure 38.
0%
1%
2%
3%
0 1 2 3 4N
i ext
ract
ion
hours
0.000%
0.003%
0.006%
0.009%
0.012%
0.015%
0 1 2 3 4
Fe e
xtra
ctio
n
hours
1 hour 1 hour 3 hour
0%
3%
6%
9%
12%
15%
0 1 2 3
Cu
extra
ctio
n
hours
Figure 38: Extraction rates for Cu, Ni and Fe in batch stirred tank reactors with 7M total ammonia and ambient temperatures.
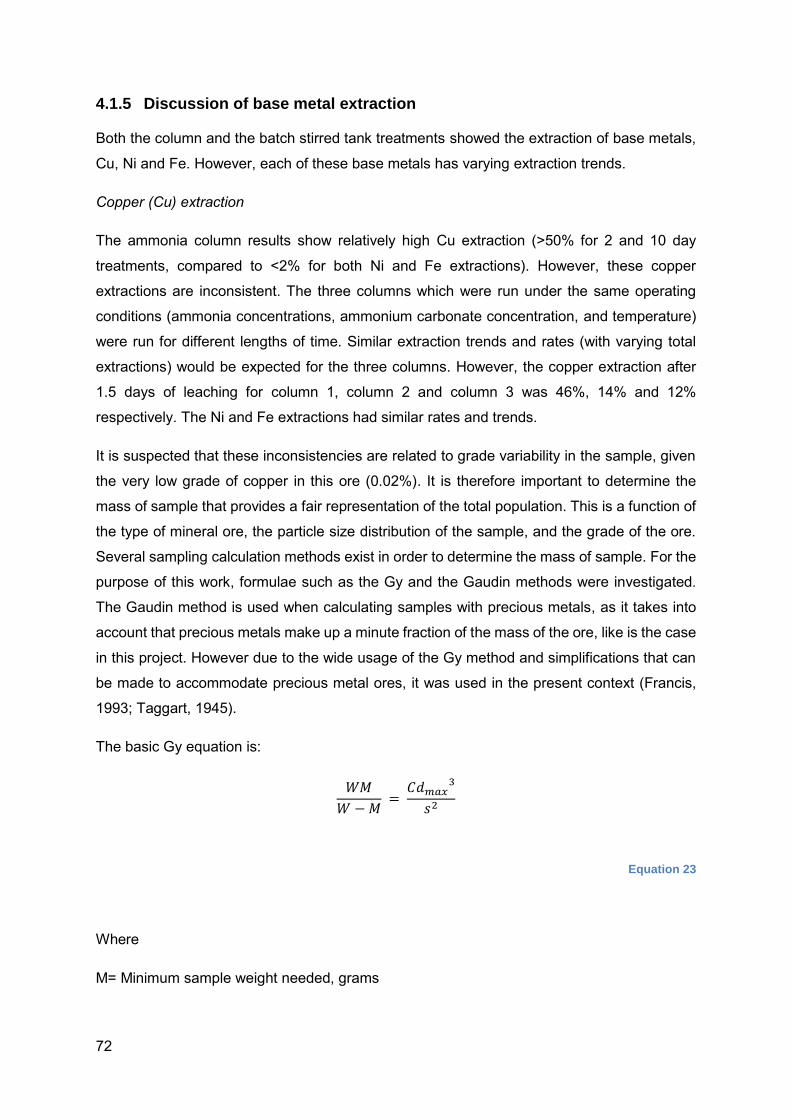
72
4.1.5 Discussion of base metal extraction
Both the column and the batch stirred tank treatments showed the extraction of base metals,
Cu, Ni and Fe. However, each of these base metals has varying extraction trends.
Copper (Cu) extraction
The ammonia column results show relatively high Cu extraction (>50% for 2 and 10 day
treatments, compared to <2% for both Ni and Fe extractions). However, these copper
extractions are inconsistent. The three columns which were run under the same operating
conditions (ammonia concentrations, ammonium carbonate concentration, and temperature)
were run for different lengths of time. Similar extraction trends and rates (with varying total
extractions) would be expected for the three columns. However, the copper extraction after
1.5 days of leaching for column 1, column 2 and column 3 was 46%, 14% and 12%
respectively. The Ni and Fe extractions had similar rates and trends.
It is suspected that these inconsistencies are related to grade variability in the sample, given
the very low grade of copper in this ore (0.02%). It is therefore important to determine the
mass of sample that provides a fair representation of the total population. This is a function of
the type of mineral ore, the particle size distribution of the sample, and the grade of the ore.
Several sampling calculation methods exist in order to determine the mass of sample. For the
purpose of this work, formulae such as the Gy and the Gaudin methods were investigated.
The Gaudin method is used when calculating samples with precious metals, as it takes into
account that precious metals make up a minute fraction of the mass of the ore, like is the case
in this project. However due to the wide usage of the Gy method and simplifications that can
be made to accommodate precious metal ores, it was used in the present context (Francis,
1993; Taggart, 1945).
The basic Gy equation is:
𝑊𝑀
𝑊 − 𝑀 =
𝐶𝑑𝑚𝑎𝑥3
𝑠2
Equation 23
Where
M= Minimum sample weight needed, grams
73
W= Weight of the entire lot being sampled, grams
C= Sampling constant for the material being sampled, g/cm3
dmax= Dimensions of the largest pieces in the sample, cm
s= value of the standard deviation that will be needed to give the desired level of assurance
(assay units, such as % wt.).
For the purpose of this work,
Equation 23 can be simplified to Equation 24 when W>>>M, as is the case with precious metal
ores.
M = 𝐶𝑑𝑚𝑎𝑥
3
𝑠2
Equation 24
(Francis, 1993)
In order to make preliminary calculations, the same assumptions as in the work by Holmes
(2004) were made, as a similar ore was used. This calculation using the following parameters
(shown in appendix section8.3) resulted in a minimum sample mass of 27 kg in order to have
a fair representation of the ore. A summary of the parameters used in this calculation is
presented in Table 21
Table 21: Summary of parameters used in calculation of minimal sample size
Variables Units Coarse ore Milled ore
Cu assay % 0.024 0.024 s % 0.022 0.022 C g/cm3 162 610
dmax cm 0.43 0.03 Mass kg 26.64 0.04
This calculation was done on the basis of the Cu concentration and the top size of the ore
used. Due to limitations of the columns in the laboratory, only 3kg of ore was used, therefore
this explains the inconsistent nature of the Cu extraction curves for the 2, 5 and 10 day column
treatment curves (see Figure 35). Further, for a much smaller top size such as the ore used
for the batch stirred tank treatment, the minimal sample requirement was 35g. Given that 200g
were used for each batch test, the Cu extraction curves were more consistent in this case (see
Figure 38).
74
Iron (Fe) extraction
In terms of the Fe extraction, the total extraction of Fe in both the column and the batch stirred
tank treatments was below 0.02% and therefore it can be assumed to be zero/no extraction.
This shows that Fe was hardly dissolved in the ammonia solution. This is in line with work by
Beckstead and Miller and Muzawazi (Muzawazi, 2013; Beckstead & Miller, 1977) that alluded
to the oxidation of iron to ferric and subsequently the precipitation of ferric to iron oxides which
are insoluble in ammonia under the given conditions. In the case of this project (see Table 6),
Fe is hence considered insoluble as it is in the form of Fe oxides/hydroxides.
Nickel (Ni) extraction
In terms of the nickel extraction, in an attempt to dissolve the oxidation layer, the results of
both the column treatment and the batch stirred tank treatments, show that the longer the
treatments, the higher the Ni extractions, this was expected. However, a low total Ni extraction
was observed for both the column and the batch stirred tank reactors (a minimum of 1.1% and
2.5% respectively).
Finally, due to the inconsistencies with the Cu extraction rates and the insignificant Fe
extractions, Ni extraction will be used as a proxy to investigate the leaching of base metals
from here onwards. Further, due to the instant dissolution of the base metals, especially in the
stirred batch tank tests (see Figure 38), the long term tests were used to investigate what
happens to Ni extraction over a longer period of time.
The column and batch stirred tank treated ore was floated in order to determine the effect of
the treatment on the flotation of this ore. The subsequent flotation results will be presented in
Chapter 5 (flotation results). The long term ammonia leaching of the ore was also investigated
and the results of the column and batch stirred tank ammonia leaching tests is presented
below.
4.2 Extraction of Valuable Metals
This section presents the results of the long term ammonia column and batch stirred tank
reactor leach. The head sample analysis (elemental base and precious group metals) and the
extraction results of Cu, Fe and Ni (base metals) has been presented and discussed.
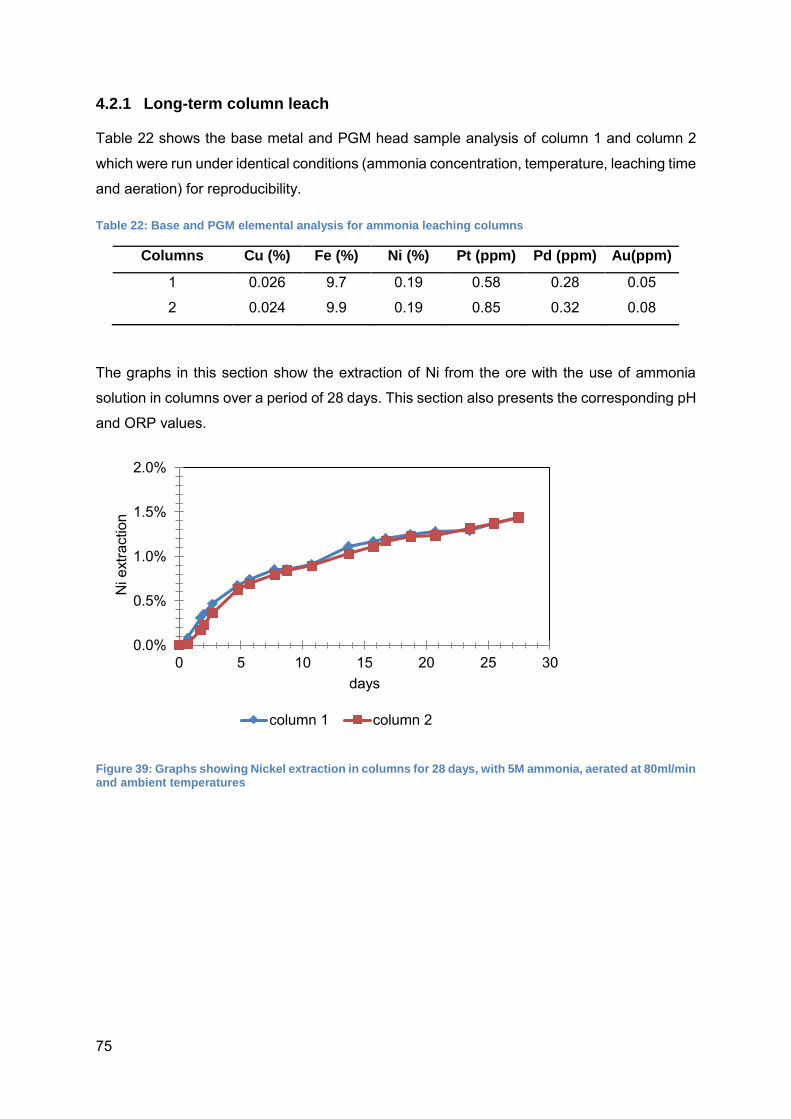
75
4.2.1 Long-term column leach
Table 22 shows the base metal and PGM head sample analysis of column 1 and column 2
which were run under identical conditions (ammonia concentration, temperature, leaching time
and aeration) for reproducibility.
Table 22: Base and PGM elemental analysis for ammonia leaching columns
Columns Cu (%) Fe (%) Ni (%) Pt (ppm) Pd (ppm) Au(ppm)
1 0.026 9.7 0.19 0.58 0.28 0.05
2 0.024 9.9 0.19 0.85 0.32 0.08
The graphs in this section show the extraction of Ni from the ore with the use of ammonia
solution in columns over a period of 28 days. This section also presents the corresponding pH
and ORP values.
Figure 39: Graphs showing Nickel extraction in columns for 28 days, with 5M ammonia, aerated at 80ml/min and ambient temperatures
0.0%
0.5%
1.0%
1.5%
2.0%
0 5 10 15 20 25 30
Ni e
xtra
ctio
n
days
column 1 column 2
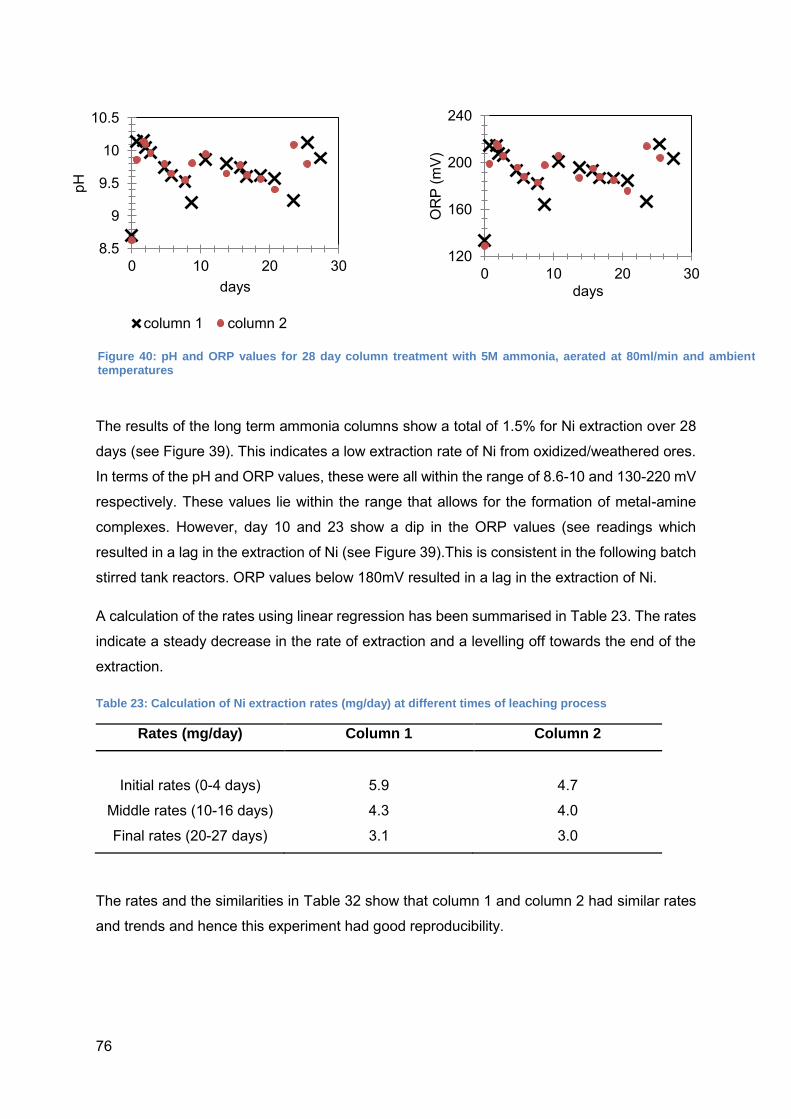
76
The results of the long term ammonia columns show a total of 1.5% for Ni extraction over 28
days (see Figure 39). This indicates a low extraction rate of Ni from oxidized/weathered ores.
In terms of the pH and ORP values, these were all within the range of 8.6-10 and 130-220 mV
respectively. These values lie within the range that allows for the formation of metal-amine
complexes. However, day 10 and 23 show a dip in the ORP values (see readings which
resulted in a lag in the extraction of Ni (see Figure 39).This is consistent in the following batch
stirred tank reactors. ORP values below 180mV resulted in a lag in the extraction of Ni.
A calculation of the rates using linear regression has been summarised in Table 23. The rates
indicate a steady decrease in the rate of extraction and a levelling off towards the end of the
extraction.
Table 23: Calculation of Ni extraction rates (mg/day) at different times of leaching process
Rates (mg/day) Column 1 Column 2
Initial rates (0-4 days) 5.9 4.7
Middle rates (10-16 days) 4.3 4.0
Final rates (20-27 days) 3.1 3.0
The rates and the similarities in Table 32 show that column 1 and column 2 had similar rates
and trends and hence this experiment had good reproducibility.
8.5
9
9.5
10
10.5
0 10 20 30
pH
days
column 1 column 2
120
160
200
240
0 10 20 30
OR
P (m
V)
days
Figure 40: pH and ORP values for 28 day column treatment with 5M ammonia, aerated at 80ml/min and ambient temperatures
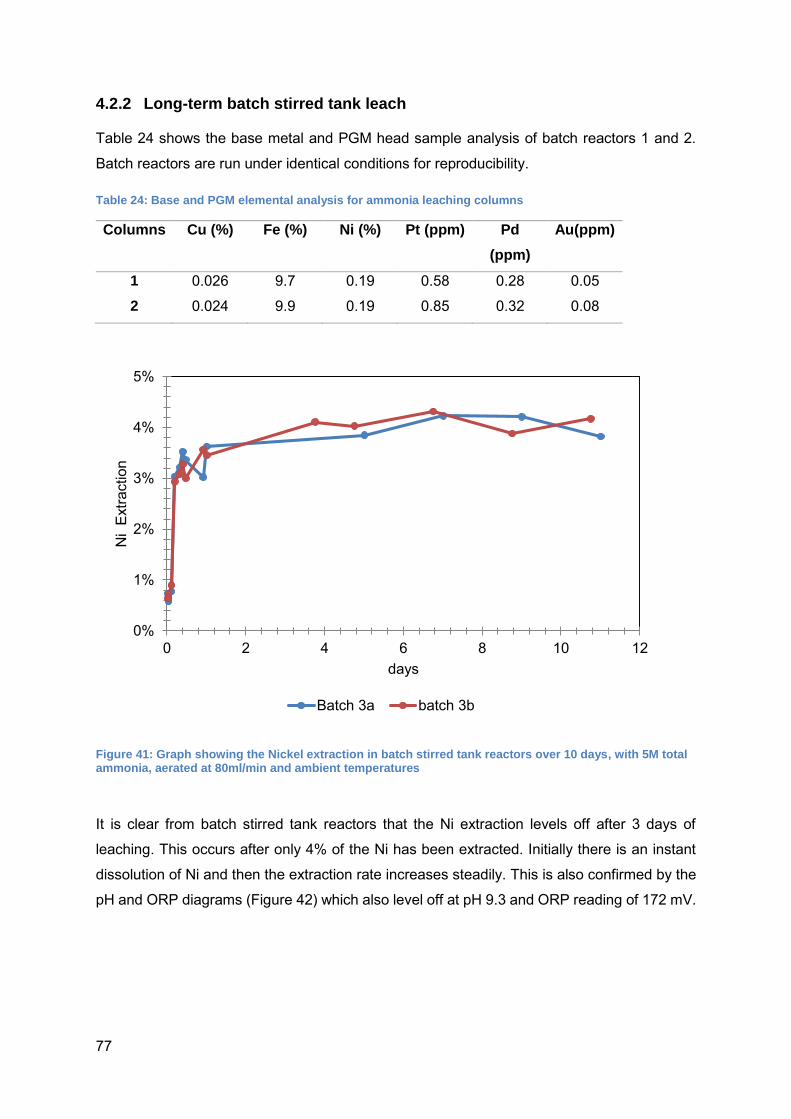
77
4.2.2 Long-term batch stirred tank leach
Table 24 shows the base metal and PGM head sample analysis of batch reactors 1 and 2.
Batch reactors are run under identical conditions for reproducibility.
Table 24: Base and PGM elemental analysis for ammonia leaching columns
Columns Cu (%) Fe (%) Ni (%) Pt (ppm) Pd
(ppm)
Au(ppm)
1 0.026 9.7 0.19 0.58 0.28 0.05
2 0.024 9.9 0.19 0.85 0.32 0.08
Figure 41: Graph showing the Nickel extraction in batch stirred tank reactors over 10 days, with 5M total ammonia, aerated at 80ml/min and ambient temperatures
It is clear from batch stirred tank reactors that the Ni extraction levels off after 3 days of
leaching. This occurs after only 4% of the Ni has been extracted. Initially there is an instant
dissolution of Ni and then the extraction rate increases steadily. This is also confirmed by the
pH and ORP diagrams (Figure 42) which also level off at pH 9.3 and ORP reading of 172 mV.
0%
1%
2%
3%
4%
5%
0 2 4 6 8 10 12
Ni
Extra
ctio
n
days
Batch 3a batch 3b
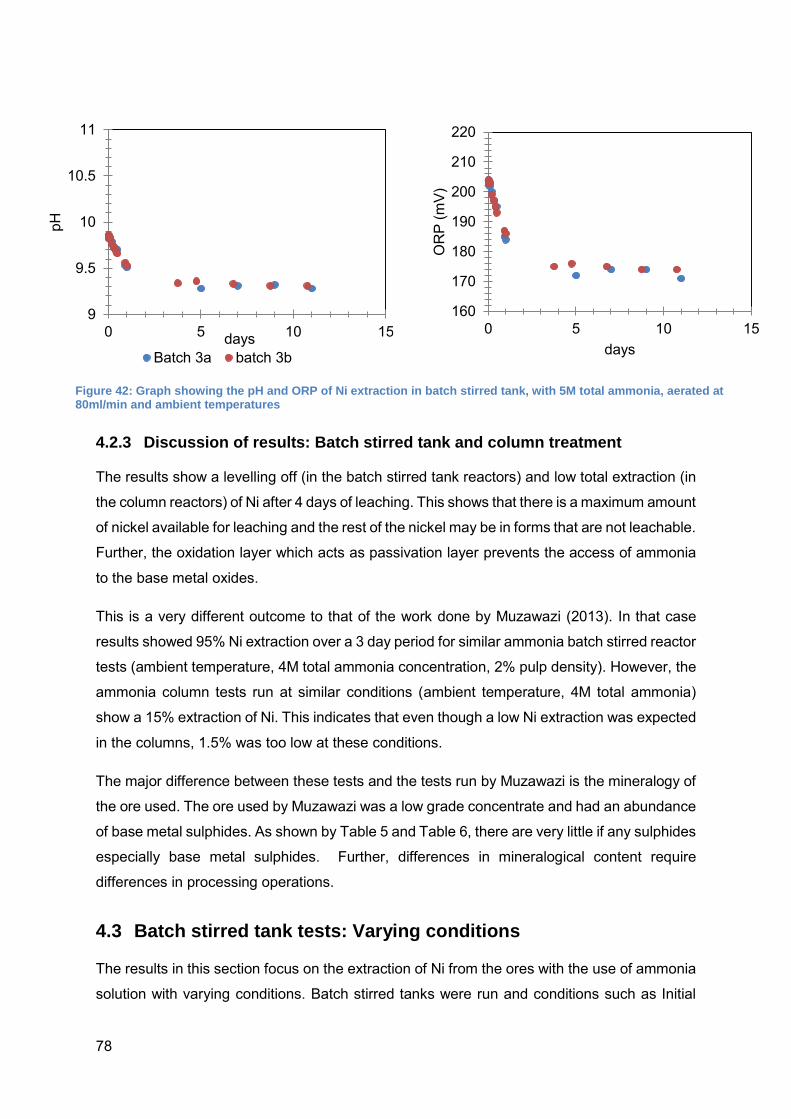
78
4.2.3 Discussion of results: Batch stirred tank and column treatment
The results show a levelling off (in the batch stirred tank reactors) and low total extraction (in
the column reactors) of Ni after 4 days of leaching. This shows that there is a maximum amount
of nickel available for leaching and the rest of the nickel may be in forms that are not leachable.
Further, the oxidation layer which acts as passivation layer prevents the access of ammonia
to the base metal oxides.
This is a very different outcome to that of the work done by Muzawazi (2013). In that case
results showed 95% Ni extraction over a 3 day period for similar ammonia batch stirred reactor
tests (ambient temperature, 4M total ammonia concentration, 2% pulp density). However, the
ammonia column tests run at similar conditions (ambient temperature, 4M total ammonia)
show a 15% extraction of Ni. This indicates that even though a low Ni extraction was expected
in the columns, 1.5% was too low at these conditions.
The major difference between these tests and the tests run by Muzawazi is the mineralogy of
the ore used. The ore used by Muzawazi was a low grade concentrate and had an abundance
of base metal sulphides. As shown by Table 5 and Table 6, there are very little if any sulphides
especially base metal sulphides. Further, differences in mineralogical content require
differences in processing operations.
4.3 Batch stirred tank tests: Varying conditions
The results in this section focus on the extraction of Ni from the ores with the use of ammonia
solution with varying conditions. Batch stirred tanks were run and conditions such as Initial
9
9.5
10
10.5
11
0 5 10 15
pH
daysBatch 3a batch 3b
160
170
180
190
200
210
220
0 5 10 15
OR
P (m
V)
days
Figure 42: Graph showing the pH and ORP of Ni extraction in batch stirred tank, with 5M total ammonia, aerated at 80ml/min and ambient temperatures
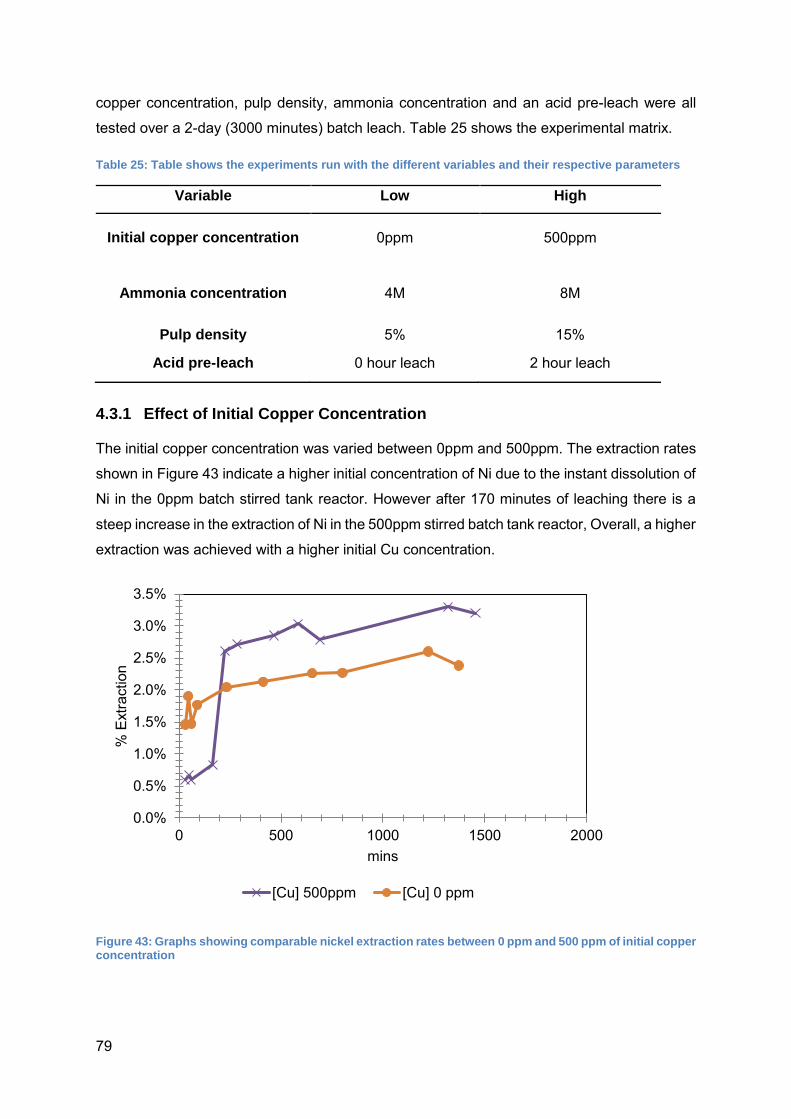
79
copper concentration, pulp density, ammonia concentration and an acid pre-leach were all
tested over a 2-day (3000 minutes) batch leach. Table 25 shows the experimental matrix.
Table 25: Table shows the experiments run with the different variables and their respective parameters
Variable Low High
Initial copper concentration 0ppm 500ppm
Ammonia concentration 4M 8M
Pulp density 5% 15%
Acid pre-leach 0 hour leach 2 hour leach
4.3.1 Effect of Initial Copper Concentration
The initial copper concentration was varied between 0ppm and 500ppm. The extraction rates
shown in Figure 43 indicate a higher initial concentration of Ni due to the instant dissolution of
Ni in the 0ppm batch stirred tank reactor. However after 170 minutes of leaching there is a
steep increase in the extraction of Ni in the 500ppm stirred batch tank reactor, Overall, a higher
extraction was achieved with a higher initial Cu concentration.
Figure 43: Graphs showing comparable nickel extraction rates between 0 ppm and 500 ppm of initial copper concentration
0.0%
0.5%
1.0%
1.5%
2.0%
2.5%
3.0%
3.5%
0 500 1000 1500 2000
% E
xtra
ctio
n
mins
[Cu] 500ppm [Cu] 0 ppm
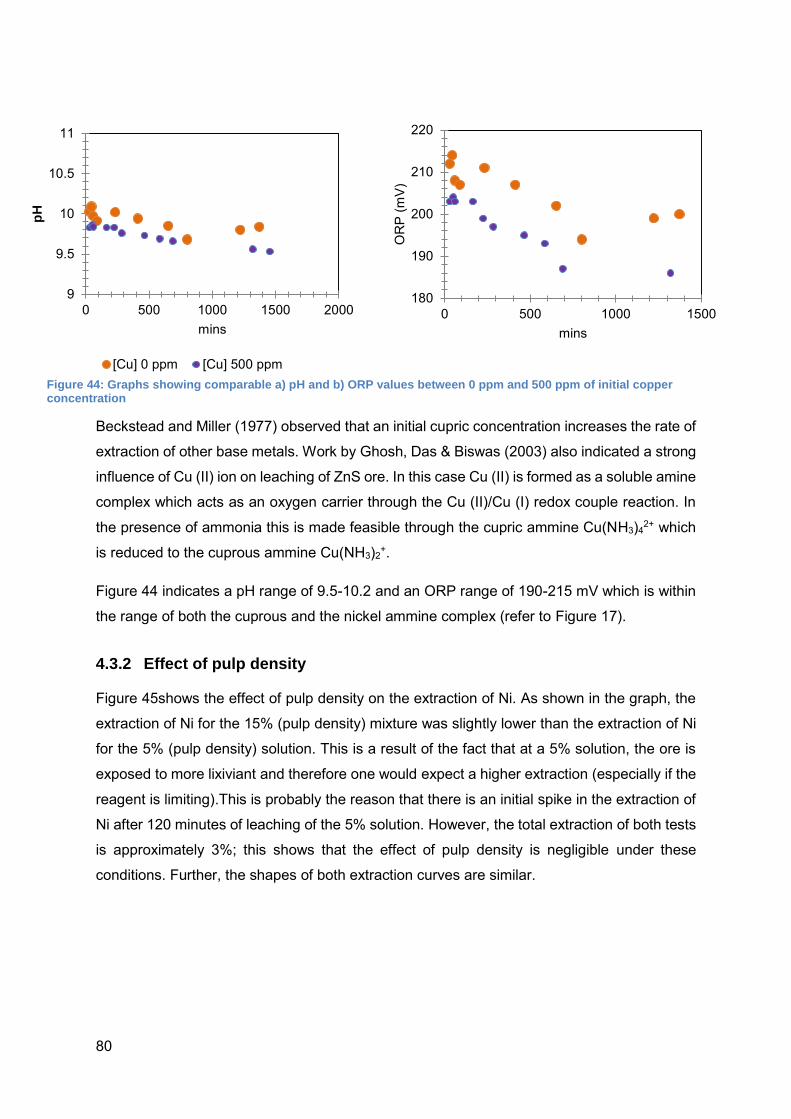
80
Beckstead and Miller (1977) observed that an initial cupric concentration increases the rate of
extraction of other base metals. Work by Ghosh, Das & Biswas (2003) also indicated a strong
influence of Cu (II) ion on leaching of ZnS ore. In this case Cu (II) is formed as a soluble amine
complex which acts as an oxygen carrier through the Cu (II)/Cu (I) redox couple reaction. In
the presence of ammonia this is made feasible through the cupric ammine Cu(NH3)42+ which
is reduced to the cuprous ammine Cu(NH3)2+.
Figure 44 indicates a pH range of 9.5-10.2 and an ORP range of 190-215 mV which is within
the range of both the cuprous and the nickel ammine complex (refer to Figure 17).
4.3.2 Effect of pulp density
Figure 45shows the effect of pulp density on the extraction of Ni. As shown in the graph, the
extraction of Ni for the 15% (pulp density) mixture was slightly lower than the extraction of Ni
for the 5% (pulp density) solution. This is a result of the fact that at a 5% solution, the ore is
exposed to more lixiviant and therefore one would expect a higher extraction (especially if the
reagent is limiting).This is probably the reason that there is an initial spike in the extraction of
Ni after 120 minutes of leaching of the 5% solution. However, the total extraction of both tests
is approximately 3%; this shows that the effect of pulp density is negligible under these
conditions. Further, the shapes of both extraction curves are similar.
9
9.5
10
10.5
11
0 500 1000 1500 2000
pH
mins
[Cu] 0 ppm [Cu] 500 ppm
180
190
200
210
220
0 500 1000 1500
OR
P (m
V)
mins
Figure 44: Graphs showing comparable a) pH and b) ORP values between 0 ppm and 500 ppm of initial copper concentration
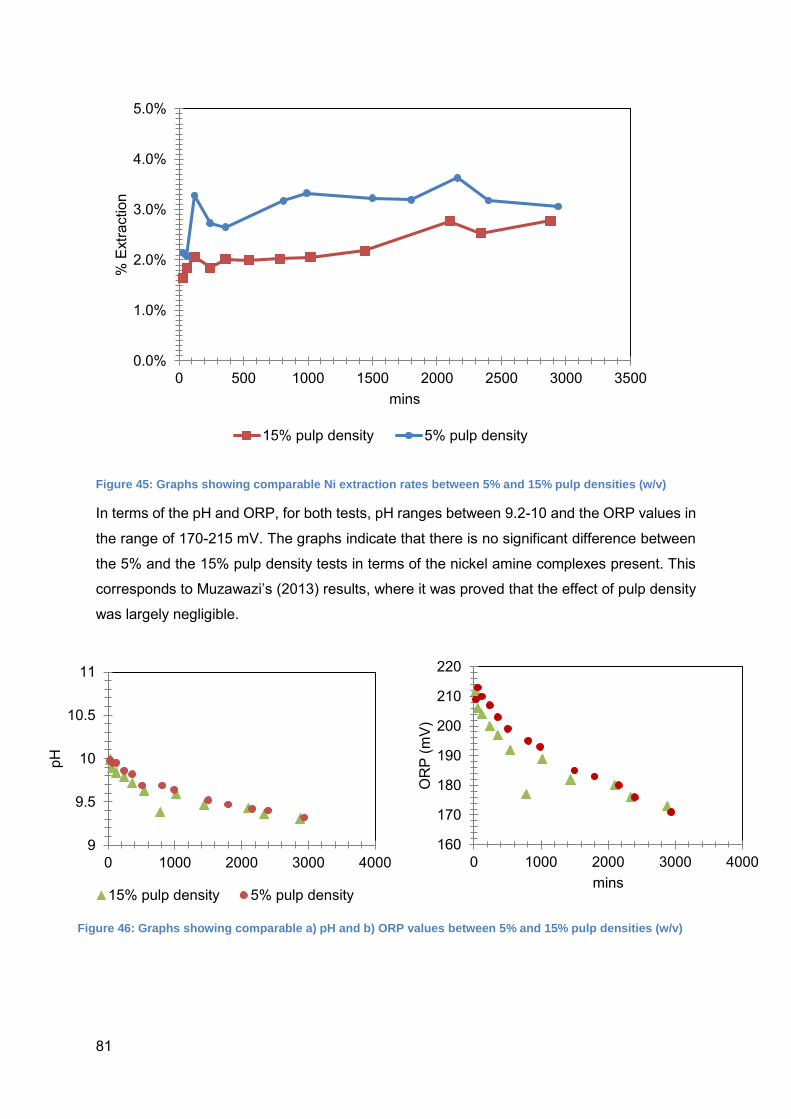
81
Figure 45: Graphs showing comparable Ni extraction rates between 5% and 15% pulp densities (w/v)
In terms of the pH and ORP, for both tests, pH ranges between 9.2-10 and the ORP values in
the range of 170-215 mV. The graphs indicate that there is no significant difference between
the 5% and the 15% pulp density tests in terms of the nickel amine complexes present. This
corresponds to Muzawazi’s (2013) results, where it was proved that the effect of pulp density
was largely negligible.
0.0%
1.0%
2.0%
3.0%
4.0%
5.0%
0 500 1000 1500 2000 2500 3000 3500
% E
xtra
ctio
n
mins
15% pulp density 5% pulp density
9
9.5
10
10.5
11
0 1000 2000 3000 4000
pH
15% pulp density 5% pulp density
160
170
180
190
200
210
220
0 1000 2000 3000 4000
OR
P (m
V)
mins
Figure 46: Graphs showing comparable a) pH and b) ORP values between 5% and 15% pulp densities (w/v)
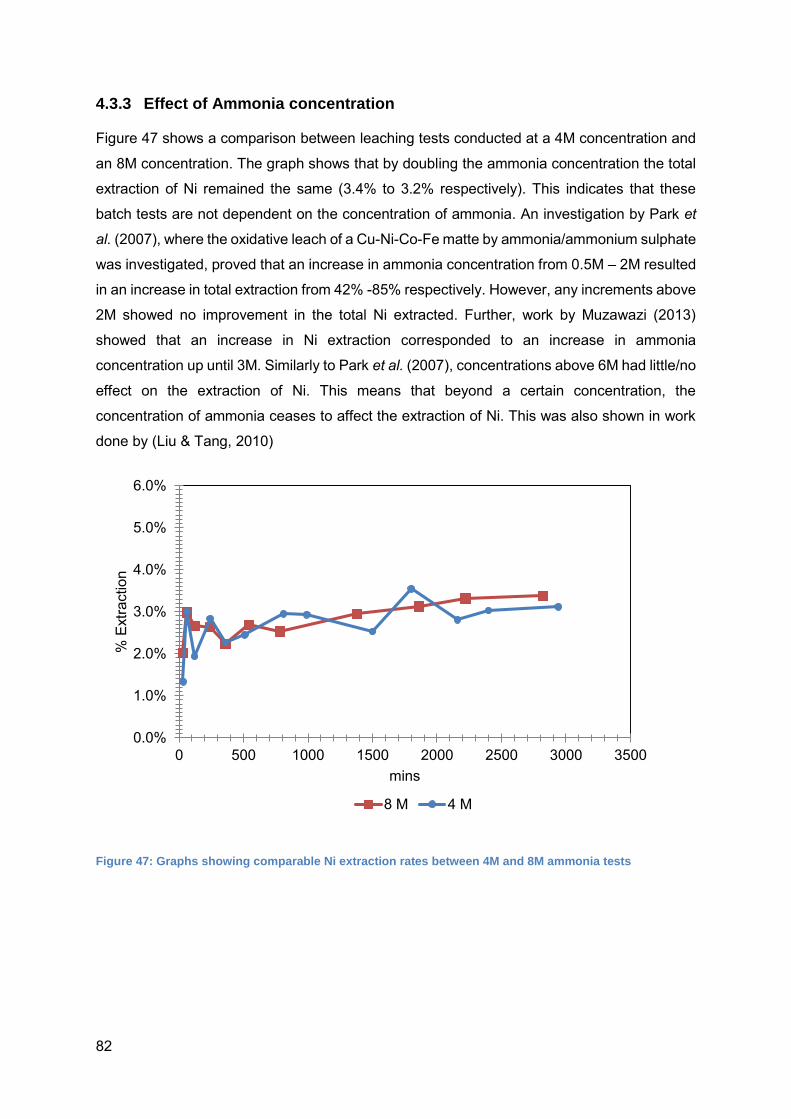
82
4.3.3 Effect of Ammonia concentration
Figure 47 shows a comparison between leaching tests conducted at a 4M concentration and
an 8M concentration. The graph shows that by doubling the ammonia concentration the total
extraction of Ni remained the same (3.4% to 3.2% respectively). This indicates that these
batch tests are not dependent on the concentration of ammonia. An investigation by Park et
al. (2007), where the oxidative leach of a Cu-Ni-Co-Fe matte by ammonia/ammonium sulphate
was investigated, proved that an increase in ammonia concentration from 0.5M – 2M resulted
in an increase in total extraction from 42% -85% respectively. However, any increments above
2M showed no improvement in the total Ni extracted. Further, work by Muzawazi (2013)
showed that an increase in Ni extraction corresponded to an increase in ammonia
concentration up until 3M. Similarly to Park et al. (2007), concentrations above 6M had little/no
effect on the extraction of Ni. This means that beyond a certain concentration, the
concentration of ammonia ceases to affect the extraction of Ni. This was also shown in work
done by (Liu & Tang, 2010)
Figure 47: Graphs showing comparable Ni extraction rates between 4M and 8M ammonia tests
0.0%
1.0%
2.0%
3.0%
4.0%
5.0%
6.0%
0 500 1000 1500 2000 2500 3000 3500
% E
xtra
ctio
n
mins
8 M 4 M
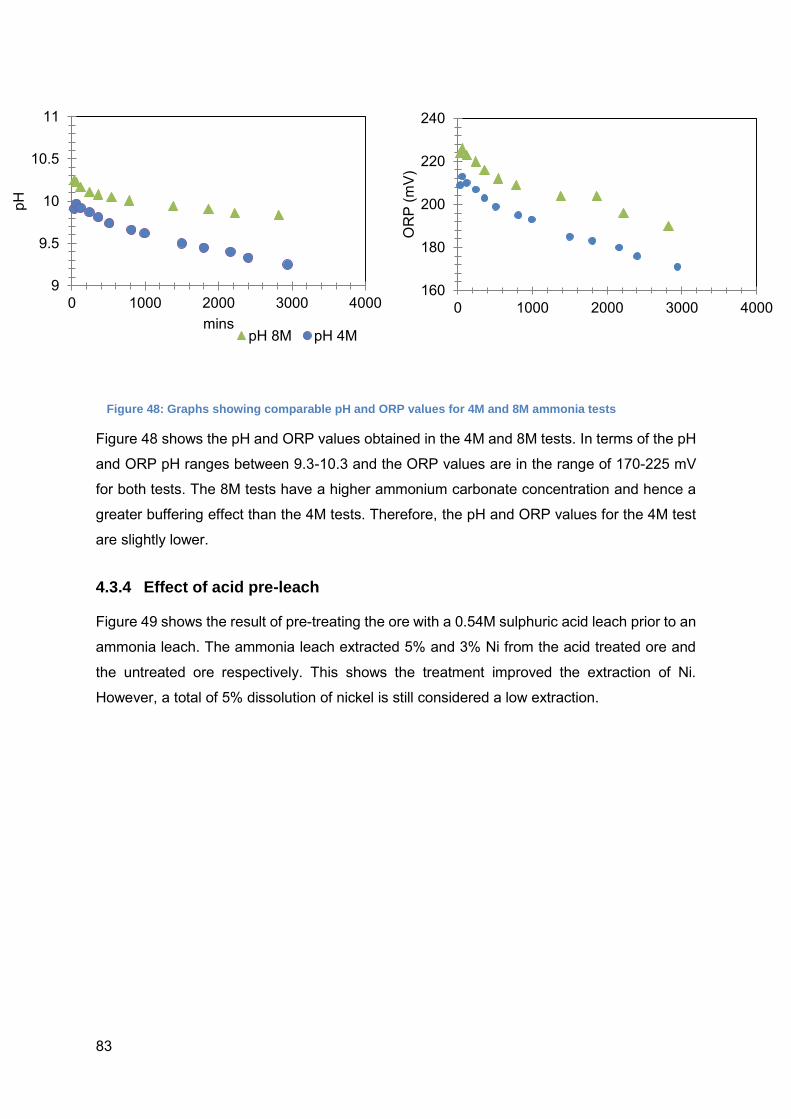
83
Figure 48 shows the pH and ORP values obtained in the 4M and 8M tests. In terms of the pH
and ORP pH ranges between 9.3-10.3 and the ORP values are in the range of 170-225 mV
for both tests. The 8M tests have a higher ammonium carbonate concentration and hence a
greater buffering effect than the 4M tests. Therefore, the pH and ORP values for the 4M test
are slightly lower.
4.3.4 Effect of acid pre-leach
Figure 49 shows the result of pre-treating the ore with a 0.54M sulphuric acid leach prior to an
ammonia leach. The ammonia leach extracted 5% and 3% Ni from the acid treated ore and
the untreated ore respectively. This shows the treatment improved the extraction of Ni.
However, a total of 5% dissolution of nickel is still considered a low extraction.
9
9.5
10
10.5
11
0 1000 2000 3000 4000
pH
minspH 8M pH 4M
160
180
200
220
240
0 1000 2000 3000 4000
OR
P (m
V)Figure 48: Graphs showing comparable pH and ORP values for 4M and 8M ammonia tests
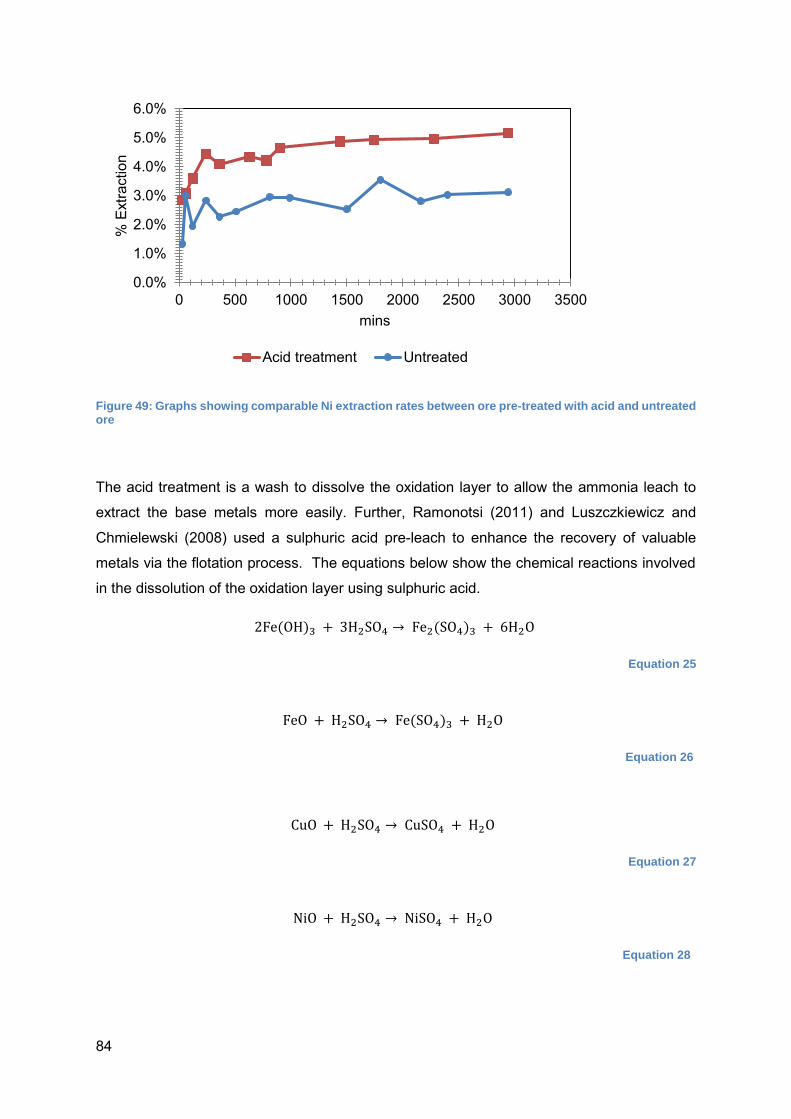
84
Figure 49: Graphs showing comparable Ni extraction rates between ore pre-treated with acid and untreated ore
The acid treatment is a wash to dissolve the oxidation layer to allow the ammonia leach to
extract the base metals more easily. Further, Ramonotsi (2011) and Luszczkiewicz and
Chmielewski (2008) used a sulphuric acid pre-leach to enhance the recovery of valuable
metals via the flotation process. The equations below show the chemical reactions involved
in the dissolution of the oxidation layer using sulphuric acid.
2Fe(OH)3 + 3H2SO4 → Fe2(SO4)3 + 6H2O
Equation 25
FeO + H2SO4 → Fe(SO4)3 + H2O
Equation 26
CuO + H2SO4 → CuSO4 + H2O
Equation 27
NiO + H2SO4 → NiSO4 + H2O
Equation 28
0.0%
1.0%
2.0%
3.0%
4.0%
5.0%
6.0%
0 500 1000 1500 2000 2500 3000 3500
% E
xtra
ctio
n
mins
Acid treatment Untreated
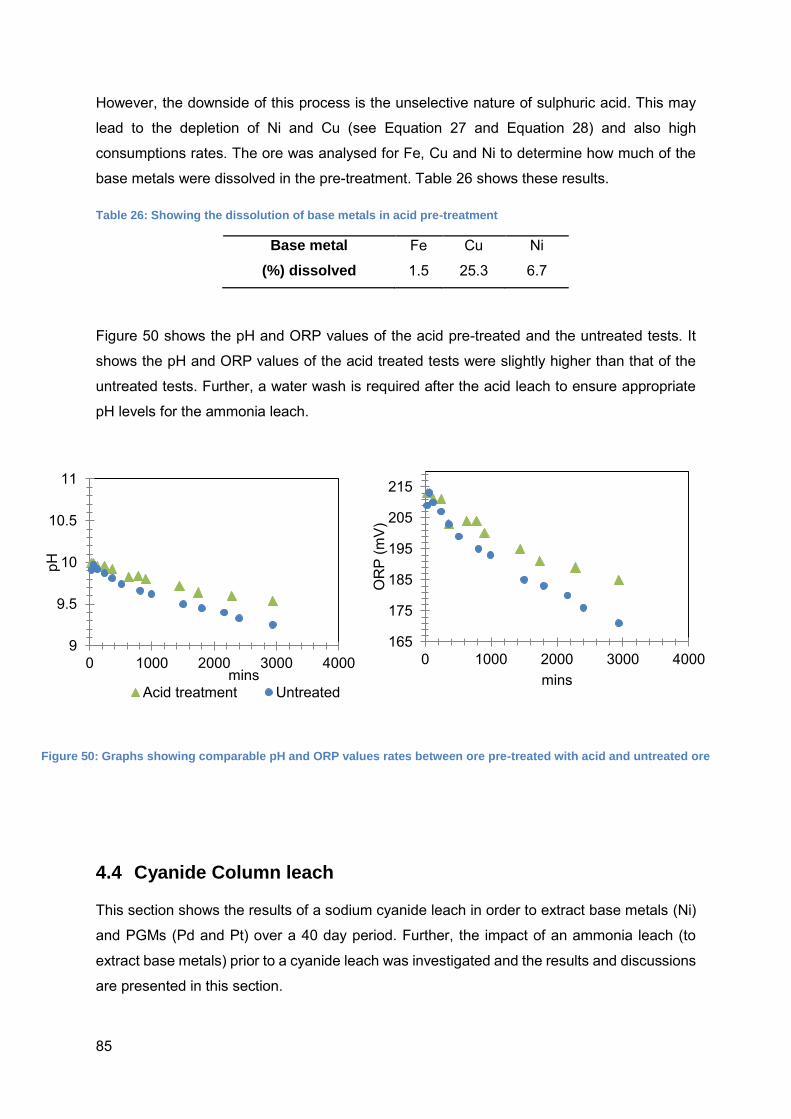
85
However, the downside of this process is the unselective nature of sulphuric acid. This may
lead to the depletion of Ni and Cu (see Equation 27 and Equation 28) and also high
consumptions rates. The ore was analysed for Fe, Cu and Ni to determine how much of the
base metals were dissolved in the pre-treatment. Table 26 shows these results.
Table 26: Showing the dissolution of base metals in acid pre-treatment
Base metal Fe Cu Ni
(%) dissolved 1.5 25.3 6.7
Figure 50 shows the pH and ORP values of the acid pre-treated and the untreated tests. It
shows the pH and ORP values of the acid treated tests were slightly higher than that of the
untreated tests. Further, a water wash is required after the acid leach to ensure appropriate
pH levels for the ammonia leach.
4.4 Cyanide Column leach
This section shows the results of a sodium cyanide leach in order to extract base metals (Ni)
and PGMs (Pd and Pt) over a 40 day period. Further, the impact of an ammonia leach (to
extract base metals) prior to a cyanide leach was investigated and the results and discussions
are presented in this section.
165
175
185
195
205
215
0 1000 2000 3000 4000
OR
P (m
V)
mins
9
9.5
10
10.5
11
0 1000 2000 3000 4000
pH
minsAcid treatment Untreated
Figure 50: Graphs showing comparable pH and ORP values rates between ore pre-treated with acid and untreated ore
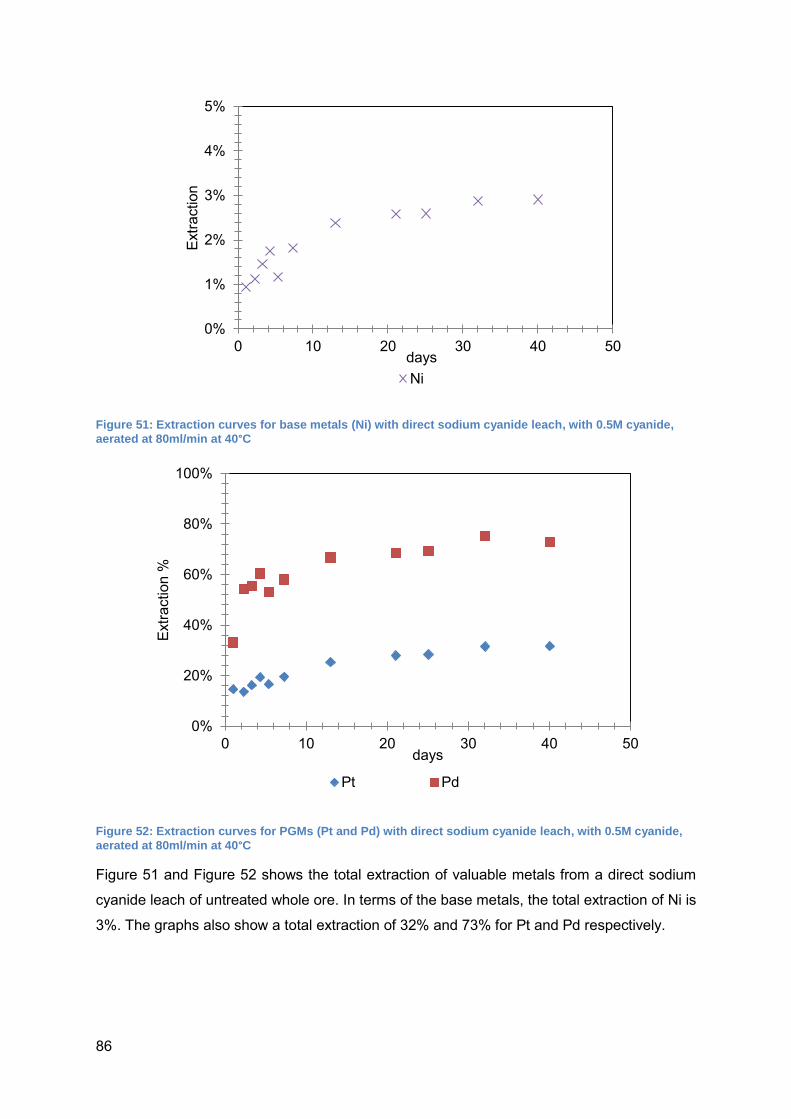
86
Figure 51: Extraction curves for base metals (Ni) with direct sodium cyanide leach, with 0.5M cyanide,
aerated at 80ml/min at 40°C
Figure 52: Extraction curves for PGMs (Pt and Pd) with direct sodium cyanide leach, with 0.5M cyanide,
aerated at 80ml/min at 40°C
Figure 51 and Figure 52 shows the total extraction of valuable metals from a direct sodium
cyanide leach of untreated whole ore. In terms of the base metals, the total extraction of Ni is
3%. The graphs also show a total extraction of 32% and 73% for Pt and Pd respectively.
0%
1%
2%
3%
4%
5%
0 10 20 30 40 50
Extra
ctio
n
daysNi
0%
20%
40%
60%
80%
100%
0 10 20 30 40 50
Extra
ctio
n %
days
Pt Pd
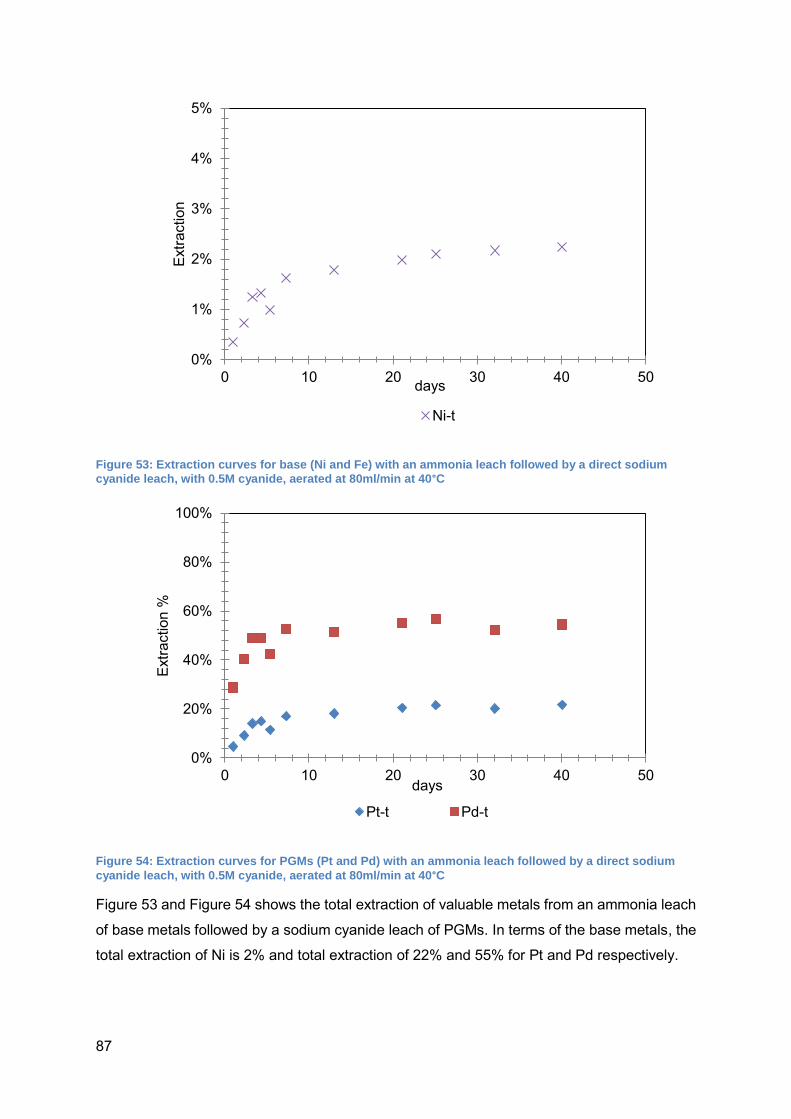
87
Figure 53: Extraction curves for base (Ni and Fe) with an ammonia leach followed by a direct sodium
cyanide leach, with 0.5M cyanide, aerated at 80ml/min at 40°C
Figure 54: Extraction curves for PGMs (Pt and Pd) with an ammonia leach followed by a direct sodium
cyanide leach, with 0.5M cyanide, aerated at 80ml/min at 40°C
Figure 53 and Figure 54 shows the total extraction of valuable metals from an ammonia leach
of base metals followed by a sodium cyanide leach of PGMs. In terms of the base metals, the
total extraction of Ni is 2% and total extraction of 22% and 55% for Pt and Pd respectively.
0%
1%
2%
3%
4%
5%
0 10 20 30 40 50
Extra
ctio
n
days
Ni-t
0%
20%
40%
60%
80%
100%
0 10 20 30 40 50
Extra
ctio
n %
days
Pt-t Pd-t

88
A comparison between the column 1 and column 2 (untreated and ammonia treated) shows a
higher extraction was achieved in the untreated column for Pt, Pd and Ni. Therefore the
ammonia treatment decreases the total extraction of both the base metals and PGMs. A water
wash could be introduced to ensure that any ammonia residues do not interfere with the
cyanide leach.
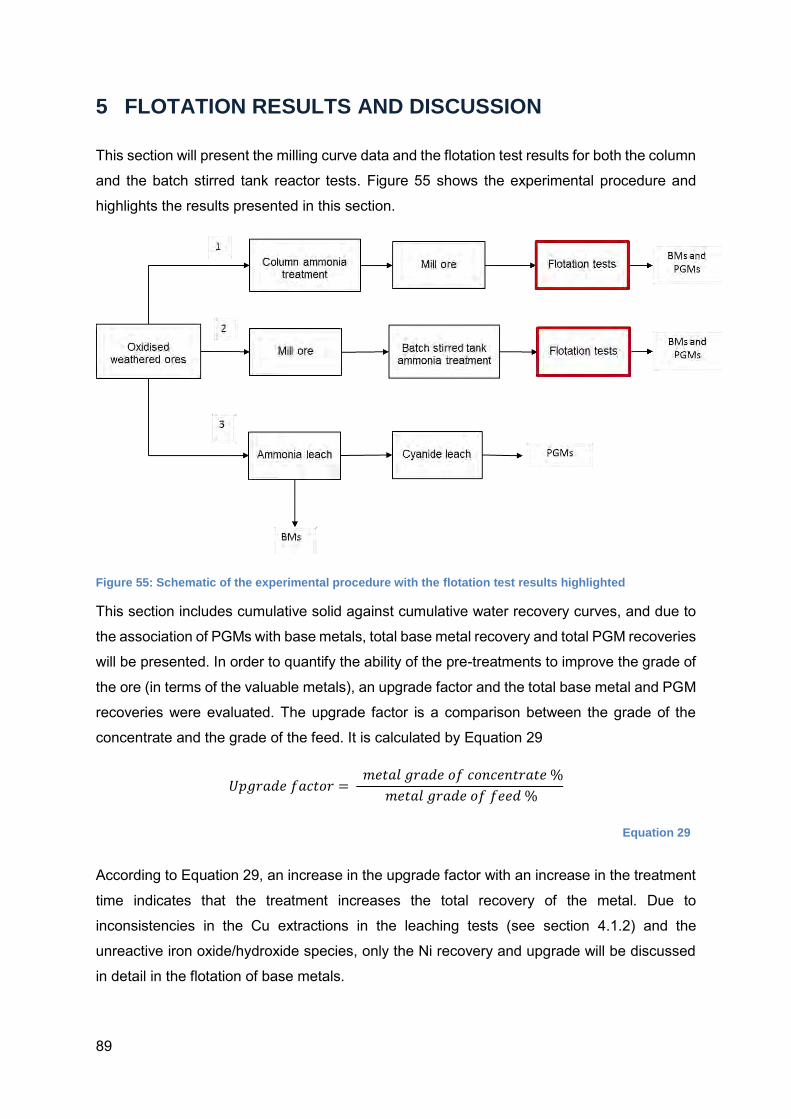
89
5 FLOTATION RESULTS AND DISCUSSION
This section will present the milling curve data and the flotation test results for both the column
and the batch stirred tank reactor tests. Figure 55 shows the experimental procedure and
highlights the results presented in this section.
Figure 55: Schematic of the experimental procedure with the flotation test results highlighted
This section includes cumulative solid against cumulative water recovery curves, and due to
the association of PGMs with base metals, total base metal recovery and total PGM recoveries
will be presented. In order to quantify the ability of the pre-treatments to improve the grade of
the ore (in terms of the valuable metals), an upgrade factor and the total base metal and PGM
recoveries were evaluated. The upgrade factor is a comparison between the grade of the
concentrate and the grade of the feed. It is calculated by Equation 29
𝑈𝑝𝑔𝑟𝑎𝑑𝑒 𝑓𝑎𝑐𝑡𝑜𝑟 = 𝑚𝑒𝑡𝑎𝑙 𝑔𝑟𝑎𝑑𝑒 𝑜𝑓 𝑐𝑜𝑛𝑐𝑒𝑛𝑡𝑟𝑎𝑡𝑒 %
𝑚𝑒𝑡𝑎𝑙 𝑔𝑟𝑎𝑑𝑒 𝑜𝑓 𝑓𝑒𝑒𝑑 %
Equation 29
According to Equation 29, an increase in the upgrade factor with an increase in the treatment
time indicates that the treatment increases the total recovery of the metal. Due to
inconsistencies in the Cu extractions in the leaching tests (see section 4.1.2) and the
unreactive iron oxide/hydroxide species, only the Ni recovery and upgrade will be discussed
in detail in the flotation of base metals.
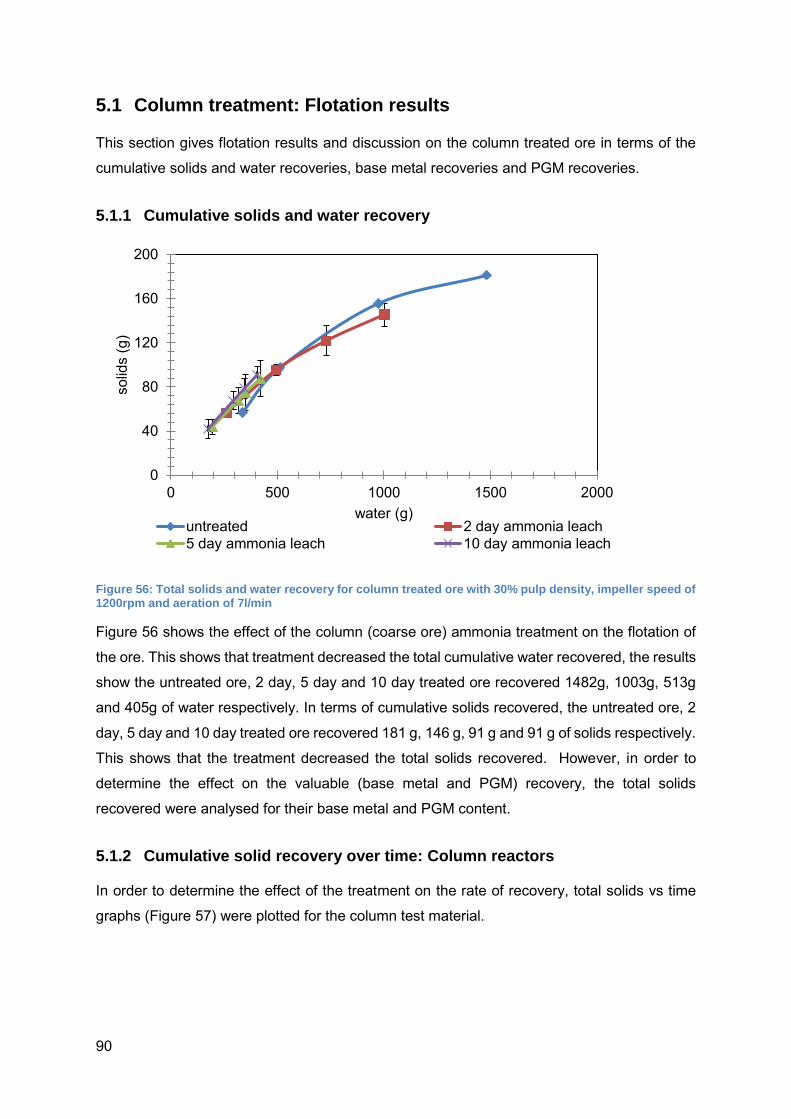
90
5.1 Column treatment: Flotation results
This section gives flotation results and discussion on the column treated ore in terms of the
cumulative solids and water recoveries, base metal recoveries and PGM recoveries.
5.1.1 Cumulative solids and water recovery
Figure 56: Total solids and water recovery for column treated ore with 30% pulp density, impeller speed of 1200rpm and aeration of 7l/min
Figure 56 shows the effect of the column (coarse ore) ammonia treatment on the flotation of
the ore. This shows that treatment decreased the total cumulative water recovered, the results
show the untreated ore, 2 day, 5 day and 10 day treated ore recovered 1482g, 1003g, 513g
and 405g of water respectively. In terms of cumulative solids recovered, the untreated ore, 2
day, 5 day and 10 day treated ore recovered 181 g, 146 g, 91 g and 91 g of solids respectively.
This shows that the treatment decreased the total solids recovered. However, in order to
determine the effect on the valuable (base metal and PGM) recovery, the total solids
recovered were analysed for their base metal and PGM content.
5.1.2 Cumulative solid recovery over time: Column reactors
In order to determine the effect of the treatment on the rate of recovery, total solids vs time
graphs (Figure 57) were plotted for the column test material.
0
40
80
120
160
200
0 500 1000 1500 2000
solid
s (g
)
water (g)untreated 2 day ammonia leach5 day ammonia leach 10 day ammonia leach
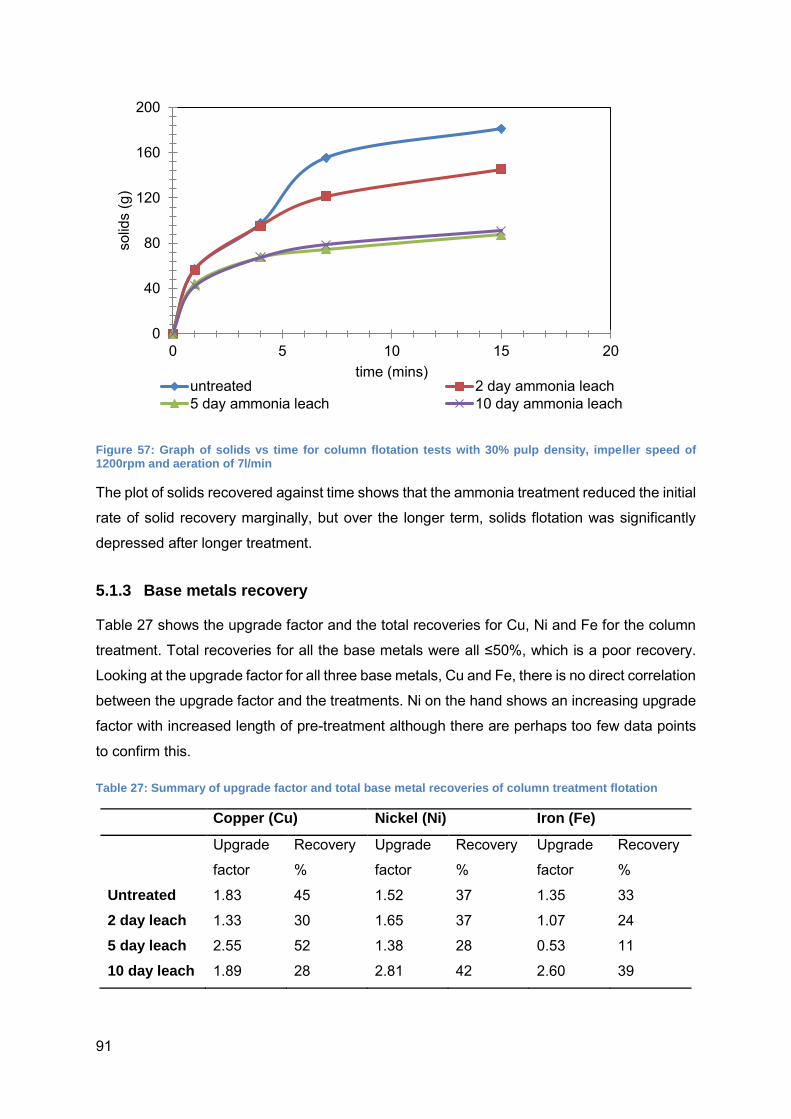
91
Figure 57: Graph of solids vs time for column flotation tests with 30% pulp density, impeller speed of 1200rpm and aeration of 7l/min
The plot of solids recovered against time shows that the ammonia treatment reduced the initial
rate of solid recovery marginally, but over the longer term, solids flotation was significantly
depressed after longer treatment.
5.1.3 Base metals recovery
Table 27 shows the upgrade factor and the total recoveries for Cu, Ni and Fe for the column
treatment. Total recoveries for all the base metals were all ≤50%, which is a poor recovery.
Looking at the upgrade factor for all three base metals, Cu and Fe, there is no direct correlation
between the upgrade factor and the treatments. Ni on the hand shows an increasing upgrade
factor with increased length of pre-treatment although there are perhaps too few data points
to confirm this.
Table 27: Summary of upgrade factor and total base metal recoveries of column treatment flotation
Copper (Cu) Nickel (Ni) Iron (Fe)
Upgrade
factor
Recovery
%
Upgrade
factor
Recovery
%
Upgrade
factor
Recovery
%
Untreated 1.83 45 1.52 37 1.35 33
2 day leach 1.33 30 1.65 37 1.07 24
5 day leach 2.55 52 1.38 28 0.53 11
10 day leach 1.89 28 2.81 42 2.60 39
0
40
80
120
160
200
0 5 10 15 20
solid
s (g
)
time (mins)untreated 2 day ammonia leach5 day ammonia leach 10 day ammonia leach
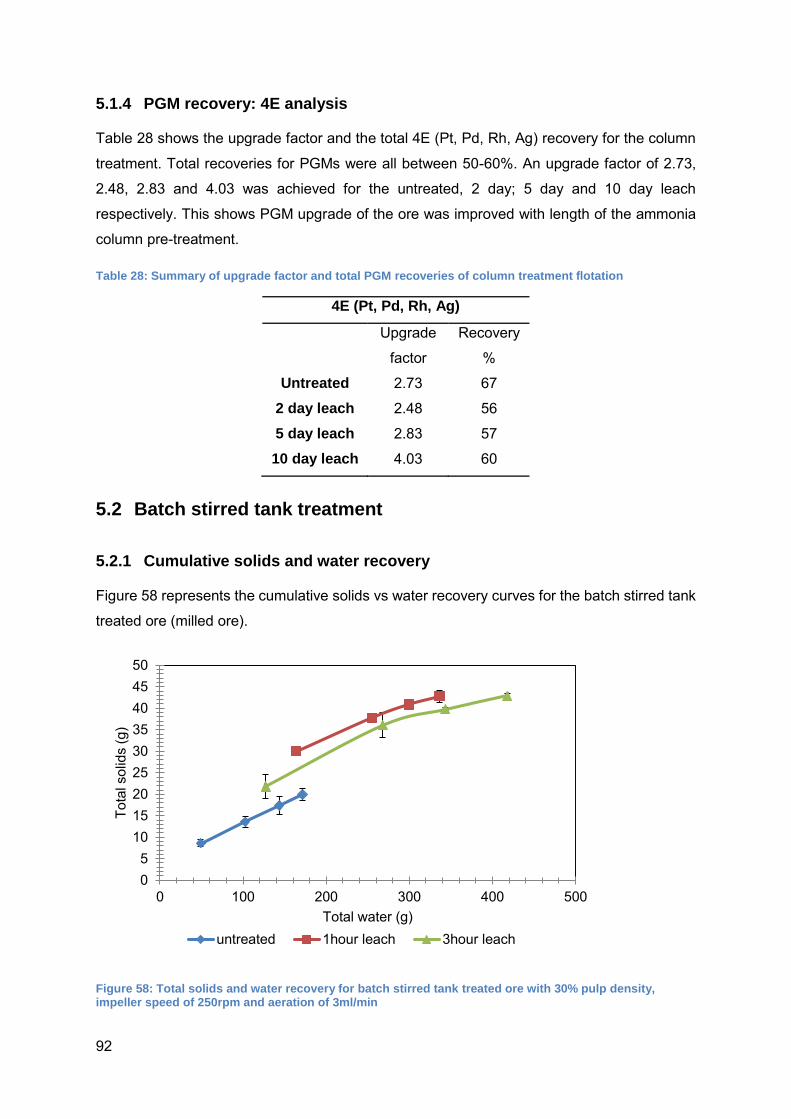
92
5.1.4 PGM recovery: 4E analysis
Table 28 shows the upgrade factor and the total 4E (Pt, Pd, Rh, Ag) recovery for the column
treatment. Total recoveries for PGMs were all between 50-60%. An upgrade factor of 2.73,
2.48, 2.83 and 4.03 was achieved for the untreated, 2 day; 5 day and 10 day leach
respectively. This shows PGM upgrade of the ore was improved with length of the ammonia
column pre-treatment.
Table 28: Summary of upgrade factor and total PGM recoveries of column treatment flotation
4E (Pt, Pd, Rh, Ag)
Upgrade
factor
Recovery
%
Untreated 2.73 67
2 day leach 2.48 56
5 day leach 2.83 57
10 day leach 4.03 60
5.2 Batch stirred tank treatment
5.2.1 Cumulative solids and water recovery
Figure 58 represents the cumulative solids vs water recovery curves for the batch stirred tank
treated ore (milled ore).
Figure 58: Total solids and water recovery for batch stirred tank treated ore with 30% pulp density, impeller speed of 250rpm and aeration of 3ml/min
05
101520253035404550
0 100 200 300 400 500
Tota
l sol
ids
(g)
Total water (g)untreated 1hour leach 3hour leach
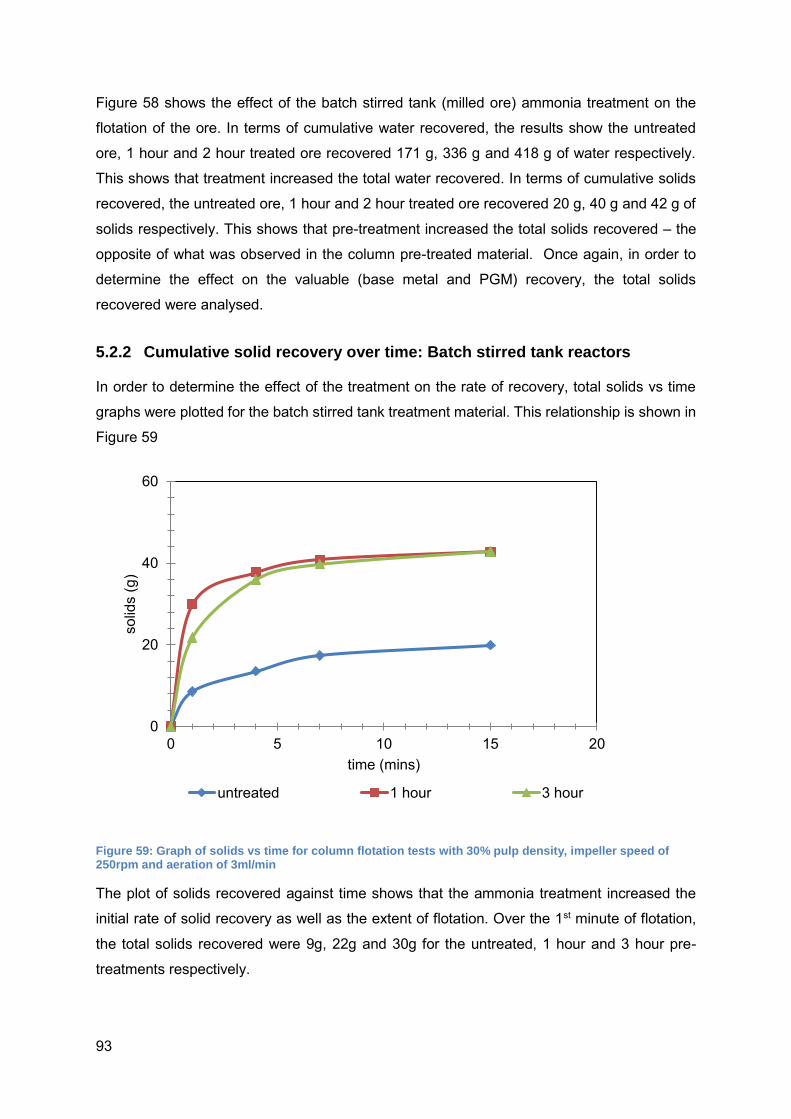
93
Figure 58 shows the effect of the batch stirred tank (milled ore) ammonia treatment on the
flotation of the ore. In terms of cumulative water recovered, the results show the untreated
ore, 1 hour and 2 hour treated ore recovered 171 g, 336 g and 418 g of water respectively.
This shows that treatment increased the total water recovered. In terms of cumulative solids
recovered, the untreated ore, 1 hour and 2 hour treated ore recovered 20 g, 40 g and 42 g of
solids respectively. This shows that pre-treatment increased the total solids recovered – the
opposite of what was observed in the column pre-treated material. Once again, in order to
determine the effect on the valuable (base metal and PGM) recovery, the total solids
recovered were analysed.
5.2.2 Cumulative solid recovery over time: Batch stirred tank reactors
In order to determine the effect of the treatment on the rate of recovery, total solids vs time
graphs were plotted for the batch stirred tank treatment material. This relationship is shown in
Figure 59
Figure 59: Graph of solids vs time for column flotation tests with 30% pulp density, impeller speed of 250rpm and aeration of 3ml/min
The plot of solids recovered against time shows that the ammonia treatment increased the
initial rate of solid recovery as well as the extent of flotation. Over the 1st minute of flotation,
the total solids recovered were 9g, 22g and 30g for the untreated, 1 hour and 3 hour pre-
treatments respectively.
0
20
40
60
0 5 10 15 20
solid
s (g
)
time (mins)
untreated 1 hour 3 hour
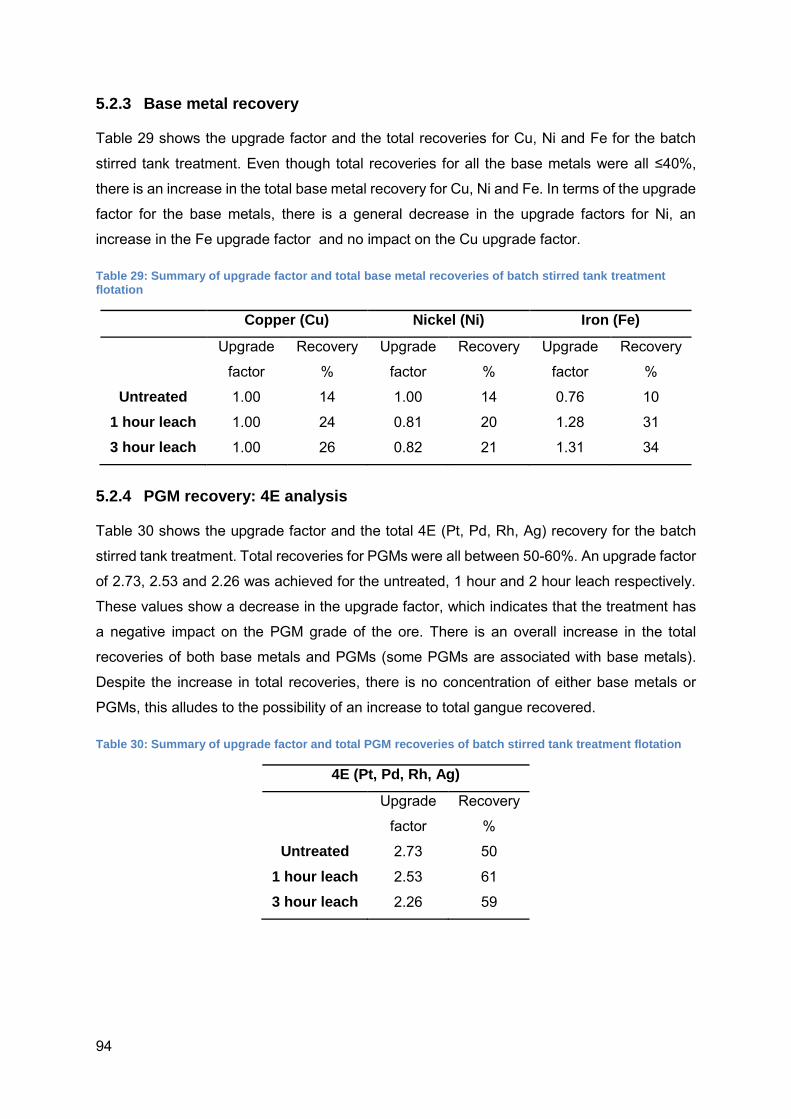
94
5.2.3 Base metal recovery
Table 29 shows the upgrade factor and the total recoveries for Cu, Ni and Fe for the batch
stirred tank treatment. Even though total recoveries for all the base metals were all ≤40%,
there is an increase in the total base metal recovery for Cu, Ni and Fe. In terms of the upgrade
factor for the base metals, there is a general decrease in the upgrade factors for Ni, an
increase in the Fe upgrade factor and no impact on the Cu upgrade factor.
Table 29: Summary of upgrade factor and total base metal recoveries of batch stirred tank treatment flotation
Copper (Cu) Nickel (Ni) Iron (Fe)
Upgrade
factor
Recovery
%
Upgrade
factor
Recovery
%
Upgrade
factor
Recovery
%
Untreated 1.00 14 1.00 14 0.76 10
1 hour leach 1.00 24 0.81 20 1.28 31
3 hour leach 1.00 26 0.82 21 1.31 34
5.2.4 PGM recovery: 4E analysis
Table 30 shows the upgrade factor and the total 4E (Pt, Pd, Rh, Ag) recovery for the batch
stirred tank treatment. Total recoveries for PGMs were all between 50-60%. An upgrade factor
of 2.73, 2.53 and 2.26 was achieved for the untreated, 1 hour and 2 hour leach respectively.
These values show a decrease in the upgrade factor, which indicates that the treatment has
a negative impact on the PGM grade of the ore. There is an overall increase in the total
recoveries of both base metals and PGMs (some PGMs are associated with base metals).
Despite the increase in total recoveries, there is no concentration of either base metals or
PGMs, this alludes to the possibility of an increase to total gangue recovered.
Table 30: Summary of upgrade factor and total PGM recoveries of batch stirred tank treatment flotation
4E (Pt, Pd, Rh, Ag)
Upgrade
factor
Recovery
%
Untreated 2.73 50
1 hour leach 2.53 61
3 hour leach 2.26 59
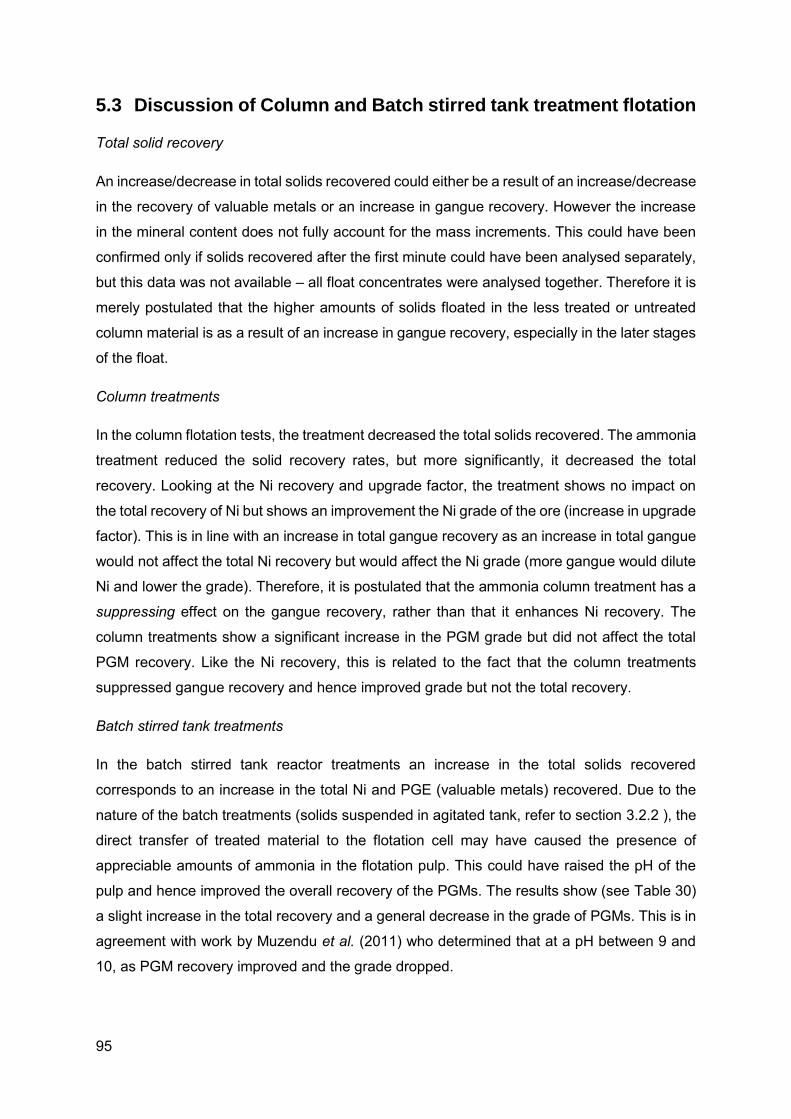
95
5.3 Discussion of Column and Batch stirred tank treatment flotation
Total solid recovery
An increase/decrease in total solids recovered could either be a result of an increase/decrease
in the recovery of valuable metals or an increase in gangue recovery. However the increase
in the mineral content does not fully account for the mass increments. This could have been
confirmed only if solids recovered after the first minute could have been analysed separately,
but this data was not available – all float concentrates were analysed together. Therefore it is
merely postulated that the higher amounts of solids floated in the less treated or untreated
column material is as a result of an increase in gangue recovery, especially in the later stages
of the float.
Column treatments
In the column flotation tests, the treatment decreased the total solids recovered. The ammonia
treatment reduced the solid recovery rates, but more significantly, it decreased the total
recovery. Looking at the Ni recovery and upgrade factor, the treatment shows no impact on
the total recovery of Ni but shows an improvement the Ni grade of the ore (increase in upgrade
factor). This is in line with an increase in total gangue recovery as an increase in total gangue
would not affect the total Ni recovery but would affect the Ni grade (more gangue would dilute
Ni and lower the grade). Therefore, it is postulated that the ammonia column treatment has a
suppressing effect on the gangue recovery, rather than that it enhances Ni recovery. The
column treatments show a significant increase in the PGM grade but did not affect the total
PGM recovery. Like the Ni recovery, this is related to the fact that the column treatments
suppressed gangue recovery and hence improved grade but not the total recovery.
Batch stirred tank treatments
In the batch stirred tank reactor treatments an increase in the total solids recovered
corresponds to an increase in the total Ni and PGE (valuable metals) recovered. Due to the
nature of the batch treatments (solids suspended in agitated tank, refer to section 3.2.2 ), the
direct transfer of treated material to the flotation cell may have caused the presence of
appreciable amounts of ammonia in the flotation pulp. This could have raised the pH of the
pulp and hence improved the overall recovery of the PGMs. The results show (see Table 30)
a slight increase in the total recovery and a general decrease in the grade of PGMs. This is in
agreement with work by Muzendu et al. (2011) who determined that at a pH between 9 and
10, as PGM recovery improved and the grade dropped.
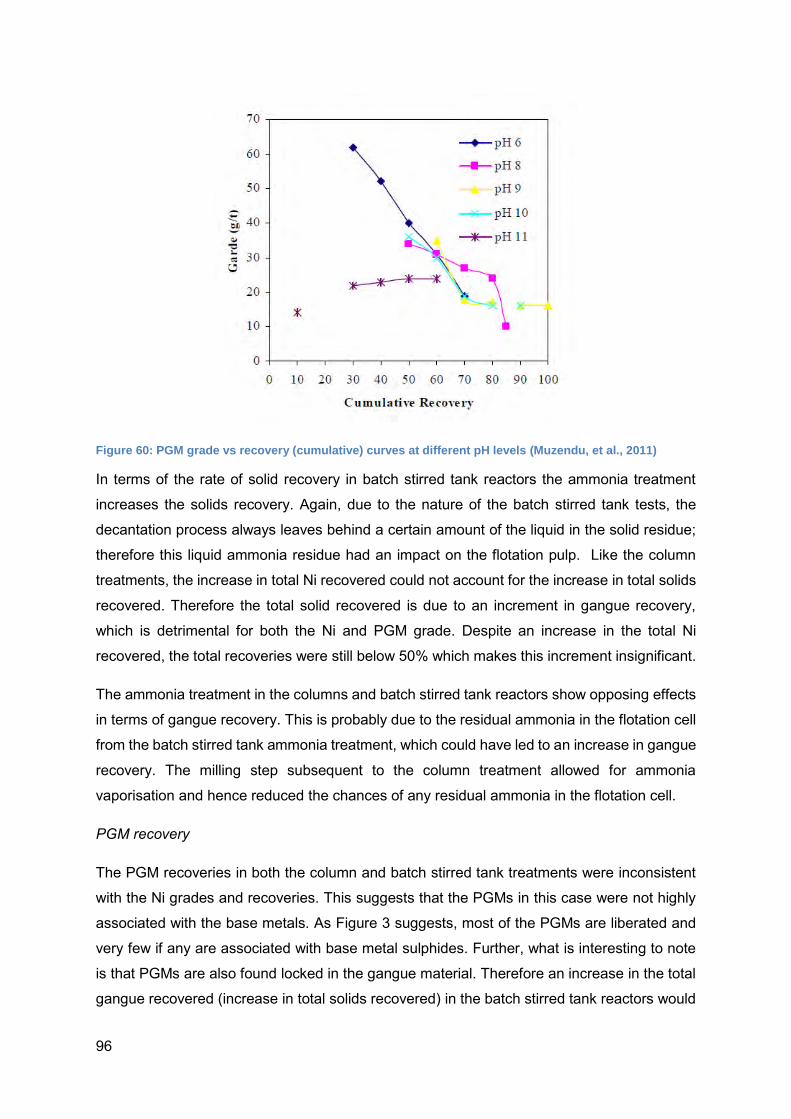
96
Figure 60: PGM grade vs recovery (cumulative) curves at different pH levels (Muzendu, et al., 2011)
In terms of the rate of solid recovery in batch stirred tank reactors the ammonia treatment
increases the solids recovery. Again, due to the nature of the batch stirred tank tests, the
decantation process always leaves behind a certain amount of the liquid in the solid residue;
therefore this liquid ammonia residue had an impact on the flotation pulp. Like the column
treatments, the increase in total Ni recovered could not account for the increase in total solids
recovered. Therefore the total solid recovered is due to an increment in gangue recovery,
which is detrimental for both the Ni and PGM grade. Despite an increase in the total Ni
recovered, the total recoveries were still below 50% which makes this increment insignificant.
The ammonia treatment in the columns and batch stirred tank reactors show opposing effects
in terms of gangue recovery. This is probably due to the residual ammonia in the flotation cell
from the batch stirred tank ammonia treatment, which could have led to an increase in gangue
recovery. The milling step subsequent to the column treatment allowed for ammonia
vaporisation and hence reduced the chances of any residual ammonia in the flotation cell.
PGM recovery
The PGM recoveries in both the column and batch stirred tank treatments were inconsistent
with the Ni grades and recoveries. This suggests that the PGMs in this case were not highly
associated with the base metals. As Figure 3 suggests, most of the PGMs are liberated and
very few if any are associated with base metal sulphides. Further, what is interesting to note
is that PGMs are also found locked in the gangue material. Therefore an increase in the total
gangue recovered (increase in total solids recovered) in the batch stirred tank reactors would
97
have led to the increase in the PGMs recovered as shown in the results above. For both the
tests (column and batch stirred tank reactors), the untreated yielded a different PGM recovery
(67% and 50% respectively), this was probably due to a difference in the size of the cell used,
even though this should not have had an impact on the recoveries and grades.
Naturally floated gangue
According to work done by Becker et al. (2009), the concentration of PGMs and base metals
is diluted by Naturally Floated Gangue (NFG) in the flotation of Merensky ore. The four main
silicate minerals that contribute to the dilution of valuable metals are orthopyroxene,
clinopyroxene, plagioclase and talc. Of these four, talc is known to be hydrophobic and
naturally floatable (Becker et al., 2009; Shortridge, 2002). The high content of these silicate
minerals in this ore, orthopyroxene (24.6%), clinopyroxene (10.3%), plagioclase (4.4%) and
talc (18%) in this ore (see Table 6), would explain why an increase in total base metal and
PGMs recovered did not correspond to an upgrade of the ore, specifically for the column
treatment tests. Even though the recovery of NFGs is minimised by the use of depressants,
this is sometimes achieved at the expense of valuable minerals (Wiese, Harris & Bradshaw,
2007).
Examination of the iron (Fe) species could also explain the low valuable metal recoveries. In
terms of base metal recoveries work done by Peng et al. (2002), on the flotation of base metals
from chalcopyrite, indicated that the hydrophilic iron oxidation species on the surface of
minerals play a role in depressing the mineral and hence led to poor flotation. Work by Yelloji
and Natarajan (1988) also emphasized the negative impact an iron hydroxide or oxide layer
had on the floatability of chalcopyrite. Similarly, in this case, the high iron oxides/hydroxides
concentration (see Table 6) has resulted in the poor flotation. Further even though both the
column and the batch stirred tank treatments showed some leaching of Cu and Ni, there was
no significant leaching of Fe. Therefore, on the assumption that the oxidation layer contained
iron oxides/hydroxides, the treatments aimed at dissolving the oxidation layer proved
unsuccessful, especially in the dissolution of iron.
98
6 CONCLUSIONS AND RECOMMENDATIONS
6.1 Conclusions
The main aim of this thesis was to investigate the use of an ammonia treatment in order to
improve the conventional processing of oxidized/weathered ores. These improvements
included a chemical pre-treatment for the flotation of the ores and an extraction of valuable
metals from the ore. Hence the following key questions were addressed:
Can ammonia be used as a lixiviant to treat PGM oxidized/weathered ores?
As a pre-treatment for the flotation process, the ammonia treatment was used to dissolve the
oxidation layer (base metal oxides) formed on the oxidized/weathered ores, however, due to
the low extraction of base metals, this was unsuccessful.
As a lixiviant to extract valuable metals from the ore, low extractions were observed in both
columns and batch stirred tank reactors. Various factors such as pulp density, ammonia
concentration, initial copper concentration and an acid pre-treatment were investigated in
batch stirred tank reactors and the acid pre-treatment showed the most significant effect on
the extraction of nickel. However, the use of sodium cyanide solutions as a lixiviant showed
some promising Pt and Pd extractions.
Fe oxides/hydroxides which form 10% wt. of the ore inhibit effective leaching in both the pre-
treatment and extraction tests.
Can an ammonia solution be used for treatment of PGM oxidized/weathered ores
make the PGM ores more amenable to flotation?
As shown by the flotation results, the treatment increased total solids recovery in the batch
stirred tank and decreased total solids recovery in the column tests. However, an increase in
total solids recovered did not correspond to the metals recovered in terms of masses. This
alludes to the fact that the treatments could have more of an impact on the gangue recovery
and not valuable metal flotation.
In the column tests, the ammonia treatment suppressed gangue recovery (decreased the total
solids recovered) and hence improved the efficiency of the flotation by improving the Ni and
PGM grade recovery. However, the Ni and PGM total recovery were independent of the
ammonia treatment.
99
In the batch stirred tank tests, the ammonia treatment showed a marginal improvement in total
Ni recoveries and a decrease in the Ni grade. The ammonia batch stirred tank treatment
showed a marginal decrease in the PGM grade and slight improvement in total PGM recovery.
Further, in both the batch stirred tank and the column reactors, the total base metal recoveries
are all below 50%. Therefore any improvement is still limited by the presence of iron
oxides/hydroxides which decrease the hydrophobicity and collection adsorption of the
minerals hence in poor recoveries.
What are the optimal reactor configurations (columns or batch stirred tank reactors)?
In terms of the impact on flotation, both treatments had relatively low base metal recoveries
(<50%) and hence they had no success in the dissolution of the oxidation layer. The column
flotation tests showed an upgrade in the Ni and PGM grades but inconsistent total Ni recovery.
On the other hand, batch stirred tank reactors showed a downgrade in the Ni grade and poor
total Ni recoveries. Therefore, based on the upgrading factors, only the column treatment has
the ability to concentrate the ore in terms of base metals and PGMs and is therefore the
preferred treatment.
6.2 Recommendations
In order to fully determine the effect of the treatment, a mineralogical analysis (MLA) would
have to be done on the treated ore. These results would be compared to the feed mineralogical
results shown in Table 6. A look into what impact the various ammonia treatments have on
the mineralogy of the ore would be useful.
Further, analyses on the individual concentrates (in terms of base metals and PGMs) would
give more detailed on the flotation trends and not merely the total recovery. This would help
understand the effect of the treatment. This would also lead to gangue recovery data that
would help investigate what happens to the gangue material during the flotation process after
the treatments.
In order to better determine the effect of the ammonia treatment on the oxidised PGM ores,
higher base metal and PGM concentrations would better show the impact of the ammonia pre-
treatment on oxidised PGM ores.
To further understand the impact of ammonia on the pulp alkalinity, further studies that involve
the monitoring of the pulp pH should be conducted.
100
7 BIBLIOGRAPHY
Adams, M., Liddell, K. & Holohan, T. 2011. Hydrometallurgy processing of platreef flotation
concentrate. Mineral Engineering, 1(24), pp. 545-550.
Africa, C. o. M. S., 2008. Platinum group metals in Africa. [Online]
Available at: http://www.bullion.org.za/content/?pid=86&pagename=Platinum
[Accessed 19 April 2013].
ALS Geochemistry, 2013. Schedule of sevices and fees, Johannesburg: ALS Geochemistry.
Alymore, M., 2001. Treatment of a refractory gold-copper sulfide concentrate by copper
ammoniacal thiosulfate leaching. Mineral engineering, 14(6), pp. 615-637.
Arbriter, N. & Milligan, D., 1976. Reduction of copper ammine solutions to metal with sulfur
dioxide. Extractive Metallurgy of Copper, 2, pp. 974-993.
Aspola, L., Matusewicz, K., Haavaniammi, S. & Hughes, S., 2012. Outotec smelting solutions
for the PGM industry, s.l.: s.n.
Atkins, P. & Paula, J., 2010. Atkins' Physical chemistry. 9th ed. United Kingdom: Oxford
university press.
Bartlett, R., 1992. Solution Mining: Leaching and fluid recovery of materials. 1st ed.
Amsterdam: Gordon and Breach science publishers S.A.
Bartlett, R., 1998. Solution Mining: Leaching and Fluid Recovery of Materials. 2nd ed. Perth:
Gordon and Breach Science Publishers.
Bau, M., Koschinsky, A. & Mohwinkel, D., n.d. Experiments on carboxylic acids and
siderphore-promoted disolutionof supergene, oxidised PGE ores from the Great Dyke.
Becker, M., Harris, P., Wiese, J. & Bradshaw, D., 2009. Mineralogical characterisation of
naturally floatable gangue in Merensky Reef ore flotation. International Journal of Mineral
Processing, 93(3-4), pp. 246-255.
Becker, M., Ramonotsi, M. & Petersen, J., 2011. Effect of alteration on the mineralogy and
flotation performance of PPM platinum ore. Trondheim, ICAM.
Becker, M., Wiese, J. & Ramonotsi, M., 2014. Investigation into the mineralogy and flotation
performance of oxidised PGM ore. Minerals Engineering, 65, pp. 24-32.
101
Beckstead, L. & Miller, J., 1977. Ammonia, oxidation leaching of chalcopyrite-reaction kinetics.
Metallurgical and materials transactions, 8(1), pp. 19-29.
Bell, S., Welch, G. & Bennett, P., 1995. Development of ammoniacal lixiviants for the in-situ
leaching of chalcopyrite. Hydrometallurgy, 39(1-3), pp. 11-23.
Bingol, D., Canbazoglu, M. & Aydogan, S., 2005. Dissolution kinetics of malachite in
ammonia/ammonium carbonate leaching. Hydrometallurgy, 76(1-2), pp. 55-62.
Black, W., 2000. The Platinum Group Metals Industry. 1st ed. Cambridge: Woodhead
Publishing Limited.
Boulton, A., 2002. Improving sulphide mineral flotation selectivity against iron sulphide
gangue. 1st ed. Adelaide: Ian Wark Research Institute.
Castro, S., Soto, H. & Goldfarb, J. L. J., 1974. Sulphidizing reactions in the flotation of oxidised
copper minerals, II. Role of the adsorption and oxidation of sodium sulphide in the flotation of
chrysocolla and malachite. Minerals Processing, 1(2),pp. 151-161.
Cawthorn, G., 2010. The platinum group element deposits of the Bushveld complex in South
africa. Platinum metals , 4(54), pp. 205-215.
Cawthorn, R., 1999. The platinum and palladium resources of the Bushveld complex. South
African Journal of Science, 95, pp. 481-489.
Cawthorn, R. G., 2010. Geological interpretations from teh PGE distribution in the Bushveld
Merensky adn UG2 chromitite reefs. Sun City, The Southern African Institute of Minings and
Metallurgy.
Cawthorn, R., Lee, C., Shouwstra, R. & Mellowship, P., 2002. Relationship between pge and
pgm in the bushveld complex. The Canadian Mineralogist, 40, pp. 311-328.
Chamberlain, P. & Pojar, M., 1984. Gold and Silver leaching practices in the Unites States,
Washington: Bureau of Mines Information Circular.
Chang, C. & Liu, J., 1998. Feasibility of copper leaching from an industrial sludge using
ammonia solutions. Journal of hazardous materials, 58(1-3), pp. 121-132.
Chen, J. & Huang, K., 2006. A new technique for extraction of platinum group metals.
Hydrometallurgy, 82(3-4), pp. 164-171.
City of Cape town, 2008. Integrated Development plan (IDP) 2007/8 - 2011/12, Cape Town:
City of Cape Town.
102
Clarke, P., Fornasiero, D., Ralston, J. & Smart, R. S. C., 1995. A study of the removal of
oxidation products from sulfide mineral surfaces. Minerals engineering, 8(11), pp. 1347-1357.
Cottrell, A., 1967. An introduction to metallurgy. 1st ed. London: Edward Arnold Publishers.
Cramer, L. A., 2008. What is your PGM concentrate worth? Third International Platinum
conference. Sun City, The Southern African Institute of Mining and Metallurgy.
Crozier, R., 1992. Flotation - Theory, reagents and ore testing. 1st ed. Chille: Pergmon Press.
Crundwell, F; Moats, M; Ramachandran, V; Robinson, T; Davenport, W. 1995. Extractive
metallurgy of Nickel, Cobalt and Platinum Group Metals. London: Elsevier.
Deng, T. & Chen, J., 1991. Treatment of oxidized copper ores with emphasis on refractory
ores. Mineral Processing and Extractive Metallurgy Review, 7(3-4), pp. 175-207.
Dixon, P. & Madigan, D., 1975. Hydrometallurgical recovery of copper nickel or zinc from
sulphide ores by oxidation in ammoniacal chloride or nitrate solutions. United States, Patent
No. US 3927170 A.
Dunne, C., 2011. The Ugly duckling (UG 2). s.l., MMA President's technical Seminar.
Dutrizac, J. E., 1981. Ammonia Percoaltion Leaching of Copper Ores. Canadian metallurgy
quarterly, 20(3), pp. 307-315.
Environmental Radiation Survey and Site Execution, 2009. Environmental Radiation Survey
and Site Execution. [Online]
Available at: http://www.eurssem.eu/
[Accessed 23 January 2015].
Eurus Mineral Consultants, 2012. Laboratory flotation rate test procedure for PGM, base metal
sulphide and oxide ores, Johannesburg: Eurus mineral consultants.
Fraiser Institute, 2012. Miningfacts.org. [Online]
Available at: http://www.miningfacts.org/environment/what-is-the-role-of-cyanide-in-mining/
[Accessed 19 May 2014].
Francis, P., 1993. Pierre Gy's sampling theory and sampling practice. 2nd ed. Florida: CRC
press.
Fuerstenau, D. W., 1999. The Froth Flotation Century. Denver, Society for Mining, Metallurgy,
and Exploration, pp. 3-21.
103
Fuerstenau, M., Jameson, G. & Yoon, R., 2007. Froth flotation: A centuary of Innovation. 1st
ed. Colorado: Society for Mining, Metallurgy and Exploration.
Gaudin, A., 1939. Principles of Mineral dressing. 1st ed. New York: McGraw-Hill Book
Company.
Ghorbani, Y., Becker, M., Mainza, A., Franzidis, J., Petersen, J., 2011. Large particle effects
in chemical/biochemical heap leach processes – A review. Minerals Engineering, 24(11), pp.
1172-1184.
Ghosh, M., Das, R. & Biswas, A., 2003. Oxidative ammonia leaching of sphalerite: Part II:
Cu(II)-catalyzed kinetics. International Journal of Mineral Processing, 70(1-4), pp. 221-234.
Gos, S. & Rubo, A., 2001. The relevance of alternative lixiviants with regard to work safety
and environmental safety, Hanau: CyPlus.
Grosse, A., Dicinoski, W., Shaw, M. & Haddad, P., 2003. Leaching and recovery of
ammoniacal thiosulfate leach liquors ( a review). Hydrometallurgy, 69(1-3), pp. 1-21.
Gupta, C. K., 2003. Chemical Metallurgy: Principles and practice. Mumbai: Wiley-VCH Verlag
GmbH & Co.
Gupta, C. & Mukherjee, T., 1990. Hydrometallurgy in Extraction processes. Florida: CRC
press.
Habashi, F., 1993. A textbook of hydrometallurgy. Quebec: Metallurge Extractive Quebec,
Enr.
Habashi, F., 1999. Hydrometallurgy. 2nd ed. Quebec: s.n.
Habashi, F., 2005. A short history of hydrometallurgy. Hydrometallurgy, 79(1-2), pp. 15-22.
Halpern, J., 1953. Kinetics of the dissolution of copper in aqueous ammonia. Journal of
Electrochemical society, 100(10), pp. 421-428.
Hawley, C., 2008. Alaska Mining hall of fame. [Online]
Available at: http://alaskamininghalloffame.org/inductees/stannard.php
[Accessed 01 December 2014].
Holmes, R., 2004. Correct sampling and measurement - the foundation of accurate
metallurgical accounting. Chemometrics and intelligent laboratory systems, 74(1), pp. 71-83.
104
Illinois State Water Survey, n.d. Nitrogen Cycles project. [Online]
Available at:
http://www.isws.illinois.edu/nitro/terms.asp?lpg=glossary&lsec=hinfl&term=NSpecies
[Accessed 06 February 2015].
Jones, R. T., 1999. Platinum Smelting in South Africa, Randburg: s.n.
Kappes, D., 1998. Heap leach or mill? Economic considerations in a period of stable gold
prices, Reno: Kappes, Cassidy and Associates.
Kawatra, S., 2001. Flotation Fundamentals, Michigan: University of Michigan.
Kawatra, S. K., 1989. Froth Flotation - Fundamental principles, Houghton: Michegan
technological University.
King, R. P., 1982. Flotation of fine particles. In: R. P. King, ed. Principles of flotation.
Johannesburg: South African Institute of Mining and Metallurgy, pp. 215-225.
Kinnaird, J., 2005. The Bushveld Large Igneous Province, Johannesburg: School of
Geosciences.
Knell, M. & Kroll, H., 1954. Polyhydroxyethyl polyamine compound. United States of America,
Patent No. 2906762.
Koski, R., Munk, L., Foster, A., Shanks, W., Stillings, L., 2008. Sulfide oxidation and
distribution of metals near abandoned copper mines in coastal environments, Prince William
Sound, Alaska, USA. Applied Geochemistry, 23(2), pp. 227-254.
Kuhn, H., Forsterling, H. & Waldeck, D., 2009. Principles of Physical Chemistry. 2nd ed. New
Jersey: John Wiley & sons.
Lee, A., n.d. Uriahsweety. [Online]
Available at: http://uriahsweety.wordpress.com/the-process-of-froth-flotation/
[Accessed 27 November 2014].
Lee, J., Nagaraj, D. & E, C., 1998. Practical aspects of oxide copper recover with alkyl
hydroxamates. Minerals Engineering, 11(10), pp. 929-939.
Lee, K., Archibald, D. & McLean, J. R. M., 2009. Flotation of mixed copper oxide and sulphide
minerals with xanthate and hydroxamate collectors. Minerals Engineering, 22(1), pp. 395-401.
Legrand, D., Bancroft, G. & Nesbitt, H., 2005. Oxidation/alteration of pentlandite and
pyroohotite surfaces at oH 9.3. American Mineralogist, 90, pp. 1042-1054.
105
Liddell, K. & Adams, M., 2012. Kell hydrometallurgical process for extraction of platinum group
metals and base metals from flotation concentrates. The Southern African institutre of minning
and metallurgy, 112, pp. 31-35.
Liu, W. & Tang, M., 2010. Dissolution kinetics of low grade complex copper ore in ammonia-
ammonium chloride solution. Transaction of nonferrous metals society of china, 20(5), pp.
910-917.
Luszczkiewicz, A. & Chmielewski, T., 2008. Acid treatment of copper sulfide middlings and
rougher concentrates in the flotation circuit of carbonate ores. International Journal for Mineral
Processing, 88(1-2), pp. 45-52.
McInnes, C., Sparrow, J. & Wookcock, J., 1994. Extraction of Platinum, palladium and gold by
cyanidation of Coronation Hill ore. Hydrometallurgy, 35(2), pp. 141-159.
Meng, X. & Han, K., 1996. The principles and applications of ammonia leaching of Metals-A
review. Mineral processing and Extractive Metallurgy Review, 16(2), pp. 23-61.
Milbourne, J., Tomlinson, M. & Gormely, L., 2003. Use of hydrometallurgy in direct processing
of base metal/PGM concentrates. Vancouver, The Minerals, Metals and Materials society, pp.
617-630.
Musonda, K. & Mwase, J., 2009. Cyanide Protocol for laboratory use, Cape Town: Univeristy
of Cape Town.
Muzawazi, C., 2013. Base metal heap and tank leaching of a platreef flotation concentrate
using ammonical solutions, Cape Town: s.n.
Muzawazi, C., 2013. Base metal heap and tank leaching of a platreef flotation concentrate
using ammonical solutions, Cape Town: Univeristy of Cape Town.
Muzawazi, C., 2013. Base metal heap and tank leaching of a platreef flotation concentrate
using ammonical solutions, Cape Town: University of Cape Town.
Muzendu, E., Afolabi, A., Abdulkareem, A. & Ntuli, F., 2011. Effect of pH on the recovery and
Grade of Base metal sulphides by flotaiton. San francisco, World Congress on Engineering
and Computer science.
Mwase, J., 2009. Hydrometallurgy extraction of platinum group metals from low grade
concentrate, Cape town: s.n.
106
Mwase, J., 2009. Hydrometallurgy extraction of platinum group metals from low grade
concentrate,, Cape town: University of Cape town.
Mwase, J., Petersen, J. & Eksteen, J., 2011. A conceptual flowsheet for heap leaching of
platinum group metal (PGMs) from a low-grade ore concentrate. Hydrometallurgy, 111, pp.
129-135.
Mwase, J., Petersen, J. & Eksteen, J., 2012. Assessing a two-stage heap leaching process
for Platreef flotation concentrate. Hydrometallurgy, 129-130 pp. 74-81.
Newell, A. & Bradshaw, D., 2007. The development of a sulfidisation technique to restore the
flotation of oxidised pentlandite. Minerals Engineering, 20(10), pp. 1039-1046.
Newell, A., Bradshaw, D. & Harris, P., 2006. The effect of heavy oxidation upon flotation and
potential remedies for Merensky type sulfides. Mineral Engineering, 19(6-8), pp. 675-686.
Obethur, T., Melcher, F., Buchholz, P. & Locmelis, M., 2013. The oxidised ores of the main
sulphide Zone, Great dyke, Zimbabwe: Turning resources into minable reserves. Journal of
Southern African Institute of Mining and Metallurgy, 113(3), pp. 191-201.
Obethur, T., Melcher, F., Buchholz, P. & Locmelis, M., 2013. The oxidised ores of the main
sulphide Zone, Great dyke, Zimbabwe: Turning resources into minable reserves- mineralogy
is key. Journal of Southern African Institute of Mining and Metallurgy, 113(3), pp. 191-201.
Osseo-Asare, K., J, L., Kim, S. & Pickering, W., 1983. Cobalt extraction in ammoniacal
solution: Electrochemical effect of metallic iron. Metallurgical and Materials Transactions,
14(4), pp. 571-578.
Park, K., Mohapatra, D., Reddy, B. & Nam, C., 2006. A study on the oxidative
ammonia/ammonium sulphate leaching of a complex matte. Hydrometallurgy, 86(3-4), pp.
164-171.
Peng, Y., Grano, S., Fornasiero, D. & Ralston, J., 2002. Control of grinding conditions in the
flotation of chalcopyrite and separation from pyrite. International Journal of Mineral
Processing, 69(1-4), pp. 87-100.
Polinares, 2012. Fact Sheet: Platinum Group Metals, s.l.: Polinares Consortium.
Prestidge, C. & Ralston, J., 1995. Contact angle studies of Galena particles. Journal of Colloid
and interface Science, 184(2), pp. 512-518.
Pryor, E. J., 1965. Mineral Processing. 3rd ed. London: Elsevier Publsihing Co Ltd.
107
Ramonotsi, M., 2011. characterisation of the effect of alteration on the PPM Platinum ore and
evaluation of selected strategies to improve metallurgical performance, Cape Town: Univeristy
of Cape Town.
Ramonotsi, M., 2011. Characterisation of the effect of altertion on the PPM platinum ore and
evaluation of selected strategies to improve metallurgical performance, Cape town: University
of Cape Town.
Ramonotsi, M., 2011. Effect of alteration on the mineralogy and flotation performance of ppm
platinum ore, Cape Town: University of Cape town.
Rao, S., 2006. Aqueous processing of minerals and metals; Past , present and future.
Everyman's Science, XLI(2), pp. 120-126.
Rhamadhani, M., Chen, J., Hidayat, T., Jak, E., Hayes, P., 2009. Advances in research on
nickel production through the Caron process. s.l., European Metallurgical conferecen.
Ross, V., 1997. Particle-bubble attachment in flotation froths. Minerals engineering, 10(7), pp.
695-706.
Royal Bafokeng Platinum, 2014. Mining and processing of PGMs. [Online]
Available at: http://www.bafokengplatinum.co.za/b/process.php
[Accessed 08 January 2015].
Schouwstra, R., Kinloch, E. & Lee, C., 2000. A short geological review of the Bushveld
Complex. Platinum Metals Review, 44(1), pp. 33-39.
Shamaila, S. & O'Connor, C., 2008. The role of synthetic minerals in determining the relative
flotation behaviour of Platreef PGE tellurides and arsenides. Minerals Engineering, 21(12-14),
pp. 899-904.
Shortridge, P., 2002. The influence of polymeric charge and structure, molecular weight and
ionic conditions on depressant ability to reduce the natural floatability of talc, Cape Town:
University of Cape Town.
Smart, R., 1991. Surface layers in base metal sulphide flotation. Minerals Engineering, 4(7),
pp. 891-909.
Smart, R., Amarantidis, J., Skinner, W., Prestidge, C., LaVanier, L., Grano, S., 1996. Surface
analytical studies of oxidation and collector adsorption in sulfide mineral flotation. Scanning
Microscopy, 12(4), pp. 553-583.
108
Sohn, H. & Wadsworth, E., 1979. Rate of extractive metallurgy. 1st ed. New York: Plenum
Press.
Solomon, N., 2010. Effect of HPGR on platinum bearing ores and the flotation response as
compared to the conventional ball mill, Cape Town: University of Cape town.
South African government, 2014. Minerals -South African Government. [Online]
Available at: http://www.gov.za/about-sa/minerals
[Accessed 15 November 2014].
Stewart, M. & Kappes, D., 2012. SART for copper control in cyanide heap leaching. The
Southern African Institute of Minning and Metalurgy, 118, pp. 1037-1043.
Taggart, A., 1945. Handbook of Mineral Dressing; Ores and Industrial Minerals. In: Wiley
Engineering Handbook Series. s.l.:Wiley & Sons Inc, p. Section 19.
Takeno, N., 2005. Atlas of Eh-pH diagrams - Intercomparison of themodynamic databases,
Japan: National Institute of Advanced Industrial Science and Technology.
The Royal Society of Chemistry, 2010. Atomic absorption spectrometry, London: The Royal
society of Chemistry.
Tozowa, K., Umetutsu, Y. & K, S., 1976. Chemistry of ammonia leaching of copper
concentrates. The extractive metallurgy of copper, 20, pp. 13-20.
U.S. Environmental Protection Agency, 1994. Treatment of cyanide heap leaches and tailings,
Washington: U.S. Environmental Protection Agency.
University of Cape Town, 2008. Hydrometallurgy: Theory and Practice, Study guide, Cape
Town: University of Cape Town.
Valix, M. & Cheung, W., 2002. Effect of sulfur on the mineral phases of laterite ores at high
temperature reduction. Minerals Engineering, 15(7), pp. 523-530.
van Wyk, A., 2014. Flowsheet development adn comparison for the recover of precious metals
from cyanide leach solutions, Stellenbosch: Stellenbosch University.
Vermaak, F., 1995. The platinum group metals - a global perspective. Randburg: Minktek.
Vermaak, F., 1995. The platinum-group metals – a global perspective. Randburg: Mintek.
Vermaak, M. K., 2005. Pretoria: University of Pretoria.
109
Vignes, A., 2011. Extractive metallurgy 3: Processing operations and routes. 1st ed. United
States: Wiley-ISTE.
Voordouw & Buekes, 2000. South African Journal of Geology. GeoScienceWorld, Issue 112.
Welham, N., Johnston, G. & Sutecliffe, M., 2010. Method for ammoniacal leaching. United
States, Patent No. US 2010/0180728 A1.
Wiese, J., Harris, P. & Bradshaw, D., 2005. The influence of the reagent suite on the flotation
of ores from the Merensky reef. Minerals engineering, 18(2), pp. 189-198.
Wiese, J., Harris, P. & Bradshaw, D., 2007. The response of sulphide and gangue minerals in
selected Merensky ores to increased depressant dosage. Minerals Engineering, Volume 20,
pp. 986-995.
Wilhelm, N., Johnson, G. & Mathew, L., 2010. Method for ammonia leaching. Australia, Patent
No. US 2010/0180728A1.
Wills, B., 1997. Mineral Processing Technology. 6th ed. London: Butterworth Heinemann.
Wolf, R., 2005. What is ICP-MS? and more importantly, what can it do?, Virginia: USGS.
Yelloji, M. & Natarajan, K., 1988. Influence of Galvanic interaction between chalcopyrite and
some metallic materials on flotation. Minerals Engineering, 1(4), pp. 281-294.
Zhou, R. & Chander, S., 1993. Kinetics of sulfidization of malachite in hydrosulfide and
tetrasulfide solutions. International Journal of Mineral Processing, 37(3-4), pp. 257-272.
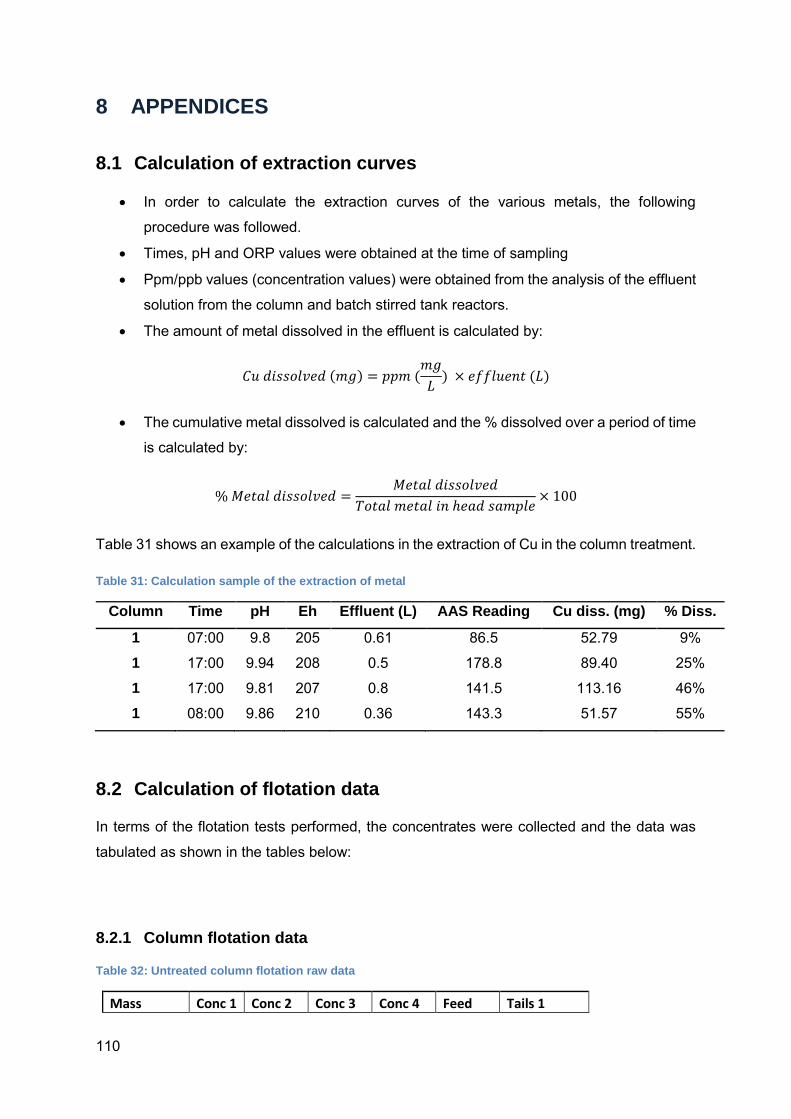
110
8 APPENDICES
8.1 Calculation of extraction curves
In order to calculate the extraction curves of the various metals, the following
procedure was followed.
Times, pH and ORP values were obtained at the time of sampling
Ppm/ppb values (concentration values) were obtained from the analysis of the effluent
solution from the column and batch stirred tank reactors.
The amount of metal dissolved in the effluent is calculated by:
𝐶𝑢 𝑑𝑖𝑠𝑠𝑜𝑙𝑣𝑒𝑑 (𝑚𝑔) = 𝑝𝑝𝑚 (𝑚𝑔
𝐿) × 𝑒𝑓𝑓𝑙𝑢𝑒𝑛𝑡 (𝐿)
The cumulative metal dissolved is calculated and the % dissolved over a period of time
is calculated by:
% 𝑀𝑒𝑡𝑎𝑙 𝑑𝑖𝑠𝑠𝑜𝑙𝑣𝑒𝑑 =𝑀𝑒𝑡𝑎𝑙 𝑑𝑖𝑠𝑠𝑜𝑙𝑣𝑒𝑑
𝑇𝑜𝑡𝑎𝑙 𝑚𝑒𝑡𝑎𝑙 𝑖𝑛 ℎ𝑒𝑎𝑑 𝑠𝑎𝑚𝑝𝑙𝑒× 100
Table 31 shows an example of the calculations in the extraction of Cu in the column treatment.
Table 31: Calculation sample of the extraction of metal
Column Time pH Eh Effluent (L) AAS Reading Cu diss. (mg) % Diss.
1 07:00 9.8 205 0.61 86.5 52.79 9%
1 17:00 9.94 208 0.5 178.8 89.40 25%
1 17:00 9.81 207 0.8 141.5 113.16 46%
1 08:00 9.86 210 0.36 143.3 51.57 55%
8.2 Calculation of flotation data
In terms of the flotation tests performed, the concentrates were collected and the data was
tabulated as shown in the tables below:
8.2.1 Column flotation data
Table 32: Untreated column flotation raw data
Mass Conc 1 Conc 2 Conc 3 Conc 4 Feed Tails 1
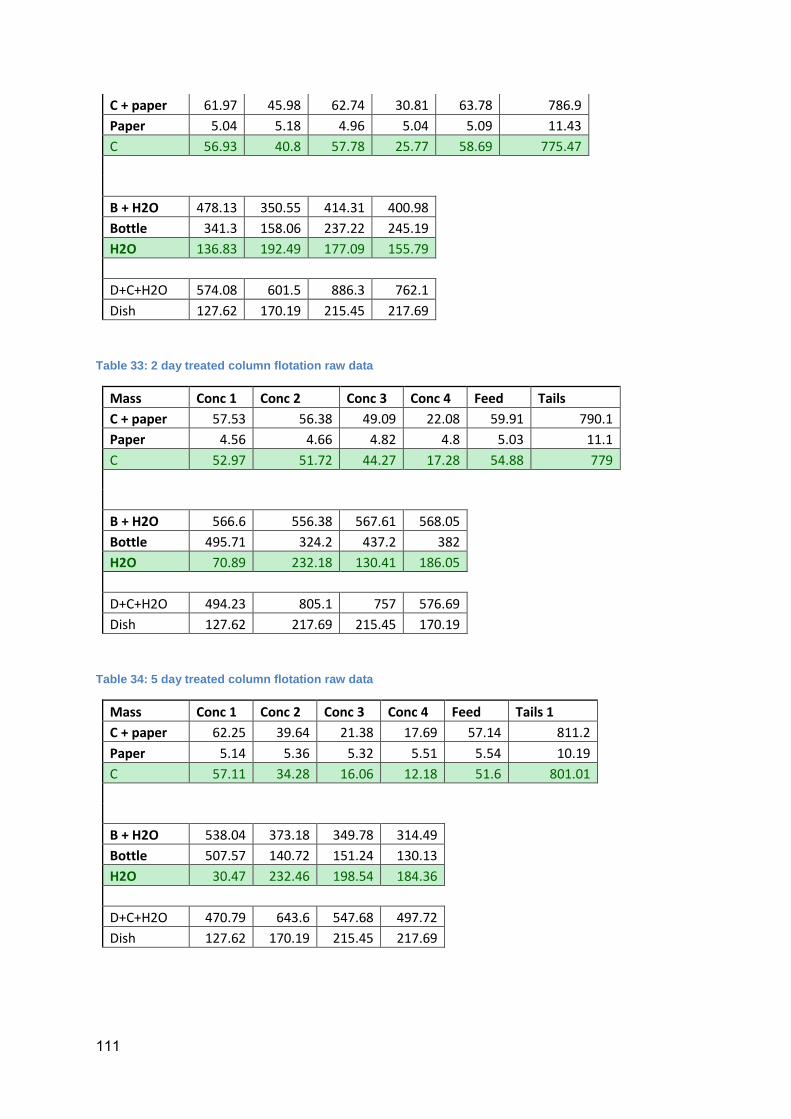
111
C + paper 61.97 45.98 62.74 30.81 63.78 786.9
Paper 5.04 5.18 4.96 5.04 5.09 11.43
C 56.93 40.8 57.78 25.77 58.69 775.47
B + H2O 478.13 350.55 414.31 400.98
Bottle 341.3 158.06 237.22 245.19
H2O 136.83 192.49 177.09 155.79
D+C+H2O 574.08 601.5 886.3 762.1
Dish 127.62 170.19 215.45 217.69
Table 33: 2 day treated column flotation raw data
Mass Conc 1 Conc 2 Conc 3 Conc 4 Feed Tails
C + paper 57.53 56.38 49.09 22.08 59.91 790.1
Paper 4.56 4.66 4.82 4.8 5.03 11.1
C 52.97 51.72 44.27 17.28 54.88 779
B + H2O 566.6 556.38 567.61 568.05
Bottle 495.71 324.2 437.2 382
H2O 70.89 232.18 130.41 186.05
D+C+H2O 494.23 805.1 757 576.69
Dish 127.62 217.69 215.45 170.19
Table 34: 5 day treated column flotation raw data
Mass Conc 1 Conc 2 Conc 3 Conc 4 Feed Tails 1
C + paper 62.25 39.64 21.38 17.69 57.14 811.2
Paper 5.14 5.36 5.32 5.51 5.54 10.19
C 57.11 34.28 16.06 12.18 51.6 801.01
B + H2O 538.04 373.18 349.78 314.49
Bottle 507.57 140.72 151.24 130.13
H2O 30.47 232.46 198.54 184.36
D+C+H2O 470.79 643.6 547.68 497.72
Dish 127.62 170.19 215.45 217.69
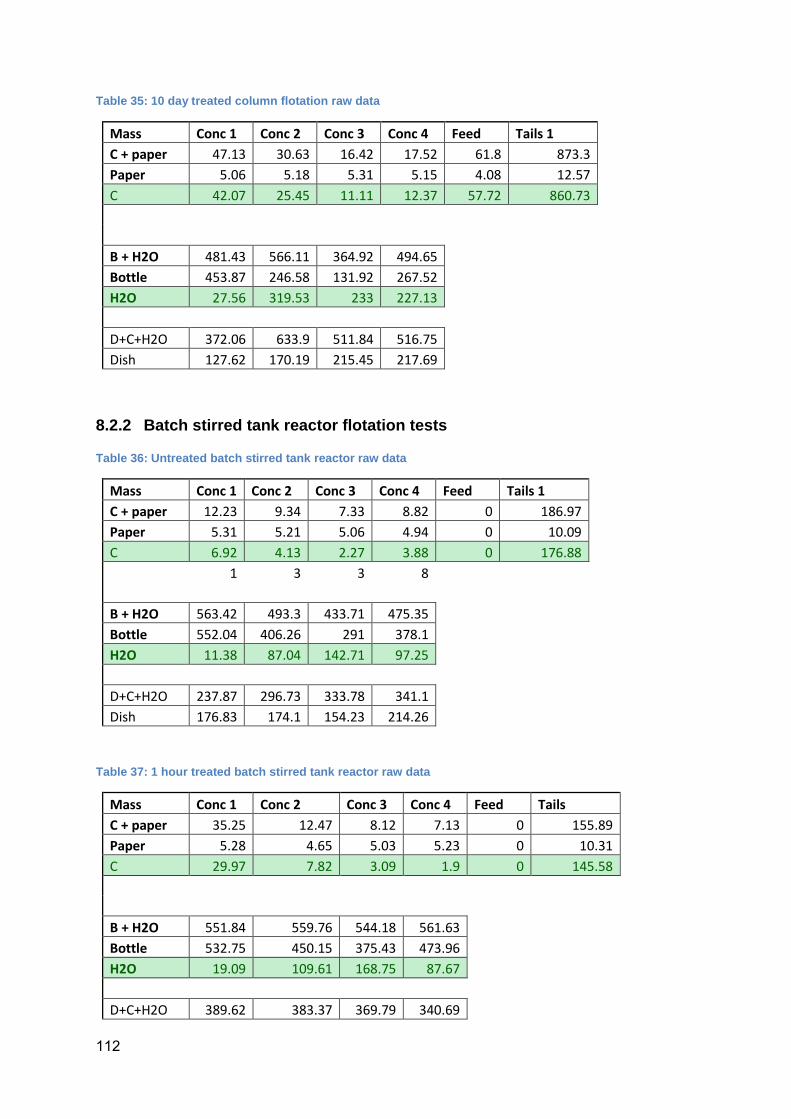
112
Table 35: 10 day treated column flotation raw data
Mass Conc 1 Conc 2 Conc 3 Conc 4 Feed Tails 1
C + paper 47.13 30.63 16.42 17.52 61.8 873.3
Paper 5.06 5.18 5.31 5.15 4.08 12.57
C 42.07 25.45 11.11 12.37 57.72 860.73
B + H2O 481.43 566.11 364.92 494.65
Bottle 453.87 246.58 131.92 267.52
H2O 27.56 319.53 233 227.13
D+C+H2O 372.06 633.9 511.84 516.75
Dish 127.62 170.19 215.45 217.69
8.2.2 Batch stirred tank reactor flotation tests
Table 36: Untreated batch stirred tank reactor raw data
Mass Conc 1 Conc 2 Conc 3 Conc 4 Feed Tails 1
C + paper 12.23 9.34 7.33 8.82 0 186.97
Paper 5.31 5.21 5.06 4.94 0 10.09
C 6.92 4.13 2.27 3.88 0 176.88
1 3 3 8
B + H2O 563.42 493.3 433.71 475.35
Bottle 552.04 406.26 291 378.1
H2O 11.38 87.04 142.71 97.25
D+C+H2O 237.87 296.73 333.78 341.1
Dish 176.83 174.1 154.23 214.26
Table 37: 1 hour treated batch stirred tank reactor raw data
Mass Conc 1 Conc 2 Conc 3 Conc 4 Feed Tails
C + paper 35.25 12.47 8.12 7.13 0 155.89
Paper 5.28 4.65 5.03 5.23 0 10.31
C 29.97 7.82 3.09 1.9 0 145.58
B + H2O 551.84 559.76 544.18 561.63
Bottle 532.75 450.15 375.43 473.96
H2O 19.09 109.61 168.75 87.67
D+C+H2O 389.62 383.37 369.79 340.69
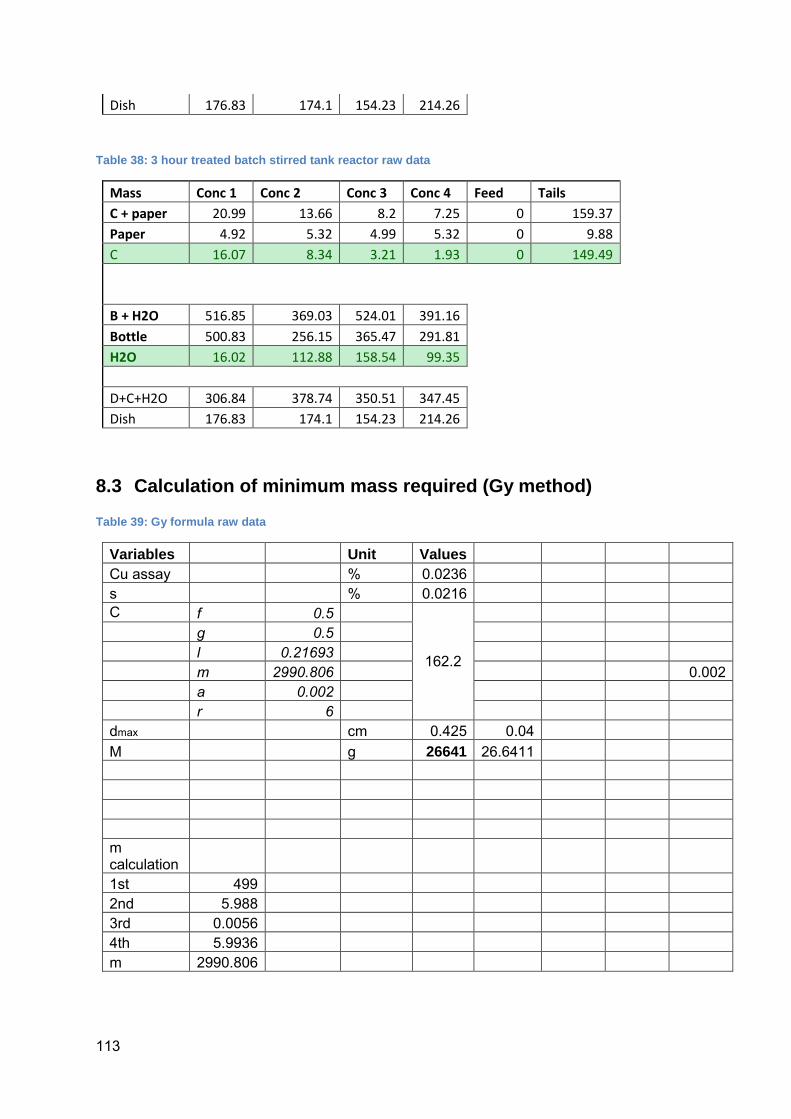
113
Dish 176.83 174.1 154.23 214.26
Table 38: 3 hour treated batch stirred tank reactor raw data
Mass Conc 1 Conc 2 Conc 3 Conc 4 Feed Tails
C + paper 20.99 13.66 8.2 7.25 0 159.37
Paper 4.92 5.32 4.99 5.32 0 9.88
C 16.07 8.34 3.21 1.93 0 149.49
B + H2O 516.85 369.03 524.01 391.16
Bottle 500.83 256.15 365.47 291.81
H2O 16.02 112.88 158.54 99.35
D+C+H2O 306.84 378.74 350.51 347.45
Dish 176.83 174.1 154.23 214.26
8.3 Calculation of minimum mass required (Gy method)
Table 39: Gy formula raw data
Variables Unit Values Cu assay % 0.0236 s % 0.0216 C f 0.5
162.2
g 0.5 l 0.21693 m 2990.806 0.002 a 0.002
r 6 dmax cm 0.425 0.04 M g 26641 26.6411 m calculation 1st 499 2nd 5.988 3rd 0.0056 4th 5.9936 m 2990.806
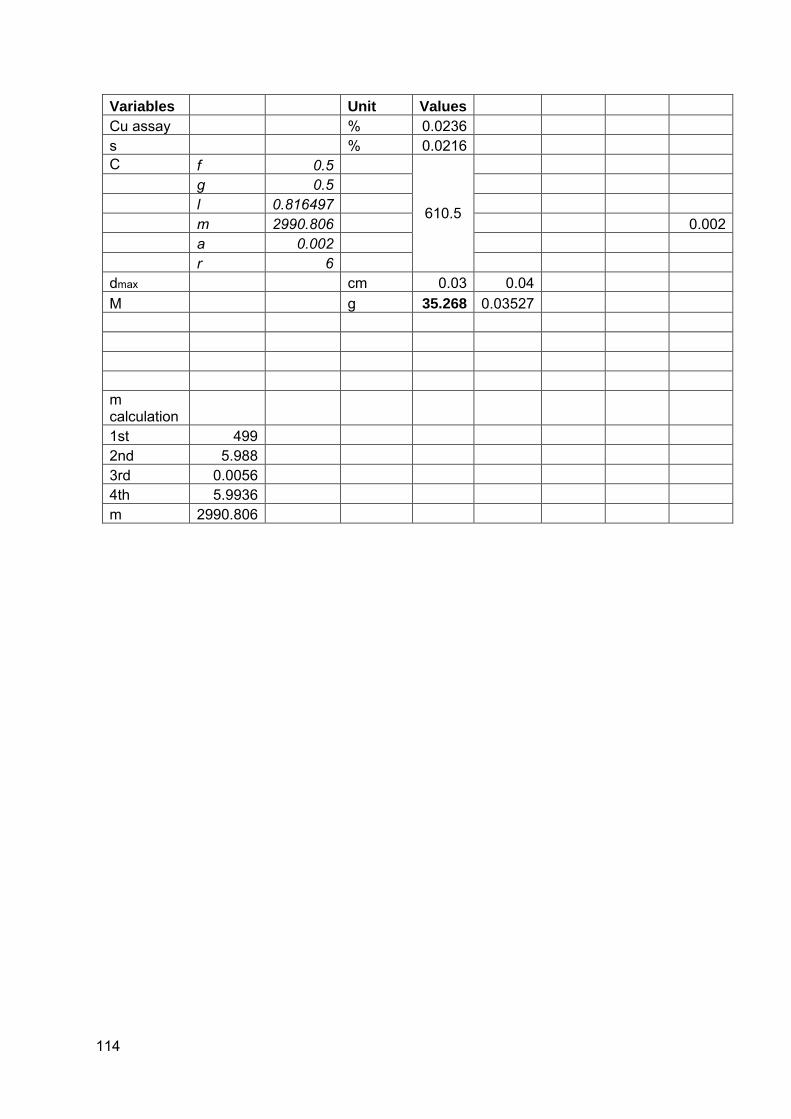
114
Variables Unit Values Cu assay % 0.0236 s % 0.0216 C f 0.5
610.5
g 0.5 l 0.816497 m 2990.806 0.002 a 0.002
r 6 dmax cm 0.03 0.04 M g 35.268 0.03527 m calculation 1st 499 2nd 5.988 3rd 0.0056 4th 5.9936 m 2990.806
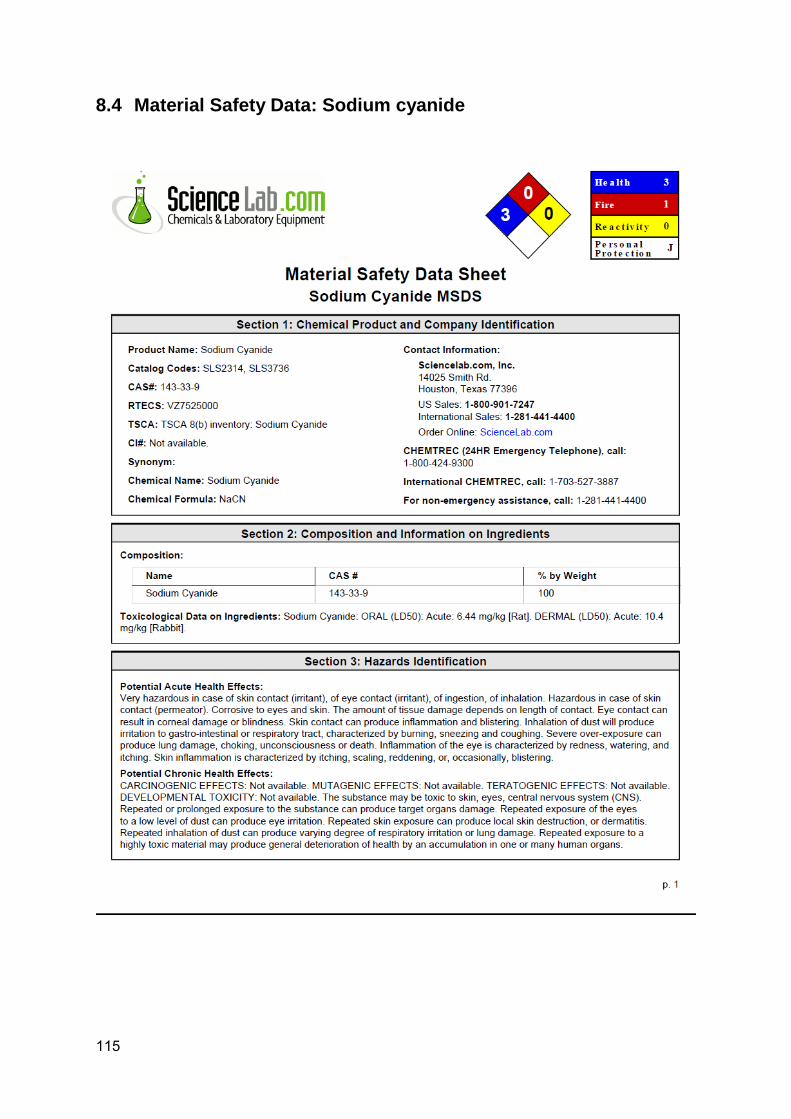
115
8.4 Material Safety Data: Sodium cyanide
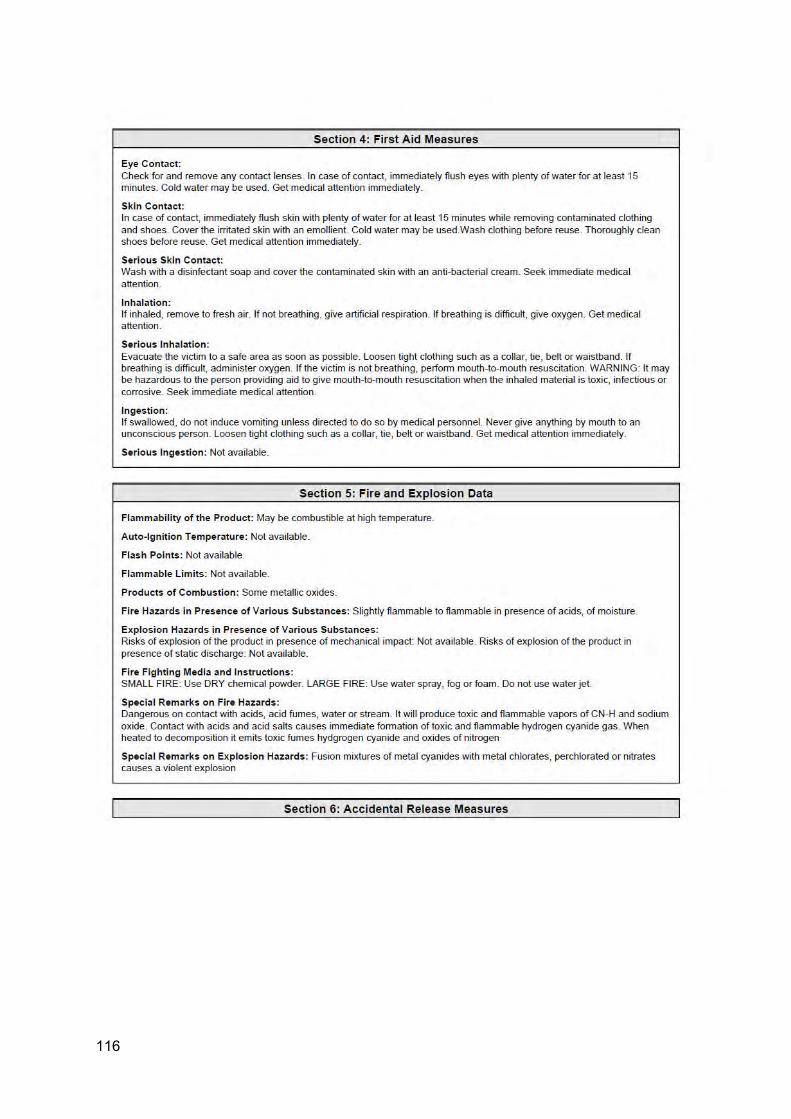
116
Section 4: First A id Measures
Eye Contact: Check for and remove any contact lenses. In case of contact, immediately flush eyes with plenty of water for at least 15 minutes. Cold water may be used. Get medical attention immediately.
Skin Contact: In case of contact, immediately fl ush skin with plenty of water for at least 15 minutes while removing contaminated clothing and shoes. Cover the irritated skin with an emollient. Cold water may be used.Wash clothing before reuse. Thoroughly clean shoes before reuse. Get medical attention immediately.
Serious Skin Contact: Wash with a disinfectant soap and cover the contaminated skin with an anti-bacterial cream. Seek immediate medical attention.
Inhalati on : If inhaled, remove to fresh air. If not breathing, give artificial respiration. If breathing is difficult, give oxygen. Get medical attention.
Serious Inhalation : Evacuate the victim to a safe area as soon as possible. Loosen tight clothing such as a colla r, tie, belt or waistband. If breathing is difficult, administer oxygen. If the victim is not breathing, perform mouth-to-mouth resuscitation. WARNING: It may be hazardous to the person providing aid to give mouth-to-mouth resuscitation when the inhaled material is toxic, infectious or corrosive. Seek immediate medical attention.
Ingestion : If swallowed, do not induce vomiting unless directed to do so by medical personnel. Never give anything by mouth to an unconscious person. Loosen tight clothing such as a collar, tie, belt or waistband. Get medical attention immediately.
Serious Ingestion : Not available.
Section 5: Fire and Explosion Cata
Flammabil ity of the Product: May be combustible at high temperature.
Auto -Ignit ion Temperature: Not available.
Flash Points: Not available.
Flammable Limits: Not available.
Products of Combustion : Some metallic oxides.
Fi re Hazards in Presence of Various Substances: Slightly flammable to flammable in presence of acids, of moisture.
Explosion Hazards in Presence of Various Substances: Risks of explosion of the product in presence of mechanical impact: Not available. Risks of explosion of the product in presence of static d ischarge: Not available.
Fi re Fighting Media and Instructions: SMALL FIRE: Use DRY chemical powder. LARGE FIRE: Use water spray, fog or foam. Do not use water jet.
Special Remarks on Fire Hazards: Dangerous on contact with acids, acid fumes, water or stream. It will produce toxic and flammable vapors of CN-H and sodium oxide. Contact with acids and acid salts causes immediate formation of toxic and flammable hydrogen cyanide gas. When heated to decomposition it emits toxic fumes hydgrogen cyanide and oxides of nitrogen
Special Remarks on Explosion Hazards: Fusion mixtures of metal cyanides with metal chlorates, perchlorated or nitrates causes a violent explosion
Section 6: Accidental Release Measures
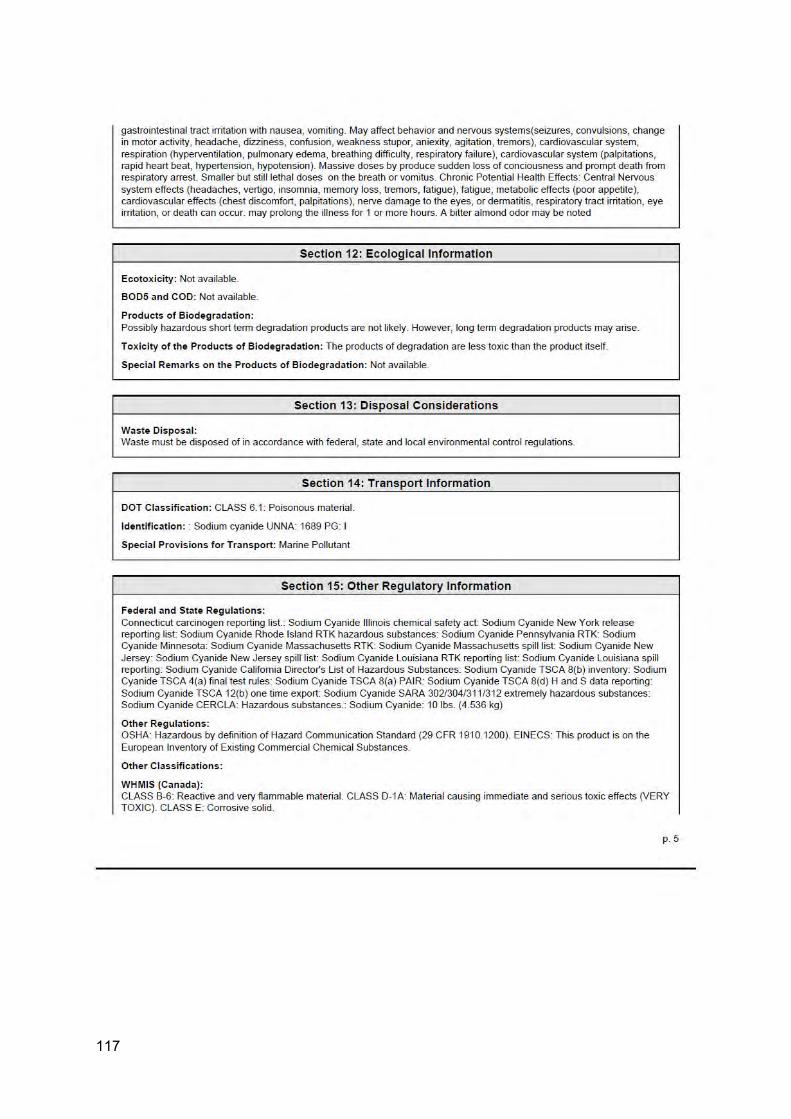
117
gastrointestinal tract irritation with nausea, vomiting. May affect behavior and nervous systems(seizures, convulsions, change in motor activity, headache, dizziness, confusion, weakness stupor, aniexity, agitation, tremors), cardiovascular system, respiration (hyperventilation, pulmonary edema, breathing diffi culty, respiratory failure), cardiovascular system (palpitations, rapid heart beat, hypertension, hypotension). Massive doses by produce sudden loss of conciousness and prompt death from respiratory arrest. Smaller but still lethal doses on the breath or vomitus. Chronic Potential Health Effects: Central Nervous system effects (headaches, vertigo, insomnia, memory loss, tremors, fatigue), fatigue, metabolic effects (poor appetite), cardiovascular effects (chest discomfort, palpitations), nerve damage to the eyes, or dermatitis, respiratory tract irritation, eye irritation, or death can occur. may prolong the illness for 1 or more hours. A bitter almond odor may be noted
Ecotoxicity: Not available.
BODS and COD: Not available.
Products of Biodegradation :
Section 12: Ecological Information
Possibly hazardous short term degradation products are not likely. However, long term degradation products may arise.
Toxicity of the Products of Biodegradat ion : The products of degradation are less toxic than the product itself .
Special Remarks on the Products of Biodegradation : Not available.
Section 13: Disposal Considerations
Waste Disposal: Waste must be disposed of in accordance with federal, state and local environmental control regulations.
Section 14: Transport Information
DOT Classification : CLASS 6.1: Poisonous material.
Ident ification: : Sodium cyanide UNNA: 1689 PG: I
Special Provis ions fo r Transport : Marine Pollutant
Section 15: Other Regulatory Information
Federal and State Regulations: Connecticut carcinogen reporting list.: Sodium Cyanide Il linois chemical safety act: Sodium Cyanide New York release reporting list: Sodium Cyanide Rhode Island RTK hazardous substances: Sodium Cyanide Pennsylvania RTK: Sodium Cyanide Minnesota: Sodium Cyanide Massachusetts RTK: Sodium Cyanide Massachusetts spill list: Sodium Cyanide New Jersey: Sodium Cyanide New Jersey spill list: Sodium Cyanide Louisiana RTK reporting list: Sodium Cyanide Louisiana spill reporting: Sodium Cyanide California Director's List of Hazardous Substances: Sodium Cyanide TSCA 8(b) inventory: Sodium Cyanide TSCA 4(a) final test rules: Sodium Cyanide TSCA 8(a) PAIR: Sodium Cyanide TSCA 8(d) H and S data reporting Sodium Cyanide TSCA 12(b) one time export Sodium Cyanide SARA 302/304/311/312 extremely hazardous substances: Sodium Cyanide CERCLA: Hazardous substances.: Sodium Cyanide: 10 lbs. (4.536 kg)
Other Regulations: OSHA: Hazardous by definition of Hazard Communication Standard (29 CFR 1910.1200). EINECS: This product is on the European Inventory of Existing Commercial Chemical Substances.
Other Classifications :
WHMIS (Canada): CLASS B-6: Reactive and very flammable material. CLASS D-1 A: Material causing immediate and serious toxic effects (VERY TOXIC). CLASS E: Corrosive solid.
p.5
118
Spec ific Grav ity : 1.595 (Water = 1)
Vapor Pressure: Not applicable.
Vapor Dens ity: Vapor Density of Hydrogen Cyanide gas: 0.941
Vo latility : Not available.
Odor Thresho ld : Not available.
Water/Oil Dist. Coeff.: Not available.
lonic ity (in Water): Not available.
Dispersion Properties: See solubility in water.
Solubi lity: Soluble in cold water. Slightly soluble in Ethanol
Section 10: Stability and Reactivity Data
Stability: The p roduct is stable.
Instability Tem perature: Not available.
Conditions of Instability: Excess heat, moisture, incompatibles.
Incompatib ility w ith various substances: Reactive with oxidiz ing agents, acids, moisture.
Corrosiv ity: Corrosive in presence of aluminum. Non-corrosive in presence of glass.
Special Remar ks on Reactiv it y : Violent reaction with fluorine gas, magnesium, nitrates, nitric acid. Dangerous on contact with acids, acid fumes, water or stream. It wil produce toxic and flammable vapors of CN-H and sodium oxide. Cyanide may react with C02 in o rdinary air to form toxic hydrogen cyanide gas. Strong oxidizers such as acids, acid salts, chlorates, and nitrates. Contact with acids and acid salts caus·es immediate formation of toxic and flammable hydrogen cyanide gas.
Special Remar ks on Corrosiv ity: Corrosive to aluminum
Polymerization : Will not occur.
Section 11: Toxicolog ical Information
Routes of Entry: Absorbed through skin. Dermal contact. Eye contact. Inhalation. Ingestion.
Toxicity to An imals: Acute oral toxicity (LOSO) 6.44 mg/kg [Rat] . Acute dermal toxicity (LOSO) 10.4 mg/kg [Rabbit] .
Chronic Effect s on Humans: May cause damage to the following organs: skin, eyes, central nervous system (CNS).
Other Toxic Effects on Humans: Very hazardous in case of skin contact (irritant), of ingestion, of inhalation. Hazardous in case of skin contact (permeator).
Special Remar ks on Toxicity to Animals: Not available.
Special Remar ks on Chronic Effects on Humans : May cause adverse reproductive effects (maternal and paternal fertility) based on animal data.
Special Remar ks on other Toxic Effects on Humans: Acute Potential Health effects: Skin: May cause itching and irritation. May be fatal if absorbed through injured skin with symtpoms similar to those noted for inhalation and ingestion. Eyes: May cause eye irritation and eye damage. Inhalation: May cause resp iratory tract irritation. May be fatal if inhaled. Th e substance inhibits cellular respiration causing metabolic asphyxiation. M ay cause headache, weakness, dizziness, labored breathing, nausea, vomiting. May be followed by cardiovascular effects , unconciousness, convulsions, coma, and death Ingestion: May be fatal if swallowed. May cause
p. 4
119
Small Spill : Use appropriate tools to put the spilled solid in a convenient waste disposal container.
Large Spill: Corrosive solid. Poisonous solid . Stop leak if without risk. Do no1 get water inside container. Do not touch spilled material. Use water spray to reduce vapors. Prevent entry into sewers, basements or confined areas; dike if needed. Eliminate all ignition sources. Call for assistance on disposal. Be careful that the product is not present at a concentration level above TL V. Check TL V on the MSDS and with local authorities.
Section 7: Handl ing and Storage
Precautions: Keep locked up .. Keep container dry. Keep away from heat. Keep away from sources of ignition. Empty containers pose a fire risk, evaporate the residue under a fume hood. Ground all equipment containing material. Do not ingest. Do not breathe dust. Never add water to this product. In case of insufficient vent ilation, wear suitable respiratory equipment. If i ngested, seek medical advice immediately and show the container or the label. Avoid contact with skin and eyes. Keep away from incompatibles such as oxidizing agents, acids, moisture.
Storage: Keep container tightly closed. Keep container in a cool, well-ventilated area. Do not store above 24 •c (75.2°F).
Section 8: Exposure Cont rols/Personal Protect ion
Engineering Controls: Use process enclosures, local exhaust ventilation, or other eng ineering controls to keep airborne levels below recommended exposure limits. If user operations generate dust, fume or mist, use ventilation to keep exposure to airborne contaminants below the exposu re limit.
Personal Protection: Splash goggles. Synthetic apron. Vapor and dust respirator. Be sure to use an approved/certified respirator or equivalent. Gloves.
Personal Protection in Case of a Large Spill : Splash goggles. Full suit. Vapor and dust respirator. Boots. Gloves. A self contained breathing apparatus should be used to avoid inhalation of the product. Suggested protective clothing might not be sufficient; consult a specialist BEFORE hand ling this product.
Exposure Limits: STEL: 5 (mg/m3) from ACGIH (TLV) [United States] SKIN CEIL: 4.7 from NIOSH CEIL: 5 (mg/m3) from NIOSHConsult local authorities for acceptable exposure limits.
Section 9: Physical and Chemical Properties
Physical state and appearance: Solid. (Granular solid. Flakes solid .)
Odor: Faint almond-like odor. Odorless when perfectly dry. Emits odor of hydrogen cyanide when damp.
Taste: Not available.
Molecular Weigh t : 49.01 g/mole
Color: White.
pH (1 % soln/water): Not available.
Boil ing Point: 1496°C (2724.8°F)
Melting Point: 563°C (1045 .4 °F)
Critical Temperature : Not available.
p.3
120
DSCL (EEC): R27/28- Very toxic in contact with skin and if swallowed. R41- Risk of serious damage to eyes. S1 /2 - Keep Jocked up and out of the reach of children. S26- In case of contact with eyes, rinse immediately with plenty of water and seek medical advice. S28- After contact with skin, wash immediately with plenty of water S36/37- Wear suitable protective clothing and gloves. S39-Wear eye/face protection. S45- In case of accident or if you feel unwell, seek medical advice immediately (show the label where possible). S46- If swallowed, seek medical advice immediately and show this container or label.
HMIS (U.S.A.):
Health Hazard : 3
Fire Hazard: 1
Reactivity: 0
Personal Protection: j
National Fire Protection Association (U.S.A.):
Health: 3
Flammabil ity : 0
Reactivity: 0
Specific hazard :
Protective Equipment : Gloves. Synthetic apron. Vapor and dust respirator. Be sure to use an approved/certified respirator or equivalent. Wear appropriate respirator when ventilation is inadequate. Splash goggles.
Section 16: Other Information
References: Not available.
Other Special Considerations: Not available.
Created : 10/11/2005 01:58 PM
Last Updated: 05/21/2013 12:00 PM
The information above is believed to be accurate and represents the best information currently available to us. However, we make no warranty of merchantability or any other warranty, express or implied, with respect to such information, and we assume no liability resulting from its use. Users should make their own investigations to determine the suitability of the information for their particular purposes. In no event shall ScienceLab.com be liable for any claims, losses, or damages of any third party or for Jost profits or any special, indirect, incidental, consequential or exemplary damages, howsoever arising, even if ScienceLab.com has been advised of the possibility of such damages.
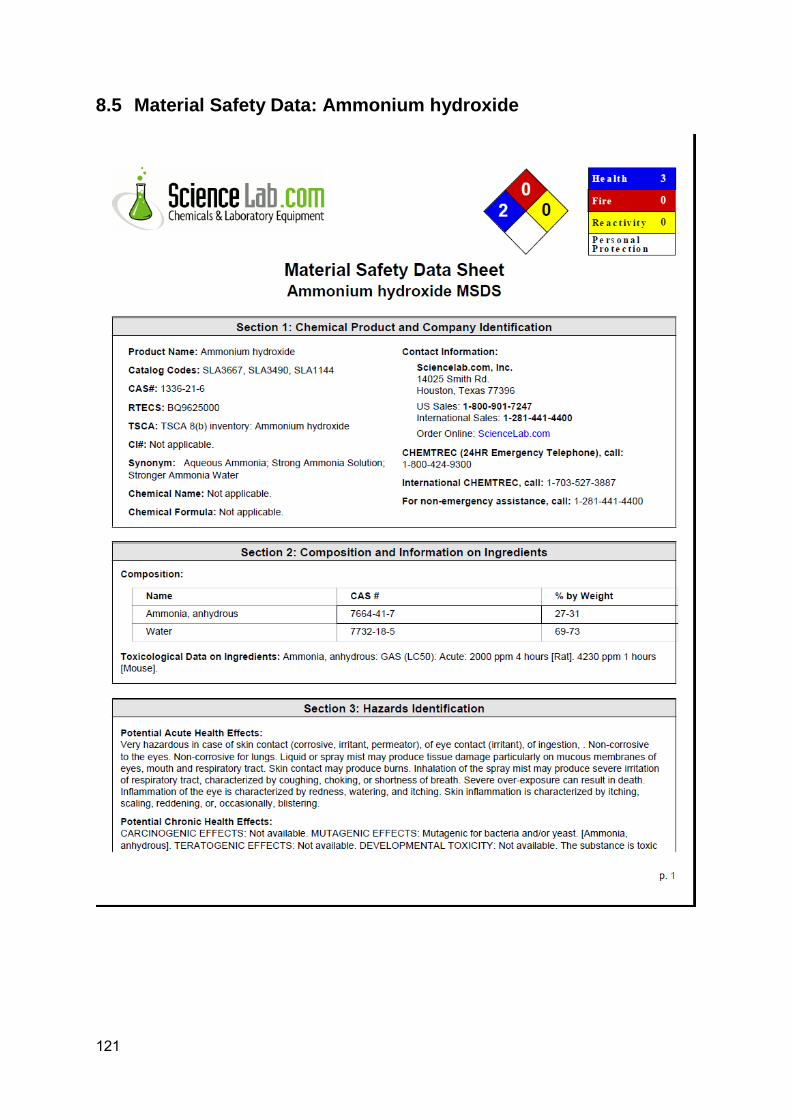
121
8.5 Material Safety Data: Ammonium hydroxide
122
to upper respiratory tract. skin, eyes. Repeated or prolonged exposure to the substance can produce target organs damage. Repeated or prolonged contact with spray mist may produce chronic eye irritation and severe skin irritation. Repeated or prolonged exposure to spray mist may produce respiratory tract irritation leading to frequent attacks of bronchial infection. Repeated exposure to a highly toxic material may produce general deterioration of health by an accumulation in one or many human organs.
Section 4: First Aid Measures
Eye Contact: Check for and remove any contact lenses. Immediately flush eyes with running water for at least 15 minutes, Keeping eyelids open. Cold water may be used. Get medical attention immediately . Finish by rinsing thoroughly with running water to avoid a possible infection.
Skin Contact : In case of contact, immediately flush skin with plenty of water for at least 15 minutes while removing contaminated clothing and shoes. Cover the irritated skin with an emollient. Cold water may be used.Wash clothing before reuse. Thoroughly clean shoes before reuse. Get medical attention immediately.
Serious Skin Contact: Wash with a disinfectant soap and cover the contaminated skin with an anti-bacterial cream. Seek immediate medical attention.
Inhalation: If inhaled, remove to fresh air. If not breathing, give artificial respiration. If breathing is difficult, give oxygen. Get medical attention immediately.
Serious Inhalation: Evacuate the victim to a safe area as soon as possible. Loosen tight clothing such as a collar, tie. belt or waistband. If breathing is difficult, administer oxygen. If the victim is not breathing, perform mouth-to-mouth resuscitation. WARNING: It may be hazardous to the person providing aid to give mouth-to-mouth resuscitation when the inhaled material is toxic, infectious or corrosive. Seek medical attenti'.>n .
Ingestion: If swallowed, do not induce vomiting unless directed to do so by medical personnel. Never give anything by mouth to an unconscious person. Loosen tight clothing such as a collar, tie, belt or waistband. Get medical at1ention immediately.
Serious Ingestion: Not available.
Section 5 : Fire and Explosion Data
Flammability of the Product: Non-flammable.
Auto-Ignition Temperature: Not applicable.
Flash Points: Not applicable.
Flammable Limits: Not applicable.
Products of Combustion: Hazardous decomposition include Nitr ic oxide, and ammonia fumes
Fire Hazards in Presence of Various Substances: Not applicable.
Explos ion Hazards in Presence of Various Substances: Non-explosive in presence of open flames and sparks, of shocks.
Fire Fighting Media and Instructions : Not applicable.
Specia l Remarks on Fire Hazards: Not available.
Specia l Remarks on Explos ion Hazards: Forms explosive compounds with many heavy metals such as silver. lead, zinc and their halide salts. It can form shock sensitive compounds with halogens, mercury oxide, and siliver oxide.
p. 2
123
Section 6: Accidental Release Measures
Small Spill: Dilute with water and mop up, or absorb with an inert dry material and place in an appropriate waste disposal container. If necessary: Neutralize the residue with a dilute solution of acetic acid.
Large Spill: Corrosive liquid. Poisonous liquid. Stop leaK if without risk. Absorb with DRY earth, sand or other non-combustible material. Do not get water inside container. Do not touch spilled material. Use water spray curtain to divert vapor drift. Use water spray to reduce vapors. Prevent entry into sewers, basements or confined areas; diKe if needed. Call for assistance on disposal. Neutralize the residue with a dilute solution of acetic acid. Be careful that the product is not present at a concentration level above TLV. ChecK TLV on the MSDS and with local authorities.
Sect ion 7: Handling and Storage
Precautions: Keep JocKed up .. Keep container dry. Do not ingest. Do not breathe gas/fumes/ vapor/spray. Never add water to this product. In case of insufficient ventilation, wear suitable respiratory equipment. If ingested, seek medical advice immediately and show the container or the label. Avoid contact with skin and eyes. Keep away from incompatibles such as metals, acids.
Storage: Keep container tightly closed. Keep container in a cool, well-ventilated area. Do not store above 25°C (77°F).
Section 8: Exposure Controls/Personal Protection
Engineering Controls: Provide exhaust ventilation or other engineering controls to keep the a irborne concentrations of vapors below their respective threshold limit value. Ensure that eyewash stations and safety showers are proximal to the worK-station location.
Personal Protection: Face shield. Full suit. Vapor respirator. Be sure to use an appro'led/certified respirator or equivalent. Gloves. Boots.
Personal Protection in Case of a Large Spi ll : Splash goggles. Full suit. Vapor respirator. Boots. Gloves. A self contained breathing apparatus should be used to avoid inhalation of the product. Suggested protective clothing might not be sufficient; consult a specialist BEFORE handling this product.
Exposure Limits: TWA: 25 (ppm) from ACGIH (TLV) (United States) TWA: 50 STEL 35 (ppm) from OSHA (PEL) (United States) TWA 25 STEL 35 from NIOSH Consult local authorities for acceptable exposure limits.
Sect ion 9: Physical and Chemical Properties
Physica l state and appearance: Liquid.
Odor: Ammonia-liKe (Strong.)
Taste: Acrid.
Molecular Weight : 35.05
Color: Colortess.
pH (1% soln/water) : 11 .6 (Basic.) This is the actual pH in a 1 N solution.
Boi ling Point: Not available
Melting Point: -69.2°C (-92.6°F)
Cr itical Temperature: Not available.
p. 3
124
Specific Gravity: 0.898 (Water = 1}
Vapor Pressure: 287 .9 KPa (@ 20°C)
Vapor Density: Not available
Volatility : Not available.
Odor Threshold: 5 - 50 ppm as ammonia
Water/Oil Dist. Coeff.: Not available.
lonicity (in Water) : Not available.
Dispersion Properties: See solubility in water
Solubility: Easily soluble in cold water.
Section 1 O: Stability and Reactivity Data
Stability : The product is stable.
Instabi lity Temperature: Not available.
Conditions of Instability: Incompatible materials, high temperatures
Incompatibility with various substances: Highly reactive with metals. Reactive with acids. Slightly reactive to reactive with oxidizing agents.
Corros iv ity: Extremely corrosive in presence of zinc, of copper. Corrosive in presence of aluminum. Non-corrosive in presence of glass, of stainless steel(304), of stainless steel(316}.
Specia l Remarks on Reactiv ity : Incompatible with the following: Organic acids, amides. organic anhydrides, isocyanates, vinyl acetate, epichlorhydrin, aldehydes, Acrolein, Acrylic acid, chlorosulfonic acid, dimethyl sulfate, fluorine, gold+ aqua regia, hydrochloric acid, hydrofluoric acid, hydrogen peroxide, iod ine. nitric acid, olelum, propiolactone, propylene oxide, silver nitrate. silver oxide, silver oxide + ethyl alcohol, nitromethane, silver permanganate. sulfuric acid, halogens. Forms explosive compounds with many heavy metals (silver, lead, zinc} and halide salts.
Specia l Remarks on Corros iv ity : Dissolves copper and zinc. Corrosive to aluminum and its alloys. Corrosive to galvanized surfaces. Severe corrosive effect on brass and bronze
Polymerization: Will not occur.
Section 11 : Toxicological Information
Routes of Entry: Absorbed through sKin. Dermal contact. Eye contact. Inhalation. Ingestion.
Toxicity to Animals: Acute oral toxicity (LD50): 350 mg/kg [Rat).
Chronic Effects on Humans: MUTAGENIC EFFECTS: Mutagenic for bacteria and/or yeast. [Ammonium hydroxide). May cause damage to the following organs: mucous membranes, sKin. eyes.
Other Toxic Effects on Humans: Very hazardous in case of sKin contact (corrosive. irritant. permeator}. of ingestion, . Hazardous in case of eye contact (corrosive), of inhalation (lung corrosive).
Specia l Remarks on Toxicity to An imals: Highly toxic to aquatic organisms
Specia l Remarks on Chronic Effects on Humans: May affect genetic material based on tests with microorganisms and animals. May cause cancer (tumorigenic) based on animal data. No human data found at this time. (Ammonia, anhydrous}
p. 4
125
Special Remarks on other Toxic Effects on Humans: Acute Potential Health Effects: Skin: Causes severe irritation. Causes skin burns. May cause deep, penetrating ulcers of the skin. Contact with skin may cause staining, inflammation, and th ickening of the skin. Eye: Contact with liquid or vapor causes severe burns and possible irreversible eye damage including co meal injury and cataracts. Inhalation: Causes severe irritation of the upper respiratory tract with coughing, burns, breathing difficulty. May cause acute pulmonary edema, pneumoconiosis, fibrosis, and even coma. It is a respiratory stimulant when inhaled at lower concentrations. It may also affect behavior/ central nervous system (convulsions. seizures, ataxia, tremor), cardiovascular system (increase in blood pressure and pulse rate). Ingestion: Harmful if swallowed. Affects the Gastrointestinal tract (bums, swelling of the lips, mouth, and larynx, throat constriction, nausea, vomiting, convulsions, shock. and may cause severe and permanent damage), liver, and urinary system (kidneys) May affect behavior (convulsions, seizures. ataxia, excitement). Chronic Potential Health Effects: Ingestion: May cause effects similar to those of acute ingestion. Inhalation: Repeated exposure to low concentrations may cause bronchitis with cough, phlegm, and/or shortness of breath. May also cause liver and kidney damage, and affect the brain. and blood. Eye: May cause corneal damage and the development of cataracts and glaucoma. Skin: Repeated skin contact to low concentrations may cause dryness, itching. and redness {dermatitis)
Section 12: Ecological Information
Ecotoxi,;ity: Ecotoxicity in water (LC50): 0.1 ppm 24 hours (Rainbow trout). 8.2mg/l 96 hours [Fathead minnow]. 0.1 ppm 48 hours [Bluegill].
BODS and COD: Not available.
Products of Biodegradation: Possibly hazardous short term degradation products are not likely. However, long term degradation products may arise.
Toxicity of the Products of Biodegradation: The products of degradation are less toxic than the product itself.
Special Remarks on the Products of Biodegradation: Not available.
Section 13: Disposal Considerations
Waste Disposal: Waste must be disposed of in accordance with federal, state and local environmental control regulations.
Section 14: Transport Information
DOT Classification: Class 8: Corrosive material
Identif ication: : Ammonia Solution UNNA: 2672 PG: Il l
Special Provisions for Transport: Not available.
Section 15: Other Reg ulatory Information
Federal and State Regulations: Connecticut hazardous material survey.: Ammonium hydroxide Illinois toxic substances disclosure to employee act: Ammonium hydroxide Illinois chemical safety act: Ammonium hydroxide New York release reporting list: Ammonium hydroxide Pennsylvania RTK: Ammonium hydroxide Massachusetts RTK: Ammonium hydroxide Massachusetts spill list: Ammonium hydroxide New Jersey: Ammonium hydroxide New Jersey spill list: Ammonium hydroxide New Jersey toxic catastrophe prevention act: Ammonium hydroxide Louisiana spill reporting: Ammonium hydroxide California Directors List of Hazardous Substances (8 CCR 339): Ammonium hydroxide TSCA 8(b} inventory: Ammonium hydroxide CERCLA: Hazardous substances.: Ammonium hydroxide: 1000 lbs. (453.6 kg)
Other Regulations:
p. 5
126
Related Documents