This article appeared in a journal published by Elsevier. The attached copy is furnished to the author for internal non-commercial research and education use, including for instruction at the authors institution and sharing with colleagues. Other uses, including reproduction and distribution, or selling or licensing copies, or posting to personal, institutional or third party websites are prohibited. In most cases authors are permitted to post their version of the article (e.g. in Word or Tex form) to their personal website or institutional repository. Authors requiring further information regarding Elsevier’s archiving and manuscript policies are encouraged to visit: http://www.elsevier.com/copyright

Welcome message from author
This document is posted to help you gain knowledge. Please leave a comment to let me know what you think about it! Share it to your friends and learn new things together.
Transcript
This article appeared in a journal published by Elsevier. The attachedcopy is furnished to the author for internal non-commercial researchand education use, including for instruction at the authors institution
and sharing with colleagues.
Other uses, including reproduction and distribution, or selling orlicensing copies, or posting to personal, institutional or third party
websites are prohibited.
In most cases authors are permitted to post their version of thearticle (e.g. in Word or Tex form) to their personal website orinstitutional repository. Authors requiring further information
regarding Elsevier’s archiving and manuscript policies areencouraged to visit:
http://www.elsevier.com/copyright
Author's personal copy
Research Paper
Ammonia and greenhouse gas emissions from slattedand solid floors in dairy cattle houses: A scale model study
Jose Pereira a,e,*, David Fangueiro b, Tom H. Misselbrook c, David R. Chadwick c,Joao Coutinho d, Henrique Trindade e
aEscola Superior Agraria de Viseu, Instituto Politecnico de Viseu, Quinta da Alagoa, 3500-606 Viseu, PortugalbUIQA, Instituto Superior de Agronomia, TU Lisbon, Tapada da Ajuda, 1349-017 Lisboa, PortugalcRothamsted Research, North Wyke, Okehampton, Devon, EX20 2SB, UKdChemistry Centre, Department of Biology and Environment, Universidade de Tras-os-Montes e Alto Douro, Apartado 1013,
5001-801 Vila Real, PortugaleCITAB e Centre for the Research and Technology of Agro-Environment and Biological Sciences, Department of Agronomy,
Universidade de Tras-os-Montes e Alto Douro, 5001-801 Vila Real, Portugal
a r t i c l e i n f o
Article history:
Received 15 July 2010
Received in revised form
18 February 2011
Accepted 28 February 2011
Published online 30 March 2011
Dairy cattle are usually housed in naturally ventilated houses where removal of excreta is
periodically performed. The aim of this controlled study was to compare the effect of two
floor designs and three air temperatures (5, 15 and 25 �C) on NH3, N2O, CH4 and CO2
emissions arising from cattle excreta deposition to the floor. Two scale models were built
to simulate a level solid floor without urine drainage, and a slatted concrete floor. Following
application of a mixture of urine and faeces, these two floor type models were subjected to
a constant airflow rate (12.5 exchanges h�1) and gaseous emissions were measured over
a 72-h period.
Emissions of NH3, N2O, CO2 and CH4 increased significantly with air temperature with
both floor type models and emissions of NH3, N2O and CO2 were significantly greater from
the solid floor relative to the slatted floor at all temperatures considered. The cumulative
NH3 (27e66% of total N applied) and CO2 (<19% of total C applied) emissions were greater
from the solid floor than from the slatted floor (by 36% and 44%, respectively). The
cumulative N2O (<0.1% of total N applied) and CH4 (<0.4% of total C applied) emissions
were relatively low and CH4 values did not differ significantly between treatments.
Cumulative greenhouse gas emissions (as CO2-equivalents) increased significantly with
temperature but did not differ between the floor types.
ª 2011 IAgrE. Published by Elsevier Ltd. All rights reserved.
1. Introduction
Livestock production is the major source of gaseous emissions
from agriculture (Snell, Seipelt, & van denWeghe, 2003) and, in
Portugal, dairy farming is the main source of ammonia (NH3)
emission (PNIR, 2009). Ammonia emissions lead to acidification
and nutrient-N enrichment of ecosystems and can also be
consideredasa secondaryparticulatepollutantassociatedwith
health hazards (Erisman, Bleeker, Galloway, & Sutton, 2007).
Dairy farming isalsoa sourceofother environmentallyharmful
* Corresponding author. Escola Superior Agraria de Viseu, Instituto Politecnico de Viseu, Quinta da Alagoa, 3500-606 Viseu, Portugal.Tel.: þ351 232 446 600; fax: þ351 232 426 536.
E-mail addresses: [email protected], [email protected] (J. Pereira).
Avai lab le at www.sc iencedi rect .com
journa l homepage : www.e lsev i er . com/ locate / i ssn /15375110
b i o s y s t em s e n g i n e e r i n g 1 0 9 ( 2 0 1 1 ) 1 4 8e1 5 7
1537-5110/$ e see front matter ª 2011 IAgrE. Published by Elsevier Ltd. All rights reserved.doi:10.1016/j.biosystemseng.2011.02.011
Author's personal copy
gases, suchasnitrousoxide (N2O)andmethane (CH4), twoof the
main greenhouse gases (GHG) contributing to global warming
(IPCC, 2007). Ammonia is not considered to be a direct GHG but
indirectly contributes to global warming since deposited NH3
may be converted to N2O in the soil after nitrification and
subsequent denitrification (IPCC, 2007).
Excreta (urine and faeces) deposited in cattle houses results
in significant gaseous emissions.Ammonia emissions induced
by the hydrolysis of urea present in the urine (Ni, Vinckier,
Hendriks, & Coenegrachts, 1999; Sommer et al., 2006) depend
onseveral parameters, suchas theair velocityover themanure
surface, rate of urea hydrolysis, pH of excreta and air temper-
ature (Cortus, Lemay, Barber, Hill, & Godbout, 2008; Elzing &
Monteny, 1997a; Morsing, Strøm, Zhang, & Kai, 2008). The
formation of ammoniacal N can subsequently lead to N2O
emission from nitrification and/or denitrification processes
(Misselbrook, Webb, Chadwick, Ellis, & Pain, 2001). Methane
may be emitted due the existence of anaerobic conditions in
excreta deposited on floors (Misselbrook et al., 2001) and
carbon dioxide (CO2) should be predominantly a product of
aerobic decomposition of organic compounds in slurry based
cattle buildings (i.e. in open ventilated systems), and will also
result from urea hydrolysis (Møller, Sommer, & Ahring, 2004).
In Portugal, dairy cattle are usually housed in naturally
ventilated buildings with slatted or solid floors on which urine
and faeces remain for a period of a few hours to several days
(Pereira, Misselbrook, Chadwick, Coutinho, & Trindade, 2010).
Previous studies have shown that deposited excreta may lead
to significant emissions of N2O, CO2, CH4 and NH3
(Misselbrook et al., 2001; Snell et al., 2003) and that increasing
temperature leads to increases in NH3 (Elzing & Monteny,
1997a), N2O (Sommer et al., 2006), CO2 (Ni et al., 1999) and
CH4 emissions (Kashyap, Dadhich, & Sharma, 2003). The
emissions of these four gases from cattle buildings have been
previously studied in countries fromNorthern Europe (Braam,
Smits, Gunnink, & Swierstra, 1997; Braam & Swierstra, 1999;
Ngwabie, Jeppsson, Nimmermark, Swensson, & Gustafsson,
2009; Ni et al., 1999; Snell et al., 2003). However, there is
a lack of information for gaseous emissions from cattle
housing in Mediterranean countries, where climatic condi-
tions are significantly different to those of Northern Europe
and where it may be hypothesised that higher air tempera-
tures will contribute to increased gaseous emissions.
Previous studies (e.g. Braam et al., 1997; Morsing et al., 2008;
Swierstra, Smits, & Kroodsma, 1995) have shown that floor
design,namely slattedversus solidfloors, has a strong influence
on NH3 emissions. Swierstra et al. (1995) observed that a cubicle
house with solid concrete floors with a 3% slope to the centre,
a central gutter andno finish gave a reduction of 48% of theNH3
emission compared to an identical cow house with a standard
slatted floor. Furthermore, Braam et al. (1997) reported that
scrapinganon-slopingconcretefloorwillhave littleeffectonthe
NH3 emission because a thin layer of slurry is retained by the
floor,whichwillbeasignificantsourceofNH3.ThepotentialNH3
emission from a slatted floor was estimated to be three times
higher than for a V-shaped solid floor (Monteny & Erisman,
1998). However, the effect of floor design on GHG emissions
has been poorly studied. Furthermore, results obtained in some
previousstudiesdidnotdifferentiateemissionsoriginating from
animal respiration (CO2), enteric fermentation (CH4) or excreta
deposition on the floor (NH3, N2O, CO2 and CH4) (Cabaraux,
Philippe, Laitat, & Canart, 2009; Ngwabie et al., 2009; Ni et al.,
1999). Additionally, results from in-situ measurements of
gaseous emissions in cattle housingmaybe affected by building
ventilation (temperature variation andnon-constant flux of air).
The aim of this present study was to evaluate, using a scale
model, the effect of floor design (solid or slatted floor) under
different controlled indoor air temperatures on NH3 and GHG
(N2O, CH4 and CO2) emissions from cattle excreta deposition.
2. Materials and methods
2.1. Experimental set-up
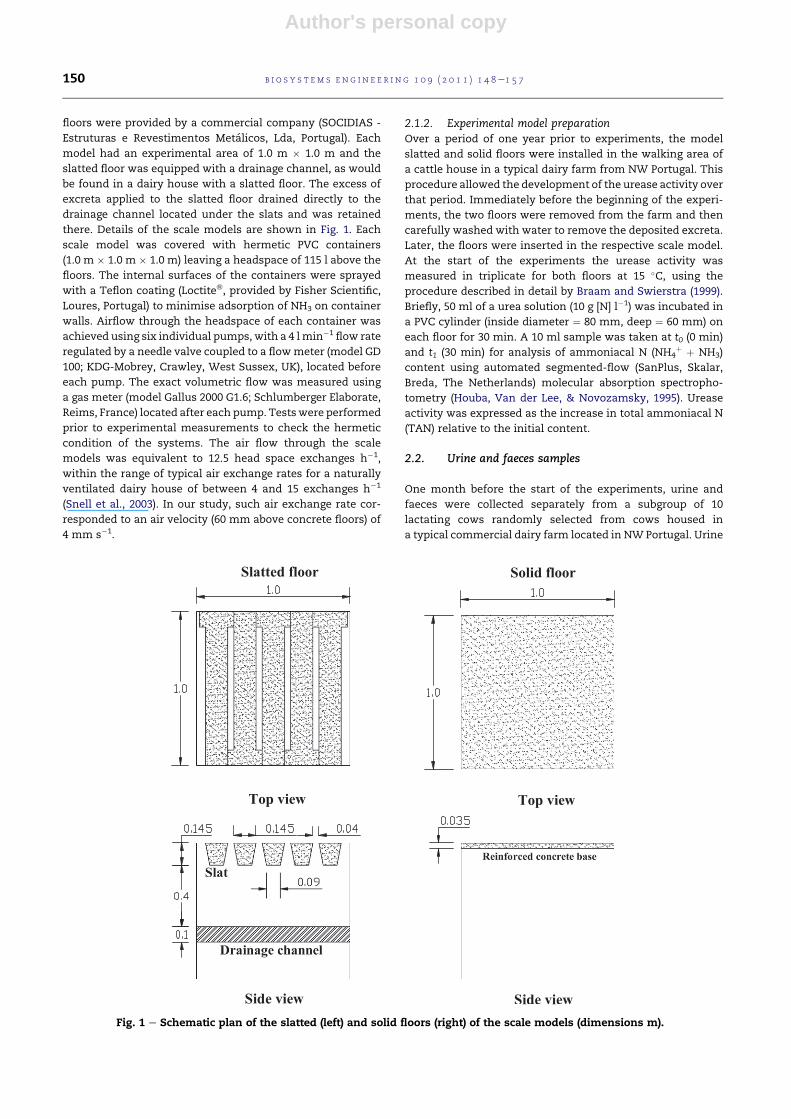
2.1.1. Scale model of concrete floorsScale models of two types of concrete floor e slatted and solid
(the latter with no slope or urine drainage), were built. The
Nomenclature
Symbols
A Exposed surface area of the floor, m2
CO2-equivalents Cumulative N2O and/or CH4 emissions
expressed as CO2 using the conversion factors,
g m�2 or %
F Ammonia emission rates, mg m�2 h�1
NH4þ Ammonium, g kg�1
NO3� Nitrate, mg kg�1
t Time lenght of the sampling period, h
t0 Sample of urea solution taken at 0 min
t1 Sample urea solution taken at 30 min
TAN Total ammoniacal N concentration, mg l�1 or
g kg�1
V Volume of the acid trap solution, l
Abbreviations
ANOVA Analysis of variance
DM Dry matter
EMEP-CORINIAR Air pollutant emission inventory
guidebook
EN European normalization
GC Gas chromatography
GHG Greenhouse gas emissions
N Number of replications
ND Not determined
NIR Near-infrared detection
PVC Polyvinyl chloride
TGA Trace gas analyser
TOC Total organic carbon
Total N emissions Total cumulative N (NH3 þ N2O)
emissions
Total C emissions Total cumulative C (CO2 þ CH4)
emissions
b i o s y s t em s e ng i n e e r i n g 1 0 9 ( 2 0 1 1 ) 1 4 8e1 5 7 149
Author's personal copy
floors were provided by a commercial company (SOCIDIAS -
Estruturas e Revestimentos Metalicos, Lda, Portugal). Each
model had an experimental area of 1.0 m � 1.0 m and the
slatted floor was equipped with a drainage channel, as would
be found in a dairy house with a slatted floor. The excess of
excreta applied to the slatted floor drained directly to the
drainage channel located under the slats and was retained
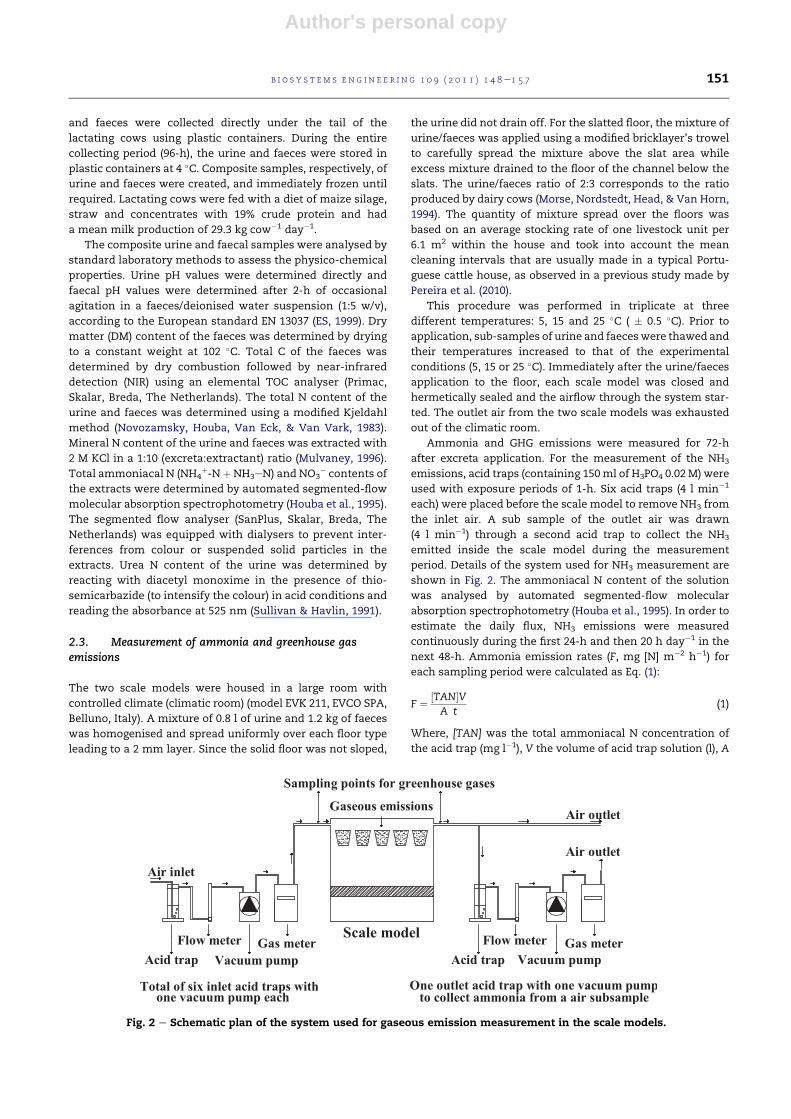
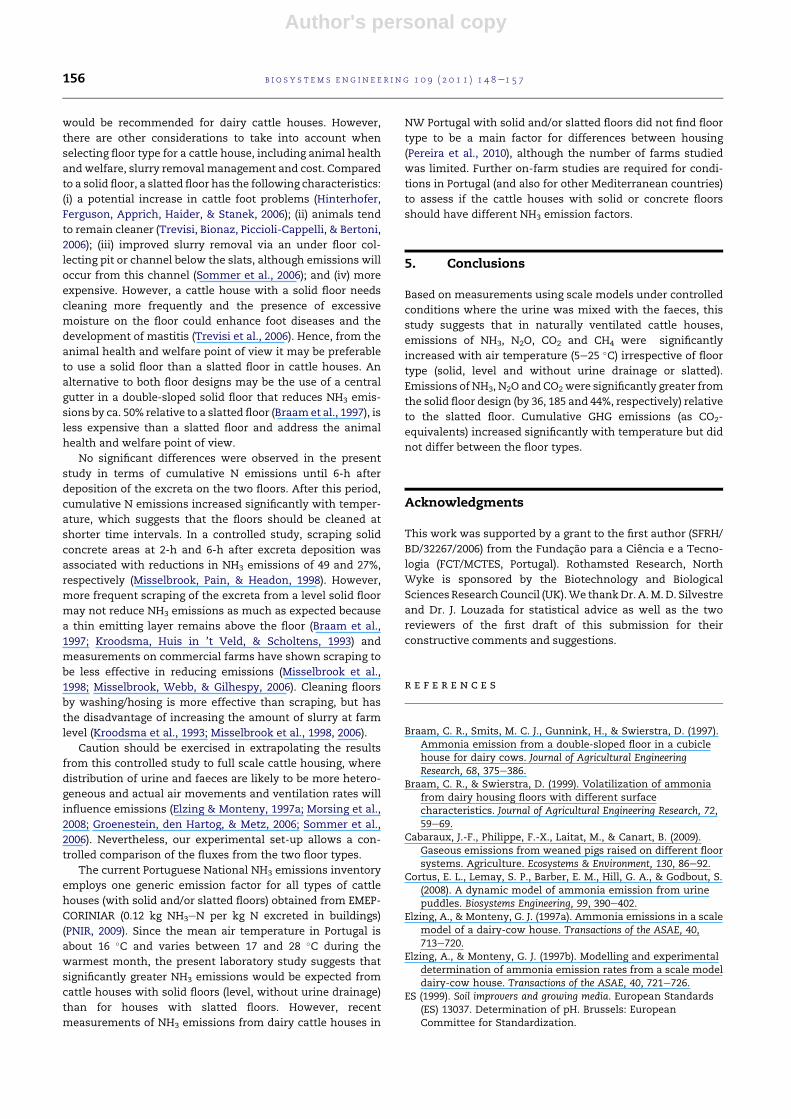
there. Details of the scale models are shown in Fig. 1. Each
scale model was covered with hermetic PVC containers
(1.0 m � 1.0 m � 1.0 m) leaving a headspace of 115 l above the
floors. The internal surfaces of the containers were sprayed
with a Teflon coating (Loctite�, provided by Fisher Scientific,
Loures, Portugal) to minimise adsorption of NH3 on container
walls. Airflow through the headspace of each container was
achieved using six individual pumps, with a 4 lmin�1 flow rate
regulated by a needle valve coupled to a flowmeter (model GD
100; KDG-Mobrey, Crawley, West Sussex, UK), located before
each pump. The exact volumetric flow was measured using
a gas meter (model Gallus 2000 G1.6; Schlumberger Elaborate,
Reims, France) located after each pump. Testswere performed
prior to experimental measurements to check the hermetic
condition of the systems. The air flow through the scale
models was equivalent to 12.5 head space exchanges h�1,
within the range of typical air exchange rates for a naturally
ventilated dairy house of between 4 and 15 exchanges h�1
(Snell et al., 2003). In our study, such air exchange rate cor-
responded to an air velocity (60 mm above concrete floors) of
4 mm s�1.
2.1.2. Experimental model preparationOver a period of one year prior to experiments, the model
slatted and solid floors were installed in the walking area of
a cattle house in a typical dairy farm from NW Portugal. This
procedure allowed the development of the urease activity over
that period. Immediately before the beginning of the experi-
ments, the two floors were removed from the farm and then
carefully washed with water to remove the deposited excreta.
Later, the floors were inserted in the respective scale model.
At the start of the experiments the urease activity was
measured in triplicate for both floors at 15 �C, using the
procedure described in detail by Braam and Swierstra (1999).
Briefly, 50 ml of a urea solution (10 g [N] l�1) was incubated in
a PVC cylinder (inside diameter ¼ 80 mm, deep ¼ 60 mm) on
each floor for 30 min. A 10 ml sample was taken at t0 (0 min)
and t1 (30 min) for analysis of ammoniacal N (NH4þ þ NH3)
content using automated segmented-flow (SanPlus, Skalar,
Breda, The Netherlands) molecular absorption spectropho-
tometry (Houba, Van der Lee, & Novozamsky, 1995). Urease
activity was expressed as the increase in total ammoniacal N
(TAN) relative to the initial content.
2.2. Urine and faeces samples
One month before the start of the experiments, urine and
faeces were collected separately from a subgroup of 10
lactating cows randomly selected from cows housed in
a typical commercial dairy farm located in NW Portugal. Urine
Fig. 1 e Schematic plan of the slatted (left) and solid floors (right) of the scale models (dimensions m).
b i o s y s t em s e n g i n e e r i n g 1 0 9 ( 2 0 1 1 ) 1 4 8e1 5 7150
Author's personal copy
and faeces were collected directly under the tail of the
lactating cows using plastic containers. During the entire
collecting period (96-h), the urine and faeces were stored in
plastic containers at 4 �C. Composite samples, respectively, of
urine and faeces were created, and immediately frozen until
required. Lactating cows were fed with a diet of maize silage,
straw and concentrates with 19% crude protein and had
a mean milk production of 29.3 kg cow�1 day�1.
The composite urine and faecal samples were analysed by
standard laboratory methods to assess the physico-chemical
properties. Urine pH values were determined directly and
faecal pH values were determined after 2-h of occasional
agitation in a faeces/deionised water suspension (1:5 w/v),
according to the European standard EN 13037 (ES, 1999). Dry
matter (DM) content of the faeces was determined by drying
to a constant weight at 102 �C. Total C of the faeces was
determined by dry combustion followed by near-infrared
detection (NIR) using an elemental TOC analyser (Primac,
Skalar, Breda, The Netherlands). The total N content of the
urine and faeces was determined using a modified Kjeldahl
method (Novozamsky, Houba, Van Eck, & Van Vark, 1983).
Mineral N content of the urine and faeces was extracted with
2 M KCl in a 1:10 (excreta:extractant) ratio (Mulvaney, 1996).
Total ammoniacal N (NH4þ-N þNH3eN) and NO3
� contents of
the extracts were determined by automated segmented-flow
molecular absorption spectrophotometry (Houba et al., 1995).
The segmented flow analyser (SanPlus, Skalar, Breda, The
Netherlands) was equipped with dialysers to prevent inter-
ferences from colour or suspended solid particles in the
extracts. Urea N content of the urine was determined by
reacting with diacetyl monoxime in the presence of thio-
semicarbazide (to intensify the colour) in acid conditions and
reading the absorbance at 525 nm (Sullivan & Havlin, 1991).
2.3. Measurement of ammonia and greenhouse gasemissions
The two scale models were housed in a large room with
controlled climate (climatic room) (model EVK 211, EVCO SPA,
Belluno, Italy). A mixture of 0.8 l of urine and 1.2 kg of faeces
was homogenised and spread uniformly over each floor type
leading to a 2 mm layer. Since the solid floor was not sloped,
the urine did not drain off. For the slatted floor, the mixture of
urine/faeces was applied using a modified bricklayer’s trowel
to carefully spread the mixture above the slat area while
excess mixture drained to the floor of the channel below the
slats. The urine/faeces ratio of 2:3 corresponds to the ratio
produced by dairy cows (Morse, Nordstedt, Head, & Van Horn,
1994). The quantity of mixture spread over the floors was
based on an average stocking rate of one livestock unit per
6.1 m2 within the house and took into account the mean
cleaning intervals that are usually made in a typical Portu-
guese cattle house, as observed in a previous study made by
Pereira et al. (2010).
This procedure was performed in triplicate at three
different temperatures: 5, 15 and 25 �C ( � 0.5 �C). Prior to
application, sub-samples of urine and faeceswere thawed and
their temperatures increased to that of the experimental
conditions (5, 15 or 25 �C). Immediately after the urine/faeces
application to the floor, each scale model was closed and
hermetically sealed and the airflow through the system star-
ted. The outlet air from the two scale models was exhausted
out of the climatic room.
Ammonia and GHG emissions were measured for 72-h
after excreta application. For the measurement of the NH3
emissions, acid traps (containing 150ml of H3PO4 0.02 M) were
used with exposure periods of 1-h. Six acid traps (4 l min�1
each) were placed before the scale model to remove NH3 from
the inlet air. A sub sample of the outlet air was drawn
(4 l min�1) through a second acid trap to collect the NH3
emitted inside the scale model during the measurement
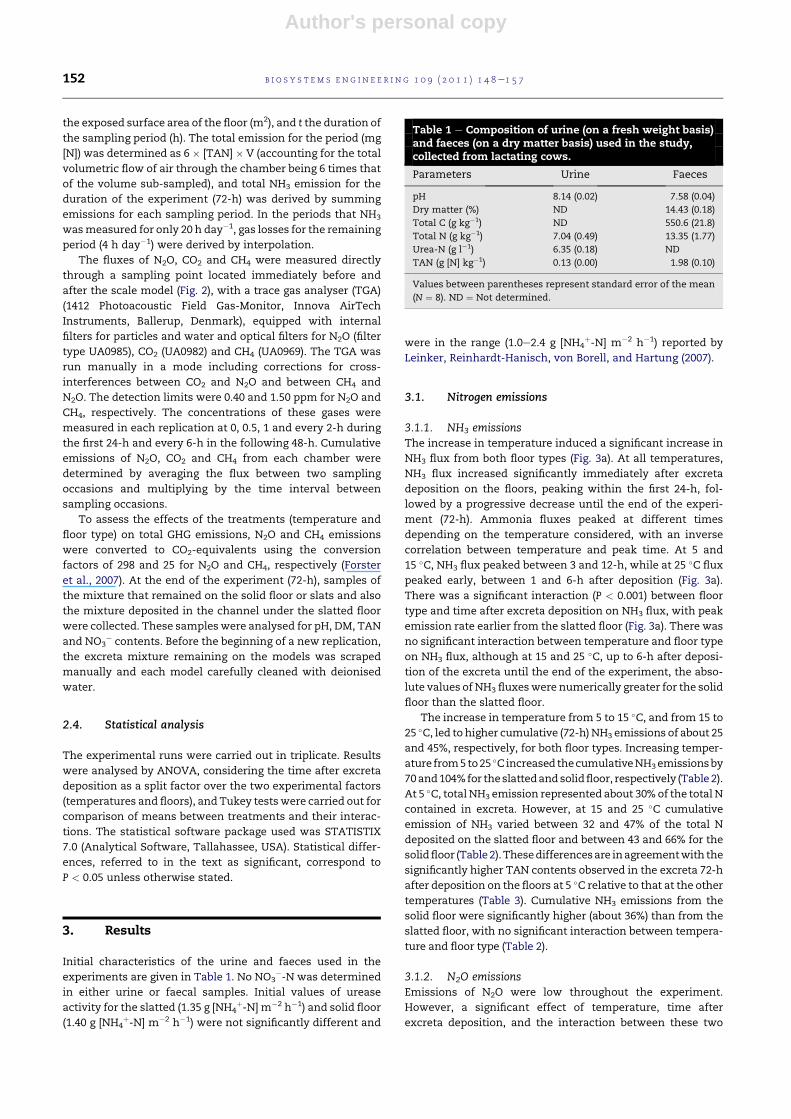
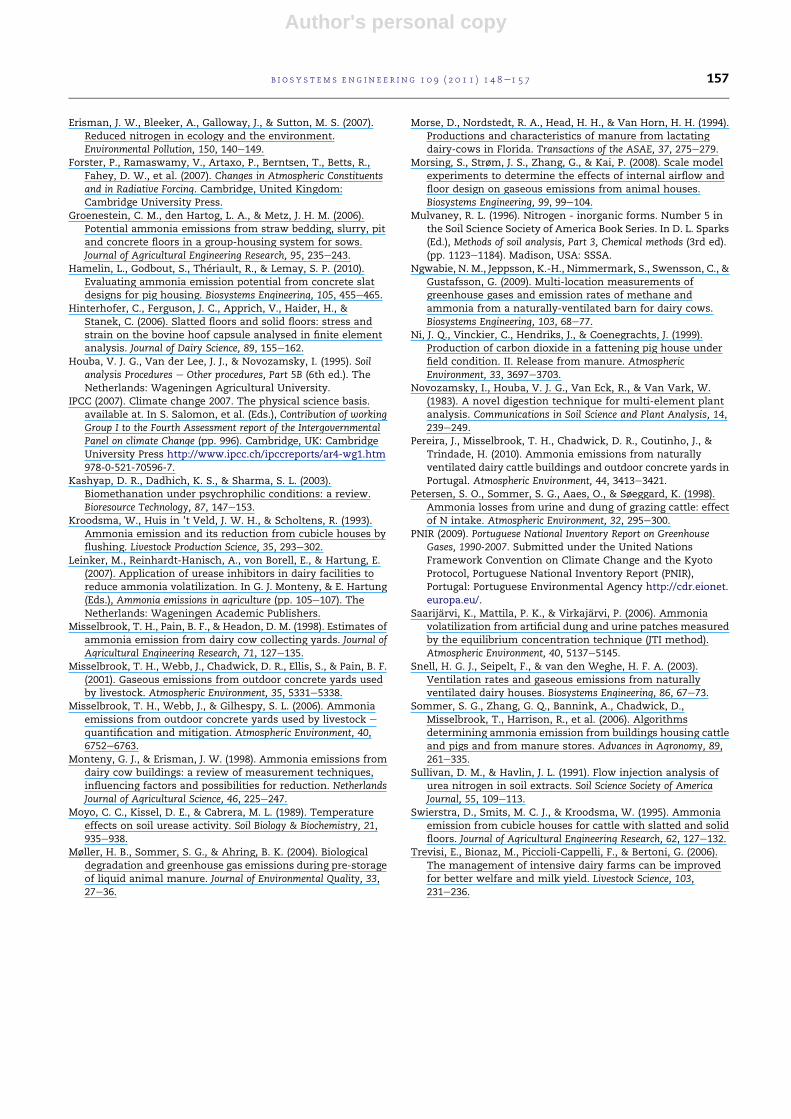
period. Details of the system used for NH3 measurement are
shown in Fig. 2. The ammoniacal N content of the solution
was analysed by automated segmented-flow molecular
absorption spectrophotometry (Houba et al., 1995). In order to
estimate the daily flux, NH3 emissions were measured
continuously during the first 24-h and then 20 h day�1 in the
next 48-h. Ammonia emission rates (F, mg [N] m�2 h�1) for
each sampling period were calculated as Eq. (1):
F ¼ ½TAN�VA t
(1)
Where, [TAN] was the total ammoniacal N concentration of
the acid trap (mg l�1), V the volume of acid trap solution (l), A
Fig. 2 e Schematic plan of the system used for gaseous emission measurement in the scale models.
b i o s y s t em s e ng i n e e r i n g 1 0 9 ( 2 0 1 1 ) 1 4 8e1 5 7 151
Author's personal copy
the exposed surface area of the floor (m2), and t the duration of
the sampling period (h). The total emission for the period (mg
[N]) was determined as 6 � [TAN] � V (accounting for the total
volumetric flow of air through the chamber being 6 times that
of the volume sub-sampled), and total NH3 emission for the
duration of the experiment (72-h) was derived by summing
emissions for each sampling period. In the periods that NH3
wasmeasured for only 20 h day�1, gas losses for the remaining
period (4 h day�1) were derived by interpolation.
The fluxes of N2O, CO2 and CH4 were measured directly
through a sampling point located immediately before and
after the scale model (Fig. 2), with a trace gas analyser (TGA)
(1412 Photoacoustic Field Gas-Monitor, Innova AirTech
Instruments, Ballerup, Denmark), equipped with internal
filters for particles and water and optical filters for N2O (filter
type UA0985), CO2 (UA0982) and CH4 (UA0969). The TGA was
run manually in a mode including corrections for cross-
interferences between CO2 and N2O and between CH4 and
N2O. The detection limits were 0.40 and 1.50 ppm for N2O and
CH4, respectively. The concentrations of these gases were
measured in each replication at 0, 0.5, 1 and every 2-h during
the first 24-h and every 6-h in the following 48-h. Cumulative
emissions of N2O, CO2 and CH4 from each chamber were
determined by averaging the flux between two sampling
occasions and multiplying by the time interval between
sampling occasions.
To assess the effects of the treatments (temperature and
floor type) on total GHG emissions, N2O and CH4 emissions
were converted to CO2-equivalents using the conversion
factors of 298 and 25 for N2O and CH4, respectively (Forster
et al., 2007). At the end of the experiment (72-h), samples of
the mixture that remained on the solid floor or slats and also
the mixture deposited in the channel under the slatted floor
were collected. These sampleswere analysed for pH, DM, TAN
and NO3� contents. Before the beginning of a new replication,
the excreta mixture remaining on the models was scraped
manually and each model carefully cleaned with deionised
water.
2.4. Statistical analysis
The experimental runs were carried out in triplicate. Results
were analysed by ANOVA, considering the time after excreta
deposition as a split factor over the two experimental factors
(temperatures and floors), and Tukey testswere carried out for
comparison of means between treatments and their interac-
tions. The statistical software package used was STATISTIX
7.0 (Analytical Software, Tallahassee, USA). Statistical differ-
ences, referred to in the text as significant, correspond to
P < 0.05 unless otherwise stated.
3. Results
Initial characteristics of the urine and faeces used in the
experiments are given in Table 1. No NO3�-N was determined
in either urine or faecal samples. Initial values of urease
activity for the slatted (1.35 g [NH4þ-N] m�2 h�1) and solid floor
(1.40 g [NH4þ-N] m�2 h�1) were not significantly different and
were in the range (1.0e2.4 g [NH4þ-N] m�2 h�1) reported by
Leinker, Reinhardt-Hanisch, von Borell, and Hartung (2007).
3.1. Nitrogen emissions
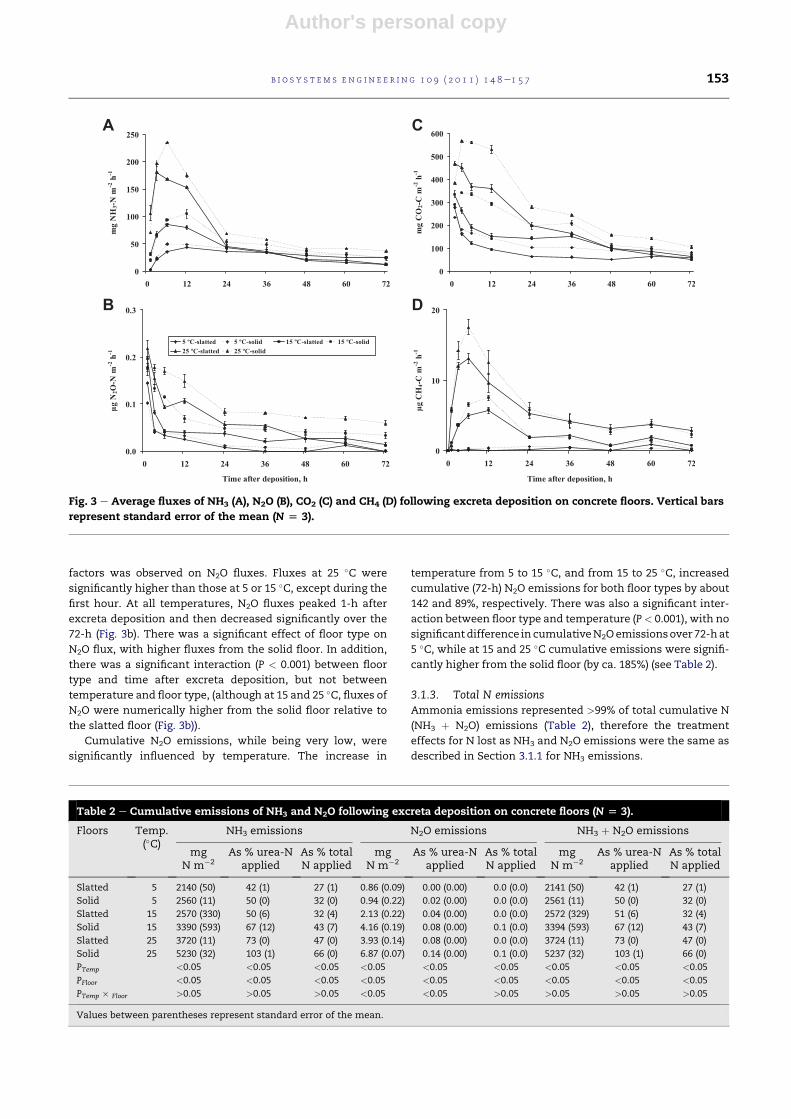
3.1.1. NH3 emissionsThe increase in temperature induced a significant increase in
NH3 flux from both floor types (Fig. 3a). At all temperatures,
NH3 flux increased significantly immediately after excreta
deposition on the floors, peaking within the first 24-h, fol-
lowed by a progressive decrease until the end of the experi-
ment (72-h). Ammonia fluxes peaked at different times
depending on the temperature considered, with an inverse
correlation between temperature and peak time. At 5 and
15 �C, NH3 flux peaked between 3 and 12-h, while at 25 �C flux
peaked early, between 1 and 6-h after deposition (Fig. 3a).
There was a significant interaction (P < 0.001) between floor
type and time after excreta deposition on NH3 flux, with peak
emission rate earlier from the slatted floor (Fig. 3a). There was
no significant interaction between temperature and floor type
on NH3 flux, although at 15 and 25 �C, up to 6-h after deposi-
tion of the excreta until the end of the experiment, the abso-
lute values of NH3 fluxeswere numerically greater for the solid
floor than the slatted floor.
The increase in temperature from 5 to 15 �C, and from 15 to
25 �C, led to higher cumulative (72-h) NH3 emissions of about 25
and 45%, respectively, for both floor types. Increasing temper-
ature from5to25 �C increased thecumulativeNH3emissionsby
70and104%for theslattedandsolidfloor, respectively (Table 2).
At 5 �C, total NH3 emission represented about 30% of the total N
contained in excreta. However, at 15 and 25 �C cumulative
emission of NH3 varied between 32 and 47% of the total N
deposited on the slatted floor and between 43 and 66% for the
solidfloor (Table2).Thesedifferencesare inagreementwith the
significantly higher TAN contents observed in the excreta 72-h
after deposition on the floors at 5 �C relative to that at the other
temperatures (Table 3). Cumulative NH3 emissions from the
solid floor were significantly higher (about 36%) than from the
slatted floor, with no significant interaction between tempera-
ture and floor type (Table 2).
3.1.2. N2O emissionsEmissions of N2O were low throughout the experiment.
However, a significant effect of temperature, time after
excreta deposition, and the interaction between these two
Table 1 e Composition of urine (on a fresh weight basis)and faeces (on a dry matter basis) used in the study,collected from lactating cows.
Parameters Urine Faeces
pH 8.14 (0.02) 7.58 (0.04)
Dry matter (%) ND 14.43 (0.18)
Total C (g kg�1) ND 550.6 (21.8)
Total N (g kg�1) 7.04 (0.49) 13.35 (1.77)
Urea-N (g l�1) 6.35 (0.18) ND
TAN (g [N] kg�1) 0.13 (0.00) 1.98 (0.10)
Values between parentheses represent standard error of the mean
(N ¼ 8). ND ¼ Not determined.
b i o s y s t em s e n g i n e e r i n g 1 0 9 ( 2 0 1 1 ) 1 4 8e1 5 7152
Author's personal copy
factors was observed on N2O fluxes. Fluxes at 25 �C were
significantly higher than those at 5 or 15 �C, except during the
first hour. At all temperatures, N2O fluxes peaked 1-h after
excreta deposition and then decreased significantly over the
72-h (Fig. 3b). There was a significant effect of floor type on
N2O flux, with higher fluxes from the solid floor. In addition,
there was a significant interaction (P < 0.001) between floor
type and time after excreta deposition, but not between
temperature and floor type, (although at 15 and 25 �C, fluxes ofN2O were numerically higher from the solid floor relative to
the slatted floor (Fig. 3b)).
Cumulative N2O emissions, while being very low, were
significantly influenced by temperature. The increase in
temperature from 5 to 15 �C, and from 15 to 25 �C, increasedcumulative (72-h) N2O emissions for both floor types by about
142 and 89%, respectively. There was also a significant inter-
action between floor type and temperature (P< 0.001), with no
significantdifference in cumulativeN2Oemissionsover 72-hat
5 �C, while at 15 and 25 �C cumulative emissions were signifi-
cantly higher from the solid floor (by ca. 185%) (see Table 2).
3.1.3. Total N emissionsAmmonia emissions represented >99% of total cumulative N
(NH3 þ N2O) emissions (Table 2), therefore the treatment
effects for N lost as NH3 and N2O emissions were the same as
described in Section 3.1.1 for NH3 emissions.
Fig. 3 e Average fluxes of NH3 (A), N2O (B), CO2 (C) and CH4 (D) following excreta deposition on concrete floors. Vertical bars
represent standard error of the mean (N [ 3).
Table 2 e Cumulative emissions of NH3 and N2O following excreta deposition on concrete floors (N [ 3).
Floors Temp.(�C)
NH3 emissions N2O emissions NH3 þ N2O emissions
mgN m�2
As % urea-Napplied
As % totalN applied
mgN m�2
As % urea-Napplied
As % totalN applied
mgN m�2
As % urea-Napplied
As % totalN applied
Slatted 5 2140 (50) 42 (1) 27 (1) 0.86 (0.09) 0.00 (0.00) 0.0 (0.0) 2141 (50) 42 (1) 27 (1)
Solid 5 2560 (11) 50 (0) 32 (0) 0.94 (0.22) 0.02 (0.00) 0.0 (0.0) 2561 (11) 50 (0) 32 (0)
Slatted 15 2570 (330) 50 (6) 32 (4) 2.13 (0.22) 0.04 (0.00) 0.0 (0.0) 2572 (329) 51 (6) 32 (4)
Solid 15 3390 (593) 67 (12) 43 (7) 4.16 (0.19) 0.08 (0.00) 0.1 (0.0) 3394 (593) 67 (12) 43 (7)
Slatted 25 3720 (11) 73 (0) 47 (0) 3.93 (0.14) 0.08 (0.00) 0.0 (0.0) 3724 (11) 73 (0) 47 (0)
Solid 25 5230 (32) 103 (1) 66 (0) 6.87 (0.07) 0.14 (0.00) 0.1 (0.0) 5237 (32) 103 (1) 66 (0)
PTemp <0.05 <0.05 <0.05 <0.05 <0.05 <0.05 <0.05 <0.05 <0.05
PFloor <0.05 <0.05 <0.05 <0.05 <0.05 <0.05 <0.05 <0.05 <0.05
PTemp � Floor >0.05 >0.05 >0.05 <0.05 <0.05 >0.05 >0.05 >0.05 >0.05
Values between parentheses represent standard error of the mean.
b i o s y s t em s e ng i n e e r i n g 1 0 9 ( 2 0 1 1 ) 1 4 8e1 5 7 153
Author's personal copy
3.2. Carbon emissions
3.2.1. CO2 emissionsThe fluxes of CO2 emitted from both floor types increased
significantly with the temperature, and decreased with time
after excreta deposition. In addition, results showed signifi-
cant effects of floor type and a significant interaction between
floor type and time after excreta deposition (P < 0.001), but
there was no significant interaction between temperature and
floor type. Hence, at all temperatures studied, CO2 emissions
peaked between 0 and 1-h after application, followed by
a progressive decrease until the end of the experiment. Fluxes
of CO2 were always significantly higher from the solid floor
than the slatted floor (Fig. 3c).
The increases in temperature from 5 to 15 �C and 15e25 �Cled to increases in cumulative CO2 emissions of about 60 and
50%, respectively, and the increase in temperature from 5 to
25 �C led to an increase in cumulative CO2 emissions of 140%.
Cumulative CO2 emissions represented less than 19% of total
C deposited in the excreta (Table 4). Cumulative CO2 emis-
sions were significantly affected by temperature and floor
type as well as the interaction between these two factors. At
5 �C, the cumulative CO2 emissions did not differ significantly
between the two types of floors. However, at 15 and 25 �C,cumulative CO2 emission from the solid floor was about 44%
higher than from the slatted floor (Table 4).
3.2.2. CH4 emissionsMethane fluxes were generally low throughout the experi-
ment. Fluxes of CH4 were affected by temperature, time after
excreta deposition, and the interaction between these two
factors was significant (P < 0.001). Floor type did not signifi-
cantly influence CH4 fluxes and there was no significant
interaction between temperature and floor type. Hence, at 15
and 25 �C, CH4 emissions peaked between 3 and 6-h after
deposition of the excreta, but, at 5 �C, CH4 emissions were
below the analyser detection limit (1.50 ppm) (Fig. 3d).
Cumulative CH4 emissions were significantly higher at
25 �C relative to others temperatures studied. Cumulative CH4
emissions represented less than 0.4% of total C deposited on
the floors (Table 4).
3.2.3. Total C emissionsTotal C (CO2 þ CH4) emissions were dominated by CO2 emis-
sions, so treatment effects for total C emissionswere the same
as described in Section 3.2.1 for CO2 emissions.
3.3. Greenhouse gas emissions
Greenhouse gases (N2O and CH4) emissions, expressed as
CO2-equivalents, increased significantly with temperature.
A greater increase in GHG emissions was observed when
temperature increased from 5 to 15 �C (14.8 times) than from
15 to 25 �C (2.3 times). Greenhouse gas emissions did not differ
significantly between the two types of floor and there was no
significant interaction between temperature and floor type. At
15 and 25 �C for both floor types, N2O emissions (as CO2-
equivalents) were the dominant GHG (>50%). However, at 5 �C,CH4 emissions represented 100% of the total GHG emissions
for both floor types (Table 5).
4. Discussion
4.1. Nitrogen emissions
The pattern of NH3 emission, with a peak within the first 24-h
following excreta deposition, is typical of those observed by
others (e.g. Elzing & Monteny, 1997a). The low NH3 emissions
Table 3 e Excreta characteristics 72-h after deposition onconcrete floors (TAN on a fresh weight basis) (N [ 3).
Floors Temp.(�C) pH Drymatter(%)
TAN(g [N] kg�1)
Slatted (slats) 5 8.70d 14.7cd 0.88b
Slatted (channel) 5 8.62d 11.6d 1.68a
Solid 5 9.05abc 26.3abc 0.62bc
Slatted (slats) 15 9.01bc 22.5bcd 0.34d
Slatted (channel) 15 8.92c 11.2d 0.34d
Solid 15 9.06abc 28.0ab 0.41cd
Slatted (slats) 25 9.25a 25.2abc 0.22d
Slatted (channel) 25 9.08abc 17.2bcd 0.18d
Solid 25 9.20ab 37.1a 0.34d
Values with different superscripts within columns are significantly
different (P < 0.05).
Table 4 e Cumulative emissions of CO2 and CH4 following excreta deposition on concrete floors (N [ 3).
Floors Temp.(�C) CO2 emissions CH4 emissions CO2 þ CH4 emissions
mg C m�2 As % totalC applied
mg C m�2 As % totalC applied
mg C m�2 As % totalC applied
Slatted 5 5200 (241) 5 (0) 0 (0) 0.0 (0.0) 5200 (241) 5 (0)
Solid 5 7700 (6) 8 (0) 0 (0) 0.0 (0.0) 7700 (6) 8 (0)
Slatted 15 8600 (954) 9 (1) 143 (21) 0.2 (0.0) 8743 (960) 9 (1)
Solid 15 12300 (1007) 13 (1) 138 (17) 0.1 (0.0) 12438 (1008) 13 (1)
Slatted 25 12600 (434) 13 (0) 358 (93) 0.4 (0.1) 12958 (341) 14 (0)
Solid 25 18300 (357) 19 (0) 398 (106) 0.4 (0.1) 18698 (463) 20 (0)
PTemp <0.05 <0.05 <0.05 <0.05 <0.05 <0.05
PFloor <0.05 <0.05 >0.05 >0.05 <0.05 <0.05
PTemp � Floor <0.05 <0.05 >0.05 >0.05 <0.05 <0.05
Values between parentheses represent standard error of the mean.
b i o s y s t em s e n g i n e e r i n g 1 0 9 ( 2 0 1 1 ) 1 4 8e1 5 7154
Author's personal copy
observed fromboth floor types at 5 �Cduring the first fewhours
after application of excreta (Fig. 3a) were probably due to the
inactivation of the urease enzyme present on the floors and/or
reduction in thehydrolysis of theurea (Braametal., 1997;Moyo,
Kissel, & Cabrera, 1989). Urine is generally acknowledged to be
the predominant source of NH3 emissions from cattle excreta
(Petersen, Sommer, Aaes, & Søeggard, 1998; Saarijarvi, Mattila,
& Virkajarvi, 2006). The increase in NH3 emission with
temperature is related to two processes: the formation of NH4þ
in aqueousphase (fromureahydrolysis), and the release ofNH3
to the gaseous phase. The NH4þ formation increases with the
increase in urease activity between 10 and 40 �C, whereas at
temperatures lower than 10 �C, urease activity is reduced
markedly (Sommer et al., 2006). The NH3 release from the
aqueous to gaseous phase is controlled by chemical and phys-
ical factors influencing diffusion, dissociation, evaporation and
volatilisation, and will increase with increasing temperature
(Elzing & Monteny, 1997b).
Ammonia emissions from floor surfaces are mainly influ-
enced by (i) the characteristics of the surface layer of the floor
affecting the urea hydrolysis rate due to the contact area
between the urine and the enzyme urease present on floor,
and (ii) by the characteristics of the emitting layer, particularly
the overall emitting surface area of urine remaining on the
floor (Elzing & Monteny, 1997a; Hamelin, Godbout, Theriault,
& Lemay, 2010). In our study, the surface area of contact for
the solid floor was 22% higher than for the slatted floor,
contributing to the significantly higher NH3 emissions at 15
and 25 �C (Fig. 3A and Table 2). For the slatted floor, significant
drainage of urine to the below-floor channel may also have
occurred prior to hydrolysis, leading to lower emissions
(Cortus et al., 2008; Hamelin et al., 2010). The differences
between the texture and porosity of the slatted and solid floors
could also have led to different infiltration rates and absorp-
tion of the urea in the concrete pores of each floor (Cortus
et al., 2008). The porosity and surface roughness of the
slatted floor was decreased by a compressive stress during
construction relative to solid floor. Nevertheless, this should
have not been a limiting factor considering the values of
urease activity (>1.0) determined here for the two floor
surfaces (Braam & Swierstra, 1999).
The increase in cumulative N2O emissions with tempera-
ture is probably related to the enhanced activity of nitrifying
bacteria at higher temperatures (Sommer et al., 2006).
However, emissions of N2O were small even if they were
significantly different from zero, with cumulative emissions
representing less than 0.1% of the total N deposited on the
floors in all treatments (Table 2). These low N2O emissions
were probably due to the fact that themain source of N2O was
the nitrification process since no NO3� was initially present in
urine and faeces deposited on the floors and the aerobic
conditions of the experiment did not favour the denitrification
processes. Similarly, previous studies have shown that in
cattle houses (Ngwabie et al., 2009) and outdoor concrete
yards (Misselbrook et al., 2001) with systems of liquid manure
management and daily or frequent removal of the excreta to
outdoor stores, N2O emissions are very low or negligible.
The lower N2O emissions observed from the slatted floor
could be related to the lower surface area,which promoted the
drainage of urine from the slats thereby reducing the avail-
ability of NH4þ for nitrification/denitrification processes.
4.2. Carbon emissions
Carbon dioxide emitted by excreta deposition does not
contribute to the greenhouse effect because it is part of the so-
called short C cycle. However, rates of CO2 emission give an
indication of biological activity and the rate at which the
decomposition processes are occurring. The CO2 emissions
that occurred during the 72-h of experiment had a similar
pattern toNH3 emissions. However, CO2 emissionsweremuch
higher, and peaked earlier, than NH3 emissions because the
CO2 was released more quickly from excreta deposited on
floors due to the lower solubility of the CO2 (Ni et al., 1999).
Since most of the C content of excreta is derived from faeces
rather than urine (Sommer et al., 2006), processes such as
organic matter decomposition and bacterial respiration under
aerobic conditions are likely to be the main source of CO2
emissions,withsomeemissionsderiving fromureahydrolysis.
As biological processes, these will be highly influenced by
temperature, in the sameway as urease activity (Fig. 3a and c).
In the present study, CH4 emissions were very low
(Table 4), as might be expected for a thin film of excreta where
generally aerobic conditions will exist. Misselbrook et al.
(2001), measuring from a concrete yard used by cattle, repor-
ted that significant CH4 emissions were associated with the
presence of dung pats, within which anaerobic conditions
may occur, with little or no emission from other areas. In the
present study, CH4 emissions were not detected at 5 �C,because of the detection limits of the gas analyser being used.
Misselbrook et al. (2001), usingmore sensitive GC analysis, did
report low CH4 emission rates under the winter conditions of
the UK.
4.3. Practical considerations regarding floor type
In this study, NH3 emissions were higher from the simulated
solid floor (level without urine drainage) compared to the
slatted floor at all temperatures considered. In addition, these
two floors did not differ significantly in terms of GHG emis-
sions. Hence, in terms of gaseous emissions, slatted floor use
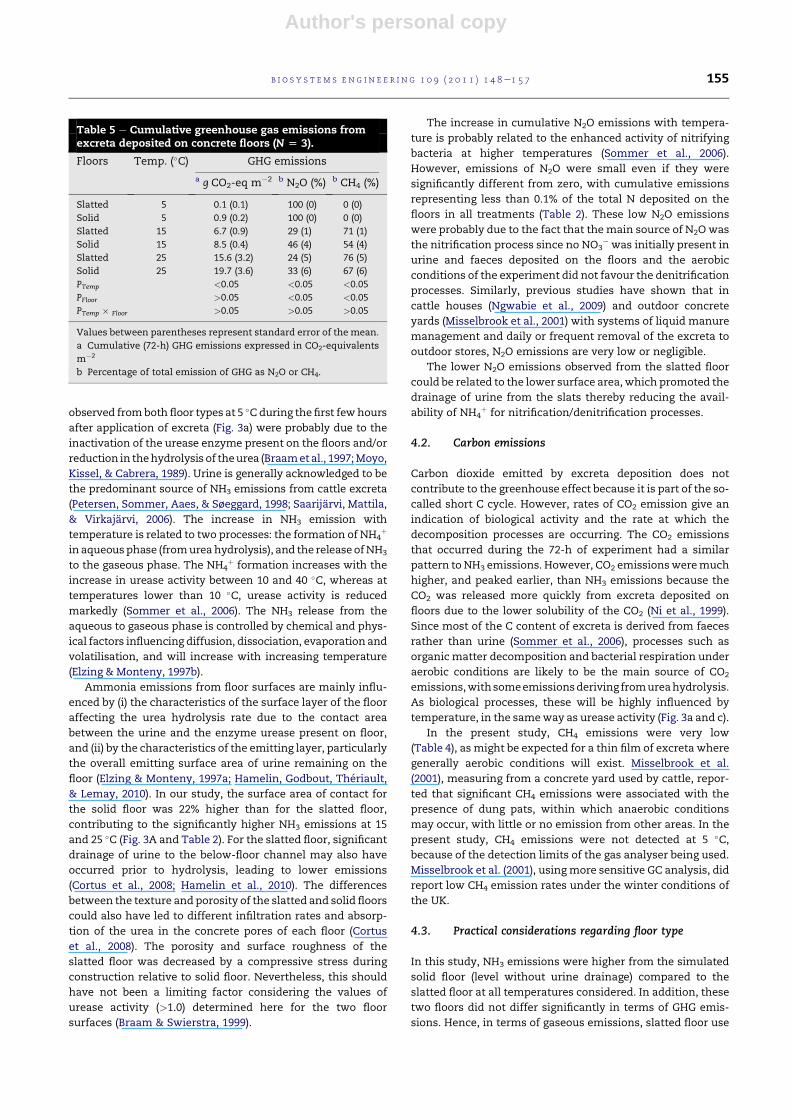
Table 5 e Cumulative greenhouse gas emissions fromexcreta deposited on concrete floors (N [ 3).
Floors Temp. (�C) GHG emissions
a g CO2-eq m�2 b N2O (%) b CH4 (%)
Slatted 5 0.1 (0.1) 100 (0) 0 (0)
Solid 5 0.9 (0.2) 100 (0) 0 (0)
Slatted 15 6.7 (0.9) 29 (1) 71 (1)
Solid 15 8.5 (0.4) 46 (4) 54 (4)
Slatted 25 15.6 (3.2) 24 (5) 76 (5)
Solid 25 19.7 (3.6) 33 (6) 67 (6)
PTemp <0.05 <0.05 <0.05
PFloor >0.05 <0.05 <0.05
PTemp � Floor >0.05 >0.05 >0.05
Values between parentheses represent standard error of the mean.
a Cumulative (72-h) GHG emissions expressed in CO2-equivalents
m�2
b Percentage of total emission of GHG as N2O or CH4.
b i o s y s t em s e ng i n e e r i n g 1 0 9 ( 2 0 1 1 ) 1 4 8e1 5 7 155
Author's personal copy
would be recommended for dairy cattle houses. However,
there are other considerations to take into account when
selecting floor type for a cattle house, including animal health
andwelfare, slurry removal management and cost. Compared
to a solid floor, a slatted floor has the following characteristics:
(i) a potential increase in cattle foot problems (Hinterhofer,
Ferguson, Apprich, Haider, & Stanek, 2006); (ii) animals tend
to remain cleaner (Trevisi, Bionaz, Piccioli-Cappelli, & Bertoni,
2006); (iii) improved slurry removal via an under floor col-
lecting pit or channel below the slats, although emissions will
occur from this channel (Sommer et al., 2006); and (iv) more
expensive. However, a cattle house with a solid floor needs
cleaning more frequently and the presence of excessive
moisture on the floor could enhance foot diseases and the
development of mastitis (Trevisi et al., 2006). Hence, from the
animal health and welfare point of view it may be preferable
to use a solid floor than a slatted floor in cattle houses. An
alternative to both floor designs may be the use of a central
gutter in a double-sloped solid floor that reduces NH3 emis-
sions by ca. 50% relative to a slatted floor (Braamet al., 1997), is
less expensive than a slatted floor and address the animal
health and welfare point of view.
No significant differences were observed in the present
study in terms of cumulative N emissions until 6-h after
deposition of the excreta on the two floors. After this period,
cumulative N emissions increased significantly with temper-
ature, which suggests that the floors should be cleaned at
shorter time intervals. In a controlled study, scraping solid
concrete areas at 2-h and 6-h after excreta deposition was
associated with reductions in NH3 emissions of 49 and 27%,
respectively (Misselbrook, Pain, & Headon, 1998). However,
more frequent scraping of the excreta from a level solid floor
may not reduce NH3 emissions as much as expected because
a thin emitting layer remains above the floor (Braam et al.,
1997; Kroodsma, Huis in ’t Veld, & Scholtens, 1993) and
measurements on commercial farms have shown scraping to
be less effective in reducing emissions (Misselbrook et al.,
1998; Misselbrook, Webb, & Gilhespy, 2006). Cleaning floors
by washing/hosing is more effective than scraping, but has
the disadvantage of increasing the amount of slurry at farm
level (Kroodsma et al., 1993; Misselbrook et al., 1998, 2006).
Caution should be exercised in extrapolating the results
from this controlled study to full scale cattle housing, where
distribution of urine and faeces are likely to be more hetero-
geneous and actual air movements and ventilation rates will
influence emissions (Elzing & Monteny, 1997a; Morsing et al.,
2008; Groenestein, den Hartog, & Metz, 2006; Sommer et al.,
2006). Nevertheless, our experimental set-up allows a con-
trolled comparison of the fluxes from the two floor types.
The current Portuguese National NH3 emissions inventory
employs one generic emission factor for all types of cattle
houses (with solid and/or slatted floors) obtained from EMEP-
CORINIAR (0.12 kg NH3eN per kg N excreted in buildings)
(PNIR, 2009). Since the mean air temperature in Portugal is
about 16 �C and varies between 17 and 28 �C during the
warmest month, the present laboratory study suggests that
significantly greater NH3 emissions would be expected from
cattle houses with solid floors (level, without urine drainage)
than for houses with slatted floors. However, recent
measurements of NH3 emissions from dairy cattle houses in
NW Portugal with solid and/or slatted floors did not find floor
type to be a main factor for differences between housing
(Pereira et al., 2010), although the number of farms studied
was limited. Further on-farm studies are required for condi-
tions in Portugal (and also for other Mediterranean countries)
to assess if the cattle houses with solid or concrete floors
should have different NH3 emission factors.
5. Conclusions
Based on measurements using scale models under controlled
conditions where the urine was mixed with the faeces, this
study suggests that in naturally ventilated cattle houses,
emissions of NH3, N2O, CO2 and CH4 were significantly
increased with air temperature (5e25 �C) irrespective of floor
type (solid, level and without urine drainage or slatted).
Emissions of NH3, N2O and CO2 were significantly greater from
the solid floor design (by 36, 185 and 44%, respectively) relative
to the slatted floor. Cumulative GHG emissions (as CO2-
equivalents) increased significantly with temperature but did
not differ between the floor types.
Acknowledgments
This work was supported by a grant to the first author (SFRH/
BD/32267/2006) from the Fundacao para a Ciencia e a Tecno-
logia (FCT/MCTES, Portugal). Rothamsted Research, North
Wyke is sponsored by the Biotechnology and Biological
Sciences ResearchCouncil (UK).We thankDr. A.M.D. Silvestre
and Dr. J. Louzada for statistical advice as well as the two
reviewers of the first draft of this submission for their
constructive comments and suggestions.
r e f e r e n c e s
Braam, C. R., Smits, M. C. J., Gunnink, H., & Swierstra, D. (1997).Ammonia emission from a double-sloped floor in a cubiclehouse for dairy cows. Journal of Agricultural EngineeringResearch, 68, 375e386.
Braam, C. R., & Swierstra, D. (1999). Volatilization of ammoniafrom dairy housing floors with different surfacecharacteristics. Journal of Agricultural Engineering Research, 72,59e69.
Cabaraux, J.-F., Philippe, F.-X., Laitat, M., & Canart, B. (2009).Gaseous emissions from weaned pigs raised on different floorsystems. Agriculture. Ecosystems & Environment, 130, 86e92.
Cortus, E. L., Lemay, S. P., Barber, E. M., Hill, G. A., & Godbout, S.(2008). A dynamic model of ammonia emission from urinepuddles. Biosystems Engineering, 99, 390e402.
Elzing, A., & Monteny, G. J. (1997a). Ammonia emissions in a scalemodel of a dairy-cow house. Transactions of the ASAE, 40,713e720.
Elzing, A., & Monteny, G. J. (1997b). Modelling and experimentaldetermination of ammonia emission rates from a scale modeldairy-cow house. Transactions of the ASAE, 40, 721e726.
ES (1999). Soil improvers and growing media. European Standards(ES) 13037. Determination of pH. Brussels: EuropeanCommittee for Standardization.
b i o s y s t em s e n g i n e e r i n g 1 0 9 ( 2 0 1 1 ) 1 4 8e1 5 7156
Author's personal copy
Erisman, J. W., Bleeker, A., Galloway, J., & Sutton, M. S. (2007).Reduced nitrogen in ecology and the environment.Environmental Pollution, 150, 140e149.
Forster, P., Ramaswamy, V., Artaxo, P., Berntsen, T., Betts, R.,Fahey, D. W., et al. (2007). Changes in Atmospheric Constituentsand in Radiative Forcing. Cambridge, United Kingdom:Cambridge University Press.
Groenestein, C. M., den Hartog, L. A., & Metz, J. H. M. (2006).Potential ammonia emissions from straw bedding, slurry, pitand concrete floors in a group-housing system for sows.Journal of Agricultural Engineering Research, 95, 235e243.
Hamelin, L., Godbout, S., Theriault, R., & Lemay, S. P. (2010).Evaluating ammonia emission potential from concrete slatdesigns for pig housing. Biosystems Engineering, 105, 455e465.
Hinterhofer, C., Ferguson, J. C., Apprich, V., Haider, H., &Stanek, C. (2006). Slatted floors and solid floors: stress andstrain on the bovine hoof capsule analysed in finite elementanalysis. Journal of Dairy Science, 89, 155e162.
Houba, V. J. G., Van der Lee, J. J., & Novozamsky, I. (1995). Soilanalysis Procedures e Other procedures, Part 5B (6th ed.). TheNetherlands: Wageningen Agricultural University.
IPCC (2007). Climate change 2007. The physical science basis.available at. In S. Salomon, et al. (Eds.), Contribution of workingGroup I to the Fourth Assessment report of the IntergovernmentalPanel on climate Change (pp. 996). Cambridge, UK: CambridgeUniversity Press http://www.ipcc.ch/ipccreports/ar4-wg1.htm978-0-521-70596-7.
Kashyap, D. R., Dadhich, K. S., & Sharma, S. L. (2003).Biomethanation under psychrophilic conditions: a review.Bioresource Technology, 87, 147e153.
Kroodsma, W., Huis in ’t Veld, J. W. H., & Scholtens, R. (1993).Ammonia emission and its reduction from cubicle houses byflushing. Livestock Production Science, 35, 293e302.
Leinker, M., Reinhardt-Hanisch, A., von Borell, E., & Hartung, E.(2007). Application of urease inhibitors in dairy facilities toreduce ammonia volatilization. In G. J. Monteny, & E. Hartung(Eds.), Ammonia emissions in agriculture (pp. 105e107). TheNetherlands: Wageningen Academic Publishers.
Misselbrook, T. H., Pain, B. F., & Headon, D. M. (1998). Estimates ofammonia emission from dairy cow collecting yards. Journal ofAgricultural Engineering Research, 71, 127e135.
Misselbrook, T. H., Webb, J., Chadwick, D. R., Ellis, S., & Pain, B. F.(2001). Gaseous emissions from outdoor concrete yards usedby livestock. Atmospheric Environment, 35, 5331e5338.
Misselbrook, T. H., Webb, J., & Gilhespy, S. L. (2006). Ammoniaemissions from outdoor concrete yards used by livestock e
quantification and mitigation. Atmospheric Environment, 40,6752e6763.
Monteny, G. J., & Erisman, J. W. (1998). Ammonia emissions fromdairy cow buildings: a review of measurement techniques,influencing factors and possibilities for reduction. NetherlandsJournal of Agricultural Science, 46, 225e247.
Moyo, C. C., Kissel, D. E., & Cabrera, M. L. (1989). Temperatureeffects on soil urease activity. Soil Biology & Biochemistry, 21,935e938.
Møller, H. B., Sommer, S. G., & Ahring, B. K. (2004). Biologicaldegradation and greenhouse gas emissions during pre-storageof liquid animal manure. Journal of Environmental Quality, 33,27e36.
Morse, D., Nordstedt, R. A., Head, H. H., & Van Horn, H. H. (1994).Productions and characteristics of manure from lactatingdairy-cows in Florida. Transactions of the ASAE, 37, 275e279.
Morsing, S., Strøm, J. S., Zhang, G., & Kai, P. (2008). Scale modelexperiments to determine the effects of internal airflow andfloor design on gaseous emissions from animal houses.Biosystems Engineering, 99, 99e104.
Mulvaney, R. L. (1996). Nitrogen - inorganic forms. Number 5 inthe Soil Science Society of America Book Series. In D. L. Sparks(Ed.), Methods of soil analysis, Part 3, Chemical methods (3rd ed).(pp. 1123e1184). Madison, USA: SSSA.
Ngwabie, N. M., Jeppsson, K.-H., Nimmermark, S., Swensson, C., &Gustafsson, G. (2009). Multi-location measurements ofgreenhouse gases and emission rates of methane andammonia from a naturally-ventilated barn for dairy cows.Biosystems Engineering, 103, 68e77.
Ni, J. Q., Vinckier, C., Hendriks, J., & Coenegrachts, J. (1999).Production of carbon dioxide in a fattening pig house underfield condition. II. Release from manure. AtmosphericEnvironment, 33, 3697e3703.
Novozamsky, I., Houba, V. J. G., Van Eck, R., & Van Vark, W.(1983). A novel digestion technique for multi-element plantanalysis. Communications in Soil Science and Plant Analysis, 14,239e249.
Pereira, J., Misselbrook, T. H., Chadwick, D. R., Coutinho, J., &Trindade, H. (2010). Ammonia emissions from naturallyventilated dairy cattle buildings and outdoor concrete yards inPortugal. Atmospheric Environment, 44, 3413e3421.
Petersen, S. O., Sommer, S. G., Aaes, O., & Søeggard, K. (1998).Ammonia losses from urine and dung of grazing cattle: effectof N intake. Atmospheric Environment, 32, 295e300.
PNIR (2009). Portuguese National Inventory Report on GreenhouseGases, 1990-2007. Submitted under the United NationsFramework Convention on Climate Change and the KyotoProtocol, Portuguese National Inventory Report (PNIR),Portugal: Portuguese Environmental Agency http://cdr.eionet.europa.eu/.
Saarijarvi, K., Mattila, P. K., & Virkajarvi, P. (2006). Ammoniavolatilization from artificial dung and urine patches measuredby the equilibrium concentration technique (JTI method).Atmospheric Environment, 40, 5137e5145.
Snell, H. G. J., Seipelt, F., & van den Weghe, H. F. A. (2003).Ventilation rates and gaseous emissions from naturallyventilated dairy houses. Biosystems Engineering, 86, 67e73.
Sommer, S. G., Zhang, G. Q., Bannink, A., Chadwick, D.,Misselbrook, T., Harrison, R., et al. (2006). Algorithmsdetermining ammonia emission from buildings housing cattleand pigs and from manure stores. Advances in Agronomy, 89,261e335.
Sullivan, D. M., & Havlin, J. L. (1991). Flow injection analysis ofurea nitrogen in soil extracts. Soil Science Society of AmericaJournal, 55, 109e113.
Swierstra, D., Smits, M. C. J., & Kroodsma, W. (1995). Ammoniaemission from cubicle houses for cattle with slatted and solidfloors. Journal of Agricultural Engineering Research, 62, 127e132.
Trevisi, E., Bionaz, M., Piccioli-Cappelli, F., & Bertoni, G. (2006).The management of intensive dairy farms can be improvedfor better welfare and milk yield. Livestock Science, 103,231e236.
b i o s y s t em s e ng i n e e r i n g 1 0 9 ( 2 0 1 1 ) 1 4 8e1 5 7 157
Related Documents