Investment-Linked Funds For the Financial Year Ended 31 March 2018 ANNUAL REPORT 2018 AmMetLife Insurance Berhad (15743-P) A PIDM member

Welcome message from author
This document is posted to help you gain knowledge. Please leave a comment to let me know what you think about it! Share it to your friends and learn new things together.
Transcript

Investment-Linked FundsFor the Financial Year Ended 31 March 2018
ANNUAL REPORT
2018
AmMetLife Insurance Berhad (15743-P)
A PIDM member

Investment-Linked FundsFor the Financial Year Ended 31 March 2018
ANNUAL REPORT
2018AmMetLife Insurance Berhad headquarters located at
Menara 1 Sentrum, No.201 Jalan Tun Sambanthan, 50470 Kuala Lumpur.
THIS PAGE ISINTENTIONALLY
LEFT BLANK

Investment-Linked FundsFor the Financial Year Ended 31 March 2018
ANNUAL REPORT
2018
Contents
Chairman's Message 05
Corporate Profile 06
Investment-Linked Funds Objective 07
Investment Market Review 11
Investment Outlook 19
Investment Strategy 25
Fund Performance 29
Sectoral and Category Breakdown 41
Comparative Performance Table 51
Summary of Financial Information 59

AmMetLife Insurance Berhad Annual Report for the Investment-Linked Funds Financial Year Ended 31 March 20184
Annual Report for the AmMetLife Insurance Berhad Financial Year Ended 31 March 2018 Investment-Linked Funds
THIS PAGE ISINTENTIONALLY
LEFT BLANK

AmMetLife Insurance Berhad Annual Report for the Investment-Linked Funds Financial Year Ended 31 March 2018 5
Annual Report for the AmMetLife Insurance Berhad Financial Year Ended 31 March 2018 Investment-Linked Funds
Customers are at the heart of everything we do. It is therefore our main priority to add value to the services that we offer in order to support the diverse needs of both existing and potential customers.
Chairman's Message
Dear Valued Policy Holders,
I would like to take the opportunity to express my gratitude for your continued support of AmMetLife. Our growth over the past four decades would not have been possible without all of you, who remain the foundation on which we have built one of the nation’s most well-established insurance companies.
I am proud to announce the continued growth of our investment-linked portfolios for the financial year ended 31 March 2018. The total net asset value of our investment-linked funds is RM117.69 million, a year-on-year growth in Net Asset Value of 12.69%. This financial year, our best performing investment-linked fund was the AmMetLife Dividend Fund, which delivered an exceptional return of 11.79%.
All domestic funds, namely the AmMetLife Equity Fund, AmMetLife Bond Fund, AmMetLife Balanced Fund, AmMetLife Dana Teguh and AmMetLife Dividend Fund – have outperformed their respective benchmarks during the year and since inception. The AmMetLife Dividend Fund and AmMetLife Equity Fund delivered two-year performance growth rates of 17.86% and 16.44%, respectively.
In relation to the feeder funds, our best one-year performing fund was the AmMetLife Global Emerging Market Fund, with one year returns of 7.89% for the financial year 2018. The AmMetLife Global Emerging Market Fund was also our best two-year performer, with performance of 35.60%.
At AmMetLife, customers are at the heart of everything we do. It is therefore our main priority to add value to the services that we offer in order to support the diverse needs of both existing and potential customers. This we intend to accomplish with the help of rapid advancements in technology, which we will utilise to facilitate growth and development, both in our customers’ needs, as well as that of the Company.
As always, you have our assurance that we remain committed to helping our valued customers find the right products to suit your protection needs.
Thank you.
Cho Horng FattChairmanAmMetLife Insurance Berhad

AmMetLife Insurance Berhad Annual Report for the Investment-Linked Funds Financial Year Ended 31 March 20186
Corporate Profile
AmMetLife is a strategic partnership between
AMMB Holdings Berhad (“AmBank Group”) and
MetLife International Holdings LLC (“MetLife”).
AmMetLife offers a comprehensive range of
life assurance and wealth protection solutions
distributed through a combination of over 170
AmBank and AmMetLife branded branch offices,
in addition to the strength of its authorised life
insurance agents nationwide.
The strategic partnership combines the international
expertise and financial strength of MetLife with the
local strength and reach of AmBank Group to create
a customer-centric and modern life assurance
solutions provider in Malaysia.
We are focused on meeting our customers’ diverse
needs with innovative solutions at different stages of
their lives, making it easier and simpler for families
and individuals to achieve financial security and
pursue more from life.
Investment-Linked FundsFor the Financial Year Ended 31 March 2018
ANNUAL REPORT
2018

AmMetLife Insurance Berhad Annual Report for the Investment-Linked Funds Financial Year Ended 31 March 2018
Investment-LinkedFunds Objective
Investment-Linked FundsFor the Financial Year Ended 31 March 2018
ANNUAL REPORT
2018

AmMetLife Insurance Berhad Annual Report for the Investment-Linked Funds Financial Year Ended 31 March 20188
Annual Report for the AmMetLife Insurance Berhad Financial Year Ended 31 March 2018 Investment-Linked Funds
Investment-Linked Funds Objective
1. AmMetLife Equity Fund
The Fund aims to provide the Policyholder with capital appreciation, over the medium to long-term investment horizon, mainly through investments in Malaysian securities with superior growth potential.
Returns will be obtained via growth in unit price rather than income distribution.
2. AmMetLife Bond Fund
The Fund aims to provide the Policyholder with an opportunity to gain higher than the average income earned from fixed deposits, over the long-term investment horizon, mainly through investments in a diversified portfolio of fixed income securities.
Returns will be obtained via growth in unit price rather than income distribution.
3. AmMetLife Balanced Fund
The Fund aims to provide the Policyholder with an opportunity to gain higher than the average income earned from fixed deposits with a lower level of risk as compared to equity funds, over the medium-term investment horizon via exposure in Malaysian equities and/or equity-related securities and fixed income and/or fixed income-related securities.
Returns will be obtained via growth in unit price rather than income distribution.
4. AmMetLife Dana Teguh
The Fund aims to provide the Policyholder with an opportunity to gain higher than the average income earned from fixed deposits with a lower level of risk as compared to equity funds, over the medium-term investment horizon, via exposure in Shariah approved Malaysian equities and/or equity-related securities and Islamic debt and/or debt-related securities.
Returns will be obtained via growth in unit price rather than income distribution.
5. AmMetLife Dividend Fund
The Fund aims to provide the Policyholder with total returns primarily through investments in equities and/or equity-related securities of companies that offer sustainable dividend payments and attractive yields, emphasising on medium to long-term capital appreciation opportunities.
Returns will be obtained via growth in unit price rather than income distribution.
6. AmMetLife Oasis Islamic Equity Fund
The Fund seeks to achieve capital appreciation over the medium to long-term via investments in:
1. AmOasis Global Islamic Equity Fund, a Collective Investment Scheme (CIS) managed by AmFunds Management Berhad. 2. Shariah-approved equities listed on Bursa Malaysia.
Returns will be obtained via growth in unit price rather than income distribution.
7. AmMetLife Global Emerging Market Fund
The Fund seeks to achieve capital appreciation over the long-term horizon through investing mainly in:
1. Global Emerging Market Opportunities Fund, a Collective Investment Scheme (CIS) managed by AmFunds Management Berhad.
2. Equities listed on Bursa Malaysia.
Returns will be obtained via growth in unit price rather than income distribution.

AmMetLife Insurance Berhad Annual Report for the Investment-Linked Funds Financial Year Ended 31 March 2018 9
Annual Report for the AmMetLife Insurance Berhad Financial Year Ended 31 March 2018 Investment-Linked Funds
8. AmMetLife Global Agribusiness Fund
The Fund seeks to achieve capital appreciation over the long-term horizon through investing mainly in a Target Fund: Global Agribusiness Fund, a Collective Investment Scheme (CIS) managed by AmFunds Management Berhad that invests in global agribusiness equities from agricultural commodities to consumer products. Agribusiness is a generic term that refers to the various businesses involved in food production.
Returns will be obtained via growth in unit price rather than income distribution.
9. AmMetLife Precious Metals Fund
The Fund seeks to achieve capital appreciation over the medium to long-term horizon through investing mainly in a Target Fund: Precious Metals Securities Fund, a Collective Investment Scheme (CIS) managed by AmFunds Management Berhad that invests in a portfolio of global Shariah-observant equities and equity-related securities of companies engaged in activities related to gold, silver, platinum or other precious metals.
Returns will be obtained via growth in unit price rather than income distribution.
10. AmMetLife Tactical Bond Fund
The Fund seeks to achieve moderate capital appreciation over the medium to long-term horizon through investing mainly in a Target Fund: AmTactical Bond Fund, a Collective Investment Scheme (CIS) managed by AmFunds Management Berhad, where the Target Fund aims to provide income and to a lesser extent, capital appreciation, by investing primarily in bonds.
Returns will be obtained via growth in unit price rather than income distribution.
11. AmMetLife Asia Pacific REITS Fund
The Fund seeks to achieve moderate capital appreciation over the medium to long-term horizon, investing mainly in a Target Fund: AmAsia Pacific REITS Fund, a Collective Investment Scheme (CIS) managed by AmFunds Management Berhad, where the Target Fund aims to provide regular income and to a lesser extent, capital appreciation over the medium to long-term by investing in real estate investment trusts (REITS).
Returns will be obtained via growth in unit price rather than income distribution.

THIS PAGE ISINTENTIONALLY
LEFT BLANK
Investment-Linked FundsFor the Financial Year Ended 31 March 2018
ANNUAL REPORT
2018

InvestmentMarket Review
Investment-Linked FundsFor the Financial Year Ended 31 March 2018
ANNUAL REPORT
2018

AmMetLife Insurance Berhad Annual Report for the Investment-Linked Funds Financial Year Ended 31 March 201812
Annual Report for the AmMetLife Insurance Berhad Financial Year Ended 31 March 2018 Investment-Linked Funds
Investment Market ReviewAmMetLife Equity Fund, Balanced Fund, Dana Teguh, Dividend Fund, Bond Fund
Equity Market ReviewFor the period under review, 1 Apr 2017 to 31 Mar 2018, KLCI was up 7%.
In the 2nd quarter 2017, KLCI was on mild uptrend. KLCI went up by 1.3% in 2Q17. Ringgit was strengthening against dollar and foreign funds inflows were strong at approximately RM5.1b for 2Q17 alone.
In the 3rd quarter 2017, KLCI was rather flat. This is the quarter where crude oil price started to strengthened when Saudi Arabia has pledged to limit its export at 6.6m barrels a day (bpd) starting Aug 2017, almost 1m bpd lower from a year ago. Hurricane in US, OPEC’s rhetoric to extend production cut to Dec 2018 from Mar 2018, helped to push crude oil price higher. In 3Q17, Brent crude oil price rose 20% q/q to close at US57/bbl.
In the 4th quarter 2017, we saw a minor market correction where KLCI hit the bottom at 1,713 points on 4 Dec 2017. The market was weak in the beginning of the quarter despite stronger-than-expected 3Q17 GDP at 6.2% (2Q17: 5.8%). Ringgit appreciated 5.75% against dollar in the quarter to close at RM4.00 to dollar, aided by strong Brent crude oil price which appreciated by 16% q/q to close at US$66/bbl. Investors’ sentiment changed in Dec 2018, KLCI rose 4.6% m/m, presumably aided by year-end window dressing activity. Strong performance was seen in financials sector as market was expecting Bank Negara interest hike in Jan 2018.
In the 1st quarter of 2018, we saw continuing strong performance of KLCI which started in Dec 17 to record 3.7% gain q/q. KLCI also hit the high of 1,876 points on 22 Mac 2018. Foreigners were strong net buyers, possibly attracted to the appreciating Ringgit. Ringgit broke the psychological level of RM4.00 to dollar in Jan 2018. Continued strength in the crude oil price, which rose 5% q/q to close at US$70/bbl, supported the appreciation of Ringgit. Financial sector was outperforming aided by Bank Negara’s 25 bps OPR hike. Despite the seemingly bullish market tone reflected by KLCI, we also noticed divergence of index performance outside of KLCI. For example, FTSE Bursa Malaysia 70 and FTSE Bursa Malaysia Small Cap Index was down -3% and -12.9% q/q respectively. This may be explained by heightened trade war tension between US-China. US President Trump announced import tariff on steel and aluminum and China responded by imposing import tariff on 128 US products.
Top performing KLCI stocks during the financial year were Nestle (+94%), Press Metal (+63%) and Hong Leong Bank (+36%). Top losers were Astro Malaysia (-27%), Telekom (-18%) and AMMB Holdings (-16%).
Fixed Income Market ReviewDuring the period under review, Malaysia’s real GDP growth recorded a stronger growth of +5.6% YoY in 1Q17, up from +4.5% in 4Q16, on the back of stronger external activities and domestic demand. Thereafter, real GDP recorded a stronger growth of +5.8% YoY in 2Q17, up from +5.6% in 1Q, on the back of stronger external activities and private consumption. In 3Q17, real GDP grew by a stronger +6.2% YoY vs +5.8% in 2Q17, on the back of stronger export growth and overall domestic demand/private investment. This is the key driver for the strengthening of MYR as it reinforced rate hike expectations. Lastly, real GDP grew +5.9% YoY in 4Q17, slightly slower than the +6.2% recorded in 3Q17. The slower pace was dragged down by slower export growth. Full year growth was stellar at +5.9%, the fastest in three years supported by a surge in exports, and resilient domestic demand.
For the whole year of 2017, CPI averaged 3.9%, significantly higher than 2016’s average of 2.1% and at the high end of Bank Negara‘s 3.0%–4.0% guidance. Meanwhile, core inflation remains low and stable at 2.2% YoY in December.
In October, highlights of the budget announcement are as follow:• 2017GDPrevisedupto5.2–5.7% (from4.3–4.8%),onthe
back of better performance in the agriculture, manufacturing and services sectors.
• 2018GDPisforecasttoexpandby5.0–5.5%,drivenbythemanufacturing, construction and services sectors.
• The government remains committed to a gradual fiscalconsolidation, with the deficit target moderating to 2.8% in 2018 (3.0% in 2017).
• Current account surplus estimated to be sustained atRM32.3b or 2.5% of GNI for 2017 and forecast to be marginally higher at RM32.9b or 2.3% of GNI for 2018.
• The 2018 Budget is based on an oil price assumption ofUSD52 per barrel (USD50 in 2017 and current price of ≈USD59).
• GSTcollectionisprojectedtoincreasetoRM43.8b(RM41.5bin 2017).
• Inflationisexpectedtobebenignat2.5–3.5%in2018(3.0–4.0% in 2017).
In the month of November, we noted selling pressure in the bond market due to the hawkish shift in the November MPC statement. Bank Negara hinted that it may consider reviewing the current degree of monetary accommodation given the strength of global and domestic macroeconomic conditions.

AmMetLife Insurance Berhad Annual Report for the Investment-Linked Funds Financial Year Ended 31 March 2018 13
Annual Report for the AmMetLife Insurance Berhad Financial Year Ended 31 March 2018 Investment-Linked Funds
The above came as a surprise to the market. As a result, the MGS/IRS curve steepened across all tenors particularly on the long-end.
With economic data showing the economy on a steady growth path and inflation still at elevated levels, Bank Negara raised its policy rate by 25 basis points during its Monetary Policy Committee (MPC) held on 25 January 2018. The rate hike raised the Overnight Policy Rate (OPR) to 3.25% - the first increase since July 2014.
- by AmFunds Management Berhad
AmMetLife Oasis Islamic Equity Fund Market ReviewFeeder FundAmOasis Global Islamic Equity FundTarget FundOasis Crescent Global Equity Fund
Global equity markets have maintained their strong run in 2017, on the back of improved global macroeconomic conditions and expectations for fiscal reforms. The major equity indices are trading in line or at premium to their long term average valuations. The strong growth expectations for e-commerce related stocks have seen this sector rise substantially over the past year. However, as yields start to increase and normalize from the current low levels, any disappointment on earnings for these companies could result in significant downside. We believe some caution is warranted in these sectors and stock picking will be even more critical to generate long term value. During uncertain times, the market is likely to draw greater distinction between low and high quality companies which should play out favourably for our portfolio positioning.
The global economy entered 2018 with a synchronised upswing firmly underway, driven by improving manufacturing output, trade volumes and commodity prices. In January 2018, the IMF upgraded its forecasts further and now expects global economic growth to firm to 3.9% in both 2018 and 2019, after 3.6% in 2017, a pace comfortably above the 3.2% recorded in 2016, when there were widespread concerns over secular economic stagnation. The synchronised global economic upswing has led to narrower output gaps and, together with higher oil prices, has provided the basis for reflation. However, inflation increases have remained measured suggesting some economic ‘slack’ is still prevalent in key economies. From 0.8% in 2016, the IMF projects inflation in Developed Markets will
average 1.7% in 2018 and 2.1% in 2019, in line with most central bank’s target levels.
Against the backdrop of US economic upswing, the Federal Reserve has raised the Funds Rate six times since December 2015, each by +25 basis points, to reach 1.75% in March 2018. The improving job market has supported growth in disposable income and helped underpin consumer spending. A series of tax cuts have been implemented with a view of boosting investment and employment. As things stand, the plans are unfunded and will over the long-term add significantly to the fiscal deficit.
Global Equity markets extended their strong run into January 2018 supported by the global macro recovery and higher earnings expectations in the US post the tax reforms. The momentum was disrupted in February and market volatility has risen sharply as investors fret over the impact of the US Fed rate hike cycle on funding costs, increasing risk of a trade war emanating from the imposition of trade tariffs by the US and more recently the threat of regulation on mega-tech companies. Despite the recent contraction, most global indices are still trading at close to the long term average on key valuation metrics, driven by technology stocks.
- Source: Oasis Crescent Global Equity- by AmFunds Management Berhad
AmMetLife Global Emerging Market Fund Market Review Feeder FundGlobal Emerging Market Opportunities FundTarget FundSchroders ISF Global Emerging Market Opportunities Fund
Emerging markets (EM) rallied sharply over the 12-month period, supported by accelerating global growth and trade. US dollar weakness was beneficial. Strong performance from technology stocks also made a material contribution performance. This was despite some market volatility towards the end of the period, following the announcement of US trade tariffs. The MSCI Emerging Markets index posted a strong gain and outperformed the MSCI World.
China registered a robust return and was among the best-performing markets, attributable in part due to a sharp rally in technology stocks. Macroeconomic data was broadly stable with GDP growth at 6.8% year-on-year in Q4 showing minimal

AmMetLife Insurance Berhad Annual Report for the Investment-Linked Funds Financial Year Ended 31 March 201814
Annual Report for the AmMetLife Insurance Berhad Financial Year Ended 31 March 2018 Investment-Linked Funds
Investment Market Review (Cont’d)
impact from the authorities’ moves to selectively tighten credit and tackle financial sector risks. The synchronised uptick in global growth was supportive for Hungary and the Czech Republic, both of which outperformed. In the Czech Republic, currency appreciation was a major driver of excess returns, after the central bank removed the cap on the currency’s appreciation relative to the euro. Thailand, and to a lesser extent South Korea also outperformed. Both markets benefited from a firmer external environment which underpinned acceleration in exports. There was a rise in tensions between South Korea and China over the period, linked to the installation of THAAD missiles in South Korea. However, these concerns moderated later in the period, amid rising hopes for improvement in relations with North Korea. This was triggered by President Trump’s commitment to meet with North Korean leader Kim Jong-un, and the latter’s visit to Beijing.
Elsewhere, Brazil’s economy exited recession and policy continued to improve. Inflation maintained a downward trajectory and the central bank continued to reduce headline interest rates, from high levels. Meanwhile, the conviction of former President Luiz Inácio Lula da Silva on corruption charges served to dim the chances of a return to power for the leftist Workers Party in 2018 presidential elections. Improved commodity prices were also supportive. Peru was another market which benefited from stronger commodity prices. This was despite political uncertainty which culminated in the resignation of President Kuczynski in March 2018.
In contrast, Qatari equities were firmly lower, owing to the implementation of an economic and diplomatic blockade by a group of regional countries in June. The UAE underperformed, in part attributable to weakness from Emaar Properties, which disappointed with its special dividend announcement. India finished in positive territory but lagged the index. Lingering effects from demonetisation, combined with uncertainty from a Goods and Services Tax implementation weighed on economic growth. Rising concerns over the country’s twin deficits also contributed to a pick-up in bond yields later in the period.
- Source: Schroders Investment Management Limited (the Target Fund’s investment manager)- by AmFunds Management Berhad
AmMetLife Global Agribusiness Fund Market ReviewFeeder FundGlobal Agribusiness FundTarget FundDWS Global Agribusiness Fund
In the light of the political turmoil in the US, geopolitical tensions in Asia and Middle East as well as monetary policy measures in Europe and the US in 2017 we saw rising prices for many commodities.
While prices of many industrial metals such as copper, aluminum, nickel and zinc rose by more than 20 percent and also the price of oil rose again since summer, the price trend for agricultural commodities has been sobering. In the current calendar year, corn, wheat, coffee, cocoa and sugar have been showing partly clearly negative performance. Farmers' incomes declined in 2017 as well. However, there is also positive news for the agricultural sector: on the one hand, prices for potash, phosphate and nitrogen fertilizers have recovered since the summer months. As a result, share prices rose sharply for many producers. On the other hand, the demand for agricultural commodities is likely to rise: the US dollar continues to weaken as many countries with their currency not pegged to the USD can import agricultural commodities from the US cheaper.
Despite the difficult environment, the fund management achieved an increase in the share value of around 13.7 percent in the reporting period (E share class in USD).
- Source: Deutsche Asset Management (Asia) Limited (the Target Fund’s investment manager)- by AmFunds Management Berhad
AmMetLife Precious Metals Fund Market ReviewFeeder FundPrecious Metals Securities FundTarget FundDeutsche Noor Precious Metals Securities Fund
Leading up to the preliminary round of the French elections on 23rd April 2017, there was widespread belief that Marie Le Pen would take one of the two spots in the final round of voting. This would have marked an embracement by the French people of a populist, anti-establishment candidate and could have put France on the path to eventual exit from the European Union. Tension and risk aversion drove up the price of Gold on

AmMetLife Insurance Berhad Annual Report for the Investment-Linked Funds Financial Year Ended 31 March 2018 15
Annual Report for the AmMetLife Insurance Berhad Financial Year Ended 31 March 2018 Investment-Linked Funds
safe-haven buying and EUR currency hedging. While Le Pen did make it through the first round of voting, she got a smaller share of the vote than feared and her opponent in the second round was the centrist Macron. This was the best possible outcome for markets and for the Euro and the Gold price saw gains from the beginning of the month erased. During May, yields and coincident moves in the Gold price showed an extremely strong negative correlation. Focusing on what drove yields lower, we believe the divergence in the perception of political stability between the US and Europe was a key factor. In the US, the unexpected firing of FBI Director Comey sent shockwaves through the political landscape. The sudden nature of the decision did little to assuage the nerves of investors, especially when combined with the cloud of suspicion already hanging over the Trump administration. In June, Gold posted its first monthly loss following the well anticipated rate hike by the Fed during the middle of the month. Notably, the US dollar also weakened. We would note that diverging political and economic policy climates can drive currencies separate and apart from changes in relative yield spreads and these currency moves can cause distortion when conducting analysis of the Gold price.
During July 2017, price motivators for Gold were varied and their messages mixed. Stronger employment data was offset by stalling inflation and weak retail sales. Such conditions leave “data dependent” policymakers in a precarious position. In order to determine the path of rates, they must first discern which data are indicative of the true state of the economy. The Gold price reflected this uncertainty about where rates and the economy might be headed next, remaining range-bound between $1,200 and $1,300/oz since the end of February. During August the Gold price received dual boosts from 2 main sources: geopolitical risk and an increased sense that the market had the path of future rates correct. North Korea’s sabre-rattling reached new heights during August as the small nation launched a missile over the island of Japan and made their intentions to continue development of full nuclear weapons capability clear. Markets were understandably rattled by the news, and safe-haven assets, such as Gold which saw its second best monthly return of 2017, caught a bid.
Gold also received support from the market’s interpretation of the minutes from the latest FOMC meeting, which conveyed a growing uneasiness about whether the “transitory” low inflation environment was, in fact, transitory. What a difference a month makes. Coming into September, Gold investors were riding high; surfing the dual supportive waves of a heightened
geopolitical risk premium and widespread belief that the Fed’s hands were tied by low and stable inflation, but the events of the month whipsawed the Gold price and drove the metal back below the psychologically important $1,300/oz level.
September marked a sell-off from Gold’s year-to-date peak. Following this major price move, Gold remained under pressure owing to positive developments around tax reforms in the US. The slide was also exacerbated by news out of the EU that policymakers planned to cut the rate of bond purchases, but coincidentally extended the program, causing a sell-off in the EUR and a commensurate increase in the Dollar. Initially, prospects for tax reform looked bleak, but things quickly changed as the political appetite for reform increased. Versions of tax reform that had a chance at actually being passed were hastily assembled as the palatable outcome of higher economic growth and lower taxes contributed to a bipartisan effort. A stronger economy benefits the USD and reinforces the rate hiking cycle by the Fed; both of which are negative for safe-haven assets like Gold. All-in-all, an environment of global synchronous growth and policy normalization contributed to Gold’s range-bound price action throughout most of the fourth quarter. The beginning of December saw much of the same sort of price action in Gold that had been pressuring the market since the September highs. The metal saw steady price weakness and generally poor sentiment while the market waited for a rate hike from the Fed. Immediately following the announcement of the rate hike, the Gold price mounted an impressive recovery as the dual supports of upcoming seasonal strength (early 2018) and the clearing of the rate hike overhang allowed gold to appreciate through year end and gap upwards, ending the month almost +5% from the mid-month trough.
Moving into 2018, Gold appreciated throughout January, ending the month over 3% higher at $1,345/oz. The increase in Gold prices was roughly in-line with the normal seasonal uptick, but there seemed to be additional factors beginning to emerge; the most prominent of which was a shift in focus by market participants toward the return of inflation. Largely absent since the GFC, talk of inflation began to creep into the rhetoric of market participants and central bankers alike. On the market side, the 5-year forward inflation breakeven rate widened ~20bps, signaling investors’ expectations had begun toward level policymakers would consider ‘normal’ and ‘healthy’. This rise marked a swift reversal from the generally tepid inflation expectations that had been present for much of the past 5 years. On the central bankers’ side, the Fed re-iterated its expectation for a gradual increase in inflation

AmMetLife Insurance Berhad Annual Report for the Investment-Linked Funds Financial Year Ended 31 March 201816
Annual Report for the AmMetLife Insurance Berhad Financial Year Ended 31 March 2018 Investment-Linked Funds
Investment Market Review (Cont’d)
toward their 2% target throughout 2018. During the month of February, the Gold price remained anchored in the $1,320–$1,350 range, reflecting, in our view, the balance of risks in the near-to-medium term for the yellow metal. On the upside, green-shoots of inflation began to appear, altering the Dollar’s reaction function to rising nominal rates. On the downside, new Fed chair Powell’s first remarks in front of Congress were taken mawkishly, causing market participants to begin to price in the probability of four rate hikes in 2018. Also of interest was Gold’s (lack of) reaction to the equity market volatility. We believe Gold was a source of liquidity used to meet margin calls, which drove selling and ultimately kept a lid on prices despite the perceived increase in uncertainty. Throughout March, an increase in the Fed target rate and tariffs whipsawed the Gold price in a $40/oz range. The traditional waypoints for the forward path of the Gold price were mixed in March as well, with the USD flat, yields down, inflation breakevens falling and financial conditions tightening. Risks to the upside currently look centered on rising geopolitical and economic risks associated with trade tensions. We are monitoring this situation closely as a shift in the macroeconomic picture in the US could alter our expectations for the Gold price this year.
- Source: Deutsche Asset Management Investment GmbH (the Target Fund’s investment manager)- by AmFunds Management Berhad
AmMetLife Tactical Bond Fund Market ReviewTarget FundAmTactical Bond Fund
The Malaysian government announced its 2018 budget, following are the highlights:• 2017GDPisrevisedupto5.2–5.7%(from4.3–4.8%),onthe
back of better performance in the agriculture, manufacturing and services sectors.
• 2018GDPisforecasttoexpandby5.0–5.5%,drivenbythemanufacturing, construction and services sectors.
• The government remains committed to a gradual fiscalconsolidation, with the deficit target moderating to 2.8% in 2018 (3.0% in 2017).
• Exports growth expected to jump 16.6% to RM917.5b for2017, supported by strong demand in manufactured goods and commodities. This would normalize to 3.4% in 2018.
• Current account surplus estimated to be sustained atRM32.3b or 2.5% of GNI for 2017 and forecast to be marginally higher at RM32.9b or 2.3% of GNI for 2018.
• Revenuegrowthof6.5%(6.1%in2017)balancedbya6.5%increase in operating expenditure, while development expenditure remains unchanged.
• The 2018 Budget is based on an oil price assumption ofUSD52 per barrel (USD50 in 2017 and current price of ≈USD59).
• GSTcollectionisprojectedtoincreasetoRM43.8b(RM41.5bin 2017).
• Inflationisexpectedtobebenignat2.5–3.5%in2018(3.0–4.0% in 2017).
• 2%pointreductioninRM20,000–70,000personal incometax band, translating to about RM1.5b of foregone revenue.
Malaysia’s labour force grew by 2.2% YoY to 15.1m in October while unemployment rate remains at a healthy level 3.4%. Due to the strong economic performance in the past year, jobs creation has been steadily gaining momentum and thus outpacing unemployment growth since March 2017. Finally, the Government announced that it has agreed to provide RM929.4m for the subsidy and rebate of 1.80sen/kWh for the period of Jan 1 to June 30, 2018, hence sparing consumers the potential of an electricity rate hike for the next six months.
BNM raised its policy rate by 25 basis points during its Monetary Policy Committee (MPC) held on 25 January 2018. The rate hike raised the Overnight Policy Rate (OPR) to 3.25% - the first increase since July 2014. In its statement following the rate hike BNM stated that the OPR hike was not monetary tightening but rather normalisation of the degree of monetary accommodation. It further added that the MPC wants to pre-emptively ensure that the policy stance is appropriate, to prevent a build-up of risks that could arise from interest rates being too low for too long.
Malaysia’s 4Q17 GDP was released. Real GDP grew 5.9% YoY, slightly slower than the 6.2% recorded in 3Q17. The slower pace was dragged down by slower export growth. Full year growth was stellar at 5.9%, the fastest in three years supported by a surge in exports, and resilient domestic demand. Full year current account (“CA”) surplus in the balance of payment remained healthy at RM40.3 billion or 3% of GDP (2.4% GDP 2016).
- by AmFunds Management Berhad

AmMetLife Insurance Berhad Annual Report for the Investment-Linked Funds Financial Year Ended 31 March 2018 17
Annual Report for the AmMetLife Insurance Berhad Financial Year Ended 31 March 2018 Investment-Linked Funds
AmMetLife Asia Pacific REITS Fund Market ReviewTarget FundAmAsia Pacific REITS Fund
Outlook turned more positive at the start of 2Q17 with the IMF upgrading its 2017 global GDP forecast to 3.5% from 3.1% on stable economic recovery, global trade turning around due to destocking, as well as corporates starting to raise production. Some geopolitical uncertainty was lifted with the victory of Macron in the French presidential elections, allaying concerns of a breakdown of the EU. Trump announced a plan to reduce corporate tax to 15% from 35% and the US Fed pulled the trigger on a second interest rate hike in June. However, sentiment started to turn due to geopolitical risks as well as concerns of the impact of global bank monetary policy normalization.
In July, the US Fed expressed its expectation to reduce its balance sheet beginning this year, while the IMF cut its US growth forecast to 2.1%. Bank of China hiked interest rates by 25bps to 0.75%, the first time in 7 years. Europe PMI rose to 57.4, a 6-year high. Geopolitical tensions heightened in August due to North Korea.
In September 2017, the IMF raised its global GDP forecast from +3.6 in 2017 and +3.7% in 2018. US unemployment hit a 17-year low at 4.2%. EU investor confidence was at a 10yr high even as Draghi reiterated ECB will continue to buy “sizeable amounts of corporate bonds” supporting credit & peripheral assets more generally. PM Abe’s LDP election win in Japan gave him control of 2/3rds of the lower house. In October the AUD weakened against the USD. Japan REITs continued to face selling pressure from domestic investment trusts although this was to some extent offset by foreign as well as ETF buying. Singapore REITs +2.5% with Office being the best performer during the month.
All eyes were on the US Tax Code changes in November. Yellen confirmed she will leave the US Fed board in February 2018 when Jerome Powell takes over as Chairman. It was also a better month for regional REITs as the sector rebounded.
2017 closes with a number of surprises as global markets continued to trend higher despite concerns on headwinds from political uncertainty (Trump as US President), US Fed rate hikes, election risks in Eurozone, in addition to geopolitical tensions in North Korea and the Middle East. The global market was well supported by:1. the robust economic growth across the globe;2. stronger corporate earnings, especially from the
technology sector; 3. recovery of oil prices;4. low inflation and interest rate environment; and
5. strong job market which boosted consumer confidence, underpinning the recovery of consumption.
The US Fed left its benchmark interest rate unchanged in January attributable to the economy growing at ‘a solid rate’ and the job market continuing to gain strength.
Global markets went through a volatile session in the month of February 2018 due to nervous investors selling on key concerns being:1. an overheating US economy (risk of more rate hikes);2. higher inflation expectations; and3. possibility of a global trade war. Regional REITs were sold down on as US yields spiked.
During the month of March 2018, Trump announced 25% steel and 10% aluminum tariffs which exacerbated market volatility. Trump and Kim planned to meet by May to discuss the denuclearisation of Korea. ECB President Mario Draghi announced the phasing out of monthly asset purchases by the end of 2018. EU 2017 GDP +2.3%. Japan Q4 GDP revised +1.1 to +1.6%. Governor Kuroda said the BoJ will start pondering a stimulus exit in 2019. JPY broke through the 105.00 level for the 1st time since Nov 2016. China exports jumped 45% yoy, whilst imports grew 6%, leaving a USD33b trade surplus.
The US equity market went through a tumultuous time in April 2018 on the back of the escalating fears of trade wars between the US and China. This was triggered by the US government consideration in imposing an additional USD100b in tariffs on China products, after China implemented retaliatory tariffs of up to 25% on USD3b in food imports from the US. Nevertheless, Chinese President’s relatively conciliatory stance and his pledge to further open the economy to foreign competition helped to tame the market. In addition, the anticipated robust earnings season and the ending of the fear of a full blown war between Syria and Russia also somewhat reinstated investors’ confidence. On the flipside, this was mitigated by some positives, being:1. a pullback in the market with 10-Year Treasury note yields
rising above the 3 percent threshold (its highest since January 2014);
2. the optimism on improving economic growth, with preliminary reading of US first quarter GDP showing an increased annualized rate of 2.3%; and
3. the upbeat corporate earnings releases.
Investors were also found some reprieve in easing tensions between North and South Korea. For the month, Dow Jones Industrial Average Index closed marginally positive by 0.25%.
- by AmFunds Management Berhad

AmMetLife Insurance Berhad Annual Report for the Investment-Linked Funds Financial Year Ended 31 March 201818
THIS PAGE ISINTENTIONALLY
LEFT BLANK
Investment-Linked FundsFor the Financial Year Ended 31 March 2018
ANNUAL REPORT
2018

AmMetLife Insurance Berhad Annual Report for the Investment-Linked Funds Financial Year Ended 31 March 2018
Investment Outlook
Investment-Linked FundsFor the Financial Year Ended 31 March 2018
ANNUAL REPORT
2018

AmMetLife Insurance Berhad Annual Report for the Investment-Linked Funds Financial Year Ended 31 March 201820
Annual Report for the AmMetLife Insurance Berhad Financial Year Ended 31 March 2018 Investment-Linked Funds
Investment OutlookAmMetLife Equity Fund, Balanced Fund, Dana Teguh, Dividend Fund, Bond Fund
Equity Market OutlookThe global market volatility continued in March 2018 since it started in early February this year, which has spilled over to the local market sentiment. During the month, there was a clear switch in local market interest where investors were moving from smaller cap/speculative stocks to mid-large cap/defensive stocks to ride through this volatile period. Foreign fund flows continued to be weak where March’s net outflow was RM61 mil although YTD it was RM2.2 bil of net inflow. Market remained cautious during the month mainly due to:1. Trump’s announcement on the import tariff decision on steel
and aluminum;2. concerns over increased trade protectionism on the sudden
dismissal of US Secretary of State, Rex Tillerson who is a free trade advocate; and
3. additional tariffs on Chinese goods announced by US was reciprocated by China’s proposed tariffs on 128 US products that could lead to a trade war.
On a m-o-m basis, the KLCI closed slightly higher and this has brought KLCI to be the best performing index in USD term YTD in the region.
Fixed Income Market OutlookAs widely expected the U.S. Federal Reserve increased the federal funds by rate by 25bps during its March 2018 meeting. In its statement, the Feds continued to signal a total of 3 hikes for 2018, increased GDP forecast for 2018 to 2.7% from 2.5% and maintained forecast inflation at 1.9%. Despite the rate hike, the Fed’s statement was less hawkish than market expectations with the USD falling by 0.65% and the 10 year UST yield declining 6bps in overnight trading.
Concerns of a trade war loom over the market after the US announced planned tariffs of imports from China. These tariffs follow the imposition of tariffs on Chinese steel and aluminum by the US which led China to reciprocate by imposing tariffs on American imports to China. The subdued inflationary environment and downside risk to trade should support global bond yields.
On the domestic front BNM’s expectation of sustained economic growth and declining inflation means that monetary policy is not expected to deviate significantly from its current state.
- by AmFunds Management Berhad
AmMetLife Oasis Islamic Equity Fund Market OutlookFeeder Fund AmOasis Global Islamic Equity FundTarget Fund Oasis Crescent Global Equity Fund
The global economy faces a number of key risks going forward. Most importantly, the normalisation of monetary policy in developed markets, in particular the US, may cause a faster than expected tightening of global financial conditions, which could impact market valuations and increase market volatility. Different segments of the market perform differently in a rising interest rate environment making it important to distinguish cyclical and defensive positioning as well as choices on rate-sensitive sector preferences. Steps by the US President to add tariffs on steel and aluminum imports has led to corresponding measures by the Chinese authorities, leading to fears of an escalating ‘tit-for-tat’ trade war. In addition, China’s high level of corporate indebtedness and lack of transparency on local government balance sheets also poses a key risk to its economy and, by extension, the global economy, implying market volatility could persist.
Given this backdrop, we believe some caution is warranted going forward and stock picking will be even more critical to generate long term value. During uncertain times, the market is likely to draw greater distinction between low and high quality companies which should play out favourably for our portfolio positioning.
WEIGHTED
HIGHQUALITY TRADING AT A DISCOUNT TO THE MARKET AT LOW
RISK
ROAE PE EV/EBITDA DY
FCF YIELDND/EBITDA BETA
* *
OASIS CRESCENT GLOBAL EQUITY MODEL PORTFOLIO
25.9 14.3 9.5 3.1 7.0 0.5 0.9
DJIM INDEX 16.1 23.0 13.3 1.9 4.2 0.4 1.0
Source: Oasis Research; Bloomberg: March 2018
Since inception of the Oasis Crescent Global Equity fund, we have constantly maintained a Beta less than that of the DJIM, illustrating that the fund's market-related risk has been kept lower. The portfolio offers significantly higher sustainable Return on Equity than the DJIM while trading at substantially discounted valuations across most metrics. In addition to our portfolio’s attractive valuations, a considerable number of

AmMetLife Insurance Berhad Annual Report for the Investment-Linked Funds Financial Year Ended 31 March 2018 21
Annual Report for the AmMetLife Insurance Berhad Financial Year Ended 31 March 2018 Investment-Linked Funds
companies in our portfolio are involved in share buybacks, which implies that a change in sentiment from growth to value could result in a significant upside opportunity for the portfolio. Companies in our portfolio have strong balance sheets which should provide downside protection in a normalizing interest rate environment while strong free cash flow yields should allow for value enhancing opportunities to be pursued. We are confident that our portfolio is well positioned to provide attractive risk adjusted returns for our clients over the long-term.
- Source: Oasis Crescent Global Equity - by AmFunds Management Berhad
AmMetLife Global Emerging Market Fund Market Outlook Feeder Fund Global Emerging Market Opportunities FundTarget Fund Schroders ISF Global Emerging Market Opportunities Fund
Global growth appears relatively well supported, despite some signs of a moderation in momentum. The outlook for emerging growth remains positive, though we expect modest deceleration in the pace of economic growth in China, from a high level. Most emerging economies are mid-cycle and we expect healthy growth to continue to support an on-going recovery in corporate earnings and return-on-equity. It is still our expectation that earnings will lead market performance in 2018. Market valuations in aggregate are in line with their long term average on price-book and attractive on 12.6x forward price-to-earnings ratio (PER), a discount of close to 22% to the MSCI World.
Two of our risks for 2018 have been developed market monetary policy normalisation and trade conflict. Both persist, with the US late cycle and moving into fiscal stimulus, and with a notable deterioration in sentiment regarding trade protectionism as a result of recent US action. NAFTA also remains an outstanding issue. We constantly reassess our core view to evaluate the extent to which either of these two key issues could impact growth and earnings expectations. Domestic politics and geopolitics are further areas to monitor, in particular upcoming elections in Mexico and Brazil, and potential positive policy action in South Africa.
Russia is also a key country to watch. Following the announcement of new US sanctions on Russia on 6 April, the Russian equity market and the rouble have been volatile, and the environment remains fluid and uncertain. The actions taken by the US represent a material escalation in geopolitical risk. Alleged chemical attacks by the Assad government, which is backed by Russia, in Syria have also increased this risk. We cannot accurately forecast the next steps, but in our experience Russian equities can often overreact in the near term to negative news flow due to the lack of a natural local buyer given the country’s immature pension/asset management industry.
In April, we added Poland to our core market list. The outlook for economic growth is robust and we have identified a number of strong bottom-up opportunities. We also reduced risk in Russia by lowering the size of the relative overweight position. We will continue to analyse the situation and our position on an on-going basis.
In Hungary, the macroeconomic environment remains supportive and valuations are reasonable. In South Korea, geopolitical and trade risks are on-going. However, the market offers attractive valuations and corporate governance continues to improve. In Russia, the latest US sanctions have likely lifted the risk premium for the Russian market on a sustained basis but the gradual economic rebound should remain intact and valuations look cheap, especially after the recent sell-off. In Greece, economic recovery is on-going and valuations are attractive.
We are currently finding strong bottom-up ideas in the non-core markets, notably China but also South Africa and Brazil. We have also identified stock opportunities in Pakistan and Egypt.
- Source: Schroders Investment Management Limited (the Target Fund’s investment manager)- by AmFunds Management Berhad

AmMetLife Insurance Berhad Annual Report for the Investment-Linked Funds Financial Year Ended 31 March 201822
Annual Report for the AmMetLife Insurance Berhad Financial Year Ended 31 March 2018 Investment-Linked Funds
Investment Outlook (Cont’d)
AmMetLife Global Agribusiness Fund Market OutlookFeeder Fund Global Agribusiness FundTarget Fund DWS Global Agribusiness Fund
For five years weak overall grain markets have capped farmers’ income which translates into higher competition among farmer suppliers (fertilizers, seeds, machinery, etc.) for a higher share of a shrinking pie. This continues to be a drag on the core sector. More promising, the latest USDA Prospective Planting report suggest a decline in US acres for soybeans and corn, which will support pricing going forward. A weaker USD versus last year is helping; we have seen stronger US exports this season. Also we see grain prices picking up as of lately which could be a sign for a slowly recovering Agriculture sector. Corn is trading around $4, which is the highest level since June 2016.
While there is no urgency to get exposed to the core segment, it certainly appears to bottom out which could eventually turn into a decent cycle after the declines over the last few years. But even without, the broadened investment horizon of the fund provides other opportunities in more remote sectors: Food delivery, precision farming, higher value animal feed ingredients or aquaculture are less to even negatively correlate with the traditional Agribusiness and should therefore perform independently of commodity prices.
- Source: Deutsche Asset Management (Asia) Limited (the Target Fund’s investment manager)- by AmFunds Management Berhad
AmMetLife Precious Metals Fund Market OutlookFeeder Fund Precious Metals Securities FundTarget Fund Deutsche Noor Precious Metals Securities Fund
Path of real rates remains muddy A tone of policy normalization has become prevalent across much of the globe. The steady march away from unconventional monetary policy is already well underway in the US and has begun to enter the rhetoric in the EU. Meanwhile, in Japan, years of loose monetary have cast off the threat of deflation
and resulted in rising consumer confidence and GDP. This all points to an environment of rising nominal yields, which would ordinarily be negative for Gold.
However, recently the market has seen a shift in inflation expectations that could keep real rates depressed despite nominal increases in yields as global central bankers normalize policy. It is of the utmost importance for Gold investors to monitor the relationship between nominal yields (e.g. Treasuries), inflation expectations (e.g. forward TIPS breakeven), the USD and realized inflation. We see the risks to real rates as roughly balanced at this point, informing our somewhat muted views on the Gold price this year.
The current rate environment has been extremely constructive for Gold. Even if the Fed follows through with their intended rate hikes this year, nominal interest rates in the United States will still be at historic lows and real rates will be at the lowest levels since the 1980’s.• Intheshortrun,heightenedmarketuncertaintyshouldkeep
the Gold price bid as investors’ demand for safe-haven assets meets a relatively fixed supply.
• Over the long-term, we have entered an era ofunprecedented negative nominal rates which has served to remove a key impediment to holding Gold (“it doesn’t pay a yield), strengthening the fundamental case for long-term appreciation in the Gold price.
We believe Gold represents the cleanest and most effective way to gain safe-haven exposure and that we should continue to see support for the yellow metal as long as uncertainty remains.
- Source: Deutsche Asset Management Investment GmbH (the Target Fund’s investment manager)- by AmFunds Management Berhad

AmMetLife Insurance Berhad Annual Report for the Investment-Linked Funds Financial Year Ended 31 March 2018 23
Annual Report for the AmMetLife Insurance Berhad Financial Year Ended 31 March 2018 Investment-Linked Funds
AmMetLife Tactical Bond Fund Market OutlookTarget Fund AmTactical Bond Fund
As widely expected the Federal Reserve increased the federal funds by rate by 25bps during its March 2018 meeting. In its statement the Fed continued to signal a total of 3 hikes for 2018, increased GDP forecast for 2018 to 2.7% from 2.5% and maintained forecast inflation at 1.9%. Despite the rate hike the Fed’s statement was less hawkish than market expectations with the USD falling by O.65% and the 10 year UST yield declining 6bps in overnight trading.
Concerns of a trade war loom over the market after the US announced planned tariffs of 25% on USD 50b of imports from China. These tariffs follow the imposition of tariffs on Chinese steel and aluminum by the US which led China to reciprocate by imposing tariffs on USD 3b of American imports to China. The subdued inflationary environment and downside risk to trade should support to global bond yields.
On the domestic front BNM’s expectation of sustained economic growth and declining inflation means that monetary policy is not expected to deviate significantly from its current state.
- by AmFunds Management Berhad
AmMetLife Asia Pacific REITS Fund Market OutlookTarget Fund AmAsia Pacific REITS Fund
Global investors continue to monitor the progress of trade talks between the US and China, as well as that of relations between North and South Korea following the summit at end-April 2018; on a related note, the outcome of the North Korea-US talks scheduled to take place in Singapore on 12th June 2018 would also be on the radars of investors.
In addition to this, investors will continue to monitor economic data in the US as a precursor to monetary policy decisions made by the Federal Reserve, which guided for 3 rate hikes for 2018.
While the market may take rate hikes as negative news for REITs, we believe that the rate hikes as a positive read-through on economic growth should be positive for REITs. This being economic growth would underpin rental rate growth, thus offsetting the impact of higher interest rates. Furthermore, the REITs have well-managed balance sheets with staggered debt maturity profiles as well as high fixed debt ratios, mitigating the impact of higher rates to distributions.
- by AmFunds Management Berhad

AmMetLife Insurance Berhad Annual Report for the Investment-Linked Funds Financial Year Ended 31 March 201824
THIS PAGE ISINTENTIONALLY
LEFT BLANK
Investment-Linked FundsFor the Financial Year Ended 31 March 2018
ANNUAL REPORT
2018

AmMetLife Insurance Berhad Annual Report for the Investment-Linked Funds Financial Year Ended 31 March 2018
Investment Strategy
Investment-Linked FundsFor the Financial Year Ended 31 March 2018
ANNUAL REPORT
2018

AmMetLife Insurance Berhad Annual Report for the Investment-Linked Funds Financial Year Ended 31 March 201826
Annual Report for the AmMetLife Insurance Berhad Financial Year Ended 31 March 2018 Investment-Linked Funds
Investment StrategyAmMetLife Equity Fund, Balanced Fund, Dana Teguh, Dividend Fund, Bond Fund
Equity Investment StrategyAlthough global markets are expected to remain volatile in the near term, we remain cautiously optimistic on the local front due to the following reasons: 1. Continuing strong macro-economic data – BNM recently
projected GDP growth for 2018 at 5.5% to 6.0%;2. Stronger Ringgit outlook – this will provide cost savings to
certain local corporates and encourage foreign fund flows;3. Oil price recovery – a clear-cut beneficiary for a net export
country like Malaysia which will boost government revenues and improve fiscal balance;
4. Election sentiment boost – given that during the three of the past four election years, KLCI had risen in the 12-month period leading elections; and
5. Cheapest market in terms of valuation relative to its peers in ASEAN market except Singapore.
Fixed Income Investment StrategyGiven the robust market liquidity, supportive MGS market and attractive spreads for lower rated papers we foresee a greater number of lower rated corporate issuers tapping the market. In the near term, the rising global interest rate environment and impending general election remains the key factors that could influence the direction of the market.
For duration strategy, we were overweight from neutral against benchmark. Our revision was premised on the softer domestic inflationary outlook going forward, the stronger MYR amidst a weak USD and the downside risks to global environment. Whilst we do not expect a major rally in MGS yields we opine that domestic yields will remain well supported. In a relatively stable yield environment a longer duration strategy allows us to reap higher yields typically offered by longer dated bonds.
For Balanced Fund and Dana TeguhIn view of our market outlook above, we will keep the asset allocation in the fixed income to its minimal and overweight equities.
- by AmFunds Management Berhad
AmMetLife Oasis Islamic Equity Fund Investment StrategyFeeder Fund AmOasis Global Islamic Equity FundTarget Fund Oasis Crescent Global Equity Fund
The objective of the Oasis Crescent Global Equity Fund is to achieve medium to long-term growth of capital and income by
investing in shares, including preference shares, of companies and shares or units in collective investment schemes and real estate investment trusts (“REITS”) listed and traded on the international stock exchanges and on markets, set out in the Prospectus and that are Shariah compliant according to the guidelines set by the Investment Manager’s Shariah Advisory Board. Oasis Crescent Global Equity Fund’s objective is to protect the real wealth and improving the standard of living of all investors. The Fund targets to provide attractive risk adjusted returns to our clients, which is driven by our instrument selection based on quality and value and ensuring that the portfolio is appropriately diversified. One of the key attributes of our philosophy is to provide significant downside protection relative to the market based on our quality and valuation selection criteria. This is one of the key drivers of outperformance and wealth creation over the long term.
We have maintained our investment philosophy of investing in high quality companies which have strong competitive advantages and the ability to leverage off those competitive advantages to deliver a higher level of sustainable Return on Equity (ROE) through the economic cycle. We believe that companies which have healthy balance sheets and strong cash flows have the ability to sustain themselves during challenging economic environments while delivering real earnings growth over the long-term. Our portfolio trades at a significant discount to the global equity market across various measures and provides sustainably higher ROE through the economic cycle.
This should result in real wealth creation for our clients over the long term. Furthermore, given the current interest rate environment, we believe earnings for large-cap cash flush companies are understated due to almost negligible returns on their cash balances. As economic conditions and interest rates start to normalize, these companies stand to benefit while higher leveraged companies will struggle as their funding costs increase. Companies in our portfolio have a sustainable long term competitive advantage in a form of a lower weighted average cost of capital due to their strong free cash flow generations.
- Source: Oasis Crescent Global Equity - by AmFunds Management Berhad

AmMetLife Insurance Berhad Annual Report for the Investment-Linked Funds Financial Year Ended 31 March 2018 27
Annual Report for the AmMetLife Insurance Berhad Financial Year Ended 31 March 2018 Investment-Linked Funds
AmMetLife Global Emerging Market Fund Investment StrategyFeeder Fund Global Emerging Market Opportunities FundTarget FundSchroders ISF Global Emerging Market Opportunities
Our core markets at the beginning of the period were Brazil, Russia, South Korea and Hungary. We removed Brazil from our core markets list in January 2018 and added Greece. In Brazil, the economy continues to recover and we expect on-going uplift in earnings, but valuations in certain cases do not sufficiently compensate for political risk relating to an uncertain outcome of elections in October. In Greece, valuations are cheap and there is an opportunity for a recovery in the economy.
- Source: Schrorders Investment Management Limited (the Target Fund’s investment manager)- by AmFunds Management Berhad
AmMetLife Global Agribusiness Fund Investment StrategyFeeder Fund Global Agribusiness FundTarget FundDWS Global Agribusiness Fund
Worldwide, the stocks of most agricultural commodities are currently relatively well filled. The past years have been good years of harvest, reflected in falling prices for corn, wheat and soybeans. However, the weakness of the US dollar in recent months may favor higher demand for agricultural commodities and exports of corn and soybeans from the United States. The prices of many agricultural commodities are currently close to their cost of production, so that farmers should not receive a price incentive for an area expansion and thus should only increase the supply in the next harvest cycle limited.
For some months, however, an increase in fertilizer prices of nitrogen products has been observed. We expect this trend to continue long term and stocks of nitrogen fertilizer producers should benefit from it.
In the future, we expect positive signals from subsections of specialty chemicals. For example, from our point of view, prices for methionine, a feed supplement, have potential for recovery after a low has been reached during the summer. In this context, selected companies in the field of life sciences with a high degree of specialization seem promising.
Whether the above-mentioned trends will have a positive impact in 2018 remains to be seen. As a result, we will continue to pursue a "balanced" approach in the portfolio between upstream and downstream companies.
One of the strongest drivers in this sector is the global population growth. Although long-term forecasts appear to be uncertain with regard to the specifics, it is undisputed that the global population continuously grows. This development, in addition to high population growth in emerging markets, is also helped by a noticeable improvement of medical care. The potential imbalance between food supply and demand is still a central aspect, even more than ten years after the implementation of the fund. Up to now, crop production has been successfully and steadily ramped up due to new research and technological progress. In addition to population growth, however, increasing wealth also leads to changes on the demand side. Particularly dietary changes cause high challenges.
Here are three examples:1. Higher meat consumption: an increasing number of people
- particularly in Asia - consume more meat. Breeding animals accordingly requires a steady increase of animal feed. Unfortunately, this is required in a much higher proportion than the resulting quantity of meat.
2. Organic food: an increasing number of people is wealthy and show higher preference for organic food. Production of organic food requires much more effort than production of conventional food, as, for example, using crop protection is not possible so that plants have higher exposure to pests and weather effects. Accordingly, harvest yields are lower.
3. Food Delivery: The number of online platforms that allow consumers to conveniently order food from their favourite restaurant from home has increased significantly in recent years. Since this trend in the USA has been an integral part of new digital services for some time now, providers have recently gained considerable attention in Europe as well. In 2017, for example some companies already ventured to go public. Above all, they benefit from an increase in single households (currently approx. 40 in percent Germany) and the possibility of offering a broad culinary selection via the platform.
These are only a few examples highlighting the complexity of the agricultural business.
- Source: Deutsche Asset Management (Asia) Limited (the Target Fund’s manager)- by AmFunds Management Berhad

AmMetLife Insurance Berhad Annual Report for the Investment-Linked Funds Financial Year Ended 31 March 201828
Investment Strategy (Cont’d)
AmMetLife Precious Metals Fund Investment StrategyFeeder Fund Precious Metals Securities FundTarget FundDWS Noor Precious Metals Securities Fund
Continued focus on execution, flexibility and valuationWe continue to keep the fund invested in companies with strong management teams that have shown the ability to execute with operational stability and have a lower than average financial and operational risk profile. We believe this approach will generate alpha through the entire price cycle. However, deploying this approach does leave the fund underexposed to firms with extreme levels of operational and financial leverage. As such, the fund may underperform in the short term, during periods with elevated upward Gold price volatility.
We believe our approaches will more than make up for the lack of gearing to the Gold price in environments with elevated volatility through company specific re-ratings. As portfolio firms demonstrate the increase in overall production level and financial flexibility that accompany exiting the heavy spending portion of the capex cycle, we believe investors will respond by increasing valuations relative to peers, driving alpha.
- Source: Deutsche Asset Management Investment GmbH (the Target Fund’s investment manager)- by AmFunds Management Berhad
AmMetLife Tactical Bond Fund Investment StrategyTarget FundAmTactical Bond Fund
For duration strategy, we are changing our strategy to overweight from neutral against benchmark. Our revision is premised on the softer domestic inflationary outlook going forward, the stronger MYR amidst a weak USD and the downside risks to global environment. Whilst we do not expect a major rally in MGS yields we opine that domestic yields will remain well supported. In a relatively stable yield environment a longer duration strategy allows us to reap higher yields typically offered by longer dated bonds.
- by AmFunds Management Berhad
AmMetLife Asia Pacific REITS Fund Investment StrategyTarget FundAmAsia Pacific REITS Fund
We continue to be overweight Singapore relative to the benchmark due to the improvement in global macro fundamentals as well as sector fundamentals e.g. sustained growth in demand and rental rates for office. In addition, the geographical and segment diversification initiatives undertaken by some of the larger REITs recently would help the REITs to benefit from the up cycles in property markets elsewhere, rather than entirely hinge on the dynamics within Singapore.
We remain positive on Australia barring unforeseen circumstances as we believe there is another year for growth in the office and warehouse segments due to supply constraints in Sydney and Melbourne which are being positively reflected in rental rate growth.
The allocation to Japan will continue to be underweight relative to the benchmark partly due to the volatile nature of the JPY in addition. While physical property market fundamentals are intact (tight supply + sustained demand) underpinning rental rate growth, namely in the office segment, sector performance has proven to be flow-driven. On that note, foreign investor interest in the JREIT sector has returned along with inflows from JREIT ETFs. We continue to be selective with a strong preference for asset quality, growth prospects as well as strong corporate governance.
By and large, investors are decidedly more skittish this year thus far for a plethora of reasons, ranging from concerns on interest rate hikes in the US to geopolitical risks in North Asia to policy risks as the details on the trade tariffs implemented by Trump play out. As such, the house call is to keep equity weighting on the lower side i.e. 80–90% until the risks have abated. That being said, the volatility is proving to be an opportunity to add to favoured positions at better valuations.
- by AmFunds Management Berhad
Investment-Linked FundsFor the Financial Year Ended 31 March 2018
ANNUAL REPORT
2018

AmMetLife Insurance Berhad Annual Report for the Investment-Linked Funds Financial Year Ended 31 March 2018
Fund Performance
Investment-Linked FundsFor the Financial Year Ended 31 March 2018
ANNUAL REPORT
2018

AmMetLife Insurance Berhad Annual Report for the Investment-Linked Funds Financial Year Ended 31 March 201830
Annual Report for the AmMetLife Insurance Berhad Financial Year Ended 31 March 2018 Investment-Linked Funds
AmMetLife Equity Fund
Since Inception Performance
AmMetLife Equity Fund vs BenchmarkPerformance since 27 February 2004 – 31 March 2018
Full Year Performance
AmMetLife Equity Fund vs BenchmarkPerformance since 1 April 2017 – 31 March 2018
Fund Performance
Mar
-04
Mar
-05
Mar
-06
Mar
-07
Mar
-08
Mar
-09
Mar
-10
Mar
-11
Mar
-12
Mar
-13
Mar
-14
Mar
-15
Mar
-16
Mar
-17
Mar
-18
Perf
orm
ance
(%)
Month
150.00
120.00
90.00
60.00
30.00
0.00
-30.00
AmMetLife EquityFBMKLCI
Apr
-17
May
-17
Jun-
17
Jul-1
7
Aug
-17
Sep-
17
Oct
-17
Nov
-17
Dec
-17
Jan-
18
Feb-
18
Mar
-18
Perf
orm
ance
(%)
Month
15.00
12.00
9.00
6.00
3.00
0.00
-3.00
AmMetLife EquityFBMKLCI

AmMetLife Insurance Berhad Annual Report for the Investment-Linked Funds Financial Year Ended 31 March 2018 31
Annual Report for the AmMetLife Insurance Berhad Financial Year Ended 31 March 2018 Investment-Linked Funds
AmMetLife Bond Fund
Since Inception Performance
AmMetLife Bond Fund vs BenchmarkPerformance since 27 February 2004 – 31 March 2018
Full Year Performance
AmMetLife Bond Fund vs BenchmarkPerformance since 1 April 2017 – 31 March 2018
Mar
-04
Mar
-05
Mar
-06
Mar
-07
Mar
-08
Mar
-09
Mar
-10
Mar
-11
Mar
-12
Mar
-13
Mar
-14
Mar
-15
Mar
-16
Mar
-17
Mar
-18
Perf
orm
ance
(%)
Month
90.00
70.00
50.00
30.00
10.00
-10.00
AmMetLife BondMBB 12mth FD rates
Apr
-17
May
-17
Jun-
17
Jul-1
7
Aug
-17
Sep-
17
Oct
-17
Nov
-17
Dec
-17
Jan-
18
Feb-
18
Mar
-18
Perf
orm
ance
(%)
Month
4.00
3.00
2.00
1.00
0.00
AmMetLife BondMBB 12mth FD rates

AmMetLife Insurance Berhad Annual Report for the Investment-Linked Funds Financial Year Ended 31 March 201832
Annual Report for the AmMetLife Insurance Berhad Financial Year Ended 31 March 2018 Investment-Linked Funds
AmMetLife Balanced Fund
Since Inception Performance
AmMetLife Balanced Fund vs BenchmarkPerformance since 27 February 2004 – 31 March 2018
Full Year Performance
AmMetLife Balanced Fund vs BenchmarkPerformance since 1 April 2017 – 31 March 2018
Mar
-04
Mar
-05
Mar
-06
Mar
-07
Mar
-08
Mar
-09
Mar
-10
Mar
-11
Mar
-12
Mar
-13
Mar
-14
Mar
-15
Mar
-16
Mar
-17
Mar
-18
Perf
orm
ance
(%)
150.00
120.00
90.00
60.00
30.00
0.00
-30.00
Month
AmMetLife Balanced50% FBMKLCI & 50% MBB 12mth FD rates
Apr
-17
May
-17
Jun-
17
Jul-1
7
Aug
-17
Sep-
17
Oct
-17
Nov
-17
Dec
-17
Jan-
18
Feb-
18
Mar
-18
Perf
orm
ance
(%)
Month
15.00
12.00
9.00
6.00
3.00
0.00
-3.00
AmMetLife Balanced50% FBMKLCI & 50% MBB 12mth FD rates
Fund Performance (Cont’d)

AmMetLife Insurance Berhad Annual Report for the Investment-Linked Funds Financial Year Ended 31 March 2018 33
Annual Report for the AmMetLife Insurance Berhad Financial Year Ended 31 March 2018 Investment-Linked Funds
AmMetLife Dana Teguh
Since Inception Performance
AmMetLife Dana Teguh vs BenchmarkPerformance since inception 27 February 2004 – 31 March 2018
Full Year Performance
AmMetLife Dana Teguh vs BenchmarkPerformance since 1 April 2017 – 31 March 2018
Mar
-04
Mar
-05
Mar
-06
Mar
-07
Mar
-08
Mar
-09
Mar
-10
Mar
-11
Mar
-12
Mar
-13
Mar
-14
Mar
-15
Mar
-16
Mar
-17
Mar
-18
Perf
orm
ance
(%)
180.00
150.00
120.00
90.00
60.00
30.00
0.00
-30.00
Month
AmMetLife Dana Teguh50% FBM Emas Syariah & 50% MBB 12mth GIA-i Tier 1
Apr
-17
May
-17
Jun-
17
Jul-1
7
Aug
-17
Sep-
17
Oct
-17
Nov
-17
Dec
-17
Jan-
18
Feb-
18
Mar
-18
Perf
orm
ance
(%)
Month
12.00
10.00
8.00
6.00
4.00
2.00
0.00
-2.00
AmMetLife Dana Teguh50% FBM Emas Syariah & 50% MBB 12mth GIA-i Tier 1

AmMetLife Insurance Berhad Annual Report for the Investment-Linked Funds Financial Year Ended 31 March 201834
Annual Report for the AmMetLife Insurance Berhad Financial Year Ended 31 March 2018 Investment-Linked Funds
Fund Performance (Cont’d)
AmMetLife Oasis Islamic Equity Fund
Since Inception Performance
AmMetLife Oasis Islamic Equity Fund vs BenchmarkPerformance since 1 April 2007 – 31 March 2018
Full Year Performance
AmMetLife Oasis Islamic Equity Fund vs BenchmarkPerformance since 1 April 2017 – 31 March 2018
Apr
-07
Feb-
08
Dec
-08
Oct
-09
Aug
-10
Jun-
11
Apr
-12
Feb-
13
Dec
-13
Oct
-14
Aug
-15
Jun-
16
Apr
-17
Feb-
18
Perf
orm
ance
(%)
Month
90.00
60.00
30.00
0.00
-30.00
-60.00
AmMetLife Oasis Islamic EquityDow Jones Islamic Market Index
Perf
orm
ance
(%)
Month
25.00
20.00
15.00
10.00
5.00
0.00
-5.00
-10.00
-15.00
Apr
-17
May
-17
Jun-
17
Jul-1
7
Aug
-17
Sep-
17
Oct
-17
Nov
-17
Dec
-17
Jan-
18
Feb-
18
Mar
-18
AmMetLife Oasis Islamic Equity
Dow Jones Islamic Market Index

AmMetLife Insurance Berhad Annual Report for the Investment-Linked Funds Financial Year Ended 31 March 2018 35
Annual Report for the AmMetLife Insurance Berhad Financial Year Ended 31 March 2018 Investment-Linked Funds
Jun-
08
Mar
-09
Dec
-09
Sep-
10
Jun-
11
Mar
-12
Dec
-12
Sep-
13
Jun-
14
Mar
-15
Dec
-15
Sep-
16
Jun-
17
Mar
-18
Perf
orm
ance
(%)
Month
60.00
40.00
20.00
0.00
-20.00
-40.00
-60.00
AmMetLife Global Emerging MarketMSCI Emerging Markets Index
AmMetLife Global Emerging Market Fund
Since Inception Performance
AmMetLife Global Emerging Market Fund vs BenchmarkPerformance since 1 June 2008 – 31 March 2018
Full Year Performance
AmMetLife Global Emerging Market Fund vs BenchmarkPerformance since 1 April 2017 – 31 March 2018
Perf
orm
ance
(%)
Month
40.00
35.00
30.00
25.00
20.00
15.00
10.00
5.00
0.00
-5.00
Apr
-17
May
-17
Jun-
17
Jul-1
7
Aug
-17
Sep-
17
Oct
-17
Nov
-17
Dec
-17
Jan-
18
Feb-
18
Mar
-18
AmMetLife Global Emerging Market
MSCI Emerging Markets Index

AmMetLife Insurance Berhad Annual Report for the Investment-Linked Funds Financial Year Ended 31 March 201836
Annual Report for the AmMetLife Insurance Berhad Financial Year Ended 31 March 2018 Investment-Linked Funds
Fund Performance (Cont’d)
AmMetLife Precious Metals Fund
Since Inception Performance
AmMetLife Precious Metals Fund vs BenchmarkPerformance since 1 September 2008 – 31 March 2018
Full Year Performance
AmMetLife Precious Metals Fund vs BenchmarkPerformance since 1 April 2017 – 31 March 2018
Perf
orm
ance
(%)
80.00
60.00
40.00
20.00
0.00
-20.00
-40.00
-60.00
-80.00
Sep-
08
Mar
-09
Sep-
09
Mar
-10
Sep-
10
Mar
-11
Sep-
11
Mar
-12
Sep-
12
Mar
-13
Sep-
13
Mar
-14
Sep-
14
Mar
-15
Sep-
15
Mar
-16
Sep-
16
Mar
-17
Sep-
17
Mar
-18
Month
AmMetLife Precious Metals
FTSE Gold Mines Index
Apr
-17
May
-17
Jun-
17
Jul-1
7
Aug
-17
Sep-
17
Oct
-17
Nov
-17
Dec
-17
Jan-
18
Feb-
18
Mar
-18
Perf
orm
ance
(%)
Month
9.00
6.00
3.00
0.00
-3.00
-6.00
-9.00
-12.00
-15.00
AmMetLife Precious Metals
FTSE Gold Mines Index

AmMetLife Insurance Berhad Annual Report for the Investment-Linked Funds Financial Year Ended 31 March 2018 37
Annual Report for the AmMetLife Insurance Berhad Financial Year Ended 31 March 2018 Investment-Linked Funds
AmMetLife Global Agribusiness Fund
Since Inception Performance
AmMetLife Global Agribusiness Fund vs BenchmarkPerformance since 1 September 2008 – 31 March 2018
Full Year Performance
AmMetLife Global Agribusiness Fund vs BenchmarkPerformance since 1 April 2017 – 31 March 2018
Sep-
08
Mar
-09
Sep-
09
Mar
-10
Sep-
10
Mar
-11
Sep-
11
Mar
-12
Sep-
12
Mar
-13
Sep-
13
Mar
-14
Sep-
14
Mar
-15
Sep-
15
Mar
-16
Sep-
16
Mar
-17
Sep-
17
Mar
-18
Perf
orm
ance
(%)
90.00
60.00
30.00
0.00
-30.00
-60.00
Month
AmMetLife Global AgribusinessMSCI World Index
Apr
-17
May
-17
Jun-
17
Jul-1
7
Aug
-17
Sep-
17
Oct
-17
Nov
-17
Dec
-17
Jan-
18
Feb-
18
Mar
-18
Perf
orm
ance
(%)
Month
24.00
20.00
16.00
12.00
8.00
4.00
0.00
-4.00
AmMetLife Global Agribusiness
MSCI World Index

AmMetLife Insurance Berhad Annual Report for the Investment-Linked Funds Financial Year Ended 31 March 201838
Annual Report for the AmMetLife Insurance Berhad Financial Year Ended 31 March 2018 Investment-Linked Funds
Fund Performance (Cont’d)
AmMetLife Dividend Fund
Since Inception Performance
AmMetLife Dividend Fund vs BenchmarkPerformance since 27 October 2011 – 31 March 2018
Full Year Performance
AmMetLife Dividend Fund vs BenchmarkPerformance since 1 April 2017 – 31 March 2018
Oct
-11
May
-12
Dec
-12
Jul-1
3
Feb-
14
Sep-
14
Apr
-15
Nov
-15
Jun-
16
Jan-
17
Aug
-17
Mar
-18
Perf
orm
ance
(%)
Month
80.00
70.00
60.00
50.00
40.00
30.00
20.00
10.00
0.00
-10.00
AmMetLife Dividend
FBMKLCI
Perf
orm
ance
(%)
Month
20.00
15.00
10.00
5.00
0.00
-5.00
Apr
-17
May
-17
Jun-
17
Jul-1
7
Aug
-17
Sep-
17
Oct
-17
Nov
-17
Dec
-17
Jan-
18
Feb-
18
Mar
-18
AmMetLife DividendFBMKLCI

AmMetLife Insurance Berhad Annual Report for the Investment-Linked Funds Financial Year Ended 31 March 2018 39
Annual Report for the AmMetLife Insurance Berhad Financial Year Ended 31 March 2018 Investment-Linked Funds
AmMetLife Asia Pacific REITS Fund
Since Inception Performance
AmMetLife Asia Pacific REITS Fund vs BenchmarkPerformance since 17 September 2013 – 31 March 2018
Full Year Performance
AmMetLife Asia Pacific REITS Fund vs BenchmarkPerformance since 1 April 2017 – 31 March 2018
Perf
orm
ance
(%)
40.00
32.00
24.00
16.00
8.00
0.00
-8.00
-16.00
Sep-
13
Dec
-13
Mar
-14
Jun-
14
Sep-
14
Dec
-14
Mar
-15
Jun-
15
Sep-
15
Dec
-15
Mar
-16
Jun-
16
Sep-
16
Dec
-16
Mar
-17
Jun-
17
Sep-
17
Dec
-17
Mar
-18
Month
S&P Pan Asia REITs Index
Apr
-17
May
-17
Jun-
17
Jul-1
7
Aug
-17
Sep-
17
Oct
-17
Nov
-17
Dec
-17
Jan-
18
Feb-
18
Mar
-18
Perf
orm
ance
(%)
Month
12.00
10.00
8.00
6.00
4.00
2.00
0.00
-2.00
-4.00
-6.00
S&P Pan Asia REITs Index

40AmMetLife Insurance Berhad Annual Report for the Investment-Linked Funds Financial Year Ended 31 March 2018
Fund Performance (Cont’d)
AmMetLife Tactical Bond Fund
Since Inception Performance
AmMetLife Tactical Bond Fund vs BenchmarkPerformance since 17 September 2013 – 31 March 2018
Full Year Performance
AmMetLife Tactical Bond Fund vs BenchmarkPerformance since 1 April 2017 – 31 March 2018
Sep-
13
Dec
-13
Mar
-14
Jun-
14
Sep-
14
Dec
-14
Mar
-15
Jun-
15
Sep-
15
Dec
-15
Mar
-16
Jun-
16
Sep-
16
Dec
-16
Mar
-17
Jun-
17
Sep-
17
Dec
-17
Mar
-18
Perf
orm
ance
(%)
24.00
20.00
16.00
12.00
8.00
4.00
0.00
-4.00
Month
AmMetLife Tactical Bond
Quantshop ALL MGS Index
Apr
-17
May
-17
Jun-
17
Jul-1
7
Aug
-17
Sep-
17
Oct
-17
Nov
-17
Dec
-17
Jan-
18
Feb-
18
Mar
-18
Perf
orm
ance
(%)
Month
8.00
6.00
4.00
2.00
0.00
-2.00
AmMetLife Tactical BondQuantshop ALL MGS Index
Investment-Linked FundsFor the Financial Year Ended 31 March 2018
ANNUAL REPORT
2018

AmMetLife Insurance Berhad Annual Report for the Investment-Linked Funds Financial Year Ended 31 March 2018
Sectoral andCategory Breakdown
Investment-Linked FundsFor the Financial Year Ended 31 March 2018
ANNUAL REPORT
2018

AmMetLife Insurance Berhad Annual Report for the Investment-Linked Funds Financial Year Ended 31 March 201842
Annual Report for the AmMetLife Insurance Berhad Financial Year Ended 31 March 2018 Investment-Linked Funds
Sectoral and Category Breakdown
AmMetLife Equity FundDetails of portfolio composition of AmMetLife Equity Fund as at 31 March 2018 are as follows:
FY 2018 FY 2017 FY 2016 FY 2015 FY 2014 % % % % %
Construction 6.02 9.02 4.55 2.91 7.72
Consumer products 0.99 – – 3.07 –
Finance 25.16 22.97 23.94 24.83 11.34
Industrial products 14.38 9.24 11.65 8.84 13.03
Infrastructure – 1.96 1.70 3.80 1.31
Plantations 2.93 3.01 3.44 0.97 –
Properties – 2.59 – – 2.97
REITS 1.61 1.53 – – –
Technology 3.24 5.88 4.05 4.19 –
Trading/Services 28.41 35.15 38.10 44.47 45.85
Repurchase agreements/Cash 17.26 8.66 12.57 6.91 17.77
100.00 100.00 100.00 100.00 100.00
FY 2018 FY 2017 FY 2016 FY 2015 FY 2014 % % % % %
Malaysia Unit Trusts 0.24 0.21 9.67 9.75 9.56
Corporate Bonds 85.64 83.98 79.58 82.63 68.18
Malaysian Government Securities 6.67 – – – –
Repurchase agreements/Cash 7.45 15.81 10.74 7.62 22.26
100.00 100.00 100.00 100.00 100.00
AmMetLife Bond Fund Details of portfolio composition of AmMetLife Bond Fund as at 31 March 2018 are as follows:
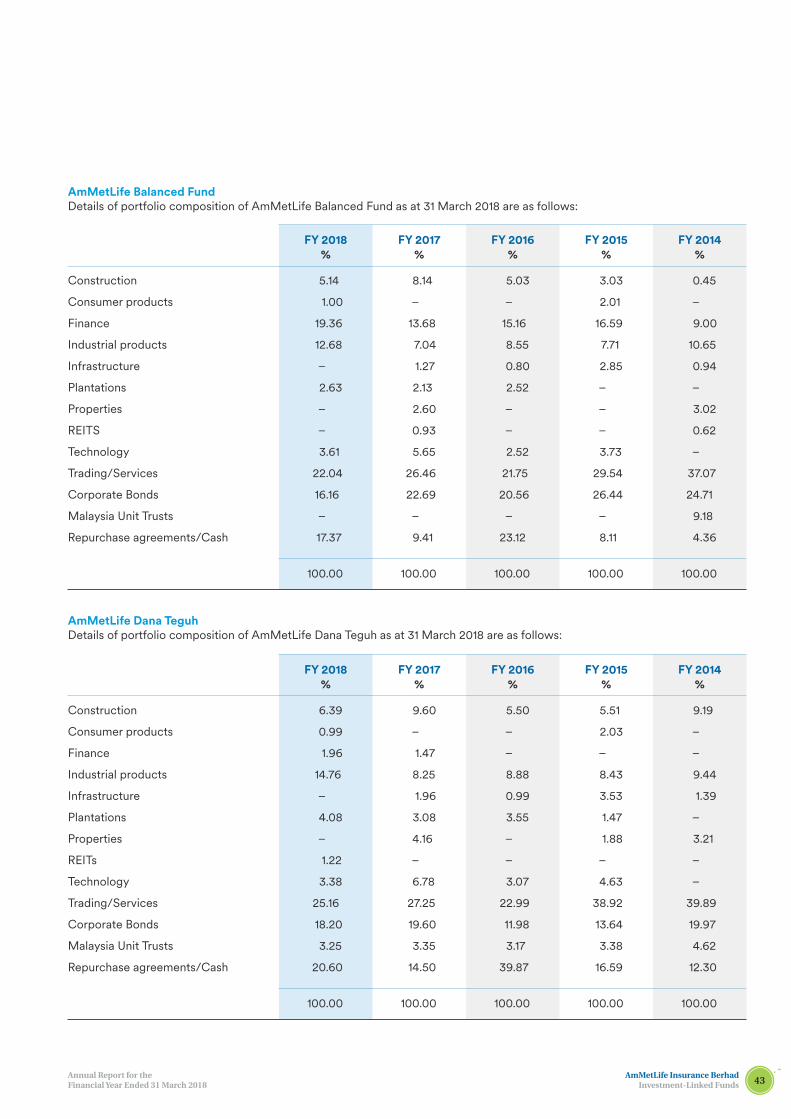
AmMetLife Insurance Berhad Annual Report for the Investment-Linked Funds Financial Year Ended 31 March 2018 43
Annual Report for the AmMetLife Insurance Berhad Financial Year Ended 31 March 2018 Investment-Linked Funds
AmMetLife Balanced FundDetails of portfolio composition of AmMetLife Balanced Fund as at 31 March 2018 are as follows:
FY 2018 FY 2017 FY 2016 FY 2015 FY 2014 % % % % %
Construction 5.14 8.14 5.03 3.03 0.45
Consumer products 1.00 – – 2.01 –
Finance 19.36 13.68 15.16 16.59 9.00
Industrial products 12.68 7.04 8.55 7.71 10.65
Infrastructure – 1.27 0.80 2.85 0.94
Plantations 2.63 2.13 2.52 – –
Properties – 2.60 – – 3.02
REITS – 0.93 – – 0.62
Technology 3.61 5.65 2.52 3.73 –
Trading/Services 22.04 26.46 21.75 29.54 37.07
Corporate Bonds 16.16 22.69 20.56 26.44 24.71
Malaysia Unit Trusts – – – – 9.18
Repurchase agreements/Cash 17.37 9.41 23.12 8.11 4.36
100.00 100.00 100.00 100.00 100.00
FY 2018 FY 2017 FY 2016 FY 2015 FY 2014 % % % % %
Construction 6.39 9.60 5.50 5.51 9.19
Consumer products 0.99 – – 2.03 –
Finance 1.96 1.47 – – –
Industrial products 14.76 8.25 8.88 8.43 9.44
Infrastructure – 1.96 0.99 3.53 1.39
Plantations 4.08 3.08 3.55 1.47 –
Properties – 4.16 – 1.88 3.21
REITs 1.22 – – – –
Technology 3.38 6.78 3.07 4.63 –
Trading/Services 25.16 27.25 22.99 38.92 39.89
Corporate Bonds 18.20 19.60 11.98 13.64 19.97
Malaysia Unit Trusts 3.25 3.35 3.17 3.38 4.62
Repurchase agreements/Cash 20.60 14.50 39.87 16.59 12.30
100.00 100.00 100.00 100.00 100.00
AmMetLife Dana TeguhDetails of portfolio composition of AmMetLife Dana Teguh as at 31 March 2018 are as follows:

AmMetLife Insurance Berhad Annual Report for the Investment-Linked Funds Financial Year Ended 31 March 201844
Annual Report for the AmMetLife Insurance Berhad Financial Year Ended 31 March 2018 Investment-Linked Funds
AmMetLife Oasis Islamic Equity FundDetails of portfolio composition of AmMetLife Oasis Islamic Equity Fund as at 31 March 2018 are as follows:
FY 2018 FY 2017 FY 2016 FY 2015 FY 2014 % % % % %
Malaysia Unit Trusts 93.67 93.12 92.38 90.69 89.53
Repurchase agreements/Cash 6.33 6.88 7.62 9.31 10.47
100.00 100.00 100.00 100.00 100.00
AmOasis Global Islamic Equity Fund (“Target Fund”) Sector Allocation*
Note: Source of Target Fund’s sector allocation from Oasis Crescent Capital (Pty) Ltd (Target Fund’s Investment Manager)*As percentage of NAV. Please note that asset exposure for the fund is subject to frequent change on a daily basis
FY 2018 FY 2017 FY 2016 FY 2015 FY 2014 % % % % %
Basic Materials 4.00 6.00 7.00 8.00 4.00
Communication 16.00 19.00 20.00 20.00 18.00
Consumer, Cyclical 14.00 13.00 15.00 11.00 8.00
Consumer, Non Cyclical 5.00 6.00 5.00 8.00 9.00
Energy 7.00 7.00 7.00 8.00 10.00
Healthcare 23.00 20.00 18.00 19.00 22.00
Industrials 5.00 4.00 4.00 3.00 6.00
Property 1.00 1.00 1.00 1.00 1.00
Technology 25.00 24.00 23.00 22.00 22.00
Sectoral and Category Breakdown (Cont’d)

AmMetLife Insurance Berhad Annual Report for the Investment-Linked Funds Financial Year Ended 31 March 2018 45
Annual Report for the AmMetLife Insurance Berhad Financial Year Ended 31 March 2018 Investment-Linked Funds
AmMetLife Precious Metals FundDetails of portfolio composition of AmMetLife Precious Metals Fund as at 31 March 2018 are as follows:
Note: Source of Target Fund’s sector allocation from from Deutsche Investment Management America Inc (Target Fund’s Investment Manager)*As percentage of NAV. Please note that asset exposure for the fund is subject to frequent change on a daily basis
Precious Metals Securities (“Target Fund”) Sector Allocation*
FY 2018 FY 2017 FY 2016 FY 2015 FY 2014 % % % % %
Malaysia Unit Trusts 84.53 84.27 81.02 79.80 96.40
Repurchase agreements/Cash 15.47 15.73 18.98 20.20 3.60
100.00 100.00 100.00 100.00 100.00
FY 2018 FY 2017 FY 2016 FY 2015 FY 2014 % % % % %
Gold 83.75 81.61 69.28 70.14 73.46
Precious Metals & Minerals 6.66 7.61 18.99 15.15 13.09
Silver 7.25 10.03 9.71 12.60 6.77
Diversified Metals & Mining – – – – 6.60
Cash and other assets 2.30 0.71 1.96 2.09 0.05

AmMetLife Insurance Berhad Annual Report for the Investment-Linked Funds Financial Year Ended 31 March 201846
Annual Report for the AmMetLife Insurance Berhad Financial Year Ended 31 March 2018 Investment-Linked Funds
AmMetLife Global Agribusiness FundDetails of portfolio composition of AmMetLife Global Agribusiness Fund as at 31 March 2018 are as follows:
FY 2018 FY 2017 FY 2016 FY 2015 FY 2014 % % % % %
Malaysia Unit Trusts 91.09 92.14 93.68 90.29 88.08
Repurchase agreements/Cash 8.91 7.86 6.32 9.71 11.92
100.00 100.00 100.00 100.00 100.00
Global Agribusiness (“Target Fund”) Sector Allocation*
FY 2018 FY 2017 FY 2016 FY 2015 FY 2014 % % % % %
Agricultural Products 16.30 14.60 24.50 22.70 19.10
Agricultural & Farm Mach – 4.20 – – –
Breweries 3.10 2.10 3.10 3.20 3.70
Diversified Banks – – – – 3.20
Diversified Chemicals 3.90 5.50 2.10 3.20 3.70
Fertilizers & Agricultural Chemicals 23.20 31.70 38.30 39.90 38.20
Food Distributors – – 4.20 2.00 1.50
Food Retails 3.10 4.50 2.60 2.90 2.90
Internet Software & Services 7.20 – – – –
Marine Ports & Services – – 1.60 1.40 1.70
Other Sectors 10.20 5.40 1.30 3.30 4.30
Packaged Foods & Meat 17.00 16.60 17.70 16.70 19.50
Personal Products 3.80 3.30 – – –
Railroads 3.00 – – – 1.30
Restaurants – – 1.70 2.80 0.90
Speciality Chemicals 6.10 4.80 – – –
Not Classified – – 1.40 0.90 –
Soft Drinks – – 1.20 1.00 –
Tobacco – 5.90 – – –
Note: Source of Target Fund’s sector allocation from Deutsche Asset Management Investment GmbH (Target Fund’s Investment Manager)*As percentage of NAV. Please note that asset exposure for the fund is subject to frequent change on a daily basis
Sectoral and Category Breakdown (Cont’d)

AmMetLife Insurance Berhad Annual Report for the Investment-Linked Funds Financial Year Ended 31 March 2018 47
Annual Report for the AmMetLife Insurance Berhad Financial Year Ended 31 March 2018 Investment-Linked Funds
AmMetLife Global Emerging Market FundDetails of portfolio composition of AmMetLife Global Emerging Market Fund as at 31 March 2018 are as follows:
Global Emerging Market Opportunities (“Target Fund”) Sector Allocation*
FY 2018 FY 2017 FY 2016 FY 2015 FY 2014 % % % % %
Malaysia Unit Trusts 83.94 94.09 93.38 90.97 87.74
Repurchase agreements/Cash 16.06 5.91 6.62 9.03 12.26
100.00 100.00 100.00 100.00 100.00
FY 2018 FY 2017 FY 2016 FY 2015 FY 2014 % % % % %
Consumer Discretionary 13.44 10.20 14.15 12.97 15.87
Consumer Staples 4.14 2.38 3.56 5.11 3.37
Energy 10.58 9.57 3.62 3.71 10.12
Financials 23.09 27.14 31.81 33.68 34.12
Health Care – 1.00 2.07 3.72 0.90
Industrials 2.61 6.72 5.72 3.98 2.59
Information Technology 27.46 21.79 21.64 24.10 18.14
Liquid Assets 2.29 3.33 9.80 – –
Materials 12.17 8.51 3.40 1.94 3.29
Real Estate 0.27 1.93 – – –
Telecommunication Services 2.89 6.36 4.23 3.86 3.63
Utilities 1.07 1.06 – 1.18 –
Cash – – – 5.75 7.97
Note: Source of Target Fund’s sector allocation from Schroder Investment Management Ltd (Target Fund’s Investment Manager)*As percentage of NAV. Please note that asset exposure for the fund is subject to frequent change on a daily basis

AmMetLife Insurance Berhad Annual Report for the Investment-Linked Funds Financial Year Ended 31 March 201848
Annual Report for the AmMetLife Insurance Berhad Financial Year Ended 31 March 2018 Investment-Linked Funds
AmMetLife Asia Pacific REITS FundDetails of portfolio composition of AmMetLife Asia Pacific REITS Fund as at 31 March 2018 are as follows:
AmAsia Pacific REITS – Class B (MYR) Sector Allocation*
FY 2018 FY 2017 FY 2016 FY 2015 FY 2014 % % % % %
Malaysia Unit Trusts 73.25 90.85 93.87 91.50 88.62
Repurchase agreements/Cash 26.75 9.15 6.13 8.50 11.38
100.00 100.00 100.00 100.00 100.00
FY 2018 FY 2017 FY 2016 FY 2015 FY 2014 % % % % %
Cash and others (1.19) 1.35 14.95 – –
Fixed Deposit/Negotiable Instruments/Cash – – – 15.20 13.90
Health Care – 1.49 – – –
Money Market Deposit 14.86 17.54 – – –
Real Estate 86.33 77.59 2.34 84.80 86.10
REITs – – 80.25 – –
Utilities – 2.03 2.46 – –
AmMetLife Dividend FundDetails of portfolio composition of AmMetLife Dividend Fund as at 31 March 2018 are as follows:
FY 2018 FY 2017 FY 2016 FY 2015 FY 2014 % % % % %
Construction 6.61 9.24 5.44 3.89 4.96
Consumer products 0.99 – – 2.00 –
Finance 26.46 23.22 25.53 24.41 13.88
Industrial products 15.16 9.33 12.24 8.88 3.89
Infrastructure – 1.98 1.71 4.13 4.99
Plantations 3.17 3.12 2.73 0.48 –
Properties – 2.67 – – 7.41
REITS 0.94 1.53 – – 4.53
Technology 3.41 6.05 3.58 5.30 –
Trading/Services 30.91 34.52 39.82 44.23 41.11
Repurchase agreements/Cash 12.34 8.34 8.95 6.68 19.24
100.00 100.00 100.00 100.00 100.00
Note: Source of Target Fund’s sector allocation from AmFunds Management Berhad*As percentage of NAV. Please note that asset exposure for the fund is subject to frequent change on a daily basis
Sectoral and Category Breakdown (Cont’d)

AmMetLife Insurance Berhad Annual Report for the Investment-Linked Funds Financial Year Ended 31 March 2018 49
Annual Report for the AmMetLife Insurance Berhad Financial Year Ended 31 March 2018 Investment-Linked Funds
FY 2018 FY 2017 FY 2016 FY 2015 FY 2014 % % % % %
Malaysia Unit Trusts 92.24 92.15 91.97 90.63 86.64
Repurchase agreements/Cash 7.76 7.85 8.03 9.37 13.36
100.00 100.00 100.00 100.00 100.00
FY 2018 FY 2017 FY 2016 FY 2015 FY 2014 % % % % %
Bond 75.68 86.76 95.79 93.10 84.47
Government 14.41 – – – –
Cash 9.91 13.24 4.21 6.90 15.53
AmTactical Bond – Class B (MYR) Sector Allocation*
AmMetLife Tactical Bond FundDetails of portfolio composition of AmMetLife Tactical Bond Fund as at 31 March 2018 are as follows:
Note: Source of Target Fund’s sector allocation from AmFunds Management Berhad*As percentage of NAV. Please note that asset exposure for the fund is subject to frequent change on a daily basis

THIS PAGE ISINTENTIONALLY
LEFT BLANK
Investment-Linked FundsFor the Financial Year Ended 31 March 2018
ANNUAL REPORT
2018

ComparativePerformance Table
Investment-Linked FundsFor the Financial Year Ended 31 March 2018
ANNUAL REPORT
2018

AmMetLife Insurance Berhad Annual Report for the Investment-Linked Funds Financial Year Ended 31 March 201852
Annual Report for the AmMetLife Insurance Berhad Financial Year Ended 31 March 2018 Investment-Linked Funds
Comparative Performance TableFund Performance as at 31 March 2018
I Year 3 Years 5 Years Since Launch
Average Compounded Annual Return % Annual Return %
AmMetLife Equity Fund 10.80 5.46 7.38 6.20
AmMetLife Bond Fund 3.25 3.25 3.05 4.06
AmMetLife Balanced Fund 9.25 5.07 5.81 5.88
AmMetLife Dana Teguh 5.99 4.13 7.77 6.35
AmMetLife Oasis Islamic Equity Fund (7.55) 0.75 5.06 1.76
AmMetLife Global Emerging Market Fund 7.91 8.64 7.04 3.44
AmMetLife Precious Metals Fund (13.70) 0.58 (7.08) (7.17)
AmMetLife Global Agribusiness Fund (1.06) 0.28 2.18 2.94
AmMetLife Dividend Fund 11.82 5.80 8.15 8.10
AmMetLife Asia Pacific REITS Fund (4.14) 5.06 – 6.14
AmMetLife Tactical Bond Fund 1.54 4.79 – 3.83

AmMetLife Insurance Berhad Annual Report for the Investment-Linked Funds Financial Year Ended 31 March 2018 53
Annual Report for the AmMetLife Insurance Berhad Financial Year Ended 31 March 2018 Investment-Linked Funds
Net Asset Value, Number of Units and Unit PriceAs at 31 March 2018
AmMetLife Equity FundPerformance details of the Fund for the financial years ended 31 March 2018 are as follows:
*Above prices and net asset value per unit are not shown as ex–distribution as there was no income distribution declared by the fund for the financial year Note: 1.Total return is the actual return of the Fund for the financial year, computed based on net asset value per unit and net of all fees
AmMetLife Bond Fund Performance details of the Fund for the financial years ended 31 March 2018 are as follows:
*Above prices and net asset value per unit are not shown as ex-distribution as there was no income distribution declared by the fund for the financial year Note: 1.Total return is the actual return of the Fund for the financial year, computed based on net asset value per unit and net of all fees
FY 2018 FY 2017 FY 2016 FY 2015 FY 2014
Unit Prices (RM)
Highest NAV per unit for the year 1.2146 1.0646 1.0216 1.0197 0.9946
Lowest NAV per unit for the year 1.0596 0.9663 0.8888 0.8684 0.8253
Net Asset Value (NAV) and Units in Circulation (UIC) as at the end of the Year*
Total NAV (RM million) 27.4472 22.4706 20.3461 19.3462 14.5438
UIC (in million) 23.3447 21.1743 20.1536 19.2958 14.6327
NAV per unit (RM) 1.1758 1.0612 1.0096 1.0026 0.9939
Total Return for the Year (%)
Total Return¹ 10.80 5.11 0.70 0.88 20.68
Capital growth 10.80 5.11 0.70 0.88 20.68
Income distributions – – – – –
FY 2018 FY 2017 FY 2016 FY 2015 FY 2014
Unit Prices (RM)
Highest NAV per unit for the year 0.8797 0.8520 0.8241 0.7992 0.7752
Lowest NAV per unit for the year 0.8520 0.8234 0.7993 0.7738 0.7576
Net Asset Value (NAV) and Units in Circulation (UIC) as at the end of the Year*
Total NAV (RM million) 10.3783 10.6700 11.9043 12.4142 16.7134
UIC (in million) 11.7957 12.5241 14.4607 15.5323 21.5938
NAV per unit (RM) 0.8797 0.8520 0.8232 0.7992 0.7740
Total Return for the Year (%)
Total Return¹ 3.25 3.50 3.00 3.26 2.23
Capital growth 3.25 3.50 3.00 3.26 2.23
Income distributions – – – – –

AmMetLife Insurance Berhad Annual Report for the Investment-Linked Funds Financial Year Ended 31 March 201854
Annual Report for the AmMetLife Insurance Berhad Financial Year Ended 31 March 2018 Investment-Linked Funds
AmMetLife Balanced FundPerformance details of the Fund for the financial years ended 31 March 2018 are as follows:
*Above prices and net asset value per unit are not shown as ex-distribution as there was no income distribution declared by the fund for the financial year Note: 1.Total return is the actual return of the Fund for the financial year, computed based on net asset value per unit and net of all fees
FY 2018 FY 2017 FY 2016 FY 2015 FY 2014
Unit Prices (RM)
Highest NAV per unit for the year 1.1608 1.0332 0.9860 1.0026 0.9834
Lowest NAV per unit for the year 1.0309 0.9573 0.9036 0.8708 0.8513
Net Asset Value (NAV) and Units in Circulation (UIC) as at the end of the Year*
Total NAV (RM million) 26.5720 23.4425 22.2433 21.9194 24.1576
UIC (in million) 23.5920 22.7392 22.6014 22.5725 24.6747
NAV per unit (RM) 1.1263 1.0309 0.9842 0.9711 0.9790
Total Return for the Year (%)
Total Return¹ 9.25 4.74 1.35 (0.81) 15.30
Capital growth 9.25 4.74 1.35 (0.81) 15.30
Income distributions – – – – –
AmMetLife Dana Teguh Performance details of the Fund for the financial years ended 31 March 2018 are as follows:
*Above prices and net asset value per unit are not shown as ex-distribution as there was no income distribution declared by the fund for the financial year Note: 1.Total return is the actual return of the Fund for the financial year, computed based on net asset value per unit and net of all fees
FY 2018 FY 2017 FY 2016 FY 2015 FY 2014
Unit Prices (RM)
Highest NAV per unit for the year 1.2569 1.1340 1.0948 1.0617 1.0088
Lowest NAV per unit for the year 1.1310 1.0611 0.9946 0.9333 0.8260
Net Asset Value (NAV) and Units in Circulation (UIC) as at the end of the Year*
Total NAV (RM million) 20.7810 19.3195 19.3700 17.9532 12.1769
UIC (in million) 17.3367 17.0814 17.8878 16.9101 12.1007
NAV per unit (RM) 1.1987 1.1310 1.0829 1.0617 1.0063
Total Return for the Year (%)
Total Return¹ 5.99 4.44 2.00 5.51 22.03
Capital growth 5.99 4.44 2.00 5.51 22.03
Income distributions – – – – –
Net Asset Value, Number of Units and Unit Price (Cont’d)
As at 31 March 2018

AmMetLife Insurance Berhad Annual Report for the Investment-Linked Funds Financial Year Ended 31 March 2018 55
Annual Report for the AmMetLife Insurance Berhad Financial Year Ended 31 March 2018 Investment-Linked Funds
AmMetLife Oasis Islamic Equity FundPerformance details of the Fund for the financial years ended 31 March 2018 are as follows:
*Above prices and net asset value per unit are not shown as ex-distribution as there was no income distribution declared by the fund for the financial year Note: 1.Total return is the actual return of the Fund for the financial year, computed based on net asset value per unit and net of all fees
FY 2018 FY 2017 FY 2016 FY 2015 FY 2014
Unit Prices (RM)
Highest NAV per unit for the year 0.6567 0.6618 0.6224 0.5953 0.5827
Lowest NAV per unit for the year 0.6050 0.5558 0.5525 0.5100 0.4672
Net Asset Value (NAV) and Units in Circulation (UIC) as at the end of the Year*
Total NAV (RM million) 3.6121 4.1535 3.9426 4.2864 4.5139
UIC (in million) 5.9629 6.3387 6.9363 7.2363 8.5410
NAV per unit (RM) 0.6058 0.6553 0.5684 0.5923 0.5285
Total Return for the Year (%)
Total Return¹ (7.55) 15.29 (4.04) 12.07 11.66
Capital growth (7.55) 15.29 (4.04) 12.07 11.66
Income distributions – – – – –
AmMetLife Global Emerging Market Fund Performance details of the Fund for the financial years ended 31 March 2018 are as follows:
*Above prices and net asset value per unit are not shown as ex-distribution as there was no income distribution declared by the fund for the financial year Note: 1.Total return is the actual return of the Fund for the financial year, computed based on net asset value per unit and net of all fees
FY 2018 FY 2017 FY 2016 FY 2015 FY 2014
Unit Prices (RM)
Highest NAV per unit for the year 0.7271 0.6496 0.5792 0.5658 0.5229
Lowest NAV per unit for the year 0.6403 0.5016 0.4873 0.5143 0.4673
Net Asset Value (NAV) and Units in Circulation (UIC) as at the end of the Year*
Total NAV (RM million) 3.0306 1.1770 0.9253 0.9532 0.8839
UIC (in million) 4.3478 1.8222 1.8000 1.7536 1.7201
NAV per unit (RM) 0.6970 0.6459 0.5141 0.5436 0.5139
Total Return for the Year (%)
Total Return¹ 7.91 25.64 (5.43) 5.78 3.61
Capital growth 7.91 25.64 (5.43) 5.78 3.61
Income distributions – – – – –

AmMetLife Insurance Berhad Annual Report for the Investment-Linked Funds Financial Year Ended 31 March 201856
Annual Report for the AmMetLife Insurance Berhad Financial Year Ended 31 March 2018 Investment-Linked Funds
AmMetLife Precious Metals FundPerformance details of the Fund for the financial years ended 31 March 2018 are as follows:
*Above prices and net asset value per unit are not shown as ex-distribution as there was no income distribution declared by the fund for the financial year Note: 1.Total return is the actual return of the Fund for the financial year, computed based on net asset value per unit and net of all fees
FY 2018 FY 2017 FY 2016 FY 2015 FY 2014
Unit Prices (RM)
Highest NAV per unit for the year 0.3003 0.3393 0.2689 0.3027 0.3532
Lowest NAV per unit for the year 0.2448 0.2500 0.2021 0.2231 0.2534
Net Asset Value (NAV) and Units in Circulation (UIC) as at the end of the Year*
Total NAV (RM million) 3.3177 4.1296 3.8197 3.8268 3.9300
UIC (in million) 13.5443 14.5436 14.6769 15.8907 13.9612
NAV per unit (RM) 0.2450 0.2839 0.2603 0.2408 0.2815
Total Return for the Year (%)
Total Return¹ (13.70) 9.07 8.10 (14.46) (20.39)
Capital growth (13.70) 9.07 8.10 (14.46) (20.39)
Income distributions – – – – –
AmMetLife Global Agribusiness Fund Performance details of the Fund for the financial years ended 31 March 2018 are as follows:
*Above prices and net asset value per unit are not shown as ex-distribution as there was no income distribution declared by the fund for the financial year Note: 1.Total return is the actual return of the Fund for the financial year, computed based on net asset value per unit and net of all fees
FY 2018 FY 2017 FY 2016 FY 2015 FY 2014
Unit Prices (RM)
Highest NAV per unit for the year 0.7177 0.6846 0.6959 0.6773 0.6195
Lowest NAV per unit for the year 0.6571 0.5584 0.5506 0.5785 0.5672
Net Asset Value (NAV) and Units in Circulation (UIC) as at the end of the Year*
Total NAV (RM million) 2.3152 2.2642 2.0259 2.1153 1.8693
UIC (in million) 3.5065 3.3927 3.4758 3.2309 3.0205
NAV per unit (RM) 0.6603 0.6674 0.5829 0.6547 0.6189
Total Return for the Year (%)
Total Return¹ (1.06) 14.50 (10.97) 5.78 4.39
Capital growth (1.06) 14.50 (10.97) 5.78 4.39
Income distributions – – – – –
Net Asset Value, Number of Units and Unit Price (Cont’d)
As at 31 March 2018

AmMetLife Insurance Berhad Annual Report for the Investment-Linked Funds Financial Year Ended 31 March 2018 57
Annual Report for the AmMetLife Insurance Berhad Financial Year Ended 31 March 2018 Investment-Linked Funds
AmMetLife Dividend FundPerformance details of the Fund for the financial years ended 31 March 2018 are as follows:
AmMetLife Asia Pacific REITS FundPerformance details of the Fund for the financial years ended 31 March 2018 are as follows:
*Above prices and net asset value per unit are not shown as ex-distribution as there was no income distribution declared by the fund for the financial year Note: 1.Total return is the actual return of the Fund for the financial year, computed based on net asset value per unit and net of all fees
FY 2018 FY 2017 FY 2016 FY 2015 FY 2014
Unit Prices (RM)
Highest NAV per unit for the year 0.8522 0.7404 0.7083 0.6968 0.6290
Lowest NAV per unit for the year 0.7365 0.6720 0.6196 0.6015 0.5566
Net Asset Value (NAV) and Units in Circulation (UIC) as at the end of the Year*
Total NAV (RM million) 15.9615 14.8032 14.0841 12.6593 9.4440
UIC (in million) 19.3455 20.0619 20.1110 18.1690 15.0299
NAV per unit (RM) 0.8251 0.7379 0.7003 0.6968 0.6283
Total Return for the Year (%)
Total Return¹ 11.82 5.37 0.50 10.90 12.66
Capital growth 11.82 5.37 0.50 10.90 12.66
Income distributions – – – – –
*Above prices and net asset value per unit are not shown as ex-distribution as there was no income distribution declared by the fund for the financial year Note: 1.Total return is the actual return of the Fund for the financial year, computed based on net asset value per unit and net of all fees
FY 2018 FY 2017 FY 2016 FY 2015 FY 2014
Unit Prices (RM)
Highest NAV per unit for the year 0.6896 0.6835 0.6113 0.5669 0.5000
Lowest NAV per unit for the year 0.6530 0.5906 0.5457 0.4907 0.4750
Net Asset Value (NAV) and Units in Circulation (UIC) as at the end of the Year*
Total NAV (RM million) 3.3038 1.3032 0.9213 0.6857 0.5809
UIC (in million) 5.0429 1.9066 1.5349 1.2136 1.1849
NAV per unit (RM) 0.6552 0.6835 0.6002 0.5650 0.4903
Total Return for the Year (%)
Total Return¹ (4.14) 13.88 6.23 15.24 –
Capital growth (4.14) 13.88 6.23 15.24 –
Income distributions – – – – –

AmMetLife Insurance Berhad Annual Report for the Investment-Linked Funds Financial Year Ended 31 March 201858
Investment-Linked FundsFor the Financial Year Ended 31 March 2018
ANNUAL REPORT
2018
AmMetLife Tactical Bond FundPerformance details of the Fund for the financial years ended 31 March 2018 are as follows:
*Above prices and net asset value per unit are not shown as ex-distribution as there was no income distribution declared by the fund for the financial year Note: 1.Total return is the actual return of the Fund for the financial year, computed based on net asset value per unit and net of all fees
FY 2018 FY 2017 FY 2016 FY 2015 FY 2014
Unit Prices (RM)
Highest NAV per unit for the year 0.5941 0.5854 0.5576 0.5153 0.5008
Lowest NAV per unit for the year 0.5839 0.5458 0.5026 0.4869 0.4807
Net Asset Value (NAV) and Units in Circulation (UIC) as at the end of the Year*
Total NAV (RM million) 0.9704 0.7058 0.5451 0.4635 0.4912
UIC (in million) 1.6367 1.2088 0.9958 0.8995 0.9949
NAV per unit (RM) 0.5929 0.5839 0.5474 0.5153 0.4937
Total Return for the Year (%)
Total Return¹ 1.54 6.67 6.23 4.38 –
Capital growth 1.54 6.67 6.23 4.38 –
Income distributions – – – – –
Net Asset Value, Number of Units and Unit Price (Cont’d)
As at 31 March 2018

AmMetLife Insurance Berhad Annual Report for the Investment-Linked Funds Financial Year Ended 31 March 2018
Investment-Linked FundsFor the Financial Year Ended 31 March 2018
ANNUAL REPORT
2018
Summary ofFinancial Information
Statement by the Manager 60
Independent Auditors’ Report 61
Statements of Assets and Liabilities 63
Statements of Income and Expenditure 69
Statements of Changes in Net Asset Value 75
Notes to the Financial Information 81

AmMetLife Insurance Berhad Annual Report for the Investment-Linked Funds Financial Year Ended 31 March 201860
Annual Report for the AmMetLife Insurance Berhad Financial Year Ended 31 March 2018 Investment-Linked Funds
Statement By The Manager
In the opinion of the Manager, the accompanying financial information of the Investment-linked Funds of AmMetLife Insurance Berhad comprising the AmMetLife Equity Fund, AmMetLife Bond Fund, AmMetLife Balanced Fund, AmMetLife Dana Teguh, AmMetLife Oasis Islamic Equity Fund, AmMetLife Asia Pacific REITS Fund, AmMetLife Global Emerging Market Fund, AmMetLife Tactical Bond Fund, AmMetLife Precious Metals Fund, AmMetLife Global Agribusiness Fund and AmMetLife Dividend Fund set out on pages 63 to 125 have been prepared in accordance with the accounting policies as described in Note 2.2 to the financial information and the Guidelines on Investment-linked Insurance/Takaful Business issued by Bank Negara Malaysia.
On behalf of AmMetLife Insurance Berhad
Lee Jiau Jiunn
Kuala Lumpur, Malaysia28 June 2018

AmMetLife Insurance Berhad Annual Report for the Investment-Linked Funds Financial Year Ended 31 March 2018 61
Annual Report for the AmMetLife Insurance Berhad Financial Year Ended 31 March 2018 Investment-Linked Funds
Independent Auditors’ ReportReport on the financial information
OpinionWe have audited the financial information of AmMetLife Equity Fund, AmMetLife Bond Fund, AmMetLife Balanced Fund, AmMetLife Dana Teguh, AmMetLife Oasis Islamic Equity Fund, AmMetLife Asia Pacific REITS Fund, AmMetLife Global Emerging Market Fund, AmMetLife Tactical Bond Fund, AmMetLife Precious Metals Fund, AmMetLife Global Agribusiness Fund and AmMetLife Dividend Fund (collectively referred to as "the Funds"), which comprise the statement of assets and liabilities as at 31 March 2018, and the statement of income and expenditure, statement of changes in net asset value of the Funds for the year then ended, and a summary of significant accounting policies, as set out on pages 63 to 125.
In our opinion, the accompanying financial information of the Funds for the year ended 31 March 2018 are prepared, in all material respects, in accordance with the accounting policies as described in Note 2.2 to the financial information and the Guidelines on Investment-linked Insurance/Takaful Business issued by Bank Negara Malaysia.
Basis for OpinionWe conducted our audit in accordance with approved standards on auditing in Malaysia and International Standards on Auditing. Our responsibilities under those standards are further described in the Auditors’ Responsibilities for the Audit of the Financial Information section of our report. We believe that the audit evidence we have obtained is sufficient and appropriate to provide a basis for our opinion.
Emphasis of MatterWe draw attention to Note 2.1 to the financial information of the Funds, which describes the basis of accounting. The financial information of the Funds are prepared to assist the Funds in complying with the Guidelines on Investment-linked Insurance/Takaful Business issued by Bank Negara Malaysia. As a result, the financial information of the Funds may not be suitable for another purpose. Our report is intended solely for the unitholders of the Funds, as a body and should not be distributed to or used by parties other than the unitholders of the Funds. Our opinion is not modified in respect of this matter.
Independence and Other Ethical ResponsibilitiesWe are independent of the Funds in accordance with the By-Laws (on Professional Ethics, Conduct and Practice) of the Malaysian Institute of Accountants (“By-Laws”) and the International Ethics Standards Board for Accountants’ Code of Ethics for Professional Accountants (“IESBA Code”), and we have fulfilled our other ethical responsibilities in accordance with the By-Laws and the IESBA Code.
Information Other than the Financial Information and Auditors’ Report ThereonThe directors of the Manager ("the directors") are responsible for the other information. The other information comprises the information contained in the Annual Report of the Funds, but does not include the financial information of the Funds and our auditors’ report thereon.
Our opinion on the financial information of the Funds does not cover the other information and we do not express any form of assurance conclusion thereon.
In connection with our audit of the financial information of the Funds, our responsibility is to read the other information and, in doing so, consider whether the other information is materially inconsistent with the financial information of the Funds or our knowledge obtained in the audit or otherwise appears to be materially misstated.
If, based on the work we have performed, we conclude that there is a material misstatement of this other information, we are required to report that fact. We have nothing to report in this regard.
Responsibilities of the Directors of the Manager for the Financial InformationThe directors are responsible for the preparation of financial information of the Funds that give a true and fair view in accordance with the accounting policies as described in Note 2.2 to the financial information and the Guidelines on Investment-linked Insurance/Takaful Business issued by Bank Negara Malaysia. The directors are also responsible for such internal control as the directors determine is necessary to enable the preparation of financial information of the Funds that are free from material misstatement, whether due to fraud or error.

AmMetLife Insurance Berhad Annual Report for the Investment-Linked Funds Financial Year Ended 31 March 201862
Annual Report for the AmMetLife Insurance Berhad Financial Year Ended 31 March 2018 Investment-Linked Funds
Independent Auditors’ Report (Cont’d)
Responsibilities of the Directors of the Manager for the Financial Information (cont’d.)In preparing the financial information of the Funds, the directors are responsible for assessing the Funds’ ability to continue as a going concern, disclosing, as applicable, matters related to going concern and using the going concern basis of accounting unless the directors either intend to liquidate the Funds or to cease operations, or have no realistic alternative but to do so.
Auditors’ Responsibilities for the Audit of the Financial InformationOur objectives are to obtain reasonable assurance about whether the financial information of the Funds as a whole are free from material misstatement, whether due to fraud or error, and to issue an auditors’ report that includes our opinion. Reasonable assurance is a high level of assurance, but is not a guarantee that an audit conducted in accordance with approved standards on auditing in Malaysia and International Standards on Auditing will always detect a material misstatement when it exists. Misstatements can arise from fraud or error and are considered material if, individually or in the aggregate, they could reasonably be expected to influence the economic decisions of users taken on the basis of these financial information.
As part of an audit in accordance with approved standards on auditing in Malaysia and International Standards on Auditing, we exercise professional judgement and maintain professional skepticism throughout the audit. We also:• IdentifyandassesstherisksofmaterialmisstatementofthefinancialinformationoftheFunds,whetherduetofraudorerror,design
and perform audit procedures responsive to those risks, and obtain audit evidence that is sufficient and appropriate to provide a basis for our opinion. The risk of not detecting a material misstatement resulting from fraud is higher than for one resulting from error, as fraud may involve collusion, forgery, intentional omissions, misrepresentations, or the override of internal control.
• Obtainanunderstandingofinternalcontrolrelevanttotheauditinordertodesignauditproceduresthatareappropriateinthecircumstances, but not for the purpose of expressing an opinion on the effectiveness of the Funds’ internal control.
• Evaluate the appropriateness of accounting policies used and the reasonableness of accounting estimates and relateddisclosures made by the directors.
• Conclude on the appropriateness of the directors’ use of the going concern basis of accounting and, based on the auditevidence obtained, whether a material uncertainty exists related to events or conditions that may cast significant doubt on the Funds’ ability to continue as a going concern. If we conclude that a material uncertainty exists, we are required to draw attention in our auditors’ report to the related disclosures in the financial information of the Funds or, if such disclosures are inadequate, to modify our opinion. Our conclusions are based on the audit evidence obtained up to the date of our auditors’ report. However, future events or conditions may cause the Funds to cease to continue as a going concern.
• Evaluatetheoverallpresentation,structureandcontentofthefinancialinformationoftheFunds,includingthedisclosures,andwhether the financial information represent the underlying transactions and events in a manner that achieves fair presentation.
We communicate with the directors of the manager regarding, among other matters, the planned scope and timing of the audit and significant audit findings, including any significant deficiencies in internal control that we identify during our audit.
Ernst & Young Dato' Megat Iskandar Shah Bin Mohamad NorAF: 0039 No. 03083/07/2019 JChartered Accountants Chartered Accountant
Kuala Lumpur, Malaysia28 June 2018

AmMetLife Insurance Berhad Annual Report for the Investment-Linked Funds Financial Year Ended 31 March 2018 63
Annual Report for the AmMetLife Insurance Berhad Financial Year Ended 31 March 2018 Investment-Linked Funds
AmMetLife Equity Fund AmMetLife Bond Fund
2018 2017 2018 2017 Note RM RM RM RM
Assets
Investments 3 22,709,193 20,525,583 10,324,347 8,983,254
Deferred tax assets 4 – – 17,066 12,354
Other receivables 473,186 325,422 186,401 120,736
Cash and bank balances 4,678,596 1,836,044 53,774 1,766,295 Total assets 27,860,975 22,687,049 10,581,588 10,882,639
Liabilities
Provision for taxation 118,502 9,713 186,284 195,259
Deferred tax liabilities 4 249,816 167,567 – –
Other payables 45,442 39,198 17,043 17,331 Total liabilities 413,760 216,478 203,327 212,590
Net asset value of funds (“NAV”) 27,447,215 22,470,571 10,378,261 10,670,049
Represented by:
Unitholders’ contribution 18,720,260 16,260,962 6,098,692 6,722,194
Undistributed income 8,726,955 6,209,609 4,279,569 3,947,855 Unitholders’ capital 5 27,447,215 22,470,571 10,378,261 10,670,049
Units in circulation 5 23,344,659 21,174,271 11,795,727 12,524,097
NAV per unit (RM) 5 1.1757 1.0612 0.8798 0.8520
The accompanying notes form an integral part of the financial information.
Summary of Financial Information
Statements of Assets and Liabilities
As at 31 March 2018

AmMetLife Insurance Berhad Annual Report for the Investment-Linked Funds Financial Year Ended 31 March 201864
Annual Report for the AmMetLife Insurance Berhad Financial Year Ended 31 March 2018 Investment-Linked Funds
Statements of Assets and Liabilities (Cont’d)
As at 31 March 2018
AmMetLife Balanced Fund AmMetLife Dana Teguh
2018 2017 2018 2017 Note RM RM RM RM
Assets
Investments 3 21,955,658 21,236,222 16,500,663 16,519,017
Other receivables 424,648 204,329 321,276 307,710
Cash and bank balances 4,587,723 2,352,749 4,258,583 2,731,334 Total assets 26,968,029 23,793,300 21,080,522 19,558,061
Liabilities
Provision for taxation 162,011 89,336 151,745 96,791
Deferred tax liabilities 4 192,361 129,736 113,386 109,292
Other payables 41,649 131,773 34,385 32,465 Total liabilities 396,021 350,845 299,516 238,548
Net asset value of funds (“NAV”) 26,572,008 23,442,455 20,781,006 19,319,513
Represented by:
Unitholders’ contribution 17,111,079 16,141,426 13,253,239 12,923,137
Undistributed income 9,460,929 7,301,029 7,527,767 6,396,376 Unitholders’ capital 5 26,572,008 23,442,455 20,781,006 19,319,513
Units in circulation 5 23,592,015 22,739,174 17,336,705 17,081,405
NAV per unit (RM) 5 1.1263 1.0309 1.1987 1.1310
The accompanying notes form an integral part of the financial information.

AmMetLife Insurance Berhad Annual Report for the Investment-Linked Funds Financial Year Ended 31 March 2018 65
Annual Report for the AmMetLife Insurance Berhad Financial Year Ended 31 March 2018 Investment-Linked Funds
AmMetLife Oasis Islamic AmMetLife Asia Pacific Equity Fund REITS Fund
2018 2017 2018 2017 Note RM RM RM RM
Assets
Investments 3 3,383,640 3,867,551 2,555,849 1,183,915
Tax recoverable 6,612 3,975 – –
Deferred tax assets 4 32,542 – – –
Other receivables 1,533 65,794 743,431 35,029
Cash and bank balances 207,603 311,364 16,585 106,487 Total assets 3,631,930 4,248,684 3,315,865 1,325,431
Liabilities
Provision for taxation – – 438 1,224
Deferred tax liabilities 4 – 10,139 4,933 15,448
Other payables 19,788 85,090 6,661 5,556 Total liabilities 19,788 95,229 12,032 22,228
Net asset value of funds (“NAV”) 3,612,142 4,153,455 3,303,833 1,303,203
Represented by:
Unitholders’ contribution 2,815,174 3,064,950 3,123,965 1,027,951
Undistributed income 796,968 1,088,505 179,868 275,252 Unitholders’ capital 5 3,612,142 4,153,455 3,303,833 1,303,203
Units in circulation 5 5,962,878 6,338,719 5,042,910 1,906,595
NAV per unit (RM) 5 0.6058 0.6553 0.6551 0.6835
The accompanying notes form an integral part of the financial information.

AmMetLife Insurance Berhad Annual Report for the Investment-Linked Funds Financial Year Ended 31 March 201866
Annual Report for the AmMetLife Insurance Berhad Financial Year Ended 31 March 2018 Investment-Linked Funds
AmMetLife Global Emerging AmMetLife Market Fund Tactical Bond Fund
2018 2017 2018 2017 Note RM RM RM RM
Assets
Investments 3 2,707,293 1,107,420 895,082 650,390
Other receivables 309,761 7,081 21,178 7,251
Cash and bank balances 50,624 92,110 63,172 57,849 Total assets 3,067,678 1,206,611 979,432 715,490
Liabilities
Provision for taxation 1,166 1,168 378 172
Deferred tax liabilities 4 28,701 22,235 2,801 4,140
Other payables 7,215 6,253 5,825 5,377 Total liabilities 37,082 29,656 9,004 9,689
Net asset value of funds (“NAV”) 3,030,596 1,176,955 970,428 705,801
Represented by:
Unitholders’ contribution 2,701,024 924,998 874,724 621,753
Undistributed income 329,572 251,957 95,704 84,048 Unitholders’ capital 5 3,030,596 1,176,955 970,428 705,801
Units in circulation 5 4,347,776 1,822,190 1,636,696 1,208,818
NAV per unit (RM) 5 0.6970 0.6459 0.5929 0.5839
The accompanying notes form an integral part of the financial information.
Statements of Assets and Liabilities (Cont’d)
As at 31 March 2018

AmMetLife Insurance Berhad Annual Report for the Investment-Linked Funds Financial Year Ended 31 March 2018 67
Annual Report for the AmMetLife Insurance Berhad Financial Year Ended 31 March 2018 Investment-Linked Funds
AmMetLife Precious AmMetLife Global Metals Fund Agribusiness Fund
2018 2017 2018 2017 Note RM RM RM RM
Assets
Investments 3 2,804,365 3,479,947 2,328,372 2,292,767
Deferred tax assets 4 248,956 233,973 – –
Tax recoverable 47,798 29,257 – –
Other receivables 26,101 24,560 29,840 18,870
Cash and bank balances 199,874 371,208 788 60 Total assets 3,327,094 4,138,945 2,359,000 2,311,697
Liabilities
Provision for taxation – – 4,019 5,523
Deferred tax liabilities 4 – – 29,275 31,933
Other payables 9,375 9,307 10,463 10,029 Total liabilities 9,375 9,307 43,757 47,485
Net asset value of funds (“NAV”) 3,317,719 4,129,638 2,315,243 2,264,212
Represented by:
Unitholders’ contribution 6,803,554 7,091,553 1,958,591 1,881,641
(Accumulated losses)/ Undistributed income (3,485,835) (2,961,915) 356,652 382,571 Unitholders’ capital 5 3,317,719 4,129,638 2,315,243 2,264,212
Units in circulation 5 13,544,270 14,543,625 3,506,537 3,392,692
NAV per unit (RM) 5 0.2450 0.2839 0.6603 0.6674
The accompanying notes form an integral part of the financial information.
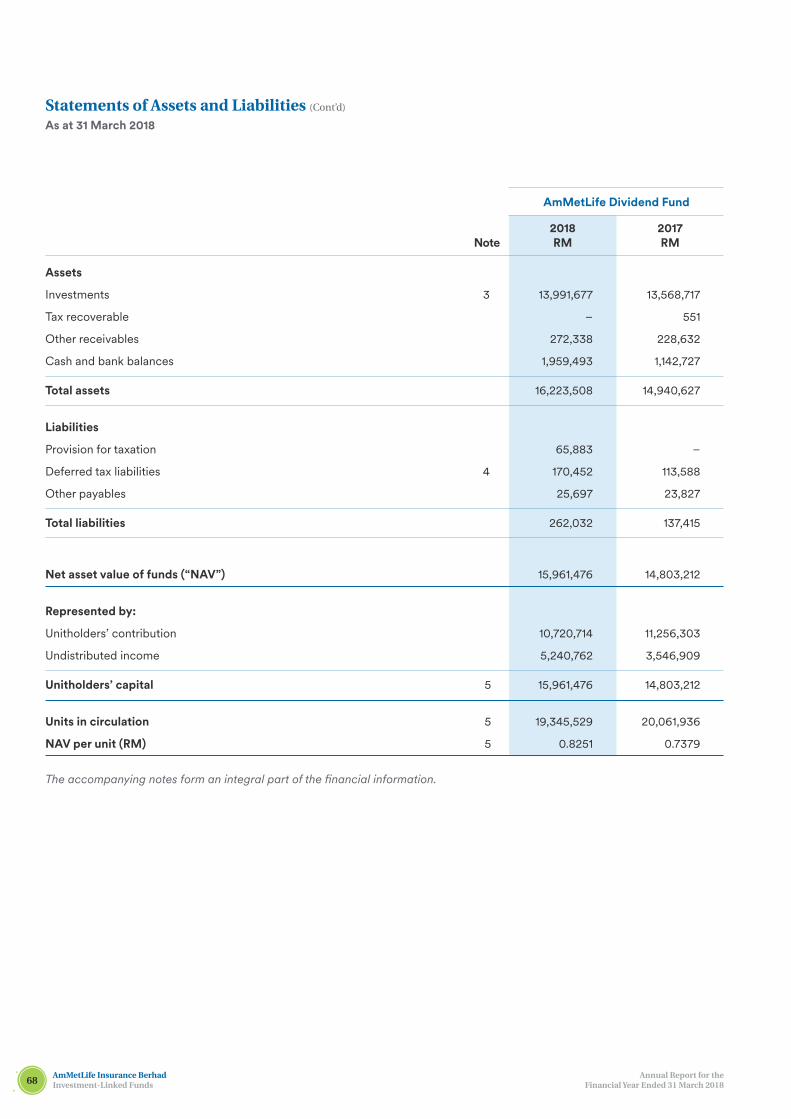
AmMetLife Insurance Berhad Annual Report for the Investment-Linked Funds Financial Year Ended 31 March 201868
Annual Report for the AmMetLife Insurance Berhad Financial Year Ended 31 March 2018 Investment-Linked Funds
AmMetLife Dividend Fund
2018 2017 Note RM RM
Assets
Investments 3 13,991,677 13,568,717
Tax recoverable – 551
Other receivables 272,338 228,632
Cash and bank balances 1,959,493 1,142,727 Total assets 16,223,508 14,940,627
Liabilities
Provision for taxation 65,883 –
Deferred tax liabilities 4 170,452 113,588
Other payables 25,697 23,827 Total liabilities 262,032 137,415
Net asset value of funds (“NAV”) 15,961,476 14,803,212
Represented by:
Unitholders’ contribution 10,720,714 11,256,303
Undistributed income 5,240,762 3,546,909 Unitholders’ capital 5 15,961,476 14,803,212
Units in circulation 5 19,345,529 20,061,936
NAV per unit (RM) 5 0.8251 0.7379
The accompanying notes form an integral part of the financial information.
Statements of Assets and Liabilities (Cont’d)
As at 31 March 2018

AmMetLife Insurance Berhad Annual Report for the Investment-Linked Funds Financial Year Ended 31 March 2018 69
Annual Report for the AmMetLife Insurance Berhad Financial Year Ended 31 March 2018 Investment-Linked Funds
AmMetLife Equity Fund AmMetLife Bond Fund
2018 2017 2018 2017 Note RM RM RM RM
Net investment income:
Interest income 6 80,548 63,386 545,841 579,117
Dividend income 7 735,583 567,593 2,483 20,668
816,131 630,979 548,324 599,785
Gain on disposal of investments 1,222,399 – 8,255 87,464
Net unrealised capital gain 1,028,119 963,683 – –
Other income – 2,615 1 858 Total income 3,066,649 1,597,277 556,580 688,107
Management expenses (362,818) (301,363) (105,941) (113,240)
Loss on disposal of investments – (118,923) – –
Net unrealised capital loss – – (79,286) (104,076) Total outgo (362,818) (420,286) (185,227) (217,316)
Excess of income over outgo before taxation 2,703,831 1,176,991 371,353 470,791
Taxation 8 (186,485) (73,090) (39,639) (75,898)
Excess of income over outgo after taxation 2,517,346 1,103,901 331,714 394,893
Undistributed income brought forward 6,209,609 5,105,708 3,947,855 3,552,962
Undistributed income carried forward 8,726,955 6,209,609 4,279,569 3,947,855
The accompanying notes form an integral part of the financial information.
Summary of Financial Information
Statements of Income and Expenditure
For the financial year ended 31 March 2018

AmMetLife Insurance Berhad Annual Report for the Investment-Linked Funds Financial Year Ended 31 March 201870
Annual Report for the AmMetLife Insurance Berhad Financial Year Ended 31 March 2018 Investment-Linked Funds
Statements of Income and Expenditure (Cont’d)
For the financial year ended 31 March 2018
AmMetLife Balanced Fund AmMetLife Dana Teguh
2018 2017 2018 2017 Note RM RM RM RM
Net investment income:
Interest income 6 335,707 381,663 276,576 292,779
Dividend income 7 547,293 416,395 390,146 312,915 883,000 798,058 666,722 605,694
Gain on disposal of investments 1,023,963 70,690 759,399 56,272
Net unrealised capital gain 762,506 624,898 51,179 479,254
Other income 2 2,784 1 1,499 Total income 2,669,471 1,496,430 1,477,301 1,142,719
Management expenses (338,172) (293,369) (258,938) (239,485)
Total outgo (338,172) (293,369) (258,938) (239,485)
Excess of income over outgo before taxation 2,331,299 1,203,061 1,218,363 903,234
Taxation 8 (171,399) (138,118) (86,972) (84,469)
Excess of income over outgo after taxation 2,159,900 1,064,943 1,131,391 818,765 Undistributed income brought forward 7,301,029 6,236,086 6,396,376 5,577,611
Undistributed income carried forward 9,460,929 7,301,029 7,527,767 6,396,376
The accompanying notes form an integral part of the financial information.

AmMetLife Insurance Berhad Annual Report for the Investment-Linked Funds Financial Year Ended 31 March 2018 71
Annual Report for the AmMetLife Insurance Berhad Financial Year Ended 31 March 2018 Investment-Linked Funds
The accompanying notes form an integral part of the financial information.
AmMetLife AmOasis AmMetLife Asia Pacific Islamic Equity Fund REITS Fund
2018 2017 2018 2017 Note RM RM RM RM
Net investment income:
Interest income 6 7,113 8,340 4,082 2,705
Dividend income 7 197,119 949,330 29,260 46,044 204,232 957,670 33,342 48,749
Gain on disposal of investments – 23,998 817 12,020
Net unrealised capital gain – – – 91,515
Other income 10,778 11,920 1 229 Total income 215,010 993,588 34,160 152,513
Management expenses (8,025) (7,753) (8,227) (6,588)
Loss on disposal of investments (7,744) – – –
Net unrealised capital loss (533,510) (428,998) (131,440) – Total outgo (549,279) (436,751) (139,667) (6,588)
(Deficit)/excess of income over outgo before taxation (334,269) 556,837 (105,507) 145,925
Taxation 8 42,732 31,733 10,123 (8,499)
(Deficit)/excess of income over outgo after taxation (291,537) 588,570 (95,384) 137,426
Undistributed income brought forward 1,088,505 499,935 275,252 137,826
Undistributed income carried forward 796,968 1,088,505 179,868 275,252

AmMetLife Insurance Berhad Annual Report for the Investment-Linked Funds Financial Year Ended 31 March 201872
Annual Report for the AmMetLife Insurance Berhad Financial Year Ended 31 March 2018 Investment-Linked Funds
AmMetLife Global AmMetLife Tactical Emerging Market Fund Bond Fund
2018 2017 2018 2017 Note RM RM RM RM
Net investment income:
Interest income 6 4,602 2,059 1,980 1,509
Dividend income 7 2,671 2,272 29,573 25,276 7,273 4,331 31,553 26,785
Gain on disposal of investments – 2,580 2,103 –
Net unrealised capital gain 80,826 253,577 – 18,680
Other income 4,596 2,627 – 142 Total income 92,695 263,115 33,656 45,607
Management expenses (8,246) (6,072) (6,271) (5,685)
Net unrealised capital loss – – (16,741) – Total outgo (8,246) (6,072) (23,012) (5,685)
Excess of income over outgo before taxation 84,449 257,043 10,644 39,922
Taxation 8 (6,834) (20,657) 1,012 (1,616)
Excess of income over outgo after taxation 77,615 236,386 11,656 38,306 Undistributed income brought forward 251,957 15,571 84,048 45,742
Undistributed income carried forward 329,572 251,957 95,704 84,048
The accompanying notes form an integral part of the financial information.
Statements of Income and Expenditure (Cont’d)
For the financial year ended 31 March 2018

AmMetLife Insurance Berhad Annual Report for the Investment-Linked Funds Financial Year Ended 31 March 2018 73
Annual Report for the AmMetLife Insurance Berhad Financial Year Ended 31 March 2018 Investment-Linked Funds
AmMetLife Precious AmMetLife Global Metals Fund Agribusiness Fund
2018 2017 2018 2017 Note RM RM RM RM
Net investment income:
Interest income 6 6,182 8,417 6,584 6,319 6,182 8,417 6,584 6,319
Gain on disposal of investments – – – 19,064
Net unrealised capital gain – 566,597 – 295,073
Other income 9,513 8,646 6,573 6,133 Total income 15,695 583,660 13,157 326,589
Management expenses (12,674) (13,546) (7,976) (7,667)
Loss on disposal of investments (384,946) (155,416) – –
Net unrealised capital loss (187,278) – (33,232) – Total outgo (584,898) (168,962) (41,208) (7,667)
(Deficit)/excess of income over outgo before taxation (569,203) 414,698 (28,051) 318,922
Taxation 8 45,283 (33,568) 2,132 (25,636)
(Deficit)/excess of income over outgo after taxation (523,920) 381,130 (25,919) 293,286 Undistributed (losses)/income brought forward (2,961,915) (3,343,045) 382,571 89,285
Undistributed (losses)/income carried forward (3,485,835) (2,961,915) 356,652 382,571
The accompanying notes form an integral part of the financial information.

AmMetLife Insurance Berhad Annual Report for the Investment-Linked Funds Financial Year Ended 31 March 201874
Annual Report for the AmMetLife Insurance Berhad Financial Year Ended 31 March 2018 Investment-Linked Funds
AmMetLife Dividend Fund
2018 2017 Note RM RM
Net investment income:
Interest income 6 41,146 38,404
Dividend income 7 468,145 394,678 509,291 433,082
Gain on disposal of investments 827,355 622
Net unrealised capital gain 710,809 573,627
Other income – 416 Total income 2,047,455 1,007,747
Management expenses (227,257) (206,707) Total outgo (227,257) (206,707)
Excess of income over outgo before taxation 1,820,198 801,040
Taxation 8 (126,345) (49,313)
Excess of income over outgo after taxation 1,693,853 751,727 Undistributed income brought forward 3,546,909 2,795,182
Undistributed income carried forward 5,240,762 3,546,909
The accompanying notes form an integral part of the financial information.
Statements of Income and Expenditure (Cont’d)
For the financial year ended 31 March 2018

AmMetLife Insurance Berhad Annual Report for the Investment-Linked Funds Financial Year Ended 31 March 2018 75
Annual Report for the AmMetLife Insurance Berhad Financial Year Ended 31 March 2018 Investment-Linked Funds
Summary of Financial Information
Statements of Changes in Net Asset Value
For the financial year ended 31 March 2018
2018 2017 RM RM
Net asset value at the beginning of the year 22,470,571 20,346,140
Amounts received from units created 11,142,198 8,183,288
Amounts paid for units cancelled (8,682,900) (7,162,758) 24,929,869 21,366,670
Net realised gain after taxation 1,571,476 217,313
Net unrealised capital gain after taxation 945,870 886,588 Net asset value at the end of the year 27,447,215 22,470,571
The accompanying notes form an integral part of the financial information.
AmMetLife Equity Fund
2018 2017 RM RM
Net asset value at the beginning of the year 10,670,049 11,904,335
Amounts received from units created 3,730,927 3,602,125
Amounts paid for units cancelled (4,354,429) (5,231,304) 10,046,547 10,275,156
Net realised gain after taxation 406,288 521,541
Net unrealised capital loss after taxation (74,574) (126,648) Net asset value at the end of the year 10,378,261 10,670,049
AmMetLife Bond Fund

AmMetLife Insurance Berhad Annual Report for the Investment-Linked Funds Financial Year Ended 31 March 201876
Annual Report for the AmMetLife Insurance Berhad Financial Year Ended 31 March 2018 Investment-Linked Funds
Statements of Changes in Net Asset Value (Cont’d)
For the financial year ended 31 March 2018
2018 2017 RM RM
Net asset value at the beginning of the year 23,442,455 22,243,302
Amounts received from units created 9,369,120 7,124,184
Amounts paid for units cancelled (8,399,467) (6,989,974) 24,412,108 22,377,512
Net realised gain after taxation 1,460,019 541,614
Net unrealised capital gain after taxation 699,881 523,329 Net asset value at the end of the year 26,572,008 23,442,455
The accompanying notes form an integral part of the financial information.
2018 2017 RM RM
Net asset value at the beginning of the year 19,319,513 19,370,004
Amounts received from units created 7,118,683 4,806,600
Amounts paid for units cancelled (6,788,581) (5,675,856) 19,649,615 18,500,748
Net realised gain after taxation 1,084,306 396,054
Net unrealised capital gain after taxation 47,085 422,711 Net asset value at the end of the year 20,781,006 19,319,513
AmMetLife Dana Teguh
AmMetLife Balanced Fund

AmMetLife Insurance Berhad Annual Report for the Investment-Linked Funds Financial Year Ended 31 March 2018 77
Annual Report for the AmMetLife Insurance Berhad Financial Year Ended 31 March 2018 Investment-Linked Funds
2018 2017 RM RM
Net asset value at the beginning of the year 4,153,455 3,942,629
Amounts received from units created 594,384 614,364
Amounts paid for units cancelled (844,160) (992,108) 3,903,679 3,564,885
Net realised gain after taxation 199,292 983,249
Net unrealised capital loss after taxation (490,829) (394,679) Net asset value at the end of the year 3,612,142 4,153,455
2018 2017 RM RM
Net asset value at the beginning of the year 1,303,203 921,290
Amounts received from units created 3,473,654 1,056,820
Amounts paid for units cancelled (1,377,640) (812,333) 3,399,217 1,165,777
Net realised gain after taxation 25,541 53,232
Net unrealised capital (loss)/gain after taxation (120,925) 84,194 Net asset value at the end of the year 3,303,833 1,303,203
The accompanying notes form an integral part of the financial information.
AmMetLife Oasis Islamic Equity Fund
AmMetLife Asia Pacific REITS Fund

AmMetLife Insurance Berhad Annual Report for the Investment-Linked Funds Financial Year Ended 31 March 201878
Annual Report for the AmMetLife Insurance Berhad Financial Year Ended 31 March 2018 Investment-Linked Funds
The accompanying notes form an integral part of the financial information.
AmMetLife Tactical Bond Fund
AmMetLife Global Emerging Market Fund
2018 2017 RM RM
Net asset value at the beginning of the year 1,176,955 925,335
Amounts received from units created 2,317,524 96,093
Amounts paid for units cancelled (541,498) (80,859) 2,952,981 940,569
Net realised gain after taxation 3,255 3,095
Net unrealised capital gain after taxation 74,360 233,291 Net asset value at the end of the year 3,030,596 1,176,955
2018 2017 RM RM
Net asset value at the beginning of the year 705,801 545,141
Amounts received from units created 799,751 433,451
Amounts paid for units cancelled (546,780) (311,097) 958,772 667,495
Net realised gain after taxation 27,058 21,120
Net unrealised capital (loss)/gain after taxation (15,402) 17,186 Net asset value at the end of the year 970,428 705,801
Statements of Changes in Net Asset Value (Cont’d)
For the financial year ended 31 March 2018

AmMetLife Insurance Berhad Annual Report for the Investment-Linked Funds Financial Year Ended 31 March 2018 79
Annual Report for the AmMetLife Insurance Berhad Financial Year Ended 31 March 2018 Investment-Linked Funds
2018 2017 RM RM
Net asset value at the beginning of the year 4,129,638 3,819,735
Amounts received from units created 508,585 853,037
Amounts paid for units cancelled (796,584) (924,264) 3,841,639 3,748,508
Net realised loss after taxation (351,625) (140,139)
Net unrealised capital (loss)/gain after taxation (172,295) 521,269 Net asset value at the end of the year 3,317,719 4,129,638
2018 2017 RM RM
Net asset value at the beginning of the year 2,264,212 2,025,933
Amounts received from units created 422,072 468,280
Amounts paid for units cancelled (345,122) (523,287) 2,341,162 1,970,926
Net realised gain after taxation 4,655 21,819
Net unrealised capital (loss)/gain after taxation (30,574) 271,467 Net asset value at the end of the year 2,315,243 2,264,212
The accompanying notes form an integral part of the financial information.
AmMetLife Global Agribusiness Fund
AmMetLife Precious Metals Fund

AmMetLife Insurance Berhad Annual Report for the Investment-Linked Funds Financial Year Ended 31 March 201880
Annual Report for the AmMetLife Insurance Berhad Financial Year Ended 31 March 2018 Investment-Linked Funds
The accompanying notes form an integral part of the financial information.
2018 2017 RM RM
Net asset value at the beginning of the year 14,803,212 14,084,122
Amounts received from units created 2,332,544 1,577,157
Amounts paid for units cancelled (2,868,133) (1,609,794) 14,267,623 14,051,485
Net realised gain after taxation 1,039,908 223,991
Net unrealised capital gain after taxation 653,945 527,736 Net asset value at the end of the year 15,961,476 14,803,212
AmMetLife Dividend Fund
Statements of Changes in Net Asset Value (Cont’d)
For the financial year ended 31 March 2018

AmMetLife Insurance Berhad Annual Report for the Investment-Linked Funds Financial Year Ended 31 March 2018 81
Annual Report for the AmMetLife Insurance Berhad Financial Year Ended 31 March 2018 Investment-Linked Funds
1. The Manager and its principal activity The investment-linked funds of AmMetLife Insurance Berhad ("the Manager") comprise the AmMetLife Equity Fund, AmMetLife
Bond Fund, AmMetLife Balanced Fund, AmMetLife Dana Teguh, AmMetLife Oasis Islamic Equity Fund, AmMetLife Asia Pacific REITS Fund, AmMetLife Global Emerging Market Fund, AmMetLife Tactical Bond Fund, AmMetLife Precious Metals Fund, AmMetLife Global Agribusiness Fund and AmMetLife Dividend Fund (collectively referred to as "the Funds").
The Manager is a public limited liability company incorporated and domiciled in Malaysia and licensed under the Financial Services Act 2013. Its principal activity is the underwriting of life and investment-linked insurance business.
There has been no significant changes in the nature of the principal activities of the Manager during the financial year ended 31 March 2018.
The financial information were authorised for issue by the Board of Directors of the Manager in accordance with a resolution on 28 June 2018.
2. Significant accounting policies 2.1 Basis of Preparation
The financial information of the Funds have been prepared in accordance with the accounting policies as described in Note 2.2 to the financial information and the Guidelines on Investment-Linked Insurance/Takaful Business issued by Bank Negara Malaysia ("BNM").
The financial information have been prepared under the historical cost convention except as disclosed in the significant accounting policies in Note 2.2 to the financial information.
The financial information of the Funds have been prepared on going concern basis.
The financial information are presented in Ringgit Malaysia ("RM").
2.2 Summary of significant accounting policies(a) Management fee
Management fee is charged based on the Funds' daily net assets value, at the following rates:(i) AmMetLife Equity Fund 1.50% per annum(ii) AmMetLife Bond Fund 1.00% per annum(iii) AmMetLife Balanced Fund 1.50% per annum(iv) AmMetLife Dana Teguh 1.50% per annum(v) AmMetLife Oasis Islamic Equity Fund 1.50% per annum(vi) AmMetLife Asia Pacific REITS Fund 1.50% per annum(vii) AmMetLife Global Emerging Market Fund 1.50% per annum(viii) AmMetLife Tactical Bond Fund 1.00% per annum(ix) AmMetLife Precious Metals Fund 1.50% per annum(x) AmMetLife Global Agribusiness Fund 1.50% per annum(xi) AmMetLife Dividend Fund 1.50% per annum
Summary of Financial Information
Note to the Financial Information
31 March 2018

AmMetLife Insurance Berhad Annual Report for the Investment-Linked Funds Financial Year Ended 31 March 201882
Annual Report for the AmMetLife Insurance Berhad Financial Year Ended 31 March 2018 Investment-Linked Funds
Notes to the Financial Information (Cont’d)
(b) Financial instruments – initial recognition and subsequent measurement (i) Date of recognition
All financial assets and liabilities are initially recognised on the trade date, i.e. the date that the Funds become a party to the contractual provisions of the instrument. This includes “regular way trades” purchases or sales of financial assets that require delivery of assets within the time frame generally established by regulation or convention in the market place.
(ii) Initial measurement of financial instruments Financial assets are classified as financial assets at fair value through profit or loss, financial assets available-for-sale, financial assets or loans and receivables, as appropriate. Financial liabilities of the Funds are classified as financial liabilities at fair value through profit or loss or at amortised cost, as appropriate. The Funds determine the classification of its financial assets and financial liabilities at initial recognition.
The classification of financial instruments at initial recognition depends on the purpose and the management’s intention for which the financial instruments were acquired and their characteristics. All financial instruments are measured initially at their fair value plus transaction costs, except in the case of financial assets and financial liabilities recorded at fair value through profit or loss, which is measured at fair value.
The Funds classify the investment into financial assets at fair value through profit or loss ("FVTPL") or loans and receivable ("LAR").
(iii) Subsequent measurement The subsequent measurement of financial instruments depends on their classification as described below:1. FVTPL
Financial assets at FVTPL are recorded in the Statements of Assets and Liabilities at fair value. Changes in fair value are recognised in the Statements of Income and Expenditure. Interest and dividend income or expense are recorded as “Net Investment Income” or “Interest expense”, as appropriate and in accordance with the terms of the contract, or when the right to the payment has been established.
Included in this classification are fixed income securities, collective investment schemes and equities.
2. LARLAR include non–derivative financial assets with fixed or determinable payments that are not quoted in an active market.
After initial measurement, the amounts are subsequently measured at amortised cost using the effective interest rate ("EIR"), less allowance for impairment. Amortised cost is calculated by taking into account any discount or premium on acquisition and fees and costs that are an integral part of the EIR.
(iv) Financial liabilities at amortised cost Financial liabilities of the Funds, that are not designated at FVTPL, are classified as financial liabilities at amortised cost, where the substance of the contractual arrangement results in the Funds having an obligation either to deliver cash or another financial asset to the holder, or to satisfy the obligation other than by the exchange of a fixed amount of cash or another financial asset for a fixed number of own equity instruments.
After initial measurement, these are subsequently measured at amortised cost using the EIR method. Amortised cost is calculated by taking into account any discount or premium on the issue and costs that are an integral part of the EIR.

AmMetLife Insurance Berhad Annual Report for the Investment-Linked Funds Financial Year Ended 31 March 2018 83
Annual Report for the AmMetLife Insurance Berhad Financial Year Ended 31 March 2018 Investment-Linked Funds
(c) Derecognition of financial assets and financial liabilities (i) Financial assets
A financial asset (or, where applicable a part of a financial asset or part of a group of similar financial assets) is derecognised when:
– The rights to receive cash flows from the asset have expired– The Funds have transferred its rights to receive cash flows from the asset or have assumed an
obligation to pay the received cash flows in full without material delay to a third party under a “pass-through” arrangement; and either:
– The Funds have transferred substantially all the risks and rewards of the asset, or– The Funds have neither transferred nor retained substantially all the risks and rewards of the asset,
but have transferred control of the asset.
When the Funds have transferred their rights to receive cash flows from an asset or have entered into a pass–through arrangement, and have neither transferred nor retained substantially all the risks and rewards of the asset nor transferred control of the asset, the asset is recognised to the extent of the Funds continuing involvement in the asset. In that case, the Funds also recognise an associated liability. The transferred asset and the associated liability are measured on a basis that reflects the rights and obligations that the Funds have retained.
(ii) Financial liabilities A financial liability is derecognised when the obligation under the liability is discharged, cancelled or expired. Where an existing financial liability is replaced by another from the same lender on substantially different terms, or the terms of an existing liability are substantially modified, such an exchange or modification is treated as a derecognition of the original liability and the recognition of a new liability. The difference between the carrying value of the original financial liability and the consideration paid is recognised in profit or loss.
(d) Determination of fair value The fair value of financial assets such as equity securities, that are actively traded in organised financial markets is determined by reference to quoted prices for assets at the close of business on the reporting date.
For investment in unit, real estate investment trusts, fair value is determined by reference to published net asset values. Investments in equity that do not have quoted market price in an active market and whose fair value cannot be reliaby measured will be stated at cost less impairment losses.
For financial instruments where there is no active market such as unquoted fixed income securities i.e. unquoted bond, fair value is obtained from Bond Pricing Agency Malaysia Sdn. Bhd. ("BPAM").
If the fair value cannot be measured reliaby, financial instruments are measured at cost, being the fair value of the consideration paid for the acquisition of the instruments or the amount received on issuing the financial liability. All transaction costs directly attributable to the acquisition are also included in the cost of the investment.
The fair value of Negotiable Instruments of Deposit ("NID") are based on broker quotes, whereas the fair value of fixed/yield bearing deposits is the principal itself.

AmMetLife Insurance Berhad Annual Report for the Investment-Linked Funds Financial Year Ended 31 March 201884
Annual Report for the AmMetLife Insurance Berhad Financial Year Ended 31 March 2018 Investment-Linked Funds
(e) Impairment of financial assetsThe Funds assess at each reporting date whether there is any objective evidence that a financial asset or a group of financial assets is impaired. A financial asset or a group of financial assets is deemed to be impaired if, and only if, there is objective evidence of impairment as a result of one or more events that has occurred after the initial recognition of the asset (an incurred “loss event”) and that loss event (or events) has an impact on the estimated future cash flows of the financial asset or the group of financial assets that can be reliably estimated.
Financial assets carried at amortised costEvidence of impairment may include indications that the borrower or a group of borrowers is experiencing significant financial difficulty, the probability that they will enter bankruptcy or other financial reorganisation, default or delinquency in interest or principal payments and where observable data indicates that there is a measurable decrease in the estimated future cash flows, such as changes in arrears or economic conditions that correlate with defaults.
For financial assets carried at amortised cost, the Funds first assess individually whether objective evidence of impairment exists for financial assets that are individually significant, or collectively for financial assets that are not individually significant. If the Funds determine that no objective evidence of impairment exists for an individually assessed financial asset, it includes the asset in a group of financial assets with similar credit risk characteristics and collectively assesses them for impairment. Assets that are individually assessed for impairment and for which an impairment loss is, or continues to be, recognised are not included in a collective assessment of impairment.
If there is objective evidence that an impairment loss has been incurred, the amount of the loss is measured as the difference between the asset’s carrying amount and the present value of estimated future cash flows (excluding future expected credit losses that have not yet been incurred). The carrying amount of the asset is reduced through the use of an allowance account and the amount of the loss is recognised in the Statements of Income and Expenditure. Interest income continues to be accrued on the reduced carrying amount and is accrued using the rate of interest used to discount the future cash flows for the purpose of measuring the impairment loss. The interest income is recorded as part of “Interest income”. LAR together with the associated allowance are written off when there is no realistic prospect of future recovery and all collateral has been realised or has been transferred to the Funds. If, in a subsequent year, the amount of the estimated impairment loss increases or decreases because of an event occurring after the impairment was recognised, the previously recognised impairment loss is increased or reduced by adjusting the allowance account. If a future write-off is later recovered, the recovery is credited to the “Impairment losses on LAR" to the extent that the carrying amount of the asset does not exceed its amortised cost at the reversal date.
The present value of the estimated future cash flows is discounted at the financial asset’s original EIR. If LAR have variable interest rates, the discount rate for measuring any impairment loss is the current EIR. If the Funds have reclassified trading assets to LAR, the discount rate for measuring any impairment loss is the new EIR determined at the reclassification date. The calculation of the present value of the estimated future cash flows of a collateralised financial asset reflects the cash flows that may result from foreclosure less costs for obtaining and selling the collateral, whether or not foreclosure is probable.
(f) Offsetting financial instrumentsFinancial assets and financial liabilities are offset and the net amount reported in the Statements of Assets and Liabilities if, and only if, there is a currently enforceable legal right to offset the recognised amounts and there is an intention to settle on a net basis, or to realise the asset and settle the liability simultaneously. This is generally not the case with master netting agreements, therefore, the related assets and liabilities are presented gross in the Statements of Assets and Liabilities.
Notes to the Financial Information (Cont’d)

AmMetLife Insurance Berhad Annual Report for the Investment-Linked Funds Financial Year Ended 31 March 2018 85
Annual Report for the AmMetLife Insurance Berhad Financial Year Ended 31 March 2018 Investment-Linked Funds
(g) Impairment of non-financial assets The Funds assess at each reporting date whether there is an indication that an asset may be impaired. If any indication exists, or when annual impairment testing for an asset is required, the Funds estimate the asset’s recoverable amount. An asset’s recoverable amount is the higher of an asset’s or cash-generating unit’s (“CGU”) fair value less costs to sell and its value in use. Where the carrying amount of an asset or CGU exceeds its recoverable amount. An asset is considered impaired and is written down to its recoverable amount. In assessing value in use, the estimated future cash flows are discounted to their present value using a pre-tax discount rate that reflects current market assessment of the time value of money and the risks specific to the asset. In determining fair value less costs to sell, an appropriate valuation model is used. These calculations are corroborated by valuation multiples, quoted share prices for publicly traded entities or other available fair value indicators.
For assets excluding goodwill, an assessment is made at each reporting date as to whether there is any indication that previously recognised impairment losses may no longer exist or may have decreased. If such indication exists, the Funds estimate the asset’s or CGU’s recoverable amount. A previously recognised impairment loss is reversed only if there has been a change in the assumptions used to determine the asset’s recoverable amount since the last impairment loss was recognised. The reversal is limited so that the carrying amount of the asset does not exceed its recoverable amount, nor exceed the carrying amount that would have been determined, net of depreciation or amortisation, had no impairment loss been recognised for the asset in prior years. Such reversal is recognised in the Statements of Income and Expenditure.
(h) Net creation of units Net creation of units represents premiums paid by policyholders as payment for a new contract or subsequent payments to increase the amount of that contract less switching costs, if any, within funds. Net creation of units is recognised on a receipt basis.
(i) Net cancellation of units Net cancellation of units represents cancellation of units arising from surrenders and withdrawals. Net cancellation is recognised upon surrendering of the related insurance contract.
(j) Other revenue recognition Revenue is recognised to the extent that it is probable that the economic benefits will flow to the Funds and the revenue can be reliably measured. The following specific recognition criteria must be met before revenue is recognised.
(i) Interest income Interest and financing income and expense are recognised in profit or loss using the effective interest method. Once a financial asset or a group of similar financial assets has been written down as a result of an impairment loss, interest income is recognised using the rate of interest used to discount the future cash flows for the purpose of measuring the impairment loss.
(ii) Realised gains and losses on investments On disposal of investments, the difference between the net disposal proceeds and the carrying amount of investment is credited or charged to Statements of Income and Expenditure.
(iii) Dividend income Dividend income represents gross dividends from quoted and unquoted investments and is recognised when the right to receive payment is established.

AmMetLife Insurance Berhad Annual Report for the Investment-Linked Funds Financial Year Ended 31 March 201886
Annual Report for the AmMetLife Insurance Berhad Financial Year Ended 31 March 2018 Investment-Linked Funds
(k) Income taxIncome tax on the profit and loss comprises current and deferred tax. Current tax is the expected amount of income taxes payable in respect of the taxable profit for the year and is measured using the tax rates that have been enacted on the date of the Statements of Assets and Liabilities.
Deferred tax is provided for, using the liability method, on temporary differences at the date of Statements of Assets and Liabilities between the tax bases of assets and liabilities and their carrying amounts in the financial information. In principle, deferred tax liabilities are recognised for all taxable temporary differences and deferred tax assets are recognised for all deductible temporary differences, to the extent that it is probable that taxable profits will be available against which the deductible temporary differences can be utilised.
Deferred tax is measured at the tax rates that are expected to apply in the period when the asset is realised or the liability is settled, based on tax rates that have been enacted or substantively enacted at the date of Statements of Assets and Liabilities. Deferred tax is recognised as income or an expense in the Statements of Income and Expenditure, except when it arises from a transaction which is recognised directly in unitholders' capital, in which case, the deferred tax is also recognised in unitholders' capital.
(l) ProvisionsProvisions are recognised when the Funds have a present obligation as a result of a past event and it is probable that an outflow of resources embodying economic benefits will be required to settle the obligation, and a reliable estimate of the amount can be made. Provisions are reviewed at each Statements of Assets and Liabilities date and adjusted to reflect the current best estimate. Where the effect of the time value of money is material, provisions are discounted using a current pre-tax rate that reflects, where appropriate, the risks specific to the liability. Where discounting is used, the increase in the provision due to the passage of time is recognised as finance cost.
(m) Foreign currencies transactions (i) Functional and presentation currency
The financial statements are presented in Ringgit Malaysia ("RM") which is also the functional and presentation currency of the Funds.
(ii) Foreign currency transaction Transactions in foreign currencies are initially recorded in the functional currency rate prevailing at the dates of the transactions. Monetary assets and liabilities denominated in foreign currencies are re-translated at the functional currency rate of exchange ruling at the reporting date. All differences are taken to profit or loss. Non-monetary items denominated in foreign currencies that are measured at historical cost are translated using the exchange rates as at the dates of initial transactions.
Non-monetary items measured at fair value in a foreign currency are translated using the exchange rates at the date when the fair value was determined. All foreign exchange differences are taken to profit or loss, except for differences relating to items where gains or losses are recognised directly in equity, in which case, the gain or loss is recognised net of the exchange component in equity.
(n) Cash and cash equivalentsCash and cash equivalents consist of cash and bank balances, excluding fixed and call deposits.
Notes to the Financial Information (Cont’d)

AmMetLife Insurance Berhad Annual Report for the Investment-Linked Funds Financial Year Ended 31 March 2018 87
Annual Report for the AmMetLife Insurance Berhad Financial Year Ended 31 March 2018 Investment-Linked Funds
2018 2017 RM RM
Quoted equity securities 22,267,521 20,182,682
Quoted unit and property trust funds 441,672 342,901
22,709,193 20,525,583
FVTPL:
Quoted equity securities
Cost 19,103,788 18,084,089
Net unrealised gain 3,163,733 2,098,593
Fair value 22,267,521 20,182,682
Quoted unit and property trust funds
Cost 482,705 346,913
Net unrealised loss (41,033) (4,012)
Fair value 441,672 342,901
Total investments at FVTPL 22,709,193 20,525,583
Total investments 22,709,193 20,525,583
3. Investments
(i) AmMetLife Equity Fund

AmMetLife Insurance Berhad Annual Report for the Investment-Linked Funds Financial Year Ended 31 March 201888
Annual Report for the AmMetLife Insurance Berhad Financial Year Ended 31 March 2018 Investment-Linked Funds
2018
No. of Cost Fair value Fair value as Units RM RM % of NAV
FVTPL:
Quoted equity securities
Construction
Econpile Holdings Berhad 411,500 484,912 405,328 1.48%
Econpile Holdings Berhad – Warrants 82,300 – 14,814 0.05%
Gamuda Berhad 73,200 337,419 379,176 1.38%
Gamuda Berhad – Warrants 10,616 2,654 12,633 0.05%
IJM Corporation Berhad 171,300 573,232 459,084 1.67%
Sunway Construction Group Berhad 184,700 327,589 380,482 1.39%
Consumer
Padini Holdings Berhad 61,000 246,062 272,670 0.99%
Finance
CIMB Group Holdings Berhad 193,462 1,082,364 1,390,992 5.07%
Hong Leong Bank Berhad 44,200 754,370 830,960 3.03%
Malayan Banking Berhad 252,990 2,199,385 2,681,694 9.77%
Public Bank Berhad 83,400 1,516,138 2,001,600 7.29%
Industrial Products
Denko Industrial Corporation Berhad 220,300 343,275 352,480 1.28%
Hartalega Holdings Berhad 59,600 248,131 360,580 1.31%
Petron Malaysia Refining & Marketing Bhd 22,500 231,910 193,275 0.70%
Petronas Chemicals Group Berhad 168,400 1,270,889 1,390,984 5.07%
Top Glove Corporation Bhd 44,800 223,442 431,872 1.57%
Uchi Technologies Bhd 78,600 260,062 209,862 0.76%
V.S Industry Berhad 320,550 596,475 759,704 2.77%
Wah Seong Corporation Berhad 171,000 183,698 247,950 0.90%
Plantations
Kuala Lumpur Kepong Berhad 14,800 346,830 378,584 1.38%
Sime Darby Plantation Berhad 76,862 389,614 424,278 1.55%
3. Investments (Cont’d)
(i) AmMetLife Equity Fund (Cont’d)
The composition, costs and fair values of the FVTPL investments in Malaysia as at 31 March 2018 are as detailed below:
Notes to the Financial Information (Cont’d)

AmMetLife Insurance Berhad Annual Report for the Investment-Linked Funds Financial Year Ended 31 March 2018 89
Annual Report for the AmMetLife Insurance Berhad Financial Year Ended 31 March 2018 Investment-Linked Funds
2018
No. of Cost Fair value Fair value as Units RM RM % of NAV
FVTPL: (Cont’d)
Quoted equity securities (Cont’d)
Technology
Globetronics Technology Berhad 90,600 421,875 367,836 1.34%
Inari Amertron Berhad 189,700 291,988 521,675 1.90%
Trading & Services
AirAsia Berhad 129,800 399,312 510,114 1.86%
Axiata Group Berhad 170,782 897,901 930,762 3.39%
Bermaz Auto Berhad 230,700 501,073 498,312 1.82%
Bumi Armada Berhad 307,200 272,540 256,512 0.93%
Dialog Group Berhad 190,300 319,113 584,221 2.13%
Genting Berhad 96,600 802,160 843,318 3.07%
Genting Malaysia Berhad 41,100 188,070 201,390 0.73%
My E.G. Services Berhad 102,800 221,073 298,120 1.09%
Mynews Holdings Berhad 25,200 29,687 36,540 0.13%
Serba Dinamik Holdings Berhad 236,600 811,393 809,172 2.95%
Sime Darby Berhad 76,862 129,040 202,915 0.74%
Telekom Malaysia Berhad 95,200 614,360 496,944 1.81%
Tenaga Nasional Berhad 131,200 1,585,752 2,130,688 7.76%
19,103,788 22,267,521 81.13%
Quoted unit and property trust funds
KLCC Real Estate Investment Trust 61,600 482,705 441,672 1.61%
Total investments at FVTPL 19,586,493 22,709,193 82.74%
(i) AmMetLife Equity Fund (Cont’d)

AmMetLife Insurance Berhad Annual Report for the Investment-Linked Funds Financial Year Ended 31 March 201890
Annual Report for the AmMetLife Insurance Berhad Financial Year Ended 31 March 2018 Investment-Linked Funds
2018 2017 RM RM
Malaysian Government Securities 692,587 –
Unquoted corporate bonds 8,887,733 8,960,882
Unquoted unit and property trust funds 25,027 22,372
Deposits with licensed financial institutions 719,000 –
10,324,347 8,983,254
FVTPL:Malaysian Government Securities
Cost 695,975 –
Net unrealised loss (3,388) –
Fair value 692,587 –
Unquoted corporate bonds
Cost 9,097,980 9,116,780
Net unrealised loss (210,247) (155,898)
Fair value 8,887,733 8,960,882
Unquoted unit and property trust funds
Cost 24,712 20,893
Net unrealised gain 315 1,479
Fair value 25,027 22,372
Total investments at FVTPL 9,605,347 8,983,254
LAR:
Deposits with licensed financial institutions 719,000 –
Total investments 10,324,347 8,983,254
3. Investments (Cont’d)
(ii) AmMetLife Bond Fund
Notes to the Financial Information (Cont’d)

AmMetLife Insurance Berhad Annual Report for the Investment-Linked Funds Financial Year Ended 31 March 2018 91
Annual Report for the AmMetLife Insurance Berhad Financial Year Ended 31 March 2018 Investment-Linked Funds
2018
No. of Cost Fair value Fair value as Units RM RM % of NAV
FVTPL:
Malaysian government securities 700,000 695,975 692,587 6.67%
695,975 692,587 6.67%
Unquoted corporate bonds
Sistem Penyuraian Trafik KL Barat Sdn Bhd due 28/12/2018 1,300,000 1,335,880 1,317,303 12.69% RHB Bank Berhad Hybrid Tier 1 due 29/03/2019 1,300,000 1,550,900 1,342,224 12.93% Konsortium Lebuhraya Utara-Timur (KL) Sdn Bhd due 02/12/2026 400,000 389,800 397,840 3.83%Sime Darby Berhad due 24/03/2026 1,500,000 1,500,000 1,567,470 15.10% Tanjung Bin Energy Issuer Berhad due 15/09/2031 900,000 984,150 987,687 9.52% Sarawak Energy Berhad due 25/04/2036 500,000 500,300 485,870 4.68%Projek Lebuhraya Usahasama Berhad due 12/01/2026 500,000 520,550 504,215 4.86%Manjung Island Energy Berhad due 25/11/2025 1,000,000 1,013,700 990,670 9.55%Sarawak Hidro Sdn Bhd due 11/08/2026 300,000 301,200 295,044 2.84%Gamuda Berhad due 16/03/2023 1,000,000 1,001,500 999,410 9.63%
9,097,980 8,887,733 85.64%
Unquoted unit and property trust funds
AmBond Fund 15,569 18,728 18,606 0.18%AmDynamic Bond Fund 9,920 5,984 6,421 0.06%
24,712 25,027 0.24%
Total investments at FVTPL 9,818,667 9,605,347 92.55%
(ii) AmMetLife Bond Fund (Cont’d)
The composition, costs and fair values of the FVTPL investments in Malaysia as at 31 March 2018 are as detailed below:

AmMetLife Insurance Berhad Annual Report for the Investment-Linked Funds Financial Year Ended 31 March 201892
Annual Report for the AmMetLife Insurance Berhad Financial Year Ended 31 March 2018 Investment-Linked Funds
2018 2017 % %
Malaysian government securities 4.93 –Unquoted corporate bonds – secured – 4.98Unquoted corporate bonds – unsecured 4.97 5.00
Deposits with licensed financial institutions 3.50 –
3. Investments (Cont’d)
(ii) AmMetLife Bond Fund (Cont’d)
The weighted average effective interest rates per annum are as follows:
2018 2017 RM RM
Quoted equity securities 17,660,512 15,699,664
Unquoted corporate bonds 4,295,146 5,318,717
Quoted unit and property trust funds – 217,841
21,955,658 21,236,222
FVTPL:
Quoted equity securities
Cost 15,193,912 14,017,212
Net unrealised gain 2,466,600 1,682,452
Fair value 17,660,512 15,699,664
Unquoted corporate bonds
Cost 4,357,240 5,377,540
Net unrealised loss (62,094) (58,823)
Fair value 4,295,146 5,318,717
Quoted unit and property trust funds
Cost – 219,769
Net unrealised gain – (1,928)
Fair value – 217,841
Total investments at FVTPL 21,955,658 21,236,222
Total investments 21,955,658 21,236,222
(iii) AmMetLife Balanced Fund
Notes to the Financial Information (Cont’d)

AmMetLife Insurance Berhad Annual Report for the Investment-Linked Funds Financial Year Ended 31 March 2018 93
Annual Report for the AmMetLife Insurance Berhad Financial Year Ended 31 March 2018 Investment-Linked Funds
2018
No. of Cost Fair value Fair value as Units RM RM % of NAV
FVTPL:
Quoted equity securities
Construction
Econpile Holdings Berhad 409,750 486,149 403,604 1.52%
Econpile Holdings Berhad – Warrants 81,950 – 14,751 0.06%
Gamuda Berhad 34,100 168,107 176,638 0.66%
Gamuda Berhad – Warrants 10,200 2,550 12,138 0.05%
IJM Corporation Berhad 162,500 552,993 435,500 1.64%
Sunway Construction Group Berhad 157,500 279,376 324,450 1.22%
Consumer
Padini Holdings Berhad 59,200 247,440 264,624 1.00%
Finance
CIMB Group Holdings Berhad 131,044 730,499 942,206 3.55%
Hong Leong Bank Berhad 42,900 755,806 806,520 3.04%
Malayan Banking Berhad 167,716 1,486,939 1,777,790 6.69%
Public Bank Berhad 67,400 1,238,382 1,617,600 6.09%
Industrial Products
Denko Industrial Corporation Berhad 213,400 332,523 341,440 1.28%
Hartalega Holdings Berhad 59,400 247,299 359,370 1.35%
Petron Malaysia Refining & Marketing Bhd 21,700 223,750 186,403 0.70%
Petronas Chemicals Group Berhad 114,400 833,823 944,944 3.56%
Top Glove Corporation Bhd 43,200 215,437 416,448 1.57%
Uchi Technologies Bhd 78,300 259,066 209,061 0.79%
V.S Industry Berhad 283,000 513,487 670,710 2.52%
Wah Seong Corporation Berhad 166,500 178,863 241,425 0.91%
(iii) AmMetLife Balanced Fund (Cont’d)
The composition, costs and fair values of the FVTPL investments in Malaysia as at 31 March 2018 are as detailed below:

AmMetLife Insurance Berhad Annual Report for the Investment-Linked Funds Financial Year Ended 31 March 201894
Annual Report for the AmMetLife Insurance Berhad Financial Year Ended 31 March 2018 Investment-Linked Funds
2018
No. of Cost Fair value Fair value as Units RM RM % of NAV
FVTPL: (Cont’d)
Quoted equity securities (Cont’d)
Plantations
Kuala Lumpur Kepong Berhad 9,900 231,996 253,242 0.95%
Sime Darby Plantation Berhad 80,678 429,220 445,343 1.68%
Technology
Globetronics Technology Berhad 88,000 412,436 357,280 1.34%
Inari Amertron Berhad 219,200 361,063 602,800 2.27%
Trading & Services
AirAsia Berhad 125,100 391,269 491,643 1.85%
Axiata Group Berhad 118,412 615,630 645,345 2.43%
Bermaz Auto Berhad 246,200 526,220 531,792 2.00%
Bumi Armada Berhad 299,900 266,068 250,416 0.94%
Dialog Group Berhad 162,500 272,524 498,875 1.88%
Genting Berhad 56,200 460,816 490,626 1.85%
Genting Malaysia Berhad 29,200 122,677 143,080 0.54%
My E.G. Services Berhad 100,000 215,087 290,000 1.09%
Mynews Holdings Berhad 25,400 29,923 36,830 0.14%
Serba Dinamik Holdings Berhad 188,200 648,901 643,644 2.42%
Sime Darby Berhad 80,678 142,158 212,990 0.80%
Telekom Malaysia Berhad 38,000 243,358 198,360 0.75%
Tenaga Nasional Berhad 87,600 1,072,077 1,422,624 5.35%
15,193,912 17,660,512 66.46%
3. Investments (Cont’d)
(iii) AmMetLife Balanced Fund (Cont’d)
Notes to the Financial Information (Cont’d)

AmMetLife Insurance Berhad Annual Report for the Investment-Linked Funds Financial Year Ended 31 March 2018 95
Annual Report for the AmMetLife Insurance Berhad Financial Year Ended 31 March 2018 Investment-Linked Funds
2018
No. of Cost Fair value Fair value as Units RM RM % of NAV
FVTPL: (Cont’d)
Unquoted corporate bonds
Encorp Systembilt Sdn Bhd due 16/11/2018 500,000 497,200 501,245 1.89%
Sistem Penyuraian Trafik KL Barat Sdn Bhd due 28/12/2018 1,900,000 1,952,440 1,925,289 7.25%
Sarawak Hidro Sdn Bhd due 11/08/2026 1,900,000 1,907,600 1,868,612 7.03%
4,357,240 4,295,146 16.16%
Total investments at FVTPL 19,551,152 21,955,658 82.63%
2018 2017 % %
Unquoted corporate bonds – secured – 4.98Unquoted corporate bonds – unsecured 5.02 5.03
The weighted average effective interest rates per annum are as follows:
(iii) AmMetLife Balanced Fund (Cont’d)

AmMetLife Insurance Berhad Annual Report for the Investment-Linked Funds Financial Year Ended 31 March 201896
Annual Report for the AmMetLife Insurance Berhad Financial Year Ended 31 March 2018 Investment-Linked Funds
2018 2017 RM RM
Quoted equity securities 11,788,466 12,084,396
Quoted unit and property trust funds 254,535 –
Unquoted corporate bonds 3,783,081 3,786,777
Unquoted unit and property trust funds 674,581 647,844
16,500,663 16,519,017
FVTPL:
Quoted equity securities
Cost 10,314,812 10,706,935
Net unrealised gain 1,473,654 1,377,461
Fair value 11,788,466 12,084,396
Quoted unit and property trust funds
Cost 278,230 –
Net unrealised gain (23,695) –
Fair value 254,535 –
Unquoted corporate bonds
Cost 3,826,840 3,826,840
Net unrealised loss (43,759) (40,063)
Fair value 3,783,081 3,786,777
Unquoted unit and property trust funds
Cost 663,452 619,091
Net unrealised gain 11,129 28,753
Fair value 674,581 647,844
Total investments at FVTPL 16,500,663 16,519,017
Total investments 16,500,663 16,519,017
3. Investments (Cont’d)
(iv) AmMetLife Dana Teguh
Notes to the Financial Information (Cont’d)

AmMetLife Insurance Berhad Annual Report for the Investment-Linked Funds Financial Year Ended 31 March 2018 97
Annual Report for the AmMetLife Insurance Berhad Financial Year Ended 31 March 2018 Investment-Linked Funds
2018
No. of Cost Fair value Fair value as Units RM RM % of NAV
FVTPL:
Quoted equity securities
Construction
Econpile Holdings Berhad 438,250 252,634 431,676 2.08%
Econpile Holdings Berhad – Warrants 87,650 – 15,777 0.08%
Gamuda Berhad 28,300 139,356 146,594 0.71%
Gamuda Berhad – Warrants 12,016 3,004 14,299 0.07%
IJM Corporation Berhad 131,600 418,171 352,688 1.70%
Ikhmas Jaya Group Berhad 198,200 144,158 74,325 0.36%
Sunway Construction Group Berhad 141,900 296,997 292,314 1.41%
Consumer
Padini Holdings Berhad 46,200 192,511 206,514 0.99%
Finance
BIMB Holdings Berhad 103,900 435,541 408,327 1.96%
Industrial Products
Denko Industrial Corporation Berhad 170,600 265,831 272,960 1.31%
Hartalega Holdings Berhad 49,400 205,700 298,870 1.44%
Petron Malaysia Refining & Marketing Bhd 17,600 181,486 151,184 0.73%
Petronas Chemicals Group Berhad 127,600 965,113 1,053,976 5.07%
Top Glove Corporation Bhd 34,400 171,569 331,616 1.60%
Uchi Technologies Bhd 65,100 215,400 173,817 0.84%
V.S Industry Berhad 251,675 446,611 596,470 2.87%
Wah Seong Corporation Berhad 130,400 140,082 189,080 0.91%
(iv) AmMetLife Dana Teguh (Cont’d)
The composition, costs and fair values of the FVTPL investments in Malaysia as at 31 March 2018 are as detailed below:

AmMetLife Insurance Berhad Annual Report for the Investment-Linked Funds Financial Year Ended 31 March 201898
Annual Report for the AmMetLife Insurance Berhad Financial Year Ended 31 March 2018 Investment-Linked Funds
2018
No. of Cost Fair value Fair value as Units RM RM % of NAV
FVTPL: (Cont’d)
Quoted equity securities (Cont’d)
Plantations
Kuala Lumpur Kepong Berhad 16,300 380,497 416,954 2.01%
Sime Darby Plantation Berhad 77,934 414,002 430,196 2.07%
Technology
Globetronics Technology Berhad 69,000 335,913 280,140 1.35%
Inari Amertron Berhad 153,200 237,249 421,300 2.03%
Trading & Services
Axiata Group Berhad 153,321 822,421 835,599 4.02%
Bermaz Auto Berhad 235,100 520,886 507,816 –
Dialog Group Berhad 168,800 283,082 518,216 2.49%
IHH Healthcare Berhad 34,600 213,281 209,330 1.01%
My E.G. Services Berhad 78,400 165,555 227,360 1.09%
Serba Dinamik Holdings Berhad 179,500 618,858 613,890 2.95%
Sime Darby Berhad 77,934 137,118 205,746 0.99%
Telekom Malaysia Berhad 77,200 489,148 402,984 1.94%
Tenaga Nasional Berhad 105,200 1,222,638 1,708,448 8.22%
10,314,812 11,788,466 56.73%
3. Investments (Cont’d)
(iv) AmMetLife Dana Teguh (Cont’d)
Notes to the Financial Information (Cont’d)

AmMetLife Insurance Berhad Annual Report for the Investment-Linked Funds Financial Year Ended 31 March 2018 99
Annual Report for the AmMetLife Insurance Berhad Financial Year Ended 31 March 2018 Investment-Linked Funds
2018
No. of Cost Fair value Fair value as Units RM RM % of NAV
FVTPL: (Cont’d)
Quoted unit and property trust funds
KLCC Real Estate Investment Trust 35,500 278,230 254,535 1.22%
Unquoted corporate bonds
Encorp Systembilt Sdn Bhd due 16/11/2018 1,000,000 994,400 1,002,490 4.82%
Sistem Penyuraian Trafik KL Barat Sdn Bhd due 28/12/2018 900,000 924,840 911,979 4.39%
Sarawak Hidro Sdn Bhd due 11/08/2026 1,900,000 1,907,600 1,868,612 8.99%
3,826,840 3,783,081 18.20%
Unquoted unit and property trust funds
AmBon Islam Fund 562,949 663,452 674,581 3.25%
Total investments at FVTPL 15,083,334 16,500,663 79.40%
(iv) AmMetLife Dana Teguh (Cont’d)
2018 2017 % %
Unquoted corporate bonds – unsecured 4.76 4.76
The weighted average effective interest rates per annum are as follows:

AmMetLife Insurance Berhad Annual Report for the Investment-Linked Funds Financial Year Ended 31 March 2018100
Annual Report for the AmMetLife Insurance Berhad Financial Year Ended 31 March 2018 Investment-Linked Funds
2018 2017 RM RM
Unquoted unit and property trust funds 3,383,640 3,867,551
FVTPL:
Unquoted unit and property trust funds
Cost 3,790,418 3,740,819
Net unrealised gain (406,778) 126,732
Fair value 3,383,640 3,867,551
Total investments at FVTPL 3,383,640 3,867,551
Total investments 3,383,640 3,867,551
3. Investments (Cont’d)
(v) AmMetLife Oasis Islamic Equity Fund
2018
No. of Cost Fair value Fair value as Units RM RM % of NAV
FVTPL:
Unquoted unit and property trust funds
AmOasis Global Islamic Equity 3,970,011 3,790,418 3,383,640 93.67%
Total investments at FVTPL 3,790,418 3,383,640 93.67%
The composition, costs and fair values of the FVTPL investments in Malaysia as at 31 March 2018 are as detailed below:
Notes to the Financial Information (Cont’d)

AmMetLife Insurance Berhad Annual Report for the Investment-Linked Funds Financial Year Ended 31 March 2018 101
Annual Report for the AmMetLife Insurance Berhad Financial Year Ended 31 March 2018 Investment-Linked Funds
2018 2017 RM RM
Unquoted unit and property trust funds 2,420,040 1,183,915
Deposits with licensed financial institutions 135,809 –
2,555,849 1,183,915 FVTPL:
Unquoted unit and property trust funds
Cost 2,358,382 990,817
Net unrealised gain 61,658 193,098
Fair value 2,420,040 1,183,915
Total investments at FVTPL 2,420,040 1,183,915
LAR:
Deposits with licensed financial institutions 135,809 –
Total investments 2,555,849 1,183,915
The composition, costs and fair values of the FVTPL investments in Malaysia as at 31 March 2018 are as detailed below:
2018
No. of Cost Fair value Fair value as Units RM RM % of NAV
FVTPL:
Unquoted unit and property trust funds
AmAsia Pacific REITS 3,319,215 2,358,382 2,420,040 73.25%
Total investments at FVTPL 2,358,382 2,420,040 73.25%
(vi) AmMetLife Asia Pacific REITS Fund
2018 2017 % %
Deposits with licensed financial institutions 3.40 –
The weighted average effective interest rates per annum are as follows:

AmMetLife Insurance Berhad Annual Report for the Investment-Linked Funds Financial Year Ended 31 March 2018102
Annual Report for the AmMetLife Insurance Berhad Financial Year Ended 31 March 2018 Investment-Linked Funds
2018 2017 RM RM
Unquoted unit and property trust funds 2,543,844 1,107,420
Deposits with licensed financial institutions 163,449 –
2,707,293 1,107,420 FVTPL:
Unquoted unit and property trust funds
Cost 2,185,085 829,487
Net unrealised gain 358,759 277,933
Fair value 2,543,844 1,107,420
Total investments at FVTPL 2,543,844 1,107,420
LAR:
Deposits with licensed financial institutions 163,449 –
Total investments 2,707,293 1,107,420
3. Investments (Cont’d)
(vii) AmMetLife Global Emerging Market Fund
2018
No. of Cost Fair value Fair value as Units RM RM % of NAV
FVTPL:
Unquoted unit and property trust funds
AmCash Management 98,421 98,421 98,421 3.25%
AmGlobal Emerging Market Opportunities 1,607,879 2,086,664 2,445,423 80.69%
2,185,085 2,543,844 83.94% Total investments at FVTPL 2,185,085 2,543,844 83.94%
The composition, costs and fair values of the FVTPL investments in Malaysia as at 31 March 2018 are as detailed below:
2018 2017 % %
Deposits with licensed financial institutions 3.40 –
The weighted average effective interest rates per annum are as follows:
Notes to the Financial Information (Cont’d)

AmMetLife Insurance Berhad Annual Report for the Investment-Linked Funds Financial Year Ended 31 March 2018 103
Annual Report for the AmMetLife Insurance Berhad Financial Year Ended 31 March 2018 Investment-Linked Funds
2018 2017 RM RM
Unquoted unit and property trust funds 895,082 650,390
FVTPL:
Unquoted unit and property trust funds
Cost 860,070 598,637
Net unrealised gain 35,012 51,753
Fair value 895,082 650,390
Total investments at FVTPL 895,082 650,390
Total investments 895,082 650,390
2018
No. of Cost Fair value Fair value as Units RM RM % of NAV
FVTPL:
Unquoted unit and property trust funds
AmTactical Bond 854,004 860,070 895,082 92.24%
Total investments at FVTPL 860,070 895,082 92.24%
The composition, costs and fair values of the FVTPL investments in Malaysia as at 31 March 2018 are as detailed below:
(viii) AmMetLife Tactical Bond Fund

AmMetLife Insurance Berhad Annual Report for the Investment-Linked Funds Financial Year Ended 31 March 2018104
Annual Report for the AmMetLife Insurance Berhad Financial Year Ended 31 March 2018 Investment-Linked Funds
2018 2017 RM RM
Unquoted unit and property trust funds 2,804,365 3,479,947
Deposits with licensed financial institutions – – 2,804,365 3,479,947
FVTPL:
Unquoted unit and property trust funds
Cost 5,916,311 6,404,615
Net unrealised loss (3,111,946) (2,924,668)
Fair value 2,804,365 3,479,947
Total investments at FVTPL 2,804,365 3,479,947
Total investments 2,804,365 3,479,947
3. Investments (Cont’d)
(ix) AmMetLife Precious Metals Fund
2018
No. of Cost Fair value Fair value as Units RM RM % of NAV
FVTPL:
Unquoted unit and property trust funds
AmPrecious Metals 7,837,801 5,916,311 2,804,365 84.53%
Total investments at FVTPL 5,916,311 2,804,365 84.53%
The composition, costs and fair values of the FVTPL investments in Malaysia as at 31 March 2018 are as detailed below:
Notes to the Financial Information (Cont’d)

AmMetLife Insurance Berhad Annual Report for the Investment-Linked Funds Financial Year Ended 31 March 2018 105
Annual Report for the AmMetLife Insurance Berhad Financial Year Ended 31 March 2018 Investment-Linked Funds
2018 2017 RM RM
Unquoted unit and property trust funds 2,108,847 2,086,283
Deposits with licensed financial institutions 219,525 206,484 2,328,372 2,292,767
FVTPL:
Unquoted unit and property trust funds
Cost 1,742,914 1,687,118
Net unrealised gain 365,933 399,165
Fair value 2,108,847 2,086,283
Total investments at FVTPL 2,108,847 2,086,283
LAR:
Deposits with licensed financial institutions 219,525 206,484
Total investments 2,328,372 2,292,767
(x) AmMetLife Global Agribusiness Fund
The composition, costs and fair values of the FVTPL investments in Malaysia as at 31 March 2018 are as detailed below:
2018
No. of Cost Fair value Fair value as Units RM RM % of NAV
FVTPL:
Unquoted unit and property trust funds
AmGlobal Agribusiness 1,899,862 1,742,914 2,108,847 91.09%
Total investments at FVTPL 1,742,914 2,108,847 91.09%
2018 2017 % %
Deposits with licensed financial institutions 3.40 3.20
The weighted average effective interest rates per annum are as follows:

AmMetLife Insurance Berhad Annual Report for the Investment-Linked Funds Financial Year Ended 31 March 2018106
Annual Report for the AmMetLife Insurance Berhad Financial Year Ended 31 March 2018 Investment-Linked Funds
3. Investments (Cont’d)
(xi) AmMetLife Dividend Fund
2018 2017 RM RM
Quoted equity securities 13,841,107 13,342,933
Quoted unit and property trust funds 150,570 225,784 13,991,677 13,568,717
FVTPL:
Quoted equity securities
Cost 11,696,436 11,920,417
Net unrealised gain 2,144,671 1,422,516
Fair value 13,841,107 13,342,933
Quoted unit and property trust funds
Cost 164,587 228,455
Net unrealised loss (14,017) (2,671)
Fair value 150,570 225,784
Total investments at FVTPL 13,991,677 13,568,717
Total investments 13,991,677 13,568,717
Notes to the Financial Information (Cont’d)

AmMetLife Insurance Berhad Annual Report for the Investment-Linked Funds Financial Year Ended 31 March 2018 107
Annual Report for the AmMetLife Insurance Berhad Financial Year Ended 31 March 2018 Investment-Linked Funds
2018
No. of Cost Fair value Fair value as Units RM RM % of NAV
FVTPL:
Quoted equity securities
Construction
Econpile Holdings Berhad 253,750 298,958 249,944 1.57%
Econpile Holdings Berhad – Warrants 50,750 – 9,135 0.06%
Gamuda Berhad 45,200 222,365 234,136 1.47%
Gamuda Berhad – Warrants 8,150 2,038 9,698 0.06%
IJM Corporation Berhad 111,400 371,932 298,552 1.87%
Sunway Construction Group Berhad 123,100 218,400 253,586 1.59%
Consumer
Padini Holdings Berhad 35,500 139,225 158,685 0.99%
Finance
CIMB Group Holdings Berhad 113,711 634,516 817,582 5.12%
Hong Leong Bank Berhad 25,900 440,219 486,920 3.05%
Malayan Banking Berhad 149,229 1,276,048 1,581,827 9.91%
Public Bank Berhad 55,700 1,011,038 1,336,800 8.38%
Industrial Products
Denko Industrial Corporation Berhad 129,400 201,633 207,040 1.30%
DRB-Hicom Berhad 34,900 62,719 85,156 0.53%
Hartalega Holdings Berhad 36,800 153,238 222,640 1.39%
Petron Malaysia Refining & Marketing Bhd 13,200 136,069 113,388 0.71%
Petronas Chemicals Group Berhad 98,100 733,037 810,306 5.08%
Top Glove Corporation Bhd 26,400 131,689 254,496 1.59%
Uchi Technologies Bhd 48,100 159,146 128,427 0.80%
V.S Industry Berhad 191,500 347,580 453,855 2.84%
Wah Seong Corporation Berhad 100,100 107,533 145,145 0.91%
(xi) AmMetLife Dividend Fund (Cont’d)
The composition, costs and fair values of the FVTPL investments in Malaysia as at 31 March 2018 are as detailed below:

AmMetLife Insurance Berhad Annual Report for the Investment-Linked Funds Financial Year Ended 31 March 2018108
Annual Report for the AmMetLife Insurance Berhad Financial Year Ended 31 March 2018 Investment-Linked Funds
2018
No. of Cost Fair value Fair value as Units RM RM % of NAV
FVTPL: (Cont’d)
Quoted equity securities (Cont’d)
Plantations
Kuala Lumpur Kepong Berhad 9,200 214,712 235,336 1.47%
Sime Darby Plantation Berhad 49,167 248,038 271,402 1.70%
Technology
Globetronics Technology Berhad 53,100 241,026 215,586 1.35%
Inari Amertron Berhad 119,400 183,831 328,350 2.06%
Trading & Services
AirAsia Berhad 76,300 233,324 299,859 1.88%
Axiata Group Berhad 102,339 534,306 557,747 3.49%
Bermaz Auto Berhad 156,300 341,035 337,608 2.12%
Bumi Armada Berhad 183,900 163,195 153,557 0.96%
Dialog Group Berhad 126,900 212,864 389,583 2.44%
Genting Berhad 64,200 538,283 560,466 3.51%
Genting Malaysia Berhad 25,900 120,604 126,910 0.80%
My E.G. Services Berhad 60,100 129,268 174,290 1.09%
Mynews Holdings Berhad 15,800 18,614 22,910 0.14%
Serba Dinamik Holdings Berhad 138,400 474,550 473,328 2.97%
Sime Darby Berhad 49,167 82,150 129,801 0.81%
Telekom Malaysia Berhad 35,200 224,223 183,744 1.15%
Tenaga Nasional Berhad 93,800 1,089,030 1,523,312 9.54%
11,696,436 13,841,107 86.72%
Quoted unit and property trust funds
KLCC Real Estate Investment Trust 21,000 164,587 150,570 0.94%
Total investments at FVTPL 11,861,023 13,991,677 87.66%
3. Investments (Cont’d)
(xi) AmMetLife Dividend Fund (Cont’d)
Notes to the Financial Information (Cont’d)

AmMetLife Insurance Berhad Annual Report for the Investment-Linked Funds Financial Year Ended 31 March 2018 109
Annual Report for the AmMetLife Insurance Berhad Financial Year Ended 31 March 2018 Investment-Linked Funds
4. Deffered Taxation The deferred tax liability/(asset) relate to unrealised capital gain/(losses) on investments of the respective Funds.
(i) AmMetLife Equity Fund
2018 2017 RM RM
At beginning of the year 167,567 90,472
Recognised in the Statement of Income and Expenditure (Note 8) 82,249 77,095 At end of the year 249,816 167,567
2018 2017 RM RM
At beginning of the year (12,354) (34,926)
Recognised in the Statement of Income and Expenditure (Note 8) (4,712) 22,572 At end of the year (17,066) (12,354)
(ii) AmMetLife Bond Fund
2018 2017 RM RM
At beginning of the year 129,736 28,167
Recognised in the Statement of Income and Expenditure (Note 8) 62,625 101,569 At end of the year 192,361 129,736
(iii) AmMetLife Balanced Fund
2018 2017 RM RM
At beginning of the year 109,292 52,749
Recognised in the Statement of Income and Expenditure (Note 8) 4,094 56,543 At end of the year 113,386 109,292
(iv) AmMetLife Dana Teguh

AmMetLife Insurance Berhad Annual Report for the Investment-Linked Funds Financial Year Ended 31 March 2018110
Annual Report for the AmMetLife Insurance Berhad Financial Year Ended 31 March 2018 Investment-Linked Funds
2018 2017 RM RM
At beginning of the year 15,448 8,127
Recognised in the Statement of Income and Expenditure (Note 8) (10,515) 7,321 At end of the year 4,933 15,448
(vi) AmMetLife Asia Pacific REITS Fund
2018 2017 RM RM
At beginning of the year 10,139 44,458
Recognised in the Statement of Income and Expenditure (Note 8) (42,681) (34,319) At end of the year (32,542) 10,139
2018 2017 RM RM
At beginning of the year 22,235 1,949
Recognised in the Statement of Income and Expenditure (Note 8) 6,466 20,286 At end of the year 28,701 22,235
(vii) AmMetLife Global Emerging Market Fund
2018 2017 RM RM
At beginning of the year 4,140 2,646
Recognised in the Statement of Income and Expenditure (Note 8) (1,339) 1,494 At end of the year 2,801 4,140
(viii) AmMetLife Tactical Bond Fund
4. Deffered Taxation (Cont’d)
(v) AmMetLife Oasis Islamic Equity Fund
Notes to the Financial Information (Cont’d)

AmMetLife Insurance Berhad Annual Report for the Investment-Linked Funds Financial Year Ended 31 March 2018 111
Annual Report for the AmMetLife Insurance Berhad Financial Year Ended 31 March 2018 Investment-Linked Funds
(ix) AmMetLife Precious Metals Fund
2018 2017 RM RM
At beginning of the year (233,973) (279,301)
Recognised in the Statement of Income and Expenditure (Note 8) (14,983) 45,328 At end of the year (248,956) (233,973)
2018 2017 RM RM
At beginning of the year 31,933 8,327
Recognised in the Statement of Income and Expenditure (Note 8) (2,658) 23,606 At end of the year 29,275 31,933
(x) AmMetLife Global Agribusiness Fund
2018 2017 RM RM
At beginning of the year 113,588 67,697
Recognised in the Statement of Income and Expenditure (Note 8) 56,864 45,891 At end of the year 170,452 113,588
(xi) AmMetLife Dividend Fund

AmMetLife Insurance Berhad Annual Report for the Investment-Linked Funds Financial Year Ended 31 March 2018112
Annual Report for the AmMetLife Insurance Berhad Financial Year Ended 31 March 2018 Investment-Linked Funds
5. Unitholders’ Capital
(i) AmMetLife Equity Fund
(ii) AmMetLife Bond Fund
2018 2017
No. of No. of Units RM Units RM
Amount received for creations during the year 4,559,620 11,142,198 3,114,522 8,183,288
Amount paid for cancellations due to surrenders during the year (2,389,232) (8,682,900) (2,093,830) (7,162,758) 2,170,388 2,459,298 1,020,692 1,020,530 Unitholders’ capital brought forward 21,174,271 22,470,571 20,153,579 20,346,140
Excess of income over outgo after taxation – 2,517,346 – 1,103,901 23,344,659 27,447,215 21,174,271 22,470,571
Net asset value per unit at 31 March 1.1757 1.0612
2018 2017
No. of No. of Units RM Units RM
Amount received for creations during the year 1,920,282 3,730,927 2,228,213 3,602,125
Amount paid for cancellations due to surrenders during the year (2,648,652) (4,354,429) (4,164,865) (5,231,304) (728,370) (623,502) (1,936,652) (1,629,179) Unitholders’ capital brought forward 12,524,097 10,670,049 14,460,749 11,904,335
Excess of income over outgo after taxation – 331,714 – 394,893 11,795,727 10,378,261 12,524,097 10,670,049
Net asset value per unit at 31 March 0.8798 0.8520
Notes to the Financial Information (Cont’d)

AmMetLife Insurance Berhad Annual Report for the Investment-Linked Funds Financial Year Ended 31 March 2018 113
Annual Report for the AmMetLife Insurance Berhad Financial Year Ended 31 March 2018 Investment-Linked Funds
2018 2017
No. of No. of Units RM Units RM
Amount received for creations during the year 3,217,133 9,369,120 2,717,567 7,124,184
Amount paid for cancellations due to surrenders during the year (2,364,292) (8,399,467) (2,579,809) (6,989,974) 852,841 969,653 137,758 134,210 Unitholders’ capital brought forward 22,739,174 23,442,455 22,601,416 22,243,302
Excess of income over outgo after taxation – 2,159,900 – 1,064,943 23,592,015 26,572,008 22,739,174 23,442,455
Net asset value per unit at 31 March 1.1263 1.0309
(iii) AmMetLife Balanced Fund
2018 2017
No. of No. of Units RM Units RM
Amount received for creations during the year 2,817,584 7,118,683 1,457,502 4,806,600
Amount paid for cancellations due to surrenders during the year (2,562,284) (6,788,581) (2,263,867) (5,675,856) 255,300 330,102 (806,365) (869,256) Unitholders’ capital brought forward 17,081,405 19,319,513 17,887,770 19,370,004
Excess of income over outgo after taxation – 1,131,391 – 818,765 17,336,705 20,781,006 17,081,405 19,319,513
Net asset value per unit at 31 March 1.1987 1.1310
(iv) AmMetLife Dana Teguh

AmMetLife Insurance Berhad Annual Report for the Investment-Linked Funds Financial Year Ended 31 March 2018114
Annual Report for the AmMetLife Insurance Berhad Financial Year Ended 31 March 2018 Investment-Linked Funds
2018 2017
No. of No. of Units RM Units RM
Amount received for creations during the year 3,559,172 3,473,654 854,724 1,056,820
Amount paid for cancellations due to surrenders during the year (422,857) (1,377,640) (483,005) (812,333) 3,136,315 2,096,014 371,719 244,487 Unitholders’ capital brought forward 1,906,595 1,303,203 1,534,876 921,290
(Deficit)/excess of income over outgo after taxation – (95,384) – 137,426 5,042,910 3,303,833 1,906,595 1,303,203
Net asset value per unit at 31 March 0.6551 0.6835
(vi) AmMetLife Asia Pacific REITS Fund
2018 2017
No. of No. of Units RM Units RM
Amount received for creations during the year 898,002 594,384 516,256 614,364
Amount paid for cancellations due to surrenders during the year (1,273,843) (844,160) (1,113,838) (992,108) (375,841) (249,776) (597,582) (377,744) Unitholders’ capital brought forward 6,338,719 4,153,455 6,936,301 3,942,629
(Deficit)/excess of income over outgo after taxation – (291,537) – 588,570 5,962,878 3,612,142 6,338,719 4,153,455
Net asset value per unit at 31 March 0.6058 0.6553
5. Unitholders’ Capital (Cont’d)
(v) AmMetLife Oasis Islamic Equity Fund
Notes to the Financial Information (Cont’d)

AmMetLife Insurance Berhad Annual Report for the Investment-Linked Funds Financial Year Ended 31 March 2018 115
Annual Report for the AmMetLife Insurance Berhad Financial Year Ended 31 March 2018 Investment-Linked Funds
(vii) AmMetLife Global Emerging Market Fund
2018 2017
No. of No. of Units RM Units RM
Amount received for creations during the year 2,665,491 2,317,524 117,801 96,093
Amount paid for cancellations due to surrenders during the year (139,905) (541,498) (95,581) (80,859) 2,525,586 1,776,026 22,220 15,234 Unitholders’ capital brought forward 1,822,190 1,176,955 1,799,970 925,335
Excess of income over outgo after taxation – 77,615 – 236,386 4,347,776 3,030,596 1,822,190 1,176,955
Net asset value per unit at 31 March 0.6970 0.6459
2018 2017
No. of No. of Units RM Units RM
Amount received for creations during the year 779,028 799,751 383,863 433,451
Amount paid for cancellations due to surrenders during the year (351,150) (546,780) (170,835) (311,097) 427,878 252,971 213,028 122,354 Unitholders’ capital brought forward 1,208,818 705,801 995,790 545,141
Excess of income over outgo after taxation – 11,656 – 38,306 1,636,696 970,428 1,208,818 705,801
Net asset value per unit at 31 March 0.5929 0.5839
(viii) AmMetLife Tactical Bond Fund

AmMetLife Insurance Berhad Annual Report for the Investment-Linked Funds Financial Year Ended 31 March 2018116
Annual Report for the AmMetLife Insurance Berhad Financial Year Ended 31 March 2018 Investment-Linked Funds
2018 2017
No. of No. of Units RM Units RM
Amount received for creations during the year 2,329,233 508,585 1,793,963 853,037
Amount paid for cancellations due to surrenders during the year (3,328,588) (796,584) (1,927,233) (924,264) (999,355) (287,999) (133,270) (71,227) Unitholders’ capital brought forward 14,543,625 4,129,638 14,676,895 3,819,735
(Deficit)/excess of income over outgo after taxation – (523,920) – 381,130 13,544,270 3,317,719 14,543,625 4,129,638
Net asset value per unit at 31 March 0.2450 0.2839
2018 2017
No. of No. of Units RM Units RM
Amount received for creations during the year 351,855 422,072 372,209 468,280
Amount paid for cancellations due to surrenders during the year (238,010) (345,122) (455,314) (523,287) 113,845 76,950 (83,105) (55,007) Unitholders’ capital brought forward 3,392,692 2,264,212 3,475,797 2,025,933
(Deficit)/excess of income over outgo after taxation – (25,919) – 293,286 3,506,537 2,315,243 3,392,692 2,264,212
Net asset value per unit at 31 March 0.6603 0.6674
(x) AmMetLife Global Agribusiness Fund
5. Unitholders’ Capital (Cont’d)
(ix) AmMetLife Precious Metals Fund
Notes to the Financial Information (Cont’d)

AmMetLife Insurance Berhad Annual Report for the Investment-Linked Funds Financial Year Ended 31 March 2018 117
Annual Report for the AmMetLife Insurance Berhad Financial Year Ended 31 March 2018 Investment-Linked Funds
2018 2017
No. of No. of Units RM Units RM
Amount received for creations during the year 1,266,274 2,332,544 1,288,555 1,577,157
Amount paid for cancellations due to surrenders during the year (1,982,681) (2,868,133) (1,337,599) (1,609,794) (716,407) (535,589) (49,044) (32,637) Unitholders’ capital brought forward 20,061,936 14,803,212 20,110,980 14,084,122
Excess of income over outgo after taxation – 1,693,853 – 751,727 19,345,529 15,961,476 20,061,936 14,803,212
Net asset value per unit at 31 March 0.8251 0.7379
(xi) AmMetLife Dividend Fund

AmMetLife Insurance Berhad Annual Report for the Investment-Linked Funds Financial Year Ended 31 March 2018118
Annual Report for the AmMetLife Insurance Berhad Financial Year Ended 31 March 2018 Investment-Linked Funds
6. Interest Income
AmMetLife Equity Fund AmMetLife Bond Fund
2018 2017 2018 2017 RM RM RM RM
Interest income from: Deposits with licensed financial institutions 80,548 63,386 42,702 38,235
Corporate bonds – – 503,139 540,882
80,548 63,386 545,841 579,117
AmMetLife Balanced Fund AmMetLife Dana Teguh
2018 2017 2018 2017 RM RM RM RM
Interest income from: Deposits with licensed financial institutions 75,042 103,932 91,006 127,627
Corporate bonds 260,665 277,731 185,570 165,152
335,707 381,663 276,576 292,779
AmMetLife Oasis AmMetLife Asia Pacific Islamic Equity Fund REITS Fund
2018 2017 2018 2017 RM RM RM RM
Interest income from: Deposits with licensed financial institutions 7,113 8,340 4,082 2,705
AmMetLife Global AmMetLife Tactical Emerging Market Fund Bond Fund
2018 2017 2018 2017 RM RM RM RM
Interest income from: Deposits with licensed financial institutions 4,602 2,059 1,980 1,509
Notes to the Financial Information (Cont’d)

AmMetLife Insurance Berhad Annual Report for the Investment-Linked Funds Financial Year Ended 31 March 2018 119
Annual Report for the AmMetLife Insurance Berhad Financial Year Ended 31 March 2018 Investment-Linked Funds
AmMetLife Precious AmMetLife Global Metals Fund Agribusiness Fund
2018 2017 2018 2017 RM RM RM RM
Interest income from: Deposits with licensed financial institutions 6,182 8,417 6,584 6,319
AmMetLife Dividend Fund
2018 2017 RM RM
Interest income from: Deposits with licensed financial institutions 41,146 38,404

AmMetLife Insurance Berhad Annual Report for the Investment-Linked Funds Financial Year Ended 31 March 2018120
Annual Report for the AmMetLife Insurance Berhad Financial Year Ended 31 March 2018 Investment-Linked Funds
7. Dividend Income
AmMetLife Equity Fund AmMetLife Bond Fund
2018 2017 2018 2017 RM RM RM RM
Gross dividends from: Quoted equity securities in Malaysia 709,725 556,540 – –
Quoted unit and property trust funds in Malaysia 25,858 11,053 – –
Unquoted unit and property trust funds in Malaysia – – 2,483 20,668
735,583 567,593 2,483 20,668
AmMetLife Balanced Fund AmMetLife Dana Teguh
2018 2017 2018 2017 RM RM RM RM
Gross dividends from: Quoted equity securities in Malaysia 529,498 407,345 336,004 282,461
Quoted unit and property trust funds in Malaysia 17,795 9,050 9,780 –
Unquoted unit and property trust funds in Malaysia – – 44,362 30,454
547,293 416,395 390,146 312,915
AmMetLife Oasis AmMetLife Asia Pacific Islamic Equity Fund REITS Fund
2018 2017 2018 2017 RM RM RM RM
Gross dividends from: Unquoted unit and property trust funds in Malaysia 197,119 949,330 29,260 46,044
Notes to the Financial Information (Cont’d)

AmMetLife Insurance Berhad Annual Report for the Investment-Linked Funds Financial Year Ended 31 March 2018 121
Annual Report for the AmMetLife Insurance Berhad Financial Year Ended 31 March 2018 Investment-Linked Funds
AmMetLife Global AmMetLife Tactical Emerging Market Fund Bond Fund
2018 2017 2018 2017 RM RM RM RM
Gross dividends from: Unquoted unit and property trust funds in Malaysia 2,671 2,272 29,573 25,276
AmMetLife Dividend Fund
2018 2017 RM RM
Gross dividends from: Quoted equity securities in Malaysia 453,291 387,100
Quoted unit and property trust funds in Malaysia 14,854 7,578
468,145 394,678

AmMetLife Insurance Berhad Annual Report for the Investment-Linked Funds Financial Year Ended 31 March 2018122
Annual Report for the AmMetLife Insurance Berhad Financial Year Ended 31 March 2018 Investment-Linked Funds
8. Taxation
AmMetLife Equity Fund AmMetLife Bond Fund
2018 2017 2018 2017 RM RM RM RM
Malaysian income tax: Current year’s provision 104,236 (4,005) 44,351 53,326
Deferred tax: Relating to origination and reversal of temporary differences (Note 4) 82,249 77,095 (4,712) 22,572
Tax expense for the year 186,485 73,090 39,639 75,898
AmMetLife Balanced Fund AmMetLife Dana Teguh
2018 2017 2018 2017 RM RM RM RM
Malaysian income tax: Current year’s provision 108,774 36,549 82,878 27,926
Deferred tax: Relating to origination and reversal of temporary differences (Note 4) 62,625 101,569 4,094 56,543
Tax expense for the year 171,399 138,118 86,972 84,469
AmMetLife Oasis AmMetLife Asia Pacific Islamic Equity Fund REITS Fund
2018 2017 2018 2017 RM RM RM RM
Malaysian income tax: Current year’s provision (51) 2,586 392 1,178
Deferred tax: Relating to origination and reversal of temporary differences (Note 4) (42,681) (34,319) (10,515) 7,321
Tax (credit)/expense for the year (42,732) (31,733) (10,123) 8,499
Notes to the Financial Information (Cont’d)

AmMetLife Insurance Berhad Annual Report for the Investment-Linked Funds Financial Year Ended 31 March 2018 123
Annual Report for the AmMetLife Insurance Berhad Financial Year Ended 31 March 2018 Investment-Linked Funds
AmMetLife Global AmMetLife Tactical Emerging Market Fund Bond Fund
2018 2017 2018 2017 RM RM RM RM
Malaysian income tax: Current year’s provision 368 371 327 122
Deferred tax: Relating to origination and reversal of temporary differences (Note 4) 6,466 20,286 (1,339) 1,494
Tax expense/(credit) for the year 6,834 20,657 (1,012) 1,616
AmMetLife Dividend Fund
2018 2017 RM RM
Malaysian income tax: Current year’s provision 69,481 3,422
Deferred tax: Relating to origination and reversal of temporary differences (Note 4) 56,864 45,891
Tax expense for the year 126,345 49,313
AmMetLife Precious AmMetLife Global Metals Fund Agribusiness Fund
2018 2017 2018 2017 RM RM RM RM
Malaysian income tax: Current year’s provision (30,300) (11,760) 526 2,030
Deferred tax: Relating to origination and reversal of temporary differences (Note 4) (14,983) 45,328 (2,658) 23,606
Tax (credit)/expense for the year (45,283) 33,568 (2,132) 25,636
The tax charge on the Funds relates to investment income received and gain on disposal of investments during the year/period, at the preferential tax rate of 8% in accordance with the method prescribed under the Income Tax Act, 1967 for life insurance business.

AmMetLife Insurance Berhad Annual Report for the Investment-Linked Funds Financial Year Ended 31 March 2018124
Annual Report for the AmMetLife Insurance Berhad Financial Year Ended 31 March 2018 Investment-Linked Funds
AmMetLife Equity Fund AmMetLife Bond Fund
2018 2017 2018 2017 RM RM RM RM
Excess of income over outgo before taxation 2,703,831 1,176,991 371,353 470,791
Taxation at Malaysian tax charge of 8% 216,306 94,159 29,708 37,663
Income not subject to tax (58,846) (45,178) 1,456 29,176
Expenses not deductible for tax purposes 29,025 24,109 8,475 9,059
186,485 73,090 39,639 75,898
AmMetLife Balanced Fund AmMetLife Dana Teguh
2018 2017 2018 2017 RM RM RM RM
Excess of income over outgo before taxation 2,331,299 1,203,061 1,218,363 903,234
Taxation at Malaysian tax charge of 8% 186,504 96,245 97,469 72,259
Income not subject to tax (42,159) 18,403 (31,212) (6,949)
Expenses not deductible for tax purposes 27,054 23,470 20,715 19,159
171,399 138,118 86,972 84,469
AmMetLife Oasis AmMetLife Asia Pacific Islamic Equity Fund REITS Fund
2018 2017 2018 2017 RM RM RM RM
(Deficit)/excess of income over outgo before taxation (334,269) 556,837 (105,507) 145,925
Taxation at Malaysian tax charge of 8% (26,742) 44,547 (8,441) 11,674
Income not subject to tax (16,632) (76,900) (2,340) (3,702)
Expenses not deductible for tax purposes 642 620 658 527
(42,732) (31,733) (10,123) 8,499
A reconciliation of income tax expense applicable to the excess/(deficit) of income over outgo before taxation at the income tax rate applicable to the investment-linked funds, to income tax expense at the effective income tax rate, is as follows:
8. Taxation (Cont’d)
Notes to the Financial Information (Cont’d)

AmMetLife Insurance Berhad Annual Report for the Investment-Linked Funds Financial Year Ended 31 March 2018 125
Annual Report for the AmMetLife Insurance Berhad Financial Year Ended 31 March 2018 Investment-Linked Funds
AmMetLife Global AmMetLife Tactical Emerging Market Fund Bond Fund
2018 2017 2018 2017 RM RM RM RM
Excess of income over outgo before taxation 84,449 257,043 10,644 39,922
Taxation at Malaysian tax charge of 8% 6,756 20,563 852 3,194
Income not subject to tax (582) (392) (2,366) (2,033)
Expenses not deductible for tax purposes 660 486 502 455
6,834 20,657 (1,012) 1,616
AmMetLife Precious AmMetLife Global Metals Fund Agribusiness Fund
2018 2017 2018 2017 RM RM RM RM
(Deficit)/excess of income over outgo before taxation (569,203) 414,698 (28,051) 318,922
Taxation at Malaysian tax charge of 8% (45,536) 33,176 (2,244) 25,514
Income not subject to tax (761) (692) (526) (491)
Expenses not deductible for tax purposes 1,014 1,084 638 613
(45,283) 33,568 (2,132) 25,636
AmMetLife Dividend Fund
2018 2017 RM RM
Excess of income over outgo before taxation 1,820,198 801,040
Taxation at Malaysian tax charge of 8% 145,616 64,083
Income not subject to tax (37,452) (31,307)
Expenses not deductible for tax purposes 18,181 16,537
126,345 49,313

ammetlife.com
AmMetLife Insurance Berhad (15743-P)
Level 20, Menara 1 Sentrum, No. 201, Jalan Tun Sambanthan, 50470 Kuala Lumpur, MalaysiaT 1300 88 8800 E [email protected]

AmMetLife Insurance Berhad (15743-P)
Ahli PIDM
Dana Berkaitan PelaburanBagi Tahun Kewangan Berakhir 31 Mac 2018
LAPORAN TAHUNAN
2018

AmMetLife Insurance Berhad headquarters located atMenara 1 Sentrum, No.201 Jalan Tun Sambanthan, 50470 Kuala Lumpur.
HALAMAN INI SENGAJA DIBIARKAN
KOSONG
Dana Berkaitan PelaburanBagi Tahun Kewangan Berakhir 31 Mac 2018
LAPORAN TAHUNAN
2018

Isi Kandungan
Mesej Pengerusi 131
Profil Korporat 132
Objektif Dana Berkaitan Pelaburan 133
Ulasan Pasaran Pelaburan 137
Tinjauan Pelaburan 145
Strategi Pelaburan 151
Prestasi Dana 157
Pecahan Mengikut Sektor dan Kategori 169
Jadual Perbandingan Prestasi 179
Ringkasan Maklumat Kewangan 187
Dana Berkaitan PelaburanBagi Tahun Kewangan Berakhir 31 Mac 2018
LAPORAN TAHUNAN
2018

AmMetLife Insurance Berhad Laporan Tahunan Bagi Dana Berkaitan Pelaburan Tahun Kewangan Berakhir 31 Mac 2018
Laporan Tahunan Bagi AmMetLife Insurance Berhad Tahun Kewangan Berakhir 31 Mac 2018 Dana Berkaitan Pelaburan
HALAMAN INI SENGAJA DIBIARKAN
KOSONG

AmMetLife Insurance Berhad Laporan Tahunan Bagi Dana Berkaitan Pelaburan Tahun Kewangan Berakhir 31 Mac 2018
Laporan Tahunan Bagi AmMetLife Insurance Berhad Tahun Kewangan Berakhir 31 Mac 2018 Dana Berkaitan Pelaburan 131
Mesej Pengerusi
Pelanggan merupakan nadi kepada segala yang kami lakukan. Oleh itu, keutamaan utama kami adalah menambah nilai kepada perkhidmatan yang kami tawarkan untuk menyokong pelbagai keperluan pelanggan sedia ada dan pelanggan berpotensi
Pemegang Polisi Yang Dihargai,
Saya ingin mengambil kesempatan ini untuk mengucapkan terima kasih atas sokongan berterusan anda terhadap AmMetLife. Pertumbuhan kami selama empat dekad yang lalu tidak mungkin berlaku tanpa anda semua. Anda kekal sebagai asas dalam usaha kami membina salah sebuah syarikat insurans yang paling mantap di negara ini.
Dengan sukacitanya saya mengumumkan pertumbuhan berterusan portfolio berkaitan pelaburan kami untuk tahun kewangan berakhir 31 Mac 2018. Jumlah nilai aset bersih dana berkaitan pelaburan kami ialah RM117.69 juta, yakni pertumbuhan tahun ke tahun dalam Aset Bersih Nilai sebanyak 12.69%. Pada tahun kewangan ini, prestasi dana berkaitan pelaburan kami yang terbaik ialah Dana AmMetLife Dividend, yang memberikan pulangan luar biasa sebanyak 11.79%.
Semua dana domestik, iaitu Dana AmMetLife Equity, Dana AmMetLife Bond, Dana AmMetLife Balanced, AmMetLife Dana Teguh dan Dana AmMetLife Dividend - telah mengatasi penanda aras masing-masing sepanjang tahun dan sejak penubuhannya. Dana AmMetLife Dividend dan Dana AmMetLife Equity menunjukkan kadar pertumbuhan prestasi dua tahun masing-masing sebanyak 17.86% dan 16.44%.
Berhubung dengan dana sasaran, prestasi terbaik dana setahun kami ialah Dana AmMetLife Global Emerging Market, dengan pulangan satu tahun sebanyak 7.89% untuk tahun kewangan 2018. Dana AmMetLife Global Emerging Market juga merupakan dana terbaik dua tahun, dengan prestasi 35.60%.
Di AmMetLife, pelanggan merupakan nadi kepada segala yang kami lakukan. Oleh itu, keutamaan utama kami adalah menambah nilai kepada perkhidmatan yang kami tawarkan untuk menyokong pelbagai keperluan pelanggan sedia ada dan pelanggan berpotensi. Kami berhasrat untuk mencapainya melalui bantuan kemajuan teknologi yang pesat, yang akan kami gunakan untuk memudahkan pertumbuhan dan pembangunan, baik dalam memenuhi keperluan pelanggan kami, mahupun keperluan Syarikat.
Akhir sekali, kami memberi jaminan bahawa kami kekal komited untuk menyediakan produk yang sesuai kepada pelanggan kami yang dihargai demi memenuhi keperluan perlindungan mereka.
Terima kasih.
Cho Horng FattPengerusiAmMetLife Insurance Berhad

AmMetLife Insurance Berhad Laporan Tahunan Bagi Dana Berkaitan Pelaburan Tahun Kewangan Berakhir 31 Mac 2018132
Profil Korporat
AmMetLife merupakan perkongsian strategik antara
AMMB Holdings Berhad (“Kumpulan AmBank ”)
dan Metlife International Holdings LLC (“MetLife”).
AmMetLife menawarkan pelbagai insurans hayat dan
perlindungan dana kewangan yang komprehensif
yang diedarkan melalui rangkaian Kumpulan AmBank
yang mempunyai lebih daripada 170 cawangan
AmBank dan AmMetLife di seluruh negara, tambahan
lagi dengan kekuatan pasukan ejen insurans hayat
yang sah di seluruh Malaysia.
Perkongsian strategik ini menggabungkan kepakaran
antarabangsa dan kekukuhan kewangan MetLife dan
kekuatan dan jangkauan tempatan AmBank Group
untuk menjadi syarikat insurans yang mesra pelanggan
dan moden di Malaysia. Kami memberi tumpuan bagi
memenuhi keperluan pelanggan kami yang pelbagai
dengan memberi penyelesaian yang inovatif di pelbagai
peringkat kehidupan mereka, menjadikannya ia lebih
mudah dan senang untuk seisi keluarga dan individu
untuk mencapai jaminan kewangan dan meneruskan
kehidupan yang lebih baik.
Dana Berkaitan PelaburanBagi Tahun Kewangan Berakhir 31 Mac 2018
LAPORAN TAHUNAN
2018

AmMetLife Insurance Berhad Laporan Tahunan Bagi Dana Berkaitan Pelaburan Tahun Kewangan Berakhir 31 Mac 2018
Objektif DanaBerkaitan Pelaburan
Dana Berkaitan PelaburanBagi Tahun Kewangan Berakhir 31 Mac 2018
LAPORAN TAHUNAN
2018

AmMetLife Insurance Berhad Laporan Tahunan Bagi Dana Berkaitan Pelaburan Tahun Kewangan Berakhir 31 Mac 2018
Laporan Tahunan Bagi AmMetLife Insurance Berhad Tahun Kewangan Berakhir 31 Mac 2018 Dana Berkaitan Pelaburan134
Objektif Dana Berkaitan Pelaburan
1. Dana AmMetLife Equity
Dana ini bertujuan untuk memberikan Pemegang Polisi dengan peningkatan modal, bagi tempoh pelaburan jangka masa sederhana ke panjang, terutamanya melalui pelaburan di dalam sekuriti Malaysia dengan potensi pertumbuhan yang menggalakkan.
Pulangan akan diperoleh melalui peningkatan harga unit dan bukannya pengagihan pendapatan.
2. Dana AmMetLife Bond
Dana ini bertujuan untuk memberikan Pemegang Polisi peluang untuk mendapatkan pendapatan yang lebih tinggi berbanding pendapatan purata yang diperoleh menerusi pendapatan tetap, bagi tempoh pelaburan jangka masa panjang, terutamanya melalui pelaburan dalam pelbagai portfolio sekuriti berpendapatan tetap.
Pulangan akan diperoleh melalui peningkatan harga unit dan bukannya pengagihan pendapatan.
3. Dana AmMetLife Balanced
Dana ini bertujuan untuk memberikan Pemegang Polisi peluang untuk mendapatkan pendapatan yang lebih tinggi berbanding pendapatan purata yang diperoleh daripada deposit tetap dengan tahap risiko lebih rendah berbanding dengan dana ekuiti, bagi tempoh pelaburan jangka masa sederhana melalui pendedahan kepada ekuiti dan/atau sekuriti berkaitan ekuiti Malaysia dan pendapatan tetap dan/atau sekuriti berkaitan pendapatan tetap.
Pulangan akan diperoleh melalui peningkatan harga unit dan bukannya pengagihan pendapatan.
4. AmMetLife Dana Teguh
Dana ini bertujuan untuk memberikan Pemegang Polisi peluang untuk mendapatkan pendapatan yang lebih tinggi berbanding pendapatan purata yang diperoleh daripada deposit tetap dengan tahap risiko lebih rendah berbanding dengan dana ekuiti, bagi tempoh pelaburan jangka masa sederhana, melalui pendedahan kepada ekuiti patuh Syariah Malaysia dan/atau sekuriti berkaitan ekuiti dan hutang Islam dan/atau sekuriti berkaitan hutang.
Pulangan akan diperoleh melalui peningkatan harga unit dan bukannya pengagihan pendapatan.
5. Dana AmMetLife Dividend
Dana ini bertujuan untuk memberikan Pemegang Polisi pulangan keseluruhan terutamanya melalui pelaburan dalam ekuiti dan/atau sekuriti berkaitan ekuiti syarikat-syarikat yang menawarkan pembayaran dividen yang mampan dan hasil yang menarik, dengan memberi penekanan kepada peluang peningkatan modal dalam jangka masa sederhana ke panjang.
Pulangan akan diperoleh melalui peningkatan harga unit dan bukannya pengagihan pendapatan.
6. Dana AmMetLife Oasis Islamic Equity
Dana ini bertujuan untuk mencapai peningkatan modal dalam jangka masa sederhana ke panjang melalui pelaburan dalam:
1. Dana AmOasis Global Islamic Equity, sebuah Collective Investment Scheme (CIS) yang diuruskan oleh AmFunds Management Berhad.
2. Ekuiti-ekuiti patuh Syariah yang tersenarai di Bursa Malaysia.
Pulangan akan diperoleh melalui peningkatan harga unit dan bukannya pengagihan pendapatan.

AmMetLife Insurance Berhad Laporan Tahunan Bagi Dana Berkaitan Pelaburan Tahun Kewangan Berakhir 31 Mac 2018
Laporan Tahunan Bagi AmMetLife Insurance Berhad Tahun Kewangan Berakhir 31 Mac 2018 Dana Berkaitan Pelaburan 135
7. Dana AmMetLife Global Emerging Market
Dana ini bertujuan untuk mencapai peningkatan modal dalam jangka masa panjang melalui pelaburan dalam:
1. Dana Global Emerging Market Opportunities, sebuah Collective Investment Scheme (CIS) yang diuruskan oleh AmFunds Management Berhad.
2. Ekuiti-ekuiti yang tersenarai di Bursa Malaysia.
Pulangan akan diperoleh melalui peningkatan harga unit dan bukannya pengagihan pendapatan.
8. Dana AmMetLife Global Agribusiness
Dana ini bertujuan untuk mencapai peningkatan modal dalam jangka masa panjang terutamanya melalui pelaburan dalam Dana Sasaran: Dana Global Agribusiness, sebuah Collective Investment Scheme (CIS) yang diuruskan oleh AmFunds Management Berhad yang melabur dalam ekuiti perniagaan agro global dari komoditi pertanian kepada produk pengguna. Perniagaan agro adalah istilah umum yang merujuk kepada pelbagai perniagaan yang berkaitan dengan pengeluaran produk makanan.
Pulangan akan diperoleh melalui peningkatan harga unit dan bukannya pengagihan pendapatan.
9. Dana AmMetLife Precious Metals
Dana ini bertujuan untuk mencapai peningkatan modal dalam jangka masa sederhana ke panjang terutamanya melalui pelaburan dalam Dana Sasaran: Dana Precious Metals Securities, sebuah Collective Investment Scheme (CIS) yang diuruskan oleh AmFunds Management Berhad yang melabur dalam portfolio ekuiti patuh Syariah global dan sekuriti berkaitan ekuiti syarikat-syarikat yang terbabit dalam kegiatan berkaitan emas, perak, platinum atau logam berharga lain.
Pulangan akan diperoleh melalui peningkatan harga unit dan bukannya pengagihan pendapatan.
10. Dana AmMetLife Tactical Bond
Dana ini bertujuan untuk mencapai peningkatan modal sederhana dalam jangka masa sederhana ke panjang terutamanya melalui pelaburan dalam Dana Sasaran: Dana AmTactical Bond, sebuah Collective Investment Scheme (CIS) yang diuruskan oleh AmFunds Management Berhad, di mana Dana Sasaran bermatlamat untuk memberikan pendapatan dan sebahagian kecilnya, peningkatan modal, dengan melabur terutamanya di dalam bon.
Pulangan akan diperoleh melalui peningkatan harga unit dan bukannya pengagihan pendapatan.
11. Dana AmMetLife Asia Pacific REITS
Dana ini bertujuan untuk mencapai peningkatan modal sederhana bagi jangka masa sederhana ke panjang melalui pelaburan terutamanya melalui Dana Sasaran: Dana AmAsia Pacific REITS, sebuah Collective Investment Scheme (CIS) yang diuruskan oleh AmFunds Management Berhad, di mana Dana Sasaran bermatlamat untuk memberikan pendapatan tetap dan sebahagian kecilnya, peningkatan modal dalam jangka masa sederhana ke panjang dengan melabur dalam amanah pelaburan hartanah (REITS).
Pulangan akan diperoleh melalui peningkatan harga unit dan bukannya pengagihan pendapatan.

Dana Berkaitan PelaburanBagi Tahun Kewangan Berakhir 31 Mac 2018
LAPORAN TAHUNAN
2018
HALAMAN INI SENGAJA DIBIARKAN
KOSONG

Dana Berkaitan PelaburanBagi Tahun Kewangan Berakhir 31 Mac 2018
LAPORAN TAHUNAN
2018
Ulasan PasaranPelaburan

AmMetLife Insurance Berhad Laporan Tahunan Bagi Dana Berkaitan Pelaburan Tahun Kewangan Berakhir 31 Mac 2018
Laporan Tahunan Bagi AmMetLife Insurance Berhad Tahun Kewangan Berakhir 31 Mac 2018 Dana Berkaitan Pelaburan138
Ulasan Pasaran EkuitiBagi tempoh tinjauan 1 April 2017 sehingga 31 Mac 2018, KLCI meningkat sebanyak 7%.
Pada suku kedua 2017, KLCI mencatat peningkatan pada kadar sederhana. KLCI meningkat sebanyak 3.1% pada 2Q17. Kedudukan Ringgit kian kukuh berbanding Dolar dan aliran masuk dana asing dilihat utuh pada kira-kira RM5.1b dalam tempoh 2Q17 sahaja.
Pada suku ketiga 2017, persembahan KLCI agak mendatar. Suku ini juga menyaksikan tempoh di mana harga minyak mentah mula mengukuh apabila Arab Saudi telah berjanji untuk mengehadkan eksportnya kepada 6.6m tong sehari (bpd) mulai Ogos 2017, hampir 1mbpd lebih rendah dari tahun lalu. Pergolakan di Amerika Syarikat, serta retorik OPEC untuk melanjutkan pengeluaran pada Disember 2018 dari Mac 2018, membantu menaikkan harga minyak mentah. Pada 3Q17, harga minyak mentah Brent naik 20% qoq untuk ditutup pada kadar US57/bbl.
Pada suku keempat tahun 2017, kami menyaksikan pembetulan pasaran kecil di mana KLCI merosot kepada 1,713 mata pada 4 Dis 2017. Pasaran lemah pada permulaan suku walaupun KDNK 3Q17 lebih kukuh daripada yang dijangkakan pada kadar 6.2% (2Q17: 5.8%). Nilai Ringgit meningkat 5.75% berbanding Dolar pada suku ini untuk ditutup pada harga RM4.00 berbanding Dolar, didorong oleh harga minyak mentah Brent yang kukuh, yang meningkat 16% qoq hingga ditutup pada kadar US$66/bbl. Sentimen pelabur berubah pada Disember 2018 apabila KLCI naik 4.6% mom, berkemungkinan dibantu oleh aktiviti “window dressing” akhir tahun. Prestasi yang kukuh dilihat dalam sektor kewangan memandangkan pasaran menjangkakan kenaikan faedah Bank Negara pada Januari 2018.
Pada suku pertama 2018, kami menyaksikan prestasi kukuh KLCI yang berterusan bermula 17 Disember hingga mencatat rekod 3.7% qoq. KLCI juga mencecah paras tertinggi, 1,876 mata pada 22 Mac 2018. Warga asing merupakan pelabur menyeluruh yang memainkan peranan besar, yang mungkin tertarik dengan kedudukan Ringgit yang kian meningkat. Ringgit memecah tahap psikologi sebanyak RM4.00 berbanding Dolar pada Januari 2018. Pengukuhan ini berterusan seperti dilihat pada harga minyak mentah, yang meningkat 5% qoq untuk ditutup pada harga AS$70/bbl, mendorong lonjakan Ringgit. Sektor kewangan mengatasi jangkaan yang disokong oleh kenaikan OPR 25 bps Bank Negara. Walaupun kedudukan
pasaran tidak menentu yang mencerminkan KLCI, kami juga menyaksikan perbezaan prestasi indeks di luar KLCI. Sebagai contoh, Indeks FTSE Bursa Malaysia 70 dan Indeks FTSE Bursa Malaysia Small Cap masing-masing merudum pada kadar -3% dan -12.9% qoq. Hal ini dipengaruhi oleh ketegangan perang perdagangan yang semakin meningkat antara AS dan China. Presiden AS Donald Trump mengumumkan tarif import ke atas keluli dan aluminium dan China pula bertindak balas dengan mengenakan tarif import ke atas 128 jenis produk AS.
Saham-saham KLCI yang mencatatkan prestasi tertinggi sepanjang tahun kewangan adalah Nestle (+94%), Press Metal (+63%) dan Hong Leong Bank (+36%). Manakala saham yang mencatat kerugian signifikan termasuklah Astro Malaysia (-27%), Telekom (-18%) dan AMMB Holdings (-16%).
Ulasan Pasaran Pendapatan TetapDalam tempoh tinjauan, KDNK sebenar Malaysia mencatatkan pertumbuhan yang lebih kukuh sebanyak +5.6% YoY pada 1Q17, meningkat daripada +4.5% pada 4Q16, berikutan aktiviti luaran yang lebih kukuh serta permintaan domestik. Selepas itu, KDNK sebenar mencatat pertumbuhan yang lebih tinggi sebanyak +5.8% YoY pada 2Q17, meningkat daripada +5.6% pada Q1, berikutan aktiviti luaran yang lebih kukuh dan penggunaan swasta. Pada 3Q17, KDNK sebenar mencatat peningkatan sebanyak 6.2% YoY berbanding +5.8% pada 2Q17, berikutan pertumbuhan eksport yang lebih kukuh dan permintaan dalam negeri/pelaburan swasta keseluruhan. Ini adalah pemacu utama kepada pengukuhan MYR memandangkan ia telah meningkatkan jangkaan kenaikan kadar. Akhir sekali, KDNK sebenar meningkat +5.9% YoY pada 4Q17, sedikit lebih perlahan daripada +6.2% yang dicatatkan pada 3Q17. Momentum pertumbuhan yang lebih perlahan telah didorong oleh pertumbuhan eksport yang perlahan. Pertumbuhan tahun penuh adalah pada tahap cemerlang pada kadar +5.9%, iaitu yang terpantas dalam tempoh tiga tahun yang disokong oleh peningkatan eksport serta permintaan domestik yang mampan.
Bagi keseluruhan tahun 2017, CPI mencatatkan purata 3.9%, jauh lebih tinggi daripada purata pada 2016 sebanyak 2.1% dan petunjuk Bank Negara pada akhir tahun iaitu 3.0%–4.0%. Sementara itu, inflasi teras kekal rendah dan stabil pada 2.2% YoY pada bulan Disember.
Ulasan Pasaran PelaburanDana AmMetLife Equity, Dana Balanced, Dana Teguh, Dana Dividend, Dana Bond

AmMetLife Insurance Berhad Laporan Tahunan Bagi Dana Berkaitan Pelaburan Tahun Kewangan Berakhir 31 Mac 2018
Laporan Tahunan Bagi AmMetLife Insurance Berhad Tahun Kewangan Berakhir 31 Mac 2018 Dana Berkaitan Pelaburan 139
Pada bulan Oktober, sorotan pengumuman belanjawan adalah seperti berikut:• KDNK 2017 disemak sehingga 5.2–5.7% (dari 4.3–4.8%),
di bawah prestasi yang lebih baik dalam sektor pertanian, pembuatan dan perkhidmatan.
• KDNK 2018 diramalkan akan berkembang sebanyak 5.0–5.5%, didorong oleh sektor perkilangan, pembinaan dan perkhidmatan.
• Kerajaan tetap komited kepada penyatuan fiskal secara berperingkat, dengan sasaran defisit berkurangan hingga 2.8% pada tahun 2018 (3.0% pada tahun 2017).
• Lebihan akaun semasa dianggar dapat dikekalkan pada RM32.3b atau 2.5% daripada PNK bagi tahun 2017 dan diramalkan menjadi lebih tinggi pada RM32.9b atau 2.3% daripada PNK bagi tahun 2018.
• Bajet 2018 adalah berasaskan kepada harga minyak iaitu USD52 setong (USD50 pada 2017 dan harga semasa ≈USD59).
• Kutipan GST dijangka meningkat kepada RM43.8b (RM41.5b pada 2017).
• Inflasi dijangka berkurangan pada 2.5–3.5% pada tahun 2018 (3.0–4.0% pada tahun 2017).
Pada bulan November, kami mencatatkan tekanan jualan di pasaran bon berikutan peralihan “hawkish” dalam kenyataan MPC pada November. Bank Negara memberi bayangan bahawa ia boleh mempertimbangkan untuk mengkaji semula tahap penginapan kewangan semasa memandangkan terdapat kekuatan keadaan makroekonomi global dan domestik. Hal yang tersebut menjadi satu kejutan terhadap pasaran. Akibatnya, lengkung MGS/IRS menjejaskan semua tenor terutamanya pada jangka masa panjang.
Dengan data ekonomi yang memperlihatkan ekonomi pada landasan pertumbuhan yang stabil dan inflasi masih berada pada tahap yang tinggi, Bank Negara menaikkan kadar dasarnya sebanyak 25 mata asas semasa mesyuarat Jawatankuasa Dasar Monetari (MPC) yang diadakan pada 25 Januari 2018. Kenaikan kadar ini telah meningkatkan Kadar Dasar Semalaman (OPR) kepada 3.25% – kenaikan pertama sejak Julai 2014.
- oleh AmFunds Management Berhad
Ulasan Pasaran Dana AmMetLife Oasis Islamic Equity Dana SasaranDana AmOasis Global Islamic EquityDana Sasaran AkhirDana Oasis Crescent Global Equity
Pasaran ekuiti global mengekalkan prestasi kukuh pada 2017, berikutan keadaan makroekonomi global yang lebih baik dan jangkaan untuk pembaharuan fiskal. Indeks ekuiti utama didagangkan dalam talian atau pada premium kepada penilaian purata jangka panjangnya. Jangkaan pertumbuhan yang kukuh untuk saham berkaitan e-dagang telah menyaksikan sektor ini melonjak dengan ketara sepanjang tahun lalu. Walau bagaimanapun, apabila hasil mula meningkat dan berada pada tahap normal daripada tahap rendah semasa, sebarang kerugian dalam pendapatan bagi syarikat-syarikat ini boleh mengakibatkan kejatuhan yang signifikan. Kami percaya terdapat kewaspadaan dalam sektor ini dan pemilihan saham akan menjadi lebih penting untuk menjana nilai jangka panjang. Sepanjang tempoh yang tidak menentu, pasaran mungkin akan memaparkan jurang yang lebih besar antara syarikat-syarikat berkualiti rendah dan berkualiti tinggi yang sememangnya memainkan peranan untuk kedudukan portfolio kami.
Ekonomi global membuka tirai 2018 dengan peningkatan segerak yang teguh, didorong oleh peningkatan pengeluaran pembuatan, jumlah dagangan dan harga komoditi. Pada Januari 2018, IMF meningkatkan ramalannya dan kini menjangka pertumbuhan ekonomi global untuk meningkat kepada 3.9% pada 2018 dan 2019, selepas 3.6% pada 2017, dengan kadar yang lebih tinggi daripada 3.2% yang dicatatkan pada 2016, apabila terdapat kebimbangan yang meluas berkenaan ekonomi sekular. Peningkatan ekonomi global yang diselaraskan telah mengurangkan jurang output dan, di samping harga minyak yang lebih tinggi, telah menyediakan asas untuk reflasi. Bagaimanapun, peningkatan inflasi masih diukur yang menjangkakan beberapa ‘kemerosotan’ ekonomi masih meluas dalam ekonomi utama. Daripada 0.8% pada 2016, IMF mengunjurkan inflasi dalam Pasaran Maju akan mencatat kadar purata 1.7% pada 2018 dan 2.1% pada 2019, sejajar dengan tahap sasaran akhir bank pusat.
Dengan persekitaran ekonomi AS yang meningkat, Rizab Persekutuan telah menaikkan Kadar Dana sebanyak enam kali ganda sejak Disember 2015, masing-masing dengan +25 mata asas, mencapai 1.75% pada Mac 2018. Pasaran kerja yang

AmMetLife Insurance Berhad Laporan Tahunan Bagi Dana Berkaitan Pelaburan Tahun Kewangan Berakhir 31 Mac 2018
Laporan Tahunan Bagi AmMetLife Insurance Berhad Tahun Kewangan Berakhir 31 Mac 2018 Dana Berkaitan Pelaburan140
Ulasan Pasaran Pelaburan (Sambungan)
bertambah baik telah menyokong pertumbuhan pendapatan boleh guna dan membantu menyokong perbelanjaan pengguna. Satu siri pemotongan cukai telah dilaksanakan dengan tujuan untuk meningkatkan pelaburan dan peluang pekerjaan. Sebagaimana yang ditegaskan, rancangan tersebut tidak dibiayai dana dan akan melebihi jangkaan jangka panjang dengan defisit fiskal.
Pasaran Ekuiti global telah meneruskan aliran kukuh sehingga Januari 2018 yang disokong oleh pemulihan makro global dan jangkaan pendapatan yang lebih tinggi di Amerika Syarikat selepas pembaharuan cukai. Momentum itu terjejas pada bulan Februari dan ketidaktentuan pasaran telah meningkat dengan ketara memandangkan para pelabur terkesan dengan kenaikan kadar Fed AS pada kos pendanaan, meningkatkan risiko perang perdagangan yang berpunca daripada pengenaan tarif perdagangan oleh Amerika Syarikat dan baru-baru ini, ancaman peraturan mengenai syarikat-syarikat berteknologi tinggi. Walaupun terdapat penguncupan baru-baru ini, kebanyakan indeks global masih didagangkan hampir pada purata jangka panjang pada metrik penilaian utama, didorong oleh saham teknologi.
- Sumber: Oasis Crescent Global Equity
- oleh AmFunds Management Berhad
Ulasan Pasaran Dana AmMetLife Global Emerging Market Dana Sasaran Dana Global Emerging Market OpportunitiesDana Sasaran Akhir Dana Schroders ISF Global Emerging Market Opportunities
Pasaran baru muncul (EM) mencatat peningkatan mendadak dalam tempoh 12 bulan, disokong oleh pertumbuhan dan perdagangan global yang rancak. Kelemahan Dolar AS juga membawa manfaat dalam hal ini. Prestasi kukuh saham teknologi juga menjadi satu sumbangan yang signifikan, biarpun dalam keadaan turun naik pasaran menjelang akhir tempoh berikutan pengumuman tarif perdagangan AS. Indeks MSCI Emerging Markets mencatatkan keuntungan yang kukuh dan telah mengatasi prestasi MSCI World.
China mencatatkan pulangan yang kukuh dan merupakan antara pasaran yang berprestasi terbaik, sebahagiannya disebabkan oleh peningkatan besar dalam saham teknologi. Data makroekonomi secara amnya stabil dengan pertumbuhan KDNK pada kadar 6.8% tahun ke tahun pada Q4 menunjukkan kesan minimum daripada langkah pihak berkuasa untuk memperketat kredit dan menangani risiko sektor kewangan. Kenaikan sedikit yang diselaraskan dalam pertumbuhan global
menyediakan sokongan kepada Hungary dan Republik Czech, yang mana kedua-duanya telah menunjukkan prestasi baik. Di Republik Czech, penghargaan mata wang adalah pemacu utama pulangan berlebihan, selepas bank pusat menghapuskan cap pada nilai mata wang berbanding dengan euro. Thailand, dan pada tahap yang lebih rendah Korea Selatan juga telah berjaya mengatasi prestasi. Kedua-dua pasaran mendapat manfaat daripada persekitaran luaran yang lebih teguh yang menggalakkan lagi eksport. Terdapat peningkatan ketegangan antara Korea Selatan dan China sepanjang tempoh itu, yang dikaitkan dengan pemasangan peluru berpandu THAAD di Korea Selatan. Walau bagaimanapun, keprihatinan ini menurun kepada tahap sederhana kemudiannya, di tengah-tengah harapan yang kian meningkat terhadap pemulihan hubungan dengan Korea Utara. Hal ini dipacu oleh komitmen Presiden Trump untuk bertemu dengan pemimpin Korea Utara Kim Jong-un, dan kunjungan selepas itu ke Beijing.
Dalam pada itu, ekonomi Brazil pula keluar daripada kemelut kemelesetan dan dasarnya terus bertambah baik. Inflasi mengekalkan trajektori menurun dan bank pusat terus mengurangkan kadar faedah utama, dari paras yang tinggi. Sementara itu, sabitan bekas Presiden Luiz Inácio Lula da Silva atas tuduhan rasuah berkemungkinan menjadikan peluangnya semakin tipis untuk kembali berkuasa bagi pihak Parti Pekerja kiri pada pilihan raya presiden 2018. Harga komoditi yang bertambah baik juga menjadi faktor sokongan. Peru pula adalah pasaran lain yang mendapat manfaat daripada harga komoditi yang lebih kukuh walaupun dipengaruhi ketidakpastian politik yang berakhir dengan peletakan jawatan Presiden Kuczynski pada Mac 2018.
Sebaliknya, ekuiti Qatari semakin merudum, berikutan pelaksanaan sekatan ekonomi dan diplomatik oleh sekumpulan negara serantau pada bulan Jun. UAE mencatatkan prestasi kurang berjaya, sebahagiannya disebabkan kelemahan yang dipaparkan Emaar Properties, yang kecewa dengan pengumuman dividen khasnya. India pula berakhir di wilayah positif tetapi dengan indeks yang tertangguh. Kesan buruk daripada penyitaan, ditambah pula dengan ketidakpastian berikutan pelaksanaan Cukai Barangan dan Perkhidmatan didapati telah membebani pertumbuhan ekonomi. Peningkatan kebimbangan terhadap defisit kembar negara juga menyumbang kepada peningkatan dalam hasil bon seterusnya dalam tempoh tersebut.
- Sumber: Schroders Investment Management Limited
(pengurus pelaburan Dana Sasaran Akhir)
- oleh AmFunds Management Berhad

AmMetLife Insurance Berhad Laporan Tahunan Bagi Dana Berkaitan Pelaburan Tahun Kewangan Berakhir 31 Mac 2018
Laporan Tahunan Bagi AmMetLife Insurance Berhad Tahun Kewangan Berakhir 31 Mac 2018 Dana Berkaitan Pelaburan 141
Ulasan Pasaran Dana AmMetLife Global Agribusiness Dana Sasaran Dana Global AgribusinessDana Sasaran Akhir Dana DWS Global Agribusiness
Berikutan pergolakan politik di Amerika Syarikat, ketegangan geopolitik di Asia dan Timur Tengah serta langkah-langkah dasar monetari di Eropah dan Amerika Syarikat pada tahun 2017, kami menyaksikan peningkatan harga bagi kebanyakan komoditi.
Sementara harga logam perindustrian seperti tembaga, aluminium, nikel dan zink meningkat lebih daripada 20% dan harga minyak mencatat peningkatan seterusnya sejak musim panas, keadaan ini dilihat memburukkan lagi trend harga komoditi pertanian. Dalam tahun kalendar semasa, tanaman jagung, gandum, kopi, koko dan gula sebahagiannya telah menunjukkan prestasi negatif yang jelas. Pendapatan petani turut merosot pada tahun 2017. Walau bagaimanapun, masih terdapat berita positif untuk sektor pertanian: di satu pihak, harga untuk baja potash, fosfat dan nitrogen telah pulih sejak bulan-bulan musim panas. Oleh yang demikian, harga saham telah meningkat dengan ketara bagi kebanyakan pengeluar. Sebaliknya, permintaan bagi komoditi pertanian dijangka terus meningkat: Dolar AS terus lemah kerana kebanyakan negara dengan mata wang yang tidak disandarkan kepada USD boleh mengimport komoditi pertanian dari AS pada harga lebih murah.
Walaupun dengan persekitaran yang sukar, pengurusan dana telah mencatatkan peningkatan nilai saham sekitar 13.7% dalam tempoh pelaporan (kelas saham E dalam USD).
- Sumber: Deutsche Asset Management (Asia) Limited
(pengurus Dana Sasaran Akhir)
- oleh AmFunds Management Berhad
Ulasan Pasaran AmMetLife Precious Metals Dana Sasaran Dana Precious Metals SecuritiesDana Sasaran Akhir Dana Deutsche Noor Precious Metals Securities
Dolar AS juga jelas dilihat lemah. Kami akan mengambil perhatian bahawa iklim dasar politik dan ekonomi yang berbeza dapat memacu mata wang yang berasingan dan selain perubahan dalam spread hasil relatif dan langkah-langkah mata wang ini boleh menyebabkan herotan ketika analisis harga Emas dijalankan.
Didahului pusingan awal pilihanraya Perancis pada 23 April 2017, terdapat kepercayaan yang tinggi bahawa Marie Le Pen akan mengisi salah satu daripada dua tempat dalam pusingan akhir pengundian. Hal ini akan menandakan sokongan orang Perancis kepada seorang calon populis, anti penubuhan dan boleh menarik Perancis keluar dari Kesatuan Eropah. Ketegangan dan tekanan risiko mendorong harga Emas pada pembelian selamat dan lindung nilai mata wang EUR. Walaupun Le Pen berjaya pada pusingan pertama pengundian, beliau hanya memenangi sebahagian undi yang lebih kecil berbanding lawannya pada pusingan kedua iaitu Macron centrist. Situasi ini adalah hasil terbaik untuk pasaran dan Euro, dan harga Emas menyaksikan keuntungan dari awal bulan terhapus. Pada bulan Mei, hasil dan kebetulan berubah terhadap harga Emas, yang menunjukkan korelasi negatif yang sangat ketara. Berfokus pada apa yang mendorong hasil lebih rendah, kami percaya bahawa faktor utama adalah perbezaan dalam persepsi kestabilan politik antara AS dan Eropah. Di Amerika Syarikat, pembunuhan Pengarah FBI Comey yang tidak disangka telah membawa gelombang kejutan melalui landskap politik. Keputusan yang dibuat secara tiba-tiba tidak sedikit menjejaskan saraf pelabur, terutama apabila digabungkan dengan kecurigaan yang melingkari pentadbiran Trump. Pada bulan Jun, Gold mencatatkan kerugian bulanan pertamanya berikutan kenaikan kadar harga yang dijangkakan oleh Fed pada pertengahan bulan itu. Terutama, Dolar AS juga lemah. Kami akan mengambil perhatian bahawa iklim dasar politik dan ekonomi yang berbeza dapat merangsang mata wang yang berasingan dan selain perubahan dalam sebaran hasil relatif, langkah-langkah mata wang ini boleh menyebabkan penyelewengan apabila menjalankan analisis harga Emas.
Pada Julai 2017, pemacu harga untuk Emas berubah dan mesejnya telah bercampur aduk. Data guna tenaga yang lebih kukuh diimbangi dengan penurunan inflasi dan jualan runcit yang lemah. Keadaan seperti itu meletakkan penggubah dasar “yang bergantung kepada data” dalam kedudukan yang tidak menentu. Untuk menentukan laluan kadar, mereka mesti terlebih dahulu membezakan data yang menunjukkan keadaan sebenar ekonomi. Harga Emas mencerminkan ketidakpastian ini tentang kadar harga dan ekonomi yang akan diteruskan selanjutnya, selebihnya terikat antara $1,200 dan $1,300/oz sejak akhir bulan Februari. Pada bulan Ogos, harga Emas menerima dua rangsangan daripada 2 sumber utama: risiko geopolitik dan peningkatan jangkaan bahawa pasaran mempunyai kadar masa depan yan nya untuk meneruskan pembangunan senjata nuklear sepenuhnya. Pasaran telah dijelaskan dengan lancar oleh berita, dan aset selamat seperti Emas, yang menyaksikan

AmMetLife Insurance Berhad Laporan Tahunan Bagi Dana Berkaitan Pelaburan Tahun Kewangan Berakhir 31 Mac 2018
Laporan Tahunan Bagi AmMetLife Insurance Berhad Tahun Kewangan Berakhir 31 Mac 2018 Dana Berkaitan Pelaburan142
pulangan bulanan terbaik kedua tahun 2017, telah berjaya menarik tawaran.
Emas juga mendapat sokongan daripada interpretasi pasaran mengenai minit-minit daripada mesyuarat FOMC yang terkini, yang mencerminkan ketidakupayaan yang semakin jelas sama ada persekitaran inflasi “peralihan” yang rendah itu sebenarnya, bersifat sementara. Dalam masa sebulan, perbezaan sudah dapat dirasai. Menjelang September, pelabur Emas mencatat prestasi memberangsangkan; melayari gelombang sokongan dua hala premium geopolitik yang tinggi dan keyakinan yang meluas bahawa pihak Fed terikat oleh inflasi yang rendah dan stabil, tetapi peristiwa pada bulan itu telah menyaksikan lonjakan harga Emas dan merangsang kedudukan logam kembali di bawah tahap psikologi penting $1,300/oz.
September menyaksikan penjualan daripada kemuncak tahunan semasa Emas. Berikutan langkah harga utama ini, Emas terus mengalami tekanan berikutan perkembangan positif daripada pembaharuan cukai di Amerika Syarikat. Memburukkan lagi keadaan, gelombang ini turut terjejas oleh berita dari EU bahawa penggubah dasar merancang untuk mengurangkan kadar pembelian bon, tetapi secara kebetulan memperluaskan program itu, menyebabkan penjualan dalam EUR dan peningkatan yang sepadan dalam Dolar. Pada mulanya, prospek untuk pembaharuan cukai kelihatan suram, tetapi senario berubah secara drastik apabila selera politik untuk pembaharuan meningkat. Versi pembaharuan cukai yang mempunyai peluang untuk benar-benar diluluskan dibangunkan segera sebagai hasil yang meluas daripada pertumbuhan ekonomi yang lebih tinggi dan cukai yang lebih rendah menyumbang kepada usaha kedua-dua pihak. Ekonomi yang lebih baik memberi faedah kepada USD dan memperkukuhkan kitaran kenaikan kadar oleh Fed; kedua-duanya membawa kesan negatif terhadap aset yang selamat seperti Emas. Secara keseluruhannya, persekitaran pertumbuhan segerak global dan normalisasi dasar telah menyumbang kepada tindakan harga Emas terikat di seluruh bahagian kebanyakan suku keempat. Permulaan bulan Disember menyaksikan banyak tindakan harga yang sama bagi Emas yang telah menekan pasaran sejak bulan September. Prestasi Logam menyaksikan kelemahan harga yang ketara dan sentimen yang umumnya lemah sementara pasaran menunggu kenaikan kadar daripada Fed. Sejurus selepas pengumuman kenaikan kadar harga, harga Emas mencatatkan pemulihan yang memberangsangkan sebagai dwi sokongan kepada kekuatan bermusim yang akan datang (awal tahun 2018) dan penjelasan kenaikan kadar harga emas tidak dibenarkan untuk sepanjang hujung tahun dan jurang ke atas,
menutup bulan tersebut pada kadar hampir +5% dari palung pertengahan bulan.
Memasuki tahun 2018, Emas mencatat peningkatan sepanjang Januari, mengakhiri bulan dengan kadar lebih tinggi 3%, pada $1,345/oz. Peningkatan harga Emas adalah hampir sejajar dengan kenaikan sedikit yang bermusim, tetapi sepertinya terdapat faktor-faktor tambahan yang mula muncul, yang paling menonjol adalah pergeseran fokus oleh peserta pasaran terhadap pulangan inflasi. Sebahagian besar tidak hadir sejak GFC, perbincangan inflasi mula menyentuh retorik peserta pasaran dan bank pusat. Dari segi pasaran, kadar pemulihan inflasi selama 5 tahun meluas pada kadar ~20bps, menandakan jangkaan pelabur telah menuju ke tahap di mana penggubah dasar akan mempertimbangkan notasi ‘normal’ dan ‘sihat’. Peningkatan ini menandakan perubahan segera daripada jangkaan inflasi lazim yang telah wujud sejak 5 tahun yang lalu. Bagi pihak bank pusat, Fed kembali menyatakan jangkaannya untuk peningkatan inflasi secara beransur-ansur ke arah sasaran 2% sepanjang 2018. Sepanjang bulan Februari, harga Emas kekal berada dalam lingkungan $1,320–$1,350, yang mencerminkan dalam pandangan, keseimbangan risiko dalam jangka masa terdekat untuk logam kuning. Sementara itu, kenaikan inflasi muda mula muncul, mengubah fungsi tindak balas Dollar kepada kenaikan kadar nominal. Di sisi negatifnya, kenyataan baru pengerusi Fed yang baru, Powell di hadapan Kongres telah diambil secara serius, menyebabkan para peserta pasaran mula menjangka kemungkinan kebangkitan empat kadar pada 2018. Antara yang turut menarik perhatian juga adalah reaksi Emas (kekurangan) terhadap ketidaktentuan pasaran ekuiti. Kami percaya Emas adalah sumber kecairan yang digunakan untuk memenuhi keperluan margin, yang mendorong jualan dan akhirnya mengekalkan paras harga walaupun ketidaktentuan dilihat semakin serius. Sepanjang bulan Mac, peningkatan kadar sasaran dan tarif Fed mencatatkan harga Emas dalam lingkungan $40/oz. Titik arah tradisional untuk laluan di hadapan harga Emas didapati bercampur pada bulan Mac, dengan kadar USD yang mendatar, menurun, inflasi juga berkurang dan keadaan kewangan yang tertekan. Risiko kepada kenaikan harga kini dilihat berpusat pada peningkatan risiko geopolitik dan ekonomi yang berkaitan dengan ketegangan perdagangan. Kami memantau keadaan ini dengan teliti sebagai peralihan dalam gambaran makroekonomi di Amerika Syarikat yang dapat mengubah jangkaan kami terhadap harga Emas tahun ini.
- Sumber: Deutsche Asset Management Investment GmbH (pengurus pelaburan Dana Sasaran Akhir)- oleh AmFunds Management Berhad
Ulasan Pasaran Pelaburan (Sambungan)

AmMetLife Insurance Berhad Laporan Tahunan Bagi Dana Berkaitan Pelaburan Tahun Kewangan Berakhir 31 Mac 2018
Laporan Tahunan Bagi AmMetLife Insurance Berhad Tahun Kewangan Berakhir 31 Mac 2018 Dana Berkaitan Pelaburan 143
Ulasan Pasaran Dana AmMetLife Tactical Bond Dana SasaranDana AmTactical Bond
Kerajaan Malaysia telah mengumumkan bajet 2018; yang berikut adalah agenda utamanya:• KDNK 2017 disemak sehingga 5.2–5.7% (dari 4.3–4.8%),
di bawah prestasi yang lebih baik dalam sektor pertanian, pembuatan dan perkhidmatan.
• KDNK 2018 diramalkan akan berkembang sebanyak 5.0–5.5%, didorong oleh sektor pembuatan, pembinaan dan perkhidmatan.
• Kerajaan tetap komited kepada penyatuan fiskal secara berperingkat, dengan sasaran defisit berkurangan hingga 2.8% pada tahun 2018 (3.0% pada tahun 2017).
• Pertumbuhan eksport dijangka melonjak 16.6% kepada RM917.5b pada 2017, disokong oleh permintaan tinggi barangan sektor pembuatan dan komoditi. Prestasi ini akan mencapai tahap normal kepada 3.4% pada 2018.
• Lebihan akaun semasa dianggar dapat dikekalkan pada RM32.3b atau 2.5% daripada PNK bagi tahun 2017 dan diramalkan menjadi lebih tinggi pada RM32.9b atau 2.3% daripada PNK bagi tahun 2018.
• Pertumbuhan pendapatan sebanyak 6.5% (6.1% pada tahun 2017) diimbangi dengan perbelanjaan operasi sebanyak 6.5%, manakala perbelanjaan pembangunan kekal tidak berubah.
• Bajet 2018 adalah berasaskan kepada harga minyak iaitu USD52 setong (USD50 pada 2017 dan harga semasa ≈USD59).
• Kutipan GST dijangka meningkat kepada RM43.8b (RM41.5b pada 2017).
• Inflasi dijangka berkurangan pada 2.5–3.5% pada tahun 2018 (3.0–4.0% pada tahun 2017).
• Pengurangan 2% dalam RM20,000-70,000 band cukai pendapatan peribadi, memberi pulangan kira-kira RM1.5b daripada pendapatan melepas.
Tenaga buruh Malaysia meningkat 2.2% YoY kepada 15.1 juta pada bulan Oktober manakala kadar pengangguran kekal pada paras yang sihat sebanyak 3.4%. Kerana prestasi ekonomi yang kukuh pada tahun lalu, peluang pekerjaan dilihat semakin meluas dan dengan itu, kelebihan ini mengatasi pertumbuhan pengangguran sejak Mac 2017. Akhirnya, Kerajaan mengumumkan bahawa ia telah bersetuju untuk menyediakan peruntukan RM929.4 juta untuk subsidi dan rebat sebanyak 1.80sen/kWh bagi tempoh 1 Januari hingga 30 Jun 2018, dengan itu mengurangkan potensi kenaikan kadar elektrik bagi tempoh enam bulan akan datang.
BNM menaikkan kadar dasarnya sebanyak 25 mata asas semasa mesyuarat Jawatankuasa Dasar Monetari (MPC) yang diadakan pada 25 Januari 2018. Kenaikan kadar ini seterusnya meningkatkan Kadar Dasar Semalaman (OPR) kepada 3.25% – kenaikan pertama sejak Julai 2014. Dalam kenyataannya berikutan kenaikan kadar, BNM menegaskan bahawa kenaikan OPR bukan bermaksud pengetatan monetari, namun ia merupakan normalisasi tahap penginapan monetari. BNM juga turut menambah bahawa MPC mahu memastikan bahawa dasar dasar adalah wajar, untuk mengelakkan risiko yang mungkin timbul daripada keadaan kadar faedah terlalu rendah dalam tempoh masa terlalu lama.
KDNK 4Q17 Malaysia telah pun diumumkan. KDNK sebenar meningkat 5.9% YoY, sedikit lebih perlahan daripada 6.2% yang direkodkan dalam 3Q17. Kenaikan yang lebih perlahan ini telah didorong oleh pertumbuhan eksport yang perlahan. Pertumbuhan tahun penuh adalah cemerlang pada kadar 5.9%, catatan terpantas dalam tempoh tiga tahun yang disokong oleh peningkatan dalam eksport dan permintaan domestik yang berdaya tahan. Lebihan akaun semasa tahun penuh (“CA”) dalam imbangan pembayaran kekal sihat pada RM40.3b atau 3% daripada KDNK (2.4% KDNK 2016).
- oleh AmFunds Management Berhad
Ulasan Pasaran Dana AmMetLife Asia Pacific REITS Dana SasaranDana AmAsia Pacific REITS
Tinjauan menjadi lebih positif pada permulaan 2Q17 dengan IMF menaikkan unjuran KDNK global 2017 kepada 3.5% daripada 3.1% di tengah-tengah pemulihan ekonomi yang stabil, perdagangan global yang bervariasi disebabkan oleh pemecatan, serta sektor korporat yang mula meningkatkan pengeluaran. Sesetengah ketidakpastian geopolitik telah dipulihkan dengan kemenangan Macron dalam pilihan raya presiden Perancis, meredakan kebimbangan mengenai perpecahan EU. Trump mengumumkan rancangan untuk mengurangkan cukai korporat kepada 15% daripada 35% dan AS Fed menarik pencetus kenaikan kadar faedah kedua pada bulan Jun. Walau bagaimanapun, sentimen mula berubah disebabkan oleh risiko geopolitik serta kebimbangan terhadap kesan normalisasi dasar monetari bank global.
Pada bulan Julai, US Fed menyatakan jangkaannya untuk mengurangkan lembaran imbangannya mulai tahun ini,

AmMetLife Insurance Berhad Laporan Tahunan Bagi Dana Berkaitan Pelaburan Tahun Kewangan Berakhir 31 Mac 2018144
Dana Berkaitan PelaburanBagi Tahun Kewangan Berakhir 31 Mac 2018
LAPORAN TAHUNAN
2018
sementara IMF mengurangkan ramalan pertumbuhan AS kepada 2.1%. Bank of China menaikkan kadar faedah sebanyak 25bps kepada 0.75%, buat pertama kali dalam tempoh 7 tahun. PMI Eropah meningkat kepada 57.4, iaitu kenaikan 6 tahun. Keadaan geopolitik semakin tegang pada bulan Ogos disebabkan oleh Korea Utara.
Pada September 2017, IMF menaikkan unjuran KDNK global daripada +3.6% pada 2017 dan +3.7% pada 2018. Pengangguran di AS mencecah paras terendah dalam tempoh 17 tahun pada kadar 4.2%. Keyakinan pelabur EU berada pada paras kenaikan 10 tahun walaupun Draghi menegaskan bahawa ECB akan terus membeli “jumlah bon korporat yang besar” yang menyokong kredit & aset persisian secara umum. Pemilihan LDP Perdana Menteri Abe di Jepun memberinya kawalan 2/3 rumah tahap rendah. Pada bulan Oktober, nilai AUD jatuh berbanding USD. REIT Jepun terus menghadapi tekanan jualan daripada amanah pelaburan domestik walaupun keadaan ini sedikit sebanyak diimbangi oleh pembelian asing dan ETF. REIT Singapura +2.5% dengan Pejabat memaparkan prestasi terbaik sepanjang bulan itu.
Semua perhatian tertumpu pada perubahan Kod Cukai Amerika Syarikat pada bulan November. Yellen mengesahkan bahawa beliau akan meninggalkan barisan lembaga Fed AS pada Februari 2018 apabila Jerome Powell mengambil alih jawatan Pengerusi. Ia juga merupakan bulan yang lebih baik untuk REIT serantau memandangkan sektor itu telah pulih.
2017 ditutup dengan beberapa kejutan memandangkan pasaran global terus menyaksikan peningkatan walaupun terdapat kebimbangan terhadap ketidaktentuan politik (Trump sebagai Presiden AS), kenaikan kadar Fed AS, risiko pilihan raya di zon Euro, selain ketegangan geopolitik di Korea Utara dan Timur Tengah. Pasaran global disokong dengan baik oleh:1. pertumbuhan ekonomi yang kukuh di seluruh dunia;2. pendapatan korporat yang lebih kukuh, terutamanya dalam
sektor teknologi; 3. pemulihan harga minyak;4. persekitaran kadar inflasi dan kadar faedah yang rendah; dan5. pasaran kerja yang kuat yang meningkatkan keyakinan
pengguna, seterusnya menyokong pemulihan penggunaan.
Kadar faedah penanda aras US Fed tidak berubah pada bulan Januari disebabkan oleh pertumbuhan ekonomi pada ‘kadar mampat’ dan pasaran kerja dilihat terus mengukuh.
Pasaran global melalui tempoh ketidaktentuan pada bulan Februari 2018 berikutan ketakutan pelabur yang menjual atas kebimbangan utama, termasuklah:
1. ekonomi Amerika Syarikat yang terlalu kritikal (risiko kenaikan kadar lebih banyak);
2. jangkaan inflasi yang lebih tinggi; dan 3. kemungkinan perang perdagangan global.REIT serantau telah dijual berikutan kenaikan hasil AS.
Pada bulan Mac 2018, Trump mengumumkan 25% tarif keluli dan 10% tarif aluminium yang dilihat memburukkan lagi keadaan turun naik pasaran. Trump dan Kim merancang untuk bertemu pada Mei untuk membincangkan penyahnuklearan di Korea. Presiden ECB Mario Draghi mengumumkan pembatalan pembelian aset bulanan pada akhir 2018. KDNK EU pada 2017 adalah +2.3%. KDNK Q4 Jepun telah disemak semula pada kadar +1.1 hingga + 1.6%. Gabenor Kuroda berkata BoJ akan mula menitikberatkan rangsangan pada 2019. JPY memecah rekod dengan pencapaian tahap 105.00 untuk kali pertama sejak November 2016. Eksport China melonjak 45% YoY, sementara import meningkat 6%, menghasilkan lebihan perdagangan sebanyak USD33b.
Pasaran ekuiti AS mengharungi masa yang sukar pada bulan April 2018 di tengah-tengah kebimbangan yang semakin meningkat berhubung perang perdagangan antara AS dan China. Hal ini dicetuskan oleh pertimbangan kerajaan AS untuk mengenakan tambahan USD100b dalam tarif ke atas produk China, selepas China melaksanakan tarif balas sehingga 25% pada USD3b ke atas produk makanan import dari Amerika Syarikat. Walau bagaimanapun, pendirian Presiden China yang agak konservatif dan janjinya untuk terus membuka ekonomi kepada persaingan asing membantu mengawal pasaran. Di samping itu, jangkaan musim perolehan yang mantap dan berakhirnya ketakutan perang besar antara Syria dan Rusia juga mengembalikan keyakinan para pelabur. Pada sisi lain, hal ini juga diredakan oleh beberapa langkah positif, iaitu:1. penarikan balik di pasaran dengan hasil nota Perbendaharaan
10 Tahun yang meningkat di atas ambang 3% (tertinggi sejak Januari 2014);
2. keyakinan untuk meningkatkan pertumbuhan ekonomi, dengan bacaan awal KDNK suku pertama AS menunjukkan peningkatan tahunan sebanyak 2.3%; dan
3. siaran pendapatan korporat yang meningkat.
Pelabur juga merasai beberapa penangguhan dalam pengurangan ketegangan antara Korea Utara dan Korea Selatan. Bagi bulan tersebut, Indeks Purata Perindustrian Dow Jones ditutup positif pada kadar 0.25%.
- oleh AmFunds Management Berhad
Ulasan Pasaran Pelaburan (Sambungan)

AmMetLife Insurance Berhad Laporan Tahunan Bagi Dana Berkaitan Pelaburan Tahun Kewangan Berakhir 31 Mac 2018
Dana Berkaitan PelaburanBagi Tahun Kewangan Berakhir 31 Mac 2018
LAPORAN TAHUNAN
2018
Tinjauan Pelaburan

AmMetLife Insurance Berhad Laporan Tahunan Bagi Dana Berkaitan Pelaburan Tahun Kewangan Berakhir 31 Mac 2018
Laporan Tahunan Bagi AmMetLife Insurance Berhad Tahun Kewangan Berakhir 31 Mac 2018 Dana Berkaitan Pelaburan146
Tinjauan Pasaran EkuitiKetidaktentuan pasaran global berterusan pada bulan Mac 2018 sejak ia mula dirasai pada awal Februari tahun ini, mempengaruhi sentimen pasaran tempatan. Pada bulan itu, terdapat perubahan yang jelas dalam minat pasaran tempatan di mana para pelabur bergerak dari saham cap/spekulasi yang lebih rendah kepada stok pertengahan/pertahanan pertengahan besar untuk mengharungi tempoh yang tidak menentu ini. Aliran dana asing terus lemah di mana aliran keluar bersih Mac adalah RM61 juta walaupun YTD mencatat aliran masuk bersih sebanyak RM2.2b. Pasaran kekal berhati-hati pada bulan ini terutamanya disebabkan oleh:1. Pengumuman Trump mengenai keputusan tarif import ke
atas keluli dan aluminium;2. kebimbangan terhadap peningkatan perlindungan
perdagangan terhadap pemecatan mengejut Setiausaha Negara AS, Rex Tillerson, yang menyokong perdagangan bebas; dan
3. tarif tambahan ke atas barangan China yang diumumkan oleh AS disumbangkan oleh tarif yang dicadangkan China ke atas 128 jenis produk AS yang boleh membawa kepada perang perdagangan.
Pada asas m-o-m, KLCI ditutup sedikit lebih tinggi dan ini menjadikan KLCI sebagai indeks berprestasi terbaik dalam jangka panjang USD YTD di rantau ini.
Tinjauan Pasaran Pendapatan TetapSeperti dijangka ramai, Rizab Persekutuan A.S. meningkatkan kadar dana persekutuan sebanyak 25 bps semasa mesyuarat pada Mac 2018. Dalam kenyataannya, Fed terus mencatatkan jumlah kenaikan 3 kali ganda untuk 2018, peningkatan unjuran KDNK 2018 kepada 2.7% daripada 2.5%, dan mengekalkan unjuran inflasi pada kadar 1.9%. Meskipun dengan kenaikan kadar, penyata Fed dilihat lebih rendah berbanding jangkaan pasaran dengan USD jatuh sebanyak 0.65% dan hasil UST 10 tahun menurun 6bps dalam perdagangan semalaman.
Kebimbangan mengenai perang perdagangan mempengaruhi pasaran selepas AS mengumumkan tarif import yang dirancang ke atas barangan dari China. Tarif ini adalah sebagaimana pengenaan tarif pada keluli dan aluminium China oleh AS yang menyebabkan China juga menzahirkan respons dengan mengenakan tarif import Amerika ke China. Persekitaran inflasi yang lemah dan risiko penurunan perdagangan turut mendorong penghasilan bon global.
Di peringkat domestik, jangkaan BNM terhadap pertumbuhan ekonomi yang mapan dan penurunan inflasi bermakna dasar monetari tidak dijangka akan tersasar jauh daripada keadaan semasa.
- oleh AmFunds Management Berhad
Tinjauan Pasaran Dana AmMetLife Oasis Islamic Equity Dana Sasaran Dana AmOasis Global Islamic EquityDana Sasaran Akhir Dana Oasis Crescent Global Equity
Ekonomi global menghadapi beberapa risiko utama pada masa hadapan. Yang paling signifikan, normalisasi dasar monetari di pasaran maju, khususnya Amerika Syarikat, boleh menyebabkan pengetatan keadaan kewangan global yang lebih pantas daripada yang dijangka, seterusnya boleh memberi impak kepada penilaian pasaran dan meningkatkan ketidaktentuan pasaran. Segmen-segmen pasaran yang berbeza dengan persekitaran kadar faedah yang meningkat, oleh yang demikian, adalah penting untuk membezakan kedudukan kitaran dan pertahanan serta pilihan keutamaan sektor sensitif kadar. Inisiatif yang diambil oleh Presiden AS untuk menambah tarif import keluli dan aluminium telah membawa kepada langkah yang sepadan oleh pihak berkuasa China, yang mencetuskan kebimbangan terhadap perang perdagangan ‘tit-for-tat’ yang semakin meningkat. Di samping itu, keberhutangan korporat yang tinggi di China serta ketelusan dalam lembaran imbangan kerajaan tempatan juga menimbulkan risiko utama ke atas ekonomi dan, dengan lanjutan, ekonomi global, menandakan bahawa ketidaktentuan pasaran akan berterusan.
Dengan persekitaran ini, kami percaya beberapa langkah berhati-hati akan diambil dan pemilihan saham akan menjadi lebih kritikal untuk menjana nilai jangka panjang. Sepanjang tempoh yang tidak menentu ini, pasaran mungkin akan meningkatkan jurang antara syarikat-syarikat berkualiti rendah dan tinggi, yang sepatutnya memaparkan prestasi yang baik untuk kedudukan portfolio kami.
Tinjauan PelaburanDana AmMetLife Equity, Dana Balanced, Dana Teguh, Dana Dividend, Dana Bond

AmMetLife Insurance Berhad Laporan Tahunan Bagi Dana Berkaitan Pelaburan Tahun Kewangan Berakhir 31 Mac 2018
Laporan Tahunan Bagi AmMetLife Insurance Berhad Tahun Kewangan Berakhir 31 Mac 2018 Dana Berkaitan Pelaburan 147
WEIGHTED
HIGHQUALITY
TRADING AT A DISCOUNT TO THE MARKETAT LOW
RISK
ROAE PE EV/EBITDA DY
FCF YIELDND/EBITDA BETA
* *
OASIS CRESCENT GLOBAL EQUITY MODEL PORTFOLIO
25.9 14.3 9.5 3.1 7.0 0.5 0.9
DJIM INDEX 16.1 23.0 13.3 1.9 4.2 0.4 1.0
Sumber: Oasis Research; Bloomberg: Mac 2018
Sejak penubuhan dana Oasis Crescent Global Equity, kami terus mengekalkan Beta kurang daripada DJIM, yang menggambarkan bahawa risiko berkaitan dengan dana dikekalkan pada tahap lebih rendah. Portfolio tersebut menawarkan Pulangan atas Ekuiti yang mampan pada kadar lebih tinggi daripada DJIM semasa menjalankan perdagangan pada penilaian yang banyak dikurangkan, merentasi kebanyakan metrik. Di samping penilaian menarik dalam portfolio kami, sejumlah besar syarikat dalam portfolio kami terlibat dalam pembelian balik saham, yang menunjukkan bahawa perubahan sentimen daripada pertumbuhan kepada nilai boleh menggalakkan peluang yang signifikan untuk portfolio ini. Syarikat-syarikat dalam portfolio kami mempunyai lembaran imbangan yang kukuh yang boleh memberikan perlindungan penurunan harga dalam persekitaran kadar faedah yang normal dan hasil aliran tunai bebas yang kukuh sepatutnya memberi peluang peningkatan nilai untuk diteruskan. Kami yakin portfolio kami berada pada kedudukan yang baik untuk menyediakan pulangan yang diselaraskan dengan risiko yang menarik untuk pelanggan kami dalam jangka masa panjang.
- Sumber: Oasis Crescent Global Equity
- oleh AmFunds Management Berhad
Tinjauan Pasaran Dana AmMetLife Global Emerging Market Dana Sasaran Dana Global Emerging Market OpportunitiesDana Sasaran AkhirDana Schroders ISF Global Emerging Market Opportunities
Pertumbuhan global dilihat mendapat sokongan yang baik, walaupun terdapat tanda-tanda momentum yang sederhana. Tinjauan untuk pertumbuhan yang semakin meningkat masih positif, walaupun kami menjangkakan penurunan dalam kadar pertumbuhan ekonomi di China, dari paras yang tinggi. Kebanyakan ekonomi sedang membangun adalah ekonomi pertengahan kitaran dan kami menjangkakan pertumbuhan
yang sihat akan terus menyokong pemulihan yang berterusan dalam pendapatan korporat dan pulangan ke atas ekuiti. Kami juga masih menjangkakan bahawa pendapatan akan menerajui prestasi pasaran pada tahun 2018. Penilaian pasaran dalam agregat adalah selaras dengan purata jangka panjang pada harga buku dan menarik pada nisbah harga-kepada-pendapatan 12.6x ke hadapan (PER), diskaun hampir 22% kepada MSCI World.
Dua daripada risiko kami bagi tahun 2018 adalah dasar monetari yang ketat di pasaran maju, serta konflik perdagangan. Kami juga melihat pasaran AS sedang memasuki kitaran pertumbuhan lewat dan akibatnya, ia meningkatkan rangsangan fiskal negara tersebut. NAFTA juga kekal sebagai isu tertunggak. Kami sentiasa menilai semula pandangan teras untuk menilai sejauh mana salah satu daripada kedua-dua isu utama ini boleh mempengaruhi jangkaan pertumbuhan dan pendapatan. Politik dan geopolitik domestik adalah faktor yang perlu dipantau seterusnya, khususnya pilihan raya akan datang di Mexico dan Brazil, serta tindakan dasar yang berpotensi positif di Afrika Selatan.
Rusia juga merupakan satu kuasa besar yang harus diberi perhatian. Berikutan pengumuman sekatan baru AS ke atas Rusia pada 6 April, pasaran ekuiti Rusia dan rouble (mata wang Rusia) melalui keadaan yang tidak menentu, dan persekitarannya kekal cair dan tidak menentu. Tindakan yang diambil oleh AS mewakili peningkatan harga bahan dalam risiko geopolitik. Serangan kimia yang diketuai oleh kerajaan Assad di Syria, yang disokong oleh Rusia, juga telah meningkatkan risiko ini. Kami tidak boleh meramalkan langkah-langkah seterusnya secara tepat, tetapi mengikut pengalaman kami, ekuiti Rusia sering bertindak balas dalam jangka masa terdekat terhadap aliran berita negatif disebabkan oleh kekurangan pembeli tempatan memandangkan industri pengurusan pencen/aset negara yang belum matang.
Pada bulan April, kami meletakkan Poland sebagai tambahan dalam senarai pasaran utama kami. Tinjauan untuk pertumbuhan ekonomi adalah kukuh dan kami telah mengenal pasti sejumlah peluang bawah-atas yang kukuh. Kami juga telah berjaya mengurangkan risiko di Rusia dengan menurunkan saiz kedudukan yang mencatat lebihan berat. Kami akan terus menganalisis keadaan dan kedudukan kami secara berterusan.
Di Hungary, persekitaran makroekonomi terus menyedia sokongan dan penilaian adalah munasabah. Di Korea Selatan, risiko geopolitik dan perdagangan masih berterusan. Walau bagaimanapun, pasaran menawarkan penilaian yang menarik dan tadbir urus korporat terus bertambah baik. Di Rusia, sekatan

AmMetLife Insurance Berhad Laporan Tahunan Bagi Dana Berkaitan Pelaburan Tahun Kewangan Berakhir 31 Mac 2018
Laporan Tahunan Bagi AmMetLife Insurance Berhad Tahun Kewangan Berakhir 31 Mac 2018 Dana Berkaitan Pelaburan148
terbaru Amerika Syarikat berkemungkinan akan meningkatkan premium risiko untuk pasaran Rusia secara berterusan tetapi pemulihan ekonomi secara beransur-ansur masih berada pada tahap positif dan penilaian dilihat murah, terutama selepas penjualan baru-baru ini. Di Greece, pemulihan ekonomi terus berjalan dan penilaian adalah menarik.
Kami sedang mencari idea bawah-atas yang kukuh di pasaran bukan teras, terutamanya China, malah juga Afrika Selatan dan Brazil. Kami juga telah mengenal pasti peluang saham di Pakistan dan Mesir.
- Sumber: Schroders Investment Management Limited
(pengurus pelaburan Dana Sasaran)
- oleh AmFunds Management Berhad
Tinjauan Pasaran Dana AmMetLife Global Agribusiness Dana Sasaran Dana Global AgribusinessDana Sasaran Akhir Dana DWS Global Agribusiness
Selama lima tahun, pasaran bijirin secara keseluruhan yang dilihat lemah telah menutup pendapatan petani yang diterjemahkan kepada persaingan yang lebih tinggi dalam kalangan pembekal petani (baja, biji, jentera, dan lain-lain) untuk bahagian yang lebih besar daripada pecahan sektor yang semakin mengecil. Hal ini terus menarik sektor teras. Harapan dilihat lebih cerah apabila laporan Penanaman Prospektif USDA terbaru mencadangkan penurunan ekar Amerika Syarikat bagi tanaman kacang soya dan jagung, yang akan menyokong harga ke hadapan. Kedudukan USD yang lebih lemah berbanding tahun lepas turut membantu; kami telah melihat eksport AS yang lebih kukuh pada musim ini. Kami juga mendapati bahawa harga bijirin meningkat sehingga baru-baru ini, yang menjadi tanda pemulihan sektor Pertanian secara perlahan-lahan. Tanaman jagung didagangkan sekitar $4, yang merupakan kadar tertinggi sejak Jun 2016.
Walaupun tidak terdesak untuk mendapat pendedahan kepada segmen teras, ia pasti muncul di bahagian bawah yang akhirnya boleh berubah menjadi kitaran yang baik selepas mengalami kejatuhan beberapa tahun kebelakangan ini. Namun, walaupun tanpa pelaburan, dana pelaburan yang lebih meluas menyediakan peluang lain dalam sektor kelompok kecil: penghantaran makanan, pertanian jitu, bahan makanan
haiwan bernilai tinggi atau akuakultur kurang berkorelasi negatif dengan industri Agrobisnes tradisional dan oleh itu harus dilaksanakan secara bebas daripada harga komoditi.
- Sumber: Deutsche Asset Management (Asia) Limited
(pengurus Dana Sasaran Akhir)
- oleh AmFunds Management Berhad
Tinjauan Pasaran Dana AmMetLife Precious Metals Dana Sasaran Dana Precious Metals SecuritiesDana Sasaran Akhir Dana Deutsche Noor Precious Metals Securities
Momentum kadar sebenar kekal tidak menentuMomentum dasar normalisasi telah menjadi lazim di seluruh dunia. Pergerakan yang mantap daripada dasar monetari bukan konvensional telah berjalan baik di AS dan telah mula memasuki retorik di EU. Sementara itu, di Jepun, tahun kewangan yang longgar telah menghapuskan ancaman deflasi dan membantu meningkatkan keyakinan pengguna dan KDNK. Semua trend ini memberi gambaran persekitaran hasil nominal yang meningkat, yang biasanya negatif bagi Emas.
Walau bagaimanapun, pasaran baru-baru ini menyaksikan peralihan dalam jangkaan inflasi yang boleh mengekalkan kadar sebenar yang menghadapi tekanan walaupun berlaku kenaikan nominal hasil berikutan tindakan normalisasi dasar oleh bank pusat global. Adalah sangat penting bagi pelabur Emas untuk memantau hubungan antara hasil nominal (contohnya Perbendaharaan), jangkaan inflasi (contohnya TIP masa depan), USD dan inflasi nyata. Kami melihat risiko terhadap kadar sebenar berada pada tahap seimbang pada ketika ini, menggambarkan pandangan kami yang spontan pada harga Emas tahun ini.
Persekitaran kadar semasa selama ini dilihat sangat kukuh untuk Emas. Walaupun Fed menyusul dengan kenaikan harga yang dicadangkan pada tahun ini, kadar faedah nominal di Amerika Syarikat masih akan berada di paras terendah dalam sejarah dan kadar sebenar akan berada di tahap terendah sejak tahun 1980-an.• Dalam jangka masa pendek, ketidakpastian pasaran yang
semakin tinggi akan mengekalkan harga Emas apabila permintaan para pelabur untuk aset selamat dapat memenuhi penawaran tetap secara relatif.
Tinjauan Pelaburan (Sambungan)

AmMetLife Insurance Berhad Laporan Tahunan Bagi Dana Berkaitan Pelaburan Tahun Kewangan Berakhir 31 Mac 2018
Laporan Tahunan Bagi AmMetLife Insurance Berhad Tahun Kewangan Berakhir 31 Mac 2018 Dana Berkaitan Pelaburan 149
• Untuk jangka masa panjang, kami telah memasuki era kadar nominal negatif yang belum pernah berlaku sebelum ini yang telah menyelesaikan halangan utama untuk pegangan Emas (“ia tidak membayar hasil”), memperkukuh kes asas untuk penghargaan jangka panjang terhadap harga Emas.
Kami percaya Emas mewakili cara yang paling bersih dan paling berkesan untuk mendapatkan pendedahan aset selamat dan kami akan terus melihat sokongan terhadap logam kuning selagi ketidakpastian masih berterusan.
- Sumber: Deutsche Asset Management Investment GmbH
(pengurus pelaburan Dana Sasaran Akhir)
- oleh AmFunds Management Berhad
Tinjauan Pasaran Dana AmMetLife Tactical Bond Dana SasaranDana AmTactical Bond
Seperti dijangka ramai, Rizab Persekutuan A.S. meningkatkan kadar dana persekutuan sebanyak 25 bps semasa mesyuarat pada Mac 2018. Dalam kenyataannya, Fed terus mencatatkan jumlah kenaikan 3 kali ganda untuk 2018, peningkatan unjuran KDNK 2018 kepada 2.7% daripada 2.5%, dan mengekalkan unjuran inflasi pada kadar 1.9%. Meskipun dengan kenaikan kadar, penyata Fed dilihat lebih rendah berbanding jangkaan pasaran dengan USD jatuh sebanyak 0.65% dan hasil UST 10 tahun menurun 6bps dalam perdagangan semalaman.
Kebimbangan mengenai perang perdagangan mempengaruhi pasaran selepas AS mengumumkan tarif import 25% pada USD50b yang dirancang ke atas barangan dari China. Tarif ini adalah sebagaimana pengenaan tarif pada keluli dan aluminium China oleh AS yang menyebabkan China juga menzahirkan respons dengan mengenakan tarif import Amerika ke China pada USD3b. Persekitaran inflasi yang lemah dan risiko penurunan perdagangan turut mendorong penghasilan bon global.
Di peringkat domestik, jangkaan BNM terhadap pertumbuhan ekonomi yang mapan dan penurunan inflasi bermakna dasar monetari tidak dijangka akan tersasar jauh daripada keadaan semasa.
- oleh AmFunds Management Berhad
Tinjauan Pasaran Dana AmMetLife Asia Pacific REITS Dana Sasaran Dana AmAsia Pacific REITS
Pelabur seluruh dunia terus memantau kemajuan perbincangan perdagangan antara Amerika Syarikat dan China, serta hubungan antara Korea Utara dan Korea Selatan berikutan sidang kemuncak pada hujung April 2018; pada perkara yang berkaitan, hasil perbincangan Korea Utara-AS dijadualkan berlangsung di Singapura pada 12 Jun 2018 juga akan menjadi perhatian pelabur.
Di samping itu, pelabur akan terus memantau data ekonomi di Amerika Syarikat sebagai pendahuluan kepada keputusan dasar monetari yang diambil oleh Rizab Persekutuan, yang berpandu untuk 3 kenaikan kadar bagi tahun 2018.
Walaupun pasaran mungkin merasakan bahawa kenaikan kadar sebagai berita negatif terhadap REIT, kami pula percaya kenaikan kadar sebagai bacaan positif terhadap pertumbuhan ekonomi memberi impak positif untuk REITs. Ini kerana pertumbuhan ekonomi akan menyokong pertumbuhan kadar sewa, dengan itu mengimbangi kesan kadar faedah yang lebih tinggi. Tambahan pula, REITs mempunyai lembaran imbangan yang diuruskan dengan baik dengan profil kematangan hutang yang berperingkat serta nisbah hutang tetap yang tinggi, mengurangkan kesan kadar yang lebih tinggi terhadap pengedaran.
- oleh AmFunds Management Berhad

Dana Berkaitan PelaburanBagi Tahun Kewangan Berakhir 31 Mac 2018
LAPORAN TAHUNAN
2018
HALAMAN INI SENGAJA DIBIARKAN
KOSONG

Dana Berkaitan PelaburanBagi Tahun Kewangan Berakhir 31 Mac 2018
LAPORAN TAHUNAN
2018
Strategi Pelaburan

AmMetLife Insurance Berhad Laporan Tahunan Bagi Dana Berkaitan Pelaburan Tahun Kewangan Berakhir 31 Mac 2018
Laporan Tahunan Bagi AmMetLife Insurance Berhad Tahun Kewangan Berakhir 31 Mac 2018 Dana Berkaitan Pelaburan152
Strategi Pelaburan EkuitiWalaupun pasaran global dijangka terus berada dalam keadaan tidak menentu dalam jangka masa terdekat, kami terus optimis pada peringkat tempatan disebabkan oleh perkara berikut: 1. Data makroekonomi yang berterusan – BNM baru-baru
ini menjana pertumbuhan KDNK 2018 pada kadar 5.5% hingga 6.0%;
2. Prospek Ringgit yang lebih kukuh – ini akan memberi penjimatan kos kepada syarikat tempatan tertentu dan menggalakkan aliran dana asing;
3. Pemulihan harga minyak – benefisiari yang jelas bagi sebuah negara eksport bersih seperti Malaysia yang akan meningkatkan pendapatan kerajaan dan meningkatkan baki fiskal;
4. Rangsangan sentimen pilihan raya – memandangkan tiga daripada empat tahun pilihan raya yang lalu, KLCI telah meningkat dalam tempoh 12 bulan pemilihan utama; dan
5. pasaran termurah dari segi penilaian relatif berbanding pesaing-pesaing di pasaran ASEAN kecuali Singapura.
Strategi Pelaburan Pendapatan TetapMemandangkan terdapat kecairan pasaran yang kukuh, pasaran MGS yang menyokong serta sebaran menarik untuk undian yang lebih rendah, kami menjangkakan lebih banyak penerbit korporat bertaraf rendah akan mendekati pasaran. Dalam jangka masa terdekat, persekitaran kadar faedah global yang semakin meningkat dan pilihan raya umum akan terus menjadi faktor utama yang boleh mempengaruhi hala tuju pasaran.
Untuk strategi jangka masa, kami mempunyai lebihan berat daripada neutral terhadap penanda aras. Semakan kami didasarkan pada prospek inflasi domestik yang lebih perlahan pada masa hadapan, MYR yang lebih kukuh di tengah-tengah kedudukan USD yang lemah dan risiko penurunan ke atas persekitaran global. Walaupun kami tidak mengharapkan peningkatan utama dalam hasil MGS, kami berpendapat bahawa hasil domestik akan terus disokong dengan baik. Dalam persekitaran hasil yang stabil secara relatif, strategi jangka masa yang lebih panjang membolehkan kami menuai hasil yang lebih tinggi yang biasanya ditawarkan oleh bon bertarikh lebih lama.
Untuk Dana Balanced dan Dana TeguhMelihat kepada prospek pasaran di atas, kami akan terus mengekalkan peruntukan aset dalam pendapatan tetap kepada ekuiti minimum dan ekuiti lebihan berat.
- oleh AmFunds Management Berhad
Strategi Pelaburan Dana AmMetLife Oasis Islamic Equity Dana Sasaran Dana AmOasis Global Islamic EquityDana Sasaran Akhir Dana Oasis Crescent Global EquityStrategi dan Dasar Dana SasaranObjektif Dana Oasis Crescent Global Equity adalah untuk mencapai modal dan pendapatan jangka sederhana hingga panjang dengan melabur dalam saham, termasuk saham keutamaan, syarikat dan saham atau unit dalam skim pelaburan kolektif dan amanah pelaburan hartanah (“REITS”) yang tersenarai dan didagangkan di bursa saham antarabangsa dan di pasaran, yang dinyatakan dalam Prospektus dan yang mematuhi Syariah mengikut garis panduan yang ditetapkan oleh Lembaga Penasihat Syariah Pengurus Pelaburan. Tujuannya adalah untuk melindungi kekayaan sebenar dan meningkatkan taraf hidup semua pelabur. Dana ini menyasarkan untuk menyediakan pulangan yang diselaraskan dengan risiko yang menarik kepada pelanggan kami, yang dipacu oleh pemilihan instrumen kami berdasarkan kualiti dan nilai, serta memastikan bahawa portfolio dipelbagaikan dengan sewajarnya. Salah satu ciri penting falsafah kami adalah untuk memberikan perlindungan penurunan yang signifikan berbanding dengan pasaran berdasarkan kriteria pemilihan kualiti dan penilaian kami. Ini adalah salah satu pemacu utama kejayaan dan pencapaian kekayaan dalam jangka masa panjang.
Kami telah mengekalkan falsafah pelaburan kami untuk melabur dalam syarikat-syarikat berkualiti tinggi yang mempunyai kelebihan daya saing yang kuat serta keupayaan untuk memanfaatkan kelebihan daya saing untuk menghasilkan pulangan yang lebih tinggi terhadap Pulangan Ekuiti (ROE) yang lebih tinggi melalui kitaran ekonomi. Kami percaya bahawa syarikat-syarikat yang mempunyai kunci kira-kira yang sihat dan aliran tunai yang kukuh mempunyai keupayaan untuk bertahan dalam mengharungi persekitaran ekonomi yang mencabar di samping menjana pertumbuhan pendapatan sebenar sepanjang tempoh jangka panjang. Portfolio kami menjalankan perdagangan dengan diskaun yang ketara kepada pasaran ekuiti global dalam pelbagai langkah dan menyediakan ROE yang lebih tinggi secara berterusan melalui kitaran ekonomi.
Hal ini akan memacu penciptaan kekayaan sebenar untuk pelanggan kami dalam jangka masa panjang. Selain itu, melihat kepada persekitaran kadar faedah semasa, kami percaya
Strategi PelaburanDana AmMetLife Equity, Dana Balanced, Dana Teguh, Dana Dividend, Dana Bond

AmMetLife Insurance Berhad Laporan Tahunan Bagi Dana Berkaitan Pelaburan Tahun Kewangan Berakhir 31 Mac 2018
Laporan Tahunan Bagi AmMetLife Insurance Berhad Tahun Kewangan Berakhir 31 Mac 2018 Dana Berkaitan Pelaburan 153
pendapatan bagi syarikat aliran tunai besar-besaran mengalami penurunan disebabkan oleh pulangan yang hampir diabaikan terhadap baki tunai mereka. Memandangkan keadaan ekonomi dan kadar faedah mula normal, syarikat-syarikat ini mendapat faedah manakala syarikat-syarikat dengan leveraj yang lebih tinggi terpaksa bertungkus lumus kerana kos pembiayaan mereka meningkat. Syarikat-syarikat dalam portfolio kami mempunyai kelebihan daya saing jangka panjang yang mampan dalam bentuk modal purata wajaran yang lebih rendah dibantu oleh generasi aliran tunai yang kukuh.
- Sumber: Oasis Crescent Global Equity
- oleh AmFunds Management Berhad
Strategi Pelaburan Dana AmMetLife Global Emerging Market Dana Sasaran Dana Global Emerging Market OpportunitiesDana Sasaran Akhir Dana Schroders ISF Global Emerging Market OpportunitiesPasaran utama kami pada permulaan tempoh adalah Brazil, Rusia, Korea Selatan dan Hungary. Kami membawa keluar Brazil daripada senarai pasaran utama kami pada Januari 2018 dan menambah Greece. Di Brazil, ekonomi terus pulih dan kami menjangkakan akan terus meningkat dalam pendapatan, tetapi penilaian dalam kes tertentu tidak memuaskan untuk menampung risiko politik yang berkaitan dengan keputusan yang tidak pasti pada pilihan raya dalam bulan Oktober. Di Greece, penilaian adalah murah dan terdapat peluang untuk pemulihan ekonomi.
- Sumber: Schroders Investment Management Limited
(pengurus pelaburan Dana Sasaran Akhir)
- oleh AmFunds Management Berhad
Strategi Pelaburan Dana AmMetLife Global AgribusinessDana Sasaran Dana Global AgribusinessDana Sasaran Akhir Dana DWS Global AgribusinessDi seluruh dunia, stok komoditi bagi kebanyakan hasil pertanian kini dipenuhi dengan baik. Tahun-tahun yang lalu telah menjadi tahun penuaian yang baik, digambarkan melalui
kejatuhan harga jagung, gandum dan kacang soya. Walau bagaimanapun, kedudukan Dolar AS yang lemah pada bulan-bulan kebelakangan ini mungkin memihak kepada permintaan yang lebih tinggi untuk komoditi pertanian serta eksport jagung dan kacang soya dari Amerika Syarikat. Harga komoditi pertanian pada masa ini hampir menyamai kos pengeluarannya, kesannya petani tidak boleh menerima insentif harga untuk pengembangan kawasan dan oleh itu hanya perlu meningkatkan bekalan dalam kitaran penuaian seterusnya terhad.
Untuk beberapa bulan, bagaimanapun, peningkatan harga baja produk nitrogen telah diperhatikan. Kami menjangkakan trend ini akan berterusan untuk jangka masa panjang dan stok pengeluar baja nitrogen akan mendapat manfaat daripadanya.
Pada masa akan datang, kami menjangkakan isyarat positif daripada sub-bahagian bahan kimia khusus. Sebagai contoh, dari sudut pandang kami, harga untuk methionina, suplemen makanan, mempunyai potensi untuk pemulihan selepas kejatuhan pada musim panas. Dalam konteks ini, syarikat-syarikat terpilih dalam bidang sains hayat dengan tahap pengkhususan tinggi dilihat mempunyai peluang yang cerah.
Sama ada trend yang dinyatakan di atas akan memberi impak positif pada 2018, hal ini masih perlu diberi perhatian. Oleh yang demikian, kami akan meneruskan pendekatan “seimbang” dalam portfolio antara syarikat huluan dan hiliran.
Salah satu pemacu yang kuat dalam sektor ini ialah pertumbuhan populasi global. Walaupun ramalan jangka panjang kelihatan tidak menentu berhubung dengan perkara tertentu, perkembangan pesat populasi seluruh dunia tidak dapat dipertikaikan. Perkembangan ini, di samping pertumbuhan penduduk yang tinggi di pasaran baru muncul, juga dibantu oleh peningkatan yang ketara dalam penjagaan perubatan. Ketidakseimbangan potensi antara bekalan dan permintaan makanan masih merupakan aspek utama, bahkan lebih dari sepuluh tahun selepas pelaksanaan dana. Sehingga sekarang, pengeluaran tanaman telah berjaya dan terus meningkat kerana penyelidikan dan kemajuan teknologi baru. Selain pertumbuhan penduduk, bagaimanapun, peningkatan kekayaan juga menyebabkan perubahan dari segi permintaan. Khususnya, perubahan diet membawa cabaran yang besar.
Berikut adalah tiga contoh yang perlu diberi perhatian:1. Permintaan daging yang lebih tinggi: semakin tinggi bilangan
pengguna - terutamanya di Asia - menggunakan lebih banyak daging. Semakin meningkat populasi haiwan pembiakan,

AmMetLife Insurance Berhad Laporan Tahunan Bagi Dana Berkaitan Pelaburan Tahun Kewangan Berakhir 31 Mac 2018
Laporan Tahunan Bagi AmMetLife Insurance Berhad Tahun Kewangan Berakhir 31 Mac 2018 Dana Berkaitan Pelaburan154
maka stok makanan haiwan juga sewajarnya memerlukan penambahan. Malangnya, ini diperlukan dalam kadar yang lebih tinggi daripada kuantiti daging yang dihasilkan.
2. Makanan organik: semakin ramai orang yang ada “kemampuan” dan menunjukkan minat lebih tinggi terhadap makanan organik. Pengeluaran makanan organik memerlukan lebih banyak usaha daripada pengeluaran makanan konvensional, contohnya, menggunakan perlindungan tanaman adalah tidak wajar supaya tanaman lebih terdedah kepada perosak dan kesan cuaca. Oleh itu, hasil penuaian adalah lebih rendah.
3. Penghantaran makanan: Bilangan platform dalam talian yang membolehkan pengguna untuk memesan makanan dari restoran kegemaran mereka dari rumah meningkat dengan ketara pada tahun-tahun kebelakangan ini. Memandangkan trend ini di Amerika Syarikat telah menjadi sebahagian daripada perkhidmatan digital baru untuk sementara waktu, pembekal baru-baru ini mendapat perhatian yang besar di Eropah juga. Pada tahun 2017, sebagai contoh, beberapa syarikat telah menembusi industri awam. Kesimpulannya, mereka mendapat manfaat daripada peningkatan isi rumah tunggal (kini sekitar 40 peratus di Jerman) dan kemungkinan menawarkan pemilihan masakan yang luas melalui platform ini.
Ini hanya beberapa contoh yang menekankan kerumitan perniagaan sektor pertanian.
- Sumber: Deutsche Asset Management (Asia) Limited
(pengurus pelaburan Dana Sasaran)
- oleh AmFunds Management Berhad
Strategi Pelaburan Dana AmMetLife Precious Metals Dana Sasaran Dana Precious Metals SecuritiesDana Sasaran Akhir Dana DWS Deutsche Noor Precious Metals Securities
Tumpuan berterusan pada pelaksanaan, fleksibiliti dan penilaianKami terus mengekalkan dana yang dilaburkan dalam syarikat-syarikat dengan pasukan pengurusan yang kuat yang telah menunjukkan keupayaan untuk melaksanakan tugas dengan kestabilan operasi dan mempunyai profil risiko kewangan dan operasi yang lebih rendah berbanding purata. Kami percaya pendekatan ini akan menghasilkan alpha melalui kitaran harga
keseluruhan. Walau bagaimanapun, pendekatan ini tidak meninggalkan dana yang tidak dapat dilepaskan oleh firma dengan tahap leveraj operasi dan kewangan yang berlebihan. Oleh itu, dana mungkin memaparkan prestasi kurang baik dalam jangka masa pendek, semasa tempoh ketidaktentuan harga Emas yang semakin serius.
Kami percaya pendekatan kami bukan sekadar mampu menampung kekurangan penggearan pada harga Emas dalam persekitaran dengan turun naik yang tinggi melalui penarafan semula syarikat tertentu. Memandangkan firma portfolio menunjukkan peningkatan dalam tahap pengeluaran keseluruhan dan fleksibiliti kewangan yang telah bebas daripada bahagian perbelanjaan berat kitaran capex, kami percaya para pelabur akan memberikan respons dengan meningkatkan penilaian relatif terhadap pesaingnya, seterusnya membentuk alpha.
- Sumber: Deutsche Asset Management Investment GmbH
(pengurus pelaburan Dana Sasaran Akhir)
- oleh AmFunds Management Berhad
Strategi Pelaburan Dana AmMetLife Tactical Bond Dana Sasaran Dana AmTactical BondUntuk strategi jangka masa, kami mengubah strategi kami untuk lebihan berat badan daripada neutral terhadap penanda aras. Semakan kami didasarkan pada prospek inflasi domestik yang lebih perlahan pada masa hadapan, MYR yang lebih kukuh di tengah-tengah kedudukan USD yang lemah dan risiko penurunan ke atas persekitaran global. Walaupun kami tidak mengharapkan peningkatan utama dalam hasil MGS, kami berpendapat bahawa hasil domestik akan terus disokong dengan baik. Dalam persekitaran hasil yang stabil secara relatif, strategi jangka masa yang lebih panjang membolehkan kami menuai hasil yang lebih tinggi yang biasanya ditawarkan oleh bon bertarikh lebih lama.
- oleh AmFunds Management Berhad
Strategi Pelaburan (Sambungan)

AmMetLife Insurance Berhad Laporan Tahunan Bagi Dana Berkaitan Pelaburan Tahun Kewangan Berakhir 31 Mac 2018
Laporan Tahunan Bagi AmMetLife Insurance Berhad Tahun Kewangan Berakhir 31 Mac 2018 Dana Berkaitan Pelaburan 155
Strategi Pelaburan Dana AmMetLife Asia Pacific REITS Dana Sasaran Dana AmAsia Pacific REITSKami terus mencatat lebihan berat Singapura berbanding penanda aras berikutan peningkatan asas makro global serta asas-asas sector, contohnya pertumbuhan permintaan dan kadar sewa yang berterusan untuk pejabat. Di samping itu, inisiatif kepelbagaian geografi dan segmen yang dilaksanakan oleh beberapa REIT yang lebih besar baru-baru ini akan membantu REITs mendapat faedah daripada kitaran di pasaran hartanah di tempat lain, dan bukannya bergantung sepenuhnya kepada kepelbagaian di Singapura.
Kami kekal positif di Australia yang menghalang keadaan yang tidak diduga kerana kami percaya terdapat satu lagi tahun untuk pertumbuhan segmen pejabat dan gudang disebabkan oleh kekangan penawaran di Sydney dan Melbourne yang secara positif dicerminkan dalam pertumbuhan kadar sewa.
Peruntukan kepada Jepun kekal kurang berat berbanding dengan penanda aras yang sebahagiannya dicetuskan oleh keadaan tidak menentu JPY. Walaupun asas pasaran hartanah
fizikal adalah utuh (bekalan yang padat + permintaan yang berterusan) yang mendasari pertumbuhan kadar sewa, iaitu bagi segmen pejabat, prestasi sektor telah terbukti dipengaruhi oleh aliran. Melihat senario ini, minat pelabur asing dalam sektor JREIT telah kembali memuncak bersama-sama dengan aliran masuk daripada JREIT ETFs. Kami terus memilih dengan keutamaan yang kukuh untuk kualiti aset, prospek pertumbuhan serta tadbir urus korporat yang kukuh.
Setakat ini, pelabur-pelabur semakin yakin pada tahun ini atas beberapa faktor, daripada kebimbangan mengenai kenaikan kadar faedah di Amerika Syarikat kepada risiko geopolitik di Asia Utara terhadap risiko dasar apabila butiran tentang tarif perdagangan yang dilaksanakan oleh Trump kini dikuatkuasakan. Oleh itu, panggilan pulang adalah untuk memelihara ekuiti di bahagian bawah iaitu 80–90% sehingga risiko semakin berkurang. Hal ini menunjukkan bahawa, ketidaktentuan tersebut telah terbukti menjadi peluang untuk menambah nilai kedudukan yang digemari pada penilaian yang lebih baik.
- oleh AmFunds Management Berhad

Dana Berkaitan PelaburanBagi Tahun Kewangan Berakhir 31 Mac 2018
LAPORAN TAHUNAN
2018
HALAMAN INI SENGAJA DIBIARKAN
KOSONG

Dana Berkaitan PelaburanBagi Tahun Kewangan Berakhir 31 Mac 2018
LAPORAN TAHUNAN
2018
Pretasi Dana

AmMetLife Insurance Berhad Laporan Tahunan Bagi Dana Berkaitan Pelaburan Tahun Kewangan Berakhir 31 Mac 2018
Laporan Tahunan Bagi AmMetLife Insurance Berhad Tahun Kewangan Berakhir 31 Mac 2018 Dana Berkaitan Pelaburan158
Pretasi Dana
Dana AmMetLife Equity
Prestasi Sejak Permulaan
Dana AmMetLife Equity berbanding Penanda ArasPrestasi sejak 27 Februari 2004 – 31 Mac 2018
Prestasi Setahun Penuh
Dana AmMetLife Equity berbanding Penanda ArasPrestasi sejak 1 April 2017 – 31 Mac 2018
Apr
-17
Mei
-17
Jun-
17
Jul-1
7
Ogo
s-17
Sep-
17
Okt
-17
Nov
-17
Dis
-17
Jan-
18
Feb-
18
Mac
-18
Pret
asi (
%)
Bulan
15.00
12.00
9.00
6.00
3.00
0.00
-3.00
AmMetLife EquityFBMKLCI
Mac
-04
Mac
-05
Mac
-06
Mac
-07
Mac
-08
Mac
-09
Mac
-10
Mac
-11
Mac
-12
Mac
-13
Mac
-14
Mac
-15
Mac
-16
Mac
-17
Mac
-18
Pret
asi (
%)
Bulan
150.00
120.00
90.00
60.00
30.00
0.00
-30.00
AmMetLife EquityFBMKLCI

AmMetLife Insurance Berhad Laporan Tahunan Bagi Dana Berkaitan Pelaburan Tahun Kewangan Berakhir 31 Mac 2018
Laporan Tahunan Bagi AmMetLife Insurance Berhad Tahun Kewangan Berakhir 31 Mac 2018 Dana Berkaitan Pelaburan 159
Dana AmMetLife Bond
Prestasi Sejak Permulaan
Dana AmMetLife Bond berbanding Penanda ArasPrestasi sejak 27 Februari 2004 – 31 Mac 2018
Prestasi Setahun Penuh
Dana AmMetLife Bond berbanding Penanda ArasPrestasi sejak 1 April 2017 – 31 Mac 2018
Mac
-04
Mac
-05
Mac
-06
Mac
-07
Mac
-08
Mac
-09
Mac
-10
Mac
-11
Mac
-12
Mac
-13
Mac
-14
Mac
-15
Mac
-16
Mac
-17
Mac
-18
Pret
asi (
%)
Bulan
90.00
70.00
50.00
30.00
10.00
-10.00
AmMetLife BondMBB 12mth FD rates
Apr
-17
Mei
-17
Jun-
17
Jul-1
7
Ogo
s-17
Sep-
17
Okt
-17
Nov
-17
Dis
-17
Jan-
18
Feb-
18
Mac
-18
Pret
asi (
%)
Bulan
4.00
3.00
2.00
1.00
0.00
AmMetLife BondMBB 12mth FD rates

AmMetLife Insurance Berhad Laporan Tahunan Bagi Dana Berkaitan Pelaburan Tahun Kewangan Berakhir 31 Mac 2018
Laporan Tahunan Bagi AmMetLife Insurance Berhad Tahun Kewangan Berakhir 31 Mac 2018 Dana Berkaitan Pelaburan160
Dana AmMetLife Balanced
Prestasi Sejak Permulaan
Dana AmMetLife Balanced berbanding Penanda ArasPrestasi sejak 27 Februari 2004 – 31 Mac 2018
Prestasi Setahun Penuh
Dana AmMetLife Balanced berbanding Penanda ArasPrestasi sejak 1 April 2017 – 31 Mac 2018
Pretasi Dana (Sambungan)
Mac
-04
Mac
-05
Mac
-06
Mac
-07
Mac
-08
Mac
-09
Mac
-10
Mac
-11
Mac
-12
Mac
-13
Mac
-14
Mac
-15
Mac
-16
Mac
-17
Mac
-18
Pret
asi (
%)
150.00
120.00
90.00
60.00
30.00
0.00
-30.00
Bulan
AmMetLife Balanced50% FBMKLCI & 50% MBB 12mth FD rates
Apr
-17
Mei
-17
Jun-
17
Jul-1
7
Ogo
s-17
Sep-
17
Okt
-17
Nov
-17
Dis
-17
Jan-
18
Feb-
18
Mac
-18
Pret
asi (
%)
Bulan
15.00
12.00
9.00
6.00
3.00
0.00
-3.00
AmMetLife Balanced50% FBMKLCI & 50% MBB 12mth FD rates

AmMetLife Insurance Berhad Laporan Tahunan Bagi Dana Berkaitan Pelaburan Tahun Kewangan Berakhir 31 Mac 2018
Laporan Tahunan Bagi AmMetLife Insurance Berhad Tahun Kewangan Berakhir 31 Mac 2018 Dana Berkaitan Pelaburan 161
AmMetLife Dana Teguh
Prestasi Sejak Permulaan
AmMetLife Dana Teguh berbanding Penanda ArasPrestasi sejak inception 27 Februari 2004 – 31 Mac 2018
Prestasi Setahun Penuh
AmMetLife Dana Teguh berbanding Penanda ArasPrestasi sejak 1 April 2017 – 31 Mac 2018
Mac
-04
Mac
-05
Mac
-06
Mac
-07
Mac
-08
Mac
-09
Mac
-10
Mac
-11
Mac
-12
Mac
-13
Mac
-14
Mac
-15
Mac
-16
Mac
-17
Mac
-18
Pret
asi (
%)
180.00
150.00
120.00
90.00
60.00
30.00
0.00
-30.00
Bulan
AmMetLife Dana Teguh50% FBM Emas Syariah & 50% MBB 12mth GIA-i Tier 1
Apr
-17
Mei
-17
Jun-
17
Jul-1
7
Ogo
s-17
Sep-
17
Okt
-17
Nov
-17
Dis
-17
Jan-
18
Feb-
18
Mac
-18
Pret
asi (
%)
Bulan
12.00
10.00
8.00
6.00
4.00
2.00
0.00
-2.00
AmMetLife Dana Teguh50% FBM Emas Syariah & 50% MBB 12mth GIA-i Tier 1

AmMetLife Insurance Berhad Laporan Tahunan Bagi Dana Berkaitan Pelaburan Tahun Kewangan Berakhir 31 Mac 2018
Laporan Tahunan Bagi AmMetLife Insurance Berhad Tahun Kewangan Berakhir 31 Mac 2018 Dana Berkaitan Pelaburan162
Pretasi Dana (Sambungan)
Dana AmMetLife Oasis Islamic Equity
Prestasi Sejak Permulaan
Dana AmMetLife Oasis Islamic Equity berbanding Penanda ArasPrestasi sejak 1 April 2007 – 31 Mac 2018
Prestasi Setahun Penuh
Dana AmMetLife Oasis Islamic Equity berbanding Penanda ArasPrestasi sejak 1 April 2017 – 31 Mac 2018
Apr
-07
Feb-
08
Dis
-08
Okt
-09
Ogo
s-10
Jun-
11
Apr
-12
Feb-
13
Dis
-13
Okt
-14
Ogo
s-15
Jun-
16
Apr
-17
Feb-
18
Pret
asi (
%)
Bulan
90.00
60.00
30.00
0.00
-30.00
-60.00
AmMetLife Oasis Islamic EquityDow Jones Islamic Market Index
Pret
asi (
%)
Bulan
25.00
20.00
15.00
10.00
5.00
0.00
-5.00
-10.00
-15.00
Apr
-17
Mei
-17
Jun-
17
Jul-1
7
Ogo
s-17
Sep-
17
Okt
-17
Nov
-17
Dis
-17
Jan-
18
Feb-
18
Mac
-18
AmMetLife Oasis Islamic Equity
Dow Jones Islamic Market Index

AmMetLife Insurance Berhad Laporan Tahunan Bagi Dana Berkaitan Pelaburan Tahun Kewangan Berakhir 31 Mac 2018
Laporan Tahunan Bagi AmMetLife Insurance Berhad Tahun Kewangan Berakhir 31 Mac 2018 Dana Berkaitan Pelaburan 163
Dana AmMetLife Global Emerging Market
Prestasi Sejak Permulaan
Dana AmMetLife Global Emerging Market berbanding Penanda ArasPrestasi sejak 1 Jun 2008 – 31 Mac 2018
Prestasi Setahun Penuh
Dana AmMetLife Global Emerging Market berbanding Penanda ArasPrestasi sejak 1 April 2017 – 31 Mac 2018
Pret
asi (
%)
Bulan
40.00
35.00
30.00
25.00
20.00
15.00
10.00
5.00
0.00
-5.00
Apr
-17
Mei
-17
Jun-
17
Jul-1
7
Ogo
s-17
Sep-
17
Okt
-17
Nov
-17
Dis
-17
Jan-
18
Feb-
18
Mac
-18
AmMetLife Global Emerging Market
MSCI Emerging Markets Index
Jun-
08
Mac
-09
Dis
-09
Sep-
10
Jun-
11
Mac
-12
Dis
-12
Sep-
13
Jun-
14
Mac
-15
Dis
-15
Sep-
16
Jun-
17
Mac
-18
Pret
asi (
%)
Bulan
60.00
40.00
20.00
0.00
-20.00
-40.00
-60.00
AmMetLife Global Emerging MarketMSCI Emerging Markets Index

AmMetLife Insurance Berhad Laporan Tahunan Bagi Dana Berkaitan Pelaburan Tahun Kewangan Berakhir 31 Mac 2018
Laporan Tahunan Bagi AmMetLife Insurance Berhad Tahun Kewangan Berakhir 31 Mac 2018 Dana Berkaitan Pelaburan164
Dana AmMetLife Precious Metals
Prestasi Sejak Permulaan
Dana AmMetLife Precious Metals berbanding Penanda ArasPrestasi sejak 1 September 2008 – 31 Mac 2018
Prestasi Setahun Penuh
Dana AmMetLife Precious Metals berbanding Penanda ArasPrestasi sejak 1 April 2017 – 31 Mac 2018
Pretasi Dana (Sambungan)Pr
etas
i (%
)
80.00
60.00
40.00
20.00
0.00
-20.00
-40.00
-60.00
-80.00
Sep-
08
Mac
-09
Sep-
09
Mac
-10
Sep-
10
Mac
-11
Sep-
11
Mac
-12
Sep-
12
Mac
-13
Sep-
13
Mac
-14
Sep-
14
Mac
-15
Sep-
15
Mac
-16
Sep-
16
Mac
-17
Sep-
17
Mac
-18
Bulan
AmMetLife Precious Metals
FTSE Gold Mines Index
Apr
-17
Mei
-17
Jun-
17
Jul-1
7
Ogo
s-17
Sep-
17
Okt
-17
Nov
-17
Dis
-17
Jan-
18
Feb-
18
Mac
-18
Pret
asi (
%)
Bulan
9.00
6.00
3.00
0.00
-3.00
-6.00
-9.00
-12.00
-15.00
AmMetLife Precious Metals
FTSE Gold Mines Index

AmMetLife Insurance Berhad Laporan Tahunan Bagi Dana Berkaitan Pelaburan Tahun Kewangan Berakhir 31 Mac 2018
Laporan Tahunan Bagi AmMetLife Insurance Berhad Tahun Kewangan Berakhir 31 Mac 2018 Dana Berkaitan Pelaburan 165
Dana AmMetLife Global Agribusiness
Prestasi Sejak Permulaan
Dana AmMetLife Global Agribusiness berbanding Penanda ArasPrestasi sejak 1 September 2008 – 31 Mac 2018
Prestasi Setahun Penuh
Dana AmMetLife Global Agribusiness berbanding Penanda ArasPrestasi sejak 1 April 2017 – 31 Mac 2018
Sep-
08
Mac
-09
Sep-
09
Mac
-10
Sep-
10
Mac
-11
Sep-
11
Mac
-12
Sep-
12
Mac
-13
Sep-
13
Mac
-14
Sep-
14
Mac
-15
Sep-
15
Mac
-16
Sep-
16
Mac
-17
Sep-
17
Mac
-18
Pret
asi (
%)
90.00
60.00
30.00
0.00
-30.00
-60.00
Bulan
AmMetLife Global AgribusinessMSCI World Index
Apr
-17
Mei
-17
Jun-
17
Jul-1
7
Ogo
s-17
Sep-
17
Okt
-17
Nov
-17
Dis
-17
Jan-
18
Feb-
18
Mac
-18
Pret
asi (
%)
Bulan
24.00
20.00
16.00
12.00
8.00
4.00
0.00
-4.00
AmMetLife Global Agribusiness
MSCI World Index

AmMetLife Insurance Berhad Laporan Tahunan Bagi Dana Berkaitan Pelaburan Tahun Kewangan Berakhir 31 Mac 2018
Laporan Tahunan Bagi AmMetLife Insurance Berhad Tahun Kewangan Berakhir 31 Mac 2018 Dana Berkaitan Pelaburan166
Dana AmMetLife Dividend
Prestasi Sejak Permulaan
Dana AmMetLife Dividend berbanding Penanda ArasPrestasi sejak 27 Oktober 2011 – 31 Mac 2018
Prestasi Setahun Penuh
Dana AmMetLife Dividend berbanding Penanda ArasPrestasi sejak 1 April 2017 – 31 Mac 2018
Pretasi Dana (Sambungan)
Okt
-11
Mei
-12
Dis
-12
Jul-1
3
Feb-
14
Sep-
14
Apr
-15
Nov
-15
Jun-
16
Jan-
17
Ogo
s-17
Mac
-18
Pret
asi (
%)
Bulan
80.00
70.00
60.00
50.00
40.00
30.00
20.00
10.00
0.00
-10.00
AmMetLife Dividend
FBMKLCI
Pret
asi (
%)
Bulan
20.00
15.00
10.00
5.00
0.00
-5.00
Apr
-17
Mei
-17
Jun-
17
Jul-1
7
Ogo
s-17
Sep-
17
Okt
-17
Nov
-17
Dis
-17
Jan-
18
Feb-
18
Mac
-18
AmMetLife DividendFBMKLCI

AmMetLife Insurance Berhad Laporan Tahunan Bagi Dana Berkaitan Pelaburan Tahun Kewangan Berakhir 31 Mac 2018
Laporan Tahunan Bagi AmMetLife Insurance Berhad Tahun Kewangan Berakhir 31 Mac 2018 Dana Berkaitan Pelaburan 167
Dana AmMetLife Asia Pacific REITS
Prestasi Sejak Permulaan
Dana AmMetLife Asia Pacific REITS berbanding Penanda ArasPrestasi sejak 17 September 2013 – 31 Mac 2018
Prestasi Setahun Penuh
Dana AmMetLife Asia Pacific REITS berbanding Penanda ArasPrestasi sejak 1 April 2017 – 31 Mac 2018
Pret
asi (
%)
40.00
32.00
24.00
16.00
8.00
0.00
-8.00
-16.00
Sep-
13
Dis
-13
Mac
-14
Jun-
14
Sep-
14
Dis
-14
Mac
-15
Jun-
15
Sep-
15
Dis
-15
Mac
-16
Jun-
16
Sep-
16
Dis
-16
Mac
-17
Jun-
17
Sep-
17
Dis
-17
Mac
-18
Bulan
S&P Pan Asia REITs Index
Apr
-17
Mei
-17
Jun-
17
Jul-1
7
Ogo
s-17
Sep-
17
Okt
-17
Nov
-17
Dis
-17
Jan-
18
Feb-
18
Mac
-18
Pret
asi (
%)
Bulan
12.00
10.00
8.00
6.00
4.00
2.00
0.00
-2.00
-4.00
-6.00
S&P Pan Asia REITs Index

AmMetLife Insurance Berhad Laporan Tahunan Bagi Dana Berkaitan Pelaburan Tahun Kewangan Berakhir 31 Mac 2018168
Dana Berkaitan PelaburanBagi Tahun Kewangan Berakhir 31 Mac 2018
LAPORAN TAHUNAN
2018
Dana AmMetLife Tactical Bond
Prestasi Sejak Permulaan
Dana AmMetLife Tactical Bond berbanding Penanda ArasPrestasi sejak 17 September 2013 – 31 Mac 2018
Prestasi Setahun Penuh
Dana AmMetLife Tactical Bond berbanding Penanda ArasPrestasi sejak 1 April 2017 – 31 Mac 2018
Pretasi Dana (Sambungan)
Sep-
13
Dis
-13
Mac
-14
Jun-
14
Sep-
14
Dis
-14
Mac
-15
Jun-
15
Sep-
15
Dis
-15
Mac
-16
Jun-
16
Sep-
16
Dis
-16
Mac
-17
Jun-
17
Sep-
17
Dis
-17
Mac
-18
Pret
asi (
%)
24.00
20.00
16.00
12.00
8.00
4.00
0.00
-4.00
Bulan
AmMetLife Tactical Bond
Quantshop ALL MGS Index
Apr
-17
Mei
-17
Jun-
17
Jul-1
7
Ogo
s-17
Sep-
17
Okt
-17
Nov
-17
Dis
-17
Jan-
18
Feb-
18
Mac
-18
Pret
asi (
%)
Bulan
8.00
6.00
4.00
2.00
0.00
-2.00
AmMetLife Tactical BondQuantshop ALL MGS Index

AmMetLife Insurance Berhad Laporan Tahunan Bagi Dana Berkaitan Pelaburan Tahun Kewangan Berakhir 31 Mac 2018
Dana Berkaitan PelaburanBagi Tahun Kewangan Berakhir 31 Mac 2018
LAPORAN TAHUNAN
2018
Pecahan MengikutSektor dan Kategori

AmMetLife Insurance Berhad Laporan Tahunan Bagi Dana Berkaitan Pelaburan Tahun Kewangan Berakhir 31 Mac 2018
Laporan Tahunan Bagi AmMetLife Insurance Berhad Tahun Kewangan Berakhir 31 Mac 2018 Dana Berkaitan Pelaburan170
Dana AmMetLife EquityButiran komposisi portfolio Dana AmMetLife Equity pada 31 Mac 2018 adalah seperti berikut:
TK 2018 TK 2017 TK 2016 TK 2015 TK 2014 % % % % %
Pembinaan 6.02 9.02 4.55 2.91 7.72
Produk pengguna 0.99 – – 3.07 –
Kewangan 25.16 22.97 23.94 24.83 11.34
Produk perindustrian 14.38 9.24 11.65 8.84 13.03
Infrastruktur – 1.96 1.70 3.80 1.31
Perladangan 2.93 3.01 3.44 0.97 –
Hartanah – 2.59 – – 2.97
REITS 1.61 1.53 – – –
Teknologi 3.24 5.88 4.05 4.19 –
Perdagangan/Perkhidmatan 28.41 35.15 38.10 44.47 45.85
Perjanjian pembelian semula/Tunai 17.26 8.66 12.57 6.91 17.77
100.00 100.00 100.00 100.00 100.00
TK 2018 TK 2017 TK 2016 TK 2015 TK 2014 % % % % %
Unit Amanah Malaysia 0.24 0.21 9.67 9.75 9.56
Bon-bon Korporat 85.64 83.98 79.58 82.63 68.18
Sekuriti Kerajaan Malaysia 6.67 – – – –
Perjanjian pembelian semula/Tunai 7.45 15.81 10.74 7.62 22.26
100.00 100.00 100.00 100.00 100.00
Dana AmMetLife Bond Butiran komposisi portfolio Dana AmMetLife Bond pada 31 Mac 2018 adalah seperti berikut:
Pecahan Sektor dan Kategori

AmMetLife Insurance Berhad Laporan Tahunan Bagi Dana Berkaitan Pelaburan Tahun Kewangan Berakhir 31 Mac 2018
Laporan Tahunan Bagi AmMetLife Insurance Berhad Tahun Kewangan Berakhir 31 Mac 2018 Dana Berkaitan Pelaburan 171
Dana AmMetLife BalancedButiran komposisi portfolio Dana AmMetLife Balanced pada 31 Mac 2018 adalah seperti berikut:
TK 2018 TK 2017 TK 2016 TK 2015 TK 2014 % % % % %
Pembinaan 5.14 8.14 5.03 3.03 0.45
Produk pengguna 1.00 – – 2.01 –
Kewangan 19.36 13.68 15.16 16.59 9.00
Produk perindustrian 12.68 7.04 8.55 7.71 10.65
Infrastruktur – 1.27 0.80 2.85 0.94
Perladangan 2.63 2.13 2.52 – –
Hartanah – 2.60 – – 3.02
REITS – 0.93 – – 0.62
Teknologi 3.61 5.65 2.52 3.73 –
Perdagangan/Perkhidmatan 22.04 26.46 21.75 29.54 37.07
Bon-bon Korporat 16.16 22.69 20.56 26.44 24.71
Unit Amanah Malaysia – – – – 9.18
Perjanjian pembelian semula/Tunai 17.37 9.41 23.12 8.11 4.36
100.00 100.00 100.00 100.00 100.00
AmMetLife Dana TeguhButiran komposisi portfolio AmMetLife Dana Teguh pada 31 Mac 2018 adalah seperti berikut:
TK 2018 TK 2017 TK 2016 TK 2015 TK 2014 % % % % %
Pembinaan 6.39 9.60 5.50 5.51 9.19
Produk pengguna 0.99 – – 2.03 –
Kewangan 1.96 1.47 – – –
Produk perindustrian 14.76 8.25 8.88 8.43 9.44
Infrastruktur – 1.96 0.99 3.53 1.39
Perladangan 4.08 3.08 3.55 1.47 –
Hartanah – 4.16 – 1.88 3.21
REITS 1.22 – – – –
Teknologi 3.38 6.78 3.07 4.63 –
Perdagangan/Perkhidmatan 25.16 27.25 22.99 38.92 39.89
Bon-bon Korporat 18.20 19.60 11.98 13.64 19.97
Unit Amanah Malaysia 3.25 3.35 3.17 3.38 4.62
Perjanjian Pembelian Semula/Tunai 20.60 14.50 39.87 16.59 12.30
100.00 100.00 100.00 100.00 100.00

AmMetLife Insurance Berhad Laporan Tahunan Bagi Dana Berkaitan Pelaburan Tahun Kewangan Berakhir 31 Mac 2018
Laporan Tahunan Bagi AmMetLife Insurance Berhad Tahun Kewangan Berakhir 31 Mac 2018 Dana Berkaitan Pelaburan172
Dana AmMetLife Oasis Islamic EquityButiran komposisi portfolio Dana AmMetLife Oasis Islamic Equity pada 31 Mac 2018 adalah seperti berikut:
Peruntukan Sektor* Dana AmOasis Global Islamic Equity (“Dana Sasaran”)
Nota: Sumber peruntukan sektor Dana Sasaran daripada Oasis Cresent Capital (Pty) Ltd (Pengurus Pelaburan Dana Sasaran)
*Sebagai peratusan dari NAB. Sila ambil perhatian bahawa pendedahan aset bagi dana adalah tertakluk kepada perubahan yang kerap setiap hari.
TK 2018 TK 2017 TK 2016 TK 2015 TK 2014 % % % % %
Unit Amanah Malaysia 93.67 93.12 92.38 90.69 89.53
Perjanjian Pembelian Semula/Tunai 6.33 6.88 7.62 9.31 10.47
100.00 100.00 100.00 100.00 100.00
TK 2018 TK 2017 TK 2016 TK 2015 TK 2014 % % % % %
Bahan Asas 4.00 6.00 7.00 8.00 4.00
Komunikasi 16.00 19.00 20.00 20.00 18.00
Pengguna, Berkitar 14.00 13.00 15.00 11.00 8.00
Pengguna, Tidak Berkitar 5.00 6.00 5.00 8.00 9.00
Tenaga 7.00 7.00 7.00 8.00 10.00
Penjagaan Kesihatan 23.00 20.00 18.00 19.00 22.00
Perindustrian 5.00 4.00 4.00 3.00 6.00
Hartanah 1.00 1.00 1.00 1.00 1.00
Teknologi 25.00 24.00 23.00 22.00 22.00
Pecahan Sektor dan Kategori (Sambungan)

AmMetLife Insurance Berhad Laporan Tahunan Bagi Dana Berkaitan Pelaburan Tahun Kewangan Berakhir 31 Mac 2018
Laporan Tahunan Bagi AmMetLife Insurance Berhad Tahun Kewangan Berakhir 31 Mac 2018 Dana Berkaitan Pelaburan 173
Dana AmMetLife Precious MetalsButiran komposisi portfolio Dana AmMetLife Precious Metals pada 31 Mac 2018 adalah seperti berikut:
Nota: Sumber peruntukan sektor Dana Sasaran daripada Deutsche Investment Management America Inc (Pengurus Pelaburan Dana Sasaran)
*Sebagai peratusan dari NAB. Sila ambil perhatian bahawa pendedahan aset bagi dana adalah tertakluk kepada perubahan yang kerap setiap hari.
Peruntukan Sektor* Precious Metals Securities (“Dana Sasaran”)
TK 2018 TK 2017 TK 2016 TK 2015 TK 2014 % % % % %
Unit Amanah Malaysia 84.53 84.27 81.02 79.80 96.40
Perjanjian Pembelian Semula/Tunai 15.47 15.73 18.98 20.20 3.60
100.00 100.00 100.00 100.00 100.00
TK 2018 TK 2017 TK 2016 TK 2015 TK 2014 % % % % %
Emas 83.75 81.61 69.28 70.14 73.46
Logam Berharga & Mineral 6.66 7.61 18.99 15.15 13.09
Perak 7.25 10.03 9.71 12.60 6.77
Pelbagai Logam & Perlombongan – – – – 6.60
Tunai dan aset lain 2.30 0.71 1.96 2.09 0.05

AmMetLife Insurance Berhad Laporan Tahunan Bagi Dana Berkaitan Pelaburan Tahun Kewangan Berakhir 31 Mac 2018
Laporan Tahunan Bagi AmMetLife Insurance Berhad Tahun Kewangan Berakhir 31 Mac 2018 Dana Berkaitan Pelaburan174
Dana AmMetLife Global AgribusinessButiran komposisi portfolio Dana AmMetLife Global Agribusiness pada 31 Mac 2018 adalah seperti berikut:
Peruntukan Sektor* Dana Global Agribusiness (“Dana Sasaran”)
Nota: Sumber peruntukan sektor Dana Sasaran daripada Deutsche Asset Management Investment GmbH (Pengurus Pelaburan Dana Sasaran)
*Sebagai peratusan dari NAB. Sila ambil perhatian bahawa pendedahan aset bagi dana adalah tertakluk kepada perubahan yang kerap setiap hari.
TK 2018 TK 2017 TK 2016 TK 2015 TK 2014 % % % % %
Unit Amanah Malaysia 91.09 92.14 93.68 90.29 88.08
Perjanjian Pembelian Semula/Tunai 8.91 7.86 6.32 9.71 11.92
100.00 100.00 100.00 100.00 100.00
TK 2018 TK 2017 TK 2016 TK 2015 TK 2014 % % % % %
Produk Pertanian 16.30 14.60 24.50 22.70 19.10
Jentera Pertanian & Perladangan – 4.20 – – –
Kilang Minuman Keras 3.10 2.10 3.10 3.20 3.70
Pelbagai Bahan Bank – – – – 3.20
Pelbagai Bahan Kimia 3.90 5.50 2.10 3.20 3.70
Baja & Kimia Pertanian 23.20 31.70 38.30 39.90 38.20
Pengedar Makanan – – 4.20 2.00 1.50
Peruncitan Makanan 3.10 4.50 2.60 2.90 2.90
Perisian Internet & Perkhidmatan 7.20 – – – –
Pelabuhan & Perkhidmatan Marin – – 1.60 1.40 1.70
Sektor-sektor lain 10.20 5.40 1.30 3.30 4.30
Makanan Berbungkus & Daging 17.00 16.60 17.70 16.70 19.50
Produk Peribadi 3.80 3.30 – – –
Landasan Keretapi 3.00 – – – 1.30
Restoran – – 1.70 2.80 0.90
Bahan Kimia Khusus 6.10 4.80 – – –
Tidak diklasifikasikan – – 1.40 0.90 –
Minuman Ringan – – 1.20 1.00 –
Tembakau – 5.90 – – –
Pecahan Sektor dan Kategori (Sambungan)

AmMetLife Insurance Berhad Laporan Tahunan Bagi Dana Berkaitan Pelaburan Tahun Kewangan Berakhir 31 Mac 2018
Laporan Tahunan Bagi AmMetLife Insurance Berhad Tahun Kewangan Berakhir 31 Mac 2018 Dana Berkaitan Pelaburan 175
Dana AmMetLife Global Emerging MarketButiran komposisi portfolio Dana AmMetLife Global Emerging Market pada 31 Mac 2018 adalah seperti berikut:
Peruntukan Sektor* Global Emerging Market Opportunities (“Dana Sasaran”)
Nota: Sumber peruntukan sektor Dana Sasaran daripada Schroder Investment Management Ltd (Pengurus Pelaburan Dana Sasaran)
*Sebagai peratusan dari NAB. Sila ambil perhatian bahawa pendedahan aset bagi dana adalah tertakluk kepada perubahan yang kerap setiap hari.
TK 2018 TK 2017 TK 2016 TK 2015 TK 2014 % % % % %
Unit Amanah Malaysia 83.94 94.09 93.38 90.97 87.74
Perjanjian Pembelian Semula/Tunai 16.06 5.91 6.62 9.03 12.26
100.00 100.00 100.00 100.00 100.00
TK 2018 TK 2017 TK 2016 TK 2015 TK 2014 % % % % %
Budi Bicara Pengguna 13.44 10.20 14.15 12.97 15.87
Barangan Asas Pengguna 4.14 2.38 3.56 5.11 3.37
Tenaga 10.58 9.57 3.62 3.71 10.12
Kewangan 23.09 27.14 31.81 33.68 34.12
Penjagaan Kesihatan – 1.00 2.07 3.72 0.90
Perindustrian 2.61 6.72 5.72 3.98 2.59
Teknologi Maklumat 27.46 21.79 21.64 24.10 18.14
Aset Cair 2.29 3.33 9.80 – –
Bahan-bahan 12.17 8.51 3.40 1.94 3.29
Hartanah 0.27 1.93 – – –
Perkhidmatan Telekomunikasi 2.89 6.36 4.23 3.86 3.63
Utiliti 1.07 1.06 – 1.18 –
Tunai – – – 5.75 7.97

AmMetLife Insurance Berhad Laporan Tahunan Bagi Dana Berkaitan Pelaburan Tahun Kewangan Berakhir 31 Mac 2018
Laporan Tahunan Bagi AmMetLife Insurance Berhad Tahun Kewangan Berakhir 31 Mac 2018 Dana Berkaitan Pelaburan176
Dana AmMetLife Asia Pacific REITSButiran komposisi portfolio Dana AmMetLife Asia Pacific REITS pada 31 Mac 2018 adalah seperti berikut:
Dana AmMetLife DividendButiran komposisi portfolio Dana AmMetLife Dividend pada 31 Mac 2018 adalah seperti berikut:
Nota: Sumber peruntukan sektor Dana Sasaran daripada AmFunds Management Berhad
*Sebagai peratusan dari NAB. Sila ambil perhatian bahawa pendedahan aset bagi dana adalah tertakluk kepada perubahan yang kerap setiap hari.
Peruntukan Sektor* AmAsia Pacific REITS – Class B (MYR)
Pecahan Sektor dan Kategori (Sambungan)
TK 2018 TK 2017 TK 2016 TK 2015 TK 2014 % % % % %
Unit Amanah Malaysia 73.25 90.85 93.87 91.50 88.62
Perjanjian Pembelian Semula/Tunai 26.75 9.15 6.13 8.50 11.38
100.00 100.00 100.00 100.00 100.00
FY 2018 FY 2017 FY 2016 FY 2015 FY 2014 % % % % %
Tunai dan lain-lain (1.19) 1.35 14.95 – –
Deposit Tetap/Instrumen Boleh Niaga/Tunai – – – 15.20 13.90
Penjagaan Kesihatan – 1.49 – – –
Deposit Pasaran Wang 14.86 17.54 – – –
Hartanah 86.33 77.59 2.34 84.80 86.10
REITs – – 80.25 – –
Utiliti – 2.03 2.46 – –
TK 2018 TK 2017 TK 2016 TK 2015 TK 2014 % % % % %
Pembinaan 6.61 9.24 5.44 3.89 4.96
Produk pengguna 0.99 – – 2.00 –
Kewangan 26.46 23.22 25.53 24.41 13.88
Produk perindustrian 15.16 9.33 12.24 8.88 3.89
Infrastruktur – 1.98 1.71 4.13 4.99
Perladangan 3.17 3.12 2.73 0.48 –
Hartanah – 2.67 – 0.00 7.41
REITS 0.94 1.53 – – 4.53
Teknologi 3.41 6.05 3.58 5.30 –
Perdagangan/Perkhidmatan 30.91 34.52 39.82 44.23 41.11
Perjanjian Pembelian Semula/Tunai 12.34 8.34 8.95 6.68 19.24
100.00 100.00 100.00 100.00 100.00

AmMetLife Insurance Berhad Laporan Tahunan Bagi Dana Berkaitan Pelaburan Tahun Kewangan Berakhir 31 Mac 2018
Laporan Tahunan Bagi AmMetLife Insurance Berhad Tahun Kewangan Berakhir 31 Mac 2018 Dana Berkaitan Pelaburan 177
Peruntukan Sektor* AmTactical Bond – Class B (MYR)
Dana AmMetLife Tactical BondButiran komposisi portfolio Dana AmMetLife Tactical Bond pada 31 Mac 2018 adalah seperti berikut:
Nota: Sumber peruntukan sektor Dana Sasaran daripada AmFunds Management Berhad
*Sebagai peratusan dari NAB. Sila ambil perhatian bahawa pendedahan aset bagi dana adalah tertakluk kepada perubahan yang kerap setiap hari.
TK 2018 TK 2017 TK 2016 TK 2015 TK 2014 % % % % %
Unit Amanah Malaysia 92.24 92.15 91.97 90.63 86.64
Perjanjian pembelian semula/Tunai 7.76 7.85 8.03 9.37 13.36
100.00 100.00 100.00 100.00 100.00
TK 2018 TK 2017 TK 2016 TK 2015 TK 2014 % % % % %
Bon 75.68 86.76 95.79 93.10 84.47
Kerajaan 14.41 – – – –
Tunai 9.91 13.24 4.21 6.90 15.53

Dana Berkaitan PelaburanBagi Tahun Kewangan Berakhir 31 Mac 2018
LAPORAN TAHUNAN
2018
HALAMAN INI SENGAJA DIBIARKAN
KOSONG

Dana Berkaitan PelaburanBagi Tahun Kewangan Berakhir 31 Mac 2018
LAPORAN TAHUNAN
2018
JadualPerbandingan Prestasi

AmMetLife Insurance Berhad Laporan Tahunan Bagi Dana Berkaitan Pelaburan Tahun Kewangan Berakhir 31 Mac 2018
Laporan Tahunan Bagi AmMetLife Insurance Berhad Tahun Kewangan Berakhir 31 Mac 2018 Dana Berkaitan Pelaburan180
I Tahun 3 Tahun 5 Tahun Sejak Pelancaran
Purata Kompaun Pulangan Tahunan % Pulangan Tahunan %
Dana AmMetLife Equity 10.80 5.46 7.38 6.20
Dana AmMetLife Bond 3.25 3.25 3.05 4.06
Dana AmMetLife Balanced 9.25 5.07 5.81 5.88
AmMetLife Dana Teguh 5.99 4.13 7.77 6.35
Dana AmMetLife Oasis Islamic Equity (7.55) 0.75 5.06 1.76
Dana AmMetLife Global Emerging Market 7.91 8.64 7.04 3.44
Dana AmMetLife Precious Metals (13.70) 0.58 (7.08) (7.17)
Dana AmMetLife Global Agribusiness (1.06) 0.28 2.18 2.94
Dana AmMetLife Dividend 11.82 5.80 8.15 8.10
Dana AmMetLife Asia Pacific REITS (4.14) 5.06 – 6.14
Dana AmMetLife Tactical Bond 1.54 4.79 – 3.83
Jadual Perbandingan PrestasiPrestasi Dana pada 31 Mac 2018

AmMetLife Insurance Berhad Laporan Tahunan Bagi Dana Berkaitan Pelaburan Tahun Kewangan Berakhir 31 Mac 2018
Laporan Tahunan Bagi AmMetLife Insurance Berhad Tahun Kewangan Berakhir 31 Mac 2018 Dana Berkaitan Pelaburan 181
Dana AmMetLife EquityButiran prestasi Dana bagi tahun kewangan berakhir 31 Mac 2018 adalah seperti berikut:
*Harga dan nilai aset bersih setiap unit di atas tidak ditunjukkan sebagai tanpa pengagihan kerana tiada pengagihan pendapatan diisytiharkan oleh dana bagi tahun kewanganNota: 1. Jumlah pulangan adalah pulangan sebenar Dana bagi tahun kewangan, dikira berdasarkan kepada nilai aset bersih seunit dan bersih daripada semua yuran
TK 2018 TK 2017 TK 2016 TK 2015 TK 2014
Harga Seunit (RM)
NAB tertinggi seunit bagi tahun 1.2146 1.0646 1.0216 1.0197 0.9946
NAB terendah seunit bagi tahun 1.0596 0.9663 0.8888 0.8684 0.8253
Nilai Aset Bersih (NAB) dan Unit dalam Edaran (UDE) pada akhir Tahun*
Jumlah NAB (RM juta) 27.4472 22.4706 20.3461 19.3462 14.5438
UDE (dalam juta) 23.3447 21.1743 20.1536 19.2958 14.6327
NAB seunit (RM) 1.1758 1.0612 1.0096 1.0026 0.9939
Jumlah Pulangan bagi Tahun (%)
Jumlah Pulangan¹ 10.80 5.11 0.70 0.88 20.68
Pertumbuhan modal 10.80 5.11 0.70 0.88 20.68
Pengagihan pendapatan – – – – –
Dana AmMetLife Bond Butiran prestasi Dana bagi tahun kewangan berakhir 31 Mac 2018 adalah seperti berikut:
*Harga dan nilai aset bersih setiap unit di atas tidak ditunjukkan sebagai tanpa pengagihan kerana tiada pengagihan pendapatan diisytiharkan oleh dana bagi tahun kewanganNota: 1. Jumlah pulangan adalah pulangan sebenar Dana bagi tahun kewangan, dikira berdasarkan kepada nilai aset bersih seunit dan bersih daripada semua yuran
TK 2018 TK 2017 TK 2016 TK 2015 TK 2014
Harga Seunit (RM)
NAB tertinggi seunit bagi tahun 0.8797 0.8520 0.8241 0.7992 0.7752
NAB terendah seunit bagi tahun 0.8520 0.8234 0.7993 0.7738 0.7576
Nilai Aset Bersih (NAB) dan Unit dalam Edaran (UDE) pada akhir Tahun*
Jumlah NAB (RM juta) 10.3783 10.6700 11.9043 12.4142 16.7134
UDE (dalam juta) 11.7957 12.5241 14.4607 15.5323 21.5938
NAB seunit (RM) 0.8797 0.8520 0.8232 0.7992 0.7740
Jumlah Pulangan bagi Tahun (%)
Jumlah Pulangan¹ 3.25 3.50 3.00 3.26 2.23
Pertumbuhan modal 3.25 3.50 3.00 3.26 2.23
Pengagihan pendapatan – – – – –
Nilai Aset Bersih, Jumlah Unit dan Harga UnitPada 31 Mac 2018

AmMetLife Insurance Berhad Laporan Tahunan Bagi Dana Berkaitan Pelaburan Tahun Kewangan Berakhir 31 Mac 2018
Laporan Tahunan Bagi AmMetLife Insurance Berhad Tahun Kewangan Berakhir 31 Mac 2018 Dana Berkaitan Pelaburan182
Dana AmMetLife BalancedButiran prestasi Dana bagi tahun kewangan berakhir 31 Mac 2018 adalah seperti berikut:
*Harga dan nilai aset bersih setiap unit di atas tidak ditunjukkan sebagai tanpa pengagihan kerana tiada pengagihan pendapatan diisytiharkan oleh dana bagi tahun kewanganNota: 1. Jumlah pulangan adalah pulangan sebenar Dana bagi tahun kewangan, dikira berdasarkan kepada nilai aset bersih seunit dan bersih daripada semua yuran
TK 2018 TK 2017 TK 2016 TK 2015 TK 2014
Harga Seunit (RM)
NAB tertinggi seunit bagi tahun 1.1608 1.0332 0.9860 1.0026 0.9834
NAB terendah seunit bagi tahun 1.0309 0.9573 0.9036 0.8708 0.8513
Nilai Aset Bersih (NAB) dan Unit dalam Edaran (UDE) pada akhir Tahun*
Jumlah NAB (RM juta) 26.5720 23.4425 22.2433 21.9194 24.1576
UDE (dalam juta) 23.5920 22.7392 22.6014 22.5725 24.6747
NAB seunit (RM) 1.1263 1.0309 0.9842 0.9711 0.9790
Jumlah Pulangan Bagi Tahun (%)
Jumlah Pulangan¹ 9.25 4.74 1.35 (0.81) 15.30
Pertumbuhan Modal 9.25 4.74 1.35 (0.81) 15.30
Pengagihan Pendapatan – – – – –
AmMetLife Dana Teguh Butiran prestasi Dana bagi tahun kewangan berakhir 31 Mac 2018 adalah seperti berikut:
*Harga dan nilai aset bersih setiap unit di atas tidak ditunjukkan sebagai tanpa pengagihan kerana tiada pengagihan pendapatan diisytiharkan oleh dana bagi tahun kewanganNota: 1. Jumlah pulangan adalah pulangan sebenar Dana bagi tahun kewangan, dikira berdasarkan kepada nilai aset bersih seunit dan bersih daripada semua yuran
TK 2018 TK 2017 TK 2016 TK 2015 TK 2014
Harga Seunit (RM)
NAB tertinggi seunit bagi tahun 1.2569 1.1340 1.0948 1.0617 1.0088
NAB terendah seunit bagi tahun 1.1310 1.0611 0.9946 0.9333 0.8260
Nilai Aset Bersih (NAB) dan Unit dalam Edaran (UDE) pada akhir Tahun*
Jumlah NAB (RM juta) 20.7810 19.3195 19.3700 17.9532 12.1769
UDE (dalam juta) 17.3367 17.0814 17.8878 16.9101 12.1007
NAB seunit (RM) 1.1987 1.1310 1.0829 1.0617 1.0063
Jumlah Pulangan Bagi Tahun (%)
Jumlah Pulangan¹ 5.99 4.44 2.00 5.51 22.03
Pertumbuhan Modal 5.99 4.44 2.00 5.51 22.03
Pengagihan Pendapatan – – – – –
Nilai Aset Bersih, Jumlah Unit dan Harga Unit (Sambungan)
Pada 31 Mac 2018

AmMetLife Insurance Berhad Laporan Tahunan Bagi Dana Berkaitan Pelaburan Tahun Kewangan Berakhir 31 Mac 2018
Laporan Tahunan Bagi AmMetLife Insurance Berhad Tahun Kewangan Berakhir 31 Mac 2018 Dana Berkaitan Pelaburan 183
Dana AmMetLife Oasis Islamic EquityButiran prestasi Dana bagi tahun kewangan berakhir 31 Mac 2018 adalah seperti berikut:
*Harga dan nilai aset bersih setiap unit di atas tidak ditunjukkan sebagai tanpa pengagihan kerana tiada pengagihan pendapatan diisytiharkan oleh dana bagi tahun kewanganNota: 1. Jumlah pulangan adalah pulangan sebenar Dana bagi tahun kewangan, dikira berdasarkan kepada nilai aset bersih seunit dan bersih daripada semua yuran
TK 2018 TK 2017 TK 2016 TK 2015 TK 2014
Harga Seunit (RM)
NAB tertinggi seunit bagi tahun 0.6567 0.6618 0.6224 0.5953 0.5827
NAB terendah seunit bagi tahun 0.6050 0.5558 0.5525 0.5100 0.4672
Nilai Aset Bersih (NAB) dan Unit dalam Edaran (UDE) pada akhir Tahun*
Jumlah NAB (RM juta) 3.6121 4.1535 3.9426 4.2864 4.5139
UDE (dalam juta) 5.9629 6.3387 6.9363 7.2363 8.5410
NAB seunit (RM) 0.6058 0.6553 0.5684 0.5923 0.5285
Jumlah Pulangan Bagi Tahun (%)
Jumlah Pulangan¹ (7.55) 15.29 (4.04) 12.07 11.66
Pertumbuhan Modal (7.55) 15.29 (4.04) 12.07 11.66
Pengagihan Pendapatan – – – – –
Dana AmMetLife Global Emerging MarketButiran prestasi Dana bagi tahun kewangan berakhir 31 Mac 2018 adalah seperti berikut:
*Harga dan nilai aset bersih setiap unit di atas tidak ditunjukkan sebagai tanpa pengagihan kerana tiada pengagihan pendapatan diisytiharkan oleh dana bagi tahun kewanganNota: 1. Jumlah pulangan adalah pulangan sebenar Dana bagi tahun kewangan, dikira berdasarkan kepada nilai aset bersih seunit dan bersih daripada semua yuran
TK 2018 TK 2017 TK 2016 TK 2015 TK 2014
Harga Seunit (RM)
NAB tertinggi seunit bagi tahun 0.7271 0.6496 0.5792 0.5658 0.5229
NAB terendah seunit bagi tahun 0.6403 0.5016 0.4873 0.5143 0.4673
Nilai Aset Bersih (NAB) dan Unit dalam Edaran (UDE) pada akhir Tahun*
Jumlah NAB (RM juta) 3.0306 1.1770 0.9253 0.9532 0.8839
UDE (dalam juta) 4.3478 1.8222 1.8000 1.7536 1.7201
NAB seunit (RM) 0.6970 0.6459 0.5141 0.5436 0.5139
Total Return for the Year (%)
Jumlah Pulangan¹ 7.91 25.64 (5.43) 5.78 3.61
Pertumbuhan Modal 7.91 25.64 (5.43) 5.78 3.61
Pengagihan Pendapatan – – – – –

AmMetLife Insurance Berhad Laporan Tahunan Bagi Dana Berkaitan Pelaburan Tahun Kewangan Berakhir 31 Mac 2018
Laporan Tahunan Bagi AmMetLife Insurance Berhad Tahun Kewangan Berakhir 31 Mac 2018 Dana Berkaitan Pelaburan184
Dana AmMetLife Precious MetalsButiran prestasi Dana bagi tahun kewangan berakhir 31 Mac 2018 adalah seperti berikut:
*Harga dan nilai aset bersih setiap unit di atas tidak ditunjukkan sebagai tanpa pengagihan kerana tiada pengagihan pendapatan diisytiharkan oleh dana bagi tahun kewanganNota: 1. Jumlah pulangan adalah pulangan sebenar Dana bagi tahun kewangan, dikira berdasarkan kepada nilai aset bersih seunit dan bersih daripada semua yuran
TK 2018 TK 2017 TK 2016 TK 2015 TK 2014
Harga Seunit (RM)
NAB tertinggi seunit bagi tahun 0.3003 0.3393 0.2689 0.3027 0.3532
NAB terendah seunit bagi tahun 0.2448 0.2500 0.2021 0.2231 0.2534
Nilai Aset Bersih (NAB) dan Unit dalam Edaran (UDE) pada akhir Tahun*
Jumlah NAB (RM juta) 3.3177 4.1296 3.8197 3.8268 3.9300
UDE (dalam juta) 13.5433 14.5436 14.6769 15.8907 13.9612
NAB seunit (RM) 0.2450 0.2839 0.2603 0.2408 0.2815
Jumlah Pulangan Bagi Tahun (%)
Jumlah Pulangan¹ (13.70) 9.07 8.10 (14.46) (20.39)
Pertumbuhan Modal (13.70) 9.07 8.10 (14.46) (20.39)
Pengagihan Pendapatan – – – – –
Dana AmMetLife Global Agribusiness Butiran prestasi Dana bagi tahun kewangan berakhir 31 Mac 2018 adalah seperti berikut:
*Harga dan nilai aset bersih setiap unit di atas tidak ditunjukkan sebagai tanpa pengagihan kerana tiada pengagihan pendapatan diisytiharkan oleh dana bagi tahun kewanganNota: 1. Jumlah pulangan adalah pulangan sebenar Dana bagi tahun kewangan, dikira berdasarkan kepada nilai aset bersih seunit dan bersih daripada semua yuran
TK 2018 TK 2017 TK 2016 TK 2015 TK 2014
Harga Seunit (RM)
NAB tertinggi seunit bagi tahun 0.7177 0.6846 0.6959 0.6773 0.6195
NAB terendah seunit bagi tahun 0.6571 0.5584 0.5506 0.5785 0.5672
Nilai Aset Bersih (NAB) dan Unit dalam Edaran (UDE) pada akhir Tahun*
Jumlah NAB (RM juta) 2.3152 2.2642 2.0259 2.1153 1.8693
UDE (dalam juta) 3.5065 3.3927 3.4758 3.2309 3.0205
NAB seunit (RM) 0.6603 0.6674 0.5829 0.6547 0.6189
Jumlah Pulangan Bagi Tahun (%)
Jumlah Pulangan¹ (1.06) 14.50 (10.97) 5.78 4.39
Pertumbuhan Modal (1.06) 14.50 (10.97) 5.78 4.39
Pengagihan Pendapatan – – – – –
Nilai Aset Bersih, Jumlah Unit dan Harga Unit (Sambungan)
Pada 31 Mac 2018

AmMetLife Insurance Berhad Laporan Tahunan Bagi Dana Berkaitan Pelaburan Tahun Kewangan Berakhir 31 Mac 2018
Laporan Tahunan Bagi AmMetLife Insurance Berhad Tahun Kewangan Berakhir 31 Mac 2018 Dana Berkaitan Pelaburan 185
Dana AmMetLife Dividend FundButiran prestasi Dana bagi tahun kewangan berakhir 31 Mac 2018 adalah seperti berikut:
*Harga dan nilai aset bersih setiap unit di atas tidak ditunjukkan sebagai tanpa pengagihan kerana tiada pengagihan pendapatan diisytiharkan oleh dana bagi tahun kewanganNota: 1. Jumlah pulangan adalah pulangan sebenar Dana bagi tahun kewangan, dikira berdasarkan kepada nilai aset bersih seunit dan bersih daripada semua yuran
TK 2018 TK 2017 TK 2016 TK 2015 TK 2014
Harga Seunit (RM)
NAB tertinggi seunit bagi tahun 0.8522 0.7404 0.7083 0.6968 0.6290
NAB terendah seunit bagi tahun 0.7365 0.6720 0.6196 0.6015 0.5566
Nilai Aset Bersih (NAB) dan Unit dalam Edaran (UDE) pada akhir Tahun*
Jumlah NAB (RM juta) 15.9615 14.8032 14.0841 12.6593 9.4440
UDE (dalam juta) 19.3455 20.0619 20.1110 18.1690 15.0299
NAB seunit (RM) 0.8251 0.7379 0.7003 0.6968 0.6283
Jumlah Pulangan Bagi Tahun (%)
Jumlah Pulangan¹ 11.82 5.37 0.50 10.90 12.66
Pertumbuhan Modal 11.82 5.37 0.50 10.90 12.66
Pengagihan Pendapatan – – – – –
Dana AmMetLife Asia Pacific REITSButiran prestasi Dana bagi tahun kewangan berakhir 31 Mac 2018 adalah seperti berikut:
*Harga dan nilai aset bersih setiap unit di atas tidak ditunjukkan sebagai tanpa pengagihan kerana tiada pengagihan pendapatan diisytiharkan oleh dana bagi tahun kewanganNota: 1. Jumlah pulangan adalah pulangan sebenar Dana bagi tahun kewangan, dikira berdasarkan kepada nilai aset bersih seunit dan bersih daripada semua yuran
TK 2018 TK 2017 TK 2016 TK 2015 TK 2014
Harga Seunit (RM)
NAB tertinggi seunit bagi tahun 0.6896 0.6835 0.6113 0.5669 0.5000
NAB terendah seunit bagi tahun 0.6530 0.5906 0.5457 0.4907 0.4750
Nilai Aset Bersih (NAB) dan Unit dalam Edaran (UDE) pada akhir Tahun*
Jumlah NAB (RM juta) 3.3038 1.3032 0.9213 0.6857 0.5809
UDE (dalam juta) 5.0429 1.9066 1.5349 1.2136 1.1849
NAB seunit (RM) 0.6552 0.6835 0.6002 0.5650 0.4903
Jumlah Pulangan Bagi Tahun (%)
Jumlah Pulangan¹ (4.14) 13.88 6.23 15.24 –
Pertumbuhan Modal (4.14) 13.88 6.23 15.24 –
Pengagihan Pendapatan – – – – –

AmMetLife Insurance Berhad Laporan Tahunan Bagi Dana Berkaitan Pelaburan Tahun Kewangan Berakhir 31 Mac 2018186
Dana Berkaitan PelaburanBagi Tahun Kewangan Berakhir 31 Mac 2018
LAPORAN TAHUNAN
2018
Dana AmMetLife Tactical BondButiran prestasi Dana bagi tahun kewangan berakhir 31 Mac 2018 adalah seperti berikut:
*Harga dan nilai aset bersih setiap unit di atas tidak ditunjukkan sebagai tanpa pengagihan kerana tiada pengagihan pendapatan diisytiharkan oleh dana bagi tahun kewanganNota: 1. Jumlah pulangan adalah pulangan sebenar Dana bagi tahun kewangan, dikira berdasarkan kepada nilai aset bersih seunit dan bersih daripada semua yuran
TK 2018 TK 2017 TK 2016 TK 2015 TK 2014
Harga Seunit (RM)
NAB tertinggi seunit bagi tahun 0.5941 0.5854 0.5576 0.5153 0.5008
NAB terendah seunit bagi tahun 0.5839 0.5458 0.5026 0.4869 0.4807
Nilai Aset Bersih (NAB) dan Unit dalam Edaran (UDE) pada akhir Tahun*
Jumlah NAB (RM juta) 0.9704 0.7058 0.5451 0.4635 0.4912
UDE (dalam juta) 1.6367 1.2088 0.9958 0.8995 0.9949
NAB seunit (RM) 0.5929 0.5839 0.5474 0.5153 0.4937
Jumlah Pulangan Bagi Tahun (%)
Jumlah Pulangan¹ 1.54 6.67 6.23 4.38 –
Pertumbuhan Modal 1.54 6.67 6.23 4.38 –
Pengagihan Pendapatan – – – – –
Nilai Aset Bersih, Jumlah Unit dan Harga Unit (Sambungan)
Pada 31 Mac 2018

AmMetLife Insurance Berhad Laporan Tahunan Bagi Dana Berkaitan Pelaburan Tahun Kewangan Berakhir 31 Mac 2018
Dana Berkaitan PelaburanBagi Tahun Kewangan Berakhir 31 Mac 2018
LAPORAN TAHUNAN
2018
Pernyataan oleh Pengurus 188
Laporan Juruaudit Bebas 189
Penyata Aset dan Liabiliti 192
Penyata Pendapatan dan Perbelanjaan 198
Penyata Perubahan di dalam Nilai Aset Bersih 204
Nota-nota kepada Maklumat Kewangan 210
Ringkasan kepadaMaklumat Kewangan

AmMetLife Insurance Berhad Laporan Tahunan Bagi Dana Berkaitan Pelaburan Tahun Kewangan Berakhir 31 Mac 2018
Laporan Tahunan Bagi AmMetLife Insurance Berhad Tahun Kewangan Berakhir 31 Mac 2018 Dana Berkaitan Pelaburan188
Pada pendapat Pengurus, maklumat kewangan Dana-dana Berkaitan Pelaburan AmMetLife Insurance Berhad yang disertakan terdiri daripada Dana AmMetLife Equity, Dana AmMetLife Bond, Dana AmMetLife Balanced, Dana AmMetLife Dana Teguh, Dana AmMetLife Oasis Islamic Equity, Dana AmMetLife Asia Pacific REITS, Dana AmMetLife Global Emerging Market, Dana AmMetLife Tactical Bond, Dana AmMetLife Precious Metals, Dana AmMetLife Global Agribusiness dan Dana AmMetLife Dividend seperti yang termaktub dalam muka surat 192 hingga 254 telah disediakan menurut polisi perakaunan seperti yang diterangkan dalam Nota 2.2 kepada maklumat kewangan dan Garis Panduan Perniagaan Insurans/Takaful Berkaitan Pelaburan yang diterbitkan oleh Bank Negara Malaysia.
Bagi pihak AmMetLife Insurance Berhad
Lee Jiau Jiunn
Kuala Lumpur, Malaysia28 Jun 2018
Pernyataan oleh Pengurus

AmMetLife Insurance Berhad Laporan Tahunan Bagi Dana Berkaitan Pelaburan Tahun Kewangan Berakhir 31 Mac 2018
Laporan Tahunan Bagi AmMetLife Insurance Berhad Tahun Kewangan Berakhir 31 Mac 2018 Dana Berkaitan Pelaburan 189
PendapatKami telah mengaudit maklumat kewangan Dana AmMetLife Equity, Dana AmMetLife Bond, Dana AmMetLife Balanced, Dana AmMetLife Dana Teguh, Dana AmMetLife Oasis Islamic Equity, Dana AmMetLife Asia Pacific REITS, Dana AmMetLife Global Emerging Market, Dana AmMetLife Tactical Bond, Dana AmMetLife Precious Metals, Dana AmMetLife Global Agribusiness dan Dana AmMetLife Dividend (kesuluruhannya dirujuk sebagai “Dana”), yang terdiri daripada penyata aset dan liabiliti pada 31 Mac 2018, dan penyata pendapatan dan perbelanjaan, penyata perubahan dalam nilai aset bersih Dana-dana bagi tahun yang berakhir ketika itu, dan ringkasan polisi perakaunan yang penting, seperti yang termaktub dalam muka surat 192 hingga 254.
Pada pendapat kami, maklumat kewangan Dana-dana yang disertakan bagi tahun berakhir 31 Mac 2018 telah disediakan, dalam segala aspek penting, menurut polisi-polisi perakaunan seperti yang diterangkan dalam Nota 2.2 kepada maklumat kewangan serta Garis Panduan Perniagaan Insurans/Takaful Berkaitan Pelaburan yang dikeluarkan oleh Bank Negara Malaysia.
Asas Pendapat Kami Kami telah menjalankan audit menurut piawaian pengauditan yang diluluskan di Malaysia dan Piawaian Pengauditan Antarabangsa. Tanggungjawab kami di seksyen piawaian-piawaian tersebut telah dihuraikan secara lanjut dalam laporan kami di bahagian Tanggungjawab Juruaudit terhadap Pengauditan Maklumat Kewangan. Kami percaya bahawa bukti audit yang kami peroleh adalah mencukupi dan bersesuaian untuk memberi asas yang munasabah bagi pendapat kami.
Penekanan ke atas Sesuatu Perkara – Asas Perakaunan dan Sekatan ke atas Pengedaran dan PenggunaanKami ingin beri perhatian kepada Nota 2.1 terhadap maklumat kewangan Dana-dana, yang menerangkan asas perakaunan. Maklumat kewangan Dana-dana disediakan untuk membantu Dana-dana mematuhi Garis Panduan Perniagaan Insurans/Takaful Berkaitan Pelaburan yang dikeluarkan oleh Bank Negara Malaysia. Oleh itu, maklumat kewangan Dana-dana mungkin tidak bersesuaian untuk tujuan yang lain. Laporan kami hanya untuk para pemegang unit Dana-dana, sebagai suatu badan dan tidak sepatutnya diedarkan kepada atau digunakan oleh pihak selain daripada para pemegang unit Dana-dana. Pendapat kami tidak diubah berkaitan perkara ini.
Kebebasan dan Tanggungjawab Beretika Yang LainKami bebas daripada Dana-dana selaras dengan Undang-undang Kecil (berhubung Etika Profesional, Tatacara dan Amalan) Institut Akauntan Malaysia (“Undang-undang Kecil”) dan Lembaga Piawaian Etika Antarabangsa berhubung Kod Etika Akauntan untuk Akauntan Profesional (“Kod IESBA”), dan kami telah memenuhi tanggungjawab beretika kami yang lain menurut Undang-Undang Kecil dan Kod IESBA.
Maklumat selain daripada Maklumat Kewangan dan Laporan Juruaudit mengenainyaPara pengarah kepada Pengurus (“para pengarah”) bertanggungjawab ke atas lain-lain maklumat. Lain-lain maklumat tersebut merangkumi maklumat yang terkandung dalam Laporan Tahunan Dana-dana tetapi tidak termasuk maklumat kewangan Dana-dana dan laporan juruaudit mengenainya.
Pendapat kami tentang maklumat kewangan Dana-dana tidak merangkumi lain-lain maklumat dan kami tidak memberi sebarang bentuk kesimpulan yang pasti berkaitannya.
Berhubung pengauditan kami ke atas maklumat kewangan Dana-dana, tanggungjawab kami adalah membaca lain-lain maklumat dan mempertimbangkan sama ada terdapatnya percanggahan material antara lain-lain maklumat dengan maklumat kewangan Dana-dana atau dengan pengetahuan kami yang diperoleh semasa pengauditan ataupun selain ini disalah nyatakan secara material.
Sekiranya, berdasarkan kerja yang telah kami laksanakan, kami menyimpulkan bahawa terdapatnya salah nyata material terhadap lain-lain maklumat, kami dikehendaki melaporkan fakta tersebut. Kami tidak mempunyai apa-apa untuk dilaporkan berkaitan perkara ini.
Laporan Juruaudit BebasLaporan mengenai maklumat kewangan

AmMetLife Insurance Berhad Laporan Tahunan Bagi Dana Berkaitan Pelaburan Tahun Kewangan Berakhir 31 Mac 2018
Laporan Tahunan Bagi AmMetLife Insurance Berhad Tahun Kewangan Berakhir 31 Mac 2018 Dana Berkaitan Pelaburan190
Tanggungjawab Para Pengarah kepada Pengurus ke atas Maklumat KewanganPara pengarah bertanggungjawab terhadap penyediaan maklumat kewangan Dana-dana yang memberi pandangan yang benar dan adil selaras dengan polisi-polisi perakaunan yang dihuraikan dalam Nota 2.2 kepada maklumat kewangan dan Garis Panduan Perniagaan Insurans/Takaful Berkaitan Pelaburan yang dikeluarkan oleh Bank Negara Malaysia. Para pengarah juga bertanggungjawab ke atas kawalan dalaman tertentu sebagaimana yang ditentukan oleh para pengarah sebagai perlu untuk membolehkan penyediaan maklumat kewangan Dana-dana yang bebas daripada salah nyata material, sama ada disebabkan penipuan atau kesilapan.
Dalam menyediakan maklumat kewangan Dana-dana, para pengarah bertanggungjawab menilai kemampuan Dana-dana untuk diteruskan sebagai usaha berterusan, mendedahkan, sebagaimana yang berkenaan, perkara berkaitan dengan usaha berterusan dan menggunakan dasar perakaunan usaha berterusan melainkan para pengarah ingin membubarkan Dana-dana atau menamatkan operasi, atau tidak mempunyai pilihan lain yang realistik kecuali untuk berbuat demikian.
Tanggungjawab Juruaudit terhadap Pengauditan Maklumat KewanganObjektif kami adalah untuk memperolehi jaminan yang munasabah sama ada maklumat kewangan Dana-dana secara keseluruhannya adalah bebas daripada salah nyata material, sama ada disebabkan penipuan atau kesilapan, serta menerbitkan laporan juruaudit yang mengandungi pendapat kami. Jaminan yang munasabah merupakan kepastian tahap tinggi, tetapi bukan merupakan jaminan bahawa pengauditan yang dijalankan menurut piawaian pengauditan yang diluluskan di Malaysia dan Piawaian Pengauditan Antarabangsa akan selalunya dapat mengesan salah nyata material ketika kewujudannya. Salah nyata boleh timbul daripada penipuan atau kesilapan dan dianggap material jika, secara individunya atau keseluruhannya, ianya boleh dengan munasabahnya dijangka mempengaruhi keputusan ekonomi para pengguna yang bersandarkan maklumat kewangan ini.
Sebagai sebahagian daripada pengauditan yang menurut piawaian pengauditan yang diluluskan di Malaysia dan Piawaian Pengauditan Antarabangsa, kami mengamalkan pengadilan profesional dan mengekalkan kesangsian profesional sepanjang pengauditan. Kami juga:• MengenalpastidanmenaksirrisikosalahnyatamaterialmaklumatkewanganDana-dana,samaadadisebabkanpenipuanatau
kesilapan, merangka dan melaksanakan tatacara pengauditan berdasarkan risiko tersebut, dan mendapatkan bukti pengauditan yang mencukupi dan sesuai untuk dijadikan asas pendapat kami. Risiko kegagalan mengesan salah nyata material yang disebabkan penipuan adalah lebih tinggi daripada yang disebabkan kesilapan, kerana penipuan boleh melibatkan persubahatan, pemalsuan, ketinggalan fakta yang disengajakan, salah nyataan, atau pengatasan kawalan dalaman.
• Mendapatkanpemahamankawalandalamanyangadakaitandenganpengauditansupayadapatmerangkatatacarapengauditanyang bersesuaian dengan keadaan tersebut, tetapi bukan dengan tujuan menyatakan pendapat berkaitan keberkesanan kawalan dalaman Dana-dana.
• Menilai kesesuaian polisi-polisi perakaunan yang digunakan dan kemunasabahan anggaran perakaunan dan pendedahanberkaitan yang dibuat oleh para pengarah.
• Menyimpulkan kesesuaian penggunaan dasar perakaunan usaha berterusan oleh para pengarah dan, berdasarkan buktipengauditan yang diperoleh, sama ada wujudnya ketidakpastian material berkaitan peristiwa-peristiwa atau keadaan-keadaan yang menimbulkan keraguan ketara tentang kemampuan Dana-dana untuk diteruskan sebagai usaha berterusan. Jika kami menyimpulkan akan wujudnya keraguan material, kami dikehendaki melaporkan dalam laporan juruaudit kami mengenai pendedahan berkaitan yang terdapat dalam maklumat kewangan Dana-dana atau, jika pendedahan tersebut tidak mencukupi, pendapat kami akan diubah. Kesimpulan kami adalah berdasarkan bukti pengauditan yang diperoleh sehingga tarikh laporan juruaudit kami. Walau bagaimanapun, peristiwa-peristiwa atau keadaan-keadaan yang akan berlaku pada masa akan datang boleh menyebabkan Dana-dana untuk menamatkan terus usaha yang berterusan.
• Menilai pembentangan, struktur dan kandungan keseluruhan maklumat kewangan Dana-dana, termasuk pendedahan-pendedahan, dan sama ada maklumat kewangan mewakili urus niaga dasaran dan peristiwa-peristiwa dengan cara yang menghasilkan pembentangan adil.
Laporan Juruaudit Bebas (Sambungan)

AmMetLife Insurance Berhad Laporan Tahunan Bagi Dana Berkaitan Pelaburan Tahun Kewangan Berakhir 31 Mac 2018
Laporan Tahunan Bagi AmMetLife Insurance Berhad Tahun Kewangan Berakhir 31 Mac 2018 Dana Berkaitan Pelaburan 191
Kami berkomunikasi dengan para pengarah kepada pengurus tentang, antara perkara-perkara lain, skop yang dirancangkan dan pemasaan pengauditan dan penemuan pengauditan yang penting, termasuk sebarang kekurangan ketara dalam kawalan dalaman yang kami kenal pasti ketika pengauditan kami.
Ernst & Young Dato’ Megat Iskandar Shah Bin Mohamad NorAF: 0039 No. 03083/07/2019 JAkauntan-akauntan Berkanun Akauntan Bertauliah
Kuala Lumpur, Malaysia28 Jun 2018

AmMetLife Insurance Berhad Laporan Tahunan Bagi Dana Berkaitan Pelaburan Tahun Kewangan Berakhir 31 Mac 2018
Laporan Tahunan Bagi AmMetLife Insurance Berhad Tahun Kewangan Berakhir 31 Mac 2018 Dana Berkaitan Pelaburan192
Dana AmMetLife Equity Dana AmMetLife Bond
2018 2017 2018 2017 Nota RM RM RM RM
Aset
Pelaburan 3 22,709,193 20,525,583 10,324,347 8,983,254
Aset cukai tertunda 4 – – 17,066 12,354
Lain-lain belum terima 473,186 325,422 186,401 120,736
Tunai dan baki di bank 4,678,596 1,836,044 53,774 1,766,295 Jumlah aset 27,860,975 22,687,049 10,581,588 10,882,639
Liabiliti
Peruntukan cukai 118,502 9,713 186,284 195,259
Liabiliti cukai tertunda 4 249,816 167,567 – –
Lain-lain belum bayar 45,442 39,198 17,043 17,331 Jumlah liabiliti 413,760 216,478 203,327 212,590
Nilai aset bersih dana (“NAB”) 27,447,215 22,470,571 10,378,261 10,670,049
Diwakili oleh:
Caruman pemegang unit 18,720,260 16,260,962 6,098,692 6,722,194
Pendapatan belum agih 8,726,955 6,209,609 4,279,569 3,947,855 Modal pemegang unit 5 27,447,215 22,470,571 10,378,261 10,670,049
Unit dalam edaran 5 23,344,659 21,174,271 11,795,727 12,524,097
NAB seunit (RM) 5 1.1757 1.0612 0.8798 0.8520
Nota-nota yang disertakan membentuk sebahagian penting maklumat kewangan ini.
Ringkasan kepada Maklumat Kewangan
Penyata-penyata Aset dan Liabiliti
Pada 31 Mac 2018

AmMetLife Insurance Berhad Laporan Tahunan Bagi Dana Berkaitan Pelaburan Tahun Kewangan Berakhir 31 Mac 2018
Laporan Tahunan Bagi AmMetLife Insurance Berhad Tahun Kewangan Berakhir 31 Mac 2018 Dana Berkaitan Pelaburan 193
Dana AmMetLife Balanced Dana AmMetLife Dana Teguh
2018 2017 2018 2017 Nota RM RM RM RM
Aset
Pelaburan 3 21,955,658 21,236,222 16,500,663 16,519,017
Lain-lain belum terima 424,648 204,329 321,276 307,710
Tunai dan baki di bank 4,587,723 2,352,749 4,258,583 2,731,334 Jumlah aset 26,968,029 23,793,300 21,080,522 19,558,061
Liabiliti
Peruntukan cukai 162,011 89,336 151,745 96,791
Liabiliti cukai tertunda 4 192,361 129,736 113,386 109,292
Lain-lain belum bayar 41,649 131,773 34,385 32,465 Jumlah liabiliti 396,021 350,845 299,516 238,548
Nilai aset bersih dana (“NAB”) 26,572,008 23,442,455 20,781,006 19,319,513
Diwakili oleh:
Caruman pemegang unit 17,111,079 16,141,426 13,253,239 12,923,137
Pendapatan belum agih 9,460,929 7,301,029 7,527,767 6,396,376 Modal pemegang unit 5 26,572,008 23,442,455 20,781,006 19,319,513
Unit dalam edaran 5 23,592,015 22,739,174 17,336,705 17,081,405
NAB seunit (RM) 5 1.1263 1.0309 1.1987 1.1310
Nota-nota yang disertakan membentuk sebahagian penting maklumat kewangan ini.

AmMetLife Insurance Berhad Laporan Tahunan Bagi Dana Berkaitan Pelaburan Tahun Kewangan Berakhir 31 Mac 2018
Laporan Tahunan Bagi AmMetLife Insurance Berhad Tahun Kewangan Berakhir 31 Mac 2018 Dana Berkaitan Pelaburan194
Dana AmMetLife Dana AmMetLife Oasis Islamic Equity Asia Pacific REITS
2018 2017 2018 2017 Nota RM RM RM RM
Aset
Pelaburan 3 3,383,640 3,867,551 2,555,849 1,183,915
Cukai boleh pulih 6,612 3,975 – –
Aset cukai tertunda 4 32,542 – – –
Lain-lain belum terima 1,533 65,794 743,431 35,029
Tunai dan baki di bank 207,603 311,364 16,585 106,487 Jumlah aset 3,631,930 4,248,684 3,315,865 1,325,431
Liabiliti
Peruntukan cukai – – 438 1,224
Liabiliti cukai tertunda 4 – 10,139 4,933 15,448
Lain-lain belum bayar 19,788 85,090 6,661 5,556 Jumlah liabiliti 19,788 95,229 12,032 22,228
Nilai aset bersih dana (“NAB”) 3,612,142 4,153,455 3,303,833 1,303,203
Diwakili oleh:
Caruman pemegang unit 2,815,174 3,064,950 3,123,965 1,027,951
Pendapatan belum agih 796,968 1,088,505 179,868 275,252 Modal pemegang unit 5 3,612,142 4,153,455 3,303,833 1,303,203
Unit dalam edaran 5 5,962,878 6,338,719 5,042,910 1,906,595
NAB seunit (RM) 5 0.6058 0.6553 0.6551 0.6835
Nota-nota yang disertakan membentuk sebahagian penting maklumat kewangan ini.
Penyata-penyata Aset dan Liabiliti (Sambungan)
Pada 31 Mac 2018

AmMetLife Insurance Berhad Laporan Tahunan Bagi Dana Berkaitan Pelaburan Tahun Kewangan Berakhir 31 Mac 2018
Laporan Tahunan Bagi AmMetLife Insurance Berhad Tahun Kewangan Berakhir 31 Mac 2018 Dana Berkaitan Pelaburan 195
Dana AmMetLife Dana AmMetLife Global Emerging Market Tactical Bond
2018 2017 2018 2017 Nota RM RM RM RM
Aset
Pelaburan 3 2,707,293 1,107,420 895,082 650,390
Lain-lain belum terima 309,761 7,081 21,178 7,251
Tunai dan baki di bank 50,624 92,110 63,172 57,849 Jumlah aset 3,067,678 1,206,611 979,432 715,490
Liabiliti
Peruntukan cukai 1,166 1,168 378 172
Liabiliti cukai tertunda 4 28,701 22,235 2,801 4,140
Lain-lain belum bayar 7,215 6,253 5,825 5,377 Jumlah liabiliti 37,082 29,656 9,004 9,689
Nilai aset bersih dana (“NAB”) 3,030,596 1,176,955 970,428 705,801
Diwakili oleh:
Caruman pemegang unit 2,701,024 924,998 874,724 621,753
Pendapatan belum agih 329,572 251,957 95,704 84,048 Modal pemegang unit 5 3,030,596 1,176,955 970,428 705,801
Unit dalam edaran 5 4,347,776 1,822,190 1,636,696 1,208,818
NAB seunit (RM) 5 0.6970 0.6459 0.5929 0.5839
Nota-nota yang disertakan membentuk sebahagian penting maklumat kewangan ini.

AmMetLife Insurance Berhad Laporan Tahunan Bagi Dana Berkaitan Pelaburan Tahun Kewangan Berakhir 31 Mac 2018
Laporan Tahunan Bagi AmMetLife Insurance Berhad Tahun Kewangan Berakhir 31 Mac 2018 Dana Berkaitan Pelaburan196
Dana AmMetLife Dana AmMetLife Precious Metals Global Agribusiness
2018 2017 2018 2017 Nota RM RM RM RM
Aset
Pelaburan 3 2,804,365 3,479,947 2,328,372 2,292,767
Aset cukai tertunda 4 248,956 233,973 – –
Cukai boleh pulih 47,798 29,257 – –
Lain-lain belum terima 26,101 24,560 29,840 18,870
Tunai dan baki di bank 199,874 371,208 788 60 Jumlah aset 3,327,094 4,138,945 2,359,000 2,311,697
Liabiliti
Peruntukan cukai – – 4,019 5,523
Liabiliti cukai tertunda 4 – – 29,275 31,933
Lain-lain belum bayar 9,375 9,307 10,463 10,029 Jumlah liabiliti 9,375 9,307 43,757 47,485
Nilai aset bersih dana (“NAB”) 3,317,719 4,129,638 2,315,243 2,264,212
Diwakili oleh:
Caruman pemegang unit 6,803,554 7,091,553 1,958,591 1,881,641
(Kerugian terkumpul)/ Pendapatan belum agih (3,485,835) (2,961,915) 356,652 382,571 Modal pemegang unit 5 3,317,719 4,129,638 2,315,243 2,264,212
Unit dalam edaran 5 13,544,270 14,543,625 3,506,537 3,392,692
NAB seunit (RM) 5 0.2450 0.2839 0.6603 0.6674
Nota-nota yang disertakan membentuk sebahagian penting maklumat kewangan ini.
Penyata-penyata Aset dan Liabiliti (Sambungan)
Pada 31 Mac 2018

AmMetLife Insurance Berhad Laporan Tahunan Bagi Dana Berkaitan Pelaburan Tahun Kewangan Berakhir 31 Mac 2018
Laporan Tahunan Bagi AmMetLife Insurance Berhad Tahun Kewangan Berakhir 31 Mac 2018 Dana Berkaitan Pelaburan 197
Dana AmMetLife Dividend
2018 2017 Nota RM RM
Aset
Pelaburan 3 13,991,677 13,568,717
Cukai boleh pulih – 551
Lain-lain belum terima 272,338 228,632
Tunai dan baki di bank 1,959,493 1,142,727 Jumlah aset 16,223,508 14,940,627
Liabiliti
Peruntukan cukai 65,883 –
Liabiliti cukai tertunda 4 170,452 113,588
Lain-lain belum bayar 25,697 23,827 Jumlah liabiliti 262,032 137,415
Nilai aset bersih dana (“NAB”) 15,961,476 14,803,212
Diwakili oleh:
Caruman pemegang unit 10,720,714 11,256,303
Pendapatan belum agih 5,240,762 3,546,909 Modal pemegang unit 5 15,961,476 14,803,212
Unit dalam edaran 5 19,345,529 20,061,936
NAB seunit (RM) 5 0.8251 0.7379
Nota-nota yang disertakan membentuk sebahagian penting maklumat kewangan ini.

AmMetLife Insurance Berhad Laporan Tahunan Bagi Dana Berkaitan Pelaburan Tahun Kewangan Berakhir 31 Mac 2018
Laporan Tahunan Bagi AmMetLife Insurance Berhad Tahun Kewangan Berakhir 31 Mac 2018 Dana Berkaitan Pelaburan198
Dana AmMetLife Equity Dana AmMetLife Bond
2018 2017 2018 2017 Nota RM RM RM RM
Pendapatan pelaburan bersih:
Pendapatan faedah 6 80,548 63,386 545,841 579,117
Pendapatan dividen 7 735,583 567,593 2,483 20,668
816,131 630,979 548,324 599,785
Laba atas pelupusan pelaburan 1,222,399 – 8,255 87,464
Laba modal tidak terealisasi bersih 1,028,119 963,683 – –
Pendapatan yang lain – 2,615 1 858 Jumlah pendapatan 3,066,649 1,597,277 556,580 688,107
Belanja pengurusan (362,818) (301,363) (105,941) (113,240)
Rugi daripada pelupusan pelaburan – (118,923) – –
Rugi modal tidak terealisasi bersih – – (79,286) (104,076) Jumlah belanja (362,818) (420,286) (185,227) (217,316)
Lebihan pendapatan daripada belanja sebelum pencukaian 2,703,831 1,176,991 371,353 470,791
Pencukaian 8 (186,485) (73,090) (39,639) (75,898)
Lebihan pendapatan daripada belanja selepas pencukaian 2,517,346 1,103,901 331,714 394,893
Pendapatan belum agih dibawa ke depan 6,209,609 5,105,708 3,947,855 3,552,962
Pendapatan belum agih dihantar ke depan 8,726,955 6,209,609 4,279,569 3,947,855
Nota-nota yang disertakan membentuk sebahagian penting maklumat kewangan ini.
Ringkasan kepada Maklumat Kewangan
Penyata-penyata Pendapatan dan Perbelanjaan
Bagi tahun kewangan berakhir 31 Mac 2018

AmMetLife Insurance Berhad Laporan Tahunan Bagi Dana Berkaitan Pelaburan Tahun Kewangan Berakhir 31 Mac 2018
Laporan Tahunan Bagi AmMetLife Insurance Berhad Tahun Kewangan Berakhir 31 Mac 2018 Dana Berkaitan Pelaburan 199
Dana AmMetLife Balanced Dana AmMetLife Dana Teguh
2018 2017 2018 2017 Nota RM RM RM RM
Pendapatan pelaburan bersih:
Pendapatan faedah 6 335,707 381,663 276,576 292,779
Pendapatan dividen 7 547,293 416,395 390,146 312,915 883,000 798,058 666,722 605,694
Laba atas pelupusan pelaburan 1,023,963 70,690 759,399 56,272
Laba modal tidak terealisasi bersih 762,506 624,898 51,179 479,254
Pendapatan yang lain 2 2,784 1 1,499 Jumlah pendapatan 2,669,471 1,496,430 1,477,301 1,142,719
Belanja pengurusan (338,172) (293,369) (258,938) (239,485) Jumlah belanja (338,172) (293,369) (258,938) (239,485)
Lebihan pendapatan daripada belanja sebelum pencukaian 2,331,299 1,203,061 1,218,363 903,234
Pencukaian 8 (171,399) (138,118) (86,972) (84,469)
Lebihan pendapatan daripada belanja selepas pencukaian 2,159,900 1,064,943 1,131,391 818,765 Pendapatan belum agih dibawa ke depan 7,301,029 6,236,086 6,396,376 5,577,611
Pendapatan belum agih dihantar ke depan 9,460,929 7,301,029 7,527,767 6,396,376
Nota-nota yang disertakan membentuk sebahagian penting maklumat kewangan ini.

AmMetLife Insurance Berhad Laporan Tahunan Bagi Dana Berkaitan Pelaburan Tahun Kewangan Berakhir 31 Mac 2018
Laporan Tahunan Bagi AmMetLife Insurance Berhad Tahun Kewangan Berakhir 31 Mac 2018 Dana Berkaitan Pelaburan200
Dana AmMetLife Dana AmMetLife Oasis Islamic Equity Asia Pacific REITS
2018 2017 2018 2017 Nota RM RM RM RM
Pendapatan pelaburan bersih:
Pendapatan faedah 6 7,113 8,340 4,082 2,705
Pendapatan dividen 7 197,119 949,330 29,260 46,044 204,232 957,670 33,342 48,749
Laba atas pelupusan pelaburan – 23,998 817 12,020
Laba modal tidak terealisasi bersih – – – 91,515
Pendapatan yang lain 10,778 11,920 1 229 Jumlah pendapatan 215,010 993,588 34,160 152,513
Belanja pengurusan (8,025) (7,753) (8,227) (6,588)
Rugi atas pelupusan pelaburan (7,744) – – –
Rugi modal tidak terealisasi bersih (533,510) (428,998) (131,440) – Jumlah belanja (549,279) (436,751) (139,667) (6,588)
(Defisit)/lebihan pendapatan daripada belanja sebelum pencukaian (334,269) 556,837 (105,507) 145,925
Pencukaian 8 42,732 31,733 10,123 (8,499)
(Defisit)/lebihan pendapatan daripada belanja selepas pencukaian (291,537) 588,570 (95,384) 137,426
Pendapatan belum agih dibawa ke depan 1,088,505 499,935 275,252 137,826
Pendapatan belum agih dihantar ke depan 796,968 1,088,505 179,868 275,252
Nota-nota yang disertakan membentuk sebahagian penting maklumat kewangan ini.
Penyata-penyata Pendapatan dan Perbelanjaan (Sambungan)
Bagi tahun kewangan berakhir 31 Mac 2018

AmMetLife Insurance Berhad Laporan Tahunan Bagi Dana Berkaitan Pelaburan Tahun Kewangan Berakhir 31 Mac 2018
Laporan Tahunan Bagi AmMetLife Insurance Berhad Tahun Kewangan Berakhir 31 Mac 2018 Dana Berkaitan Pelaburan 201
Dana AmMetLife Dana AmMetLife Global Emerging Market Tactical Bond
2018 2017 2018 2017 Nota RM RM RM RM
Pendapatan pelaburan bersih:
Pendapatan faedah 6 4,602 2,059 1,980 1,509
Pendapatan dividen 7 2,671 2,272 29,573 25,276 7,273 4,331 31,553 26,785
Laba atas pelupusan pelaburan – 2,580 2,103 –
Laba modal tidak terealisasi bersih 80,826 253,577 – 18,680
Pendapatan yang lain 4,596 2,627 – 142 Jumlah pendapatan 92,695 263,115 33,656 45,607
Belanja pengurusan (8,246) (6,072) (6,271) (5,685)
Rugi modal tidak terealisasi bersih – – (16,741) – Jumlah belanja (8,246) (6,072) (23,012) (5,685)
Lebihan pendapatan daripada belanja sebelum pencukaian 84,449 257,043 10,644 39,922
Pencukaian 8 (6,834) (20,657) 1,012 (1,616)
Lebihan pendapatan daripada belanja selepas pencukaian 77,615 236,386 11,656 38,306 Pendapatan belum agih dibawa ke depan 251,957 15,571 84,048 45,742
Pendapatan belum agih dihantar ke depan 329,572 251,957 95,704 84,048
Nota-nota yang disertakan membentuk sebahagian penting maklumat kewangan ini.

AmMetLife Insurance Berhad Laporan Tahunan Bagi Dana Berkaitan Pelaburan Tahun Kewangan Berakhir 31 Mac 2018
Laporan Tahunan Bagi AmMetLife Insurance Berhad Tahun Kewangan Berakhir 31 Mac 2018 Dana Berkaitan Pelaburan202
Dana AmMetLife Dana AmMetLife Precious Metals Global Agribusiness
2018 2017 2018 2017 Nota RM RM RM RM
Pendapatan pelaburan bersih:
Pendapatan faedah 6 6,182 8,417 6,584 6,319 6,182 8,417 6,584 6,319
Laba atas pelupusan pelaburan – – – 19,064
Laba modal tidak terealisasi bersih – 566,597 – 295,073
Pendapatan yang lain 9,513 8,646 6,573 6,133 Jumlah pendapatan 15,695 583,660 13,157 326,589
Belanja pengurusan (12,674) (13,546) (7,976) (7,667)
Rugi atas pelupusan pelaburan (384,946) (155,416) – –
Rugi modal tidak terealisasi bersih (187,278) – (33,232) – Jumlah belanja (584,898) (168,962) (41,208) (7,667)
(Defisit)/lebihan pendapatan daripada belanja sebelum pencukaian (569,203) 414,698 (28,051) 318,922
Pencukaian 8 45,283 (33,568) 2,132 (25,636)
(Defisit)/lebihan pendapatan daripada belanja selepas pencukaian (523,920) 381,130 (25,919) 293,286 (Rugi)/pendapatan belum agih dibawa ke depan (2,961,915) (3,343,045) 382,571 89,285
(Rugi)/pendapatan belum agih dihantar ke depan (3,485,835) (2,961,915) 356,652 382,571
Nota-nota yang disertakan membentuk sebahagian penting maklumat kewangan ini.
Penyata-penyata Pendapatan dan Perbelanjaan (Sambungan)
Bagi tahun kewangan berakhir 31 Mac 2018

AmMetLife Insurance Berhad Laporan Tahunan Bagi Dana Berkaitan Pelaburan Tahun Kewangan Berakhir 31 Mac 2018
Laporan Tahunan Bagi AmMetLife Insurance Berhad Tahun Kewangan Berakhir 31 Mac 2018 Dana Berkaitan Pelaburan 203
Dana AmMetLife Dividend
2018 2017 Nota RM RM
Pendapatan pelaburan bersih:
Pendapatan faedah 6 41,146 38,404
Pendapatan dividen 7 468,145 394,678 509,291 433,082
Laba atas pelupusan pelaburan 827,355 622
Laba modal tidak terealisasi bersih 710,809 573,627
Pendapatan yang lain – 416 Jumlah pendapatan 2,047,455 1,007,747
Belanja pengurusan (227,257) (206,707) Jumlah belanja (227,257) (206,707)
Lebihan pendapatan daripada belanja sebelum pencukaian 1,820,198 801,040
Pencukaian 8 (126,345) (49,313)
Lebihan pendapatan daripada belanja selepas pencukaian 1,693,853 751,727 Pendapatan belum agih dibawa ke depan 3,546,909 2,795,182
Pendapatan belum agih dihantar ke depan 5,240,762 3,546,909
Nota-nota yang disertakan membentuk sebahagian penting maklumat kewangan ini.

AmMetLife Insurance Berhad Laporan Tahunan Bagi Dana Berkaitan Pelaburan Tahun Kewangan Berakhir 31 Mac 2018
Laporan Tahunan Bagi AmMetLife Insurance Berhad Tahun Kewangan Berakhir 31 Mac 2018 Dana Berkaitan Pelaburan204
2018 2017 RM RM
Nilai aset bersih pada awal tahun 22,470,571 20,346,140
Amaun diterima daripada penerbitan unit 11,142,198 8,183,288
Amaun dibayar bagi pembatalan unit (8,682,900) (7,162,758) 24,929,869 21,366,670
Laba terealisasi bersih selepas pencukaian 1,571,476 217,313
Laba modal belum terealisasi bersih selepas pencukaian 945,870 886,588 Nilai aset bersih pada akhir tahun 27,447,215 22,470,571
Nota-nota yang disertakan membentuk sebahagian penting maklumat kewangan ini.
Dana AmMetLife Equity
2018 2017 RM RM
Nilai aset bersih pada awal tahun 10,670,049 11,904,335
Amaun diterima daripada penerbitan unit 3,730,927 3,602,125
Amaun dibayar bagi pembatalan unit (4,354,429) (5,231,304) 10,046,547 10,275,156
Laba terealisasi bersih selepas pencukaian 406,288 521,541
Rugi modal belum terealisasi bersih selepas pencukaian (74,574) (126,648) Nilai aset bersih pada akhir tahun 10,378,261 10,670,049
Dana AmMetLife Bond
Ringkasan kepada Maklumat Kewangan
Penyata-penyata Perubahan dalam Nilai Aset Bersih
Bagi tahun kewangan berakhir 31 Mac 2018

AmMetLife Insurance Berhad Laporan Tahunan Bagi Dana Berkaitan Pelaburan Tahun Kewangan Berakhir 31 Mac 2018
Laporan Tahunan Bagi AmMetLife Insurance Berhad Tahun Kewangan Berakhir 31 Mac 2018 Dana Berkaitan Pelaburan 205
2018 2017 RM RM
Nilai aset bersih pada awal tahun 23,442,455 22,243,302
Amaun diterima daripada penerbitan unit 9,369,120 7,124,184
Amaun dibayar bagi pembatalan unit (8,399,467) (6,989,974) 24,412,108 22,377,512
Laba terealisasi bersih selepas pencukaian 1,460,019 541,614
Laba modal belum terealisasi bersih selepas pencukaian 699,881 523,329 Nilai aset bersih pada akhir tahun 26,572,008 23,442,455
Nota-nota yang disertakan membentuk sebahagian penting maklumat kewangan ini.
2018 2017 RM RM
Nilai aset bersih pada awal tahun 19,319,513 19,370,004
Amaun diterima daripada penerbitan unit 7,118,683 4,806,600
Amaun dibayar bagi pembatalan unit (6,788,581) (5,675,856) 19,649,615 18,500,748
Laba terealisasi bersih selepas pencukaian 1,084,306 396,054
Laba modal belum terealisasi bersih selepas pencukaian 47,085 422,711 Nilai aset bersih pada akhir tahun 20,781,006 19,319,513
Dana AmMetLife Dana Teguh
Dana AmMetLife Balanced

AmMetLife Insurance Berhad Laporan Tahunan Bagi Dana Berkaitan Pelaburan Tahun Kewangan Berakhir 31 Mac 2018
Laporan Tahunan Bagi AmMetLife Insurance Berhad Tahun Kewangan Berakhir 31 Mac 2018 Dana Berkaitan Pelaburan206
2018 2017 RM RM
Nilai aset bersih pada awal tahun 4,153,455 3,942,629
Amaun diterima daripada penerbitan unit 594,384 614,364
Amaun dibayar bagi pembatalan unit (844,160) (992,108) 3,903,679 3,564,885
Laba terealisasi bersih selepas pencukaian 199,292 983,249
Rugi modal belum terealisasi bersih selepas pencukaian (490,829) (394,679) Nilai aset bersih pada akhir tahun 3,612,142 4,153,455
2018 2017 RM RM
Nilai aset bersih pada awal tahun 1,303,203 921,290
Amaun diterima daripada penerbitan unit 3,473,654 1,056,820
Amaun dibayar bagi pembatalan unit (1,377,640) (812,333) 3,399,217 1,165,777
Laba terealisasi bersih selepas pencukaian 25,541 53,232
(Rugi)/laba modal belum terealisasi bersih selepas pencukaian (120,925) 84,194 Nilai aset bersih pada akhir tahun 3,303,833 1,303,203
Nota-nota yang disertakan membentuk sebahagian penting maklumat kewangan ini.
Dana AmMetLife Oasis Islamic Equity
Dana AmMetLife Asia Pacific REITS
Penyata-penyata Perubahan dalam Nilai Aset Bersih (Sambungan)
Bagi tahun kewangan berakhir 31 Mac 2018

AmMetLife Insurance Berhad Laporan Tahunan Bagi Dana Berkaitan Pelaburan Tahun Kewangan Berakhir 31 Mac 2018
Laporan Tahunan Bagi AmMetLife Insurance Berhad Tahun Kewangan Berakhir 31 Mac 2018 Dana Berkaitan Pelaburan 207
Nota-nota yang disertakan membentuk sebahagian penting maklumat kewangan ini.
Dana AmMetLife Tactical Bond
Dana AmMetLife Global Emerging Market
2018 2017 RM RM
Nilai aset bersih pada awal tahun 1,176,955 925,335
Amaun diterima daripada penerbitan unit 2,317,524 96,093
Amaun dibayar bagi pembatalan unit (541,498) (80,859) 2,952,981 940,569
Laba terealisasi bersih selepas pencukaian 3,255 3,095
Laba modal belum terealisasi bersih selepas pencukaian 74,360 233,291 Nilai aset bersih pada akhir tahun 3,030,596 1,176,955
2018 2017 RM RM
Nilai aset bersih pada awal tahun 705,801 545,141
Amaun diterima daripada penerbitan unit 799,751 433,451
Amaun dibayar bagi pembatalan unit (546,780) (311,097) 958,772 667,495
Laba terealisasi bersih selepas pencukaian 27,058 21,120
(Rugi)/laba modal belum terealisasi bersih selepas pencukaian (15,402) 17,186 Nilai aset bersih pada akhir tahun 970,428 705,801

AmMetLife Insurance Berhad Laporan Tahunan Bagi Dana Berkaitan Pelaburan Tahun Kewangan Berakhir 31 Mac 2018
Laporan Tahunan Bagi AmMetLife Insurance Berhad Tahun Kewangan Berakhir 31 Mac 2018 Dana Berkaitan Pelaburan208
2018 2017 RM RM
Nilai aset bersih pada awal tahun 4,129,638 3,819,735
Amaun diterima daripada penerbitan unit 508,585 853,037
Amaun dibayar bagi pembatalan unit (796,584) (924,264) 3,841,639 3,748,508
Rugi terealisasi bersih selepas pencukaian (351,625) (140,139)
(Rugi)/laba modal belum terealisasi bersih selepas pencukaian (172,295) 521,269 Nilai aset bersih pada akhir tahun 3,317,719 4,129,638
2018 2017 RM RM
Nilai aset bersih pada awal tahun 2,264,212 2,025,933
Amaun diterima daripada penerbitan unit 422,072 468,280
Amaun dibayar bagi pembatalan unit (345,122) (523,287) 2,341,162 1,970,926
Laba terealisasi bersih selepas pencukaian 4,655 21,819
(Rugi)/laba modal belum terealisasi bersih selepas pencukaian (30,574) 271,467 Nilai aset bersih pada akhir tahun 2,315,243 2,264,212
Nota-nota yang disertakan membentuk sebahagian penting maklumat kewangan ini.
Dana AmMetLife Global Agribusiness
Dana AmMetLife Precious Metals
Penyata-penyata Perubahan dalam Nilai Aset Bersih (Sambungan)
Bagi tahun kewangan berakhir 31 Mac 2018

AmMetLife Insurance Berhad Laporan Tahunan Bagi Dana Berkaitan Pelaburan Tahun Kewangan Berakhir 31 Mac 2018
Laporan Tahunan Bagi AmMetLife Insurance Berhad Tahun Kewangan Berakhir 31 Mac 2018 Dana Berkaitan Pelaburan 209
Nota-nota yang disertakan membentuk sebahagian penting maklumat kewangan ini.
2018 2017 RM RM
Nilai aset bersih pada awal tahun 14,803,212 14,084,122
Amaun diterima daripada penerbitan unit 2,332,544 1,577,157
Amaun dibayar bagi pembatalan unit (2,868,133) (1,609,794) 14,267,623 14,051,485
Laba terealisasi bersih selepas pencukaian 1,039,908 223,991
Laba modal belum terealisasi bersih selepas pencukaian 653,945 527,736 Nilai aset bersih pada akhir tahun 15,961,476 14,803,212
Dana AmMetLife Dividend

AmMetLife Insurance Berhad Laporan Tahunan Bagi Dana Berkaitan Pelaburan Tahun Kewangan Berakhir 31 Mac 2018
Laporan Tahunan Bagi AmMetLife Insurance Berhad Tahun Kewangan Berakhir 31 Mac 2018 Dana Berkaitan Pelaburan210
1. Pengurus dan aktiviti utamanya Dana-dana berkaitan pelaburan AmMetLife Insurance Berhad (“Pengurus”) terdiri daripada Dana AmMetLife Equity, Dana
AmMetLife Bond, Dana AmMetLife Balanced, Dana AmMetLife Dana Teguh, Dana AmMetLife Oasis Islamic Equity, Dana AmMetLife Asia Pacific REITS, Dana AmMetLife Global Emerging Market, Dana AmMetLife Tactical Bond, Dana AmMetLife Precious Metals, Dana AmMetLife Global Agribusiness dan Dana AmMetLife Dividend (keseluruhannya dirujuk sebagai “Dana”).
Pengurus ialah sebuah syarikat awam liabiliti terhad yang diperbadankan dan bermastautin di Malaysia dan dilesenkan dibawah Akta Perkhidmatan Kewangan 2013. Aktiviti utamanya adalah perniagaan pengunderaitan insurans hayat dan berkaitan pelaburan.
Tidak terdapat perubahan ketara dalam aktiviti utama Pengurus semasa tahun kewangan berakhir 31 Mac 2018.
Maklumat kewangan telah dibenarkan keluarannya oleh Lembaga Pengarah Pengurus menurut resolusi pada 28 Jun 2018.
2. Polisi perakaunan yang penting 2.1 Asas Penyediaan
Maklumat kewangan Dana-dana telah disediakan menurut polisi perakaunan seperti yang dinyatakan dalam Nota 2.2 kepada maklumat kewangan dan Garis Panduan Perniagaan Insurans/Takaful Berkaitan Pelaburan yang diterbitkan oleh Bank Negara Malaysia (“BNM”).
Maklumat kewangan ini telah disediakan di bawah konvensyen kos sejarah kecuali seperti yang dinyatakan di dalam polisi perakaunan yang penting di dalam Nota 2.2 kepada maklumat kewangan.
Maklumat kewangan Dana-dana telah disediakan atas dasar usaha berterusan.
Maklumat kewangan dibentangkan dalam Ringgit Malaysia (“RM”).
2.2 Ringkasan polisi perakaunan yang penting(a) Yuran pengurusan
Yuran pengurusan dicaj berdasarkan kepada nilai aset bersih Dana-dana, pada kadar berikut:(i) Dana AmMetLife Equity 1.50% setahun(ii) Dana AmMetLife Bond 1.00% setahun(iii) Dana AmMetLife Balanced 1.50% setahun(iv) Dana AmMetLife Dana Teguh 1.50% setahun(v) Dana AmMetLife Oasis Islamic Equity 1.50% setahun(vi) Dana AmMetLife Asia Pacific REITS 1.50% setahun(vii) Dana AmMetLife Global Emerging Market 1.50% setahun(viii) Dana AmMetLife Tactical Bond 1.00% setahun(ix) Dana AmMetLife Precious Metals 1.50% setahun(x) Dana AmMetLife Global Agribusiness 1.50% setahun(xi) Dana AmMetLife Dividend 1.50% setahun
Ringkasan kepada Maklumat Kewangan
Nota-nota kepada Maklumat Kewangan
31 Mac 2018

AmMetLife Insurance Berhad Laporan Tahunan Bagi Dana Berkaitan Pelaburan Tahun Kewangan Berakhir 31 Mac 2018
Laporan Tahunan Bagi AmMetLife Insurance Berhad Tahun Kewangan Berakhir 31 Mac 2018 Dana Berkaitan Pelaburan 211
(b) Instrumen kewangan – pengiktirafan awal dan pengukuran berikutan (i) Tarikh pengiktirafan
Semua aset dan liabiliti kewangan pada mulanya diiktiraf pada tarikh dagangan, iaitu tarikh Dana-dana menjadi pihak kepada peruntukan kontrak instrumen tersebut. Ini termasuk pembelian atau penjualan “dagangan lazim” aset kewangan yang memerlukan penghantaran aset dalam tempoh masa yang secara amnya ditetapkan oleh peraturan atau konvensyen dalam pasaran.
(ii) Pengukuran awal instrumen kewangan Aset kewangan diklasifikasikan sebagai aset kewangan pada nilai saksama melalui keuntungan atau kerugian, aset kewangan sedia untuk dijual, aset kewangan atau pinjaman dan belum terima, sewajarnya. Liabiliti-liabiliti kewangan Dana-dana diklasifikasikan sebagai liabiliti-liabiliti kewangan pada nilai saksama melalui keuntungan atau kerugian atau pada kos terlunas, sewajarnya. Dana-dana menentukan klasifikasi aset-aset kewangan dan liabiliti-liabiliti kewangannya pada pengiktirafan awal.
Klasifikasi instrumen kewangan pada pengiktirafan awal bergantung kepada tujuan dan niat pengurusan memperoleh instrumen kewangan serta ciri-cirinya. Semua instrumen kewangan diukur pada awalnya pada nilai saksama, ditambah kos transaksi, kecuali dalam kes aset kewangan dan liabiliti kewangan yang direkodkan pada nilai saksama melalui untung atau rugi, yang diukur pada nilai saksama.
Dana-dana mengklasifikasikan pelaburan ke dalam aset kewangan pada nilai saksama melalui untung atau rugi (“FVTPL”) atau pinjaman dan belum terima (“LAR”).
(iii) Pengukuran berikutan Pengukuran berikutan instrumen kewangan bergantung kepada klasifikasinya seperti yang dinyatakan di bawah:1. FVTPL Aset-aset kewangan pada FVTPL direkodkan dalam Penyata-penyata Aset dan Liabiliti pada nilai
saksama. Perubahan dalam nilai saksama diiktiraf dalam Penyata-penyata Pendapatan dan Perbelanjaan. Pendapatan atau belanja faedah dan dividen direkodkan sebagai “Pendapatan Pelaburan Bersih” atau “Belanja faedah”, sebagaimana yang wajar dan menurut terma kontrak, atau apabila hak pembayaran telah ditentukan.
Termasuk dalam klasifikasi ini ialah sekuriti pendapatan tetap, skim pelaburan kolektif dan ekuiti.
2. LAR LAR termasuk aset kewangan bukan derivatif dengan pembayaran tetap atau boleh ditentukan, di mana harganya tidak disiarkan di pasaran aktif.
Selepas pengukuran awal, amaun tersebut seterusnya diukur pada kos terlunas dengan menggunakan kadar faedah efektif (“EIR”), tolak peruntukan untuk rosotnilai. Kos terlunas dikira dengan mengambil kira sebarang diskaun atau premium pada masa perolehan dan yuran serta kos yang merupakan sebahagian penting EIR.
(iv) Liabiliti kewangan pada kos terlunas Liabiliti kewangan Dana-dana, yang tidak ditetapkan pada FVTPL, diklasifikasikan sebagai liabiliti kewangan pada kos terlunas, di mana kandungan pengaturan berkontrak menyebabkan Dana-dana berkewajipan sama ada untuk memberikan wang tunai atau aset kewangan yang lain kepada pemegang, atau untuk memenuhi kewajipan tersebut selain daripada dengan pertukaran satu amaun tunai yang tetap atau aset kewangan yang lain untuk sejumlah tetap instrumen ekuiti sendiri.
Selepas ukuran permulaan, ini berikutnya diukur pada kos terlunas menggunakan kaedah EIR. Kos terlunas dikira dengan mengambil kira sebarang diskaun atau premium di atas penerbitan dan kos yang merupakan sebahagian besar EIR.

AmMetLife Insurance Berhad Laporan Tahunan Bagi Dana Berkaitan Pelaburan Tahun Kewangan Berakhir 31 Mac 2018
Laporan Tahunan Bagi AmMetLife Insurance Berhad Tahun Kewangan Berakhir 31 Mac 2018 Dana Berkaitan Pelaburan212
(c) Penyahiktirafan aset kewangan dan liabiliti kewangan (i) Aset kewangan
Aset kewangan (atau, di mana berkaitan, sebahagian daripada aset kewangan atau sebahagian daripada sekumpulan aset kewangan yang serupa) dinyahiktiraf apabila:
– Hak-hak untuk menerima aliran tunai daripada aset telah luput– Dana-dana telah memindahkan haknya untuk menerima aliran tunai daripada aset-aset atau telah
mengambil alih kewajipan untuk membayar aliran-aliran tunai yang diterima dengan sepenuhnya tanpa kelewatan material kepada pihak ketiga di bawah pengaturan “serah semua”; dan sama ada:
– Dana-dana telah memindahkan sebahagian besar risiko dan ganjaran aset, atau– Dana-dana belum memindahkan mahupun menahan sebahagian besar daripada semua risiko dan
ganjaran aset, tetapi telah memindahkan kawalan aset.
Apabila Dana-dana telah memindahkan haknya untuk menerima aliran tunai daripada aset atau telah terlibat dalam pengaturan serah semua, dan tidak memindahkan mahupun menahan sebahagian besar daripada kesemua risiko dan ganjaran aset ataupun memindahkan kawalan aset, aset tersebut diiktiraf setakat penglibatan berterusan Dana-dana dalam aset tersebut. Dalam kes ini, Dana-dana juga mengiktiraf liabiliti yang berkaitan. Aset yang telah dipindahkan dan liabiliti yang berkaitan diukur pada dasar yang menunjukkan hak dan kewajipan yang telah ditahan oleh Dana-dana.
(ii) Liabiliti kewangan Liabiliti kewangan dinyahiktiraf apabila tanggungjawab di bawah liabiliti dilepaskan, dibatalkan atau luput. Sekiranya liabiliti kewangan sedia ada digantikan dengan yang lain daripada peminjam yang sama berdasarkan terma-terma yang besar perbezaannya, atau terma liabiliti sedia ada diubah secara besar, pertukaran atau perubahan sedemikian dianggap sebagai penyahiktirafan liabiliti asal dan pengiktirafan liabiliti yang baru. Perbezaan di antara nilai dibawa liabiliti kewangan asal dan pertimbangan yang dibayar diiktiraf dalam keuntungan atau kerugian.
(d) Penentuan nilai saksama Nilai saksama aset kewangan seperti sekuriti ekuiti, yang didagangkan secara aktif di dalam pasaran kewangan teratur ditentukan dengan merujuk kepada harga yang disiarkan bagi aset pada penutup dagangan pada tarikh laporan.
Bagi pelaburan dalam amanah saham, amanah saham hartanah, nilai saksama ditentukan dengan merujuk kepada nilai aset bersih yang disiarkan. Pelaburan dalam ekuiti yang tidak mempunyai harga pasaran yang disiarkan di pasaran aktif dan yang nilai saksamanya tidak boleh diukur dengan tepat akan dinyatakan pada kos ditolak kerugian rosotnilai.
Bagi instrumen kewangan yang tiada pasaran aktif seperti sekuriti pendapatan tetap tak disebut iaitu bon tak disebut, nilai saksama diperoleh daripada Bond Pricing Agency Malaysia Sdn. Bhd. (“BPAM”).
Sekiranya nilai saksama tidak boleh diukur dengan tepat, instrumen kewangan diukur pada kos, yang merupakan nilai saksama pertimbangan yang dibayar bagi pemerolehan instrumen tersebut atau amaun yang diterima atas penerbitan liabiliti kewangan tersebut. Semua kos transaksi yang boleh dikaitkan secara langsung kepada pemerolehan tersebut juga dimasukkan di dalam kos pelaburan.
Nilai saksama Instrumen Deposit Boleh Niaga (“NID”) adalah berdasarkan siaran harga broker, manakala nilai saksama deposit tetap/berhasil adalah prinsipalnya sendiri.
(e) Rosotnilai aset kewangan Dana-dana menaksir pada setiap tarikh laporan sama ada terdapat sebarang bukti objektif bahawa sesuatu aset kewangan atau sekumpulan aset kewangan telah terjejas. Suatu aset kewangan atau sekumpulan aset kewangan dianggap terjejas sekiranya, dan hanya sekiranya, terdapat bukti objektif rosotnilai akibat satu atau lebih kejadian
Nota-nota kepada Maklumat Kewangan (Sambungan)

AmMetLife Insurance Berhad Laporan Tahunan Bagi Dana Berkaitan Pelaburan Tahun Kewangan Berakhir 31 Mac 2018
Laporan Tahunan Bagi AmMetLife Insurance Berhad Tahun Kewangan Berakhir 31 Mac 2018 Dana Berkaitan Pelaburan 213
yang telah berlaku selepas pengiktirafan awal aset tersebut (“peristiwa kerugian” yang telah berlaku) dan peristiwa (atau peristiwa-peristiwa) kerugian tersebut memberi impak kepada anggaran aliran tunai masa depan aset kewangan atau kumpulan aset kewangan yang boleh dianggarkan secara boleh percaya.
Aset kewangan yang dibawa pada kos terlunasBukti rosotnilai boleh termasuk tanda-tanda bahawa peminjam atau sekumpulan peminjam sedang mengalami masalah kewangan besar, kemungkinan bahawa mereka akan diisytiharkan muflis atau penyusunan semula kewangan yang lain, keingkaran atau delinkuensi dalam pembayaran faedah atau prinsipal dan jika data yang boleh dilihat menunjukkan bahawa terdapat pengurangan yang boleh diukur dalam anggaran aliran tunai masa depan, seperti perubahan dalam tunggakan atau keadaan ekonomi yang berkaitan dengan keingkaran.
Bagi aset kewangan yang dibawa pada kos terlunas, Dana-dana pada mulanya menilai secara individu sama ada bukti objektif rosotnilai wujud bagi aset kewangan yang signifikan secara individu, atau secara kolektif bagi aset kewangan yang tidak signifikan secara individu. Sekiranya Dana-dana menentukan bahawa tiada bukti objektif rosotnilai wujud bagi aset kewangan yang telah dinilai secara individu, ia memasukkan aset tersebut ke dalam sekumpulan aset kewangan dengan sifat-sifat risiko kredit yang serupa dan menilainya secara kolektif bagi kemerosotan. Aset yang dinilai secara individu bagi kemerosotan dan yang mana kerugian rosotnilai diiktiraf atau terus diiktiraf, tidak dimasukkan dalam penilaian rosotnilai secara kolektif.
Sekiranya terdapat bukti objektif bahawa kerugian rosotnilai telah berlaku, amaun rugi diukur sebagai perbezaan antara amaun dibawa aset tersebut dan nilai semasa anggaran aliran tunai masa hadapan (tidak termasuk jangkaan kerugian kredit masa depan yang belum berlaku). Amaun dibawa aset tersebut dikurangkan melalui penggunaan akaun peruntukan dan amaun rugi diiktiraf dalam Penyata-penyata Pendapatan dan Perbelanjaan. Pendapatan faedah terus diakru pada amaun dibawa yang telah dikurangkan dan diakru menggunakan kadar faedah yang digunakan untuk mendiskaun aliran tunai masa depan bagi tujuan mengukur kerugian rosotnilai. Pendapatan faedah direkodkan sebagai sebahagian daripada “Pendapatan faedah”. LAR bersama dengan peruntukan yang berkaitan dihapus kira apabila tiada prospek realistik pemulihan masa hadapan dan semua cagaran telah terealisasi atau telah dipindahkan ke Dana-dana. Sekiranya, dalam tahun berikutnya, amaun anggaran kerugian rosotnilai meningkat atau berkurangan disebabkan oleh peristiwa yang berlaku selepas rosotnilai tersebut diiktiraf, kerugian rosotnilai yang diiktiraf sebelumnya akan ditingkatkan atau dikurangkan dengan menyelaraskan akaun peruntukan. Sekiranya hapus kira masa hadapan dipulihkan kemudiannya, pemulihan tersebut dikreditkan ke “Kerugian rosotnilai atas LAR” setakat mana amaun dibawa aset tidak melebihi kos terlunasnya pada tarikh penarikbalikan.
Nilai semasa anggaran aliran tunai masa depan didiskaunkan pada EIR asal aset kewangan. Sekiranya LAR mempunyai kadar faedah boleh ubah, kadar diskaun bagi mengukur sebarang kerugian rosotnilai ialah EIR semasa. Sekiranya Dana-dana telah mengklasifikasikan semula aset dagangan kepada LAR, kadar diskaun bagi mengukur sebarang kerugian rosotnilai ialah EIR baru yang ditentukan pada tarikh klasifikasi semula. Pengiraan nilai semasa anggaran aliran tunai masa depan aset kewangan bercagar menunjukkan aliran tunai yang mungkin terhasil daripada perampasan harta tolak kos bagi mendapatkan dan menjual cagaran tersebut, sama ada perampasan harta berkemungkinan atau tidak.
(f) Mengofset instrumen kewanganAset-aset kewangan dan liabiliti kewangan diofset dan amaun bersih dilaporkan dalam Penyata-penyata Aset dan Liabiliti sekiranya, dan hanya sekiranya, pada masa ini terdapat hak di sisi undang-undang yang boleh dikuatkuasakan untuk mengofset amaun-amaun yang diiktiraf dan terdapat niat untuk menyelesaikan secara bersih, atau untuk merealisasikan aset tersebut dan menyelesaikan liabiliti secara serentak. Ini pada amnya tidak berlaku bagi perjanjian-perjanjian induk penghasilan bersih, oleh itu, aset dan liabiliti yang berkaitan dibentangkan kasar di dalam Penyata-penyata Aset dan Liabiliti.

AmMetLife Insurance Berhad Laporan Tahunan Bagi Dana Berkaitan Pelaburan Tahun Kewangan Berakhir 31 Mac 2018
Laporan Tahunan Bagi AmMetLife Insurance Berhad Tahun Kewangan Berakhir 31 Mac 2018 Dana Berkaitan Pelaburan214
(g) Rosotnilai aset bukan kewanganDana-dana menaksir pada setiap tarikh laporan sama ada terdapat tanda bahawa sesuatu aset mungkin terjejas. Sekiranya sebarang tanda wujud, atau apabila ujian rosotnilai tahunan bagi sesuatu aset diperlukan, Dana-dana menganggarkan amaun boleh pulih aset tersebut. Amaun boleh pulih sesuatu aset adalah nilai saksama aset atau unit penjanaan tunai (“CGU”) tolak kos untuk menjual atau nilai gunaannya, yang mana lebih tinggi. Jika amaun dibawa aset atau CGU melebihi amaun boleh pulihnya, aset tersebut dianggap terjejas dan diturun nilai kepada amaun boleh pulihnya. Dalam menaksir nilai gunaan, anggaran aliran tunai masa depan didiskaun kepada nilai semasanya menggunakan kadar diskaun pra-cukai yang menunjukkan penilaian pasaran semasa nilai masa wang dan risiko yang spesifik kepada aset tersebut. Dalam menentukan nilai saksama ditolak kos untuk menjual, satu model penilaian yang sesuai digunakan. Pengiraan ini disokong oleh gandaan penilaian, harga saham disebut bagi entiti-entiti dagangan awam atau penanda nilai saksama lain yang ada.
Bagi aset tidak termasuk muhibah, pentaksiran dibuat pada setiap tarikh laporan sama ada terdapatnya sebarang tanda yang kerugian rosotnilai yang telah diiktiraf sebelumnya mungkin tidak lagi wujud atau mungkin telah berkurangan. Sekiranya terdapat tanda sedemikian, Dana-dana menganggarkan amaun boleh pulih aset atau CGU tersebut. Kerugian rosotnilai yang telah diiktiraf sebelumnya hanya dibalikkan hanya sekiranya terdapat perubahan terhadap anggapan-anggapan yang digunakan untuk menentukan amaun boleh pulih aset sejak kerugian rosotnilai yang terakhir diiktiraf. Penarikbalikan tersebut adalah terhad agar amaun dibawa aset tidak melebihi amaun boleh pulihnya, mahupun melebihi amaun dibawa yang mungkin akan ditentukan, bersih daripada susut nilai atau pelunasan, sekiranya tiada kerugian kemerosotan diiktiraf bagi aset tersebut dalam tahun-tahun terdahulu. Pembalikan sedemikian diiktiraf dalam Penyata Pendapatan dan Perbelanjaan.
(h) Penerbitan bersih unit Penerbitan bersih unit mewakili premium yang dibayar oleh para pemegang polisi sebagai pembayaran bagi kontrak baru atau pembayaran berikutannya untuk meningkatkan amaun kontrak itu tolak kos penukaran, sekiranya ada, dalam dana-dana. Penerbitan bersih unit diiktiraf berdasarkan penerimaan.
(i) Pembatalan bersih unitPembatalan bersih unit mewakili pembatalan unit yang timbul daripada serahan dan pengeluaran. Pembatalan bersih diiktiraf semasa serahan kontrak insurans yang berkaitan.
(j) Pengiktirafan hasil yang lain Hasil diiktiraf selagi ia berkebarangkalian bahawa manfaat ekonomi akan mengalir kepada Dana-dana dan hasil tersebut boleh diukur secara tepat. Kriteria pengiktirafan spesifik berikut harus dipenuhi sebelum hasil diiktiraf.
(i) Pendapatan faedah Faedah dan pendapatan dan belanja pembiayaan diiktiraf dalam untung atau rugi menggunakan kaedah faedah efektif. Apabila sesuatu aset kewangan atau sekumpulan aset kewangan yang serupa telah diturun nilai akibat kerugian kemerosotan, pendapatan faedah diiktiraf menggunakan kadar faedah yang digunakan untuk mendiskaun aliran tunai masa depan untuk tujuan mengukur kerugian rosotnilai.
(ii) Laba dan rugi pelaburan terealisasi Pada pelupusan pelaburan, perbezaan antara hasil pelupusan bersih dan amaun dibawa pelaburan dikreditkan atau dicaj kepada Penyata-penyata Pendapatan dan Perbelanjaan.
(iii) Pendapatan dividen Pendapatan dividen mewakili dividen kasar daripada pelaburan-pelaburan disebut dan tak disebut dan diiktiraf apabila hak untuk menerima pembayaran ditetapkan.
Nota-nota kepada Maklumat Kewangan (Sambungan)

AmMetLife Insurance Berhad Laporan Tahunan Bagi Dana Berkaitan Pelaburan Tahun Kewangan Berakhir 31 Mac 2018
Laporan Tahunan Bagi AmMetLife Insurance Berhad Tahun Kewangan Berakhir 31 Mac 2018 Dana Berkaitan Pelaburan 215
(k) Cukai pendapatan Cukai pendapatan ke atas untung dan rugi terdiri daripada cukai semasa dan tertunda. Cukai semasa ialah jangkaan amaun cukai pendapatan yang harus dibayar berkenaan dengan untung boleh cukai bagi tahun ini dan diukur menggunakan kadar cukai berkanun pada tarikh Penyata-penyata Aset dan Liabiliti.
Cukai tertunda diperuntukkan, menggunakan kaedah liabiliti, atas perbezaan sementara pada tarikh Penyata-penyata Aset dan Liabiliti antara asas cukai aset dan liabiliti dan amaun dibawanya dalam maklumat kewangan. Pada dasarnya, liabiliti cukai tertunda diiktiraf bagi semua perbezaan sementara boleh cukai dan aset cukai tertunda diiktiraf bagi semua perbezaan sementara boleh potong, setakat adanya kemungkinan bahawa untung boleh cukai akan wujud, lantas membolehkan perbezaan sementara boleh potong digunakan.
Cukai tertunda diukur pada kadar cukai yang dijangka akan dikenakan dalam tempoh ketika aset tersebut direalisasikan atau liabiliti diselesaikan, berdasarkan kadar cukai berkanun atau berkanun secara substantif pada tarikh Penyata Aset dan Liabiliti. Cukai tertunda diiktiraf sebagai pendapatan atau perbelanjaan dalam Penyata Pendapatan dan Perbelanjaan, kecuali apabila ia timbul daripada transaksi yang telah diiktiraf secara terus dalam modal para pemegang unit, yang mana dalam kes ini, cukai tertunda juga diiktiraf dalam modal para pemegang unit.
(l) PeruntukanPeruntukan diiktiraf apabila Dana-dana mempunyai obligasi semasa akibat peristiwa terdahulu dan berkemungkinan bahawa aliran keluar sumber yang membawa manfaat-manfaat ekonomi diperlukan untuk menyelesaikan obligasi tersebut, dan anggaran boleh percaya amaun boleh dibuat. Peruntukan dikaji semula pada setiap tarikh Penyata Aset dan Liabiliti dan diselaraskan untuk menunjukkan anggaran terbaik semasa. Di mana kesan nilai masa wang adalah penting, peruntukan didiskaun menggunakan kadar pra-cukai semasa yang menunjukkan, sewajarnya, risiko yang spesifik kepada liabiliti. Di mana pendiskaunan digunakan, peningkatan dalam peruntukan yang disebabkan oleh peredaran masa diiktiraf sebagai kos kewangan.
(m) Urus niaga mata wang asing (i) Mata wang fungsian dan pembentangan
Penyata-penyata kewangan ini dibentangkan dalam Ringgit Malaysia (“RM”) yang juga mata wang fungsian dan pembentangan Dana-dana.
(ii) Urus niaga mata wang asing Urus niaga dalam mata wang asing pada mulanya direkodkan pada kadar semasa mata wang fungsian pada tarikh urus niaga. Aset dan liabiliti monetari berdenominasi mata wang asing ditukarkan semula pada kadar pertukaran mata wang fungsian pada tarikh laporan. Semua perbezaan dibawa ke untung dan rugi. Butiran bukan monetari berdenominasi mata wang asing yang diukur pada kos sejarah ditukarkan menggunakan kadar pertukaran pada tarikh urus niaga-urus niaga awal.
Butiran bukan monetari diukur pada nilai saksama dalam mata wang asing ditukarkan menggunakan kadar pertukaran pada tarikh apabila nilai saksama ditentukan. Semua perbezaan pertukaran asing dibawa ke untung atau rugi kecuali bagi perbezaan yang berkaitan dengan butiran yang mana untung atau rugi diiktiraf secara langsung dalam ekuiti, yang mana dalam hal ini, untung atau rugi diiktiraf bersih daripada komponen pertukaran dalam ekuiti.
(n) Tunai dan kesetaraan tunaiTunai dan kesetaraan tunai terdiri daripada tunai dan baki di bank, tidak termasuk deposit tetap dan panggilan.

AmMetLife Insurance Berhad Laporan Tahunan Bagi Dana Berkaitan Pelaburan Tahun Kewangan Berakhir 31 Mac 2018
Laporan Tahunan Bagi AmMetLife Insurance Berhad Tahun Kewangan Berakhir 31 Mac 2018 Dana Berkaitan Pelaburan216
3. Pelaburan
(i) Dana AmMetLife Equity
2018 2017 RM RM
Sekuriti ekuiti disebut 22,267,521 20,182,682
Dana amanah saham dan harta tanah disebut 441,672 342,901
22,709,193 20,525,583
FVTPL:
Sekuriti ekuiti disebut
Kos 19,103,788 18,084,089
Laba tidak terealisasi bersih 3,163,733 2,098,593
Nilai saksama 22,267,521 20,182,682
Dana amanah saham dan harta tanah disebut
Kos 482,705 346,913
Rugi tidak terealisasi bersih (41,033) (4,012)
Nilai saksama 441,672 342,901
Jumlah pelaburan pada FVTPL 22,709,193 20,525,583
Jumlah pelaburan 22,709,193 20,525,583
Nota-nota kepada Maklumat Kewangan (Sambungan)

AmMetLife Insurance Berhad Laporan Tahunan Bagi Dana Berkaitan Pelaburan Tahun Kewangan Berakhir 31 Mac 2018
Laporan Tahunan Bagi AmMetLife Insurance Berhad Tahun Kewangan Berakhir 31 Mac 2018 Dana Berkaitan Pelaburan 217
2018
Nilai saksama Jumlah Kos Nilai saksama sebagai % Unit RM RM daripada NAB
FVTPL:
Sekuriti ekuiti disebut
Pembinaan
Econpile Holdings Berhad 411,500 484,912 405,328 1.48%
Econpile Holdings Berhad – Waran 82,300 – 14,814 0.05%
Gamuda Berhad 73,200 337,419 379,176 1.38%
Gamuda Berhad – Waran 10,616 2,654 12,633 0.05%
IJM Corporation Berhad 171,300 573,232 459,084 1.67%
Sunway Construction Group Berhad 184,700 327,589 380,482 1.39%
Pengguna
Padini Holdings Berhad 61,000 246,062 272,670 0.99%
Kewangan
CIMB Group Holdings Berhad 193,462 1,082,364 1,390,992 5.07%
Hong Leong Bank Berhad 44,200 754,370 830,960 3.03%
Malayan Banking Berhad 252,990 2,199,385 2,681,694 9.77%
Public Bank Berhad 83,400 1,516,138 2,001,600 7.29%
Perindustrian
Denko Industrial Corporation Berhad 220,300 343,275 352,480 1.28%
Hartalega Holdings Berhad 59,600 248,131 360,580 1.31%
Petron Malaysia Refining & Marketing Berhad 22,500 231,910 193,275 0.70%
Petronas Chemicals Group Berhad 168,400 1,270,889 1,390,984 5.07%
Top Glove Corporation Berhad 44,800 223,442 431,872 1.57%
Uchi Technologies Berhad 78,600 260,062 209,862 0.76%
V.S Industry Berhad 320,550 596,475 759,704 2.77%
Wah Seong Corporation Berhad 171,000 183,698 247,950 0.90%
Perladangan
Kuala Lumpur Kepong Berhad 14,800 346,830 378,584 1.38%
Sime Darby Plantation Berhad 76,862 389,614 424,278 1.55%
(i) Dana AmMetLife Equity (Sambungan)
Komposisi, kos dan nilai saksama pelaburan FVTPL di Malaysia pada 31 Mac 2018 dinyatakan di bawah:

AmMetLife Insurance Berhad Laporan Tahunan Bagi Dana Berkaitan Pelaburan Tahun Kewangan Berakhir 31 Mac 2018
Laporan Tahunan Bagi AmMetLife Insurance Berhad Tahun Kewangan Berakhir 31 Mac 2018 Dana Berkaitan Pelaburan218
2018
Nilai saksama Jumlah Kos Nilai saksama sebagai % Unit RM RM daripada NAB
FVTPL: (Sambungan)
Sekuriti ekuiti disebut (Sambungan)
Teknologi
Globetronics Technology Berhad 90,600 421,875 367,836 1.34%
Inari Amertron Berhad 189,700 291,988 521,675 1.90%
Dagangan & Perkhidmatan
AirAsia Berhad 129,800 399,312 510,114 1.86%
Axiata Group Berhad 170,782 897,901 930,762 3.39%
Bermaz Auto Berhad 230,700 501,073 498,312 1.82%
Bumi Armada Berhad 307,200 272,540 256,512 0.93%
Dialog Group Berhad 190,300 319,113 584,221 2.13%
Genting Berhad 96,600 802,160 843,318 3.07%
Genting Malaysia Berhad 41,100 188,070 201,390 0.73%
My E.G. Services Berhad 102,800 221,073 298,120 1.09%
Mynews Holdings Berhad 25,200 29,687 36,540 0.13%
Serba Dinamik Holdings Berhad 236,600 811,393 809,172 2.95%
Sime Darby Berhad 76,862 129,040 202,915 0.74%
Telekom Malaysia Berhad 95,200 614,360 496,944 1.81%
Tenaga Nasional Berhad 131,200 1,585,752 2,130,688 7.76%
19,103,788 22,267,521 81.13%
Dana amah saham dan harta tanah disebut
KLCC Real Estate Investment Trust 61,600 482,705 441,672 1.61%
Jumlah pelaburan pada FVTPL 19,586,493 22,709,193 82.74%
Nota-nota kepada Maklumat Kewangan (Sambungan)
3. Pelaburan (Sambungan)
(i) Dana AmMetLife Equity (Sambungan)

AmMetLife Insurance Berhad Laporan Tahunan Bagi Dana Berkaitan Pelaburan Tahun Kewangan Berakhir 31 Mac 2018
Laporan Tahunan Bagi AmMetLife Insurance Berhad Tahun Kewangan Berakhir 31 Mac 2018 Dana Berkaitan Pelaburan 219
2018 2017 RM RM
Sekuriti kerajaan Malaysia 692,587 –
Bon korporat tak disebut 8,887,733 8,960,882
Dana amanah saham dan harta tanah tak disebut 25,027 22,372
Simpanan di institusi kewangan berlesen 719,000 –
10,324,347 8,983,254
FVTPL:Sekuriti kerajaan Malaysia:
Kos 695,975 –
Rugi tidak terealisasi bersih (3,388) –
Nilai saksama 692,587 –
Bon korporat tak disebut:
Kos 9,097,980 9,116,780
Rugi tidak terealisasi bersih (210,247) (155,898)
Nilai saksama 8,887,733 8,960,882
Dana amanah saham dan harta tanah tak disebut:
Kos 24,712 20,893
Laba tidak terealisasi bersih 315 1,479
Nilai saksama 25,027 22,372
Jumlah pelaburan pada FVTPL 9,605,347 8,983,254
LAR:
Simpanan di institusi kewangan berlesen 719,000 –
Jumlah pelaburan 10,324,347 8,983,254
(ii) Dana AmMetLife Bond

AmMetLife Insurance Berhad Laporan Tahunan Bagi Dana Berkaitan Pelaburan Tahun Kewangan Berakhir 31 Mac 2018
Laporan Tahunan Bagi AmMetLife Insurance Berhad Tahun Kewangan Berakhir 31 Mac 2018 Dana Berkaitan Pelaburan220
2018
Nilai saksama Jumlah Kos Nilai saksama sebagai % Unit RM RM daripada NAB
FVTPL:
Sekuriti kerajaan Malaysia 700,000 695,975 692,587 6.67%
695,975 692,587 6.67%
Bon korporat tak disebut
Sistem Penyuraian Trafik KL Barat Sdn Berhad matang pada 28/12/2018 1,300,000 1,335,880 1,317,303 12.69% RHB Bank Berhad Hybrid Peringkat 1 matang pada 29/03/2019 1,300,000 1,550,900 1,342,224 12.93% Konsortium Lebuhraya Utara-Timur (KL) Sdn Berhad matang pada 02/12/2026 400,000 389,800 397,840 3.83% Sime Darby Berhad matang pada 24/03/2026 1,500,000 1,500,000 1,567,470 15.10%Tanjung Bin Energy Issuer Berhad matang pada 15/09/2031 900,000 984,150 987,687 9.52% Sarawak Energy Berhad matang pada 25/04/2036 500,000 500,300 485,870 4.68% Projek Lebuhraya Usahasama Berhad matang pada 12/01/2026 500,000 520,550 504,215 4.86% Manjung Island Energy Berhad matang pada 25/11/2025 1,000,000 1,013,700 990,670 9.55%Sarawak Hidro Sdn Berhad matang pada 11/08/2026 300,000 301,200 295,044 2.84%Gamuda Berhad matang pada 16/03/2023 1,000,000 1,001,500 999,410 9.63%
9,097,980 8,887,733 85.64%
Dana amanah saham dan harta tanah tak disebut
Dana AmBond 15,569 18,728 18,606 0.18%Dana AmDynamic Bond 9,920 5,984 6,421 0.06%
24,712 25,027 0.24%
Jumlah pelaburan pada FVTPL 9,818,667 9,605,347 92.55%
Nota-nota kepada Maklumat Kewangan (Sambungan)
3. Pelaburan (Sambungan)
(ii) Dana AmMetLife Bond (Sambungan)
Komposisi, kos dan nilai saksama pelaburan FVTPL di Malaysia pada 31 Mac 2018 dinyatakan di bawah:

AmMetLife Insurance Berhad Laporan Tahunan Bagi Dana Berkaitan Pelaburan Tahun Kewangan Berakhir 31 Mac 2018
Laporan Tahunan Bagi AmMetLife Insurance Berhad Tahun Kewangan Berakhir 31 Mac 2018 Dana Berkaitan Pelaburan 221
2018 2017 % %
Sekuriti kerajaan Malaysia 4.93 –Bon korporat tak disebut – bercagar% – 4.98Bon korporat tak disebut – tidak bercagar% 4.97 5.00
Simpanan di institusi kewangan berlesen 3.50 –
2018 2017 RM RM
Sekuriti ekuiti disebut 17,660,512 15,699,664
Bon korporat tak disebut 4,295,146 5,318,717
Dana amanah saham dan harta tanah disebut – 217,841
21,955,658 21,236,222
FVTPL:
Sekuriti ekuiti disebut
Kos 15,193,912 14,017,212
Laba tidak terealisasi bersih 2,466,600 1,682,452
Nilai saksama 17,660,512 15,699,664
Bon korporat tak disebut
Kos 4,357,240 5,377,540
Rugi tidak terealisasi bersih (62,094) (58,823)
Nilai saksama 4,295,146 5,318,717
Dana amanah saham dan harta tanah disebut
Kos – 219,769
Rugi tidak terealisasi bersih – (1,928)
Nilai saksama – 217,841
Jumlah pelaburan pada FVTPL 21,955,658 21,236,222
Jumlah pelaburan 21,955,658 21,236,222
(iii) Dana AmMetLife Balanced
(ii) Dana AmMetLife Bond (Sambungan)
Purata wajaran kadar faedah efektif tahunan adalah seperti berikut:

AmMetLife Insurance Berhad Laporan Tahunan Bagi Dana Berkaitan Pelaburan Tahun Kewangan Berakhir 31 Mac 2018
Laporan Tahunan Bagi AmMetLife Insurance Berhad Tahun Kewangan Berakhir 31 Mac 2018 Dana Berkaitan Pelaburan222
2018
Nilai saksama Jumlah Kos Nilai saksama sebagai % Unit RM RM daripada NAB
FVTPL:
Sekuriti ekuiti disebut
Pembinaan
Econpile Holdings Berhad 409,750 486,149 403,604 1.52%
Econpile Holdings Berhad – Waran 81,950 – 14,751 0.06%
Gamuda Berhad 34,100 168,107 176,638 0.66%
Gamuda Berhad – Waran 10,200 2,550 12,138 0.05%
IJM Corporation Berhad 162,500 552,993 435,500 1.64%
Sunway Construction Group Berhad 157,500 279,376 324,450 1.22%
Pengguna
Padini Holdings Berhad 59,200 247,440 264,624 1.00%
Kewangan
CIMB Group Holdings Berhad 131,044 730,499 942,206 3.55%
Hong Leong Bank Berhad 42,900 755,806 806,520 3.04%
Malayan Banking Berhad 167,716 1,486,939 1,777,790 6.69%
Public Bank Berhad 67,400 1,238,382 1,617,600 6.09%
Produk Perindustrian
Denko Industrial Corporation Berhad 213,400 332,523 341,440 1.28%
Hartalega Holdings Berhad 59,400 247,299 359,370 1.35%
Petron Malaysia Refining & Marketing Berhad 21,700 223,750 186,403 0.70%
Petronas Chemicals Group Berhad 114,400 833,823 944,944 3.56%
Top Glove Corporation Berhad 43,200 215,437 416,448 1.57%
Uchi Technologies Berhad 78,300 259,066 209,061 0.79%
V.S Industry Berhad 283,000 513,487 670,710 2.52%
Wah Seong Corporation Berhad 166,500 178,863 241,425 0.91%
Nota-nota kepada Maklumat Kewangan (Sambungan)
3. Pelaburan (Sambungan)
(iii) Dana AmMetLife Balanced (Sambungan)
Komposisi, kos dan nilai saksama pelaburan FVTPL di Malaysia pada 31 Mac 2018 dinyatakan di bawah:

AmMetLife Insurance Berhad Laporan Tahunan Bagi Dana Berkaitan Pelaburan Tahun Kewangan Berakhir 31 Mac 2018
Laporan Tahunan Bagi AmMetLife Insurance Berhad Tahun Kewangan Berakhir 31 Mac 2018 Dana Berkaitan Pelaburan 223
2018
Nilai saksama Jumlah Kos Nilai saksama sebagai % Unit RM RM daripada NAB
FVTPL: (Sambungan)
Sekuriti ekuiti disebut (Sambungan)
Perladangan
Kuala Lumpur Kepong Berhad 9,900 231,996 253,242 0.95%
Sime Darby Plantation Berhad 80,678 429,220 445,343 1.68%
Teknologi
Globetronics Technology Berhad 88,000 412,436 357,280 1.34%
Inari Amertron Berhad 219,200 361,063 602,800 2.27%
Dagangan & Perkhidmatan
AirAsia Berhad 125,100 391,269 491,643 1.85%
Axiata Group Berhad 118,412 615,630 645,345 2.43%
Bermaz Auto Berhad 246,200 526,220 531,792 2.00%
Bumi Armada Berhad 299,900 266,068 250,416 0.94%
Dialog Group Berhad 162,500 272,524 498,875 1.88%
Genting Berhad 56,200 460,816 490,626 1.85%
Genting Malaysia Berhad 29,200 122,677 143,080 0.54%
My E.G. Services Berhad 100,000 215,087 290,000 1.09%
Mynews Holdings Berhad 25,400 29,923 36,830 0.14%
Serba Dinamik Holdings Berhad 188,200 648,901 643,644 2.42%
Sime Darby Berhad 80,678 142,158 212,990 0.80%
Telekom Malaysia Berhad 38,000 243,358 198,360 0.75%
Tenaga Nasional Berhad 87,600 1,072,077 1,422,624 5.35%
15,193,912 17,660,512 66.46%

AmMetLife Insurance Berhad Laporan Tahunan Bagi Dana Berkaitan Pelaburan Tahun Kewangan Berakhir 31 Mac 2018
Laporan Tahunan Bagi AmMetLife Insurance Berhad Tahun Kewangan Berakhir 31 Mac 2018 Dana Berkaitan Pelaburan224
2018
Nilai saksama Jumlah Kos Nilai saksama sebagai % Unit RM RM daripada NAB
FVTPL: (Sambungan)
Bon korporat tak disebut
Encorp Systembilt Sdn Berhad matang pada 16/11/2018 500,000 497,200 501,245 1.89%
Sistem Penyuraian Trafik KL Barat Sdn Berhad matang pada 28/12/2018 1,900,000 1,952,440 1,925,289 7.25%
Sarawak Hidro Sdn Berhad matang pada 11/08/2026 1,900,000 1,907,600 1,868,612 7.03%
4,357,240 4,295,146 16.16%
Jumlah pelaburan pada FVTPL 19,551,152 21,955,658 82.63%
2018 2017 % %
Bon korporat tak disebut – bercagar – 4.98Bon korporat tak disebut – tidak bercagar 5.02 5.03
Purata wajaran kadar faedah efektif tahunan adalah seperti berikut:
Nota-nota kepada Maklumat Kewangan (Sambungan)
3. Pelaburan (Sambungan)
(iii) Dana AmMetLife Balanced (Sambungan)

AmMetLife Insurance Berhad Laporan Tahunan Bagi Dana Berkaitan Pelaburan Tahun Kewangan Berakhir 31 Mac 2018
Laporan Tahunan Bagi AmMetLife Insurance Berhad Tahun Kewangan Berakhir 31 Mac 2018 Dana Berkaitan Pelaburan 225
2018 2017 RM RM
Sekuriti ekuiti disebut 11,788,466 12,084,396
Dana amanah saham dan harta tanah disebut 254,535 –
Bon korporat tak disebut 3,783,081 3,786,777
Dana amanah saham dan harta tanah tak disebut 674,581 647,844
16,500,663 16,519,017
FVTPL:
Sekuriti ekuiti disebut
Kos 10,314,812 10,706,935
Laba tidak terealisasi bersih 1,473,654 1,377,461
Nilai saksama 11,788,466 12,084,396
Dana amanah saham dan harta tanah disebut
Kos 278,230 –
Rugi tidak terealisasi bersih (23,695) –
Nilai saksama 254,535 –
Bon korporat tak disebut
Kos 3,826,840 3,826,840
Rugi tidak terealisasi bersih (43,759) (40,063)
Nilai saksama 3,783,081 3,786,777
Dana amanah saham dan harta tanah tak disebut
Kos 663,452 619,091
Laba tidak terealisasi bersih 11,129 28,753
Nilai saksama 674,581 647,844
Jumlah pelaburan pada FVTPL 16,500,663 16,519,017
Jumlah pelaburan 16,500,663 16,519,017
(iv) Dana AmMetLife Dana Teguh

AmMetLife Insurance Berhad Laporan Tahunan Bagi Dana Berkaitan Pelaburan Tahun Kewangan Berakhir 31 Mac 2018
Laporan Tahunan Bagi AmMetLife Insurance Berhad Tahun Kewangan Berakhir 31 Mac 2018 Dana Berkaitan Pelaburan226
2018
Nilai saksama Jumlah Kos Nilai saksama sebagai % Unit RM RM daripada NAB
FVTPL:
Sekuriti ekuiti disebut
Pembinaan
Econpile Holdings Berhad 438,250 252,634 431,676 2.08%
Econpile Holdings Berhad – Waran 87,650 – 15,777 0.08%
Gamuda Berhad 28,300 139,356 146,594 0.71%
Gamuda Berhad – Waran 12,016 3,004 14,299 0.07%
IJM Corporation Berhad 131,600 418,171 352,688 1.70%
Ikhmas Jaya Group Berhad 198,200 144,158 74,325 0.36%
Sunway Construction Group berhad 141,900 296,997 292,314 1.41%
Pengguna
Padini Holdings Berhad 46,200 192,511 206,514 0.99%
Kewangan
BIMB Holdings Berhad 103,900 435,541 408,327 1.96%
Produk Perindustrian
Denko Industrial Corporation Berhad 170,600 265,831 272,960 1.31%
Hartalega Holdings Berhad 49,400 205,700 298,870 1.44%
Petron Malaysia Refining & Marketing Berhad 17,600 181,486 151,184 0.73%
Petronas Chemicals Group Berhad 127,600 965,113 1,053,976 5.07%
Top Glove Corporation Berhad 34,400 171,569 331,616 1.60%
Uchi Technologies Berhad 65,100 215,400 173,817 0.84%
V.S Industry Berhad 251,675 446,611 596,470 2.87%
Wah Seong Corporation Berhad 130,400 140,082 189,080 0.91%
Nota-nota kepada Maklumat Kewangan (Sambungan)
3. Pelaburan (Sambungan)
(iv) Dana AmMetLife Dana Teguh (Sambungan)
Komposisi, kos dan nilai saksama pelaburan FVTPL di Malaysia pada 31 Mac 2018 dinyatakan di bawah:

AmMetLife Insurance Berhad Laporan Tahunan Bagi Dana Berkaitan Pelaburan Tahun Kewangan Berakhir 31 Mac 2018
Laporan Tahunan Bagi AmMetLife Insurance Berhad Tahun Kewangan Berakhir 31 Mac 2018 Dana Berkaitan Pelaburan 227
(iv) Dana AmMetLife Dana Teguh (Sambungan)
2018
Nilai saksama Jumlah Kos Nilai saksama sebagai % Unit RM RM daripada NAB
FVTPL: (Sambungan)
Sekuriti ekuiti disebut (Sambungan)
Perladangan
Kuala Lumpur Kepong Berhad 16,300 380,497 416,954 2.01%
Sime Darby Plantation Berhad 77,934 414,002 430,196 2.07%
Teknologi
Globetronics Technology Berhad 69,000 335,913 280,140 1.35%
Inari Amertron Berhad 153,200 237,249 421,300 2.03%
Dagangan & Perkhidmatan
Axiata Group Berhad 153,321 822,421 835,599 4.02%
Bermaz Auto Berhad 235,100 520,886 507,816 –
Dialog Group Berhad 168,800 283,082 518,216 2.49%
IHH Healthcare Berhad 34,600 213,281 209,330 1.01%
My E.G. Services Berhad 78,400 165,555 227,360 1.09%
Serba Dinamik Holdings Berhad 179,500 618,858 613,890 2.95%
Sime Darby Berhad 77,934 137,118 205,746 0.99%
Telekom Malaysia Berhad 77,200 489,148 402,984 1.94%
Tenaga Nasional Berhad 105,200 1,222,638 1,708,448 8.22%
10,314,812 11,788,466 56.73%

AmMetLife Insurance Berhad Laporan Tahunan Bagi Dana Berkaitan Pelaburan Tahun Kewangan Berakhir 31 Mac 2018
Laporan Tahunan Bagi AmMetLife Insurance Berhad Tahun Kewangan Berakhir 31 Mac 2018 Dana Berkaitan Pelaburan228
2018
Nilai saksama Jumlah Kos Nilai saksama sebagai % Unit RM RM daripada NAB
FVTPL: (Sambungan)
Dana amanah saham danharta tanah disebut
KLCC Real Estate Investment Trust 35,500 278,230 254,535 1.22%
Bon korporat tak disebut
Encorp Systembilt Sdn Berhad matang pada 16/11/2018 1,000,000 994,400 1,002,490 4.82%
Sistem Penyuraian Trafik KL Barat Sdn Berhad matang pada 28/12/2018 900,000 924,840 911,979 4.39%
Sarawak Hidro Sdn Berhad matang pada 11/08/2026 1,900,000 1,907,600 1,868,612 8.99%
3,826,840 3,783,081 18.20%
Dana amanah saham dan harta tanah tak disebut
Dana AmBon Islam 562,949 663,452 674,581 3.25%
Jumlah pelaburan pada FVTPL 15,083,334 16,500,663 79.40%
2018 2017 % %
Bon korporat tak disebut – tidak bercagar 4.76 4.76
Purata wajaran kadar faedah efektif tahunan adalah seperti berikut:
Nota-nota kepada Maklumat Kewangan (Sambungan)
3. Pelaburan (Sambungan)
(iv) Dana AmMetLife Dana Teguh (Sambungan)

AmMetLife Insurance Berhad Laporan Tahunan Bagi Dana Berkaitan Pelaburan Tahun Kewangan Berakhir 31 Mac 2018
Laporan Tahunan Bagi AmMetLife Insurance Berhad Tahun Kewangan Berakhir 31 Mac 2018 Dana Berkaitan Pelaburan 229
(v) Dana AmMetLife Oasis Islamic Equity
2018 2017 RM RM
Dana amanah saham dan harta tanah tak disebut 3,383,640 3,867,551
FVTPL:
Dana amanah saham dan harta tanah tak disebut
Kos 3,790,418 3,740,819
Laba tidak terealisasi bersih (406,778) 126,732
Nilai saksama 3,383,640 3,867,551
Jumlah pelaburan pada FVTPL 3,383,640 3,867,551
Jumlah pelaburan 3,383,640 3,867,551
2018
Nilai saksama Jumlah Kos Nilai saksama sebagai % Unit RM RM daripada NAB
FVTPL:
Dana amanah saham dan harta tanah tak disebut
AmOasis Islamic Equity 3,970,011 3,790,418 3,383,640 93.67%
Jumlah pelaburan pada FVTPL 3,790,418 3,383,640 93.67%
Komposisi, kos dan nilai saksama pelaburan FVTPL di Malaysia pada 31 Mac 2018 dinyatakan di bawah:

AmMetLife Insurance Berhad Laporan Tahunan Bagi Dana Berkaitan Pelaburan Tahun Kewangan Berakhir 31 Mac 2018
Laporan Tahunan Bagi AmMetLife Insurance Berhad Tahun Kewangan Berakhir 31 Mac 2018 Dana Berkaitan Pelaburan230
Komposisi, kos dan nilai saksama pelaburan FVTPL di Malaysia pada 31 Mac 2018 dinyatakan di bawah:
2018
Nilai saksama Jumlah Kos Nilai saksama sebagai % Unit RM RM daripada NAB
FVTPL:
Dana amanah saham dan harta tanah tak disebut
AmAsia Pacific REITS 3,319,215 2,358,382 2,420,040 73.25%
Jumlah pelaburan pada FVTPL 2,358,382 2,420,040 73.25%
2018 2017 RM RM
Dana amanah saham dan harta tanah tak disebut 2,420,040 1,183,915
Simpanan di institusi kewangan berlesen 135,809 –
2,555,849 1,183,915 FVTPL:
Dana amanah saham dan harta tanah tak disebut
Kos 2,358,382 990,817
Laba tidak terealisasi bersih 61,658 193,098
Nilai saksama 2,420,040 1,183,915
Jumlah pelaburan pada FVTPL 2,420,040 1,183,915
LAR:
Simpanan di institusi kewangan berlesen 135,809 –
Jumlah pelaburan 2,555,849 1,183,915
2018 2017 % %
Simpanan di institusi kewangan berlesen 3.40 –
Purata wajaran kadar faedah efektif tahunan ialah seperti berikut:
Nota-nota kepada Maklumat Kewangan (Sambungan)
3. Pelaburan (Sambungan)
(vi) Dana AmMetLife Asia Pacific REITS

AmMetLife Insurance Berhad Laporan Tahunan Bagi Dana Berkaitan Pelaburan Tahun Kewangan Berakhir 31 Mac 2018
Laporan Tahunan Bagi AmMetLife Insurance Berhad Tahun Kewangan Berakhir 31 Mac 2018 Dana Berkaitan Pelaburan 231
2018
Nilai saksama Jumlah Kos Nilai saksama sebagai % Unit RM RM daripada NAB
FVTPL:
Dana amanah saham dan harta tanah tak disebut
AmCash Management 98,421 98,421 98,421 3.25%
AmGlobal Emerging Market Opportunities 1,607,879 2,086,664 2,445,423 80.69%
2,185,085 2,543,844 83.94% Jumlah pelaburan pada FVTPL 2,185,085 2,543,844 83.94%
Komposisi, kos dan nilai saksama pelaburan FVTPL di Malaysia pada 31 Mac 2018 dinyatakan di bawah:
(vii) Dana AmMetLife Global Emerging Market
2018 2017 RM RM
Dana amanah saham dan harta tanah tak disebut 2,543,844 1,107,420
Simpanan di institusi kewangan berlesen 163,449 –
2,707,293 1,107,420 FVTPL:
Dana amanah saham dan harta tanah tak disebut
Kos 2,185,085 829,487
Laba tidak terealisasi bersih 358,759 277,933
Nilai saksama 2,543,844 1,107,420
Jumlah pelaburan pada FVTPL 2,543,844 1,107,420
LAR:
Simpanan di institusi kewangan berlesen 163,449 –
Jumlah pelaburan 2,707,293 1,107,420
2018 2017 % %
Simpanan di institusi kewangan berlesen 3.40 –
Purata wajaran kadar faedah efektif tahunan ialah seperti berikut:

AmMetLife Insurance Berhad Laporan Tahunan Bagi Dana Berkaitan Pelaburan Tahun Kewangan Berakhir 31 Mac 2018
Laporan Tahunan Bagi AmMetLife Insurance Berhad Tahun Kewangan Berakhir 31 Mac 2018 Dana Berkaitan Pelaburan232
2018 2017 RM RM
Dana amanah saham dan harta tanah tak disebut 895,082 650,390
FVTPL:
Dana amanah saham dan harta tanah tak disebut
Kos 860,070 598,637
Laba tidak terealisasi bersih 35,012 51,753
Nilai saksama 895,082 650,390
Jumlah pelaburan pada FVTPL 895,082 650,390
Jumlah pelaburan 895,082 650,390
2018
Nilai saksama Jumlah Kos Nilai saksama sebagai % Unit RM RM daripada NAB
FVTPL:
Dana amanah saham dan harta tanah tak disebut
AmTactical Bond 854,004 860,070 895,082 92.24%
Jumlah pelaburan pada FVTPL 860,070 895,082 92.24%
Komposisi, kos dan nilai saksama pelaburan FVTPL di Malaysia pada 31 Mac 2018 dinyatakan di bawah:
Nota-nota kepada Maklumat Kewangan (Sambungan)
3. Pelaburan (Sambungan)
(viii) Dana AmMetLife Tactical Bond

AmMetLife Insurance Berhad Laporan Tahunan Bagi Dana Berkaitan Pelaburan Tahun Kewangan Berakhir 31 Mac 2018
Laporan Tahunan Bagi AmMetLife Insurance Berhad Tahun Kewangan Berakhir 31 Mac 2018 Dana Berkaitan Pelaburan 233
2018 2017 RM RM
Dana amanah saham dan harta tanah tak disebut 2,804,365 3,479,947
Simpanan di institusi kewangan berlesen – – 2,804,365 3,479,947
FVTPL:
Dana amanah saham dan harta tanah tak disebut
Kos 5,916,311 6,404,615
Rugi tidak terealisasi bersih (3,111,946) (2,924,668)
Nilai saksama 2,804,365 3,479,947
Jumlah pelaburan pada FVTPL 2,804,365 3,479,947
Jumlah pelaburan 2,804,365 3,479,947
2018
Nilai saksama Jumlah Kos Nilai saksama sebagai % Unit RM RM daripada NAB
FVTPL:
Dana amanah saham dan harta tanah tak disebut
AmPrecious Metals 7,837,801 5,916,311 2,804,365 84.53%
Jumlah pelaburan pada FVTPL 5,916,311 2,804,365 84.53%
Komposisi, kos dan nilai saksama pelaburan FVTPL di Malaysia pada 31 Mac 2018 dinyatakan di bawah:
(ix) Dana AmMetLife Precious Metals

AmMetLife Insurance Berhad Laporan Tahunan Bagi Dana Berkaitan Pelaburan Tahun Kewangan Berakhir 31 Mac 2018
Laporan Tahunan Bagi AmMetLife Insurance Berhad Tahun Kewangan Berakhir 31 Mac 2018 Dana Berkaitan Pelaburan234
2018 2017 RM RM
Dana amanah saham dan harta tanah tak disebut 2,108,847 2,086,283
Simpanan di institusi kewangan berlesen 219,525 206,484 2,328,372 2,292,767
FVTPL:
Dana amanah saham dan harta tanah tak disebut
Kos 1,742,914 1,687,118
Laba tidak terealisasi bersih 365,933 399,165
Nilai saksama 2,108,847 2,086,283
Jumlah pelaburan pada FVTPL 2,108,847 2,086,283
LAR:
Simpanan di institusi kewangan berlesen 219,525 206,484
Jumlah pelaburan 2,328,372 2,292,767
Komposisi, kos dan nilai saksama pelaburan FVTPL di Malaysia pada 31 Mac 2018 dinyatakan di bawah:
2018
Nilai saksama Jumlah Kos Nilai saksama sebagai % Unit RM RM daripada NAB
FVTPL:
Dana amanah saham dan harta tanah tak disebut
AmGlobal Agribusiness 1,899,862 1,742,914 2,108,847 91.09%
Jumlah pelaburan pada FVTPL 1,742,914 2,108,847 91.09%
2018 2017 % %
Simpanan di institusi kewangan berlesen 3.40 3.20
Purata wajaran kadar faedah efektif tahunan adalah seperti berikut:
Nota-nota kepada Maklumat Kewangan (Sambungan)
3. Pelaburan (Sambungan)
(x) Dana AmMetLife Global Agribusiness

AmMetLife Insurance Berhad Laporan Tahunan Bagi Dana Berkaitan Pelaburan Tahun Kewangan Berakhir 31 Mac 2018
Laporan Tahunan Bagi AmMetLife Insurance Berhad Tahun Kewangan Berakhir 31 Mac 2018 Dana Berkaitan Pelaburan 235
2018 2017 RM RM
Sekuriti ekuiti disebut 13,841,107 13,342,933
Dana amanah saham dan harta tanah disebut 150,570 225,784 13,991,677 13,568,717
FVTPL:
Sekuriti ekuiti disebut
Kos 11,696,436 11,920,417
Laba tidak terealisasi bersih 2,144,671 1,422,516
Nilai saksama 13,841,107 13,342,933
Dana amanah saham dan harta tanah disebut
Kos 164,587 228,455
Rugi tidak terealisasi bersih (14,017) (2,671)
Nilai saksama 150,570 225,784
Jumlah pelaburan pada FVTPL 13,991,677 13,568,717
Jumlah pelaburan 13,991,677 13,568,717
(xi) Dana AmMetLife Dividend

AmMetLife Insurance Berhad Laporan Tahunan Bagi Dana Berkaitan Pelaburan Tahun Kewangan Berakhir 31 Mac 2018
Laporan Tahunan Bagi AmMetLife Insurance Berhad Tahun Kewangan Berakhir 31 Mac 2018 Dana Berkaitan Pelaburan236
2018
Nilai saksama Jumlah Kos Nilai saksama sebagai % Unit RM RM daripada NAB
FVTPL:
Sekuriti ekuiti disebut
Pembinaan
Econpile Holdings Berhad 253,750 298,958 249,944 1.57%
Econpile Holdings Berhad – Waran 50,750 – 9,135 0.06%
Gamuda Berhad 45,200 222,365 234,136 1.47%
Gamuda Berhad – Waran 8,150 2,038 9,698 0.06%
IJM Corporation Berhad 111,400 371,932 298,552 1.87%
Sunway Construction Group Berhad 123,100 218,400 253,586 1.59%
Pengguna
Padini Holdings Berhad 35,500 139,225 158,685 0.99%
Kewangan
CIMB Group Holdings Berhad 113,711 634,516 817,582 5.12%
Hong Leong Bank Berhad 25,900 440,219 486,920 3.05%
Malayan Banking Berhad 149,229 1,276,048 1,581,827 9.91%
Public Bank Berhad 55,700 1,011,038 1,336,800 8.38%
Produk Perindustrian
Denko Industrial Corporation Berhad 129,400 201,633 207,040 1.30%
DRB-Hicom Berhad 34,900 62,719 85,156 0.53%
Hartalega Holdings Berhad 36,800 153,238 222,640 1.39%
Petron Malaysia Refining & Marketing Bhd 13,200 136,069 113,388 0.71%
Petronas Chemicals Group Berhad 98,100 733,037 810,306 5.08%
Top Glove Corporation Bhd 26,400 131,689 254,496 1.59%
Uchi Technologies Bhd 48,100 159,146 128,427 0.80%
V.S Industry Berhad 191,500 347,580 453,855 2.84%
Wah Seong Corporation Berhad 100,100 107,533 145,145 0.91%
Nota-nota kepada Maklumat Kewangan (Sambungan)
3. Pelaburan (Sambungan)
(xi) Dana AmMetLife Dividend (Sambungan)
Komposisi, kos dan nilai saksama pelaburan FVTPL di Malaysia pada 31 Mac 2018 dinyatakan di bawah:

AmMetLife Insurance Berhad Laporan Tahunan Bagi Dana Berkaitan Pelaburan Tahun Kewangan Berakhir 31 Mac 2018
Laporan Tahunan Bagi AmMetLife Insurance Berhad Tahun Kewangan Berakhir 31 Mac 2018 Dana Berkaitan Pelaburan 237
2018
Nilai saksama Jumlah Kos Nilai saksama sebagai % Unit RM RM daripada NAB
FVTPL: (Sambungan)
Sekuriti ekuiti disebut (Sambungan)
Perladangan
Kuala Lumpur Kepong Berhad 9,200 214,712 235,336 1.47%
Sime Darby Plantation Berhad 49,167 248,038 271,402 1.70%
Teknologi
Globetronics Technology Berhad 53,100 241,026 215,586 1.35%
Inari Amertron Berhad 119,400 183,831 328,350 2.06%
Dagangan & Perkhidmatan
AirAsia Berhad 76,300 233,324 299,859 1.88%
Axiata Group Berhad 102,339 534,306 557,747 3.49%
Bermaz Auto Berhad 156,300 341,035 337,608 2.12%
Bumi Armada Berhad 183,900 163,195 153,557 0.96%
Dialog Group Berhad 126,900 212,864 389,583 2.44%
Genting Berhad 64,200 538,283 560,466 3.51%
Genting Malaysia Berhad 25,900 120,604 126,910 0.80%
My E.G. Services Berhad 60,100 129,268 174,290 1.09%
Mynews Holdings Berhad 15,800 18,614 22,910 0.14%
Serba Dinamik Holdings Berhad 138,400 474,550 473,328 2.97%
Sime Darby Berhad 49,167 82,150 129,801 0.81%
Telekom Malaysia Berhad 35,200 224,223 183,744 1.15%
Tenaga Nasional Berhad 93,800 1,089,030 1,523,312 9.54%
11,696,436 13,841,107 86.72%
Dana amanah saham dan harta tanah disebut
KLCC Real Estate Investment Trust 21,000 164,587 150,570 0.94%
Jumlah pelaburan pada FVTPL 11,861,023 13,991,677 87.66%
(xi) Dana AmMetLife Dividend (Sambungan)

AmMetLife Insurance Berhad Laporan Tahunan Bagi Dana Berkaitan Pelaburan Tahun Kewangan Berakhir 31 Mac 2018
Laporan Tahunan Bagi AmMetLife Insurance Berhad Tahun Kewangan Berakhir 31 Mac 2018 Dana Berkaitan Pelaburan238
2018 2017 RM RM
Pada awal tahun 167,567 90,472
Diiktiraf dalam Penyata Pendapatan dan Perbelanjaan (Nota 8) 82,249 77,095 Pada akhir tahun 249,816 167,567
2018 2017 RM RM
Pada awal tahun (12,354) (34,926)
Diiktiraf dalam Penyata Pendapatan dan Perbelanjaan (Nota 8) (4,712) 22,572 Pada akhir tahun (17,066) (12,354)
(ii) Dana AmMetLife Bond
2018 2017 RM RM
Pada awal tahun 129,736 28,167
Diiktiraf dalam Penyata Pendapatan dan Perbelanjaan (Nota 8) 62,625 101,569 Pada akhir tahun 192,361 129,736
(iii) Dana AmMetLife Balanced
2018 2017 RM RM
Pada awal tahun 109,292 52,749
Diiktiraf dalam Penyata Pendapatan dan Perbelanjaan (Nota 8) 4,094 56,543 Pada akhir tahun 113,386 109,292
(iv) Dana AmMetLife Dana Teguh
Nota-nota kepada Maklumat Kewangan (Sambungan)
4. Cukai tertunda Liabiliti/(aset) cukai tertunda adalah berkaitan dengan laba/(rugi) modal tidak terealisasi di atas pelaburan dana-dana
masing-masing.
(i) Dana AmMetLife Equity

AmMetLife Insurance Berhad Laporan Tahunan Bagi Dana Berkaitan Pelaburan Tahun Kewangan Berakhir 31 Mac 2018
Laporan Tahunan Bagi AmMetLife Insurance Berhad Tahun Kewangan Berakhir 31 Mac 2018 Dana Berkaitan Pelaburan 239
2018 2017 RM RM
Pada awal tahun 15,448 8,127
Diiktiraf dalam Penyata Pendapatan dan Perbelanjaan (Nota 8) (10,515) 7,321 Pada akhir tahun 4,933 15,448
(vi) Dana AmMetLife Asia Pacific REITS
2018 2017 RM RM
Pada awal tahun 10,139 44,458
Diiktiraf dalam Penyata Pendapatan dan Perbelanjaan (Nota 8) (42,681) (34,319) Pada akhir tahun (32,542) 10,139
2018 2017 RM RM
Pada awal tahun 22,235 1,949
Diiktiraf dalam Penyata Pendapatan dan Perbelanjaan (Nota 8) 6,466 20,286 Pada akhir tahun 28,701 22,235
(vii) Dana AmMetLife Global Emerging Market
2018 2017 RM RM
Pada awal tahun 4,140 2,646
Diiktiraf dalam Penyata Pendapatan dan Perbelanjaan (Nota 8) (1,339) 1,494 Pada akhir tahun 2,801 4,140
(viii) Dana AmMetLife Tactical Bond
(v) Dana AmMetLife Oasis Islamic Equity

AmMetLife Insurance Berhad Laporan Tahunan Bagi Dana Berkaitan Pelaburan Tahun Kewangan Berakhir 31 Mac 2018
Laporan Tahunan Bagi AmMetLife Insurance Berhad Tahun Kewangan Berakhir 31 Mac 2018 Dana Berkaitan Pelaburan240
2018 2017 RM RM
Pada awal tahun (233,973) (279,301)
Diiktiraf dalam Penyata Pendapatan dan Perbelanjaan (Nota 8) (14,983) 45,328 Pada akhir tahun (248,956) (233,973)
2018 2017 RM RM
Pada awal tahun 31,933 8,327
Diiktiraf dalam Penyata Pendapatan dan Perbelanjaan (Nota 8) (2,658) 23,606 Pada akhir tahun 29,275 31,933
(x) Dana AmMetLife Global Agribusiness
2018 2017 RM RM
Pada awal tahun 113,588 67,697
Diiktiraf dalam Penyata Pendapatan dan Perbelanjaan (Nota 8) 56,864 45,891 Pada akhir tahun 170,452 113,588
(xi) Dana AmMetLife Dividend
Nota-nota kepada Maklumat Kewangan (Sambungan)
4. Cukai tertunda (Sambungan)
(ix) Dana AmMetLife Precious Metals

AmMetLife Insurance Berhad Laporan Tahunan Bagi Dana Berkaitan Pelaburan Tahun Kewangan Berakhir 31 Mac 2018
Laporan Tahunan Bagi AmMetLife Insurance Berhad Tahun Kewangan Berakhir 31 Mac 2018 Dana Berkaitan Pelaburan 241
5. Modal para pemegang unit
(i) Dana AmMetLife Equity
(ii) Dana AmMetLife Bond
2018 2017
Jumlah Jumlah Unit RM Unit RM
Amaun diterima bagi penerbitan semasa tahun tersebut 4,559,620 11,142,198 3,114,522 8,183,288
Amaun dibayar bagi pembatalan disebabkan oleh serahan semasa tahun tersebut (2,389,232) (8,682,900) (2,093,830) (7,162,758) 2,170,388 2,459,298 1,020,692 1,020,530 Modal para pemegang unit dibawa ke hadapan 21,174,271 22,470,571 20,153,579 20,346,140
Lebihan pendapatan daripada perbelanjaan selepas cukai – 2,517,346 – 1,103,901 23,344,659 27,447,215 21,174,271 22,470,571
Nilai aset bersih seunit pada 31 Mac 1.1757 1.0612
2018 2017
Jumlah Jumlah Unit RM Unit RM
Amaun diterima bagi penerbitan semasa tahun tersebut 1,920,282 3,730,927 2,228,213 3,602,125
Amaun dibayar bagi pembatalan disebabkan oleh serahan semasa tahun tersebut (2,648,652) (4,354,429) (4,164,865) (5,231,304) (728,370) (623,502) (1,936,652) (1,629,179) Modal para pemegang unit dibawa ke hadapan 12,524,097 10,670,049 14,460,749 11,904,335
Lebihan pendapatan daripada perbelanjaan selepas cukai – 331,714 – 394,893 11,795,727 10,378,261 12,524,097 10,670,049
Nilai aset bersih seunit pada 31 Mac 0.8798 0.8520

AmMetLife Insurance Berhad Laporan Tahunan Bagi Dana Berkaitan Pelaburan Tahun Kewangan Berakhir 31 Mac 2018
Laporan Tahunan Bagi AmMetLife Insurance Berhad Tahun Kewangan Berakhir 31 Mac 2018 Dana Berkaitan Pelaburan242
2018 2017
Jumlah Jumlah Unit RM Unit RM
Amaun diterima bagi penerbitan semasa tahun tersebut 3,217,133 9,369,120 2,717,567 7,124,184
Amaun dibayar bagi pembatalan disebabkan oleh serahan semasa tahun tersebut (2,364,292) (8,399,467) (2,579,809) (6,989,974) 852,841 969,653 137,758 134,210 Modal para pemegang unit dibawa ke hadapan 22,739,174 23,442,455 22,601,416 22,243,302
Lebihan pendapatan daripada perbelanjaan selepas cukai – 2,159,900 – 1,064,943 23,592,015 26,572,008 22,739,174 23,442,455
Nilai aset bersih seunit pada 31 Mac 1.1263 1.0309
2018 2017
Jumlah Jumlah Unit RM Unit RM
Amaun diterima bagi penerbitan semasa tahun tersebut 2,817,584 7,118,683 1,457,502 4,806,600
Amaun dibayar bagi pembatalan disebabkan oleh serahan semasa tahun tersebut (2,562,284) (6,788,581) (2,263,867) (5,675,856) 255,300 330,102 (806,365) (869,256) Modal para pemegang unit dibawa ke hadapan 17,081,405 19,319,513 17,887,770 19,370,004
Lebihan pendapatan daripada perbelanjaan selepas cukai – 1,131,391 – 818,765 17,336,705 20,781,006 17,081,405 19,319,513
Nilai aset bersih seunit pada 31 Mac 1.1987 1.1310
(iv) Dana AmMetLife Dana Teguh
Nota-nota kepada Maklumat Kewangan (Sambungan)
5. Modal para pemegang unit (Sambungan)
(iii) Dana AmMetLife Balanced

AmMetLife Insurance Berhad Laporan Tahunan Bagi Dana Berkaitan Pelaburan Tahun Kewangan Berakhir 31 Mac 2018
Laporan Tahunan Bagi AmMetLife Insurance Berhad Tahun Kewangan Berakhir 31 Mac 2018 Dana Berkaitan Pelaburan 243
(v) Dana AmMetLife Oasis Islamic Equity
2018 2017
Jumlah Jumlah Unit RM Unit RM
Amaun diterima bagi penerbitan semasa tahun tersebut 3,559,172 3,473,654 854,724 1,056,820
Amaun dibayar bagi pembatalan disebabkan oleh serahan semasa tahun tersebut (422,857) (1,377,640) (483,005) (812,333) 3,136,315 2,096,014 371,719 244,487 Modal para pemegang unit dibawa ke hadapan 1,906,595 1,303,203 1,534,876 921,290
(Defisit)/lebihan pendapatan daripada perbelanjaan selepas cukai – (95,384) – 137,426 5,042,910 3,303,833 1,906,595 1,303,203
Nilai aset bersih seunit pada 31 Mac 0.6551 0.6835
(vi) Dana AmMetLife Asia Pacific REITS
2018 2017
Jumlah Jumlah Unit RM Unit RM
Amaun diterima bagi penerbitan semasa tahun tersebut 898,002 594,384 516,256 614,364
Amaun dibayar bagi pembatalan disebabkan oleh serahan semasa tahun tersebut (1,273,843) (844,160) (1,113,838) (992,108) (375,841) (249,776) (597,582) (377,744) Modal para pemegang unit dibawa ke hadapan 6,338,719 4,153,455 6,936,301 3,942,629
(Defisit)/lebihan pendapatan daripada perbelanjaan selepas cukai – (291,537) – 588,570 5,962,878 3,612,142 6,338,719 4,153,455
Nilai aset bersih seunit pada 31 Mac 0.6058 0.6553

AmMetLife Insurance Berhad Laporan Tahunan Bagi Dana Berkaitan Pelaburan Tahun Kewangan Berakhir 31 Mac 2018
Laporan Tahunan Bagi AmMetLife Insurance Berhad Tahun Kewangan Berakhir 31 Mac 2018 Dana Berkaitan Pelaburan244
2018 2017
Jumlah Jumlah Unit RM Unit RM
Amaun diterima bagi penerbitan semasa tahun tersebut 2,665,491 2,317,524 117,801 96,093
Amaun dibayar bagi pembatalan disebabkan oleh serahan semasa tahun tersebut (139,905) (541,498) (95,581) (80,859) 2,525,586 1,776,026 22,220 15,234 Modal para pemegang unit dibawa ke hadapan 1,822,190 1,176,955 1,799,970 925,335
Lebihan pendapatan daripada perbelanjaan selepas cukai – 77,615 – 236,386 4,347,776 3,030,596 1,822,190 1,176,955
Nilai aset bersih seunit pada 31 Mac 0.6970 0.6459
2018 2017
Jumlah Jumlah Unit RM Unit RM
Amaun diterima bagi penerbitan semasa tahun tersebut 779,028 799,751 383,863 433,451
Amaun dibayar bagi pembatalan disebabkan oleh serahan semasa tahun tersebut (351,150) (546,780) (170,835) (311,097) 427,878 252,971 213,028 122,354 Modal para pemegang unit dibawa ke hadapan 1,208,818 705,801 995,790 545,141
Lebihan pendapatan daripada perbelanjaan selepas cukai – 11,656 – 38,306 1,636,696 970,428 1,208,818 705,801
Nilai aset bersih seunit pada 31 Mac 0.5929 0.5839
(viii) Dana AmMetLife Tactical Bond
Nota-nota kepada Maklumat Kewangan (Sambungan)
5. Modal para pemegang unit (Sambungan)
(vii) Dana AmMetLife Global Emerging Market

AmMetLife Insurance Berhad Laporan Tahunan Bagi Dana Berkaitan Pelaburan Tahun Kewangan Berakhir 31 Mac 2018
Laporan Tahunan Bagi AmMetLife Insurance Berhad Tahun Kewangan Berakhir 31 Mac 2018 Dana Berkaitan Pelaburan 245
2018 2017
Jumlah Jumlah Unit RM Unit RM
Amaun diterima bagi penerbitan semasa tahun tersebut 2,329,233 508,585 1,793,963 853,037
Amaun dibayar bagi pembatalan disebabkan oleh serahan semasa tahun tersebut (3,328,588) (796,584) (1,927,233) (924,264) (999,355) (287,999) (133,270) (71,227) Modal para pemegang unit dibawa ke hadapan 14,543,625 4,129,638 14,676,895 3,819,735
(Defisit)/lebihan pendapatan daripada perbelanjaan selepas cukai – (523,920) – 381,130 13,544,270 3,317,719 14,543,625 4,129,638
Nilai aset bersih seunit pada 31 Mac 0.2450 0.2839
2018 2017
Jumlah Jumlah Unit RM Unit RM
Amaun diterima bagi penerbitan semasa tahun tersebut 351,855 422,072 372,209 468,280
Amaun dibayar bagi pembatalan disebabkan oleh serahan semasa tahun tersebut (238,010) (345,122) (455,314) (523,287) 113,845 76,950 (83,105) (55,007) Modal para pemegang unit dibawa ke hadapan 3,392,692 2,264,212 3,475,797 2,025,933
(Defisit)/lebihan pendapatan daripada perbelanjaan selepas cukai – (25,919) – 293,286 3,506,537 2,315,243 3,392,692 2,264,212
Nilai aset bersih seunit pada 31 Mac 0.6603 0.6674
(x) Dana AmMetLife Global Agribusiness
(ix) Dana AmMetLife Precious Metals

AmMetLife Insurance Berhad Laporan Tahunan Bagi Dana Berkaitan Pelaburan Tahun Kewangan Berakhir 31 Mac 2018
Laporan Tahunan Bagi AmMetLife Insurance Berhad Tahun Kewangan Berakhir 31 Mac 2018 Dana Berkaitan Pelaburan246
2018 2017
Jumlah Jumlah Unit RM Unit RM
Amaun diterima bagi penerbitan semasa tahun tersebut 1,266,274 2,332,544 1,288,555 1,577,157
Amaun dibayar bagi pembatalan disebabkan oleh serahan semasa tahun tersebut (1,982,681) (2,868,133) (1,337,599) (1,609,794) (716,407) (535,589) (49,044) (32,637) Modal para pemegang unit dibawa ke hadapan 20,061,936 14,803,212 20,110,980 14,084,122
Lebihan pendapatan daripada perbelanjaan selepas cukai – 1,693,853 – 751,727 19,345,529 15,961,476 20,061,936 14,803,212
Nilai aset bersih seunit pada 31 Mac 0.8251 0.7379
Nota-nota kepada Maklumat Kewangan (Sambungan)
5. Modal para pemegang unit (Sambungan)
(xi) Dana AmMetLife Dividend

AmMetLife Insurance Berhad Laporan Tahunan Bagi Dana Berkaitan Pelaburan Tahun Kewangan Berakhir 31 Mac 2018
Laporan Tahunan Bagi AmMetLife Insurance Berhad Tahun Kewangan Berakhir 31 Mac 2018 Dana Berkaitan Pelaburan 247
6. Pendapatan faedah
Dana AmMetLife Equity Dana AmMetLife Bond
2018 2017 2018 2017 RM RM RM RM
Pendapatan faedah daripada: Deposit dengan institusi kewangan berlesen 80,548 63,386 42,702 38,235
Bon korporat – – 503,139 540,882
80,548 63,386 545,841 579,117
Dana AmMetLife Balanced Dana AmMetLife Dana Teguh
2018 2017 2018 2017 RM RM RM RM
Pendapatan faedah daripada: Deposit dengan institusi kewangan berlesen 75,042 103,932 91,006 127,627
Bon korporat 260,665 277,731 185,570 165,152
335,707 381,663 276,576 292,779
Dana AmMetLife Dana AmMetLife Oasis Islamic Equity Asia Pacific REITS
2018 2017 2018 2017 RM RM RM RM
Pendapatan faedah daripada: Deposit dengan institusi kewangan berlesen 7,113 8,340 4,082 2,705
Dana AmMetLife Dana AmMetLife Global Emerging Market Tactical Bond
2018 2017 2018 2017 RM RM RM RM
Pendapatan faedah daripada: Deposit dengan institusi kewangan berlesen 4,602 2,059 1,980 1,509

AmMetLife Insurance Berhad Laporan Tahunan Bagi Dana Berkaitan Pelaburan Tahun Kewangan Berakhir 31 Mac 2018
Laporan Tahunan Bagi AmMetLife Insurance Berhad Tahun Kewangan Berakhir 31 Mac 2018 Dana Berkaitan Pelaburan248
Dana AmMetLife Dana AmMetLife Precious Metals Global Agribusiness
2018 2017 2018 2017 RM RM RM RM
Pendapatan faedah daripada: Deposit dengan institusi kewangan berlesen 6,182 8,417 6,584 6,319
Dana AmMetLife Dividend
2018 2017 RM RM
Pendapatan faedah daripada: Deposit dengan institusi kewangan berlesen 41,146 38,404
Nota-nota kepada Maklumat Kewangan (Sambungan)
6. Pendapatan faedah (Sambungan)

AmMetLife Insurance Berhad Laporan Tahunan Bagi Dana Berkaitan Pelaburan Tahun Kewangan Berakhir 31 Mac 2018
Laporan Tahunan Bagi AmMetLife Insurance Berhad Tahun Kewangan Berakhir 31 Mac 2018 Dana Berkaitan Pelaburan 249
Dana AmMetLife Equity Dana AmMetLife Bond
2018 2017 2018 2017 RM RM RM RM
Dividen kasar daripada: Sekuriti ekuiti disebut di Malaysia 709,725 556,540 – –
Dana amanah saham dan harta tanah disebut di Malaysia 25,858 11,053 – –
Dana amanah saham dan harta tanah tak disebut di Malaysia – – 2,483 20,668
735,583 567,593 2,483 20,668
Dana AmMetLife Balanced Dana AmMetLife Dana Teguh
2018 2017 2018 2017 RM RM RM RM
Dividen kasar daripada: Sekuriti ekuiti disebut di Malaysia 529,498 407,345 336,004 282,461
Dana amanah saham dan harta tanah disebut di Malaysia 17,795 9,050 9,780 –
Dana amanah saham dan harta tanah tak disebut di Malaysia – – 44,362 30,454
547,293 416,395 390,146 312,915
Dana AmMetLife Dana AmMetLife Oasis Islamic Equity Asia Pacific REITS
2018 2017 2018 2017 RM RM RM RM
Dividen kasar daripada: Dana amanah saham dan harta tanah tak disebut di Malaysia 197,119 949,330 29,260 46,044
7. Pendapatan dividen

AmMetLife Insurance Berhad Laporan Tahunan Bagi Dana Berkaitan Pelaburan Tahun Kewangan Berakhir 31 Mac 2018
Laporan Tahunan Bagi AmMetLife Insurance Berhad Tahun Kewangan Berakhir 31 Mac 2018 Dana Berkaitan Pelaburan250
Dana AmMetLife Dana AmMetLife Global Emerging Market Tactical Bond
2018 2017 2018 2017 RM RM RM RM
Dividen kasar daripada: Dana amanah saham dan harta tanah tak disebut di Malaysia 2,671 2,272 29,573 25,276
Dana AmMetLife Dividend
2018 2017 RM RM
Dividen kasar daripada: Sekuriti ekuiti disebut di Malaysia 453,291 387,100
Dana amanah saham dan harta tanah disebut di Malaysia 14,854 7,578
468,145 394,678
Nota-nota kepada Maklumat Kewangan (Sambungan)
7. Pendapatan dividen (Sambungan)

AmMetLife Insurance Berhad Laporan Tahunan Bagi Dana Berkaitan Pelaburan Tahun Kewangan Berakhir 31 Mac 2018
Laporan Tahunan Bagi AmMetLife Insurance Berhad Tahun Kewangan Berakhir 31 Mac 2018 Dana Berkaitan Pelaburan 251
Dana AmMetLife Equity Dana AmMetLife Bond
2018 2017 2018 2017 RM RM RM RM
Cukai pendapatan Malaysia: Peruntukan tahun semasa 104,236 (4,005) 44,351 53,326
Cukai tertunda: Berkaitan dengan pengasalan dan penarikbalikan perbezaan sementara (Nota 4) 82,249 77,095 (4,712) 22,572
Belanja cukai bagi tahun tersebut 186,485 73,090 39,639 75,898
Dana AmMetLife Balanced Dana AmMetLife Dana Teguh
2018 2017 2018 2017 RM RM RM RM
Cukai pendapatan Malaysia: Peruntukan tahun semasa 108,774 36,549 82,878 27,926
Cukai tertunda: Berkaitan dengan pengasalan dan penarikbalikan perbezaan sementara (Nota 4) 62,625 101,569 4,094 56,543
Belanja cukai bagi tahun tersebut 171,399 138,118 86,972 84,469
Dana AmMetLife Dana AmMetLife Oasis Islamic Equity Asia Pacific REITS
2018 2017 2018 2017 RM RM RM RM
Cukai pendapatan Malaysia: Peruntukan tahun semasa (51) 2,586 392 1,178
Cukai tertunda: Berkaitan dengan pengasalan dan penarikbalikan perbezaan sementara (Nota 4) (42,681) (34,319) (10,515) 7,321
(Kredit)/belanja cukai bagi tahun tersebut (42,732) (31,733) (10,123) 8,499
8. Cukai
8. Cukai (Sambungan)
Nota-nota kepada Maklumat Kewangan (Sambungan)

AmMetLife Insurance Berhad Laporan Tahunan Bagi Dana Berkaitan Pelaburan Tahun Kewangan Berakhir 31 Mac 2018
Laporan Tahunan Bagi AmMetLife Insurance Berhad Tahun Kewangan Berakhir 31 Mac 2018 Dana Berkaitan Pelaburan252
Dana AmMetLife Dana AmMetLife Global Emerging Market Tactical Bond
2018 2017 2018 2017 RM RM RM RM
Cukai pendapatan Malaysia: Peruntukan tahun semasa 368 371 327 122
Cukai tertunda: Berkaitan dengan pengasalan dan penarikbalikan perbezaan sementara (Nota 4) 6,466 20,286 (1,339) 1,494
Belanja/(kredit) cukai bagi tahun tersebut 6,834 20,657 (1,012) 1,616
Dana AmMetLife Dividend
2018 2017 RM RM
Cukai pendapatan Malaysia: Peruntukan tahun semasa 69,481 3,422
Cukai tertunda: Berkaitan dengan pengasalan dan penarikbalikan perbezaan sementara (Nota 4) 56,864 45,891
Belanja cukai bagi tahun tersebut 126,345 49,313
Dana AmMetLife Dana AmMetLife Precious Metals Global Agribusiness
2018 2017 2018 2017 RM RM RM RM
Cukai pendapatan Malaysia: Peruntukan tahun semasa (30,300) (11,760) 526 2,030
Cukai tertunda: Berkaitan dengan pengasalan dan penarikbalikan perbezaan sementara (Nota 4) (14,983) 45,328 (2,658) 23,606
(Kredit)/belanja cukai bagi tahun tersebut (45,283) 33,568 (2,132) 25,636
Kadar cukai keatas dana-dana adalah berkaitan dengan pendapatan pelaburan yang diterima dan keuntungan atas pelupusan pelaburan semasa tahun/tempoh tersebut, pada kadar cukai keutamaan 8% menurut kaedah yang telah ditetapkan di bawah Akta Cukai Pendapatan, 1967 untuk perniagaan insurans hayat.
Nota-nota kepada Maklumat Kewangan (Sambungan)
8. Cukai (Sambungan)

AmMetLife Insurance Berhad Laporan Tahunan Bagi Dana Berkaitan Pelaburan Tahun Kewangan Berakhir 31 Mac 2018
Laporan Tahunan Bagi AmMetLife Insurance Berhad Tahun Kewangan Berakhir 31 Mac 2018 Dana Berkaitan Pelaburan 253
Dana AmMetLife Equity Dana AmMetLife Bond
2018 2017 2018 2017 RM RM RM RM
Lebihan pendapatan daripada perbelanjaan sebelum cukai 2,703,831 1,176,991 371,353 470,791
Cukai pada kadar cukai Malaysia sebanyak 8% 216,306 94,159 29,708 37,663
Pendapatan tidak tertakluk kepada cukai (58,846) (45,178) 1,456 29,176
Perbelanjaan tidak boleh potong untuk tujuan cukai 29,025 24,109 8,475 9,059
186,485 73,090 39,639 75,898
Dana AmMetLife Balanced Dana AmMetLife Dana Teguh
2018 2017 2018 2017 RM RM RM RM
Lebihan pendapatan daripada perbelanjaan sebelum cukai 2,331,299 1,203,061 1,218,363 903,234
Cukai pada kadar cukai Malaysia sebanyak 8% 186,504 96,245 97,469 72,259
Pendapatan tidak tertakluk kepada cukai (42,159) 18,403 (31,212) (6,949)
Perbelanjaan tidak boleh potong untuk tujuan cukai 27,054 23,470 20,715 19,159
171,399 138,118 86,972 84,469
Dana AmMetLife Dana AmMetLife Oasis Islamic Equity Asia Pacific REITS
2018 2017 2018 2017 RM RM RM RM
(Defisit)/lebihan pendapatan daripada perbelanjaan sebelum cukai (334,269) 556,837 (105,507) 145,925
Cukai pada kadar cukai Malaysia sebanyak 8% (26,742) 44,547 (8,441) 11,674
Pendapatan tidak tertakluk kepada cukai (16,632) (76,900) (2,340) (3,702)
Perbelanjaan tidak boleh potong untuk tujuan cukai 642 620 658 527
(42,732) (31,733) (10,123) 8,499
Satu penyesuaian perbelanjaan cukai pendapatan yang dikenakan kepada lebihan/(defisit) pendapatan berbanding perbelanjaan sebelum cukai pada kadar cukai pendapatan yang dikenakan kepada dana-dana berkaitan pelaburan, kepada perbelanjaan cukai pendapatan pada kadar cukai pendapatan efektif, adalah seperti berikut:

AmMetLife Insurance Berhad Laporan Tahunan Bagi Dana Berkaitan Pelaburan Tahun Kewangan Berakhir 31 Mac 2018
Laporan Tahunan Bagi AmMetLife Insurance Berhad Tahun Kewangan Berakhir 31 Mac 2018 Dana Berkaitan Pelaburan254
Dana AmMetLife Dana AmMetLife Global Emerging Market Tactical Bond
2018 2017 2018 2017 RM RM RM RM
Lebihan pendapatan daripada perbelanjaan sebelum cukai 84,449 257,043 10,644 39,922
Cukai pada kadar cukai Malaysia sebanyak 8% 6,756 20,563 852 3,194
Pendapatan tidak tertakluk kepada cukai (582) (392) (2,366) (2,033)
Perbelanjaan tidak boleh potong untuk tujuan cukai 660 486 502 455
6,834 20,657 (1,012) 1,616
Dana AmMetLife Dana AmMetLife Precious Metals Global Agribusiness
2018 2017 2018 2017 RM RM RM RM
(Defisit)/lebihan pendapatan daripada perbelanjaan sebelum cukai (569,203) 414,698 (28,051) 318,922
Cukai pada kadar cukai Malaysia sebanyak 8% (45,536) 33,176 (2,244) 25,514
Pendapatan tidak tertakluk kepada cukai (761) (692) (526) (491)
Perbelanjaan tidak boleh potong untuk tujuan cukai 1,014 1,084 638 613
(45,283) 33,568 (2,132) 25,636
Dana AmMetLife Dividend
2018 2017 RM RM
Lebihan pendapatan daripada perbelanjaan sebelum cukai 1,820,198 801,040
Cukai pada kadar cukai Malaysia sebanyak 8% 145,616 64,083
Pendapatan tidak tertakluk kepada cukai (37,452) (31,307)
Perbelanjaan tidak boleh potong untuk tujuan cukai 18,181 16,537
126,345 49,313
Nota-nota kepada Maklumat Kewangan (Sambungan)
8. Cukai (Sambungan)

AmMetLife Insurance Berhad Laporan Tahunan Bagi Dana Berkaitan Pelaburan Tahun Kewangan Berakhir 31 Mac 2018
Laporan Tahunan Bagi AmMetLife Insurance Berhad Tahun Kewangan Berakhir 31 Mac 2018 Dana Berkaitan Pelaburan
HALAMAN INI SENGAJA DIBIARKAN
KOSONG

ammetlife.com
AmMetLife Insurance Berhad (15743-P)
Tingkat 20, Menara 1 Sentrum, No. 201, Jalan Tun Sambanthan, 50470 Kuala Lumpur, MalaysiaT 1300 88 8800 E [email protected]
Related Documents


![Comparative Analysis of Unit Linked Insurance Plans and Mutual Funds [Max_ Newyork] (2)](https://static.cupdf.com/doc/110x72/54122d4b7bef0a945d8b482b/comparative-analysis-of-unit-linked-insurance-plans-and-mutual-funds-max-newyork-2.jpg)


