Mémoire présenté en vue de l’obtention du grade de Docteur d'Oniris - École Nationale Vétérinaire Agroalimentaire et de l'Alimentation Nantes-Atlantique sous le sceau de l’Université Bretagne Loire École doctorale : Végétal, Environnement, Nutrition, Agroalimentaire, Mer Disciplines : Biochimie et biologie moléculaire section CNU 64, Biologie des populations et écologie section CNU 67, Biologie des organismes section CNU 68 Spécialités : Biochimie, biologie moléculaire et cellulaire, Biologie des organismes, Écologie et évolution, Génétique, génomique et bio-informatique, Microbiologie, virologie et parasitologie, Sciences de l'aliment Description et comportement des communautés bactériennes de la viande de poulet conservée sous atmosphère protectrice JURY Rapporteurs : Jean-Pierre GUYOT, Directeur de recherche, IRD, Montpellier, France Frédéric LEROY, Professeur, Université de Bruxelles, Belgique Examinateurs : Johanna BJORKROTH, Professeur, Université d’Helsinki, Finlande Pascal BONNARME, Directeur de recherche, INRA, Grignon, France Marie-Christine CHAMPOMIER-VERGES, Directrice de recherche, INRA, Jouy-en-Josas, France Directeur de Thèse : Monique ZAGOREC, Directrice de recherche, INRA/Oniris, Nantes, France Co-encadrants : Hervé PREVOST, Professeur, INRA/Oniris, Nantes, France Benoît REMENANT, Chargé de Projet, Anses, Angers, France Amélie ROUGER

Welcome message from author
This document is posted to help you gain knowledge. Please leave a comment to let me know what you think about it! Share it to your friends and learn new things together.
Transcript

Mémoire présenté en vue de l’obtention du
grade de Docteur d'Oniris - École Nationale Vétérinaire Agroalimentaire et de
l'Alimentation Nantes-Atlantique sous le sceau de l’Université Bretagne Loire
École doctorale : Végétal, Environnement, Nutrition, Agroalimentaire, Mer
Disciplines : Biochimie et biologie moléculaire section CNU 64, Biologie des populations et écologie section CNU
67, Biologie des organismes section CNU 68
Spécialités : Biochimie, biologie moléculaire et cellulaire, Biologie des organismes, Écologie et évolution,
Génétique, génomique et bio-informatique, Microbiologie, virologie et parasitologie, Sciences de l'aliment
Unité de recherche : UMR 1014 INRA-Oniris Secalim Sécurité des aliments et Microbiologie
Soutenue le 27 juin 2017
Description et comportement des communautés bactériennes de la viande de poulet conservée sous
atmosphère protectrice
JURY
Rapporteurs : Jean-Pierre GUYOT, Directeur de recherche, IRD, Montpellier, France
Frédéric LEROY, Professeur, Université de Bruxelles, Belgique
Examinateurs : Johanna BJORKROTH, Professeur, Université d’Helsinki, Finlande Pascal BONNARME, Directeur de recherche, INRA, Grignon, France Marie-Christine CHAMPOMIER-VERGES, Directrice de recherche, INRA, Jouy-en-Josas, France
Directeur de Thèse : Monique ZAGOREC, Directrice de recherche, INRA/Oniris, Nantes, France Co-encadrants : Hervé PREVOST, Professeur, INRA/Oniris, Nantes, France Benoît REMENANT, Chargé de Projet, Anses, Angers, France
Amélie ROUGER

A.Rouger 2017
1

A.Rouger 2017
2

A.Rouger 2017
3
« Tout obstacle renforce la détermination. Celui qui s'est fixé un but n'en change pas. »
Léonard De Vinci
Architecte, Artiste, Ingénieur, Peintre, Philosophe, Scientifique, Sculpteur (1452 - 1519)

A.Rouger 2017 Remerciements
4
A.Rouger 2017 Remerciements
5
Remerciements
Mes premiers remerciements vont à la région Pays de la Loire pour avoir financé ce projet. Merci
également à Marie-France Pilet directrice de l’unité Secalim dans laquelle j’ai effectué ce travail de
thèse. Merci d’avoir été à l’écoute, toujours disponible et de m’avoir dispensé tous ces bons conseils
qui m’ont permis de mener à bien ce doctorat.
Je tiens bien évidemment à exprimer ma gratitude aux membres du jury qui ont accepté d’examiner
mon travail de thèse, Jean-Pierre Guyot et Frédéric Leroy en tant que rapporteurs, Marie-Christine
Champomier-Verges, Johanna Björkroth et Pascal Bonnarme en tant qu’examinateurs. Merci
également à Stéphane Chaillou et Yves Leloir, membres de mon comité de suivi de thèse pour tous
leurs conseils et leurs remarques positives sur mon travail. Merci enfin à Marie De Lamballerie de
m’avoir prodigué ses conseils déjà en master, et d’avoir exécuté avec bienveillance ce rôle de tutrice
pour l’école EIR-Agreenium.
Ce projet n’aurait pas pu être mené à bien sans mes encadrants. Un grand merci à Benoit pour ta
patience et ta bienveillance quand j’ai appris à taper (malgré mon problème de MAJUSCULE!) mes
premières lignes de commandes. Sans toi pour m’accompagner, je n’aurais pas appris autant en bio-
analyses. Merci également à Hervé pour ses conseils et ses remarques constructives, qui m’ont permis
de prendre du recul sur les méthodes et sur le sujet. Et bien sûr un merci tout particulier pour ma
directrice de thèse Monique Zagorec. Ce serait trop long de lister toutes les qualités transmises durant
ces quelques années : la rigueur, la compassion, l’accompagnement à devenir une « grande », le
décryptage de l’écriture manuscrite et j’en passe. Je vais résumer par merci pour tout, tout ce que j’ai
appris, découvert, partagé. Je pense que je pourrais écrire autant de pages que dans ce manuscrit pour
décrire tous les intérêts et le positif d’avoir Monique comme directrice de thèse ; pour tout ça
merci.
I would like to thank my finish team which welcome me for 3 months: Johanna Björkroth at the head
of this team, thank you for your unbelievable hunting stories telling during coffee break. Thank you so
much to Jenni Hultman for all bioinformatics skills she transmitted to me during my stay and long time
after by email and skype. I would like to thank you also for your support for intensive interval body
sport sessions and your warm welcome. Thanks to Per Johansson for his crazy (scientific or not!) news
during the coffee break. Thank also to the technical staff, especially to Henna for her motivation for
kettlebell session
Je voudrais également remercier tous les personnels de l'unité Secalim, en commençant par l'équipe
technique, Valérie, Sandrine, Agnès, Nicolas, qui m'ont accompagnée lorsqu'il fallait découper du
poulet et ensemencer de nombreuses boîtes de Petri. Un merci particulier à Nicolas avec qui j’ai
« Tout, dans la vie, n’est qu’une question de détermination et de désir. Tout n’est qu’une question d’opportunités, de
rencontres et de chances à saisir. » Extrait de L'invention de nos vies de Karine Tuil.

A.Rouger 2017 Remerciements
6
« maniper » un peu plus, qui a accepté et adopté mes codes couleurs, les billes et mon organisation
parfois un peu maniaque. Merci pour ta bonne humeur !
Merci également à Isabelle notre gestionnaire avec qui j'ai souvent interagit pour différents problèmes
de commandes, évidemment urgentes, mais aussi pour des billets, des contrats et tout l’administratif ;
merci pour ta patience.
Merci aussi à Sandrine Guillou pour tous ces échanges, au détour d’une pause, que ce soit sur l'analyse
de mes données dans R ou les stats !
Je voudrais aussi dire toute ma sympathie à Laurent pour son écoute et sa disponibilité lors d’une
pause clope (sans cigarette !) souvent vitale. Merci pour tous les sujets abordés, pour ta bienveillance
et tes conseils, que ce soit d’un point de vue professionnel ou simplement personnel.
Une pensée pour mes collègues doc’, pas encore doc’ et presque doc’.
Une petite pensée pour les anciens doctorants qui ont soutenu leur thèse durant ma présence à
Secalim : Sabrina, Laure, Emilie, Stéphane, Rached, Ramila, Taous, Vicky. Merci pour toutes vos
expériences partagées, qui m’ont permis d’avancer à mon tour dans l’unité.
J’ai une pensée particulière pour les « futures » docteurs Géraldine (J-7 ! Défi relevé ! A ton tour !) et
Nassima (d’ici à la fin de l’année on ne lâche rien !). Merci pour ces moments passés ensemble dans ce
bureau des doc’, qui grâce à nous, a pris une petite touche féminine dans la déco. Bon courage à vous
pour la suite !
Je souhaite également plein de bonnes choses aux nouveaux doctorants de l’unité, en particulier
Benjamin et Juliana avec qui j'ai eu l'occasion de partir, de partager mon bureau quelques mois -
assurez bien la relève de la représentation des doc’ aux CU de l’unité. Bon courage pour la suite ! -
Merci encore aux postdocs de l'unité Alizée et à Raouf qui ont su être de bon conseil lors de la période
de rédaction. Un merci particulier à un ancien postdoc, Manu qui nous a apporté sa bonne humeur et
ses crêpes a-rhum-atisées dans ce bureau essentiellement féminin !
Une petite pensée pour Sophie, stagiaire à qui je l’espère j’ai fait découvrir le milieu de la recherche.
Merci pour ta bonne humeur et ton implication dans ce projet, ce qui m’a permis de découvrir le rôle
d’encadrant dans les meilleures conditions.
Un merci global à tous les autres membres de l'unité que j'ai côtoyés pendant ces presque 4 ans et que
je ne peux citer individuellement. Merci aux autres collègues du G5 avec qui nous avons pu partager
l'organisation du bâtiment. Et puis, une pensée pour les collègues de la Géraudière avec qui j'ai partagé
mes premiers pas en recherche, en stage et en doctorat.
Un merci tout particulier à Lysiane qui malgré la distance a su être présente dans les moments difficiles.
Ton soutien a été très appréciable! Merci d’avoir été là en congrès pour me dépanner en cosmétique
lorsque ma valise s’est perdue en Italie ! J’ai mis un peu plus de temps que toi mais on y est arrivé…
Well done baby Ecobiopro !
Il y a eu les collègues, mais ils y a eu aussi les copains qui m’ont soutenue pendant ce doctorat. Merci
à Elodie et Thomas d’avoir été présents dès que j’ai eu besoin de vous. Merci de votre soutien et de
« Cela semble toujours impossible jusqu’à ce qu’on y
arrive. » (N. Mandela)

A.Rouger 2017 Remerciements
7
vos encouragements. Merci aussi d’avoir élargi le cercle de copains avec votre petit Lucas, qui j’en suis
sûre lira ce manuscrit quand il aura des dents !! Une petite pensée pour Alban, qui est venu souvent
partager des moments avec nous (baby-shower, resto chinois, raclette !) et pour Fabien qui de temps
à autre, est venu nous raconté ses stages d’interne en médecine !
Il y a aussi les collègues qui sont devenues des amies n’est-ce pas, Marion et Emilie. Merci à vous les
filles d’avoir été là pour tout, le soutien, les encouragements, les bons conseils et les potins ! A
nouveau cela serait trop long de lister tous ces moments passés ensemble à refaire le monde et me
dire « tu verras quand ça sera ton tour… » et bien, je crois que ça y est, je peux enfin comprendre nos
discussions du vendredi soir au Jéroboam. Je n’oublie pas Thomas et François, que je remercie pour
avoir supporté nos « piapiapias » jusqu’à pas d’heure. Même si je redoute un peu la vengeance de
Thomas pour le petit poney, je veux quand même vous dire à tous les 4 un grand merci.
Merci également à mes copines Fit girls Géraldine et Mihanta, merci de m’avoir encouragée et portée
avec vous dans ces défis plus ou moins sportifs, la révélation de la course à pied, le TBC, le Miracle
Morning, mais aussi le chocolat, le welsh et les gaufres… Merci de votre bienveillance.
Enfin je ne serais pas là où je suis aujourd’hui sans mes parents et ma famille. A mes parents à qui je
n’ai pas souvent témoigné ma gratitude, je voudrais vous dire le plus grand des mercis. Vous avez cru
en moi et vous m’avez portée jusque-là. Je suis fière de la personne que je suis devenue grâce à vous
et je pense qu’aujourd’hui vous pouvez aussi être fiers de vous (et de moi !). Merci également à
Annabelle et Patrice de faire finalement partie de cette aventure ; malgré des débuts parfois difficiles,
je suis contente de vous avoir auprès de moi aujourd’hui. Un petit clin d’œil à Morgane qui occupera
toujours une place particulière dans mon cœur. Je voudrais également avoir une pensée particulière
pour mes grands-parents ; mamie Huguette merci pour tes petits chaussons réconfortants à enfiler en
rentrant du travail ; mamie Gilberte merci d’avoir toujours été présente et de t’être inquiétée (peut-
être trop!) pour moi; et à mes papis à qui je pense souvent.
Je voudrais encore remercier mon oncle pour ses corrections et ses conseils, pas seulement pendant
la période de rédaction mais depuis le début de mes études et encore aujourd’hui pour relire une lettre
de motivation ! Merci d’être toujours présent et disponible pour moi. Un mot pour Gilles tu as su
vulgariser mon sujet de thèse à ta manière, merci de toutes les bêtises racontées à ce sujet.
Enfin merci à mon Pelote qui m’a accompagnée au quotidien pendant ma thèse. Merci d’avoir partagé
avec moi les hauts et les bas qui jalonnent une thèse. Tu m’as soutenue, encouragée et aussi parfois
(souvent !) supportée, sans jamais cesser de m’aimer ; si j’y suis arrivée c’est aussi grâce à toi, pour
tout ça merci.
La partie remerciement n’est finalement pas la partie la plus facile à écrire, car j’aimerais n’avoir oublié
personne. Je remercie donc chaleureusement toutes les personnes que j’aurais omis de citer et qui ont
participé de près ou de loin, avec plus ou moins d’implication, d‘un point de vue professionnel ou non,
lors de ce projet de thèse.
Merci…
« Je n’échoue jamais, je réussi ou j’apprends ».
(N. Mandela)

A.Rouger 2017 Remerciements
8

A.Rouger 2017 Sommaire
9
Sommaire
Remerciements ....................................................................................................................................... 5
Sommaire ................................................................................................................................................ 9
Abréviations .......................................................................................................................................... 11
Tables des illustrations - Tableaux ........................................................................................................ 13
Tables des illustrations - Figures ........................................................................................................... 15
Introduction ........................................................................................................................................... 19
Chapitre 1 Synthèse bibliographique .................................................................................................... 23
1.1- La viande de poulet en quelques chiffres ............................................................................... 23
1.1.1- Production et consommation de la viande de volaille .................................................. 23
1.1.2- Production et consommation de la viande de volaille en France ................................. 24
1.1.3- Impact environnemental de la viande de volaille ......................................................... 25
1.1.4- Intérêt pour le consommateur ...................................................................................... 26
1.1.5- Choix du modèle d’étude : la viande de poulet ............................................................ 28
1.2- Revue bibliographique ............................................................................................................ 29
1.2.1- Préambule ........................................................................................................................... 29
1.2.2- Endogenous contaminations occurring on poultry meat: A review ................................... 29
1.2.3- Ce qu’il faut retenir de la revue ......................................................................................... 54
1.3- Microbiotes standards ............................................................................................................ 54
1.3.1- Pourquoi utiliser un microbiote standard ? ........................................................................ 54
1.3.2- Les pratiques utilisées en écologie microbienne ................................................................ 56
1.3.3- Challenge tests : inoculation sur des matrices pauci microbiennes ................................... 57
1.4- Méthodes utilisées en écologie microbienne / Approches omiques combinées ................... 58
1.4.1- Limites des milieux de cultures pour l’écologie microbienne ............................................. 58
1.4.2- Le pyroséquençage.............................................................................................................. 59
1.4.3- Biais liés à ces méthodes de séquençage ............................................................................ 61
1.4.4- Bio-analyse : pipelines et utilisation de bases de données ................................................. 65
1.4.5- Les travaux publiés en écologie microbienne des aliments ................................................ 67
1.4.6- Intérêt des approches « omiques » combinées .................................................................. 69
Chapitre 2 Mise au point d’un microbiote standard ............................................................................. 71
2.1- Préambule ............................................................................................................................... 71
2.2- A method to isolate bacterial communities and characterize ecosystems from food products: Validation and utilization in as a reproducible chicken meat model ................................................ 72
Abstract ......................................................................................................................................... 72
Introduction ................................................................................................................................... 73

A.Rouger 2017 Sommaire
10
Materials and methods ................................................................................................................. 76
Results and discussion ................................................................................................................... 80
Conclusion ..................................................................................................................................... 91
2.3- Ce qu’il faut retenir du chapitre 2 ........................................................................................... 92
Chapitre 3 Description de la diversité bactérienne ............................................................................... 93
3.1- Préambule ............................................................................................................................... 93
3.2- Diversity of bacterial communities in French chicken cuts stored under modified atmosphere packaging. .......................................................................................................................................... 93
Abstract ......................................................................................................................................... 93
Introduction ................................................................................................................................... 94
Materials and methods ................................................................................................................. 96
Results and discussion ................................................................................................................. 102
Conclusion ................................................................................................................................... 113
3.3- Ce qu’il faut retenir du chapitre 3 ......................................................................................... 115
Chapitre 4 Dynamique des écosystèmes microbiens .......................................................................... 117
4.1- Préambule ................................................................................................................................ 117
4.2- Optimizing storage parameter to manage chicken meat ecosystem stored under modified atmosphere packaging. ................................................................................................................... 117
Abstract ....................................................................................................................................... 118
4.2.1.Introduction ........................................................................................................................ 119
4.2.2. Materials and Methods ..................................................................................................... 120
4.2.3. Results ............................................................................................................................... 126
4.2.4.Discussion ........................................................................................................................... 149
4.3- Ce qu’il faut retenir du chapitre 4 ............................................................................................ 153
Discussion et perspectives .................................................................................................................. 157
Valorisation des travaux de thèse ....................................................................................................... 161
Annexe 1 Differentially expressed genes ............................................................................................ 165
Annexe 2 Test d’extraction d’ARN ....................................................................................................... 203
Annexe 3 Schéma du projet eNABLE ................................................................................................... 205
Références bibliographiques ............................................................................................................... 207

A.Rouger 2017 Abréviations
11
Abréviations
• AA Acetic Acid
• AB Agriculture Biologique
• ADN Acide Désoxyribonucléique
• ADNr Acide Désoxyribonucléique
ribosomique
• AFNOR NF Association française de
normalisation
• AHC Agglomerative hierarchical
clustering
• ANOVA Analysis of variance
• ANR Agence Nationale de la recherche
• ARN Acide Ribonucléique
• ASC Acidified Sodium Chlorite
• BHI Brain-Heart Infusion
• bp base pair
• BPA Baird-Parker Agar
• CA Citric Acid
• CCDA Charcoal Cefoperazone
Deoxycholate Agar
• CD Chlorine Dioxide;
• cDNA complementary
Deoxyribonucleic Acid
• CFC Cefalotin Fucidin Cetrimide;
• CFU Colony-Forming Units
• CGAAER Conseil général de
l'alimentation, de l'agriculture et des
espaces ruraux
• DLA Deoxycholate Lactose Agar;
• DLC Date Limite de Consommation
• DMSO dimethyl sulfoxide
• DNA Deoxyribonucleic Acid
• EBI European Bioinformatics Institute
• EBP EcoBioPro
• edta Ethylenediaminetetraacetic acid
• ENA European Nucleotide Archive
• EU European Union
• EURL Entreprise unipersonnelle à
responsabilité limitée
• FEMS Federation of European
Microbiological Societies
• FISH Hybridation in situ et microscopie
de fluorescence
• FROGS Find Rapidly OTUs with Galaxy
Solution
• FSIS Food Safety and Inspection
Service
• G Glutamal
• Gb Giga Byte
• Hab habitant
• IA Iron Agar
• ICFMH International Committee of
Food Microbiology and Hygiene
• INRA Institut National de la Recherche
Agronomique
• ISO Organisation Internationale de
normalisation
• ITAVI Institut Technique de
l'Aviculture
• kGy kilo gray
• KO Potassium Oleate
• LA Lactic Acid
• LAB Lactic Acid Bacteria
• LSD Least Significant difference
• LSV Laboratoire de la Santé des
Végétaux
• LUNAM L'Université Nantes Angers Le
Mans
• MALDI TOF MS Matrix Assisted Laser
Desorption Ionization-Time Of Flight
Mass Spectrometry
• MAP Modified atmosphere packaging
• Mb Mega bytes
• MG-RAST Metagenomic Rapid
Annotations using Subsystems
Technology
• MRS de Man Rogosa & Sharpe;

A.Rouger 2017
12
• MTEC Millions de Tonnes Equivalent
Carcasses
• NA not available
• NaCl Chlorure de sodium
• NCBI National Center for
Biotechnology Information
• NGS Next generation sequencing
• O2 dioxygen
• OECD/FAO Organization for Economic
Co-operation and Development/Food
and Agriculture Organization
• OTU Operational Taxonomic Units
• PA Peroxy Acids
• PAC BIO
• PCA Plate Count Agar
• PCoA Principal Coordinates Analysis
• PCR Polymerase Chain Reaction
• PCR DGGE Polymerase Chain Reaction
coupled with Denaturing Gradient Gel
Electrophoresis
• PCR TTGE Polymerase Chain Reaction
coupled with Temperature Gradient
Gel Electrophoresis
• pH potentiel hydrogène
• QALY quality-adjusted life years
• qPCR quantitative PCR
• RAPD PCR Random amplified
polymorphism DNA-PCR
• RDP Ribosomal Database Project
database
• REA-PFGE PCR Restriction
Endonuclease Analysis - Pulsed-Field
Gel electrophoresis PCR
• REP PCR Repetitive Element
palindromic PCR
• RFI Recherche-Formation-Innovation
• rpm revolution per minute
• RV Rappaport de Vassiliadis
• SDS PAGE Electrophorèse en Gel de
Polyacrylamide contenant du
dodécysulfate de sodium
• SRA Sequence Read Archive
• STAA Streptomycin Thallous Acetate
Agar
• Taq Pol Thermus aquaticus
Polymerase
• Tec Tonnes Equivalent Carcasses
• TS Tryptone Salt solution
• TSA Tryptone Soy Agar
• TSP TriSodium Phosphate
• TTI time temperature indicators
• TVC total viable count
• UBD Use-By Date
• UE Union Européenne
• UFC Unité Formant Colonie
• UMR Unité Mixte de Recherche
• USA United States of America
• VBNC Viable But Non Cultivable
• VRBG Violet Red Bile Glucose agar
• VRBL Violet Red Bile Lactose agar
• XLD Xylose Lysine Deoxycholate agar

A.Rouger 2017 Tables des illustrations - Tableaux
13
Tables des illustrations - Tableaux
Tableau 1 Quelques éléments de comparaison des élevages bovins porcins et de volailles ............... 25
Tableau 2 Récapitulatif des conditions d’élevage de volaille suivant les modes de production. ......... 26
Tableau 3 Comparaison des techniques de séquençage haut débit en fonction de la longueur des
lectures et du nombre de lectures par cycle de séquençage. ............................................................... 60
Tableau 4 Avantages et inconvénients des différentes technologies de séquençage à haut débit. .... 61
Tableau 5 Liste (non exhaustive) des études des microbiotes en science des aliments ...................... 67
Table 1 Examples of the three most reported methods for bacterial recovery from poultry meat
samples .................................................................................................................................................. 35
Table 2 Most commonly used media for microbiological analysis of poultry meat ............................. 37
Table 3 Target values and acceptable values for 3 types of bacterial populations depending on the
products and their storage conditions .................................................................................................. 38
Table 4 Time period to reach spoilage (i.e. 7 log CFU/g of total viable counts) depending on packaging
conditions. ............................................................................................................................................. 45
Table 5 Examples of chemical treatments tested and experimental designs ....................................... 47
Table 6 Values reported for various contaminants occurring on poultry meat. ................................... 49
Table 7 Enumeration of bacteria from spoiled chicken meat. .............................................................. 51
Table 8 Description of the 23 chicken leg samples used for microbiota collection. ............................. 75
Table 9 Comparison of recovery of bacteria and estimation of quality of DNA extraction using different
protocols ................................................................................................................................................ 82
Table 10 Concentration of DNA extracted from the bacterial stocks of the 23 samples and subsequent
PCR efficiency ........................................................................................................................................ 88
Table 11 Primers used in this study ....................................................................................................... 98
Table 12 Comparison of pipeline analysis for the different strategies tested in this study .................. 99
Table 13 Bacterial strains used and culture conditions ...................................................................... 101
Table 14 Number of reads identified at species level ......................................................................... 106
Table 15 Richness and diversity indices of the 10 microbial communities issued from chicken legs . 112
Table 16 Bacterial strains used and culture conditions. ..................................................................... 121
Table 17 Primers used in this study ..................................................................................................... 123
Table 18 List of genome species used in reference database of this study. ....................................... 135
Table 19 Summary of cDNA reads obtained per samples. .................................................................. 136
Table 20 Comparison of bacteria present and active depending on storage condition ..................... 150

A.Rouger 2017 Tables des illustrations - Tableaux
14

A.Rouger 2017 Tables des illustrations - Figures
15
Tables des illustrations - Figures
Figure 1 Schéma récapitulatif des travaux menés au cours du doctorat .............................................. 20
Figure 2 Production/consommation de viande de volailles par pays dans le monde en 2015. ........... 23
Figure 3 Consommation de viande de volaille en Europe en 2015. ...................................................... 24
Figure 4 Filière volaille de chair en France pour l'année 2015. ............................................................. 24
Figure 5 Volailles abattues en France en 2015. ..................................................................................... 25
Figure 6 Prix d’achats moyens des viandes par les ménages en 2014. ................................................. 27
Figure 7 Proportion de la production initiale de viande perdues ou gaspillées à différents stade de la
chaine de production et de consommation selon les zones géographiques ........................................ 28
Figure 8 Steps in poultry slaughtering and the associated contamination routes. .............................. 32
Figure 9 Dessin de l’humoriste vétérinaire Kastet représentant la complexité du microbiote intestinal
de l’homme. .......................................................................................................................................... 55
Figure 10 Procédure de traitement d’un échantillon en vue de l’analyse de la diversité bactérienne. 62
Figure 11 Procédure d'analyse des données de séquençage haut débit .............................................. 66
Figure 12 Méthodes de séquençage haut débit couramment utilisées pour caractériser la diversité
microbienne. ......................................................................................................................................... 70
Figure 13 Experimental design to set up an efficient and reliable method to collect and analyse a viable
bacterial community model characteristic of poultry cuts. .................................................................. 77
Figure 14 Efficiency of successive rinsing steps on the recovery of bacteria ........................................ 83
Figure 15 Total viable counts recovered per chicken leg. ..................................................................... 84
Figure 16 Composition and viability of bacterial communities from 9 samples of chicken legs before
and after frozen storage at -80 °C, determined by enumeration on various specific media. ............... 85
Figure 17 Supplementary Figure. Composition and viability of bacterial communities from 23 samples
of chicken legs before and after frozen storage at -80 °C, determined by enumeration on various
specific media. ....................................................................................................................................... 87
Figure 18 Principal component analysis of the 23 chicken leg microbiotas and PCR amplification from
their DNA. .............................................................................................................................................. 89
Figure 19 Challenge-tests of microbiotas E and U inoculated on chicken breast dices and incubated
under two different modified atmosphere packaging. ......................................................................... 90
Figure 20 Kinetics of B. thermosphacta and Pseudomonas sp. reimplantation monitored on specific
media after inoculation of microbiota E or U........................................................................................ 90
Figure 21 Rarefaction curves from 10 pyrosequencing data set. ....................................................... 103
A.Rouger 2017 Tables des illustrations - Figures
16
Figure 22 Relative abundance of bacterial genera in 3 different chicken legs samples (E, N and U) with
4 different analysis pipelines ............................................................................................................... 104
Figure 23 Relative abundance of bacterial genera in 10 chicken legs samples .................................. 105
Figure 24 Comparison of bacteria quantification by different methods ............................................ 110
Figure 25 Regression plots of quantification obtained by 3 different method ................................... 111
Figure 26 Experimental design of this study and methods used for NGS analysis. ............................ 122
Figure 27 Challenge-tests of microbiotas E and U inoculated on chicken breast dices and incubated
under modified atmosphere packaging A (70% O2 - 30% CO2) stored at 4°C. .................................... 126
Figure 28 Growth kinetics of B. thermosphacta (a), LAB (b) and Pseudomonas sp. (c) reimplantation
monitored on specific media after inoculation of microbiota E or U and storage under MAP A (70% O2
- 30% CO2) or MAP B (50% CO2 - 50% N2) or air C (~21% O2 - 78% N2). .............................................. 127
Figure 29 Evolution of gaseous composition in packages during storage of chicken meat at 4°C. .... 128
Figure 30 β diversity with Bray-Curtis dissimilarity index and visualization with PCoA ordination on the
normalized data ................................................................................................................................... 129
Figure 31 Relative abundance identified by meta-barcoding after inoculation of microbiota E (after 7
and 9 days) or microbiota U (after 7 days) under MAP A (70% O2 - 30% CO2) or MAP B (50% CO2 - 50%
N2) or air C (~21% O2 - 78% N2). ........................................................................................................... 130
Figure 32 Comparison of B. thermosphacta quantification by different methods. ............................ 131
Figure 33 Taxonomy assignation of 3 metagenomes annotated with MG-Rast server. ..................... 133
Figure 34 Classification of genes expressed by microbiota E after 7 (blue) and 9 (red) days of storage
under MAP A (70% O2 - 30% CO2) or MAP B (50% CO2 - 50% N2) or air C (~21% O2 - 78% N2). .......... 137
Figure 35 Log of count reads per functional categories observed for each MAP A (70% O2 - 30% CO2) or
MAP B (50% CO2 - 50% N2) or air C (~21% O2 - 78% N2). ..................................................................... 138
Figure 36 Agglomerative hierarchical clustering (AHC) of metatranscriptome samples from total read
counts of 24 032 genes ....................................................................................................................... 139
Figure 37 Venn diagram with the number of genes differentially expressed according to the MAP
condition MAP A (70% O2 - 30% CO2) or MAP B (50% CO2 - 50% N2) or air C (~21% O2 - 78% N2) for
microbial communities E and U........................................................................................................... 140
Figure 38 Differentially expressed genes and their taxonomic assignation depending on the conditions.
............................................................................................................................................................. 141
Figure 39 Species assignation of up-regulated genes ......................................................................... 142
Figure 40 The ribose operon in B.thermosphacta adapted from Autieri et al. (2007) ....................... 143
Figure 41 Schema of allantoin pathway adapted from Lee et al. (2013) ............................................ 145
Figure 42 Arginine degradation pathway adapted from Champomier Vergès et al. (1999) ............... 145
Figure 43 Sugars related functions up-regulated by L. sakei in microbiota U..................................... 147

A.Rouger 2017 Tables des illustrations - Figures
17
Figure 44 Pyrimidine biosynthesis related functions up-regulated by L. sakei in microbiota U. ........ 148
Figure 45 Major metabolic pathways used by bacteria in chicken meat microbiota. ........................ 152
Figure 46 Résultats de puces ARN Agilent ou Experion montrant la qualité des ARN extrait lors de 3
challenges tests (A, B et C). ................................................................................................................. 155

A.Rouger 2017 Tables des illustrations - Figures
18

A.Rouger 2017 Introduction
19
Introduction
Le travail effectué au cours de ce doctorat s’est déroulé au sein de l’Unité Mixte de Recherche (INRA-
Oniris) 1014 SECALIM (Sécurité des Aliments et Microbiologie) à Nantes. Les recherches menées dans
l’unité se focalisent sur la caractérisation et la maîtrise du risque microbien dans les produits carnés et
produits de la mer. Dans ce cadre de recherche, le projet « Pstrat », financé par la Région des Pays de
la Loire (2012-2017) et porté par Monique Zagorec, vise à acquérir des connaissances sur les
comportements microbiens dans les aliments par méthode de séquençage à haut débit, afin de donner
les pistes pour maîtriser les flores bactériennes indésirables qui y résident.
En effet, les aliments peuvent héberger une flore endogène pouvant comprendre des bactéries
pathogènes ou altérantes qui influencent la qualité du produit. La connaissance des écosystèmes est
donc indispensable dans le domaine de la maîtrise de la qualité et de la sécurité des aliments. Une des
difficultés majeures de l’étude des écosystèmes microbiens alimentaires est qu’ils peuvent évoluer
quantitativement et qualitativement très rapidement entre le moment de la production et la date
limite de consommation (DLC). De plus, les communautés bactériennes présentes sur les aliments sont
extrêmement variables d’un lot à l’autre ou en fonction du procédé de conservation, ce qui rend les
études difficilement reproductibles et comparables.
Ce projet a contribué à renforcer la dynamique scientifique de l’unité par l’acquisition collective des
méthodes en « omiques », en particulier la métagénomique pour une vision sans a priori « d’écologie
microbienne synthétique ». Dans le cadre de ce projet, le recrutement de Benoit Remenant, post-
doctorant bio-analyste, a permis d’acquérir des méthodes d’analyses nécessaires à l’utilisation de ces
données « omiques ». D’autre part, dans le but de comprendre les fonctions exprimées par ces
écosystèmes microbiens une analyse métatranscriptomique a été réalisée dans le cadre d’une
collaboration avec le laboratoire « Food Hygiene and Environmental Health » de l’Université d’Helsinki.
Le partage de protocoles expérimentaux et l’apprentissage de méthodes d’analyses avec l’équipe de
Johanna Bjortkröth ont été possibles grâce à deux mobilités d’une durée totale de 3 mois financées
par la DARESE (INRA - Direction de l'Action Régionale, de l'Enseignement Supérieur et de l'Europe) et
l’ICFMH (International Committee on Food Microbiology and Hygiene) dans le cadre de mon parcours
à l’EIR-A (Ecole Internationale de Recherche Agreenium).

A.Rouger 2017 Introduction
20
Les différentes étapes de cette étude sont présentées sur le schéma récapitulatif des travaux menés
au cours de ce doctorat (Figure 1).
Figure 1 Schéma récapitulatif des travaux menés au cours du doctorat
Le chapitre 1 comprend une synthèse bibliographique reprenant les principaux chiffres de production
et de consommation de viande de volaille ainsi qu’une analyse bibliographique préparée dans le cadre
d’un projet effectué avec le pôle de compétitivité Valorial. Ce projet a abouti à une synthèse
bibliographique sur les communautés bactériennes de la viande de volaille soumise dans la revue Food
Microbiology. Les modèles d’étude décrits pour étudier des écosystèmes microbiens sont également
récapitulés avant d’évoquer les méthodes utilisées en écologie microbienne.
Au vu de l’état de l’art, les contaminations présentes sur la viande de poulet sont variables suivant les
découpes, les saisons, les lots, etc. Notre stratégie présentée dans le chapitre 2 a donc été de
reconstruire un écosystème microbien standard que l’on a souhaité le plus proche possible de la
réalité. Pour cela nous avons décidé de collecter des bactéries naturellement présentes sur la viande
de poulet afin de les utiliser comme inoculum sur de la viande pauci microbienne. Cette première étape
a nécessité la mise au point d’un protocole d’échantillonnage mais aussi un protocole d’isolement et

A.Rouger 2017 Introduction
21
de stockage des bactéries. En effet, il nous a fallu collecter suffisamment de bactéries vivantes afin de
pouvoir les stocker (c’est pourquoi nous avons choisi les cuisses de poulet qui sont les plus
contaminées) et les ré-inoculer. Il nous a aussi fallu obtenir une suspension bactérienne la plus pure
possible pour l’extraction des acides nucléiques et l’amplification d’ADN. Nous avons également vérifié
que les bactéries étaient capables de survire à la congélation, et de se redévelopper sur la viande de
poulet sans nécessiter une étape de pré-culture et que ce développement se faisait bien au dépend de
la flore endogène de la viande. Ces travaux sont publiés dans la revue International Journal of Food
Microbiology.
Dans le chapitre 3 nous avons décrit les communautés bactériennes présentes naturellement sur la
viande de poulet avant la DLC. Pour cela nous avons comparé les résultats obtenus par méthodes
culturales sur différents milieux sélectifs et les résultats d’analyses des données de pyroséquençage.
Ceci nous a permis de faire un état des lieux le plus exhaustif possible des communautés bactériennes
présentes sur la viande. Ce travail a fait l’objet d’une publication soumise dans Food Microbiology.
Une fois les bactéries connues et disposant d’un écosystème microbien standard nous avons cherché
à connaître l’influence des conditions de stockage (atmosphère) sur la composition des microbiotes et
les fonctions qu’ils expriment. Ces résultats sont présentés dans le chapitre 3. Nous avons utilisé deux
microbiotes de notre collection pour réaliser des challenges tests sur de la viande de poulet pauci
microbienne stockée sous 3 atmosphères différentes. Un suivi cinétique des bactéries a été effectué
par méthodes culturales classiques durant le temps de stockage de la viande (9 jours) et nous avons
également extrait les acides nucléiques (ADN et ARN). Ces acides nucléiques ont alors été utilisés dans
une étude métagénomique et métatranscriptomique afin d’identifier les fonctions présentes et les
fonctions effectivement exprimées par les communautés microbiennes. Un contrôle par
métabarcoding/métagénétique a également été effectué afin de vérifier les espèces bactériennes
présentes et confirmer les résultats obtenus par métagénomique. Un article scientifique issu de cette
étude est en cours de préparation.
Pour conclure, une discussion générale et les perspectives du projet sont détaillées en fin de
document.

A.Rouger 2017 Introduction
22

A.Rouger 2017 Chapitre 1 Synthèse bibliographique
23
Chapitre 1 Synthèse bibliographique
1.1- La viande de poulet en quelques chiffres
1.1.1- Production et consommation de la viande de volaille
La production de viande dans le monde était de 318 millions de tonnes pour l’année 2015 et ce chiffre
ne cesse d’augmenter (OECD/FAO, 2016). La viande de volaille est la deuxième viande la plus produite
dans le monde derrière la viande de porc. En 2015 d’après la Food and Agriculture Organisation
(OECD/FAO, 2016), la production mondiale de viande de volaille a été estimée à 112,1 millions de
tonnes en 2015 soit une hausse de 1,4% par rapport à l’année 2014 et ce autant dans les pays
développés que ceux en développement (Figure 2).
Figure 2 Production/consommation de viande de volailles par pays dans le monde en 2015. Carte élaborée à partir des chiffres de l’Agreste1
La FAO prédit une augmentation annuelle de la production de viande de volaille de 1,8% de 2015 à
2024 contre 1,3% toutes viandes confondues. La viande de volaille serait alors la 1e production de
viande dans le monde avec une estimation de 134,5 millions de tonnes en 2023. Dans ce contexte
l’Union Européenne (UE) est le 3e producteur de viande de volaille (équivalent à la production du Brésil)
1 http://agreste.agriculture.gouv.fr/publications/chiffres-et-donnees/
20 947
13 635
3 235
2 096
13 541
18 129 1 471
3 8021 728
4 718
Production/Consommation 1 000 tonnes équivalent carcasses - 2015
17 734
9 735
4 162
13 671
1 330 2 298
3 8921 066
3 981
1 723NANA

A.Rouger 2017 Chapitre 1 Synthèse bibliographique
24
derrière les Etats-Unis et la Chine. L’UE se place aussi à la 3e position en termes de consommation de
viande de volailles avec en moyenne, 36 kg équivalent carcasses par an et par habitant (Figure 3).
Figure 3 Consommation de viande de volaille en Europe en 2015. Carte élaborée à partir des chiffres de l’Agreste1
1.1.2- Production et consommation de la viande de volaille en France
En 2015, la production était de 1,8 MTEC (millions de tonnes équivalent carcasses) et une
consommation de 1,7 MTEC ce qui représente un solde financier de 99 millions d’euros (Figure 4). On
exporte environ 650 000 TEC (dont la moitié vers UE et l’autre moitié vers des pays tiers) sous forme
de viande congelée et on importe 559 000 TEC (la quasi-totalité en provenance de l’UE sous forme de
viande fraiche et congelée). L’import/export représentent chacun environ 1.2 milliard d’euros et
concerne majoritairement la viande de poulet.
Figure 4 Filière volaille de chair en France pour l'année 2015. Source (ITAVI, 2016)
26,6
44,836,9
30,535,2
20,0
21,126,3
21,3
22,9
21,7
24,1
22,1
27,7
24,8
23,2
21,0
20 - 30
30 - 40
> 40
Consommation(kg/an/habitant)

A.Rouger 2017 Chapitre 1 Synthèse bibliographique
25
En France la majorité des volailles abattues sont des poulets de chair. Le poulet est également la viande
de volaille la plus consommée (60%). La production de volaille en France est majoritairement produite
(65%) en Bretagne et Pays de la Loire (Figure 5).
Figure 5 Volailles abattues en France en 2015. Graphiques élaborés à partir des chiffres de l’Agreste
En 2015, en France la consommation de viande de volaille était de 26,7 kg/hab, représentée
majoritairement par de la viande de poulet vendue en frais et principalement sous forme de découpes
avec presque 17 kg/hab contre environ 5 kg de dinde et 3 kg de canard par habitant (ITAVI, 2016).
1.1.3- Impact environnemental de la viande de volaille
Avec l’objectif de nourrir les 9 milliards d’hommes en 2050, l’agriculture doit faire face à de nouveaux
enjeux économiques et environnementaux. En effet, l’élevage intensif doit permettre une meilleure
productivité tout en respectant les contraintes écologiques et environnementales (développement
durable). Dans ce contexte, la viande de volaille présente un coût de production raisonné par rapport
à la production de viande de bœuf par exemple. Il faut 4 kg de céréales pour produire 1 kg de viande
de poulet contre 6 kg pour 1 kg de viande de porc et 12 kg pour 1 kg de viande de bœuf (Tableau 1).
De plus, l’élevage de volaille nécessite une surface au sol moins importante (53 m² nécessaire pour la
production d’1 kg de viande) que les autres élevages : bœuf + fourrage 323 m², poisson 207 m², porc
55 m². Enfin, dans un contexte de développement durable, la production de viande de bœuf est
reconnue comme étant très émettrice de CO2 et de méthane.
Tableau 1 Quelques éléments de comparaison des élevages bovins porcins et de volailles
1 chiffres-carbone.fr 2 waterfootprint.org
3 www.wwf.fr 4(Dutuit & Gorenflot, 2008)
61%20%
2%14%
0% 3%
Poulets
Dindes
Pintades
Canards
Oies
Poules
6%8%
35%
2%2%
32%
3% 12%
Aquitaine
Bourgogne
Bretagne
Centre
Midi-Pyrénées
Pays de la loire
Poitou-Charentes
Rhône-Alpes
Autres régions
Volailles abattues en France en 2015
Equivalent carbone
pour 1 kg de viande1 Besoin en eau
pour 1 kg de viande2 Surface de sol
pour 1 kg de viande3 Céréales
pour 1 kg de viande4
Bœuf 27 kg 15 500 L 323 m² 12 kg Porc 5,1 kg 4 800 L 55 m² 6 kg
Poulet 3,7 kg 3 900 L 53 m² 4 kg

A.Rouger 2017 Chapitre 1 Synthèse bibliographique
26
Les conditions d’élevage de la volaille permettent plusieurs cycles de production dans l’année
contrairement au bœuf par exemple où plusieurs mois sont nécessaires pour produire de la viande de
veau et plusieurs années pour de la viande de bœuf. En France, la durée d’élevage varie suivant le
mode de production de 35 jours pour un poulet standard à 81 jours pour un poulet « bio » ou « label
rouge » (Tableau 2).
Tableau 2 Récapitulatif des conditions d’élevage de volaille suivant les modes de production. Source : CIWF France = Organisation non gouvernementale internationale pour le respect du bien-être animal en élevage
Mode de production
Poulet standard Poulet certifié Poulet Label Rouge Poulet Agriculture
Biologique
Lignée de poulet Croissance rapide Croissance
intermédiaire Rustique à croissance
lente Rustique à croissance
lente
Age d'abattage 35/40 jours 56 jours 81 jours minimum 81 jours minimum
Taille du poulailler Pas de norme
(jusqu'à 2000 m²) Pas de norme
(jusqu'à 2000 m²) 400 m² maximum 2 x 200 m² maximum
Densité dans le poulailler par m²
20/25 poulets 20/25 poulets 11 poulets 11 poulets
Espace en plein air
Aucun, élevage en claustration
Aucun, élevage en claustration
2 m² /poulet appellation "plein air" - 4m² /poulet appellation "en liberté"
4 m² par poulet
Eclairage Artificiel Artificiel Lumière naturelle Lumière naturelle
Alimentation Pas d'exigence Pas d'exigence 100 % végétaux,
minéraux, vitamines dont 75% de céréales
100 % végétaux, minéraux, vitamines 90% de produits AB,
dont 65% de céréales
1.1.4- Intérêt pour le consommateur
La viande de volaille présente plusieurs intérêts (économique, nutritionnel, pratique, …) pour le
consommateur.
Devant le recul de la consommation de viande par les ménages (-4.9% pour le porc en 2014) les ventes
de viande de volaille restent en constante augmentation (+0.4%) (ITAVI, 2016). Le prix d’achat de la
viande de volaille est d’environ de 9 € par kg, équivalent au prix du porc, mais plus accessible que celui
du bœuf (Figure 6).

A.Rouger 2017 Chapitre 1 Synthèse bibliographique
27
Figure 6 Prix d’achats moyens des viandes par les ménages en 2014.
Graphiques élaborés à partir des chiffres de l’Agreste
La viande volaille est considérée comme une viande blanche ayant une bonne qualité nutritionnelle et
diététique. Elle est naturellement maigre et les lipides sont surtout contenus dans la peau qu’il est aisé
de retirer pour limiter l’apport en graisse (14 % et 4 % de lipides pour le poulet et la dinde,
respectivement). La viande de volaille est également riche en protéines et contient tous les acides
aminés, vitamines et minéraux nécessaires à la nutrition humaine. Cependant dans certaines études
et auprès des industriels de la filière, les filets de poulet sont considérés comme de la viande blanche
alors que les cuisses de poulet sont considérées comme une viande rouge en raisons du niveau de
contamination bactériennes (Baston et al., 2010).
La viande de volaille est consommée dans le monde entier notamment grâce à la facilité d’élevage des
animaux sous la plupart des climats et à une compatibilité avec les pratiques culturelles de différents
pays. En effet, la viande de volaille ne présente aucun interdit religieux comme le précise le Conseil
général de l'alimentation, de l'agriculture et des espaces ruraux (CGAAER). En France, les volailles sont
consommées sous forme entière (carcasses) notamment en période de fêtes (poulet entier, dinde,
chapon) mais de plus en plus sous forme de découpes crues prêtes à cuire (cuisses de poulets, ailes,
filets, etc) et conservées sous atmosphère protectrice. Le conditionnement sous atmosphère
protectrice permet d’allonger la DLC des produits (McMillin, 2008). Pour les cuisses de poulet par
exemple la DLC varie de 9 à 17 jours. Dans le cadre d’une enquête réalisée au laboratoire, nous avons
constaté qu’au moins 3 atmosphères protectrices différentes sont utilisées par les industriels de la
filière volaille (suivant les produits et suivants les industriels) : 50% CO2/50% N2 (viandes « blanches »),
70% O2/30% C02 (viandes « rouges ») et 40% N2/25% CO2/35% O2 (viandes marinées) (Macé et al.,
2014). Nous avons observé des proportions variables de CO2 et O2 dans les barquettes de découpes du
commerce corroborant les pratiques (Rouger et al., 2017).

A.Rouger 2017 Chapitre 1 Synthèse bibliographique
28
1.1.5- Choix du modèle d’étude : la viande de poulet
Bien que très consommée et présentant de nombreux avantages pour le consommateur, la viande de
volaille est naturellement contaminée par la bactérie pathogène Campylobacter, et est considérée
comme la principale source de campylobactérioses. En Europe en 2015, 46,7 % des carcasses de poulet
ont été répertoriées comme contaminées (EFSA, 2016). Campylobacter est le 1e agent pathogène
responsable de gastroentérites bactériennes en Europe avec 229 213 cas recensés derrière Salmonella
(94 625 cas recensés) (EFSA, 2016). Cette zoonose entraine des coûts de santé importants (EFSA, 2016,
Saint-Cyr et al., 2016) qu’il est difficile d’estimer au vu des symptômes le plus souvent bénins (gastro-
entérite) et en raison du délai entre l’apparition des symptômes et la consommation d’aliments
contaminés qui rend difficile l’établissement du lien maladie/aliment incriminé. De nombreuses études
visent à comprendre le comportement de Campylobacter afin de trouver des moyens de réduire la
prévalence de ce pathogène le plus possible en amont dans la chaine de production.
Hormis les pathogènes, des bactéries altérantes sont également présentes sur la viande de volaille.
Comme pour toutes les denrées hautement périssables les pertes et gaspillages liés à la contamination
microbiologique de l’aliment existent aussi pour la viande de poulet. Il y a peu de données rapportées
sur les pertes (avant la commercialisation) et les gaspillages (après commercialisation) mais on estime
qu’1/3 des denrées, toutes confondues, sont perdues ou gaspillées. Gustavsson et al., (2011) précise
les proportions des pertes et gaspillages pour les toutes les viandes (Figure 7).
Figure 7 Proportion de la production initiale de viande perdues ou gaspillées à différents stade de
la chaine de production et de consommation selon les zones géographiques (Gustavsson et al., 2011).
Il est aisé de comprendre l’enjeu économique : connaitre les contaminations microbiologiques
(pathogènes ou altérants) et leurs devenirs durant la conservation permettra de mettre en œuvre des
moyens de maitrise de la qualité des aliments.

A.Rouger 2017 Chapitre 1 Synthèse bibliographique
29
Du fait de l’important bassin de production en région Pays de la Loire, le projet financé par la région
vise à étudier les contaminations bactériennes de la viande de volaille. La part occupée par la
production et la consommation de la viande de poulet a orienté notre choix pour cette matrice. Avant
de chercher à comprendre comment les contaminations peuvent être maitrisées au cours de la
conservation de la viande, il est intéressant de connaitre et de décrire ces contaminations.
1.2- Revue bibliographique
1.2.1- Préambule
Dans le cadre d’un projet financé par le pôle de compétitivité Valorial, une revue bibliographique a été
réalisée pour faire un état de l’art des communautés bactériennes décrites à ce jour sur la viande de
volaille. Ce travail a donné lieu à la rédaction d’un article de synthèse soumis dans la revue Food
Microbiology (Reference: FM_2017_316).
Les points suivants sont abordés dans la revue :
• Les réservoirs de contamination de la viande de poulet et les différentes étapes d’abattage et
de transformation de la viande sont des sources potentielles de contamination
• Les méthodes de détection et de quantification des bactéries de la viande
• Les communautés bactériennes de la viande de poulet à T0, à l’altération
• Les pathogènes présents sur la viande de volaille.
1.2.2- Endogenous contaminations occurring on poultry meat: A review
Amélie Rouger, Odile Tresse, Monique Zagorec#
UMR1014 SECALIM, INRA, Oniris, Nantes, France
# Corresponding author: Monique Zagorec: [email protected]
Abstract
With the constant increase in poultry meat consumption worldwide and the large variety of poultry
meat products and consumer demand, ensuring the microbial safety of poultry carcasses and cuts is
essential. In the present review, we address the bacterial contamination of poultry meat from the
slaughtering steps to the use-by-date of the products. The different contamination sources are listed
and the methods used to identify bacterial contaminants, as well as their limitations, are reviewed.
The culture-dependent techniques for detecting and counting bacterial contaminants and the

A.Rouger 2017 Chapitre 1 Synthèse bibliographique
30
subsequent identification of isolates through molecular methods are presented. The overall
approaches based on next generation sequencing, which have led to a more detailed description of
bacterial contaminants of poultry meat, are also listed. Taking into account the diversity and limitations
of the methods reported in the literature, we present a critical view of the contaminants occurring on
poultry meat cuts and their behavior toward sanitizing treatments and the various storage conditions
in use. A list of the main pathogenic bacteria of concern for the consumer and those responsible for
spoilage and waste of poultry meat is established. This review also highlights the need to continue to
explore poultry meat bacterial communities.
Keywords maximum of 6 keywords
Chicken meat, bacteria, slaughter, spoilage, pathogen
Highlights 3 to 5 bullet points (maximum 85 characters, including spaces, per bullet point).
• Bacterial contamination occurred on poultry during slaughter and transformation process.
• Methods used to describe bacterial contaminations increased with NGS technologies
• Bacterial contaminations of poultry are poorly known according to cultural methods.
Introduction
Poultry meat consumption is steadily increasing worldwide and reached 28.6 kg per year per capita in
2015 (OECD, 2016). The developed western countries, particularly the United States of America (USA),
are the largest consumers with 47.7 kg per inhabitant in 2015. The same increase is observed in the
European Union (EU) and in countries of the Organization for Economic Co-operation and
Development (OECD). Similarly, poultry meat consumption has doubled in France over the past 30
years and has become the second most consumed meat since 2012, reaching more than 26 kg per
capita in 2014 (close to the consumption reported for the EU and OECD) after pork meat (32.5 kg per
capita). Among poultry meat products, chicken carcasses, cuts, and processed products are the most
consumed (~75% of total poultry meat) followed by turkey (~25%) and, to a lesser extent, duck (France
Agrimer, 2015). In France, 60% of the chicken meat is sold as fresh cuts (France Agrimer, 2015), often
stored under various modified atmosphere packagings (MAPs) (Rouger et al., 2017). Vacuum
packaging, the use of modified atmospheres, chilling, or marinades are different practices for ensuring
microbial quality during the storage of poultry cuts, and depend on consumer habits and countries
(see, as examples, Cunningham and Cox, 1987; Nieminen et al., 2012a; 2012b; Rouger et al., 2017).
Therefore, ensuring the microbial safety of poultry meat products is an important issue in this context
of increasing consumption and production, with various consumer habits and needs. In fact, during
and after slaughtering, the bacteria from animal microbiota, the slaughterhouse environment, and

A.Rouger 2017 Chapitre 1 Synthèse bibliographique
31
equipment contaminate carcasses, their subsequent cuts, and processed meat products. Some of
these bacterial contaminants can grow or survive during food processing and storage. The resulting
bacterial communities present on poultry meat can include pathogenic species such as Salmonella and
Campylobacter, the two main pathogens responsible for human gastroenteritis due to poultry meat
consumption. Both pathogens are hosted by poultry and can therefore contaminate meat. Since 2005,
Campylobacter has been the most commonly reported gastrointestinal bacterial pathogen in humans
in the EU, where the numbers of reported confirmed cases in 2015 were 229,213 for human
campylobacteriosis and 94,625 for human salmonellosis (EFSA, 2016). In the USA, among 14 foodborne
pathogens, Salmonella and Campylobacter are responsible for the greatest loss of QALYs (quality-
adjusted life years), which take into account economic cost, hospital treatment, morbidity, and
mortality (Hoffman et al., 2012). Poultry consumption has also been shown to be the first cause of
foodborne outbreaks in the USA between 1998 and 2012 (Chai et al., 2017). Other emerging
pathogens, such as Aeromonas sp., may also be considered (Praveen et al., 2016). In addition to
foodborne pathogens, bacteria responsible for spoilage may lead to large economic losses. Their
growth and metabolic activity during shelf life leading to color, odor, taste, or texture defects are
responsible for waste and losses of food products and have therefore an important impact on the
economy of the poultry meat production sector.
Most of the literature dealing with the microbial contamination of poultry meat is based on cultural
methods using various selective media. A majority of reports is dedicated to detecting the presence of
pathogens (mainly Salmonella and Campylobacter) and sometimes to studying their behavior under
different decontamination, transformation, or storage conditions. Poultry meat contamination by
spoilage bacteria has been less studied and is often limited to their enumeration by counting CFUs
(Colony Forming Units) on different, more or less specific, media. Challenge tests, based on the
inoculation of individual strains or strain cocktails on meat cuts, have been used to investigate the
growth ability of bacteria under various treatments. Finally, a few studies have recently used high
throughput sequencing technologies to describe poultry meat contaminants, leading to a more precise
description of bacterial species (Nieminen et al., 2012a; 2012b; Line et al., 2013; Mormile et al., 2013,
Chaillou et al., 2015).
The aim of this review is to describe the state of the art about the knowledge available on the bacterial
communities present in fresh poultry meat. The sources of contamination will be listed and the
diversity of bacterial communities contaminating poultry meat will be presented, with an emphasis on
the limitations of the methods used for describing poultry meat microbiota. Reports will also be
presented on the bacterial growth dynamics throughout the production process, from the
slaughterhouse to the end products, and depending on the storage conditions or various treatments.

A.Rouger 2017 Chapitre 1 Synthèse bibliographique
32
Sources of contamination
Muscles are sterile in healthy living birds although various microbiotas are hosted in the digestive tract,
lungs, skin, feathers, etc.. In slaughterhouses, the surfaces, air (aerosols), and liquids also encompass
bacteria. Therefore, carcasses and cuts after animal killing can be contaminated by animal and
slaughterhouse environment microbiota. Figure 8 summarizes the different steps in poultry
slaughtering and the associated contamination routes. Although there are some differences between
the practices in large-scale commercial slaughterhouses and small-scale slaughtering facilities, the
main steps of poultry slaughtering are similar (FAO, 1996). Compared to the slaughtering process of
mammals, the main differences to be noted for poultry slaughtering are: i) the use of a water bath (hot
or chilled) at different stages of the process; ii) the feather removal step, which can be mechanical and
is performed differently from removing the skin of mammals; iii) the small size of birds (compared to
cattle or sheep, for example) which has consequences on the manipulation of carcasses and the
mechanization of some processes. As a result, the nature and origin of bacterial contaminants
occurring on poultry meat is different from those on meat of mammalian origin.
Figure 8 Steps in poultry slaughtering and the associated contamination routes.
As shown in Figure 8, after transport, the birds are suspended from the conveyor and then stunned
and killed. After bleeding, the birds are scalded in hot water at a temperature ranging from 50°C to
60°C to loosen the feathers. Subsequently, the feathers are mechanically abraded from the scalded

A.Rouger 2017 Chapitre 1 Synthèse bibliographique
33
birds. In large-scale slaughterhouses, feathers are removed using rotating rubber fingers and then the
carcasses receive a spray wash prior to evisceration. Evisceration can be carried out by mechanical
aspiration or manually after the carcasses have been cut open. At this stage, the gizzard, heart, and
liver are also retrieved. Next, the carcasses are chilled, either by immersion in cold water or by air
chilling. Subsequent transformation steps include cutting, deboning, grinding, and the use of various
treatments for meat product storage such as marinating or addition of different ingredients (salt,
spices) in processed products such as sausages.
During these successive steps, bacterial contamination of carcasses may occur from equipment
surfaces, water, and animal microbiota. Psychrotrophic lactic acid bacteria (LAB) from the air and the
environment can contaminate broiler meat (Vihavainen et al., 2007). The skin of poultry carcasses and
cuts is directly in contact with air and equipment surfaces and is therefore easily contaminated. On
fresh meat, bacteria are present on the surface rather than in the meat (Luber, 2009). However, in
processed products such as marinated ones, bacteria can migrate into the muscles (Warsow et al.,
2008).
Bacterial contamination by equipment surfaces can take place early in the process. For example, the
rubber fingers used for feather removal or conveyor belts can be sources of bacterial contamination
(Arnold, 2007; Arnold and Yates, 2009; Veluz et al., 2012). During the subsequent processing steps
(deboning, cutting, mincing, mixing) for meat-based foodstuff production, manipulators, air and
equipment surfaces are the main sources of contamination. In fact, transformation operations increase
the surface area of meat in contact with working surfaces and air (Álvarez-Astorga et al., 2002).
Consequently, the level of mesophilic and psychrotrophic bacteria is higher in transformed products
than on primary cuts (Álvarez-Astorga et al., 2002).
The water baths used during the process have a washing effect that diminishes the bacterial loads, but
can also promote cross-contamination between carcasses (Göksoy et al., 2004; Russell, 2008).
Nevertheless, the high temperatures (50°C to 60°C) of the hot water used for scalding contribute to
stopping bacterial growth, particularly that of pathogens whose optimal growth temperature is lower
(42-43°C, 35-43°C, and 30-37°C for Campylobacter, Salmonella, and Listeria monocytogenes,
respectively) (James et al., 2006). This helps to diminish the bacterial counts present on skin. However,
high temperatures dilate feather follicles and relax poultry skin. Further processing steps may
therefore lead to bacteria transfer from feathers to skin and follicles, previously dilated by the hot
water, and to entrapping bacteria after the cooling of plucked carcasses. Cold water used for chilling
carcasses after evisceration can act as a cross-contamination vehicle between carcasses, but also has
a decontaminating effect by rinsing the surface of carcasses, particularly when chlorine is added to the
water as in the USA (Demirok et al., 2013). Although cold water and air chilling procedures have

A.Rouger 2017 Chapitre 1 Synthèse bibliographique
34
different effects on diminishing Salmonella and Campylobacter counts, no difference has been
observed in the impact of the two procedures on the shelf life of cuts (Demirok et al., 2013).
The evisceration step, because of the microbiota present at high counts in the digestive tract, is a
critical point of carcass contamination. The gastrointestinal tract of birds hosts many bacteria,
including some that can be potentially dangerous for the consumer such as Campylobacter sp. or
Salmonella. In fact, Campylobacter living in the intestinal tubes of birds are asymptomatic (Vandamme
et al., 2005; Wassenaar and Newell, 2006). There is a correlation between the number of
Campylobacter in the ceca and the contamination level found on carcasses (Hue et al., 2011;
Pacholewicz et al., 2016). An average contamination level of 8.05 log CFU/g of ceca and 2.39 log CFU/g
of carcasses has been measured (Hue et al., 2011). Poultry gut microbiota has been studied in detail,
in particular to correlate animal feeding, health, and gut microbiota (see Waite and Taylor, 2014; Mohd
Shaufi et al., 2015; Ranjitkar et al., 2016 as recent examples). However, to our knowledge, no study
has yet been performed to establish a link between the composition of animal microbiota and that of
the meat produced from these animals, although it has been reported that bacteria present in meat
products originate at least partly from the animal digestive tract (Chaillou et al., 2015).
The evolution of the level of bacterial contamination throughout the slaughtering process has been
described (Göksoy et al., 2004; Hinton et al., 2004). The contamination level of carcasses by
Pseudomonas and H2S-producing bacteria decreased by about 2 logs after evisceration and chilling by
immersion in cold water. After 14 days of storage at refrigerated temperature, these bacterial
populations reached more than 9-12 log10 CFU per ml of carcass rinses, while Brochothrix
thermosphacta was detected only during storage reaching more than 6-12 log10 CFU per ml of carcass
rinses (Hinton et al. (2004). Similar results were observed by bacterial enumeration performed on neck
skin (Göksoy et al., 2004). This shows the washing effect at different steps, as well as the subsequent
bacterial development that can occur during the storage period. After initial contamination, some
bacteria can persist during meat product storage. As an example, isolates of Chromobacterium
violaceum, a bacterium known to occur in water and soil, could be recovered from killed animals before
the scalding step and also after 10 days of storage of carcasses at refrigerated temperature (Hinton et
al., 2004).
Microbiological methods used to identify bacteria from poultry meat
Numerous scientific studies have been devoted to the microbiology of poultry meat. A large majority
focused on detecting, counting, and/or identifying bacteria present on carcasses and on various
poultry cuts by using cultural methods. Near-infrared hyperspectral imaging and spectroscopic
transforms have also been proposed as a non-invasive and fast method for counting total viable

A.Rouger 2017 Chapitre 1 Synthèse bibliographique
35
counts, Pseudomonas counts, and Enterobacteriaceae counts directly on meat samples (Feng and Sun,
2013a; 2013b; Feng et al., 2013). The large diversity of practices makes it difficult to compare the
results reported by this rich literature. On the other hand, such data may provide information to assess
the relevance of the microbiological criteria applied by poultry meat producers to ensure the safety of
their products. Because the bacterial contamination of poultry meat occurs more frequently on the
skin or the surface of cuts, several methods for recovering bacteria can be used. Table 1 reports
examples of the three main methods recorded in the literature.
Table 1 Examples of the three most reported methods for bacterial recovery from poultry meat samples
Method Principle References
Stomaching/blending
A piece of deboned meat including muscle and/or skin is added to a liquid solution, then
mixed, and the resulting mixture is filtered to remove
meat residues.
Arnaut-Rollier et al., 1999a; Álvarez-Astorga et al., 2002; Capita et al.,
2002a; Hinton et al., 2003; Karama et al., 2003; Goksoy et al., 2004;
González-Miret et al., 2006; Patsias et al., 2006; Balamatsia et al., 2007;
Chaiba et al., 2007; Chouliara et al., 2007; Cohen et al., 2007; Nieminen et al., 2012a; Herbert et al., 2013; Säde
et al., 2013
Rinsing A piece of meat including
muscle and/or skin is added to a liquid solution.
Hinton et al., 2004; Zhang et al., 2012
Swabbing
A meat or equipment surface is scrubbed to collect bacteria
with a swab. The swab is diluted in a solution to place
bacteria in suspension.
Gill et al., 2005; James et al., 2006
The stomaching method, often used by food microbiologists, enables a smooth mechanical separation
of bacteria from the meat matrix. Rinsing and contact methods, like swabbing or membrane adhesion,
are used for recovering bacteria from the meat surface. These methods have been compared and
classified according to their destructive or non-destructive effect (Capita et al., 2004). For stomaching,
a piece of meat including muscle and/or skin is added to a liquid solution, then mixed, and the resulting
mixture is filtered to remove meat residues. This enables the collection of almost all bacteria. Some
authors also include an additional step using an ultrasonic bath or a pulsifier, which combines high
frequency waves and strong stirring to resuspend the bacteria in the solution and improve their
separation from meat (Lynch et al., 2010). The use of a pulsifier rather than a stomacher is less
destructive for meat. Consequently, fewer meat residues, which could interfere with subsequent
analyses, are present in the suspension (Lynch et al., 2010; Al-Nehlawi et al., 2013; Bolton et al., 2014).
The swabbing method, performed to collect bacteria from a surface with a swab, is of particular

A.Rouger 2017 Chapitre 1 Synthèse bibliographique
36
interest to harvest bacteria unevenly distributed on the carcasses. This method is appropriate for the
detection of low-incidence bacteria. However, the results obtained with swabbing are less
reproducible because the bacteria are not necessarily detached from the meat surface (Gill and Badoni,
2005). The last and least destructive method is rinsing. Meat samples are rinsed in a dilution solution
causing no damage to the carcasses or cuts and enabling the collection of whole bacterial communities
present on the surface. The bacterial recovery yields of the stomaching and rinsing methods are similar
(Gill et al., 2005). For routine contamination tests performed in production plants, stomaching (or
blending), rinsing and the use of sponges or swabs are part of the recommended procedures.
The bacterial suspensions obtained after stomaching, rinsing or swabbing are usually spread on agar
media for enumeration. Alternatively, detection kits can be used, such as the Iso Gird membrane filter
for the detection of coliforms. Such membranes are analyzed by plating the bacteria immediately after
sampling. This method is efficient for low microbial contamination levels as membrane overloading
should be avoided (Álvarez-Astorga et al., 2002). The most commonly used media for the
microbiological analysis of poultry meat are summarized in Table 2. After incubation at optimal
temperature for periods ranging from a few hours to several days, bacterial counts are enumerated as
CFU/ml, CFU/g, or CFU/cm2. The conditions of incubation and the use of media are variable to
modulate their selectivity. So, for some media, standardized conditions are found in the ISO
description. The incubation temperature influences the bacterial population: the incubation of PCA
plates for 72 hours at 30°C or 55°C is used to select mesophilic or thermophilic bacteria, respectively.
For psychrotrophic microorganisms, the incubation conditions can reach 10 days at 6.5°C. In some
specific cases, for low-abundance bacteria like some pathogens, an enrichment step in liquid broth
(Table 2) is performed prior to plating on agar media. When very selective media are used, such as
those for the detection of important pathogens, the bacterial population can be directly determined.
There are also some media to enumerate specific families or genera such as lactic acid bacteria (LAB),
Enterobacteriaceae or Pseudomonads (see Table 2). In some cases, the colonies require further
identification by various methods. As examples, the various methods described above have been
reported to isolate poultry meat pathogens or have focused on only one genus with subsequent
identification of isolates (Arnaut-Rollier et al., 1999a; 1999b; Capita et al., 2002a; Okolocha and
Ellerbroek, 2005; Chaiba et al., 2007; Akbar and Anal, 2013). The same methods have also been used
to investigate the behavior of microbial contaminants or after challenge test inoculation of sterile meat
matrices regarding various storage or decontamination conditions (Lemay et al., 2002; del Río et al.,
2006; 2007a; 2007b; Katzav et al., 2008; Warsow et al., 2008; Alonso-Hernando et al., 2012a; Juck et
al., 2012; Alonso-Hernando et al., 2013).

A.Rouger 2017 Chapitre 1 Synthèse bibliographique
37
Table 2 Most commonly used media for microbiological analysis of poultry meat
Targeted bacteria Broth for the enrichment
step Medium used for plating
Total viable count NA PCA
LAB NA MRS
Pseudomonas NA CFC
Brochothrix thermosphacta NA STAA
Enterobacteria NA VRBG
Salmonella RV XLD
Campylobacter Preston or Bolton Skirrow, Karmali, or CCDA
H2S-producing bacteria NA IA
Coliforms NA VRBL, DLA
Clostridium perfringens NA TSA
Staphylococcus aureus NA BPA RV: Rappaport de Vassiliadis; PCA: Plate Count Agar; MRS: de Man Rogosa & Sharpe; CFC: Cefalotin Fucidin
Cetrimide; STAA: Streptomycin Thallous Acetate Agar; VRBG: Violet Red Bile Glucose agar; XLD: Xylose Lysine
Deoxycholate agar; CCDA: Charcoal Cefoperazone Deoxycholate Agar; IA: Iron Agar; VRBL: Violet Red Bile Lactose
agar; DLA: Deoxycholate Lactose Agar; TSA: Tryptone Soy Agar; BPA: Baird-Parker Agar.
NA: not available
Microbiological tests have also been developed for the routine assessment of the microbial quality of
poultry meat products or to determine their shelf life. These tests are mainly based on bacterial
enumeration and require different steps to collect bacteria in sufficient amounts, to identify and/or
enumerate them, and to check if the results meet the regulation safety criteria.
In the USA, both Salmonella and Campylobacter must be controlled in poultry and several
antimicrobials can be used post-slaughtering to control them in poultry meat (FSIS, 2014; 2015). In the
EU, Salmonella detection on poultry meat products is mandatory, as described in the hygiene criteria
of CE regulation N° 1441/2007. As an example of the procedure for determining the shelf life of poultry
meat products, the French regulation AFNOR NF V 01-003 recommends a sampling of 5 pieces of meat
from the same slaughtering batch (muscle and skin). Five analyses must be performed at day 0 and day
5 after a storage period corresponding to 1/3rd of the shelf life at 4°C and 2/3rds of the shelf life at 8°C.
Microbial results expressed in CFU must match the criteria summarized in Table 3. The shelf life of the
products must be assessed periodically, at least annually, and 60% of the results must be below the
target value, and 100% must be below the tolerance value (10 times the target).

A.Rouger 2017 Chapitre 1 Synthèse bibliographique
38
Table 3 Target values and acceptable values for 3 types of bacterial populations depending on the
products and their storage conditions
Storage conditions Target value (/g) Acceptable value (/g)
Pseudomonas Under air +/- plastic wrap 107 108
LAB Vacuum/ modified atmosphere 107 108
Cooked products 3 x 10⁵ 3 x 10⁶
Total viable count Cooked products 3 x 10⁵ 3 x 10⁶
For such analyses to estimate the microbiological and sensory shelf life of poultry meat, the limitations
of the bacterial indicators used (mesophilic and psychrotrophic bacteria and Enterobacteriaceae) have
been shown (Smolander et al., 2004). Moreover, the limitation of the selectivity of some media has
been reported. As an example, isolates further identified as belonging to Aeromonas, Acinetobacter,
Myroides, or Shewanella genera came from CFC medium described as selective for Pseudomonas
(Hinton et al., 2004). In addition, for the food-processing industry, the delay required to obtain the
results of microbiological analyses could be a critical point because of the need to maintain profitability
and productivity. The CE regulation n° 2073/2005 noted that the food industry should use faster and
more efficient methods of analysis, but this consideration is no longer present in the modified
regulation (CE) n° 1441/2007. Special care is required for monitoring Campylobacter and the various
methods that can be used have been recently reviewed (Josefsen et al., 2015; Macé et al., 2015).
Methods used to characterize bacterial contaminants from poultry meat after isolation
Such methods can be employed either to verify the identification of colonies or for deeper analyses
aimed at typing or comparing isolates. Some are based on the major protein content. Matrix-Assisted-
Laser-Desorption-Ionization-Time-Of-Flight Mass Spectrometry (MALDI-TOF MS) is a fast and accurate
method that has been used to identify food isolates, although it is mostly dedicated to foodborne
pathogen identification (Kern et al., 2013 and references therein). Nevertheless, by simultaneously
analyzing several thousands of colonies picked from poultry meat samples, the growth dynamics of
various bacterial species under different MAP were compared (Höll et al., 2016). Another protein-
based analytical method, SDS-polyacrylamide gel electrophoresis of proteins (SDS-PAGE), has also
been reported as an efficient approach for typing isolates (Doulgeraki et al., 2012).
The other commonly used methods are based on DNA molecular techniques (see Doulgeraki et al.,
2012, for a review). The PCR (polymerase chain reaction) is a fast, specific, sensitive and accurate
method. Based on primers that can be specific for a kingdom (bacteria), a family (for instance
firmicutes), a genus (Campylobacter) or a species (Brochothrix thermosphacta), it is used to amplify a

A.Rouger 2017 Chapitre 1 Synthèse bibliographique
39
specific region of the chromosome. Depending on the conditions used for the PCR reaction (choice of
the primers, stringency of the melting temperature, number of amplification cycles), various regions
of DNA can be amplified. PCR can be used simply to verify the identity of a clone by the presence or
absence of amplification from chromosomal DNA, or for further analysis of the PCR fragment after
amplification. The 16S ribosomal RNA (rRNA) gene is mainly targeted for such analyses. In most cases,
DNA sequencing of the 16S rRNA gene (or part of it) is one of the methods of choice to identify an
isolate at the species level. Such a procedure was used to characterize Enterobacteriaceae present on
poultry cuts (Säde et al., 2013). The terminal limitation fragment length polymorphism (T-RFLP)
technique is based on the comparison of electrophoretic migration profiles obtained after an
enzymatic digestion of the PCR fragments. As an example, the combination of T-RFLP and 16S rRNA
gene sequencing led to the identification of the spoilage bacteria in marinated poultry meat as
belonging to the species Leuconostoc gelidum, Lactobacillus sakei and Lactobacillus curvatus
(Björkroth, 2005). Random PCR amplification can also be used and the profiles obtained can be
compared between various isolates together with reference strains used as a control. Random
amplified polymorphism DNA-PCR (RAPD-PCR) is based on short and nonspecific primers that hybridize
randomly on DNA and provide strain-specific profiles. Primer hybridization can also take place on
repeated palindromic sequences (rep-PCR) and the profiles obtained can help intra- and inter-species
differentiation (Doulgeraki et al., 2012). These methods can be used alone or in combination for typing
isolates and estimating intra-species diversity.
There are other molecular methods, based on the enzymatic digestion of chromosomal DNA (REA
PFGE: Restriction Endonuclease Analysis - Pulsed-Field Gel electrophoresis), which can be useful to
differentiate strains on the basis of their migration profiles.
To identify isolates, the PCR can also be coupled with electrophoresis of the amplified DNA under
various denaturing conditions: PCR-DGGE (Denaturing Gradient Gel Electrophoresis) (see Ercolini,
2004, for a review) and PCR-TTGE (Temporal Temperature Gel Electrophoresis) (Martin-Platero et al.,
2008). The DNA fragment can be amplified by PCR with universal primers targeting various bacterial
species of families. The sequence and base composition of the amplified PCR fragment is species-
dependent. Consequently, the migration properties under denaturing conditions depend on the
sequence, providing a unique profile that is compared with those obtained for known bacteria, used
as references. Bands obtained after migration can be sequenced to confirm the bacterial species.
However, the length of the PCR fragments used for PCR-DGGE or PCR-TTGE (usually about 300 - 400
bp) is sometimes too short for a correct identification. Moreover, there may be different migration
profiles within a species and different species may present bands with a similar migration profile,
rendering the identification of clones inaccurate. Lastly, a polyphasic approach using several methods
to ensure the correct identification of isolates has been suggested (Kort et al., 2005; Rahkila et al.,

A.Rouger 2017 Chapitre 1 Synthèse bibliographique
40
2011).These electrophoresis methods combined with PCR are also currently used to describe bacterial
communities directly from meat without a prior step of cultivation, as suggested by Zhang et al. (2012).
Methods used to identify bacterial communities directly from poultry meat samples
The use of a cultural step to describe the bacteria present in food products gives a reductive vision of
the complex microbial ecosystems they host (Ercolini, 2004). For instance, it has been estimated in
fermented food that besides the well-known and cultivable bacterial species, 25 to 50% of the bacteria
are not cultivable with the media commonly used in laboratory conditions (Juste et al., 2008). Several
hypotheses can explain these limitations, particularly the selectivity of the media or the incubation
conditions used such as temperature or atmosphere (Doulgeraki et al., 2012). Furthermore, some
bacterial species cannot yet be cultivated because no known selective media have been developed for
them (Doulgeraki et al., 2012). As an example, one of the major bacterial populations encountered on
spoiled cod fillet has been identified as an uncultured Fusobacteriaceae and has not yet been searched
for by plating methods on such food products (Chaillou et al., 2015). The development of molecular
methods during recent decades and of next generation sequencing (NGS) methods more recently has
led to new possibilities for detecting, identifying and quantifying bacteria without a culture step as a
prerequisite (for reviews, see Juste et al., 2008, and Doulgeraki et al., 2012). DNA extracted directly
from complex matrices without prior microbial cultivation can be used as a basis for researching the
composition of the microbial communities hosted by these matrices. The design of bacterial DNA
extraction procedures directly from food matrices, including poultry meat products, has been reported
(for examples, see Diaz-Sanchez et al., 2013; Chaillou et al., 2015; Rouger et al., 2017). Once the DNA
is extracted, various methods can be used including some of those described above.
PCR amplification can be performed to detect the presence of various bacteria using primers
specifically designed for targeting a species, a genus, or a family. Nevertheless, for some pathogenic
bacteria present at low levels the detection by such a method still requires an enrichment step to
increase the detection threshold, as is the case for Campylobacter in poultry products (Katsav et al.,
2008). Real-time quantitative PCR (q-PCR) is used to quantify various species from bacterial DNA
prepared from meat samples. A method has been designed for DNA extraction and q-PCR
quantification of Salmonella enterica from poultry meat (Agrimonti et al., 2013). A linear correlation
between the q-PCR quantification and bacterial enumeration by cultural methods was obtained.
However, for both PCR and q-PCR, the DNA from dead bacterial cells can also be amplified and may
introduce a bias in the detection or quantification. On the other hand, such methods can detect or
quantify non-cultivated bacteria. In addition, food matrix residues (particularly, lipid residues) can
inhibit the PCR amplification (Rossen et al., 1992; Abu al-Soud and Rådström, 2000; Lubeck et al.,

A.Rouger 2017 Chapitre 1 Synthèse bibliographique
41
2003). The two main advantages of such methods are: i) their specificity, compared to the less specific
cultural methods, particularly for the detection and quantification of pathogenic bacteria; and ii) the
short time needed to obtain results, compared to the delay required to incubate plates and verify
colony identity. Nevertheless, as nucleic acids from dead cells may also be amplified, all methods based
on PCR amplification also generate biases.
To identify bacteria present in food ecosystems, hybridization to DNA microarrays or FISH
(Fluorescence In Situ Hybridization) techniques have also been reported (Juste et al., 2008). These two
methods require primers specific to the bacteria to be identified (Diaz-Sanchez et al., 2013). Because
of their specificity, the methods mentioned above are not suitable to describe the microbial
communities composing complex ecosystems as a whole. Other methods, based on a first step of DNA
extraction followed by PCR amplification and subsequent analysis, have emerged recently aimed at an
overall description of microbial (essentially bacterial) species of various ecosystems, including food
products.
The method based on PCR-DGGE described above has also been performed after amplification on
whole DNA extracted from food. Even in the absence of identification, the PCR-DGGE migration
profiles, obtained from DNA extracted from food, can be used to compare different food samples or
to follow the dynamics of the bacterial communities during storage (Villani et al., 2007). Data obtained
by PCR-DGGE and 16S rRNA gene barcoded pyrosequencing on the same DNA samples extracted from
seafood products have been compared (Roh et al., 2010; Chaillou et al., 2015). The results did not
correlate for a quantitative comparison but enabled pyrosequencing observations to be partially
confirmed.
The most exhaustive method for describing the microbial ecology of complex ecosystems, including
that of meat products, is based on high throughput sequencing. Since 2005, following the
pyrosequencing development that revolutionized the access to bacterial genome sequences
(Margulies et al., 2005), many techniques have emerged and are still in constant evolution. A large (or
even huge) number of sequencing reads can be obtained in a short time, from only a small quantity of
DNA, with no need of cloning steps and for a reasonable price. There are two main approaches. The
most commonly reported one is based on the sequencing of a short fragment, obtained by PCR
amplification of a region that is common to the microbial communities, but with sequence differences
that enable the different populations to be distinguished (metabarcoding) (Taberlet et al., 2012). The
different variable regions of the bacterial 16S-rRNA gene are the most commonly reported targets for
this approach. The second approach, which is now emerging, aims to sequence the total DNA extracted
from a sample (metagenomics) or the cDNA obtained from total RNA (metatranscriptomics).
With metabarcoding, the microbial species present in an ecosystem are determined by comparison
with sequence databases, and their relative quantification is possible. This approach has been mainly

A.Rouger 2017 Chapitre 1 Synthèse bibliographique
42
used in environmental ecology and to describe the microbiota of the digestive tract of many animals.
It emerged only recently in food science, with reports still mostly restricted to bacterial 16S rRNA gene
pyrosequencing. With such a method, depending on the number of reads obtained and the diversity
of the samples, the depth can reach 104 - 105 reads (i.e. within a bacterial population of 10x, those
present up to 10x-4 or 10x-5 will be detected). Identification of the bacteria through the partial 16S rRNA
gene sequence can reach not only the genus level but also the species level. Identification accuracy
depends on the quality of the sequence database used to assign sequence reads to operational
taxonomic units (OTU) and on the 16S rRNA gene variable regions amplified prior to sequencing. This
method can also generate errors, resulting from wrong PCR amplifications or from contamination by
the food matrix DNA (mitochondrial DNA of the animals from which the food is produced or chloroplast
DNA from spices). In fact, the number of reads finally assigned to chloroplasts could reach more than
half of the total reads obtained from poultry sausage (Chaillou et al., 2015). These were attributed to
the spices added to the sausage formula. Nevertheless, this method is useful for a more accurate
assessment of the diversity of food ecosystems. Yet only a few studies have used it to characterize the
microbiota present on poultry carcasses or processed poultry meat products (Nieminen et al., 2012a;
2012b; Mormile et al., 2013; Chaillou et al., 2015).
With metagenomics, the whole DNA sequence is determined to assess what is there and which
functions are potentially present. To date, only one article has reported this method for poultry meat
(Nieminen et al., 2012b). Such a method does not only focus on bacteria and may reveal the presence
of other microorganisms such as yeasts, archeae, or viruses. None of those was found in poultry meat
(Nieminen et al., 2012b), except the virome of chicken skin assessed by metagenomics (Denesvre et
al., 2015). These authors also noticed that, depending on the samples, 50 to 80% of the reads actually
came from meat cells as they could be aligned to the Gallus gallus genome (Nieminen et al., 2012b;
Denesvre et al., 2015). The metatranscriptomics approach aims to reveal and quantify in a relative way
the genes expressed by the microbial community of the analyzed ecosystem. Only very few
metatranscriptomics analyses have been reported on food samples and, to our knowledge, none
dealing with poultry meat.
Variability of bacterial communities regarding different matrices and processes
Despite the various methods used and their limitations, we have combined the data reported in the
literature to draw a picture of the composition of the bacterial communities occurring on poultry meat
depending on different variables. We chose to select variations depending on the meat matrix or on
the storage/transformation process. The bacterial communities present on poultry carcasses and cuts
and their dynamics depend on different factors: the storage temperature, the gas composition used

A.Rouger 2017 Chapitre 1 Synthèse bibliographique
43
for MAP, the composition of marinades or various chemical treatments that can be applied to control
bacteria. A number of studies were selected to illustrate the diversity of the methods used.
Variability of bacterial contaminants regarding meat matrix and origin
Most of the literature focuses on chicken meat and, to a lesser extent, turkey meat. A comparative
study of the microbiological quality of poultry meat in Morocco showed that turkey meat was more
contaminated (5.4 - 7.4 log CFU/g total aerobic counts) than chicken meat (4.5 - 6.6 log CFU/g) (Cohen
et al., 2007). Nevertheless, for several pathogens (Escherichia coli, Staphylococcus aureus, and
Clostridium perfringens) the contamination level was similar in chicken and turkey meat. The
difference might result from the different farming conditions and/or intrinsic differences between
these two birds. These authors also noticed that the traditional slaughtering process increases
contamination by microbial communities. This correlates with another observation, which reported a
higher contamination level of skins of chicken carcasses from traditional markets and artisanal
slaughterhouses (Chaiba et al., 2007). This study, also carried out in Morocco, showed higher counts
of mesophilic and psychrotrophic bacteria, total and fecal coliforms, and S. aureus on artisanal
products than on carcasses purchased from supermarkets.
The contamination level regarding different cuts or raw vs. transformed products has also been
evaluated. Al Alvarez-Astorga et al. (2002) enumerated the mesophilic bacteria from various poultry
cuts (thighs, wings, giblets, hamburgers, and sausages). These were higher in processed products
(hamburgers, sausages) with approximately 7 log CFU/g, than in the fresh cuts (thighs, wings) with
approximately 5.7 log CFU/g. This may result from the temperature during the transformation process
(10°C) and from the mixing steps that increase the surface area of meat in contact with surfaces and
air, both favorable to bacterial growth and to the possibility of increased contamination.
Variability of bacterial contaminants regarding storage temperature
The importance of temperature for bacterial growth can be assessed at different critical points
between the slaughtering and the consumption of the product, in particular:
- during carcass handling (the temperature in the processing plants is usually about 10°C);
- during the storage of meat products (with an estimation of a rupture in the cold chain between the
time of sale and the consumer’s fridge, whose temperature is estimated to be higher than 4°C).
Tuncer and Sireli (2008) studied the effect of chilling carcasses using chilled air or a cold water bath on
their microbial communities. Refrigeration by chilled air slows down the development of the total
viable count (approximately 1 log) and causes a rapid decrease in temperature. This inhibits the
multiplication of Salmonella and Campylobacter and so chilled-air cooling would be more efficient.
A.Rouger 2017 Chapitre 1 Synthèse bibliographique
44
However, it is necessary to take into account the fact that Listeria can grow at this storage
temperature.
Smolander et al. (2004) showed that the product shelf life can be increased by storage at low
temperature and the absence of a break in the cold chain. The shelf life can even be doubled when the
temperature is lowered to 3.4°C compared to storage at 8.3°C. Low temperatures delay the growth of
Enterobacteriaceae, which can produce sulfuric compounds and organoleptic deterioration of the
meat quality. On the other hand, the growth of psychrotrophic bacteria is enhanced. Actually, at 4°C
and 7°C, the total viable counts develop faster (Tuncer et al., 2008) than at 0°C. Consequently, the
threshold of 107 CFU/cm² is reached earlier in the storage period when the temperature is higher. In
addition, Zhang et al. (2012) showed that microbial communities develop faster at 10°C (9.7 log
CFU/cm² of TVC) than at 4°C (6.4 log CFU/cm² of TVC). Storage at 4°C is damaging for B. thermosphacta
and S. putrefaciens growth after 7, 10 or 14 days whereas Aeromonas hydrophila and Aeromonas
sobria are psychrotrophic bacteria that can develop at low temperature (Hinton et al., 2004).
Smolander et al. (2004) also pointed out that the shelf life of products cannot be lengthened too much
by storage at 0°C, because pathogenic agents such as Listeria can multiply at these temperatures.
These authors suggested that the use of time temperature indicators (“TTI”) could enable the
assessment of chicken meat quality.
Variability of bacterial contaminant regarding gas composition of packaging
Balamatsia et al. (2007) and Chouliara et al. (2007) compared the effect of different atmospheres used
for packaging poultry meat (Table 4). B. thermosphacta and Enterobacteriaceae counts were not
significantly affected by the type of packaging but were detected as bacteria responsible for spoilage
(Chouliara et al., 2007). The use of vacuum packaging and some MAP extended the shelf life of chicken
cuts by about 2-3 days (30% CO2 - 65% N2 - 5% O2, MAP1, Table 4) and by more than 9 days (65% CO2 -
30% N2 - 5% O2, MAP2, Table 4) (Balamatsia et al., 2007). CO2 has a bacteriostatic effect, which inhibits
the growth of aerobic microorganisms such as Pseudomonas spp. that are considered putative spoilage
organisms. A MAP containing more CO2 (70% CO2 - 30% N2) was more effective than one containing
less (30% CO2 – 70% N2) (Chouliara et al., 2007). However, LAB species can grow in the presence of CO2,
which explains why this bacterial community can become dominant in products stored under CO2-
enriched MAP. These atmospheres produced a decrease of about 1-1.5 log CFU/g of total viable counts
in the meat cuts and consequently increased the product shelf life by 2-3 days (Balamatsia et al., 2007;
Chouliara et al., 2007).
Replacing nitrogen by argon in the composition of MAP (proportion from 15% to 82%) was tested
(Herbert et al., 2013). No strong difference was observed, with only B. thermosphacta appearing to be
significantly affected by a high proportion of Ar in the gas mixture. Nevertheless, the various

A.Rouger 2017 Chapitre 1 Synthèse bibliographique
45
proportions of Ar or N2/CO2/O2 in the gas mixtures tested shaped differently the growth dynamics and
the ratio of different populations (LAB, B. thermosphacta, Pseudomonas spp., and
Enterobacteriaceae). The growth of mesophilic LAB was favored by anaerobic conditions or high
quantities of CO2 or both. At low Ar or N2 concentration (15%), the dominant microbial communities
were composed of Pseudomonas spp., Enterobacteriaceae, and B. thermosphacta with dominance of
the latter increasing during storage (Herbert et al., 2013). These authors noted the ability of
Pseudomonas spp., considered aerobic bacteria, to grow with only residual amounts of O2.
Table 4 Time period to reach spoilage (i.e. 7 log CFU/g of total viable counts) depending on packaging conditions. Data are taken from Balamatsia et al., (2007) (upper part) and Chouliara et al., (2007) (lower part).
Bacterial counts at T0 (Log UFC/g)
Time (days) to reach spoilage (>7 log CFU/g )
Air Vacuum MAP1 MAP2 MAP3 MAP4
Total viable count 4.9 5 7 11 15 ND ND
LAB 3.9 5 12 NA NA ND ND
Pseudomonas 4.2 7-11 NA NA NA ND ND
Total viable count 4.3 5-6 ND ND ND 11-12 14-15
Pseudomonas 3.4 7 ND ND ND 14-15 16-17
LAB 3.7 9 ND ND ND 13-14 15-16
B. thermosphacta 3.0 8-9 ND ND ND 15 13-14
NA: not achieved (threshold: 7 log CFU/g not achieved during the storage period studied) MAP1 30% CO2 - 65% N2 - 5% O2 MAP2 65% CO2 - 30% N2 - 5% O2
MAP3 30% CO2 - 70% N2
MAP4 70% CO2 - 30% N2
Patsias et al. (2006) compared the effect of MAP on precooked chicken breasts. Three atmospheres
were tested: 30% CO2 - 70% N2, 60% CO2 - 40% N2, and 90% CO2 - 10% N2. The presence of CO2, alone
or in combination with N2, affected the growth of aerobic spoilage bacteria (for example Pseudomonas
spp.) and favored the development of facultative anaerobic populations (LAB). The shelf life was
extended by 4 days with the 30% CO2 - 70% N2 mixture, and by more than 6 days with mixtures
composed of 60% CO2 - 40% N2 and 90% CO2 - 10% N2.
Another study (Al-Nehlawi et al., 2013) showed that a pretreatment of 3 hours with 100% CO2 prior to
packaging under 70% CO2 - 15% O2 - 15% N2 improved the microbiological quality of the meat of raw
chicken drumsticks and prolonged shelf life. The Pseudomonas counts, as well as the total aerobic
counts, were significantly lower after 7 and 12 days of storage when a CO2 pretreatment was applied.
Such treatment had no additional effect on coliforms, which were undetectable after 7 days of storage

A.Rouger 2017 Chapitre 1 Synthèse bibliographique
46
under MAP, whether or not a CO2 pretreatment was applied. Such an effect on the shelf life resulted
from a better availability of CO2 in the headspace during storage because of the dissolution of CO2 in
meat after the pretreatment.
Variability of bacterial contaminants in marinated chicken and with various additives
The definition of marinade varies according to the country (Björkroth, 2005; Yusop et al., 2010).
Marinades may be composed of a mixture of oil or salt and phosphates (in France and Spain, for
instance) or a sauce with oil, organic acids, or spices, essential oil and thickener (Finland, China, and
Italy). In all cases, marinades are associated with storage under different MAP.
Chouliara et al. (2007) compared the effect of adding oregano essential oil at 0.1% or 1% alone or in
combination with MAP on the microbiological quality of chicken cuts. The addition of 0.1% oregano
essential oil increased the shelf life by 3-4 days while the increase provided by the gas mixture (70%
CO2 - 30% N2) was only 2-3 days. The combination of a marinade with oregano essential oil and storage
under MAP showed that the two treatments could be added as the shelf life reached more than 20
days with a decrease in the total viable count of 2-3 log CFU/g.
In Finland, the consumption of marinated poultry products packaged under MAP is common and the
effect of the marinade on their microbial safety has been well documented. The Finnish marinade can
be complex as it is composed of acetic acid, honey, glucose, maltodextrin, NaCl, phosphate, rape seed
oil, spices (sweet pepper, curry, black pepper, garlic and turmeric), thickener (guar gum and xanthan
gum), and yeast extract (Nieminen et al., 2012b). Such marinades may influence the LAB population
by favoring the growth of specific species, particularly because of the source of carbohydrates they
provide (Björkroth, 2005). The MAP commonly used in Finland is composed of 65% N2 and 35% CO2.
The marinade favors a LAB psychrotrophic population, not detected in the unmarinated products
(Björkroth, 2005); especially Leuconostoc gasicomitatum, also detected in spoiled meat and seafood
products (Chaillou et al., 2005) and in some vegetables associated with marinated fish products (Lyhs
et al., 2003). This bacterial species, unable to survive in the digestive tract of the animal, certainly
originates from the environment and is adapted to the cold because it can persist throughout the
transformation process (Björkroth, 2005). As the combination of MAP and marinade favors the
emergence of this group of bacteria, it is necessary to understand their mechanism of adaptation to
monitor them in such products. It should be noted that the marinade had no effect on Campylobacter.
In a study combining the identification of isolates, as well as 16S rDNA gene pyrosequencing and
metagenomics an overview of the effect of marinades on broiler fillet strip microbiology was reported
(Nieminen et al., 2012a). Samples stored at 6°C under MAP (65% N2 - 35% CO2) with and without
marinade were compared. The combination of cultural and molecular methods confirmed that among
LAB, marinade favored Leuconostoc and particularly L. gasicomitatum, and decreased B.

A.Rouger 2017 Chapitre 1 Synthèse bibliographique
47
thermosphacta, Clostridium spp., and Enterobacteriaceae. Among LAB belonging to the genus
Carnobacterium, C. divergens was present in higher amounts than C. maltaromaticum, although both
species seemed sensitive to marinade, certainly because of the presence of acetic acid.
Variability of bacterial contaminant regarding sanitizing treatments
The effect of several sanitizing treatments tested on artificially contaminated products has also been
assessed. These treatments are summarized in Table 5.
Table 5 Examples of chemical treatments tested and experimental designs
Type of experiment / Reference
TSP ASC CA PA CD LA AA K3PO4 KO G
Strain Isolation
(Alonso-Hernando et al., 2010) x x x
(del Río et al., 2008) x x x
(Alonso-Hernando et al., 2009) x x x x
Artificial contamination
(Alonso-Hernando et al., 2012a) x x x x x
(Alonso-Hernando et al., 2013) x x x x x
(del Río et al., 2007a) x x x x
(del Río et al., 2006) x
(del Río et al., 2007a) x x x x
Natural contamination
(del Río et al., 2007b) x x x x
(Hinton et al., 2003) x x
(Okolocha et al., 2005) x x x
(Bolton et al., 2014) x x x x x
(Capita et al., 2013) x x x x
TSP: TriSodium Phosphate; ASC: Acidified Sodium Chlorite; CA: Citric Acid; PA: Peroxy Acids; CD: Chlorine Dioxide;
LA: Lactic Acid; AA: Acetic Acid; KO: Potassium Oleate; G: Glutamal.
In laboratory conditions (in vitro), the effect of 3 treatments on the lag phase and on the maximum
growth rate was measured on several pathogenic (Salmonella enterica serotype Enteritidis, L.
monocytogenes) and spoilage (Pseudomonas fluorescens and B. thermosphacta) bacteria (del Río et
al., 2008). Acidified sodium chlorite was the most effective at decreasing the growth of all tested
bacteria, whereas trisodium phosphate and citric acid were more effective against Gram-negative and
Gram-positive bacteria, respectively. However, the effectiveness varied with the concentrations used.
For example, at low concentrations trisodium phosphate increased the growth rate of S. enterica and
L. monocytogenes. As well as the consequence of the strong effect of citric acid toward B.
thermosphacta, the possible increased growth of pathogens was questioned. Thus, the authors
questioned the potential danger to consumers of some treatments, by increasing the proportion of
pathogenic bacteria with regard to the spoilage ones. Alonso-Hernando et al. (2012a) reached the
A.Rouger 2017 Chapitre 1 Synthèse bibliographique
48
same conclusion about the dangerous effects of treatments favoring pathogenic bacteria as an indirect
consequence of inhibiting spoilage bacteria.
In addition, the acid stress response of L. monocytogenes after exposure to acidic poultry meat
decontaminants may even enhance its survival of a subsequent exposure to stronger acidity such as
that encountered during gastric transit (Alonso-Hernando et al., 2009). This adaptation to acidic
conditions involves membrane fluidity in L. monocytogenes and S. enterica and suggests that other
decontaminants should be preferred rather than sub-inhibitory concentrations of citric acid or peroxy
acids (Alonso-Hernando et al., 2010). Other studies have been carried out under laboratory conditions
to investigate the effectiveness of treatments against pathogenic bacteria (Alonso-Hernando et al.,
2013; del Río et al., 2006; 2007a). In summary, these studies showed that trisodium phosphate and
citric acid were effective against Gram-positive pathogenic bacteria and peroxy acids and acidified
sodium chlorite against Gram-negative bacteria. However, the observation of significant reductions in
the microbial level immediately after treatment resulted from trials that were not performed in real
meat conditions.
Naturally contaminated meat matrices have also been used (Bolton et al., 2014; Capita et al., 2013). In
these conditions, all decontaminants tested (trisodium phosphate, lactic and citric acids, peroxy acids,
acidified sodium chlorite) reduced the total viable counts, Enterobacteriaceae, Pseudomonas, and LAB
counts. The most effective concentrations reported were 14% for trisodium phosphate and 5% for
citric acid. Trisodium phosphate, citric acid, acidified sodium chlorite, and peroxy acids were
considered interesting treatments for extending the shelf life and improving the safety of products (del
Río et al., 2007b).
The effectiveness of chemical decontaminants and physical treatments (like steam, hot water, and
electricity) during or after the slaughtering process has been reviewed (Loretz et al., 2010). These
authors emphasized that besides the relative effectiveness of treatments toward a variety of bacterial
species, these must be considered as part of an integral food safety system. In that sense, some authors
also completed the analysis of treatments of carcasses against pathogens with a sensory analysis
performed by trained panelists on the cooked carcasses (Okolocha and Ellerbroek, 2005). Since then,
several other authors have also included the analysis of the sensory impact of decontamination
treatments (see Samant et al., 2015, for a recent review).
The impact of other physical decontamination processes on the microbiology of poultry meat has also
been investigated. High hydrostatic pressure associated with the addition of nisin or glucono-delta-
lactone was effective at decreasing the counts of psychrotrophic bacteria and, to a lesser extent,
mesophilic bacteria (Yuste et al., 1998). Gamma irradiation associated with storage under different
MAP was also effective at reducing LAB, B. thermosphacta, Pseudomonas, and Enterobacteriaceae
(Chouliara et al., 2008). Nevertheless, although such physical treatments have proven their ability to

A.Rouger 2017 Chapitre 1 Synthèse bibliographique
49
reduce the microbial load, they may have indirect effects on the sensory attributes of meat (color,
texture). In addition, the perception by consumers of such practices can be controversial and their use
is regulated differently depending on the country (see Ahn et al., 2013; Garriga and Aymerich, 2009;
EC regulation No. 258/97).
The major bacterial contaminants of poultry meat
Bacterial contaminants
As shown above, a wide range of studies has been dedicated to the detection or enumeration of
various bacterial families and species present on poultry meat. The influence of various storage
processes on microbial growth dynamics during the shelf life of products has also been widely
investigated. The microbial communities present during the product manufacture and then after a few
days of storage have been estimated. To illustrate the diversity of the bacteria targeted, we list the
results (enumerations in log CFU/g) of several studies carried out by cultural methods on chicken meat
(Table 6), resulting in a global inventory of the microbiota that can be encountered. Total viable counts
represent various bacterial species, increasing during storage, and varying considerably between
samples. As an example, we have previously shown that total viable counts from chicken legs sampled
after storage at 4°C for 2/3rds of their shelf life varied from 3 to 8 log CFU/g (Rouger et al., 2017).
Table 6 Values reported for various contaminants occurring on poultry meat. Data were collected from: A (Al-Nehlawi et al., 2013); B (Balamatsia et al., 2007); C (Chaiba et al., 2007); D (Capita et al., 2002a); E (Chouliara et al., 2007); F (Capita et al., 2013); and G (del Río et al., 2007b). Values are expressed in log CFU/g.
A B C D E F G
Total viable count 5 4.9 ND 4.88-5.41 4.28 5.66 ND
Psychrotrophic bacteria ND ND 4.02-4.48 ND ND ND 4
Mesophilic bacteria ND ND 4.74-6.18 ND ND ND 5
LAB ND 3.9 ND ND 3.66 ND 3.5
Pseudomonas 3.5 4.2 ND ND 3.38 ND 4.5
Enterobacteriaceae ND ND ND 2.58-3.53 ND ND 3
B. thermosphacta ND ND ND ND ND ND 4
E. coli 2 ND 0.70-2.34 2.60-3.63 ND ND ND
Coliforms 2.2 ND 3.54-4.64 ND ND ND 3
S. aureus ND ND 0.68-2.43 ND ND ND ND
ND: not determined

A.Rouger 2017 Chapitre 1 Synthèse bibliographique
50
Pseudomonads, often recorded in poultry meat, are mainly represented by the species Pseudomonas
fragi, Pseudomonas lundensis, and Pseudomonas fluorescens (Arnaut-Rollier et al., 1999a; 1999b).
Among Enterobacteriaceae, the main genera are Hafnia (Hafnia alvei, Hafnia paralvei), Serratia
(Serratia fonticola, Serratia grimesii, Serratia liquefaciens, Serratia proteamaculans and Serratia
quinivorans) and Rahnella, Yersinia, and Buttiauxella (Säde et al., 2013). Several new Enterococcus
species such as Enterococcus viikkiensis and Enterococcus saigonensis have also described in poultry
meat products (Rakila et al., 2011; Harada et al., 2016). Among the various reports found in the
literature, some targeted more specifically spoilage bacteria whereas others focused on pathogens.
Spoilage bacteria
Once bacteria contaminate meat and constitute the initial microbiota, the storage conditions and the
various treatments applied shape the fate of this microbiota. The storage temperature as well as the
nature and concentration of the gas used in gas mixtures for packaging are selective for some bacterial
populations. Storage at low temperature favors the growth of psychrotrophic and psychrophilic
bacteria while CO2 has an inhibitory effect on Pseudomonas spp. Some species can survive throughout
the process such as S. putrefaciens, frequently found on carcasses during the slaughtering process and
still present after 14 days of storage under air (Hinton et al., 2004). During storage, the bacterial load
increases but the microbiota diversity decreases compared with that initially present (Chaillou et al.,
2015; Höll et al., 2016). Microbial spoilage occurs as a consequence of the growth and metabolic
activities of spoiling bacteria. In most studies, the bacteria that dominate spoiled food have been
considered those responsible for spoilage and, in some studies, the criterion of microbiological
acceptability (total viable counts reaching 7 log CFU/g) has been used to define spoilage. Examples of
bacteria enumerations in spoiled chicken meat products are listed in Table 7. B. thermosphacta, LAB,
Enterobacteriaceae and Pseudomonas spp. are considered potential spoilers of poultry meat.
However, from these examples, it is clear that these potential spoilage bacteria were not systematically
the dominant ones (columns A, B, and D, Table 7). This suggests either that the presence of bacterial
species causing spoilage was not detected by the methods used in these studies or that spoilage may
be caused by subdominant species. Table 7 also illustrates the extreme variability in the microbial
communities present in spoiled poultry meat and the difficulty of clearly identifying the spoilage
bacteria. Therefore, the definition of poultry meat spoilage bacteria must be considered carefully.

A.Rouger 2017 Chapitre 1 Synthèse bibliographique
51
Table 7 Enumeration of bacteria from spoiled chicken meat. Bacterial counts are expressed as (log CFU/g), except in C (log CFU/cm2). Data were collected from: A (Zhang et al., 2012); B (Capita et al., 2013); C (Chouliara et al., 2007); D (Al-Nehlawi et al., 2013); E (Balamatsia et al., 2007) and F (Björkroth, 2005).
A B$$ C D E F$
Storage duration (days)
4 5 9 11 15 Until
spoiled
Storage temperature
10°C 7°C 4°C 3°C 4°C 6°C
Storage packaging Air Air Air 70% CO2, 15% O2, 15% N2
Air 65% N2, 35% CO2
Total viable count 9.5* 8.27 7.55 6.5 8 9.0
LAB 8* ND 7.02 ND 7 9.1
Enterobacteriaceae 8* ND ND ND 6 7.6
B. thermosphacta ND ND 7.23 ND 6 ND
Pseudomonas 6* ND 7.21 5 6 ND
Coliforms ND ND ND 3.7 ND ND ND: not determined $ marinated poultry $$ bacterial count determination after rinsing with water
A list of bacteria present in different meat products and their occurrence depending on the packaging
atmosphere used for storage has been established by Doulgeraki et al. (2012). Some of them were
reported as poultry meat spoilage microorganisms. B. thermosphacta, P. fluorescens, and S.
putrefaciens are among the spoilage bacterial species most cited in spoiled chicken meat products
(Hinton et al., 2004; Russell, 2008; Zhang et al., 2012). The spoilage potential of Aeromonas
salmonicida, P. fluorescens,
P. fragi and S. liquefaciens has also been evaluated by challenge tests and sensory evaluation (Wang
et al., 2017). A. hydrophila and A. sobria have been reported as psychrotrophic bacteria that could
cause spoilage in addition to being potentially pathogenic for humans (Hinton et al., 2004). Molecular
identification of colonies isolated from marinated spoiled poultry meat showed the involvement of
several LAB species, in particular Leuconostoc gelidum subsp. gasicomitatum and Lactobacillus
oligofermentans (Koort et al., 2005; Björkroth, 2005; Nieminen et al., 2012). Further investigation
based on sensory analyses and genome or metabolic activity characterization of these LAB species
confirmed their role in spoilage (Rahkila et al., 2012; Jääskeläinen et al., 2013). MALDI-TOF MS was
also applied to colonies isolated from chicken breasts stored under 2 different MAPs and at 2 different
temperatures in order to identify spoilage bacteria (Höll et al., 2016). B. thermosphacta, H. alvei and
bacteria belonging to the genera Carnobacterium, Janthinobacterium, Pseudomonas, and Serratia
were identified in the dominant microbiota. However, in this study, spoilage was considered to occur
when total viable counts reached 7 log CFU/g, with no indication about sensory deterioration (Höll et
al., 2016). Most of the species cited above, highlighted by isolation, correlate with the genera detected
A.Rouger 2017 Chapitre 1 Synthèse bibliographique
52
by sequencing after PCR-DGGE of DNA extracted from broiler chicken carcasses following storage
under different conditions (Zhang et al., 2012).
Pathogens
Numerous articles have investigated the prevalence of various pathogens in poultry meat. Among
these, Campylobacter and Salmonella make up a large majority of the reports. These two human
pathogens can be present at high loads in the gastrointestinal tract of birds but, after contamination
of poultry meat, it is important to detect their presence even at a very low level. Therefore, some
studies have focused on establishing correlations between the occurrence in animals and in meat (Hue
et al., 2011). The emergence of antimicrobial resistance among foodborne pathogens is also
extensively recorded (for a recent review, see Grant et al., 2016). In addition, the impact of breeding
or farming on the prevalence and antibio-resistance in Campylobacter has been addressed (Economou
et al., 2015). Methods for fast and accurate detection and identification of Campylobacter have been
proposed (Fontanot et al., 2014, and references therein). Nevertheless, the data obtained by different
methods should be carefully interpreted. As an example, the Campylobacter proportion enumerated
in poultry feces determined either by high-throughput sequencing or by plating on various
Campylobacter selective media gave quite different values (Oakley et al., 2012). Both C. jejuni and C.
coli can be isolated from poultry meat (Hue et al., 2011), but also from human clinical cases that may
result from contaminated food consumption (Wassenaar and Newell, 2006). No clear correlation could
be established between the presence of Campylobacter in poultry meat and the level of bacterial
contamination of chicken or turkey cuts (Fontanot et al., 2014). Salmonella enterica is among the most
tracked human pathogen with the serovar Enteritidis being mainly associated with poultry meat and
with outbreaks (Jackson et al., 2013). Other foodborne human pathogens present in various meat
products have also been investigated such as Listeria monocytogenes (Capita et al., 2001;
Gudbjörnsdóttir et al., 2004; Van Nierop et al., 2005; Cohen et al., 2007; Alonso-Hernando et al.,
2012b). Listeria spp. prevalence in poultry meat is noticeable with Listeria innocua as the dominant
species followed by L. monocytogenes and several other Listeria species (Listeria welshimeri, Listeria
grayi, and Listeria ivanovii). The prevalence of Staphylococcus aureus on poultry meat products has
been addressed although most of the literature has focused on antibiotic resistance and typing of the
isolates (Capita et al., 2002b; Waters et al., 2011; Akbar and Anal, 2013; Krupa et al., 2014). Although
there are a few reports on the detection of Clostridium perfringens on poultry meat (for example, see
Cohen et al., 2007) most of the literature focuses on assessing and modeling its growth on meat after
spore germination following the slaughtering process (Juneja et al., 2013; Mohr et al., 2015; Huang,
2016). Lastly, the emergence of Aeromonas from poultry meat products as a vector of human infection
has also been reported (Praveen et al., 2016). Among Aeromonas spp. detected on poultry carcasses,

A.Rouger 2017 Chapitre 1 Synthèse bibliographique
53
A. caviae, A. hydrophila, A. salmonicida-masoucida, and A. schuberti have been reported to survive
after 14 days of product storage (Hinton et al., 2004).
Conclusion
The poultry meat sector tends to provide ready to eat products, which are safe for the consumer and
have a long shelf life. Thus, the impact of various treatments (temperature, chemical treatment,
marinade, or preservation processes) in reducing pathogens has been investigated. Many studies have
also been conducted to test such treatments for extending the shelf life and avoiding spoilage.
The large number of publications dedicated to poultry meat microbiology and the variety of the results
highlight the wide diversity of the microbiological status of poultry meat products. The bacterial loads
can vary by several log CFU/g for similar cuts, stored under similar conditions. To date, the microbial
ecology of poultry meat products has been considered mainly through cultural methods, which can
introduce a bias because of the relative selectivity of the media used. In particular, poorly selective
media targeting large families of bacteria such as LAB or Enterobacteriaceae have been used, leading
to a poor characterization of the bacterial species present. The studies aimed at assessing the spoilage
and/or shelf life of the products have used various criteria that make it difficult to describe clearly
which bacteria can spoil poultry meat under which conditions, except for marinated poultry. In fact,
marinades providing sugar and acetic acid lead to a pressure selection on the bacterial diversity,
including bacteria responsible for spoilage, with the identification of the bacterial functions involved
in spoilage appearance. Concerning pathogens, most of the efforts have focused on tracking them
while only a few describe their behavior in the meat matrix and consider the meat microbiota. In fact,
two approaches can be distinguished: one focusing on only one or a few species, mostly pathogenic,
with little attention paid to the microbiota because of the low contamination level of pathogens
regarding that of total counts; and one focusing on a wider range of microbes, but assessing microbiota
with techniques that induce a bias in the identification or that are generalist because of the media
used. A third approach, already used for investigating complex environments, has recently appeared
in food microbiology and tends to study the microbiota by non-cultural methods. The advantage of the
latter is a better description of the bacterial species present on poultry meat, regardless of the
detection of pathogens that are often present at a lower level. Finally, although the gastrointestinal
tract of birds and slaughtering facilities have been identified as the main reservoirs for the origin of
poultry meat contaminants, there is a lack of knowledge about the flux of microbiota from the animals
to the end products. The few studies about the transmission from animal to meat have mainly focused
on pathogens.

A.Rouger 2017 Chapitre 1 Synthèse bibliographique
54
The combination of high throughput sequencing approaches with highly selective cultural methods
throughout the production chain will be necessary to assess the nature and origin of meat
contaminants and their dynamics during processing and storage.
Acknowledgments
This work was financed by the “Région Pays de la Loire” (PhD grant to AR) and the project was
supported by Valorial, an agri-food competitiveness cluster. We thank Catherine Magras and Hervé
Prévost, Professors at Oniris (Nantes, France) and Benoît Remenant, Project manager at Anses (Angers,
France), for helpful discussions.
1.2.3- Ce qu’il faut retenir de la revue
La viande est inévitablement contaminée lors des étapes d’abattage et de transformation (plumaison,
éviscération, découpe…). Les méthodes culturales sont le plus souvent utilisées pour décrire ces
contaminations. Bien que largement utilisées dans l’industrie pour surveiller le niveau de
contamination et la présence de Salmonella (critère de sécurité de la viande), ces méthodes, dont les
biais sont maintenant identifiés, ne sont pas exhaustives pour la description des contaminations
bactériennes. D’autres méthodes, en particulier de biologie moléculaire, existent bien que peu
utilisées au niveau industriel. Ces méthodes souvent plus rapides permettent de s’affranchir des biais
liés à la non-cultivabilité des bactéries. Dans la littérature, il est noté que suivant les découpes choisies
(présence de la peau ou non), suivant les saisons ou encore suivant les procédés de transformation
(volaille entière, différentes découpes) la charge bactérienne est variable. Ainsi, si l’on souhaite étudier
l’influence de paramètres de conservation sur les contaminants, une réflexion s’impose pour la mise
au point d’un protocole standard permettant des expériences reproductibles pour s’affranchir de cette
variabilité.
1.3- Microbiotes standards
1.3.1- Pourquoi utiliser un microbiote standard ?
La définition de l’écologie microbienne énoncée par Thomas Brock est l’étude du comportement et
des activités des microorganismes dans leur environnement naturel (Brock, 1978). Dans le cadre de
notre étude des communautés bactériennes de viande de poulet, nous avons constaté que les
contaminations microbiennes suivant les lots peuvent être très variables. Outre le fait de décrire les

A.Rouger 2017 Chapitre 1 Synthèse bibliographique
55
communautés bactériennes présentes nous souhaitions comprendre leurs dynamiques au cours du
stockage avec l’idée de pouvoir un jour les maitriser plus efficacement. Une étude de Møller et al.
(2013) a comparé la croissance de Salmonella inoculée sur de la viande stérile ou sur de la viande
naturellement contaminée. Des modèles mathématiques de prédiction de la croissance de cette
bactérie pathogène ont été développés et les auteurs ont noté que Salmonella semble moins se
développer en présence du microbiote naturel de la viande. Il est donc intéressant de tenir compte de
l’ensemble des contaminants.
Dans ce contexte, l’utilisation d’un microbiote standard va permettre d’améliorer grandement la
répétabilité des expérimentations et va fournir des données reproductibles, s’affranchissant ainsi de
la variabilité entre les lots. Ce microbiote sera une approximation de la réalité mais sera utile pour
établir des hypothèses et répondre à des questions en conditions réelles de conservation de la viande.
Un dessin de l’humoriste vétérinaire Kastet (Figure 9) résume ce propos montrant la complexité du
microbiote intestinal de l’homme par rapport à la vision que l’on peut avoir dans des conditions de
laboratoire.
Figure 9 Dessin de l’humoriste vétérinaire Kastet représentant la complexité du microbiote
intestinal de l’homme2.
Un modèle d’étude visant à mimer la viande de poulet a été mis au point par Birk et al. (2004). Ce « jus
de poulet » se rapproche au mieux de l’aliment pour étudier le comportement de Campylobacter.
L’équipe note la simplification des expériences en milieux de culture mais comme pour tous les
écosystèmes bactériens, la proportion des différents contaminants que l’on obtient par méthode
culturale ne reproduit pas la réalité et la complexité de l’écosystème. Il nous revient alors de
2 (Corpet & Brugère, Revue de Médecine Vétérinaire, 1995, 146, 2, 73-92)

A.Rouger 2017 Chapitre 1 Synthèse bibliographique
56
développer un écosystème standard qui se rapprocherait au plus près de la viande de poulet
naturellement contaminée.
1.3.2- Les pratiques utilisées en écologie microbienne
Dans le domaine des sciences de l’environnement (sol, océan, etc…), l’écologie microbienne a connu
un essor depuis une trentaine d’année. L’utilisation de dispositifs expérimentaux appelés microcosmes
permet de réunir plusieurs espèces en interactions dans un système de taille réduite afin d’étudier les
interactions biotiques. En 1980, les 1e échantillons d’ADN sont extraits à partir de sol. Nesme et al.
(2016) font une revue sur les méthodes utilisées dans ce domaine : le 1e séquençage par
métagénomique a eu lieu en 2005 et la 1e étude en métatranscriptomique a lieu l’année suivante. Par
exemple lors de prélèvements d’eau ou de sol, il est possible de récolter une grande quantité d’une
même matrice. Suivant les questions biologiques que l’on se pose, cela peut permettre de s’affranchir
de la variabilité liée à l’échantillon. Si l’on souhaite étudier une dynamique des communautés
bactériennes au cours d’une cinétique cela est faisable par exemple à l’échelle d’un océan en fixant le
même point de prélèvement. Mais la situation est plus compliquée en science des aliments. Pour cela
les chercheurs utilisent un même lot, par exemple un même lot de viande (même abattoir, même
jour,…) et peuvent stocker les échantillons. Il faut donc s’assurer que les variations observées sont dues
aux conditions expérimentales et non à la variabilité du lot.
Une des solutions pour s’affranchir de la variabilité est l’utilisation d’un modèle d’étude représentatif
de l’écosystème à observer. L’étude de l’écosystème fromager illustre cette approche. En effet, le
fromage est un aliment fermenté qui a donné lieu à de nombreuses études. Le fromage peut être
réalisé à partir de différent consortia microbiens. Callon et al. (2011) ont inoculé du lait avec des
consortia plus ou moins simplifiés pour fabriquer des fromages et montrer leurs effets anti-listeria.
Ainsi l’écosystème microbien peut être simplifié. L’inventaire des espèces bactériennes et des levures
et moisissures des écosystèmes fromagers a été réalisé au cours d’une thèse (Cholet, 2006). Devant la
complexité de l’écosystème (Monnet et al., 2016) une étude de métatranscriptomique a été réalisée
in situ sur un fromage Reblochon fait avec quelques souches bactériennes et de levures. Ce reblochon
est produit avec deux bactéries lactiques Streptococcus thermophilus et Lactobacillus delbrueckii sp.,
une bactérie d’affinage, Brevibacterium aurantiacum et deux espèces de levures Debaryomyces
hansenii et Geotrichum candidum. Ce consortium d’inoculation permettait de diminuer la complexité
du microbiote du fromage et d’étudier les comportements et les activités de quelques espèces
majoritaires, déjà décrites dans la littérature et dont les génomes sont séquencés.

A.Rouger 2017 Chapitre 1 Synthèse bibliographique
57
L’inoculation simplifiée est une solution bien adaptée pour traiter des produits fermentés. Cependant
pour des matrices non fermentées (charge bactérienne plus diverse et moins élevée), la dynamique
écosystémique est perdue et l’on étudie alors les capacités d’une ou quelques souches microbiennes
seulement. Pour exemple, les études portant sur les microbiotes intestinaux complexes ont recours à
des souris axéniques inoculées avec une flore intestinale. En 1874, Billroth démontre que les fœtus
extraits chirurgicalement de manière stérile sont dépourvus de germe (Billroth, 1874). On parle alors
d’« axénie». En laboratoire, il est assez aisé de maintenir les nouveaux nés d’animaux en
environnement stérile. Ainsi sur des animaux maintenus axéniques, il est possible d’inoculer une flore
connue, on parle alors d’animaux gnotobiotiques (Gnoto, en grec signifie « connu », biota évoque les
« formes de vie »). L’utilisation de souris axéniques que l’on inocule avec des flores isolées de
microbiote humain est un modèle d’étude utilisé pour comprendre comment le microbiote intestinal
influence l’organisme (Corpet et al., 1989).
Ainsi pour aborder l’écologie microbienne on peut avoir recours à un écosystème simplifié
représentatif de l’écosystème à étudier ou le constituer. Lors de l’étude d’aliments non fermentés dont
la charge bactérienne est plus faible mais plus diverse que celles des aliments fermentés, il est difficile
de simplifier l’écosystème microbien tout en gardant une diversité importante. La méthode la plus
simple pour constituer ce microbiote standard est donc l’inoculation d’une flore connue sur une
matrice stérile.
1.3.3- Challenge tests : inoculation sur des matrices pauci microbiennes
En microbiologie des aliments, des challenges tests sont souvent effectués, dans lesquels on inocule
sciemment une ou plusieurs espèces bactériennes sur une matrice afin d’examiner un phénomène. Il
s’agit d’une technique utilisée pour démontrer par exemple l'efficacité antimicrobienne d'une
substance produite par une souche donnée, ou pour étudier le potentiel d’altération d’une ou de
plusieurs espèces ou souches. Comme mentionné précédemment, les matrices alimentaires sont
naturellement contaminées. Afin de s’affranchir de ce problème et suivant l’objectif de l’étude,
l’inoculation se fait sur une matrice stérile (ou pauci microbienne) ou bien sur une matrice
naturellement contaminée.
Pour rendre une matrice pauci-microbienne la pratique utilisée en microbiologie environnementale,
est réalisée par dilution de l’échantillon pour diminuer la charge bactérienne, par exemple avec des
échantillons de sol (Philippot et al., 2013). Rendre une matrice alimentaire liquide stérile est aussi
possible par filtration ou stérilisation. Cependant ces méthodes sont peu adaptées à la matrice viande
(solide et crue). Pour des matrices solides telles que la viande, Juck et al. (2012) ont utilisé un
traitement thermique couplé à un traitement par hautes pressions. L'objectif de cette étude était de

A.Rouger 2017 Chapitre 1 Synthèse bibliographique
58
déterminer la pression d'inactivation des agents pathogènes dans un modèle alimentaire. Si les agents
pathogènes sont bien détruits, la structure et la composition de la matrice est également modifiée.
Dans ce type d’approche un biais sur la croissance des bactéries sera observé. Le traitement thermique
impose de travailler sur une matrice cuite.
L’ionisation est la méthode la plus utilisée en microbiologie des aliments (Joffraud et al., 1998, Warsow
et al., 2008, Fall et al., 2012). L’ionisation par rayons X ou γ permet de prolonger la durée de
conservation et d’inactiver les bactéries. Dans la littérature, différentes doses appliquées ont été
rapportées: une dose de 11,95 kGy pour ioniser de la viande de dinde (Warsow et al., 2008); 1,5 à 3
kGy pour du saumon (Joffraud et al., 1998) ou encore 3,76 kGy pour des crevettes cuites décortiquées
(Fall et al., 2012). Cette méthode présente toutefois des limites : elle peut générer des molécules
comme des formes réactives de l’oxygène, pouvant avoir un effet antagoniste ou inhibiteur sur les
bactéries ré-inoculées ou sur les enzymes comme la Taq Polymérase (Consortium du projet ANR
ECOBIOPRO, résultats non publiés).
La découpe stérile peut être utilisée pour certaines matrices. En effet, l’intérieur du muscle, juste après
l’abattage, est stérile. Ainsi en effectuant une découpe, à l’aide d’ustensiles stériles, suivi d’un
traitement rapide à l’éthanol on peut alors obtenir une matrice pauci-microbienne comme décrit par
Jorgensen et al. (2001) avec du saumon.
Nous comprenons donc qu’il est possible de constituer une matrice dite standard (microbiote connu)
afin d’étudier l’écologie microbienne de la viande de poulet. Pour cela, quels sont les outils pour
étudier communautés bactériennes dans leur globalité ?
1.4- Méthodes utilisées en écologie microbienne / Approches omiques combinées
1.4.1- Limites des milieux de cultures pour l’écologie microbienne
Plusieurs études ont montré les limites des méthodes cultures-dépendantes pour identifier les
bactéries (Martin-Platero et al., 2008, Jaffrès et al., 2009). En effet, comme l’évoquent Juste et al.
(2008) sur des matrices fermentées simples, de 25 à 50% de la communauté bactérienne n’est pas
cultivable par les méthodes utilisées en laboratoire. L’existence d’un état viable non cultivable (VBNC)
est controversé mais pourrait expliquer les différences parfois observées entre les résultats obtenus
par méthodes moléculaires et culturales (Stokell & Steck, 2001). D’autres hypothèses peuvent
expliquer les limites des méthodes culturales comme notamment la sélectivité des milieux ou encore

A.Rouger 2017 Chapitre 1 Synthèse bibliographique
59
les conditions d’incubation. Ercolini (2004) a également évoqué les limites de ces méthodes culturales
en expliquant le manque de connaissances sur le développement bactérien dans son habitat naturel.
En effet, il est difficile de reproduire les conditions de l’environnement sur un milieu de culture
universel. Les milieux de culture sont utiles lorsque l’on étudie une espèce bactérienne en particulier
avec un milieu propre à l’espèce étudiée (Basu et al., 2015). En revanche pour des communautés
complexes, il existe des milieux plus ou moins sélectifs permettant le dénombrement et la détection
de certaines espèces, pathogènes notamment. Juste et al. (2008) montrent que les techniques
moléculaires permettent de montrer la diversité d’un écosystème, d’identifier les bactéries qui le
composent et enfin de les quantifier.
Il existe de nombreuses méthodes indépendantes de la culture pour identifier les espèces bactériennes
parmi lesquelles, l’hybridation in situ et microscopie de fluorescence (FISH) ou encore la PCR couplée
à la TTGE (Temporal temperature gradient gel electrophoresis) ou à la DGGE (Denaturing Gradient Gel
Electrophoresis) mais aussi le séquençage à haut débit. Ces méthodes sont listées dans la revue
précédemment présentée. Nous nous concentrerons dans la suite de cette synthèse bibliographique
sur les méthodes de séquençage à haut débit utilisées dans ce projet.
1.4.2- Le pyroséquençage
Depuis les premières méthodes décrites en 1977 par Maxam et Gilbert et par Sanger et al. (Maxam &
Gilbert, 1977, Sanger et al., 1977), les méthodes de séquençage ont largement évolué du séquençage
d’un gène, d’un génome complet jusqu’à permettre aujourd’hui le séquençage d’un microbiote.
Le pyroséquençage est une des premières techniques dite « innovante » de séquençage à haut débit
décrite par Margulies et al. (2005). Cette équipe développe une technique de séquençage à très haut
débit, on parle de séquençage de nouvelle génération NGS. Ils décrivent la technologie 454
(développée par Roche) utilisée pour décrire des écosystèmes alimentaires. Comme travaux pionniers
dans le domaine, on peut citer Humblot & Guyot (2009), Jung et al. (2011), Sakamoto et al. (2011),
Park et al. (2012). Elle permet de séquencer à partir de molécules d'ADN uniques et de traiter, en une
seule fois, plus de 20 millions de bases nucléotidiques par cycle de quatre heures, ce qui correspond à
plus de 100 fois la capacité des instruments reposant sur les techniques de type Sanger. Le
pyroséquençage permet alors le séquençage rapide (5 jours pour un génome microbien) et
révolutionnaire par rapport à la méthode Sanger et à moindre coût. Cette méthode est dite « semi
quantitative » car la proportion d’une séquence par rapport à une autre (et donc d’une espèce
bactérienne par rapport à une autre) peut être évaluée sans toutefois apporter d’éléments précis sur
la proportion des individus au départ.

A.Rouger 2017 Chapitre 1 Synthèse bibliographique
60
Humblot et Guyot (2009) ont utilisé pour la première fois le pyroséquençage de l’ADN ribosomique
(ADNr) 16S pour déchiffrer le microbiome d'un aliment fermenté. Néanmoins, à cette époque-là seules
200 pb du gène de l'ARNr 16S pouvaient être séquencées, et parce que les espèces bactériennes
impliquées dans le processus de fermentation étaient phylogénétiquement proches, l’assignation
taxonomique n'a été possible que jusqu'au niveau du genre. Mais ce problème a également été
rencontré dans d'autres méthodes couramment utilisées telles que la PCR-DGGE suivie par le
séquençage des bandes.
1.4.3- Evolution des techniques de séquençage
Les techniques de séquençage à haut débit évoluent rapidement. Goodwin et al. (2016) décrivent les
différentes technologies utilisées maintenant en routine (Pacific BioSciences, Illumina, SoliD, …) avec
les caractéristiques de chacune (Tableau 3).
Tableau 3 Comparaison des techniques de séquençage haut débit en fonction de la longueur des lectures et du nombre de lectures par cycle de séquençage. D’après Alberti et Labadie, Journée Transcriptomique Génoscope juin 2014, Glenn (2011) et Goodwin (2016).
Technologie de séquençage
Longueur maximum des lectures
Nb de séquences (millions)
Données générées
Durée du séquençage
Roche 454 GS Flex + 800 pb 1 800 Mb 1 jour
Illumina
HiSeq 2x250pb 3000 10-1800 Gb Quelques jours
MiSeq 2x300pb 15 -25 0.3-15 Gb Quelques heures
NextSeq 2x150 pb 130-400 16-120 Gb Quelques heures
PacBio RSII 30 kb 0.05 275-375 Mb Quelques heures
Life technologie
SOLiD 75 pb 1400 25-100 Gb Quelques jours
Ion PGM 400pb 0.5-5 30 Mb -2 Gb Quelques heures
IonProton 200 pb 60-80 10 Gb Quelques heures
Les différents avantages et inconvénients de ces technologies de séquençage sont listés dans le
Tableau 4.
L’évolution des technologies de séquençage est très rapide. En octobre 2013, la technologie 454 de
Roche est arrêtée. En parallèle, Illumina est la technologie la plus couramment utilisée dans la
littérature (HiSeq en 2010, MiSeq en 2012 et NextSeq en 2013). Fondée en 1998, la société Illumina
développe son propre service de séquençage en 2009. Aujourd’hui on estime à 90% des séquences

A.Rouger 2017 Chapitre 1 Synthèse bibliographique
61
d’ADN produites sur des machines Illumina3. De son côté, Ion Torrent la technologie de séquençage
haut débit de Life technologies se développe aussi (SOLiD en 2007, IonPGM en 2010 et IonProton en
2012).
Tableau 4 Avantages et inconvénients des différentes technologies de séquençage à haut débit. Source Alberti et Labadie, Journée Transcriptomique Génoscope juin 2014
AVANTAGES INCONVENIENTS
454 Roche -Séquençage de longs fragments
(> 800 bases)
-Préparation des banques -Taux erreur élevé (homo-polymères) -Coût élevé (systèmes enzymatiques)
-Débit limité
Illumina
-Débit élevé -Taux erreur <2%
-Coût -Large domaine d’applications
-Lectures courtes (haut débit) -Fréquence des évolutions techniques et
logicielles -Taille des fichiers générés
-Faible complexité (haut débit)
SOLiD -Débit (150 Gb/sem)
-Coût -Taux erreur <1%
-Préparation des banques -Lectures courtes
-Complexité d’analyse
Ion PGM Ion Proton
-Pas de système optique mais un détecteur électronique
-Utilisation de nucléotides non marqués -Capacités dépendantes des puces
-Préparation des banques -Difficulté à séquencer les homopolymères
-Coût -Taux d’erreur (~10%)
PacBio -Pas d’amplification
-Rapidité (3 bases/sec) -Longueur de lecture (5 Kb en moyenne)
-Taux d’erreur élevé (~15%) -Photo-inactivation de la polymérase
-Coût
Les technologies de séquençage peuvent être comparées selon différents critères : le coût, le débit
mais aussi le taux d’erreur et la procédure de préparation des échantillons. Les coûts de séquençage
ont largement diminué à ce jour tandis que les débits de séquençage ne cessent d’augmenter
(5000$/Mb et 1Mb / jour en 2005 contre 0.03 $/ Mb et 160Gb /jour en 2013). L’équipe de Liu et al.
(2012) a comparé des systèmes de séquençage tandis que Ross et al. (2013) ont mesuré les biais de
séquence. Lors du séquençage, des erreurs peuvent survenir. Nakamura et al. (2011) listent les erreurs
retrouvées dans les séquenceurs Illumina. Les technologies Illumina semblent générer moins d’erreurs
(0.01 % à 1 %) que les technologies Ion Torrent (0.1 % à 10 %) par exemple (Ross et al., 2013).
1.4.3- Biais liés à ces méthodes de séquençage
Comme pour les méthodes culturales, les techniques moléculaires présentent elles aussi de nombreux
biais qui peuvent impacter l'analyse de la diversité microbienne d'un échantillon. Head et al. (1998)
font le point sur dix années d'études moléculaires ainsi que sur les biais de l'ensemble de ces
3 www.technologyreview.com/s/531091/emtech-illumina-says-228000-human-genomes-will-be-sequenced-this-year/

A.Rouger 2017 Chapitre 1 Synthèse bibliographique
62
techniques de biologie moléculaire. Dans ce paragraphe nous nous intéresserons aux biais
couramment décrits en lien avec la procédure de séquençage haut débit.
La procédure de traitement d’un échantillon classiquement utilisée est présentée Figure 10.
Wintzingerode et al. (1997) font un inventaire des biais majeurs rencontrés à chacune des étapes
d’amplification et de séquençage. Pour chaque étape clé, voici quelques remarques ou questions à
soulever.
Figure 10 Procédure de traitement d’un échantillon en vue de l’analyse de la diversité bactérienne.
Suivant la question de recherche, l’échantillonnage peut varier. En effet, suivant si l’on cherche à
décrire les communautés bactériennes ou si l’on souhaite réaliser une cinétique, le prélèvement des
bactéries ne sera pas le même. L’échantillon doit être représentatif de l’environnement étudié. C’est
pourquoi il faut aussi s’assurer que l’échantillon soit suffisamment contaminé, permettant une
extraction d’acides nucléiques en quantité suffisante. La question de la protection (lyse, multiplication)
des bactéries durant le transport ou le moment de collecte peut être importante. Par exemple la
procédure pour filtrer 200 L d’eau ou prélever 10 g de matrice ne nécessite pas les mêmes précautions.
Les acides nucléiques peuvent être extraits directement à partir de la matrice étudiée mais des résidus
pouvant inhiber ou limiter les étapes suivantes peuvent subsister.
Lors de la collecte des bactéries, il faut s’assurer du rendement de cette étape. En effet si les bactéries
sont organisées en biofilm par exemple ou en surface d’une matrice, la méthode devra être adaptée.
Echantillons de viande
Extr
acti
on
d’a
cid
es
nu
cléi
qu
es
Collecte des bactéries
Purification(s)
Amplification
Lyse
Contrôles qualitéet quantité
Séquençage
Préparationde la librairie
Contrôles qualitéet quantité

A.Rouger 2017 Chapitre 1 Synthèse bibliographique
63
La procédure de stockage des bactéries (couramment à -80°C en présence de glycérol) devra être
réfléchie. Lors des travaux portant sur le séquençage de l’ADNc, il est préconisé de stopper les
réactions se produisant dans le milieu, en plongeant les culots bactériens dans l’azote liquide par
exemple (McCarthy et al., 2015).
Lors de l’étape de lyse, l’efficacité du traitement, qu’il soit chimique ou mécanique, doit être prise en
compte. Une lyse mécanique trop forte peut engendrer la fragmentation ou la dégradation des acides
nucléiques, provoquant ainsi une source importante d’erreurs lors des étapes d’amplification
(formation de séquences chimériques par exemple).
De plus les ARN sont sensibles aux RNases potentiellement présentes dans le milieu et pouvant être
co-extraites avec les ARN. Différentes solutions de protection (RNA protect ou RNA later) existent pour
y remédier (McCarthy et al., 2015).
Différents kits de purification existent. Le plus souvent, ils sont composés de colonnes de fixation par
affinité des acides nucléiques, afin de les nettoyer puis ensuite de les éluer dans un tampon adapté.
Ces colonnes peuvent être saturées si la quantité d’acide nucléique est trop importante. Il faut donc
s’assurer de la gamme prévue par le fabriquant du kit. La fragilité de l’ARN nécessite de travailler
rapidement et sur glace afin d’inhiber au maximum les réactions enzymatiques. Même si des kits sont
couramment utilisés, l’extraction d’acides nucléiques bactériens à partir de matrice alimentaire
nécessite des étapes de mise au point (Pinto et al., 2007). La présence d’inhibiteur de PCR dans la
matrice par exemple peut engendrer des biais lors des étapes ultérieures. Dans le sol par exemple,
l’acide humique est connu comme étant un inhibiteur de PCR (Feinstein et al., 2009). Certains
fabricants ont breveté des technologies d’anti-inhibiteurs présents dans leurs kits (Faber et al., 2013).
Après extraction, différentes étapes peuvent être nécessaires. Pour exemple en
métatranscriptomique, les ARN extraits comportent jusqu’à 95% d’ARNr qui peuvent être retirés par
déplétion. Des kits utilisés pour cette étape permettent de retirer également des potentiels ARN
eucaryotes, mitochondriaux ou chlorophylliens contaminants. Ces différentes étapes peuvent
influencer le rendement d’extraction. La quantité et la qualité des acides nucléiques dépendent donc
de la concentration bactérienne initiale mais aussi des différents rendements de chacune des étapes.
Dans le cas d’études de diversité à partir d’un gène représentatif (16S ou gène de ménage par
exemple), les acides nucléiques sont amplifiés. Nous avons vu que la présence d’inhibiteur de PCR dans
la matrice peut influencer mais une contamination par de l’ADN ou de l’ARN eucaryotes peut
également générer des biais lors de l’identification par exemple (Glassing et al., 2016). Des difficultés
d’amplification par PCR ont été mises en évidence lors de la détection de Salmonella sur de la viande

A.Rouger 2017 Chapitre 1 Synthèse bibliographique
64
naturellement contaminée ou inoculée (Bülte & Jakob, 1995). Un biais lors des amplifications par PCR
peut également exister avec des bactéries dites VBNC par exemple (Ceuppens et al., 2014).
Le choix des amorces est également une étape clé. En effet, pour étudier la totalité des communautés
bactériennes, des amorces permettant d’amplifier un fragment de l’ADNr 16S sont le plus souvent
utilisées. Cependant le nombre de copies de ce gène (et parfois la séquence) varie suivant les espèces,
ce qui entraine des biais lors de la quantification ; on parle alors de quantification semi-relative
(Klappenbach et al., 2000). De plus les amorces utilisées pour le pyroséquençage sont longues (environ
30 pb) et peuvent s’hybrider entre elles et limiter le rendement de la PCR. Des amorces dites
universelles peuvent permettre l’amplification de fragments plus ou moins longs entrainant alors des
difficultés lors de l’amplification. Le choix de la polymérase est donc important (Abu Al-Soud &
Rådström, 1998). La fidélité d’une polymérase doit permettre de ne pas générer trop d’erreurs lors de
l’amplification mais elle doit également être efficace pour amplifier des fragments longs (Keohavong
& Thilly, 1989, Cline et al., 1996). Des solutions comme la T4gene 32 permettent de faciliter les
amplifications (Wilson, 1997, Abu Al-Soud & Rådström, 2000). C’est lors de l’étape d’amplification que
peuvent être formées des séquences chimériques. Des fragments, dont la synthèse ne se serait pas
terminée à temps lors d’une phase d’élongation de la PCR, peuvent servir d’amorces sur un brin d’ADN
différent pour le cycle suivant. Lors de la phase d’élongation suivante, la synthèse continue sur ce
deuxième ADN et le fragment ainsi obtenu est composé de deux morceaux d’ADN provenant de deux
espèces bactériennes différentes. Ces fragments, s’ils sont générés lors des 1e cycles de PCR peuvent
être largement représentés lors du séquençage (Haas et al., 2011). La détection des séquences
chimériques, lors du nettoyage des lectures obtenues, doit donc être envisagée.
Il est aussi possible de séquencer l’ADN sans étape préalable d’amplification par PCR. C’est le cas dans
l’étude de Nieminen et al. (2012) qui ont réalisé à la fois le séquençage d’un fragment de l’ADNr 16S
et le séquençage de l'ADN total extrait de viande de poulet marinée et stockée pendant 13 jours à 6°C.
Un total de 560 000 séquences brutes a été obtenu. Les séquences provenant des cellules de poulet
ont été retirées en les comparants au génome de Gallus gallus. Les auteurs ont montré que la marinade
diminue les proportions de B. thermosphacta, de Clostridium et d’Enterobacteriaceae dans le
microbiote des produits étudiés. Cette analyse métagénomique a révélé la présence de bactéries non
associées à l’altération de produits marinés comme Vagococcus et Vibrio. Ainsi, les résultats
confirment que la marinade peut prolonger la durée de vie sensorielle de la viande de poulet en
retardant la croissance de bactéries associées à l'altération et en favorisant Leuconostoc
gasicomitatum.

A.Rouger 2017 Chapitre 1 Synthèse bibliographique
65
Le contrôle de la qualité et de la quantité d’acides nucléiques est nécessaire avant le séquençage.
Plusieurs appareils permettent le dosage de la concentration d’acides nucléiques. Les plus
couramment utilisés sont le spectrophotomètre NanoDrop ou le spectrofluoromètre Qubit présenté
comme la meilleure méthode pour doser les acides nucléiques (Robin et al., 2016). La qualité des
acides nucléiques peut être vérifiée sur des puces à ARN ou ADN à l’aide de systèmes d’électrophorèse
en micro-capillaires automatisés (par exemple le Bioanalyzer d’Agilent ou l’Experion de Biorad).
Bien que la qualité des séquences dépende de la pureté de l’ADN séquencé, Tyler et al. (2016) ont
montré l’importance de la méthode de préparation des librairies. L’optimisation des méthodes de
préparataion des libraires Illumina a été rapportée (Oyola, et al., 2012). Par exemple le kit de
préparation de librairies Illumina TruSeq produit des données présentant une qualité plus uniforme
qu’après utilisation de la méthode Nextera XT. Les biais principalement identifiés lors de la
fragmentation des acides nucléiques ou lors d’amplifications aléatoires sont décrit dans la revue de
(van Dijk et al., 2014).
Une fois les librairies préparées, le séquencage peut avoir lieu. Nous avons vu précedemment les
avantages et inconvénients de chacunes de ces méthodes.
1.4.4- Bio-analyse : pipelines et utilisation de bases de données
L’identification des espèces se base sur la comparaison par rapport à des séquences d’ADN. Les
logiciels d’analyse de données requièrent donc des bases de données de séquences fiables et
exhaustives afin de comparer les séquences obtenues à des séquences références. Les méthodes de
séquençage à haut débit ont généré une pléthore de séquences disponibles dans différentes bases de
données. Ainsi il existe une multitude de séquences plus ou moins complètes et de plus ou moins
bonne qualité de bactérie comme évoqué dans la littérature (Humblot & Guyot, 2009).
Les pipelines et logiciels d’analyses de données, bien qu’en constante évolution, sont de plus en plus
accessibles (Mothur, Qiime, Frogs…). Ils reposent tous sur le même principe illustré Figure 11.

A.Rouger 2017 Chapitre 1 Synthèse bibliographique
66
Figure 11 Procédure d'analyse des données de séquençage haut débit
Des contrôles qualité permettent de vérifier le nombre de séquences mais aussi leur qualité en sortie
de séquenceur et après les étapes de nettoyage pour vérifier que ce dernier a bien été effectué.
La plupart des études visent à identifier des espèces bactériennes au sein d’écosystèmes complexes
basées sur la séquence de l’ADNr. En effet cet ADN, existant chez toutes les espèces, présente des
zones très conservées et d’autres spécifiques de chaque genre ou espèce. Ainsi les zones conservées
peuvent alors servir pour dessiner des amorces pour amplifier par PCR la même région d’ADNr à partir
d’ADN total extrait d’un écosystème. En revanche, la séquence des zones spécifiques peut servir à
identifier les espèces ou les genres. Des bases de données de séquence d’ADNr ont été créées,
contenant des séquences non redondantes et curées, afin de permettre d’identifier ses propres
données par comparaison (Cole et al., 2005, Cole et al., 2007). Ce type de base de données classe et
met à jour mensuellement toutes les données provenant des recherches scientifiques concernant les
séquences d’ADNr. Une étude visant à comparer les différentes procédures d’analyse de données de
métagénomique ciblée montre la difficulté à comparer les résultats de données de séquençage à haut
débit de par le choix des amorces ou le nombre de copies du gène cible (souvent ADNr 16S) mais
également suivant la base de données de référence utilisée (Siegwald et al., 2017). Une normalisation
des données grâce à l’utilisation d’un jeu de données comme étalon interne pourrait être un bon
Données brutes fournies par le séquenceur
Demultiplexage
Retire les séquences de mauvaise qualitéRetire les adtatateurs si besoin
Filtre les chimères
Contrôle qualité
Traitement des données(assemblages, mapping, annotation, etc…)
bases de données
Nettoyage des séquencesDétection des chimères
Table d’abondance
Analyses bio statistiques
Contrôle qualité
Sépare les séquences provenantd’un même échantillon en
fonction du tag
A adapter suivant le type de données de séquencage
Calcul des indices de diversitéAnalyse et tests statistiques

A.Rouger 2017 Chapitre 1 Synthèse bibliographique
67
indicateur de comparaison (Siegwald et al., 2017). Cependant des ambiguïtés d’identification peuvent
persister.
1.4.5- Les travaux publiés en écologie microbienne des aliments
Nous comprenons donc l’apport du développement de nouvelles méthodes de séquençage à l’écologie
microbienne. En science des aliments, ces approches sont récentes en comparaison de l’étude des
microbiotes environnementaux (eau et sol) ou animaux. De plus, les études recensées sur les aliments
ont été essentiellement menées sur des produits fermentés et se sont souvent limités à décrire les
communautés microbiennes (Tableau 5). En effet, les produits fermentés contiennent une charge
bactérienne importante permettant l’extraction facilitée des acides nucléiques en vue d’un
séquençage.
L’impact des technologies de séquençage à haut débit a permis de rendre plus accessible la
caractérisation des écosystèmes microbiens des aliments. L’application de ces méthodes permet
d’envisager de nouveaux enjeux industriels comme par exemple la maitrise des écosystèmes
microbiens durant les procédés de fabrication et durant la conservation de l’aliment (Galimberti et al.,
2015). Quelques études visant à décrire les communautés bactériennes de denrées hautement
périssables (viande et produits de la mer) sont répertoriées dans le Tableau 5.
Tableau 5 Liste (non exhaustive) des études des microbiotes en science des aliments
Denrée Méthodes de
séquençage Objectif de l'étude Référence
PRODUITS FERMENTES
Ben-saalga
(millet fermenté) Pyroséquençage Description de la diversité microbienne (Humblot & Guyot, 2009)
Produits de la mer
fermentés Pyroséquençage Investigation des archées et des bactéries (Roh et al., 2010)
Liqueur chinoise Pyroséquençage Diversité des bactéries et des levures (Li et al., 2011)
Nukadoko
(riz fermenté) Pyroséquençage Investigation des communautés bactériennes (Sakamoto et al., 2011)
Kimchi
(chou fermenté) Pyroséquençage Description des communautés microbiennes
(Jung et al., 2011, Park et
al., 2012)
Fromage polonais Pyroséquençage Biodiversité du microbiote de l’Oscypek
(fromage) (Alegria et al., 2012)
Narezushi (poissons
fermentés) Pyroséquençage
Changement de populations durant la
fermentation (Kiyohara et al., 2012)
Grains de kéfir Pyroséquençage Description des communautés microbiennes (Nalbantoglu et al., 2014)
Fromage belge Pyroséquençage Exploration du microbiote du fromage Herve (Delcenserie et al., 2014)

A.Rouger 2017 Chapitre 1 Synthèse bibliographique
68
Fromage mexicain Pyroséquençage Changement des communautés bactériennes
durant la fabrication du fromage Poro
(Aldrete-Tapia et al.,
2014)
Fromage italiens Pyroséquençage Caractérisation de l’usine et de l’affinage du
fromage Caciocavallo pugliese (De Pasquale et al., 2014)
Fromage français Solid
métagénomique
Activités métaboliques au cours de l'affinage du
reblochon (Dugat-Bony et al., 2015)
Chicha
(maïs fermenté) Pyroséquençage Analyse de la diversité des bactéries lactiques (Elizaquívela et al., 2015)
Levains de
panification Pyroséquençage Description de la diversité bactérienne (Lhomme et al., 2015)
Salami italien Pyroséquençage Diversité du microbiote pendant la fermentation
naturelle (Greppi et al., 2015)
Salami italien Illumina MiSeq Diversité bactérienne (Połka et al., 2015)
Fromage kazakh Séquençage
SMRT* Pacbio
Comparaison des microbiotes de fromages
belges, italiens et kazakhs (Li et al., 2017)
Zhenjiang (vinaigre
de céréales)
Illumina
métagénomique
Identification des voies métaboliques des
microbes responsable de l’odeur typique du
vinaigre
(Wu et al., 2017)
PRODUITS NON FERMENTES
Viande de poulet Métagénomique
454
Effet de la marinade sur les communautés
bactériennes (Nieminen et al., 2012)
Steak de bœuf Pyroséquençage Origine des bactéries altérantes (De Filippis et al., 2013)
Saucisses de porc Pyroséquençage
Dynamique des communautés microbiennes
durant réfrigération en fonction de la
composition et de la température
(Benson et al., 2014)
Viande de porc Pyroséquençage Origine des contaminations en abattoir (Hultman et al., 2015)
Produits carnés et
produit de la mer Pyroséquençage
Diversité bactérienne de 10 denrées à T0 et après
altération (Chaillou et al., 2015)
Viande bœuf Pyroséquençage Dynamique des bactéries durant la réfrigération
et effet de différentes MAP (Stoops et al., 2015)
Saucisses de porc Pyroséquençage Impact de la concentration en sel sur les
communautés microbiennes (Fougy et al., 2016)
** (Single Molecule, Real-Time)
Dans la plupart de ces études, le but est de décrire les communautés bactériennes présentes sur des
aliments (Tableau 3) ou bien de montrer l’impact d’un procédé de conservation sur les communautés
microbiennes de la viande (marinade, réfrigération, salage) (Nieminen et al., 2012, Benson et al., 2014,
Fougy et al, 2016). Par exemple, Chaillou et al., (2015) décrivent les communautés bactériennes de 10
denrées au moment de l’emballage et après altération. Ils ont mis en évidence la présence d’espèces
bactériennes jusqu’à lors non décrites dans la littérature dans des produits de la mer. Ce sont
également les premiers à avoir montré l’existence de communautés microbiennes présentes à la fois
dans les produits carnées et les produits de la mer. Les sources de contaminations de la viande ne sont
A.Rouger 2017 Chapitre 1 Synthèse bibliographique
69
pas seulement les microbiotes des animaux dont sont issus les aliments mais également
l’environnement d’abattoir et de l’usine de transformation des produits et les conditions de stockage
(à froid). Ces conclusions sont reprises également pour les microbiotes de viande de bœufs (De Filippis
et al., 2013, Chaillou et al., 2015, Hultman et al. 2015). Les conditions de stockage (sous vide ou sous
atmosphère modifiée) influencent les communautés bactériennes de la viande de porc où les
communautés microbiennes sont plus diverses dans les emballages sous vide (69 OTUs vs 46 OTUs)
(Fougy et al., 2016). De plus, des analyses sensorielles montrent que l’altération est réduite lorsque les
communautés microbiennes sous dominantes sont plus abondantes dans une formulation enrichie en
sel et stocké sous vide (Fougy et al., 2016). Ces différents exemples illustrent des questions de
recherche résolues en science des aliments à l’aide de méthodes de séquençage à haut débit.
Nous remarquons également que le pyroséquençage est la méthode la plus largement utilisée. Cette
méthode a permis de décrire les communautés bactériennes mais reste basée sur la comparaison de
fragment d’ADNr 16S à des bases de données. Parmi les études listées dans le tableau 5, seules 3
études utilisent la métagénomique (séquençage de l’ADN sans étape d’amplification) permettant ainsi
de limiter les biais liés à l’amplification PCR (Jung et al., 2011, Nieminen et al., 2012, Dugat-Bony et al.,
2015). La métagénomique est un outil puissant car elle permet l’exploration de la biodiversité et donne
un aperçu du potentiel fonctionnel d’un écosystème. Il est également intéressant de comprendre
comment les bactéries se comportent au sein de l’écosystème. Pour cela quelques études récentes de
métatranscriptomique ont été réalisées en science des aliments. Il s’agit d’études de produits
fermentés préalablement décrits par pyroséquençage. Weckx et al. (2011) et Jung et al. (2013) ont
étudié les fonctions bactériennes exprimées lors de la fermentation, respectivement du levain de
panification et du kimchi. Ensuite sur le fromage qui a fait l’objet de nombreuses études, De Filippis et
al. (2016) ont cherché à montrer les fonctions qui variaient au cours de l’affinage de fromages italiens
quand Monnet et al. (2016) se sont intéressés aux interactions se produisant entre les différentes
espèces de l’écosystème fromager du reblochon.
1.4.6- Intérêt des approches « omiques » combinées
Le développement des techniques de séquençage à haut débit a ouvert de nouvelles perspectives en
écologie microbienne des aliments. Plusieurs revues répertorient les différentes stratégies pour
analyser les communautés microbiennes (Bergholz et al., 2014, Franzosa et al., 2015). Aguiar-Pulido et
al. (2016) notent qu’il est intéressant de combiner les approches « omiques » comme la
métagénomique, la métatranscriptomique et la métabolomique. En science de l’environnement,
domaine dans lequel les technologies de séquençage à haut débit ont été largement utilisées, ces
approches combinées sont courantes (Hultman et al., 2015).

A.Rouger 2017 Chapitre 1 Synthèse bibliographique
70
La Figure 12 inspirée de la revue de Cardenas et Tiedje (2008) résume ces nouvelles méthodes et les
questions auxquelles chacune permet de répondre en écologie microbienne des aliments.
Il parait donc indispensable d’utiliser les méthodes de séquençage haut débit en plein essor, mais il
convient également de valider et vérifier ces résultats par d’autres approches (qPCR, TTGE,
DGGE…). Afin d’avoir une vision plus globale d’un écosystème, les méthodes de biologie moléculaire
peuvent aussi être couplées à des méthodes de microbiologie culturale plus classiquement utilisées
(Cholet, 2006, Corre, 2015, Fougy, 2016).
Les résultats obtenus au cours de ces travaux de doctorat sont présentés dans les chapitres suivant.
Figure 12 Méthodes de séquençage haut débit couramment utilisées pour caractériser la diversité microbienne.
Inspirée de (Cardenas & Tiedje, 2008)
Qui est là?Questions
Méthodes
Qui peut faire quoi? Qui fait quoi?
Metabarcoding 16S rRNA Métagénomique Métatrancriptomique
Influence de différentes variables sur(dynamiques au cours du temps, influence des procédés ou du stockage)
Extraction acides nucléiques
ADN ARN
Amplification Reverse transcription
Echantillon de viande

A.Rouger 2017 Chapitre 2 Mise au point d’un microbiote standard
71
Chapitre 2 Mise au point d’un microbiote
standard
2.1- Préambule
Dans la littérature, nous avons pu constater que les contaminations de la viande de poulet sont
variables suivant les lots et les découpes mais aussi suivant les procédés de transformation et suivant
les saisons. Ces contaminations, bien qu’étudiées par méthodes culturales restent peu décrites par des
méthodes moléculaires. Dans l’objectif d’étudier les microbiotes de la viande de volaille, nous devons
nous affranchir de la variabilité mentionnée précédemment. Nous avons donc développé un modèle
expérimental. Notre idée a été de reconstituer écosystème représentatif de viande de volaille que l’on
pourrait réutiliser pour réaliser des challenges tests de manière reproductible.
Nous avons dû choisir parmi les découpes de poulet (poulet entier, cuisse avec peau, filet sans peau)
lesquelles présentaient une charge bactérienne suffisamment importante pour constituer notre stock.
En effet, juste après emballage, la viande est peu contaminée, puis la charge bactérienne augmente
jusqu’à la DLC. Cependant à la DLC, la diversité des communautés bactériennes diminue. En effet, une
ou quelques espèces de bactéries altérantes peuvent s’être largement développées. Nous avons
effectué un suivi cinétique de la charge bactérienne pour choisir le moment de récolte des bactéries,
afin d’avoir un niveau de contamination suffisant mais dont la diversité était suffisamment
représentative.
Nous nous sommes assurés de pouvoir obtenir l’ADN de ces communautés bactériennes afin
d’envisager l’optimisation des méthodes NGS ensuite. Un protocole de séparation des bactéries de la
matrice et d’extraction d’ADN bactérien à partir de matrice alimentaire viande de volaille a été mis au
point.
Après avoir vérifié la viabilité des communautés bactériennes récoltées et conservées à 80°C, nous
avons testé leur capacité à se redévelopper sur la viande, sans étape préalable de culture (afin de
limiter les biais de sélection des espèces cultivables). Pour cela, des matrices de viande de poulet pauci
microbienne ont été utilisées pour des challenges test avec les communautés microbiennes
préalablement stockées. Nous avons suivi par méthodes culturales le développement de quelques

A.Rouger 2017 Chapitre 2 Mise au point d’un microbiote standard
72
flores au cours du temps de conservation de la viande et montré la capacité de notre microbiote
standard à permettre des expériences répétables avec des microbiotes contrôlés.
Ces travaux ont fait l’objet d’un article accepté en avril 2016 dans Internationnal journal of Food
Microbiology, (dx.doi.org/10.1016/j.ijfoodmicro.2016.04.028).
2.2- A method to isolate bacterial communities and characterize ecosystems from food
products: Validation and utilization in as a reproducible chicken meat model
Amélie Rouger1,2, Benoit Remenant1,2, Hervé Prévost1,2, Monique Zagorec1,2,#
1 INRA, UMR1014, Secalim, Nantes, France
2 LUNAM Université, Oniris, Nantes, France
# Corresponding author: Monique Zagorec, [email protected], ONIRIS - INRA, UMR 1014
SECALIM - Route de gachet - CS40706 - 44307 Nantes cedex 3, France
Abstract
Influenced by production and storage processes and by seasonal changes the diversity of meat
products microbiota can be very variable. Because microbiotas influence meat quality and safety,
characterizing and understanding their dynamics during processing and storage is important for
proposing innovative and efficient storage conditions. Challenge tests are usually performed using
meat from the same batch, inoculated at high levels with one or few strains. Such experiments do not
reflect the true microbial situation, and the global ecosystem is not taken into account. Our purpose
was to constitute live stocks of chicken meat microbiotas to create standard and reproducible
ecosystems. We searched for the best method to collect contaminating bacterial communities from
chicken cuts to store as frozen aliquots. We tested several methods to extract DNA of these stored
communities for subsequent PCR amplification. We determined the best moment to collect bacteria
in sufficient amounts during the product shelf life. Results showed that the rinsing method associated
to the use of Mobio DNA extraction kit was the most reliable method to collect bacteria and obtain
DNA for subsequent PCR amplification. Then, 23 different chicken meat microbiotas were collected
using this procedure. Microbiota aliquots were stored at -80 °C without important loss of viability.
Their characterization by cultural methods confirmed the large variability (richness and abundance) of
bacterial communities present on chicken cuts. Four of these bacterial communities were used to
estimate their ability to regrow on meat matrices. Challenge tests performed on sterile matrices
showed that these microbiotas were successfully inoculated and could overgrow the natural
microbiota of chicken meat. They can therefore be used for performing reproducible challenge tests

A.Rouger 2017 Chapitre 2 Mise au point d’un microbiote standard
73
mimicking a true meat ecosystem and enabling the possibility to test the influence of various
processing or storage conditions on complex meat matrices.
Introduction
Microbial diversity is shaping the ecology of very diverse ecosystems. For example, bacteria are known
to be a major part of geo-chemical cycles in natural environment. Studying the microbial diversity and
interactions of bacteria with the support and the other organisms is always a challenge due to the
extreme variability which can occur between samples. In meat agro-food industry, contaminating
bacteria originate from animal microbiota (feces, hide, skin, or feather), from production plant
environment (air, equipment, surfaces) and from human manipulators (Chaillou et al., 2015).
Therefore, a large diversity of species can be hosted by meat products. After initial contamination of
carcasses or cuts, processing steps and storage conditions like temperature and the atmosphere used
for packaging, shape the evolution of this microbiota. The microbial diversity and its dynamics during
food production can influence the product shelf life and safety if spoilage bacteria are favored and
pathogenic bacteria present and able to grow.
In poultry meat, the total viable counts reported in the literature and expressed as colony forming
units per gram (CFU/g) ranges from 6.5 to 9 log depending on authors, and on storage conditions and
poultry cuts (Björkroth, 2005, Balamatsia et al., 2007, Chouliara et al., 2007, Zhang et al., 2012, Al-
Nehlawi et al., 2013, Capita et al., 2013). This suggests that a great quantitative variability of bacterial
contamination hosted by poultry meat exists. Pseudomonas sp., Enterobacteriaceae, Brochothrix
thermosphacta, and lactic acid bacteria such as Carnobacterium sp. and lactotobacilli are among the
most often bacterial contaminants reported by authors. A large majority of the published results are
focused on pathogenic bacteria whereas spoilage microorganisms were rarely investigated. Indeed,
Salmonella and Campylobacter prevalence, or characteristics of Staphylococcus aureus isolates from
poultry cuts have been reported from several countries (see as examples (Atanassova & Ring, 1999,
Capita et al., 2001, Capita et al., 2002b, Capita et al., 2007). In addition, only few studies dealing with
the whole microbiota of poultry meat have been reported ((Hinton Jr & Ingram, 2003, del Río et al.,
2007b, Nieminen et al., 2012). Many articles focused only one bacterial species and did not consider
the natural bacterial contaminants, despite their impact on the bacterial dynamics. For instance on
pork meat, the conclusions drawn by using Salmonella growth predictive models were different when
sterile or naturally contaminated meats were used, the natural microbiota of meat reducing
Salmonella growth (Møller et al., 2013). This example shows the importance to consider food matrices
as a global ecosystem hosting complex microbial communities (Fleet, 1999).

A.Rouger 2017 Chapitre 2 Mise au point d’un microbiote standard
74
Several studies aiming at understanding the mechanisms of bacterial adaptation to food environment
have been reported. In general, the approaches used are based on challenge tests in which bacteria
(commonly one or a few strains) are inoculated at empirical levels, which do not always reflect the
conditions that occur in commercialized and consumed products. As an example, the effect of modified
atmosphere packaging on the growth of Campylobacter was studied on chicken breast fillet by
inoculating meat at 104 to 105 CFU/g with a five-strain cocktail (Meredith et al., 2014). Although
informative the results obtained in such conditions, do not reflect the real situation of the products
that can be proposed on the market as the concentration of Campylobacter in naturally contaminated
products is difficult to estimate (Rohonczy et al., 2013). Indeed, most often only prevalence of
Campylobacter is reported (see Economou et al., 2015 as example) and only few reports about the
contamination level are available, as it varies along the food chain and is batch-dependent (Gruntar et
al., 2015).
Poultry meat samples constitute very heterogeneous matrices depending on the type of cuts. The
unavoidable bacterial contamination occurs mostly at the surface and on the skin of the cuts during
the different steps of the slaughtering process (Luber, 2009). The poultry meat worldwide production
is in constant increase each year reaching 106.8 million tons in 2013. In connection with the human
population growth, the needs for meat production also increase especially in developing countries.
According to the FAO, increased consumption is mainly due to an attractive price-quality ratio and to
health and nutrition benefits of poultry meat. On the other hand, chicken meat attractivity increases
because producers develop retails and ready-to-eat products, fast and easy to prepare, fitting with to
consumers demand. It is therefore necessary to guaranty the safety of poultry meat to face this
increasing demand.
The effects of different treatments have been studied in order to develop strategies for fighting human
pathogens or spoilage species. Among those the use of modified atmosphere packaging, alone (Al-
Nehlawi et al., 2013, Meredith et al., 2014) or combined to protective cultures (Melero et al., 2012) or
essential oils (Chouliara et al., 2007) as well as decontamination with various chemicals (Okolocha &
Ellerbroek, 2005, del Río et al., 2007b, Alonso-Hernando et al., 2012a, Capita et al., 2013) are the most
documented. The effects of other treatments such as irradiation (Szczawińska et al., 1991) or
marinades (Nieminen et al., 2012) have also been described. To overcome variability, microbiologists
usually inoculate food or matrices from one batch in order to obtain reproducible matrices. In
microbial ecology studies aiming to elucidate bacterial interactions, with the food matrix and/or other
micro-organisms, the challenge is i) to define reproducible and reliable experimental conditions to lead
to biological interpretation, or ii) to multiply sampling or experiments to obtain statistical significance
of the results. In the present study we designed a method to collect poultry meat bacterial

A.Rouger 2017 Chapitre 2 Mise au point d’un microbiote standard
75
communities in order to develop an accurate model useful to reproducibly investigate the effect of
various meat processing and storage conditions on the evolution of meat microbiota.
Table 8 Description of the 23 chicken leg samples used for microbiota collection.
Samples Shef-life a
(days)
French Department Origin/
Slaughter house b
Free-
range
Appellations label /
Descriptions O2 -CO2 (%) c
A 11 44/1 X Label Rouge/ Yellow 53.0-23.4
B NA 85/1 - -/- 53.0-18.0
Cd 11 44/1 X Label Rouge/ White 45.1-24.7
D 11 56/1 - -/- 48.1-22.2
E 17 85/2 - -/ White 36.8-21.2
Fd NA 85/1 X Label Rouge/ Black 44.7-21.6
G NA 72/1 X Label Rouge/- 3.3-22.6
H 12 53/1 - -/- 7.6-15.4
I 12 72/2 - -/- 53.9-24.4
J d e 12 72/2 - -/- 19.0-0.0
K 14 44/1 X Label Rouge/ White 53.3-21.7
Ld NA 85/1 - -/- 44.4-19.0
M 12 85/3 X Organic/- 0.6-13.7
Nd NA 72/1 X Organic/- 1.9-22.7
O NA 85/1 X Organic/- 34.6-16.3
P 13 85/1 X Label Rouge/ Black 41.4-20.3
Q 12 53/1 - -/- 0.8-23.3
R 11 56/1 - -/- 45.9-24.7
Sd 13 85/3 X Organic/- 0.4-18.2
T NA 85/1 X Label Rouge/ Black 42.8-20.6
U 9 85/1 X Label Rouge/- 22.0-17.6
V 11 53/2 X Label Rouge/- 2.1-20.7
W 11 61/1 - Halal/- 32.1-17.8
a estimated shelf life calculated from the indicated UBD and date of production b the different slaughterhouses were numbered c CO2 and O2 percentages measured in the headspace when bacteria were collected d Bacteria were collected at UBD e unclosed (damaged) package NA not available - not documented

A.Rouger 2017 Chapitre 2 Mise au point d’un microbiote standard
76
In France chicken legs are a popular meal and are often sold as portions of 2, 4, 6 or more legs packaged
under various modified atmospheres. In addition, a large choice of meat is proposed, issued from
various farming practices (including organic, free-range, “label rouge” farming), and performed on
various genetic backgrounds (white, yellow and black races). We took into account this large diversity
of producing conditions in our sampling procedure and collected microbiota from chicken meat to
constitute a livestock that could be characterized and used to re inoculate fresh matrices to create a
standard ecosystem.
Materials and methods
Chicken meat samples
Chicken cuts (portions of 2 legs or 1kg - i.e. 4-6 - breast fillets) stored under modified atmosphere were
collected from local supermarkets on the day of arrival, i.e. 1-2 days after slaughtering, and stored at
4°C until experiments. Gas composition of the meat packages was measured just before collecting
bacteria as described by Melero et al (2012)using a digital O2/CO2 analyzer (Oxybaby, WITT Gasetechnik
GmbH & Co KG, Germany).
For the constitution of life stocks representing diverse bacterial communities naturally present on
poultry meat 23 packs of two chicken legs (coined here A to W) from various origins and labels were
used. The characteristics of the 23 samples are summarized in Table 8. After rinsing one leg for 5 min
in 200 mL TS, bacteria were collected by centrifugation, the pellet was resuspended in 85 mL of TS and
1 mL-aliquots were stored at -80 °C for further studies. Bacteria were enumerated before and after
various freezing periods at -80 °C (1 to 28 weeks depending on batches).
Bacteria collecting
The experimental design to set up a reliable method for collecting and store the bacterial communities
from meat samples is summarized Figure 13. Four different treatments were tested to recover bacteria
from meat (stomaching, rinsing, swabbing, and scrapping). Collected bacteria were resuspended in
sterile TS then stored at -80 °C as 1 mL aliquots with 15% (v/v) glycerol and the efficiency of each
treatment was estimated by CFU counting at each step (Figure 13).
Stomaching
Fifty grams of meat were aseptically transferred into a sterile stomacher bag, with 200 mL TS (8.5 g/L
NaCl, 1 g/L tryptone in distilled water) containing 1% Tween 80. Meat samples were then homogenized
for 2 min in a stomacher (Masticator, IUL Instruments, England). The homogenate was filtered through
the bag filter and centrifuged through a filter (F) or a column (C) from Nucleospin Plant II Midi kit

A.Rouger 2017 Chapitre 2 Mise au point d’un microbiote standard
77
(Macherey Nagel, EURL, France) at 8 000xg during 10 min at room temperature. These filters bind cell
fragments whereas columns bind eukaryote DNA from the matrix. Unlysed bacteria were therefore
collected in the pellet and resuspended into 3.3 mL TS. Alternatively, 30 mL of blended mixture were
filtered by gravity through a sterile paper filter or used for 2 successive centrifugation steps a low
gravity to remove food residues: 30 mL were first centrifuged at 100xg, 3 min at room temperature
and 25 mL of supernatant were subsequently centrifuged at 500xg for 5 min. Then 20 mL of filtrate or
supernatant were centrifuged at 3 000xg 20 min at 4 °C and the bacterial pellet was resuspended into
3.3 mL TS.
Figure 13 Experimental design to set up an efficient and reliable method to collect and analyse a
viable bacterial community model characteristic of poultry cuts.
Rinsing
A whole portion of meat was added with 200 mL TS into a sterile stomacher bag. Alternatively TS
containing 1 % Tween 80 or peptone water (peptone 10 g/L, sodium chloride 5 g/L, disodium
phosphate 3.56 g/L, potassium dihydrogen phosphate 1.5 g/L, pH 7.2 at 25 °C) were tested. Hand-
agitation was performed during 30 sec to 5 min. The liquid was filtered through the bag filter,
centrifuged at 4 000xg for 20 min at 4 °C then the bacterial pellet was suspended into 100 mL TS.
Chicken cuts
Differentialcentrifugations
100xg, 500xg, 3,000xg
Storage -80 °C
DNA extractionMo Bio/Qiagen/Promega
+PCR
Matrix inoculation
Numerationon PCA
Scraping1 leg
25 cm2
Stomaching50 g cut from 1
leg or fillet
Rinsing1 leg
Swabbing1 leg
25 cm2
Centrifugation4,000xg
FiltrationsF, C, paper
Centrifugation 8,000xg
Addition of glycerol 15%

A.Rouger 2017 Chapitre 2 Mise au point d’un microbiote standard
78
Swabbing
A 5 cm x 5 cm zone on chicken skin was swabbed. The swab (Copan Diagnostic 155C, Italy) was vortexed
with 5 mL TS containing 1% Tween 80 and the operation was repeated four times on the same zone.
The volume was adjusted to 15 mL with TS containing 1% Tween 80.
Scraping
A volume of 1 mL TS containing 1% Tween 80 was sprayed with a pipet onto a 5 cm x 5 cm surface of
chicken skin. Scraping with a sterile scalpel was performed and the liquid was collected into a sterile
Petri dish. The operation was repeated four times on the same zone. The bacterial suspension was
adjusted to 15 mL with TS.
DNA extraction
To isolate DNA from the collected bacteria, 1 mL of bacterial suspension was centrifuged at 10,000xg,
10 min at 4 °C. Several DNA extraction methods were tested as described below. After bacterial pellet
suspension in various lysis buffers, incubation for 10 min at 56 °C to dissolve the fatty moiety of meat
residues or sonication in an ultrasonic bath 3 min at 50 °C (Aerosec Industry, France) to strengthen the
lysis efficiency were tested.
The Qiagen DNeasy Blood and tissue kit (Qiagen, Germany) was used as recommended by the
manufacturer. Bacterial pellet was resuspended in lysis solution (Tris–HCl 20 mM, pH 8.0, EDTA 2 mM,
1.2% Triton X-100) containing 20 mg/mL lysozyme and 29 U/mL mutanolysin then incubated at 37 °C
for 1 h. After addition of 0.3 g of glass beads (150 - 200 µm diameter), a mechanical lysis was performed
by shaking twice 2 min in a bead beater (MM200 30 Hz, Germany) interspersed by 2 min storage on
ice. Proteins and RNAs were degraded by adding 200 µl AL buffer from the kit containing proteinase K
(20 mg/mL) and Rnase A (1 mg/mL) (Qiagen, Germany) then incubating 30 min at 56 °C. After
centrifugation at 10,000xg for 3 min the supernatant was collected and DNA was precipitated by
addition of 200 µl ice-cold ethanol. DNA was purified on Qiagen kit columns as recommended by the
manufacturer.
When the Promega wizard genomic DNA purification kit (Promega, France) was used, bacteria were
suspended in Nuclei lysis solution, provided with the kit, and incubated at 80 °C for 5 min, then 3 µL of
RNAse solution from the kit were added with a further incubation for 1 h at 37 °C. A volume of 200 µL
of protein precipitation solution included in the kit was added and the mixture was incubated 5 min in
ice. After a centrifugation step at 13,000xg for 3 min, DNA was precipitated from the supernatant with
600 µL isopropanol and collected by centrifugation at 13,000xg for 2 min. The DNA pellet was washed
A.Rouger 2017 Chapitre 2 Mise au point d’un microbiote standard
79
with ethanol 70%, dried and suspended with rehydration solution 1 h at 65 °C according to the
Promega instruction manual.
With Mo Bio Power Food Microbial DNA isolation kit (Mo Bio laboratories, Inc., USA), 450 µL of heated
lysis solution PF1 was used to suspend bacterial pellet. The suspension was transferred in Micro Bead
tubes provided with the kit and mechanical lysis was performed by shaking 10 min in a MobioVortex
(Genie2). Other steps were performed according to the manufacturer instruction manual with the use
of Mobio colums for DNA purification.
Removing residual proteins from the final DNA solutions by extracting twice with
phenol:chloroform:isoamyl-alcohol (25:24:1) and once with chloroform:isoamyl-alcohol (24:1) was
also tested.
DNA quantification and PCR conditions
DNA concentrations were measured with a Qubit fluorometer (Invitrogen, CA, USA) and PCR fragments
were visualized after electrophoresis on 1-1.5% (w/v) agarose gels. All PCR amplifications were
performed in a PTC-100 Thermocycler (MJ Research Inc., Watertown MA, USA).
The 1,500 pb 16S rRNA gene fragment was amplified by PCR with primer pairs fd1 (5’-AGA GTT TGA
TCC TGG CTC AG) and rd1 (5’-TAA GGA GGT GAT CCA GCC) (Weisburg et al., 1991). The PCR mixture
(50 µL) contained 1X Taq buffer (10 mM Tris-HCl, 50 mM KCl, 1.5 mM MgCl2, pH 8.3), 0.2 mM dNTP
(New England Biolabs, USA), 0.4 µM each primer, 1.5 U of Taq DNA polymerase (New England Biolabs,
USA) and 2.5 µL of DNA. The amplification was performed with first a denaturation step (94 °C, 10 min)
followed by 35 cycles of [denaturation (94 °C, 1 min) annealing (56 °C, 1 min 15 sec) extension (72 °C,
1 min 15 sec)] and a final extension step (72 °C, 7 min).
The primers 702-F (5’-AAT TGC CTT CTT CCG TGT A) and 310-R (5’-AGT TGC GCA CAA TTA TTT TC) were
used to amplify a 420 bp fragment of the Lactobacillus sakei katA gene as previously described (Ammor
et al., 2005). L. sakei is a lactic acid bacterium which is usually not present on poultry meat (Najjari et
al., 2008). Therefore this species easily identified by PCR targeting its katA gene was used as a control
of DNA extraction and subsequent PCR efficiency.
Challenge tests
Samples of fresh breast chicken meat from the local supermarket were rinsed with ethanol 100% or
sodium lactate sodium lactate 2% in sterile water (Loretz et al., 2010). After briefly drying on sterile
filter paper, breasts were aseptically cut in 2 cm dices. One aliquot (1 mL) of the bacterial communities
isolated from chicken legs and stored at -80 °C was gently defrosted, diluted in TS to obtain appropriate

A.Rouger 2017 Chapitre 2 Mise au point d’un microbiote standard
80
cell concentration. A volume of 1 mL of appropriate dilution was inoculated per 100 g of meat dices,
and the mixture was homogenized. For each challenge test, three replicates were performed. After
homogenization 50 g portions were packaged under two different modified atmospheres routinely
used by meat producers (50% CO2 - 50% N2 and 30% CO2 - 70% O2) and stored at 4 °C.
CFU were determined after plating serial 10-fold dilutions on various media. The total aerobic viable
counts were determined after 2 days incubation at 30 °C on Plate Count Agar (PCA) (Biokar, France).
Lactic acid bacteria (LAB) were counted on MRS agar medium pH 5.2 (AES, France) after 4 days
incubation at 25 °C under anaerobic conditions (Anaerocult A, Merck, Germany). Numeration of
Pseudomonas sp. and Brochothrix thermosphacta were determined at 25 °C on specific media:
Cephalosporine Fucidine Cetrimide CFC (Biokar, France) for 2 days, and Streptomycin Sulfate Thallium
Acetate Actidione agar STAA (Oxoid, France) for 3 days, respectively. Enterobacteria counts were
determined on Violet Red Bile Glucose agar VRBG (Biokar, France) after 1 day incubation at 37 °C.
Statistical analyses
Results obtained from bacterial enumeration after rinsing were analyzed using Student’s T-test. P
values <0.05 were considered statistically significant. For comparing bacterial viability after storage at
-80 °C, analysis of variance (ANOVA) and pair-comparison of treatment means were achieved by the
Fisher least significant difference (LSD) test (95.0%) with the XLstat version 2014.3.07 extension, with
mean uncertainty of 0.5 log CFU/g. Principal component analyses of the 23 chicken leg samples and
PCR amplification from their DNA were performed with “ade4” and “ape” packages in R version 3.0.2
© 2013 The R Foundation for Statistical Computing.
Results and discussion
To collect bacterial communities naturally contaminating poultry meat, both chicken breast fillets and
chicken legs were tested. However, due to a very poor initial bacterial contamination on chicken breast
(data not shown), we rapidly chose to extract bacteria only from chicken legs, where bacterial
contamination were higher, due to the presence of the animal skin on the product. We determined
the optimal conditions to collect bacterial communities that we could store as aliquots to be
reproducibly reused for inoculating meat matrices, and that could be characterized using both cultural
and molecular methods. For that purpose, we determined i) the best method to separate bacteria from
meat; ii) the best conditions to extract DNA from the stored communities for their analysis by
molecular methods needing PCR amplification; and iii) then the best moment to collect bacteria in
sufficient amount during the product shelf life. Life stocks were then constituted following these
optimized methods. Their viability after cold storage and their ability to regrow on meat matrices were
checked.

A.Rouger 2017 Chapitre 2 Mise au point d’un microbiote standard
81
Bacteria separation method and DNA extraction
We tested different methods previously used to collect bacteria from meat (Capita et al., 2004, Gill &
Badoni, 2005) and associated them with different DNA extraction protocols in order to set up the best
method allowing to separate the most possible viable bacteria from the matrix and extract their DNA,
whilst avoiding PCR inhibitors.
Stomaching is a method broadly used because it usually permits to collect bacteria with a high
efficiency. However, as chicken legs are heterogeneous matrices, one difficulty is to pick exactly the
same proportions of skin, fat and muscle. In addition a prior deboning of meat is required for
stomaching. A subsequent step (filtration, centrifugation or decantation) is often necessary to clear
bacteria from matrix residues especially when a further DNA extraction step is required. Other
methods such as swabbing or rinsing methods can also be used as they are described in standard
protocols for the detection of pathogens. These three methods, as well as scraping test allowed
recovery of bacteria (Table 9). Then we tested various DNA extraction procedures following examples
reported in the literature (Pinto et al., 2007, Pirondini et al., 2010). To check the efficiency of DNA
recovery and the possible presence of PCR inhibitors, DNA samples extracted with various methods
were used to amplify the 16S rRNA gene. After stomaching, DNA could not be PCR amplified whatever
the method to separate bacteria from meat matrix was, and whatever the DNA extraction procedure
used (Table 9, Figure 18).
After scraping, only the use of Mobio kit led to a positive PCR amplification. As well, after swabbing,
only the Mobio kit utilization led to a positive PCR reaction, and an additional ultrasonic bath for DNA
extraction had a negative effect on the PCR amplification. Finally a positive PCR amplification was
obtained after rinsing, with both Mobio and Promega DNA extraction kits and an ultrasonic treatment
did not appear to have an impact on the PCR efficiency. For subsequent steps, the rinsing method
associated to the use of Mobio DNA extraction kit was chosen. In addition, we considered rinsing to
be a more accurate and reproducible method to collect bacteria independently from the heterogeneity
of poultry cuts. The reasons why other methods, although enabling bacteria recovery, did not lead to
PCR amplification may results from the presence of PCR inhibitors issued from meat, as reported
before and particularly for chicken meat (Rossen et al., 1992, Abu Al-Soud & Rådström, 2000, Lübeck
et al., 2003). Different sources of contamination by a likely PCR inhibitor like glove powder, plastic
tubes and matrices are known (Rossen et al., 1992, Wilson, 1997, Abu Al-Soud & Rådström, 2000). But
it seems that the strongest inhibitor contaminations occur in some food matrices as reported in poultry
meat in which the presence of PCR inhibitors and of DNases preventing Salmonella DNA extraction
(Park et al., 2014). Meat and fat residues could also lead to DNA degradation or a protection of bacteria

A.Rouger 2017 Chapitre 2 Mise au point d’un microbiote standard
82
during the lysis step of the DNA extraction. Further experiments would be required to fully understand
why such broadly used methods as stomaching are efficient on most food matrices but not on chicken
cuts.
Table 9 Comparison of recovery of bacteria and estimation of quality of DNA extraction using different protocols
Bacterial Isolation
Additional step for bacterial isolation
Culture numbered
DNA extraction
kits
Additional step for DNA
extraction
16S rRNA gene
amplification
Stomacher
Nucleospin 5.7 104 a
Qiagen none -
Qiagen purificationb -
Qiagen heated c -
Promega ultrasonic bath d -
Mobio none -
Mobio ultrasonic bath d -
Paper filtration + Nucleospin
7.2 104 a Qiagen none -
Differential centrifugations 1.0 105 a Qiagen none -
Rinsing Ø 5.9 107 e
Promega ultrasonic bath d +
Mobio none +
Mobio ultrasonic bath d +
Swabbing Ø 3.2 106 e
Promega ultrasonic bath d -
Mobio none +
Mobio ultrasonic bath d -
Scraping Ø 9.4 106 e
Promega none -
Promega ultrasonic bath d -
Mobio none +
Mobio ultrasonic bath d + a CFU/g; b phenol-chloroform purification (see 2.6.2); c heating step for 10 min at 56 °C; d ultrasonic bath for 3 min at 50 °C; +/- positive or negative amplification Chicken legs were stored at 4 °C until UBD before to apply the different extraction methods
Method optimization and validation
To tentatively improve the efficiency of bacteria recovery we tested whether several successive rinses
could improve the yield of recovery. Six successive rinses of 5 min or 30 sec were performed and total
viable counts in each successive rinsing solution were measured. Rinsing for 5 min was slightly more

A.Rouger 2017 Chapitre 2 Mise au point d’un microbiote standard
83
efficient than for 30 sec (Figure 14). In both cases the first rinsing step was the most efficient as more
than 90% of bacteria were collected after the first rinse and each of the subsequent rinses allowed
only a negligible additional recovery. Therefore we chose to perform only one rinse but for a 5 min
period. Indeed, although a 30-second-rinse is usually recommended in protocols for microbial
assessment of food products, a very short time for a handed experiment and its reproducibility may
be experimenter dependent.
Figure 14 Efficiency of successive rinsing steps on the recovery of bacteria
Results are the mean of data obtained for 3 different chicken legs. Results are expressed as CFU/mL of rinsing
solution. Asterisks show the values that are not statistically different (P < 0.05)
After validation of the method to collect bacteria, we checked whether it was optimal for efficient
recovery of bacteria from meat and for DNA extraction and subsequent PCR amplification. For that
purpose, a batch of chicken legs was inoculated with an overnight MRS culture of L. sakei (108 CFU/mL)
used as a marker. The rinsing protocol and DNA extraction described above were immediately
performed on this artificially contaminated meat. To check the putative presence of PCR inhibitors in
the DNA extracted from bacteria collected from chicken meat, the pure culture of L. sakei was also
added in the rinsing solution obtained from a naturally contaminated chicken leg, at 105, 106, 107, and
108 CFU/mL of rinsing solution. Then DNA was extracted and a PCR targeting the katA gene specific of
L. sakei was performed. As expected, L. sakei was not detected in the bacteria collected from poultry
meat. A clear L. sakei band was observed with samples issued from the chicken meat inoculated with
L. sakei, showing that our protocol allowed indeed to collect bacteria, and to extract their DNA with a
0,0
1,0
2,0
3,0
4,0
5,0
6,0
7,0
8,0
9,0
10,0
5 min 30 s
log
CFU
/g
Rinse 1 Rinse 2 Rinse 3 Rinse 4 Rinse 5 Rinse 6
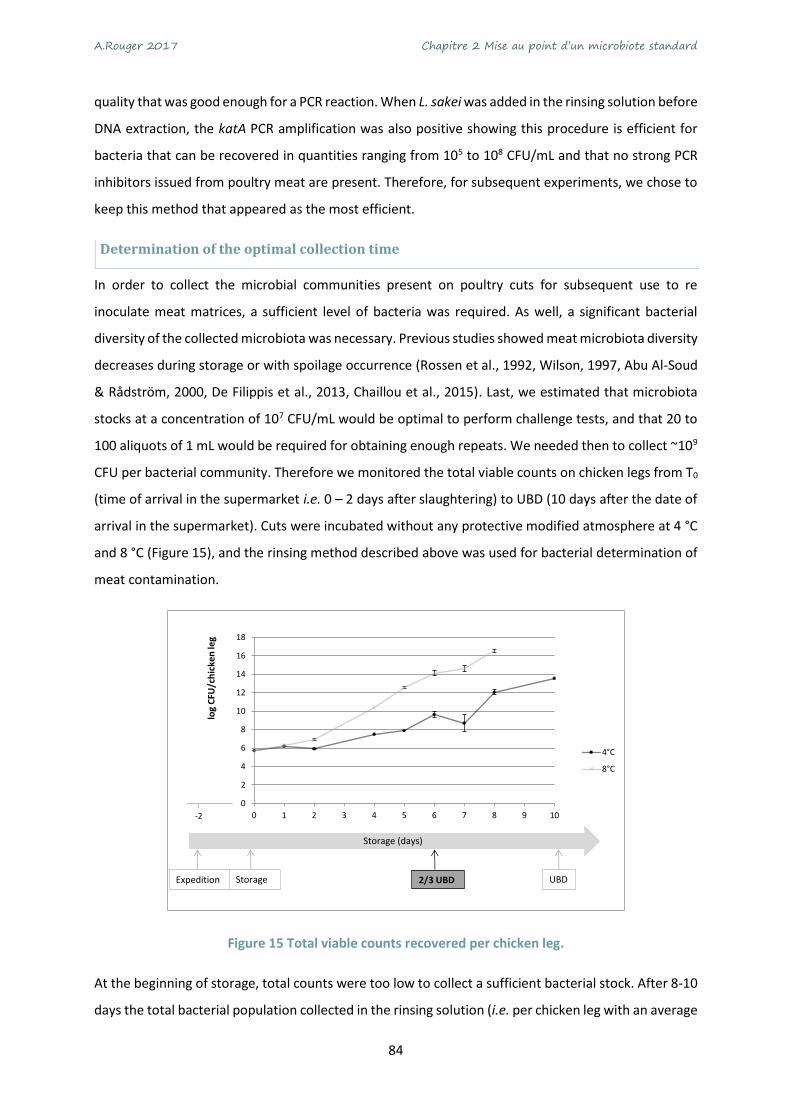
A.Rouger 2017 Chapitre 2 Mise au point d’un microbiote standard
84
quality that was good enough for a PCR reaction. When L. sakei was added in the rinsing solution before
DNA extraction, the katA PCR amplification was also positive showing this procedure is efficient for
bacteria that can be recovered in quantities ranging from 105 to 108 CFU/mL and that no strong PCR
inhibitors issued from poultry meat are present. Therefore, for subsequent experiments, we chose to
keep this method that appeared as the most efficient.
Determination of the optimal collection time
In order to collect the microbial communities present on poultry cuts for subsequent use to re
inoculate meat matrices, a sufficient level of bacteria was required. As well, a significant bacterial
diversity of the collected microbiota was necessary. Previous studies showed meat microbiota diversity
decreases during storage or with spoilage occurrence (Rossen et al., 1992, Wilson, 1997, Abu Al-Soud
& Rådström, 2000, De Filippis et al., 2013, Chaillou et al., 2015). Last, we estimated that microbiota
stocks at a concentration of 107 CFU/mL would be optimal to perform challenge tests, and that 20 to
100 aliquots of 1 mL would be required for obtaining enough repeats. We needed then to collect ~109
CFU per bacterial community. Therefore we monitored the total viable counts on chicken legs from T0
(time of arrival in the supermarket i.e. 0 – 2 days after slaughtering) to UBD (10 days after the date of
arrival in the supermarket). Cuts were incubated without any protective modified atmosphere at 4 °C
and 8 °C (Figure 15), and the rinsing method described above was used for bacterial determination of
meat contamination.
Figure 15 Total viable counts recovered per chicken leg.
At the beginning of storage, total counts were too low to collect a sufficient bacterial stock. After 8-10
days the total bacterial population collected in the rinsing solution (i.e. per chicken leg with an average
0
2
4
6
8
10
12
14
16
18
0 1 2 3 4 5 6 7 8 9 10
log
CFU
/ch
icke
n le
g
4°C
8°C
UBDExpedition Storage 2/3 UBD
Storage (days)
-2

A.Rouger 2017 Chapitre 2 Mise au point d’un microbiote standard
85
weight of 278.5 ± 89 g) reached ~13 log CFU after storage at 4 °C and more than 16 log CFU when cuts
were stored at 8 °C. At this time, the quantity is sufficient to prepare a bacterial stock. However, at the
end of the storage period we had a risk to collect microbiota with low diversity and enriched in spoilage
bacteria (De Filippis et al., 2013, Chaillou et al., 2015). To have a stock with enough bacteria and still
representing the diversity occurring on poultry cuts, we decided to collect bacteria from single chicken
legs stored at 4 °C for 6 to 11 days, depending on the shelf-life of each batch (see table 1), a period
corresponding to 2/3 of their UBD.
Constitution of a viable poultry meat microbiota collection
The results of bacterial communities recovered for 9 samples (A to I) are shown in Figure 16. Results
obtained for all 23 samples are shown in supplementary Figure 17.
Figure 16 Composition and viability of bacterial communities from 9 samples of chicken legs before
and after frozen storage at -80 °C, determined by enumeration on various specific media.
Asterisks show when the values before and after freezing are statistically different.
An important variability in both total viable counts and diversity of bacterial population is observed
between samples. Total viable counts vary from ~5 log CFU/g between the less contaminated samples

A.Rouger 2017 Chapitre 2 Mise au point d’un microbiote standard
86
(103 CFU/g in samples A or D) to the most contaminated ones (108 CFU/g for samples J or N). Bacterial
diversity also differed between samples: Pseudomonas sp. and B. thermosphacta ratio differed
between chicken legs. In sample B Pseudomonas sp. were dominant by about 2 log units when
compared to the B. thermosphacta population whereas in samples N and Q the opposite situation was
observed. This might be the consequence of the gas composition used for packaging as sample B was
stored under an O2 rich packaging whereas packaging atmosphere of samples N and Q was poor in O2.
Indeed several gas ratios were measured in the pack head-space (Table 8). One gas mixture contained
high O2 concentration apparently completed with CO2 (samples A, B, C as example), one poor in O2 and
completed with CO2 (and probably N2) (like samples G, H, M) and possibly a third one with another CO2
- N2 - O2 balance (like samples E, O, U). These observations may explain the different microbiotas
observed.
After storage at -80 °C, bacterial population remained cultivable and the richness in aliquots was not
particularly affected (Figure 16 and Figure 17). However, a significant decrease or increase of
Enterobacteriaceae counts was observed in most samples (Figure 17), which can result from a
fluctuation in counting analysis from VRBG plates. Lactic acid bacteria and B. thermosphacta viability
was decreased in some samples (Figure 17), without modifying drastically the balance of the bacterial
communities of our life stocks.
For the 23 stored bacterial stocks, we also tested our DNA extraction procedure. DNA concentration
was measured and PCR amplifications were performed on 16S rRNA gene. Despite the optimization of
the method and several repeats, only 10 amplifications were successful (Table 10, Figure 18). All PCR-
positive reactions were obtained with DNA extracted from high cell concentration bacterial samples
(>105 CFU/g). However, several samples issued from bacterial communities with such high bacterial
concentration did not lead to a positive PCR reaction. It seems clear that is not a problem of DNA
extraction or stability because samples leading to similar DNA concentrations could be either positive
or negative (samples Q and R, Table 10).

A.Rouger 2017 Chapitre 2 Mise au point d’un microbiote standard
87
0123456789
10
AB
CD
EF
GH
IJ
KL
MN
OP
QR
ST
UV
W
log cfu/g
Sam
ple
s
0123456789
10
AB
CD
EF
GH
IJ
KL
MN
OP
QR
ST
UV
W
log cfu/g
Sam
ple
s
Aer
ob
ic m
eso
ph
ilic
flo
raP
seu
do
mo
na
sB
roch
oth
rix
ther
mo
sph
act
aLa
ctic
aci
d b
acte
ria
Ente
rob
ater
ia
Be
fore
sto
rage
Aft
er
sto
rage
Figu
re 1
7 Su
pp
lem
en
tary
Fig
ure
. Co
mp
osi
tio
n a
nd
via
bili
ty o
f b
acte
rial
co
mm
un
itie
s fr
om
23
sam
ple
s o
f ch
icke
n le
gs b
efo
re a
nd
af
ter
fro
zen
sto
rage
at
-80
°C
, de
term
ine
d b
y e
nu
me
rati
on
on
var
iou
s sp
ecif
ic m
edia
.

A.Rouger 2017 Chapitre 2 Mise au point d’un microbiote standard
88
Table 10 Concentration of DNA extracted from the bacterial stocks of the 23 samples and subsequent PCR efficiency
Samples Bacterial counts
(Log CFU/mL) DNA concentration
(µg/ml)
A 3.8±0.03 10,4
B 4.9±0.02 14,3
C 3.8±0.07 8,9
D 3.1±0.13 11,1
E* 7.5±0.11 19,6
F* 5.6±0.29 8,1
G* 4.3±0.29 8,3
H 3.9±0.08 30,8
I* 5.7±0.18 18,4
J* 9.4±0.00 95,6
K 3.6±0.10 7,2
L 5.9±0.10 10,2
M* 5.6±0.29 14,1
N* 8.8±0.27 12,1
O 4.1±0.25 26,0
P 3.0±0.16 4,8
Q* 7.3±0.19 22,8
R 4.2±0.11 23,8
S 5.7±0.04 7,9
T* 5.6±0.02 10,2
U* 7.3±0.14 29,0
V 3.9±0.02 10,1
W 3.7±0.02 27,2
*positive amplification
We also could not correlate the PCR efficiency with the nature of bacterial population, the weight of
the meat sample used, the nature of the gas packaging (see Figure 18). Such differences in PCR
amplification could be explained by the presence of PCR inhibitors and/ or of DNases in some samples
but not in some others.
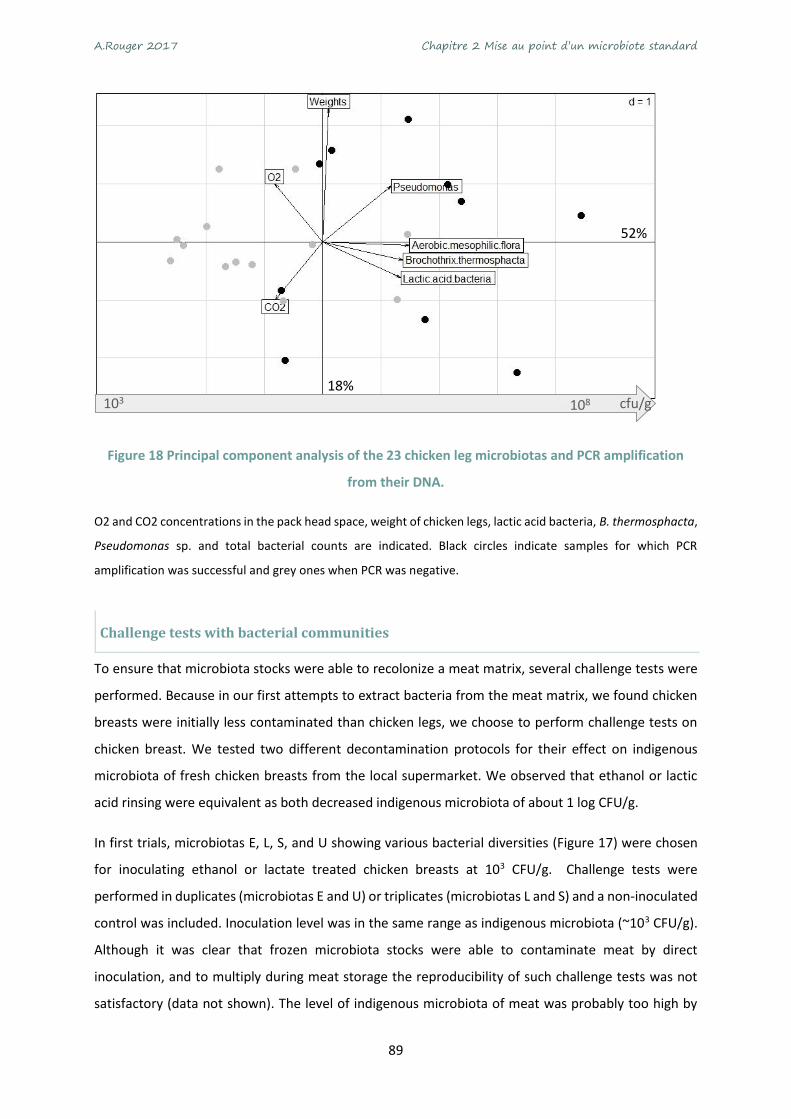
A.Rouger 2017 Chapitre 2 Mise au point d’un microbiote standard
89
Figure 18 Principal component analysis of the 23 chicken leg microbiotas and PCR amplification
from their DNA.
O2 and CO2 concentrations in the pack head space, weight of chicken legs, lactic acid bacteria, B. thermosphacta,
Pseudomonas sp. and total bacterial counts are indicated. Black circles indicate samples for which PCR
amplification was successful and grey ones when PCR was negative.
Challenge tests with bacterial communities
To ensure that microbiota stocks were able to recolonize a meat matrix, several challenge tests were
performed. Because in our first attempts to extract bacteria from the meat matrix, we found chicken
breasts were initially less contaminated than chicken legs, we choose to perform challenge tests on
chicken breast. We tested two different decontamination protocols for their effect on indigenous
microbiota of fresh chicken breasts from the local supermarket. We observed that ethanol or lactic
acid rinsing were equivalent as both decreased indigenous microbiota of about 1 log CFU/g.
In first trials, microbiotas E, L, S, and U showing various bacterial diversities (Figure 17) were chosen
for inoculating ethanol or lactate treated chicken breasts at 103 CFU/g. Challenge tests were
performed in duplicates (microbiotas E and U) or triplicates (microbiotas L and S) and a non-inoculated
control was included. Inoculation level was in the same range as indigenous microbiota (~103 CFU/g).
Although it was clear that frozen microbiota stocks were able to contaminate meat by direct
inoculation, and to multiply during meat storage the reproducibility of such challenge tests was not
satisfactory (data not shown). The level of indigenous microbiota of meat was probably too high by
52%
18%103 108 cfu/g

A.Rouger 2017 Chapitre 2 Mise au point d’un microbiote standard
90
comparison to the inoculation level. Indeed, the importance of the level of the natural contamination
on the growth of protective cultures has been previously shown in beef meat (Chaillou et al., 2014).
Figure 19 Challenge-tests of microbiotas E and U inoculated on chicken breast dices and incubated under two different modified atmosphere packaging.
Total aerobic mesophilic bacteria were enumerated at T0, and then at day 1, 2, 3, and 6. A non-inoculated control (Ni) was also performed. O2/CO2 ratios in modified atmosphere packaging (MAP)
are indicated. For further experiments, microbiotas were inoculated at 105 CFU/g. Microbiotas E and U were chosen
because of their different abundance of B. thermosphacta. Meat was then stored at 4 °C under CO2/N2
or CO2/O2 atmospheres and bacteria were enumerated on contaminated meat and on non-inoculated
control at T0 and during storage. Dynamics of total aerobic mesophilic counts is presented Figure 19.
From inoculation time till day 6 both inoculated microbiotas dominated the indigenous contaminants,
whatever the storage atmosphere used. Figure 20 shows B. thermosphacta and Pseudomonas sp.
counts. At T0 B. thermosphacta level was ~4 104 CFU/g and ~2 103 CFU/g in meat samples inoculated
with microbiotas E and U, respectively. Despite this initial difference, under O2 rich atmosphere, the
final B. thermosphacta population reached similar levels (2.2 1011 CFU/g and 1.3 1011 CFU/g) at day 6.
Conversely, at the end of storage under CO2/N2 atmosphere, B. thermosphacta counts remained about
1 log higher with microbiota E (5.7 107 CFU/g) than with microbiota U (6.6 106 CFU/g).
Figure 20 Kinetics of B. thermosphacta and Pseudomonas sp. reimplantation monitored on specific media after inoculation of microbiota E or U.
Pseudomonas sp. (grey lines) and B. thermosphacta (black lines) were enumerated at T0, and then at day 1, 2,
and 6. O2/CO2 ratios in modified atmosphere packaging (MAP) are indicated.

A.Rouger 2017 Chapitre 2 Mise au point d’un microbiote standard
91
Pseudomonas sp. behavior was different: with an initial inoculation level of ~2 102 CFU/g with both
microbiotas, in the presence of O2 Pseudomonas sp. final population was 1 log higher with microbiota
U than after inoculation of microbiota E (Figure 20). As expected, in the absence of O2, Pseudomonas
sp. did not grow. However a stable population level was observed during storage, suggesting that those
bacteria could survive. Finally; the comparison of B. thermosphacta, Pseudomonas sp. and total aerobic
mesophilic counts at the end of storage confirmed that packaging atmosphere has an important impact
on bacterial development. The use of a ratio 50% CO2 - 50% N2 showed a better inhibiting activity than
30% CO2 - 70% O2. This cannot rely only on CO2 as the two atmospheres we used contained high levels
of this gas.
Conclusion
A high variability between poultry meat samples had been shown in this study. The contamination
level as well as the nature of bacterial species contaminating chicken cuts can be drastically different
depending on the batches. To ensure poultry meat microbial safety, microbial ecology studies are
necessary, which are complicated by the above mentioned high variability. We propose a method
enabling the collection of viable bacterial stocks that can be stored as aliquots for performing
reproducible and standard challenge tests. This method, based on a rinsing step of meat, followed by
bacteria concentration and freezing allowed collecting 23 different viable microbiotas. Four of those
were chosen to conduct challenge tests and have successfully recolonized meat without a prior culture
step, which could potentially lead to a bias in microbial diversity evaluation. We also developed a
protocol for extracting bacterial DNA out of these microbiotas, for subsequent PCR amplification.
Although DNA extraction was successful, PCR amplification efficiency needed a minimal amount of
bacteria (>105 CFU/g) and the presence of PCR inhibitors was suspected in about half of the samples.
Nevertheless, the use of such a method should help for the detailed characterization of meat
microbiota and the study of its dynamics during different meat treatments or storage conditions
dedicated to improve microbial safety, such as the use of various atmosphere packaging or
decontamination treatments (Doulgeraki et al., 2012). In particular, we think that our method will be
useful to study the response to storage conditions, by species occurrence and co-occurrence in order
to better understand the microbial role in meat spoilage and to plan consequent improvement of meat
storage systems. In fine, the results may lead to describe relevant markers (bacterial species, genes…)
for the development of simple, fast, accurate and low-cost methods to be used by the agro-food
industry for a better control of poultry meat safety.

A.Rouger 2017 Chapitre 2 Mise au point d’un microbiote standard
92
Acknowledgements
This work was financed by “Région Pays de la Loire” (PhD grant to AR and post-doc grant to BR). The
authors would like to thank Valérie Anthoine and Nicolas Moriceau, Oniris-INRA, Nantes for their
technical support and Sandrine Guillou, Oniris-INRA, Nantes for her contribution during statistical
analysis. We thank Mark Irle, École du Bois, Nantes and also Catherine Magras, Odile Tresse and Marie-
France Pilet, Oniris-INRA, Nantes for helpful and critical discussions, and the Oniris food technology
pilot plan for access to food packaging facilities.
2.3- Ce qu’il faut retenir du chapitre 2
Dans le but de reconstituer un écosystème microbien de viande de volaille, nous avons tout d’abord
récolté des bactéries provenant de cuisses de poulet. En effet, la peau présente sur les cuisses de
poulet est fortement contaminée, ce qui nous a permis de récolter suffisamment de bactéries entre
2/3 de la DLC et la DLC du produit. Nous avons collectés les bactéries provenant de 23 lots de cuisses
de poulet de marques, d’origines et d’appellations différentes. Les bactéries ont été stockées en
présence de glycérol à -80°C et leur viabilité a été testé. Les bactéries sont capables de survire à la
congélation et nous retrouvons les proportions globalement similaires avant et après congélation.
Nous avons constaté que les espèces que nous avions recherchées par méthodes culturales sont
retrouvées dans des proportions variables suivant les lots. En flore totale, cela représente de 3 à 8 log
UFC/g. Nous avons constaté également les variations de la composition de l’atmosphère protectrice
suivant les lots. Dans le but de réaliser différentes études par biologie moléculaire, nous avons extrait
l’ADN après optimisation du protocole. L’extraction d’ADN et l’amplification PCR a été possible pour
10 des 23 lots.
Enfin les communautés bactériennes ont été ré-inoculées sur de la viande pauci microbienne et nous
avons montré que sans étape de culture préalable les bactéries étaient capables de se ré implanter et
de se développer sur la viande au cours de la conservation sous amphotère protectrice.
Nous avons donc mis au point une méthode permettant de collecter et de conserver des microbiotes
standards de viande de poulet. Cependant bien que les méthodes culturales nous aient permis
d’évaluer le niveau global de contamination et le suivi de quelques flores d’intérêt, la composition de
ces communautés microbiennes isolées dans cette étude est peu exhaustive. Nous avons donc
cherché, dans la suite de ces travaux de thèse, à décrire par méthode de biologie moléculaire, les
communautés bactériennes à partir de l’ADN bactérien isolé des 10 lots de cuisses de poulet.

A.Rouger 2017 Chapitre 3 Description de la diversité bactérienne
93
Chapitre 3 Description de la diversité
bactérienne
3.1- Préambule
Dix des 23 communautés récoltées (chapitre 2) ont été analysées de manière plus approfondie par
pyroséquençage de la région V1-V3 de l’ADNr 16S. Différents pipelines d’analyse des données ont été
testés et les données ont été comparées aux résultats obtenus par microbiologie culturale classique et
par qPCR.
Cette étude a fait l’objet d’un manuscrit soumis en janvier 2017 dans la revue Food Microbiology
(Reference: FM_2017_102).
3.2- Diversity of bacterial communities in French chicken cuts stored under modified
atmosphere packaging.
Amélie Rouger, Nicolas Moriceau, Hervé Prévost, Benoît Remenant*, Monique Zagorec#
Food microbiology
UMR1014 SECALIM, INRA, Oniris, 44307, Nantes, France
# Corresponding author : Monique Zagorec
*present address, Laboratoire de la Santé des Végétaux LSV, Anses, Angers, France
Abstract
Poultry meat, the second most consumed meat in France, is commercialized mainly as portions of
chicken cuts with various quality labels, stored under various modified atmosphere packaging (MAP),
with shelf-life ranging from 9 to 17 days. We used 16S rDNA pyrosequencing to describe microbiota of
chicken legs. Ten samples representing a wide diversity of labels and MAP available on the market
were collected from local supermarkets and stored at 4°C. Microbiota were collected, total DNA was
extracted, and V1-V3 fragment of 16S rRNA genes were amplified and sequenced. For data analysis

A.Rouger 2017 Chapitre 3 Description de la diversité bactérienne
94
several pipelines were compared. The Qiime pipeline was chosen to cluster reads and we used a
database previously developed for a meat and fish microbial ecology study. Variability between
samples was observed and a listing of bacteria present on chicken meat was established. The structure
of the bacterial communities were compared with traditional cultural methods and validated with
quantitative real time PCR. Brochothrix thermosphacta, Pseudomonas sp., and Carnobacterium sp.
were dominant and the nature of the gas used for packaging influenced the relative abundance of each
suggesting a MAP gas composition dependent competition between these species. We also noticed
that slaughterhouse environment may influence the nature of the contaminants.
Highlights
• Microbiota of chicken cuts is variable
• Pyrosequencing approaches have to be combined to other methods to validate results
• Slaughterhouse environment may influence the nature of the meat contaminants
• Nature of the gas shapes the relative abundance of bacteria.
Keys word: Pyrosequencing; chicken meat; spoilage; modified atmosphere packaging; microbiota.
Introduction
Richness and abundance of microbiota present in food products, and especially meats, play an
important role in the shelf life of the products, their microbial safety, and therefore the consumer
health. Unlike fermented food, where unwanted bacteria are controlled by the addition of bacterial
starters that become dominant during the process, fresh meat contamination is more diversified.
Sources of contamination are the animal and the environment microbiota, and depend on the farming
and slaughtering process (Chaillou et al., 2015). Poultry meat can host very diverse microbial
communities varying with seasonal changes (Cohen et al., 2007) among which spoilage bacteria
(Doulgeraki et al., 2012) or pathogens such as Campylobacter (Gruntar et al., 2015) and Salmonella
(Rasschaert et al., 2008) which must be controlled to ensure safety of the products (Álvarez-Astorga et
al., 2002).
The use-by-date (UBD) of fresh poultry meat is determined as the time period during shelf life for
bacterial contamination to reach around 7 log CFU.g-1 (Okolocha & Ellerbroek, 2005). It usually varies
from 4 to 15 days depending notably on the type of gas used for packaging, i.e. air or modified
atmosphere packaging (MAP). In France, the chicken cuts most commonly sold in supermarkets are

A.Rouger 2017 Chapitre 3 Description de la diversité bactérienne
95
packed under various MAP, either enriched or devoid of O2 and the shelf-life can reach 17 days (Rouger
et al., 2017). In addition a large panel of quality labels (standard, organic, halal, free range) is available
and various breeding or farming practices exist, that may influence the bacterial loads present on meat.
Most of the information dealing with fresh meat product bacterial contamination is issued from
cultural methods (for a review see (Doulgeraki et al., 2012). These cultural methods use selective media
for bacteria detection and quantification such as total viable counts, lactic acid bacteria,
Enterobacteria, Pseudomonas sp., Brochothrix (Mead, 2004). In a previous study, we used such plating
methods to determine the contamination level of chicken legs and a large variation of total aerobic
counts between samples (from 3 to 8 log CFUg-1) was observed (Rouger et al., 2017). We also noticed
that the ratio between lactic acid bacteria, Pseudomonas, Enterobacteria, and Brochothrix
thermosphacta loads differed within samples. However, we did not observe any correlation between
these variations and meat quality labels or MAP gas composition. Nevertheless a competition between
bacterial contaminants exists during poultry meat storage (Alonso-Hernando et al., 2012a) and storage
conditions may influence food microbiota (Chaillou et al., 2015). With the development of high-
throughput sequencing methods, the description of complex microbial communities of many
environments has been revisited. Next generation sequencing (NGS) technologies are nowadays
commonly used, in particular to investigate animal and environmental microbiota and In addition
software and analysis pipelines are easily and freely available (Ercolini, 2013, Mayo et al., 2014). More
recently, these have been also applied to food but mainly to fermented products which microbial
diversity is less complex than that of fresh products.
Nevertheless few studies using sequencing approach have been reported on non-fermented meat
products, most of them dedicated to beef or pork meat (Ercolini et al., 2006, Benson et al., 2014,
Chaillou et al., 2015, Hultman et al., 2015). To our knowledge, only two studies using NGS focused on
poultry meat, a comparison of microbiota present in marinated vs non marinated Finnish chicken
breast (Nieminen et al., 2012) and the analysis of the contamination along the production chain in USA,
from broiler chicken production to carcasses, which are rinsed in a chlorinated solution (Oakley et al.,
2013).
In the present study, we describe the diversity of the microbiota of chicken legs from 10 different
samples collected from French supermarkets and stored under various MAP, by a 16S rRNA gene
pyrosequencing approach.

A.Rouger 2017 Chapitre 3 Description de la diversité bactérienne
96
Materials and methods
16S rRNA gene pyrosequencing
DNA extraction from meat microbiota
In a previous study we collected bacterial communities from 23 chicken leg samples and stored them
at -80°C with glycerol 15%, and bacterial DNA was extracted from 10 out of these communities (Rouger
et al., 2017). Briefly, after thawing tubes, bacteria were collected by centrifugation at 10 000xg for 10
min at 4°C. DNA was extracted with Mobio Power Food Microbial DNA isolation kit with a prior step of
incubation in an ultrasonic bath (see (Rouger et al., 2017).
Pyrosequencing PCR conditions
The V1-V3 region of the 16S rRNA gene (567 bp) was amplified by PCR with 27F
(CGTATCGCCTCCCTCGCGCCATCAGxAGAGTTTGATCCTGGCTCAG and 534R
(CTATGCGCCTTGCCAGCCCGCTCAGxATTACCGCGGCTGCTGG) with x representing the barcodes specific
for each of the 10 samples (see Table 11).
The 50 µL PCR mixture was composed of 2.5 U of high fidelity Pwo DNA polymerase (Roche Diagnostics,
France), 1X Pwo buffer (100 mM Tris–HCl, 250 mM KCl, 50 mM (NH4)2SO4, 20 mM MgSO4, pH 8.85), 0.2
mM dNTP (New England Biolabs, USA), 0.6 µM of each primers, and 2.5 µL of the DNA solution. All PCR
amplifications were performed in a PTC-100 Thermocycler (MJ Research Inc., USA). The PCR protocol
encompassed an initial denaturation step (94 °C for 2 min) followed by 30 or 35 cycles comprising a
denaturation step (94 °C for 30 s), primer annealing steps using a temperature gradient (60 °C for 30
s, −0.5 °C per cycle), and an extension step (72 °C for 1 min). At the end a final extension at 72 °C for 7
min was performed. Two PCR amplifications were performed per sample, with either 30 or 35 cycles.
DNA quantification and quality control
PCR fragments were visualized on 1 % (w/v) agarose gels. PCR products were purified with the QIAquick
kit (Qiagen SA, France) according to the manufacturer’s procedure, then concentrated in a SpeedVac
system (Thermofisher scientific, France) to obtain a final volume of 30 µL purified DNA. DNA
concentration was measured with a Qubit fluorimeter (Invitrogen, CA, USA), quality and quantity
parameters were checked on Experion DNA 12K chips (Biorad, France) prior sequencing.

A.Rouger 2017 Chapitre 3 Description de la diversité bactérienne
97
The 50 µL PCR mixture was composed of 2.5 U of high fidelity Pwo DNA polymerase (Roche Diagnostics,
France), 1X Pwo buffer (100 mM Tris–HCl, 250 mM KCl, 50 mM (NH4)2SO4, 20 mM MgSO4, pH 8.85), 0.2
mM dNTP (New England Biolabs, USA), 0.6 µM of each primers, and 2.5 µL of the DNA solution. All PCR
amplifications were performed in a PTC-100 Thermocycler (MJ Research Inc., USA). The PCR protocol
encompassed an initial denaturation step (94 °C for 2 min) followed by 30 or 35 cycles comprising a
denaturation step (94 °C for 30 s), primer annealing steps using a temperature gradient (60 °C for 30
s, −0.5 °C per cycle), and an extension step (72 °C for 1 min). At the end a final extension at 72 °C for 7
min was performed. Two PCR amplifications were performed per sample, with either 30 or 35 cycles.
DNA quantification and quality control
PCR fragments were visualized on 1 % (w/v) agarose gels. PCR products were purified with the QIAquick
kit (Qiagen SA, France) according to the manufacturer’s procedure, then concentrated in a SpeedVac
system (Thermofisher scientific, France) to obtain a final volume of 30 µL purified DNA. DNA
concentration was measured with a Qubit fluorimeter (Invitrogen, CA, USA), quality and quantity
parameters were checked on Experion DNA 12K chips (Biorad, France) prior sequencing.

A.Rouger 2017 Chapitre 3 Description de la diversité bactérienne
98
Table 11 Primers used in this study
Pri
mer
seq
uen
ce (
5′→
3′)
Pri
mer
nam
eB
arco
des
aFr
agm
ent
size
(b
p)
Targ
etR
efer
ence
All
bac
teri
a
CG
TATC
GC
CTC
CC
TCG
CG
CC
ATC
AG
xAG
AG
TTTG
ATC
CTG
GC
TCA
Ga
CTA
TGC
GC
CTT
GC
CA
GC
CC
GC
TCA
GxA
TTA
CC
GC
GG
CTG
CTG
Ga
Sam
ple
sFo
rwar
dR
ever
se
56
7
16
S rR
NA
gen
e V
1-
V3
reg
ion
Ch
aillo
u e
t al
.,
20
15
27
F-M
ID0
8/53
4R-M
ID14
EC
TCG
CG
TGTC
CG
AG
AG
ATA
C
27
F-M
ID1
0/53
4R-M
ID13
FTC
TCTA
TGC
GC
ATA
GTA
GTG
27
F-M
ID4
3/53
4R-M
ID02
GTC
GC
AC
TAG
TA
CG
CTC
GA
CA
27
F_M
ID1
9/5
34R
_MID
21
ITG
TAC
TAC
TCC
GTA
GA
CTA
G
27
F_M
ID2
3/5
34R
_MID
25
JTA
CTC
TCG
TGTC
GTC
GC
TCG
27
F_M
ID2
7/5
34R
_MID
29
MA
CG
CG
AG
TAT
AC
TGTA
CA
GT
27
F_M
ID3
1/5
34R
_MID
33
NA
GC
GTC
GTC
TA
TAG
AG
TAC
T
27
F_M
ID3
5/5
34R
_MID
37
QC
AG
TAG
AC
GT
TAC
AC
AC
AC
T
27
F_M
ID3
9/5
34R
_MID
41
TTA
CA
GA
TCG
TTA
GTG
TAG
AT
27
F_M
ID1
5/5
34R
_MID
17
UA
TAC
GA
CG
TAC
GTC
TAG
TAC
B. t
her
mo
sph
acta
GG
AC
CA
GA
GG
TTA
TCG
AA
AC
ATT
AA
CTG
TAA
TAC
CA
GC
AG
CA
GG
AA
TTG
CTT
QSF
03
-BTH
-F
QSF
03
-BTH
-R1
48
rpo
CFo
ugy
et
al, 2
01
6
C. d
iver
gen
sC
CG
TCA
GG
GG
ATG
AG
CA
GTT
AC
AC
ATT
CG
GA
AA
CG
GA
TGC
TAA
T
CB
1
CB
2R
34
0
16
S rR
NA
gen
eSc
arp
ellin
i et
al.,
20
02
Pse
ud
om
on
as s
pp
.A
CTT
TAA
GTT
GG
GA
GG
AA
GG
G
AC
AC
AG
GA
AA
TTC
CA
CC
AC
CC
Pse
43
5F
Pse
44
9R
25
1
16
S rR
NA
gen
eB
ergm
ark
et a
l.,
20
12
Shew
anel
la s
pp
.C
GC
GA
TTG
GA
TGA
AC
CTA
G
GG
CTT
TGC
AA
CC
CTC
TGTA
She2
11
f
She1
25
91
16
16
S rR
NA
gen
eTo
do
rova
an
d
Co
stel
lo, 2
00
6
Cam
pyl
ob
acte
r sp
p.
ATC
TAA
TGG
CTT
AA
CC
ATT
AA
AC
GG
AC
GG
TAA
CTA
GTT
TAG
TATT
MD
16
S1
MD
16
S28
57
16
S rR
NA
gen
eLi
nto
n e
t al
., 1
99
7
a : x r
epre
sen
t th
e b
arco
des
sp
ecif
ic f
or
each
of
the
10 s
amp
les
Tab
le 1
2 P
rim
ers
use
d in
th
is s
tud
y

A.Rouger 2017 Chapitre 3 Description de la diversité bactérienne
99
Sequencing and data analysis
For each sample, the DNA amplified after 30 and 35 cycles were pooled and sequenced in single end
by Eurofins MWG (Ebersberg, Germany) using 454 GS-FLX++ Titanium Technologies (454 Life
Technologies, USA). Different strategies were compared for data analysis: the FROGS pipeline (Find
Rapidly OTUs with Galaxy Solution) (Escudie et al., 2015) or the protocol designed in previous study
(Chaillou et al., 2015) were tested. In addition the pipeline using Qiime software currently found in the
literature for metabarcoding data sets (Caporaso et al., 2010). Those were combined to different
databases. The main features of the strategies tested are summarized Table 12.
FROGS is a pipeline developed to run in a reasonable time in an user-friendly under Galaxy
environment. The pipeline includes demultiplexing, and a pre process step to filter and delete
sequences with unexpected lengths, with ambiguous bases (N) and which do not contain primer
sequence at both 3’- and 5’-ends. The clusterization is performed with Swarm, a robust and fast
clustering method for amplicon-based studies without global threshold and independent of sequence
order (Mahe et al., 2014). After clustering, detection of chimeras is performed with a specific removal
method of FROGS (Vsearch and cross-validation). After filtering multi-affiliation with 2 taxonomy
affiliation procedures were performed. FROGS pipeline includes also statistics tools.
Table 13 Comparison of pipeline analysis for the different strategies tested in this study
FROGS Qiime (Caporaso et al.,
2010) EBP (Chaillou et al., 2015)
Pre process Integrated in the pipeline
(cutadapt / fastQC software)
Done manually (cutadapt / fastQC
software)
Done manually (cutadapt / fastQC
software)
Detection of primers 5’ and 3’ 5’ 5’
Detection of chimeras VQIIME after clustering DECIPHER before
clustering DECIPHER before
clustering
Clustering software SWARM (Mahe et al.,
2014) Pick de novo included in
Qiime software
gsAssembler or CD-Hit (Genomes assembly
software)
Reference sequences for each OTUs
- Most represented
sequences Consensus sequences
16S rDNA Database Double affiliation default
RDP (Cole et al., 2005) SILVA
Possible of double affiliation
RDP (Cole et al., 2005) EBP_DB (Chaillou et al.,
2015)
RDP EBP_DB (Chaillou et al.,
2015)
Normalization / statistics Integrated in the pipeline Done manually Done manually

A.Rouger 2017 Chapitre 3 Description de la diversité bactérienne
100
The protocol design by Chaillou et al. (2015) uses different software, reads were demultiplexed
according to barcode sequences with cutadapt and quality of the sequencing is checked using FastQC
software (Babraham Bioinformatics). The reads are trimmed and filtered with quality score threshold
of 20. Chimeric sequences are detected using Decipher web server (Wright et al., 2012) and are
removed from the dataset prior any bioinformatic analysis (Haas et al., 2011). Software used for
clustering, initially designed for genome assembly, is used here to cluster 16S rDNA sequences. The
clustering is performed with Qiime software (Caporaso et al., 2010) using the longest reads as
reference for each operational taxonomic unit (OTU) whereas in the strategy developed by Chaillou et
al. (2015) a consensus sequence of each OUT is used as reference. The reference sequences of each
OTU are blasted against the Ribosomal Database Project database (RDP II) (Cole et al., 2005) and the
EBP/silva database designed by Chaillou et al. (2015) for taxonomic assignation. Relative abundances
are estimated by counting the number of reads mapped on OTUs sequences. For both Qiime and EBP
methods statistical analysis are performed manually.
Statistical analysis
The rarefaction curves were designed using command citation ("vegan") in R (Oksanen et al., 2016.)
and Qiime was used to calculate diversity and richness indices (Caporaso et al., 2010). To establish OTU
relative abundance, the numbers of reads were normalized to the median value of total reads as
described by Chaillou et al. (2015). For each sample read counts were divided by a normalization factor
corresponding to the number of reads in the sample divided by the median value of total reads
obtained for the 10 samples.
Bacterial pure cultures for real time quantitative PCR (qPCR)
Strains were cultured on BHI (AES, France) plates with 1.5% agar (Biokar Diagnostics, France) for 36 h
at adequate temperature (Table 3). A colony was resuspended into 10 mL of BHI broth and incubated
overnight (see Table 13 for incubation conditions). Bacterial cultures were inoculated at 1% on fresh
BHI broth and grown for 3-5 h to reach a bacterial suspension of 8 log CFU.mL-1.
A series of 10-fold dilution was performed in BHI broth to obtain bacterial concentrations ranging from
3 to 8 log CFU.mL-1. The exact bacterial concentration was determined after plating on BHI.
DNA extraction for qPCR
A volume of 1 mL of each dilution was centrifuged at 10 000xg for 10 min at 4°C. Bacteria pellets were
resuspended in a Dulbecco’s phosphate buffered saline solution without Ca and Mg (1X) (Eurobio,

A.Rouger 2017 Chapitre 3 Description de la diversité bactérienne
101
France) and DNA was extracted with the High Pure PCR Template Preparation Kit (Roche, France)
according to the manufacturer and eluted in 200 µL milliQ water.
Table 14 Bacterial strains used and culture conditions
Bacterial species Strains Temperature of
incubation Agitation in BHI
broth
Brochothrix thermosphacta DSM 20171 26°C 140 rpm
Carnobacterium divergens V41 30°C -
Pseudomonas fluorescens CIP 6913.T 30°C 240 rpm
Shewanella putrefaciens CIP 6929 26°C 140 rpm
Routine PCR procedure
The PCR mixture (50 µL) contained 1X Taq buffer (10 mM Tris-HCl, 50 mM KCl, 1.5 mM MgCl2, pH 8.3),
0.2 mM dNTP (Euromedex, France), 0.4 µM of each primer, 1.5 U of Taq DNA polymerase (New England
Biolabs, USA) and 1 µL of DNA. The PCR protocol encompassed an initial denaturation step (94 °C for
2 min) followed by 35 cycles comprising a denaturation step (94 °C for 30 s), primer annealing steps
for 1 min 30 s at 59 °C, and an extension step (72 °C for 1 min). At the end a final extension at 72 °C for
7 min was performed.
qPCR procedure
The qPCR mixture (20 µL) contained 1X Solis BIOdYNE (Estonia) mix (5X Hot firepool evagreen qPCR
mix plus (ROX), 0.18 mM each primer and 5 µL of DNA. The quantitative PCR were performed on a
Chromo4 system (Biorad, France). The protocol encompassed an initial denaturation step (95 °C for 15
min) followed by 40 cycles comprising a denaturation step (95 °C for 15 s) and a primer annealing step
for 1 min at 65 °C for C. divergens and B. thermosphacta, 60 °C for Pseudomonas genus, and 56 °C for
Shewanella genus. Melting curves were checked from 55 °C to 94 °C. Each sample was quantified in
triplicate and the average threshold cycle (CT) was calculated. Calibration curves were obtained for
each strain with DNA obtained from 3 independent extractions performed on pure cultures dilutions
ranging from 3 to 8 log CFU.mL-1 (section 2.3). Linear regression of the calibration curves were used to
convert CT in estimated bacterial population level in log CFU.mL-1. Quantification of bacteria from
chicken leg was performed in triplicate from DNA extracted from microbiota (section 2.1).

A.Rouger 2017 Chapitre 3 Description de la diversité bactérienne
102
Data accession numbers
The fastq formatted and quality filtered read sequences have been deposited at the European
Nucleotide Archive (ENA) under the project accession number PRJEB18779 with the accession number
ERS1491275.
Results and discussion
In a previous study (Rouger et al., 2017) we determined the bacterial communities from 23 chicken
legs by using various selective culture media. We observed that total aerobic mesophilic counts varied
from 3 to 8 log CFU.g-1 with lactic acid bacteria, Pseudomonas sp., and B. thermosphacta detected as
the dominant bacteria with relative abundance varying between samples. In the present study 10 of
those chicken leg bacterial communities (named E, F, G, I, J, M, N, Q, T and U) were chosen as
representative the diversity of cuts sold on the French market. From those we investigated the
bacterial diversity on a more exhaustive and non-a priori way with a NGS approach on the V1-V3 region
of 16S rRNA gene from the total metagenomic DNA.
Raw data processing
A total of 220,481 reads were obtained, ranging from 11,883 (sample I) to 33,150 (sample U) per
sample. A maximum of 90 reads per sample were removed from the analysis after quality filtering and
less than 2,500 reads after chimera removal. On average, 5.6% of reads were removed during the pre-
processing steps. From the initial number of reads, the remaining sequences ranged from 86.6%
(sample T) to 98.8% (sample M). Finally for the 10 samples a total of 209,122 reads were used for the
analysis. To verify that the sequencing coverage was large enough to describe the bacterial diversity,
rarefaction curves were established (Figure 21).
It appears from these rarefaction curves that the richness saturation was almost reached for some
samples encompassing around 100 species. However for other samples with the same number of
reads, a higher richness (up to 200 species) led to curves which did not reach the plateau. A deeper
sequencing might have been required for a better coverage of under-represented species.
Nevertheless, a large number of species were detected in our samples, which are probably
representative of the diversity of the chicken meat bacterial ecosystem.

A.Rouger 2017 Chapitre 3 Description de la diversité bactérienne
103
Figure 21 Rarefaction curves from 10 pyrosequencing data set.
Validation of data pipeline analysis
Different pipelines have been developed to analyze datasets of amplicon sequencing. The best known
to analyze 454 dataset are, for example, Qiime (Caporaso et al., 2010) and Mothur (Schloss et al.,
2009). In others cases, authors use combinations of different software initially developed for others
applications (Chaillou et al., 2015). To investigate the robustness of the OTUs identified in our samples,
4 couples (methods/database) were applied, Qiime software (Caporaso et al., 2010) using both RDP
database [Qiime/RDP] or the database designed by Chaillou et al. (2015) [Qiime/EBP_DB], method
followed by Chaillou et al. (2015) (named [EBP/EBP_DB] in this study) and FROGS using Silva database
[FROGS/Silva] (Escudie et al., 2015)
The analysis was performed for each sample but a complete analysis could be obtained for only 3
samples by using FROGS pipeline. Indeed, the 3’-end of the reads was of poor quality and sequence
length was too short to match with parameters used during the pre-process. Therefore we used the
subset of 3 samples to compare the OTUs and their relative abundances obtained with the 4 different
methods. Results are shown Figure 22.

A.Rouger 2017 Chapitre 3 Description de la diversité bactérienne
104
Figure 22 Relative abundance of bacterial genera in 3 different chicken legs samples (E, N and U)
with 4 different analysis pipelines FROGS using Silva database [FROGS/Silva] or with Qiime software using both RDP database
[Qiime/RDP] or database design by Chaillou et al., (2015) [Qiime/EBP_DB] or with the pipeline and the database design by Chaillou et al., (2015) [EBP/EBP_DB]
For samples E and N, the [FROGS/Silva], [Qiime/RDP] and [Qiime/EBP_DB] methods produced quite
similar results on the identified genera and their relative abundance. The [EBP/EBP_DB] method
produced similar results although Acinetobacter, a genus belonging to the dominant microbiota
detected with other methods, and known to be present on poultry meat (Liu et al., 2006, Lupo et al.,
2014) was not detected (Figure 22). For sample U relative abundance and OTUs identification obtained
were different depending on the pipeline analysis used. Pseudomonas was among the dominant
genera according to the 4 strategies. However, Rahnella, Enterobacter and gammaproteobacteria,
Klebsiella/Budvicia, and Pectobacterium/Gibsiella, were among the dominant genera identified after
treatment with [FROGS/Silva], [Qiime/RDP], [Qiime/EBP_DB], and [EBP/EBP_DB], respectively (Figure
22). Except Gibsiella which has been described as an oak phytopathogen (Brady et al., 2010) and the
family of undetermined Gammaproteobacteria, the other genera belong to Enterobacteriacae family
and may therefore be indeed present on poultry cuts. In NCBI database, only partial 16S rDNA
sequences are available for Gibsiella and Rahnella (Stock et al., 2000). In addition, the Gibsiella 16S
rDNA partial sequence matches with Pseudomonas fluorescens and Serratia genomes with 99%
identity score. The Gibsiella identification obtained by [EBP/EBP_DB] method was thus considered as
erroneous. As taxonomic assessment was performed only on the 16S rRNA gene V1-V3 region,
misidentifications for some OTUs are plausible. [EBP/EBP_DB] method was not further used because
of the misidentification of Gibsiella in sample U and the absence of detection of Acinetobacter in

A.Rouger 2017 Chapitre 3 Description de la diversité bactérienne
105
samples E and N. As well, [Qiime/RDP] was not further used in our study due a lack of identification of
Gammaproteobacteria and a putative overestimation of Enterobacter in sample U. [FROGS/Silva]
method could not be used since analysis could be performed with only 3 out of the 10 datasets.
Therefore the [Qiime/EBP_DB] method using the Qiime pipeline (Caporaso et al., 2010) with and
assignation of OTU against the EBP database which was developed to identify bacteria of food products
at species level (Chaillou et al., 2015) was kept for further analyses.
Bacterial communities present on chicken legs
Abundance Table of 20 dominant species belong to 12 different genera is presented in Table 14.
Only OTUs accounting for more than 0.5% of the total reads were considered. Read counts (total of
197,366 reads) were normalized and relative abundances were calculated for each OTUs. Among the
10 samples, 12 dominant genera encompassing 20 species were identified (Figure 23).
Figure 23 Relative abundance of bacterial genera in 10 chicken legs samples
Qiime pipeline is used with and assignation of OTU against the EBP database. Twelve dominant genera representing more than 0.5% of the total reads are listed. Reads counts (total of 197 366 reads) were normalized and relative abundances were calculated for each OTUs.

A.Rouger 2017 Chapitre 3 Description de la diversité bactérienne
106
Table 15 Number of reads identified at species level
Do
min
an
t sp
ecie
s w
ith
mo
re t
ha
n 0
.5%
of
the
tota
l rea
ds
are
list
ed.
Tab
le 1
6 N
um
ber
of
read
s id
enti
fied
at
spe
cie
s le
vel

A.Rouger 2017 Chapitre 3 Description de la diversité bactérienne
107
Among those Brochothrix, Carnobacterium, and Pseudomonas previously described as meat
contaminants (Doulgeraki et al., 2012, Chaillou et al., 2015) are the dominant genera of most samples.
This is in accordance with the microbiological analysis previously performed by plating methods in
which we identified Pseudomonas, B. thermosphacta, and lactic acid bacteria as the main
contaminants (Rouger et al., 2017).
Within the 10 samples of chicken legs Brochothrix accounted for 36% of total reads and was present
in all samples (Figure 23). At the species level, this genus was represented only by B. thermosphacta.
This Gram positive species is currently found in different food ecosystems, especially in meat products
(Borch et al., 1996, Doulgeraki et al., 2012, Rouger et al., 2017) where it is considered as a major
spoilage bacterium (Chaillou et al., 2015, Fougy et al., 2016). Brochothrix campestris the other species
belonging to the Brochothrix genus has been described in soil or other environments and is usually not
reported as food spoilage bacterium compared to B. thermosphacta (Gribble & Brightwell, 2013).
The genus Pseudomonas was the second most abundant genus found in chicken legs with 12% of total
reads. The detection of some Pseudomonas species in this study, such as Pseudomonas fragi,
correlates with the previous description of this species as food spoiler and present in chicken microbial
ecosystem (Arnaut-Rollier et al., 1999a, 1999b, Mohareb et al., 2015). The presence of two sequence
clusters identified as Pseudomonas extremaustralis and Pseudomonas cedrina in our chicken samples
is more doubtful since these species have been rather described as soil bacteria. The genus
Pseudomonas encompasses many different species which identification based on V1-V3 16S rDNA
sequence is difficult (Bergmark et al., 2012). The presence of P. extremaustralis and P. cedrina in
chicken legs would therefore require confirmation.
With 6% of total reads, Carnobacterium was the third dominant genus found in chicken meat microbial
ecosystem. Carnobacterium maltaromaticum was the main species, in agreement with previous
studies which reported its isolation from different food products (Leisner et al., 2012, Cailliez-Grimal
et al., 2013).
Shewanella was also belonging to the dominant microbiota of chicken legs, accounting for 6% of total
reads, although this was mainly due to its dominance in sample M (Figure 23). The species were
identified as Shewanella profunda, Shewanella xiamensis and Shewanella baltica. However
identification of S. profunda and S. xiamensis present mostly in sample M could be also associated to
Shewanella putrefaciens because of their 16S rDNA sequence similarity (Potron et al., 2011). This last
species has been isolated from human microbiota, but also from environment and food products (Holt
et al., 2005). S. baltica, a species present in oceans has also been reported as a fish and seafood
products spoilage organism as S. putrefaciens (Vogel et al., 2005, Remenant et al., 2015).

A.Rouger 2017 Chapitre 3 Description de la diversité bactérienne
108
Some other genera representing around 6% of total reads were identified; Klebsiella and Budvicia were
quite abundant in 2 of the 10 chicken leg samples (T and U) and were represented by two species. The
first one, Klebsiella pneumoniae has been previously described in the human respiratory microbiota
and as an opportunistic pathogen and a commensal organism. It is also present in birds and potentially
responsible for respiratory tract disease in poultry (Younis et al., 2016). The second one, Budvicia
aquatica, of the Enterobacteriaceae family is usually found in surface water (Bouvet et al., 1985) but
may be associated to human diseases (Tomczak and Smuszkiewicz, 2014). The most abundant species
from the genus Acinetobacter found in our samples was Acinetobacter lwoffii, already described on
healthy human skin and microbiota (Regalado et al., 2009) but also responsible for bird diseases
including chicken ones (Wang et al., 2012). This species was found in particular in samples N and J.
Others species like Acinetobacter soli and Acinetobacter venetianus previously isolated from soil and
environment (Al Atrouni et al., 2016) were also observed in this study.
Other genera accounting for only 1% of total reads and present in only some of the 10 samples are
listed below. Psychrobacter urativorans present in all samples has been reported in frozen meat (Vela
et al., 2003, Bowman, 2006). The only species belonging to the genus Vagococcus found in the present
study was Vagococcus fluvialis (samples N and E). The first isolates of this species were recovered from
chicken faeces and river water (Hashimoto et al., 1974) 1979) and new isolates were subsequently
reported from various animals (pigs, cattle, cats, horse and fishes). Several human clinical isolates and
fish probiotics have been described as well (Teixeira et al., 1997, Yi et al., 2005, Sorroza et al., 2012).
Among Flavobacterium the species Flavobacterium antarcticum was identified in sample J. This species
was isolated from a terrestrial sample from the Antarctic, issued from a penguin habitat suggesting its
adaptation to cold and aquatic environments (Yi et al., 2005). Anaerococcus tetradius was detected in
sample I. This anaerobe (Murphy & Frick, 2013) is associated with clinical infections like pleural
empyema (Ezaki et al., 2001). However, this species renamed in 2001 (former name
Peptostreptococcus tetradius) was initially considered as close to Peptostreptococcus barnesae
isolated from chicken feces and renamed Gallicola barnesae (Ezaki et al., 2001). Therefore, we cannot
exclude a misidentification due to sequence 16S rDNA similarities or to errors in the origin of the A.
tetradius sequence present in the database. Finally Janthinobacterium lividum has been described in
samples issued from soils, rivers, lakes and springs but also on skin of amphibians and has been also
linked to milk and meat spoilage (Pantanella et al., 2007). This species was found in low abundance in
some samples but especially in samples E and J. This psychrotolerant species is aerobic and capnophilic
i.e. high CO2 concentrations enhance its growth (Valdes et al., 2015). It has also been reported as
potentially important for fighting Listeria biofilms in food environments (Fox et al., 2014).

A.Rouger 2017 Chapitre 3 Description de la diversité bactérienne
109
All the genera and species we observed in chicken legs microbiota have already been described in food,
animal or water/soil environments. Among those, some have been described as food spoilage bacteria
and some as putative human or animal pathogens. This diversity of species could be explained by the
presence of non-sterile environment in the farm, especially for free range poultry living outdoors.
During the slaughtering process, the water used to rinse carcasses is a potential source of
contamination (Goksoy et al., 2004). Finally, manipulators and mechanical evisceration could explain
the presence of bacteria associated to human or chicken gut microbiota. The presence of several
psychrotrophic and psychrotolerant species in our meat sample microbiota has been already described
and reported as the consequence of cold storage shaping of microbial communities balance (Chaillou
et al., 2015).
The bacterial communities present in Finnish chicken breasts stored with or without the use of a
marinade have been described at the family level by using a metagenomic approach (Nieminen et al.,
2012). Our results are in agreement with those obtained with chicken breasts although some bacteria
reported in the Finnish poultry products were absent from our results. Indeed among lactic acid
bacteria Carnobacteriaceae, Leuconostocaceae, and Lactobacilaceae have been detected in chicken
breasts with Carnobacteriaceae abundance much higher than that of the two other families (Nieminen
et al., 2012). This may explain that only Carnobacteria was observed in our study. As well some species
such as the known pathogens Campylobacter and Salmonella, important for poultry meat safety, were
not detected in our datasets. The prevalence of Campylobacter is on average 88% of carcasses and
76% of products at the retail level (Saint-Cyr et al., 2016). Salmonella was detected in chicken meat at
level of 6.5% and the prevalence is 0.34% in the EU countries (EFSA, 2016). However, the
contamination level of those two pathogens is usually very low (about 2 log CFU.g-1) (Mead, 2004).
Therefore, because of this very low level of contamination the early amplification steps may minimize
or exclude under-represented communities. Only very deep NGS sequencing or specific PCR may
detect such contaminants. The estimated total viable counts of our samples ranged from 4 (sample G)
to 9 (sample J) log CFU.g-1. As the number of reads per sample ranged between ~8,500 and 39,000
(Table 4) and with a cut off of OTU representing at least 0.5% of total reads, such low contamination
level would not be detected here. Nevertheless, PCR amplification by using specific primers (Table 1)
to detect the presence of Campylobacter was negative for the 10 samples (data not shown).
Validation by quantitative PCR and plating methods
Other studies describing the bacterial communities present in meat products, have reported the use
of several methods to validate the results as for example in pork sausages (Fougy et al., 2016). In the

A.Rouger 2017 Chapitre 3 Description de la diversité bactérienne
110
present study abundance of the species C. divergens and B. thermosphacta, and of the genera
Pseudomonas and Shewanella was determined by qPCR on the DNA extracted from the 10 chicken leg
microbiota. The qPCR results were then compared to the data obtained by pyrosequencing and also
to those obtained by plating method in our previous study for Brochothrix and Pseudomonas (Rouger
et al., 2017) (Figure 24). The regression plots of log CFU.mL-1 obtained through the different methods
are shown in supplementary Figure 25. For pyrosequencing data, the relative abundance of reads was
converted to a percentage of total reads (per sample) with 100% set up as the total aerobic counts
measured on plates (expressed in log CFU.mL-1).
Figure 24 Comparison of bacteria quantification by different methods
Results are expressed in log CFU.mL-1. Counting coined as cultures are issued from plating methods (Rouger et al., 2016). For pyrosequencing data, relative abundance of reads was converted to a percentage of total reads (per sample) with 100% set up as the total viable counts measured on plates. Samples with quantification results differing by more than 1 log CFU.mL-1 depending on the method used are noticed by *.
A relatively good correlation of the ordination of samples according to population level was observed
with the different counting estimations (Figure 24). This was particularly true for Pseudomonas and
confirmed by regression plots (Figure 25) indicating a regression coefficient > 0.95 for comparisons
between the three methods. Brochothrix quantification data by plating method and by pyrosequencing
were also correlated but qPCR quantification results differed (Figure 24 and Figure 25).
Carnobacterium counting by pyrosequencing and by plating method was more divergent although the
Brochothrix
Pseudomonas
Shewanella
Carnobacterium
Cultures Pyrosequencing Quantitative PCR
G 3.87±0.00 4.33 4.91±0.22
M* 4.92±0.03 4.57 6.09±0.12
T 4.04±0.02 4.62 5.24±0.23
F 5.05±0.00 4.93 4.72±0.06
U 5.72±0.05 5.40 5.97±0.15
I 5.72±0.08 5.85 5.90±0.18
Q 6.80±0.14 6.92 7.29±0.04
E 7.09±0.00 7.39 6.89±0.10
N 7.36±0.00 7.92 7.77±0.24
J* 7.83±0.00 8.38 6.94±0.14
Cultures Pyrosequencing Quantitative PCR
G* 3.40±0.03 2.08 2.44±0.05
I 3.26±0.09 2.53 2.14±0.10
Q 4.28±0.25 4.27 3.52±0.06
M 5.70±0.18 4.78 5.40±0.05
F 5.27±0.07 4.91 4.48±0.16
E 6.19±0.17 5.42 5.94±0.06
T 5.76±0.11 5.57 5.20±0.07
N 5.96±0.10 5.67 5.45±0.09
U 7.09±0.00 6.36 6.52±0.04
J 8.92±0.00 8.69 8.54±0.08
Pyrosequencing Quantitative PCR
G 2.07 1.74±0.06
I 2.75 3.62±0.14
F* 4.29 1.84±0.13
Q 4.47 5.56±0.10
T* 5.09 6.40±0.01
U 5.59 6.19±0.09
E 5.88 6.51±0.00
M* 6.57 4.04±0.12
N 6.66 6.06±0.13
J* 7.22 3.63±0.20
Pyrosequencing Quantitative PCR
G 3.23 3.76±0.07
I 4.12 4.32±0.05
U 4.38 5.19±0.07
M 4.53 5.23±0.07
F 4.57 4.77±0.02
T 5.22 4.66±0.04
Q 5.61 5.75±0.02
J 6.37 5.77±0.05
E 6.87 6.49±0.03
N 7.49 7.04±0.05
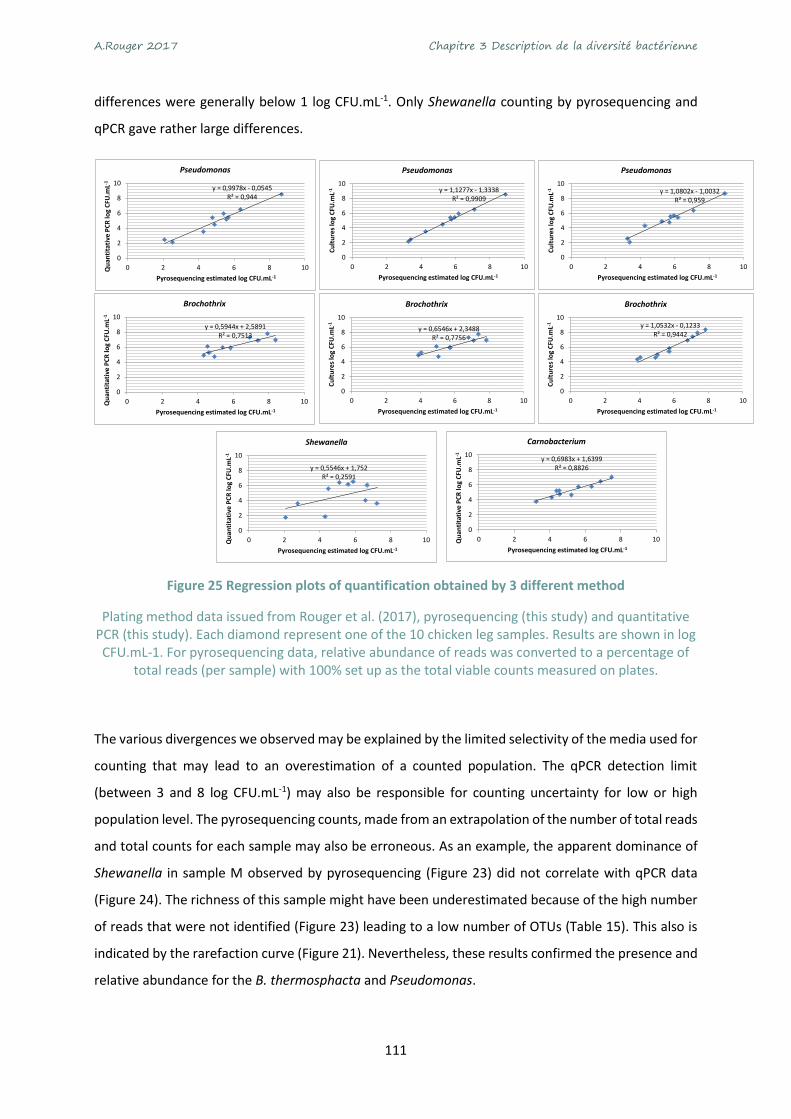
A.Rouger 2017 Chapitre 3 Description de la diversité bactérienne
111
differences were generally below 1 log CFU.mL-1. Only Shewanella counting by pyrosequencing and
qPCR gave rather large differences.
Figure 25 Regression plots of quantification obtained by 3 different method
Plating method data issued from Rouger et al. (2017), pyrosequencing (this study) and quantitative PCR (this study). Each diamond represent one of the 10 chicken leg samples. Results are shown in log CFU.mL-1. For pyrosequencing data, relative abundance of reads was converted to a percentage of
total reads (per sample) with 100% set up as the total viable counts measured on plates.
The various divergences we observed may be explained by the limited selectivity of the media used for
counting that may lead to an overestimation of a counted population. The qPCR detection limit
(between 3 and 8 log CFU.mL-1) may also be responsible for counting uncertainty for low or high
population level. The pyrosequencing counts, made from an extrapolation of the number of total reads
and total counts for each sample may also be erroneous. As an example, the apparent dominance of
Shewanella in sample M observed by pyrosequencing (Figure 23) did not correlate with qPCR data
(Figure 24). The richness of this sample might have been underestimated because of the high number
of reads that were not identified (Figure 23) leading to a low number of OTUs (Table 15). This also is
indicated by the rarefaction curve (Figure 21). Nevertheless, these results confirmed the presence and
relative abundance for the B. thermosphacta and Pseudomonas.
y = 0,9978x - 0,0545R² = 0,944
0
2
4
6
8
10
0 2 4 6 8 10Qu
anti
tati
ve P
CR
log
CFU
.mL-1
Pyrosequencing estimated log CFU.mL-1
Pseudomonas
y = 1,1277x - 1,3338R² = 0,9909
0
2
4
6
8
10
0 2 4 6 8 10
Cu
ltu
res
log
CFU
.mL-1
Pyrosequencing estimated log CFU.mL-1
Pseudomonas
y = 1,0802x - 1,0032R² = 0,959
0
2
4
6
8
10
0 2 4 6 8 10
Cu
ltu
res
log
CFU
.mL-1
Pyrosequencing estimated log CFU.mL-1
Pseudomonas
y = 0,5944x + 2,5891R² = 0,7513
0
2
4
6
8
10
0 2 4 6 8 10Qu
anti
tati
ve P
CR
log
CFU
.mL-1
Pyrosequencing estimated log CFU.mL-1
Brochothrix
y = 0,6546x + 2,3488R² = 0,7756
0
2
4
6
8
10
0 2 4 6 8 10
Cu
ltu
res
log
CFU
.mL-1
Pyrosequencing estimated log CFU.mL-1
Brochothrix
y = 1,0532x - 0,1233R² = 0,9442
0
2
4
6
8
10
0 2 4 6 8 10
Cu
ltu
res
log
CFU
.mL-1
Pyrosequencing estimated log CFU.mL-1
Brochothrix
y = 0,5546x + 1,752R² = 0,2591
0
2
4
6
8
10
0 2 4 6 8 10Qu
anti
tati
ve P
CR
log
CFU
.mL-1
Pyrosequencing estimated log CFU.mL-1
Shewanella
y = 0,6983x + 1,6399R² = 0,8826
0
2
4
6
8
10
0 2 4 6 8 10Qu
anti
tati
ve P
CR
log
CFU
.mL-1
Pyrosequencing estimated log CFU.mL-1
Carnobacterium

A.Rouger 2017 Chapitre 3 Description de la diversité bactérienne
112
Table 17 Richness and diversity indices of the 10 microbial communities issued from chicken legs
Chicken meat microbial diversity – Influence of slaughtering and storage practices
Once the presence and relative abundance of bacteria validated, we compared the microbial diversity
between the 10 chicken leg samples. In Table 15, we listed from 15 (sample I) to 20 (sample F)
dominant OTUs. However, the total number of OTUs ranged from 89 (sample M) to 278 (sample G)
(Table 15). To complete this diversity analysis different richness and evenness indices were calculated
for each samples (Table 15).
An equitability (evenness) index is close to 1 when no species clearly dominates and close to 0 with
the presence of dominant species (Heip et al., 1998). In the 10 samples, sample Q showed the lowest
(Table 15), as encompassing a single highly dominant species (Brochothrix, Fig. 2). At the opposite
sample T had the highest equitability index (0.48, Table 15). Accordingly this sample did not exhibit a
clear cut dominant species but was rather dominated by 6-8 species, each with a close relative
abundance (Table 15). This also correlates with the Shannon index to estimate the diversity. Sample T
was the most diversified with the highest Shannon index (4.51) close to that of sample F (4.52) that
also harbored a high evenness, and sample Q at the opposite with the smallest Shannon index (1.28).
Richness expressed here by the Chao1 index showed sample I as that with the lowest richness and
sample U as the richest sample (Table 15).
Thus, we observed that both the nature of the most abundant species present in chicken leg meat but
also their relative abundance were different depending on the samples. Interestingly, we noticed that
bacterial profiles of samples T and U were similar compared to other samples especially because of
the presence of similar ratios of Klebsiella, Budvicia, and Pseudomonas among the dominant
microbiota and a higher abundance of Carnobacterium and Vagococcus in sample T (Figure 23).
Nb of reads to be analysed
after cleaning step
Nb of reads identified by
Qiime/EBP analysis
Number of observed OTU by Qiime/EBP
analysis
Equitability -
Evenness
Shannon -
Diversity
Simpson -
Diversity
Chao1 -
Richness
E 17707 17019 108 0.29 2.58 0.60 1308 F 28083 24863 256 0.45 4.52 0.87 2069 G 15732 15457 278 0.42 3.87 0.68 1195 I 10575 10252 162 0.38 3.39 0.65 1020 J 21736 12094 92 0.36 3.61 0.70 2325
M 14737 8508 89 0.42 4.11 0.75 2073 N 24764 24475 104 0.36 3.38 0.77 2434 Q 29073 28623 144 0.14 1.28 0.25 1275 T 15772 16746 221 0.48 4.51 0.90 1296 U 30943 39329 108 0.34 3.6 0.76 4270

A.Rouger 2017 Chapitre 3 Description de la diversité bactérienne
113
According to our previous study, these two samples, sold with two different brand names, were issued
from the same slaughterhouse, have been processed the same day and also harbored the same use-
by-date (Rouger et al., 2017). However, their contamination was different with a proportion of lactic
acid bacteria counts more important in sample T (Rouger et al., 2017) correlating with the present
data.
This observation strengthens the link between the meat contamination and the process environment
of slaughterhouses (manipulators, surfaces, rinsed water …) as previously proposed (Chaillou et al.,
2015).
The chicken leg samples used in this study were packaged under modified atmosphere, and the CO2
and O2 percentages in the headspace had been measured just before opening the pack (Rouger et al.,
2017). These values issued from our previous article have been reported Figure 23. When O2 was low
in the packs (samples G, M, N and Q) Pseudomonas was not present or detected at very low levels.
Conversely when packs contained a high percentage of O2, Pseudomonas were identified among the
dominant species (samples F, J, T and U), in accordance with the aerophillic phenotype of these
bacteria. However, we noticed that in samples E and I, dominated by Brochothrix, and, to a lesser
extent by Carnobacterium in sample E, Pseudomonas were absent despite a high concentration of O2.
The highest abundance of the aerobic and capnophilic bacterium Janthinobacterium was observed in
sample J, as was the case for Pseudomonas, a sample stored under air (Rouger et al., 2017). This may
suggest a competition between bacteria composing meat microbiota depending on CO2 and/or O2
concentration used in the MAP.
Conclusion
In this study we described the microbiota of chicken legs from local supermarkets by the use of V1-V3
16S rRNA gene pyrosequencing. Several strategies were compared to choose the most accurate to
determine the dominant species. The data were compared to previous microbiology analysis and qPCR
partially confirmed the dominance. Cultural methods are commonly used in food microbiology to
detect some specific bacteria but the results may be biased and the specificity of the media is often
questioned. Sequencing of 16S rRNA gene is a powerful method currently used to determine the
structure of complex ecosystems (Petrosino et al., 2009) by identification of relative abundance of
different species composing them. However, 16S rRNA gene sequencing approach has also known
biases, especially due to the PCR amplification performed prior the sequencing step (Lee et al., 2012),
which can lead to wrong relative abundance and may also generate chimeric sequences. PCR-
generated chimeras created during the first step of amplificiation lead to errors during the process of
bacterial identification. Special care of this chimeras is required during the pipeline analysis. An other

A.Rouger 2017 Chapitre 3 Description de la diversité bactérienne
114
bias of the 16S rRNA gene sequencing method is the limit of the databases used for bacterial
identification. As well, due to the high conservation of the 16S rDNA sequence, it is difficult to
discriminate some OTUs at the species or even genus level. The use of housekeeping genes may be
very useful for getting more accurate results. Using only 16S rRNA gene requires verifications by
additional blast or by the use of other molecular methods like qPCR which itself needs adaptions.
Although each of the methods used in this study harbor some biases, we could correlated the data by
confirming the presence and relative abundance of some of the dominant species contaminating fresh
chicken legs.
In this study we showed the variability of microbial communities present on chicken legs stored at low
temperature and collected before the UBD. The samples, collected from supermarkets, did not show
any obvious spoilage. Nevertheless we noticed the dominance of different species known as
responsible for meat spoilage, such as B. thermosphacta or Pseudomonas. Although the two main
human pathogens associated to poultry consumption, Campylobacter and Salmonella, were not
detected, other putative pathogens were observed.
The microbiota (essentially that of gastrointestinal tract) of broilers and its impact on animal health
and on productivity has been described (Stanley et al., 2013, Stanley et al., 2014, Waite & Taylor, 2014,
Choi et al., 2015, Mohd Shaufi et al., 2015). However, the contamination of chicken meat by the animal
microbiota during the slaughtering process has not yet been deeply investigated. In a way to
characterize microorganisms from farm to fork in USA, Oakley et al., (2013) identified the microbiota
from broiler chicken production to the carcasses, which are rinsed with a chlorinated solution. In EU,
such decontamination of the carcasses is not allowed. Storage at low temperature and gas composition
of MAP are used for limiting bacterial growth until UBD. We noticed that contaminants present on
chicken legs could originate from animal microbiota, from water, and from slaughterhouse
environment. Most of the contaminants were adapted to the storage conditions, being psychrotroph
and adapted to the gas composition of the packaging. We also observed a potential competition
between the various species composing chicken meat microbiota, depending on the nature of the
MAP. Interactions between Carnobacterium and Brochothrix during food spoilage have been
suspected (Laursen et al., 2006). It would therefore be interesting to investigate the microbiota of
chicken along the production chain, from living animals to chicken cuts at retrieval for determining the
contamination steps and the nature of the contaminants. As well, since microbial contamination of
chicken cuts is variable, the influence of storage conditions, in particular that of the MAP gas
composition on the dynamics of meat microbiota may help improving chicken meat safety.

A.Rouger 2017 Chapitre 3 Description de la diversité bactérienne
115
Acknowledgements
This work was financed by “Région Pays de la Loire” (PhD grant to AR and postdoctoral grant to BR).
We thank INRA MIGALE bioinformatics platform for access to computational resources and data
storage facilities. Stephane Chaillou (INRA AgroParitech, UMR1319, Jouy en Josas, France) is
acknowledged for providing the EcoBioPro database and for helpful discussions. Thanks’ to Géraldine
Pascal (INRA INPT ENVT, UMR1388, Toulouse, France) for helpful and critical discussions in Frogs
analysis.
3.3- Ce qu’il faut retenir du chapitre 3
La composition bactérienne de 10 lots de cuisses de poulet conservées sous atmosphère protectrice a
été décrite par pyroséquençage et partiellement validée par qPCR. Cette méthode a permis d’obtenir
une liste des espèces bactériennes présentes sur la viande de poulet. Les genres majoritairement
retrouvés sont Brochothrix, Pseudomonas, Carnobacterium et Shewanella. Les différences entre les 10
lots, préalablement observées par méthodes culturales (chapitre 2) ont été confirmées par séquençage
à haut débit.
Un possible lien peut être fait entre l’abattoir et les lots de viande. En effet, 2 lots qui proviennent du
même abattoir et ont été produits le même jour, présentent des profils bactériens proches en ce qui
concerne les espèces retrouvées et leurs proportions. Cependant cette hypothèse devrait être vérifiée
en échantillonnant plus de 2 lots. La composition de l’atmosphère protectrice semble également avoir
un impact sur les proportions des espèces bactériennes. En effet une corrélation existe entre une forte
proportion d’O2 dans les barquettes et la présence de certaines flores comme Pseudomonas en
quantité significative. Ces Pseudomonas ne sont pas retrouvés quand l’atmosphère est appauvrie en
O2. Cependant dans certains cas, lorsque Brochothrix est largement majoritaire et Carnobacterium
dans une moindre mesure, et malgré une forte concentration en oxygène, les Pseudomonas ne sont
pas retrouvés, ce qui laisse penser à une compétition entre ces communautés bactériennes dépendant
de l’atmosphère gazeuse.
Afin de vérifier cette dernière hypothèse, nous allons étudier l’influence des atmosphères modifiées
sur les communautés bactériennes et nous allons également chercher à savoir quelles espèces
bactériennes sont actives et qu’expriment-elles au sein du microbiote.

A.Rouger 2017 Chapitre 3 Description de la diversité bactérienne
116

A.Rouger 2017 Chapitre 4 Dynamique des écosystèmes microbiens
117
Chapitre 4 Dynamique des écosystèmes
microbiens
4.1- Préambule
Nous avons constaté que différentes atmosphères protectrices sont couramment utilisées pour le
conditionnement de la viande de poulet et que la charge bactérienne et la nature des contaminants
varient suivant les lots. Dans ce chapitre nous avons investigué l’effet de la composition des
atmosphères protectrices sur la diversité et l’abondance relative des espèces bactériennes au cours de
la conservation. Nous avons également recherché quelles fonctions étaient différentiellement
exprimées par les contaminants. Pour ce faire, nous avons utilisé 2 microbiotes (E et U) récoltés en
chapitre 2 et dont la composition et les proportions des espèces dominantes sont différentes (chapitre
3). Le microbiote E est très riche en Brochothrix et dans une moindre proportion en Carnobacterium.
Le microbiote U est quant à lui plus pauvre en Brochothrix mais il est composé de Pseudomonas,
Budvicia et Klebsiella. Nous avons inoculé ces 2 microbiotes sur de la viande de poulet pauci
microbienne selon la méthode développée au chapitre 2. Les viandes ont été stockées à 4°C ou sous
les 2 atmosphères couramment utilisées (70% O2 - 30% CO2 ou 50% CO2 - 50% N2) et un contrôle a été
réalisé sous air.
La croissance bactérienne a été suivie au long du stockage par méthodes culturales. Les ADN et ARN
bactériens ont été récoltés afin d’être séquencés (métabarcoding, métagénomique et
métatranscriptomique) pour voir comment la composition des microbiotes avait évolué suivant les
MAP utilisées et pour comprendre quelles espèces bactériennes étaient actives et ce qu’elles
exprimaient.
Cette étude est présentée sous forme d’un article scientifique en préparation.
4.2- Optimizing storage parameter to manage chicken meat ecosystem stored under
modified atmosphere packaging.
Amélie Rouger1, Jenni Hultman2, Per Johansson2, Nicolas Moriceau1, Johanna Björkröth2, Monique
Zagorec1#
1 UMR1014 SECALIM, INRA, Oniris, 44307, Nantes, France

A.Rouger 2017 Chapitre 4 Dynamique des écosystèmes microbiens
118
2 Department of Food Hygiene and Environmental Health, Faculty of Veterinary Medicine, University of Helsinki, Finland
# Corresponding author: Monique Zagorec, [email protected], ONIRIS - INRA, UMR 1014
SECALIM - Route de gachet - CS40706 - 44307 Nantes cedex 3, France
Abstract
Controlling spoilage microorganisms, especially in raw meat products, is a challenge for the food
industry. Microbial communities contaminating meat vary depending on seasonal changes and
production processes. In addition, the storage conditions, for example modified atmosphere
packaging, have selective effects on the microbiota dynamics. Bacterial interactions during storage of
meat are complex and poorly known. Their description should pave the way for improving the quality
of fresh meat. Thanks to the recent development of next-generation sequencing methods, widely used
for characterizing microbes in different ecosystems, we studied bacterial community dynamics during
poultry meat storage under different MAP conditions.
Two microbiotas with very different composition, were used for challenge tests. After their inoculation,
the 2 microbiota could overgrow the initial contaminants. Bacterial growth kinetics were monitored at
day 2, 4, 7 and 9 after inoculation. DNA for metabarcoding and metagenomics, and RNA for
metatranscriptomics could be recovered in sufficient amounts only at day 7 and 9.
We observed that the duplicate challenge tests produced similar results, confirming that microbiota
inoculation method diminished the effect of sample variation. Each of the 3 gaseous atmospheres
shaped microbial communities differently. Nevertheless, independently from the inoculated
microbiotas dominant bacterial communities were converging depending on gas used for packaging.
Surprisingly, the active bacteria species, as observed from metatranscriptomics were not
systematically the dominant ones. In particular, Brochothrix thermosphacta, a spoilage organism,
enhanced by storage under 70% O2 - 30% CO2 up-regulated only the ribose utilization operon.
Conversely, lactobacilli (Lactobacillus fuchuensis in microbiota E and Lactobacillus sakei in microbiota
U) although subdominant under 50% CO2 - 50% N2 atmosphere up-regulated several hundreds of genes
among which those dedicated to cell division, transcription and translation showing their growth
activity.
Keys word
Metatranscriptomics, metagenomics, metabarcoding, Chicken meat quality, food spoilage
A.Rouger 2017 Chapitre 4 Dynamique des écosystèmes microbiens
119
4.2.1.Introduction
World poultry meat production and consumption are steadily increasing and ensuring the bacterial
safety of poultry cuts is a challenge.
A large diversity of bacterial species can be hosted by meat products depending on seasonal changes,
production processes (Cohen et al., 2007) and storage conditions (Chouliara et al., 2007). Bacterial
contamination occurs mostly at the surface and on the skin during slaughtering (Luber, 2009). This
contamination originates from animal microbiota (faeces, hide, skin and feathers), from the plant
environment (air, equipment, surfaces) and from human handling. The meat microbiota may
encompass pathogenic and spoilage bacteria (Doulgeraki et al., 2012) which must be controlled to
ensure the safety and the quality of the products (Álvarez-Astorga et al., 2002). The literature reports
highly variable total viable counts (from 3 to 9 log CFU/g) depending on storage conditions and poultry
cuts (Björkroth, 2005, Balamatsia et al., 2007, Chouliara et al., 2007, Zhang et al., 2012, Al-Nehlawi et
al., 2013, Capita et al., 2013, Rouger et al., 2017). In addition large variations exist between samples of
the same cuts (Rouger et al., 2017). The use-by-date (UBD) of poultry meat is reached when bacterial
contamination reaches around 7 log CFU/g (Okolocha & Ellerbroek, 2005). Storage conditions such as
the use of modified atmosphere packaging (MAP) or marinades together with cold temperatures limit
the growth of bacteria and shape the bacterial communities initially present on carcasses. It is
therefore important to consider meat as complex ecosystems hosting complex microbiota (Fleet,
1999). However, only a few studies dealing with meat microbiota have been reported (del Río et al.,
2007b, Cardenas & Tiedje, 2008, Nieminen et al., 2012, Oakley et al., 2013, Benson et al., 2014, Mayo
et al., 2014, Chaillou et al., 2015, Fougy et al., 2016).
Understanding the metabolic functions expressed by bacteria during storage, especially the spoiler’s
bioprotective agents, may also contribute to improve storage conditions for ensuring the microbial
control of meat products.
Our strategy was to use standard ecosystems (real, reproducible, storable and known) to limit the
natural microbial variability in order to perform reproducible challenge tests. Two different microbiota
were inoculated onto model meat matrices, which were then stored under different gaseous
atmospheres. Bacterial dynamics and genes expressed by microbiota were monitored.
A.Rouger 2017 Chapitre 4 Dynamique des écosystèmes microbiens
120
4.2.2. Materials and Methods
4.2.2.1. Challenge test
Fresh chicken breast fillets were collected from the local supermarket not more 2 days after arrival
and transferred to the laboratory at 4°C. They were then rinsed with 70% ethanol. After briefly drying
on sterile filter paper, breasts were aseptically cut into 2 cm cubes. One aliquot (1 mL) of two bacterial
communities (named E and U in this study) isolated from chicken legs and stored at -80 °C (Rouger et
al., 2017) were gently defrosted, and then diluted in tryptone salt solution to obtain an appropriate
cell concentration. Meat cubes were inoculated at 5 log CFU/g. Each challenge test was performed in
duplicates. After inoculation, 50 g portions were packaged under three different atmospheres: A, (70%
O2 - 30% CO2) and B, (50% CO2 - 50% N2), which are the 2 modified atmospheres routinely used in
France for poultry cuts storage; and under air C (20% O2 - 80% N2) used as a control. Meat was stored
for 9 days at 4 °C. The modified atmosphere composition in the head space was checked at each
collection time (2, 4, 7 and 9 days) with triplicate measures of O2 and CO2 with an Oxybaby gaz analyzer
(WITT Gasetechnik GmbH & Co KG, Germany).
4.2.2.2. Bacterial cultures
4.2.2.2.1. Bacterial enumeration from meat samples
For each collection time, a 40 g-portion of meat was rinsed with tryptone salt solution. CFU were
determined after plating serial 10-fold dilutions on various media. The total aerobic viable counts were
determined after 2 days incubation at 30 °C on Plate Count Agar (PCA) (Biokar, France). Lactic acid
bacteria (LAB) were counted on MRS agar medium pH 5.2 (AES, France) after 4 days incubation at 25
°C under anaerobic conditions (Anaerocult A, Merck, Germany). Enumeration of Pseudomonas spp.
and Brochothrix thermosphacta were performed at 25 °C on Cephalosporine Fucidine Cetrimide CFC
(Biokar, France) for 2 days, and Streptomycin Sulfate Thallium Acetate Actidione agar STAA (Oxoid,
France) for 3 days, respectively.
4.2.2.2.2. Bacterial pure cultures for real time quantitative PCR (qPCR)
Strains were cultured on BHI plates (AES, France) containing 1.5% agar (Biokar Diagnostics, France) for
36 h at adequate temperature (Table 16). One colony was resuspended into 10 mL of BHI broth and
incubated overnight (see Table 16 for incubation conditions). Bacterial cultures were inoculated at 1%
on fresh BHI broth and grown for 3-5 h to reach 8 log CFU.mL-1.
A series of 10-fold dilution was performed in BHI broth to obtain bacterial concentrations ranging from
3 to 8 log CFU.mL-1. The exact bacterial concentration was determined after plating on BHI.

A.Rouger 2017 Chapitre 4 Dynamique des écosystèmes microbiens
121
Table 18 Bacterial strains used and culture conditions.
Bacterial species Strains Temperature of
incubation Agitation in BHI
broth
Brochothrix thermosphacta DSM 20171 26°C 140 rpm
Carnobacterium divergens V41 30°C -
Acinetobacter lwoffii DSM 30°C 240 rpm
4.2.2.3. Nucleic acid extraction
4.2.2.3.1. DNA extraction from pure cultures for qPCR
A volume of 1 mL of bacterial dilutions ranging from 3 to 8 log cells.ml-1 was centrifuged at 10 000xg
for 10 min at 4°C. Bacteria pellets were resuspended in a Dulbecco’s phosphate buffered saline solution
without Ca and Mg (Eurobio, France) and DNA was extracted with the High Pure PCR Template
Preparation Kit (Roche, France) following the manufacturer’s instructions and eluted in 200 µL milliQ
water.
4.2.2.3.2. Nucleic acid extraction from meat and quality control for sequencing
Immediately after opening, 10 g of meat was added to 10 ml RNA protect cell reagent (Qiagen,
Germany) and gently mixed during 15 s. Meat residues and fat were removed from the liquid mixture
by centrifugation at 200xg for 3 min at 4°C. The supernatant was aliquoted (1 mL) in Eppendorf tubes
and centrifuged for 5 min at 10000xg at 4°C to collect bacteria. The bacterial pellet was resuspended
into 200 µL RNA protect and stored at -80°C until further nucleic acid extraction.
The nucleic acid extraction was performed with the AllPrep RNA/DNA (Qiagen, Germany) according to
the manufacturer’s procedure. Chemical lysis of bacteria was performed in phenol/chloroform with
Qiagen lysis buffer containing β-mercaptoethanol according to the recommendations of the
manufacturer. Mechanical lysis was achieved using a FastPrep (MPbiomedicals) for 40 s at a frequency
of 5.5 m/s. The cleaning and elution steps for both RNA and DNA were performed on spin membrane
columns provided in the kit. Experimental design using DNA for both metabarcoding and metagenomic
analyses and RNA for metatranscriptomics is summarized in Figure 26.

A.Rouger 2017 Chapitre 4 Dynamique des écosystèmes microbiens
122
Figure 26 Experimental design of this study and methods used for NGS analysis.
The nucleic acids concentration was measured with a Qubit fluorometer apparatus (Invitrogen, CA,
USA) and the quality of RNA was checked on RNA chips on 2100 Bioanalyzer system (Agilent, United
States) or automated electrophoresis Experion system (Biorad, France).
4.2.2.4. PCR conditions
4.2.2.4.1. qPCR procedure
The qPCR mixture (20 µL) contained 1X Solis BIOdYNE (Estonia) mix, 5X Hot firepool evagreen qPCR
mix plus (ROX), 0.18 mM each primer (Table 17) and 5 µL of DNA. The qPCR were performed on a
Chromo4 system (Biorad, France). The protocol encompassed an initial denaturation step (95 °C for 15
min) followed by 40 cycles comprising a denaturation step (95 °C for 15 s) and a primer annealing step
for 1 min at 65 °C for C. divergens, B. thermosphacta and A. lwoffi. Melting curves were checked from
55 °C to 94 °C. Each sample was quantified in triplicate and the average threshold cycle (CT) was
calculated. Calibration curves were obtained for the 3 species with DNA obtained from 3 independent
extractions performed on pure culture dilutions ranging from 3 to 8 log CFU.mL-1. Linear regression of
the calibration curves were used to convert CT in estimated bacterial population level in log CFU.mL-1.
16 S Database
NCBI
Meat samples
RNA extraction
META-BARCODINGWho is there ?
Relative abundance
RNA depletion
DNA extraction
cDNA
V1-V3 16S RNA geneamplification
Illumina MiSeq sequencing Illumina NextSeq sequencing Illumina HiSeq sequencing
Filtering
Assembly
Annotation
Filtering
Mapping against
MappingAvailablegenomes
sample pooling
METATRANSCRIPTOMEWho is doing what?
METAGENOMEWho is there ?
Which functions are present?
Gallus gallusgenomeIDBA
Velveth
ProkkaMG-RastMothur
RiboZero bacteria
ScriptSeq2
Bowtie2 Metaxa2
Silva 123nr
RDP II Mapping
Bowtie2
Statistical analysisPhyloseqVegan
Statistical analysis
DEseq2
MG-Rast

A.Rouger 2017 Chapitre 4 Dynamique des écosystèmes microbiens
123
Table 19 Primers used in this study
Specificity PRIMER SEQUENCE (5′→3′) PRIMER NAME
FRAGMENT SIZE (BP)
TARGET REFERENCE
All species AGAGTTTGATCMTGGCTCAG
GTATTACCGCGGCTGCTG 8f
518r 567
16S rRNA gene
Edwards et al, 1989
B. thermosphacta GGACCAGAGGTTATCGAAACATTAACTG
TAATACCAGCAGCAGGAATTGCTT
QSF03-BTH-F QSF03-BTH-
R 148 rpoC
Fougy et al, 2016
C. divergens CCGTCAGGGGATGAGCAGTTAC ACATTCGGAAACGGATGCTAAT
CB1 CB2R
340 16S
rRNA gene
Scarpellini et al., 2002
A.lwoffii
GAAGCTAGAGTATGGGAGAGGA GTCAGTATTAGGCCAGATGGCT
QSF01-ACI-F QSF01-ACI-R
108 16S
rRNA gene
Fougy et al, 2016
4.2.2.4.2. PCR conditions for meta-barcoding sequencing
The V1-V3 region of the 16S rRNA gene (567 bp) was amplified by PCR with primers 8f and 518r (Table
17). Partial Illumina TruSeq adapter sequences were added to the 5’ end of the reverse
primer. The PCR mixture was composed of 1 x Phusion GC buffer (Thermofisher scientific, France), 200
µM deoxynucleoside triphosphate (dNTP) mix, 0.2 µM each primer, 2.5% dimethyl sulfoxide (DMSO),
and 50 to 250 ng of DNA and 1 U of Phusion polymerase (Thermofisher scientific, France). Four
replicate reactions were performed for each sample with the following conditions: an initial
denaturation step (98 °C for 30 s) followed by 15 cycles comprising a denaturation step (98 °C for 10 s),
a primer annealing step (60 °C for 30 s), and an extension step (72 °C for 10 min). At the end a final
extension was performed at 72 °C for 10 min. Sequencing adapters and sample specific 8 bp barcodes
were added in a second PCR after ExoSAP (Thermofisher scientific, France) purification of the pooled
PCR products. The PCR reaction consisted of 1 x Phusion GC buffer, 200 µM dNTP mix, 0.2 µM each
adapter (full-length TruSeq P5 and Index containing P7 adapters), 2.5% DMSO, and from 4 to 8 µl of
purified PCR product. The cycling conditions consisted of an initial denaturation step (98 °C for 30s)
followed by 18 cycles comprising a denaturation step (98 °C for 10 s), a primer annealing step (65 °C
for 30 s), and an extension step (72 °C for 10 min). At the end a final extension at 72°C for 10 min was
performed. The PCR products were purified and quantified at the Institute of
Biotechnology, University of Helsinki, where the MiSeq sequencing was performed.
4.2.2.4.3. Metagenomes preparation for sequencing
Depending on the quantity of DNA required for sequencing, varying numbers of (100 ng) samples with
same bacterial profile identified by meta-barcoding were pooled. The DNA solutions were
concentrated in a SpeedVac system (Thermofisher scientific, France) to obtain a final volume of 30 µL

A.Rouger 2017 Chapitre 4 Dynamique des écosystèmes microbiens
124
of purified DNA. DNA concentration was measured with a NanoDrop Thermo Fischer Scientific, France),
prior sequencing.
4.2.2.4.4. Metatranscriptome preparation for sequencing
The RiboZero kit for bacteria (Illumina, United States) was used for rRNA depletion following the
manufacturer instructions. Then the RNA solution was fragmented and converted into cDNA with the
Illumina ScriptSeq kit (Illumina, United States) before purification on the MiniElute kit (Qiagen,
Germany). The sequencing libraries for cDNA (barcodes and adaptors ligations) were performed
according to the Illumina procedure prior sequencing.
4.2.2.5. Next Generation Sequencing (NGS) data analysis
All cDNA, PCR-fragment and genomic DNA samples were sequenced with Illumina technologies i.e.
with HiSeq, MiSeq and NextSeq technologies, respectively (figure 26). After sequencing all the reads
are analysed with fastQC software (Babraham Bioinformatics) to check the quality of sequencing.
The Mothur procedure was followed to analyse the metabarcoding sequencing outputs (Schloss et al.,
2009). Reads were demultiplexed according to barcode sequences with cutadapt. The reads were
trimmed and filtered with a quality score threshold of 20 and a minimum length of 100 bp. Chimeric
sequences were detected using Uchime integrated into the Mothur procedure and were removed from
the dataset prior any bioinformatic analysis (Haas et al., 2011).
The unique sequences were identified by mapping against the silva_nr_123 database for taxonomic
assignation. Those sequences were clustered according to the Mothur procedure and relative
abundances were estimated by counting the number of reads mapped on OTUs sequences. After
quality trimming, chimera removal, OTU picking and taxonomic assignment of OTUs, the data were
transformed to a biom file that contains the OTU table and taxonomic assignment for each OTU.
Unwanted sequences as chloroplast sequences, not removed with Mothur procedure were removed
with phyloseq package (R) (McMurdie & Holmes, 2013).
Metagenomic reads were assembled with both IDBA (Peng et al., 2012) and Velvet (Zerbino, 2010)
software using the following kmer lengths: 57, 61, 74 with Velvet and 80 and 100 with IDBA. Contigs
were load on MGrast server (Metagenomic Rapid Annotations using Subsystems Technology - Meyer
et al, 2008) for a fast automatic annotation and were also annotated using Prokka (Seemann, 2014).
The use of Metaxa2 (Bengtsson et al., 2011) provided the taxonomic assignation of bacterial species in
metagenomes by mapping against the Ribosomal Database Project database (RDP II) (Cole et al., 2005).

A.Rouger 2017 Chapitre 4 Dynamique des écosystèmes microbiens
125
For metatranscriptomics, after a quality control check, reads were trimmed according to a quality
threshold of 20. The reads were aligned against the Gallus gallus genome with Bowtie2 software
(Langmead & Salzberg, 2012) to identify chicken reads. The remaining reads were loaded on MG-Rast
website (Metagenomic Rapid Annotations using Subsystems Technology) (Meyer et al., 2008) for
automatic annotation. After removing reads issued from Gallus gallus, the remaining reads were
analysed by mapping against a database created with the publicly available genomes from 60 species
(corresponding to 16 genera) present in poultry meat microbiota. The reads were aligned against this
database with Bowtie2 software to identify the functions expressed and their relative abundances.
4.2.2.6. Statistical analysis
For 16S results output the biom file from mothur was analyzed with the Phyloseq package (R)
(McMurdie & Holmes, 2013).
The metabarcoding reads (OTUs) were normalized by dividing the number of reads of each OTU by the
sum of all OTU reads per samples. Some α and β diversity measures, Shannon and inverse Simpson
indices, were visualized using the raw count data. Then β diversity with Bray-Curtis dissimilarity index
and visualization with PCoA ordination on the normalized data were performed. Relative abundance
plots were designed by merging data in Phyloseq package.
We used the MG-Rast server, developed to perform statistical analyses, for a fast checking of the
metagenomes and metatranscriptomes data. Krona application included in MG-Rast was used to
visualize taxonomic diversity of metagenomes.
For metatranscriptomics, differential expression analysis (between 2 conditions) was conducted using
the Bioconductor DESeq2 package in R environment R (Love et al., 2014). Library effective size
normalization was performed for each metatranscriptomic samples. P-values were adjusted for
multiple testing using Bonferroni procedure which assesses the false discovery rate (Reiner et al.,
2003). Gene with adjusted p-values < 0.01 and with log2foldchange > 2 or < -2 were considered to be
differentially expressed between the two chosen conditions. Venn diagrams were performed with
Venny application (Oliveros, 2007-2015).
4.2.2.8. Data accession numbers
The fastq formatted and quality filtered read sequences have been deposited at the European
Nucleotide Archive (ENA) under the project accession number xxx with the accession number xxx
The 16S rRNA gene amplicon sequences and the metagenomic sequences were deposited in the
Sequence Read Archive (SRA) at EBI (accession number ERP001021). The metagenomic sequences
were deposited also in the MG-RAST server (http://metagenomics.anl.gov).

A.Rouger 2017 Chapitre 4 Dynamique des écosystèmes microbiens
126
4.2.3. Results
4.2.3.1. Growth dynamics during storage
Challenge tests were performed in duplicate for both microbiota E and U and a non-inoculated control
was included. Inoculation level was 2 log higher (~ 5 log CFU/g) than the indigenous microbiota. Meat
was then stored at 4 °C under the three different gaseous atmospheres and bacteria were enumerated
at day 0 and during storage (T2, T4, T7 and T9). Dynamics of total aerobic mesophilic counts for MAP
A are presented in figure 27.
Figure 27 Challenge-tests of microbiotas E and U inoculated on chicken breast dices and incubated under modified atmosphere packaging A (70% O2 - 30% CO2) stored at 4°C.
Total aerobic mesophilic bacteria were enumerated at T0, and then at day 2, 4, 7, and 9. A non-inoculated control was also performed.
At day 0, total aerobic mesophilic counts in inoculated samples were around 4.5 log CFU/g. After 9
days the counts reached 8-9 log CFU/g. The indigenous microbiota of the non-inoculated control was
2.43 ± 0.1 log CFU/g at day 0 and reached only 7 log CFU/g at day 9. The 2 log CFU/g difference between
inoculated and non-inoculated samples remained during the whole storage period showing that
inoculated microbiotas E and U dominated the indigenous contaminants all along the storage. Storage
under MAP B and air gave similar results (data not shown) demonstrating that microbiotas E and U
overgrow endogenous microbiota whatever the gaseous atmosphere used.
Microbiota E
Microbiota U
Control

A.Rouger 2017 Chapitre 4 Dynamique des écosystèmes microbiens
127
Counts of B. thermosphacta, LAB and Pseudomonas spp. counts are shown Figure 28.
Figure 28 Growth kinetics of B. thermosphacta (a), LAB (b) and Pseudomonas sp. (c) reimplantation monitored on specific media after inoculation of microbiota E or U and storage under MAP A (70%
O2 - 30% CO2) or MAP B (50% CO2 - 50% N2) or air C (~21% O2 - 78% N2).
B. thermosphacta counts were in the same range as the total viable counts. LAB were 1 log lower than
the total viable counts while Pseudomonas spp. were 3 log lower than the total viable counts for
modified atmospheres A and B.
We observed a clear positive effect of air storage on the growth of Pseudomonas spp. When compared
to MAP A or B (Figure 28 c) and a negative effect of modified atmosphere B on the growth of B.
thermosphacta (Figure 28 a).
4.2.3.2. Evolution of MAP composition during meat storage
In this study three current poultry meat packaging atmospheres were used: MAP A: 70% O2 - 30% CO2,
widely used for red meat products, MAP B: 50% CO2 - 50% N2 used for various processed meats such
as sausages, and air, defined here as C: ~21% O2 - 78% N2. The gas composition in each package head
space was monitored during 9 days of storage (Figure 29).
0,00
1,00
2,00
3,00
4,00
5,00
6,00
7,00
8,00
9,00
10,00
0 2 4 6 8 10
log
cfu
/g
Storage (Days)
B. thermosphacta
EA
EB
UA
UB
EC
UC
0,00
1,00
2,00
3,00
4,00
5,00
6,00
7,00
8,00
9,00
10,00
0 2 4 6 8 10
log
cfu
/g
Storage (Days)
Pseudomonas sp.
EA
EB
UA
UB
EC
UC
0,00
1,00
2,00
3,00
4,00
5,00
6,00
7,00
8,00
9,00
10,00
0 2 4 6 8 10
log
cfu
/g
Storage (Days)
LAB
EA
EB
UA
UB
EC
UC
a b
c

A.Rouger 2017 Chapitre 4 Dynamique des écosystèmes microbiens
128
Figure 29 Evolution of gaseous composition in packages during storage of chicken meat at 4°C.
O2 and CO2 were measured, ratio were completed to 100% for comparison between the 3 conditions for each microbiota inoculated and the control (non-inoculated). Data are the mean of 3 measures.
Under MAP A and B the O2 and CO2 concentrations were rather stable during the whole storage. Under
air (C) we noticed an O2 decrease concomitant with CO2 increase especially in inoculated meat. This
may suggest that respiration occurred during storage under air. It could result from the presence of
Pseudomonas spp. under air but not under MAP B which contained 50% CO2. In MAP A, containing
large proportion of O2, such O2 consumption and CO2 production were not observed and Pseudomonas
spp. growth was weak.
To further investigate the effect of gaseous atmospheres on the microbial communities, nucleic acids
were collected from inoculated meat. DNA for metabarcoding and metagenomics and RNA for
metatranscriptomics could be recovered in sufficient amounts only at day 7 and 9.
0%
20%
40%
60%
80%
100%
0 2 4 7 9
0%
20%
40%
60%
80%
100%
0 2 4 7 9
0%
20%
40%
60%
80%
100%
0 2 4 7 9
0%
20%
40%
60%
80%
100%
0 2 4 7 9
0%
20%
40%
60%
80%
100%
0 2 4 7 9
0%
20%
40%
60%
80%
100%
0 2 4 7 9
0%
20%
40%
60%
80%
100%
0 2 4 7 9
0%
20%
40%
60%
80%
100%
0 2 4 7 9
0%
20%
40%
60%
80%
100%
0 2 4 7 9
MA
P A
MA
P B
Air
C
Microbiota E Microbiota U Control
CO2
O2
Other

A.Rouger 2017 Chapitre 4 Dynamique des écosystèmes microbiens
129
4.2.3.3. Bacterial composition of microbiotas
4.2.3.3.1. Description at genus level (meta-barcoding)
A total of 717 660 reads was obtained, i.e. ~105 reads per sample. Identification for taxonomic
assignation and estimation of relative abundance of genus and species were performed. The ordination
plot drawn Figure 30 shows that sample clusters were clearly depending on the atmosphere
composition. Even though the microbiotas inoculated were different at day 0. For each MAP
composition, no statistical difference between microbiotas was observed at day 7 and day 9.
Figure 30 β diversity with Bray-Curtis dissimilarity index and visualization with PCoA ordination on the normalized data
For both microbiota and whatever the day of collection, the duplicates were very homogeneous (see
Figure 31). This was confirmed by α and β diversity measures, i.e. Shannon and inverse Simpson indices
visualized using the raw count data. Challenge tests performed on this study show in advantages of the
use of standard meat microbiota for reproducibility and also repeatability of experiments.
For microbiotas E, observation of microbial profiles (Figure 31) and a statistical ANOVA analysis showed
no significant differences between each samples at day 7 or 9.

A.Rouger 2017 Chapitre 4 Dynamique des écosystèmes microbiens
130
4.2.3.3.2. Influence of MAP on dominant genera
Under air (C) the most abundant genus was Brochothrix. This genus was also dominant under MAP A
but under MAP B Brochothrix genus was co-dominant with Carnobacterium. The 2nd most dominant
genus under control conditions (air C) was Acinetobacter. This genus was not observed under MAP A
or B but only observed under air. Regarding Carnobacterium genus, their proportion decreased under
air, increased under MAP A and became the dominant genus under MAP B.
Figure 31 Relative abundance identified by meta-barcoding after inoculation of microbiota E (after 7 and 9 days) or microbiota U (after 7 days) under MAP A (70% O2 - 30% CO2) or MAP B (50% CO2 -
50% N2) or air C (~21% O2 - 78% N2). Results obtained for the two repeats (1 and 2) are shown.
Therefore, it appeared that whatever the nature of the microbiota inoculated, the gaseous atmosphere
shaped the dominant microbial communities during the cold storage. MAP A promoted essentially
Brochothrix and Carnobacterium whereas, to a second extent, MAP B led to Carnobacterium
dominance followed by Brochothrix.
Day 7 Day 9 Day 9Day 7 Day 7 Day 9
MAP A MAP B air C
Day 7 Day 7 Day 7
MAP A MAP B air C
Microbiota E Microbiota U

A.Rouger 2017 Chapitre 4 Dynamique des écosystèmes microbiens
131
Result of relative abundance were checked and validated by qPCR on 3 dominant species i.e. B.
thermosphacta, A. lwoffi and C. divergens. As a selective media exist for Brochothrix enumeration, we
compared the data obtained by 16S metabarcoding, qPCR and plate counting (Figure 32).
Figure 32 Comparison of B. thermosphacta quantification by different methods.
Not determined results are identified by *.
A quite good correlation was observed between results obtained from culture, metabarcoding and
qPCR.
4.2.3.3.3. Description of the sub-dominant genera
Regarding the sub-dominant genera, some differences depending on the MAP could be observed.
Pseudomonas sp. were identified only under air whereas Lactobacillus sp. were found only in samples
stored under MAP B. In addition, Rahnella were identified only in microbiota U.
To summarize Brochothrix and Carnobacterium were the two dominant genera in the microbiota E and
U under MAP A and MAP B. Brochothrix was dominant in gaseous atmospheres containing O2 (MAP A
and air C) whereas Carnobacterium was dominant under MAP without O2 and enriched with CO2 (MAP
B). To a lesser extent, Acinetobacter was observed only under air. The sub-dominant genera were
Lactobacillus, Pseudomonas and Rahnella. Pseudomonas was observed only in meat stored under air
correlating with plate count determination.
4.2.3.3.4. Description at species level (metagenomics)
To deeper describe microbiotas at species level and to validate metabarcoding data, metagenomes
were also sequenced. Two different metagenomes were constituted by pooling DNA from different
samples as follows:

A.Rouger 2017 Chapitre 4 Dynamique des écosystèmes microbiens
132
• Metagenome A001 was constructed with the DNA pooled from two replicates of samples E
under air C at time 7. This one was use both to validate metabarcoding data and to describe
bacterial species.
• Metagenome A002 was constructed with the DNA pooled from two replicates of samples E
under MAP B at time 7 and time 9 and with the two replicates of samples U under MAP B
at time 7 and under air C at time 9. This one was used to cover the species diversity
encountered in our various samples.
The taxonomy identification of bacterial species of metagenomes was performed according to 2
different ways. Each IDBA assembled metagenome was re-annotated with MG-Rast to obtain
taxonomy and function assignations. Figure 32 shows the different taxonomy assignations observed
for each metagenomes annotated with MG-Rast.
Contamination of prokaryotic DNA by eukaryotic DNA is unavoidable and could be explain by residual
chicken DNA or fungal and moulds DNA. Metagenome A002 shows the largest part of chicken DNA
contaminations. In addition if abundance is observed, the metagenome is the less diverse despite of
the number of samples pooled in this metagenomes samples. MG-Rast taxonomic identification used
different databases available on MG-Rast server gives a first idea of the bacterial diversity present in
each metagenome.
The richness of the taxon identified in metagenome A001 resulting from DNA extracted from
microbiota E after storage for 7 days under air partially correlated with metabarcoding results (Figure
33 A). Brochothrix genus accounted for 32% of the reads, but only half was assigned to B.
thermosphacta, the second half being assigned to the second species belonging to Brochothrix genus,
namely B. campestris. In addition, 14% of the reads in metagenome A001 were assigned to an
uncultured bacterium which was not detected by metabarcoding. Several LAB (L. sakei, L. fuchuensis,
L. curvatus, C. maltaromaticum, Carnobacterium galinarum, C. divergens, Enterococcus phoeniculicola
Enterococcus faecalis, Enterococcus sp.) accounted each for 0.8-3% of the reads.
Gammaproteobacteria including Acinetobacter and Pseudomonas were also accounted for a few
percent of the reads identified. Several Enterobacteriaceae associated to insects or plants were also
identified.
A large number of species were identified in metagenome A002 including those described above.
Several additional minor Lactobacillus, Lactococcus, Streptococcus, Vagococcus and Pediococccus
species were also noticed.

A.Rouger 2017 Chapitre 4 Dynamique des écosystèmes microbiens
133
Figure 33 Taxonomy assignation of 3 metagenomes annotated with MG-Rast server.
Eukarotics assignation are in green, viruses in blue and bacteria in red.

A.Rouger 2017 Chapitre 4 Dynamique des écosystèmes microbiens
134
The power and relevance of the database used by MG-Rast for taxonomic identification have to be
interpreted carefully. To complement the identification details, taxonomic assignation with Metaxa2
and RDP was also performed with metagenomes. Some rRNA of mitochondria and fungi
(Agaricomycetes Saccharomycetales and Craniata families) were found. Regarding bacteria, the
families listed below were identified:
• Flavobacteriaceae especially Myroides genus
• Listeriaceae identified as Brochothrix or Listeria genera
• Carnobacteriaceae represent by Carnobacterium genus (C. divergens and C. maltaromaticum species and another genus Trichoccus is found)
• Enterococcaceae especially Enterococcus and Vagococcus genera
• Lactobacillaceae represented by Lactobacillus genus
• Leuconostocaceae identified as Weissella genus and additionnal Leuconostoc genus found
• Streptococcaceae represented by Lactococcus genus
• Shewanellaceae especially Shewanella genus
• Enterobacteriaceae represented by Rahnella, Ewingella and Yersinia genera
• Moraxellaceae especially Acinetobacter and Psychrobacter genus
• Pseudomonadaceae represent by Pseudomonas genus
4.2.3.4. Reference database constitution
Therefore, metabarcoding and metagenomic analyses led to list bacteria present in our microbiota
under various condition. The resulting 60 species belonging to 15 genera is summarize table 18. A
database with the publicly available genomes from these 60 species was constituted and used as a
reference to map RNA reads from metatranscriptomic analysis.
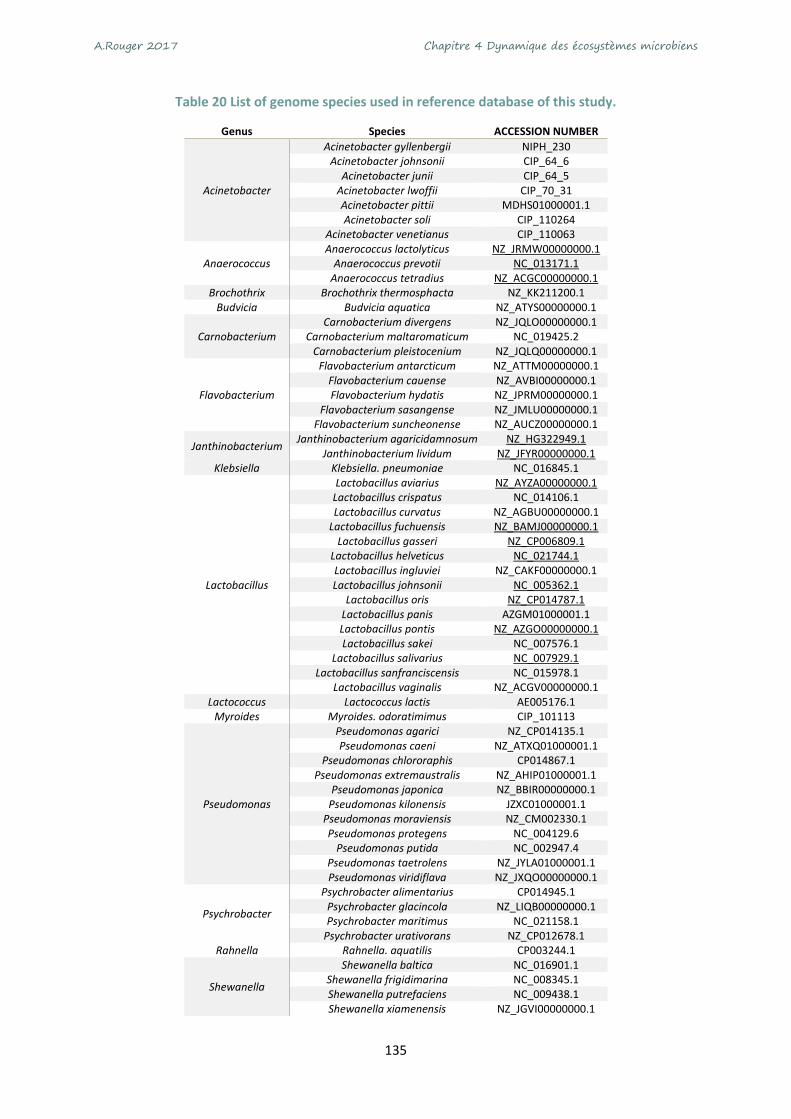
A.Rouger 2017 Chapitre 4 Dynamique des écosystèmes microbiens
135
Table 20 List of genome species used in reference database of this study.
Genus Species ACCESSION NUMBER
Acinetobacter
Acinetobacter gyllenbergii NIPH_230 Acinetobacter johnsonii CIP_64_6
Acinetobacter junii CIP_64_5 Acinetobacter lwoffii CIP_70_31 Acinetobacter pittii MDHS01000001.1 Acinetobacter soli CIP_110264
Acinetobacter venetianus CIP_110063
Anaerococcus Anaerococcus lactolyticus NZ_JRMW00000000.1
Anaerococcus prevotii NC_013171.1
Anaerococcus tetradius NZ_ACGC00000000.1
Brochothrix Brochothrix thermosphacta NZ_KK211200.1 Budvicia Budvicia aquatica NZ_ATYS00000000.1
Carnobacterium Carnobacterium divergens NZ_JQLO00000000.1
Carnobacterium maltaromaticum NC_019425.2 Carnobacterium pleistocenium NZ_JQLQ00000000.1
Flavobacterium
Flavobacterium antarcticum NZ_ATTM00000000.1 Flavobacterium cauense NZ_AVBI00000000.1 Flavobacterium hydatis NZ_JPRM00000000.1
Flavobacterium sasangense NZ_JMLU00000000.1 Flavobacterium suncheonense NZ_AUCZ00000000.1
Janthinobacterium Janthinobacterium agaricidamnosum NZ_HG322949.1
Janthinobacterium lividum NZ_JFYR00000000.1
Klebsiella Klebsiella. pneumoniae NC_016845.1
Lactobacillus
Lactobacillus aviarius NZ_AYZA00000000.1
Lactobacillus crispatus NC_014106.1 Lactobacillus curvatus NZ_AGBU00000000.1
Lactobacillus fuchuensis NZ_BAMJ00000000.1
Lactobacillus gasseri NZ_CP006809.1
Lactobacillus helveticus NC_021744.1
Lactobacillus ingluviei NZ_CAKF00000000.1 Lactobacillus johnsonii NC_005362.1
Lactobacillus oris NZ_CP014787.1
Lactobacillus panis AZGM01000001.1 Lactobacillus pontis NZ_AZGO00000000.1
Lactobacillus sakei NC_007576.1 Lactobacillus salivarius NC_007929.1
Lactobacillus sanfranciscensis NC_015978.1 Lactobacillus vaginalis NZ_ACGV00000000.1
Lactococcus Lactococcus lactis AE005176.1 Myroides Myroides. odoratimimus CIP_101113
Pseudomonas
Pseudomonas agarici NZ_CP014135.1 Pseudomonas caeni NZ_ATXQ01000001.1
Pseudomonas chlororaphis CP014867.1 Pseudomonas extremaustralis NZ_AHIP01000001.1
Pseudomonas japonica NZ_BBIR00000000.1 Pseudomonas kilonensis JZXC01000001.1
Pseudomonas moraviensis NZ_CM002330.1 Pseudomonas protegens NC_004129.6
Pseudomonas putida NC_002947.4 Pseudomonas taetrolens NZ_JYLA01000001.1 Pseudomonas viridiflava NZ_JXQO00000000.1
Psychrobacter
Psychrobacter alimentarius CP014945.1 Psychrobacter glacincola NZ_LIQB00000000.1 Psychrobacter maritimus NC_021158.1
Psychrobacter urativorans NZ_CP012678.1 Rahnella Rahnella. aquatilis CP003244.1
Shewanella
Shewanella baltica NC_016901.1 Shewanella frigidimarina NC_008345.1 Shewanella putrefaciens NC_009438.1 Shewanella xiamenensis NZ_JGVI00000000.1
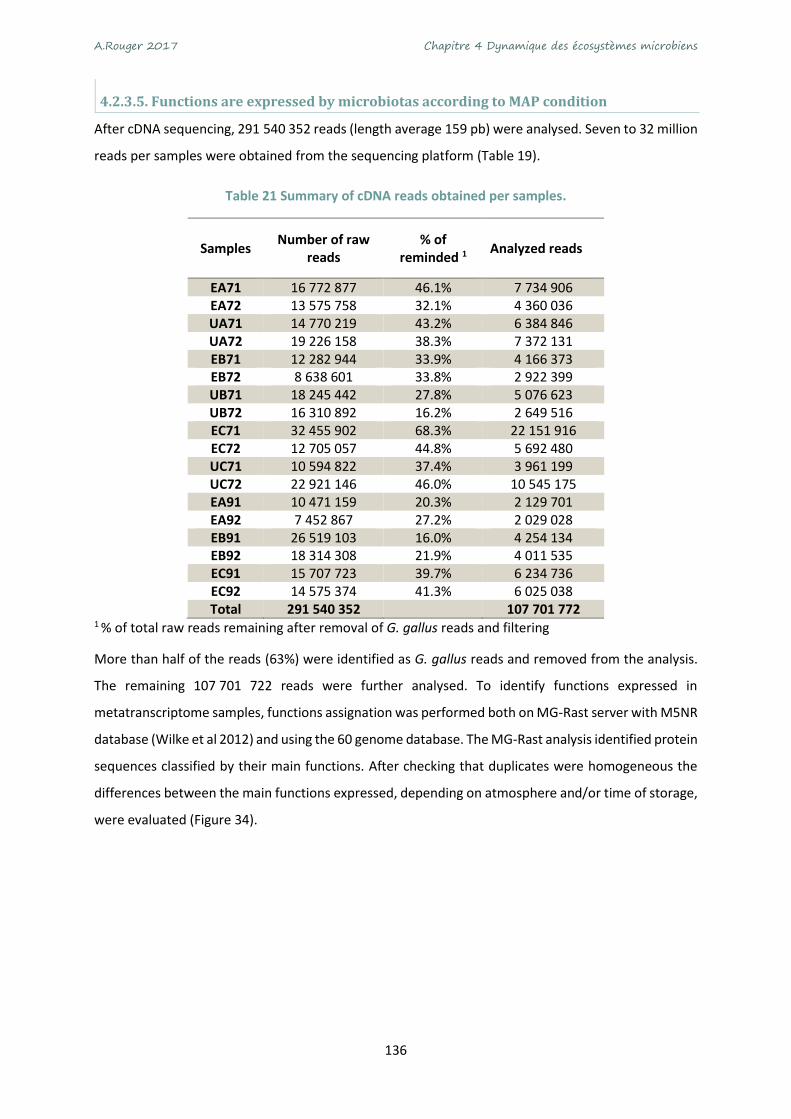
A.Rouger 2017 Chapitre 4 Dynamique des écosystèmes microbiens
136
4.2.3.5. Functions are expressed by microbiotas according to MAP condition
After cDNA sequencing, 291 540 352 reads (length average 159 pb) were analysed. Seven to 32 million
reads per samples were obtained from the sequencing platform (Table 19).
Table 21 Summary of cDNA reads obtained per samples.
Samples Number of raw
reads % of
reminded 1 Analyzed reads
EA71 16 772 877 46.1% 7 734 906 EA72 13 575 758 32.1% 4 360 036 UA71 14 770 219 43.2% 6 384 846 UA72 19 226 158 38.3% 7 372 131 EB71 12 282 944 33.9% 4 166 373 EB72 8 638 601 33.8% 2 922 399 UB71 18 245 442 27.8% 5 076 623 UB72 16 310 892 16.2% 2 649 516 EC71 32 455 902 68.3% 22 151 916 EC72 12 705 057 44.8% 5 692 480 UC71 10 594 822 37.4% 3 961 199 UC72 22 921 146 46.0% 10 545 175 EA91 10 471 159 20.3% 2 129 701 EA92 7 452 867 27.2% 2 029 028 EB91 26 519 103 16.0% 4 254 134 EB92 18 314 308 21.9% 4 011 535 EC91 15 707 723 39.7% 6 234 736 EC92 14 575 374 41.3% 6 025 038 Total 291 540 352 107 701 772
1 % of total raw reads remaining after removal of G. gallus reads and filtering
More than half of the reads (63%) were identified as G. gallus reads and removed from the analysis.
The remaining 107 701 722 reads were further analysed. To identify functions expressed in
metatranscriptome samples, functions assignation was performed both on MG-Rast server with M5NR
database (Wilke et al 2012) and using the 60 genome database. The MG-Rast analysis identified protein
sequences classified by their main functions. After checking that duplicates were homogeneous the
differences between the main functions expressed, depending on atmosphere and/or time of storage,
were evaluated (Figure 34).

A.Rouger 2017 Chapitre 4 Dynamique des écosystèmes microbiens
137
MAP B (50% CO2 - 50% N2) or air C (~21% O2 - 78% N2).
Figu
re 3
4 C
lass
ific
atio
n o
f ge
nes
exp
ress
ed b
y m
icro
bio
ta E
aft
er 7
(b
lue)
an
d 9
(re
d)
day
s o
f st
ora
ge u
nd
er M
AP
A (
70
% O
2 -
30
% C
O2)
or
MA
P B
(5
0%
CO
2 -
50
% N
2) o
r ai
r C
(~2
1%
O2
- 7
8%
N2)
.

A.Rouger 2017 Chapitre 4 Dynamique des écosystèmes microbiens
138
No significant time effect was observed according to the main function categories. A 0.5-1 log
difference between day 7 and 9 was observed in MAP A and air C samples, whereas no time effect was
observed for MAP B (data not shown). As already observed from metabarcoding, the
metatranscriptomic data obtained after MG-Rast annotation, showed that samples from day 7 and day
9 were similar.
A comparison of functional categories expressed by microbiota E (day 7 + day 9) under different MAP
is shown Figure 35.
Figure 35 Log of count reads per functional categories observed for each MAP A (70% O2 - 30% CO2) or MAP B (50% CO2 - 50% N2) or air C (~21% O2 - 78% N2).
Globally, it appears that more functions were expressed under air (C). That could suggest that both
MAP A and B indeed limit bacterial activity. The most abundant functional categories observed for
each MAP condition were carbohydrate metabolism, clustering based subsystems and protein
metabolism. In a smaller proportion, some functions identified as Photosynthesis or Dormancy and
sporulation classes could be artefactual and required further assignation. Interestingly, metabolism of
aromatic compounds and secondary metabolism functions, which could be involved in spoilage, were
lower in samples stored under MAP A.
The annotation performed with MG-Rast was useful to have a first overview of different functions
expressed in meat samples but to assign expressed genes to species, we mapped metatranscriptome
reads against database constituted with the genomes of 60 species available from the NCBI database.

A.Rouger 2017 Chapitre 4 Dynamique des écosystèmes microbiens
139
4.2.3.6. Functions are expressed by species according to MAP condition
On average only, 34% of metatranscriptomic reads could be mapped against bacterial genomes from
the database. Number of reads mapped per samples were variable from 26% to 48% of the total
filtered reads whilst database was created with identified species from metabarcoding and
metagenomic result. Actually, mapping against metagenome annotated with Prokka provided
identification level of metatranscriptome up to 47% on average. The remaining reads could be
identified as mitochondrial or yeast or fungi which were not removed during the procedure of RNA
extraction or depletion but were not checked.
After mapping, identified genes according to each conditions were sorted and normalized to see genes
differentially expressed. This analysis was performed a first time with all samples using air C sample as
reference. Since no statistical difference was observed between samples from day 7 and day 9 (Figure
36), data for samples of time 7 and 9 were pooled. Then agglomerative hierarchical clustering (AHC)
of metatranscriptome samples were drawn (figure 36).
Figure 36 Agglomerative hierarchical clustering (AHC) of metatranscriptome samples from total read counts of 24 032 genes
Agglomerative hierarchical clustering of metatranscriptome data clearly cluster samples with air
storage statistically different from to the other MAP. Interestingly we noticed that in the MAP clusters,
samples were also cluster according to the microbiota except for samples EB91 and EB92. In addition
we found that duplicates were almost all cluster by two, except for samples EA91 and EA92 (Figure
36).

A.Rouger 2017 Chapitre 4 Dynamique des écosystèmes microbiens
140
For both microbiota, samples issued from MAP A, B or C were compared in order to determine genus
that were differentially expressed depending on the storage atmosphere (Figure 37). As modified
atmospheres (A or B) are proposed to improve the shelf-life of poultry meat, we focused on the genes
that were up-regulated under those MAPs, by comparison to storage under air (Figure 38).
Figure 37 Venn diagram with the number of genes differentially expressed according to the MAP condition MAP A (70% O2 - 30% CO2) or MAP B (50% CO2 - 50% N2) or air C (~21% O2 - 78% N2) for
microbial communities E and U.

A.Rouger 2017 Chapitre 4 Dynamique des écosystèmes microbiens
141
Figure 38 Differentially expressed genes and their taxonomic assignation depending on the conditions.
The number of genes differentially expressed by microbiota E (left panel) and U (right panel) are indicated. For each microbiota, the metatranscriptomes from MAP A (70% O2 - 30% CO2) or MAP B
(50% CO2 - 50% N2) were compared to those obtained after storage under air (C) (~21% O2 - 78% N2) giving the 4 Venn diagrams. Black numbers at the top of each diagram indicate the total number of
genes. Grey numbers indicated those whose expression did not vary. Colored numbers indicated differentially expressed genes. Each pie chart details the taxonomic assignation of each pool of
differentially expressed genes.
The first observation was that more genes were up-regulated under air (from 4349 to 6262 genes) than
under condition A (62 to 95 genes) or condition B (755 to 870 genes). This could be explain by a high
metabolic activity of bacterial species under air/control compared to MAP A or B that are proposed to
improve meat shelf life. We identified that most part of up-regulated genes could be attributed to
Acinetobacter genus and from Pseudomonas in microbiota E or Rahnella and Shewanella in microbiota
U.
As we decided to focus on the effect of storage under modified atmosphere, we examined which
functions were especially up-regulated by microbiota E and U, after storage under MAP A or B, by
comparison to air storage. Indeed, as modified atmosphere packages are supposed to improve
microbial safety of poultry meat, it is meaningful to identify if undesirable functions are still expressed
under MAP, or on the contrary if beneficial functions are over-expressed. The detailed list of such up-

A.Rouger 2017 Chapitre 4 Dynamique des écosystèmes microbiens
142
regulated genes is shown in Annex 1. The assignation of these genes to the various species is shown
(Figure 39).
Figure 39 Species assignation of up-regulated genes
The number of genes up-regulated by microbiota E and U under condition A (70% O2 - 30% CO2) or B (50% CO2 - 50% N2) compared to air.
Under MAP A storage, a large part of up-regulated genes was attributed to C. maltaromaticum and
then to B. thermosphacta, C. divergens, L. sakei and L. fuchuensis were observed. In MAP B the active
species were mostly L. sakei followed by C. divergens in microbiota U and L. fuchuensis followed by C.
divergens in microbiota E.
In order to describe which functions were up-regulated, each gene position and identification was
verified by comparing to genome annotations available on Mage Microscope annotation platform.
Genomes of B. thermosphacta DSM 20171, L. sakei 23K, Carnobacterium maltaromaticum LMA28 or
C. divergens V41 were used. When EC number was available and relevant those were used to
reconstruct metabolic pathways. Because curated annotation was not available on the platform for L.
fuchuensis, we considered the annotations provided by bowtie2, and then compared the annotations
to the genome of L. sakei, as both species are closely related.

A.Rouger 2017 Chapitre 4 Dynamique des écosystèmes microbiens
143
4.2.3.6.1. Microbiota E and U under O2 and CO2 enriched atmosphere
The up-regulated genes in MAP A vs air were similar in microbiota E and U. Although B. thermosphacta
was the dominant species (Figure 31) only 7 (in microbiota E) and 6 (in microbiotas U) genes were up-
regulated by this species. The over-expression of the ribose operon rbsBCADK, encoding the ribose
ABC-trasnporter (RbsA, RbsB, RbsC) the pyranase (RbsD) and the ribokinase (RbsK) (Figure 40) suggests
that ribose is used as a preferred carbon source under MAP A. The ribose operon RbsR gene was no
up-regulated, but surprisingly a gene encoding a putative transcriptional regulator, located upstream
for the ribose operon but on the opposite orientation was also up-regulated.
Figure 40 The ribose operon in B.thermosphacta adapted from Autieri et al. (2007)
Regarding lactic acid bacteria, C. maltaromaticum up-regulated more genes (34 in microbiota E and 48
genes in microbiota U) than C. divergens (9 genes in microbiota E and 14 genes in microbiota U) or L.
fuchuensis (8 genes in microbiota E and 2 genes in microbiota U) and L. sakei (2 genes in microbiota E
and 24 genes in microbiota U) (Figure 39). B. thermosphacta, C. divergens, C. maltaromaticum and L.
sakei up-regulated also the ribose operon. A regulator of unknown functions described was also
identified downstream the ribose operon of C. maltaromaticum but was not overexpressed.
Intriguingly, the rbsR repressor was also up-regulated.
Besides ribose, other genes involved in sugar utilization were also up-regulated. C. maltaromaticum
up-regulated the gluconate kinase gene showing the utilization of pentulose and hexulose and also an
operon involved in maltodextrin degradation (malDEL and mdxE). In addition, in microbiota U genes
encoding several PTS dependent enzymes II putatively involved in maltose or cellobiose transport and
utilization were up-regulated suggesting the utilization of complex sugar as carbon sources. At the
same time, several genes encoding enzymes involved in the glycolysis pathway were over-expressed
by each LAB. Gene encoding enzymes as GlpF (glycerol permease), or GlpO (α-glycerophosphate) were
expressed by L. sakei in microbiota U suggesting glycerol utilization as carbon source. GlpF internalizes
glycerol and GlpO catalyzes the dihydroxyactetone (DHA-P) production from glycerol-P with O2 as
cofactor. Lactobacilli expressed also gene encoding enzymes involved in the last steps of glycolysis to
drive compounds to acetate pathway as lactate oxidase or pyruvate oxidase. In addition, transport of
rbsB rbsC rbsA rbsD rbsK
regulator
rbsR

A.Rouger 2017 Chapitre 4 Dynamique des écosystèmes microbiens
144
thiamine was also up-regulated by C. maltaromaticum. Thiamine is a co-factor for several reactions of
glycolysis and amino acid metabolism. Chicken meat is rich in thiamine which could therefore be
indeed used as a co-factor (Kim and Bowers 1988).
In both microbiota E and U, we also observed the up-regulation of several genes involved in iron or
heme transport. C. maltaromaticum up-regulated 10 such in microbiota E and 12 in microbiota U while
C. divergens up-regulated 4 genes involved in iron/heme transport in microbiota E and 7 in microbiota
U. Those proteins are identified as permeases belonging to the fecCD family protein transport or are
ABC transporters. C. maltaromaticum also expressed a gene encoding a heme degrading
monooxygenase (IsdG and IsdC) which releases iron from heme after internalization in the cell.
Bacteria could also defend themselves from ROS by over-expressing genes encoding the manganese-
dependent super oxide dismutase (Mn-SOD), heme-dependent catalase or NADH oxidase. Mn-SOD
gene was over-expressed by C. maltaromaticum in microbiota E and catalase gene by L. sakei in
microbiota U. In addition, several genes encoding proteins identified as involved in oxidative stress
response were listed as reductases and oxidase: ferredoxin reductase or nitroreductase in microbiota
E (4 genes) by C. maltaromaticum and L. fuchuensis and by C. maltaromaticum and L. sakei in
microbiota U (7 genes).
Therefore, MAP A which was enriched in O2 which could considered as an oxidative stress condition
for microbiotas. Oxidative stress in bacteria is a contentious subject (Imlay 2015). ROS created by
oxidative stress such as O2- and H2O2 can damage enzymes and may also cause mutations. Activated by
heme, the catalase has a major role in oxidative stress decrease by degradation of H2O2. Iron released
in the cell by fecCD or fecE transporters could be further reduced by different ferredoxins which was
found as differentially expressed in this study. Iron may also be used as a cofactor for the NADH
dehydrogenase (co-factor Iron-S) or ribonucleotide reductase reactions (co-factor Fe cation 1.17.4.1)
explaining why Carnobacteria over-expressed genes involved in transport of iron and heme.
We also observed that function involved in the use of amino acids as nitrogen source, as for example
allantoin, derived from purine. Lactic acid bacteria in E and U microbiotas up-regulated genes encoding
this pathway which convert allantoin to ammonia and CO2. Several genes were expressed by
Carnobacterium as the allantoinase gene or allD, allC and allE genes (Figure 41). This correlates with
the presence of allantoin in poultry plasma after feeding the animals with inosine-supplemented diets
(Simoyi et al., 2003).

A.Rouger 2017 Chapitre 4 Dynamique des écosystèmes microbiens
145
Figure 41 Schema of allantoin pathway adapted from Lee et al. (2013)
Genes encoding transport and/or degradation of other amino acids were also up-regulated as for
example methionine in C. maltaromaticum or threonine in L. sakei. Genes coding for the enzymes of
the arginine deiminase pathway were also up-regulated by L. sakei. Arginine can be used as a source
of energy, carbon and nitrogen for this bacterium (Figure 42) (Champomier Vergès et al., 1999). This
pathway has been shown to be expressed when limited amounts of glucose were available and also
under aerobiosis (Champomier Vergès et al., 1999).
Figure 42 Arginine degradation pathway adapted from Champomier Vergès et al. (1999)
Allantoin
Allantoate
S-2-ureidoglycine
Ureidoglycolate
Oxalurate
CO2
AllC
AllE
AllD
Purine/Inosine degradation
Allantoinase

A.Rouger 2017 Chapitre 4 Dynamique des écosystèmes microbiens
146
4.2.3.5.2. Genes up-regulated in MAP B (enriched in CO2 and N2) vs air in microbiota E and U
Compared to what we observed under MAP A, more genes were up-regulated in MAP B vs air storage.
No gene was over-expressed by B. thermosphacta (Figure 42). Genes up-regulated by Carnobacterium
were quite similar with those found in MAP A involved mainly in the transport of complex sugars and
the use of the PTS system to import carbon sources. Ribose operon and enzymes involved in the sugar
degradation and fermentation were up-regulating attesting for an active sugar metabolism. Expressed
by C. divergens only, metabolism of glycerol using FMN as co-factor is also up-regulated. As describe
in enriched O2 atmosphere (see previous section) ADI pathway were also up-regulated. Some
anaerobic regulator quite poorly known where also reported suggesting a response to anaerobic
condition. The major difference with the observation made in MAP A up-regulated genes was the
activity of 2 Lactobacillus species: L. fuchuensis up-regulated 663 genes in microbiota E and 71 in
microbiota U while L. sakei up-regulated 158 genes in microbiota E and 616 in microbiota U.
Nevertheless those two closed species regulated similar functions. From the ~750 genes up-regulated
by both L. sakei and L. fuchuensis in each microbiotas, 12% in microbiota E and 25% in microbiota U
was coding for unknown or putative functions and were not be further analyzed. Functions involved in
cell wall synthesis or cell division, translation, replication, transcription, energy production were
identified suggesting an active bacterial growth and multiplication. In microbiota E where L. fuchuensis
was the most active species, among the 663 up-regulated genes, 47 were involved in cell wall synthesis
and cell division, 40 were encoding functions associated to replication regulation, and 105 were in
translation and transcription functions. In microbiota U, the 616 up-regulated genes expressed by L.
sakei were reported as follows: 63 genes were involved in cell wall synthesis and cell division, 31 in
replication regulation, and 132 in translation and transcription functions. This suggest that in each
microbiota L. sakei and L. fuchuensis harbored an active cellular machinery in microbiota U and E,
respectively.
Other functions linked to meat environment were also up-regulated by L. sakei in microbiota U. IN
particular the genes enabling the utilization of different carbon sources available in meat were up-
regulated by L. sakei in microbiota U (Figure 43).
The PTS mannose complex involved in mannose uptake was identified through over-expression of 6
genes encoding EIIman ABCD ensuing transport and phosphorylation of mannose and the 2 PTS general
enzymes EI and HPr. In addition the PTS enzyme II cellobiose was also reported suggesting the
utilization of complex sugars. Genes encoding ribose operon as previously described were also up-
regulated. Utilization of other sugars as fructose, galactose, glucose, and mannose were also induced

A.Rouger 2017 Chapitre 4 Dynamique des écosystèmes microbiens
147
as indicated by genes encoding several permeases and transporters (GlcU), regulator (FurR) and
enzymes involved in degradation (GapA, GalE). Additionally, several genes such as those encoding
glycolytic enzymes (Pyruvate kinase, 6-phopho-fructo-kinase, fructose 1,6-biphopahse aldolase, gpmA
for example) were up-regulated attesting the utilization of different sugars by the bacteria (Figure 43).
Regeneration of NADP(H) was also up-regulated because it was used as cofactor of different stage of
glycolysis.
Figure 43 Sugars related functions up-regulated by L. sakei in microbiota U.
The genes encoding the various functions are shown. NC indicates that the corresponding genes were not detected as over expressed. EC number of enzymes are indicated.
Utilization of sugar was ensured through heterolactic fermentation and pentose phosphate pathways
by acetate kinase and pyruvate degradation metabolism. Production of compound as acetoin may also
be induced through the up-regulation of acetoacetate decarboxylase, or synthase enzymes expressed
by L. sakei.
Pyruvate generated by glycolysis could lead acetoin production because 2 genes encoding acetolactate
synthase (EC 2.2.1.6) and α-acetolactate decarboxylase (EC 4.1.1.5) were up-regulated suggesting the
production of (R)-2-acetoin, a precursor of butanoate which can be responsible for off-odors.

A.Rouger 2017 Chapitre 4 Dynamique des écosystèmes microbiens
148
Acetoacetyl-coA C-acetyltransferase (EC 2.3.1.9) and mevalonate kinase (EC 2.7.1.36) genes were up-
regulated suggesting the production of mevalonate from acetyl-coA produced after glycolysis.
Pyruvate is also used for Coenzyme A synthesis a co-factor important for several metabolic pathways.
This co-factor could also be synthesized from amino acid (alanine, methionine) and fatty acid
metabolisms as suggested by the up-regulation of different enzyme involved in those metabolisms.
Genes encoding several functions involved in amino acid metabolism (MetK) or purine metabolism
were also up-regulated by L. sakei. Amino acid as alanine, arginine, asparagine, and nucleobases as
purines (guanine and xanthine) and pyrimidines could be sources of nitrogen or biosynthesized by cells.
Metabolism of purine and pyrimidine degradation was as well up-regulated by L. sakei with 11 genes
involved in this metabolism (for example those encoding PurA, PurE and different reductases and
kinases). This observation was correlated to the high number of functions identified as involved in cell
machinery and growth of L. sakei among the up-regulated genes. In the same way, 6 genes of the F0F1
ATPase involved in energy production were up-regulated. Chaillou et al. (2005) described energy
production pathways used by L. sakei from the meat. In microbiota U, all those pathways of energy
producing were up-regulated in this study suggesting that L. sakei was well active in sample U.
Figure 44 Pyrimidine biosynthesis related functions up-regulated by L. sakei in microbiota U. The genes encoding the various functions are shown. NC indicates that the corresponding genes
were not detected as over expressed. EC number of enzymes are indicated.
In addition, genes encoding enzymes involved in the metabolism of pyrimidines were also noticed as
up-regulated. Those encode a thioredoxin reductase (EC 1.8.1.9) a putative 2’,3’-cyclic nucleotide 2’-
phosphodiesterase (EC 3.1.4.16), a deoxyadenosine kinase (EC 2.7.1.74), a thymidine kinase (EC
THYMINE
DNA
dTDP dTMP Thymidine2.7.1.212.7.4.9NC
2.7.7.7
dTTP
dUDP dUMP Deoxyuridine2.7.1.212.7.4.9NC
dUTP
URACIL
CYTOSINE
dCDP dCMP Deoxycytidine2.7.1.742.7.4.9NC
dCTP
CDP CMP CytidineNCNCNC
CTP
Thioredoxin disulfide
Thioredoxin
1.17.4.21.8.1.9
2.1.1.45
UDP
2.7.7.7
2’,3’-Cyclic CMP
3’-CMP3.1.4.16
NC
NC

A.Rouger 2017 Chapitre 4 Dynamique des écosystèmes microbiens
149
2.7.1.21) a thymidylate kinase (EC 2.7.4.9) and 2 sub-units of the DNA polymerase. This suggest
pyrimidine biosynthesis toward DNA replication (Figure 44).
L. sakei requires also vitamins. From up-regulated genes, we identified the induction of several
enzymes involved in thiamine (Vitamin B6) metabolism (EC 2.7.4.7, EC 2.8.1.7 or ThiD EC 2.7.6.2).
Thiamine biosynthesis or salvage from meat environment might ensure the presence of this co-factor
necessary for different reactions.
Conversely as what was observed under aerobic conditions, no gene for iron or heme transport was
induced. However we noticed the up-regulation of 13 genes involved in stress response as a cold shock
protein which may lead to resistance to cold storage (chicken meat stored at 4°C) or other stress
response proteins with uncharacterized functions. In microbiota U, L. sakei expressed ClpP protein in
suggesting an atypical adaptation response favoring by a zinc anaerobic reductase.
Because of a lack for curated annotation of the L. fuchuensis genome, the predicted functions
expressed by L. fuchuensis in microbiota E were confronted to L. sakei genome. Functions over
expressed by L. sakei were quite similar to that up-regulated functions of L. fuchuensis in microbiota E
suggesting that L. fuchuensis and L. sakei had the same behavior. The cobalamin biosynthesis protein
CbiM and ATP-cobalamin adenosyltransferase (EC 2.5.1.17) converting cobalamin to its co-enzyme
from were up-regulated only by L. fuchuensis. However the cbiM gene annotation is uncertain as it is
also identical to genes identified a cobalt transporters.
Nevertheless, it was interesting to notice that the predominant activity of L. sakei in microbiota U
compared to the predominant activity of L. fuchuensis in microbiota E was also identified in
atmosphere enriched in O2 validating that initial microbiota U and E were different.
4.2.4.Discussion
Two different microbiotas were used to inoculate fresh chicken meat and were able to overgrow the
indigenous contaminants. Microbiotas dynamics were followed during 9 days to investigate the
gaseous atmosphere influence and metatranscriptomic analysis allowed to describe the behavior of
various species composing the microbiotas during storage. The duplicates performed in this study
showed similar results validating our meat model system.
4.2.4.1. Gaseous atmosphere shape the bacterial populations and metabolic functions expressed
We compared the relative abundance of bacterium present in meat samples shared under various
atmospheres and the most actives ones. Relative abundance was deduces from metabarcoding and
partially confirm either by plating methods, qPCR and metagenomics. Metabolic activities were

A.Rouger 2017 Chapitre 4 Dynamique des écosystèmes microbiens
150
deduced from the amount of genes that were up-regulated in one of the 3 atmosphers. The results are
shown Table 20.
Table 22 Comparison of bacteria present and active depending on storage condition
Present genusa Active genusb
MAP A Brochothrix > Carnobacterium EA UA
Carnobacterium > Lactobacillus > Brochothrix E and U
MAP B Carnobacterium > Brochothrix > Lactobacillus EB UB
Lactobacillus >> Carnobacterium E and U
air C Brochothrix > Acinetobacter > Rahnella EC UC
Acinetobacter > Pseudomonas E Acinetobacter > Rahnella U
a Taxonomic assignation by metabarcoding (figure 30) b Taxonomic assignation of up-regulated genes differentially expressed (figure 38)
Even though B. thermosphacta was dominant in both microbiota E and U, this species was not more
active in any of the 3 storage conditions. Only the ribose operon was over-expressed under MAP A or
MAP B by comparison to storage under air. Carnobacterium (C. maltaromaticum and C. divergens)
were dominant in MAP A and B and also up-regulated gens for carbohydrate metabolism, iron
transport or oxidative stress response, depending on the MAP. Acinetobacter were the most active
bacteria under air storage. Surprisingly, lactobacilli (L. fuchuensis and L. sakei) although sub-dominant
were the most active under MAP A and MAP B.
B. thermosphacta is well-known as dominant spoiled bacterium, occurring on different MAP (Pin et al.,
2002) and differently affected by storage condition when compared to other spoilage bacteria such as
Pseudomonas for example (Stanborough et al., 2017). B. thermosphacta preferentially uses glucose as
carbon source on meat (Gill & Newton, 1977) but we showed that it could use ribose after 7 or 9 days
of cold storage. The glucose concentration of meat decreases during storage, as previously shown by
Lilyblade and Peterson (1962) imposing bacteria to use alternative carbon sources available from meat.
B. thermosphacta may also use glycerol as carbon source (Stanborough et al., 2017) although we did
not detect any up-regulation of such genes.
The influence of MAP is not only managed by O2 but also by CO2. Oxygen seemed to favor B.
thermosphacta while CO2 was more favorable to Carnobacterium. The absence of impact of CO2 on
Gram positive bacteria such as B. thermosphacta was previously reported (Johansson et al., 2011).
Nevertheless, B. thermosphacta can use sugars to produce lactate under anaerobic conditions and
acetoin in the presence of O2 (Gill and Newton 1977). However our results did not reveal such
influence. We may hypothesis that a fine tuning of gene expression by B. thermosphacta is responsible
for its adaptation but below the threshold limit we used. Indeed the genome of B. thermosphacta

A.Rouger 2017 Chapitre 4 Dynamique des écosystèmes microbiens
151
seems particularly rich in transcriptional regulators and stress response genes (Stanborough et al.,
2017).
Regarding other active bacteria species in meat microbiotas, Carnobacterium identified as dominant
in anaerobic MAP condition up-regulated various functions in both anaerobic and aerobic conditions.
As B. thermosphacta, C. divergens and C. maltaromaticum has been shown to be able to use different
carbon sources like lactose and galactose (Iskandar et al., 2016). Many species in meat microbiotas up-
regulated genes to use various sugars by using PTS systems, suggesting that other carbon sources than
glucose and ribose are available in meat. O2 proportions in the MAP also influenced the expression of
functions by Carnobacterium as for example the heme and iron transport up-regulated in aerobic
conditions while switched off in anaerobic conditions. This observation require further investigations
to understand microbial ecology of meat and to manage the spoilage caused by various species during
meat storage.
4.2.4.2. Importance of subdominant species in microbiotas.
The most relevant information from metatranscriptomic study is the high number of up-regulated
functions issued from L. sakei and L. fuchuensis, which were subdominant according to metabarcoding
and metagenomic results. The study reveals thus, the importance of subdominant species. The
presence of dominant LAB as Leuconostoc gasicomitatum in marinated chicken meat (Nieminen et al.,
2012) was not observed in our study. L. gasicomitatum was described as unable to use amino acid on
meat unlike L. sakei (Johansson et al., 2011). After 9 days of storage, the nutriments available on meat
may become limiting for L. gasicomitatum growth. Conversely, L. sakei is well adapted to meat
ecosystem because this species harbors both PTS systems and the ribose operon (Chaillou et al., 2005).
Pyruvate metabolism of L. sakei can also be modified when glucose is depleted in the environment by
using arginine pathway as described Figure 43.This condition occurred in stationary phase of L. sakei
growth. Also, the environmental pH influenced the expression of arginine pathway that could be and
additional argue of L. sakei adaptation in spoiled meat (Rimaux et al., 2012). Arginine deiminase
pathway already reported to be involved in smoked salmon spoilage (Jørgensen et al., 2000, Fernandez
& Zuniga, 2006). In addition, regulation of ribose transport and catabolic machinery of L. sakei was well
known (McLeod et al., 2011).
4.2.4.3. Different sources of carbon and nitrogen could be used in chicken meat
To summarize, major metabolic pathways used by bacteria present in chicken meat microbiotas in this
study were shown Figure 45.

A.Rouger 2017 Chapitre 4 Dynamique des écosystèmes microbiens
152
Figure 45 Major metabolic pathways used by bacteria in chicken meat microbiota. Scare boxes represent PTS transport system while cylinder boxes represent permeases.
As described by Stentz et al., (2001) meat is rich in different substrates but poor in sugars (glucose and
ribose mainly). Muscles contain glycogen (Stentz et al., 2001) which can be used as carbon source by
some bacteria. Just after slaughtering, the main sugars present in meat are glucose and fructose but
ribose is also present in smaller amounts (Aliani et al., 2013). After 6 days of storage, glucose
concentration decreases while ribose and inositol increase during the storage (Lilyblade and Peterson,
1962). Glucose is limited for bacteria growth but alternative carbon sources as amino acids or lactate
can be used (Gill & Newton, 1977). Hypothesis about possible carbon source utilization have been
proposed for L. sakei (Stentz et al., 2001) and could be extrapolated to other bacteria present in meat
(Figure 43).
4.2.4.4. Key role of species in chicken meat spoilage
LAB such as L. fuchuensis, L. sakei, C. maltaromaticum and C. divergens have been previously
associated to fresh meat spoilage and isolated from vacuum beef package (Sakala et al., 2002).
Production of off-odors, altering the sensory quality of raw meat, could incriminate these species in
meat spoilage. The role of LAB in meat spoilage was reported but this role is also still discussed
(Pothakos et al., 2015). All LAB are not involved in sensory spoilage. L. sakei for example may have a
Glycogen
Glucose
Glycolysis
Glucose
Ribose
Ribose
Ribose-5P
Pentose-P pathway
Maltose
Complexsugars PEP
Pyruvate
Acetyl-P
Lactate
Acetate
Cellobiose
Simple sugar
EI
EI-P
Protein
amino acidArginine asparagine
amino acid and nucleobasedegradation
PURINEPYRIMIDINEHISTIDINE
nucleobases purines, pyrimidines
CO2 + NH3
putrescine
Arginine
acetoin
allantoin

A.Rouger 2017 Chapitre 4 Dynamique des écosystèmes microbiens
153
bioprotective function in meat and may exert antagonistic activity against undesired microorganisms
(Champomier-Vergès et al., 2002, Chaillou et al., 2014, Jones et al., 2009). The relevant observation in
this study was the predominance of L sakei activity in microbiota U and that of L fuchuensis
predominance in microbiota E in particular anaerobic MAP B condition. Sensory tests would be
requires to state on the putative protective or spoiling role of this LAB in poultry meat. This study
shows the potential of very powerful NGS technologies applied in food microbiology. Metagenomic
and metatranscriptomic data enabled a detailed analysis of poultry meat microbial ecology and
highlighted the bacterial behaviour during poultry meat storage.
Acknowledgements
This work was financed by “Région Pays de la Loire” (PhD grant to AR), INRA (IAVFF- Agreenium) and
ICFMH. The authors would like to thank Valérie Anthoine, Oniris-INRA, Nantes and Henna Niinivirta,
University of Helsinki for their technical support and the Oniris food technology pilot plan for access
to food packaging facilities.
4.3- Ce qu’il faut retenir du chapitre 4
Le but de ce chapitre était de comprendre le comportement des espèces bactériennes au sein de
microbiotes de viande de poulet conservée sous atmosphère protectrice. Pour cela, 2 microbiotes
préalablement isolés (chapitre 2) et décrits par pyroséquençage (chapitre 3) ont été inoculés sur des
dés de viande de poulet et stockés durant 9 jours à 4°C sous 2 MAP différentes (A et B) et sous air (C).
La croissance bactérienne a été suivie de l’inoculation jusqu’à 9 jours de stockage à 4°C par méthodes
culturales montrant ainsi que les communautés bactériennes inoculées ont été capables de se
développer. Nous avons donc réussi à mimer les conditions dans lesquelles se trouvent les
communautés bactériennes au cours d’un stockage jusqu’à la DLC.
A 7 et 9 jours de stockage, les ADN et ARN bactériens ont été récoltés afin d’être séquencés
(métabarcoding, métatranscriptomique, métagénomique). Les résultats de métabarcoding et de
métagénomique nous ont permis de mettre en évidence la prédominance de B. thermosphacta dans
les microbiotes conservés sous MAP enrichie en O2 alors que dans les viandes conservées en
anaérobiose, B. thermosphacta mais aussi C. maltaromaticum and C. divergens étaient majoritaires. Il
est important de noter que ces résultats semblent valider le fait que les compositions gazeuses des
A.Rouger 2017 Chapitre 4 Dynamique des écosystèmes microbiens
154
barquettes de viande conditionnent les espèces bactériennes des microbiotes en favorisant/
sélectionnant certaines espèces.
Les résultats de métatranscriptomique ont généré une liste conséquente de fonctions
différentiellement exprimées suivant les atmosphères de stockage. Dans un souci de simplification,
nous avons spécifiquement recherché les fonctions surexprimées dans les conditions de MAP A ou B
par rapport à celles exprimées sous air. Cela nous a permis de mettre en évidence que les espèces dont
l’activité est induite par une atmosphère protectrice, ne sont pas toujours les espèces dominantes. En
effet, des lactobacilles, non détectés par pyroséquençage au chapitre 2 et détectés comme sous
dominants dans nos challenges tests semblent être plus actifs après stockage sous MAP que sous air.
Nous avons également mis en évidence la dominance de B. thermosphacta dans les différentes
conditions de stockage, avec peu de différences des fonctions exprimées. Cette bactérie semble donc
insensible aux conditions gazeuses de stockage.
Ces résultats permettent de mieux connaitre les moyens de maitrise des communautés bactériennes,
utilisés pour prolonger la DLC et assurer la sécurité et la qualité des produits. Il serait également
intéressant d’analyser les fonctions surexprimées dans les microbiotes stockés sous air.
Il faut cependant noter que des difficultés ont été rencontrées lors des extractions d’acides nucléiques
à partir de viande de poulet (Figure 46). Comme évoqué lors du chapitre 2, elles se sont révélées parfois
limitantes au cours de cette dernière étude. En effet, lors d’un 1e challenge test avec une inoculation
de la flore à 3 log UFC/g, une forte contamination d’ARN eucaryotes a été identifiée (figure 46 A). Nous
avons émis les hypothèses suivantes :
- Présence de nucléase dans la viande
- Quantité limitante de bactéries
- Inaccessibilité des bactéries lors de la lyse

A.Rouger 2017 Chapitre 4 Dynamique des écosystèmes microbiens
155
Figure 46 Résultats de puces ARN Agilent ou Experion montrant la qualité des ARN extrait lors de 3
challenges tests (A, B et C).
Un 2nd challenge test avec une inoculation initiale de 5 log CFU/g a été réalisé lors duquel différents
tests ont été effectués pour optimiser le protocole d’extraction d’acides nucléiques bactériens à partir
de viande de poulet (Annexe 2). Après optimisation, un 3e challenge test a été réalisé et nous avons
pris le soin de vérifier dès J0 l’absence de nucléase dans la viande en effectuant une extraction d’ARN
et d’ADN à J0. L’ARN a pu être extrait à partir de 4 jours de stockage. Cependant une concentration
suffisante d’ARN pour le séquençage n’a pu être obtenue qu’après 7 et 9 jours de stockage (Figure
46 C).

A.Rouger 2017 Chapitre 4 Dynamique des écosystèmes microbiens
156

A.Rouger 2017 Discussion et perspectives
157
Discussion et perspectives
Les bactéries présentes sur la viande de volaille ont été décrites le plus souvent par des méthodes
culturales mais l’état de l’art nous montre le peu d’informations qui ont été rapportées. Cela résulte
d’une part des biais inhérents à ces méthodes mais aussi à l’extrême variabilité des découpes,
transformations et préparations à base de viande de poulet. La variabilité des lots de viande de poulet
aussi bien dans la nature des contaminants que dans la charge de contamination rend difficile la
comparaison des résultats de la littérature portant sur la viande de volaille. Nous avons donc mis au
point au cours de ce projet une procédure permettant de reconstituer un microbiote standard
utilisable pour des expérimentations répétables et reproductibles, s’affranchissant ainsi de la
variabilité entre les lots de viande.
Les méthodes de séquençage à haut débit, un nouveau regard sur les communautés microbiennes de la viande à destination des industriels.
L’essor des technologies de séquençage à haut débit a rendu possible l’investigation des communautés
bactériennes dans leur globalité favorisant ainsi des études d’écologie microbienne. L’utilisation de ces
approches a permis une analyse approfondie des contaminants bactériens de la viande de volaille. Elle
nous a permis de montrer la richesse et la diversité des communautés bactériennes de la viande de
poulet. Outre le fait de générer des connaissances dans la description des espèces bactériennes, les
NGS permettent également d’étudier le comportement d’un microbiote dans sa globalité. Dans notre
étude nous avons généré des connaissances sur les microbiotes de la viande de poulet conservée sous
atmosphère protectrice fournissant des résultats utiles pour la communauté scientifique mais aussi
pour les industriels de la filière. Ces méthodes permettent d’avoir un regard différent sur les
procédures mises en place en abattoir par exemple par méthode culturale pour déterminer les critères
de sécurité et la DLC des produits. Bien que ces récentes technologies soient utilisées en recherche,
nous pouvons apporter des informations et des résultats utiles et applicables aux industriels de la
viande de poulet. De nouveaux échanges sont donc possibles avec les industriels de la filière se basant
sur des données d’écologie microbienne, démystifiant ainsi l’utilisation de ces méthodes en milieu
industriel. Ces méthodes nécessitent en revanche une capacité de traitement de donnée difficilement
accessible au niveau industriel. Rien que dans le cadre de cette thèse, une quantité importante de
données a été produite. Nous avons cherché à extraire les informations les plus pertinentes pour notre

A.Rouger 2017 Discussion et perspectives
158
projet. Cependant, une analyse complémentaire devrait être réalisée pour explorer les données de
façon plus exhaustive.
Influence de l’atmosphère protectrice sur les microbiotes
Grace aux microbiotes standards développés au cours de la première partie du projet, nous avons pu
évaluer l’impact d’un facteur abiotique (MAP) sur la dynamique des communautés bactériennes de la
viande de poulet. En effet, l’utilisation d’une atmosphère gazeuse pour augmenter la DLC des produits
de volaille, est une pratique très courante en France mais dont l’utilisation par les industriels semble
assez empirique. Pour cela 2 microbiotes différents ont été reconstitués et 2 atmosphères protectrices
ont été comparées à un conditionnement sous air. La puissance des outils de NGS a permis de mettre
en avant la diversité des microbiotes de la viande de poulet. Aucune espèce bactérienne non décrite à
ce jour n’a été retrouvé parmi les dominants contrairement à ce qui a pu être observé dans d’autre cas
(Chaillou et al. 2015). Brochothrix, Carnobacterium, Pseudomonas et Shewanella sont les principaux
genres bactériens retrouvés sur des cuisses de poulet conservées sous atmosphère gazeuse modifiée.
Bien qu’il soit aisé de comprendre que les atmosphères gazeuses vont avoir un rôle de protection en
inhibant certaines espèces bactériennes, nous avons montré que la composition gazeuse de
l’atmosphère conditionne les microbiotes. Lorsque 2 microbiotes différents sont inoculés sur la viande,
après 9 jours de stockage il semble que les profils bactériens obtenus soient similaires pour une même
atmosphère modifiée utilisée est la même. L’atmosphère enrichie en O2 et CO2 semble favoriser la
dominance de Brochothrix au dépend de Carnobacterium alors que lorsque l’atmosphère est enrichie
en CO2 et N2 Carnobacterium et Brochothrix sont identifié comme les 2 communautés microbiennes
dominantes. Des espèces sous dominantes ont aussi été identifiées. Les lactobacilles par exemple ne
sont détectés que sous atmosphère protectrice anaérobie alors que les Pseudomonas le sont en
aérobiose.
L’analyse des fonctions exprimées par ces microbiotes a montré que la composition de l’atmosphère
protectrice influence également l’activité des espèces sous dominantes. Nous avons vu en effet que le
fait d’appliquer une atmosphère modifiée n’entraine que très peu la surexpression de gènes, mais
entraine la sous expression de beaucoup plus de gènes. Ce résultat semble montrer un ralentissement
général du métabolisme au sein des communautés microbiennes, menant sans doute une altération
plus lente du produit, en accord avec les observations empiriques des industriels sur la durée de vie de
leurs produits. Nous avons également montré que les espèces sous dominantes telles que les

A.Rouger 2017 Discussion et perspectives
159
lactobacilles en anaérobiose pouvaient être très actives. Dans un même temps, les espèces
dominantes telles que B. thermosphacta semblent être bien adaptées à l’écosystème de la viande
puisque peu ou pas de fonctions sont exprimées de manière différentielle suivant les conditions de
stockage. Il est donc important de noter l’intérêt des communautés microbiennes minoritaires et de
ne pas focaliser les recherches uniquement sur les espèces dominantes. Cela nécessite donc
d’investiguer un peu plus les flores minoritaires qui dans notre exemple n’avait pas été détectées par
pyroséquençage par exemple.
La viande de poulet, un verrou scientifique lors des extractions d’acides nucléiques bactériens ?
L’utilisation de ces méthodes de séquençage à haut débit a nécessité l’extraction d’acides nucléiques
bactériens à partir de viande de volaille. Malgré une mise au point du protocole de collecte des
bactéries et de l’optimisation des étapes d’extraction, les ADN bactériens de seulement 10 des 23 lots
de viande de poulet ont pu être isolés et amplifiés (chapitre2). Lors des extractions d’ARN et ADN dans
le cadre du challenge test utilisé dans le chapitre 4, des difficultés ont également été soulevées. Ces
difficultés ont permis de répondre à un appel à projet visant à lever des verrous scientifiques proposé
par le RFI (Food for tomorrow- Région Pays de la Loire) en avril 2016. Ce projet de 6 mois, nommé
Extraction of Nucléique Acid BottlEneck in poultry meat a été financé (Annexe 3). Les principaux
objectifs de ce projet ont été d’identifier des échantillons dits « négatifs » dont les acides nucléiques
ne peuvent être extraits en qualité ou en quantité suffisantes pour une utilisation NGS, afin d’identifier
la cause de ce biais d’extraction (accessibilité des bactéries, présence d’inhibiteurs de PCR ou de
nucléases). Enfin, un protocole a été mis au point pour favoriser l’extraction d’acides nucléiques et leur
utilisation à partir d’une matrice viande de poulet.
Elucider le rôle de chacune des espèces du microbiote dans le phénomène l’altération
Bien que des espèces identifiées comme sous dominantes et cependant actives au sein du microbiote,
comme L. sakei ou L. fuchuensis aient déjà été décrites dans la littérature dans des produits carnés
altérés, il est difficile de préciser quels rôles ces espèces pourraient avoir sur la viande de volaille. Nous
avons vu que certaines voies métaboliques sont exprimées témoignant de l’utilisation de certains
sucres ou d’acides aminés. Il faudrait alors approfondir les expérimentations en ciblant ces espèces
afin de comprendre les interactions qui peuvent résider au sein des microbiotes. L’intérêt de notre
microbiote standard permet de reproduire des expériences pour valider la présence de ces sous

A.Rouger 2017 Discussion et perspectives
160
dominants et de mieux comprendre l’importance de leurs métabolisme au sein de l’écosystème. Dans
un écosystème aussi riche en nutriments que les produits carnés, les capacités à utiliser un substrat
joue un rôle très important pour la compétition inter espèces et donc, dans la dynamique des
communautés microbiennes. Les différentes voies métaboliques mises en œuvre successivement suite
à la production ou l’utilisation des substrats par les micro-organismes, conditionnent ainsi le devenir
des communautés bactériennes au cours de véritables successions écologiques. Ces expérimentations
pourraient également être combinées à des analyses sensorielles afin d’identifier si une ou plusieurs
espèces peuvent conduire à la production de composés colorés ou odorants par exemple. Cela
nécessiterait également d’améliorer la définition des critères d’altération. En effet, aujourd’hui, pour
les découpes de volailles, aucun critère sensoriel ne sert de marqueur du phénomène. En industrie, la
DLC est fixée après évaluation de la charge bactérienne totale et des bactéries lactiques déterminées
par méthodes culturales. Une formule applicable à ces résultats permet de fixer un seuil et de fixer un
délai de consommation assurant une qualité optimal et la sécurité du produit. Suite à nos travaux et
en approfondissant les hypothèses relevées, l’expression ou la présence d’une espèce bactérienne en
particulier, détectable par un gène cible (biomarqueur) par exemple pourrait permettre d’identifier
l’altération d’un produit. En combinant des approches de séquençage à haut débit et des tests
sensoriels, on pourrait savoir si la présence et le développement d’espèces, telles que des lactobacilles
au dépend de Carnobacterium ou de B. thermosphacta, favorisent ou inhibent l’altération du produit.
A terme des outils simples de détection de certaines espèces cibles pourraient être utilisés en industrie
afin de déterminer la possibilité d’altération de certains lots de viande par exemple.
Pour conclure,
Nous avons généré au cours de ce projet des informations descriptives des microbiotes de viande de
poulet et nous avons commencé à comprendre les mécanismes d’adaptation des bactéries à certaines
conditions de stockage, permettant de mieux caractériser et donc à long terme de mieux comprendre
l’altération de la viande. Des approches de bio préservation pour lutter contre altération en maitrisant
les communautés bactériennes pourraient alors être envisagées en modifiant des facteurs biotiques
ou abiotiques, favorables au développement de « bonnes » bactéries naturellement présentes sur la
viande. Un modèle comme celui développé dans ce travail de thèse serait pour cela très utile, mais les
contaminations de la viande de volaille devraient également être maitrisées très en amont de la chaine
de production, depuis l’animal jusqu’à l’aliment.

A.Rouger 2017 Valorisation des travaux de thèse
161
Valorisation des travaux de thèse
Articles dans des journaux scientifiques internationaux à comité de lecture
• Rouger A., Remenant B., Prévost H., Zagorec M., (2017), A method to isolate bacterial
communities and characterize ecosystems from food products:Validation and utilization in a
reproducible chicken meat model. International Journal of Food Microbiology 247 (2017) 38–
47
• Rouger A., Moriceau N., Prévost H., Remenant B., Zagorec M., Diversity of bacterial
communities in French chicken cuts stored under modified atmosphere packaging. Soumis dans
Food Microbiology (FM_2017_102).
• Rouger A., Tresse O., Zagorec M., Bacterial contamination occurring on poultry meat: A review,
Soumis dans Food Microbiology (FM_2017_316).
• Rouger A., Hultman J., Moriceau N., Björkroth J., Zagorec M., Optimizing storage parameter to
manage chicken meat ecosystem stored under modified atmosphere packaging, en
preparation
Article de vulgarisation scientifique
• Macé S., Rouger A., Haddad N., Zagorec M., Tresse O., 2014. Viabilité de Campylobacter en
fonction du stress oxydant et de la flore endogène des aliments, Rapport bibliographique à
destination du pôle de compétitivité Valorial.
• Présentation du sujet de thèse dans le cadre de la formation « vulgarisation scientifique » de
l’école doctorale, 2 articles « Plus redoutable que la salmonellose » et « Comprendre pour
mieux combattre » parus dans le e-journal de l’ED Biologie santé N°2, octobre 2014.
• Participation à la rédaction d’un encart présentant les travaux de l’unité de recherche dans le
dossier de presse de INRA "Volailles: les chercheurs veillent au grain" à destination du grand
public.

A.Rouger 2017 Valorisation des travaux de thèse
162
Communications en congrès internationnaux
Présentation orales
• Rouger A., Remenant B, Prévost H, Zagorec M, Deciphering bacterial diversity and ecological
interactions on poultry meat to improve food quality and safety. XXII European Symposium on
the Quality of Poultry Meat, 2015, Nantes (France)
• Rouger A., Hultman J, Remenant B, Prévost H, Björkroth J, Zagorec M, Bacterial communities’
dynamics and interactions during poultry meat storage to improve food quality and safety. 3rd
International Conference on Microbial Diversity: The challenge of Complexity, 2015, Perugia
(Italie)
Award: FEMS Young Scientists Meeting Grant
• Rouger A., Hultman J., Remenant B., Prévost H., Björkroth J., Zagorec M., Understanding
bacterial community dynamics to improve the quality of poultry meat during refrigerated
storage. 25th International ICFMH Conference – FoodMicro, 2016, Dublin (Irlande)
Award: Best oral communication of Young investigator to the profession of food microbiology
and hygiene by ICFMH
• Zagorec M., Rouger A., Hultman J., Remenant B., Prévost H., Björkroth J., Microbial
communities of poultry meat and their behavior during storage. SIBAL 2016 Internationnal
symposium on Lactic Acid Bacteria, 2016, San Miguel de Tucuman (Argentina)
Posters
• Rouger A., Remenant B, Prévost H, Zagorec M, Deciphering bacterial diversity and ecological
interactions on poultry meat to improve food quality and safety. 24th International ICFMH
Conference – FoodMicro, 2014, Nantes (France)
• Rouger A., Remenant B, Prévost H, Zagorec M, Constitution of a microbial model ecosystem of
poultry meat. XXII European Symposium on the Quality of Poultry Meat, 2015, Nantes (France)
• Rouger A., Remenant B, Prévost H, Zagorec M, Understanding diversity of bacterial
communities from poultry meat to improve food quality and safety. 6th Congress of European
Microbiologists (FEMS), 2015, Maastricht (The Netherlands)

A.Rouger 2017 Valorisation des travaux de thèse
163
Communications en congrès nationaux
Présentation orales
• Rouger A., Remenant B, Prévost H, Zagorec M, Description de la diversité des communautés
bactériennes de la viande de volaille pour améliorer la qualité et la sécurité. 20ème colloque du
Club des Bactéries Lactiques, 2015, Lille (France)
• Rouger A., Remenant B, Prévost H, Zagorec M, Description de la diversité bactérienne
présente sur la viande de volaille afin d’augmenter la qualité et la sécurité des aliments.
Journées scientifiques de l’école doctorale VENAM, 2015, Angers (France)
Posters
• Rouger A., Remenant B, Prévost H, Zagorec M, Etude des interactions bactériennes dans
l’écosystème des découpes de volaille. Journées scientifiques de l’école doctorale VENAM,
2013, Le Mans (France)
• Rouger A., Remenant B, Prévost H, Zagorec M, Caractérisation de l’écosystème microbien de
viande de volaille. Congrès National de la Société Française de Microbiologie, 2014, Paris,
(France)
• Rouger A., Remenant B, Prévost H, Zagorec M, Description de la diversité bactérienne présente
sur la viande de volaille afin d’augmenter la qualité et la sécurité des aliments. Journées
Recherche Industrie Microbiologie : Management des Ressources Microbiennes, 2014,
Narbonne (France)

A.Rouger 2017 Valorisation des travaux de thèse
164

A.Rouger 2017 Annexe 1 Differentially expressed genes
165
Annexe 1 Differentially expressed genes
Differentially expressed genes up-regulated in EA condition.
EA_descriptions ec number Descriptions
1 BN424_CARNOBACTERIUM_MALTAROMATICUM_RS00940_|_allantoinase_|_219647:221014_Reverse 3.5.2.5 Allantoine/purine degradation
2 BN424_CARNOBACTERIUM_MALTAROMATICUM_RS08115_|_Zn-dependent_hydrolase_|_1772010:1773248_Reverse 3.5.3.9 Allantoine/purine degradation allC
3 BN424_CARNOBACTERIUM_MALTAROMATICUM_RS08090_|_ureidoglycolate_dehydrogenase_|_1767281:1768330_Reverse 1.1.1.154 Allantoine/purine degradation AllD
4 BN424_CARNOBACTERIUM_MALTAROMATICUM_RS08095_|_ureidoglycolate_dehydrogenase_|_1768441:1769499_Reverse 1.1.1.154 Allantoine/purine degradation AllD
5 BN424_CARNOBACTERIUM_MALTAROMATICUM_RS04470_|_cysteine_desulfurase_SufS_subfamily_protein_|_1014935:1016173_Forward 2.8.1.7 biosynthesis of iron-sulfur clusters, thio-nucleosides in tRNA
6 BN424_CARNOBACTERIUM_MALTAROMATICUM_RS05880_|_fecCD_transport_family_protein_|_1309965:1310930_Forward Iron/heme Transport
7 BN424_CARNOBACTERIUM_MALTAROMATICUM_RS14375_|_fecCD_transport_family_protein_|_3056718:3057725_Reverse Transport fer?
Iron/heme Transport
8 BN424_CARNOBACTERIUM_MALTAROMATICUM_RS14380_|_heme_ABC_transporter_substrate-binding_protein_IsdE_|_3057715:3058617_Reverse
Iron/heme Transport
9 BN424_CARNOBACTERIUM_MALTAROMATICUM_RS14385_|_sortase_B_cell_surface_sorting_signal_domain-containing_protein_|_3058686:3060827_Reverse
Iron/heme Transport
10 BN424_CARNOBACTERIUM_MALTAROMATICUM_RS14390_|_heme_uptake_protein_IsdC_|_3061082:3061732_Reverse Iron/heme Transport
11 BN424_CARNOBACTERIUM_MALTAROMATICUM_RS14560_|_periplasmic-binding_family_protein_|_3110149:3111105_Reverse Iron/heme Transport
12 BN424_CARNOBACTERIUM_MALTAROMATICUM_RS14565_|_fecCD_transport_family_protein_|_3111133:3112137_Reverse Iron/heme Transport
13 BN424_CARNOBACTERIUM_MALTAROMATICUM_RS14575_|_fecE_|_ABC_transporter_family_protein_|_3113253:3114035_Reverse Iron/heme Transport
14 BN424_CARNOBACTERIUM_MALTAROMATICUM_RS00240_|_glpK_|_glycerol_kinase_|_57269:58777_Forward Glycerol 2.7.1.30 glycolysis
15 BN424_CARNOBACTERIUM_MALTAROMATICUM_RS00245_|_alpha-glycerophosphate_oxidase_|_58810:60639_Forward 1.1.3.21 glycolysis
16 BN424_CARNOBACTERIUM_MALTAROMATICUM_RS09680_|_superoxide_dismutase_|_2076272:2076880_Reverse 1.15.1.1 oxidative stress
17 BN424_CARNOBACTERIUM_MALTAROMATICUM_RS13460_|_Organic_hydroperoxide_resistance_protein_2_|_2855479:2855916_Forward 1.11.1.15 oxidative stress
18 BN424_CARNOBACTERIUM_MALTAROMATICUM_RS04735_|_ferredoxin--NADP(+)_reductase_|_1073913:1074905_Reverse 1.18.1.2 Redox
19 BN424_CARNOBACTERIUM_MALTAROMATICUM_RS07240_|_nitroreductase_|_1589851:1590450_Forward 1.6.6.- Reductase Redox
20 BN424_CARNOBACTERIUM_MALTAROMATICUM_RS16575_|_heme-degrading_monooxygenase_IsdG_|_3498725:3499075_Forward 1.14.99.3 release Fe from heme after internalization
21 BN424_CARNOBACTERIUM_MALTAROMATICUM_RS13615_|_D-ribose_ABC_transporter_substrate-binding_protein_|_2887581:2888510_Reverse
Ribose operon
22 BN424_CARNOBACTERIUM_MALTAROMATICUM_RS13620_|_rbsC_|_2888533:2889501_Reverse Ribose operon
23 BN424_CARNOBACTERIUM_MALTAROMATICUM_RS13625_|_ABC_transporter_family_protein_|_2889504:2890985_Reverse Ribose operon
24 BN424_CARNOBACTERIUM_MALTAROMATICUM_RS13630_|_D-ribose_pyranase_|_2891093:2891488_Reverse Ribose operon
25 BN424_CARNOBACTERIUM_MALTAROMATICUM_RS13635_|_ribokinase_|_2891463:2892368_Reverse 2.7.1.15 Ribose operon
26 BN424_CARNOBACTERIUM_MALTAROMATICUM_RS13640_|_transcriptional_regulator_|_2892365:2893345_Reverse Ribose operon
27 BN424_CARNOBACTERIUM_MALTAROMATICUM_RS02550_|_gluconate_kinase_|_607876:609414_Forward 2.7.1.12 Sugar pentulose and hexulose kinases
28 BN424_CARNOBACTERIUM_MALTAROMATICUM_RS05490_|_hypothetical_protein_|_1235086:1235646_Forward Unknown
29 BN424_CARNOBACTERIUM_MALTAROMATICUM_RS05840_|_hypothetical_protein_|_1301641:1302255_Forward Unknown
30 BN424_CARNOBACTERIUM_MALTAROMATICUM_RS06275_|_hypothetical_protein_|_1393538:1393723_Forward Unknown
31 BN424_CARNOBACTERIUM_MALTAROMATICUM_RS13360_|_hypothetical_protein_|_2836248:2836730_Forward Unknown
32 BN424_CARNOBACTERIUM_MALTAROMATICUM_RS15115_|_hypothetical_protein_|_3244191:3244448_Reverse Unknown
33 BN424_CARNOBACTERIUM_MALTAROMATICUM_RS04180_|_GTPase_HflX_|_958413:959675_Reverse Unknown function
34 BN424_CARNOBACTERIUM_MALTAROMATICUM_RS04730_|_hypothetical_protein_|_1073512:1073748_Forward Unknown, adjacent Ironredoxin
35 BR52_CARNOBACTERIUM_DIVERGENS_RS03260_|_iron_ABC_transporter_ATP-binding_protein_|_653738:654496_Forward Iron/heme Transport
36 BR52_CARNOBACTERIUM_DIVERGENS_RS05415_|_heme_ABC_transporter_substrate-binding_protein_IsdE_|_1110213:1111091_Reverse Iron/heme Transport

A.Rouger 2017 Annexe 1 Differentially expressed genes
166
37 BR52_CARNOBACTERIUM_DIVERGENS_RS05420_|_hypothetical_protein_|_1111150:1113309_Reverse Iron/heme Transport
38 BR52_CARNOBACTERIUM_DIVERGENS_RS05425_|_heme_uptake_protein_IsdC_|_1113320:1113985_Reverse Iron/heme Transport
39 BR52_CARNOBACTERIUM_DIVERGENS_RS04885_|_D-ribose_ABC_transporter_substrate-binding_protein_|_994672:995604_Reverse Ribose operon
40 BR52_CARNOBACTERIUM_DIVERGENS_RS04895_|_D-ribose_transporter_ATP-binding_protein_|_996571:998052_Reverse Ribose operon
41 BR52_CARNOBACTERIUM_DIVERGENS_RS03635_|_hypothetical_protein_|_730032:730211_Forward Unknown
42 BR52_CARNOBACTERIUM_DIVERGENS_RS05405_|_hypothetical_protein_|_1108501:1109262_Reverse Unknown
43 BR52_CARNOBACTERIUM_DIVERGENS_RS10480_|_hypothetical_protein_|_2194131:2194457_Reverse Unknown
44 JCM11249_LACTOBACILLUS_FUCHUENSIS_RS02915_|_carbamate_kinase_|_16548:17477_Reverse ADI pathway
45 JCM11249_LACTOBACILLUS_FUCHUENSIS_RS02920_|_ornithine_carbamoyltransferase_|_17493:18494_Reverse ADI pathway
46 JCM11249_LACTOBACILLUS_FUCHUENSIS_RS03380_|_oxaloacetate_decarboxylase_|_39825:41225_Forward glycolysis
47 JCM11249_LACTOBACILLUS_FUCHUENSIS_RS03490_|_pyruvate_oxidase_|_60204:62039_Reverse glycolysis
48 JCM11249_LACTOBACILLUS_FUCHUENSIS_RS09495_|_lactate_oxidase_|_207:1313_Forward glycolysis
49 JCM11249_LACTOBACILLUS_FUCHUENSIS_RS02560_|_glutathione_peroxidase_|_19411:19887_Forward oxidative stress
50 JCM11249_LACTOBACILLUS_FUCHUENSIS_RS11810_|_catalase_|_8329:9770_Forward oxidative stress
51 JCM11249_LACTOBACILLUS_FUCHUENSIS_RS02830_|_tRNA_modification_GTPase_|_69621:71009_Forward Translation
52 LCA_LACTOBACILLUS_SAKEI_RS08770_|_50S_ribosomal_protein_L23_|_1735697:1735981_Reverse Translation
53 LCA_LACTOBACILLUS_SAKEI_RS09420_|_tRNA_uridine(34)_5-carboxymethylaminomethyl_synthesis_enzyme_MnmG_|_1876244:1878136_Reverse
Translation
54 PFL_PSEUDOMONAS_PROTEGENSRS13070_|_3D-(3,5/4)-trihydroxycyclohexane-1,2-dione_acylhydrolase_(decyclizing)_|_2866680:2868617_Forward
Unknown
55 Q329_BROCHOTHRIX_THERMOSPHACTA_RS0110350_|_transcriptional_regulator_|_334158:334670_Forward Iron dependent, NADH regeneration
56 Q329_BROCHOTHRIX_THERMOSPHACTA_RS0110355_|_D-ribose_ABC_transporter_substrate-binding_protein_|_334939:335856_Reverse Ribose operon
57 Q329_BROCHOTHRIX_THERMOSPHACTA_RS0110360_|_ribose_ABC_transporter_permease_|_335869:336804_Reverse Ribose operon
58 Q329_BROCHOTHRIX_THERMOSPHACTA_RS0110365_|_D-ribose_transporter_ATP-binding_protein_|_336806:338284_Reverse Ribose operon
59 Q329_BROCHOTHRIX_THERMOSPHACTA_RS0110375_|_ribokinase_|_338704:339585_Reverse 2.7.1.15 Ribose operon
60 Q329_BROCHOTHRIX_THERMOSPHACTA_RS0109085_|_aldehyde_reductase_|_87376:88548_Forward oxidative stress
61 Q329_BROCHOTHRIX_THERMOSPHACTA_RS0110325_|_sodium:dicarboxylate_symporter_|_329644:331026_Reverse proton/sodium-glutamate symport protein

A.Rouger 2017 Annexe 1 Differentially expressed genes
167
Differentially expressed genes up-regulated in UA condition.
UA_descriptions ec number remarques
1 BN424_CARNOBACTERIUM_MALTAROMATICUM_RS04895_|_methionine_adenosyltransferase_|_1090842:1092032_Forward 2.5.1.6 AA degradation
2 BN424_CARNOBACTERIUM_MALTAROMATICUM_RS08065_|_carbamate_kinase_|_1762191:1763132_Reverse 2.7.2.2 allantoine/arginine degradation/carbamate kinase
3 BN424_CARNOBACTERIUM_MALTAROMATICUM_RS08115_|_Zn-dependent_hydrolase_|_1772010:1773248_Reverse 3.5.3.9 Allantoine/purine degradation allC
4 BN424_CARNOBACTERIUM_MALTAROMATICUM_RS08100_|_hypothetical_protein_|_1769545:1770330_Reverse 3.5.3.- Allantoine/purine degradation allE
5 BN424_CARNOBACTERIUM_MALTAROMATICUM_RS02735_|_642717:643205_Forward Amino acid permease family protein
6 BN424_CARNOBACTERIUM_MALTAROMATICUM_RS11940_|_alpha-glycosidase_|_2542681:2544459_Reverse 3.2.1.- bbmA
7 BN424_CARNOBACTERIUM_MALTAROMATICUM_RS05845_|_cobalt_transport_protein_|_1302514:1302975_Forward cobalt Transport
8 BN424_CARNOBACTERIUM_MALTAROMATICUM_RS09305_|_DeoR_family_transcriptional_regulator_|_2003950:2004702_Forward
COG1349 Transcriptional regulators of sugar metabolism
9 BN424_CARNOBACTERIUM_MALTAROMATICUM_RS00240_|_glpK_|_glycerol_kinase_|_57269:58777_Forward 2.7.1.30 glycolysis
10 BN424_CARNOBACTERIUM_MALTAROMATICUM_RS00245_|_alpha-glycerophosphate_oxidase_|_58810:60639_Forward 1.1.3.21 glycolysis
11 BN424_CARNOBACTERIUM_MALTAROMATICUM_RS00250_|_glycerol_transporter_|_60891:61607_Forward glycolysis
12 BN424_CARNOBACTERIUM_MALTAROMATICUM_RS11910_|_beta-phosphoglucomutase_|_2534635:2535295_Reverse 5.4.2.6 glycolysis (maltose)
13 BN424_CARNOBACTERIUM_MALTAROMATICUM_RS13360_|_hypothetical_protein_|_2836248:2836730_Forward hypothetical
14 BN424_CARNOBACTERIUM_MALTAROMATICUM_RS05840_|_hypothetical_protein_|_1301641:1302255_Forward Hypothetical membrane protein
15 BN424_CARNOBACTERIUM_MALTAROMATICUM_RS05850_|_ABC_transporter_family_protein_|_1303121:1304602_Forward Iron/heme Transport
16 BN424_CARNOBACTERIUM_MALTAROMATICUM_RS05880_|_fecCD_transport_family_protein_|_1309965:1310930_Forward Iron/heme Transport
17 BN424_CARNOBACTERIUM_MALTAROMATICUM_RS05885_|_ABC_transporter_family_protein_|_1310934:1311692_Forward Iron/heme Transport
18 BN424_CARNOBACTERIUM_MALTAROMATICUM_RS05890_|_ABC_transporter_substrate-binding_protein_|_1311724:1312686_Forward
Iron/heme Transport
19 BN424_CARNOBACTERIUM_MALTAROMATICUM_RS07950_|_fecCD_transport_family_protein_|_1736394:1737389_Reverse Iron/heme Transport
20 BN424_CARNOBACTERIUM_MALTAROMATICUM_RS14375_|_fecCD_transport_family_protein_|_3056718:3057725_Reverse Iron/heme Transport
21 BN424_CARNOBACTERIUM_MALTAROMATICUM_RS14380_|_heme_ABC_transporter_substrate-binding_protein_IsdE_|_3057715:3058617_Reverse
Iron/heme Transport
22 BN424_CARNOBACTERIUM_MALTAROMATICUM_RS14385_|_sortase_B_cell_surface_sorting_signal_domain-containing_protein_|_3058686:3060827_Reverse
Iron/heme Transport
23 BN424_CARNOBACTERIUM_MALTAROMATICUM_RS14390_|_heme_uptake_protein_IsdC_|_3061082:3061732_Reverse Iron/heme Transport
24 BN424_CARNOBACTERIUM_MALTAROMATICUM_RS14560_|_periplasmic-binding_family_protein_|_3110149:3111105_Reverse Iron/heme Transport
25 BN424_CARNOBACTERIUM_MALTAROMATICUM_RS14565_|_fecCD_transport_family_protein_|_3111133:3112137_Reverse Iron/heme Transport
26 BN424_CARNOBACTERIUM_MALTAROMATICUM_RS11580_|_DNA_helicase_UvrD_|_2471406:2473698_Reverse isdC heme?
27 BN424_CARNOBACTERIUM_MALTAROMATICUM_RS08105_|_sugar_(and_other)_transporter_family_protein_|_1770427:1771683_Reverse
Major facilitator family transporter
28 BN424_CARNOBACTERIUM_MALTAROMATICUM_RS11925_|_sugar_ABC_transporter_permease_|_2538522:2539373_Reverse malD
29 BN424_CARNOBACTERIUM_MALTAROMATICUM_RS11930_|_binding--dependent_transport_system_inner_membrane_component_family_protein_|_2539375:2540679_Reverse
malE
30 BN424_CARNOBACTERIUM_MALTAROMATICUM_RS11945_|_oligo-1,6-glucosidase_|_2544472:2546169_Reverse 3.2.1.10 malL
31 BN424_CARNOBACTERIUM_MALTAROMATICUM_RS11935_|_maltodextrin-binding_protein_mdxE_|_2540973:2542241_Reverse mdxE
32 BN424_CARNOBACTERIUM_MALTAROMATICUM_RS08095_|_ureidoglycolate_dehydrogenase_|_1768441:1769499_Reverse 1.1.1.154 OxydoReductase/Allantoine/purine degradation allD
33 BN424_CARNOBACTERIUM_MALTAROMATICUM_RS06695_|_energy-coupled_thiamine_transporter_ThiT_|_1485986:1486540_Forward
probable thiamine trnasporter
34 BN424_CARNOBACTERIUM_MALTAROMATICUM_RS12170_|_PTS_lactose_transporter_subunit_IIC_|_2589974:2591224_Reverse 2.7.1.69 PTS lactose
35 BN424_CARNOBACTERIUM_MALTAROMATICUM_RS15270_|_transcriptional_regulator_|_3279819:3280250_Reverse putative regulator upstream from an oxidoreductase
36 BN424_CARNOBACTERIUM_MALTAROMATICUM_RS04735_|_ferredoxin--NADP(+)_reductase_|_1073913:1074905_Reverse 1.18.1.2 Redox
37 BN424_CARNOBACTERIUM_MALTAROMATICUM_RS07960_|_pyridine_nucleotide-disulfide_oxidoreductase_|_1738420:1739475_Reverse
1.8.1.9 redox
38 BN424_CARNOBACTERIUM_MALTAROMATICUM_RS16550_|_nitroreductase_|_3493135:3493719_Forward Redox
39 BN424_CARNOBACTERIUM_MALTAROMATICUM_RS04215_|_NADH_dehydrogenase_|_965870:967075_Forward 1.6.99.3 Redox Fe-S
40 BN424_CARNOBACTERIUM_MALTAROMATICUM_RS16575_|_heme-degrading_monooxygenase_IsdG_|_3498725:3499075_Forward
1.14.99.3 release Fe from heme after internalization
41 BN424_CARNOBACTERIUM_MALTAROMATICUM_RS13615_|_D-ribose_ABC_transporter_substrate-binding_protein_|_2887581:2888510_Reverse
Ribose operon
42 BN424_CARNOBACTERIUM_MALTAROMATICUM_RS13620_|_rbsC_|_2888533:2889501_Reverse Ribose operon

A.Rouger 2017 Annexe 1 Differentially expressed genes
168
43 BN424_CARNOBACTERIUM_MALTAROMATICUM_RS13625_|_ABC_transporter_family_protein_|_2889504:2890985_Reverse Ribose operon
44 BN424_CARNOBACTERIUM_MALTAROMATICUM_RS13630_|_D-ribose_pyranase_|_2891093:2891488_Reverse Ribose operon
45 BN424_CARNOBACTERIUM_MALTAROMATICUM_RS13635_|_ribokinase_|_2891463:2892368_Reverse Ribose operon
46 BN424_CARNOBACTERIUM_MALTAROMATICUM_RS13640_|_transcriptional_regulator_|_2892365:2893345_Reverse Ribose operon
47 BN424_CARNOBACTERIUM_MALTAROMATICUM_RS05490_|_hypothetical_protein_|_1235086:1235646_Forward unknown
48 BN424_CARNOBACTERIUM_MALTAROMATICUM_RS14370_|_SrtB_family_sortase_|_3056000:3056743_Reverse unknown but conserved
49 BR52_CARNOBACTERIUM_DIVERGENS_RS10480_|_hypothetical_protein_|_2194131:2194457_Reverse hypothetical
50 BR52_CARNOBACTERIUM_DIVERGENS_RS03205_|_ABC_transporter_permease_|_643498:644574_Forward Iron/heme Transport
51 BR52_CARNOBACTERIUM_DIVERGENS_RS03210_|_hemin_ABC_transporter_ATP-binding_protein_|_644578:645249_Forward Iron/heme Transport
52 BR52_CARNOBACTERIUM_DIVERGENS_RS05405_|_hypothetical_protein_|_1108501:1109262_Reverse Iron/heme Transport
53 BR52_CARNOBACTERIUM_DIVERGENS_RS05410_|_ABC_transporter_permease_|_1109249:1110223_Reverse Iron/heme Transport
54 BR52_CARNOBACTERIUM_DIVERGENS_RS05415_|_heme_ABC_transporter_substrate-binding_protein_IsdE_|_1110213:1111091_Reverse
Iron/heme Transport
55 BR52_CARNOBACTERIUM_DIVERGENS_RS05420_|_hypothetical_protein_|_1111150:1113309_Reverse Iron/heme Transport
56 BR52_CARNOBACTERIUM_DIVERGENS_RS05425_|_heme_uptake_protein_IsdC_|_1113320:1113985_Reverse Iron/heme Transport
57 BR52_CARNOBACTERIUM_DIVERGENS_RS06500_|_MFS_transporter_|_1328162:1329595_Reverse Major Facilitator Superfamily
58 BR52_CARNOBACTERIUM_DIVERGENS_RS09060_|_PTS_beta-glucoside_transporter_subunit_EIIBCA_|_1873685:1875574_Reverse 2.7.1.191 PTS beta glucoside EIIABC
59 BR52_CARNOBACTERIUM_DIVERGENS_RS07165_|_PTS_lactose_transporter_subunit_IIC_|_1465838:1467091_Reverse PTS cellobiose family EIIC
60 BR52_CARNOBACTERIUM_DIVERGENS_RS04895_|_D-ribose_transporter_ATP-binding_protein_|_996571:998052_Reverse Ribose operon
61 BR52_CARNOBACTERIUM_DIVERGENS_RS04910_|_999342:1000316_Reverse Ribose operon regulator interaction with HPr?
62 BR52_CARNOBACTERIUM_DIVERGENS_RS00995_|_sodium:dicarboxylate_symporter_|_209259:210653_Forward transport allantoine?
63 JCM11249_LACTOBACILLUS_FUCHUENSIS_RS01880_|_phosphoketolase_|_39208:41571_Forward 4.1.2.9 degradation vers glycolyse
64 JCM11249_LACTOBACILLUS_FUCHUENSIS_RS04280_|_NAD(FAD)-dependent_dehydrogenase_|_27141:28493_Forward Redox
65 LCA_LACTOBACILLUS_SAKEI_RS03300_|_alpha-glycerophosphate_oxidase_|_653687:655513_Forward ~glpO maltaromaticum degradation vers glycolyse
66 LCA_LACTOBACILLUS_SAKEI_RS07890_|_N-acetylglucosamine-6-phosphate_deacetylase_|_1564739:1565878_Reverse 3.5.1.25 C NAG utilisation
67 LCA_LACTOBACILLUS_SAKEI_RS02940_|_NADH_peroxidase_|_585192:586544_Forward 1.11.1.1 catalase replace
68 LCA_LACTOBACILLUS_SAKEI_RS02630_|_2-amino-3-ketobutyrate_CoA_ligase_|_527761:528948_Forward 2.3.1.29 degradation threonine
69 LCA_LACTOBACILLUS_SAKEI_RS09415_|_ABC_transporter_ATP-binding_protein_|_1874495:1876119_Reverse drug resistance ABC transporter ATPase
70 LCA_LACTOBACILLUS_SAKEI_RS03305_|_glycerol_transporter_|_655538:656257_Forward 1.1.3.21 glpF degradation vers glycolyse
71 LCA_LACTOBACILLUS_SAKEI_RS00135_|_hypothetical_protein_|_26675:27040_Forward hypothetical
72 LCA_LACTOBACILLUS_SAKEI_RS01915_|_ferrichrome_ABC_transporter_substrate-binding_protein_|_408363:409286_Reverse Iron transport
73 LCA_LACTOBACILLUS_SAKEI_RS02635_|_UDP-glucose_4-epimerase_|_528968:529915_Forward 1.1.1.103 L-threonine dehydrogenase
74 LCA_LACTOBACILLUS_SAKEI_RS00150_|_2,5-diketo-D-gluconic_acid_reductase_|_29633:30484_Reverse 1.1.1.274 oxydo reductase
75 LCA_LACTOBACILLUS_SAKEI_RS00760_|_peptidase_|_155691:157391_Reverse Putative Bifunctional glycolsyltransferase
76 LCA_LACTOBACILLUS_SAKEI_RS05395_|_dihydrolipoyl_dehydrogenase_|_1075805:1077211_Reverse 1.8.1.4 redox
77 LCA_LACTOBACILLUS_SAKEI_RS05605_|_F0F1_ATP_synthase_subunit_epsilon_|_1113647:1114081_Reverse 3.6.3.14 redox
78 LCA_LACTOBACILLUS_SAKEI_RS05925_|_pyruvate_oxidase_|_1170993:1172828_Forward 1.2.3.3 redox
79 LCA_LACTOBACILLUS_SAKEI_RS06940_|_L-lactate_oxidase_|_1363470:1364576_Reverse 1.13.12.4 redox
80 LCA_LACTOBACILLUS_SAKEI_RS04710_|_ribonucleoside-diphosphate_reductase_subunit_alpha_|_927727:929898_Reverse 1.17.4.1 reductase fe
81 LCA_LACTOBACILLUS_SAKEI_RS00930_|_ribose_transporter_RbsU_|_193092:193976_Forward Ribose operon
82 LCA_LACTOBACILLUS_SAKEI_RS00935_|_D-ribose_pyranase_|_193997:194392_Forward Ribose operon
83 LCA_LACTOBACILLUS_SAKEI_RS00940_|_ribokinase_|_194412:195320_Forward Ribose operon
84 LCA_LACTOBACILLUS_SAKEI_RS05220_|_obgE_|_GTPase_ObgE_|_1037400:1038692_Reverse ribosome-associating GTP binding protein putatively involved in stress
85 LCA_LACTOBACILLUS_SAKEI_RS01885_|_thiol_reductase_thioredoxin_|_403233:403544_Forward stress oxydant
86 LCA_LACTOBACILLUS_SAKEI_RS09425_|_tRNA_uridine(34)_5-carboxymethylaminomethyl_synthesis_GTPase_MnmE_|_1878167:1879555_Reverse
translation
87 LCA_LACTOBACILLUS_SAKEI_RS09450_|_rnpA_|_ribonuclease_P_protein_component_|_1883731:1884093_Reverse 3.1.26.5 translation
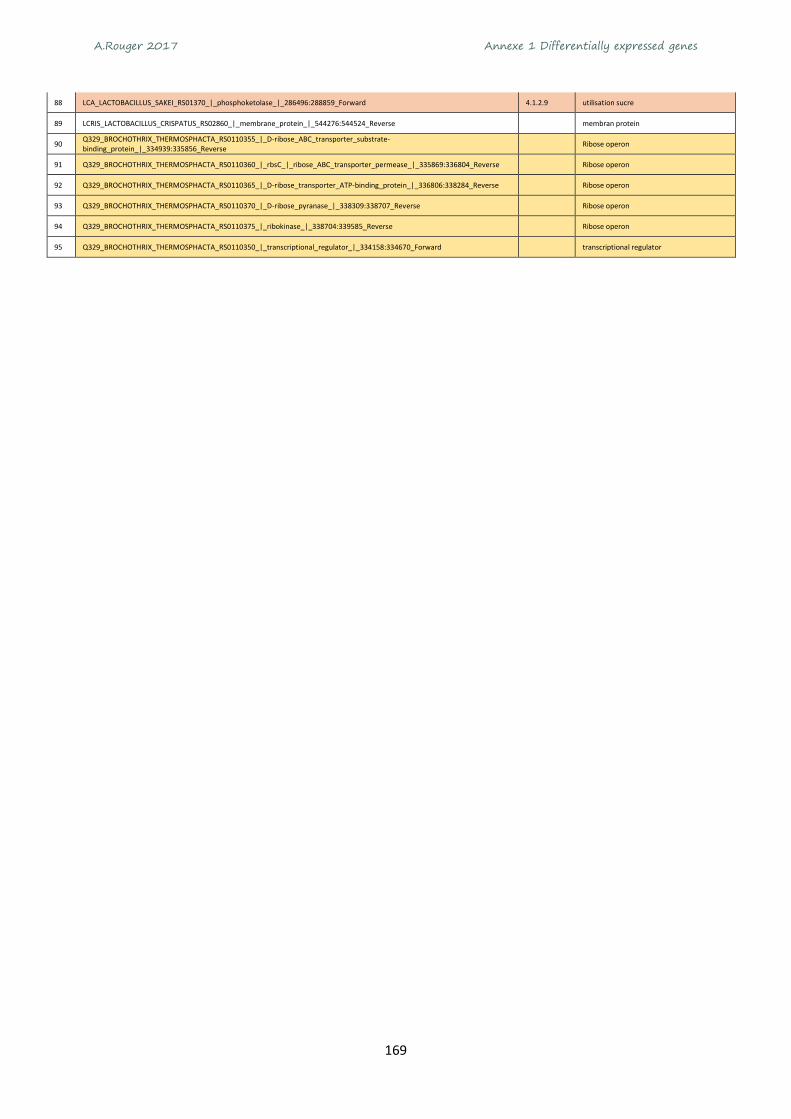
A.Rouger 2017 Annexe 1 Differentially expressed genes
169
88 LCA_LACTOBACILLUS_SAKEI_RS01370_|_phosphoketolase_|_286496:288859_Forward 4.1.2.9 utilisation sucre
89 LCRIS_LACTOBACILLUS_CRISPATUS_RS02860_|_membrane_protein_|_544276:544524_Reverse membran protein
90 Q329_BROCHOTHRIX_THERMOSPHACTA_RS0110355_|_D-ribose_ABC_transporter_substrate-binding_protein_|_334939:335856_Reverse
Ribose operon
91 Q329_BROCHOTHRIX_THERMOSPHACTA_RS0110360_|_rbsC_|_ribose_ABC_transporter_permease_|_335869:336804_Reverse Ribose operon
92 Q329_BROCHOTHRIX_THERMOSPHACTA_RS0110365_|_D-ribose_transporter_ATP-binding_protein_|_336806:338284_Reverse Ribose operon
93 Q329_BROCHOTHRIX_THERMOSPHACTA_RS0110370_|_D-ribose_pyranase_|_338309:338707_Reverse Ribose operon
94 Q329_BROCHOTHRIX_THERMOSPHACTA_RS0110375_|_ribokinase_|_338704:339585_Reverse Ribose operon
95 Q329_BROCHOTHRIX_THERMOSPHACTA_RS0110350_|_transcriptional_regulator_|_334158:334670_Forward transcriptional regulator

A.Rouger 2017 Annexe 1 Differentially expressed genes
170
Differentially expressed genes up-regulated in EB condition.
EB_descriptions ec number remarques
1 ANAEROCOCCUS,TETRADIUS|GG666300,1_cds_EEI82594,1_549_[protein=BMC_domain_protein]_[protein_id=EEI82594,1]_[location=76391,,76801]
unknown
2 BN424_CARNOBACTERIUM_MALTAROMATICUM_RS11940_|_alpha-glycosidase_|_2542681:2544459_Reverse 3.2.1.- bbmA clivage sucres complexes
3 BN424_CARNOBACTERIUM_MALTAROMATICUM_RS12155_|_PTS_sugar_transporter_subunit_IIB_|_2588476:2588793_Reverse 2.7.1.69 celA3
4 BN424_CARNOBACTERIUM_MALTAROMATICUM_RS12170_|_PTS_lactose_transporter_subunit_IIC_|_2589974:2591224_Reverse 2.7.1.69 celB
5 BN424_CARNOBACTERIUM_MALTAROMATICUM_RS12150_|_PTS_lactose/cellobiose_specific_transporter_subunit_IIA_|_2588114:2588443_Reverse 2.7.1.69 celC
6 BN424_CARNOBACTERIUM_MALTAROMATICUM_RS13615_|_D-ribose_ABC_transporter_substrate-binding_protein_|_2887581:2888510_Reverse
Ribose operon
7 BN424_CARNOBACTERIUM_MALTAROMATICUM_RS13620_|_rbsC_|_2888533:2889501_Reverse Ribose operon
8 BN424_CARNOBACTERIUM_MALTAROMATICUM_RS13625_|_ABC_transporter_family_protein_|_2889504:2890985_Reverse
Ribose operon
9 BN424_CARNOBACTERIUM_MALTAROMATICUM_RS13635_|_ribokinase_|_2891463:2892368_Reverse 2.7.1.15 Ribose operon
10 BN424_CARNOBACTERIUM_MALTAROMATICUM_RS13640_|_transcriptional_regulator_|_2892365:2893345_Reverse
Ribose operon
11 BR52_CARNOBACTERIUM_DIVERGENS_RS06620_|_carbamate_kinase_|_1358057:1359001_Reverse 2.7.2.2 ADI pathway
12 BR52_CARNOBACTERIUM_DIVERGENS_RS06630_|_ornithine_carbamoyltransferase_|_1360590:1361606_Reverse
2.1.3.3 ADI pathway
13 BR52_CARNOBACTERIUM_DIVERGENS_RS06615_|_cyclic_nucleotide-binding_protein_|_1357075:1357776_Reverse
ADI pathwayTranscriptional regulator ArcR essential for anaerobic expression of the ADI pathway, Crp/Fnr family
14 BR52_CARNOBACTERIUM_DIVERGENS_RS08860_|_rpmE2_|_50S_ribosomal_protein_L31_|_1825395:1825658_Reverse
50S_ribosomal_protein
15 BR52_CARNOBACTERIUM_DIVERGENS_RS06635_|_arginine_deiminase_|_1361637:1362875_Reverse 3.5.3.6 ADI pathway
16 BR52_CARNOBACTERIUM_DIVERGENS_RS08350_|_cadmium_transporter_|_1718139:1720262_Reverse
3.6.3.3 Cation-transporting ATPase (P-type ATPase)
17 BR52_CARNOBACTERIUM_DIVERGENS_RS07155_|_PTS_mannose_transporter_subunit_IIA_|_1464875:1465204_Reverse
2.7.1.69 EIIA PTS (lichenan?)
18 BR52_CARNOBACTERIUM_DIVERGENS_RS10005_|_FMN-binding_protein_|_2082543:2083478_Reverse
FMN-binding_protein
19 BR52_CARNOBACTERIUM_DIVERGENS_RS10425_|_hypothetical_protein_|_2183123:2184301_Reverse
Major Facilitator Superfamily
20 BR52_CARNOBACTERIUM_DIVERGENS_RS03030_|_nucleic_acid-binding_protein_|_610663:611223_Forward
nucleic_acid-binding_protein
21 BR52_CARNOBACTERIUM_DIVERGENS_RS06640_|_guanine_permease_|_1363383:1364684_Forward pbuO hypoxanthine/guanine permease regulated by PurR
22 BR52_CARNOBACTERIUM_DIVERGENS_RS09060_|_PTS_beta-glucoside_transporter_subunit_EIIBCA_|_1873685:1875574_Reverse
PTS beta glucoside EIIABC
23 BR52_CARNOBACTERIUM_DIVERGENS_RS02840_|_bifunctional_acetaldehyde-CoA/alcohol_dehydrogenase_|_571790:574393_Forward
reductase
24 BR52_CARNOBACTERIUM_DIVERGENS_RS04885_|_D-ribose_ABC_transporter_substrate-binding_protein_|_994672:995604_Reverse
Ribose operon
25 BR52_CARNOBACTERIUM_DIVERGENS_RS04890_|_rbsC_|_ribose_ABC_transporter_permease_|_995619:996569_Reverse
Ribose operon
26 BR52_CARNOBACTERIUM_DIVERGENS_RS04895_|_D-ribose_transporter_ATP-binding_protein_|_996571:998052_Reverse
Ribose operon
27 BR52_CARNOBACTERIUM_DIVERGENS_RS04900_|_D-ribose_pyranase_|_998064:998459_Reverse Ribose operon
28 BR52_CARNOBACTERIUM_DIVERGENS_RS04905_|_ribokinase_|_998434:999339_Reverse 2.7.1.15 Ribose operon
29 BR52_CARNOBACTERIUM_DIVERGENS_RS04910_|_LacI_family_transcriptional_regulator_|_999342:1000316_Reverse
Ribose operon
30 BR52_CARNOBACTERIUM_DIVERGENS_RS11980_|_PTS_beta-glucoside_transporter_subunit_EIIBCA_|_2517893:2519845_Forward
Sucrose PTS EIIABC
31 BR52_CARNOBACTERIUM_DIVERGENS_RS03205_|_ABC_transporter_permease_|_643498:644574_Forward
Transport Fer/heme
32 BR52_CARNOBACTERIUM_DIVERGENS_RS06490_|_tRNA_(guanosine(46)-N7)-methyltransferase_TrmB_|_1326423:1327067_Reverse
EC:2.1.1.33
tRNA modification
33 BR52_CARNOBACTERIUM_DIVERGENS_RS07135_|_hypothetical_protein_|_1461890:1462111_Reverse
unknown
34 BR52_CARNOBACTERIUM_DIVERGENS_RS11135_|_gldA_|_glycerol_dehydrogenase_|_2330976:2332106_Forward
glycerol metabolism
35 GJA_Janthinobacterium agaricidamnosum_RS20030_|_gapA_|_type_I_glyceraldehyde-3-phosphate_dehydrogenase_|_4671307:4672317_Reverse glycolysis
36 IW20_FLAVOBACTERIUM_HYDATIS_RS06095_|_IW20_FLAVOBACTERIUM_HYDATIS_RS06095_|_GLPGLI_family_protein_|_363194:364102_Reverse
37 JCM11249_LACTOBACILLUS_FUCHUENSIS_RS03725_|_chorismate_mutase_|_36615:36902_Forward shikimate metabolsim dans la biosynthèse d'acides aminés aromatiques tels que la phénylalanine et la tyrosine
38 JCM11249_LACTOBACILLUS_FUCHUENSIS_RS01210_|_GTP_pyrophosphokinase_|_85690:87921_Forward 2.7.6.5
(p)ppGpp synthetase; (p)ppGpp) are involved in regulating growth and several different stress responses
39 JCM11249_LACTOBACILLUS_FUCHUENSIS_RS03600_|_L-serine_dehydratase,_iron-sulfur-dependent_subunit_beta_|_13553:14203_Forward 4Fe-4S dependent protein
40 JCM11249_LACTOBACILLUS_FUCHUENSIS_RS00605_|_5-bromo-4-chloroindolyl_phosphate_hydrolase_|_123576:124262_Forward 5-bromo-4-chloroindolyl_phosphate_hydrolase
41 JCM11249_LACTOBACILLUS_FUCHUENSIS_RS00515_|_cysteine_desulfurase_|_110214:110555_Reverse 2.8.1.7 AA (alanine) biosynthesis
42 JCM11249_LACTOBACILLUS_FUCHUENSIS_RS09330_|_peptidase_M23_|_17019:17657_Forward AA catabolism
43 JCM11249_LACTOBACILLUS_FUCHUENSIS_RS09020_|_D-alanine/D-serine/glycine_permease_|_17300:18676_Forward aa permease
44 JCM11249_LACTOBACILLUS_FUCHUENSIS_RS12090_|_aspartate_aminotransferase_|_6124:7727_Forward aa synthesis
45 JCM11249_LACTOBACILLUS_FUCHUENSIS_RS05240_|_glyA_|_serine_hydroxymethyltransferase_|_32529:33776_Forward aa synthesisvitamin B6 dependent
46 JCM11249_LACTOBACILLUS_FUCHUENSIS_RS08495_|_glutamate:protein_symporter_|_11643:12917_Forward aa transport
47 JCM11249_LACTOBACILLUS_FUCHUENSIS_RS04270_|_serine/threonine_dehydratase_|_24568:25608_Forward aa utilization

A.Rouger 2017 Annexe 1 Differentially expressed genes
171
48 JCM11249_LACTOBACILLUS_FUCHUENSIS_RS04405_|_multidrug_ABC_transporter_ATP-binding_protein_|_52536:53264_Forward ABC transporter
49 JCM11249_LACTOBACILLUS_FUCHUENSIS_RS06700_|_multidrug_ABC_transporter_ATP-binding_protein_|_41573:43513_Forward ABC transporter
50 JCM11249_LACTOBACILLUS_FUCHUENSIS_RS06965_|_multidrug_ABC_transporter_ATP-binding_protein_|_6885:8669_Reverse ABC transporter
51 JCM11249_LACTOBACILLUS_FUCHUENSIS_RS06970_|_multidrug_ABC_transporter_ATP-binding_protein_|_8670:10415_Reverse ABC transporter
52 JCM11249_LACTOBACILLUS_FUCHUENSIS_RS07230_|_ABC_transporter_|_7709:10591_Reverse ABC transporter
53 JCM11249_LACTOBACILLUS_FUCHUENSIS_RS07270_|_multidrug_ABC_transporter_ATP-binding_protein_|_17943:18812_Reverse ABC transporter
54 JCM11249_LACTOBACILLUS_FUCHUENSIS_RS02885_|_sulfate_ABC_transporter_ATP-binding_protein_|_8615:10951_Reverse ABC Transporter
55 JCM11249_LACTOBACILLUS_FUCHUENSIS_RS04445_|_bacteriocin_cleavage/export_ABC_transporter_|_5:1993_Forward ABC transporter
56 JCM11249_LACTOBACILLUS_FUCHUENSIS_RS04950_|_ABC_transporter_ATP-binding_protein_|_27138:29075_Forward ABC Transporter
57 JCM11249_LACTOBACILLUS_FUCHUENSIS_RS06385_|_phosphate_ABC_transporter_ATP-binding_protein_|_13455:14213_Forward ABC Transporter
58 JCM11249_LACTOBACILLUS_FUCHUENSIS_RS07665_|_spermidine/putrescine_ABC_transporter_substrate-binding_protein_|_20913:21980_Reverse ABC transporter
59 JCM11249_LACTOBACILLUS_FUCHUENSIS_RS04250_|_peptide_ABC_transporter_ATP-binding_protein_|_21412:22113_Forward ABC transporter
60 JCM11249_LACTOBACILLUS_FUCHUENSIS_RS08050_|_manganese_transporter_|_29567:31135_Forward ABC transporter (Mn?) Manque 1 ss u qui n'est pas surexprimée
61 JCM11249_LACTOBACILLUS_FUCHUENSIS_RS02640_|_amino_acid_ABC_transporter_permease_|_30826:31485_Forward ABC Transporter permease
62 JCM11249_LACTOBACILLUS_FUCHUENSIS_RS06130_|_ABC_transporter_permease_|_3415:5514_Reverse ABC Transporter permease
63 JCM11249_LACTOBACILLUS_FUCHUENSIS_RS00050_|_multidrug_ABC_transporter_ATP-binding_protein_|_7201:9084_Reverse ABC transporter, operon with dfrA and thyA
64 JCM11249_LACTOBACILLUS_FUCHUENSIS_RS04670_|_acetate_kinase_|_38463:39644_Forward 2.7.2.1 acetate kinase 2, purines nucleosides degradation, pyruvate degradation
65 JCM11249_LACTOBACILLUS_FUCHUENSIS_RS07045_|_acetate_kinase_|_22116:23309_Reverse 2.7.2.1 acetate kinase 2, purines nucleosides degradation, pyruvate degradation
66 JCM11249_LACTOBACILLUS_FUCHUENSIS_RS05685_|_acetolactate_synthase_|_19981:21663_Forward 2.2.1.6
acetolactate synthase, acetoin biosynthesis, potential spoilage, pyruvate degradation
67 JCM11249_LACTOBACILLUS_FUCHUENSIS_RS00240_|_acyltransferase_|_48101:50014_Reverse Acetyl transferase of unknown function
68 JCM11249_LACTOBACILLUS_FUCHUENSIS_RS11290_|_acyltransferase_|_3306:4186_Reverse Acetyl transferase of unknown function
69 JCM11249_LACTOBACILLUS_FUCHUENSIS_RS01030_|_acyl_carrier_protein_|_56247:56489_Forward Acyl carrier, lipid metabolism
70 JCM11249_LACTOBACILLUS_FUCHUENSIS_RS02140_|_glutamate/gamma-aminobutyrate_family_transporter_YjeM_|_18669:20159_Forward amino acid/polyamine transporter
71 JCM11249_LACTOBACILLUS_FUCHUENSIS_RS04275_|_amino_acid_permease_|_25705:27021_Forward Aminoacid permease
72 JCM11249_LACTOBACILLUS_FUCHUENSIS_RS06670_|_amino_acid_permease_|_34150:35979_Reverse Aminoacid permease
73 JCM11249_LACTOBACILLUS_FUCHUENSIS_RS02680_|_ribonucleotide_reductase_assembly_protein_NrdI_|_38518:38982_Forward Anaerobic ribonucleoside-triphosphate reductase-activating protein
74 JCM11249_LACTOBACILLUS_FUCHUENSIS_RS11400_|_ribonucleoside-triphosphate_reductase_activating_protein_|_9755:10332_Reverse Anaerobic ribonucleoside-triphosphate reductase-activating protein
75 JCM11249_LACTOBACILLUS_FUCHUENSIS_RS09705_|_pyrroline-5-carboxylate_reductase_|_8785:9594_Reverse 1.5.1.2 Arginine and proline metabolism
76 JCM11249_LACTOBACILLUS_FUCHUENSIS_RS00930_|_arginine_repressor_|_35304:35756_Forward Arginine repressor
77 JCM11249_LACTOBACILLUS_FUCHUENSIS_RS04350_|_arginine_repressor_|_40930:41403_Forward ArgR family transcriptional regulator
78 JCM11249_LACTOBACILLUS_FUCHUENSIS_RS11760_|_arsenate_reductase_|_4521:4939_Forward arsenate reductase
79 JCM11249_LACTOBACILLUS_FUCHUENSIS_RS11320_|_ATPase_|_37681:40346_Reverse ATPase
80 JCM11249_LACTOBACILLUS_FUCHUENSIS_RS11305_|_aromatic_ring-opening_dioxygenase_LigA_|_18541:20570_Reverse biosynthèse de certains acides aminés aromatiques
81 JCM11249_LACTOBACILLUS_FUCHUENSIS_RS11520_|_carboxypeptidase_|_19723:22193_Reverse catabolisme AA?
82 JCM11249_LACTOBACILLUS_FUCHUENSIS_RS11530_|_dipeptidase_PepV_|_30317:31719_Reverse catabolisme AA?
83 JCM11249_LACTOBACILLUS_FUCHUENSIS_RS00150_|_SMC-Scp_complex_subunit_ScpB_|_28437:29060_Reverse Cell division
84 JCM11249_LACTOBACILLUS_FUCHUENSIS_RS00155_|_segregation_and_condensation_protein_A_|_29044:29802_Reverse Cell division
85 JCM11249_LACTOBACILLUS_FUCHUENSIS_RS00165_|_site-specific_tyrosine_recombinase_XerD_|_30252:31136_Reverse Cell division
86 JCM11249_LACTOBACILLUS_FUCHUENSIS_RS01235_|_division/cell_wall_cluster_transcriptional_repressor_MraZ_|_89843:90274_Forward Cell division
87 JCM11249_LACTOBACILLUS_FUCHUENSIS_RS01245_|_cell_division_protein_FtsL_|_91261:91638_Forward Cell division
88 JCM11249_LACTOBACILLUS_FUCHUENSIS_RS01270_|_cell_division_protein_FtsQ_|_97284:98138_Forward Cell division
89 JCM11249_LACTOBACILLUS_FUCHUENSIS_RS01285_|_cell_division_protein_SepF_|_100863:101294_Forward Cell division
90 JCM11249_LACTOBACILLUS_FUCHUENSIS_RS01290_|_cell_division_protein_|_101295:101579_Forward Cell division
91 JCM11249_LACTOBACILLUS_FUCHUENSIS_RS02715_|_chromosome_partitioning_protein_ParB_|_43967:44842_Reverse Cell division
92 JCM11249_LACTOBACILLUS_FUCHUENSIS_RS05300_|_rod_shape-determining_protein_|_43165:44154_Forward Cell division
93 JCM11249_LACTOBACILLUS_FUCHUENSIS_RS05320_|_cell_division_protein_FtsW_|_44985:46184_Forward Cell division
94 JCM11249_LACTOBACILLUS_FUCHUENSIS_RS06340_|_cell_division_ATP-binding_protein_FtsE_|_4587:5273_Forward Cell division
95 JCM11249_LACTOBACILLUS_FUCHUENSIS_RS06345_|_cell_division_protein_FtsX_|_5263:6150_Forward Cell division
96 JCM11249_LACTOBACILLUS_FUCHUENSIS_RS07820_|_septation_inhibitor_protein_|_12855:13526_Reverse Cell division
97 JCM11249_LACTOBACILLUS_FUCHUENSIS_RS07825_|_rod_shape-determining_protein_MreD_|_13543:14073_Reverse Cell division
98 JCM11249_LACTOBACILLUS_FUCHUENSIS_RS09055_|_cell_division_protein_FtsK_|_5102:7453_Reverse cell division

A.Rouger 2017 Annexe 1 Differentially expressed genes
172
99 JCM11249_LACTOBACILLUS_FUCHUENSIS_RS09370_|_septum_formation_initiator_family_protein_|_8596:8994_Forward cell division
100 JCM11249_LACTOBACILLUS_FUCHUENSIS_RS09390_|_cell_division_protein_FtsH_|_11704:13815_Forward cell division
101 JCM11249_LACTOBACILLUS_FUCHUENSIS_RS11655_|_cell_division_inhibitor_MinD_|_12059:12852_Reverse cell division
102 JCM11249_LACTOBACILLUS_FUCHUENSIS_RS11660_|_rod_shape-determining_protein_MreC_|_14075:14934_Reverse cell division
103 JCM11249_LACTOBACILLUS_FUCHUENSIS_RS12050_|_cell_division_protein_FtsI_|_2944:5054_Forward cell division
104 JCM11249_LACTOBACILLUS_FUCHUENSIS_RS09740_|_chloride_channel_protein_|_768:1979_Reverse cell division
105 JCM11249_LACTOBACILLUS_FUCHUENSIS_RS07365_|_flippase_|_4203:5612_Reverse Cell division?
106 JCM11249_LACTOBACILLUS_FUCHUENSIS_RS10710_|_fibronectin-binding_protein_|_60864:62578_Reverse cell surface, adhesion
107 JCM11249_LACTOBACILLUS_FUCHUENSIS_RS11975_|_UDP-N-acetylmuramoyl-tripeptide--D-alanyl-D-_alanine_ligase_|_5863:7229_Forward cell wall
108 JCM11249_LACTOBACILLUS_FUCHUENSIS_RS01795_|_aspartate_racemase_|_19860:20570_Forward 5.1.1.13 Cell wall biogenesis/degradation
109 JCM11249_LACTOBACILLUS_FUCHUENSIS_RS01255_|_phospho-N-acetylmuramoyl-pentapeptide-_transferase_|_93801:94763_Forward Cell Wall biosynthesis
110 JCM11249_LACTOBACILLUS_FUCHUENSIS_RS09210_|_UDP-N-acetylglucosamine_1-carboxyvinyltransferase_|_15709:16968_Forward Cell wall biosynthesis
111 JCM11249_LACTOBACILLUS_FUCHUENSIS_RS01835_|_UDP-N-acetylmuramoyl-L-alanyl-D-glutamate--2,_6-diaminopimelate_ligase_|_28593:30137_Forward Cell Wall biosynthesis?
112 JCM11249_LACTOBACILLUS_FUCHUENSIS_RS00735_|_UDP-N-acetylmuramate--L-alanine_ligase_|_174:1508_Forward Cell wall synthesis
113 JCM11249_LACTOBACILLUS_FUCHUENSIS_RS03685_|_pilus_assembly_protein_HicB_|_29808:30134_Reverse Cell Wall synthesis
114 JCM11249_LACTOBACILLUS_FUCHUENSIS_RS03820_|_54303:55691_Forward Cell Wall synthesis
115 JCM11249_LACTOBACILLUS_FUCHUENSIS_RS05210_|_UDP-N-acetylmuramyl_peptide_synthase_|_26911:28260_Reverse Cell Wall synthesis
116 JCM11249_LACTOBACILLUS_FUCHUENSIS_RS07345_|_UTP--glucose-1-phosphate_uridylyltransferase_|_694:1578_Reverse Cell Wall synthesis
117 JCM11249_LACTOBACILLUS_FUCHUENSIS_RS07385_|_dTDP-glucose_4,6-dehydratase_|_7782:8810_Reverse Cell Wall synthesis
118 JCM11249_LACTOBACILLUS_FUCHUENSIS_RS07390_|_dTDP-4-dehydrorhamnose_3,5-epimerase_|_8829:9410_Reverse Cell Wall synthesis
119 JCM11249_LACTOBACILLUS_FUCHUENSIS_RS07435_|_exopolysaccharide_biosynthesis_protein_|_17138:17881_Reverse Cell Wall synthesis
120 JCM11249_LACTOBACILLUS_FUCHUENSIS_RS07790_|_N-acetylmuramoyl-L-alanine_amidase_|_6707:8035_Forward Cell wall synthesis
121 JCM11249_LACTOBACILLUS_FUCHUENSIS_RS08345_|_D-alanine--D-alanine_ligase_|_4993:6045_Reverse Cell wall synthesis
122 JCM11249_LACTOBACILLUS_FUCHUENSIS_RS08765_|_N-acetylmuramoyl-L-alanine_amidase_|_12122:14080_Reverse cell wall synthesis
123 JCM11249_LACTOBACILLUS_FUCHUENSIS_RS10655_|_murD_|_UDP-N-acetylmuramoyl-L-alanyl-D-glutamate_synthetase_|_94779:96148_Forward cell wall synthesis
124 JCM11249_LACTOBACILLUS_FUCHUENSIS_RS09935_|_D-alanyl-lipoteichoic_acid_biosynthesis_protein_DltD_|_5780:7048_Reverse cell wall synthesis?
125 JCM11249_LACTOBACILLUS_FUCHUENSIS_RS09940_|_D-alanine--poly(phosphoribitol)_ligase_subunit_2_|_7050:7286_Reverse cell wall synthesis?
126 JCM11249_LACTOBACILLUS_FUCHUENSIS_RS10140_|_undecaprenyl-phosphate_alpha-N-acetylglucosaminyl_1-phosphate_transferase_|_3294:4388_Forward cell wall synthesis?
127 JCM11249_LACTOBACILLUS_FUCHUENSIS_RS10825_|_N-acetylglucosamine-6-phosphate_deacetylase_|_40051:41195_Forward cell wall?
128 JCM11249_LACTOBACILLUS_FUCHUENSIS_RS11560_|_UDP-glucose_4-epimerase_|_15288:16279_Forward cell wall?
129 JCM11249_LACTOBACILLUS_FUCHUENSIS_RS09460_|_alanine_racemase_|_9906:11057_Forward cell well synthesis
130 JCM11249_LACTOBACILLUS_FUCHUENSIS_RS04305_|_SorC_family_transcriptional_regulator_|_30627:31664_Forward CggR transcriptional regulator of gapA
131 JCM11249_LACTOBACILLUS_FUCHUENSIS_RS06905_|_peptidyl-prolyl_cis-trans_isomerase_|_41991:42575_Forward 5.2.1.8 Chaperoning folding
132 JCM11249_LACTOBACILLUS_FUCHUENSIS_RS00440_|_def_|_peptide_deformylase_|_91398:91952_Forward 3.5.1.88
cleaves off formyl group from N-terminal methionine residues of newly synthesized proteins; binds Fe2+
133 JCM11249_LACTOBACILLUS_FUCHUENSIS_RS06495_|_ATP-dependent_Clp_protease_proteolytic_subunit_|_36203:36787_Reverse ClpP protease, adaptation to atypical conditions
134 JCM11249_LACTOBACILLUS_FUCHUENSIS_RS04590_|_carboxysome_structural_protein_EutM_|_26397:26690_Forward
CoA-dependent aldehyde dehydrogenase synthesis coenzyme B12-dependent pathway of ethanolamine degradation
135 JCM11249_LACTOBACILLUS_FUCHUENSIS_RS04630_|_carboxysome_structural_protein_EutM_|_33049:33324_Forward
CoA-dependent aldehyde dehydrogenase synthesis coenzyme B12-dependent pathway of ethanolamine degradation
136 JCM11249_LACTOBACILLUS_FUCHUENSIS_RS04645_|_ethanolamine_utilization_protein_EutN_|_34528:34803_Forward
CoA-dependent aldehyde dehydrogenase synthesis coenzyme B12-dependent pathway of ethanolamine degradation
137 JCM11249_LACTOBACILLUS_FUCHUENSIS_RS04660_|_aldehyde_dehydrogenase_EutE_|_35868:37289_Forward 1.2.1.10
CoA-dependent aldehyde dehydrogenase synthesis coenzyme B12-dependent pathway of ethanolamine degradation
138 JCM11249_LACTOBACILLUS_FUCHUENSIS_RS04665_|_alcohol_dehydrogenase_|_37311:38429_Forward
CoA-dependent aldehyde dehydrogenase synthesis coenzyme B12-dependent pathway of ethanolamine degradation
139 JCM11249_LACTOBACILLUS_FUCHUENSIS_RS11170_|_ethanolamine_utilization_protein_EutP_|_40226:40654_Forward
CoA-dependent aldehyde dehydrogenase synthesis coenzyme B12-dependent pathway of ethanolamine degradation
140 JCM11249_LACTOBACILLUS_FUCHUENSIS_RS04650_|_ATP--cobalamin_adenosyltransferase_|_34815:35393_Forward cobalamin metabolism
141 JCM11249_LACTOBACILLUS_FUCHUENSIS_RS00565_|_cobalamin_biosynthesis_protein_CbiM_|_118270:119277_Forward cobalamin_biosynthesis_protein_CbiM
142 JCM11249_LACTOBACILLUS_FUCHUENSIS_RS00365_|_coaD_|_pantetheine-phosphate_adenylyltransferase_|_77045:77539_Reverse 2.7.7.3 coenzyme A biosynthesis
143 JCM11249_LACTOBACILLUS_FUCHUENSIS_RS04045_|_type_I_pantothenate_kinase_|_33167:34096_Reverse 2.7.1.33 coenzyme A synthesis
144 JCM11249_LACTOBACILLUS_FUCHUENSIS_RS00055_|_hypothetical_protein_|_9197:9658_Reverse Conserved protein of unknown function in operon with dfrA and thyA
145 JCM11249_LACTOBACILLUS_FUCHUENSIS_RS08320_|_cyclopropane-fatty-acyl-phospholipid_synthase_|_1379:2566_Reverse 2.1.1.79 cyclopropane-fatty-acyl-phospholipid synthase
146 JCM11249_LACTOBACILLUS_FUCHUENSIS_RS00790_|_glpK_|_glycerol_kinase_|_9289:10806_Forward 2.7.1.30 degradation vers glycolyse
147 JCM11249_LACTOBACILLUS_FUCHUENSIS_RS10765_|_adhP_|_zinc-dependent_alcohol_dehydrogenase_|_54662:55588_Forward
dehydrogenases catalyze the opposite reaction as part of fermentation to ensure a constant supply of NAD+
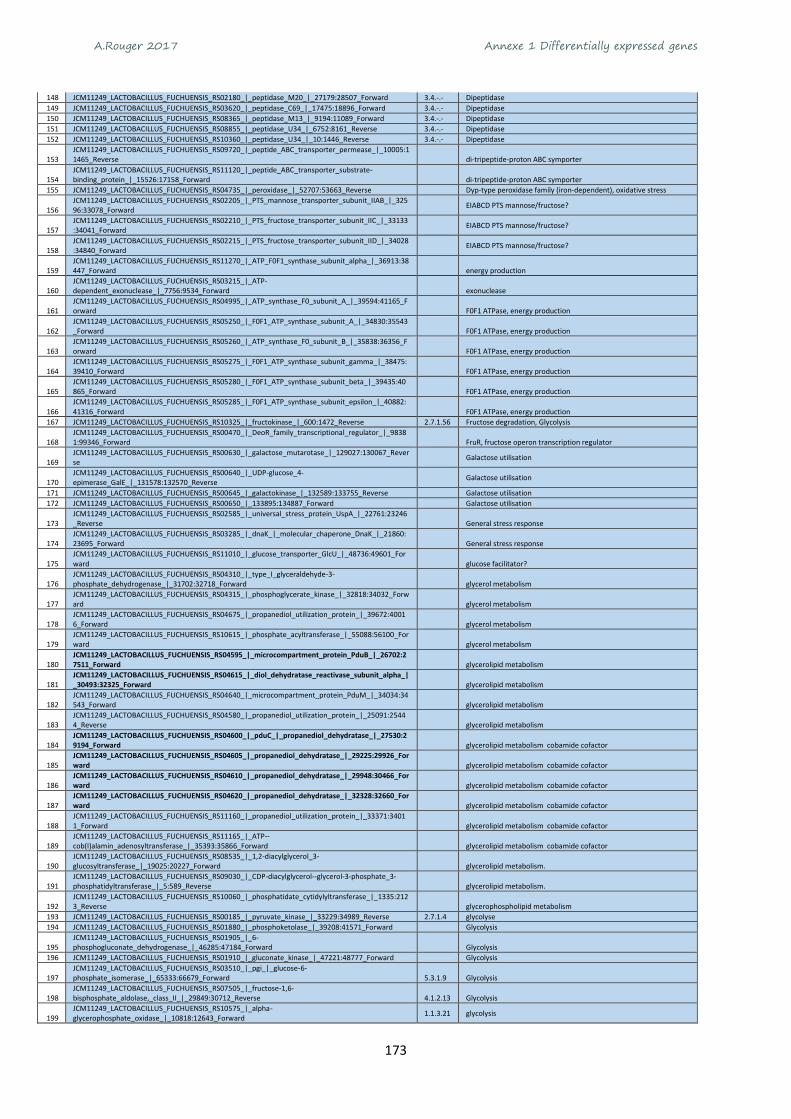
A.Rouger 2017 Annexe 1 Differentially expressed genes
173
148 JCM11249_LACTOBACILLUS_FUCHUENSIS_RS02180_|_peptidase_M20_|_27179:28507_Forward 3.4.-.- Dipeptidase
149 JCM11249_LACTOBACILLUS_FUCHUENSIS_RS03620_|_peptidase_C69_|_17475:18896_Forward 3.4.-.- Dipeptidase
150 JCM11249_LACTOBACILLUS_FUCHUENSIS_RS08365_|_peptidase_M13_|_9194:11089_Forward 3.4.-.- Dipeptidase
151 JCM11249_LACTOBACILLUS_FUCHUENSIS_RS08855_|_peptidase_U34_|_6752:8161_Reverse 3.4.-.- Dipeptidase
152 JCM11249_LACTOBACILLUS_FUCHUENSIS_RS10360_|_peptidase_U34_|_10:1446_Reverse 3.4.-.- Dipeptidase
153 JCM11249_LACTOBACILLUS_FUCHUENSIS_RS09720_|_peptide_ABC_transporter_permease_|_10005:11465_Reverse di-tripeptide-proton ABC symporter
154 JCM11249_LACTOBACILLUS_FUCHUENSIS_RS11120_|_peptide_ABC_transporter_substrate-binding_protein_|_15526:17158_Forward di-tripeptide-proton ABC symporter
155 JCM11249_LACTOBACILLUS_FUCHUENSIS_RS04735_|_peroxidase_|_52707:53663_Reverse Dyp-type peroxidase family (iron-dependent), oxidative stress
156 JCM11249_LACTOBACILLUS_FUCHUENSIS_RS02205_|_PTS_mannose_transporter_subunit_IIAB_|_32596:33078_Forward
EIABCD PTS mannose/fructose?
157 JCM11249_LACTOBACILLUS_FUCHUENSIS_RS02210_|_PTS_fructose_transporter_subunit_IIC_|_33133:34041_Forward
EIABCD PTS mannose/fructose?
158 JCM11249_LACTOBACILLUS_FUCHUENSIS_RS02215_|_PTS_fructose_transporter_subunit_IID_|_34028:34840_Forward
EIABCD PTS mannose/fructose?
159 JCM11249_LACTOBACILLUS_FUCHUENSIS_RS11270_|_ATP_F0F1_synthase_subunit_alpha_|_36913:38447_Forward energy production
160 JCM11249_LACTOBACILLUS_FUCHUENSIS_RS03215_|_ATP-dependent_exonuclease_|_7756:9534_Forward exonuclease
161 JCM11249_LACTOBACILLUS_FUCHUENSIS_RS04995_|_ATP_synthase_F0_subunit_A_|_39594:41165_Forward F0F1 ATPase, energy production
162 JCM11249_LACTOBACILLUS_FUCHUENSIS_RS05250_|_F0F1_ATP_synthase_subunit_A_|_34830:35543_Forward F0F1 ATPase, energy production
163 JCM11249_LACTOBACILLUS_FUCHUENSIS_RS05260_|_ATP_synthase_F0_subunit_B_|_35838:36356_Forward F0F1 ATPase, energy production
164 JCM11249_LACTOBACILLUS_FUCHUENSIS_RS05275_|_F0F1_ATP_synthase_subunit_gamma_|_38475:39410_Forward F0F1 ATPase, energy production
165 JCM11249_LACTOBACILLUS_FUCHUENSIS_RS05280_|_F0F1_ATP_synthase_subunit_beta_|_39435:40865_Forward F0F1 ATPase, energy production
166 JCM11249_LACTOBACILLUS_FUCHUENSIS_RS05285_|_F0F1_ATP_synthase_subunit_epsilon_|_40882:41316_Forward F0F1 ATPase, energy production
167 JCM11249_LACTOBACILLUS_FUCHUENSIS_RS10325_|_fructokinase_|_600:1472_Reverse 2.7.1.56 Fructose degradation, Glycolysis
168 JCM11249_LACTOBACILLUS_FUCHUENSIS_RS00470_|_DeoR_family_transcriptional_regulator_|_98381:99346_Forward FruR, fructose operon transcription regulator
169 JCM11249_LACTOBACILLUS_FUCHUENSIS_RS00630_|_galactose_mutarotase_|_129027:130067_Reverse
Galactose utilisation
170 JCM11249_LACTOBACILLUS_FUCHUENSIS_RS00640_|_UDP-glucose_4-epimerase_GalE_|_131578:132570_Reverse
Galactose utilisation
171 JCM11249_LACTOBACILLUS_FUCHUENSIS_RS00645_|_galactokinase_|_132589:133755_Reverse Galactose utilisation
172 JCM11249_LACTOBACILLUS_FUCHUENSIS_RS00650_|_133895:134887_Forward Galactose utilisation
173 JCM11249_LACTOBACILLUS_FUCHUENSIS_RS02585_|_universal_stress_protein_UspA_|_22761:23246_Reverse General stress response
174 JCM11249_LACTOBACILLUS_FUCHUENSIS_RS03285_|_dnaK_|_molecular_chaperone_DnaK_|_21860:23695_Forward General stress response
175 JCM11249_LACTOBACILLUS_FUCHUENSIS_RS11010_|_glucose_transporter_GlcU_|_48736:49601_Forward glucose facilitator?
176 JCM11249_LACTOBACILLUS_FUCHUENSIS_RS04310_|_type_I_glyceraldehyde-3-phosphate_dehydrogenase_|_31702:32718_Forward glycerol metabolism
177 JCM11249_LACTOBACILLUS_FUCHUENSIS_RS04315_|_phosphoglycerate_kinase_|_32818:34032_Forward glycerol metabolism
178 JCM11249_LACTOBACILLUS_FUCHUENSIS_RS04675_|_propanediol_utilization_protein_|_39672:40016_Forward glycerol metabolism
179 JCM11249_LACTOBACILLUS_FUCHUENSIS_RS10615_|_phosphate_acyltransferase_|_55088:56100_Forward glycerol metabolism
180 JCM11249_LACTOBACILLUS_FUCHUENSIS_RS04595_|_microcompartment_protein_PduB_|_26702:27511_Forward glycerolipid metabolism
181 JCM11249_LACTOBACILLUS_FUCHUENSIS_RS04615_|_diol_dehydratase_reactivase_subunit_alpha_|_30493:32325_Forward glycerolipid metabolism
182 JCM11249_LACTOBACILLUS_FUCHUENSIS_RS04640_|_microcompartment_protein_PduM_|_34034:34543_Forward glycerolipid metabolism
183 JCM11249_LACTOBACILLUS_FUCHUENSIS_RS04580_|_propanediol_utilization_protein_|_25091:25444_Reverse glycerolipid metabolism
184 JCM11249_LACTOBACILLUS_FUCHUENSIS_RS04600_|_pduC_|_propanediol_dehydratase_|_27530:29194_Forward glycerolipid metabolism cobamide cofactor
185 JCM11249_LACTOBACILLUS_FUCHUENSIS_RS04605_|_propanediol_dehydratase_|_29225:29926_Forward glycerolipid metabolism cobamide cofactor
186 JCM11249_LACTOBACILLUS_FUCHUENSIS_RS04610_|_propanediol_dehydratase_|_29948:30466_Forward glycerolipid metabolism cobamide cofactor
187 JCM11249_LACTOBACILLUS_FUCHUENSIS_RS04620_|_propanediol_dehydratase_|_32328:32660_Forward glycerolipid metabolism cobamide cofactor
188 JCM11249_LACTOBACILLUS_FUCHUENSIS_RS11160_|_propanediol_utilization_protein_|_33371:34011_Forward glycerolipid metabolism cobamide cofactor
189 JCM11249_LACTOBACILLUS_FUCHUENSIS_RS11165_|_ATP--cob(I)alamin_adenosyltransferase_|_35393:35866_Forward glycerolipid metabolism cobamide cofactor
190 JCM11249_LACTOBACILLUS_FUCHUENSIS_RS08535_|_1,2-diacylglycerol_3-glucosyltransferase_|_19025:20227_Forward glycerolipid metabolism.
191 JCM11249_LACTOBACILLUS_FUCHUENSIS_RS09030_|_CDP-diacylglycerol--glycerol-3-phosphate_3-phosphatidyltransferase_|_5:589_Reverse glycerolipid metabolism.
192 JCM11249_LACTOBACILLUS_FUCHUENSIS_RS10060_|_phosphatidate_cytidylyltransferase_|_1335:2123_Reverse glycerophospholipid metabolism
193 JCM11249_LACTOBACILLUS_FUCHUENSIS_RS00185_|_pyruvate_kinase_|_33229:34989_Reverse 2.7.1.4 glycolyse
194 JCM11249_LACTOBACILLUS_FUCHUENSIS_RS01880_|_phosphoketolase_|_39208:41571_Forward Glycolysis
195 JCM11249_LACTOBACILLUS_FUCHUENSIS_RS01905_|_6-phosphogluconate_dehydrogenase_|_46285:47184_Forward Glycolysis
196 JCM11249_LACTOBACILLUS_FUCHUENSIS_RS01910_|_gluconate_kinase_|_47221:48777_Forward Glycolysis
197 JCM11249_LACTOBACILLUS_FUCHUENSIS_RS03510_|_pgi_|_glucose-6-phosphate_isomerase_|_65333:66679_Forward 5.3.1.9 Glycolysis
198 JCM11249_LACTOBACILLUS_FUCHUENSIS_RS07505_|_fructose-1,6-bisphosphate_aldolase,_class_II_|_29849:30712_Reverse 4.1.2.13 Glycolysis
199 JCM11249_LACTOBACILLUS_FUCHUENSIS_RS10575_|_alpha-glycerophosphate_oxidase_|_10818:12643_Forward
1.1.3.21 glycolysis

A.Rouger 2017 Annexe 1 Differentially expressed genes
174
200 JCM11249_LACTOBACILLUS_FUCHUENSIS_RS05680_|_aldose_epimerase_|_18937:19812_Forward glycolysis
201 JCM11249_LACTOBACILLUS_FUCHUENSIS_RS03490_|_pyruvate_oxidase_|_60204:62039_Reverse 1.2.3.3 Glycolysis end products, Pyruvate + phosphate + O(2) <=> acetyl phosphate + CO(2) + H(2)O(2)
202 JCM11249_LACTOBACILLUS_FUCHUENSIS_RS00490_|_phosphoglycerate_mutase_|_103856:104515_Reverse 5.4.2.1 Glycolysis heterolactic fermentation
203 JCM11249_LACTOBACILLUS_FUCHUENSIS_RS10740_|_phosphoglycerate_mutase_|_20583:21256_Forward 5.4.2.1 Glycolysis heterolactic fermentation
204 JCM11249_LACTOBACILLUS_FUCHUENSIS_RS04075_|_fructose_2,6-bisphosphatase_|_40154:40810_Forward 5.4.2.1
Glycolysis heterolactic fermentation or gluconeogenesis (il y en a 5 dans le génome de 23K)
205 JCM11249_LACTOBACILLUS_FUCHUENSIS_RS01900_|_transcriptional_regulator_|_45291:46133_Reverse Glycolysis regulator?
206 JCM11249_LACTOBACILLUS_FUCHUENSIS_RS02240_|_agaS_|_tagatose-6-phosphate_ketose_isomerase_|_38846:40015_Forward Glycolysis voie du tagatose
207 JCM11249_LACTOBACILLUS_FUCHUENSIS_RS02250_|_tagatose-bisphosphate_aldolase_|_41220:42206_Forward Glycolysis voie du tagatose (galactose non PTS)
208 JCM11249_LACTOBACILLUS_FUCHUENSIS_RS09345_|_L-lactate_dehydrogenase_|_687:1664_Reverse 1.1.1.27 Glycolysis/fermentation
209 JCM11249_LACTOBACILLUS_FUCHUENSIS_RS11980_|_HAD_family_hydrolase_|_3925:4454_Forward HAD_family_hydrolase
210 JCM11249_LACTOBACILLUS_FUCHUENSIS_RS11985_|_HAD_family_hydrolase_|_6571:7172_Forward HAD_family_hydrolase
211 JCM11249_LACTOBACILLUS_FUCHUENSIS_RS10985_|_coproporphyrinogen_III_oxidase_|_18138:19275_Forward
1.3.99.22 heme biosynthesis (voie incomplete)
212 JCM11249_LACTOBACILLUS_FUCHUENSIS_RS02660_|_hemolysin_|_34503:35858_Forward hemolysinC family Mg(2+)/Co(2+) transport protein
213 JCM11249_LACTOBACILLUS_FUCHUENSIS_RS06595_|_glucose-6-phosphate_dehydrogenase_|_15513:17006_Reverse 1.1.1.49 Heterolactic fermentation, pentose phosphate pathway
214 JCM11249_LACTOBACILLUS_FUCHUENSIS_RS03035_|_serine_protease_|_41422:42684_Reverse 3.4.21.- HtrA, degradation of protein resistance to stress
215 JCM11249_LACTOBACILLUS_FUCHUENSIS_RS00190_|_6-phosphofructokinase_|_35067:36026_Reverse 2.7.1.11 http://www.genome.jp/kegg-bin/show_pathway?map00030
216 JCM11249_LACTOBACILLUS_FUCHUENSIS_RS00045_|_thymidylate_synthase_|_6229:7179_Reverse 2.1.1.45 http://www.genome.jp/kegg-bin/show_pathway?map00670 dUMP en dTMP thyA
217 JCM11249_LACTOBACILLUS_FUCHUENSIS_RS00765_|_X-Pro_dipeptidyl-peptidase_|_4090:6504_Reverse
3.4.14.11
Hydrolyzes Xaa-Pro-|- bonds to release unblocked, N-terminal dipeptides
218 JCM11249_LACTOBACILLUS_FUCHUENSIS_RS00120_|_peptidoglycan-binding_protein_LysM_|_23299:23958_Reverse Hypothetical cell surface protein
219 JCM11249_LACTOBACILLUS_FUCHUENSIS_RS00610_|_tellurite_resistance_protein_TelA_|_124246:125451_Forward Hypothetical, toxic anion resistance
220 JCM11249_LACTOBACILLUS_FUCHUENSIS_RS00545_|_114411:115214_Reverse lactate_racemization_operon_protein
221 JCM11249_LACTOBACILLUS_FUCHUENSIS_RS06425_|_glycerol-3-phosphate_dehydrogenase_|_20087:21109_Forward 1.1.1.94 Lipid biosynthesis, oxidoreductase
222 JCM11249_LACTOBACILLUS_FUCHUENSIS_RS05420_|_lipid_kinase_|_12306:13331_Reverse lipid kinase
223 JCM11249_LACTOBACILLUS_FUCHUENSIS_RS06420_|_prolipoprotein_diacylglyceryl_transferase_|_19232:20068_Forward 2.4.99.-
Lipoprotein (cell surface) biosynthesis prolipoprotein diacylglyceryl transferase
224 JCM11249_LACTOBACILLUS_FUCHUENSIS_RS05715_|_diacylglycerol_kinase_|_24943:25344_Forward 2.7.1.107 Lipoteichoic acid production (cell wall synthesis)
225 JCM11249_LACTOBACILLUS_FUCHUENSIS_RS10725_|_73616:74580_Reverse LysR family transcriptional regulator, target unknown
226 JCM11249_LACTOBACILLUS_FUCHUENSIS_RS04715_|_membrane_protein_|_48093:48788_Forward membrane protein
227 JCM11249_LACTOBACILLUS_FUCHUENSIS_RS06350_|_membrane_protein_|_6320:7456_Forward membrane protein
228 JCM11249_LACTOBACILLUS_FUCHUENSIS_RS06790_|_mechanosensitive_ion_channel_protein_MscS_|_14977:15864_Reverse membrane protein
229 JCM11249_LACTOBACILLUS_FUCHUENSIS_RS06600_|_Cro/Cl_family_transcriptional_regulator_|_17037:17684_Reverse Metal-dependent transcriptional regulator
230 JCM11249_LACTOBACILLUS_FUCHUENSIS_RS11990_|_SAM-dependent_methyltransferase_|_7542:8272_Forward methyl transferase of unknown function
231 JCM11249_LACTOBACILLUS_FUCHUENSIS_RS06265_|_hydroxymethylglutaryl-CoA_synthase_|_35173:36354_Reverse
mevalonate degradation (vers acetoacetate), mais autre enzyme 4.1.3.4 n'est pas surexprimée
232 JCM11249_LACTOBACILLUS_FUCHUENSIS_RS06270_|_hydroxymethylglutaryl-CoA_reductase,_degradative_|_36369:37637_Reverse 1.1.1.88
mevalonate degradation (vers acetoacetate), mais autre enzyme 4.1.3.4 n'est pas surexprimée
233 JCM11249_LACTOBACILLUS_FUCHUENSIS_RS06695_|_redox-sensing_transcriptional_repressor_Rex_|_40726:41376_Reverse
modulates transcription in response to the NADH/NAD(+) redox state, regulates cydAB in B. subtilis
234 JCM11249_LACTOBACILLUS_FUCHUENSIS_RS00900_|_N_utilization_substance_protein_B_|_30474:30905_Forward N_utilization_substance_protein_B
235 JCM11249_LACTOBACILLUS_FUCHUENSIS_RS09690_|_N-acetylglucosamine-6-phosphate_deacetylase_|_5895:7034_Reverse 3.5.1.25 N-acetyl glucosamine degradation (PTS sugar) vers glycolysis
236 JCM11249_LACTOBACILLUS_FUCHUENSIS_RS05915_|_isochorismatase_|_19783:20337_Reverse 3.5.1.19 NAD salvage, Metabolism of coenzymes and prosthetic groups, Nicotinamide + H(2)O <=> nicotinate + NH(3)
237 JCM11249_LACTOBACILLUS_FUCHUENSIS_RS09535_|_nadD_|_nicotinate-nicotinamide_nucleotide_adenylyltransferase_|_5937:6578_Forward nicotinate and nicotinamide metabolism.
238 JCM11249_LACTOBACILLUS_FUCHUENSIS_RS11325_|_NAD_synthetase_|_40957:41791_Reverse nicotinate and nicotinamide metabolism.
239 JCM11249_LACTOBACILLUS_FUCHUENSIS_RS07875_|_aminotransferase_V_|_24838:25986_Reverse 2.8.1.7 NifS/IcsS protein homolog, AA (alanine) biosynthesis
240 JCM11249_LACTOBACILLUS_FUCHUENSIS_RS00295_|_nucleotide_pyrophosphohydrolase_|_62169:62462_Reverse nucleotide_pyrophosphohydrolase
241 JCM11249_LACTOBACILLUS_FUCHUENSIS_RS10750_|_oligopeptidase_PepB_|_33596:35400_Reverse oligopeptidase
242 JCM11249_LACTOBACILLUS_FUCHUENSIS_RS08290_|_D-ribose_ABC_transporter_substrate-binding_protein_|_24107:25063_Forward operon ribose
243 JCM11249_LACTOBACILLUS_FUCHUENSIS_RS08295_|_ribokinase_|_25139:26047_Forward operon ribose
244 JCM11249_LACTOBACILLUS_FUCHUENSIS_RS08300_|_26162:27166_Forward operon ribose
245 JCM11249_LACTOBACILLUS_FUCHUENSIS_RS11730_|_sugar_ABC_transporter_permease_|_20810:21726_Forward Operon ribose
246 JCM11249_LACTOBACILLUS_FUCHUENSIS_RS11750_|_D-ribose_transporter_ATP-binding_protein_|_21635:23125_Forward operon ribose
247 JCM11249_LACTOBACILLUS_FUCHUENSIS_RS02530_|_2-Cys_peroxiredoxin_|_14825:15319_Forward Oxidative stress response?
248 JCM11249_LACTOBACILLUS_FUCHUENSIS_RS09965_|_FMN_reductase_|_1784:3010_Reverse oxidative stress?
249 JCM11249_LACTOBACILLUS_FUCHUENSIS_RS07360_|_NAD(P)-dependent_oxidoreductase_|_3358:4200_Reverse oxidoreductase
250 JCM11249_LACTOBACILLUS_FUCHUENSIS_RS07550_|_oxidoreductase_|_37484:38476_Reverse oxidoreductase
251 JCM11249_LACTOBACILLUS_FUCHUENSIS_RS08545_|_oxidoreductase_|_21342:22220_Forward oxidoreductase
252 JCM11249_LACTOBACILLUS_FUCHUENSIS_RS09265_|_SDR_family_oxidoreductase_|_5739:6476_Reverse oxidoreductase
253 JCM11249_LACTOBACILLUS_FUCHUENSIS_RS04280_|_NAD(FAD)-dependent_dehydrogenase_|_27141:28493_Forward oxidoreductase
254 JCM11249_LACTOBACILLUS_FUCHUENSIS_RS05215_|_NrdH-redoxin_|_28441:28755_Forward oxidoreductase
255 JCM11249_LACTOBACILLUS_FUCHUENSIS_RS05490_|_oxidoreductase_|_29989:30951_Forward oxidoreductase
256 JCM11249_LACTOBACILLUS_FUCHUENSIS_RS09515_|_alcohol_dehydrogenase_|_2799:3734_Reverse oxidoreductase

A.Rouger 2017 Annexe 1 Differentially expressed genes
175
257 JCM11249_LACTOBACILLUS_FUCHUENSIS_RS10850_|_1,3-propanediol_dehydrogenase_|_1141:2308_Forward oxidoreductase
258 JCM11249_LACTOBACILLUS_FUCHUENSIS_RS11470_|_acetaldehyde_dehydrogenase_|_18216:20809_Reverse oxidoreductase
259 JCM11249_LACTOBACILLUS_FUCHUENSIS_RS09040_|_3-oxoacyl-ACP_reductase_|_1630:2361_Reverse Oxidoreductase fatty acid synthesis
260 JCM11249_LACTOBACILLUS_FUCHUENSIS_RS07180_|_aldo/keto_reductase_|_41619:42470_Reverse oxidoreductase NADPH-dependent
261 JCM11249_LACTOBACILLUS_FUCHUENSIS_RS06300_|_xylose_isomerase_|_40935:41759_Reverse oxidoreductase xylose-> xylulose
262 JCM11249_LACTOBACILLUS_FUCHUENSIS_RS02555_|_2-dehydropantoate_2-reductase_|_18331:19269_Reverse
1.1.1.169
PanE ketopantoate reductase; catalyzes the NADPH reduction of ketopantoate to pantoate; functions in pantothenate (vitamin B5) biosynthesis
263 JCM11249_LACTOBACILLUS_FUCHUENSIS_RS02820_|_oligoendopeptidase_|_66887:68692_Forward pepF oligopeptidase
264 JCM11249_LACTOBACILLUS_FUCHUENSIS_RS07455_|_type_I_methionyl_aminopeptidase_|_21211:22005_Reverse
3.4.11.18
PepM, methionine aminopeptidase, protein modification, chaperoning
265 JCM11249_LACTOBACILLUS_FUCHUENSIS_RS01385_|_peptidase_|_17884:18360_Forward peptidase
266 JCM11249_LACTOBACILLUS_FUCHUENSIS_RS01050_|_peptide_ABC_transporter_ATP-binding_protein_|_60422:61483_Forward peptide_ABC_transporter_ATP-binding_protein
267 JCM11249_LACTOBACILLUS_FUCHUENSIS_RS08785_|_undecaprenyl-diphosphatase_|_16200:17054_Reverse peptidoglycan biosynthesis.
268 JCM11249_LACTOBACILLUS_FUCHUENSIS_RS08905_|_permease_|_14144:15598_Reverse permease
269 JCM11249_LACTOBACILLUS_FUCHUENSIS_RS00960_|_phosphopantothenoylcysteine_decarboxylase_|_39267:40469_Forward phosphopantothenoylcysteine_decarboxylase
270 JCM11249_LACTOBACILLUS_FUCHUENSIS_RS04415_|_phosphotransferase_|_54599:55384_Forward phosphorylation
271 JCM11249_LACTOBACILLUS_FUCHUENSIS_RS04365_|_carboxypeptidase_|_42822:44903_Forward polypeptide hydrolysis
272 JCM11249_LACTOBACILLUS_FUCHUENSIS_RS11630_|_spermidine/putrescine_ABC_transporter_ATP-binding_protein_|_23619:24709_Reverse potA
273 JCM11249_LACTOBACILLUS_FUCHUENSIS_RS00245_|_obgE_|_GTPase_CgtA_|_50282:51574_Reverse ppGpp-binding GTPase involved in cell partioning, DNA repair and ribosome assembly
274 JCM11249_LACTOBACILLUS_FUCHUENSIS_RS04190_|_aryl-alcohol_dehydrogenase_|_10066:11181_Reverse production aa aromatic
275 JCM11249_LACTOBACILLUS_FUCHUENSIS_RS02470_|_GTPase_HflX_|_2785:4065_Forward Protein fate or degradation
276 JCM11249_LACTOBACILLUS_FUCHUENSIS_RS10730_|_protease_|_6407:7635_Forward proteolysis
277 JCM11249_LACTOBACILLUS_FUCHUENSIS_RS05670_|_ATP-dependent_protease_subunit_HslV_|_16936:17481_Forward prtein degradation
278 JCM11249_LACTOBACILLUS_FUCHUENSIS_RS08500_|_PTS_mannose_transporter_subunit_EIIAB_|_13334:14305_Forward
PTS EIABCD mannose/sorbose/fructose family
279 JCM11249_LACTOBACILLUS_FUCHUENSIS_RS08505_|_PTS_mannose/fructose/sorbose_transporter_subunit_IIC_|_14354:15166_Forward
PTS EIABCD mannose/sorbose/fructose family
280 JCM11249_LACTOBACILLUS_FUCHUENSIS_RS08510_|_PTS_mannose_family_transporter_subunit_IID_|_15184:16095_Forward
PTS EIABCD mannose/sorbose/fructose family
281 JCM11249_LACTOBACILLUS_FUCHUENSIS_RS02175_|_PTS_sugar_transporter_subunit_IIA_|_25841:27157_Forward 2.7.1.69 PTS EIIA cellobiose
282 JCM11249_LACTOBACILLUS_FUCHUENSIS_RS07540_|_PTS_mannose_transporter_subunit_IIA_|_35529:35864_Reverse PTS EIIA mannose
283 JCM11249_LACTOBACILLUS_FUCHUENSIS_RS06705_|_PTS_sugar_transporter_subunit_IIB_|_43605:43922_Reverse 2.7.1.69 PTS EIIB cellobiose
284 JCM11249_LACTOBACILLUS_FUCHUENSIS_RS06180_|_phosphocarrier_protein_HPr_|_17192:17458_Reverse 2.7.11.- PTS general enzyme HPr, PTS sugar utilization
285 JCM11249_LACTOBACILLUS_FUCHUENSIS_RS11405_|_phosphoenolpyruvate-protein_phosphotransferase_|_15469:17192_Reverse 2.7.3.9 PTS general Enzyme I, PTS sugar utilization
286 JCM11249_LACTOBACILLUS_FUCHUENSIS_RS08395_|_PTS_N-acetylglucosamine_transporter_subunit_IIABC_|_15611:17623_Forward PTS IIABC
287 JCM11249_LACTOBACILLUS_FUCHUENSIS_RS11105_|_neopullulanase_|_51726:53470_Reverse pullulanase
288 JCM11249_LACTOBACILLUS_FUCHUENSIS_RS06525_|_nucleoside_hydrolase_|_43862:44809_Forward purine and ribose degradation
289 JCM11249_LACTOBACILLUS_FUCHUENSIS_RS05475_|_phosphoribosylaminoimidazole_carboxylase_|_26885:28003_Reverse 4.1.1.21 Purine metabolism
290 JCM11249_LACTOBACILLUS_FUCHUENSIS_RS07295_|_deoxyadenosine_kinase_|_23164:23811_Forward
2.7.1.74, 2.7.1.76 Purine metabolism, ATP + deoxyadenosine <=> ADP + dAMP
291 JCM11249_LACTOBACILLUS_FUCHUENSIS_RS09385_|_hypoxanthine_phosphoribosyltransferase_|_11070:11615_Forward 2.4.2.8
Purine metabolism, IMP + diphosphate <=> hypoxanthine + 5-phospho-alpha-D-ribose 1-diphosphate,
292 JCM11249_LACTOBACILLUS_FUCHUENSIS_RS05220_|_thymidine_kinase_|_28924:29517_Forward 2.7.1.21 Purines pyrimidines metabolism
293 JCM11249_LACTOBACILLUS_FUCHUENSIS_RS05245_|_uracil_phosphoribosyltransferase_|_33934:34563_Forward 2.4.2.9
Purines pyrimidines metabolism; Salvage pathways of pyrimidine ribonucleotides; Nucleosides and nucleotides interconversion
294 JCM11249_LACTOBACILLUS_FUCHUENSIS_RS02695_|_41087:41845_Reverse 3.1.1.1 Putative carboxyesterase
295 JCM11249_LACTOBACILLUS_FUCHUENSIS_RS05005_|_41581:42357_Forward 3.1.1.1 Putative carboxyesterase
296 JCM11249_LACTOBACILLUS_FUCHUENSIS_RS07460_|_flavodoxin_|_22261:22713_Forward Putative flavodoxin, electron transport
297 JCM11249_LACTOBACILLUS_FUCHUENSIS_RS08060_|_alpha/beta_hydrolase_|_31678:32532_Forward putative Hydrolase of the alpha/beta superfamily, unknown function
298 JCM11249_LACTOBACILLUS_FUCHUENSIS_RS03300_|_haloacid_dehalogenase_|_27017:27790_Reverse Putative hydrolase, haloacid dehalogenase family unknown function
299 JCM11249_LACTOBACILLUS_FUCHUENSIS_RS03650_|_haloacid_dehalogenase_|_22796:23638_Forward Putative hydrolase, haloacid dehalogenase family unknown function
300 JCM11249_LACTOBACILLUS_FUCHUENSIS_RS06885_|_haloacid_dehalogenase_|_38641:39426_Forward Putative hydrolase, haloacid dehalogenase family unknown function
301 JCM11249_LACTOBACILLUS_FUCHUENSIS_RS07605_|_haloacid_dehalogenase_|_8822:9709_Forward Putative hydrolase, haloacid dehalogenase family unknown function
302 JCM11249_LACTOBACILLUS_FUCHUENSIS_RS07845_|_haloacid_dehalogenase_|_16989:17612_Reverse Putative hydrolase, haloacid dehalogenase family unknown function
303 JCM11249_LACTOBACILLUS_FUCHUENSIS_RS00405_|_myo-inositol-1-monophosphatase_|_83536:84321_Reverse
3.1.3.25/ 3.1.3.-
Putative inositol monophosphatase / 5' nucleotidase (purine nucleoside monophosphate)
304 JCM11249_LACTOBACILLUS_FUCHUENSIS_RS11915_|_magnesium_transporter_|_9708:10660_Forward Putative ion Mg(2+)/Co(2+) transport protein
305 JCM11249_LACTOBACILLUS_FUCHUENSIS_RS09105_|_multidrug_MFS_transporter_|_15262:16725_Reverse
Putative phosphotransferase involved in extracellular matrix synthesis
306 JCM11249_LACTOBACILLUS_FUCHUENSIS_RS11955_|_potassium_transporter_Kup_|_14749:16775_Forward putative potassium transport system protein (kup)
307 JCM11249_LACTOBACILLUS_FUCHUENSIS_RS09045_|_zinc_protease_|_2361:3665_Reverse 3.4.24.- Putative processing protease (protein trafficking?)
308 JCM11249_LACTOBACILLUS_FUCHUENSIS_RS04065_|_prolyl_aminopeptidase_|_38106:39008_Forward 3.4.11.5 Putative proline amino peptidase
309 JCM11249_LACTOBACILLUS_FUCHUENSIS_RS10530_|_short-chain_dehydrogenase_|_46313:47121_Reverse putative protein
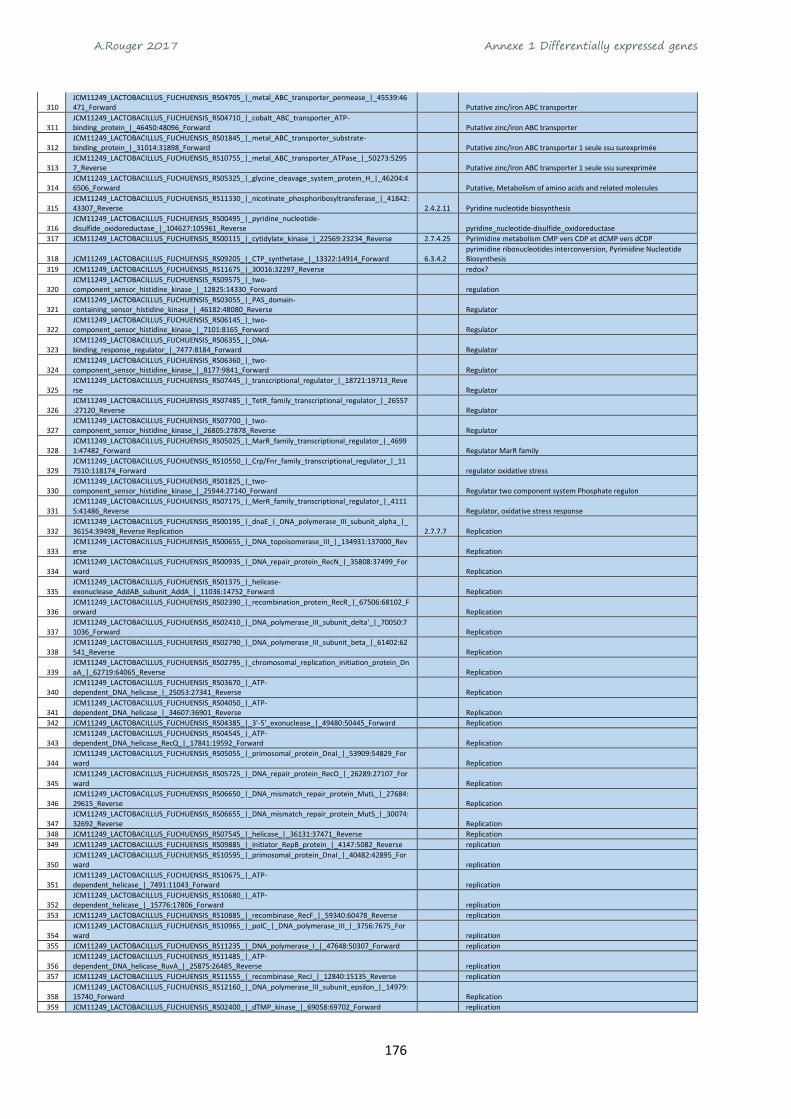
A.Rouger 2017 Annexe 1 Differentially expressed genes
176
310 JCM11249_LACTOBACILLUS_FUCHUENSIS_RS04705_|_metal_ABC_transporter_permease_|_45539:46471_Forward Putative zinc/iron ABC transporter
311 JCM11249_LACTOBACILLUS_FUCHUENSIS_RS04710_|_cobalt_ABC_transporter_ATP-binding_protein_|_46450:48096_Forward Putative zinc/iron ABC transporter
312 JCM11249_LACTOBACILLUS_FUCHUENSIS_RS01845_|_metal_ABC_transporter_substrate-binding_protein_|_31014:31898_Forward Putative zinc/iron ABC transporter 1 seule ssu surexprimée
313 JCM11249_LACTOBACILLUS_FUCHUENSIS_RS10755_|_metal_ABC_transporter_ATPase_|_50273:52957_Reverse Putative zinc/iron ABC transporter 1 seule ssu surexprimée
314 JCM11249_LACTOBACILLUS_FUCHUENSIS_RS05325_|_glycine_cleavage_system_protein_H_|_46204:46506_Forward Putative, Metabolism of amino acids and related molecules
315 JCM11249_LACTOBACILLUS_FUCHUENSIS_RS11330_|_nicotinate_phosphoribosyltransferase_|_41842:43307_Reverse 2.4.2.11 Pyridine nucleotide biosynthesis
316 JCM11249_LACTOBACILLUS_FUCHUENSIS_RS00495_|_pyridine_nucleotide-disulfide_oxidoreductase_|_104627:105961_Reverse pyridine_nucleotide-disulfide_oxidoreductase
317 JCM11249_LACTOBACILLUS_FUCHUENSIS_RS00115_|_cytidylate_kinase_|_22569:23234_Reverse 2.7.4.25 Pyrimidine metabolism CMP vers CDP et dCMP vers dCDP
318 JCM11249_LACTOBACILLUS_FUCHUENSIS_RS09205_|_CTP_synthetase_|_13322:14914_Forward 6.3.4.2 pyrimidine ribonucleotides interconversion, Pyrimidine Nucleotide Biosynthesis
319 JCM11249_LACTOBACILLUS_FUCHUENSIS_RS11675_|_30016:32297_Reverse redox?
320 JCM11249_LACTOBACILLUS_FUCHUENSIS_RS09575_|_two-component_sensor_histidine_kinase_|_12825:14330_Forward regulation
321 JCM11249_LACTOBACILLUS_FUCHUENSIS_RS03055_|_PAS_domain-containing_sensor_histidine_kinase_|_46182:48080_Reverse Regulator
322 JCM11249_LACTOBACILLUS_FUCHUENSIS_RS06145_|_two-component_sensor_histidine_kinase_|_7101:8165_Forward Regulator
323 JCM11249_LACTOBACILLUS_FUCHUENSIS_RS06355_|_DNA-binding_response_regulator_|_7477:8184_Forward Regulator
324 JCM11249_LACTOBACILLUS_FUCHUENSIS_RS06360_|_two-component_sensor_histidine_kinase_|_8177:9841_Forward Regulator
325 JCM11249_LACTOBACILLUS_FUCHUENSIS_RS07445_|_transcriptional_regulator_|_18721:19713_Reverse Regulator
326 JCM11249_LACTOBACILLUS_FUCHUENSIS_RS07485_|_TetR_family_transcriptional_regulator_|_26557:27120_Reverse Regulator
327 JCM11249_LACTOBACILLUS_FUCHUENSIS_RS07700_|_two-component_sensor_histidine_kinase_|_26805:27878_Reverse Regulator
328 JCM11249_LACTOBACILLUS_FUCHUENSIS_RS05025_|_MarR_family_transcriptional_regulator_|_46991:47482_Forward Regulator MarR family
329 JCM11249_LACTOBACILLUS_FUCHUENSIS_RS10550_|_Crp/Fnr_family_transcriptional_regulator_|_117510:118174_Forward regulator oxidative stress
330 JCM11249_LACTOBACILLUS_FUCHUENSIS_RS01825_|_two-component_sensor_histidine_kinase_|_25944:27140_Forward Regulator two component system Phosphate regulon
331 JCM11249_LACTOBACILLUS_FUCHUENSIS_RS07175_|_MerR_family_transcriptional_regulator_|_41115:41486_Reverse Regulator, oxidative stress response
332 JCM11249_LACTOBACILLUS_FUCHUENSIS_RS00195_|_dnaE_|_DNA_polymerase_III_subunit_alpha_|_36154:39498_Reverse Replication 2.7.7.7 Replication
333 JCM11249_LACTOBACILLUS_FUCHUENSIS_RS00655_|_DNA_topoisomerase_III_|_134931:137000_Reverse Replication
334 JCM11249_LACTOBACILLUS_FUCHUENSIS_RS00935_|_DNA_repair_protein_RecN_|_35808:37499_Forward Replication
335 JCM11249_LACTOBACILLUS_FUCHUENSIS_RS01375_|_helicase-exonuclease_AddAB_subunit_AddA_|_11036:14752_Forward Replication
336 JCM11249_LACTOBACILLUS_FUCHUENSIS_RS02390_|_recombination_protein_RecR_|_67506:68102_Forward Replication
337 JCM11249_LACTOBACILLUS_FUCHUENSIS_RS02410_|_DNA_polymerase_III_subunit_delta'_|_70050:71036_Forward Replication
338 JCM11249_LACTOBACILLUS_FUCHUENSIS_RS02790_|_DNA_polymerase_III_subunit_beta_|_61402:62541_Reverse Replication
339 JCM11249_LACTOBACILLUS_FUCHUENSIS_RS02795_|_chromosomal_replication_initiation_protein_DnaA_|_62719:64065_Reverse Replication
340 JCM11249_LACTOBACILLUS_FUCHUENSIS_RS03670_|_ATP-dependent_DNA_helicase_|_25053:27341_Reverse Replication
341 JCM11249_LACTOBACILLUS_FUCHUENSIS_RS04050_|_ATP-dependent_DNA_helicase_|_34607:36901_Reverse Replication
342 JCM11249_LACTOBACILLUS_FUCHUENSIS_RS04385_|_3'-5'_exonuclease_|_49480:50445_Forward Replication
343 JCM11249_LACTOBACILLUS_FUCHUENSIS_RS04545_|_ATP-dependent_DNA_helicase_RecQ_|_17841:19592_Forward Replication
344 JCM11249_LACTOBACILLUS_FUCHUENSIS_RS05055_|_primosomal_protein_DnaI_|_53909:54829_Forward Replication
345 JCM11249_LACTOBACILLUS_FUCHUENSIS_RS05725_|_DNA_repair_protein_RecO_|_26289:27107_Forward Replication
346 JCM11249_LACTOBACILLUS_FUCHUENSIS_RS06650_|_DNA_mismatch_repair_protein_MutL_|_27684:29615_Reverse Replication
347 JCM11249_LACTOBACILLUS_FUCHUENSIS_RS06655_|_DNA_mismatch_repair_protein_MutS_|_30074:32692_Reverse Replication
348 JCM11249_LACTOBACILLUS_FUCHUENSIS_RS07545_|_helicase_|_36131:37471_Reverse Replication
349 JCM11249_LACTOBACILLUS_FUCHUENSIS_RS09885_|_initiator_RepB_protein_|_4147:5082_Reverse replication
350 JCM11249_LACTOBACILLUS_FUCHUENSIS_RS10595_|_primosomal_protein_DnaI_|_40482:42895_Forward replication
351 JCM11249_LACTOBACILLUS_FUCHUENSIS_RS10675_|_ATP-dependent_helicase_|_7491:11043_Forward replication
352 JCM11249_LACTOBACILLUS_FUCHUENSIS_RS10680_|_ATP-dependent_helicase_|_15776:17806_Forward replication
353 JCM11249_LACTOBACILLUS_FUCHUENSIS_RS10885_|_recombinase_RecF_|_59340:60478_Reverse replication
354 JCM11249_LACTOBACILLUS_FUCHUENSIS_RS10965_|_polC_|_DNA_polymerase_III_|_3756:7675_Forward replication
355 JCM11249_LACTOBACILLUS_FUCHUENSIS_RS11235_|_DNA_polymerase_I_|_47648:50307_Forward replication
356 JCM11249_LACTOBACILLUS_FUCHUENSIS_RS11485_|_ATP-dependent_DNA_helicase_RuvA_|_25875:26485_Reverse replication
357 JCM11249_LACTOBACILLUS_FUCHUENSIS_RS11555_|_recombinase_RecJ_|_12840:15135_Reverse replication
358 JCM11249_LACTOBACILLUS_FUCHUENSIS_RS12160_|_DNA_polymerase_III_subunit_epsilon_|_14979:15740_Forward Replication
359 JCM11249_LACTOBACILLUS_FUCHUENSIS_RS02400_|_dTMP_kinase_|_69058:69702_Forward replication

A.Rouger 2017 Annexe 1 Differentially expressed genes
177
360 JCM11249_LACTOBACILLUS_FUCHUENSIS_RS08235_|_ribose_operon_repressor_|_12476:13483_Forward repressor operon ribose
361 JCM11249_LACTOBACILLUS_FUCHUENSIS_RS00160_|_RibT_protein_|_29810:30178_Reverse riboflavin biosynthesis
362 JCM11249_LACTOBACILLUS_FUCHUENSIS_RS01485_|_ribonucleotide-diphosphate_reductase_subunit_beta_|_36092:37057_Reverse ribonucleotide-diphosphate_reductase_subunit_beta
363 JCM11249_LACTOBACILLUS_FUCHUENSIS_RS00175_|_DNA-binding_protein_|_31704:32588_Reverse RNA processing
364 JCM11249_LACTOBACILLUS_FUCHUENSIS_RS07715_|_uridine_kinase_|_29281:29910_Reverse 2.7.1.48 salvage pathways of pyrimidine ribonucleotides
365 JCM11249_LACTOBACILLUS_FUCHUENSIS_RS00015_|_signal_peptidase_I_|_2305:2832_Reverse secretion
366 JCM11249_LACTOBACILLUS_FUCHUENSIS_RS01780_|_S26_family_signal_peptidase_|_17556:18167_Reverse Secretion
367 JCM11249_LACTOBACILLUS_FUCHUENSIS_RS00980_|_protein_phosphatase_|_45227:45973_Forward 3.1.3.16 serine/threonine phosphatase of unknown function
368 JCM11249_LACTOBACILLUS_FUCHUENSIS_RS01810_|_serine/threonine_protein_phosphatase_|_22521:23315_Reverse 3.1.3.48 Serine/tyrosine protein phosphatase
369 JCM11249_LACTOBACILLUS_FUCHUENSIS_RS11365_|_shikimate_kinase_|_44441:45000_Forward 2.7.1.71 shikimate metabolism biosynthèse de certains acides aminés aromatiques
370 JCM11249_LACTOBACILLUS_FUCHUENSIS_RS11770_|_sodium_ABC_transporter_permease_|_7880:9120_Forward sodium_ABC_transporter_permease_
371 JCM11249_LACTOBACILLUS_FUCHUENSIS_RS10820_|_glycine/betaine_ABC_transporter_|_22539:23443_Forward stress resistance (cold, osmotic stress?)
372 JCM11249_LACTOBACILLUS_FUCHUENSIS_RS10865_|_glycine/betaine_ABC_transporter_ATP-binding_protein_|_28107:29243_Forward stress resistance (cold, osmotic stress?)
373 JCM11249_LACTOBACILLUS_FUCHUENSIS_RS00625_|_cold-shock_protein_|_128728:128928_Reverse Stress response
374 JCM11249_LACTOBACILLUS_FUCHUENSIS_RS01515_|_cold-shock_protein_|_42113:42328_Reverse Stress response
375 JCM11249_LACTOBACILLUS_FUCHUENSIS_RS05500_|_cold-shock_protein_|_31552:31752_Reverse Stress response
376 JCM11249_LACTOBACILLUS_FUCHUENSIS_RS06910_|_general_stress_protein_|_42836:43213_Forward Stress response
377 JCM11249_LACTOBACILLUS_FUCHUENSIS_RS07915_|_universal_stress_protein_UspA_|_34357:34848_Forward stress response
378 JCM11249_LACTOBACILLUS_FUCHUENSIS_RS04125_|_sugar_ABC_transporter_permease_|_53586:54443_Reverse
Sugar ABC transporter
379 JCM11249_LACTOBACILLUS_FUCHUENSIS_RS04130_|_sugar_ABC_transporter_permease_|_54459:55808_Reverse
Sugar ABC transporter
380 JCM11249_LACTOBACILLUS_FUCHUENSIS_RS04135_|_sugar_ABC_transporter_substrate-binding_protein_|_55843:57093_Reverse
Sugar ABC transporter
381 JCM11249_LACTOBACILLUS_FUCHUENSIS_RS00700_|_PTS_glucitol_transporter_subunit_IIA_|_142648:144054_Forward sugar metabolism
382 JCM11249_LACTOBACILLUS_FUCHUENSIS_RS00710_|_xylose_isomerase_|_145687:147030_Reverse sugar metabolism
383 JCM11249_LACTOBACILLUS_FUCHUENSIS_RS00720_|_galactose_mutarotase_|_148564:149595_Forward sugar metabolism
384 JCM11249_LACTOBACILLUS_FUCHUENSIS_RS09565_|_phosphogluconate_dehydrogenase_(NADP(+)-dependent,_decarboxylating)_|_10173:11594_Forward sugar metabolism
385 JCM11249_LACTOBACILLUS_FUCHUENSIS_RS04100_|_maltose_phosphorylase_|_45861:48104_Reverse sugar metabolism
386 JCM11249_LACTOBACILLUS_FUCHUENSIS_RS09495_|_207:1313_Forward sugar metabolism, oxygen dependent
387 JCM11249_LACTOBACILLUS_FUCHUENSIS_RS00040_|_dihydrofolate_reductase_|_5720:6217_Reverse 1.5.1.3 synthèse tetrahydrofolate, cofactor thymidylate synthase dfrA
388 JCM11249_LACTOBACILLUS_FUCHUENSIS_RS00870_|_TetR_family_transcriptional_regulator_|_27358:27990_Forward TetR family transcriptional regulator of unknown function
389 JCM11249_LACTOBACILLUS_FUCHUENSIS_RS03640_|_TetR_family_transcriptional_regulator_|_21757:22326_Forward TetR family transcriptional regulator of unknown function
390 JCM11249_LACTOBACILLUS_FUCHUENSIS_RS03810_|_TetR_family_transcriptional_regulator_|_52686:53252_Reverse TetR family transcriptional regulator of unknown function
391 JCM11249_LACTOBACILLUS_FUCHUENSIS_RS06490_|_thioredoxin_|_35572:36093_Reverse Thioredoxine reductase/Redox
392 JCM11249_LACTOBACILLUS_FUCHUENSIS_RS06530_|_thiol_reductase_thioredoxin_|_12:323_Reverse Thioredoxine reductase/Redox
393 JCM11249_LACTOBACILLUS_FUCHUENSIS_RS04430_|_thiol_reductase_thioredoxin_|_56604:56924_Forward Thioredoxine/ redox
394 JCM11249_LACTOBACILLUS_FUCHUENSIS_RS00955_|_DNA-directed_RNA_polymerase_subunit_omega_|_38919:39176_Forward Transcription
395 JCM11249_LACTOBACILLUS_FUCHUENSIS_RS02310_|_RNA_polymerase_subunit_sigma_|_53665:54261_Forward Transcription
396 JCM11249_LACTOBACILLUS_FUCHUENSIS_RS07200_|_elongation_factor_P_|_1401:1964_Reverse Transcription
397 JCM11249_LACTOBACILLUS_FUCHUENSIS_RS07710_|_transcription_elongation_factor_GreA_|_28774:29247_Reverse Transcription
398 JCM11249_LACTOBACILLUS_FUCHUENSIS_RS11620_|_transcriptional_regulator_|_11873:13278_Reverse transcription
399 JCM11249_LACTOBACILLUS_FUCHUENSIS_RS11965_|_transcription-repair_coupling_factor_|_2744:6261_Forward transcription
400 JCM11249_LACTOBACILLUS_FUCHUENSIS_RS04475_|_DNA-binding_response_regulator_|_4164:4919_Forward transcriptional regulator
401 JCM11249_LACTOBACILLUS_FUCHUENSIS_RS07090_|_transcriptional_regulator_|_28200:28931_Reverse transcriptional regulator
402 JCM11249_LACTOBACILLUS_FUCHUENSIS_RS09035_|_XRE_family_transcriptional_regulator_|_617:1549_Reverse transcriptional regulator
403 JCM11249_LACTOBACILLUS_FUCHUENSIS_RS10940_|_PhoP_family_transcriptional_regulator_|_48090:48802_Reverse transcriptional regulator
404 JCM11249_LACTOBACILLUS_FUCHUENSIS_RS01535_|_bifunctional_pyr_operon_transcriptional_regulator/uracil_phosphoribosyltransferase_|_45758:46300_Forward transcriptional regulator
405 JCM11249_LACTOBACILLUS_FUCHUENSIS_RS00170_|_transcriptional_repressor_|_31150:31668_Reverse Transcriptional regulator for iron transport and metabolism
406 JCM11249_LACTOBACILLUS_FUCHUENSIS_RS03775_|_MarR_family_transcriptional_regulator_|_46956:47417_Forward Transcriptional regulator MarR-type, unknown target
407 JCM11249_LACTOBACILLUS_FUCHUENSIS_RS06485_|_MarR_family_transcriptional_regulator_|_35051:35503_Forward Transcriptional regulator MarR-type, unknown target
408 JCM11249_LACTOBACILLUS_FUCHUENSIS_RS03275_|_heat-inducible_transcriptional_repressor_HrcA_|_20173:21231_Forward transcriptional regulator of heat-shock genes
409 JCM11249_LACTOBACILLUS_FUCHUENSIS_RS03785_|_pur_operon_repressor_|_48705:49541_Forward transcriptional regulator of the purine biosynthesis operon
410 JCM11249_LACTOBACILLUS_FUCHUENSIS_RS02235_|_GntR_family_transcriptional_regulator_|_38095:38820_Forward transcriptional regulator, gntR family, unknown target
411 JCM11249_LACTOBACILLUS_FUCHUENSIS_RS05160_|_GntR_family_transcriptional_regulator_|_15686:16414_Forward transcriptional regulator, gntR family, unknown target

A.Rouger 2017 Annexe 1 Differentially expressed genes
178
412 JCM11249_LACTOBACILLUS_FUCHUENSIS_RS07225_|_GntR_family_transcriptional_regulator_|_6893:7663_Forward transcriptional regulator, gntR family, unknown target
413 JCM11249_LACTOBACILLUS_FUCHUENSIS_RS09685_|_GntR_family_transcriptional_regulator_|_5172:5873_Reverse transcriptional regulator, gntR family, unknown target
414 JCM11249_LACTOBACILLUS_FUCHUENSIS_RS01875_|_GntR_family_transcriptional_regulator_|_38301:39032_Forward transcriptional regulator, gntR family, unknown target
415 JCM11249_LACTOBACILLUS_FUCHUENSIS_RS09985_|_Rrf2_family_transcriptional_regulator_|_6067:6582_Reverse Transcriptional regulator, unknown target
416 JCM11249_LACTOBACILLUS_FUCHUENSIS_RS00215_|_50S_ribosomal_protein_L32_|_42679:42861_Reverse translation
417 JCM11249_LACTOBACILLUS_FUCHUENSIS_RS00315_|_tuf_|_elongation_factor_Tu_|_66147:67337_Reverse translation
418 JCM11249_LACTOBACILLUS_FUCHUENSIS_RS00335_|_30S_ribosomal_protein_S20_|_71072:71326_Forward translation
419 JCM11249_LACTOBACILLUS_FUCHUENSIS_RS00465_|_ribonuclease_J_|_96419:98107_Forward Translation
420 JCM11249_LACTOBACILLUS_FUCHUENSIS_RS00480_|_exodeoxyribonuclease_V_subunit_alpha_|_100663:103179_Reverse Translation
421 JCM11249_LACTOBACILLUS_FUCHUENSIS_RS00510_|_tRNA(5-methylaminomethyl-2-thiouridine)-_methyltransferase_|_108720:109829_Reverse Translation
422 JCM11249_LACTOBACILLUS_FUCHUENSIS_RS00580_|_RNA-binding_protein_|_120957:121424_Reverse Translation
423 JCM11249_LACTOBACILLUS_FUCHUENSIS_RS00620_|_tyrosine--tRNA_ligase_|_127125:128384_Reverse Translation
424 JCM11249_LACTOBACILLUS_FUCHUENSIS_RS00885_|_50S_ribosomal_protein_L27_|_28824:29111_Forward Translation
425 JCM11249_LACTOBACILLUS_FUCHUENSIS_RS00910_|_exodeoxyribonuclease_VII_large_subunit_|_31928:33277_Forward Translation
426 JCM11249_LACTOBACILLUS_FUCHUENSIS_RS00975_|_16S_rRNA_(cytosine(967)-C(5))-methyltransferase_|_43862:45205_Forward Translation
427 JCM11249_LACTOBACILLUS_FUCHUENSIS_RS01005_|_50S_ribosomal_protein_L28_|_50355:50540_Reverse Translation
428 JCM11249_LACTOBACILLUS_FUCHUENSIS_RS01060_|_ribonuclease_III_|_62606:63295_Forward Translation
429 JCM11249_LACTOBACILLUS_FUCHUENSIS_RS01105_|_rpsP_|_30S_ribosomal_protein_S16_|_74072:74347_Forward Translation
430 JCM11249_LACTOBACILLUS_FUCHUENSIS_RS01110_|_RNA-binding_protein_|_74357:74599_Forward Translation
431 JCM11249_LACTOBACILLUS_FUCHUENSIS_RS01120_|_tRNA_(guanine(37)-N(1))-methyltransferase_|_75184:75927_Forward Translation
432 JCM11249_LACTOBACILLUS_FUCHUENSIS_RS01125_|_rplS_|_50S_ribosomal_protein_L19_|_76046:76393_Forward Translation
433 JCM11249_LACTOBACILLUS_FUCHUENSIS_RS01170_|_aminoacyl-tRNA_deacylase_|_81018:81521_Reverse Translation
434 JCM11249_LACTOBACILLUS_FUCHUENSIS_RS01195_|_ribosomal_protein_L11_methyltransferase_|_83578:84456_Forward Translation
435 JCM11249_LACTOBACILLUS_FUCHUENSIS_RS01200_|_16S_rRNA_(uracil(1498)-N(3))-methyltransferase_|_84468:85223_Forward Translation
436 JCM11249_LACTOBACILLUS_FUCHUENSIS_RS01390_|_asnC_|_asparagine--tRNA_ligase_|_18482:19780_Forward Translation
437 JCM11249_LACTOBACILLUS_FUCHUENSIS_RS01430_|_RNA_methyltransferase_|_25723:26865_Forward Translation
438 JCM11249_LACTOBACILLUS_FUCHUENSIS_RS02290_|_cysteine--tRNA_ligase_|_50390:51796_Forward Translation
439 JCM11249_LACTOBACILLUS_FUCHUENSIS_RS02295_|_Mini-ribonuclease_3_|_51793:52197_Forward Translation
440 JCM11249_LACTOBACILLUS_FUCHUENSIS_RS02300_|_23S_rRNA_(guanosine(2251)-2'-O)-methyltransferase_RlmB_|_52283:53089_Forward Translation
441 JCM11249_LACTOBACILLUS_FUCHUENSIS_RS02305_|_DNA-binding_protein_|_53086:53619_Forward Translation
442 JCM11249_LACTOBACILLUS_FUCHUENSIS_RS02315_|_50S_ribosomal_protein_L33_|_54325:54474_Forward Translation
443 JCM11249_LACTOBACILLUS_FUCHUENSIS_RS02335_|_50S_ribosomal_protein_L11_|_56355:56780_Forward Translation
444 JCM11249_LACTOBACILLUS_FUCHUENSIS_RS02350_|_50S_ribosomal_protein_L10_|_59149:59652_Forward Translation
445 JCM11249_LACTOBACILLUS_FUCHUENSIS_RS02355_|_rplL_|_50S_ribosomal_protein_L7/L12_|_59704:60069_Forward Translation
446 JCM11249_LACTOBACILLUS_FUCHUENSIS_RS02365_|_16S_rRNA_methyltransferase_|_62874:63485_Forward Translation
447 JCM11249_LACTOBACILLUS_FUCHUENSIS_RS02375_|_tRNA-specific_adenosine_deaminase_|_64668:65171_Forward Translation
448 JCM11249_LACTOBACILLUS_FUCHUENSIS_RS02425_|_rRNA_(cytidine-2'-O-)-methyltransferase_|_72286:73164_Forward Translation
449 JCM11249_LACTOBACILLUS_FUCHUENSIS_RS02745_|_50S_ribosomal_protein_L9_|_50482:50934_Reverse Translation
450 JCM11249_LACTOBACILLUS_FUCHUENSIS_RS02755_|_30S_ribosomal_protein_S18_|_53364:53603_Reverse Translation
451 JCM11249_LACTOBACILLUS_FUCHUENSIS_RS02765_|_30S_ribosomal_protein_S6_|_54205:54501_Reverse Translation
452 JCM11249_LACTOBACILLUS_FUCHUENSIS_RS02785_|_RNA-binding_S4_protein_|_60485:60712_Reverse Translation
453 JCM11249_LACTOBACILLUS_FUCHUENSIS_RS02830_|_tRNA_modification_GTPase_|_69621:71009_Forward Translation
454 JCM11249_LACTOBACILLUS_FUCHUENSIS_RS03180_|_tryptophan--tRNA_ligase_|_71350:72372_Reverse Translation
455 JCM11249_LACTOBACILLUS_FUCHUENSIS_RS03255_|_ribosome-binding_factor_A_|_15807:16163_Forward Translation
456 JCM11249_LACTOBACILLUS_FUCHUENSIS_RS03260_|_tRNA_pseudouridine(55)_synthase_|_16250:17167_Forward Translation
457 JCM11249_LACTOBACILLUS_FUCHUENSIS_RS03675_|_tryptophan--tRNA_ligase_|_27705:28721_Forward Translation
458 JCM11249_LACTOBACILLUS_FUCHUENSIS_RS03745_|_methionine--tRNA_ligase_|_39242:41287_Forward Translation
459 JCM11249_LACTOBACILLUS_FUCHUENSIS_RS04360_|_RNA_pseudouridine_synthase_|_41770:42669_Reverse Translation
460 JCM11249_LACTOBACILLUS_FUCHUENSIS_RS04435_|_tRNA-binding_protein_|_56942:57571_Forward Translation
461 JCM11249_LACTOBACILLUS_FUCHUENSIS_RS04955_|_arginine--tRNA_ligase_|_29332:31023_Forward Translation

A.Rouger 2017 Annexe 1 Differentially expressed genes
179
462 JCM11249_LACTOBACILLUS_FUCHUENSIS_RS05235_|_translation_factor_Sua5_|_31496:32509_Forward Translation
463 JCM11249_LACTOBACILLUS_FUCHUENSIS_RS05415_|_23S_rRNA_(uracil-5-)-methyltransferase_RumA_|_10857:12221_Reverse Translation
464 JCM11249_LACTOBACILLUS_FUCHUENSIS_RS05425_|_aspartyl/glutamyl-tRNA_amidotransferase_subunit_B_|_13356:14786_Reverse Translation
465 JCM11249_LACTOBACILLUS_FUCHUENSIS_RS05430_|_gatA_|_aspartyl/glutamyl-tRNA_amidotransferase_subunit_A_|_14786:16252_Reverse Translation
466 JCM11249_LACTOBACILLUS_FUCHUENSIS_RS05435_|_glutamyl-tRNA_amidotransferase_|_16255:16551_Reverse Translation
467 JCM11249_LACTOBACILLUS_FUCHUENSIS_RS05630_|_rbgA_|_ribosome_biogenesis_GTPase_YlqF_|_8192:9049_Forward Translation
468 JCM11249_LACTOBACILLUS_FUCHUENSIS_RS05710_|_16S_rRNA_maturation_RNase_YbeY_|_24489:24965_Forward Translation
469 JCM11249_LACTOBACILLUS_FUCHUENSIS_RS06055_|_50S_ribosomal_protein_L17_|_34302:34682_Forward Translation
470 JCM11249_LACTOBACILLUS_FUCHUENSIS_RS06565_|_alaS_|_alanine--tRNA_ligase_|_6672:9311_Reverse Translation
471 JCM11249_LACTOBACILLUS_FUCHUENSIS_RS06935_|_30S_ribosomal_protein_S2_|_2611:3405_Reverse Translation
472 JCM11249_LACTOBACILLUS_FUCHUENSIS_RS07745_|_RNA_methyltransferase_|_36032:36793_Reverse Translation
473 JCM11249_LACTOBACILLUS_FUCHUENSIS_RS07885_|_30S_ribosomal_protein_S4_|_28208:28795_Forward translation
474 JCM11249_LACTOBACILLUS_FUCHUENSIS_RS09065_|_tRNA_(cytidine(34)-2'-O)-methyltransferase_|_8022:8531_Reverse translation
475 JCM11249_LACTOBACILLUS_FUCHUENSIS_RS09215_|_rpmE2_|_50S_ribosomal_protein_L31_type_B_|_17119:17382_Forward translation
476 JCM11249_LACTOBACILLUS_FUCHUENSIS_RS09350_|_aminoacyl-tRNA_hydrolase_|_1904:2461_Forward translation
477 JCM11249_LACTOBACILLUS_FUCHUENSIS_RS09500_|_translation_initiation_factor_IF-3_|_1547:2050_Forward translation
478 JCM11249_LACTOBACILLUS_FUCHUENSIS_RS09505_|_rpmI_|_50S_ribosomal_protein_L35_|_2084:2284_Forward translation
479 JCM11249_LACTOBACILLUS_FUCHUENSIS_RS09510_|_50S_ribosomal_protein_L20_|_2361:2720_Forward translation
480 JCM11249_LACTOBACILLUS_FUCHUENSIS_RS10135_|_ribonuclease_Y_|_1581:3143_Forward translation
481 JCM11249_LACTOBACILLUS_FUCHUENSIS_RS10515_|_pseudouridine_synthase_|_27688:28436_Reverse translation
482 JCM11249_LACTOBACILLUS_FUCHUENSIS_RS10700_|_pseudouridine_synthase_|_44674:45578_Forward translation
483 JCM11249_LACTOBACILLUS_FUCHUENSIS_RS11475_|_tgt_|_queuine_tRNA-ribosyltransferase_|_21669:22810_Reverse translation
484 JCM11249_LACTOBACILLUS_FUCHUENSIS_RS11480_|_S-adenosylmethionine_tRNA_ribosyltransferase_|_23810:24839_Reverse translation
485 JCM11249_LACTOBACILLUS_FUCHUENSIS_RS11645_|_aspS_|_aspartate--tRNA_ligase_|_3233:5013_Reverse translation
486 JCM11249_LACTOBACILLUS_FUCHUENSIS_RS11670_|_valS_|_valine--tRNA_ligase_|_19069:21716_Reverse translation
487 JCM11249_LACTOBACILLUS_FUCHUENSIS_RS00310_|_tig_|_trigger_factor_|_64666:65961_Reverse Translation
488 JCM11249_LACTOBACILLUS_FUCHUENSIS_RS09530_|_RNA-binding_protein_|_5603:5920_Forward translation
489 JCM11249_LACTOBACILLUS_FUCHUENSIS_RS00300_|_YihA_family_ribosome_biogenesis_GTP-binding_protein_|_62462:63061_Reverse Translation
490 JCM11249_LACTOBACILLUS_FUCHUENSIS_RS05660_|_gid_|_methylenetetrahydrofolate--tRNA-(uracil(54)-_C(5))-methyltransferase_(FADH(2)-oxidizing)_TrmFO_|_14545:15855_Forward Translation
491 JCM11249_LACTOBACILLUS_FUCHUENSIS_RS05720_|_era_|_GTPase_Era_|_25378:26280_Forward Translation
492 JCM11249_LACTOBACILLUS_FUCHUENSIS_RS06335_|_peptide_chain_release_factor_2_|_3461:4459_Forward Translation
493 JCM11249_LACTOBACILLUS_FUCHUENSIS_RS10660_|_UDP-diphospho-muramoylpentapeptide_beta-N-acetylglucosaminyltransferase_|_96164:97262_Forward Translation
494 JCM11249_LACTOBACILLUS_FUCHUENSIS_RS02595_|_protein-tyrosine-phosphatase_|_24522:25313_Forward translation
495 JCM11249_LACTOBACILLUS_FUCHUENSIS_RS12075_|_UDP_pyrophosphate_synthase_|_2148:2908_Reverse translation
496 JCM11249_LACTOBACILLUS_FUCHUENSIS_RS05015_|_SsrA-binding_protein_|_44719:45189_Forward Translation, tmRNA-binding protein
497 JCM11249_LACTOBACILLUS_FUCHUENSIS_RS09400_|_tRNA-dihydrouridine_synthase_|_14873:15862_Forward translation?
498 JCM11249_LACTOBACILLUS_FUCHUENSIS_RS09470_|_mRNA_interferase_PemK_|_11403:11768_Forward translation? cell death?
499 JCM11249_LACTOBACILLUS_FUCHUENSIS_RS10110_|_sodium:cation_symporter_|_2459:3568_Reverse transport cation
500 JCM11249_LACTOBACILLUS_FUCHUENSIS_RS03575_|_sodium:dicarboxylate_symporter_|_7424:8821_Forward transport ions
501 JCM11249_LACTOBACILLUS_FUCHUENSIS_RS03845_|_Na+/proline_symporter_|_60059:61561_Forward transport ions
502 JCM11249_LACTOBACILLUS_FUCHUENSIS_RS03610_|_peptide_transporter_|_15143:17080_Forward Transport of peptides
503 JCM11249_LACTOBACILLUS_FUCHUENSIS_RS10760_|_sodium:proton_antiporter_|_53319:54496_Forward transport proton
504 JCM11249_LACTOBACILLUS_FUCHUENSIS_RS07560_|_sodium:proton_antiporter_|_175:2292_Reverse Transport, Na(+)/H(+) antiporter
505 JCM11249_LACTOBACILLUS_FUCHUENSIS_RS04975_|_transporter_|_33833:35272_Reverse Transporter
506 JCM11249_LACTOBACILLUS_FUCHUENSIS_RS04690_|_glycerol_transporter_|_41469:42185_Forward Transporter (facilitator) unknown substrate
507 JCM11249_LACTOBACILLUS_FUCHUENSIS_RS00445_|_ABC_transporter_|_92006:93763_Reverse transporter ABC
508 JCM11249_LACTOBACILLUS_FUCHUENSIS_RS08745_|_transporter_|_5307:6944_Reverse transporter?
509 JCM11249_LACTOBACILLUS_FUCHUENSIS_RS05765_|_peptidase_T_|_36060:37301_Forward 3.4.11.4 Tripeptide aminopeptidase PepT
510 JCM11249_LACTOBACILLUS_FUCHUENSIS_RS01240_|_16S_rRNA_(cytosine(1402)-N(4))-methyltransferase_|_90290:91249_Forward Trnaslation
511 JCM11249_LACTOBACILLUS_FUCHUENSIS_RS09750_|_glycosyl_transferase_|_3740:4561_Forward 2.4.1.- UDP-Glycosyltransferase/glycogen phosphorylase family Cell wall?
512 JCM11249_LACTOBACILLUS_FUCHUENSIS_RS05135_|_multidrug_ABC_transporter_ATP-binding_protein_|_8071:9801_Forward Uncharacterized ABC transporter
513 JCM11249_LACTOBACILLUS_FUCHUENSIS_RS00070_|_hypothetical_protein_|_12143:13417_Reverse unknown
514 JCM11249_LACTOBACILLUS_FUCHUENSIS_RS00075_|_DNA-binding_protein_|_13524:13799_Reverse unknown

A.Rouger 2017 Annexe 1 Differentially expressed genes
180
515 JCM11249_LACTOBACILLUS_FUCHUENSIS_RS00205_|_hypothetical_protein_|_39870:40742_Reverse unknown
516 JCM11249_LACTOBACILLUS_FUCHUENSIS_RS00250_|_hypothetical_protein_|_51698:52792_Reverse unknown
517 JCM11249_LACTOBACILLUS_FUCHUENSIS_RS00375_|_hypothetical_protein_|_78106:78402_Reverse unknown
518 JCM11249_LACTOBACILLUS_FUCHUENSIS_RS00385_|_hypothetical_protein_|_78842:79885_Reverse unknown
519 JCM11249_LACTOBACILLUS_FUCHUENSIS_RS00410_|_hypothetical_protein_|_84341:84622_Reverse unknown
520 JCM11249_LACTOBACILLUS_FUCHUENSIS_RS00435_|_hypothetical_protein_|_90215:90892_Reverse unknown
521 JCM11249_LACTOBACILLUS_FUCHUENSIS_RS00460_|_hypothetical_protein_|_96203:96415_Forward unknown
522 JCM11249_LACTOBACILLUS_FUCHUENSIS_RS00475_|_GNAT_family_acetyltransferase_|_99403:100617_Reverse Unknown
523 JCM11249_LACTOBACILLUS_FUCHUENSIS_RS00485_|_hypothetical_protein_|_103185:103844_Reverse unknown
524 JCM11249_LACTOBACILLUS_FUCHUENSIS_RS00520_|_cysteine_desulfurase_|_110617:111783_Reverse Unknown
525 JCM11249_LACTOBACILLUS_FUCHUENSIS_RS00540_|_hypothetical_protein_|_113959:114429_Reverse unknown
526 JCM11249_LACTOBACILLUS_FUCHUENSIS_RS00570_|_hypothetical_protein_|_119345:120067_Forward unknown
527 JCM11249_LACTOBACILLUS_FUCHUENSIS_RS00880_|_hypothetical_protein_|_28449:28790_Forward unknown
528 JCM11249_LACTOBACILLUS_FUCHUENSIS_RS01015_|_hypothetical_protein_|_51289:52959_Forward unknown
529 JCM11249_LACTOBACILLUS_FUCHUENSIS_RS01175_|_hypothetical_protein_|_81655:81837_Forward unknown
530 JCM11249_LACTOBACILLUS_FUCHUENSIS_RS01185_|_hypothetical_protein_|_82529:82930_Forward unknown
531 JCM11249_LACTOBACILLUS_FUCHUENSIS_RS01320_|_hypothetical_protein_|_108631:109311_Reverse unknown
532 JCM11249_LACTOBACILLUS_FUCHUENSIS_RS01345_|_hypothetical_protein_|_2188:3150_Forward unknown
533 JCM11249_LACTOBACILLUS_FUCHUENSIS_RS01405_|_penicillin-binding_protein_|_21258:23513_Reverse unknown
534 JCM11249_LACTOBACILLUS_FUCHUENSIS_RS01435_|_hypothetical_protein_|_26972:27925_Forward unknown
535 JCM11249_LACTOBACILLUS_FUCHUENSIS_RS01510_|_hypothetical_protein_|_41612:42022_Forward unknown
536 JCM11249_LACTOBACILLUS_FUCHUENSIS_RS01615_|_hypothetical_protein_|_63242:64111_Forward unknown
537 JCM11249_LACTOBACILLUS_FUCHUENSIS_RS01705_|_hypothetical_protein_|_86171:87961_Reverse unknown
538 JCM11249_LACTOBACILLUS_FUCHUENSIS_RS01725_|_hypothetical_protein_|_351:821_Forward unknown
539 JCM11249_LACTOBACILLUS_FUCHUENSIS_RS01840_|_hypothetical_protein_|_30259:30867_Forward unknown
540 JCM11249_LACTOBACILLUS_FUCHUENSIS_RS01935_|_hypothetical_protein_|_55777:55995_Forward unknown
541 JCM11249_LACTOBACILLUS_FUCHUENSIS_RS01955_|_hypothetical_protein_|_59989:61278_Forward unknown
542 JCM11249_LACTOBACILLUS_FUCHUENSIS_RS01975_|_nucleotidyltransferase_|_62486:63244_Forward unknown
543 JCM11249_LACTOBACILLUS_FUCHUENSIS_RS02050_|_hypothetical_protein_|_3548:5131_Forward unknown
544 JCM11249_LACTOBACILLUS_FUCHUENSIS_RS02105_|_hypothetical_protein_|_11626:12849_Forward unknown
545 JCM11249_LACTOBACILLUS_FUCHUENSIS_RS02360_|_hypothetical_protein_|_60238:62859_Forward unknown
546 JCM11249_LACTOBACILLUS_FUCHUENSIS_RS02440_|_membrane_protein_|_75230:75760_Forward unknown
547 JCM11249_LACTOBACILLUS_FUCHUENSIS_RS02480_|_hypothetical_protein_|_4683:8141_Reverse unknown
548 JCM11249_LACTOBACILLUS_FUCHUENSIS_RS02565_|_hypothetical_protein_|_19951:20685_Reverse unknown
549 JCM11249_LACTOBACILLUS_FUCHUENSIS_RS02575_|_hypothetical_protein_|_21531:22022_Reverse unknown
550 JCM11249_LACTOBACILLUS_FUCHUENSIS_RS02610_|_hypothetical_protein_|_26944:27312_Reverse unknown
551 JCM11249_LACTOBACILLUS_FUCHUENSIS_RS02645_|_hypothetical_protein_|_31503:31868_Forward unknown
552 JCM11249_LACTOBACILLUS_FUCHUENSIS_RS02665_|_hypothetical_protein_|_35916:36779_Reverse unknown
553 JCM11249_LACTOBACILLUS_FUCHUENSIS_RS02670_|_hypothetical_protein_|_36933:37298_Reverse unknown
554 JCM11249_LACTOBACILLUS_FUCHUENSIS_RS02700_|_hypothetical_protein_|_41885:42562_Reverse unknown
555 JCM11249_LACTOBACILLUS_FUCHUENSIS_RS02725_|_nucleoid_occlusion_protein_|_45612:46487_Reverse unknown
556 JCM11249_LACTOBACILLUS_FUCHUENSIS_RS02750_|_hypothetical_protein_|_50958:52991_Reverse unknown
557 JCM11249_LACTOBACILLUS_FUCHUENSIS_RS02935_|_hypothetical_protein_|_20280:21212_Reverse unknown
558 JCM11249_LACTOBACILLUS_FUCHUENSIS_RS02990_|_hypothetical_protein_|_34476:35126_Forward unknown
559 JCM11249_LACTOBACILLUS_FUCHUENSIS_RS03120_|_hypothetical_protein_|_59292:59657_Forward unknown
560 JCM11249_LACTOBACILLUS_FUCHUENSIS_RS03165_|_hypothetical_protein_|_69665:70357_Forward unknown
561 JCM11249_LACTOBACILLUS_FUCHUENSIS_RS03240_|_hypothetical_protein_|_12182:12481_Forward unknown
562 JCM11249_LACTOBACILLUS_FUCHUENSIS_RS03465_|_membrane_protein_|_57264:57944_Reverse unknown
563 JCM11249_LACTOBACILLUS_FUCHUENSIS_RS03590_|_hypothetical_protein_|_11865:12554_Forward unknown
564 JCM11249_LACTOBACILLUS_FUCHUENSIS_RS03625_|_hypothetical_protein_|_18974:19825_Forward unknown
565 JCM11249_LACTOBACILLUS_FUCHUENSIS_RS03720_|_hypothetical_protein_|_35635:36597_Forward unknown
566 JCM11249_LACTOBACILLUS_FUCHUENSIS_RS03730_|_NUDIX_hydrolase_|_37052:37555_Forward unknown
567 JCM11249_LACTOBACILLUS_FUCHUENSIS_RS03995_|_virion_core_protein_|_22733:23851_Reverse unknown
568 JCM11249_LACTOBACILLUS_FUCHUENSIS_RS04040_|_GMP_synthetase_|_31479:33032_Reverse unknown
569 JCM11249_LACTOBACILLUS_FUCHUENSIS_RS04265_|_hypothetical_protein_|_23960:24160_Forward unknown
570 JCM11249_LACTOBACILLUS_FUCHUENSIS_RS04330_|_hypothetical_protein_|_36342:36719_Forward unknown
571 JCM11249_LACTOBACILLUS_FUCHUENSIS_RS04335_|_hypothetical_protein_|_36872:38776_Forward unknown
572 JCM11249_LACTOBACILLUS_FUCHUENSIS_RS04380_|_hypothetical_protein_|_46788:49490_Forward unknown
573 JCM11249_LACTOBACILLUS_FUCHUENSIS_RS04395_|_hypothetical_protein_|_51595:51918_Reverse unknown
574 JCM11249_LACTOBACILLUS_FUCHUENSIS_RS04400_|_histidine_triad_protein_|_51918:52349_Reverse unknown
575 JCM11249_LACTOBACILLUS_FUCHUENSIS_RS04585_|_hypothetical_protein_|_25463:25996_Reverse unknown
576 JCM11249_LACTOBACILLUS_FUCHUENSIS_RS04685_|_hypothetical_protein_|_40668:41441_Forward unknown
577 JCM11249_LACTOBACILLUS_FUCHUENSIS_RS04695_|_hypothetical_protein_|_42289:44754_Forward unknown
578 JCM11249_LACTOBACILLUS_FUCHUENSIS_RS05105_|_membrane_protein_|_4472:4654_Reverse unknown
579 JCM11249_LACTOBACILLUS_FUCHUENSIS_RS05110_|_hypothetical_protein_|_4647:4967_Reverse unknown
580 JCM11249_LACTOBACILLUS_FUCHUENSIS_RS05290_|_membrane_protein_|_41455:41685_Forward unknown
581 JCM11249_LACTOBACILLUS_FUCHUENSIS_RS05360_|_type_II-A_CRISPR-associated_protein_Csn2_|_55113:55808_Forward unknown
582 JCM11249_LACTOBACILLUS_FUCHUENSIS_RS05375_|_hypothetical_protein_|_1721:1915_Forward unknown
583 JCM11249_LACTOBACILLUS_FUCHUENSIS_RS05505_|_hypothetical_protein_|_32065:32703_Forward unknown
584 JCM11249_LACTOBACILLUS_FUCHUENSIS_RS05525_|_hypothetical_protein_|_34641:36806_Reverse unknown
585 JCM11249_LACTOBACILLUS_FUCHUENSIS_RS05590_|_hypothetical_protein_|_51896:53692_Reverse unknown
586 JCM11249_LACTOBACILLUS_FUCHUENSIS_RS05705_|_hypothetical_protein_|_23806:24249_Forward unknown
587 JCM11249_LACTOBACILLUS_FUCHUENSIS_RS05875_|_hypothetical_protein_|_4905:6719_Forward unknown
588 JCM11249_LACTOBACILLUS_FUCHUENSIS_RS06125_|_hypothetical_protein_|_2614:3399_Reverse unknown
589 JCM11249_LACTOBACILLUS_FUCHUENSIS_RS06185_|_hypothetical_protein_|_17602:17793_Reverse unknown
590 JCM11249_LACTOBACILLUS_FUCHUENSIS_RS06195_|_hypothetical_protein_|_20339:20638_Forward unknown
591 JCM11249_LACTOBACILLUS_FUCHUENSIS_RS06200_|_hypothetical_protein_|_20952:22034_Forward unknown
592 JCM11249_LACTOBACILLUS_FUCHUENSIS_RS06210_|_hypothetical_protein_|_24425:25756_Reverse unknown
593 JCM11249_LACTOBACILLUS_FUCHUENSIS_RS06225_|_membrane_protein_|_27566:28039_Forward unknown

A.Rouger 2017 Annexe 1 Differentially expressed genes
181
594 JCM11249_LACTOBACILLUS_FUCHUENSIS_RS06230_|_hypothetical_protein_|_28813:29382_Reverse unknown
595 JCM11249_LACTOBACILLUS_FUCHUENSIS_RS06395_|_hypothetical_protein_|_15133:16617_Forward unknown
596 JCM11249_LACTOBACILLUS_FUCHUENSIS_RS06430_|_hypothetical_protein_|_21475:21885_Forward unknown
597 JCM11249_LACTOBACILLUS_FUCHUENSIS_RS06445_|_hydrolase_|_25050:25688_Forward unknown
598 JCM11249_LACTOBACILLUS_FUCHUENSIS_RS06470_|_RNase_adaptor_protein_RapZ_|_32093:32977_Forward unknown
599 JCM11249_LACTOBACILLUS_FUCHUENSIS_RS06475_|_hypothetical_protein_|_32974:34008_Forward unknown
600 JCM11249_LACTOBACILLUS_FUCHUENSIS_RS06480_|_DNA-binding_protein_WhiA_|_34011:34955_Forward unknown
601 JCM11249_LACTOBACILLUS_FUCHUENSIS_RS06560_|_hypothetical_protein_|_6132:6392_Reverse unknown
602 JCM11249_LACTOBACILLUS_FUCHUENSIS_RS06570_|_hypothetical_protein_|_9559:10542_Reverse unknown
603 JCM11249_LACTOBACILLUS_FUCHUENSIS_RS06620_|_GNAT_family_acetyltransferase_|_23271:23786_Reverse unknown
604 JCM11249_LACTOBACILLUS_FUCHUENSIS_RS06800_|_hypothetical_protein_|_16463:16948_Forward unknown
605 JCM11249_LACTOBACILLUS_FUCHUENSIS_RS06865_|_cell_surface_protein_|_34614:35912_Reverse unknown
606 JCM11249_LACTOBACILLUS_FUCHUENSIS_RS06875_|_5'-nucleotidase_|_36607:38028_Forward unknown
607 JCM11249_LACTOBACILLUS_FUCHUENSIS_RS06880_|_hypothetical_protein_|_38003:38620_Forward unknown
608 JCM11249_LACTOBACILLUS_FUCHUENSIS_RS06980_|_hypothetical_protein_|_10844:11086_Reverse unknown
609 JCM11249_LACTOBACILLUS_FUCHUENSIS_RS06985_|_repressor_LexA_|_11222:11836_Forward unknown
610 JCM11249_LACTOBACILLUS_FUCHUENSIS_RS07020_|_hypothetical_protein_|_17876:18313_Reverse unknown
611 JCM11249_LACTOBACILLUS_FUCHUENSIS_RS07105_|_hypothetical_protein_|_29769:30143_Reverse unknown
612 JCM11249_LACTOBACILLUS_FUCHUENSIS_RS07110_|_steroid-binding_protein_|_30336:30575_Forward unknown
613 JCM11249_LACTOBACILLUS_FUCHUENSIS_RS07130_|_hypothetical_protein_|_33987:35771_Reverse unknown
614 JCM11249_LACTOBACILLUS_FUCHUENSIS_RS07135_|_hypothetical_protein_|_35796:36608_Reverse unknown
615 JCM11249_LACTOBACILLUS_FUCHUENSIS_RS07205_|_hypothetical_protein_|_2032:2820_Reverse unknown
616 JCM11249_LACTOBACILLUS_FUCHUENSIS_RS07530_|_hypothetical_protein_|_34780:35199_Reverse unknown
617 JCM11249_LACTOBACILLUS_FUCHUENSIS_RS07555_|_hypothetical_protein_|_38644:38988_Forward unknown
618 JCM11249_LACTOBACILLUS_FUCHUENSIS_RS07575_|_hypothetical_protein_|_4191:4727_Forward unknown
619 JCM11249_LACTOBACILLUS_FUCHUENSIS_RS07615_|_GNAT_family_acetyltransferase_|_10567:11130_Reverse unknown
620 JCM11249_LACTOBACILLUS_FUCHUENSIS_RS07655_|_hypothetical_protein_|_18893:20005_Reverse unknown
621 JCM11249_LACTOBACILLUS_FUCHUENSIS_RS07660_|_TIGR00159_family_protein_|_20002:20841_Reverse unknown
622 JCM11249_LACTOBACILLUS_FUCHUENSIS_RS08100_|_hypothetical_protein_|_9859:10701_Forward unknown
623 JCM11249_LACTOBACILLUS_FUCHUENSIS_RS08210_|_hypothetical_protein_|_7364:8224_Reverse unknown
624 JCM11249_LACTOBACILLUS_FUCHUENSIS_RS08315_|_hypothetical_protein_|_1109:1324_Forward unknown
625 JCM11249_LACTOBACILLUS_FUCHUENSIS_RS08550_|_hypothetical_protein_|_22292:22525_Forward unknown
626 JCM11249_LACTOBACILLUS_FUCHUENSIS_RS08585_|_transcriptional_regulator_|_6055:6891_Reverse unknown
627 JCM11249_LACTOBACILLUS_FUCHUENSIS_RS08595_|_hypothetical_protein_|_7921:8760_Reverse unknown
628 JCM11249_LACTOBACILLUS_FUCHUENSIS_RS08690_|_hypothetical_protein_|_22796:23770_Forward unknown
629 JCM11249_LACTOBACILLUS_FUCHUENSIS_RS09050_|_hypothetical_protein_|_3655:4926_Reverse unknown
630 JCM11249_LACTOBACILLUS_FUCHUENSIS_RS09070_|_methyltransferase_|_8784:9620_Reverse unknown
631 JCM11249_LACTOBACILLUS_FUCHUENSIS_RS09085_|_GNAT_family_acetyltransferase_|_11969:12424_Forward unknown
632 JCM11249_LACTOBACILLUS_FUCHUENSIS_RS09090_|_AI-2E_family_transporter_|_12468:13613_Reverse unknown
633 JCM11249_LACTOBACILLUS_FUCHUENSIS_RS09155_|_HD_domain-containing_protein_|_2747:4120_Reverse unknown
634 JCM11249_LACTOBACILLUS_FUCHUENSIS_RS09185_|_hypothetical_protein_|_8147:10732_Forward unknown
635 JCM11249_LACTOBACILLUS_FUCHUENSIS_RS09195_|_hypothetical_protein_|_12028:12468_Forward unknown
636 JCM11249_LACTOBACILLUS_FUCHUENSIS_RS09225_|_membrane_protein_|_18087:18752_Forward unknown
637 JCM11249_LACTOBACILLUS_FUCHUENSIS_RS09290_|_hypothetical_protein_|_8841:9278_Reverse unknown
638 JCM11249_LACTOBACILLUS_FUCHUENSIS_RS09295_|_hypothetical_protein_|_9593:10234_Reverse unknown
639 JCM11249_LACTOBACILLUS_FUCHUENSIS_RS09300_|_hypothetical_protein_|_10350:11021_Reverse unknown
640 JCM11249_LACTOBACILLUS_FUCHUENSIS_RS09305_|_aquaporin_|_11251:11970_Forward unknown
641 JCM11249_LACTOBACILLUS_FUCHUENSIS_RS09475_|_membrane_protein_|_11904:12428_Forward unknown
642 JCM11249_LACTOBACILLUS_FUCHUENSIS_RS09490_|_hypothetical_protein_|_14561:15937_Reverse unknown
643 JCM11249_LACTOBACILLUS_FUCHUENSIS_RS09560_|_hypothetical_protein_|_9452:10012_Forward unknown
644 JCM11249_LACTOBACILLUS_FUCHUENSIS_RS09625_|_hypothetical_protein_|_7153:7524_Forward unknown
645 JCM11249_LACTOBACILLUS_FUCHUENSIS_RS09815_|_rhomboid_family_intramembrane_serine_protease_|_5926:6591_Forward unknown
646 JCM11249_LACTOBACILLUS_FUCHUENSIS_RS09830_|_sulfurtransferase_|_7849:8268_Forward unknown
647 JCM11249_LACTOBACILLUS_FUCHUENSIS_RS09855_|_addiction_module_toxin,_RelE/StbE_family_protein_|_209:565_Forward unknown
648 JCM11249_LACTOBACILLUS_FUCHUENSIS_RS09960_|_gamma-aminobutyrate_permease_|_18:1442_Reverse unknown
649 JCM11249_LACTOBACILLUS_FUCHUENSIS_RS09990_|_hypothetical_protein_|_6588:7118_Reverse unknown
650 JCM11249_LACTOBACILLUS_FUCHUENSIS_RS10190_|_hypothetical_protein_|_2489:2839_Reverse unknown
651 JCM11249_LACTOBACILLUS_FUCHUENSIS_RS10330_|_hypothetical_protein_|_1559:2959_Reverse unknown
652 JCM11249_LACTOBACILLUS_FUCHUENSIS_RS10380_|_hypothetical_protein_|_135:1373_Forward unknown
653 JCM11249_LACTOBACILLUS_FUCHUENSIS_RS10385_|_transposase_|_107:1186_Reverse unknown
654 JCM11249_LACTOBACILLUS_FUCHUENSIS_RS10565_|_hypothetical_protein_|_1606:2297_Forward unknown
655 JCM11249_LACTOBACILLUS_FUCHUENSIS_RS10775_|_small_protein_|_61434:61562_Forward unknown
656 JCM11249_LACTOBACILLUS_FUCHUENSIS_RS10835_|_nucleoid-associated_protein_|_67177:67484_Forward unknown
657 JCM11249_LACTOBACILLUS_FUCHUENSIS_RS10990_|_histidine_kinase_|_28686:30118_Forward unknown
658 JCM11249_LACTOBACILLUS_FUCHUENSIS_RS11005_|_alkaline_phosphatase_|_44360:46527_Reverse unknown
659 JCM11249_LACTOBACILLUS_FUCHUENSIS_RS11015_|_hypothetical_protein_|_50853:52085_Forward unknown
660 JCM11249_LACTOBACILLUS_FUCHUENSIS_RS11025_|_hypothetical_protein_|_56557:57242_Reverse unknown
661 JCM11249_LACTOBACILLUS_FUCHUENSIS_RS11045_|_cell_surface_protein_|_10452:11758_Forward unknown
662 JCM11249_LACTOBACILLUS_FUCHUENSIS_RS11060_|_hypothetical_protein_|_37908:38755_Forward unknown
663 JCM11249_LACTOBACILLUS_FUCHUENSIS_RS11155_|_hypothetical_protein_|_32676:32939_Forward unknown
664 JCM11249_LACTOBACILLUS_FUCHUENSIS_RS11315_|_hypothetical_protein_|_36879:37312_Reverse unknown
665 JCM11249_LACTOBACILLUS_FUCHUENSIS_RS11465_|_hypothetical_protein_|_12911:14232_Reverse unknown
666 JCM11249_LACTOBACILLUS_FUCHUENSIS_RS11585_|_hypothetical_protein_|_30316:34404_Reverse unknown
667 JCM11249_LACTOBACILLUS_FUCHUENSIS_RS11605_|_hypothetical_protein_|_35234:35460_Reverse unknown
668 JCM11249_LACTOBACILLUS_FUCHUENSIS_RS11640_|_hypothetical_protein_|_996:1864_Reverse unknown
669 JCM11249_LACTOBACILLUS_FUCHUENSIS_RS11690_|_hypothetical_protein_|_16391:17616_Forward unknown
670 JCM11249_LACTOBACILLUS_FUCHUENSIS_RS11815_|_hypothetical_protein_|_18187:18614_Reverse unknown
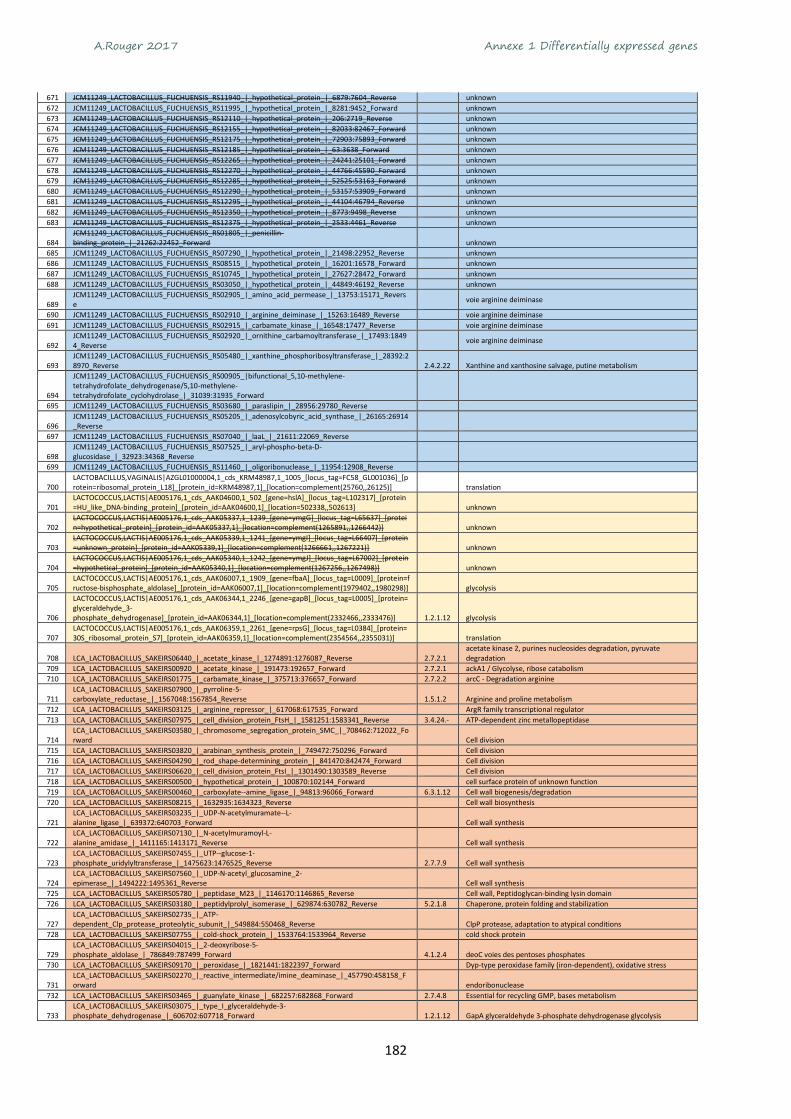
A.Rouger 2017 Annexe 1 Differentially expressed genes
182
671 JCM11249_LACTOBACILLUS_FUCHUENSIS_RS11940_|_hypothetical_protein_|_6879:7604_Reverse unknown
672 JCM11249_LACTOBACILLUS_FUCHUENSIS_RS11995_|_hypothetical_protein_|_8281:9452_Forward unknown
673 JCM11249_LACTOBACILLUS_FUCHUENSIS_RS12110_|_hypothetical_protein_|_206:2719_Reverse unknown
674 JCM11249_LACTOBACILLUS_FUCHUENSIS_RS12155_|_hypothetical_protein_|_82033:82467_Forward unknown
675 JCM11249_LACTOBACILLUS_FUCHUENSIS_RS12175_|_hypothetical_protein_|_72903:75893_Forward unknown
676 JCM11249_LACTOBACILLUS_FUCHUENSIS_RS12185_|_hypothetical_protein_|_63:3638_Forward unknown
677 JCM11249_LACTOBACILLUS_FUCHUENSIS_RS12265_|_hypothetical_protein_|_24241:25101_Forward unknown
678 JCM11249_LACTOBACILLUS_FUCHUENSIS_RS12270_|_hypothetical_protein_|_44766:45590_Forward unknown
679 JCM11249_LACTOBACILLUS_FUCHUENSIS_RS12285_|_hypothetical_protein_|_52525:53163_Forward unknown
680 JCM11249_LACTOBACILLUS_FUCHUENSIS_RS12290_|_hypothetical_protein_|_53157:53909_Forward unknown
681 JCM11249_LACTOBACILLUS_FUCHUENSIS_RS12295_|_hypothetical_protein_|_44104:46794_Reverse unknown
682 JCM11249_LACTOBACILLUS_FUCHUENSIS_RS12350_|_hypothetical_protein_|_8773:9498_Reverse unknown
683 JCM11249_LACTOBACILLUS_FUCHUENSIS_RS12375_|_hypothetical_protein_|_2533:4461_Reverse unknown
684 JCM11249_LACTOBACILLUS_FUCHUENSIS_RS01805_|_penicillin-binding_protein_|_21262:22452_Forward unknown
685 JCM11249_LACTOBACILLUS_FUCHUENSIS_RS07290_|_hypothetical_protein_|_21498:22952_Reverse unknown
686 JCM11249_LACTOBACILLUS_FUCHUENSIS_RS08515_|_hypothetical_protein_|_16201:16578_Forward unknown
687 JCM11249_LACTOBACILLUS_FUCHUENSIS_RS10745_|_hypothetical_protein_|_27627:28472_Forward unknown
688 JCM11249_LACTOBACILLUS_FUCHUENSIS_RS03050_|_hypothetical_protein_|_44849:46192_Reverse unknown
689 JCM11249_LACTOBACILLUS_FUCHUENSIS_RS02905_|_amino_acid_permease_|_13753:15171_Reverse
voie arginine deiminase
690 JCM11249_LACTOBACILLUS_FUCHUENSIS_RS02910_|_arginine_deiminase_|_15263:16489_Reverse voie arginine deiminase
691 JCM11249_LACTOBACILLUS_FUCHUENSIS_RS02915_|_carbamate_kinase_|_16548:17477_Reverse voie arginine deiminase
692 JCM11249_LACTOBACILLUS_FUCHUENSIS_RS02920_|_ornithine_carbamoyltransferase_|_17493:18494_Reverse
voie arginine deiminase
693 JCM11249_LACTOBACILLUS_FUCHUENSIS_RS05480_|_xanthine_phosphoribosyltransferase_|_28392:28970_Reverse 2.4.2.22 Xanthine and xanthosine salvage, putine metabolism
694
JCM11249_LACTOBACILLUS_FUCHUENSIS_RS00905_|bifunctional_5,10-methylene-tetrahydrofolate_dehydrogenase/5,10-methylene-tetrahydrofolate_cyclohydrolase_|_31039:31935_Forward
695 JCM11249_LACTOBACILLUS_FUCHUENSIS_RS03680_|_paraslipin_|_28956:29780_Reverse
696 JCM11249_LACTOBACILLUS_FUCHUENSIS_RS05205_|_adenosylcobyric_acid_synthase_|_26165:26914_Reverse
697 JCM11249_LACTOBACILLUS_FUCHUENSIS_RS07040_|_laaL_|_21611:22069_Reverse
698 JCM11249_LACTOBACILLUS_FUCHUENSIS_RS07525_|_aryl-phospho-beta-D-glucosidase_|_32923:34368_Reverse
699 JCM11249_LACTOBACILLUS_FUCHUENSIS_RS11460_|_oligoribonuclease_|_11954:12908_Reverse
700 LACTOBACILLUS,VAGINALIS|AZGL01000004,1_cds_KRM48987,1_1005_[locus_tag=FC58_GL001036]_[protein=ribosomal_protein_L18]_[protein_id=KRM48987,1]_[location=complement(25760,,26125)] translation
701 LACTOCOCCUS,LACTIS|AE005176,1_cds_AAK04600,1_502_[gene=hslA]_[locus_tag=L102317]_[protein=HU_like_DNA-binding_protein]_[protein_id=AAK04600,1]_[location=502338,,502613] unknown
702 LACTOCOCCUS,LACTIS|AE005176,1_cds_AAK05337,1_1239_[gene=ymgG]_[locus_tag=L65637]_[protein=hypothetical_protein]_[protein_id=AAK05337,1]_[location=complement(1265891,,1266442)] unknown
703 LACTOCOCCUS,LACTIS|AE005176,1_cds_AAK05339,1_1241_[gene=ymgI]_[locus_tag=L66407]_[protein=unknown_protein]_[protein_id=AAK05339,1]_[location=complement(1266661,,1267221)] unknown
704 LACTOCOCCUS,LACTIS|AE005176,1_cds_AAK05340,1_1242_[gene=ymgJ]_[locus_tag=L67002]_[protein=hypothetical_protein]_[protein_id=AAK05340,1]_[location=complement(1267256,,1267498)] unknown
705 LACTOCOCCUS,LACTIS|AE005176,1_cds_AAK06007,1_1909_[gene=fbaA]_[locus_tag=L0009]_[protein=fructose-bisphosphate_aldolase]_[protein_id=AAK06007,1]_[location=complement(1979402,,1980298)] glycolysis
706
LACTOCOCCUS,LACTIS|AE005176,1_cds_AAK06344,1_2246_[gene=gapB]_[locus_tag=L0005]_[protein=glyceraldehyde_3-phosphate_dehydrogenase]_[protein_id=AAK06344,1]_[location=complement(2332466,,2333476)] 1.2.1.12 glycolysis
707 LACTOCOCCUS,LACTIS|AE005176,1_cds_AAK06359,1_2261_[gene=rpsG]_[locus_tag=L0384]_[protein=30S_ribosomal_protein_S7]_[protein_id=AAK06359,1]_[location=complement(2354564,,2355031)] translation
708 LCA_LACTOBACILLUS_SAKEIRS06440_|_acetate_kinase_|_1274891:1276087_Reverse 2.7.2.1 acetate kinase 2, purines nucleosides degradation, pyruvate degradation
709 LCA_LACTOBACILLUS_SAKEIRS00920_|_acetate_kinase_|_191473:192657_Forward 2.7.2.1 ackA1 / Glycolyse, ribose catabolism
710 LCA_LACTOBACILLUS_SAKEIRS01775_|_carbamate_kinase_|_375713:376657_Forward 2.7.2.2 arcC - Degradation arginine
711 LCA_LACTOBACILLUS_SAKEIRS07900_|_pyrroline-5-carboxylate_reductase_|_1567048:1567854_Reverse 1.5.1.2 Arginine and proline metabolism
712 LCA_LACTOBACILLUS_SAKEIRS03125_|_arginine_repressor_|_617068:617535_Forward ArgR family transcriptional regulator
713 LCA_LACTOBACILLUS_SAKEIRS07975_|_cell_division_protein_FtsH_|_1581251:1583341_Reverse 3.4.24.- ATP-dependent zinc metallopeptidase
714 LCA_LACTOBACILLUS_SAKEIRS03580_|_chromosome_segregation_protein_SMC_|_708462:712022_Forward Cell division
715 LCA_LACTOBACILLUS_SAKEIRS03820_|_arabinan_synthesis_protein_|_749472:750296_Forward Cell division
716 LCA_LACTOBACILLUS_SAKEIRS04290_|_rod_shape-determining_protein_|_841470:842474_Forward Cell division
717 LCA_LACTOBACILLUS_SAKEIRS06620_|_cell_division_protein_FtsI_|_1301490:1303589_Reverse Cell division
718 LCA_LACTOBACILLUS_SAKEIRS00500_|_hypothetical_protein_|_100870:102144_Forward cell surface protein of unknown function
719 LCA_LACTOBACILLUS_SAKEIRS00460_|_carboxylate--amine_ligase_|_94813:96066_Forward 6.3.1.12 Cell wall biogenesis/degradation
720 LCA_LACTOBACILLUS_SAKEIRS08215_|_1632935:1634323_Reverse Cell wall biosynthesis
721 LCA_LACTOBACILLUS_SAKEIRS03235_|_UDP-N-acetylmuramate--L-alanine_ligase_|_639372:640703_Forward Cell wall synthesis
722 LCA_LACTOBACILLUS_SAKEIRS07130_|_N-acetylmuramoyl-L-alanine_amidase_|_1411165:1413171_Reverse Cell wall synthesis
723 LCA_LACTOBACILLUS_SAKEIRS07455_|_UTP--glucose-1-phosphate_uridylyltransferase_|_1475623:1476525_Reverse 2.7.7.9 Cell wall synthesis
724 LCA_LACTOBACILLUS_SAKEIRS07560_|_UDP-N-acetyl_glucosamine_2-epimerase_|_1494222:1495361_Reverse Cell wall synthesis
725 LCA_LACTOBACILLUS_SAKEIRS05780_|_peptidase_M23_|_1146170:1146865_Reverse Cell wall, Peptidoglycan-binding lysin domain
726 LCA_LACTOBACILLUS_SAKEIRS03180_|_peptidylprolyl_isomerase_|_629874:630782_Reverse 5.2.1.8 Chaperone, protein folding and stabilization
727 LCA_LACTOBACILLUS_SAKEIRS02735_|_ATP-dependent_Clp_protease_proteolytic_subunit_|_549884:550468_Reverse ClpP protease, adaptation to atypical conditions
728 LCA_LACTOBACILLUS_SAKEIRS07755_|_cold-shock_protein_|_1533764:1533964_Reverse cold shock protein
729 LCA_LACTOBACILLUS_SAKEIRS04015_|_2-deoxyribose-5-phosphate_aldolase_|_786849:787499_Forward 4.1.2.4 deoC voies des pentoses phosphates
730 LCA_LACTOBACILLUS_SAKEIRS09170_|_peroxidase_|_1821441:1822397_Forward Dyp-type peroxidase family (iron-dependent), oxidative stress
731 LCA_LACTOBACILLUS_SAKEIRS02270_|_reactive_intermediate/imine_deaminase_|_457790:458158_Forward endoribonuclease
732 LCA_LACTOBACILLUS_SAKEIRS03465_|_guanylate_kinase_|_682257:682868_Forward 2.7.4.8 Essential for recycling GMP, bases metabolism
733 LCA_LACTOBACILLUS_SAKEIRS03075_|_type_I_glyceraldehyde-3-phosphate_dehydrogenase_|_606702:607718_Forward 1.2.1.12 GapA glyceraldehyde 3-phosphate dehydrogenase glycolysis

A.Rouger 2017 Annexe 1 Differentially expressed genes
183
734 LCA_LACTOBACILLUS_SAKEIRS05880_|_pgi_|_glucose-6-phosphate_isomerase_|_1161804:1163150_Reverse 5.3.1.9 Glycolysis
735 LCA_LACTOBACILLUS_SAKEIRS06595_|_glucokinase_|_1298719:1299690_Reverse 2.7.1.2 glycolysis
736 LCA_LACTOBACILLUS_SAKEIRS07590_|_fructose-1,6-bisphosphate_aldolase,_class_II_|_1499463:1500326_Reverse 4.1.2.13 Glycolysis
737 LCA_LACTOBACILLUS_SAKEIRS05925_|_pyruvate_oxidase_|_1170993:1172828_Forward 1.2.3.3 Glycolysis end products, Pyruvate + phosphate + O(2) <=> acetyl phosphate + CO(2) + H(2)O(2)
738 LCA_LACTOBACILLUS_SAKEIRS00960_|_gpmA_|_2,3-bisphosphoglycerate-dependent_phosphoglycerate_mutase_|_198757:199446_Forward 5.4.2.1
Glycolysis heterolactic fermentation or gluconeogenesis (il y en a 5 dans le génome de 23K)
739 LCA_LACTOBACILLUS_SAKEIRS08020_|_L-lactate_dehydrogenase_|_1593030:1594007_Forward 1.1.1.27 Glycolysis/fermentation
740 LCA_LACTOBACILLUS_SAKEIRS00650_|_GMP_synthetase_|_132817:134370_Forward 6.3.5.2 guaA synthese des nucleotides
741 LCA_LACTOBACILLUS_SAKEIRS01230_|_glyceraldehyde_3-phosphate_reductase_|_255502:256488_Forward gylcolyse
742 LCA_LACTOBACILLUS_SAKEIRS01405_|_6-phosphogluconate_dehydrogenase_|_295038:295937_Forward 1.1.1.44 Heterolactic fermentation
743 LCA_LACTOBACILLUS_SAKEIRS06840_|_hydrolase_|_1347653:1348165_Reverse Hydrolase of unknown function
744 LCA_LACTOBACILLUS_SAKEIRS04860_|_manganese-dependent_inorganic_pyrophosphatase_|_960467:961390_Reverse 3.6.1.1
manganese-dependent inorganic pyrophosphatase, phosphate metabolism
745 LCA_LACTOBACILLUS_SAKEIRS05955_|_membrane_protein_|_1175960:1176640_Forward Membrane protein of unknown function
746 LCA_LACTOBACILLUS_SAKEIRS06855_|_insertase_|_1349511:1350500_Forward Membrane protein of unknown function
747 LCA_LACTOBACILLUS_SAKEIRS01150_|_manganese_transporter_|_241472:243046_Forward Mn(2+)/Fe(2+) transport protein
748 LCA_LACTOBACILLUS_SAKEIRS00845_|_membrane_protein_|_173993:174853_Forward mtsB Abc transporter manganese
749 LCA_LACTOBACILLUS_SAKEIRS00840_|_manganese_transporter_|_173256:173996_Forward mtsC ABC transporter manganese
750 LCA_LACTOBACILLUS_SAKEIRS02940_|_NADH_peroxidase_|_585192:586544_Forward 1.11.1.1 NADH peroxidase LSA0575 redox
751 LCA_LACTOBACILLUS_SAKEIRS01355_|_nucleoside_transporter_|_284050:285285_Forward nucleoside permease
752 LCA_LACTOBACILLUS_SAKEIRS01515_|_peptide_transporter_|_322553:324490_Forward oligopeptide transporter
753 LCA_LACTOBACILLUS_SAKEIRS00930_|_ribose_transporter_RbsU_|_193092:193976_Forward operon ribose
754 LCA_LACTOBACILLUS_SAKEIRS00935_|_D-ribose_pyranase_|_193997:194392_Forward operon ribose
755 LCA_LACTOBACILLUS_SAKEIRS00940_|_ribokinase_|_194412:195320_Forward operon ribose
756 LCA_LACTOBACILLUS_SAKEIRS06665_|_eutD_|_phosphate_acetyltransferase_|_1313600:1314586_Reverse 2.3.1.8 Pathway: purine nucleobases degradation II (anaerobic)
757 LCA_LACTOBACILLUS_SAKEIRS01525_|_peptidase_C69_|_324882:326303_Forward 3.4.-.- peptidase U34
758 LCA_LACTOBACILLUS_SAKEIRS03080_|_phosphoglycerate_kinase_|_607819:609033_Forward 2.7.2.3 PGK phosphoglycerate kinase glycolysis
759 LCA_LACTOBACILLUS_SAKEIRS01370_|_phosphoketolase_|_286496:288859_Forward 4.1.2.9 Phosphoketolase/ D-xylulose 5-phosphate/D-fructose 6-phosphate phosphoketolase
760 LCA_LACTOBACILLUS_SAKEIRS05220_|_obgE_|_GTPase_ObgE_|_1037400:1038692_Reverse ppGpp-binding GTPase involved in cell partioning, DNA repair and ribosome assembly
761 LCA_LACTOBACILLUS_SAKEIRS06485_|_transcriptional_regulator_|_1281049:1281780_Reverse Probable transcriptional regulatory , target unknown
762 LCA_LACTOBACILLUS_SAKEIRS05615_|_ATP_synthase_subunit_gamma_|_1115551:1116498_Reverse 3.6.3.14 Produces ATP from ADP in the presence of a proton gradient across the membrane F0F1 ATPase
763 LCA_LACTOBACILLUS_SAKEIRS05625_|_ATP_synthase_subunit_delta_|_1118074:1118616_Reverse 3.6.3.14 Produces ATP from ADP in the presence of a proton gradient across the membrane F0F1 ATPase
764 LCA_LACTOBACILLUS_SAKEIRS05630_|_ATP_synthase_subunit_B_|_1118603:1119124_Reverse 3.6.3.14 Produces ATP from ADP in the presence of a proton gradient across the membrane F0F1 ATPase
765 LCA_LACTOBACILLUS_SAKEIRS05640_|_F0F1_ATP_synthase_subunit_A_|_1119418:1120131_Reverse 3.6.3.14 Produces ATP from ADP in the presence of a proton gradient across the membrane F0F1 ATPase
766 LCA_LACTOBACILLUS_SAKEIRS01680_|_PTS_sugar_transporter_subunit_IIB_|_353900:354217_Forward 2.7.1.69 PTS EIIB cellobiose
767 LCA_LACTOBACILLUS_SAKEIRS07260_|_phosphocarrier_protein_HPr_|_1439647:1439913_Reverse 2.7.11.- PTS general enzyme HPr, PTS sugar utilization
768 LCA_LACTOBACILLUS_SAKEIRS07255_|_phosphoenolpyruvate--protein_phosphotransferase_|_1437923:1439647_Reverse 2.7.3.9 PTS general Enzyme I, PTS sugar utilization
769 LCA_LACTOBACILLUS_SAKEIRS03970_|_1-(5-phosphoribosyl)-5-amino-4-imidazole-_carboxylate_carboxylase_|_779645:780427_Forward PurE like, purine metabolism
770 LCA_LACTOBACILLUS_SAKEIRS06275_|_pyrH_|_UMP_kinase_|_1246332:1247057_Reverse 2.7.4.22 purine and pyrimidine metabolism; pyrimidine ribonucleotides interconversion
771 LCA_LACTOBACILLUS_SAKEIRS09050_|_deoxyadenosine_kinase_|_1795859:1796515_Forward
2.7.1.74, 2.7.1.76 Purine metabolism, ATP + deoxyadenosine <=> ADP + dAMP
772 LCA_LACTOBACILLUS_SAKEIRS02530_|_ribonuclease_Y_|_506382:507947_Forward 3.1.4.16 Putative 2',3'-cyclic-nucleotide 2'-phosphodiesterase. RNA degradation
773 LCA_LACTOBACILLUS_SAKEIRS02440_|_hypothetical_protein_|_488035:489060_Reverse 3.1.1.31 Putative 6-phosphogluconolactonase produit 6P-gluconate Utilisation des suches
774 LCA_LACTOBACILLUS_SAKEIRS07185_|_adaptor_protein_MecA_|_1421409:1422098_Reverse putative adaptor protein controlling oligomerization of the AAA+ protein ClpC, Role: control, adaptation
775 LCA_LACTOBACILLUS_SAKEIRS06820_|_aminodeoxychorismate_lyase_|_1342235:1343386_Reverse 4.1.3.38 putative aminodeoxychorismate lyase family protein, 4-amino-4-deoxychorismate <=> 4-aminobenzoate + pyruvate
776 LCA_LACTOBACILLUS_SAKEIRS03805_|_cell_division_protein_SepF_|_747929:748363_Forward putative cell division
777 LCA_LACTOBACILLUS_SAKEIRS01500_|_short-chain_dehydrogenase_|_319948:320589_Reverse putative protein
778 LCA_LACTOBACILLUS_SAKEIRS06600_|_hypothetical_protein_|_1299687:1299920_Reverse Putative transcription factor of unknown function
779 LCA_LACTOBACILLUS_SAKEIRS06980_|_MarR_family_transcriptional_regulator_|_1374739:1375230_Reverse Putative transcriptional regulator, MarR family, unknown target
780 LCA_LACTOBACILLUS_SAKEIRS07295_|_hypothetical_protein_|_1446610:1447950_Reverse Putative transporter, unknown substrate
781 LCA_LACTOBACILLUS_SAKEIRS09415_|_ABC_transporter_ATP-binding_protein_|_1874495:1876119_Reverse Putative transporter, unknown substrate
782 LCA_LACTOBACILLUS_SAKEIRS00915_|_MarR_family_transcriptional_regulator_|_190786:191328_Forward Regulator ackA?
783 LCA_LACTOBACILLUS_SAKEIRS00010_|_DNA_polymerase_III_subunit_beta_|_1734:2873_Forward replication
784 LCA_LACTOBACILLUS_SAKEIRS00040_|_single-stranded_DNA-binding_protein_|_9683:10195_Forward Replication
785 LCA_LACTOBACILLUS_SAKEIRS02525_|_DNA_recombination/repair_protein_RecA_|_504928:505995_Forward Replication/recombination
786 LCA_LACTOBACILLUS_SAKEIRS07625_|_helicase_|_1505389:1506735_Reverse Replication/transcription
787 LCA_LACTOBACILLUS_SAKEIRS07990_|_RNA-binding_protein_|_1585478:1585921_Reverse 2.7.7.8 S1 RNA binding domain protein
788 LCA_LACTOBACILLUS_SAKEIRS01805_|_preprotein_translocase_subunit_YajC_|_383023:383379_Forward Secretion
789 LCA_LACTOBACILLUS_SAKEIRS02560_|_protein_translocase_subunit_SecA_|_512874:515237_Forward Secretion
790 LCA_LACTOBACILLUS_SAKEIRS09445_|_hypothetical_protein_|_1882883:1883662_Reverse Secretion system?
791 LCA_LACTOBACILLUS_SAKEIRS04215_|_universal_stress_protein_UspA_|_823411:823905_Reverse stress repsonse
792 LCA_LACTOBACILLUS_SAKEIRS00185_|_universal_stress_protein_UspA_|_36687:37160_Forward stress response
793 LCA_LACTOBACILLUS_SAKEIRS01155_|_universal_stress_protein_UspA_|_243064:243498_Forward Stress response
794 LCA_LACTOBACILLUS_SAKEIRS03220_|_thiol_reductase_thioredoxin_|_636150:636470_Forward Thioredoxine LSA0634 Redox
795 LCA_LACTOBACILLUS_SAKEIRS03090_|_eno_|_enolase_|_609932:611227_Forward 5.3.1.1 TPI Triose phosphate isomerase glycolysis

A.Rouger 2017 Annexe 1 Differentially expressed genes
184
796 LCA_LACTOBACILLUS_SAKEIRS06445_|_DNA_methyltransferase_|_1276109:1277119_Reverse Transcription
797 LCA_LACTOBACILLUS_SAKEIRS06220_|_transcription_termination/antitermination_protein_NusA_|_1229357:1230574_Reverse Transcription; transcription elongation factor NusA
798 LCA_LACTOBACILLUS_SAKEIRS07520_|_transcriptional_regulator_|_1487955:1488926_Reverse Transcriptional regulator, unknown target
799 LCA_LACTOBACILLUS_SAKEIRS00035_|_30S_ribosomal_protein_S6_|_9348:9644_Forward Translation
800 LCA_LACTOBACILLUS_SAKEIRS00045_|_30S_ribosomal_protein_S18_|_10226:10465_Forward Translation
801 LCA_LACTOBACILLUS_SAKEIRS03390_|_50S_ribosomal_protein_L21_|_672083:672391_Forward Translation
802 LCA_LACTOBACILLUS_SAKEIRS03405_|_elongation_factor_P_|_673365:673922_Forward Translation
803 LCA_LACTOBACILLUS_SAKEIRS03620_|_RNA-binding_protein_|_719456:719698_Forward Translation
804 LCA_LACTOBACILLUS_SAKEIRS03825_|_ileS_|_isoleucine--tRNA_ligase_|_750528:753314_Forward 6.1.1.5 Translation
805 LCA_LACTOBACILLUS_SAKEIRS04245_|_30S_ribosomal_protein_S4_|_829520:830125_Reverse Translation
806 LCA_LACTOBACILLUS_SAKEIRS04345_|_aspS_|_aspartate--tRNA_ligase_|_852574:854346_Forward Translation
807 LCA_LACTOBACILLUS_SAKEIRS04940_|_gid_|_tRNA_(uracil-5-)-methyltransferase_|_980403:981714_Reverse Translation
808 LCA_LACTOBACILLUS_SAKEIRS05190_|_50S_ribosomal_protein_L32_|_1029820:1030002_Reverse Translation
809 LCA_LACTOBACILLUS_SAKEIRS05295_|_tig_|_trigger_factor_|_1056051:1057346_Reverse Translation
810 LCA_LACTOBACILLUS_SAKEIRS05300_|_tuf_|_elongation_factor_Tu_|_1057557:1058747_Reverse Translation
811 LCA_LACTOBACILLUS_SAKEIRS05310_|_RNase_J_family_beta-CASP_ribonuclease_|_1060006:1061724_Reverse Translation
812 LCA_LACTOBACILLUS_SAKEIRS05320_|_30S_ribosomal_protein_S20_|_1062501:1062755_Forward Translation
813 LCA_LACTOBACILLUS_SAKEIRS06270_|_ribosome_recycling_factor_|_1245772:1246329_Reverse Translation
814 LCA_LACTOBACILLUS_SAKEIRS06280_|_elongation_factor_Ts_|_1247193:1248068_Reverse Translation
815 LCA_LACTOBACILLUS_SAKEIRS06925_|_50S_ribosomal_protein_L20_|_1362034:1362393_Reverse Translation
816 LCA_LACTOBACILLUS_SAKEIRS07000_|_ribonuclease_R_|_1378741:1381095_Reverse Translation
817 LCA_LACTOBACILLUS_SAKEIRS07045_|_arginine--tRNA_ligase_|_1389483:1391174_Reverse Translation
818 LCA_LACTOBACILLUS_SAKEIRS08115_|_rpmE2_|_50S_ribosomal_protein_L31_type_B_|_1611937:1612200_Reverse Translation
819 LCA_LACTOBACILLUS_SAKEIRS08265_|_methionine--tRNA_ligase_|_1641460:1643505_Reverse Translation
820 LCA_LACTOBACILLUS_SAKEIRS08305_|_rplL_|_50S_ribosomal_protein_L7/L12_|_1648874:1649242_Reverse Translation
821 LCA_LACTOBACILLUS_SAKEIRS08355_|_50S_ribosomal_protein_L33_|_1658051:1658200_Reverse Translation
822 LCA_LACTOBACILLUS_SAKEIRS08575_|_30S_ribosomal_protein_S9_|_1705186:1705578_Reverse Translation
823 LCA_LACTOBACILLUS_SAKEIRS08695_|_50S_ribosomal_protein_L30_|_1728860:1729045_Reverse Translation
824 LCA_LACTOBACILLUS_SAKEIRS08715_|_30S_ribosomal_protein_S8_|_1730543:1730941_Reverse Translation
825 LCA_LACTOBACILLUS_SAKEIRS08740_|_50S_ribosomal_protein_L29_|_1732793:1732987_Reverse Translation
826 LCA_LACTOBACILLUS_SAKEIRS08770_|_50S_ribosomal_protein_L23_|_1735697:1735981_Reverse Translation
827 LCA_LACTOBACILLUS_SAKEIRS08775_|_50S_ribosomal_protein_L4_|_1735981:1736604_Reverse Translation
828 LCA_LACTOBACILLUS_SAKEIRS08785_|_30S_ribosomal_protein_S10_|_1737304:1737612_Reverse Translation
829 LCA_LACTOBACILLUS_SAKEIRS09450_|_rnpA_|_ribonuclease_P_protein_component_|_1883731:1884093_Reverse Translation
830 LCA_LACTOBACILLUS_SAKEIRS09455_|_50S_ribosomal_protein_L34_|_1884159:1884299_Reverse Translation
831 LCA_LACTOBACILLUS_SAKEIRS07320_|_hypothetical_protein_|_1452214:1452783_Reverse Translation, putative tRNA binding factor
832 LCA_LACTOBACILLUS_SAKEIRS03985_|_glycerol_transporter_|_781764:782477_Forward Transporter (facilitator) unknown substrate
833 LCA_LACTOBACILLUS_SAKEIRS00660_|_integrase_|_135980:136900_Reverse transposase
834 LCA_LACTOBACILLUS_SAKEIRS01005_|_integrase_|_210685:211605_Forward Transposase
835 LCA_LACTOBACILLUS_SAKEIRS05740_|_integrase_|_1141271:1142191_Reverse transposase
836 LCA_LACTOBACILLUS_SAKEIRS00855_|_amidase_|_175881:176387_Forward Uncharacterized isochorismatase family protein
837 LCA_LACTOBACILLUS_SAKEIRS00050_|_hypothetical_protein_|_10683:12716_Forward unknown
838 LCA_LACTOBACILLUS_SAKEIRS01170_|_hypothetical_protein_|_245582:246370_Forward Unknown
839 LCA_LACTOBACILLUS_SAKEIRS01980_|_hypothetical_protein_|_419971:420408_Forward Unknown
840 LCA_LACTOBACILLUS_SAKEIRS02675_|_hypothetical_protein_|_535680:536081_Forward Unknown
841 LCA_LACTOBACILLUS_SAKEIRS03240_|_membrane_protein_|_640800:641501_Forward Unknown
842 LCA_LACTOBACILLUS_SAKEIRS03395_|_hypothetical_protein_|_672406:672747_Forward Unknown
843 LCA_LACTOBACILLUS_SAKEIRS03530_|_hypothetical_protein_|_695401:697071_Forward Unknown
844 LCA_LACTOBACILLUS_SAKEIRS03965_|_hypothetical_protein_|_778359:779633_Forward Unknown
845 LCA_LACTOBACILLUS_SAKEIRS03975_|_hypothetical_protein_|_780424:781248_Forward Unknown
846 LCA_LACTOBACILLUS_SAKEIRS03980_|_hypothetical_protein_|_781230:781700_Forward Unknown
847 LCA_LACTOBACILLUS_SAKEIRS03990_|_hypothetical_protein_|_782498:782803_Forward Unknown
848 LCA_LACTOBACILLUS_SAKEIRS03995_|_TIGR00268_family_protein_|_782828:783664_Forward Unknown
849 LCA_LACTOBACILLUS_SAKEIRS04810_|_hypothetical_protein_|_950590:951459_Forward Unknown
850 LCA_LACTOBACILLUS_SAKEIRS04995_|_hypothetical_protein_|_990582:991427_Reverse Unknown
851 LCA_LACTOBACILLUS_SAKEIRS07635_|_hypothetical_protein_|_1507960:1508304_Forward Unknown
852 LCA_LACTOBACILLUS_SAKEIRS08035_|_hypothetical_protein_|_1596722:1597402_Forward Unknown
853 LCA_LACTOBACILLUS_SAKEIRS08085_|_membrane_protein_|_1606162:1606728_Reverse Unknown
854 LCA_LACTOBACILLUS_SAKEIRS08470_|_hypothetical_protein_|_1682910:1683128_Reverse Unknown
855 LCA_LACTOBACILLUS_SAKEIRS09140_|_hypothetical_protein_|_1815066:1815596_Reverse Unknown
856 LCA_LACTOBACILLUS_SAKEIRS09545_|_hypothetical_protein_|_1471062:1471496_Reverse Unknown
857 LCA_LACTOBACILLUS_SAKEIRS03285_|_CHAP_domain-containing_protein_|_649323:650597_Forward Unknown cell surface protein
858 LCA_LACTOBACILLUS_SAKEIRS04390_|_hypothetical_protein_|_861331:861774_Forward Unknown or translation
859 LCA_LACTOBACILLUS_SAKEIRS02370_|_hypothetical_protein_|_475428:475661_Forward unkwnown
860 LCA_LACTOBACILLUS_SAKEIRS02640_|_hypothetical_protein_|_530102:531577_Forward unkwnown
861 LCA_LACTOBACILLUS_SAKEIRS03160_|_hypothetical_protein_|_624469:624813_Forward unkwnown
862 LCA_LACTOBACILLUS_SAKEIRS05225_|_hypothetical_protein_|_1038851:1039945_Reverse unkwnown
863 LCA_LACTOBACILLUS_SAKEIRS01985_|_dipeptidase_|_420820:421917_Reverse 3.4.13.9 Xaa Pro dipeptidase PepQ
864 LCA_LACTOBACILLUS_SAKEIRS07735_|_xanthine_phosphoribosyltransferase_|_1530643:1531230_Reverse 2.4.2.22 Xanthine and xanthosine salvage, putine metabolism
865 LCA_LACTOBACILLUS_SAKEIRS08080_|_zinc_metalloprotease_HtpX_|_1605249:1606148_Reverse Zn-dependent protease with chaperone function, stress response
866 LCRIS_LACTOBACILLUS_CRISPATUS_RS02865_|_integrase_|_544887:545807_Reverse Unknown
867 LHE_LACTOBACILLUS_HELVETICUS_RS12800_|_transposase_|_276037:276707_Reverse Unknown
868 RT94_PSEUDOMONAS_VIRIDIFLAVA_RS24855_|_RT94_PSEUDOMONAS_VIRIDIFLAVA_RS24855_|_hypothetical_protein_|_63909:64787_Reverse Unknown
869 SFRI_SHEWANELLA_FRIGIDIMARINA_RS05600_|_SFRI_SHEWANELLA_FRIGIDIMARINA_RS05600_|_raiA_ribosome-associated_inhibitor_A_|_1282848:1283204_Forward Unknown

A.Rouger 2017 Annexe 1 Differentially expressed genes
185
Differentially expressed genes up-regulated in UB condition.
UBvsCup _ descriptions ec number remarques
1 ACINETOBACTER,JUNII|KB849655,1_cds_ENV65579,1_2876_[protein=hypothetical_protein]_[protein_id=ENV65579,1]_[location=complement(1853605,,1854057)]
2 AYI71_LACTOBACILLUS_ORIS_RS08120_|_AYI71_LACTOBACILLUS_ORIS_RS08120_|_protease_|_1624179:1624682_Reverse
3 BN424_CARNOBACTERIUM_MALTAROMATICUM_RS02735_|_queT_transporter_family_protein_|_642717:643205_Forward
hypothetical Membrane protein
4 BN424_CARNOBACTERIUM_MALTAROMATICUM_RS03365_|_Na+/H+_antiporter_NhaC_|_785652:787052_Forward
Na(+)/H(+) antiporter NhaC or Arginine/ornithine antiporter ArcD
5 BN424_CARNOBACTERIUM_MALTAROMATICUM_RS11580_|_DNA_helicase_UvrD_|_2471406:2473698_Reverse
Putative ATP-dependent DNA helicase (replication, transcription)
6 BN424_CARNOBACTERIUM_MALTAROMATICUM_RS14500_|_MFS_transporter_|_3091994:3093241_Reverse
Putative metabolite transport protein
7 BN424_CARNOBACTERIUM_MALTAROMATICUM_RS09305_|_DeoR_family_transcriptional_regulator_|_2003950:2004702_Forward
regulation operon fructose
8 BN424_CARNOBACTERIUM_MALTAROMATICUM_RS09100_|_haloacid_dehalogenase_|_1960211:1960924_Forward
Uncharacterized HAD-hydrolase
9 BN424_CARNOBACTERIUM_MALTAROMATICUM_RS03470_|_QacE_family_quaternary_ammonium_compound_efflux_SMR_transporter_|_806468:806791_Forward
uncharacterized protein
10 BN424_CARNOBACTERIUM_MALTAROMATICUM_RS09925_|_hypothetical_protein_|_2138520:2139344_Reverse
Unknown
11 BR52_CARNOBACTERIUM_DIVERGENS_RS01095_|_Na+/H+_antiporter_NhaC_|_231526:232932_Forward
[Carnobacterium divergens V41 WGS CDIV41] nhaC | Na(+)/H(+) antiporter NhaC putative
12 BR52_CARNOBACTERIUM_DIVERGENS_RS02995_|_604720:605040_Forward 50S RNA-binding protein, translation?
13 BR52_CARNOBACTERIUM_DIVERGENS_RS08580_|_GNAT_family_acetyltransferase_|_1776641:1777093_Forward
2.3.1.- Acetyltransferase, unknown substrate
14 BR52_CARNOBACTERIUM_DIVERGENS_RS02840_|_bifunctional_acetaldehyde-CoA/alcohol_dehydrogenase_|_571790:574393_Forward
1.1.1.1/1.2.1.10
ADH Aldehyde-alcohol dehydrogenase 2 [Includes: Alcohol dehydrogenase ; Acetaldehyde dehydrogenase] Acetaldehyde + CoA + NAD(+) <=> acetyl-CoA + NADH and An alcohol + NAD(+) <=> an aldehyde or ketone + NADH
15 BR52_CARNOBACTERIUM_DIVERGENS_RS03150_|_alpha/beta_hydrolase_|_635545:636474_Forward Alpha/beta hydrolase, unknown specificity, unknown substrate
16 BR52_CARNOBACTERIUM_DIVERGENS_RS02180_|_amino_acid_permease_|_433016:434338_Forward
aminoacid permease. Unknown substrate
17 BR52_CARNOBACTERIUM_DIVERGENS_RS03705_|_GTP-binding_protein_|_747417:749261_Forward bipA | GTPase homolog, Ribosome fixation, Translation
18 BR52_CARNOBACTERIUM_DIVERGENS_RS00375_|_eutD_|_phosphate_acetyltransferase_|_76506:77486_Forward
2.3.1.8 Carnobacterium divergens V41 WGS CDIV41] pta | Phosphate acetyltransferase Acetyl-CoA + phosphate <=> CoA + acetyl phosphate, heterolactic fermentation
19 BR52_CARNOBACTERIUM_DIVERGENS_RS00210_|_transporter_|_41826:43259_Reverse CDIV41_v1_140053 [Carnobacterium divergens V41 WGS CDIV41] ycaM | putative transporter unknown substrate
20 BR52_CARNOBACTERIUM_DIVERGENS_RS00335_|_glutamine_ABC_transporter_permease_|_69051:70493_Reverse
CDIV41_v1_140081 [Carnobacterium divergens V41 WGS CDIV41] glnP | Amino ABC transporter, permease , 3-TM region,His/Glu/Gln/Arg/opine family domain protein
21 BR52_CARNOBACTERIUM_DIVERGENS_RS02435_|_hypothetical_protein_|_487002:489878_Reverse Cell wall peptidoglycan synthesis, Transglycosylase family protein
22 BR52_CARNOBACTERIUM_DIVERGENS_RS03535_|_membrane_protein_|_709468:710337_Forward conserved membrane protein of unknown function
23 BR52_CARNOBACTERIUM_DIVERGENS_RS08750_|_membrane_protein_|_1807077:1807574_Reverse conserved membrane protein of unknown function
24 BR52_CARNOBACTERIUM_DIVERGENS_RS09915_|_membrane_protein_|_2066304:2067227_Reverse conserved membrane protein of unknown function
25 BR52_CARNOBACTERIUM_DIVERGENS_RS09920_|_membrane_protein_|_2067227:2067937_Reverse conserved membrane protein of unknown function
26 BR52_CARNOBACTERIUM_DIVERGENS_RS08355_|_transcriptional_regulator_|_1720277:1720585_Reverse
czrA | transcriptional regulator (multiple metal-sensing ArsR-SmtB transcriptional repressors family)
27 BR52_CARNOBACTERIUM_DIVERGENS_RS04920_|_peptide_ABC_transporter_permease_|_1000998:1002458_Forward
dtpT | di-tripeptide-proton ABC symporter
28 BR52_CARNOBACTERIUM_DIVERGENS_RS10420_|_flavocytochrome_c_|_2181371:2182897_Reverse FMN-binding_protein
29 BR52_CARNOBACTERIUM_DIVERGENS_RS07515_|_glucose_transporter_GlcU_|_1543245:1544096_Reverse
Glucose uptake protein GlcU, glucose transport
30 BR52_CARNOBACTERIUM_DIVERGENS_RS03865_|_glycine/betaine_ABC_transporter_ATP-binding_protein_|_782766:783959_Reverse
glycine/betaine_ABC_transporter_ATP-binding_protein, osmotic cold shock stress response, catalyzes the osmotically controlled import of the compatible solutes glycine betaine and proline betaine
31 BR52_CARNOBACTERIUM_DIVERGENS_RS00995_|_sodium:dicarboxylate_symporter_|_209259:210653_Forward
L-cystine uptake protein TcyP
32 BR52_CARNOBACTERIUM_DIVERGENS_RS00355_|_72663:73652_Forward 1.1.1.28 ldhD | D-lactate dehydrogenase | 1.1.1.28 |Glycolysis CDIV41_v1_140085 [Carnobacterium divergens V41 WGS CDIV41]
33 BR52_CARNOBACTERIUM_DIVERGENS_RS09910_|_pyroglutamyl-peptidase_I_|_2065620:2066267_Reverse
3.4.19.3
Les 4 genes font 1 opéron mais 3 inconnues, pcp, pyrrolidone-carboxylate peptidase , Release of an N-terminal pyroglutamyl group from a polypeptide, the second amino acid generally not being Pro
34 BR52_CARNOBACTERIUM_DIVERGENS_RS06500_|_MFS_transporter_|_1328162:1329595_Reverse Major Facilitator Superfamily
35 BR52_CARNOBACTERIUM_DIVERGENS_RS08585_|_peptidase_|_1777117:1777776_Forward 3.4.-.- membrane protein, protease family protein
36 BR52_CARNOBACTERIUM_DIVERGENS_RS08510_|_NAD(+)_synthetase_|_1756836:1757666_Reverse 6.3.5.1 nadE | ammonium-dependent NAD+ synthetase the enzyme that catalyzes the final reaction in the biosynthesis of NAD, ATP + deamido-NAD(+) + NH(3) <=> AMP + diphosphate + NAD(+)

A.Rouger 2017 Annexe 1 Differentially expressed genes
186
37 BR52_CARNOBACTERIUM_DIVERGENS_RS06640_|_guanine_permease_|_1363383:1364684_Forward pbuO hypoxanthine/guanine permease regulated by PurR
38 BR52_CARNOBACTERIUM_DIVERGENS_RS04605_|_glycerol-3-phosphate_acyltransferase_|_930079:930672_Reverse
plsY | acylphosphate:glycerol-3-phosphate acyltransferase, metabolism of lipids
39 BR52_CARNOBACTERIUM_DIVERGENS_RS02280_|_DNA-binding_response_regulator_|_452977:453717_Reverse
Putative accessory gene regulator A, AgrA family, unknown target
40 BR52_CARNOBACTERIUM_DIVERGENS_RS02985_|_haloacid_dehalogenase_|_603013:603546_Forward
Putative hydrolase, haloacid dehalogenase family unknown function
41 BR52_CARNOBACTERIUM_DIVERGENS_RS05540_|_membrane_protein_|_1138530:1139144_Reverse putative membrane protein of unknow function
42 BR52_CARNOBACTERIUM_DIVERGENS_RS07270_|_yibE/F-like_family_protein_|_1492505:1493632_Reverse
Putative transporter, unknown substrate
43 BR52_CARNOBACTERIUM_DIVERGENS_RS11030_|_single-stranded_DNA-binding_protein_|_2310854:2311429_Reverse
replication
44 BR52_CARNOBACTERIUM_DIVERGENS_RS03390_|_50S_ribosomal_protein_L21_|_679657:679965_Forward
translation
45 BR52_CARNOBACTERIUM_DIVERGENS_RS06375_|_50S_ribosomal_protein_L20_|_1300913:1301272_Reverse
translation
46 BR52_CARNOBACTERIUM_DIVERGENS_RS06380_|_50S_ribosomal_protein_L35_|_1301391:1301591_Reverse
translation
47 BR52_CARNOBACTERIUM_DIVERGENS_RS06385_|_translation_initiation_factor_IF-3_|_1301622:1302143_Reverse
translation
48 BR52_CARNOBACTERIUM_DIVERGENS_RS07700_|_translation_factor_Sua5_|_1573057:1574073_Reverse
translation
49 BR52_CARNOBACTERIUM_DIVERGENS_RS08860_|_50S_ribosomal_protein_L31_|_1825395:1825658_Reverse
translation
50 BR52_CARNOBACTERIUM_DIVERGENS_RS09965_|_50S_ribosomal_protein_L10_|_2076021:2076521_Reverse
translation
51 BR52_CARNOBACTERIUM_DIVERGENS_RS11035_|_30S_ribosomal_protein_S6_|_2311482:2311781_Reverse
translation
52 BR52_CARNOBACTERIUM_DIVERGENS_RS07705_|_protein-(glutamine-N5)_methyltransferase,_release_factor-specific_|_1574098:1574949_Reverse
Translation, Metabolism of coenzymes and prosthetic groups, prmC | glutamine methylase of release factor 1, Class I release factors bind to ribosomes in response to stop codons and trigger peptidyl-tRNA hydrolysis
53 BR52_CARNOBACTERIUM_DIVERGENS_RS11845_|_porin_|_2488321:2488989_Forward transport?
54 BR52_CARNOBACTERIUM_DIVERGENS_RS05905_|_gamma-aminobutyrate_permease_|_1206584:1208059_Forward
Transporter, lysP | Lysine-specific permease
55 BR52_CARNOBACTERIUM_DIVERGENS_RS03395_|_hypothetical_protein_|_679983:680315_Forward Unknown
56 BR52_CARNOBACTERIUM_DIVERGENS_RS08240_|_hypothetical_protein_|_1695543:1696046_Forward
Unknown
57 BR52_CARNOBACTERIUM_DIVERGENS_RS10005_|_FMN-binding_protein_|_2082543:2083478_Reverse
Unknown
58 BR52_CARNOBACTERIUM_DIVERGENS_RS04740_|_hypothetical_protein_|_960154:961083_Forward Unknown
59 BR52_CARNOBACTERIUM_DIVERGENS_RS11695_|_hypothetical_protein_|_2455563:2456708_Reverse
Unknown
60 BR52_CARNOBACTERIUM_DIVERGENS_RS12620_|_hypothetical_protein_|_1955598:1959860_Reverse
Unknown
61 BR52_CARNOBACTERIUM_DIVERGENS_RS09905_|_butirosin_biosynthesis_protein_BtrG_|_2065165:2065620_Reverse
Unknown function
62 BR52_CARNOBACTERIUM_DIVERGENS_RS05895_|_MarR_family_transcriptional_regulator_|_1203549:1203926_Forward
ytcD | putative transcriptional regulator (MarD family) Unknown target
63 FD34_LACTOBACILLUS_PONTIS_RS06280_|_1,3-propanediol_dehydrogenase_|_68496:69668_Forward
64 GJA_Janthinobacterium agaricidamnosum_RS22270_|_transcriptional_regulator_|_5168697:5168921_Reverse
Transcriptional regulator
65 JCM11249_LACTOBACILLUS_FUCHUENSIS_RS07720_|_ABC_transporter_substrate-binding_protein_|_29991:31136_Reverse
ABC transporter
66 JCM11249_LACTOBACILLUS_FUCHUENSIS_RS08050_|_manganese_transporter_|_29567:31135_Forward
ABC transporter (Mn?) Manque 1 ss u qui n'est pas surexprimée
67 JCM11249_LACTOBACILLUS_FUCHUENSIS_RS06025_|_adenylate_kinase_|_31227:31883_Forward ATP genaration
68 JCM11249_LACTOBACILLUS_FUCHUENSIS_RS09390_|_cell_division_protein_FtsH_|_11704:13815_Forward
Cell division
69 JCM11249_LACTOBACILLUS_FUCHUENSIS_RS08555_|_glycerol_phosphate_lipoteichoic_acid_synthase_|_22734:24797_Forward
Cell wall synthesis, exported glycerol phosphate lipoteichoic acid synthetase and anion-binding protein
70 JCM11249_LACTOBACILLUS_FUCHUENSIS_RS04390_|_peptidylprolyl_isomerase_|_50494:51399_Reverse
5.2.1.8 Chaperone, protein folding and stabilization
71 JCM11249_LACTOBACILLUS_FUCHUENSIS_RS00310_|_tig_|_trigger_factor_|_64666:65961_Reverse
Chaperoning, translation, Trigger Factor (TF) represents the only ribosome-associated chaperone known in bacteria; Involved in protein export. Acts as a chaperone by maintaining the newly synthesized secretory and non-secretory proteins in an open conformation
72 JCM11249_LACTOBACILLUS_FUCHUENSIS_RS00525_|_112050:112886_Reverse conversion L to D lactate, enf of glycolysis? or cell wall biosynthesis
73 JCM11249_LACTOBACILLUS_FUCHUENSIS_RS00555_|_116007:117281_Reverse conversion L to D lactate, enf of glycolysis? or cell wall biosynthesis
74 JCM11249_LACTOBACILLUS_FUCHUENSIS_RS11265_|_ATP_synthase_subunit_delta_|_36343:36884_Forward
F0F1 ATPase energy production
75 JCM11249_LACTOBACILLUS_FUCHUENSIS_RS11270_|_ATP_F0F1_synthase_subunit_alpha_|_36913:38447_Forward
F0F1 ATPase energy production
76 JCM11249_LACTOBACILLUS_FUCHUENSIS_RS05250_|_F0F1_ATP_synthase_subunit_A_|_34830:35543_Forward
F0F1 ATPase energy production
77 JCM11249_LACTOBACILLUS_FUCHUENSIS_RS05260_|_ATP_synthase_F0_subunit_B_|_35838:36356_Forward
F0F1 ATPase, energy production
78 JCM11249_LACTOBACILLUS_FUCHUENSIS_RS11010_|_glucose_transporter_GlcU_|_48736:49601_Forward
glucose facilitator?

A.Rouger 2017 Annexe 1 Differentially expressed genes
187
79 JCM11249_LACTOBACILLUS_FUCHUENSIS_RS04315_|_phosphoglycerate_kinase_|_32818:34032_Forward
glycerol metabolism
80 JCM11249_LACTOBACILLUS_FUCHUENSIS_RS08305_|_gpmA_|_phosphoglyceromutase_|_27288:27977_Forward
5.4.2.1 Glycolysis heterolactic fermentation or gluconeogenesis (il y en a 5 dans le génome de 23K)
81 JCM11249_LACTOBACILLUS_FUCHUENSIS_RS09345_|_L-lactate_dehydrogenase_|_687:1664_Reverse 1.1.1.27 Glycolysis/fermentation
82 JCM11249_LACTOBACILLUS_FUCHUENSIS_RS05020_|_cell_surface_protein_|_45453:46526_Forward Membrane protein
83 JCM11249_LACTOBACILLUS_FUCHUENSIS_RS01940_|_manganese_transporter_|_56279:57676_Forward
Mn transport
84 JCM11249_LACTOBACILLUS_FUCHUENSIS_RS02850_|_manganese_ABC_transporter_substrate-binding_protein_|_1362:2303_Reverse
Mn transport
85 JCM11249_LACTOBACILLUS_FUCHUENSIS_RS01870_|_nucleoside_permease_|_36908:38143_Forward
nucleoside permease
86 JCM11249_LACTOBACILLUS_FUCHUENSIS_RS07360_|_NAD(P)-dependent_oxidoreductase_|_3358:4200_Reverse
oxidoreductase
87 JCM11249_LACTOBACILLUS_FUCHUENSIS_RS08510_|_PTS_mannose_family_transporter_subunit_IID_|_15184:16095_Forward
PTS EiiD mannose/sorbose/fructose family
88 JCM11249_LACTOBACILLUS_FUCHUENSIS_RS00550_|_1-(5-phosphoribosyl)-5-amino-4-imidazole-_carboxylate_carboxylase_|_115214:115993_Reverse
PurE like, purine metabolism
89 JCM11249_LACTOBACILLUS_FUCHUENSIS_RS06925_|_pyrH_|_UMP_kinase_|_757:1482_Reverse 2.7.4.22 purine and pyrimidine metabolism; pyrimidine ribonucleotides interconversion
90 JCM11249_LACTOBACILLUS_FUCHUENSIS_RS10135_|_1581:3143_Forward 3.1.4.16 Putative 2',3'-cyclic-nucleotide 2'-phosphodiesterase. RNA degradation
91 JCM11249_LACTOBACILLUS_FUCHUENSIS_RS11955_|_potassium_transporter_Kup_|_14749:16775_Forward
putative potassium transport system protein (kup)
92 JCM11249_LACTOBACILLUS_FUCHUENSIS_RS04065_|_prolyl_aminopeptidase_|_38106:39008_Forward
3.4.11.5 Putative proline amino peptidase
93 JCM11249_LACTOBACILLUS_FUCHUENSIS_RS09885_|_initiator_RepB_protein_|_4147:5082_Reverse Replication
94 JCM11249_LACTOBACILLUS_FUCHUENSIS_RS02760_|_single-stranded_DNA-binding_protein_|_53643:54165_Reverse
Replication or transcription
95 JCM11249_LACTOBACILLUS_FUCHUENSIS_RS08055_|_universal_stress_protein_UspA_|_31160:31585_Forward
stress repsonse
96 JCM11249_LACTOBACILLUS_FUCHUENSIS_RS05500_|_cold-shock_protein_|_31552:31752_Reverse Stress response
97 JCM11249_LACTOBACILLUS_FUCHUENSIS_RS09565_|_phosphogluconate_dehydrogenase_(NADP(+)-dependent,_decarboxylating)_|_10173:11594_Forward
sugar metabolism
98 JCM11249_LACTOBACILLUS_FUCHUENSIS_RS04280_|_NAD(FAD)-dependent_dehydrogenase_|_27141:28493_Forward
sugar metabolism
99 JCM11249_LACTOBACILLUS_FUCHUENSIS_RS07385_|_dTDP-glucose_4,6-dehydratase_|_7782:8810_Reverse
sugar metabolism
100 JCM11249_LACTOBACILLUS_FUCHUENSIS_RS07390_|_dTDP-4-dehydrorhamnose_3,5-epimerase_|_8829:9410_Reverse
sugar metabolism
101 JCM11249_LACTOBACILLUS_FUCHUENSIS_RS09200_|_DNA-directed_RNA_polymerase_subunit_delta_|_12512:13120_Forward
Transcription
102 JCM11249_LACTOBACILLUS_FUCHUENSIS_RS07090_|_transcriptional_regulator_|_28200:28931_Reverse
Transcriptional regulator
103 JCM11249_LACTOBACILLUS_FUCHUENSIS_RS00215_|_50S_ribosomal_protein_L32_|_42679:42861_Reverse
Translation
104 JCM11249_LACTOBACILLUS_FUCHUENSIS_RS00315_|_tuf_|_elongation_factor_Tu_|_66147:67337_Reverse
Translation
105 JCM11249_LACTOBACILLUS_FUCHUENSIS_RS00875_|_50S_ribosomal_protein_L21_|_28126:28434_Forward
Translation
106 JCM11249_LACTOBACILLUS_FUCHUENSIS_RS02070_|_50S_ribosomal_protein_L13_|_7507:7953_Forward
Translation
107 JCM11249_LACTOBACILLUS_FUCHUENSIS_RS02350_|_50S_ribosomal_protein_L10_|_59149:59652_Forward
Translation
108 JCM11249_LACTOBACILLUS_FUCHUENSIS_RS02355_|_50S_ribosomal_protein_L7/L12_|_59704:60069_Forward
Translation
109 JCM11249_LACTOBACILLUS_FUCHUENSIS_RS02765_|_30S_ribosomal_protein_S6_|_54205:54501_Reverse
Translation
110 JCM11249_LACTOBACILLUS_FUCHUENSIS_RS02800_|_50S_ribosomal_protein_L34_|_64635:64775_Forward
Translation
111 JCM11249_LACTOBACILLUS_FUCHUENSIS_RS03250_|_translation_initiation_factor_IF-2_|_12806:15784_Forward
Translation
112 JCM11249_LACTOBACILLUS_FUCHUENSIS_RS05060_|_threonine--tRNA_ligase_|_55149:57119_Forward
Translation
113 JCM11249_LACTOBACILLUS_FUCHUENSIS_RS05700_|_30S_ribosomal_protein_S21_|_23606:23782_Forward
Translation
114 JCM11249_LACTOBACILLUS_FUCHUENSIS_RS05895_|_30S_ribosomal_protein_S12_|_15512:15925_Forward
Translation
115 JCM11249_LACTOBACILLUS_FUCHUENSIS_RS05935_|_50S_ribosomal_protein_L23_|_22294:22578_Forward
Translation
116 JCM11249_LACTOBACILLUS_FUCHUENSIS_RS05945_|_30S_ribosomal_protein_S19_|_23538:23819_Forward
Translation
117 JCM11249_LACTOBACILLUS_FUCHUENSIS_RS06010_|_50S_ribosomal_protein_L30_|_29224:29409_Forward
Translation
118 JCM11249_LACTOBACILLUS_FUCHUENSIS_RS06030_|_infA_|_translation_initiation_factor_IF-1_|_32072:32290_Forward
Translation
119 JCM11249_LACTOBACILLUS_FUCHUENSIS_RS06040_|_30S_ribosomal_protein_S13_|_32472:32837_Forward
Translation
120 JCM11249_LACTOBACILLUS_FUCHUENSIS_RS06920_|_197:754_Reverse Translation
121 JCM11249_LACTOBACILLUS_FUCHUENSIS_RS06930_|_elongation_factor_Ts_|_1621:2496_Reverse Translation
122 JCM11249_LACTOBACILLUS_FUCHUENSIS_RS07885_|_30S_ribosomal_protein_S4_|_28208:28795_Forward
Translation
123 JCM11249_LACTOBACILLUS_FUCHUENSIS_RS09215_|_50S_ribosomal_protein_L31_type_B_|_17119:17382_Forward
Translation

A.Rouger 2017 Annexe 1 Differentially expressed genes
188
124 JCM11249_LACTOBACILLUS_FUCHUENSIS_RS09375_|_9115:9561_Forward Translation
125 JCM11249_LACTOBACILLUS_FUCHUENSIS_RS06020_|_preprotein_translocase_subunit_SecY_|_29877:31172_Forward
Translation/secretion
126 JCM11249_LACTOBACILLUS_FUCHUENSIS_RS10520_|_transporter_|_40875:42409_Reverse Transport
127 JCM11249_LACTOBACILLUS_FUCHUENSIS_RS00075_|_DNA-binding_protein_|_13524:13799_Reverse Unknown
128 JCM11249_LACTOBACILLUS_FUCHUENSIS_RS00530_|_hypothetical_protein_|_112903:113208_Reverse
Unknown
129 JCM11249_LACTOBACILLUS_FUCHUENSIS_RS00880_|_hypothetical_protein_|_28449:28790_Forward Unknown
130 JCM11249_LACTOBACILLUS_FUCHUENSIS_RS02520_|_hypothetical_protein_|_13226:14404_Reverse Unknown
131 JCM11249_LACTOBACILLUS_FUCHUENSIS_RS06210_|_hypothetical_protein_|_24425:25756_Reverse Unknown
132 JCM11249_LACTOBACILLUS_FUCHUENSIS_RS11045_|_cell_surface_protein_|_10452:11758_Forward Unknown
133 JCM11249_LACTOBACILLUS_FUCHUENSIS_RS11690_|_hypothetical_protein_|_16391:17616_Forward Unknown
134 JCM11249_LACTOBACILLUS_FUCHUENSIS_RS05480_|_xanthine_phosphoribosyltransferase_|_28392:28970_Reverse
2.4.2.22 Xanthine and xanthosine salvage, putine metabolism
135 JCM11249_LACTOBACILLUS_FUCHUENSIS_RS06160_|_anaerobic_ribonucleoside_triphosphate_reductase_|_10392:12608_Reverse
Zn anaerobic reductase
136 LACTOBACILLUS,VAGINALIS|AZGL01000017,1_cds_KRM48403,1_386_[locus_tag=FC58_GL000396]_[protein=30S_ribosomal_protein_S4]_[protein_id=KRM48403,1]_[location=complement(7004,,7693)]
137 LCA_LACTOBACILLUS_SAKEI_RS07165_|_GTP_pyrophosphokinase_|_1418194:1418868_Reverse 2.7.6.5 (p)ppGpp synthetase; (p)ppGpp) are involved in regulating growth and several different stress responses
138 LCA_LACTOBACILLUS_SAKEI_RS01720_|_metallophosphoesterase_|_362960:363766_Forward 60% identical to 2'3' and 3'5' cyclic nucleotide monophosphates phosphodiesterase involved in biofilm formation of B. subtilis
139 LCA_LACTOBACILLUS_SAKEI_RS04000_|_cysteine_desulfurase_|_783792:784958_Forward 2.8.1.7 AA (alanine) biosynthesis
140 LCA_LACTOBACILLUS_SAKEI_RS03230_|_asparagine_synthetase_B_|_637303:639207_Forward 6.3.5.4 AA (asparagine) biosynthesis
141 LCA_LACTOBACILLUS_SAKEI_RS07205_|_ABC_transporter_permease_|_1424669:1426768_Reverse ABC transport system, permease component, unknown substrate
142 LCA_LACTOBACILLUS_SAKEI_RS01690_|_multidrug_ABC_transporter_ATP-binding_protein_|_354719:356665_Reverse
ABC transporter
143 LCA_LACTOBACILLUS_SAKEI_RS00840_|_manganese_transporter_|_173256:173996_Forward ABC transporter (Mn?) Manque 1 ss u qui n'est pas surexprimée
144 LCA_LACTOBACILLUS_SAKEI_RS00845_|_membrane_protein_|_173993:174853_Forward ABC transporter (Mn?) Manque 1 ss u qui n'est pas surexprimée
145 LCA_LACTOBACILLUS_SAKEI_RS04660_|_multidrug_ABC_transporter_ATP-binding_protein_|_919307:920179_Forward
ABC transporter substrate unknown
146 LCA_LACTOBACILLUS_SAKEI_RS00590_|_118452:119210_Forward ABC transporter unknown substrate
147 LCA_LACTOBACILLUS_SAKEI_RS00595_|_permease_|_119225:121045_Forward ABC transporter unknown substrate
148 LCA_LACTOBACILLUS_SAKEI_RS05720_|_multidrug_ABC_transporter_ATP-binding_protein_|_1136044:1137921_Reverse
ABC transporter unknown substrate
149 LCA_LACTOBACILLUS_SAKEI_RS04900_|_putrescine/spermidine_ABC_transporter_ATP-binding_protein_|_972085:972744_Reverse
ABC transporter, unknown substrate 1seul des 2 gènes upregulated
150 LCA_LACTOBACILLUS_SAKEI_RS06440_|_acetate_kinase_|_1274891:1276087_Reverse 2.7.2.1 acetate kinase 2, purines nucleosides degradation, pyruvate degradation
151 LCA_LACTOBACILLUS_SAKEI_RS04910_|_alpha-acetolactate_decarboxylase_|_973885:974604_Reverse
4.1.1.5 acetolactate decarboxylase, acetoin biosynthesis, potential spoilage, pyruvate degradation
152 LCA_LACTOBACILLUS_SAKEI_RS04915_|_acetolactate_synthase_|_974638:976320_Reverse 2.2.1.6 acetolactate synthase, acetoin biosynthesis, potential spoilage, pyruvate degradation
153 LCA_LACTOBACILLUS_SAKEI_RS03280_|_acyltransferase_|_647279:649096_Forward Acetyl transferase of unknown function
154 LCA_LACTOBACILLUS_SAKEI_RS04070_|_GNAT_family_acetyltransferase_|_799904:801115_Forward Acetyltransferase of unknown function
155 LCA_LACTOBACILLUS_SAKEI_RS03545_|_acyl_carrier_protein_|_700879:701121_Forward Acyl carrier, lipid metabolism
156 LCA_LACTOBACILLUS_SAKEI_RS07145_|_copper_homeostasis_protein_CutC_|_1414641:1415270_Reverse
Adaptations to atypical conditions
157 LCA_LACTOBACILLUS_SAKEI_RS06335_|_adenine_phosphoribosyltransferase_|_1257177:1257695_Reverse
2.4.2.7 adenine_phosphoribosyltransferase, adenine adenosine salvage pathway. purine pyrimidine metabolism
158 LCA_LACTOBACILLUS_SAKEI_RS08055_|_alanine_racemase_|_1598851:1599993_Reverse 5.1.1.1 Alanine biosynthesis
159 LCA_LACTOBACILLUS_SAKEI_RS07020_|_transporter_|_1384031:1385464_Forward amino acid/polyamine transport protein
160 LCA_LACTOBACILLUS_SAKEI_RS05180_|_glutamate/gamma-aminobutyrate_family_transporter_YjeM_|_1027429:1028961_Reverse
amino acid/polyamine transporter
161 LCA_LACTOBACILLUS_SAKEI_RS01715_|_amino_acid_permease_|_360954:362705_Forward Aminoacid permease
162 LCA_LACTOBACILLUS_SAKEI_RS01065_|_aminopeptidase_N_|_221085:223616_Forward 3.4.11.2 Aminopeptidase PepN
163 LCA_LACTOBACILLUS_SAKEI_RS08050_|_hypothetical_protein_|_1598503:1598769_Reverse antitoxin inactivating the upstream endoribonuclease which overexpression in lethal
164 LCA_LACTOBACILLUS_SAKEI_RS07900_|_pyrroline-5-carboxylate_reductase_|_1567048:1567854_Reverse
1.5.1.2 Arginine and proline metabolism
165 LCA_LACTOBACILLUS_SAKEI_RS03125_|_arginine_repressor_|_617068:617535_Forward ArgR family transcriptional regulator
166 LCA_LACTOBACILLUS_SAKEI_RS01650_|_L-asparaginase_|_347803:348777_Reverse 3.5.1.1 Asparagine degradation
167 LCA_LACTOBACILLUS_SAKEI_RS04570_|_hypothetical_protein_|_897612:901356_Forward ATP-dependent exoDNAse (exonuclease V) DNA recombination
168 LCA_LACTOBACILLUS_SAKEI_RS08065_|_DEAD/DEAH_box_helicase_|_1600484:1602076_Reverse ATP-dependent RNA helicase; cold shock, RNA modification

A.Rouger 2017 Annexe 1 Differentially expressed genes
189
169 LCA_LACTOBACILLUS_SAKEI_RS03155_|_penicillin-binding_protein_1A_|_622364:624445_Forward bifunctional glycolsyltransferase/transpeptidase penicillin binding protein 2A peptidoglycan biosynthesis
170 LCA_LACTOBACILLUS_SAKEI_RS01440_|_aspartate_4-decarboxylase_|_304048:305655_Forward 2.6.1.1/4.1.1.12 Bifunctional? Amino acid metabolisms
171 LCA_LACTOBACILLUS_SAKEI_RS02495_|_cell_division_protein_FtsK_|_497267:499636_Forward Cell division
172 LCA_LACTOBACILLUS_SAKEI_RS02570_|_cell_division_ATP-binding_protein_FtsE_|_516554:517240_Forward
Cell division
173 LCA_LACTOBACILLUS_SAKEI_RS03580_|_chromosome_segregation_protein_SMC_|_708462:712022_Forward
Cell division
174 LCA_LACTOBACILLUS_SAKEI_RS03755_|_division/cell_wall_cluster_transcriptional_repressor_MraZ_|_736911:737342_Forward
Cell division
175 LCA_LACTOBACILLUS_SAKEI_RS03765_|_cell_division_protein_FtsL_|_738319:738699_Forward Cell division
176 LCA_LACTOBACILLUS_SAKEI_RS03795_|_cell_division_protein_FtsA_|_745337:746647_Forward Cell division
177 LCA_LACTOBACILLUS_SAKEI_RS03800_|_cell_division_protein_FtsZ_|_746675:747913_Forward Cell division
178 LCA_LACTOBACILLUS_SAKEI_RS03820_|_arabinan_synthesis_protein_|_749472:750296_Forward Cell division
179 LCA_LACTOBACILLUS_SAKEI_RS04250_|_septation_ring_formation_regulator_EzrA_|_830498:832210_Forward
Cell division
180 LCA_LACTOBACILLUS_SAKEI_RS04290_|_841470:842474_Forward Cell division
181 LCA_LACTOBACILLUS_SAKEI_RS04295_|_842632:843492_Forward Cell division
182 LCA_LACTOBACILLUS_SAKEI_RS04300_|_843494:844024_Forward Cell division
183 LCA_LACTOBACILLUS_SAKEI_RS04305_|_septum_site-determining_protein_|_844041:844712_Forward
Cell division
184 LCA_LACTOBACILLUS_SAKEI_RS04310_|_septum_site-determining_protein_MinD_|_844714:845508_Forward
Cell division
185 LCA_LACTOBACILLUS_SAKEI_RS04615_|_cell_cycle_protein_GpsB_|_911372:911752_Forward Cell division
186 LCA_LACTOBACILLUS_SAKEI_RS05135_|_site-specific_tyrosine_recombinase_XerD_|_1016756:1017640_Reverse
Cell division
187 LCA_LACTOBACILLUS_SAKEI_RS05570_|_cell_division_protein_FtsW_|_1108754:1109953_Reverse Cell division
188 LCA_LACTOBACILLUS_SAKEI_RS05590_|_1110786:1111775_Reverse Cell division
189 LCA_LACTOBACILLUS_SAKEI_RS06620_|_cell_division_protein_FtsI_|_1301490:1303589_Reverse Cell division
190 LCA_LACTOBACILLUS_SAKEI_RS07975_|_cell_division_protein_FtsH_|_1581251:1583341_Reverse Cell division
191 LCA_LACTOBACILLUS_SAKEI_RS04935_|_tyrosine_recombinase_XerC_|_979424:980335_Reverse Cell division, site-specific tyrosine recombinase for chromosome partitioning
192 LCA_LACTOBACILLUS_SAKEI_RS00900_|_hypothetical_protein_|_186239:187585_Reverse cell surface protein
193 LCA_LACTOBACILLUS_SAKEI_RS00500_|_hypothetical_protein_|_100870:102144_Forward cell surface protein of unknown function
194 LCA_LACTOBACILLUS_SAKEI_RS00520_|_cell_surface_protein_|_103786:104262_Forward cell surface protein of unknown function
195 LCA_LACTOBACILLUS_SAKEI_RS01490_|_cell_surface_protein_|_317566:319107_Forward cell surface protein with cysteine proteinase domain
196 LCA_LACTOBACILLUS_SAKEI_RS00905_|_lipoprotein_precursor_|_187871:188863_Reverse cell surface protein, prolipoprotein
197 LCA_LACTOBACILLUS_SAKEI_RS09080_|_cell_surface_protein_|_1802276:1802998_Reverse Cell surface protein, unlnown function
198 LCA_LACTOBACILLUS_SAKEI_RS05090_|_peptidoglycan-binding_protein_LysM_|_1009695:1010396_Reverse
Cell wall
199 LCA_LACTOBACILLUS_SAKEI_RS08595_|_cell_surface_protein_|_1707594:1708571_Reverse Cell wall
200 LCA_LACTOBACILLUS_SAKEI_RS00240_|_D-alanine--D-alanine_ligase_|_44293:45345_Reverse 6.3.2.4 Cell wall (peptidoglycan) biosynthesis
201 LCA_LACTOBACILLUS_SAKEI_RS00460_|_carboxylate--amine_ligase_|_94813:96066_Forward 6.3.1.12 Cell wall biogenesis/degradation
202 LCA_LACTOBACILLUS_SAKEI_RS00465_|_aspartate_racemase_|_96075:96779_Forward 5.1.1.13 Cell wall biogenesis/degradation
203 LCA_LACTOBACILLUS_SAKEI_RS01315_|_D-alanyl-D-alanine_carboxypeptidase_|_274535:275821_Forward
3.4.16.4 Cell wall biogenesis/degradation DacA
204 LCA_LACTOBACILLUS_SAKEI_RS01325_|_lipoprotein_precursor_|_277534:278157_Forward 6.3.2.13 Cell wall biogenesis/degradation peptidoglycan biosynthesis MurE
205 LCA_LACTOBACILLUS_SAKEI_RS01895_|_D-alanine--poly(phosphoribitol)_ligase_|_403918:405444_Forward
6.1.1.13 Cell wall biosynthesis
206 LCA_LACTOBACILLUS_SAKEI_RS01900_|_D-alanyl-lipoteichoic_acid_biosynthesis_protein_DltB_|_405437:406645_Forward
6.1.1.13 Cell wall biosynthesis
207 LCA_LACTOBACILLUS_SAKEI_RS01905_|_D-alanine--poly(phosphoribitol)_ligase_subunit_2_|_406675:406911_Forward
6.1.1.13 Cell wall biosynthesis
208 LCA_LACTOBACILLUS_SAKEI_RS01910_|_D-alanyl-lipoteichoic_acid_biosynthesis_protein_DltD_|_406913:408184_Forward
6.1.1.13 Cell wall biosynthesis
209 LCA_LACTOBACILLUS_SAKEI_RS03770_|_penicillin-binding_protein_|_738696:740834_Forward Cell wall biosynthesis
210 LCA_LACTOBACILLUS_SAKEI_RS03775_|_phospho-N-acetylmuramoyl-pentapeptide-_transferase_|_740867:741829_Forward
Cell wall biosynthesis
211 LCA_LACTOBACILLUS_SAKEI_RS03785_|_UDP-N-acetylglucosamine--N-acetylmuramyl-_(pentapeptide)_pyrophosphoryl-undecaprenol_N-acetylglucosamine_transferase_|_743225:744325_Forward
Cell wall biosynthesis
212 LCA_LACTOBACILLUS_SAKEI_RS07845_|_teichoic_acid/polysaccharide_biosynthesis_protein_|_1552964:1553839_Reverse
Cell wall biosynthesis

A.Rouger 2017 Annexe 1 Differentially expressed genes
190
213 LCA_LACTOBACILLUS_SAKEI_RS07850_|_teichoic_acid/polysaccharide_export_protein_|_1553850:1555391_Reverse
Cell wall biosynthesis
214 LCA_LACTOBACILLUS_SAKEI_RS08120_|_UDP-N-acetylglucosamine_1-carboxyvinyltransferase_|_1612355:1613614_Reverse
Cell wall biosynthesis
215 LCA_LACTOBACILLUS_SAKEI_RS08215_|_1632935:1634323_Reverse Cell wall biosynthesis
216 LCA_LACTOBACILLUS_SAKEI_RS09085_|_surface_polysaccharide_deacetylase_|_1803704:1805110_Forward
Cell wall biosynthesis
217 LCA_LACTOBACILLUS_SAKEI_RS04600_|_penicillin-binding_protein_1A_|_907714:910017_Reverse 2.4.1.129 Cell wall peptidoglycan synthesis
218 LCA_LACTOBACILLUS_SAKEI_RS02535_|_undecaprenyl-phosphate_alpha-N-acetylglucosaminyl_1-phosphate_transferase_|_508103:509191_Forward
2.7.8.13 Cell wall synthesis
219 LCA_LACTOBACILLUS_SAKEI_RS03235_|_UDP-N-acetylmuramate--L-alanine_ligase_|_639372:640703_Forward
Cell wall synthesis
220 LCA_LACTOBACILLUS_SAKEI_RS04335_|_N-acetylmuramoyl-L-alanine_amidase_|_849559:850881_Reverse
Cell wall synthesis
221 LCA_LACTOBACILLUS_SAKEI_RS05595_|_UDP-N-acetylglucosamine_1-carboxyvinyltransferase_|_1111924:1113225_Reverse
2.5.1.7 Cell wall synthesis
222 LCA_LACTOBACILLUS_SAKEI_RS05675_|_UDP-N-acetylmuramyl_peptide_synthase_|_1126340:1127689_Forward
Cell wall synthesis
223 LCA_LACTOBACILLUS_SAKEI_RS07130_|_N-acetylmuramoyl-L-alanine_amidase_|_1411165:1413171_Reverse
Cell wall synthesis
224 LCA_LACTOBACILLUS_SAKEI_RS07455_|_UTP--glucose-1-phosphate_uridylyltransferase_|_1475623:1476525_Reverse
2.7.7.9 Cell wall synthesis
225 LCA_LACTOBACILLUS_SAKEI_RS07560_|_UDP-N-acetyl_glucosamine_2-epimerase_|_1494222:1495361_Reverse
Cell wall synthesis
226 LCA_LACTOBACILLUS_SAKEI_RS07820_|_teichoic_acid/polysaccharide_glycosyl_transferase_group_1_|_1547354:1548430_Reverse
Cell wall synthesis
227 LCA_LACTOBACILLUS_SAKEI_RS07830_|_teichoic_acid/polysaccharide_export_protein_|_1548846:1550261_Reverse
Cell wall synthesis
228 LCA_LACTOBACILLUS_SAKEI_RS07835_|_CDP-glycerol--glycerophosphate_glycerophosphotransferase_|_1550263:1551408_Reverse
2.7.8.- Cell wall synthesis
229 LCA_LACTOBACILLUS_SAKEI_RS08070_|_UDP-N-acetylmuramoyl-tripeptide--D-alanyl-D-_alanine_ligase_|_1602350:1603726_Reverse
Cell wall synthesis
230 LCA_LACTOBACILLUS_SAKEI_RS06020_|_alkaline_phosphatase_|_1189948:1192125_Forward Cell wall synthesis, exported glycerol phosphate lipoteichoic acid synthetase and anion-binding protein
231 LCA_LACTOBACILLUS_SAKEI_RS07510_|_exopolysaccharide_biosynthesis_protein_|_1486375:1487121_Reverse
2.7.10.2 Cell wall, EPS biosynthesis
232 LCA_LACTOBACILLUS_SAKEI_RS05780_|_peptidase_M23_|_1146170:1146865_Reverse Cell wall, Peptidoglycan-binding lysin domain
233 LCA_LACTOBACILLUS_SAKEI_RS05820_|_peptidase_M23_|_1150395:1151120_Reverse Cell wall, Peptidoglycan-binding lysin domain
234 LCA_LACTOBACILLUS_SAKEI_RS03070_|_SorC_family_transcriptional_regulator_|_605626:606663_Forward
CggR transcriptional regulator of gapA
235 LCA_LACTOBACILLUS_SAKEI_RS03180_|_peptidylprolyl_isomerase_|_629874:630782_Reverse 5.2.1.8 Chaperone, protein folding and stabilization
236 LCA_LACTOBACILLUS_SAKEI_RS06145_|_molecular_chaperone_DnaJ_|_1213558:1214709_Reverse Chaperoning , adaptation to atypical conditions (other genes from the operon (DnaK, GroES, GroEL?)
237 LCA_LACTOBACILLUS_SAKEI_RS02085_|_peptidyl-prolyl_cis-trans_isomerase_|_443641:444225_Forward
5.2.1.8 Chaperoning folding
238 LCA_LACTOBACILLUS_SAKEI_RS02735_|_ATP-dependent_Clp_protease_proteolytic_subunit_|_549884:550468_Reverse
ClpP protease, adaptation to atypical conditions
239 LCA_LACTOBACILLUS_SAKEI_RS06965_|_dephospho-CoA_kinase_|_1370499:1371107_Reverse 2.7.1.24 coenzyme A biosynthesis
240 LCA_LACTOBACILLUS_SAKEI_RS05350_|_coaD_|_phosphopantetheine_adenylyltransferase_|_1068486:1068983_Reverse
2.7.7.3 Coenzyme A biosynthesis, phosphopantetheine adenylyltransferase, 4 étapes: 6.3.2.5; 4.1.1.36; 2.7.1.24
241 LCA_LACTOBACILLUS_SAKEI_RS00220_|_cyclopropane-fatty-acyl-phospholipid_synthase_|_41152:42339_Reverse
2.1.1.79 cyclopropane-fatty-acyl-phospholipid synthase
242 LCA_LACTOBACILLUS_SAKEI_RS05085_|_cytidylate_kinase_|_1008969:1009628_Reverse 2.7.4.14 cytidylate kinase, purines pyrimidines metabolism
243 LCA_LACTOBACILLUS_SAKEI_RS01410_|_gluconate_kinase_|_295975:297531_Forward 2.7.1.12 D-gluconate vers 6P-D-gluconate
244 LCA_LACTOBACILLUS_SAKEI_RS06745_|_TIGR00159_family_protein_|_1329163:1330002_Reverse 2.7.7.85 Diadenylate cyclase, 2 ATP <=> 2 diphosphate + cyclic di-3',5'-adenylate
245 LCA_LACTOBACILLUS_SAKEI_RS00910_|_peptidase_C69_|_189076:190500_Forward 3.4.-.- Dipeptidase
246 LCA_LACTOBACILLUS_SAKEI_RS04505_|_peptidase_U34_|_883107:884543_Reverse 3.4.-.- Dipeptidase
247 LCA_LACTOBACILLUS_SAKEI_RS02025_|_dipeptidase_PepV_|_431474:432877_Reverse 3.4.13.3 Dipeptidase PePV
248 LCA_LACTOBACILLUS_SAKEI_RS07920_|_peptide_ABC_transporter_permease_|_1569369:1570829_Reverse
di-tripeptide-proton ABC symporter
249 LCA_LACTOBACILLUS_SAKEI_RS08465_|_divalent_metal_cation_transporter_|_1681251:1682627_Reverse
Divalent metal cation transporter MntH
250 LCA_LACTOBACILLUS_SAKEI_RS01600_|_hypothetical_protein_|_341984:342292_Forward DNA binding protein, replication?
251 LCA_LACTOBACILLUS_SAKEI_RS01880_|_endonuclease_MutS2_|_400730:403093_Forward DNA mismatch repair, replication
252 LCA_LACTOBACILLUS_SAKEI_RS08390_|_DNA_repair_protein_RadA_|_1664119:1665483_Reverse DNA repair
253 LCA_LACTOBACILLUS_SAKEI_RS04285_|_hypothetical_protein_|_840626:841306_Forward DNA repair or phosphate metabolism?
254 LCA_LACTOBACILLUS_SAKEI_RS06865_|_DNA-binding_response_regulator_|_1352199:1352885_Reverse
DNA-binding_response_regulator, unknown target
255 LCA_LACTOBACILLUS_SAKEI_RS09170_|_peroxidase_|_1821441:1822397_Forward Dyp-type peroxidase family (iron-dependent), oxidative stress
256 LCA_LACTOBACILLUS_SAKEI_RS08045_|_PemK_family_transcriptional_regulator_|_1598123:1598509_Reverse
endoribonuclease that inactivates cellular mRNAs by cleaving at specific sites
257 LCA_LACTOBACILLUS_SAKEI_RS03465_|_guanylate_kinase_|_682257:682868_Forward 2.7.4.8 Essential for recycling GMP, bases metabolism
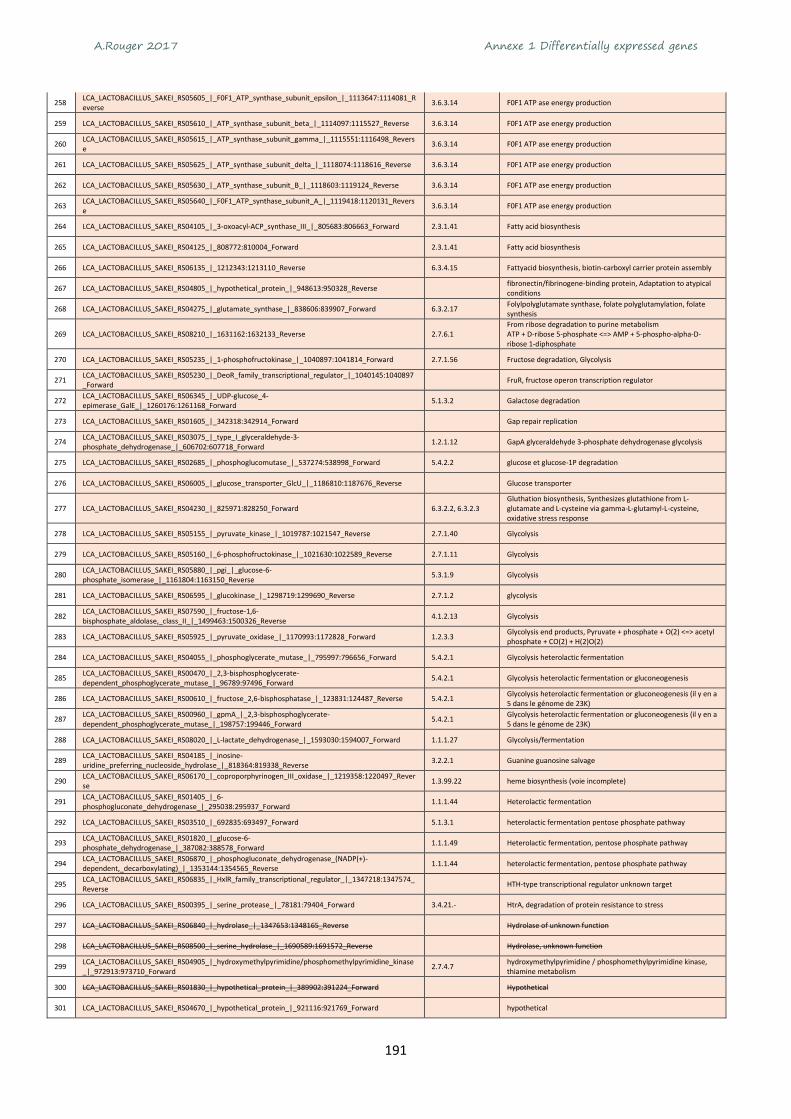
A.Rouger 2017 Annexe 1 Differentially expressed genes
191
258 LCA_LACTOBACILLUS_SAKEI_RS05605_|_F0F1_ATP_synthase_subunit_epsilon_|_1113647:1114081_Reverse
3.6.3.14 F0F1 ATP ase energy production
259 LCA_LACTOBACILLUS_SAKEI_RS05610_|_ATP_synthase_subunit_beta_|_1114097:1115527_Reverse 3.6.3.14 F0F1 ATP ase energy production
260 LCA_LACTOBACILLUS_SAKEI_RS05615_|_ATP_synthase_subunit_gamma_|_1115551:1116498_Reverse
3.6.3.14 F0F1 ATP ase energy production
261 LCA_LACTOBACILLUS_SAKEI_RS05625_|_ATP_synthase_subunit_delta_|_1118074:1118616_Reverse 3.6.3.14 F0F1 ATP ase energy production
262 LCA_LACTOBACILLUS_SAKEI_RS05630_|_ATP_synthase_subunit_B_|_1118603:1119124_Reverse 3.6.3.14 F0F1 ATP ase energy production
263 LCA_LACTOBACILLUS_SAKEI_RS05640_|_F0F1_ATP_synthase_subunit_A_|_1119418:1120131_Reverse
3.6.3.14 F0F1 ATP ase energy production
264 LCA_LACTOBACILLUS_SAKEI_RS04105_|_3-oxoacyl-ACP_synthase_III_|_805683:806663_Forward 2.3.1.41 Fatty acid biosynthesis
265 LCA_LACTOBACILLUS_SAKEI_RS04125_|_808772:810004_Forward 2.3.1.41 Fatty acid biosynthesis
266 LCA_LACTOBACILLUS_SAKEI_RS06135_|_1212343:1213110_Reverse 6.3.4.15 Fattyacid biosynthesis, biotin-carboxyl carrier protein assembly
267 LCA_LACTOBACILLUS_SAKEI_RS04805_|_hypothetical_protein_|_948613:950328_Reverse fibronectin/fibrinogene-binding protein, Adaptation to atypical conditions
268 LCA_LACTOBACILLUS_SAKEI_RS04275_|_glutamate_synthase_|_838606:839907_Forward 6.3.2.17 Folylpolyglutamate synthase, folate polyglutamylation, folate synthesis
269 LCA_LACTOBACILLUS_SAKEI_RS08210_|_1631162:1632133_Reverse 2.7.6.1 From ribose degradation to purine metabolism ATP + D-ribose 5-phosphate <=> AMP + 5-phospho-alpha-D-ribose 1-diphosphate
270 LCA_LACTOBACILLUS_SAKEI_RS05235_|_1-phosphofructokinase_|_1040897:1041814_Forward 2.7.1.56 Fructose degradation, Glycolysis
271 LCA_LACTOBACILLUS_SAKEI_RS05230_|_DeoR_family_transcriptional_regulator_|_1040145:1040897_Forward
FruR, fructose operon transcription regulator
272 LCA_LACTOBACILLUS_SAKEI_RS06345_|_UDP-glucose_4-epimerase_GalE_|_1260176:1261168_Forward
5.1.3.2 Galactose degradation
273 LCA_LACTOBACILLUS_SAKEI_RS01605_|_342318:342914_Forward Gap repair replication
274 LCA_LACTOBACILLUS_SAKEI_RS03075_|_type_I_glyceraldehyde-3-phosphate_dehydrogenase_|_606702:607718_Forward
1.2.1.12 GapA glyceraldehyde 3-phosphate dehydrogenase glycolysis
275 LCA_LACTOBACILLUS_SAKEI_RS02685_|_phosphoglucomutase_|_537274:538998_Forward 5.4.2.2 glucose et glucose-1P degradation
276 LCA_LACTOBACILLUS_SAKEI_RS06005_|_glucose_transporter_GlcU_|_1186810:1187676_Reverse Glucose transporter
277 LCA_LACTOBACILLUS_SAKEI_RS04230_|_825971:828250_Forward 6.3.2.2, 6.3.2.3 Gluthation biosynthesis, Synthesizes glutathione from L-glutamate and L-cysteine via gamma-L-glutamyl-L-cysteine, oxidative stress response
278 LCA_LACTOBACILLUS_SAKEI_RS05155_|_pyruvate_kinase_|_1019787:1021547_Reverse 2.7.1.40 Glycolysis
279 LCA_LACTOBACILLUS_SAKEI_RS05160_|_6-phosphofructokinase_|_1021630:1022589_Reverse 2.7.1.11 Glycolysis
280 LCA_LACTOBACILLUS_SAKEI_RS05880_|_pgi_|_glucose-6-phosphate_isomerase_|_1161804:1163150_Reverse
5.3.1.9 Glycolysis
281 LCA_LACTOBACILLUS_SAKEI_RS06595_|_glucokinase_|_1298719:1299690_Reverse 2.7.1.2 glycolysis
282 LCA_LACTOBACILLUS_SAKEI_RS07590_|_fructose-1,6-bisphosphate_aldolase,_class_II_|_1499463:1500326_Reverse
4.1.2.13 Glycolysis
283 LCA_LACTOBACILLUS_SAKEI_RS05925_|_pyruvate_oxidase_|_1170993:1172828_Forward 1.2.3.3 Glycolysis end products, Pyruvate + phosphate + O(2) <=> acetyl phosphate + CO(2) + H(2)O(2)
284 LCA_LACTOBACILLUS_SAKEI_RS04055_|_phosphoglycerate_mutase_|_795997:796656_Forward 5.4.2.1 Glycolysis heterolactic fermentation
285 LCA_LACTOBACILLUS_SAKEI_RS00470_|_2,3-bisphosphoglycerate-dependent_phosphoglycerate_mutase_|_96789:97496_Forward
5.4.2.1 Glycolysis heterolactic fermentation or gluconeogenesis
286 LCA_LACTOBACILLUS_SAKEI_RS00610_|_fructose_2,6-bisphosphatase_|_123831:124487_Reverse 5.4.2.1 Glycolysis heterolactic fermentation or gluconeogenesis (il y en a 5 dans le génome de 23K)
287 LCA_LACTOBACILLUS_SAKEI_RS00960_|_gpmA_|_2,3-bisphosphoglycerate-dependent_phosphoglycerate_mutase_|_198757:199446_Forward
5.4.2.1 Glycolysis heterolactic fermentation or gluconeogenesis (il y en a 5 dans le génome de 23K)
288 LCA_LACTOBACILLUS_SAKEI_RS08020_|_L-lactate_dehydrogenase_|_1593030:1594007_Forward 1.1.1.27 Glycolysis/fermentation
289 LCA_LACTOBACILLUS_SAKEI_RS04185_|_inosine-uridine_preferring_nucleoside_hydrolase_|_818364:819338_Reverse
3.2.2.1 Guanine guanosine salvage
290 LCA_LACTOBACILLUS_SAKEI_RS06170_|_coproporphyrinogen_III_oxidase_|_1219358:1220497_Reverse
1.3.99.22 heme biosynthesis (voie incomplete)
291 LCA_LACTOBACILLUS_SAKEI_RS01405_|_6-phosphogluconate_dehydrogenase_|_295038:295937_Forward
1.1.1.44 Heterolactic fermentation
292 LCA_LACTOBACILLUS_SAKEI_RS03510_|_692835:693497_Forward 5.1.3.1 heterolactic fermentation pentose phosphate pathway
293 LCA_LACTOBACILLUS_SAKEI_RS01820_|_glucose-6-phosphate_dehydrogenase_|_387082:388578_Forward
1.1.1.49 Heterolactic fermentation, pentose phosphate pathway
294 LCA_LACTOBACILLUS_SAKEI_RS06870_|_phosphogluconate_dehydrogenase_(NADP(+)-dependent,_decarboxylating)_|_1353144:1354565_Reverse
1.1.1.44 heterolactic fermentation, pentose phosphate pathway
295 LCA_LACTOBACILLUS_SAKEI_RS06835_|_HxlR_family_transcriptional_regulator_|_1347218:1347574_Reverse
HTH-type transcriptional regulator unknown target
296 LCA_LACTOBACILLUS_SAKEI_RS00395_|_serine_protease_|_78181:79404_Forward 3.4.21.- HtrA, degradation of protein resistance to stress
297 LCA_LACTOBACILLUS_SAKEI_RS06840_|_hydrolase_|_1347653:1348165_Reverse Hydrolase of unknown function
298 LCA_LACTOBACILLUS_SAKEI_RS08500_|_serine_hydrolase_|_1690589:1691572_Reverse Hydrolase, unknown function
299 LCA_LACTOBACILLUS_SAKEI_RS04905_|_hydroxymethylpyrimidine/phosphomethylpyrimidine_kinase_|_972913:973710_Forward
2.7.4.7 hydroxymethylpyrimidine / phosphomethylpyrimidine kinase, thiamine metabolism
300 LCA_LACTOBACILLUS_SAKEI_RS01830_|_hypothetical_protein_|_389902:391224_Forward Hypothetical
301 LCA_LACTOBACILLUS_SAKEI_RS04670_|_hypothetical_protein_|_921116:921769_Forward hypothetical

A.Rouger 2017 Annexe 1 Differentially expressed genes
192
302 LCA_LACTOBACILLUS_SAKEI_RS03900_|_tellurite_resistance_protein_TelA_|_768747:769943_Reverse
Hypothetical, toxic anion resistance
303 LCA_LACTOBACILLUS_SAKEI_RS02670_|_glycerol-3-phosphate_dehydrogenase_(NAD(P)(+))_|_534539:535561_Forward
1.1.1.94 Lipid biosynthesis, oxidoreductase
304 LCA_LACTOBACILLUS_SAKEI_RS04405_|_diacylglycerol_kinase_|_863501:863902_Forward 2.7.1.107/2.7.1.66 Lipid or membrane synthesis
305 LCA_LACTOBACILLUS_SAKEI_RS04675_|_lipoate--protein_ligase_A_|_921979:922992_Reverse 6.3.1.20
Lipoate is used as an essential cofactor by many enzyme complexes involved in oxidative metabolism inclusing pyruvate dehydrogenase Lipoate biosynthesis voir si 2.8.1.8 lipoyl syntase existe aussi.
306 LCA_LACTOBACILLUS_SAKEI_RS02665_|_prolipoprotein_diacylglyceryl_transferase_|_533694:534521_Forward
2.4.99.- Lipoprotein (cell surface) biosynthesis prolipoprotein diacylglyceryl transferase
307 LCA_LACTOBACILLUS_SAKEI_RS07675_|_diacylglycerol_kinase_|_1514794:1515822_Reverse 2.7.1.107 Lipoteichoic acid production (cell wall synthesis)
308 LCA_LACTOBACILLUS_SAKEI_RS04865_|_LysR_family_transcriptional_regulator_|_961443:962408_Reverse
LysR family transcriptional regulator, target unknown
309 LCA_LACTOBACILLUS_SAKEI_RS04860_|_manganese-dependent_inorganic_pyrophosphatase_|_960467:961390_Reverse
3.6.1.1 manganese-dependent inorganic pyrophosphatase, phosphate metabolism
310 LCA_LACTOBACILLUS_SAKEI_RS05710_|_mannose-6-phosphate_isomerase_|_1133860:1134834_Reverse
5.3.1.8 Mannose degradation, Glycolysis
311 LCA_LACTOBACILLUS_SAKEI_RS09000_|_alpha-galactosidase_|_1781915:1784089_Reverse 3.2.1.22 Melibiose (sugar) degradation
312 LCA_LACTOBACILLUS_SAKEI_RS01245_|_membrane_protein_|_258072:258539_Reverse Membran protein of unknown function
313 LCA_LACTOBACILLUS_SAKEI_RS07105_|_transporter_|_1402309:1403946_Reverse Membran protein of unknown function
314 LCA_LACTOBACILLUS_SAKEI_RS02075_|_membrane_protein_|_441802:442455_Forward Membrane homeostasis DedA membrane protein
315 LCA_LACTOBACILLUS_SAKEI_RS05150_|_membrane_protein_|_1019157:1019618_Reverse Membrane protein of unknown function
316 LCA_LACTOBACILLUS_SAKEI_RS05750_|_CAAX_amino_protease_|_1142886:1143542_Forward Membrane protein of unknown function
317 LCA_LACTOBACILLUS_SAKEI_RS05955_|_membrane_protein_|_1175960:1176640_Forward Membrane protein of unknown function
318 LCA_LACTOBACILLUS_SAKEI_RS05960_|_membrane_protein_|_1176700:1177407_Forward Membrane protein of unknown function
319 LCA_LACTOBACILLUS_SAKEI_RS06000_|_hypothetical_protein_|_1184101:1186644_Reverse Membrane protein of unknown function
320 LCA_LACTOBACILLUS_SAKEI_RS06265_|_phage_infection_protein_|_1242967:1245714_Forward Membrane protein of unknown function
321 LCA_LACTOBACILLUS_SAKEI_RS06855_|_insertase_|_1349511:1350500_Forward Membrane protein of unknown function
322 LCA_LACTOBACILLUS_SAKEI_RS09025_|_ABC_transporter_|_1787269:1790439_Reverse Membrane protein, unknown
323 LCA_LACTOBACILLUS_SAKEI_RS04370_|_hypothetical_protein_|_857410:859275_Forward Membren protein of unknown function
324 LCA_LACTOBACILLUS_SAKEI_RS02580_|_membrane_protein_|_518311:519444_Forward Membrene protein cell division?
325 LCA_LACTOBACILLUS_SAKEI_RS03955_|_cobalt_transporter_CbiM_|_776354:777361_Reverse Metal transport protein
326 LCA_LACTOBACILLUS_SAKEI_RS01815_|_Cro/Cl_family_transcriptional_regulator_|_386400:387062_Forward
Metal-dependent transcriptional regulator
327 LCA_LACTOBACILLUS_SAKEI_RS06885_|_SAM-dependent_methyltransferase_|_1356469:1357200_Reverse
methyl transferase of unknown function
328 LCA_LACTOBACILLUS_SAKEI_RS02430_|_S-adenosylmethionine_synthase_|_485247:486446_Forward 2.5.1.6 MetK catalyzes the formation of S-adenosylmethionine from methionine and ATP
329 LCA_LACTOBACILLUS_SAKEI_RS07365_|_hydroxymethylglutaryl-CoA_reductase,_degradative_|_1460261:1461529_Reverse
1.1.1.88 mevalonate degradation (vers acetoacetate), mais autre enzyme 4.1.3.4 n'est pas surexprimée
330 LCA_LACTOBACILLUS_SAKEI_RS04560_|_mevalonate_kinase_|_892840:893805_Reverse 2.7.1.36 Mevalonate kinase pathway mevalonate synhtesis
331 LCA_LACTOBACILLUS_SAKEI_RS01150_|_manganese_transporter_|_241472:243046_Forward Mn(2+)/Fe(2+) transport protein
332 LCA_LACTOBACILLUS_SAKEI_RS01695_|_356863:357510_Forward modulates transcription in response to the NADH/NAD(+) redox state, regulates cydAB in B. subtilis
333 LCA_LACTOBACILLUS_SAKEI_RS01560_|_MATE_family_efflux_transporter_|_332622:333989_Forward Na(+) antiporter (drug efflux pump)
334 LCA_LACTOBACILLUS_SAKEI_RS07890_|_N-acetylglucosamine-6-phosphate_deacetylase_|_1564739:1565878_Reverse
3.5.1.25 N-acetyl glucosamine degradation (PTS sugar) vers glycolysis
335 LCA_LACTOBACILLUS_SAKEI_RS02000_|_glucosamine-6-phosphate_deaminase_|_426022:426729_Forward
3.5.99.6 N-Acetyl-glucosamine degradation, carbon nitrogen metabolism
336 LCA_LACTOBACILLUS_SAKEI_RS08790_|_isochorismatase_|_1737948:1738499_Forward 3.5.1.19 NAD salvage, Metabolism of coenzymes and prosthetic groups, Nicotinamide + H(2)O <=> nicotinate + NH(3)
337 LCA_LACTOBACILLUS_SAKEI_RS02940_|_NADH_peroxidase_|_585192:586544_Forward 1.11.1.1 NADH peroxidase LSA0575 redox
338 LCA_LACTOBACILLUS_SAKEI_RS04255_|_aminotransferase_V_|_832370:833518_Forward 2.8.1.7 NifS/IcsS protein homolog, AA (alanine) biosynthesis
339 LCA_LACTOBACILLUS_SAKEI_RS01355_|_nucleoside_transporter_|_284050:285285_Forward nucleoside permease
340 LCA_LACTOBACILLUS_SAKEI_RS01345_|_oligoendopeptidase_F_|_280719:282524_Reverse 3.4.24.- oligoendopeptidase PepF1
341 LCA_LACTOBACILLUS_SAKEI_RS02510_|_3-oxoacyl-ACP_reductase_|_502399:503130_Forward Oxidoreductase fatty acid synthesis
342 LCA_LACTOBACILLUS_SAKEI_RS00150_|_2,5-diketo-D-gluconic_acid_reductase_|_29633:30484_Reverse
1.1.1.274 oxidoreductase of aldo/keto reductase family EC number putative
343 LCA_LACTOBACILLUS_SAKEI_RS04100_|_805217:805672_Forward 4.2.1.59 Palmitate (fatty acids) biosynthesis
344 LCA_LACTOBACILLUS_SAKEI_RS00200_|_2-dehydropantoate_2-reductase_|_38535:39473_Forward 1.1.1.169 PanE ketopantoate reductase; catalyzes the NADPH reduction of ketopantoate to pantoate; functions in pantothenate (vitamin B5) biosynthesis

A.Rouger 2017 Annexe 1 Differentially expressed genes
193
345 LCA_LACTOBACILLUS_SAKEI_RS08060_|_holo-ACP_synthase_|_1599997:1600350_Reverse 2.7.8.7 Pantothenate and CoA biosynthesis
346 LCA_LACTOBACILLUS_SAKEI_RS07195_|_hypothetical_protein_|_1422996:1423736_Reverse partial gene (mutation?) with identity to histidine kinase (regulator)
347 LCA_LACTOBACILLUS_SAKEI_RS09505_|_814723:815424_Forward 6.3.4.15 Pathway biotin-carboxyl carrier protein assembly
348 LCA_LACTOBACILLUS_SAKEI_RS08400_|_1666291:1666974_Forward 5.3.1.6 Pentose phosphate pathway (ribose degradation)
349 LCA_LACTOBACILLUS_SAKEI_RS07530_|_type_I_methionyl_aminopeptidase_|_1490240:1491037_Reverse
3.4.11.18 PepM, methionine aminopeptidase, protein modification, chaperoning
350 LCA_LACTOBACILLUS_SAKEI_RS05215_|_acyltransferase_|_1035333:1037261_Reverse peptidoglycan O-acetyltransferase, cell wall, OatA
351 LCA_LACTOBACILLUS_SAKEI_RS00475_|_penicillin-binding_protein_|_97477:98628_Forward 3.4.16.4 Peptodoglycan biosysnthesis
352 LCA_LACTOBACILLUS_SAKEI_RS03080_|_phosphoglycerate_kinase_|_607819:609033_Forward 2.7.2.3 PGK phosphoglycerate kinase glycolysis
353 LCA_LACTOBACILLUS_SAKEI_RS02600_|_phosphate_ABC_transporter_permease_subunit_PstC_|_522788:523711_Forward
Phosphate ABC transporter
354 LCA_LACTOBACILLUS_SAKEI_RS02610_|_phosphate_ABC_transporter_ATP-binding_protein_|_524605:525414_Forward
Phosphate ABC transporter
355 LCA_LACTOBACILLUS_SAKEI_RS02615_|_phosphate_ABC_transporter_ATP-binding_protein_|_525435:526193_Forward
Phosphate ABC transporter
356 LCA_LACTOBACILLUS_SAKEI_RS04395_|_phosphate_starvation_protein_PhoH_|_862069:863037_Forward
phosphate starvation induced protein of unknown function
357 LCA_LACTOBACILLUS_SAKEI_RS01370_|_phosphoketolase_|_286496:288859_Forward 4.1.2.9 Phosphoketolase/ D-xylulose 5-phosphate/D-fructose 6-phosphate phosphoketolase
358 LCA_LACTOBACILLUS_SAKEI_RS03730_|_GTP_pyrophosphokinase_|_732689:734920_Forward 2.7.6.5 ppGpp biosynthesis
359 LCA_LACTOBACILLUS_SAKEI_RS05220_|_obgE_|_GTPase_ObgE_|_1037400:1038692_Reverse ppGpp-binding GTPase involved in cell partioning, DNA repair and ribosome assembly
360 LCA_LACTOBACILLUS_SAKEI_RS06485_|_transcriptional_regulator_|_1281049:1281780_Reverse Probable transcriptional regulatory , target unknown
361 LCA_LACTOBACILLUS_SAKEI_RS05290_|_ATP-dependent_Clp_protease_ATP-binding_subunit_ClpX_|_1054588:1055841_Reverse
Protease, stress response
362 LCA_LACTOBACILLUS_SAKEI_RS07150_|_undecaprenyl-diphosphatase_|_1415510:1416346_Reverse 3.6.1.27 Protect, drug resistance
363 LCA_LACTOBACILLUS_SAKEI_RS00565_|_GTPase_HflX_|_111469:112740_Reverse Protein fate or degradation
364 LCA_LACTOBACILLUS_SAKEI_RS06695_|_GNAT_family_acetyltransferase_|_1318784:1319347_Reverse
protein of unknown function, acetyltransferase family protein
365 LCA_LACTOBACILLUS_SAKEI_RS02300_|_PTS_mannose_transporter_subunit_EIIAB_|_463668:464645_Forward
PTS EIIABCD mannose
366 LCA_LACTOBACILLUS_SAKEI_RS02305_|_PTS_mannose/fructose/sorbose_transporter_subunit_IIC_|_464680:465486_Forward
PTS EIIABCD mannose
367 LCA_LACTOBACILLUS_SAKEI_RS02310_|_PTS_mannose_transporter_subunit_IID_|_465505:466416_Forward
PTS EIIABCD mannose
368 LCA_LACTOBACILLUS_SAKEI_RS01680_|_PTS_sugar_transporter_subunit_IIB_|_353900:354217_Forward
2.7.1.69 PTS EIIB cellobiose
369 LCA_LACTOBACILLUS_SAKEI_RS07260_|_phosphocarrier_protein_HPr_|_1439647:1439913_Reverse 2.7.11.- PTS general enzyme HPr, PTS sugar utilization
370 LCA_LACTOBACILLUS_SAKEI_RS07255_|_phosphoenolpyruvate--protein_phosphotransferase_|_1437923:1439647_Reverse
2.7.3.9 PTS general Enzyme I, PTS sugar utilization
371 LCA_LACTOBACILLUS_SAKEI_RS00305_|_adenylosuccinate_synthetase_|_59513:60793_Forward 6.3.4.4 PurA, adenylosuccinate synthetase, purines adenosine nucleotide biosynthesis
372 LCA_LACTOBACILLUS_SAKEI_RS03970_|_1-(5-phosphoribosyl)-5-amino-4-imidazole-_carboxylate_carboxylase_|_779645:780427_Forward
PurE like, purine metabolism
373 LCA_LACTOBACILLUS_SAKEI_RS06275_|_pyrH_|_UMP_kinase_|_1246332:1247057_Reverse 2.7.4.22 purine and pyrimidine metabolism; pyrimidine ribonucleotides interconversion
374 LCA_LACTOBACILLUS_SAKEI_RS07240_|_anaerobic_ribonucleoside_triphosphate_reductase_|_1432875:1435091_Reverse
1.17.4.2 purine biosynthesis
375 LCA_LACTOBACILLUS_SAKEI_RS07725_|_adenylosuccinate_lyase_|_1528041:1529333_Reverse 4.3.2.2 Purine metabolism
376 LCA_LACTOBACILLUS_SAKEI_RS07730_|_phosphoribosylaminoimidazole_carboxylase_|_1529389:1530501_Reverse
4.1.1.21 Purine metabolism
377 LCA_LACTOBACILLUS_SAKEI_RS09050_|_deoxyadenosine_kinase_|_1795859:1796515_Forward 2.7.1.74, 2.7.1.76 Purine metabolism, ATP + deoxyadenosine <=> ADP + dAMP
378 LCA_LACTOBACILLUS_SAKEI_RS07980_|_hypoxanthine_phosphoribosyltransferase_|_1583430:1583975_Reverse
2.4.2.8 Purine metabolism, IMP + diphosphate <=> hypoxanthine + 5-phospho-alpha-D-ribose 1-diphosphate,
379 LCA_LACTOBACILLUS_SAKEI_RS01615_|_thymidylate_kinase_|_343329:343973_Forward 2.7.4.9 Purine pyrimidine metabolism
380 LCA_LACTOBACILLUS_SAKEI_RS05670_|_thymidine_kinase_|_1125569:1126162_Reverse 2.7.1.21 Purines pyrimidines metabolism
381 LCA_LACTOBACILLUS_SAKEI_RS05645_|_uracil_phosphoribosyltransferase_|_1120440:1121069_Reverse
2.4.2.9 Purines pyrimidines metabolism; Salvage pathways of pyrimidine ribonucleotides; Nucleosides and nucleotides interconversion
382 LCA_LACTOBACILLUS_SAKEI_RS02530_|_506382:507947_Forward 3.1.4.16 Putative 2',3'-cyclic-nucleotide 2'-phosphodiesterase. RNA degradation
383 LCA_LACTOBACILLUS_SAKEI_RS02440_|_hypothetical_protein_|_488035:489060_Reverse 3.1.1.31 Putative 6-phosphogluconolactonase produit 6P-gluconate Utilisation des suches
384 LCA_LACTOBACILLUS_SAKEI_RS07185_|_adaptor_protein_MecA_|_1421409:1422098_Reverse putative adaptor protein controlling oligomerization of the AAA+ protein ClpC, Role: control, adaptation
385 LCA_LACTOBACILLUS_SAKEI_RS06820_|_aminodeoxychorismate_lyase_|_1342235:1343386_Reverse 4.1.3.38 putative aminodeoxychorismate lyase family protein, 4-amino-4-deoxychorismate <=> 4-aminobenzoate + pyruvate
386 LCA_LACTOBACILLUS_SAKEI_RS05330_|_DNA_internalization-related_competence_protein_ComEC/Rec2_|_1063849:1066116_Reverse
Putative bacterial type II secretion/competence system, protein ComEC-like
387 LCA_LACTOBACILLUS_SAKEI_RS07005_|_lipase_|_1381111:1381869_Reverse 3.1.1.1 Putative carboxyesterase
388 LCA_LACTOBACILLUS_SAKEI_RS04625_|_D-3-phosphoglycerate_dehydrogenase_|_913496:914449_Forward
1.1.1.95 Putative D-3-phosphoglycerate dehydrogenase Serine biosynthesis
389 LCA_LACTOBACILLUS_SAKEI_RS03190_|_histidine_triad_protein_|_631277:631705_Reverse Putative diadenosine polyphosphate hydrolase. Unknown function

A.Rouger 2017 Annexe 1 Differentially expressed genes
194
390 LCA_LACTOBACILLUS_SAKEI_RS08340_|_lipase_|_1656016:1656873_Reverse Putative esterase, unknown substrate
391 LCA_LACTOBACILLUS_SAKEI_RS08005_|_sugar_transporter_|_1586862:1588445_Reverse putative exporter, unknown substrate
392 LCA_LACTOBACILLUS_SAKEI_RS07535_|_flavodoxin_|_1491300:1491752_Forward Putative flavodoxin, electron transport
393 LCA_LACTOBACILLUS_SAKEI_RS02040_|_cell_surface_protein_|_435713:437041_Reverse 3.1.4.46 Putative Glycerophosphoryl diester phosphodiesterase
394 LCA_LACTOBACILLUS_SAKEI_RS07555_|_glucosyl_transferase_family_2_|_1493231:1494163_Forward Putative glycosyltransferase CsbB, cell wall? Controled by stress in B. subtilis
395 LCA_LACTOBACILLUS_SAKEI_RS00310_|_guanine_permease_|_60964:62274_Forward Putative Guanine/hypoxanthine permease pbuG
396 LCA_LACTOBACILLUS_SAKEI_RS06305_|_alpha/beta_hydrolase_|_1250954:1251889_Reverse putative Hydrolase of the alpha/beta superfamily, unknown function
397 LCA_LACTOBACILLUS_SAKEI_RS06895_|_HD_domain-containing_protein_|_1357569:1358171_Reverse
Putative hydrolase of unknown function
398 LCA_LACTOBACILLUS_SAKEI_RS04205_|_haloacid_dehalogenase_|_821726:822376_Forward Putative hydrolase, haloacid dehalogenase family unknown function
399 LCA_LACTOBACILLUS_SAKEI_RS04515_|_haloacid_dehalogenase_|_885030:885836_Reverse Putative hydrolase, haloacid dehalogenase family unknown function
400 LCA_LACTOBACILLUS_SAKEI_RS06060_|_haloacid_dehalogenase_|_1199176:1199940_Forward Putative hydrolase, haloacid dehalogenase family unknown function
401 LCA_LACTOBACILLUS_SAKEI_RS06675_|_haloacid_dehalogenase_|_1315482:1316369_Forward Putative hydrolase, haloacid dehalogenase family unknown function
402 LCA_LACTOBACILLUS_SAKEI_RS06915_|_haloacid_dehalogenase_|_1360296:1360826_Reverse Putative hydrolase, haloacid dehalogenase family unknown function
403 LCA_LACTOBACILLUS_SAKEI_RS05385_|_myo-inositol-1-monophosphatase_|_1074562:1075359_Reverse
3.1.3.25/ 3.1.3.- Putative inositol monophosphatase / 5' nucleotidase (purine nucleoside monophosphate)
404 LCA_LACTOBACILLUS_SAKEI_RS02475_|_magnesium_transporter_|_494068:495021_Reverse Putative ion Mg(2+)/Co(2+) transport protein
405 LCA_LACTOBACILLUS_SAKEI_RS07700_|_CamS_family_sex_pheromone_protein_|_1520008:1521135_Reverse
putative lipoprotein of unknown function
406 LCA_LACTOBACILLUS_SAKEI_RS05580_|_membrane_protein_insertion_efficiency_factor_YidD_|_1110307:1110555_Reverse
putative membrane protein insertion efficiency factor, secretion? Cell division?
407 LCA_LACTOBACILLUS_SAKEI_RS08385_|_twitching_motility_protein_PilT_|_1662976:1664088_Reverse
Putative membrane protein possibly involved in RNA binding
408 LCA_LACTOBACILLUS_SAKEI_RS01835_|_phosphoesterase_|_391228:392181_Forward putative nanoRNase (oligoribonuclease), 3',5'-bisphosphate nucleotidase
409 LCA_LACTOBACILLUS_SAKEI_RS06540_|_FMN_reductase_|_1289947:1290504_Forward 1.6.5.2 Putative oxidoreductase
410 LCA_LACTOBACILLUS_SAKEI_RS01575_|_hypothetical_protein_|_335565:338186_Forward 2.3.2.3 Putative Phosphatidylglycerol lysyltransferase
411 LCA_LACTOBACILLUS_SAKEI_RS07505_|_multidrug_MFS_transporter_|_1485657:1486352_Reverse Putative phosphotransferase involved in extracellular matrix synthesis
412 LCA_LACTOBACILLUS_SAKEI_RS05825_|_potassium_transporter_Kup_|_1151363:1153405_Reverse putative potassium transport system protein (kup)
413 LCA_LACTOBACILLUS_SAKEI_RS02505_|_zinc_protease_|_501095:502399_Forward 3.4.24.- Putative processing protease (protein trafficking?)
414 LCA_LACTOBACILLUS_SAKEI_RS00620_|_prolyl_aminopeptidase_|_125526:126428_Reverse 3.4.11.5 Putative proline amino peptidase
415 LCA_LACTOBACILLUS_SAKEI_RS04380_|_hypothetical_protein_|_860078:860920_Reverse Putative pyruvate, phosphate dikinase regulatory protein 1, sugar metabolism
416 LCA_LACTOBACILLUS_SAKEI_RS07990_|_1585478:1585921_Reverse putative RNA degradation protein
417 LCA_LACTOBACILLUS_SAKEI_RS08165_|_membrane_protein_|_1622233:1622964_Reverse putative stress adaptation transporter
418 LCA_LACTOBACILLUS_SAKEI_RS06775_|_hypothetical_protein_|_1335081:1335299_Reverse Putative stress response protein
419 LCA_LACTOBACILLUS_SAKEI_RS06590_|_sulfurtransferase_|_1298281:1298676_Reverse Putative sulfur transferase of unknown function
420 LCA_LACTOBACILLUS_SAKEI_RS07550_|_membrane_protein_|_1492807:1493229_Forward Putative teichoic acid glycosylation protein, cell wall?
421 LCA_LACTOBACILLUS_SAKEI_RS06600_|_hypothetical_protein_|_1299687:1299920_Reverse Putative transcription factor of unknown function
422 LCA_LACTOBACILLUS_SAKEI_RS02515_|_XRE_family_transcriptional_regulator_|_503212:504135_Forward
Putative transcription regulator unknown function
423 LCA_LACTOBACILLUS_SAKEI_RS06160_|_HrcA_family_transcriptional_regulator_|_1217325:1218383_Reverse
Putative transcriptional regulator of heat-shock genes
424 LCA_LACTOBACILLUS_SAKEI_RS06980_|_MarR_family_transcriptional_regulator_|_1374739:1375230_Reverse
Putative transcriptional regulator, MarR family, unknown target
425 LCA_LACTOBACILLUS_SAKEI_RS07295_|_hypothetical_protein_|_1446610:1447950_Reverse Putative transporter, unknown substrate
426 LCA_LACTOBACILLUS_SAKEI_RS09030_|_drug_ABC_exporter,_membrane-spanning_subunit_|_1790636:1791370_Reverse
Putative transporter, unknown substrate
427 LCA_LACTOBACILLUS_SAKEI_RS09035_|_drug_ABC_exporter,_ATP-binding_subunit_|_1791383:1792252_Reverse
Putative transporter, unknown substrate
428 LCA_LACTOBACILLUS_SAKEI_RS09415_|_ABC_transporter_ATP-binding_protein_|_1874495:1876119_Reverse
Putative transporter, unknown substrate
429 LCA_LACTOBACILLUS_SAKEI_RS01330_|_metal_ABC_transporter_substrate-binding_protein_|_278307:279194_Forward
Putative zinc/iron ABC transporter 1 seule ssu surexprimée
430 LCA_LACTOBACILLUS_SAKEI_RS05565_|_glycine_cleavage_system_protein_H_|_1108427:1108735_Reverse
Putative, Metabolism of amino acids and related molecules
431 LCA_LACTOBACILLUS_SAKEI_RS02285_|_dihydroorotate_oxidase_|_460281:461222_Forward 1.3.3.1/1.3.98.1 PyrD de novo biosynthesis of pyrimidine nucleotides
432 LCA_LACTOBACILLUS_SAKEI_RS07805_|_nicotinate_phosphoribosyltransferase_|_1544046:1545509_Reverse
2.4.2.11 Pyridine nucleotide biosynthesis
433 LCA_LACTOBACILLUS_SAKEI_RS08125_|_CTP_synthetase_|_1613960:1615552_Reverse 6.3.4.2 pyrimidine ribonucleotides interconversion, Pyrimidine Nucleotide Biosynthesis
434 LCA_LACTOBACILLUS_SAKEI_RS04065_|_hypothetical_protein_|_797333:799861_Forward 3.1.11.5 Recombination

A.Rouger 2017 Annexe 1 Differentially expressed genes
195
435 LCA_LACTOBACILLUS_SAKEI_RS00640_|_ATP-dependent_DNA_helicase_|_129322:131613_Forward Recombination/Replication ?
436 LCA_LACTOBACILLUS_SAKEI_RS07220_|_histidine_kinase_|_1428346:1429414_Forward Regulation, unknown target, two-component system sensor histidine kinase
437 LCA_LACTOBACILLUS_SAKEI_RS00375_|_PAS_domain-containing_sensor_histidine_kinase_|_73161:75059_Forward
Regulator (two component system)
438 LCA_LACTOBACILLUS_SAKEI_RS01990_|_catabolite_control_protein_A_|_422134:423135_Forward Regulator catabolite repression
439 LCA_LACTOBACILLUS_SAKEI_RS00605_|_LacI_family_transcriptional_regulator_|_122821:123780_Forward
Regulator LacI family
440 LCA_LACTOBACILLUS_SAKEI_RS00615_|_MarR_family_transcriptional_regulator_|_124702:125160_Forward
Regulator MarR family
441 LCA_LACTOBACILLUS_SAKEI_RS00915_|_MarR_family_transcriptional_regulator_|_190786:191328_Forward
Regulator MarR family
442 LCA_LACTOBACILLUS_SAKEI_RS08345_|_transcription_termination/antitermination_protein_NusG_|_1657216:1657764_Reverse
Regulator of elongation (transcription)
443 LCA_LACTOBACILLUS_SAKEI_RS05010_|_ABC_transporter_ATP-binding_protein_|_993280:995169_Reverse
regulator or transporter, unknown substrate
444 LCA_LACTOBACILLUS_SAKEI_RS02585_|_DNA-binding_response_regulator_|_519464:520177_Forward
Regulator two component system Phosphate regulon
445 LCA_LACTOBACILLUS_SAKEI_RS02590_|_two-component_sensor_histidine_kinase_|_520164:521825_Forward
Regulator two component system Phosphate regulon
446 LCA_LACTOBACILLUS_SAKEI_RS06045_|_two-component_sensor_histidine_kinase_|_1196352:1197788_Reverse
Regulator, two component system (histidine kinase is not upregulated
447 LCA_LACTOBACILLUS_SAKEI_RS00005_|_chromosomal_replication_initiator_protein_DnaA_|_210:1556_Forward
Replication
448 LCA_LACTOBACILLUS_SAKEI_RS00010_|_DNA_polymerase_III_subunit_beta_|_1734:2873_Forward Replication
449 LCA_LACTOBACILLUS_SAKEI_RS00020_|_DNA_recombination_protein_RecF_|_3350:4477_Forward Replication
450 LCA_LACTOBACILLUS_SAKEI_RS00025_|_gyrB_|_DNA_gyrase_subunit_B_|_4499:6490_Forward Replication
451 LCA_LACTOBACILLUS_SAKEI_RS00040_|_single-stranded_DNA-binding_protein_|_9683:10195_Forward
Replication
452 LCA_LACTOBACILLUS_SAKEI_RS00060_|_13320:14717_Forward 3.6.1.- Replication
453 LCA_LACTOBACILLUS_SAKEI_RS01595_|_DNA_polymerase_III_subunit_gamma/tau_|_340242:341957_Forward
2.7.7.7 Replication
454 LCA_LACTOBACILLUS_SAKEI_RS01625_|_DNA_polymerase_III_subunit_delta'_|_344321:345313_Forward
2.7.7.7 Replication
455 LCA_LACTOBACILLUS_SAKEI_RS01745_|_Holliday_junction_ATP-dependent_DNA_helicase_RuvA_|_369905:370516_Forward
Replication
456 LCA_LACTOBACILLUS_SAKEI_RS01750_|_Holliday_junction_DNA_helicase_RuvB_|_370529:371536_Forward
Replication
457 LCA_LACTOBACILLUS_SAKEI_RS03480_|_primosomal_protein_N'_|_684438:686855_Forward Replication
458 LCA_LACTOBACILLUS_SAKEI_RS03845_|_DNA_topoisomerase_III_|_755103:757175_Forward Replication
459 LCA_LACTOBACILLUS_SAKEI_RS04435_|_DNA_primase_|_869440:871323_Forward Replication
460 LCA_LACTOBACILLUS_SAKEI_RS04565_|_ATP-dependent_helicase/deoxyribonuclease_subunit_B_|_894068:897628_Forward
Replication
461 LCA_LACTOBACILLUS_SAKEI_RS04575_|_ATP-dependent_helicase_|_901422:904256_Forward Replication
462 LCA_LACTOBACILLUS_SAKEI_RS04605_|_Holliday_junction_resolvase_RecU_|_910024:910656_Reverse
Replication
463 LCA_LACTOBACILLUS_SAKEI_RS05165_|_dnaE_|_DNA_polymerase_III_subunit_alpha_|_1022722:1026054_Reverse
Replication
464 LCA_LACTOBACILLUS_SAKEI_RS06975_|_DNA_polymerase_I_|_1371955:1374615_Reverse Replication
465 LCA_LACTOBACILLUS_SAKEI_RS07705_|_DNA_ligase_(NAD(+))_LigA_|_1521218:1523251_Reverse Replication
466 LCA_LACTOBACILLUS_SAKEI_RS07710_|_ATP-dependent_DNA_helicase_PcrA_|_1523766:1526015_Reverse
Replication
467 LCA_LACTOBACILLUS_SAKEI_RS01725_|_DNA_mismatch_repair_protein_MutS_|_363788:366391_Forward
Replication and DNA repair
468 LCA_LACTOBACILLUS_SAKEI_RS01730_|_DNA_mismatch_repair_protein_MutL_|_366415:368373_Forward
Replication and DNA repair
469 LCA_LACTOBACILLUS_SAKEI_RS00075_|_nucleoid_occlusion_protein_|_17517:18416_Forward Replication parB
470 LCA_LACTOBACILLUS_SAKEI_RS07330_|_1453927:1454733_Reverse Replication, recombination regulator RecX
471 LCA_LACTOBACILLUS_SAKEI_RS02525_|_DNA_recombination/repair_protein_RecA_|_504928:505995_Forward
Replication/recombination
472 LCA_LACTOBACILLUS_SAKEI_RS03535_|_ATP-dependent_DNA_helicase_RecG_|_697651:699699_Forward
Replication/transcription
473 LCA_LACTOBACILLUS_SAKEI_RS04880_|_DNA_topoisomerase_IV_|_966009:968426_Reverse Replication/transcription
474 LCA_LACTOBACILLUS_SAKEI_RS04945_|_DNA_topoisomerase_I_|_981736:983820_Reverse Replication/transcription
475 LCA_LACTOBACILLUS_SAKEI_RS05095_|_ATP-dependent_DNA_helicase_RecQ_|_1010465:1011910_Reverse
Replication/transcription
476 LCA_LACTOBACILLUS_SAKEI_RS07625_|_helicase_|_1505389:1506735_Reverse Replication/transcription
477 LCA_LACTOBACILLUS_SAKEI_RS04710_|_927727:929898_Reverse 1.17.4.1 ribonucleoside diphosphate reductase subunit alpha, 3 subunits, in operon, but only one upregulated. Catalyzes the rate-limiting step in dNTP synthesis
478 LCA_LACTOBACILLUS_SAKEI_RS00930_|_193092:193976_Forward Ribose operon

A.Rouger 2017 Annexe 1 Differentially expressed genes
196
479 LCA_LACTOBACILLUS_SAKEI_RS00935_|_D-ribose_pyranase_|_193997:194392_Forward Ribose operon
480 LCA_LACTOBACILLUS_SAKEI_RS00940_|_194412:195320_Forward Ribose operon
481 LCA_LACTOBACILLUS_SAKEI_RS00945_|_LacI_family_transcriptional_regulator_|_195385:196407_Forward
Ribose operon
482 LCA_LACTOBACILLUS_SAKEI_RS01840_|_DEAD/DEAH_box_helicase_|_392226:393581_Forward 3.6.4.13 RNA helicases utilize the energy from ATP hydrolysis to unwind RNA
483 LCA_LACTOBACILLUS_SAKEI_RS03440_|_cell_division_protein_FtsJ_|_678340:679170_Forward RNA processing
484 LCA_LACTOBACILLUS_SAKEI_RS05145_|_S1_RNA-binding_protein_|_1018225:1019136_Reverse RNA processing
485 LCA_LACTOBACILLUS_SAKEI_RS03470_|_DNA-directed_RNA_polymerase_subunit_omega_|_682873:683130_Forward
2.7.7.6 RpoZ, transcription
486 LCA_LACTOBACILLUS_SAKEI_RS06815_|_uridine_kinase_|_1341521:1342156_Reverse 2.7.1.48 salvage pathways of pyrimidine ribonucleotides
487 LCA_LACTOBACILLUS_SAKEI_RS01805_|_preprotein_translocase_subunit_YajC_|_383023:383379_Forward
Secretion
488 LCA_LACTOBACILLUS_SAKEI_RS02560_|_protein_translocase_subunit_SecA_|_512874:515237_Forward
Secretion
489 LCA_LACTOBACILLUS_SAKEI_RS02565_|_peptide_chain_release_factor_2_|_515425:516423_Forward Secretion
490 LCA_LACTOBACILLUS_SAKEI_RS03585_|_signal_recognition_particle-docking_protein_FtsY_|_712033:713496_Forward
Secretion
491 LCA_LACTOBACILLUS_SAKEI_RS03605_|_DNA-binding_protein_|_717276:717617_Forward Secretion
492 LCA_LACTOBACILLUS_SAKEI_RS03610_|_signal_recognition_particle_protein_|_717642:719078_Forward
Secretion
493 LCA_LACTOBACILLUS_SAKEI_RS04745_|_signal_peptidase_II_|_935242:935697_Forward Secretion
494 LCA_LACTOBACILLUS_SAKEI_RS09445_|_hypothetical_protein_|_1882883:1883662_Reverse Secretion system?
495 LCA_LACTOBACILLUS_SAKEI_RS03500_|_protein_kinase_|_689929:691857_Forward 2.7.11.1 serine/threonine kinase of unknown function
496 LCA_LACTOBACILLUS_SAKEI_RS03495_|_protein_phosphatase_|_689186:689932_Forward 3.1.3.16 serine/threonine phosphatase of unknown function
497 LCA_LACTOBACILLUS_SAKEI_RS01295_|_serine/threonine_protein_phosphatase_|_269925:270722_Reverse
3.1.3.48 Serine/tyrosine protein phosphatase
498 LCA_LACTOBACILLUS_SAKEI_RS06340_|_1257719:1260031_Reverse single-stranded-DNA-specific exonuclease RecJ, DNA recombination and repair
499 LCA_LACTOBACILLUS_SAKEI_RS01480_|_L-cystine_transporter_tcyP_|_314604:316001_Forward sodium-cystine symporter
500 LCA_LACTOBACILLUS_SAKEI_RS00185_|_universal_stress_protein_UspA_|_36687:37160_Forward Stress response
501 LCA_LACTOBACILLUS_SAKEI_RS00205_|_universal_stress_protein_A_|_39487:39954_Forward Stress response
502 LCA_LACTOBACILLUS_SAKEI_RS01155_|_universal_stress_protein_UspA_|_243064:243498_Forward Stress response
503 LCA_LACTOBACILLUS_SAKEI_RS01705_|_co-chaperone_GroES_|_358364:358648_Forward Stress response
504 LCA_LACTOBACILLUS_SAKEI_RS01710_|_groEL_|_molecular_chaperone_GroEL_|_358702:360327_Forward
Stress response
505 LCA_LACTOBACILLUS_SAKEI_RS01975_|_general_stress_protein_|_419531:419965_Forward Stress response
506 LCA_LACTOBACILLUS_SAKEI_RS02090_|_general_stress_protein_|_444373:444750_Forward Stress response
507 LCA_LACTOBACILLUS_SAKEI_RS03410_|_alkaline-shock_protein_|_673968:674411_Forward Stress response
508 LCA_LACTOBACILLUS_SAKEI_RS08445_|_glycine/betaine_ABC_transporter_|_1676360:1677202_Reverse
Stress response (osmoprotection)
509 LCA_LACTOBACILLUS_SAKEI_RS00795_|_alkaline-shock_protein_|_160758:161186_Forward Stress response protein
510 LCA_LACTOBACILLUS_SAKEI_RS07270_|_ATP-dependent_Clp_protease_ATP-binding_subunit_|_1440481:1442646_Forward
Stress response, ATPase/chaperone ClpE, specificity factor for ClpP protease
511 LCA_LACTOBACILLUS_SAKEI_RS05745_|_cold-shock_protein_|_1142484:1142684_Reverse Stress response, cold shok protein CspC
512 LCA_LACTOBACILLUS_SAKEI_RS06250_|_1239741:1241018_Reverse Stress response; inner membrane zinc metalloprotease required for the extracytoplasmic stress response mediated by sigma(E) (YaeL)
513 LCA_LACTOBACILLUS_SAKEI_RS00865_|_sodium:solute_symporter_|_176864:178279_Forward sugar:cation symporter
514 LCA_LACTOBACILLUS_SAKEI_RS03385_|_TetR_family_transcriptional_regulator_|_671315:671935_Forward
TetR family transcriptional regulator of unknown function
515 LCA_LACTOBACILLUS_SAKEI_RS03515_|_thiamine_pyrophosphokinase_|_693484:694134_Forward 2.7.6.2 thiamine salvage cofactor synthesis
516 LCA_LACTOBACILLUS_SAKEI_RS03220_|_thiol_reductase_thioredoxin_|_636150:636470_Forward Thioredoxine LSA0634 Redox
517 LCA_LACTOBACILLUS_SAKEI_RS02080_|_Ferredoxin--NADP_reductase_2_|_442510:443496_Reverse 1.8.1.9 Thioredoxine reductase/Redox
518 LCA_LACTOBACILLUS_SAKEI_RS01885_|_thiol_reductase_thioredoxin_|_403233:403544_Forward Thioredoxine/ redox
519 LCA_LACTOBACILLUS_SAKEI_RS05005_|_thymidylate_synthase_|_992134:993084_Reverse 2.1.1.45 thymidylate synthase, purines pyrimidines metabolism
520 LCA_LACTOBACILLUS_SAKEI_RS03090_|_eno_|_enolase_|_609932:611227_Forward 5.3.1.1 TPI Triose phosphate isomerase glycolysis
521 LCA_LACTOBACILLUS_SAKEI_RS04440_|_871347:872456_Forward Transcription
522 LCA_LACTOBACILLUS_SAKEI_RS08010_|_transcription-repair_coupling_factor_|_1588482:1592003_Reverse
Transcription

A.Rouger 2017 Annexe 1 Differentially expressed genes
197
523 LCA_LACTOBACILLUS_SAKEI_RS08360_|_DNA-directed_RNA_polymerase_subunit_sigma_|_1658326:1658886_Reverse
Transcription
524 LCA_LACTOBACILLUS_SAKEI_RS05440_|_hypothetical_protein_|_1087273:1087485_Forward Transcription, omega 1 subunit of RNA polymerase
525 LCA_LACTOBACILLUS_SAKEI_RS06955_|_helicase_DnaB_|_1368080:1369459_Reverse Transcription/replication
526 LCA_LACTOBACILLUS_SAKEI_RS01860_|_crossover_junction_endodeoxyribonuclease_RuvA_|_397932:398375_Forward
Transcription/translation
527 LCA_LACTOBACILLUS_SAKEI_RS06220_|_transcription_termination/antitermination_protein_NusA_|_1229357:1230574_Reverse
Transcription; transcription elongation factor NusA
528 LCA_LACTOBACILLUS_SAKEI_RS05140_|_Fur_family_transcriptional_regulator_|_1017727:1018170_Reverse
Transcriptional regulator for iron transport and metabolism
529 LCA_LACTOBACILLUS_SAKEI_RS01350_|_LytR_family_transcriptional_regulator_|_282718:283905_Forward
Transcriptional regulator LytR family, transcriptional attenuator
530 LCA_LACTOBACILLUS_SAKEI_RS08240_|_MarR_family_transcriptional_regulator_|_1637883:1638281_Reverse
Transcriptional regulator MarR-type, unknown target
531 LCA_LACTOBACILLUS_SAKEI_RS08230_|_pur_operon_repressor_|_1635725:1636561_Reverse transcriptional regulator of the purine biosynthesis operon
532 LCA_LACTOBACILLUS_SAKEI_RS01390_|_transcriptional_regulator_|_292531:292842_Reverse Transcriptional regulator of unknown function
533 LCA_LACTOBACILLUS_SAKEI_RS03960_|_Crp/Fnr_family_transcriptional_regulator_|_777460:778125_Reverse
Transcriptional regulator, Anaerobic regulatory protein
534 LCA_LACTOBACILLUS_SAKEI_RS07885_|_GntR_family_transcriptional_regulator_|_1564019:1564720_Reverse
transcriptional regulator, gntR family, unknown target
535 LCA_LACTOBACILLUS_SAKEI_RS07520_|_transcriptional_regulator_|_1487955:1488926_Reverse Transcriptional regulator, unknown target
536 LCA_LACTOBACILLUS_SAKEI_RS09135_|_1814544:1815059_Reverse Transcriptional regulator, unknown target
537 LCA_LACTOBACILLUS_SAKEI_RS00035_|_30S_ribosomal_protein_S6_|_9348:9644_Forward Translation
538 LCA_LACTOBACILLUS_SAKEI_RS00045_|_30S_ribosomal_protein_S18_|_10226:10465_Forward Translation
539 LCA_LACTOBACILLUS_SAKEI_RS00055_|_50S_ribosomal_protein_L9_|_12737:13189_Forward Translation
540 LCA_LACTOBACILLUS_SAKEI_RS00400_|_23S_rRNA_(pseudouridine(1915)-N(3))-methyltransferase_RlmH_|_79985:80464_Forward
Translation
541 LCA_LACTOBACILLUS_SAKEI_RS01175_|_elongation_factor_P_|_246457:247020_Forward Translation
542 LCA_LACTOBACILLUS_SAKEI_RS01375_|_glutamate--tRNA_ligase_|_288994:290481_Forward Translation
543 LCA_LACTOBACILLUS_SAKEI_RS01755_|_tRNA_preQ1(34)_S-adenosylmethionine_ribosyltransferase-isomerase_QueA_|_371551:372582_Forward
Translation
544 LCA_LACTOBACILLUS_SAKEI_RS02485_|_tRNA_(cytidine(34)-2'-O)-methyltransferase_|_496199:496708_Forward
Translation
545 LCA_LACTOBACILLUS_SAKEI_RS03225_|_DSBA_oxidoreductase_|_636489:637118_Forward Translation
546 LCA_LACTOBACILLUS_SAKEI_RS03390_|_50S_ribosomal_protein_L21_|_672083:672391_Forward Translation
547 LCA_LACTOBACILLUS_SAKEI_RS03400_|_50S_ribosomal_protein_L27_|_672776:673063_Forward Translation
548 LCA_LACTOBACILLUS_SAKEI_RS03405_|_elongation_factor_P_|_673365:673922_Forward Translation
549 LCA_LACTOBACILLUS_SAKEI_RS03505_|_691897:692811_Forward Translation
550 LCA_LACTOBACILLUS_SAKEI_RS03520_|_50S_ribosomal_protein_L28_|_694487:694672_Reverse Translation
551 LCA_LACTOBACILLUS_SAKEI_RS03615_|_30S_ribosomal_protein_S16_|_719171:719446_Forward Translation
552 LCA_LACTOBACILLUS_SAKEI_RS03620_|_719456:719698_Forward Translation
553 LCA_LACTOBACILLUS_SAKEI_RS03630_|_tRNA_(guanosine(37)-N1)-methyltransferase_TrmD_|_720284:721024_Forward
Translation
554 LCA_LACTOBACILLUS_SAKEI_RS03635_|_50S_ribosomal_protein_L19_|_721143:721490_Forward Translation
555 LCA_LACTOBACILLUS_SAKEI_RS03760_|_737357:738313_Forward Translation
556 LCA_LACTOBACILLUS_SAKEI_RS03825_|_ileS_|_isoleucine--tRNA_ligase_|_750528:753314_Forward Translation
557 LCA_LACTOBACILLUS_SAKEI_RS04010_|_tRNA(5-methylaminomethyl-2-thiouridine)-_methyltransferase_|_785587:786690_Forward
Translation
558 LCA_LACTOBACILLUS_SAKEI_RS04245_|_30S_ribosomal_protein_S4_|_829520:830125_Reverse Translation
559 LCA_LACTOBACILLUS_SAKEI_RS04260_|_tRNA_sulfurtransferase_ThiI_|_833543:834760_Forward Translation
560 LCA_LACTOBACILLUS_SAKEI_RS04270_|_valS_|_valine--tRNA_ligase_|_835833:838481_Forward Translation
561 LCA_LACTOBACILLUS_SAKEI_RS04340_|_histidine--tRNA_ligase_|_851270:852574_Forward Translation
562 LCA_LACTOBACILLUS_SAKEI_RS04345_|_aspS_|_aspartate--tRNA_ligase_|_852574:854346_Forward Translation
563 LCA_LACTOBACILLUS_SAKEI_RS04360_|_membrane_protein_|_855486:856364_Forward Translation
564 LCA_LACTOBACILLUS_SAKEI_RS04385_|_30S_ribosomal_protein_S21_|_861130:861306_Forward Translation
565 LCA_LACTOBACILLUS_SAKEI_RS04420_|_glycine--tRNA_ligase_subunit_alpha_|_865906:866823_Forward
Translation
566 LCA_LACTOBACILLUS_SAKEI_RS04425_|_glycine--tRNA_ligase_subunit_beta_|_866816:868897_Forward
Translation
567 LCA_LACTOBACILLUS_SAKEI_RS04750_|_935690:936595_Forward Translation
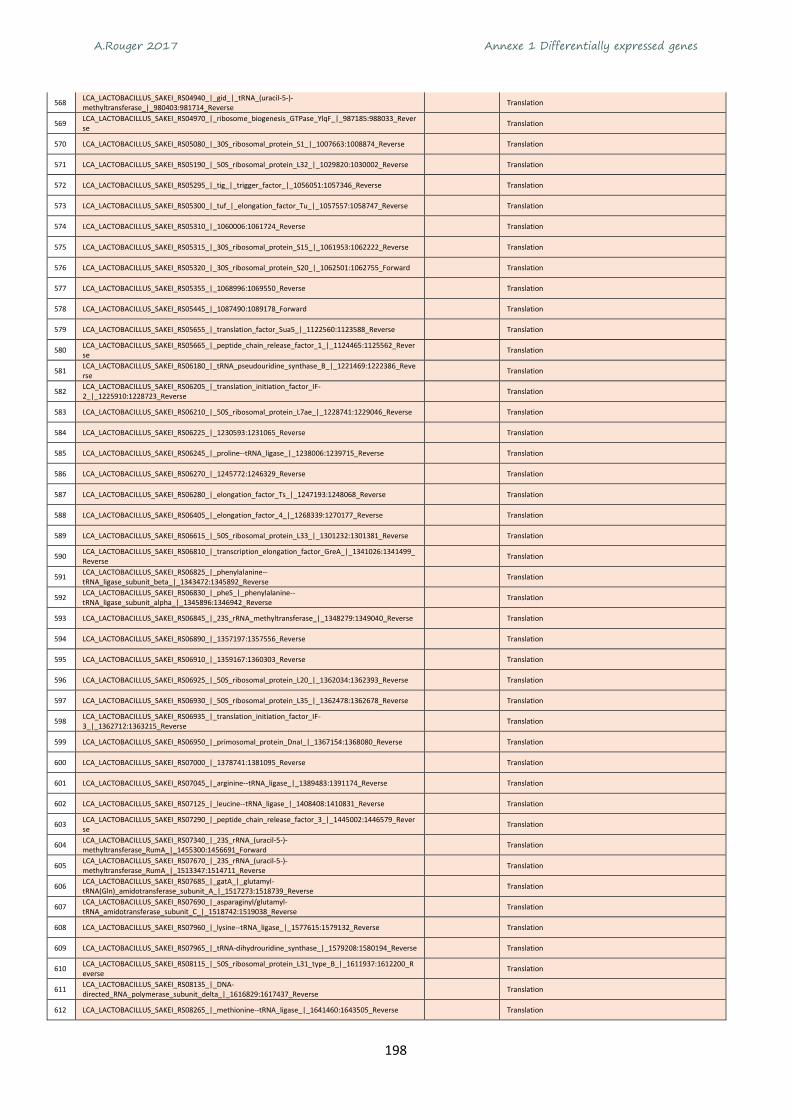
A.Rouger 2017 Annexe 1 Differentially expressed genes
198
568 LCA_LACTOBACILLUS_SAKEI_RS04940_|_gid_|_tRNA_(uracil-5-)-methyltransferase_|_980403:981714_Reverse
Translation
569 LCA_LACTOBACILLUS_SAKEI_RS04970_|_ribosome_biogenesis_GTPase_YlqF_|_987185:988033_Reverse
Translation
570 LCA_LACTOBACILLUS_SAKEI_RS05080_|_30S_ribosomal_protein_S1_|_1007663:1008874_Reverse Translation
571 LCA_LACTOBACILLUS_SAKEI_RS05190_|_50S_ribosomal_protein_L32_|_1029820:1030002_Reverse Translation
572 LCA_LACTOBACILLUS_SAKEI_RS05295_|_tig_|_trigger_factor_|_1056051:1057346_Reverse Translation
573 LCA_LACTOBACILLUS_SAKEI_RS05300_|_tuf_|_elongation_factor_Tu_|_1057557:1058747_Reverse Translation
574 LCA_LACTOBACILLUS_SAKEI_RS05310_|_1060006:1061724_Reverse Translation
575 LCA_LACTOBACILLUS_SAKEI_RS05315_|_30S_ribosomal_protein_S15_|_1061953:1062222_Reverse Translation
576 LCA_LACTOBACILLUS_SAKEI_RS05320_|_30S_ribosomal_protein_S20_|_1062501:1062755_Forward Translation
577 LCA_LACTOBACILLUS_SAKEI_RS05355_|_1068996:1069550_Reverse Translation
578 LCA_LACTOBACILLUS_SAKEI_RS05445_|_1087490:1089178_Forward Translation
579 LCA_LACTOBACILLUS_SAKEI_RS05655_|_translation_factor_Sua5_|_1122560:1123588_Reverse Translation
580 LCA_LACTOBACILLUS_SAKEI_RS05665_|_peptide_chain_release_factor_1_|_1124465:1125562_Reverse
Translation
581 LCA_LACTOBACILLUS_SAKEI_RS06180_|_tRNA_pseudouridine_synthase_B_|_1221469:1222386_Reverse
Translation
582 LCA_LACTOBACILLUS_SAKEI_RS06205_|_translation_initiation_factor_IF-2_|_1225910:1228723_Reverse
Translation
583 LCA_LACTOBACILLUS_SAKEI_RS06210_|_50S_ribosomal_protein_L7ae_|_1228741:1229046_Reverse Translation
584 LCA_LACTOBACILLUS_SAKEI_RS06225_|_1230593:1231065_Reverse Translation
585 LCA_LACTOBACILLUS_SAKEI_RS06245_|_proline--tRNA_ligase_|_1238006:1239715_Reverse Translation
586 LCA_LACTOBACILLUS_SAKEI_RS06270_|_1245772:1246329_Reverse Translation
587 LCA_LACTOBACILLUS_SAKEI_RS06280_|_elongation_factor_Ts_|_1247193:1248068_Reverse Translation
588 LCA_LACTOBACILLUS_SAKEI_RS06405_|_elongation_factor_4_|_1268339:1270177_Reverse Translation
589 LCA_LACTOBACILLUS_SAKEI_RS06615_|_50S_ribosomal_protein_L33_|_1301232:1301381_Reverse Translation
590 LCA_LACTOBACILLUS_SAKEI_RS06810_|_transcription_elongation_factor_GreA_|_1341026:1341499_Reverse
Translation
591 LCA_LACTOBACILLUS_SAKEI_RS06825_|_phenylalanine--tRNA_ligase_subunit_beta_|_1343472:1345892_Reverse
Translation
592 LCA_LACTOBACILLUS_SAKEI_RS06830_|_pheS_|_phenylalanine--tRNA_ligase_subunit_alpha_|_1345896:1346942_Reverse
Translation
593 LCA_LACTOBACILLUS_SAKEI_RS06845_|_23S_rRNA_methyltransferase_|_1348279:1349040_Reverse Translation
594 LCA_LACTOBACILLUS_SAKEI_RS06890_|_1357197:1357556_Reverse Translation
595 LCA_LACTOBACILLUS_SAKEI_RS06910_|_1359167:1360303_Reverse Translation
596 LCA_LACTOBACILLUS_SAKEI_RS06925_|_50S_ribosomal_protein_L20_|_1362034:1362393_Reverse Translation
597 LCA_LACTOBACILLUS_SAKEI_RS06930_|_50S_ribosomal_protein_L35_|_1362478:1362678_Reverse Translation
598 LCA_LACTOBACILLUS_SAKEI_RS06935_|_translation_initiation_factor_IF-3_|_1362712:1363215_Reverse
Translation
599 LCA_LACTOBACILLUS_SAKEI_RS06950_|_primosomal_protein_DnaI_|_1367154:1368080_Reverse Translation
600 LCA_LACTOBACILLUS_SAKEI_RS07000_|_1378741:1381095_Reverse Translation
601 LCA_LACTOBACILLUS_SAKEI_RS07045_|_arginine--tRNA_ligase_|_1389483:1391174_Reverse Translation
602 LCA_LACTOBACILLUS_SAKEI_RS07125_|_leucine--tRNA_ligase_|_1408408:1410831_Reverse Translation
603 LCA_LACTOBACILLUS_SAKEI_RS07290_|_peptide_chain_release_factor_3_|_1445002:1446579_Reverse
Translation
604 LCA_LACTOBACILLUS_SAKEI_RS07340_|_23S_rRNA_(uracil-5-)-methyltransferase_RumA_|_1455300:1456691_Forward
Translation
605 LCA_LACTOBACILLUS_SAKEI_RS07670_|_23S_rRNA_(uracil-5-)-methyltransferase_RumA_|_1513347:1514711_Reverse
Translation
606 LCA_LACTOBACILLUS_SAKEI_RS07685_|_gatA_|_glutamyl-tRNA(Gln)_amidotransferase_subunit_A_|_1517273:1518739_Reverse
Translation
607 LCA_LACTOBACILLUS_SAKEI_RS07690_|_asparaginyl/glutamyl-tRNA_amidotransferase_subunit_C_|_1518742:1519038_Reverse
Translation
608 LCA_LACTOBACILLUS_SAKEI_RS07960_|_lysine--tRNA_ligase_|_1577615:1579132_Reverse Translation
609 LCA_LACTOBACILLUS_SAKEI_RS07965_|_tRNA-dihydrouridine_synthase_|_1579208:1580194_Reverse Translation
610 LCA_LACTOBACILLUS_SAKEI_RS08115_|_50S_ribosomal_protein_L31_type_B_|_1611937:1612200_Reverse
Translation
611 LCA_LACTOBACILLUS_SAKEI_RS08135_|_DNA-directed_RNA_polymerase_subunit_delta_|_1616829:1617437_Reverse
Translation
612 LCA_LACTOBACILLUS_SAKEI_RS08265_|_methionine--tRNA_ligase_|_1641460:1643505_Reverse Translation

A.Rouger 2017 Annexe 1 Differentially expressed genes
199
613 LCA_LACTOBACILLUS_SAKEI_RS08290_|_hypothetical_protein_|_1645708:1646670_Reverse Translation
614 LCA_LACTOBACILLUS_SAKEI_RS08305_|_50S_ribosomal_protein_L7/L12_|_1648874:1649242_Reverse
Translation
615 LCA_LACTOBACILLUS_SAKEI_RS08310_|_50S_ribosomal_protein_L10_|_1649306:1649809_Reverse Translation
616 LCA_LACTOBACILLUS_SAKEI_RS08335_|_50S_ribosomal_protein_L11_|_1655465:1655890_Reverse Translation
617 LCA_LACTOBACILLUS_SAKEI_RS08355_|_50S_ribosomal_protein_L33_|_1658051:1658200_Reverse Translation
618 LCA_LACTOBACILLUS_SAKEI_RS08375_|_1660375:1660782_Reverse Translation
619 LCA_LACTOBACILLUS_SAKEI_RS08380_|_cysteine--tRNA_ligase_|_1660779:1662185_Reverse Translation
620 LCA_LACTOBACILLUS_SAKEI_RS08575_|_30S_ribosomal_protein_S9_|_1705186:1705578_Reverse Translation
621 LCA_LACTOBACILLUS_SAKEI_RS08580_|_50S_ribosomal_protein_L13_|_1705592:1706035_Reverse Translation
622 LCA_LACTOBACILLUS_SAKEI_RS08665_|_30S_ribosomal_protein_S13_|_1725438:1725803_Reverse Translation
623 LCA_LACTOBACILLUS_SAKEI_RS08670_|_50S_ribosomal_protein_L36_|_1725826:1725942_Reverse Translation
624 LCA_LACTOBACILLUS_SAKEI_RS08675_|_infA_|_translation_initiation_factor_IF-1_|_1725975:1726193_Reverse
Translation
625 LCA_LACTOBACILLUS_SAKEI_RS08690_|_50S_ribosomal_protein_L15_|_1728391:1728825_Reverse Translation
626 LCA_LACTOBACILLUS_SAKEI_RS08695_|_50S_ribosomal_protein_L30_|_1728860:1729045_Reverse Translation
627 LCA_LACTOBACILLUS_SAKEI_RS08705_|_50S_ribosomal_protein_L18_|_1729579:1729938_Reverse Translation
628 LCA_LACTOBACILLUS_SAKEI_RS08710_|_50S_ribosomal_protein_L6_|_1729979:1730512_Reverse Translation
629 LCA_LACTOBACILLUS_SAKEI_RS08715_|_30S_ribosomal_protein_S8_|_1730543:1730941_Reverse Translation
630 LCA_LACTOBACILLUS_SAKEI_RS08725_|_50S_ribosomal_protein_L24_|_1731747:1732058_Reverse Translation
631 LCA_LACTOBACILLUS_SAKEI_RS08740_|_50S_ribosomal_protein_L29_|_1732793:1732987_Reverse Translation
632 LCA_LACTOBACILLUS_SAKEI_RS08750_|_30S_ribosomal_protein_S3_|_1733414:1734073_Reverse Translation
633 LCA_LACTOBACILLUS_SAKEI_RS08755_|_50S_ribosomal_protein_L22_|_1734087:1734440_Reverse Translation
634 LCA_LACTOBACILLUS_SAKEI_RS08765_|_50S_ribosomal_protein_L2_|_1734825:1735658_Reverse Translation
635 LCA_LACTOBACILLUS_SAKEI_RS08770_|_50S_ribosomal_protein_L23_|_1735697:1735981_Reverse Translation
636 LCA_LACTOBACILLUS_SAKEI_RS08775_|_50S_ribosomal_protein_L4_|_1735981:1736604_Reverse Translation
637 LCA_LACTOBACILLUS_SAKEI_RS08785_|_30S_ribosomal_protein_S10_|_1737304:1737612_Reverse Translation
638 LCA_LACTOBACILLUS_SAKEI_RS08795_|_fusA_|_elongation_factor_G_|_1739070:1741157_Reverse Translation
639 LCA_LACTOBACILLUS_SAKEI_RS08800_|_30S_ribosomal_protein_S7_|_1741253:1741723_Reverse Translation
640 LCA_LACTOBACILLUS_SAKEI_RS08805_|_30S_ribosomal_protein_S12_|_1741813:1742226_Reverse Translation
641 LCA_LACTOBACILLUS_SAKEI_RS09040_|_serine--tRNA_ligase_|_1792494:1793768_Reverse Translation
642 LCA_LACTOBACILLUS_SAKEI_RS09425_|_tRNA_uridine(34)_5-carboxymethylaminomethyl_synthesis_GTPase_MnmE_|_1878167:1879555_Reverse
Translation
643 LCA_LACTOBACILLUS_SAKEI_RS09450_|_ribonuclease_P_protein_component_|_1883731:1884093_Reverse
Translation
644 LCA_LACTOBACILLUS_SAKEI_RS09455_|_50S_ribosomal_protein_L34_|_1884159:1884299_Reverse Translation
645 LCA_LACTOBACILLUS_SAKEI_RS00095_|_GTP-binding_protein_YchF_|_20351:21451_Forward Translation- GTPase interacting with 70S ribosome; ROS stress regulator
646 LCA_LACTOBACILLUS_SAKEI_RS05285_|_GTP-binding_protein_|_1053841:1054440_Reverse Translation, GTPase involved in ribosome 50S subunit assembly (maturation of the central 50S protuberance)
647 LCA_LACTOBACILLUS_SAKEI_RS07320_|_hypothetical_protein_|_1452214:1452783_Reverse Translation, putative tRNA binding factor
648 LCA_LACTOBACILLUS_SAKEI_RS05380_|_GTP-binding_protein_|_1072581:1074416_Reverse Translation, ribosome-associated GTPase
649 LCA_LACTOBACILLUS_SAKEI_RS05020_|_CCA-adding_enzyme_|_995812:997005_Reverse 2.7.7.19 Translation, RNA modification
650 LCA_LACTOBACILLUS_SAKEI_RS06995_|_SsrA-binding_protein_|_1378262:1378732_Reverse Translation, tmRNA-binding protein
651 LCA_LACTOBACILLUS_SAKEI_RS04620_|_912242:913393_Forward Translation/RNA processing
652 LCA_LACTOBACILLUS_SAKEI_RS08685_|_preprotein_translocase_subunit_SecY_|_1727095:1728390_Reverse
Translation/secretion
653 LCA_LACTOBACILLUS_SAKEI_RS00145_|_hemolysin_|_28058:29401_Reverse Transport protein
654 LCA_LACTOBACILLUS_SAKEI_RS06630_|_sodium:proton_antiporter_|_1306655:1308769_Reverse Transport, Na(+)/H(+) antiporter
655 LCA_LACTOBACILLUS_SAKEI_RS01030_|_transporter_|_214032:215201_Forward Transporter
656 LCA_LACTOBACILLUS_SAKEI_RS03985_|_glycerol_transporter_|_781764:782477_Forward Transporter (facilitator) unknown substrate
657 LCA_LACTOBACILLUS_SAKEI_RS02450_|_AI-2E_family_transporter_|_489614:490753_Forward Transporter unknown substrate

A.Rouger 2017 Annexe 1 Differentially expressed genes
200
658 LCA_LACTOBACILLUS_SAKEI_RS08455_|_glutamate/gamma-aminobutyrate_family_transporter_YjeM_|_1678738:1680222_Reverse
Transporter, unknown substrate
659 LCA_LACTOBACILLUS_SAKEI_RS01005_|_integrase_|_210685:211605_Forward Transposase
660 LCA_LACTOBACILLUS_SAKEI_RS04460_|_peptidase_T_|_874844:876085_Forward 3.4.11.4 Tripeptide aminopeptidase PepT
661 LCA_LACTOBACILLUS_SAKEI_RS01305_|_DNA-binding_response_regulator_|_272611:273297_Forward
Two component regulator (vanR?)
662 LCA_LACTOBACILLUS_SAKEI_RS01310_|_two-component_sensor_histidine_kinase_|_273297:274496_Forward
Two component regulator (vanR?)
663 LCA_LACTOBACILLUS_SAKEI_RS04925_|_ATP-dependent_protease_ATP-binding_subunit_HslU_|_977346:978764_Reverse
two-component ATP-dependent protease (ATPase and chaperone) ClpY
664 LCA_LACTOBACILLUS_SAKEI_RS04930_|_ATP-dependent_protease_subunit_HslV_|_978777:979322_Reverse
two-component ATP-dependent protease (N-terminal serine protease), ClpQ
665 LCA_LACTOBACILLUS_SAKEI_RS06795_|_DNA-binding_response_regulator_|_1337552:1338184_Reverse
two-component system response regulator, unknown target
666 LCA_LACTOBACILLUS_SAKEI_RS02355_|_glycosyl_transferase_|_472169:473371_Forward 2.4.1.- UDP-Glycosyltransferase/glycogen phosphorylase family Cell wall?
667 LCA_LACTOBACILLUS_SAKEI_RS01280_|_multidrug_ABC_transporter_permease_|_265462:267255_Forward
Uncharacterized ABC transporter, 1 seule ssu surexprimée
668 LCA_LACTOBACILLUS_SAKEI_RS00855_|_amidase_|_175881:176387_Forward Uncharacterized isochorismatase family protein
669 LCA_LACTOBACILLUS_SAKEI_RS00535_|_hypothetical_protein_|_105705:106592_Forward Unknown
670 LCA_LACTOBACILLUS_SAKEI_RS01165_|_hypothetical_protein_|_244364:245428_Reverse Unknown
671 LCA_LACTOBACILLUS_SAKEI_RS01170_|_hypothetical_protein_|_245582:246370_Forward Unknown
672 LCA_LACTOBACILLUS_SAKEI_RS01430_|_hypothetical_protein_|_301745:302095_Forward Unknown
673 LCA_LACTOBACILLUS_SAKEI_RS01495_|_hypothetical_protein_|_319208:319861_Forward unknown
674 LCA_LACTOBACILLUS_SAKEI_RS01585_|_hypothetical_protein_|_338874:339218_Forward Unknown
675 LCA_LACTOBACILLUS_SAKEI_RS01610_|_hypothetical_protein_|_342931:343185_Forward Unknown
676 LCA_LACTOBACILLUS_SAKEI_RS01855_|_hypothetical_protein_|_397672:397932_Forward Unknown
677 LCA_LACTOBACILLUS_SAKEI_RS01980_|_hypothetical_protein_|_419971:420408_Forward Unknown
678 LCA_LACTOBACILLUS_SAKEI_RS02350_|_hypothetical_protein_|_471324:471755_Reverse Unknown
679 LCA_LACTOBACILLUS_SAKEI_RS02490_|_hypothetical_protein_|_496720:497127_Forward unknown
680 LCA_LACTOBACILLUS_SAKEI_RS02500_|_hypothetical_protein_|_499834:501105_Forward Unknown
681 LCA_LACTOBACILLUS_SAKEI_RS02675_|_hypothetical_protein_|_535680:536081_Forward Unknown
682 LCA_LACTOBACILLUS_SAKEI_RS03170_|_hypothetical_protein_|_626144:628855_Forward unknown
683 LCA_LACTOBACILLUS_SAKEI_RS03185_|_hypothetical_protein_|_630948:631274_Reverse unknown
684 LCA_LACTOBACILLUS_SAKEI_RS03240_|_membrane_protein_|_640800:641501_Forward Unknown
685 LCA_LACTOBACILLUS_SAKEI_RS03395_|_hypothetical_protein_|_672406:672747_Forward Unknown
686 LCA_LACTOBACILLUS_SAKEI_RS03530_|_hypothetical_protein_|_695401:697071_Forward Unknown
687 LCA_LACTOBACILLUS_SAKEI_RS03705_|_hypothetical_protein_|_729437:729823_Forward unknown
688 LCA_LACTOBACILLUS_SAKEI_RS03710_|_hypothetical_protein_|_729967:730491_Forward unknown
689 LCA_LACTOBACILLUS_SAKEI_RS03965_|_hypothetical_protein_|_778359:779633_Forward Unknown
690 LCA_LACTOBACILLUS_SAKEI_RS03975_|_hypothetical_protein_|_780424:781248_Forward Unknown
691 LCA_LACTOBACILLUS_SAKEI_RS03980_|_hypothetical_protein_|_781230:781700_Forward Unknown
692 LCA_LACTOBACILLUS_SAKEI_RS03990_|_hypothetical_protein_|_782498:782803_Forward Unknown
693 LCA_LACTOBACILLUS_SAKEI_RS03995_|_TIGR00268_family_protein_|_782828:783664_Forward Unknown
694 LCA_LACTOBACILLUS_SAKEI_RS04005_|_cysteine_desulfurase_|_785018:785365_Forward Unknown
695 LCA_LACTOBACILLUS_SAKEI_RS04060_|_hypothetical_protein_|_796668:797327_Forward Unknown
696 LCA_LACTOBACILLUS_SAKEI_RS04200_|_hypothetical_protein_|_820725:821699_Forward Unknown
697 LCA_LACTOBACILLUS_SAKEI_RS04240_|_hypothetical_protein_|_828819:829424_Forward Unknown
698 LCA_LACTOBACILLUS_SAKEI_RS04730_|_hypothetical_protein_|_932575:932991_Forward Unknown
699 LCA_LACTOBACILLUS_SAKEI_RS04810_|_hypothetical_protein_|_950590:951459_Forward Unknown
700 LCA_LACTOBACILLUS_SAKEI_RS04995_|_hypothetical_protein_|_990582:991427_Reverse Unknown
701 LCA_LACTOBACILLUS_SAKEI_RS05065_|_hypothetical_protein_|_1004278:1005543_Reverse Unknown
702 LCA_LACTOBACILLUS_SAKEI_RS05100_|_hypothetical_protein_|_1011907:1012935_Reverse Unknown

A.Rouger 2017 Annexe 1 Differentially expressed genes
201
703 LCA_LACTOBACILLUS_SAKEI_RS05130_|_hypothetical_protein_|_1016314:1016682_Reverse Unknown
704 LCA_LACTOBACILLUS_SAKEI_RS05175_|_hypothetical_protein_|_1026404:1027279_Reverse Unknown
705 LCA_LACTOBACILLUS_SAKEI_RS05415_|_hypothetical_protein_|_1081282:1081965_Reverse Unknown
706 LCA_LACTOBACILLUS_SAKEI_RS05505_|_hypothetical_protein_|_1097506:1097793_Reverse Unknown
707 LCA_LACTOBACILLUS_SAKEI_RS05600_|_membrane_protein_|_1113253:1113486_Reverse Unknown
708 LCA_LACTOBACILLUS_SAKEI_RS05775_|_FMN_reductase_|_1145268:1146029_Reverse Unknown
709 LCA_LACTOBACILLUS_SAKEI_RS06215_|_hypothetical_protein_|_1229043:1229342_Reverse Unknown
710 LCA_LACTOBACILLUS_SAKEI_RS06325_|_hypothetical_protein_|_1256052:1256294_Reverse Unknown
711 LCA_LACTOBACILLUS_SAKEI_RS06575_|_aluminum_resistance_protein_|_1295420:1296676_Reverse Unknown
712 LCA_LACTOBACILLUS_SAKEI_RS06585_|_hypothetical_protein_|_1297727:1297906_Forward Unknown
713 LCA_LACTOBACILLUS_SAKEI_RS06740_|_hypothetical_protein_|_1328015:1329136_Reverse Unknown
714 LCA_LACTOBACILLUS_SAKEI_RS06875_|_hypothetical_protein_|_1354731:1355291_Reverse Unknown
715 LCA_LACTOBACILLUS_SAKEI_RS06880_|_hypothetical_protein_|_1355285:1356460_Reverse Unknown
716 LCA_LACTOBACILLUS_SAKEI_RS07170_|_CYTH_domain-containing_protein_|_1419015:1419596_Forward
Unknown
717 LCA_LACTOBACILLUS_SAKEI_RS07175_|_dithiol-disulfide_isomerase_|_1419674:1420318_Forward Unknown
718 LCA_LACTOBACILLUS_SAKEI_RS07265_|_hypothetical_protein_|_1440056:1440247_Reverse Unknown
719 LCA_LACTOBACILLUS_SAKEI_RS07285_|_hypothetical_protein_|_1443804:1444889_Forward Unknown
720 LCA_LACTOBACILLUS_SAKEI_RS07310_|_membrane_protein_|_1449830:1450303_Forward Unknown
721 LCA_LACTOBACILLUS_SAKEI_RS07635_|_hypothetical_protein_|_1507960:1508304_Forward Unknown
722 LCA_LACTOBACILLUS_SAKEI_RS07790_|_hypothetical_protein_|_1539095:1539529_Reverse Unknown
723 LCA_LACTOBACILLUS_SAKEI_RS07840_|_hypothetical_protein_|_1551386:1552945_Reverse Unknown
724 LCA_LACTOBACILLUS_SAKEI_RS07855_|_hypothetical_protein_|_1555445:1556896_Reverse Unknown
725 LCA_LACTOBACILLUS_SAKEI_RS08030_|_hypothetical_protein_|_1595161:1596540_Forward Unknown
726 LCA_LACTOBACILLUS_SAKEI_RS08035_|_hypothetical_protein_|_1596722:1597402_Forward Unknown
727 LCA_LACTOBACILLUS_SAKEI_RS08085_|_membrane_protein_|_1606162:1606728_Reverse Unknown
728 LCA_LACTOBACILLUS_SAKEI_RS08140_|_hypothetical_protein_|_1617481:1617921_Reverse Unknown
729 LCA_LACTOBACILLUS_SAKEI_RS08495_|_hypothetical_protein_|_1689164:1690165_Reverse Unknown
730 LCA_LACTOBACILLUS_SAKEI_RS09045_|_hypothetical_protein_|_1794061:1795644_Reverse Unknown
731 LCA_LACTOBACILLUS_SAKEI_RS09055_|_hypothetical_protein_|_1796583:1798175_Reverse Unknown
732 LCA_LACTOBACILLUS_SAKEI_RS09140_|_hypothetical_protein_|_1815066:1815596_Reverse Unknown
733 LCA_LACTOBACILLUS_SAKEI_RS09145_|_GNAT_family_acetyltransferase_|_1815693:1816220_Reverse
Unknown
734 LCA_LACTOBACILLUS_SAKEI_RS09500_|_hypothetical_protein_|_728958:729404_Forward Unknown
735 LCA_LACTOBACILLUS_SAKEI_RS09545_|_hypothetical_protein_|_1471062:1471496_Reverse Unknown
736 LCA_LACTOBACILLUS_SAKEI_RS09560_|_hypothetical_protein_|_1691588:1692406_Reverse Unknown
737 LCA_LACTOBACILLUS_SAKEI_RS00050_|_hypothetical_protein_|_10683:12716_Forward Unknown
738 LCA_LACTOBACILLUS_SAKEI_RS00100_|_hypothetical_protein_|_21469:22143_Forward Unknown
739 LCA_LACTOBACILLUS_SAKEI_RS00195_|_hypothetical_protein_|_37871:38365_Forward Unknown
740 LCA_LACTOBACILLUS_SAKEI_RS00785_|_hypothetical_protein_|_159980:160537_Forward Unknown
741 LCA_LACTOBACILLUS_SAKEI_RS01130_|_CHAP_domain-containing_protein_|_236661:237815_Forward
Unknown cell suface protein
742 LCA_LACTOBACILLUS_SAKEI_RS03285_|_CHAP_domain-containing_protein_|_649323:650597_Forward
Unknown cell surface protein
743 LCA_LACTOBACILLUS_SAKEI_RS08220_|_cell_surface_protein_|_1634456:1635076_Forward Unknown function
744 LCA_LACTOBACILLUS_SAKEI_RS03815_|_748650:749438_Forward Unknown function, shape, cell division
745 LCA_LACTOBACILLUS_SAKEI_RS02690_|_hydrolase_|_539123:539755_Forward unknown hydrolase
746 LCA_LACTOBACILLUS_SAKEI_RS05025_|_membrane_protein_|_997153:998025_Forward Unknown membrane protein
747 LCA_LACTOBACILLUS_SAKEI_RS04390_|_hypothetical_protein_|_861331:861774_Forward Unknown or translation

A.Rouger 2017 Annexe 1 Differentially expressed genes
202
748 LCA_LACTOBACILLUS_SAKEI_RS02370_|_hypothetical_protein_|_475428:475661_Forward unkwnown
749 LCA_LACTOBACILLUS_SAKEI_RS01985_|_dipeptidase_|_420820:421917_Reverse 3.4.13.9 Xaa Pro dipeptidase PepQ
750 LCA_LACTOBACILLUS_SAKEI_RS07735_|_xanthine_phosphoribosyltransferase_|_1530643:1531230_Reverse
2.4.2.22 Xanthine and xanthosine salvage, putine metabolism
751 LCA_LACTOBACILLUS_SAKEI_RS08080_|_zinc_metalloprotease_HtpX_|_1605249:1606148_Reverse Zn-dependent protease with chaperone function, stress response
752 LCA_LACTOBACILLUS_SAKEI_RS00650_|_GMP_synthetase_|_132817:134370_Forward
753 LCRIS_LACTOBACILLUS_CRISPATUS_RS02860_|_membrane_protein_|_544276:544524_Reverse
754 LCRIS_LACTOBACILLUS_CRISPATUS_RS02865_|_integrase_|_544887:545807_Reverse
755 RT94_PSEUDOMONAS_VIRIDIFLAVA_RS01750_|_ATP_synthase_subunit_alpha_|_164599:166143_Forward

A.Rouger 2017 Annexe 2 Test d’extraction d’ARN
203
Annexe 2 Test d’extraction d’ARN

A.Rouger 2017 Annexe 2 Test d’extraction d’ARN
204

A.Rouger 2017 Annexe 3 Schéma du projet eNABLE
205
Annexe 3 Schéma du projet eNABLE

A.Rouger 2017 Annexe 3 Schéma du projet eNABLE
206
A.Rouger 2017 Références bibliographiques
207
Références bibliographiques
A
• Abu Al-Soud W & Rådström P (1998) Capacity of nine thermostable DNA polymerases to
mediate DNA amplification in the presence of PCR-inhibiting samples. Applied and
Environmental Microbiology 64: 3748-3753.
• Abu Al-Soud W & Rådström P (2000) Effects of amplification facilitators on diagnostic PCR in
the presence of blood, feces, and meat. Journal of Clinical Microbiology 38: 4463-4470.
• Agrimonti C, Bortolazzi L, Maestri E, Sanangelantoni AM & Marmiroli N (2013) A Real-Time
PCR/SYBR green method for the rapid quantification of Salmonella enterica in poultry meat.
Food Analytical Methods 6: 1004-1015.
• Aguiar-Pulido V, Huang W, Suarez-Ulloa V, Cickovski T, Mathee K & Narasimhan G (2016)
Metagenomics, Metatranscriptomics, and Metabolomics Approaches for Microbiome
Analysis. Evolutionary Bioinformatics Online 12: 5-16.
• Ahn DU, Kim IS & Lee EJ (2013) Irradiation and additive combinations on the pathogen
reduction and quality of poultry meat. Poultry Science 92: 534-545.
• Akbar A & Anal AK (2013) Prevalence and antibiogram study of Salmonella and Staphylococcus
aureus in poultry meat. Asian Pacific Journal of Tropical Biomedicine 3: 163-168.
• Al Atrouni A, Joly-Guillou M-L, Hamze M & Kempf M (2016) Reservoirs of Non-baumannii
Acinetobacter Species. Frontiers in Microbiology 7: 49.
• Aldrete-Tapia A, Escobar-Ramírez MC, Tamplin ML & Hernández-Iturriaga M (2014) High-
throughput sequencing of microbial communities in Poro cheese, an artisanal Mexican cheese.
Food Microbiology 44: 136-141.
• Alegria A, Szczesny P, Mayo B, Bardowski J & Kowalczyk M (2012) Biodiversity in Oscypek, a
traditional Polish cheese, determined by culture-dependent and -independent approaches.
Applied and environmental microbiology 78: 1890-1898.
• Aliani M, Farmer L J, Kennedy J T, Moss B W & Gordon A (2013) Post-slaughter changes in ATP
metabolites, reducing and phosphorylated sugars in chicken meat. Meat Science 94: 55-62.
• Al-Nehlawi A, Saldo J, Vega LF & Guri S (2013) Effect of high carbon dioxide atmosphere
packaging and soluble gas stabilization pre-treatment on the shelf-life and quality of chicken
drumsticks. Meat Science 94: 1-8.
• Alonso-Hernando A, Capita R & Alonso-Calleja C (2012a) Behaviour of co-inoculated
pathogenic and spoilage bacteria on poultry following several decontamination treatments.
International Journal of Food Microbiology 159: 152-159.
• Alonso-Hernando A, Alonso-Calleja C & Capita R (2009) Comparative analysis of acid resistance
in Listeria monocytogenes and Salmonella enterica strains before and after exposure to poultry
decontaminants. Role of the glutamate decarboxylase (GAD) system. Food Microbiology 26:
905-909.
• Alonso-Hernando A, Alonso-Calleja C & Capita R (2010) Effects of exposure to poultry chemical
decontaminants on the membrane fluidity of Listeria monocytogenes and Salmonella enterica
strains. International Journal of Food Microbiology 137: 130-136.

A.Rouger 2017 Références bibliographiques
208
• Alonso-Hernando A, Guevara-Franco JA, Alonso-Calleja C & Capita R (2013) Effect of the
temperature of the dipping solution on the antimicrobial effectiveness of various chemical
decontaminants against pathogenic and spoilage bacteria on poultry. Journal of Food
Protection 76: 833-842.
• Alonso-Hernando A, Prieto M, García-Fernández C, Alonso-Calleja C & Capita R (2012b)
Increase over time in the prevalence of multiple antibiotic resistance among isolates of Listeria
monocytogenes from poultry in Spain. Food Control 23: 37-41.
• Álvarez-Astorga M, Capita R, Alonso-Calleja C, Moreno B, del Ma & Garcıa-Fernández C (2002)
Microbiological quality of retail chicken by-products in Spain. Meat Science 62: 45-50.
• Arnaut-Rollier I, De Zutter L & Van Hoof J (1999a) Identities of the Pseudomonas spp. in flora
from chilled chicken. International Journal of Food Microbiology 48: 87-96.
• Arnaut-Rollier I, Vauterin L, De Vos P, Massart DL, Devriese LA, De Zutter L & Van Hoof J (1999b)
A numerical taxonomic study of the Pseudomonas flora isolated from poultry meat. Journal of
Applied Microbiology, 87: 15–28.
• Arnold JW (2007) Bacterial contamination on rubber picker fingers before, during, and after
processing Poultry Science 86: 2671–2675
• Arnold JW & Yates (2009) Interventions for control of Salmonella: Clearance of microbial
growth from rubber picker fingers. Poultry Science 88: 1292–1298
• Atanassova V & Ring C (1999) Prevalence of Campylobacter spp. in poultry and poultry meat
in Germany. International Journal of Food Microbiology 51: 187-190.
• Autieri SM, Lins JJ, Leatham MP, Laux DC, Conway T & Cohen PS (2007) l-Fucose Stimulates
Utilization of d-Ribose by Escherichia coli MG1655 ΔfucAO and E. coli Nissle 1917 ΔfucAO
Mutants in the Mouse Intestine and in M9 Minimal Medium. Infection and Immunity 75: 5465-
5475.
B
• Babraham Bioinformatics http://www.bioinformatics.babraham.ac.uk/projects/fastqc/
• Balamatsia CC, Patsias A, Kontominas MG & Savvaidis IN (2007) Possible role of volatile amines
as quality-indicating metabolites in modified atmosphere-packaged chicken fillets: Correlation
with microbiological and sensory attributes. Food Chemistry 104: 1622-1628.
• Baston O, Barna O & Vasile A (2010) Microbiota and biogneic amines variation of chicken meat;
comparison between white and red meat. 11: 69-73.
• Basu S, Bose C, Ojha N, Das N, Das J, Pal M & Khurana S (2015) Evolution of bacterial and fungal
growth media. Bioinformation 11: 182-184.
• Bengtsson J, Eriksson KM, Hartmann M, Wang Z, Shenoy BD, Grelet GA, Abarenkov K, Petri A,
Rosenblad MA & Nilsson RH (2011) Metaxa: a software tool for automated detection and
discrimination among ribosomal small subunit (12S/16S/18S) sequences of archaea, bacteria,
eukaryotes, mitochondria, and chloroplasts in metagenomes and environmental sequencing
datasets. Antonie Van Leeuwenhoek 100: 471-475.
• Benson AK, David JRD, Gilbreth SE, Smith G, Nietfeldt J, Legge R, Kim J, Sinha R, Duncan CE, Ma
J & Singh I (2014) Microbial successions are associated with changes in chemical profiles of a
model refrigerated fresh pork sausage during an 80-day shelf-life study. Applied and
Environmental Microbiology 80: 5178–5194.
• Bergholz TM, Moreno Switt AI & Wiedmann M (2014) Omics approaches in food safety:
fulfilling the promise? Trends in Microbiology 22: 275-281.

A.Rouger 2017 Références bibliographiques
209
• Bergmark L, Poulsen PHB, Al-Soud WA, Norman A, Hansen LH & Sørensen SJ (2012) Assessment
of the specificity of Burkholderia and Pseudomonas qPCR assays for detection of these genera
in soil using 454 pyrosequencing. FEMS Microbiology Letters 333: 77-84.
• Billroth T (1874) Untersuchungen über die Vegetationsformen von Coccobacteria septica.
Berlin,
• Birk T, Ingmer H, Andersen MT, Jørgensen K & Brøndsted L (2004) Chicken juice, a food-based
model system suitable to study survival of Campylobacter jejuni. Letters in Applied
Microbiology 38: 66-71.
• Björkroth J (2005) Microbiological ecology of marinated meat products. Meat Science 70: 477-
480.
• Bolton DJ, Meredith H, Walsh D & McDowell DA (2014) The effect of chemical treatments in
laboratory and broiler plant studies on the microbial status and shelf-life of poultry. Food
Control 36: 230-237.
• Borch E, Kant-Muermans M-L & Blixt Y (1996) Bacterial spoilage of meat and cured meat
products. International Journal of Food Microbiology 33: 103-120.
• Bouvet OMM, Grimont PAD, Richard C, Aldova E, Hausner O & Gabrhelova M (1985) Budvicia
aquatica gen. nov., sp. nov.: a Hydrogen Sulfide-Producing Member of the Enterobacteriaceae.
International Journal of Systematic and Evolutionary Microbiology 35: 60-64.
• Bowman J (2006) The Genus Psychrobacter. Springer New York, 10.1007/0-387-30746-X_35.
• Brady C, Denman S, Kirk S, Venter S, Rodriguez-Palenzuela P & Coutinho T (2010) Description
of Gibbsiella quercinecans gen. nov., sp. nov., associated with Acute Oak Decline. Systematic
and applied microbiology 33: 444-450.
• Brock TD (1978) Thermophilic Microorganisms and Life at High Temperatures. Springer New
York, Springer-Verlag New York, 10.1007/978-1-4612-6284-8.
• Bülte M & Jakob P (1995) The use of a PCR-generated invA probe for the detection of
Salmonella spp. in artificially and naturally contaminated foods. International Journal of Food
Microbiology 26: 335-344.
C
• Cailliez-Grimal C, Chaillou S, Anba-Mondoloni J, Loux V, Afzal MI, Rahman A, Kergourlay G,
Champomier-Vergès M-C, Zagorec M, Dalgaard P, Leisner JJ, Prévost H, Revol-Junelles A-M &
Borges F (2013) Complete Chromosome Sequence of Carnobacterium maltaromaticum LMA
28. Genome Announcements 1: e00115-00112.
• Callon C, Saubusse M, Didienne R, Buchin S & Montel MC (2011) Simplification of a complex
microbial antilisterial consortium to evaluate the contribution of its flora in uncooked pressed
cheese. International Journal of Food MicrobiologyI 145: 379-389.
• Capita R, Alonso-Calleja C & Prieto M (2007) Prevalence of Salmonella enterica serovars and
genovars from chicken carcasses in slaughterhouses in Spain. Journal of Applied Microbiology
103: 1366-1375.
• Capita R, Alonso-Calleja C, Garcia-Fernandez M & Moreno B (2002) Characterization of
Staphylococcus aureus isolated from poultry meat in Spain. Poultry Science 81: 414-421.
• Capita R, Alonso-Calleja C, Moreno B & Garcıa-Fernández MaC (2001) Occurrence of Listeria
species in retail poultry meat and comparison of a cultural/immunoassay for their detection.
International Journal of Food Microbiology 65: 75-82.

A.Rouger 2017 Références bibliographiques
210
• Capita R, Álvarez-Fernández E, Fernández-Buelta E, Manteca J & Alonso-Calleja C (2013)
Decontamination treatments can increase the prevalence of resistance to antibiotics of
Escherichia coli naturally present on poultry. Food Microbiology 34: 112-117.
• Capita R, Prieto M & Alonso-Calleja C (2004) Sampling methods for microbiological mnalysis of
red meat and poultry carcasses. Journal of Food Protection 67: 1303-1308.
• Capita R, Alonso-Calleja C, García-Arias MT, Moreno B & García-Fernández MDC (2002a)
Methods to detect the occurrence of various indicator bacteria on the surface of retail poultry
in Spain. Journal of Food Science 67: 765-771.
• Capita R, Alonso-Calleja C, Garcia-Fernandez M & Moreno B (2002b) Characterization of
Staphylococcus aureus isolated from poultry meat in Spain. Poultry Science 81: 414-421.
• Caporaso JG, Kuczynski J, Stombaugh J, Bittinger K, Bushman FD, Costello EK, Fierer N, Pena
AG, Goodrich JK, Gordon JI, Huttley GA, Kelley ST, Knights D, Koenig JE, Ley RE, Lozupone CA,
McDonald D, Muegge BD, Pirrung M, Reeder J, Sevinsky JR, Turnbaugh PJ, Walters WA,
Widmann J, Yatsunenko T, Zaneveld J & Knight R (2010) QIIME allows analysis of high-
throughput community sequencing data. Nature Methods 7: 335-336.
• Cardenas E & Tiedje JM (2008) New tools for discovering and characterizing microbial diversity.
Current Opinion in Biotechnology 19: 544-549.
• Ceuppens S, Li D, Uyttendaele M, Renault P, Ross P, Ranst MV, Cocolin L & Donaghy J (2014)
Molecular methods in food safety microbiology: interpretation and implications of nucleic acid
detection. Comprehensive Reviews in Food Science and Food Safety 13: 551-577.
• Chai SJ, Cole D, Nisler A & Mahon BE (2017) Poultry: the most common food in outbreaks with
known pathogens, United States, 1998–2012. Epidemiology and Infection 145: 316–325.
• Chaiba A, Rhazi Filali F, Chahlaoui A, Soulaymani Bencheikh R & Zerhouni M (2007)
Microbiological quality of poultry meat on the Meknès market (Morocco). Internet Journal of
Food Safety 9: 67-71.
• Chaillou S, Champomier-Verges MC, Cornet M, Crutz-Le Coq AM, Dudez AM, Martin V, Beaufils
S, Darbon-Rongere E, Bossy R, Loux V & Zagorec M (2005) The complete genome sequence of
the meat-borne lactic acid bacterium Lactobacillus sakei 23K. Nat Biotechnol 23: 1527-1533.
• Chaillou S, Chaulot-Talmon A, Caekebeke H, Cardinal M, Christieans S, Denis C, Helene
Desmonts M, Dousset X, Feurer C, Hamon E, Joffraud J-J, La Carbona S, Leroi F, Leroy S, Lorre
S, Mace S, Pilet M-F, Prevost H, Rivollier M, Roux D, Talon R, Zagorec M & Champomier-Verges
M-C (2015) Origin and ecological selection of core and food-specific bacterial communities
associated with meat and seafood spoilage. International Society for Microbial Ecology Journal
9: 1105-1118.
• Chaillou S, Christieans S, Rivollier M, Lucquin I, Champomier-Vergès MC & Zagorec M (2014)
Quantification and efficiency of Lactobacillus sakei strain mixtures used as protective cultures
in ground beef. Meat Science 97: 332-338.
• Champomier-Vergès M-C, Zuniga M, Morel-Deville F, Perez-Martinez G, Zagorec M & Ehrlich
D.S (1999) Relationships between arginine degradation, pH and survival in Lactobacillus sakei.
FEMS Microbiology Letters 180: 297-304
• Choi KY, Lee TK & Sul WJ (2015) Metagenomic analysis of chicken gut microbiota for improving
metabolism and health of chickens — A review. Asian-Australasian Journal of Animal Sciences
28: 1217-1225.

A.Rouger 2017 Références bibliographiques
211
• Cholet O (2006) Etude de l’écosystème fromager par une approche biochimique et
moléculaire. Thesis, Paris-Grignon.
• Chouliara E, Karatapanis A, Savvaidis IN & Kontominas MG (2007) Combined effect of oregano
essential oil and modified atmosphere packaging on shelf-life extension of fresh chicken breast
meat, stored at 4°C. Food Microbiology 24: 607-617.
• Chouliara E, Badeka A, Savvaidis I & Kontominas MG (2008) Combined effect of irradiation and
modified atmosphere packaging on shelf-life extension of chicken breast meat:
microbiological, chemical and sensory changes. European Food Research and Technology 226:
877-888.
• Cline J, Braman JC & Hogrefe HH (1996) PCR fidelity of pfu DNA polymerase and other
thermostable DNA polymerases. Nucleic Acids Research 24.
• Cohen N, Ennaji H, Bouchrif B, Hassar M & Karib H (2007) Comparative study of microbiological
quality of raw poultry meat at various seasons and for different slaughtering processes in
Casablanca (Morocco). The Journal of Applied Poultry Research 16: 502-508.
• Cole JR, Chai B, Farris RJ, Wang Q, Kulam SA, McGarrell DM, Garrity GM & Tiedje JM (2005)
The Ribosomal Database Project (RDP-II): sequences and tools for high-throughput rRNA
analysis. Nucleic Acids Research 33: D294-296.
• Cole JR, Chai B, Farris RJ, Wang Q, Kulam-Syed-Mohideen AS & McGarrell DM (2007) The
ribosomal database project (RDP-II): introducing myRDP space and quality controlled public
data. Nucleic Acids Research 35.
• Corpet DE, Lumeau S & Corpet F (1989) Minimum antibiotic levels for selecting a resistance
plasmid in a gnotobiotic animal model. Antimicrobial Agents and Chemotherapy 33: 535-540.
• Corre E (2015) Approches moléculaires de la diversité microbienne de deux environnements
extrêmes : les sources hydrothermales profondes et les réservoirs pétroliers. Thesis, Université
de Bretagne Occidentale.
• Cunningham FE, Cox NA. (1987) The Microbiology of Poultry Meat Products. Academic Press,
1987, ISBN 9780121998806.
D
• De Filippis F, Genovese A, Ferranti P, Gilbert JA & Ercolini D (2016) Metatranscriptomics reveals
temperature-driven functional changes in microbiome impacting cheese maturation rate.
Scientific Reports 6: 21871.
• De Filippis F, La Storia A, Villani F & Ercolini D (2013) Exploring the sources of bacterial spoilers
in beefsteaks by culture-independent high-throughput sequencing. PLoS ONE 8: e70222.
• De Pasquale I, Di Cagno R, Buchin S, De Angelis M & Gobbetti M (2014) Microbial ecology
dynamics reveal a succession in the core microbiota that is involved in the ripening of pasta-
filata Caciocavallo Pugliese cheese. Applied and Environmental Microbiology 80: 6243-6255.
• del Río E, Muriente R, Prieto M, Alonso-Calleja C & Capita R (2007a) Effectiveness of trisodium
phosphate, acidified sodium chlorite, citric acid, and peroxyacids against pathogenic bacteria
on poultry during refrigerated storage. Journal of Food Protection 70: 2063-2071.
• del Río E, Panizo-Morán M, Prieto M, Alonso-Calleja C & Capita R (2007b) Effect of various
chemical decontamination treatments on natural microflora and sensory characteristics of
poultry. International Journal of Food MicrobiologyI 115: 268-280.

A.Rouger 2017 Références bibliographiques
212
• del Río E, Capita R, Prieto M & Alonso-Calleja C (2006) Comparison of pathogenic and spoilage
bacterial levels on refrigerated poultry parts following treatment with trisodium phosphate.
Food Microbiology 23: 195-198.
• del Río E, González de Caso B, Prieto M, Alonso-Calleja C & Capita R (2008) Effect of poultry
decontaminants concentration on growth kinetics for pathogenic and spoilage bacteria. Food
Microbiology 25: 888-894.
• Delcenserie V, Taminiau B, Delhalle L, Nezer C, Doyen P, Crevecoeur S, Roussey D, Korsak N &
Daube G (2014) Microbiota characterization of a Belgian protected designation of origin
cheese, Herve cheese, using metagenomic analysis. Journal of dairy science 97: 6046-6056.
• Demirok E, Veluz G, Stuyvenberg WV, Castaneda MP, Byrd A & Alvarado CZ (2013) Quality and
safety of broiler meat in various chilling systems. Poultry Science 92: 1117-1126.
• Denesvre C, Dumarest M, Remy S, Gourichon D & Eloit M (2015) Chicken skin virome analyzed
by high-throughput sequencing shows a composition highly different from human skin. Virus
genes 51: 209-216.
• Diaz-Sanchez S, Hanning I, Pendleton S & D’Souza D (2013) Next-generation sequencing: The
future of molecular genetics in poultry production and food safety. Poultry Science 92 : 562-
572.
• Doulgeraki A, Ercolini D, Villani F & Nychas G-JE (2012) Spoilage microbiota associated to the
storage of raw meat in different conditions. International Journal of Food Microbiology 157:
130-141.
• Dugat-Bony E, Straub C, Teissandier A, Onesime D, Loux V, Monnet C, Irlinger F, Landaud S,
Leclercq-Perlat MN, Bento P, Fraud S, Gibrat JF, Aubert J, Fer F, Guedon E, Pons N, Kennedy S,
Beckerich JM, Swennen D & Bonnarme P (2015) Overview of a surface-ripened cheese
community functioning by meta-omics analyses. PLoS One 10: e0124360.
• Dutuit P & Gorenflot R (2008) Glossaire pour le développement durable: des mots pour les
maux de la planète.
E
• Economou V, Zisides N., Gousia P, Petsios S, Sakkas H, Soultos N & Papadopoulou C (2015)
Prevalence and antimicrobial profile of Campylobacter isolates from free-range and
conventional farming chicken meat during a 6-year survey. Food Control 56: 161-168.
• Edwards U, Rogall T, Blocker H, Emde M & Bottger EC (1989) Isolation and direct complete
nucleotide determination of entire genes. Characterization of a gene coding for 16S ribosomal
RNA. Nucleic acids research 17: 7843-7853.
• EFSA. (2016) The European Union summary report on trends and sources of zoonoses,
zoonotic agents and food-borne outbreaks in 2015. The EFSA Journal 14, 4634, doi:
10.2903/j.efsa.2016.4634.
• Elizaquívela P, Pérez-Cataluñaa A, Yépeza A, Aristimuñob C, Jiménezb E, Cocconcellid PS,
Vignolob G & Aznara c, Rosa (2015) Pyrosequencing vs. culture-dependent approaches to
analyze lactic acid bacteria associated to chicha, a traditional maize-based fermented beverage
from Northwestern Argentina. International Journal of Food MicrobiologyI 198: 9-18.
• Ercolini D (2004) PCR-DGGE fingerprinting: novel strategies for detection of microbes in food.
Journal of Microbiological Methods 56: 297-314.

A.Rouger 2017 Références bibliographiques
213
• Ercolini D (2013) High-throughput sequencing and metagenomics: moving forward in the
culture-independent analysis of food microbial ecology. Applied and Environmental
Microbiology 79: 3148-3155.
• Ercolini D, Russo F, Torrieri E, Masi P & Villani F (2006) Changes in the spoilage-related
microbiota of beef during refrigerated storage under different packaging conditions. Applied
and Environmental Microbiology 72: 4663-4671.
• Escudie F, Auer L, Bernard M, Cauquil L, Vidal K, Maman S, Mariadassou M, Hernandez-Raquet
G & Pascal G (2015) FROGS: Find Rapidly OTU with Galaxy Solution.,
• Ezaki T, Kawamura Y, Li N, Li ZY, Zhao L & Shu S (2001) Proposal of the genera Anaerococcus
gen. nov., Peptoniphilus gen. nov. and Gallicola gen. nov. for members of the genus
Peptostreptococcus. International Journal of Systematic and Evolutionary Microbiology 51:
1521-1528.
F
• Faber KL, Person EC & Hudlow WR (2013) PCR inhibitor removal using the NucleoSpin® DNA
Clean-Up XS kit. Forensic Science International: Genetics 7: 209-213.
• Fall PA, Pilet MF, Leduc F, Cardinal M, Duflos G, Guerin C, Joffraud JJ & Leroi F (2012) Sensory
and physicochemical evolution of tropical cooked peeled shrimp inoculated by Brochothrix
thermosphacta and Lactococcus piscium CNCM I-4031 during storage at 8 degrees C.
International Journal of Food Microbiology 152: 82-90.
• FAO. (1996) Management of Waste from Animal Product Processing.
http://www.fao.org/WAIRDOCS/LEAD/X6114E/x6114e04.htm#b2-
2.2.%20Poultry%20slaughtering%20process (accessed on 27 January 2017)
• Feinstein LM, Sul WJ & Blackwood CB (2009) Assessment of Bias Associated with Incomplete
Extraction of Microbial DNA from Soil. Applied and Environmental Microbiology 75: 5428-5433.
• Feng YZ, Elmasry G, Sun DW, Scannell AG, Walsh D & Morcy N (2013) Near-infrared
hyperspectral imaging and partial least squares regression for rapid and reagentless
determination of Enterobacteriaceae on chicken fillets. Food Chemistry 138: 1829-1836.
• Feng YZ & Sun DW (2013a) Determination of total viable count (TVC) in chicken breast fillets
by near-infrared hyperspectral imaging and spectroscopic transforms. Talanta 105: 244-249.
• Feng YZ & Sun DW (2013b) Near-infrared hyperspectral imaging in tandem with partial least
squares regression and genetic algorithm for non-destructive determination and visualization
of Pseudomonas loads in chicken fillets. Talanta 109: 74-83.
• Fernandez M & Zuniga M (2006) Amino acid catabolic pathways of lactic acid bacteria. Critical
Reviews in Microbiology 32: 155-183.
• Fleet GH (1999) Microorganisms in food ecosystems. International Journal of Food
Microbiology 50: 101-117.
• Fontanot M, Iacumin L, Cecchini F, Comi G & Manzano M (2014) Rapid detection and
differentiation of important Campylobacter spp. in poultry samples by dot blot and PCR. Food
Microbiology 43: 28-34.
• Fougy L (2016) Les impacts de la réduction de la teneur en sel sur la conservation et les
écosytèmes bactériens des chipolatas. Thesis, Paris Saclay.
• Fougy L, Desmonts MH, Coeuret G, Fassel C, Hamon E, Hezard B, Champomier-Verges MC &
Chaillou S (2016) Reducing Salt in Raw Pork Sausages Increases Spoilage and Correlates with
Reduced Bacterial Diversity. Applied and Environmental Microbiology 82: 3928-3939.

A.Rouger 2017 Références bibliographiques
214
• Fox EM, Solomon K, Moore JE, Wall PG & Fanning S (2014) Phylogenetic profiles of in-house
microflora in drains at a food production facility: comparison and biocontrol implications of
Listeria-positive and -negative bacterial populations. Applied and Environmental
Microbiology 8311: 3369-3374
• France Agrimer (2015) Viandes rouges, viandes blanches, Données et bilans, Consommation
des produits carnés en 2014.
• Franzosa EA, Hsu T, Sirota-Madi A, Shafquat A, Abu-Ali G, Morgan XC & Huttenhower C (2015)
Sequencing and beyond: integrating molecular ‘omics for microbial community profiling.
Nature reviews. Microbiology 13: 360-372.
• FSIS (2014) Food Safety and Inspection Service. 9 CFR parts 381 and 500. Modernization of
poultry slaughter inspection. Federal Register 79: 49566-49637
• FSIS 2015 DRAFT Compliance guideline for controlling Salmonella and Campylobacter in
poultry, Fourth Edition, December 2015.
https://www.fsis.usda.gov/wps/portal/footer/policies-and-links/significant-guidance-
documents.Accessed 1st January 2017.
G
• Galimberti A, Bruno A, Mezzasalma V, De Mattia F, Bruni I & Labra M (2015) Emerging DNA-
based technologies to characterize food ecosystems. Food Research International 69: 424-433.
• Garriga M & Aymerich MT (2009) Advanced decontamination technologies: high hydrotatic
pressure on meat products. In: Safety of Meat and Processed Meat, F. Toldrà ed., Springer New
York, (2009), 183-208.
• Gill CO & Badoni M (2005) Recovery of bacteria from poultry carcasses by rinsing, swabbing or
excision of skin. Food Microbiology 22: 101-107.
• Gill CO & Newton KG (1977) The development of aerobic spoilage flora on meat stored at chill
temperatures. Journal of Applied Bacteriology 43: 189-195.
• Glassing A, Dowd SE, Galandiuk S, Davis B & Chiodini RJ (2016) Inherent bacterial DNA
contamination of extraction and sequencing reagents may affect interpretation of microbiota
in low bacterial biomass samples. Gut Pathogens 8: 24.
• Glenn TC (2011) Field guide to next-generation DNA sequencers. Molecular Ecology Resources
11: 759-769.
• Goksoy E, Kirkan S & Kok F (2004) Microbiological quality of broiler carcasses during processing
in two slaughterhouses in Turkey. Poultry Science 83: 1427-1432.
• Goodwin S, McPherson JD & McCombie WR (2016) Coming of age: ten years of next-
generation sequencing technologies. Nature Reviews Genetics 17: 333-351.
• Grant A, Hashem F & Parveen S (2016) Salmonella and Campylobacter: Antimicrobial
resistance and bacteriophage control in poultry. Food Microbiology 53: 104-109.
• Greppi A, Ferrocino I, La Storia A, Rantsiou K, Ercolini D & Cocolin L (2015) Monitoring of the
microbiota of fermented sausages by culture independent rRNA-based approaches.
International Journal of Food Microbiology 212: 67–75.
• Gribble A & Brightwell G (2013) Spoilage characteristics of Brochothrix thermosphacta and
campestris in chilled vacuum packaged lamb, and their detection and identification by real
time PCR. Meat Science 94: 361-368.

A.Rouger 2017 Références bibliographiques
215
• Gruntar I, Biasizzo M, Kusar D, Pate M & Ocepek M (2015) Campylobacter jejuni contamination
of broiler carcasses: Population dynamics and genetic profiles at slaughterhouse level. Food
microbiology 50: 97-101.
• Gudbjörnsdóttir B, Suihko ML, Gustavsson P, Thorkelsson G, Salo S, Sjöberg AM, Niclasen O &
Bredholt S (2004) The incidence of Listeria monocytogenes in meat, poultry and seafood plants
in the Nordic countries. Food Microbiology 21: 217-225.
• Gustavsson J, Cederberg C & Sonesson U (2011) Global food losses and food waste : extent,
causes and prevention. Food and Agriculture Organization of the United Nations, Rome,
• Haas BJ, Gevers D, Earl AM, Feldgarden M, Ward DV, Giannoukos G, Ciulla D, Tabbaa D,
Highlander SK, Sodergren E, Methé B, DeSantis TZ, Consortium THM, Petrosino JF, Knight R &
Birren BW (2011) Chimeric 16S rRNA sequence formation and detection in Sanger and 454-
pyrosequenced PCR amplicons. Genome Research 21: 494-504.
H
• Harada T, Dang VC, Nguyen DP, Nguyen TA, Sakamoto M, Ohkuma M, Motooka D, Nakamura
S, Uchida K, Jinnai M, Yonogi S, Kawahara R, Kanki M, KawaI T, Kumeda Y & Yamamoto Y (2016)
Enterococcus saigonensis sp. nov., isolated from retail chicken meat and liver. International
journal of systematic and evolutionary microbiology, 66: 3779-3785.
• Hashimoto H, Noborisaka R & Yanagawa R (1974) Distribution of Motile Streptococci in Feces
of Man and Animals and in River and Sea Water. Nippon Saikingaku Zasshi 29: 387-393.
• Hashimoto R, Kawakami H, Tomokane K, Yoshii Z, Hahn G & Tolle A (1979) Isolation and
characterization of motile group N Streptococci. Journal of Faculty Applied Biological Science
Hiroshima University 18: 207-216
• Head IM, Saunders JR & Pickup RW (1998) Microbial Evolution, Diversity, and Ecology: A
Decade of Ribosomal RNA Analysis of Uncultivated Microorganisms. Microbial ecology 35: 1-
21.
• Heip C, Herman P & Soetaert K (1998) Indices of diversity and evenness*. 24: 61-87.
• Herbert U, Rossaint S, Khanna MA & Kreyenschmidt J (2013) Comparison of argon-based and
nitrogen-based modified atmosphere packaging on bacterial growth and product quality of
chicken breast fillets. Poultry Science 92: 1348-1356.
• Hinton Jr A & Ingram KD (2003) Bactericidal activity of tripotassium phosphate and potassium
oleate on the native flora of poultry skin. Food Microbiology 20: 405-410.
• Hinton Jr A, Cason JA & Ingram KD (2004) Tracking spoilage bacteria in commercial poultry
processing and refrigerated storage of poultry carcasses. International Journal of Food
Microbiology 91: 155-165.
• Hoffman S, Batz MB & Morris JG Jr (2012) Annual cost of illness and quality-adjusted life year
losses in the United States due to 14 foodborne pathogens. Journal of Food Protection 75:
1292-1302
• Höll L, Behr J & Vogel RF (2016) Identification and growth dynamics of meat spoilage
microorganisms in modified atmosphere packaged poultry meat by MALDI-TOF MS. Food
Microbiology 60: 84-91.
• Holt HM, Gahrn-Hansen B & Bruun B (2005) Shewanella algae and Shewanella putrefaciens:
clinical and microbiological characteristics. Clinical Microbiology and Infection 11: 347-352.

A.Rouger 2017 Références bibliographiques
216
• Huang L (2016) Evaluating the Performance of a New Model for Predicting the Growth of
Clostridium perfringens in Cooked, Uncured Meat and Poultry Products under Isothermal,
Heating, and Dynamically Cooling Conditions. Journal of Food Science, 81: 1754-1765.
• Hue O, Allain V, Laisney MJ, Le Bouquin S, Lalande F, Petetin I, Rouxel S, Quesne S, Gloaguen
PY, Picherot M, Santolini J, Bougeard S, Salvat G & Chemaly M (2011) Campylobacter
contamination of broiler caeca and carcasses at the slaughterhouse and correlation with
Salmonella contamination. Food Microbiology 28(5): 862-868
• Hultman J, Rahkila R, Ali J, Rousu J & Björkroth KJ (2015) Meat Processing Plant Microbiome
and Contamination Patterns of Cold-Tolerant Bacteria Causing Food Safety and Spoilage Risks
in the Manufacture of Vacuum-Packaged Cooked Sausages. Applied and Environmental
Microbiology 81: 7088-7097.
• Hultman J, Waldrop MP, Mackelprang R, David MM, McFarland J, Blazewicz SJ, Harden J,
Turetsky MR, McGuire AD, Shah MB, VerBerkmoes NC, Lee LH, Mavrommatis K & Jansson JK
(2015) Multi-omics of permafrost, active layer and thermokarst bog soil microbiomes. Nature
521: 208-212.
• Humblot C & Guyot J-P (2009) Pyrosequencing of tagged 16S rRNA gene amplicons for rapid
deciphering of the microbiomes of fermented foods such as pearl millet slurries. Applied and
Environmental Microbiology 75: 4354-4361.
I
• Iskandar CF, Cailliez-Grimal C, Rahman A, Rondags E, Remenant B, Zagorec M, Leisner JJ,
Borges F & Revol-Junelles A-M (2016) Genes associated to lactose metabolism illustrate the
high diversity of Carnobacterium maltaromaticum. Food Microbiology 58: 79-86.
• ITAVI (2016) Situation de la production et des marchés des volailles de chair Bilan 2015. Institut
Technique de l'Aviculture, http://www.itavi.asso.fr/ mars 2016.
J
• Jääskeläinen E, Johansson P, Kostiainen O, Nieminen T, Schmidt G, Somervuo P, Mohsina M,
Vanninen P, Auvinen P & Björkroth J (2013) Significance of heme-based respiration in meat
spoilage caused by Leuconostoc gasicomitatum. Applied and Environmental Microbiology
79(4): 1078-85.
• Jackson BR, Griffin PM, Cole D, Walsh KA & Chai SJ (2013). Outbreak-associated Salmonella
enterica serotypes and food commodities, United States, 1998-2008 Emerging Infectious
Disease 19: 1239–1244
• Jaffres E, Sohier D, Leroi F, Pilet MF, Prevost H, Joffraud JJ & Dousset X (2009) Study of the
bacterial ecosystem in tropical cooked and peeled shrimps using a polyphasic approach.
International Journal of Food Microbiology 131: 20-29.
• James C, Vincent C, de Andrade Lima TI & James SJ (2006) The primary chilling of poultry
carcasses—a review. International Journal of Refrigeration 29: 847-862.
• Joffraud JJ, Leroi F & Chevalier F (1998) Development of a sterile cold-smoked fish model.
Journal of Applied Microbiology 85: 991-998.
• Johansson P, Paulin L, Säde E, Salovuori N, Alatalo ER, Björkroth KJ & Auvinen P (2011) Genome
sequence of a food spoilage lactic acid bacterium, Leuconostoc gasicomitatum LMG 18811(T),
in association with specific spoilage reactions. Applied and Environmental Microbiology 77:
4344-4351.

A.Rouger 2017 Références bibliographiques
217
• Jones R J., Zagorec M, Brightwell G, Tagg J R. (2009) Inhibition by Lactobacillus sakei of other
species in the flora of vacuum packaged raw meats during prolonged storage. Food
Microbiology 26: 876–881.
• Jørgensen LV, Huss HH & Dalgaard P (2000) The effect of biogenic amine production by single
bacterial cultures and metabiosis on cold-smoked salmon. Journal of Applied Microbiology 89:
920-934.
• Jorgensen LV, Huss HH & Dalgaard P (2001) Significance of volatile compounds produced by
spoilage bacteria in vacuum-packed cold-smoked salmon (Salmo salar) analyzed by GC-MS and
multivariate regression. Journal of Agricultural and Food Chemistry 49: 2376-2381.
• Josefsen MH, Bhunia AK, Engvall EO, Fachmann MS & Hoorfar J (2015) Monitoring
Campylobacter in the poultry production chain-from culture to genes and beyond. Journal of
Microbiological Methods 112: 118-125.
• Juck G, Neetoo H, Beswick E & Chen H (2012) Influence of prior growth conditions, pressure
treatment parameters, and recovery conditions on the inactivation and recovery of Listeria
monocytogenes, Escherichia coli, and Salmonella typhimurium in turkey meat. International
Journal of Food Microbiology 153: 203-211.
• Juneja VK, Baker DA, Thippareddi H, Snyder Jr OP & Mohr TB (2013) Growth potential of
Clostridium perfringens from spores in acidified beef, pork and poultry products during
chilling. Journal of Food Protection 76: 65–71.
• Jung JY, Lee SH, Jin HM, Hahn Y, Madsen EL & Jeon CO (2013) Metatranscriptomic analysis of
lactic acid bacterial gene expression during kimchi fermentation. International Journal of Food
Microbiology 163: 171-179.
• Jung JY, Lee SH, Kim JM, Park MS, Bae J-W, Hahn Y, Madsen EL & Jeon CO (2011) Metagenomic
analysis of kimchi, a traditional Korean fermented food. Applied and Environmental
Microbiology 77: 2264-2274.
• Juste A, Thomma BP & Lievens B (2008) Recent advances in molecular techniques to study
microbial communities in food-associated matrices and processes. Food Microbiology 25: 745-
761.
K
• Katzav M, Isohanni P, Lund M, Hakkinen M & Lyhs U (2008) PCR assay for the detection of
Campylobacter in marinated and non-marinated poultry products. Food Microbiology 25: 908-
914.
• Keohavong P & Thilly WG (1989) Fidelity of DNA polymerases in DNA amplification.
Proceedings of the National Academy of Sciences 86.
• Kern CC, Usbeck JC, Vogel RF & Behr J (2013) Optimization of Matrix-Assisted-Laser-
Desorption-Ionization-Time-Of-Flight Mass Spectrometry for the identification of bacterial
contaminants in beverages. Journal of Microbiological Methods 93: 185-191.
• Kim CS, Bowers JA (1988) Thiamin content of chicken muscle and effect of purification
variables on determined values. Poultry Science 67(1):72-77.
• Kiyohara M, Koyanagi T, Matsui H, Yamamoto K, Take H, Katsuyama Y, Tsuji A, Miyamae H,
Kondo T, Nakamura S, Katayama T & Kumagai H (2012) Changes in microbiota population
during fermentation of narezushi as revealed by pyrosequencing analysis. Biosci Biotechnol
Biochem 76: 48-52.

A.Rouger 2017 Références bibliographiques
218
• Klappenbach J, Dunbar J & Schmidt T (2000) rRNA gene copy number predicts ecological
strategies in bacteria. Applied and Environmental Microbiology 66: 1328 - 1333.
• Koort J, Murros A, Coneye T, Eerola S, Vandamme P, Sukura A & Björkroth J (2005) Lactobacillus
oligofermentans sp. nov., associated with spoilage of modified-atmosphere-packaged poultry
products. Applied and Environmental Microbiology 71: 4400–4406.
• Krupa P, Bystron J, Bania J, Podkowik M, Empel J & Mroczkowska A (2014) Genotypes and
oxacillin resistance of Staphylococcus aureus from chicken and chicken meat in Poland. Poultry
Science 93: 3179–86.
L
• Langmead B & Salzberg SL (2012) Fast gapped-read alignment with Bowtie 2. Nature methods
9: 357-359.
• Laursen BG, Leisner JJ & Dalgaard P (2006) Carnobacterium species: effect of metabolic activity
and interaction with Brochothrix thermosphacta on sensory characteristics of modified
atmosphere packed shrimp. Journal of Agricultural and Food Chemistry 54: 3604-3611.
• Lee CK, Herbold CW, Polson SW, Wommack KE, Williamson SJ, McDonald IR & Cary SC (2012)
Groundtruthing next-gen sequencing for microbial ecology–biases and errors in community
structure estimates from PCR amplicon Pyrosequencing. PLoS ONE 7: e44224.
• Lee IR, Yang L, Sebetso G, Allen R, Doan THN, Blundell R, Lui EYL, Morrow CA & Fraser JA (2013)
Characterization of the Complete Uric Acid Degradation Pathway in the Fungal Pathogen
Cryptococcus neoformans. PLOS ONE 8: e64292.
• Leisner JJ, Hansen MA, Larsen MH, Hansen L, Ingmer H & Sorensen SJ (2012) The genome
sequence of the lactic acid bacterium, Carnobacterium maltaromaticum ATCC 35586 encodes
potential virulence factors. Int J Food Microbiol 152: 107-115.
• Lemay M-J, Choquette J, Delaquis PJ, Gariépy C, Rodrigue N & Saucier L (2002) Antimicrobial
effect of natural preservatives in a cooked and acidified chicken meat model. International
Journal of Food Microbiology 78: 217-226.
• Lhomme E, Orain S, Courcoux P, Onno B & Dousset X (2015) The predominance of Lactobacillus
sanfranciscensis in French organic sourdoughs and its impact on related bread characteristics.
International Journal of Food Microbiology 213: 40-48.
• Li J, Zheng Y, Xu H, Xi X, Hou Q, Feng S, Wuri L, Bian Y, Yu Z, Kwok L-Y, Sun Z & Sun T (2017)
Bacterial microbiota of Kazakhstan cheese revealed by single molecule real time (SMRT)
sequencing and its comparison with Belgian, Kalmykian and Italian artisanal cheeses. BMC
Microbiology 17: 13.
• Li XR, Ma EB, Yan LZ, Meng H, Du XW, Zhang SW & Quan ZX (2011) Bacterial and fungal diversity
in the traditional Chinese liquor fermentation process. International Journal of Food
MicrobiologyI 146: 31-37.
• Lilyblade AL, Peterson DW (1962) Inositol and free sugars in chicken muscle post-mortem.
Journal of food science. DOI: 10.1111/j.1365-2621.1962.tb00088.x
• Line JE, Oakley BB & Stern NJ (2013) Comparison of cumulative drip sampling with whole
carcass rinses for estimation of Campylobacter species and quality indicator organisms
associated with processed broiler chickens. Poultry Science 92: 218-224.
• Liu F, Guo Y-z & Li Y-f (2006) Interactions of microorganisms during natural spoilage of pork at
5 °C. Journal of Food Engineering 72: 24-29.

A.Rouger 2017 Références bibliographiques
219
• Liu L, Li Y, Li S, Hu N, He Y, Pong R, Lin D, Lu L & Law M (2012) Comparison of next-generation
sequencing systems. Journal of Biomedicine and Biotechnology 2012: 11.
• Loretz M, Stephan R & Zweifel C (2010) Antimicrobial activity of decontamination treatments
for poultry carcasses: A literature survey. Food Control 21: 791-804.
• Love MI, Huber W & Anders S (2014) Moderated estimation of fold change and dispersion for
RNA-seq data with DESeq2. Genome Biology 15: 550.
• Lübeck PS, Wolffs P, On SLW, Ahrens P, Rådström P & Hoorfar J (2003) Toward an international
standard for PCR-based detection of food-borne thermotolerant Campylobacters: assay
development and analytical validation. Applied and Environmental Microbiology 69: 5664-
5669.
• Lubeck PS, Wolffs P, On SLW, Ahrens P, Radstrom P & Hoorfar J (2003) Toward an international
standard for PCR-based detection of food-borne thermotolerant Campylobacters: assay
development and analytical validation. Applied and Environmental Microbiology 69: 5664-
5669.
• Luber P (2009) Cross-contamination versus undercooking of poultry meat or eggs — which
risks need to be managed first? International Journal of Food Microbiology 134: 21-28.
• Lupo A, Vogt D, Seiffert SN, Endimiani A & Perreten V (2014) Antibiotic resistance and
phylogenetic characterization of Acinetobacter baumannii strains isolated from commercial
raw meat in Switzerland. J Food Prot 77: 1976-1981.
• Lyhs U, Koort JMK, Lundstrom H-S & Björkroth J (2003) Leuconostoc gelidum and Leuconostoc
gasicomitatum strains dominated the LAB population associated with strong slime formation
in an acetic-acid herring preserve. International Journal of Food Microbiology, 90: 2207–2218.
• Lynch OA, Cagney C, McDowell DA, Duffy G. (2010) A method for the growth and recovery of
17 species of Campylobacter and its subsequent application to inoculated beef. Journal of
Microbiological Methods 83: 1-7.
M
• Macé S, Rouger A, Haddad N, Zagorec M & Tresse O (2014) Viabilité de Campylobacter en
fonction du stress oxydant et de la flore endogène des aliments. Rapport bibliographique,
Valorial, confidential file.
• Macé S, Haddad N, Zagorec M & Tresse O (2015) Influence of measurement and control of
microaerobic gaseous atmospheres in methods for Campylobacter growth studies. Food
Microbiology 52: 169-176.
• Mahe F, Rognes T, Quince C, de Vargas C & Dunthorn M (2014) Swarm: robust and fast
clustering method for amplicon-based studies. PeerJ 2: e593.
• Margulies M, Egholm M, Altman WE, Attiya S, Bader JS, Bemben LA, Berka J, Braverman MS,
Chen YJ, Chen Z, Dewell SB, Du L, Fierro JM, Gomes XV, Godwin BC, He W, Helgesen S, Ho CH,
Irzyk GP, Jando SC, Alenquer ML, Jarvie TP, Jirage KB, Kim JB, Knight JR, Lanza JR, Leamon JH,
Lefkowitz SM, Lei M, Li J, Lohman KL, Lu H, Makhijani VB, McDade KE, McKenna MP, Myers
EW, Nickerson E, Nobile JR, Plant R, Puc BP, Ronan MT, Roth GT, Sarkis GJ, Simons JF, Simpson
JW, Srinivasan M, Tartaro KR, Tomasz A, Vogt KA, Volkmer GA, Wang SH, Wang Y, Weiner MP,
Yu P, Begley RF & Rothberg JM (2005) Genome sequencing in microfabricated high-density
picolitre reactors. Nature 437: 376-380.
• Martin-Platero AM, Valdivia E, Maqueda M, Martin-Sanchez I & Martinez-Bueno M (2008)
Polyphasic approach to bacterial dynamics during the ripening of spanish farmhouse cheese,

A.Rouger 2017 Références bibliographiques
220
using culture-dependent and -independent methods. Applied and Environmental Microbiology
74: 5662-5673.
• Maxam AM & Gilbert W (1977) A new method for sequencing DNA. Proceedings of the
National Academy of Sciences 74: 560-564.
• Mayo B, Rachid CTCC, Alegría Á, Leite AMO, Peixoto RS & Delgado S (2014) Impact of next
generation sequencing techniques in food microbiology. Current Genomics 15: 293-309.
• McCarthy A, Chiang E, Schmidt ML & Denef VJ (2015) RNA preservation agents and nucleic acid
extraction method bias perceived bacterial community composition. PLoS ONE 10: e0121659.
• McLeod A, Snipen L, Naterstad K, Axelsson L (2011) Global transcriptome response in
Lactobacillus sakei during growth on ribose. BMC Microbiology 11:145-171.
• McMillin KW (2008) Where is MAP Going? A review and future potential of modified
atmosphere packaging for meat. Meat Science 80: 43-65.
• McMurdie PJ & Holmes S (2013) Phyloseq: an R package for reproducible interactive analysis
and graphics of microbiome census data. PLoS ONE 8.
• Mead G (2004) Microbiological quality of poultry meat: a review. Revista Brasileira de Ciência
Avícola 6: 135-142.
• Melero B, Diez AM, Rajkovic A, Jaime I & Rovira J (2012) Behaviour of non-stressed and
stressed Listeria monocytogenes and Campylobacter jejuni cells on fresh chicken burger meat
packaged under modified atmosphere and inoculated with protective culture. International
Journal of Food Microbiology 158: 107-112.
• Meredith H, Valdramidis V, Rotabakk BT, Sivertsvik M, McDowell D & Bolton DJ (2014) Effect
of different modified atmospheric packaging (MAP) gaseous combinations on Campylobacter
and the shelf-life of chilled poultry fillets. Food Microbiology 44: 196-203.
• Meyer F, Paarmann D, D'Souza M, Olson R, Glass E, Kubal M, Paczian T, Rodriguez A, Stevens
R, Wilke A, Wilkening J & Edwards R (2008) The metagenomics RAST server – a public resource
for the automatic phylogenetic and functional analysis of metagenomes. BMC Bioinformatics
9: 1-8.
• Mohareb F, Iriondo M, Doulgeraki AI, Van Hoek A, Aarts H, Cauchi M & Nychas G-JE (2015)
Identification of meat spoilage gene biomarkers in Pseudomonas putida using gene profiling.
Food Control 57: 152-160.
• Mohd Shaufi MA, Sieo CC, Chong CW, Gan HM & Ho YW (2015) Deciphering chicken gut
microbial dynamics based on high-throughput 16S rRNA metagenomics analyses. Gut
Pathogens 7: 1-12.
• Mohr TB, Juneja VK, Thippareddi HH, Schaffner DW, Bronstein PA, Silverman M & Cook Jr LV
(2015) Assessing the performance of Clostridium perfringens cooling models for cooked,
uncured meat and poultry products. Journal of Food Protection 78: 1512–26.
• Møller COA, Ilg Y, Aabo S, Christensen BB, Dalgaard P & Hansen TB (2013) Effect of natural
microbiota on growth of Salmonella spp. in fresh pork – A predictive microbiology approach.
Food Microbiology 34: 284-295.
• Monnet C, Dugat-Bony E, Swennen D, Beckerich JM, Irlinger F, Fraud S & Bonnarme P (2016)
Investigation of the activity of the microorganisms in a reblochon-style cheese by
metatranscriptomic analysis. Frontiers in Microbiology 7: 536.

A.Rouger 2017 Références bibliographiques
221
• Mormile MR, Oakley BB, Morales CA, Line J, Berrang ME, Meinersmann RJ, Tillman GE, Wise
MG, Siragusa GR, Hiett KL & Seal BS (2013) The poultry-associated microbiome: Network
analysis and farm-to-fork characterizations. PLoS ONE 8: e57190
• Murphy EC & Frick IM (2013) Gram-positive anaerobic cocci--commensals and opportunistic
pathogens. FEMS Microbiol Rev 37: 520-553.
N
• Najjari A, Ouzari H, Boudabous A & Zagorec M (2008) Method for reliable isolation of
Lactobacillus sakei strains originating from Tunisian seafood and meat products. International
Journal of Food Microbiology 121:3 342-351.
• Nakamura K, Oshima T, Morimoto T, Ikeda S, Yoshikawa H, Shiwa Y, Ishikawa S, Linak MC, Hirai
A, Takahashi H, Altaf-Ul-Amin M, Ogasawara N & Kanaya S (2011) Sequence-specific error
profile of Illumina sequencers. Nucleic Acids Research 39.
• Nalbantoglu U, Cakar A, Dogan H, Abaci N, Ustek D, Sayood K & Can H (2014) Metagenomic
analysis of the microbial community in kefir grains. Food Microbiol 41: 42-51.
• Nesme J, Achouak W, Agathos SN, Bailey M, Baldrian P, Brunel D, Frostegard A, Heulin T,
Jansson JK, Jurkevitch E, Kruus KL, Kowalchuk GA, Lagares A, Lappin-Scott HM, Lemanceau P,
Le Paslier D, Mandic-Mulec I, Murrell JC, Myrold DD, Nalin R, Nannipieri P, Neufeld JD, O'Gara
F, Parnell JJ, Puhler A, Pylro V, Ramos JL, Roesch LF, Schloter M, Schleper C, Sczyrba A, Sessitsch
A, Sjoling S, Sorensen J, Sorensen SJ, Tebbe CC, Topp E, Tsiamis G, van Elsas JD, van Keulen G,
Widmer F, Wagner M, Zhang T, Zhang X, Zhao L, Zhu YG, Vogel TM & Simonet P (2016) Back to
the future of soil metagenomics. Frontiers in Microbiology 7: 73.
• Nieminen TT, Koskinen K, Laine P, Hultman J, Sade E, Paulin L, Paloranta A, Johansson P,
Bjorkroth J & Auvinen P (2012a) Comparison of microbial communities in marinated and
unmarinated broiler meat by metagenomics. International Journal of Food Microbiology 157:
142-149.
• Nieminen TT, Välitalo H, Säde E, Paloranta A, Koskinen K & Björkroth J (2012b) The effect of
marination on lactic acid bacteria communities in raw broiler fillet strips. Frontiers in
Microbiology 3.
O
• Oakley BB, Morales CA, Line J, Berrang ME, Meinersmann RJ, Tillman GE, Wise MG, Siragusa
GR, Hiett KL & Seal BS (2013) The poultry-associated microbiome: network analysis and farm-
to-fork characterizations. PLoS One 8: e57190.
• Oakley BB, Morales CA, Line JE, Seal BS & Hiett KL (2012) Application of high-throughput
sequencing to measure the performance of commonly used selective cultivation methods for
the foodborne pathogen Campylobacter. FEMS Microbial Ecology 79: 327-336.
• OECD (2016) Meat consumption (indicator). doi: 10.1787/fa290fd0-en (Accessed on 12
December 2016)
• OECD/FAO (2016) OECD-FAO Agricultural Outlook 2016-2025. OECD Publishing, Paris,
dx.doi.org/10.1787/agr_outlook-2016-en.
• Okolocha EC & Ellerbroek L (2005) The influence of acid and alkaline treatments on pathogens
and the shelf life of poultry meat. Food Control 16: 217-225.
• Oksanen J, Blanchet FG, Friendly M, Kindt R, Legendre P, McGlinn D, Minchin P, O'Hara R,
Simpson G, Solymos P, Stevens MHH, Szoecs E & Wagner H (2016) vegan, Community
Ecology Package. R package version 2.3-5. 2016.

A.Rouger 2017 Références bibliographiques
222
• Oliveros J (2007-2015) VENNY. An interactive tool for comparing lists with Venn diagrams.
citeulike-article-id:6994833.
P
• Pacholewicz E, Swart A, Wagenaar JA, Lipman LJ & Havelaar AH (2016) Explanatory variables
associated with Campylobacter and Escherichia coli concentrations on broiler chicken
carcasses during processing in two slaughterhouses. Journal of Food Protection 79: 2038-2047
• Pantanella F, Berlutti F, Passariello C, Sarli S, Morea C & Schippa S (2007) Violacein and biofilm
production in Janthinobacterium lividum. Journal of applied microbiology 102: 992-999.
• Park EJ, Chun J, Cha CJ, Park WS, Jeon CO & Bae JW (2012) Bacterial community analysis during
fermentation of ten representative kinds of kimchi with barcoded pyrosequencing. Food
Microbiology 30: 197-204.
• Park SH, Aydin M, Khatiwara A, Dolan MC, Gilmore DF, Bouldin JL, Ahn S & Ricke SC (2014)
Current and emerging technologies for rapid detection and characterization of Salmonella in
poultry and poultry products. Food Microbiology 38: 250-262.
• Patsias A, Chouliara I, Badeka A, Savvaidis IN & Kontominas MG (2006) Shelf-life of a chilled
precooked chicken product stored in air and under modified atmospheres: microbiological,
chemical, sensory attributes. Food Microbiology 23: 423-429.
• Peng Y, Leung HCM, Yiu SM & Chin FYL (2012) IDBA-UD: a de novo assembler for single-cell
and metagenomic sequencing data with highly uneven depth. Bioinformatics 28: 1420-1428.
• Petrosino JF, Highlander S, Luna RA, Gibbs RA & Versalovic J (2009) Metagenomic
pyrosequencing and microbial identification. Clinical Chemistry 55: 856-866.
• Philippot L, Spor A, Henault C, Bru D, Bizouard F, Jones CM, Sarr A & Maron P-A (2013) Loss in
microbial diversity affects nitrogen cycling in soil. International Society for Microbial Ecology
Journal 7: 1609-1619.
• Pin C, García de Fernando GD & Ordóñez JA (2002) Effect of modified atmosphere composition
on the metabolism of glucose by Brochothrix thermosphacta. Applied and Environmental
Microbiology 68: 4441-4447.
• Pinto AD, Forte V, Guastadisegni MC, Martino C, Schena FP & Tantillo G (2007) A comparison
of DNA extraction methods for food analysis. Food Control 18: 76-80.
• Pirondini A, Bonas U, Maestri E, Visioli G, Marmiroli M & Marmiroli N (2010) Yield and
amplificability of different DNA extraction procedures for traceability in the dairy food chain.
Food Control 21: 663-668.
• Połka J, Rebecchi A, Pisacane V, Morelli L & Puglisi E (2015) Bacterial diversity in typical Italian
salami at different ripening stages as revealed by high-throughput sequencing of 16S rRNA
amplicons. Food Microbiology 46: 342-356.
• Pothakos V, Devlieghere F, Villani F, Björkroth J & Ercolini D (2015) Lactic acid bacteria and
their controversial role in fresh meat spoilage. Meat Science 109: 66-74.
• Potron A, Poirel L & Nordmann P (2011) Origin of OXA-181, an emerging carbapenem-
hydrolyzing oxacillinase, as a chromosomal gene in Shewanella xiamenensis. Antimicrobial
agents and chemotherapy 55: 4405-4407.
• Praveen PK, Debnath C., Shekhar S., Dalai N & Ganguly S (2016) Incidence of Aeromonas spp.
infection in fish and chicken meat and its related public health hazards: A review. Veterinary
World, 9(1): 6-11.
R

A.Rouger 2017 Références bibliographiques
223
• Rahkila R, Johansson P, Sade E & Björkroth J (2011) Identification of enterococci from broiler
products and a broiler processing plant and description of Enterococcus viikkiensis sp. nov.
Applied and Environmental Microbiology 77: 1196-203.
• Rahkila R, Nieminen T, Johansson P, Sade E & Björkroth J (2012) Characterization and
evaluation of the spoilage potential of Lactococcus piscium isolates from modified atmosphere
packaged meat. International Journal of Food Microbiology 156: 50-9.
• Ranjitkar S, Lawley B, Tannock G & Engberg RM (2016) Bacterial succession in the broiler
gastrointestinal tract. Applied and Environmental Microbiology 82: 2399–2410.
• Rasschaert G, Houf K, Godard C, Wildemauwe C, Pastuszczak-Frak M & De Zutter L (2008)
Contamination of carcasses with Salmonella during poultry slaughter. Journal of food
protection 71: 146-152.
• Regalado NG, Martin G & Antony SJ (2009) Acinetobacter lwoffii: Bacteremia associated with
acute gastroenteritis. Travel Medicine and Infectious Disease 7: 316-317.
• Regulation (EC) No 258/97 of the European parliament and of the council of 27 January 1997
concerning novel foods and novel food ingredients, in: E.p.a.o.t. council (Ed.), EC 259/97,
(1997).
• Reiner A, Yekutieli D & Benjamini Y (2003) Identifying differentially expressed genes using false
discovery rate controlling procedures. Bioinformatics 19: 368-375
• Remenant B, Jaffrès E, Dousset X, Pilet M-F & Zagorec M (2015) Bacterial spoilers of food:
Behavior, fitness and functional properties. Food Microbiology 45, Part A: 45-53.
• Rimaux T, Rivière A, Illeghems K, Weckx S, De Vuyst L & Leroy F (2012) Expression of the
arginine deiminase pathway genes in Lactobacillus sakei is strain dependent and is affected by
the environmental pH. Applied and Environmental Microbiology. 78(14): 4874–4883.
• Robin JD, Ludlow AT, LaRanger R, Wright WE & Shay JW (2016) Comparison of DNA
Quantification Methods for Next Generation Sequencing. Scientific reports 6: 24067.
• Roh SW, Kim KH, Nam YD, Chang HW, Park EJ & Bae JW (2010) Investigation of archaeal and
bacterial diversity in fermented seafood using barcoded pyrosequencing. International Society
for Microbial Ecology Journal 4: 1-16.
• Rohonczy K, Rantsiou K & Cocolin L (2013) Modified enrichment strategies coupled with
molecular and conventional methods to detect and quantify Campylobacter jejuni in chicken
meat from the market. Journal of Food Safety 33: 497-502.
• Ross MG, Russ C, Costello M, Hollinger A, Lennon NJ, Hegarty R, Nusbaum C & Jaffe DB (2013)
Characterizing and measuring bias in sequence data. Genome Biology 14: R51.
• Rossen L, Nørskov P, Holmstrøm K & Rasmussen OF (1992) Inhibition of PCR by components
of food samples, microbial diagnostic assays and DNA-extraction solutions. International
Journal of Food Microbiology 17: 37-45.
• Rouger A, Remenant B, Prévost H & Zagorec M (2017) A method to isolate bacterial
communities and characterize ecosystems from food products: Validation and utilization as a
reproducible chicken meat model. International Journal of Food Microbiology 247: 38-47.
• Russell SM (2008) The Effect of an acidic, copper sulfate-based commercial sanitizer on
indicator, pathogenic, and spoilage bacteria associated with broiler chicken carcasses when
applied at various intervention points during poultry processing. Poultry Science 87: 1435-
1440.
S

A.Rouger 2017 Références bibliographiques
224
• Säde E, Murros A & Björkroth J (2013) Predominant enterobacteria on modified-atmosphere
packaged meat and poultry. Food Microbiology 34: 252-258.
• Saint-Cyr MJ, Guyard-Nicodème M, Messaoudi S, Chemaly M, Cappelier J-M, Dousset X &
Haddad N (2016) Recent Advances in Screening of Anti-Campylobacter Activity in Probiotics
for Use in Poultry. Frontiers in Microbiology 7: 553.
• Sakala RM, Kato Y, Hayashidani H, Murakami M, Kaneuchi C & Ogawa M (2002) Lactobacillus
fuchuensis sp. nov., isolated from vacuum-packaged refrigerated beef. International Journal of
Systematic and Evolutionary Microbiology 52: 1151-1154.
• Sakamoto N, Tanaka S, Sonomoto K & Nakayama J (2011) 16S rRNA pyrosequencing-based
investigation of the bacterial community in nukadoko, a pickling bed of fermented rice bran.
International Journal of Food Microbiology 144: 352-359.
• Samant SS, Crandall PG, O'Bryan C, Lingbeck JM, Martin EM & Seo HS (2015) Sensory impact
of chemical and natural antimicrobials on poultry products: a review. Poultry science 94(7):
1699-710
• Sanger F, Nicklen S & Coulson AR (1977) DNA sequencing with chain-terminating inhibitors.
Proceedings of the National Academy of Sciences 74: 5463-5467.
• Schloss PD, Westcott SL, Ryabin T, Hall JR, Hartmann M, Hollister EB, Lesniewski RA, Oakley BB,
Parks DH, Robinson CJ, Sahl JW, Stres B, Thallinger GG, Van Horn DJ & Weber CF (2009)
Introducing mothur: open-source, platform-independent, community-supported software for
describing and comparing microbial communities. Applied and Environmental Microbiology
75: 7537-7541.
• Seemann T (2014) Prokka: rapid prokaryotic genome annotation. Bioinformatics 30: 2068-
2069.
• Siegwald L, Touzet H, Lemoine Y, Hot D, Audebert C & Caboche S (2017) Assessment of
common and emerging bioinformatics pipelines for targeted metagenomics. Plos One 12:
e0169563.
• Simoyi MF, Falkenstein E, Van Dyke K, Blemings KP & Klandorf H (2003) Allantoin, the oxidation
product of uric acid is present in chicken and turkey plasma. Comparative biochemistry and
physiology 135: 325-335.
• Smolander M, Alakomi H-L, Ritvanen T, Vainionpää J & Ahvenainen R (2004) Monitoring of the
quality of modified atmosphere packaged broiler chicken cuts stored in different temperature
conditions. A. Time–temperature indicators as quality-indicating tools. Food Control 15: 217-
229.
• Sorroza L, Padilla D, Acosta F, Roman L, Grasso V, Vega J & Real F (2012) Characterization of
the probiotic strain Vagococcus fluvialis in the protection of European sea bass (Dicentrarchus
labrax) against vibriosis by Vibrio anguillarum. Veterinary microbiology 155: 369-373.
• Stanborough T, Fegan N, Powell SM, Tamplin M & Chandry PS (2017) Insight into the genome
of Brochothrix thermosphacta, a problematic meat spoilage bacterium. Applied and
Environmental Microbiology 83.
• Stanley D, Geier M, Hughes R, Denman S & Moore R (2013) Highly variable microbiota
development in the chicken gastrointestinal tract. PLoS One 8.
• Stanley D, Hughes RJ & Moore RJ (2014) Microbiota of the chicken gastrointestinal tract:
influence on health, productivity and disease. Applied Microbiology and Biotechnology 98:
4301-4310.

A.Rouger 2017 Références bibliographiques
225
• Stentz R, Cornet M, Chaillou S, Zagorec M (2001) Adaptation of Lactobacillus sakei to meat: a
new regulatory mechanism of ribose utilization?. Le Lait, INRA Editions, 2001, 81(1-2):131-138.
• Stock I, Grüger T & Wiedemann B (2000) Natural antibiotic susceptibility of Rahnella aquatilis
and R. aquatilis-related strains. Journal of Chemotherapy 12: 30-39.
• Stokell JR & Steck TR (2001) Viable but Nonculturable Bacteria. John Wiley & Sons, Ltd,
10.1002/9780470015902.a0000407.pub2.
• Stoops J, Ruyters S, Busschaert P, Spaepen R, Verreth C, Claes J, Lievens B & Van Campenhout
L (2015) Bacterial community dynamics during cold storage of minced meat packaged under
modified atmosphere and supplemented with different preservatives. Food Microbiology 48:
192-199.
• Szczawińska ME, Thayer DW & Phillips JG (1991) Fate of unirradiated Salmonella in irradiated
mechanically deboned chicken meat. International Journal of Food Microbiology 14: 313-324.
T
• Taberlet P, Coissac E, Pompanon F, Brochmann C & Willerslev E (2012) Towards next-
generation biodiversity assessment using DNA metabarcoding. Molecular Ecology 21: 2045–
2050.
• Teixeira LM, Carvalho MG, Merquior VL, Steigerwalt AG, Brenner DJ & Facklam RR (1997)
Phenotypic and genotypic characterization of Vagococcus fluvialis, including strains isolated
from human sources. Journal of clinical microbiology 35: 2778-2781.
• Tomczak H & Smuszkiewicz P (2014) A rarely isolated micro-organism, Budvicia aquatica,
cultured from urine of a patient with Guillain-Barré syndrome. JMM Case Reports 1, DOI
10.1099/jmmcr.0.001503
• Tuncer B & Sireli UT (2008) Microbial growth on broiler carcasses stored at different
temperatures after air- or water-chilling. Poultry Science 87: 793-799.
• Tyler AD, Christianson S, Knox NC, Mabon P, Wolfe J, Van Domselaar G, Graham MR & Sharma
MK (2016) Comparison of Sample Preparation Methods Used for the Next-Generation
Sequencing of Mycobacterium tuberculosis. PLoS ONE 11: e0148676.
V
• Valdes N, Soto P, Cottet L, Alarcon P, Gonzalez A, Castillo A, Corsini G & Tello M (2015) Draft
genome sequence of Janthinobacterium lividum strain MTR reveals its mechanism of
capnophilic behavior. Standards in Genomic Sciences 10: 110.
• van Dijk EL, Jaszczyszyn Y & Thermes C (2014) Library preparation methods for next-generation
sequencing: tone down the bias. Experimental cell research 322: 12-20.
• van Nierop W, Duse AG, Marais E, Aithma N, Thothobolo N, Kassel M, Stewart R, Potgieter A,
Fernandes B, Galpin JS & Bloomfield SF (2005) Contamination of chicken carcasses in Gauteng,
South Africa, by Salmonella, Listeria monocytogenes and Campylobacter. International Journal
of Food Microbiology 99: 1-6.
• Vandamme P, Dewhirst FE, Paster BJ & On SLW (2005) CLASS V. Epsilon Proteobacteria p. 1147-
1160. In Boone D.R., Castenholz R.W., Garrity G.M., Brenner D.J., Krieg N.R., Staley J.T. (ed.),
Bergey's Manual of Systematic Bacteriology, vol. 2. Springer, USA.
• Vela AI, Collins MD, Latre MV, Mateos A, Moreno MA, Hutson R, Domínguez L & Fernández-
Garayzábal JF (2003) Psychrobacter pulmonis sp. nov., isolated from the lungs of lambs.
International Journal of Systematic and Evolutionary Microbiology 53: 415-419.

A.Rouger 2017 Références bibliographiques
226
• Veluz GA, Pitchiah S, Alvarado CZ (2012) Attachment of Salmonella serovars and Listeria
monocytogenes to stainless steel and plastic conveyor belts Poultry Science 91: 2004–2010
• Vihavainen E, Lundstrom HS, Susiluoto T, Koort J, Paulin L, Auvinen P & Björkroth, KJ (2007)
Role of broiler carcasses and processing plant air in contamination of modified-atmosphere-
packaged broiler products with psychrotrophic lactic acid bacteria. Applied and Environmental
Microbiology 73: 1136-1145.
• Villani F, Casaburi A, Pennacchia C, Filosa L, Russo F & Ercolini D (2007) Microbial ecology of
the soppressata of Vallo di Diano, a traditional dry fermented sausage from southern Italy, and
in vitro and in situ selection of autochthonous starter cultures. Applied and Environmental
Microbiology 73: 5453-5463.
• Vogel BF, Venkateswaran K, Satomi M & Gram L (2005) Identification of Shewanella baltica as
the Most Important H2S-Producing Species during Iced Storage of Danish Marine Fish. Applied
and Environmental Microbiology 71: 6689-6697.
• Waite DW & Taylor MW (2014) Characterizing the avian gut microbiota: membership, driving
influences, and potential function. Frontiers in microbiology 5: 223.
W
• Wang Y, Wu C, Zhang Q, Qi J, Liu H, Wang Y, He T, Ma L, Lai J, Shen Z, Liu Y & Shen J (2012)
Identification of New Delhi Metallo-β-lactamase 1 in Acinetobacter lwoffii of Food Animal
Origin. PLOS ONE 7: e37152.
• Wang GY, Wang HH, Han YW, Xing T, Ye KP, Xu XL & Zhou GH (2017) Evaluation of the spoilage
potential of bacteria isolated from chilled chicken in vitro and in situ. Food Microbiology 63:
139-146.
• Warsow CR, Orta-Ramirez A, Marks BP, Ryser ET & Booren AM (2008) Single directional
migration of Salmonella into marinated whole muscle turkey breast. Journal of Food Protection
71: 153-156.
• Wassenaar TM & Newell DG (2006) The genus Campylobacter. In Martin Dworkin S.F. (ed.),
The Prokaryotes. Vol. 7: Proteobacteria: delta and epsilon subclasses. deeply rooting bacteria.
Springer, USA. p. 119-138
• Waters AE, Contente-Cuomo T, Buchhagen J, Liu CM, Watson L, Pearce K, Foster JT, Bowers J,
Driebe EM, Engelthaler DM, Keim PS & Price LB (2011) Multidrug-Resistant Staphylococcus
aureus in US Meat and Poultry. Clinical Infectious Diseases 52: 1227–30.
• Weckx S, Allemeersch J, Van der Meulen R, Vrancken G, Huys G, Vandamme P, Van Hummelen
P & De Vuyst L (2011) Metatranscriptome analysis for insight into whole-ecosystem gene
expression during spontaneous wheat and spelt sourdough fermentations. Applied and
Environmental Microbiology 77: 618-626.
• Wilson IG (1997) Inhibition and facilitation of nucleic acid amplification. Applied and
Environmental Microbiology 63: 3741-3751.
• Wintzingerode F V., Göbel UB & Stackebrandt E (1997) Determination of microbial diversity in
environmental samples: pitfalls of PCR-based rRNA analysis. FEMS Microbiology Reviews 21:
213-229.
• Wright ES, Yilmaz LS & Noguera DR (2012) DECIPHER, a search-based approach to chimera
identification for 16S rRNA sequences. Applied and Environmental Microbiology 78: 717-725.

A.Rouger 2017 Références bibliographiques
227
• Wu L-H, Lu Z-M, Zhang X-J, Wang Z-M, Yu Y-J, Shi J-S & Xu Z-H (2017) Metagenomics reveals
flavour metabolic network of cereal vinegar microbiota. Food Microbiology 62: 23-31.
Y
• Yi H, Oh HM, Lee JH, Kim SJ & Chun J (2005) Flavobacterium antarcticum sp. nov., a novel
psychrotolerant bacterium isolated from the Antarctic. International Journal of Systematic and
Evolutionary Microbiology 55: 637-641.
• Younis G, Awad A, El-Gamal A & Hosni R (2016) Virulence properties and antimicrobial
susceptibility profiles of Klebsiella species recovered from clinically diseased broiler chicken.
Advances Animal Veterinary Sciences 410: 536-542.
• Yusop SM, O’Sullivan MG, Kerry JF & Kerry JP (2010) Effect of marinating time and low pH on
marinade performance and sensory acceptability of poultry meat. Meat Science 85(4): 657-
663
• Yuste J, Mor-Mur M, Capellas M, Guamis B & Pla R (1998) Microbiological quality of
mechanically recovered poultry meat treated with high hydrostatic pressure and nisin. Food
Microbiology 15: 407-414.
Z
• Zerbino DR (2010) Using the Velvet de novo assembler for short-read sequencing technologies.
10.1002/0471250953.bi1105s31.
• Zhang QQ, Han YQ, Cao JX, Xu XL, Zhou GH & Zhang WY (2012) The spoilage of air-packaged
broiler meat during storage at normal and fluctuating storage temperatures. Poultry Science
91: 208-214.

A.Rouger 2017 Références bibliographiques
228

A.Rouger 2017 Références bibliographiques
229

A.Rouger 2017 Références bibliographiques
230
Description and behavior of bacterial communities of chicken meat samples
stored under modified atmosphere packaging
Résumé
Contrôler les bactéries altérantes des aliments, notamment les produits carnés crus, est un enjeu majeur pour les industries agroalimentaires. Les conditions de stockage de la viande sous différentes atmosphères exercent une pression de sélection et modifient le comportement et le développement des communautés bactériennes initialement présentes. Des méthodes de séquençage à haut débit, utilisées pour caractériser différents écosystèmes microbiens, ont été appliquées pour étudier la dynamique des communautés bactériennes de la viande de poulet au cours du stockage. Nous avons développé une méthode pour constituer des écosystèmes microbiens standards dont la composition a été déterminée par pyroséquençage du gène de l’ARNr 16S. La présence de Brochothrix thermosphacta et de Pseudomonas parmi les espèces dominantes a été confirmée et nous avons mis en évidence que Shewanella et Carnobacterium étaient sous dominantes. Nous avons sélectionné deux écosystèmes pour effectuer des challenges tests reproductibles sur de la viande de poulet conservée sous 3 atmosphères couramment utilisées. Une analyse métatranscriptomique et métagénomique a été réalisée afin de savoir “Quelles bactéries étaient présentes ?”, “Qu’étaient-elles capables de faire?” et “Qu’exprimaient-elles?” suivant les conditions. Nous avons ainsi pu évaluer l’impact des mélanges gazeux sur la dynamique bactérienne et les fonctions exprimées par les bactéries suivant les contaminants initiaux. Cela nous donne des pistes pour fournir des indications afin d’optimiser la conservation de la viande en contrôlant les écosystèmes microbiens. Mots clés Viande de poulet; Ecologie microbienne; Séquençage à haut débit; Pyroséquençage; Métatranscriptomique; Métagénomique; Atmosphère protectrice modifiée; Altération.
Abstract
Controlling spoilage microorganisms, especially in raw meat products, is challenging for the food industry. Storage conditions such as modified atmosphere packaging (MAP) have selective effects on the microbiota dynamics. Thanks to the recent development of next generation sequencing methods widely used for characterizing microbes in different ecosystems, we studied bacterial community dynamics during chicken meat storage. We developed a method to constitute a standard meat microbial ecosystem hosting known bacterial species previously described by 16S rRNA sequencing. Our results confirmed the presence of Brochothrix thermosphacta and Pseudomonas and we also showed the presence of subdominant species as Shewanella and Carnobacterium. We selected 2 bacterial communities enabling reproducible challenge tests on meat during 9 days of storage at 4°C under 3 different atmospheres currently used in the industry. Metatranscriptomic and metagenomic analyses were performed to know “Who is there?”, “What can they do?” and “What are they expressing?” depending on the gaseous mixtures and on the initial microbiota. Consequently, we could evaluate the impact of storage atmosphere on the microbiotas dynamics and on the functions the bacteria expressed, depending on the storage condition and on the nature of the bacterial communities present. This led to indications of optimized storage conditions of poultry meat by managing their ecosystems. Key Words Chicken meat; Microbial ecology; Next generation sequencing; Pyrosequencing; Metatranscriptomic; Metagenomic; Modified
atmosphere packaging; Spoilage.
L’Université Bretagne Loire
Description et comportement des communautés bactériennes de la viande de poulet conservée sous atmosphère protectrice
Amélie ROUGER
Related Documents