Amlak Finance PJSC Investor Presentation September 2017

Welcome message from author
This document is posted to help you gain knowledge. Please leave a comment to let me know what you think about it! Share it to your friends and learn new things together.
Transcript
Amlak Finance PJSC
Investor Presentation
September 2017
This presentation has been produced by the management of Amlak Finance PJSC (“Amlak” or the “Company”), solely for use at various teleconference
arranged for existing/prospective institutional investors and for their clients/potential clients and shall not be reproduced or redistributed, in whole or in part,
to any other person without Company’s written consent.
This presentation may contain certain forward-looking statements relating to the plans, strategies, business prospects, financial performance and results of
the Company and/or the industry in which it operates. Forward-looking statements concern future circumstances and results and other statements that are
not historical facts, sometimes identified by the words “believes”, “expects”, “predicts”, “intends”, “projects”, “plans”, “estimates”, “aims”, “foresees”,
“anticipates”, “targets”, and similar expressions. Such forward-looking statements including assumptions, opinions and views of the Company are solely
opinions and forecasts which are subject to risks, uncertainties and other factors that may cause actual events to differ materially from any anticipated
development. None of the Company or the officers or the employees provide any assurance that the assumptions underlying such forward-looking
statements are free from errors nor does any of them accept any responsibility for the future accuracy of the opinions expressed in this presentation or the
actual occurrence of the forecasted developments. The Company assumes no obligation to update any forward-looking statements or to conform these
forward-looking statements to the Company’s
actual results.
By participating, attending or receiving this presentation you acknowledge that you will be solely responsible for your own assessment of the market and the
market position of the Company and that you will conduct your own analysis and be solely responsible for forming your own view of the potential future
performance of the Company’s business. Neither the delivery of this presentation nor any further discussions of the Company with any of the recipients
shall, under any circumstances, create any implication that there has been no change in the affairs of the Company since such period or date.
This Presentation is intended for information purposes only and does not constitute or form part of an offer for sale or subscription or an invitation or
solicitation of an offer to subscribe for or purchase securities of any kind and neither this document nor anything contained herein shall form the basis of any
contract or commitment from any party whatsoever.
This presentation has been prepared by Amlak Finance PJSC (“Amlak”) and reflects the management’s current expectations or strategy concerning future
events and are subject to known and unknown risks and uncertainties. No representation or warranty, express or implied, is made or given by or on behalf of
Amlak or any of its respective members, directors, officers or employees or any other person as to the accuracy, completeness or fairness of the information
or opinions contained in or discussed at this presentation.
2
Disclaimer
Sections
Amlak at a Glance 1
Full Year Financial Highlights 4
Awards 5
Appendix 6
Company Profile 4
Through The Years 5
Key Strategies 7
Strategic Enablers 8
Strategic Focus 2
Business Overview 9
Full Year 2016 Consolidated Statement of Income 28
Full Year 2016 Consolidated Statement of Financial Position 29
Stakeholders Priorities 31
Products and Services 32
General Economic Indicators 33 - 37
Group Income Statement 17
Group Balance Sheet 19
Financial Ratios 21
2015 – 2017 Awards 24
Board of Directors 30
2017 Financial Highlights 3
Group Income Statement 14
Group Balance Sheet 15
Segment Strategy – REI 11
Segment Strategy – CFI 12
Segment Strategy – REF 10
Interim Consolidated Statement of Income 26
Interim Consolidated Statement of Financial Position 27
Contact Investor Relations 7 3
Amlak at a Glance Company Profile
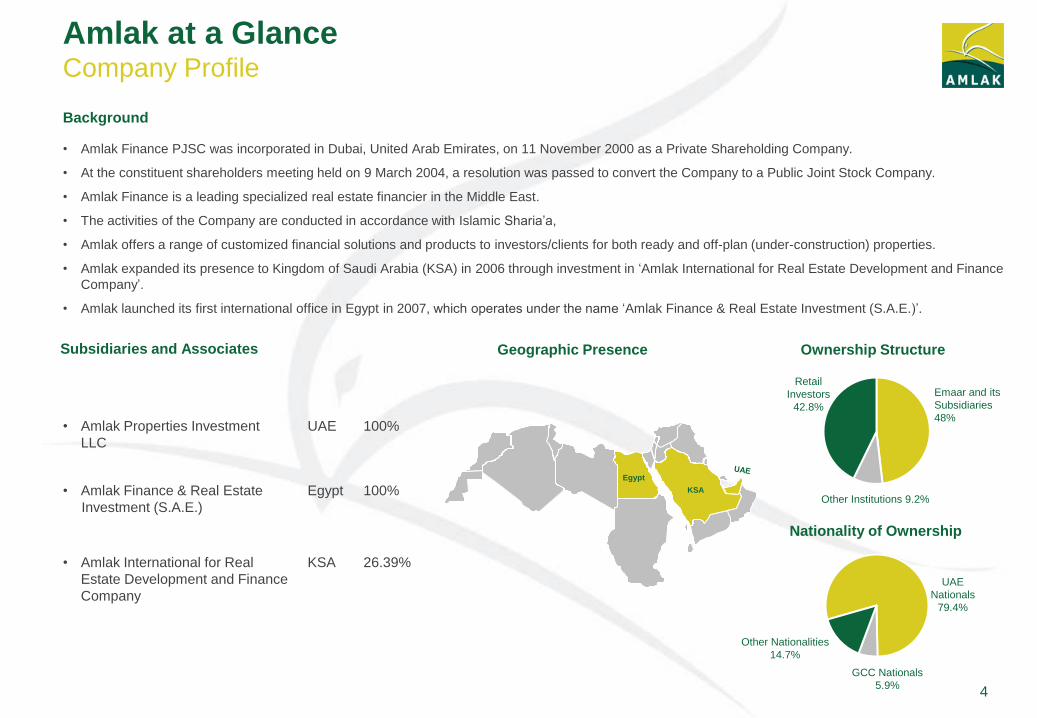
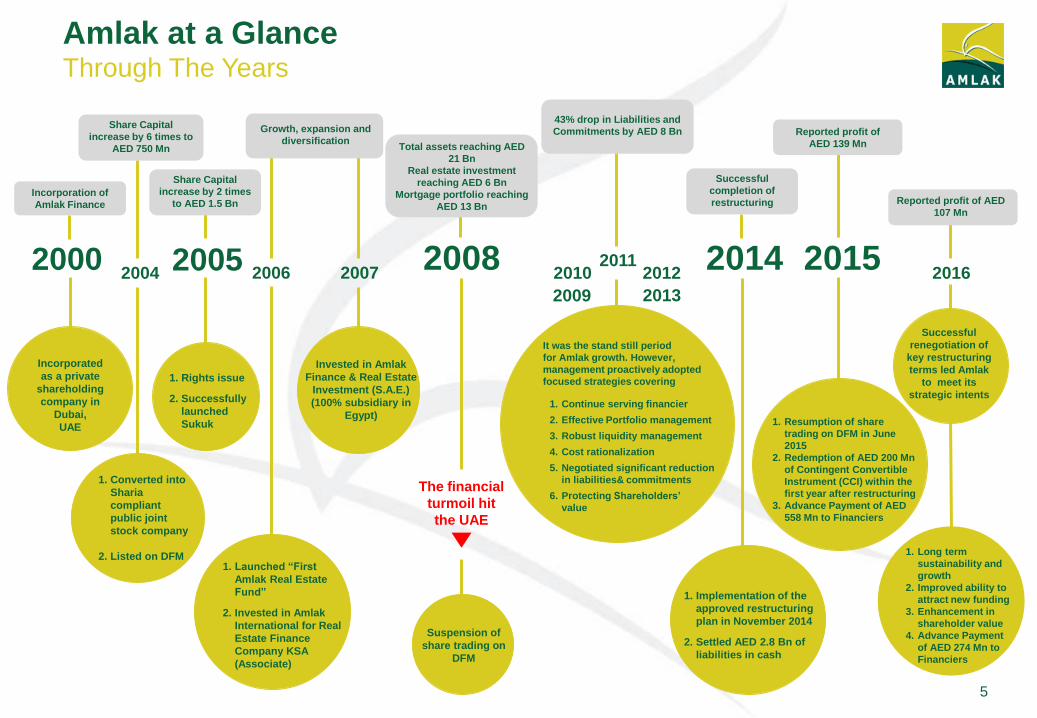
• Amlak Finance PJSC was incorporated in Dubai, United Arab Emirates, on 11 November 2000 as a Private Shareholding Company.
• At the constituent shareholders meeting held on 9 March 2004, a resolution was passed to convert the Company to a Public Joint Stock Company.
• Amlak Finance is a leading specialized real estate financier in the Middle East.
• The activities of the Company are conducted in accordance with Islamic Sharia’a,
• Amlak offers a range of customized financial solutions and products to investors/clients for both ready and off-plan (under-construction) properties.
• Amlak expanded its presence to Kingdom of Saudi Arabia (KSA) in 2006 through investment in ‘Amlak International for Real Estate Development and Finance
Company’.
• Amlak launched its first international office in Egypt in 2007, which operates under the name ‘Amlak Finance & Real Estate Investment (S.A.E.)’.
Background
Geographic Presence
• Amlak Properties Investment
LLC
UAE 100%
• Amlak Finance & Real Estate
Investment (S.A.E.)
Egypt 100%
• Amlak International for Real
Estate Development and Finance
Company
KSA 26.39%
Subsidiaries and Associates
Retail
Investors
42.8%
Emaar and its
Subsidiaries
48%
UAE
Nationals
79.4%
Other Nationalities
14.7%
GCC Nationals
5.9%
Ownership Structure
Nationality of Ownership
Other Institutions 9.2%
Egypt
KSA
4
1. Long term
sustainability and
growth
2. Improved ability to
attract new funding
3. Enhancement in
shareholder value
4. Advance Payment
of AED 274 Mn to
Financiers
5
2000 2004
2005 2006 2007
2008 2009
2010 2011
2012
2013
2014 2015 2016
1. Converted into
Sharia
compliant
public joint
stock company
2. Listed on DFM
1. Rights issue
2. Successfully
launched
Sukuk
1. Launched “First
Amlak Real Estate
Fund”
2. Invested in Amlak
International for Real
Estate Finance
Company KSA
(Associate)
Invested in Amlak
Finance & Real Estate
Investment (S.A.E.)
(100% subsidiary in
Egypt)
The financial
turmoil hit
the UAE
1. Implementation of the
approved restructuring
plan in November 2014
2. Settled AED 2.8 Bn of
liabilities in cash
1. Resumption of share
trading on DFM in June
2015
2. Redemption of AED 200 Mn
of Contingent Convertible
Instrument (CCI) within the
first year after restructuring
3. Advance Payment of AED
558 Mn to Financiers
Successful
renegotiation of
key restructuring
terms led Amlak
to meet its
strategic intents
Incorporated
as a private
shareholding
company in
Dubai,
UAE
Reported profit of
AED 139 Mn
Reported profit of AED
107 Mn
Total assets reaching AED
21 Bn
Real estate investment
reaching AED 6 Bn
Mortgage portfolio reaching
AED 13 Bn
Growth, expansion and
diversification
Share Capital
increase by 6 times to
AED 750 Mn
Amlak at a Glance Through The Years
Share Capital
increase by 2 times
to AED 1.5 Bn
It was the stand still period
for Amlak growth. However,
management proactively adopted
focused strategies covering
1. Continue serving financier
2. Effective Portfolio management
3. Robust liquidity management
4. Cost rationalization
5. Negotiated significant reduction
in liabilities& commitments
6. Protecting Shareholders’
value
43% drop in Liabilities and
Commitments by AED 8 Bn
Suspension of
share trading on
DFM
Incorporation of
Amlak Finance
Successful
completion of
restructuring
Strategic
Focus
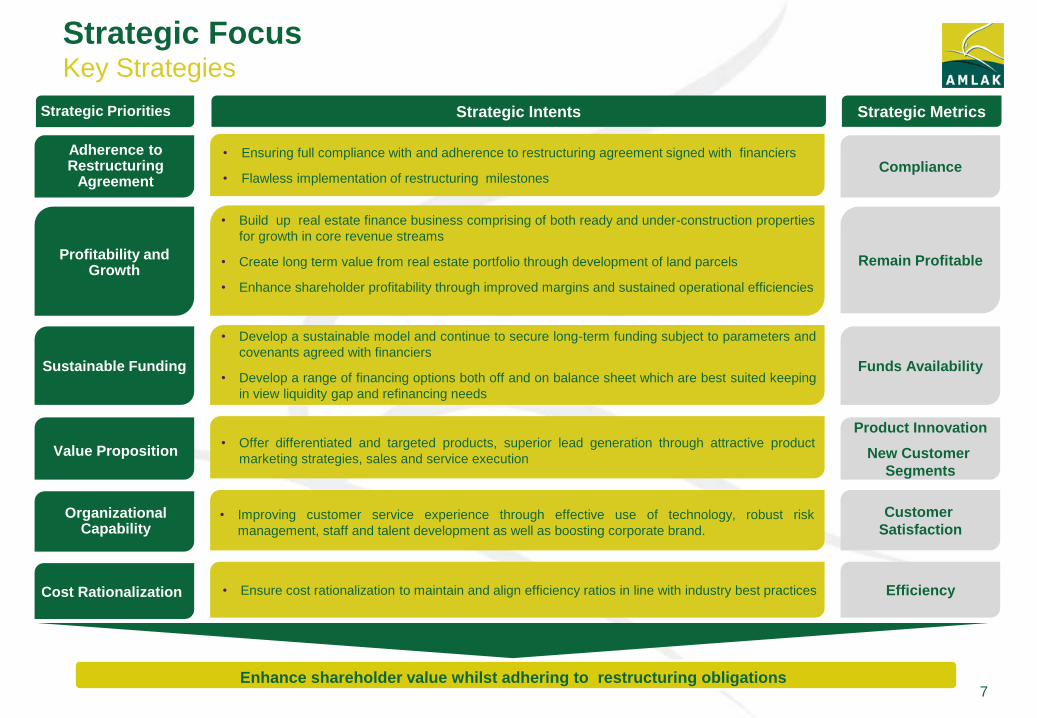
Strategic Focus Key Strategies
7
• Ensuring full compliance with and adherence to restructuring agreement signed with financiers
• Flawless implementation of restructuring milestones
Compliance
Remain Profitable
Funds Availability
Product Innovation
New Customer
Segments
Profitability and Growth
Sustainable Funding
Adherence to Restructuring
Agreement
Value Proposition
Customer
Satisfaction Organizational
Capability
• Ensure cost rationalization to maintain and align efficiency ratios in line with industry best practices Efficiency Cost Rationalization
• Build up real estate finance business comprising of both ready and under-construction properties
for growth in core revenue streams
• Create long term value from real estate portfolio through development of land parcels
• Enhance shareholder profitability through improved margins and sustained operational efficiencies
• Develop a sustainable model and continue to secure long-term funding subject to parameters and
covenants agreed with financiers
• Develop a range of financing options both off and on balance sheet which are best suited keeping
in view liquidity gap and refinancing needs
• Offer differentiated and targeted products, superior lead generation through attractive product
marketing strategies, sales and service execution
• Improving customer service experience through effective use of technology, robust risk
management, staff and talent development as well as boosting corporate brand.
Enhance shareholder value whilst adhering to restructuring obligations
Strategic Intents Strategic Metrics Strategic Priorities
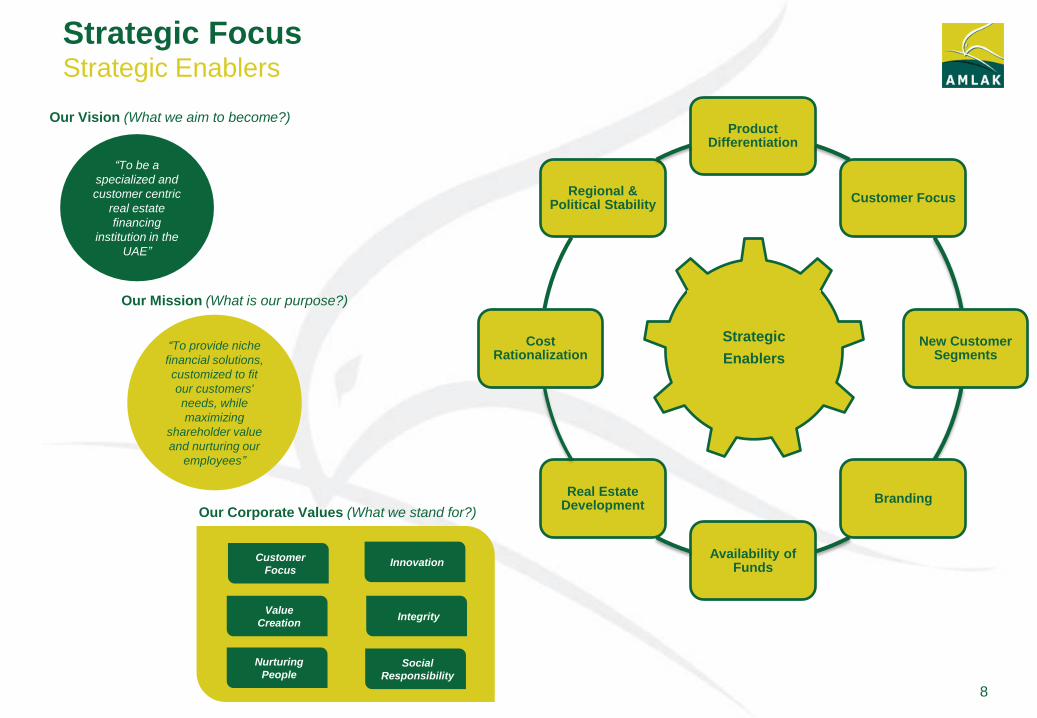
Strategic Focus Strategic Enablers
8
Product Differentiation
Customer Focus
New Customer Segments
Branding
Availability of Funds
Real Estate Development
Cost Rationalization
Regional & Political Stability
Strategic
Enablers “To provide niche
financial solutions,
customized to fit
our customers'
needs, while
maximizing
shareholder value
and nurturing our
employees”
Our Mission (What is our purpose?)
Our Vision (What we aim to become?)
“To be a
specialized and
customer centric
real estate
financing
institution in the
UAE”
Our Corporate Values (What we stand for?)
Customer
Focus Innovation
Value
Creation Integrity
Nurturing
People Social
Responsibility
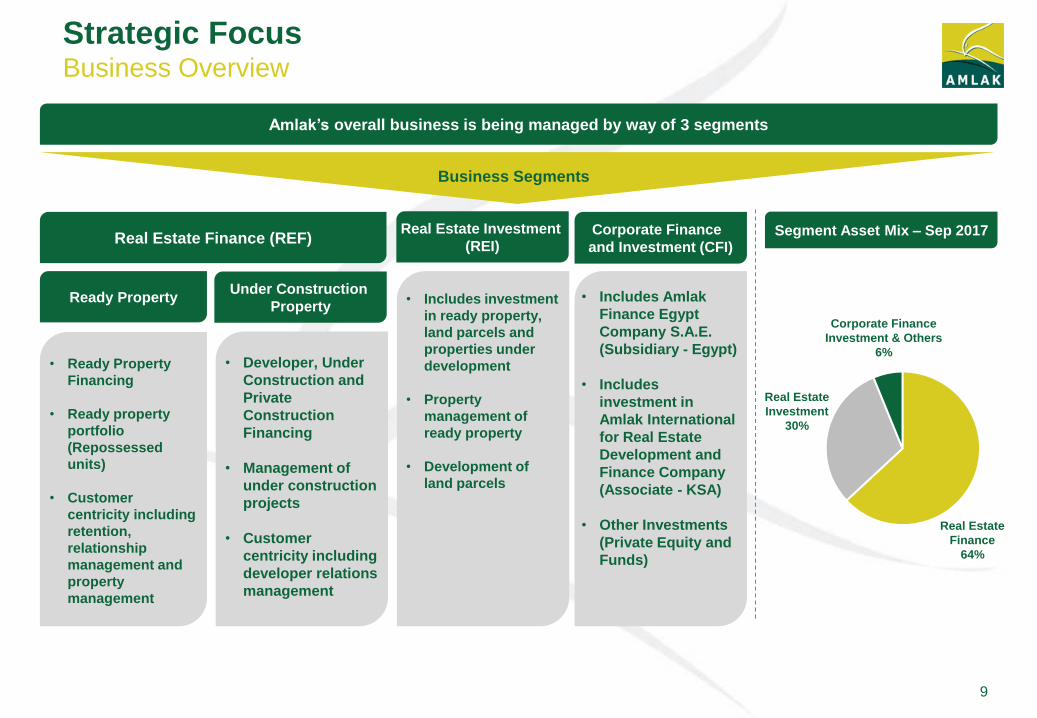
Strategic Focus Business Overview
Amlak’s overall business is being managed by way of 3 segments
Real Estate Investment
(REI) Real Estate Finance (REF)
Corporate Finance
and Investment (CFI)
Ready Property Under Construction
Property
• Ready Property
Financing
• Ready property
portfolio
(Repossessed
units)
• Customer
centricity including
retention,
relationship
management and
property
management
• Developer, Under
Construction and
Private
Construction
Financing
• Management of
under construction
projects
• Customer
centricity including
developer relations
management
• Includes investment
in ready property,
land parcels and
properties under
development
• Property
management of
ready property
• Development of
land parcels
• Includes Amlak
Finance Egypt
Company S.A.E.
(Subsidiary - Egypt)
• Includes
investment in
Amlak International
for Real Estate
Development and
Finance Company
(Associate - KSA)
• Other Investments
(Private Equity and
Funds)
Business Segments
Segment Asset Mix – Sep 2017
Corporate Finance
Investment & Others
6%
Real Estate
Investment
30%
Real Estate
Finance
64%
9
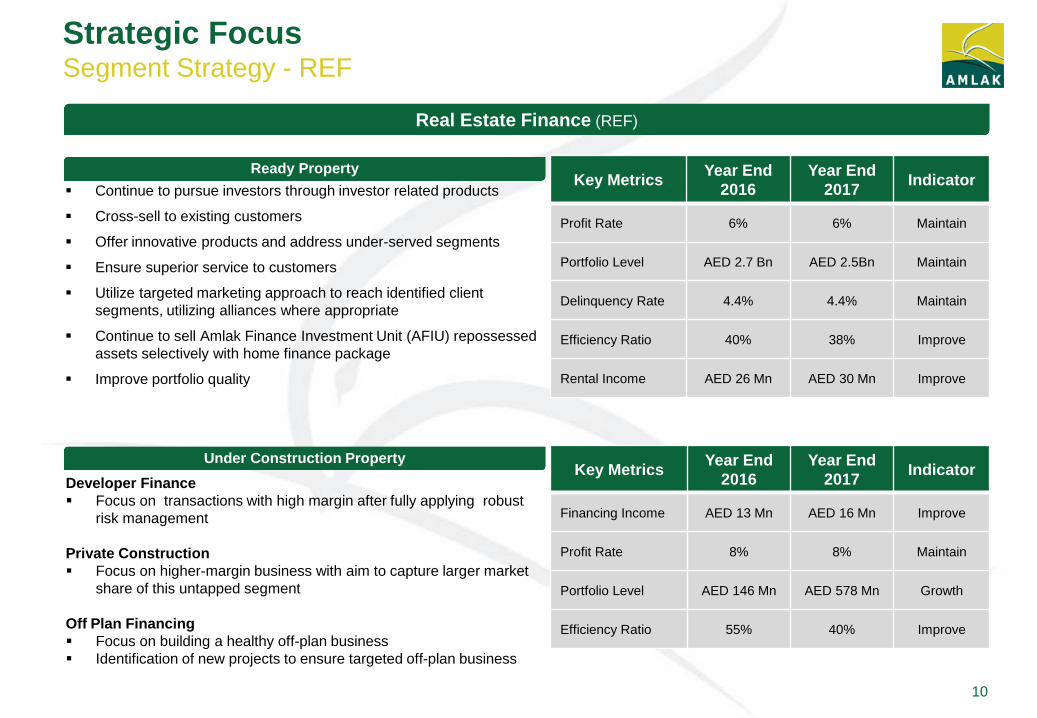
10
Ready Property
Continue to pursue investors through investor related products
Cross-sell to existing customers
Offer innovative products and address under-served segments
Ensure superior service to customers
Utilize targeted marketing approach to reach identified client
segments, utilizing alliances where appropriate
Continue to sell Amlak Finance Investment Unit (AFIU) repossessed
assets selectively with home finance package
Improve portfolio quality
Developer Finance
Focus on transactions with high margin after fully applying robust
risk management
Private Construction
Focus on higher-margin business with aim to capture larger market
share of this untapped segment
Off Plan Financing
Focus on building a healthy off-plan business
Identification of new projects to ensure targeted off-plan business
Real Estate Finance (REF)
Strategic Focus Segment Strategy - REF
Under Construction Property
Key Metrics Year End
2016
Year End
2017 Indicator
Profit Rate 6% 6% Maintain
Portfolio Level AED 2.7 Bn AED 2.5Bn Maintain
Delinquency Rate 4.4% 4.4% Maintain
Efficiency Ratio 40% 38% Improve
Rental Income AED 26 Mn AED 30 Mn Improve
Key Metrics Year End
2016
Year End
2017 Indicator
Financing Income AED 13 Mn AED 16 Mn Improve
Profit Rate 8% 8% Maintain
Portfolio Level AED 146 Mn AED 578 Mn Growth
Efficiency Ratio 55% 40% Improve
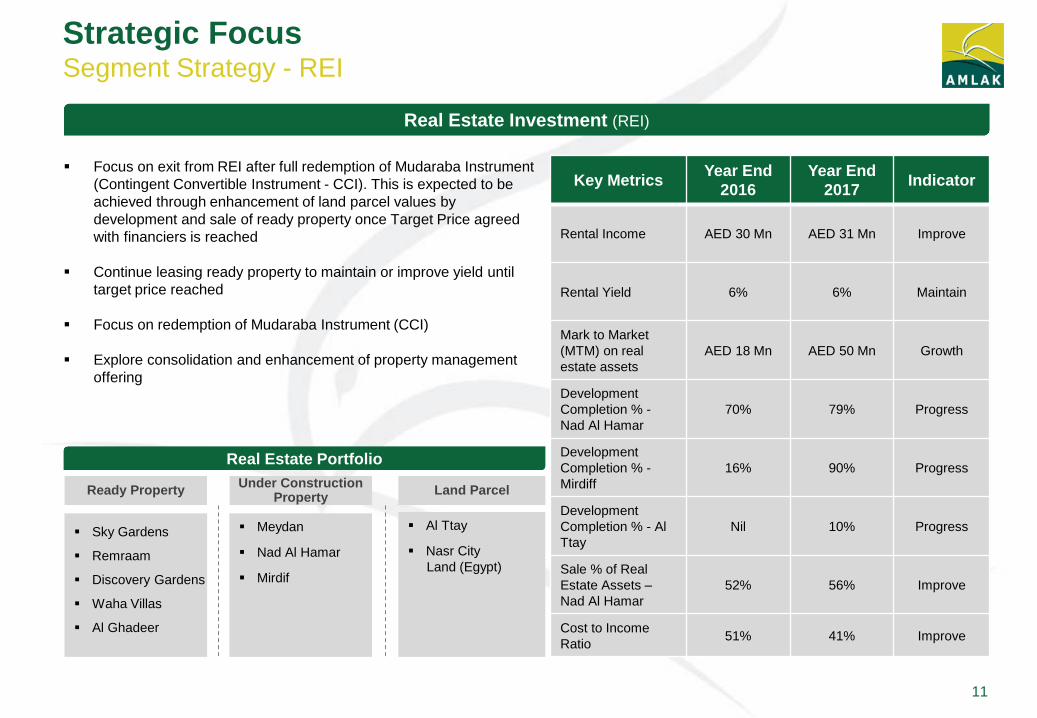
11
Focus on exit from REI after full redemption of Mudaraba Instrument
(Contingent Convertible Instrument - CCI). This is expected to be
achieved through enhancement of land parcel values by
development and sale of ready property once Target Price agreed
with financiers is reached
Continue leasing ready property to maintain or improve yield until
target price reached
Focus on redemption of Mudaraba Instrument (CCI)
Explore consolidation and enhancement of property management
offering
Real Estate Investment (REI)
Strategic Focus Segment Strategy - REI
Ready Property Under Construction
Property Land Parcel
Sky Gardens
Remraam
Discovery Gardens
Waha Villas
Al Ghadeer
Meydan
Nad Al Hamar
Mirdif
Al Ttay
Nasr City
Land (Egypt)
Real Estate Portfolio
Key Metrics Year End
2016
Year End
2017 Indicator
Rental Income AED 30 Mn AED 31 Mn Improve
Rental Yield 6% 6% Maintain
Mark to Market
(MTM) on real
estate assets
AED 18 Mn AED 50 Mn Growth
Development
Completion % -
Nad Al Hamar
70% 79% Progress
Development
Completion % -
Mirdiff
16% 90% Progress
Development
Completion % - Al
Ttay
Nil 10% Progress
Sale % of Real
Estate Assets –
Nad Al Hamar
52% 56% Improve
Cost to Income
Ratio 51% 41% Improve
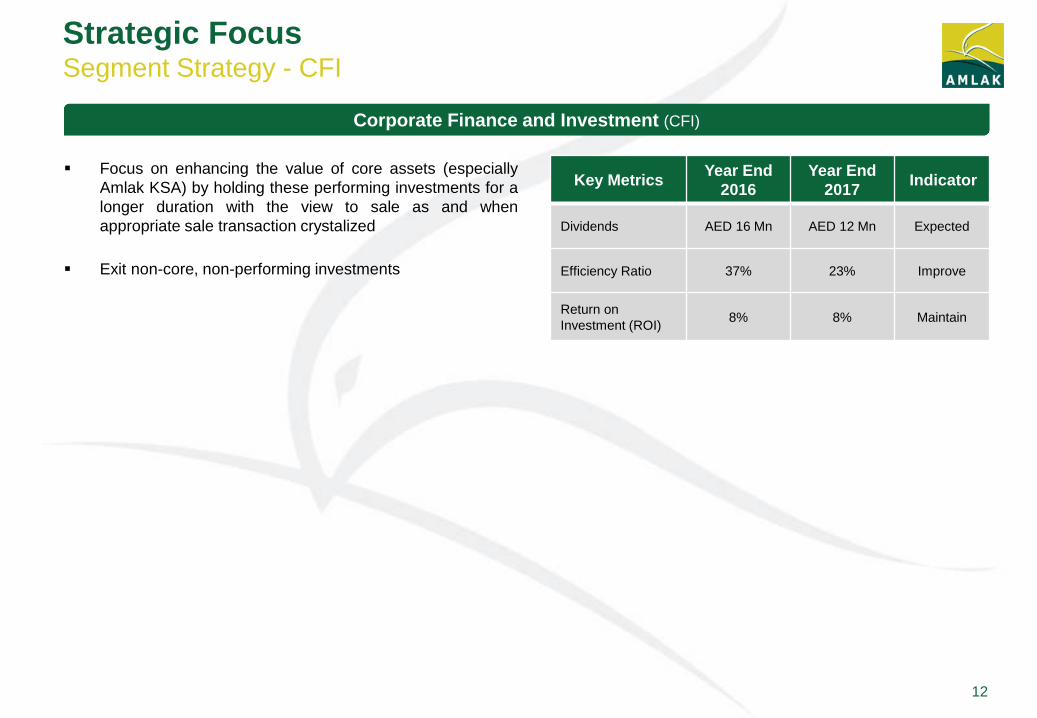
Focus on enhancing the value of core assets (especially
Amlak KSA) by holding these performing investments for a
longer duration with the view to sale as and when
appropriate sale transaction crystalized
Exit non-core, non-performing investments
Corporate Finance and Investment (CFI)
Strategic Focus Segment Strategy - CFI
Key Metrics Year End
2016
Year End
2017 Indicator
Dividends AED 16 Mn AED 12 Mn Expected
Efficiency Ratio 37% 23% Improve
Return on
Investment (ROI) 8% 8% Maintain
12

2017
Financial
Highlights
2017 Financial Highlights Group Income Statement
Highlights
Change in % Particulars
AED in Mn
14
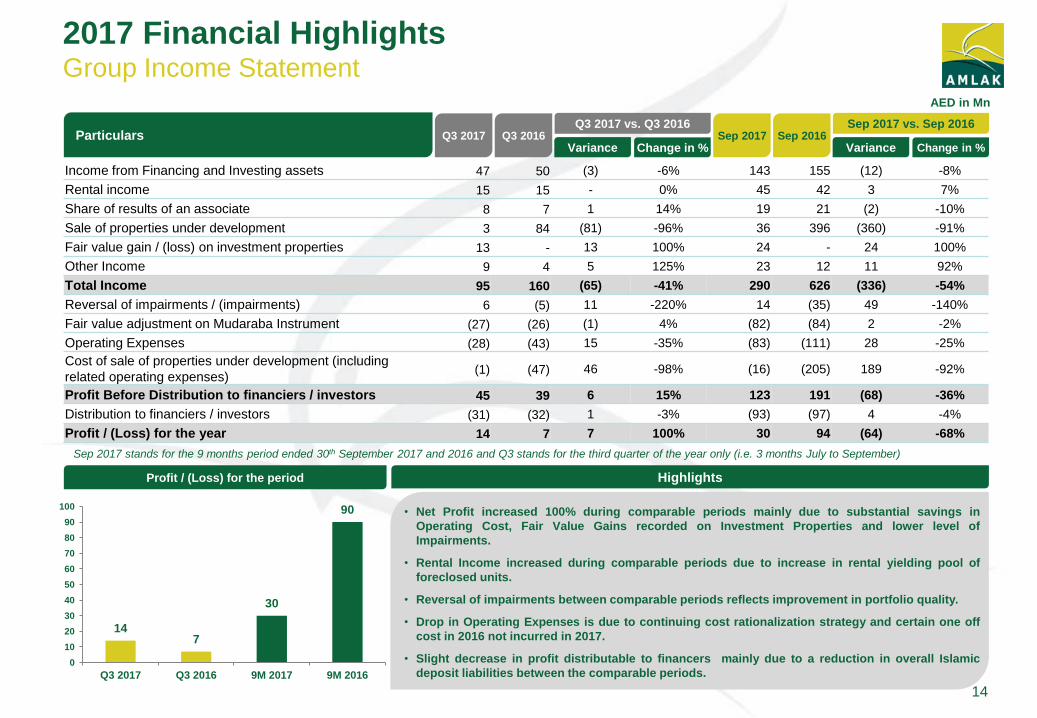
• Net Profit increased 100% during comparable periods mainly due to substantial savings in
Operating Cost, Fair Value Gains recorded on Investment Properties and lower level of
Impairments.
• Rental Income increased during comparable periods due to increase in rental yielding pool of
foreclosed units.
• Reversal of impairments between comparable periods reflects improvement in portfolio quality.
• Drop in Operating Expenses is due to continuing cost rationalization strategy and certain one off
cost in 2016 not incurred in 2017.
• Slight decrease in profit distributable to financers mainly due to a reduction in overall Islamic
deposit liabilities between the comparable periods.
Profit / (Loss) for the period
Variance Sep 2017 Sep 2016
Sep 2017 vs. Sep 2016
Change in % Variance Q3 2017 Q3 2016
Q3 2017 vs. Q3 2016
Sep 2017 stands for the 9 months period ended 30th September 2017 and 2016 and Q3 stands for the third quarter of the year only (i.e. 3 months July to September)
14 7
30
90
0
10
20
30
40
50
60
70
80
90
100
Q3 2017 Q3 2016 9M 2017 9M 2016
Income from Financing and Investing assets 47 50 (3) -6% 143 155 (12) -8%
Rental income 15 15 - 0% 45 42 3 7%
Share of results of an associate 8 7 1 14% 19 21 (2) -10%
Sale of properties under development 3 84 (81) -96% 36 396 (360) -91%
Fair value gain / (loss) on investment properties 13 - 13 100% 24 - 24 100%
Other Income 9 4 5 125% 23 12 11 92%
Total Income 95 160 (65) -41% 290 626 (336) -54%
Reversal of impairments / (impairments) 6 (5) 11 -220% 14 (35) 49 -140%
Fair value adjustment on Mudaraba Instrument (27) (26) (1) 4% (82) (84) 2 -2%
Operating Expenses (28) (43) 15 -35% (83) (111) 28 -25%
Cost of sale of properties under development (including
related operating expenses) (1) (47) 46 -98% (16) (205) 189 -92%
Profit Before Distribution to financiers / investors 45 39 6 15% 123 191 (68) -36%
Distribution to financiers / investors (31) (32) 1 -3% (93) (97) 4 -4%
Profit / (Loss) for the year 14 7 7 100% 30 94 (64) -68%
2017 Financial Highlights Group Balance Sheet
15
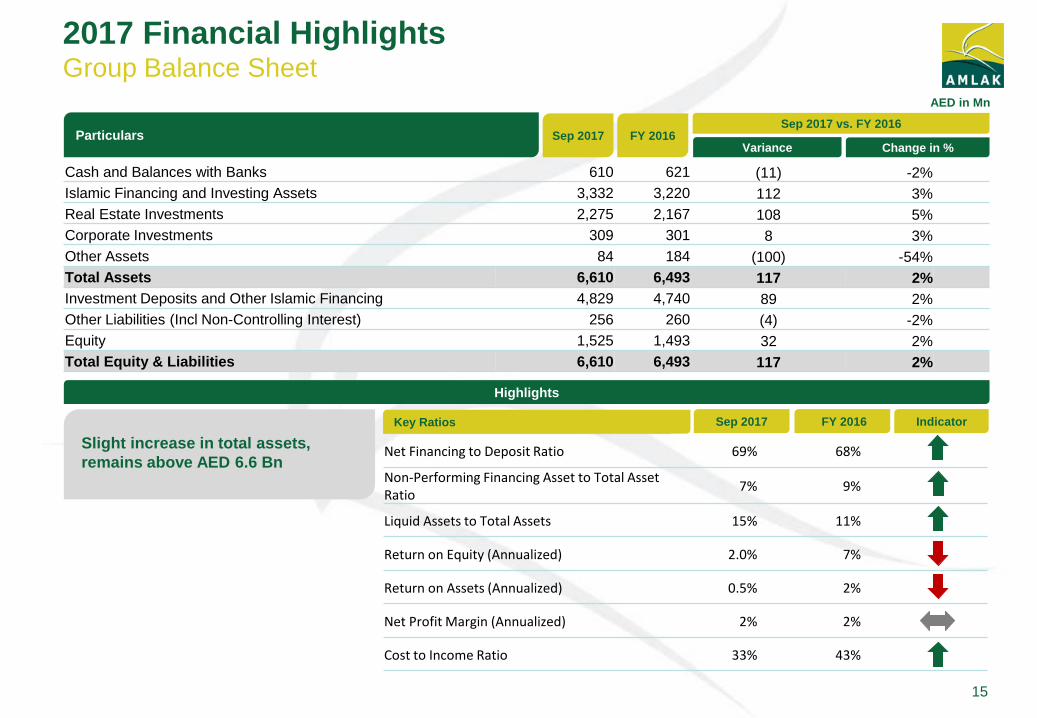
Slight increase in total assets,
remains above AED 6.6 Bn
Highlights
Net Financing to Deposit Ratio 69% 68%
Non-Performing Financing Asset to Total Asset Ratio
7% 9%
Liquid Assets to Total Assets 15% 11%
Return on Equity (Annualized) 2.0% 7%
Return on Assets (Annualized) 0.5% 2%
Net Profit Margin (Annualized) 2% 2%
Cost to Income Ratio 33% 43%
Key Ratios Sep 2017 FY 2016 Indicator
Sep 2017 FY 2016 Change in %
Sep 2017 vs. FY 2016 Particulars
AED in Mn
Variance
Cash and Balances with Banks 610 621 (11) -2%
Islamic Financing and Investing Assets 3,332 3,220 112 3%
Real Estate Investments 2,275 2,167 108 5%
Corporate Investments 309 301 8 3%
Other Assets 84 184 (100) -54%
Total Assets 6,610 6,493 117 2%
Investment Deposits and Other Islamic Financing 4,829 4,740 89 2%
Other Liabilities (Incl Non-Controlling Interest) 256 260 (4) -2%
Equity 1,525 1,493 32 2%
Total Equity & Liabilities 6,610 6,493 117 2%

Full Year
Financial
Highlights
Full Year Financial Highlights Group Income Statement
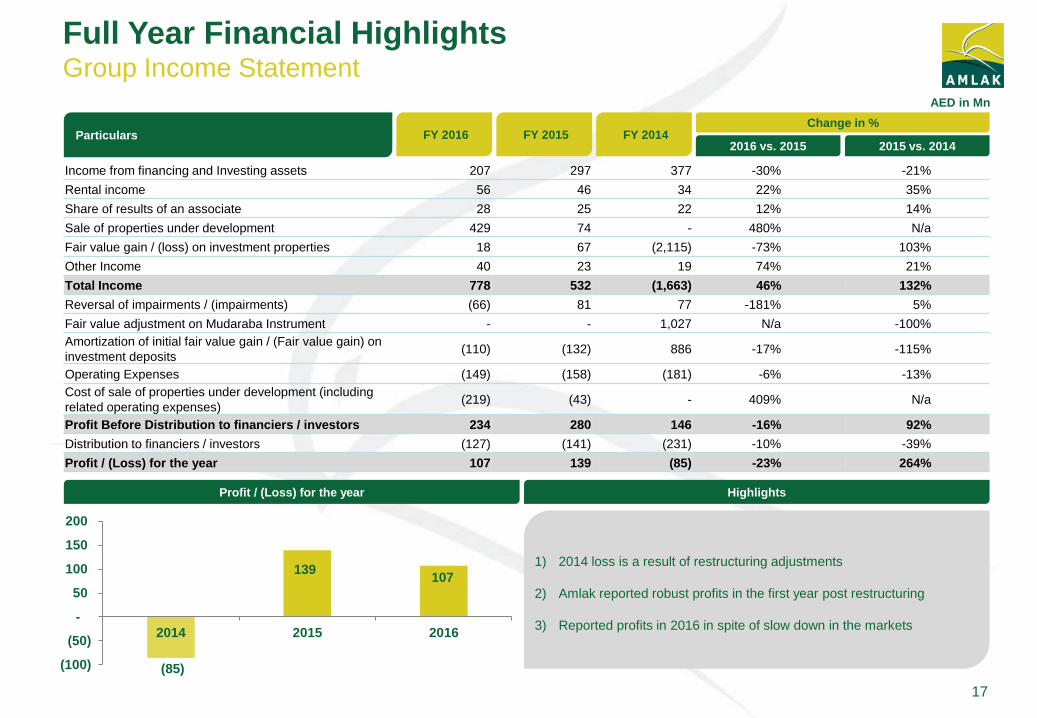
Income from financing and Investing assets 207 297 377 -30% -21%
Rental income 56 46 34 22% 35%
Share of results of an associate 28 25 22 12% 14%
Sale of properties under development 429 74 - 480% N/a
Fair value gain / (loss) on investment properties 18 67 (2,115) -73% 103%
Other Income 40 23 19 74% 21%
Total Income 778 532 (1,663) 46% 132%
Reversal of impairments / (impairments) (66) 81 77 -181% 5%
Fair value adjustment on Mudaraba Instrument - - 1,027 N/a -100%
Amortization of initial fair value gain / (Fair value gain) on
investment deposits (110) (132) 886 -17% -115%
Operating Expenses (149) (158) (181) -6% -13%
Cost of sale of properties under development (including
related operating expenses) (219) (43) - 409% N/a
Profit Before Distribution to financiers / investors 234 280 146 -16% 92%
Distribution to financiers / investors (127) (141) (231) -10% -39%
Profit / (Loss) for the year 107 139 (85) -23% 264%
Profit / (Loss) for the year
(85)
139 107
(100)
(50)
-
50
100
150
200
2014 2015 2016
Highlights
FY 2016 FY 2015 FY 2014 Change in %
2016 vs. 2015 2015 vs. 2014 Particulars
AED in Mn
17
1) 2014 loss is a result of restructuring adjustments
2) Amlak reported robust profits in the first year post restructuring
3) Reported profits in 2016 in spite of slow down in the markets
Full Year Financial Highlights Group Income Statement (cont’d)
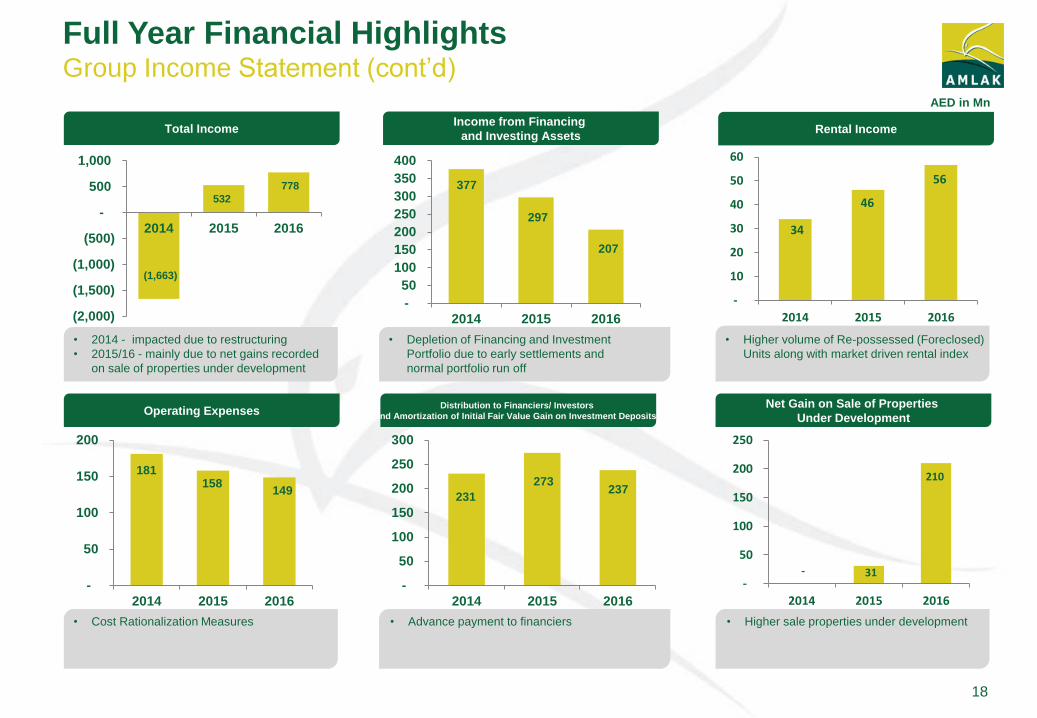
Total Income Income from Financing
and Investing Assets
Operating Expenses Distribution to Financiers/ Investors
and Amortization of Initial Fair Value Gain on Investment Deposits
Net Gain on Sale of Properties
Under Development
Rental Income
(1,663)
532
778
(2,000)
(1,500)
(1,000)
(500)
-
500
1,000
2014 2015 2016
377
297
207
-
50
100
150
200
250
300
350
400
2014 2015 2016
34
46
56
-
10
20
30
40
50
60
2014 2015 2016
- 31
210
-
50
100
150
200
250
2014 2015 2016
181 158
149
-
50
100
150
200
2014 2015 2016
AED in Mn
• 2014 - impacted due to restructuring
• 2015/16 - mainly due to net gains recorded
on sale of properties under development
• Depletion of Financing and Investment
Portfolio due to early settlements and
normal portfolio run off
• Higher volume of Re-possessed (Foreclosed)
Units along with market driven rental index
• Cost Rationalization Measures • Advance payment to financiers • Higher sale properties under development
231
273 237
-
50
100
150
200
250
300
2014 2015 2016
18
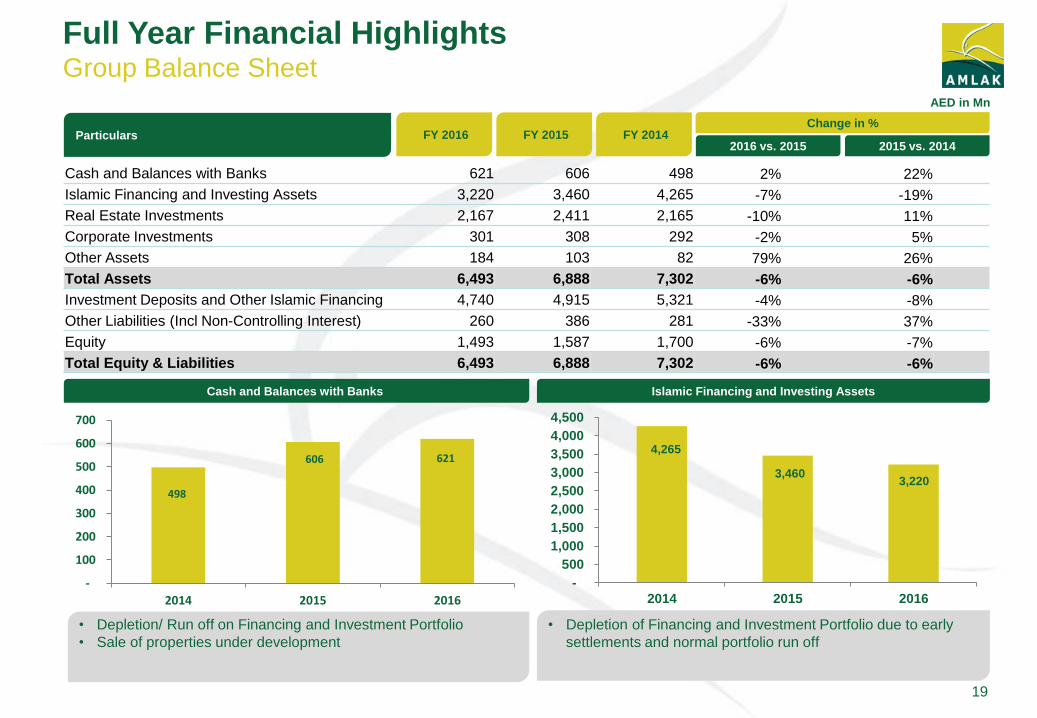
Full Year Financial Highlights Group Balance Sheet
19
Cash and Balances with Banks 621 606 498 2% 22%
Islamic Financing and Investing Assets 3,220 3,460 4,265 -7% -19%
Real Estate Investments 2,167 2,411 2,165 -10% 11%
Corporate Investments 301 308 292 -2% 5%
Other Assets 184 103 82 79% 26%
Total Assets 6,493 6,888 7,302 -6% -6%
Investment Deposits and Other Islamic Financing 4,740 4,915 5,321 -4% -8%
Other Liabilities (Incl Non-Controlling Interest) 260 386 281 -33% 37%
Equity 1,493 1,587 1,700 -6% -7%
Total Equity & Liabilities 6,493 6,888 7,302 -6% -6%
Change in % Particulars
AED in Mn
Cash and Balances with Banks Islamic Financing and Investing Assets
498
606 621
-
100
200
300
400
500
600
700
2014 2015 2016
4,265
3,460 3,220
-
500
1,000
1,500
2,000
2,500
3,000
3,500
4,000
4,500
2014 2015 2016
FY 2016 FY 2015 FY 2014 2016 vs. 2015 2015 vs. 2014
• Depletion/ Run off on Financing and Investment Portfolio
• Sale of properties under development
• Depletion of Financing and Investment Portfolio due to early
settlements and normal portfolio run off
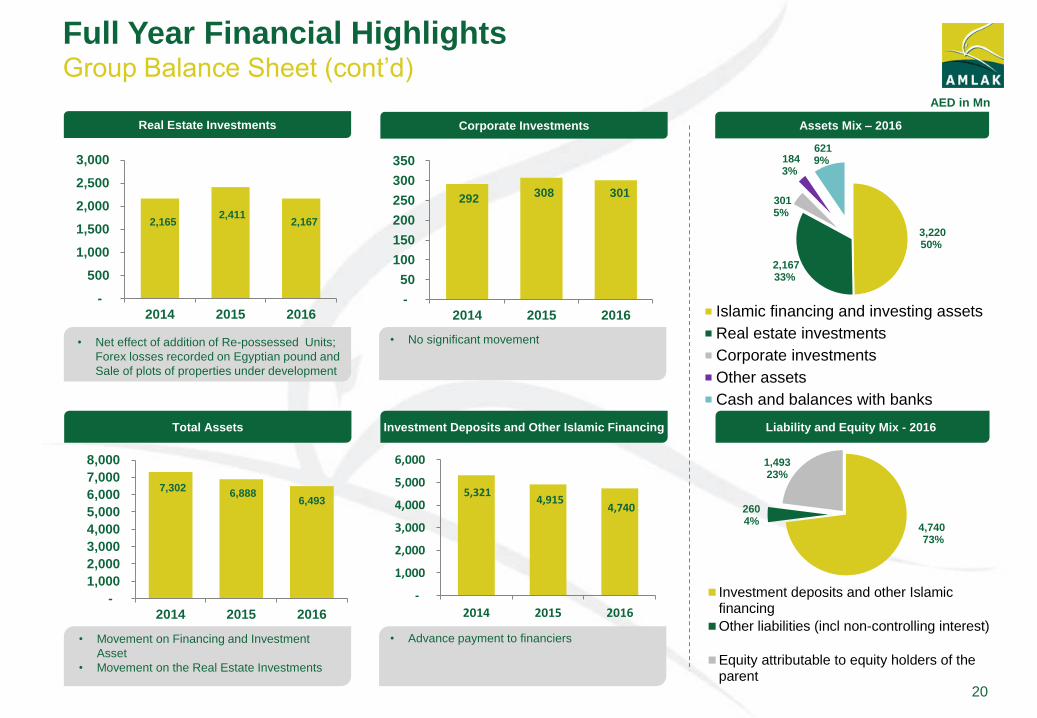
Full Year Financial Highlights Group Balance Sheet (cont’d)
20
Total Assets
Real Estate Investments Corporate Investments
Investment Deposits and Other Islamic Financing Liability and Equity Mix - 2016
Assets Mix – 2016
AED in Mn
7,302 6,888
6,493
-
1,000
2,000
3,000
4,000
5,000
6,000
7,000
8,000
2014 2015 2016
2,165 2,411
2,167
-
500
1,000
1,500
2,000
2,500
3,000
2014 2015 2016
292 308 301
-
50
100
150
200
250
300
350
2014 2015 2016
5,321 4,915
4,740
-
1,000
2,000
3,000
4,000
5,000
6,000
2014 2015 2016
• Movement on Financing and Investment
Asset
• Movement on the Real Estate Investments
• Net effect of addition of Re-possessed Units;
Forex losses recorded on Egyptian pound and
Sale of plots of properties under development
• No significant movement
• Advance payment to financiers
3,220 50%
2,167 33%
301 5%
184 3%
621 9%
Islamic financing and investing assets
Real estate investments
Corporate investments
Other assets
Cash and balances with banks
4,740 73%
260 4%
1,493 23%
Investment deposits and other Islamicfinancing
Other liabilities (incl non-controlling interest)
Equity attributable to equity holders of theparent
21
Net Financing to Deposit Ratio
Liquid Assets to Total Assets Ratio
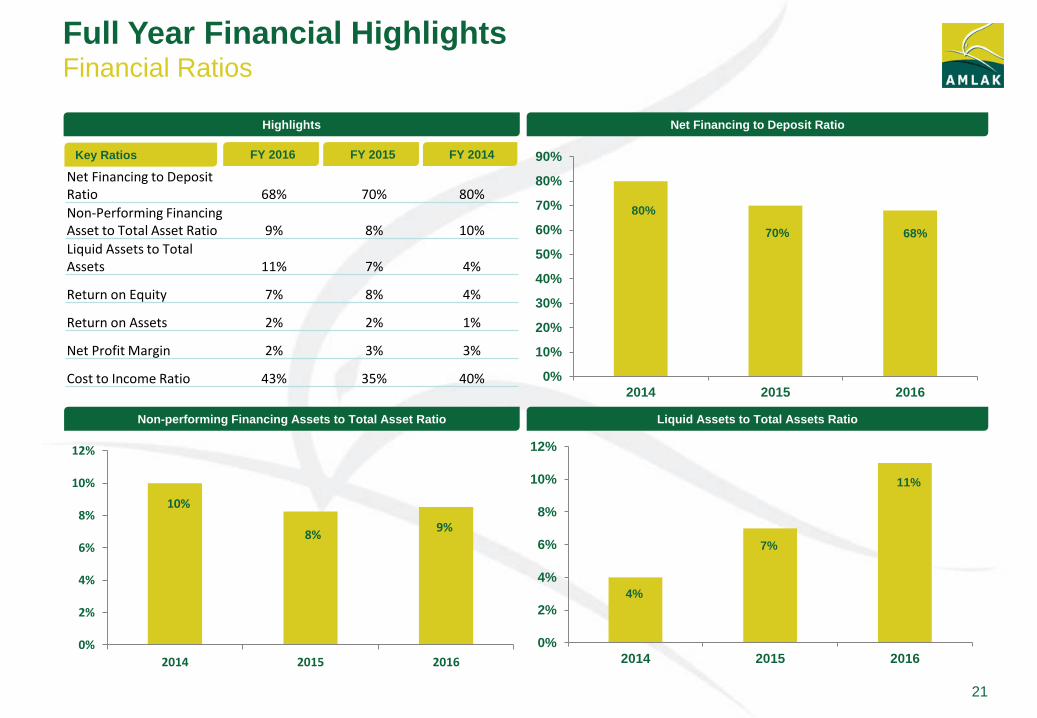
Highlights
Key Ratios FY 2016 FY 2015 FY 2014
Net Financing to Deposit Ratio 68% 70% 80%
Non-Performing Financing Asset to Total Asset Ratio 9% 8% 10%
Liquid Assets to Total Assets 11% 7% 4%
Return on Equity 7% 8% 4%
Return on Assets 2% 2% 1%
Net Profit Margin 2% 3% 3%
Cost to Income Ratio 43% 35% 40%
Non-performing Financing Assets to Total Asset Ratio
10%
8% 9%
0%
2%
4%
6%
8%
10%
12%
2014 2015 2016
80%
70% 68%
0%
10%
20%
30%
40%
50%
60%
70%
80%
90%
2014 2015 2016
4%
7%
11%
0%
2%
4%
6%
8%
10%
12%
2014 2015 2016
Full Year Financial Highlights Financial Ratios
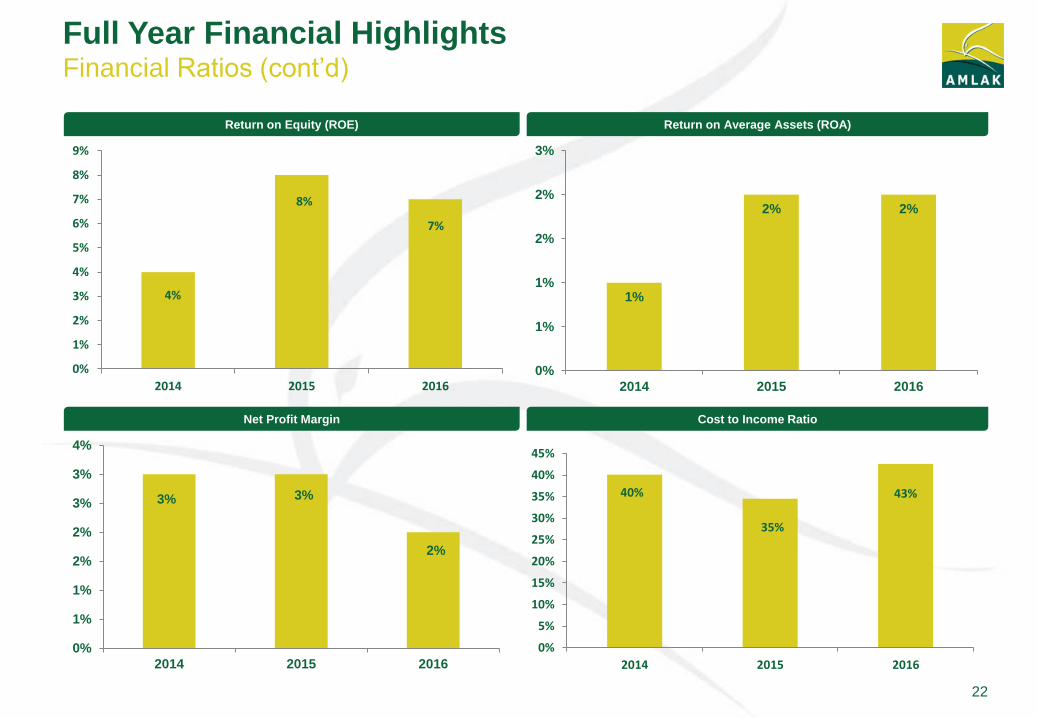
Full Year Financial Highlights Financial Ratios (cont’d)
Return on Equity (ROE)
40%
35%
43%
0%
5%
10%
15%
20%
25%
30%
35%
40%
45%
2014 2015 2016
Return on Average Assets (ROA)
Net Profit Margin Cost to Income Ratio
4%
8%
7%
0%
1%
2%
3%
4%
5%
6%
7%
8%
9%
2014 2015 2016
3% 3%
2%
0%
1%
1%
2%
2%
3%
3%
4%
2014 2015 2016
1%
2% 2%
0%
1%
1%
2%
2%
3%
2014 2015 2016
22

Awards
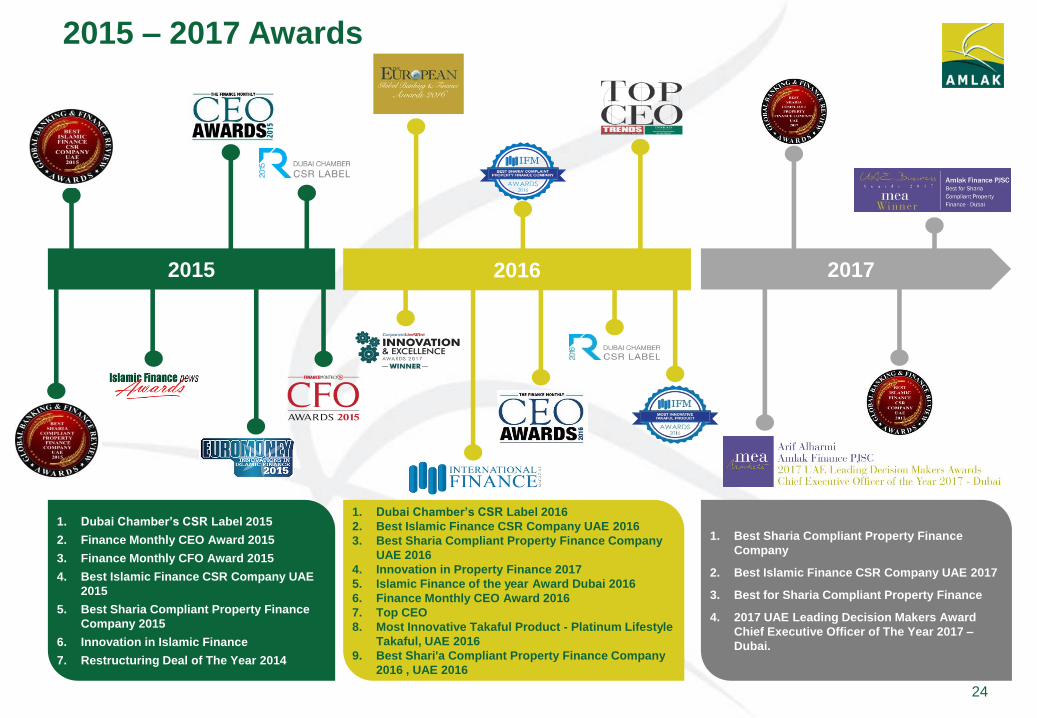
2015 – 2017 Awards
24
2015 2016
1. Dubai Chamber’s CSR Label 2015
2. Finance Monthly CEO Award 2015
3. Finance Monthly CFO Award 2015
4. Best Islamic Finance CSR Company UAE
2015
5. Best Sharia Compliant Property Finance
Company 2015
6. Innovation in Islamic Finance
7. Restructuring Deal of The Year 2014
1. Dubai Chamber’s CSR Label 2016
2. Best Islamic Finance CSR Company UAE 2016
3. Best Sharia Compliant Property Finance Company
UAE 2016
4. Innovation in Property Finance 2017
5. Islamic Finance of the year Award Dubai 2016
6. Finance Monthly CEO Award 2016
7. Top CEO
8. Most Innovative Takaful Product - Platinum Lifestyle
Takaful, UAE 2016
9. Best Shari'a Compliant Property Finance Company
2016 , UAE 2016
2017
1. Best Sharia Compliant Property Finance
Company
2. Best Islamic Finance CSR Company UAE 2017
3. Best for Sharia Compliant Property Finance
4. 2017 UAE Leading Decision Makers Award
Chief Executive Officer of The Year 2017 –
Dubai.
Appendix
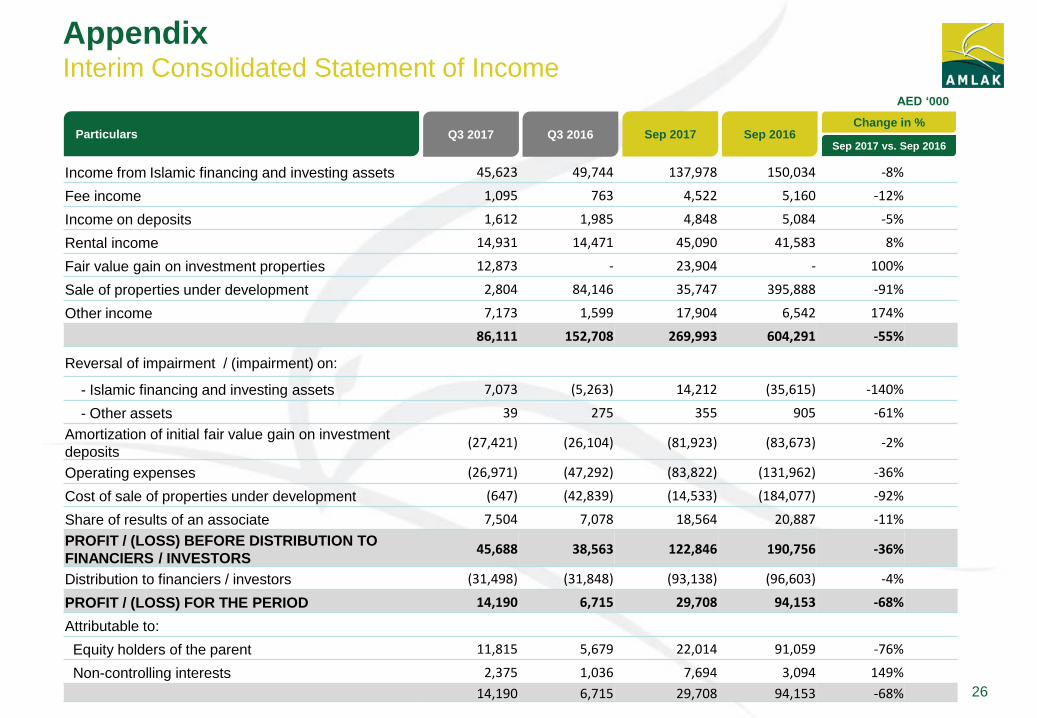
Appendix Interim Consolidated Statement of Income
26
Income from Islamic financing and investing assets 45,623 49,744 137,978 150,034 -8%
Fee income 1,095 763 4,522 5,160 -12%
Income on deposits 1,612 1,985 4,848 5,084 -5%
Rental income 14,931 14,471 45,090 41,583 8%
Fair value gain on investment properties 12,873 - 23,904 - 100%
Sale of properties under development 2,804 84,146 35,747 395,888 -91%
Other income 7,173 1,599 17,904 6,542 174%
86,111 152,708 269,993 604,291 -55%
Reversal of impairment / (impairment) on:
- Islamic financing and investing assets 7,073 (5,263) 14,212 (35,615) -140%
- Other assets 39 275 355 905 -61%
Amortization of initial fair value gain on investment
deposits (27,421) (26,104) (81,923) (83,673) -2%
Operating expenses (26,971) (47,292) (83,822) (131,962) -36%
Cost of sale of properties under development (647) (42,839) (14,533) (184,077) -92%
Share of results of an associate 7,504 7,078 18,564 20,887 -11%
PROFIT / (LOSS) BEFORE DISTRIBUTION TO
FINANCIERS / INVESTORS 45,688 38,563 122,846 190,756 -36%
Distribution to financiers / investors (31,498) (31,848) (93,138) (96,603) -4%
PROFIT / (LOSS) FOR THE PERIOD 14,190 6,715 29,708 94,153 -68%
Attributable to:
Equity holders of the parent 11,815 5,679 22,014 91,059 -76%
Non-controlling interests 2,375 1,036 7,694 3,094 149%
14,190 6,715 29,708 94,153 -68%
Sep 2017 Sep 2016 Change in %
Sep 2017 vs. Sep 2016 Particulars
AED ‘000
Q3 2017 Q3 2016
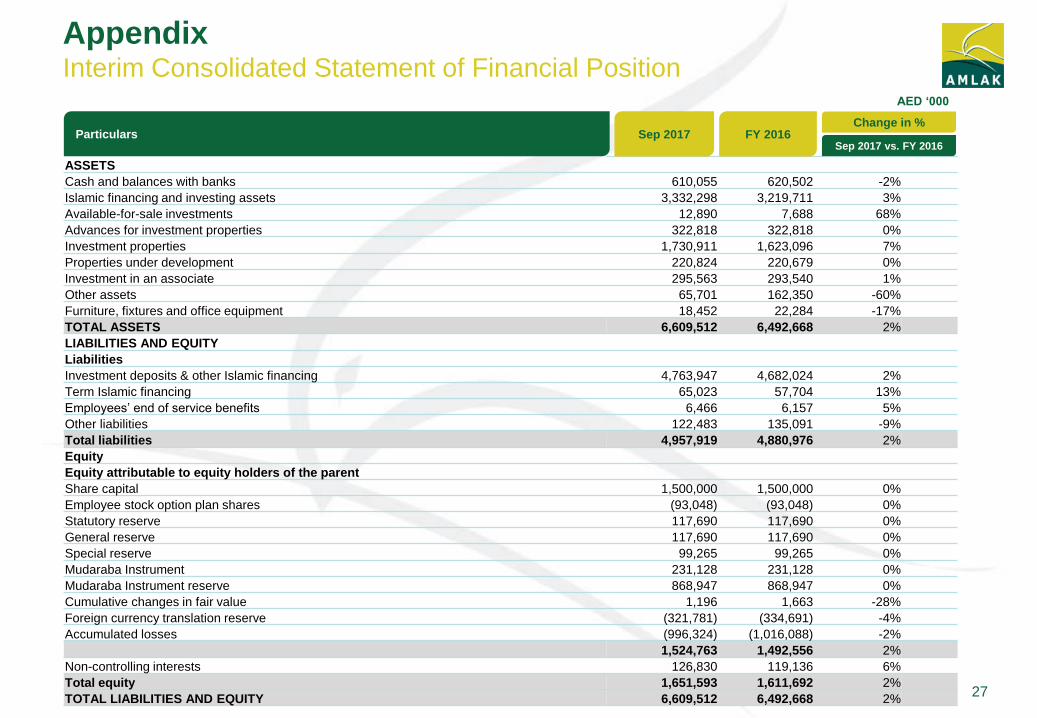
Appendix Interim Consolidated Statement of Financial Position
27
ASSETS
Cash and balances with banks 610,055 620,502 -2%
Islamic financing and investing assets 3,332,298 3,219,711 3%
Available-for-sale investments 12,890 7,688 68%
Advances for investment properties 322,818 322,818 0%
Investment properties 1,730,911 1,623,096 7%
Properties under development 220,824 220,679 0%
Investment in an associate 295,563 293,540 1%
Other assets 65,701 162,350 -60%
Furniture, fixtures and office equipment 18,452 22,284 -17%
TOTAL ASSETS 6,609,512 6,492,668 2%
LIABILITIES AND EQUITY
Liabilities
Investment deposits & other Islamic financing 4,763,947 4,682,024 2%
Term Islamic financing 65,023 57,704 13%
Employees’ end of service benefits 6,466 6,157 5%
Other liabilities 122,483 135,091 -9%
Total liabilities 4,957,919 4,880,976 2%
Equity
Equity attributable to equity holders of the parent
Share capital 1,500,000 1,500,000 0%
Employee stock option plan shares (93,048) (93,048) 0%
Statutory reserve 117,690 117,690 0%
General reserve 117,690 117,690 0%
Special reserve 99,265 99,265 0%
Mudaraba Instrument 231,128 231,128 0%
Mudaraba Instrument reserve 868,947 868,947 0%
Cumulative changes in fair value 1,196 1,663 -28%
Foreign currency translation reserve (321,781) (334,691) -4%
Accumulated losses (996,324) (1,016,088) -2%
1,524,763 1,492,556 2%
Non-controlling interests 126,830 119,136 6%
Total equity 1,651,593 1,611,692 2%
TOTAL LIABILITIES AND EQUITY 6,609,512 6,492,668 2%
AED ‘000
Sep 2017 FY 2016 Change in %
Sep 2017 vs. FY 2016 Particulars
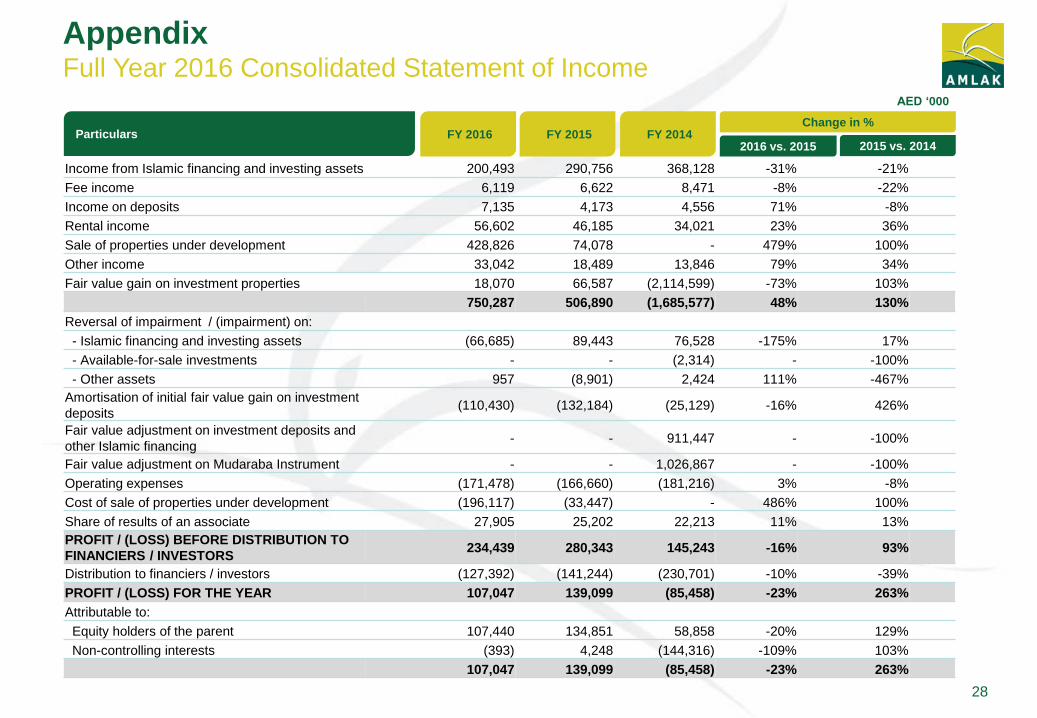
Appendix Full Year 2016 Consolidated Statement of Income
28
Income from Islamic financing and investing assets 200,493 290,756 368,128 -31% -21%
Fee income 6,119 6,622 8,471 -8% -22%
Income on deposits 7,135 4,173 4,556 71% -8%
Rental income 56,602 46,185 34,021 23% 36%
Sale of properties under development 428,826 74,078 - 479% 100%
Other income 33,042 18,489 13,846 79% 34%
Fair value gain on investment properties 18,070 66,587 (2,114,599) -73% 103%
750,287 506,890 (1,685,577) 48% 130%
Reversal of impairment / (impairment) on:
- Islamic financing and investing assets (66,685) 89,443 76,528 -175% 17%
- Available-for-sale investments - - (2,314) - -100%
- Other assets 957 (8,901) 2,424 111% -467%
Amortisation of initial fair value gain on investment
deposits (110,430) (132,184) (25,129) -16% 426%
Fair value adjustment on investment deposits and
other Islamic financing - - 911,447 - -100%
Fair value adjustment on Mudaraba Instrument - - 1,026,867 - -100%
Operating expenses (171,478) (166,660) (181,216) 3% -8%
Cost of sale of properties under development (196,117) (33,447) - 486% 100%
Share of results of an associate 27,905 25,202 22,213 11% 13%
PROFIT / (LOSS) BEFORE DISTRIBUTION TO
FINANCIERS / INVESTORS 234,439 280,343 145,243 -16% 93%
Distribution to financiers / investors (127,392) (141,244) (230,701) -10% -39%
PROFIT / (LOSS) FOR THE YEAR 107,047 139,099 (85,458) -23% 263%
Attributable to:
Equity holders of the parent 107,440 134,851 58,858 -20% 129%
Non-controlling interests (393) 4,248 (144,316) -109% 103%
107,047 139,099 (85,458) -23% 263%
FY 2016 FY 2015 FY 2014 Change in %
2016 vs. 2015 2015 vs. 2014 Particulars
AED ‘000
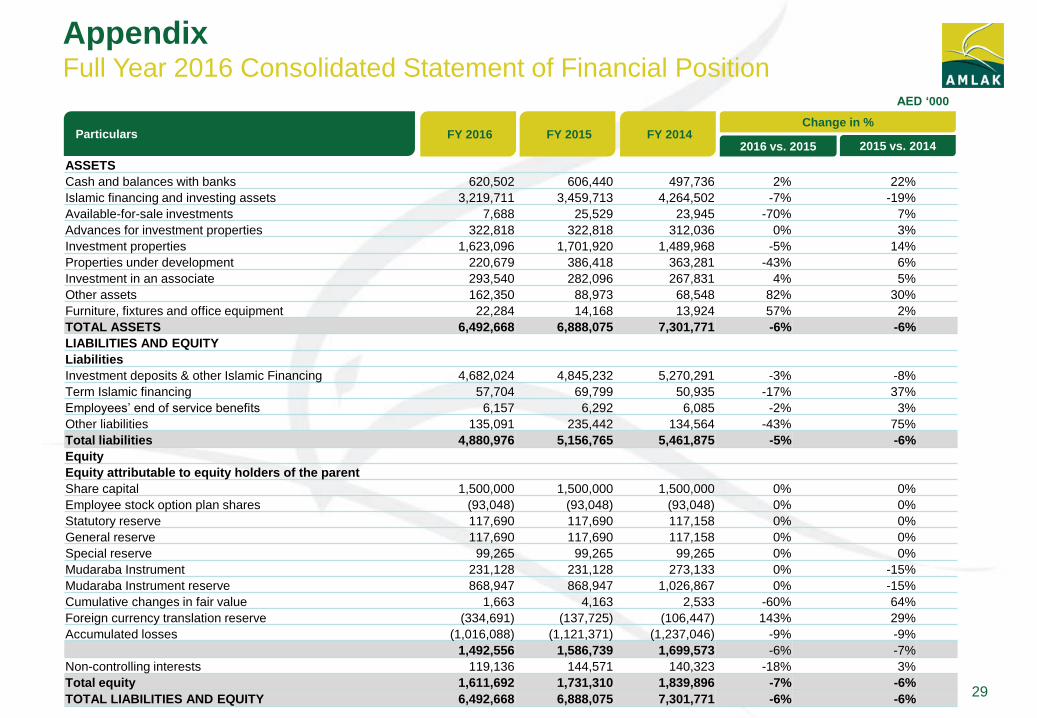
Appendix Full Year 2016 Consolidated Statement of Financial Position
29
ASSETS
Cash and balances with banks 620,502 606,440 497,736 2% 22%
Islamic financing and investing assets 3,219,711 3,459,713 4,264,502 -7% -19%
Available-for-sale investments 7,688 25,529 23,945 -70% 7%
Advances for investment properties 322,818 322,818 312,036 0% 3%
Investment properties 1,623,096 1,701,920 1,489,968 -5% 14%
Properties under development 220,679 386,418 363,281 -43% 6%
Investment in an associate 293,540 282,096 267,831 4% 5%
Other assets 162,350 88,973 68,548 82% 30%
Furniture, fixtures and office equipment 22,284 14,168 13,924 57% 2%
TOTAL ASSETS 6,492,668 6,888,075 7,301,771 -6% -6%
LIABILITIES AND EQUITY
Liabilities
Investment deposits & other Islamic Financing 4,682,024 4,845,232 5,270,291 -3% -8%
Term Islamic financing 57,704 69,799 50,935 -17% 37%
Employees’ end of service benefits 6,157 6,292 6,085 -2% 3%
Other liabilities 135,091 235,442 134,564 -43% 75%
Total liabilities 4,880,976 5,156,765 5,461,875 -5% -6%
Equity
Equity attributable to equity holders of the parent
Share capital 1,500,000 1,500,000 1,500,000 0% 0%
Employee stock option plan shares (93,048) (93,048) (93,048) 0% 0%
Statutory reserve 117,690 117,690 117,158 0% 0%
General reserve 117,690 117,690 117,158 0% 0%
Special reserve 99,265 99,265 99,265 0% 0%
Mudaraba Instrument 231,128 231,128 273,133 0% -15%
Mudaraba Instrument reserve 868,947 868,947 1,026,867 0% -15%
Cumulative changes in fair value 1,663 4,163 2,533 -60% 64%
Foreign currency translation reserve (334,691) (137,725) (106,447) 143% 29%
Accumulated losses (1,016,088) (1,121,371) (1,237,046) -9% -9%
1,492,556 1,586,739 1,699,573 -6% -7%
Non-controlling interests 119,136 144,571 140,323 -18% 3%
Total equity 1,611,692 1,731,310 1,839,896 -7% -6%
TOTAL LIABILITIES AND EQUITY 6,492,668 6,888,075 7,301,771 -6% -6%
AED ‘000
FY 2016 FY 2015 FY 2014 Change in %
Particulars 2016 vs. 2015 2015 vs. 2014
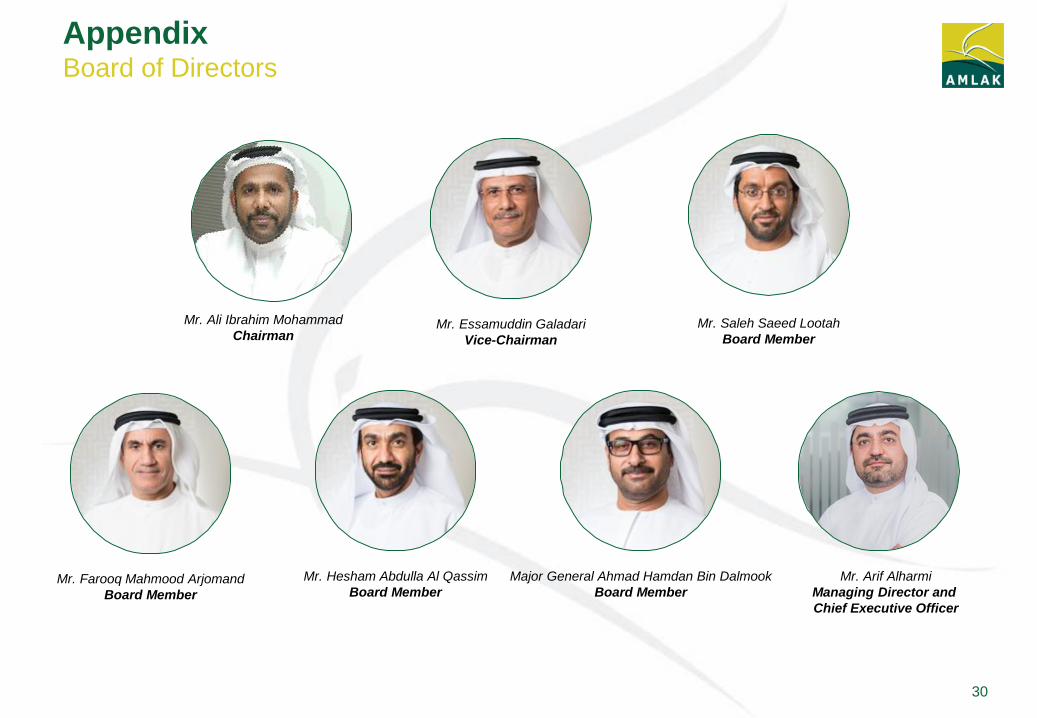
Appendix Board of Directors
30
Mr. Ali Ibrahim Mohammad
Chairman Mr. Essamuddin Galadari
Vice-Chairman
Mr. Saleh Saeed Lootah
Board Member
Mr. Farooq Mahmood Arjomand
Board Member
Mr. Hesham Abdulla Al Qassim
Board Member
Major General Ahmad Hamdan Bin Dalmook
Board Member
Mr. Arif Alharmi
Managing Director and
Chief Executive Officer
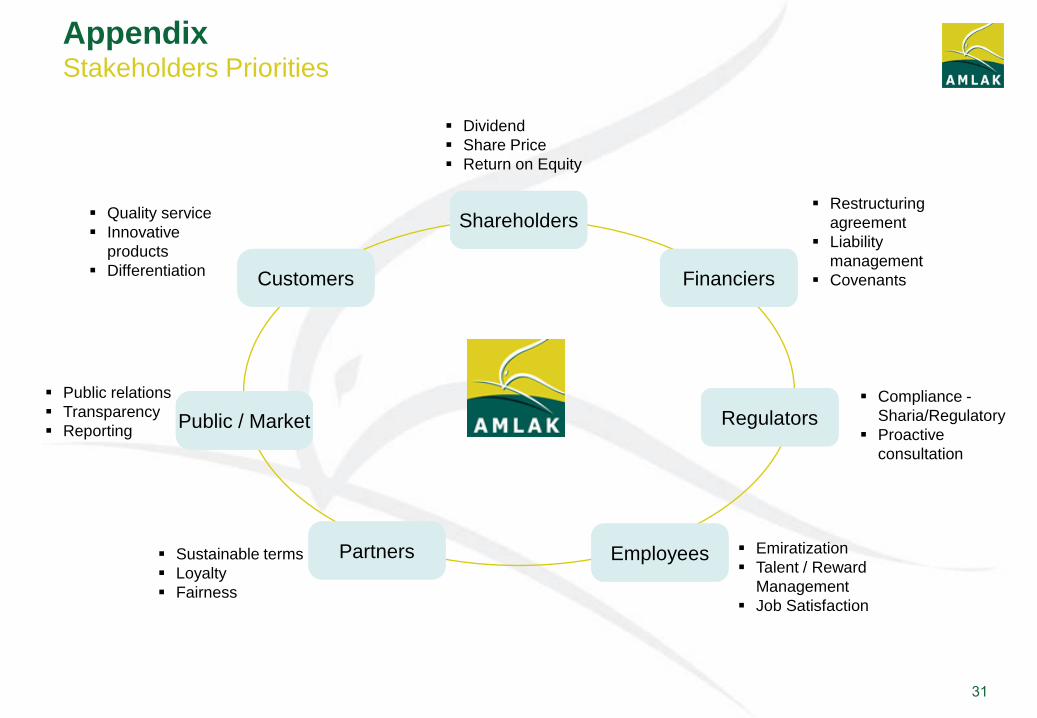
Appendix Stakeholders Priorities
31
Shareholders
Dividend
Share Price
Return on Equity
Financiers
Restructuring
agreement
Liability
management
Covenants
Regulators Compliance -
Sharia/Regulatory
Proactive
consultation
Employees Emiratization
Talent / Reward
Management
Job Satisfaction
Partners Sustainable terms
Loyalty
Fairness
Public / Market
Public relations
Transparency
Reporting
Customers
Quality service
Innovative
products
Differentiation
Appendix Products and Services
32
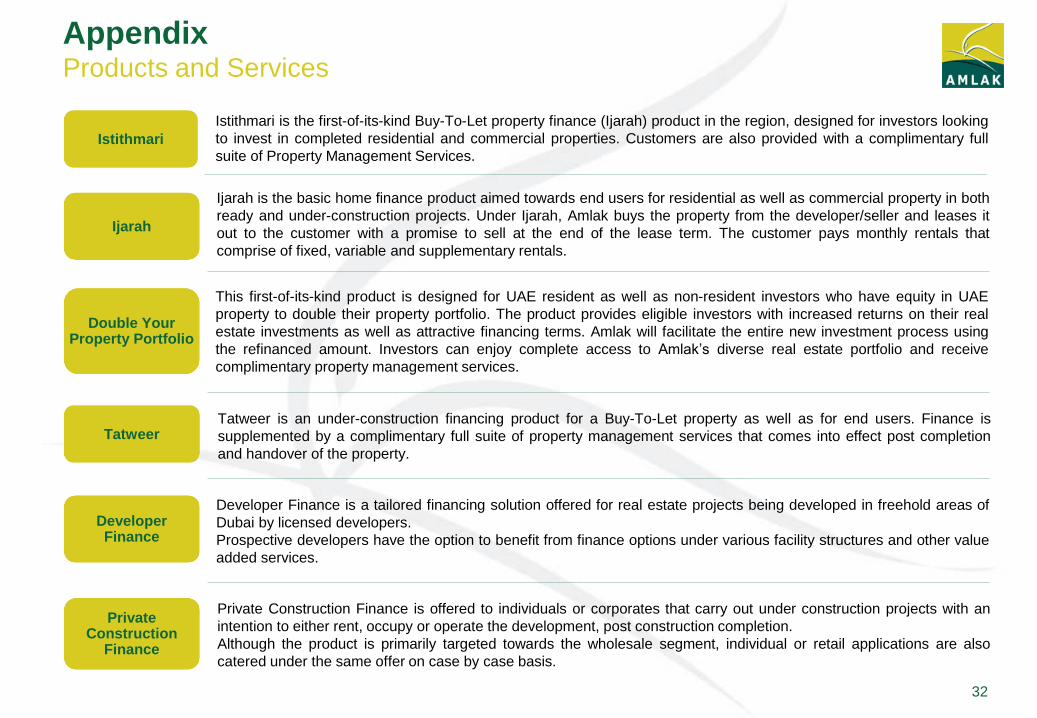
Istithmari
Ijarah
Tatweer
Developer Finance
Private Construction
Finance
Istithmari is the first-of-its-kind Buy-To-Let property finance (Ijarah) product in the region, designed for investors looking
to invest in completed residential and commercial properties. Customers are also provided with a complimentary full
suite of Property Management Services.
Ijarah is the basic home finance product aimed towards end users for residential as well as commercial property in both
ready and under-construction projects. Under Ijarah, Amlak buys the property from the developer/seller and leases it
out to the customer with a promise to sell at the end of the lease term. The customer pays monthly rentals that
comprise of fixed, variable and supplementary rentals.
Tatweer is an under-construction financing product for a Buy-To-Let property as well as for end users. Finance is
supplemented by a complimentary full suite of property management services that comes into effect post completion
and handover of the property.
Developer Finance is a tailored financing solution offered for real estate projects being developed in freehold areas of
Dubai by licensed developers.
Prospective developers have the option to benefit from finance options under various facility structures and other value
added services.
Private Construction Finance is offered to individuals or corporates that carry out under construction projects with an
intention to either rent, occupy or operate the development, post construction completion.
Although the product is primarily targeted towards the wholesale segment, individual or retail applications are also
catered under the same offer on case by case basis.
Double Your Property Portfolio
This first-of-its-kind product is designed for UAE resident as well as non-resident investors who have equity in UAE
property to double their property portfolio. The product provides eligible investors with increased returns on their real
estate investments as well as attractive financing terms. Amlak will facilitate the entire new investment process using
the refinanced amount. Investors can enjoy complete access to Amlak’s diverse real estate portfolio and receive
complimentary property management services.
Appendix General Economic Indicators - UAE and Dubai Economy
Economic growth in the UAE is expected to increase to at least 3 percent in the medium term
on the back of Expo 2020, according to Bank of America Merrill Lynch’s GEMs Macro
monthly report.
Dubai’s population stood at 2.8 million at the end of the second quarter of 2017 according to
DSC.
Dubai International Airport’s passengers reached 36.9 million up until May, a 6.7% increase
Y-o-Y.
Dubai Customs reported that non-oil foreign trade grew by 2.7% and reached AED 327
billion in the first quarter of 2017.
The Dubai Chamber of Commerce and Industry have had 8,900 new members joining them
within the first six months of 2017, a 10.9% year on year increase.
Dubai’s non-oil private sector grew faster in the first half of the year as compared to the same
period last year, according to reports by Emirates NBD. The Dubai economy tracker index
registered at 56.5 in June, up from May’s seven-month low of 55.
Rental drops have led to a reduction in the rental incomes which in return is pulling the yield
rates down.
More than 7,000 residential units have been added in the second quarter of 2017.
33
Appendix General Economic Indicators - Key Economic Indicators
34
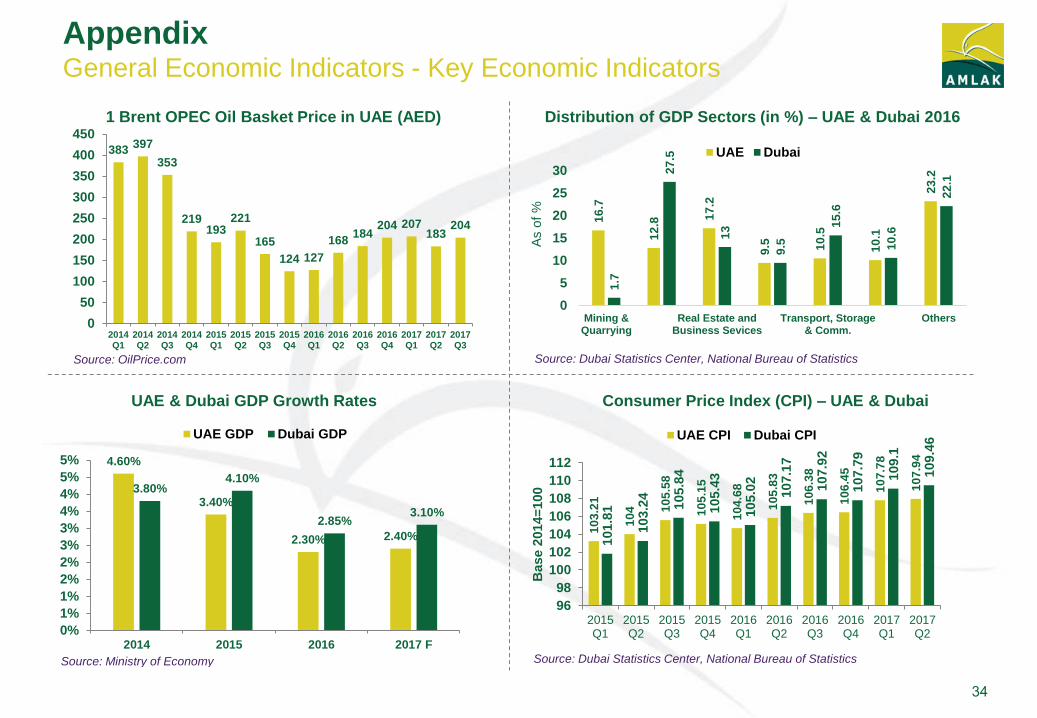
1 Brent OPEC Oil Basket Price in UAE (AED) Distribution of GDP Sectors (in %) – UAE & Dubai 2016
UAE & Dubai GDP Growth Rates Consumer Price Index (CPI) – UAE & Dubai
383 397
353
219 193
221
165
124 127
168 184
204 207 183
204
0
50
100
150
200
250
300
350
400
450
2014Q1
2014Q2
2014Q3
2014Q4
2015Q1
2015Q2
2015Q3
2015Q4
2016Q1
2016Q2
2016Q3
2016Q4
2017Q1
2017Q2
2017Q3
16
.7
12
.8 17
.2
9.5
10
.5
10
.1
23
.2
1.7
27
.5
13
9.5
15
.6
10
.6
22
.1
0
5
10
15
20
25
30
Mining &Quarrying
Real Estate andBusiness Sevices
Transport, Storage& Comm.
Others
As o
f %
UAE Dubai
Source: Dubai Statistics Center, National Bureau of Statistics
4.60%
3.40%
2.30% 2.40%
3.80% 4.10%
2.85% 3.10%
0%
1%
1%
2%
2%
3%
3%
4%
4%
5%
5%
2014 2015 2016 2017 F
UAE GDP Dubai GDP
Source: Ministry of Economy
10
3.2
1
10
4
10
5.5
8
10
5.1
5
10
4.6
8
10
5.8
3
10
6.3
8
10
6.4
5
10
7.7
8
10
7.9
4
101.8
1
103.2
4
105.8
4
105.4
3
105.0
2
107.1
7
107.9
2
107.7
9
109.1
109.4
6
96
98
100
102
104
106
108
110
112
2015Q1
2015Q2
2015Q3
2015Q4
2016Q1
2016Q2
2016Q3
2016Q4
2017Q1
2017Q2
Base 2
014=
100
UAE CPI Dubai CPI
Source: Dubai Statistics Center, National Bureau of Statistics
Source: OilPrice.com
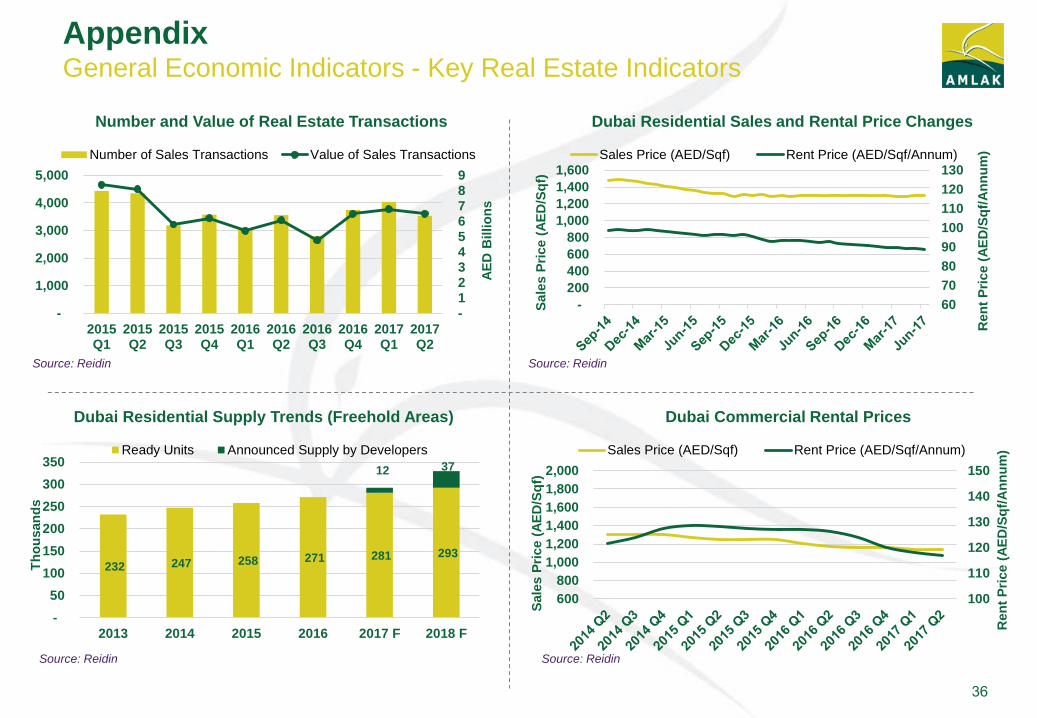
The number of sales transactions have dropped down from 4,043 in Q1 2017 to 3,532 in Q2
2017. However, when compared to Q2 2016 the value of sales transactions have increased
by 7% in Q2 2017. Even though there was a 13% decline in the number of sales
transactions, a mere 5% drop in the value of sales transactions were noticed.
Apartment sales prices are up by 0.1% when compared to the previous quarter. While,
apartment prices rose by 0.1%, villa prices rose by 1% when compared to the first quarter of
2017 indicating a bottoming out phase.
Rent prices have dropped down by 1.7% for the apartment market and by 0.7% for the villa
market when compared to Q1 2017.
Rental conditions will remain favorable for new tenants throughout 2017 as new deliveries
continue to flood the market. Landlords have also gone easy by holding the rents steady in
line with the market sentiment.
Sales prices of office buildings continued to drop in Q2 2017. However, the drop is quite
marginal indicating that it is nearing to the bottoming out phase in both sales and rent prices.
Dubai’s heavyweight property developer ‘Emaar’ have launched 12 projects this year.
Developers have their focus set on the apartment segment as more than 80% of the units
launched in 2017 are apartments.
35
Appendix General Economic Indicators - Dubai Real Estate Market
Appendix General Economic Indicators - Key Real Estate Indicators
36
Number and Value of Real Estate Transactions Dubai Residential Sales and Rental Price Changes
Dubai Commercial Rental Prices Dubai Residential Supply Trends (Freehold Areas)
- 1 2 3 4 5 6 7 8 9
-
1,000
2,000
3,000
4,000
5,000
2015Q1
2015Q2
2015Q3
2015Q4
2016Q1
2016Q2
2016Q3
2016Q4
2017Q1
2017Q2
AE
D B
illio
ns
Number of Sales Transactions Value of Sales Transactions
Source: Reidin
60
70
80
90
100
110
120
130
-
200
400
600
800
1,000
1,200
1,400
1,600
Ren
t P
rice (
AE
D/S
qf/
An
nu
m)
Sale
s P
rice (
AE
D/S
qf)
Sales Price (AED/Sqf) Rent Price (AED/Sqf/Annum)
Source: Reidin
232 247 258 271 281 293
12 37
-
50
100
150
200
250
300
350
2013 2014 2015 2016 2017 F 2018 F
Th
ou
san
ds
Ready Units Announced Supply by Developers
Source: Reidin
100
110
120
130
140
150
600
800
1,000
1,200
1,400
1,600
1,800
2,000
Ren
t P
rice (
AE
D/S
qf/
An
nu
m)
Sale
s P
rice (
AE
D/S
qf)
Sales Price (AED/Sqf) Rent Price (AED/Sqf/Annum)
Source: Reidin
Appendix General Economic Indicators - Dubai Mortgage Market
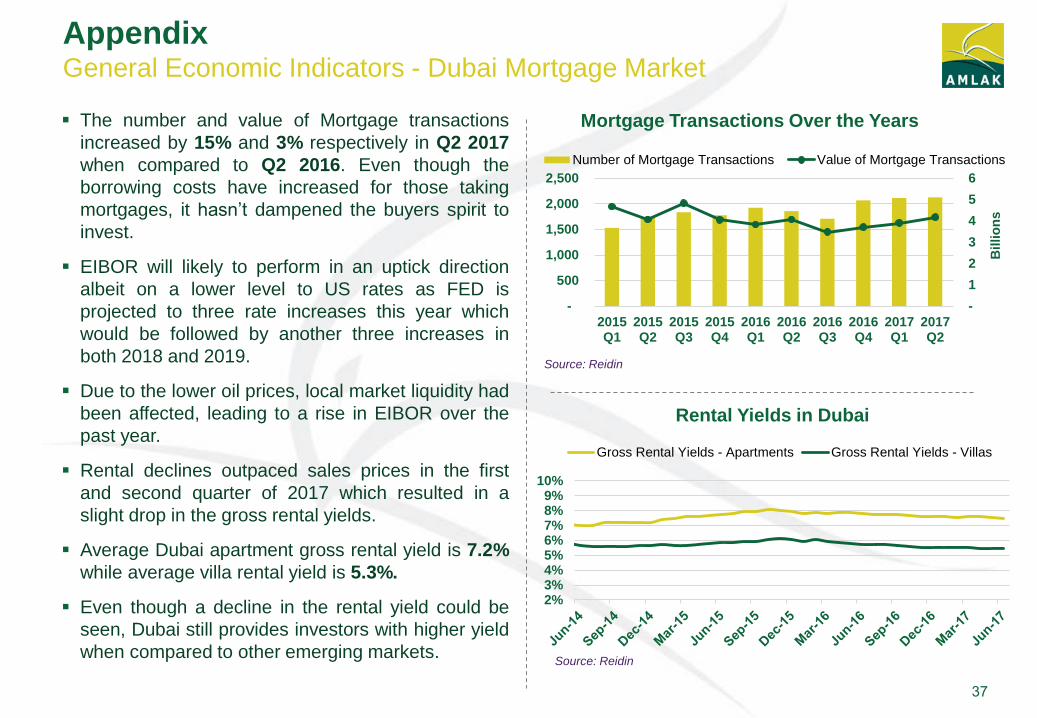
The number and value of Mortgage transactions
increased by 15% and 3% respectively in Q2 2017
when compared to Q2 2016. Even though the
borrowing costs have increased for those taking
mortgages, it hasn’t dampened the buyers spirit to
invest.
EIBOR will likely to perform in an uptick direction
albeit on a lower level to US rates as FED is
projected to three rate increases this year which
would be followed by another three increases in
both 2018 and 2019.
Due to the lower oil prices, local market liquidity had
been affected, leading to a rise in EIBOR over the
past year.
Rental declines outpaced sales prices in the first
and second quarter of 2017 which resulted in a
slight drop in the gross rental yields.
Average Dubai apartment gross rental yield is 7.2%
while average villa rental yield is 5.3%.
Even though a decline in the rental yield could be
seen, Dubai still provides investors with higher yield
when compared to other emerging markets.
37
Mortgage Transactions Over the Years
Rental Yields in Dubai
-
1
2
3
4
5
6
-
500
1,000
1,500
2,000
2,500
2015Q1
2015Q2
2015Q3
2015Q4
2016Q1
2016Q2
2016Q3
2016Q4
2017Q1
2017Q2
Billio
ns
Number of Mortgage Transactions Value of Mortgage Transactions
Source: Reidin
2%3%4%5%6%7%8%9%
10%
Gross Rental Yields - Apartments Gross Rental Yields - Villas
Source: Reidin
Phone: +971 4 4274500
Web: http://www.amlakfinance.com/en/investor-relations.html
Email: [email protected]
P O Box: 2441, Dubai, United Arab Emirates
Contact
Investor
Relations
Related Documents


