Top Banner
Amino acid metabolism II. The urea cycle Figures : Lehninger-4ed; chapter: 18 Stryer-5ed; chapter: 23
18

Amino acid metabolism II. The urea cycle Figures: Lehninger-4ed; chapter: 18 Stryer-5ed; chapter: 23.

Jan 03, 2016

Download

Documents

Welcome message from author
This document is posted to help you gain knowledge. Please leave a comment to let me know what you think about it! Share it to your friends and learn new things together.
Transcript
Page 1: Amino acid metabolism II. The urea cycle Figures: Lehninger-4ed; chapter: 18 Stryer-5ed; chapter: 23.

Amino acid metabolism II. The urea cycle

Figures:

Lehninger-4ed; chapter: 18

Stryer-5ed; chapter: 23

Page 2: Amino acid metabolism II. The urea cycle Figures: Lehninger-4ed; chapter: 18 Stryer-5ed; chapter: 23.

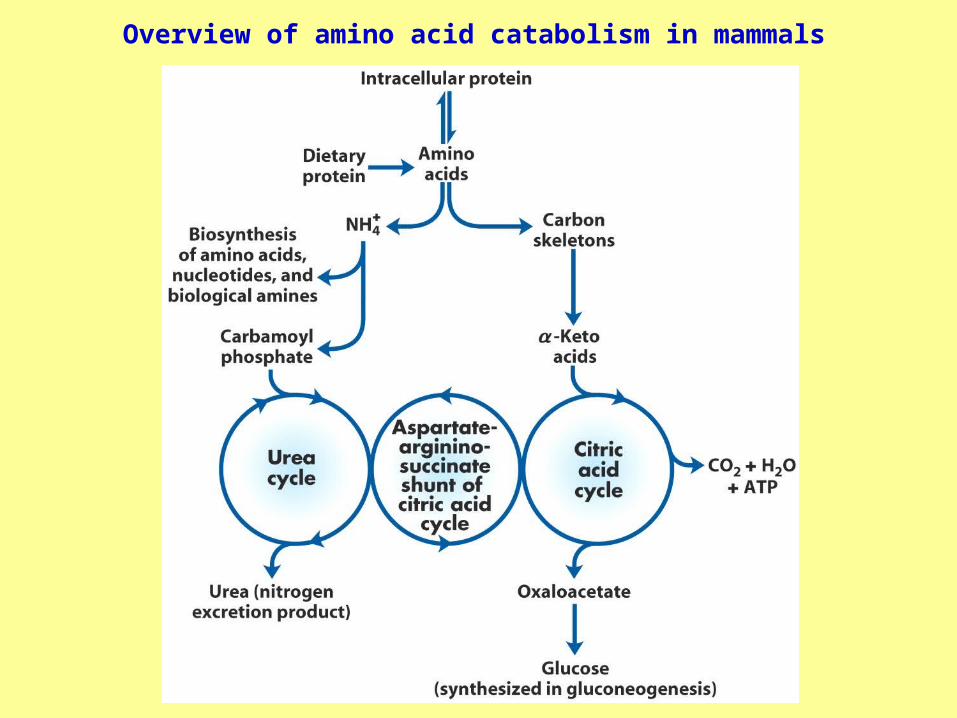
Overview of amino acid catabolism in mammals

Page 3: Amino acid metabolism II. The urea cycle Figures: Lehninger-4ed; chapter: 18 Stryer-5ed; chapter: 23.

Excretory forms of nitrogen

Page 4: Amino acid metabolism II. The urea cycle Figures: Lehninger-4ed; chapter: 18 Stryer-5ed; chapter: 23.

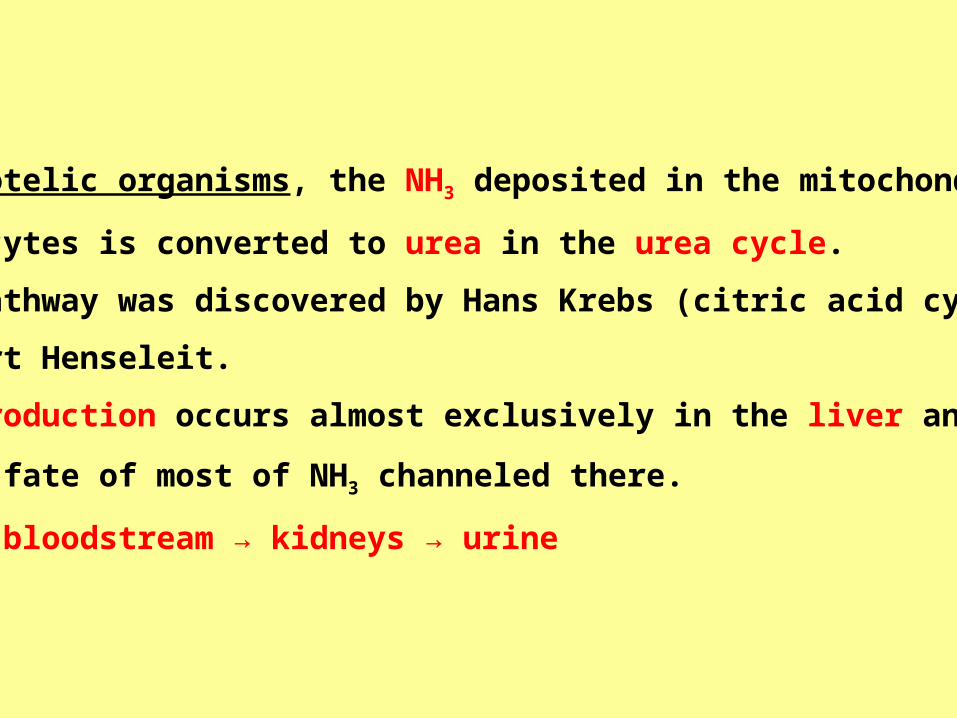
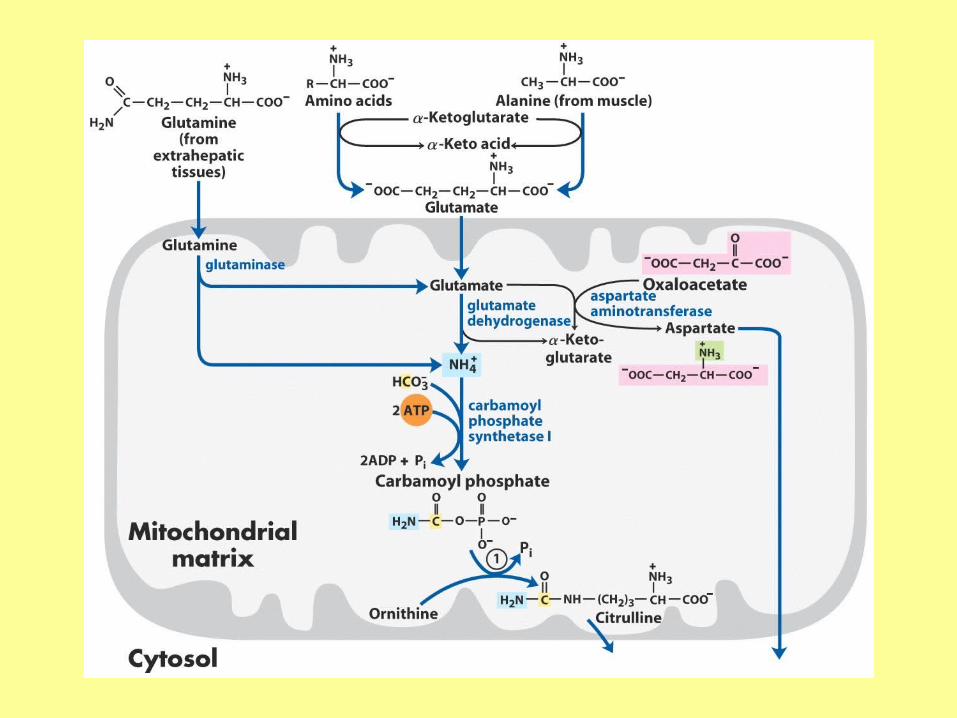
In ureotelic organisms, the NH3 deposited in the mitochondria of

hepatocytes is converted to urea in the urea cycle.

This pathway was discovered by Hans Krebs (citric acid cycle)

and Kurt Henseleit.

Urea production occurs almost exclusively in the liver and

is the fate of most of NH3 channeled there.

Urea → bloodstream → kidneys → urine

Page 5: Amino acid metabolism II. The urea cycle Figures: Lehninger-4ed; chapter: 18 Stryer-5ed; chapter: 23.

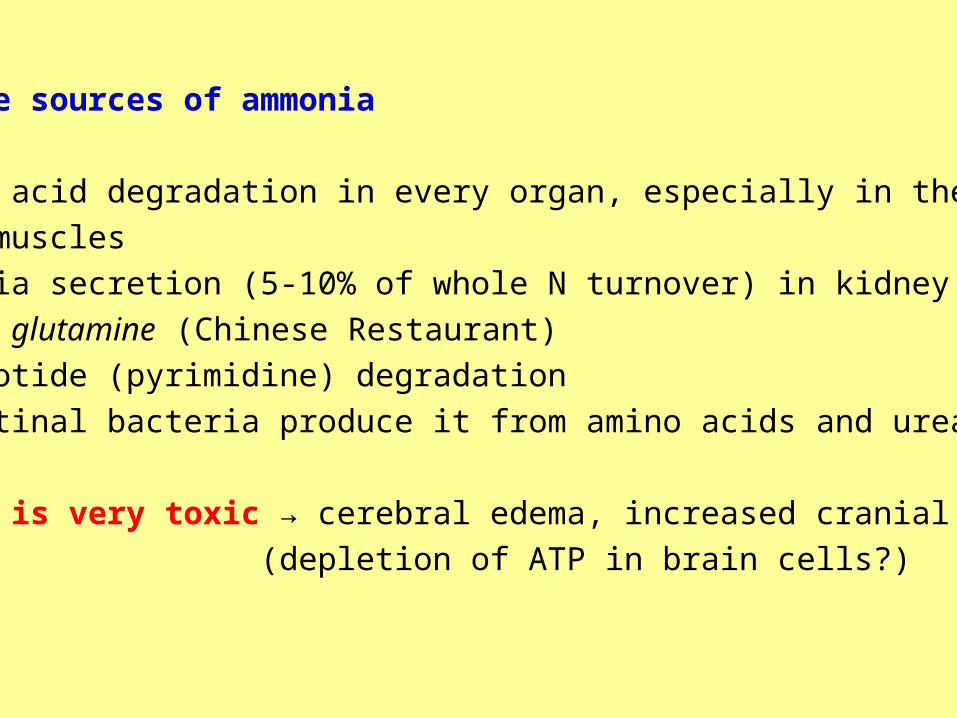
Possible sources of ammonia

● Amino acid degradation in every organ, especially in the liver

and muscles

● Ammonia secretion (5-10% of whole N turnover) in kidney tubules

from glutamine (Chinese Restaurant)

● Nucleotide (pyrimidine) degradation

● Intestinal bacteria produce it from amino acids and urea

Ammonia is very toxic → cerebral edema, increased cranial pressure

(depletion of ATP in brain cells?)

Page 6: Amino acid metabolism II. The urea cycle Figures: Lehninger-4ed; chapter: 18 Stryer-5ed; chapter: 23.
Page 7: Amino acid metabolism II. The urea cycle Figures: Lehninger-4ed; chapter: 18 Stryer-5ed; chapter: 23.
Page 8: Amino acid metabolism II. The urea cycle Figures: Lehninger-4ed; chapter: 18 Stryer-5ed; chapter: 23.
Page 9: Amino acid metabolism II. The urea cycle Figures: Lehninger-4ed; chapter: 18 Stryer-5ed; chapter: 23.
Page 10: Amino acid metabolism II. The urea cycle Figures: Lehninger-4ed; chapter: 18 Stryer-5ed; chapter: 23.
Page 11: Amino acid metabolism II. The urea cycle Figures: Lehninger-4ed; chapter: 18 Stryer-5ed; chapter: 23.
Page 12: Amino acid metabolism II. The urea cycle Figures: Lehninger-4ed; chapter: 18 Stryer-5ed; chapter: 23.
Page 13: Amino acid metabolism II. The urea cycle Figures: Lehninger-4ed; chapter: 18 Stryer-5ed; chapter: 23.
Page 14: Amino acid metabolism II. The urea cycle Figures: Lehninger-4ed; chapter: 18 Stryer-5ed; chapter: 23.
Page 15: Amino acid metabolism II. The urea cycle Figures: Lehninger-4ed; chapter: 18 Stryer-5ed; chapter: 23.
Page 16: Amino acid metabolism II. The urea cycle Figures: Lehninger-4ed; chapter: 18 Stryer-5ed; chapter: 23.

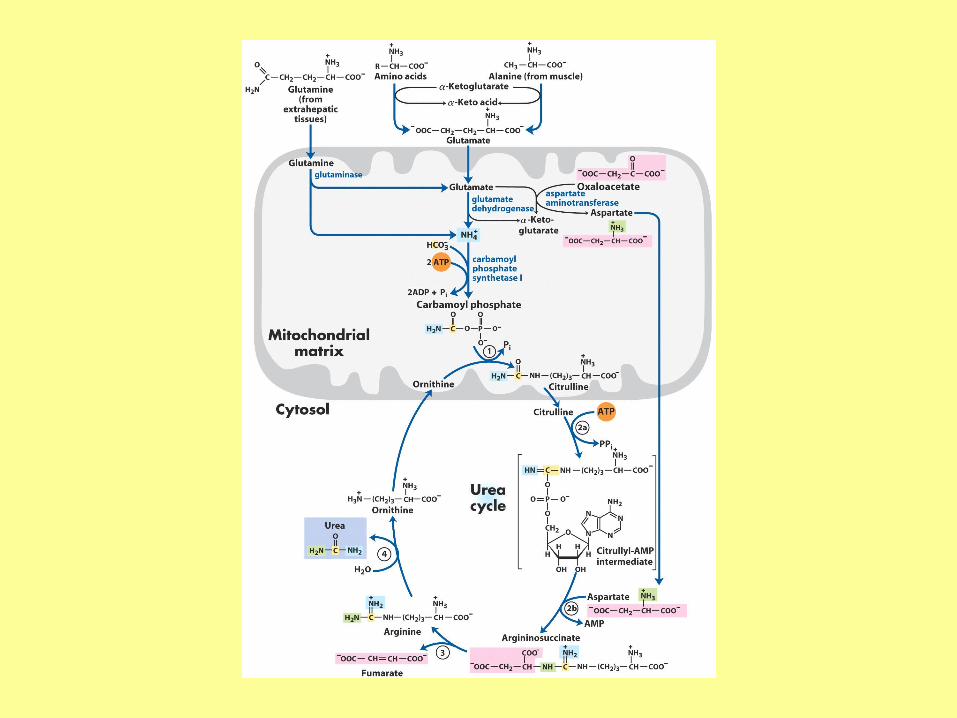
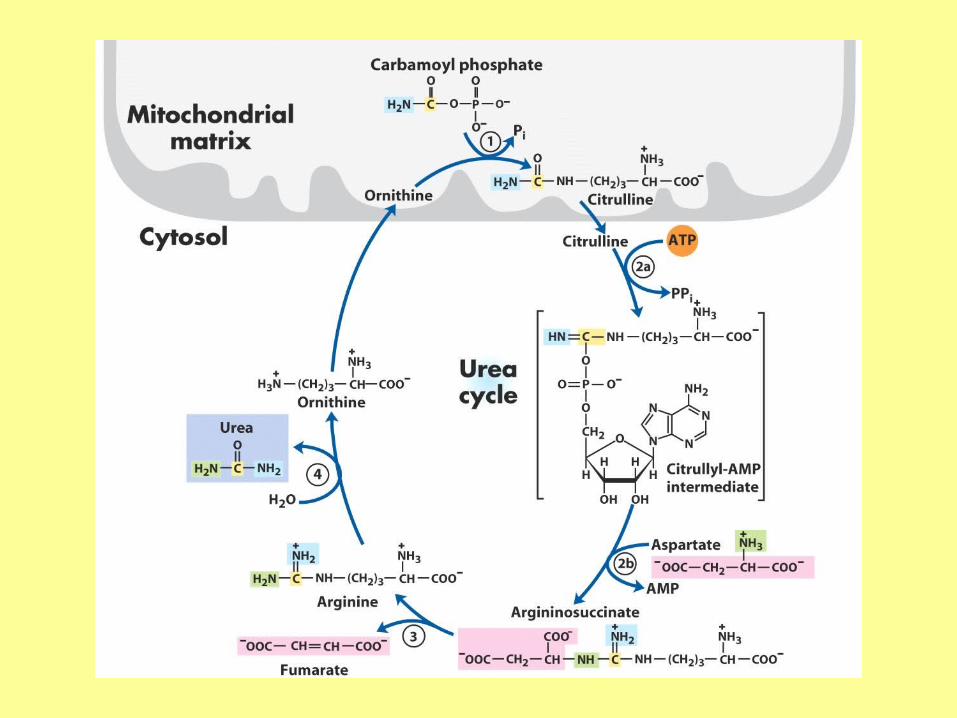
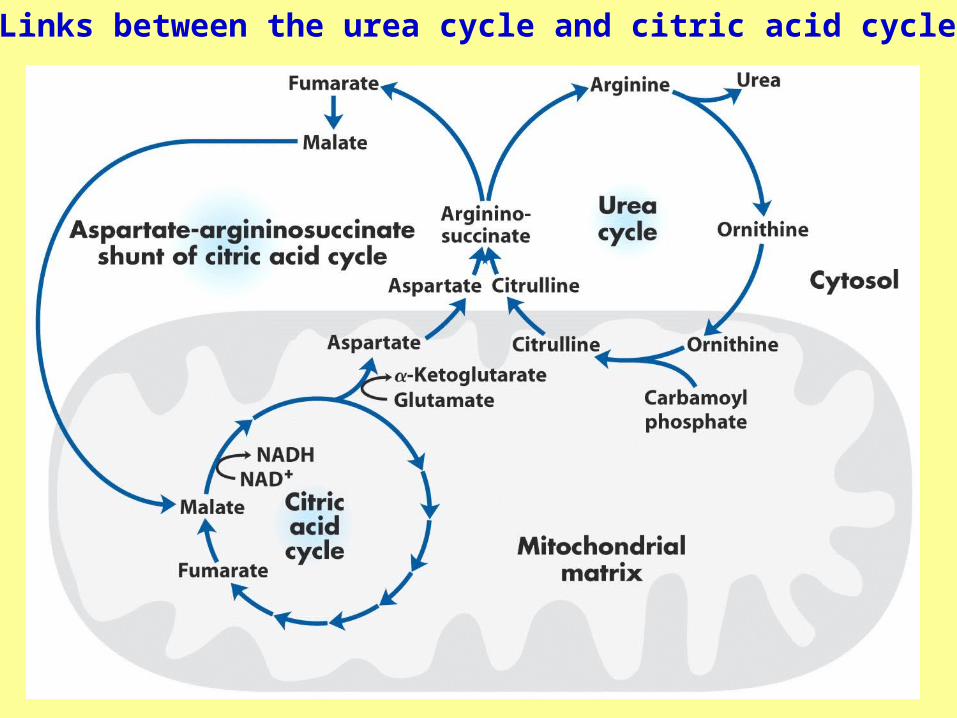
Links between the urea cycle and citric acid cycle

Page 17: Amino acid metabolism II. The urea cycle Figures: Lehninger-4ed; chapter: 18 Stryer-5ed; chapter: 23.

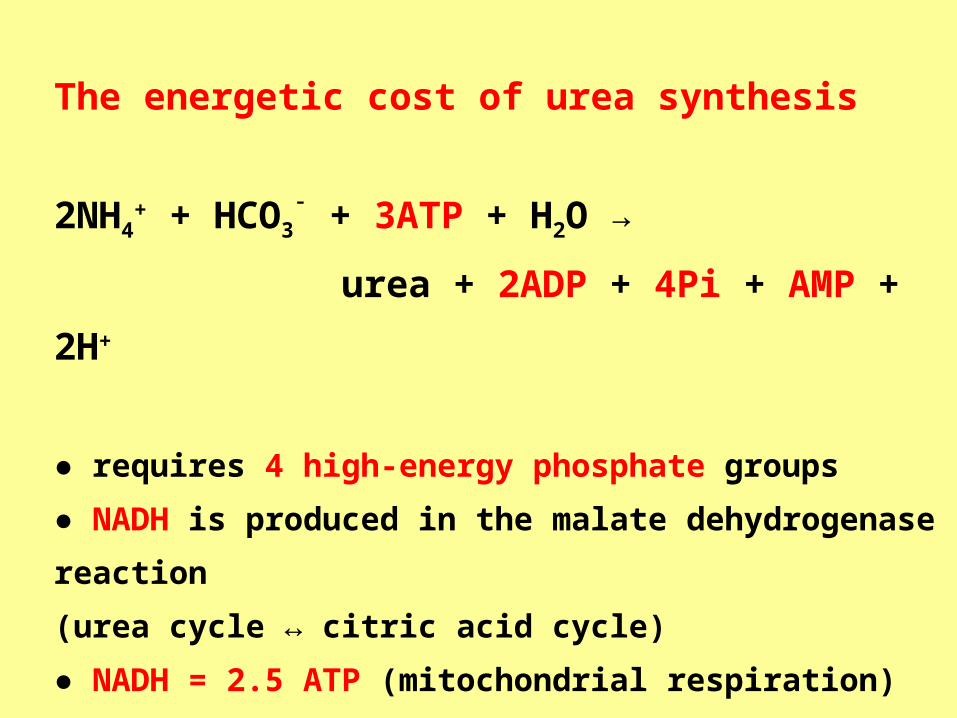
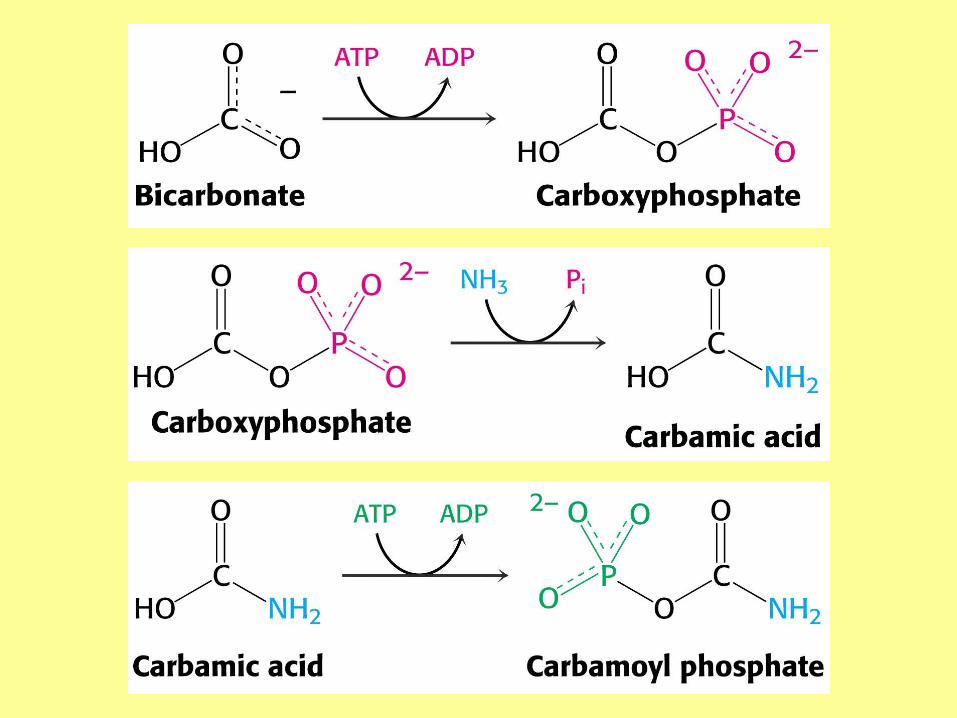
The energetic cost of urea synthesis

2NH4+ + HCO3

¯ + 3ATP + H2O →

urea + 2ADP + 4Pi + AMP + 2H+

● requires 4 high-energy phosphate groups

● NADH is produced in the malate dehydrogenase reaction

(urea cycle ↔ citric acid cycle)

● NADH = 2.5 ATP (mitochondrial respiration)

The overall energetic cost of urea synthesis is reduced!

Page 18: Amino acid metabolism II. The urea cycle Figures: Lehninger-4ed; chapter: 18 Stryer-5ed; chapter: 23.

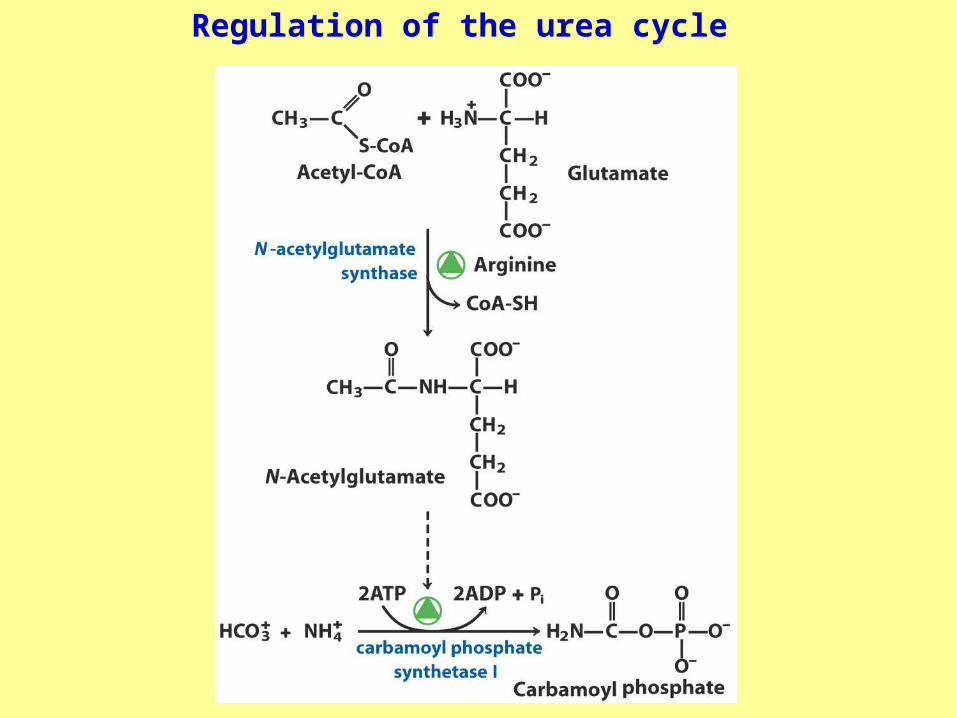
Regulation of the urea cycle