CRS Report for Congress Prepared for Members and Committees of Congress American War and Military Operations Casualties: Lists and Statistics Anne Leland Information Research Specialist Mari-Jana "M-J" Oboroceanu Information Research Specialist February 26, 2010 Congressional Research Service 7-5700 www.crs.gov RL32492

Welcome message from author
This document is posted to help you gain knowledge. Please leave a comment to let me know what you think about it! Share it to your friends and learn new things together.
Transcript
CRS Report for CongressPrepared for Members and Committees of Congress
American War and Military Operations Casualties: Lists and Statistics
Anne Leland Information Research Specialist
Mari-Jana "M-J" Oboroceanu Information Research Specialist
February 26, 2010
Congressional Research Service
7-5700 www.crs.gov
RL32492
American War and Military Operations Casualties: Lists and Statistics
Congressional Research Service
Summary This report is written in response to numerous requests for war casualty statistics and lists of war dead. It provides tables, compiled by sources at the Department of Defense (DOD), indicating the number of casualties among American military personnel serving in principal wars and combat actions.
Wars covered include the Revolutionary War, the War of 1812, the Mexican War, the Civil War, the Spanish-American War, World War I, World War II, the Korean War, the Vietnam Conflict, and the Persian Gulf War. Military operations covered include the Iranian Hostage Rescue Mission, Lebanon Peacekeeping, Urgent Fury in Grenada, Just Cause in Panama, Desert Shield and Desert Storm, Restore Hope in Somalia, Uphold Democracy in Haiti, and the ongoing Operation Enduring Freedom (OEF) and Operation Iraqi Freedom (OIF).
For the more recent conflicts, starting with the Korean War, more detailed information on types of casualties, and, when available, demographics have been included. This report also cites sources of published lists of military personnel killed in principal wars and combat actions.
This report will be updated as events warrant.
American War and Military Operations Casualties: Lists and Statistics
Congressional Research Service
Contents Introduction ................................................................................................................................1
Resources ................................................................................................................................. 20 Sources of Statistics ............................................................................................................ 20 Sources of Published Lists of Names of War Dead............................................................... 20 Additional Websites ............................................................................................................ 26 CRS Reports ....................................................................................................................... 26
Tables Table 1. Principal Wars in Which the United States Participated: U.S. Military Personnel
Serving and Casualties .............................................................................................................2
Table 2. Worldwide U.S. Active Duty Military Deaths—Selected Military Operations .................5
Table 3. Active Duty Military Deaths—Race/Ethnicity Summary ................................................6
Table 4. U.S. Active Duty Military Deaths, 1980 Through 2008, Part I, Total Military Personnel .................................................................................................................................7
Table 5. U.S. Active Duty Military Deaths, 1980 Through 2008, Part II, Cause of Death .............8
Table 6. Comparison of Death, Wounded and Amputation Statistics in American Conflicts ..................................................................................................................................9
Table 7. Korean War: Casualty Summary .................................................................................. 10
Table 8. Vietnam Conflict: Casualty Summary .......................................................................... 11
Table 9. Persian Gulf War: Casualty Summary Desert Shield/Desert Storm ............................... 12
Table 10. Global War on Terrorism: Operation Enduring Freedom by Casualty Category Within Service ....................................................................................................................... 13
Table 11. Operation Enduring Freedom, Demographics of Military Deaths................................ 14
Table 12. Operation Enduring Freedom, Military Wounded in Action ........................................ 15
Table 13. Operation Iraqi Freedom, by Casualty Category Within Service, March 19, 2003, Through February 6, 2010 ............................................................................................ 16
Table 14. Operation Iraqi Freedom: Military Deaths, March 19, 2003, Through February 6, 2010................................................................................................................................... 17
Table 15. Operation Iraqi Freedom: Military Deaths, Since May 1, 2003 ................................... 18
Table 16. Operation Iraqi Freedom: Wounded In Action, Since May 1, 2003.............................. 19
Contacts Author Contact Information ...................................................................................................... 27
Acknowledgments .................................................................................................................... 27
American War and Military Operations Casualties: Lists and Statistics
Congressional Research Service 1
Introduction This report is written in response to numerous requests for war casualty statistics and lists of war dead. It provides tables, compiled by sources at the Department of Defense (DOD), indicating the number of fatalities and numbers of wounded among American military personnel serving in principal wars and combat actions from the Revolutionary War to the current Operation Iraqi Freedom (OIF) and Operation Enduring Freedom (OEF; operations in Afghanistan and related conflicts).
A review of the composite data reveals the following.
• During the period between the Revolutionary War and the present, it was the Civil War that produced the most American fatalities, when Union statistics and Confederate estimates are taken into account.
• World War II was the first war in which there were more battle deaths than deaths from other causes such as accidents, disease, and infections.
• With a total of 383 in-theater deaths, 147 of which were battle deaths, the Persian Gulf War was the least costly in terms of fatalities (see Table 1).
• The ongoing Operation Iraqi Freedom to date has produced more than 10 times the number of in-theater deaths than the Persian Gulf War (which lasted seven months).
The casualty statistics for wars long ended are updated periodically, sometimes yearly. This almost always reflects the identification of remains of persons previously listed as missing in action and those persons’ reclassification as dead. Other reasons, much rarer, include the discovery of errors in casualty records for individuals or categories of people.
American War and Military Operations Casualties: Lists and Statistics
Congressional Research Service 2
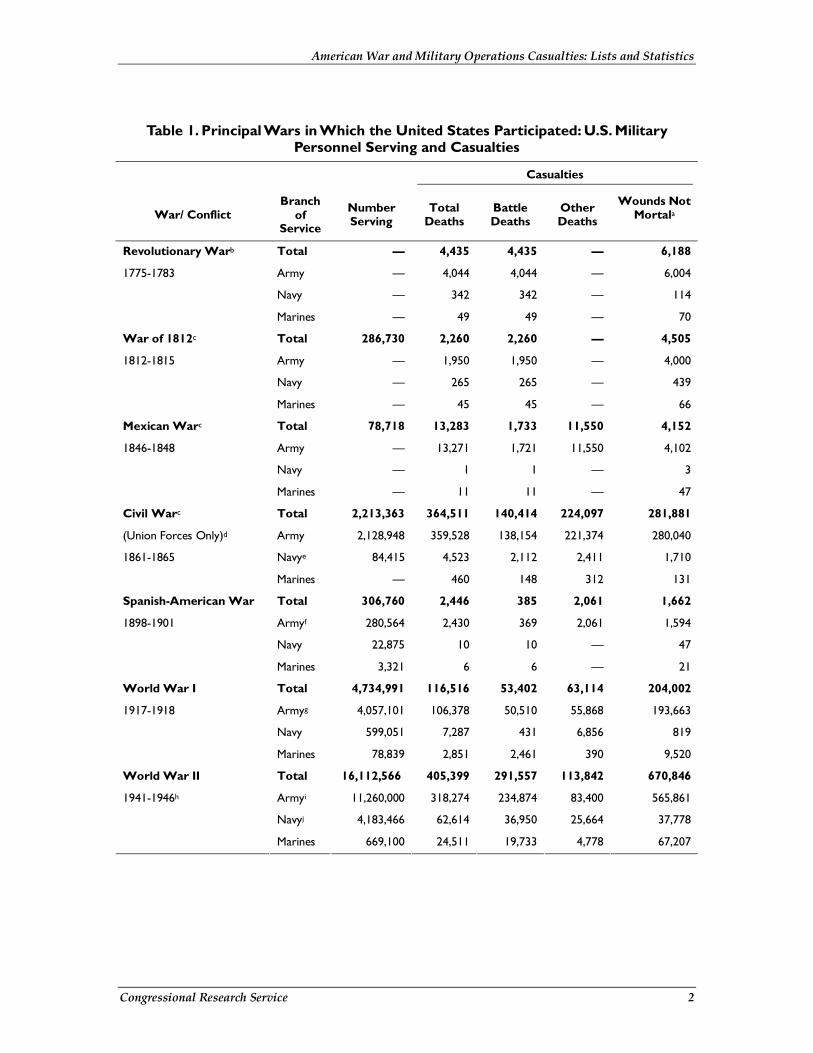
Table 1. Principal Wars in Which the United States Participated: U.S. Military Personnel Serving and Casualties
Casualties
War/ Conflict Branch
of Service
Number Serving
Total Deaths
Battle Deaths
Other Deaths
Wounds Not Mortala
Total — 4,435 4,435 — 6,188
Army — 4,044 4,044 — 6,004
Navy — 342 342 — 114
Revolutionary Warb
1775-1783
Marines — 49 49 — 70
Total 286,730 2,260 2,260 — 4,505
Army — 1,950 1,950 — 4,000
Navy — 265 265 — 439
War of 1812c
1812-1815
Marines — 45 45 — 66
Total 78,718 13,283 1,733 11,550 4,152
Army — 13,271 1,721 11,550 4,102
Navy — 1 1 — 3
Mexican Warc
1846-1848
Marines — 11 11 — 47
Total 2,213,363 364,511 140,414 224,097 281,881
Army 2,128,948 359,528 138,154 221,374 280,040
Navye 84,415 4,523 2,112 2,411 1,710
Civil Warc
(Union Forces Only)d
1861-1865
Marines — 460 148 312 131
Total 306,760 2,446 385 2,061 1,662
Armyf 280,564 2,430 369 2,061 1,594
Navy 22,875 10 10 — 47
Spanish-American War
1898-1901
Marines 3,321 6 6 — 21
Total 4,734,991 116,516 53,402 63,114 204,002
Armyg 4,057,101 106,378 50,510 55,868 193,663
Navy 599,051 7,287 431 6,856 819
World War I
1917-1918
Marines 78,839 2,851 2,461 390 9,520
Total 16,112,566 405,399 291,557 113,842 670,846
Armyi 11,260,000 318,274 234,874 83,400 565,861
Navyj 4,183,466 62,614 36,950 25,664 37,778
World War II
1941-1946h
Marines 669,100 24,511 19,733 4,778 67,207
American War and Military Operations Casualties: Lists and Statistics
Congressional Research Service 3
Casualties
War/ Conflict Branch
of Service
Number Serving
Total Deaths
Battle Deaths
Other Deaths
Wounds Not Mortala
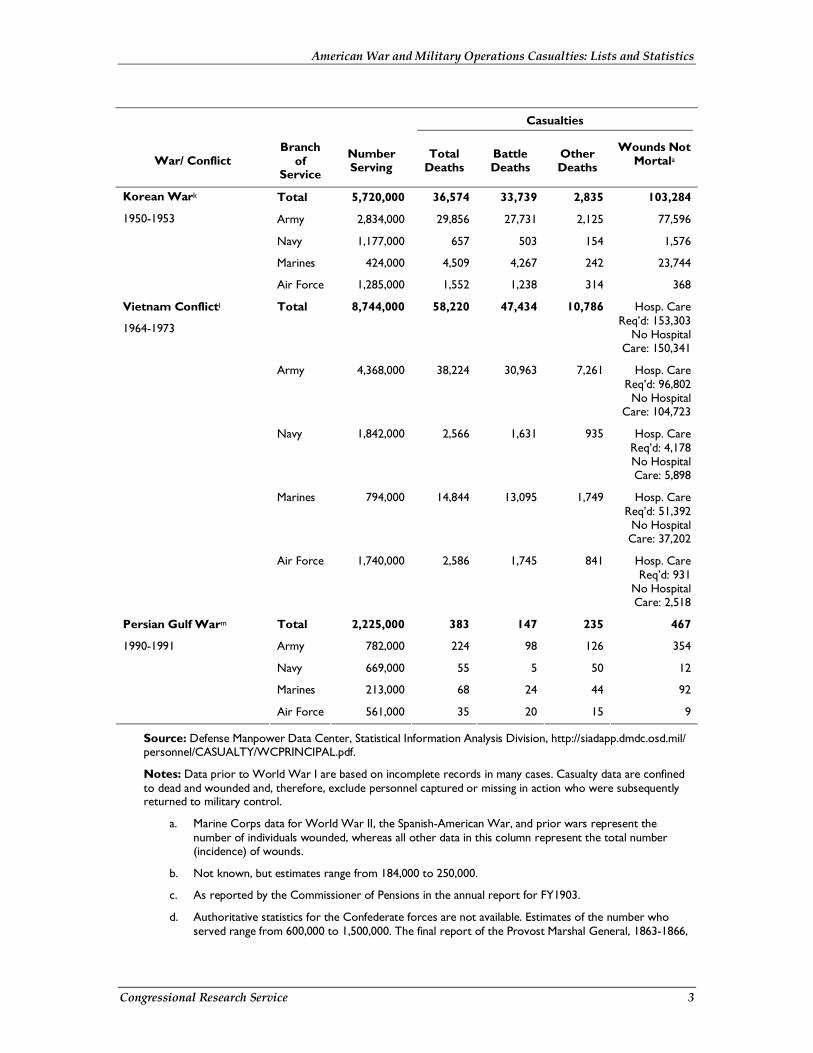
Total 5,720,000 36,574 33,739 2,835 103,284
Army 2,834,000 29,856 27,731 2,125 77,596
Navy 1,177,000 657 503 154 1,576
Marines 424,000 4,509 4,267 242 23,744
Korean Wark
1950-1953
Air Force 1,285,000 1,552 1,238 314 368
Total 8,744,000 58,220 47,434 10,786 Hosp. Care Req’d: 153,303
No Hospital Care: 150,341
Army 4,368,000 38,224 30,963 7,261 Hosp. Care Req’d: 96,802No Hospital
Care: 104,723
Navy 1,842,000 2,566 1,631 935 Hosp. Care Req’d: 4,178No Hospital Care: 5,898
Marines 794,000 14,844 13,095 1,749 Hosp. Care Req’d: 51,392No Hospital Care: 37,202
Vietnam Conflictl
1964-1973
Air Force 1,740,000 2,586 1,745 841 Hosp. Care Req’d: 931
No Hospital Care: 2,518
Total 2,225,000 383 147 235 467
Army 782,000 224 98 126 354
Navy 669,000 55 5 50 12
Marines 213,000 68 24 44 92
Persian Gulf Warm
1990-1991
Air Force 561,000 35 20 15 9
Source: Defense Manpower Data Center, Statistical Information Analysis Division, http://siadapp.dmdc.osd.mil/personnel/CASUALTY/WCPRINCIPAL.pdf.
Notes: Data prior to World War I are based on incomplete records in many cases. Casualty data are confined to dead and wounded and, therefore, exclude personnel captured or missing in action who were subsequently returned to military control.
a. Marine Corps data for World War II, the Spanish-American War, and prior wars represent the number of individuals wounded, whereas all other data in this column represent the total number (incidence) of wounds.
b. Not known, but estimates range from 184,000 to 250,000.
c. As reported by the Commissioner of Pensions in the annual report for FY1903.
d. Authoritative statistics for the Confederate forces are not available. Estimates of the number who served range from 600,000 to 1,500,000. The final report of the Provost Marshal General, 1863-1866,
American War and Military Operations Casualties: Lists and Statistics
Congressional Research Service 4
indicated 133,821Confederate deaths (74,524 battle and 59,297 other) based upon incomplete returns. In addition, an estimated 26,000 to 31,000 Confederate personnel died in Union prisons.
e. The Marine Corps number serving is included in the Navy total.
f. Number serving covers the period April 21 to August 13, 1898, while dead and wounded data are for the period May 1 to August 31, 1898. Active hostilities ceased on August 13, 1898, but ratifications of the Treaty of Peace were not exchanged between the United States and Spain until April 11, 1899.
g. Includes air service. Battle deaths and wounds not mortal include casualties suffered by American forces in northern Russia to August 25, 1919, and in Siberia to April 1, 1920. Other deaths cover the period April 1, 1917, to December 31, 1918.
h. Data are for the period December 1, 1941, through December 31, 1946, when hostilities were officially terminated by presidential proclamation, but a few battle deaths or wounds not mortal were incurred after the Japanese acceptance of the Allied peace terms on August 14, 1945. Number serving from December 1, 1941, through August 31, 1945, were: Total 14,903,213; Army 10,420,000; Navy 3,883,520; and Marine Corps 599,693.
i. Includes Army air forces, also known as the Army Air Corps.
j. Battle deaths and wounds not mortal include casualties incurred in October 1941 due to hostile action.
k. Worldwide military deaths during the Korean War totaled 54,246. In-theater casualty records are updated annually.
l. Number serving covers the period August 5, 1964, (“Vietnam era” begins) through January 27, 1973 (date of cease-fire). Deaths include the period November 1, 1955, (commencement date for the Military Assistance Advisory Group) through May 15, 1975 (date last American servicemember left Southeast Asia, i.e. Vietnam). Wounds not mortal exclude 150,332 persons not requiring hospital care. Casualty records are updated annually, including current deaths that are directly attributed to combat in the Vietnam Conflict. Additional detail now on table shows number of WIA servicemembers not requiring hospital care.
m. Coast Guard numbers are included with Navy. Casualty records are updated annually.
American War and Military Operations Casualties: Lists and Statistics
Congressional Research Service 5
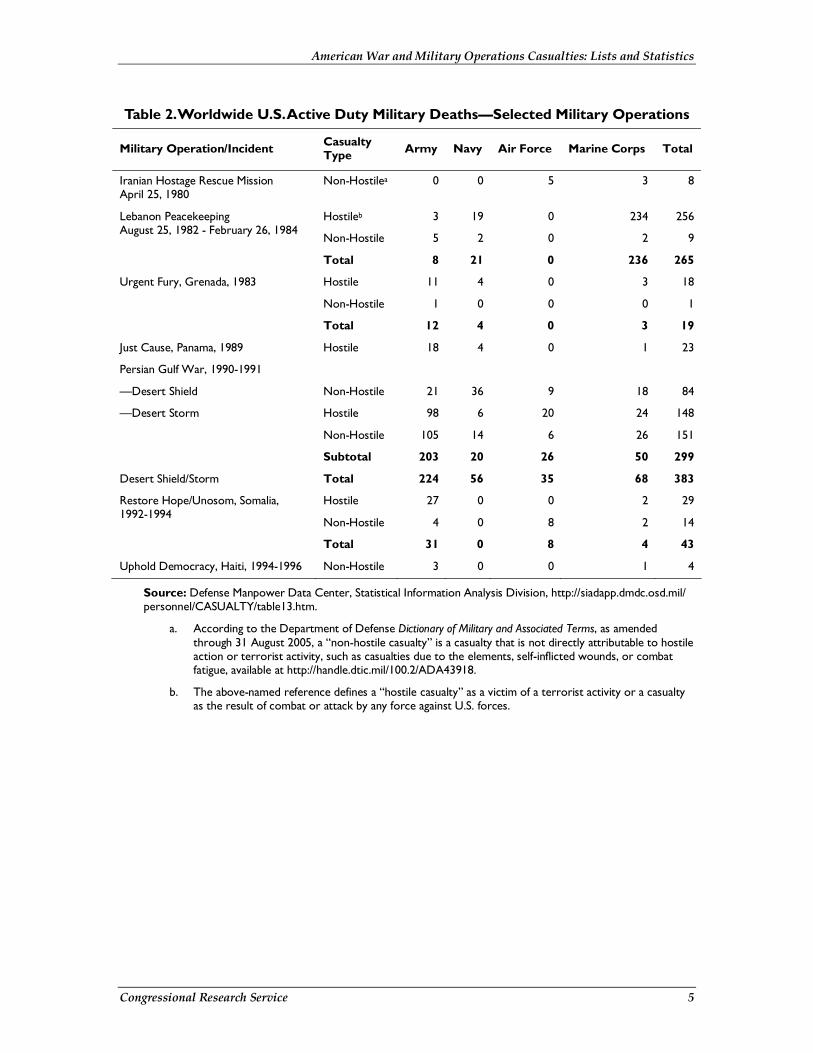
Table 2. Worldwide U.S. Active Duty Military Deaths—Selected Military Operations
Military Operation/Incident Casualty Type Army Navy Air Force Marine Corps Total
Iranian Hostage Rescue Mission April 25, 1980
Non-Hostilea 0 0 5 3 8
Hostileb 3 19 0 234 256
Non-Hostile 5 2 0 2 9
Lebanon Peacekeeping August 25, 1982 - February 26, 1984
Total 8 21 0 236 265
Hostile 11 4 0 3 18
Non-Hostile 1 0 0 0 1
Urgent Fury, Grenada, 1983
Total 12 4 0 3 19
Just Cause, Panama, 1989 Hostile 18 4 0 1 23
Persian Gulf War, 1990-1991
—Desert Shield Non-Hostile 21 36 9 18 84
Hostile 98 6 20 24 148
Non-Hostile 105 14 6 26 151
—Desert Storm
Subtotal 203 20 26 50 299
Desert Shield/Storm Total 224 56 35 68 383
Hostile 27 0 0 2 29
Non-Hostile 4 0 8 2 14
Restore Hope/Unosom, Somalia, 1992-1994
Total 31 0 8 4 43
Uphold Democracy, Haiti, 1994-1996 Non-Hostile 3 0 0 1 4
Source: Defense Manpower Data Center, Statistical Information Analysis Division, http://siadapp.dmdc.osd.mil/personnel/CASUALTY/table13.htm.
a. According to the Department of Defense Dictionary of Military and Associated Terms, as amended through 31 August 2005, a “non-hostile casualty” is a casualty that is not directly attributable to hostile action or terrorist activity, such as casualties due to the elements, self-inflicted wounds, or combat fatigue, available at http://handle.dtic.mil/100.2/ADA43918.
b. The above-named reference defines a “hostile casualty” as a victim of a terrorist activity or a casualty as the result of combat or attack by any force against U.S. forces.
American War and Military Operations Casualties: Lists and Statistics
Congressional Research Service 6
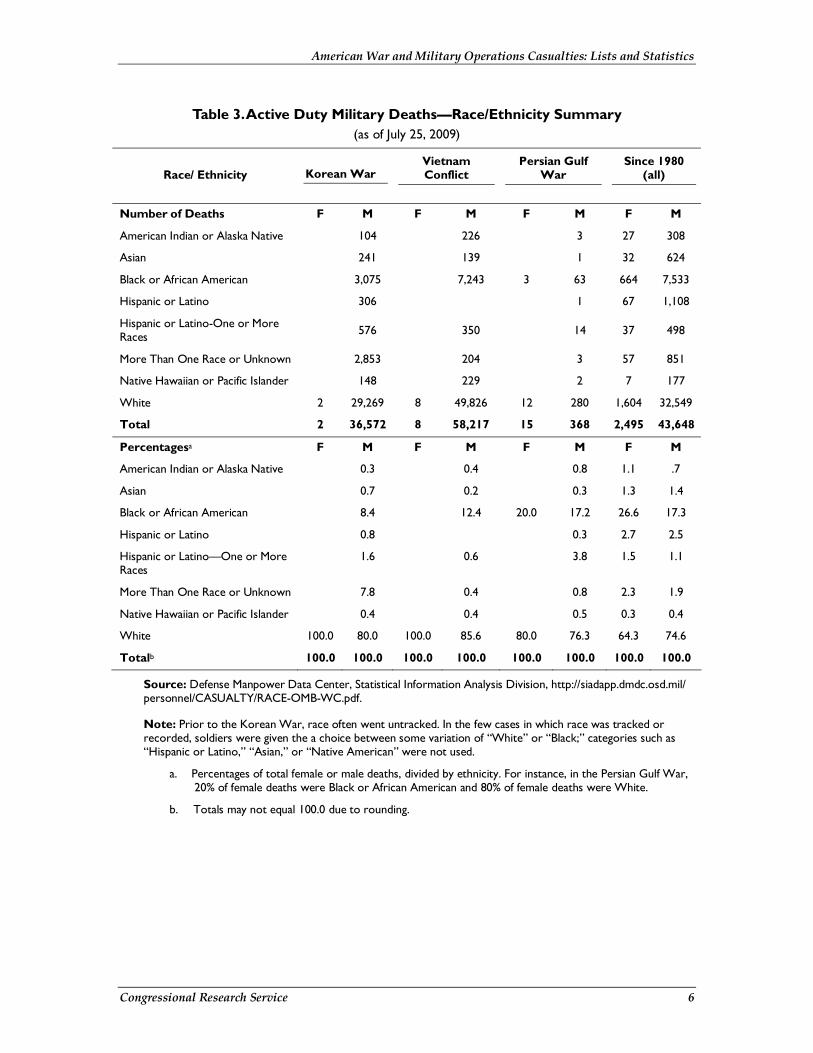
Table 3. Active Duty Military Deaths—Race/Ethnicity Summary (as of July 25, 2009)
Race/ Ethnicity Korean War Vietnam Conflict
Persian Gulf War
Since 1980 (all)
Number of Deaths F M F M F M F M
American Indian or Alaska Native 104 226 3 27 308
Asian 241 139 1 32 624
Black or African American 3,075 7,243 3 63 664 7,533
Hispanic or Latino 306 1 67 1,108
Hispanic or Latino-One or More Races 576 350 14 37 498
More Than One Race or Unknown 2,853 204 3 57 851
Native Hawaiian or Pacific Islander 148 229 2 7 177
White 2 29,269 8 49,826 12 280 1,604 32,549
Total 2 36,572 8 58,217 15 368 2,495 43,648
Percentagesa F M F M F M F M
American Indian or Alaska Native 0.3 0.4 0.8 1.1 .7
Asian 0.7 0.2 0.3 1.3 1.4
Black or African American 8.4 12.4 20.0 17.2 26.6 17.3
Hispanic or Latino 0.8 0.3 2.7 2.5
Hispanic or Latino—One or More Races
1.6 0.6 3.8 1.5 1.1
More Than One Race or Unknown 7.8 0.4 0.8 2.3 1.9
Native Hawaiian or Pacific Islander 0.4 0.4 0.5 0.3 0.4
White 100.0 80.0 100.0 85.6 80.0 76.3 64.3 74.6
Totalb 100.0 100.0 100.0 100.0 100.0 100.0 100.0 100.0
Source: Defense Manpower Data Center, Statistical Information Analysis Division, http://siadapp.dmdc.osd.mil/personnel/CASUALTY/RACE-OMB-WC.pdf.
Note: Prior to the Korean War, race often went untracked. In the few cases in which race was tracked or recorded, soldiers were given the a choice between some variation of “White” or “Black;” categories such as “Hispanic or Latino,” “Asian,” or “Native American” were not used.
a. Percentages of total female or male deaths, divided by ethnicity. For instance, in the Persian Gulf War, 20% of female deaths were Black or African American and 80% of female deaths were White.
b. Totals may not equal 100.0 due to rounding.
American War and Military Operations Casualties: Lists and Statistics
Congressional Research Service 7
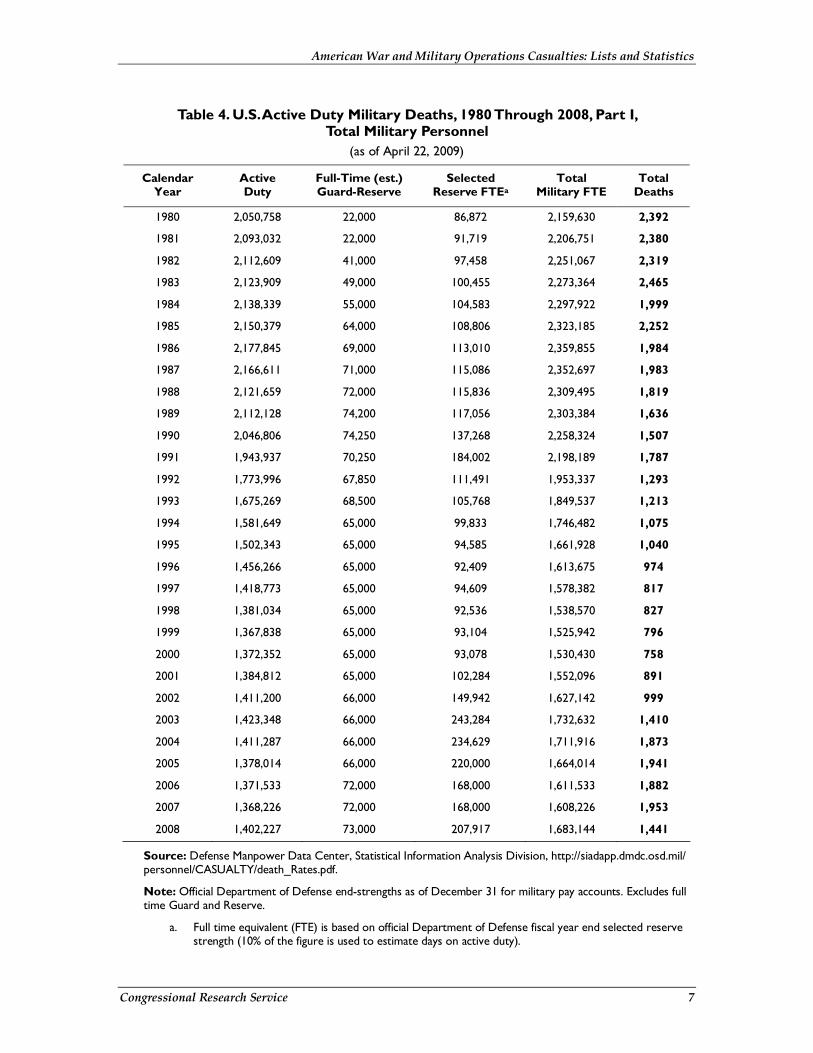
Table 4. U.S. Active Duty Military Deaths, 1980 Through 2008, Part I, Total Military Personnel
(as of April 22, 2009)
Calendar Year
Active Duty
Full-Time (est.) Guard-Reserve
Selected Reserve FTEa
Total Military FTE
Total Deaths
1980 2,050,758 22,000 86,872 2,159,630 2,392
1981 2,093,032 22,000 91,719 2,206,751 2,380
1982 2,112,609 41,000 97,458 2,251,067 2,319
1983 2,123,909 49,000 100,455 2,273,364 2,465
1984 2,138,339 55,000 104,583 2,297,922 1,999
1985 2,150,379 64,000 108,806 2,323,185 2,252
1986 2,177,845 69,000 113,010 2,359,855 1,984
1987 2,166,611 71,000 115,086 2,352,697 1,983
1988 2,121,659 72,000 115,836 2,309,495 1,819
1989 2,112,128 74,200 117,056 2,303,384 1,636
1990 2,046,806 74,250 137,268 2,258,324 1,507
1991 1,943,937 70,250 184,002 2,198,189 1,787
1992 1,773,996 67,850 111,491 1,953,337 1,293
1993 1,675,269 68,500 105,768 1,849,537 1,213
1994 1,581,649 65,000 99,833 1,746,482 1,075
1995 1,502,343 65,000 94,585 1,661,928 1,040
1996 1,456,266 65,000 92,409 1,613,675 974
1997 1,418,773 65,000 94,609 1,578,382 817
1998 1,381,034 65,000 92,536 1,538,570 827
1999 1,367,838 65,000 93,104 1,525,942 796
2000 1,372,352 65,000 93,078 1,530,430 758
2001 1,384,812 65,000 102,284 1,552,096 891
2002 1,411,200 66,000 149,942 1,627,142 999
2003 1,423,348 66,000 243,284 1,732,632 1,410
2004 1,411,287 66,000 234,629 1,711,916 1,873
2005 1,378,014 66,000 220,000 1,664,014 1,941
2006 1,371,533 72,000 168,000 1,611,533 1,882
2007 1,368,226 72,000 168,000 1,608,226 1,953
2008 1,402,227 73,000 207,917 1,683,144 1,441
Source: Defense Manpower Data Center, Statistical Information Analysis Division, http://siadapp.dmdc.osd.mil/personnel/CASUALTY/death_Rates.pdf.
Note: Official Department of Defense end-strengths as of December 31 for military pay accounts. Excludes full time Guard and Reserve.
a. Full time equivalent (FTE) is based on official Department of Defense fiscal year end selected reserve strength (10% of the figure is used to estimate days on active duty).
American War and Military Operations Casualties: Lists and Statistics
Congressional Research Service 8
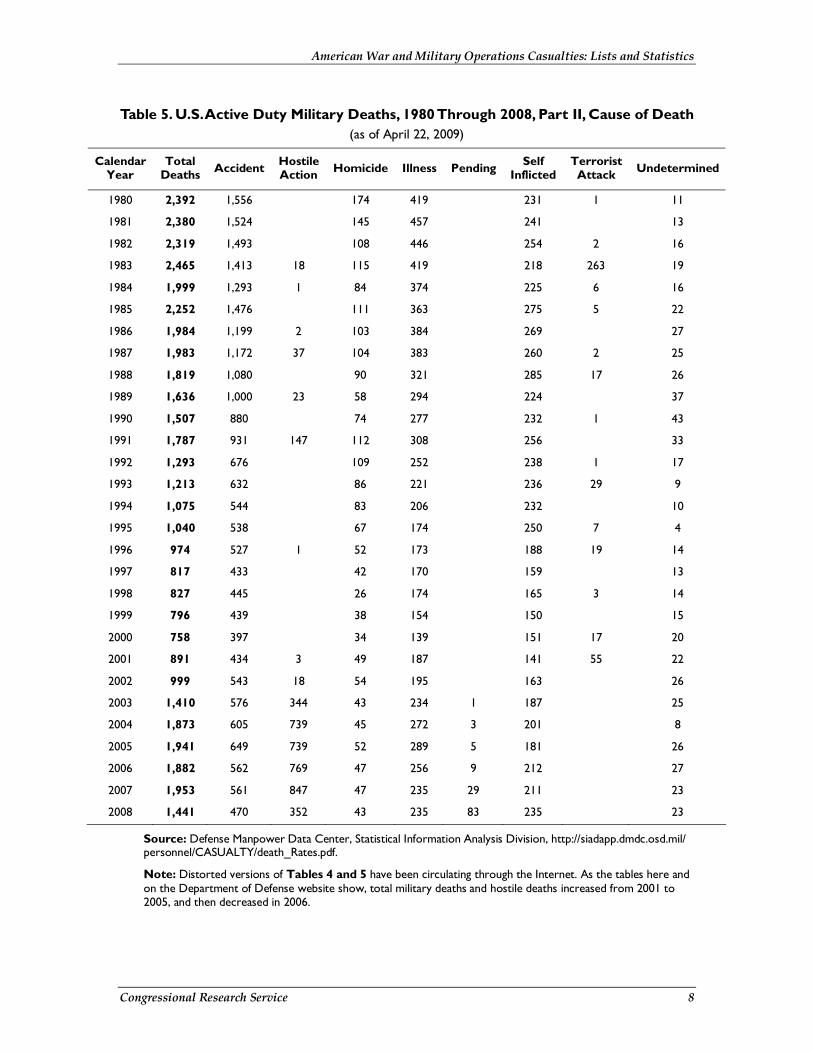
Table 5. U.S. Active Duty Military Deaths, 1980 Through 2008, Part II, Cause of Death (as of April 22, 2009)
Calendar Year
Total Deaths Accident Hostile
Action Homicide Illness Pending Self Inflicted
Terrorist Attack Undetermined
1980 2,392 1,556 174 419 231 1 11
1981 2,380 1,524 145 457 241 13
1982 2,319 1,493 108 446 254 2 16
1983 2,465 1,413 18 115 419 218 263 19
1984 1,999 1,293 1 84 374 225 6 16
1985 2,252 1,476 111 363 275 5 22
1986 1,984 1,199 2 103 384 269 27
1987 1,983 1,172 37 104 383 260 2 25
1988 1,819 1,080 90 321 285 17 26
1989 1,636 1,000 23 58 294 224 37
1990 1,507 880 74 277 232 1 43
1991 1,787 931 147 112 308 256 33
1992 1,293 676 109 252 238 1 17
1993 1,213 632 86 221 236 29 9
1994 1,075 544 83 206 232 10
1995 1,040 538 67 174 250 7 4
1996 974 527 1 52 173 188 19 14
1997 817 433 42 170 159 13
1998 827 445 26 174 165 3 14
1999 796 439 38 154 150 15
2000 758 397 34 139 151 17 20
2001 891 434 3 49 187 141 55 22
2002 999 543 18 54 195 163 26
2003 1,410 576 344 43 234 1 187 25
2004 1,873 605 739 45 272 3 201 8
2005 1,941 649 739 52 289 5 181 26
2006 1,882 562 769 47 256 9 212 27
2007 1,953 561 847 47 235 29 211 23
2008 1,441 470 352 43 235 83 235 23
Source: Defense Manpower Data Center, Statistical Information Analysis Division, http://siadapp.dmdc.osd.mil/personnel/CASUALTY/death_Rates.pdf.
Note: Distorted versions of Tables 4 and 5 have been circulating through the Internet. As the tables here and on the Department of Defense website show, total military deaths and hostile deaths increased from 2001 to 2005, and then decreased in 2006.
American War and Military Operations Casualties: Lists and Statistics
Congressional Research Service 9
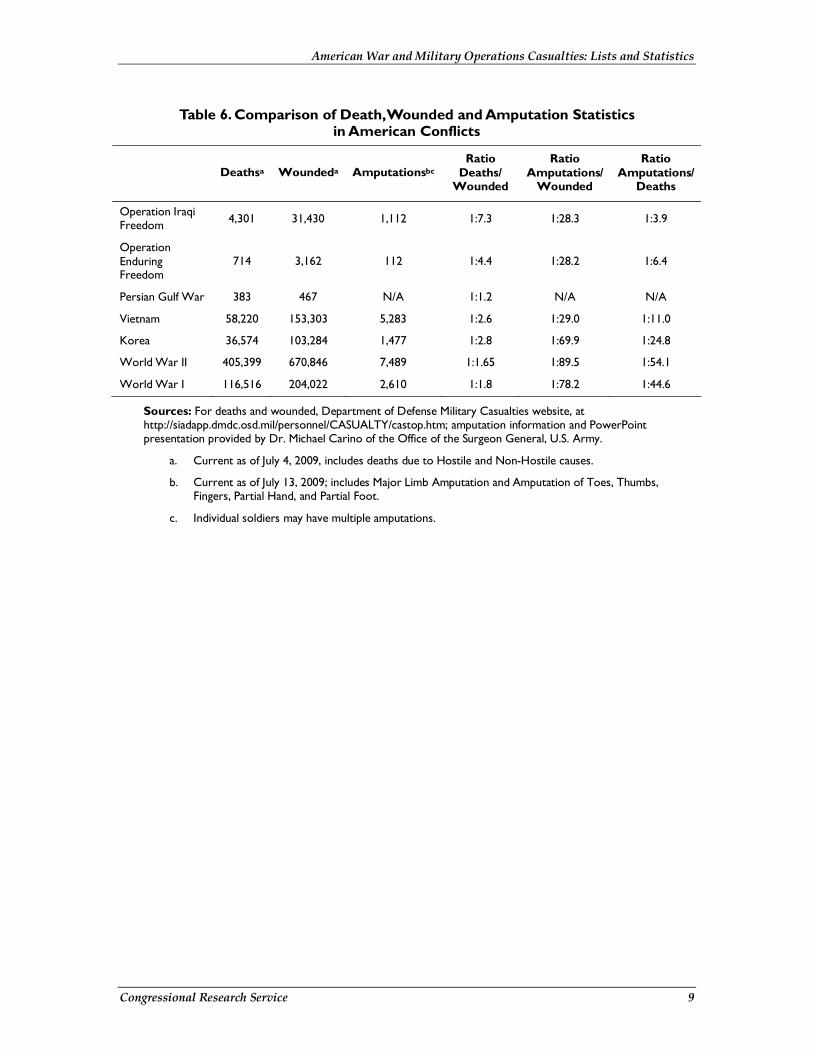
Table 6. Comparison of Death, Wounded and Amputation Statistics in American Conflicts
Deathsa Woundeda Amputationsbc
Ratio Deaths/
Wounded
Ratio Amputations/
Wounded
Ratio Amputations/
Deaths
Operation Iraqi Freedom 4,301 31,430 1,112 1:7.3 1:28.3 1:3.9
Operation Enduring Freedom
714 3,162 112 1:4.4 1:28.2 1:6.4
Persian Gulf War 383 467 N/A 1:1.2 N/A N/A
Vietnam 58,220 153,303 5,283 1:2.6 1:29.0 1:11.0
Korea 36,574 103,284 1,477 1:2.8 1:69.9 1:24.8
World War II 405,399 670,846 7,489 1:1.65 1:89.5 1:54.1
World War I 116,516 204,022 2,610 1:1.8 1:78.2 1:44.6
Sources: For deaths and wounded, Department of Defense Military Casualties website, at http://siadapp.dmdc.osd.mil/personnel/CASUALTY/castop.htm; amputation information and PowerPoint presentation provided by Dr. Michael Carino of the Office of the Surgeon General, U.S. Army.
a. Current as of July 4, 2009, includes deaths due to Hostile and Non-Hostile causes.
b. Current as of July 13, 2009; includes Major Limb Amputation and Amputation of Toes, Thumbs, Fingers, Partial Hand, and Partial Foot.
c. Individual soldiers may have multiple amputations.
American War and Military Operations Casualties: Lists and Statistics
Congressional Research Service 10
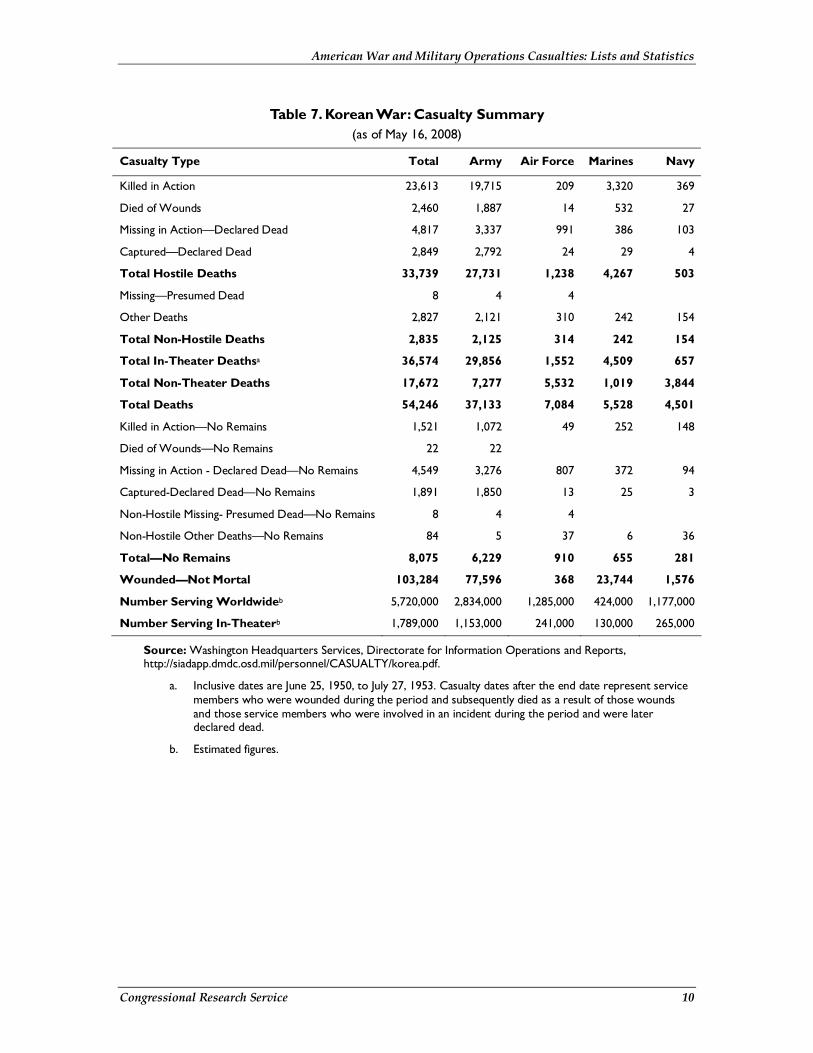
Table 7. Korean War: Casualty Summary (as of May 16, 2008)
Casualty Type Total Army Air Force Marines Navy
Killed in Action 23,613 19,715 209 3,320 369
Died of Wounds 2,460 1,887 14 532 27
Missing in Action—Declared Dead 4,817 3,337 991 386 103
Captured—Declared Dead 2,849 2,792 24 29 4
Total Hostile Deaths 33,739 27,731 1,238 4,267 503
Missing—Presumed Dead 8 4 4
Other Deaths 2,827 2,121 310 242 154
Total Non-Hostile Deaths 2,835 2,125 314 242 154
Total In-Theater Deathsa 36,574 29,856 1,552 4,509 657
Total Non-Theater Deaths 17,672 7,277 5,532 1,019 3,844
Total Deaths 54,246 37,133 7,084 5,528 4,501
Killed in Action—No Remains 1,521 1,072 49 252 148
Died of Wounds—No Remains 22 22
Missing in Action - Declared Dead—No Remains 4,549 3,276 807 372 94
Captured-Declared Dead—No Remains 1,891 1,850 13 25 3
Non-Hostile Missing- Presumed Dead—No Remains 8 4 4
Non-Hostile Other Deaths—No Remains 84 5 37 6 36
Total—No Remains 8,075 6,229 910 655 281
Wounded—Not Mortal 103,284 77,596 368 23,744 1,576
Number Serving Worldwideb 5,720,000 2,834,000 1,285,000 424,000 1,177,000
Number Serving In-Theaterb 1,789,000 1,153,000 241,000 130,000 265,000
Source: Washington Headquarters Services, Directorate for Information Operations and Reports, http://siadapp.dmdc.osd.mil/personnel/CASUALTY/korea.pdf.
a. Inclusive dates are June 25, 1950, to July 27, 1953. Casualty dates after the end date represent service members who were wounded during the period and subsequently died as a result of those wounds and those service members who were involved in an incident during the period and were later declared dead.
b. Estimated figures.
American War and Military Operations Casualties: Lists and Statistics
Congressional Research Service 11
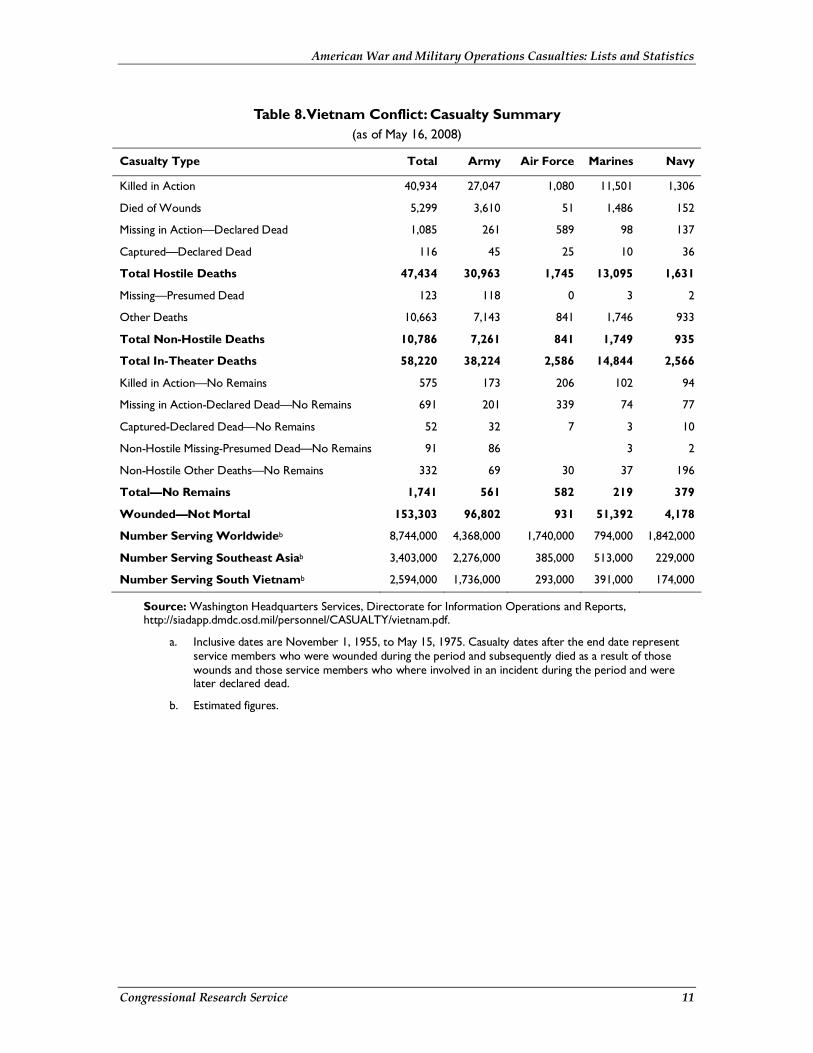
Table 8. Vietnam Conflict: Casualty Summary (as of May 16, 2008)
Casualty Type Total Army Air Force Marines Navy
Killed in Action 40,934 27,047 1,080 11,501 1,306
Died of Wounds 5,299 3,610 51 1,486 152
Missing in Action—Declared Dead 1,085 261 589 98 137
Captured—Declared Dead 116 45 25 10 36
Total Hostile Deaths 47,434 30,963 1,745 13,095 1,631
Missing—Presumed Dead 123 118 0 3 2
Other Deaths 10,663 7,143 841 1,746 933
Total Non-Hostile Deaths 10,786 7,261 841 1,749 935
Total In-Theater Deaths 58,220 38,224 2,586 14,844 2,566
Killed in Action—No Remains 575 173 206 102 94
Missing in Action-Declared Dead—No Remains 691 201 339 74 77
Captured-Declared Dead—No Remains 52 32 7 3 10
Non-Hostile Missing-Presumed Dead—No Remains 91 86 3 2
Non-Hostile Other Deaths—No Remains 332 69 30 37 196
Total—No Remains 1,741 561 582 219 379
Wounded—Not Mortal 153,303 96,802 931 51,392 4,178
Number Serving Worldwideb 8,744,000 4,368,000 1,740,000 794,000 1,842,000
Number Serving Southeast Asiab 3,403,000 2,276,000 385,000 513,000 229,000
Number Serving South Vietnamb 2,594,000 1,736,000 293,000 391,000 174,000
Source: Washington Headquarters Services, Directorate for Information Operations and Reports, http://siadapp.dmdc.osd.mil/personnel/CASUALTY/vietnam.pdf.
a. Inclusive dates are November 1, 1955, to May 15, 1975. Casualty dates after the end date represent service members who were wounded during the period and subsequently died as a result of those wounds and those service members who where involved in an incident during the period and were later declared dead.
b. Estimated figures.
American War and Military Operations Casualties: Lists and Statistics
Congressional Research Service 12
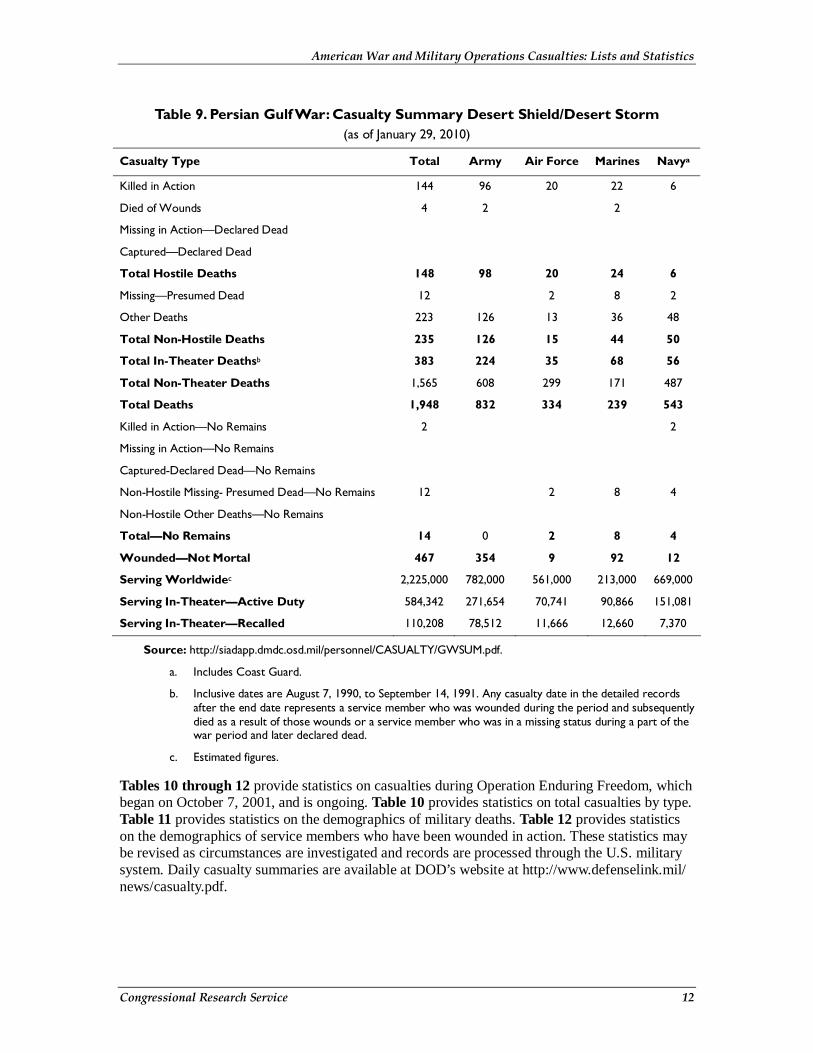
Table 9. Persian Gulf War: Casualty Summary Desert Shield/Desert Storm (as of January 29, 2010)
Casualty Type Total Army Air Force Marines Navya
Killed in Action 144 96 20 22 6
Died of Wounds 4 2 2
Missing in Action—Declared Dead
Captured—Declared Dead
Total Hostile Deaths 148 98 20 24 6
Missing—Presumed Dead 12 2 8 2
Other Deaths 223 126 13 36 48
Total Non-Hostile Deaths 235 126 15 44 50
Total In-Theater Deathsb 383 224 35 68 56
Total Non-Theater Deaths 1,565 608 299 171 487
Total Deaths 1,948 832 334 239 543
Killed in Action—No Remains 2 2
Missing in Action—No Remains
Captured-Declared Dead—No Remains
Non-Hostile Missing- Presumed Dead—No Remains 12 2 8 4
Non-Hostile Other Deaths—No Remains
Total—No Remains 14 0 2 8 4
Wounded—Not Mortal 467 354 9 92 12
Serving Worldwidec 2,225,000 782,000 561,000 213,000 669,000
Serving In-Theater—Active Duty 584,342 271,654 70,741 90,866 151,081
Serving In-Theater—Recalled 110,208 78,512 11,666 12,660 7,370
Source: http://siadapp.dmdc.osd.mil/personnel/CASUALTY/GWSUM.pdf.
a. Includes Coast Guard.
b. Inclusive dates are August 7, 1990, to September 14, 1991. Any casualty date in the detailed records after the end date represents a service member who was wounded during the period and subsequently died as a result of those wounds or a service member who was in a missing status during a part of the war period and later declared dead.
c. Estimated figures.
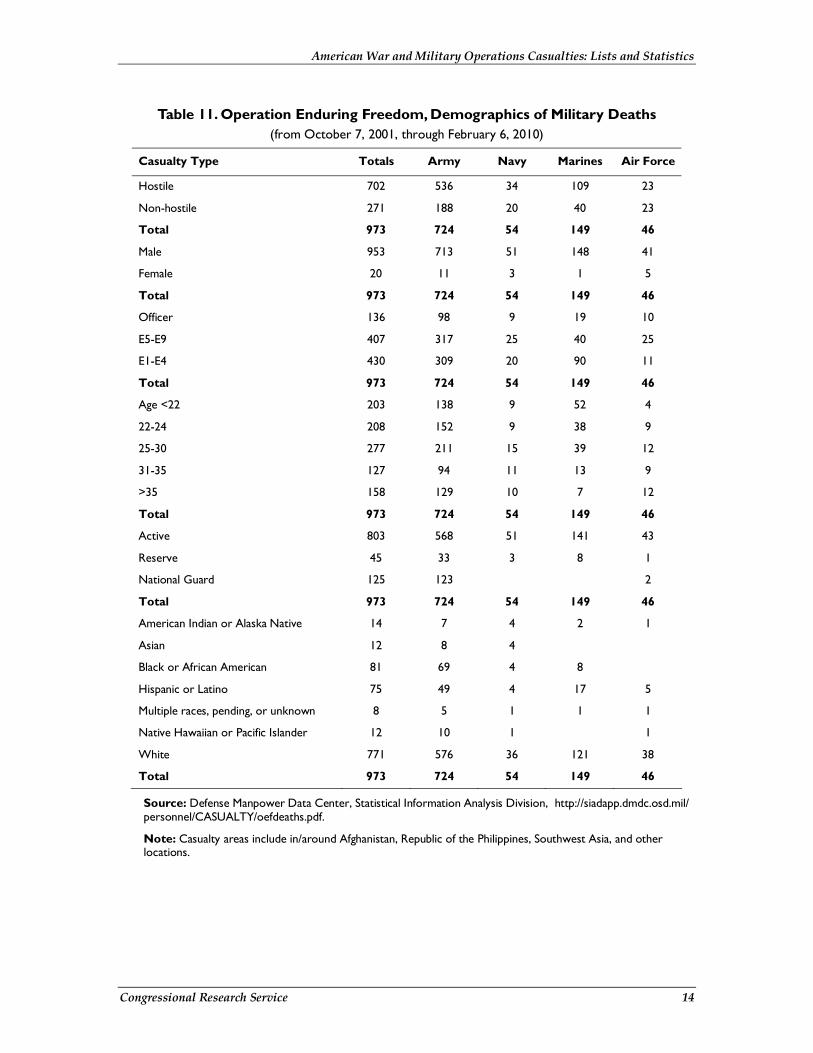
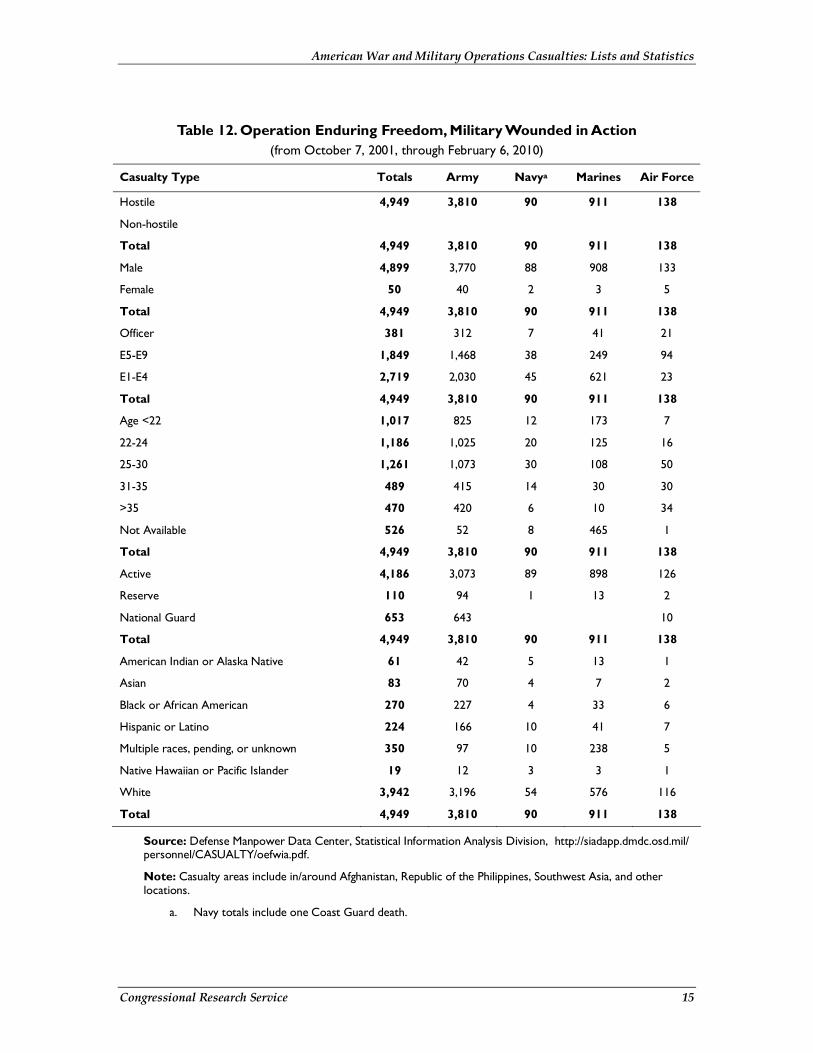
Tables 10 through 12 provide statistics on casualties during Operation Enduring Freedom, which began on October 7, 2001, and is ongoing. Table 10 provides statistics on total casualties by type. Table 11 provides statistics on the demographics of military deaths. Table 12 provides statistics on the demographics of service members who have been wounded in action. These statistics may be revised as circumstances are investigated and records are processed through the U.S. military system. Daily casualty summaries are available at DOD’s website at http://www.defenselink.mil/news/casualty.pdf.
American War and Military Operations Casualties: Lists and Statistics
Congressional Research Service 13
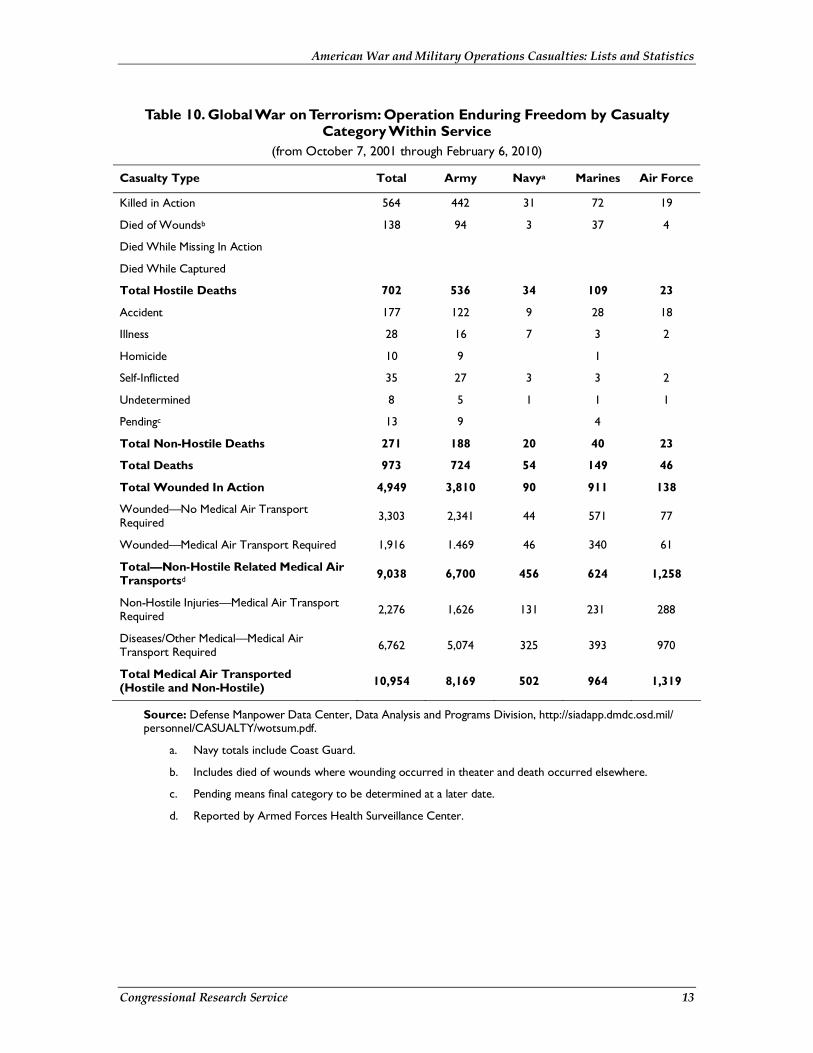
Table 10. Global War on Terrorism: Operation Enduring Freedom by Casualty Category Within Service
(from October 7, 2001 through February 6, 2010)
Casualty Type Total Army Navya Marines Air Force
Killed in Action 564 442 31 72 19
Died of Woundsb 138 94 3 37 4
Died While Missing In Action
Died While Captured
Total Hostile Deaths 702 536 34 109 23
Accident 177 122 9 28 18
Illness 28 16 7 3 2
Homicide 10 9 1
Self-Inflicted 35 27 3 3 2
Undetermined 8 5 1 1 1
Pendingc 13 9 4
Total Non-Hostile Deaths 271 188 20 40 23
Total Deaths 973 724 54 149 46
Total Wounded In Action 4,949 3,810 90 911 138
Wounded—No Medical Air Transport Required 3,303 2,341 44 571 77
Wounded—Medical Air Transport Required 1,916 1.469 46 340 61
Total—Non-Hostile Related Medical Air Transportsd 9,038 6,700 456 624 1,258
Non-Hostile Injuries—Medical Air Transport Required 2,276 1,626 131 231 288
Diseases/Other Medical—Medical Air Transport Required 6,762 5,074 325 393 970
Total Medical Air Transported (Hostile and Non-Hostile) 10,954 8,169 502 964 1,319
Source: Defense Manpower Data Center, Data Analysis and Programs Division, http://siadapp.dmdc.osd.mil/personnel/CASUALTY/wotsum.pdf.
a. Navy totals include Coast Guard.
b. Includes died of wounds where wounding occurred in theater and death occurred elsewhere.
c. Pending means final category to be determined at a later date.
d. Reported by Armed Forces Health Surveillance Center.
American War and Military Operations Casualties: Lists and Statistics
Congressional Research Service 14
Table 11. Operation Enduring Freedom, Demographics of Military Deaths (from October 7, 2001, through February 6, 2010)
Casualty Type Totals Army Navy Marines Air Force
Hostile 702 536 34 109 23
Non-hostile 271 188 20 40 23
Total 973 724 54 149 46
Male 953 713 51 148 41
Female 20 11 3 1 5
Total 973 724 54 149 46
Officer 136 98 9 19 10
E5-E9 407 317 25 40 25
E1-E4 430 309 20 90 11
Total 973 724 54 149 46
Age <22 203 138 9 52 4
22-24 208 152 9 38 9
25-30 277 211 15 39 12
31-35 127 94 11 13 9
>35 158 129 10 7 12
Total 973 724 54 149 46
Active 803 568 51 141 43
Reserve 45 33 3 8 1
National Guard 125 123 2
Total 973 724 54 149 46
American Indian or Alaska Native 14 7 4 2 1
Asian 12 8 4
Black or African American 81 69 4 8
Hispanic or Latino 75 49 4 17 5
Multiple races, pending, or unknown 8 5 1 1 1
Native Hawaiian or Pacific Islander 12 10 1 1
White 771 576 36 121 38
Total 973 724 54 149 46
Source: Defense Manpower Data Center, Statistical Information Analysis Division, http://siadapp.dmdc.osd.mil/personnel/CASUALTY/oefdeaths.pdf.
Note: Casualty areas include in/around Afghanistan, Republic of the Philippines, Southwest Asia, and other locations.
American War and Military Operations Casualties: Lists and Statistics
Congressional Research Service 15
Table 12. Operation Enduring Freedom, Military Wounded in Action (from October 7, 2001, through February 6, 2010)
Casualty Type Totals Army Navya Marines Air Force
Hostile 4,949 3,810 90 911 138
Non-hostile
Total 4,949 3,810 90 911 138
Male 4,899 3,770 88 908 133
Female 50 40 2 3 5
Total 4,949 3,810 90 911 138
Officer 381 312 7 41 21
E5-E9 1,849 1,468 38 249 94
E1-E4 2,719 2,030 45 621 23
Total 4,949 3,810 90 911 138
Age <22 1,017 825 12 173 7
22-24 1,186 1,025 20 125 16
25-30 1,261 1,073 30 108 50
31-35 489 415 14 30 30
>35 470 420 6 10 34
Not Available 526 52 8 465 1
Total 4,949 3,810 90 911 138
Active 4,186 3,073 89 898 126
Reserve 110 94 1 13 2
National Guard 653 643 10
Total 4,949 3,810 90 911 138
American Indian or Alaska Native 61 42 5 13 1
Asian 83 70 4 7 2
Black or African American 270 227 4 33 6
Hispanic or Latino 224 166 10 41 7
Multiple races, pending, or unknown 350 97 10 238 5
Native Hawaiian or Pacific Islander 19 12 3 3 1
White 3,942 3,196 54 576 116
Total 4,949 3,810 90 911 138
Source: Defense Manpower Data Center, Statistical Information Analysis Division, http://siadapp.dmdc.osd.mil/personnel/CASUALTY/oefwia.pdf.
Note: Casualty areas include in/around Afghanistan, Republic of the Philippines, Southwest Asia, and other locations.
a. Navy totals include one Coast Guard death.
American War and Military Operations Casualties: Lists and Statistics
Congressional Research Service 16
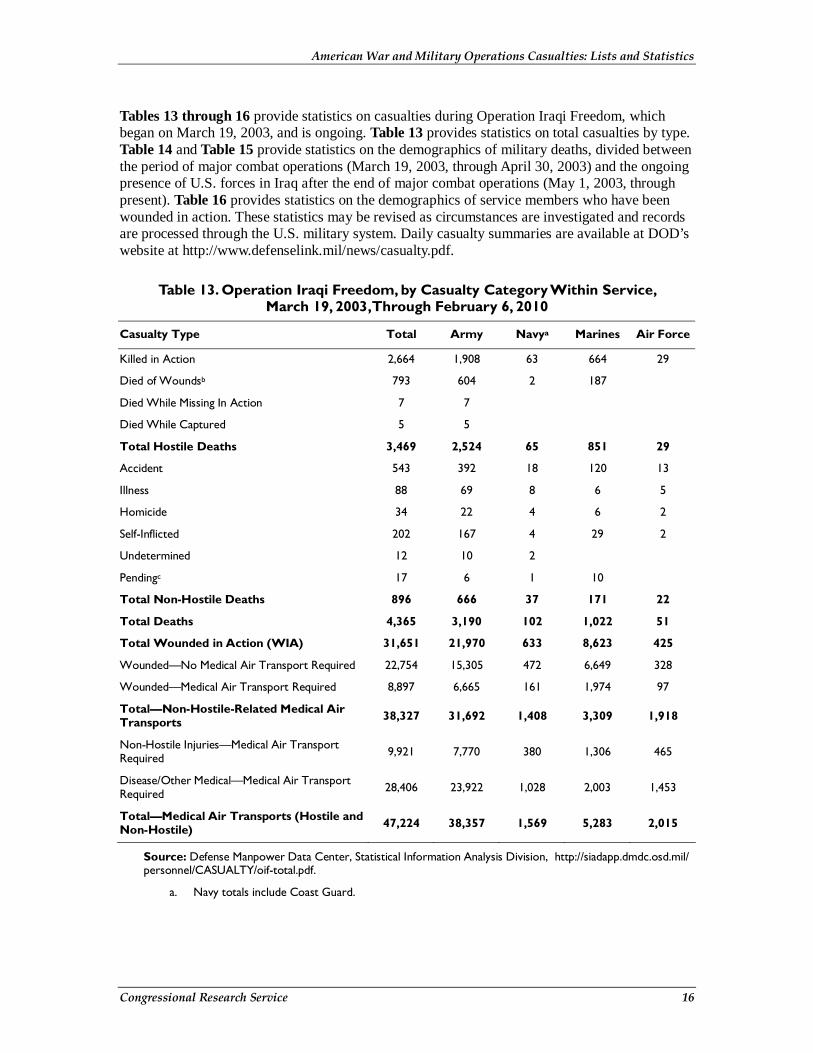
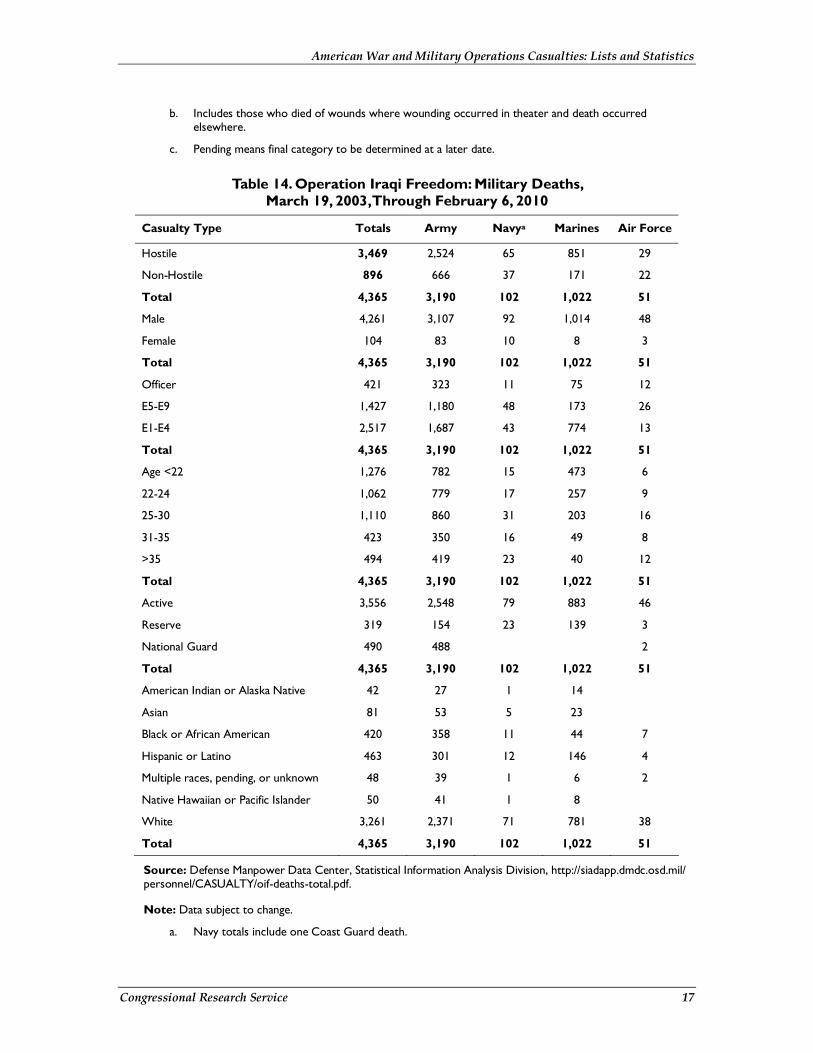
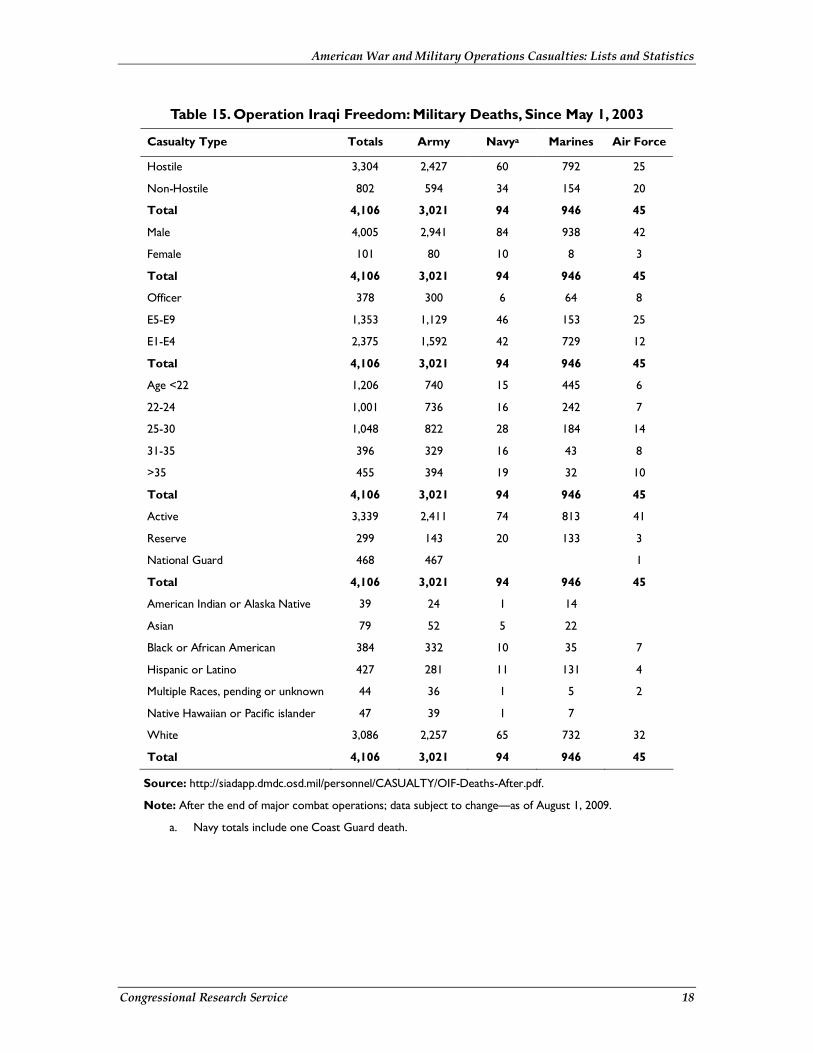
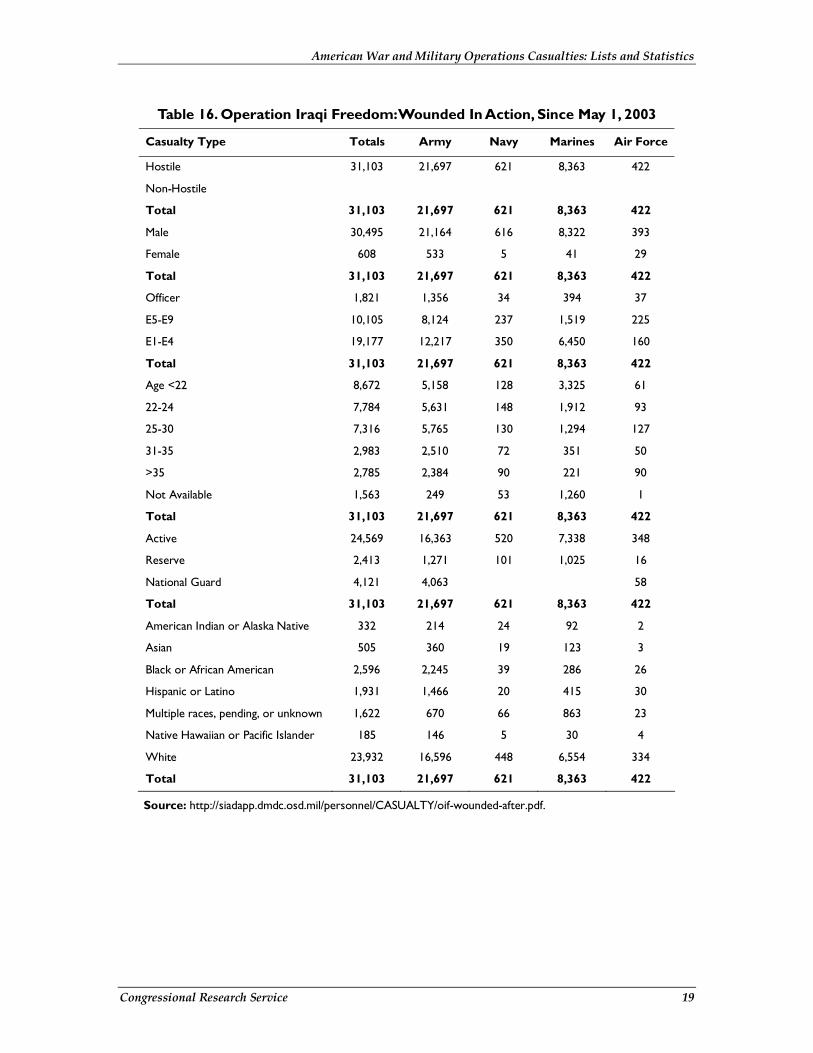
Tables 13 through 16 provide statistics on casualties during Operation Iraqi Freedom, which began on March 19, 2003, and is ongoing. Table 13 provides statistics on total casualties by type. Table 14 and Table 15 provide statistics on the demographics of military deaths, divided between the period of major combat operations (March 19, 2003, through April 30, 2003) and the ongoing presence of U.S. forces in Iraq after the end of major combat operations (May 1, 2003, through present). Table 16 provides statistics on the demographics of service members who have been wounded in action. These statistics may be revised as circumstances are investigated and records are processed through the U.S. military system. Daily casualty summaries are available at DOD’s website at http://www.defenselink.mil/news/casualty.pdf.
Table 13. Operation Iraqi Freedom, by Casualty Category Within Service, March 19, 2003, Through February 6, 2010
Casualty Type Total Army Navya Marines Air Force
Killed in Action 2,664 1,908 63 664 29
Died of Woundsb 793 604 2 187
Died While Missing In Action 7 7
Died While Captured 5 5
Total Hostile Deaths 3,469 2,524 65 851 29
Accident 543 392 18 120 13
Illness 88 69 8 6 5
Homicide 34 22 4 6 2
Self-Inflicted 202 167 4 29 2
Undetermined 12 10 2
Pendingc 17 6 1 10
Total Non-Hostile Deaths 896 666 37 171 22
Total Deaths 4,365 3,190 102 1,022 51
Total Wounded in Action (WIA) 31,651 21,970 633 8,623 425
Wounded—No Medical Air Transport Required 22,754 15,305 472 6,649 328
Wounded—Medical Air Transport Required 8,897 6,665 161 1,974 97
Total—Non-Hostile-Related Medical Air Transports 38,327 31,692 1,408 3,309 1,918
Non-Hostile Injuries—Medical Air Transport Required 9,921 7,770 380 1,306 465
Disease/Other Medical—Medical Air Transport Required 28,406 23,922 1,028 2,003 1,453
Total—Medical Air Transports (Hostile and Non-Hostile) 47,224 38,357 1,569 5,283 2,015
Source: Defense Manpower Data Center, Statistical Information Analysis Division, http://siadapp.dmdc.osd.mil/personnel/CASUALTY/oif-total.pdf.
a. Navy totals include Coast Guard.
American War and Military Operations Casualties: Lists and Statistics
Congressional Research Service 17
b. Includes those who died of wounds where wounding occurred in theater and death occurred elsewhere.
c. Pending means final category to be determined at a later date.
Table 14. Operation Iraqi Freedom: Military Deaths, March 19, 2003, Through February 6, 2010
Casualty Type Totals Army Navya Marines Air Force
Hostile 3,469 2,524 65 851 29
Non-Hostile 896 666 37 171 22
Total 4,365 3,190 102 1,022 51
Male 4,261 3,107 92 1,014 48
Female 104 83 10 8 3
Total 4,365 3,190 102 1,022 51
Officer 421 323 11 75 12
E5-E9 1,427 1,180 48 173 26
E1-E4 2,517 1,687 43 774 13
Total 4,365 3,190 102 1,022 51
Age <22 1,276 782 15 473 6
22-24 1,062 779 17 257 9
25-30 1,110 860 31 203 16
31-35 423 350 16 49 8
>35 494 419 23 40 12
Total 4,365 3,190 102 1,022 51
Active 3,556 2,548 79 883 46
Reserve 319 154 23 139 3
National Guard 490 488 2
Total 4,365 3,190 102 1,022 51
American Indian or Alaska Native 42 27 1 14
Asian 81 53 5 23
Black or African American 420 358 11 44 7
Hispanic or Latino 463 301 12 146 4
Multiple races, pending, or unknown 48 39 1 6 2
Native Hawaiian or Pacific Islander 50 41 1 8
White 3,261 2,371 71 781 38
Total 4,365 3,190 102 1,022 51
Source: Defense Manpower Data Center, Statistical Information Analysis Division, http://siadapp.dmdc.osd.mil/personnel/CASUALTY/oif-deaths-total.pdf.
Note: Data subject to change.
a. Navy totals include one Coast Guard death.
American War and Military Operations Casualties: Lists and Statistics
Congressional Research Service 18
Table 15. Operation Iraqi Freedom: Military Deaths, Since May 1, 2003
Casualty Type Totals Army Navya Marines Air Force
Hostile 3,304 2,427 60 792 25
Non-Hostile 802 594 34 154 20
Total 4,106 3,021 94 946 45
Male 4,005 2,941 84 938 42
Female 101 80 10 8 3
Total 4,106 3,021 94 946 45
Officer 378 300 6 64 8
E5-E9 1,353 1,129 46 153 25
E1-E4 2,375 1,592 42 729 12
Total 4,106 3,021 94 946 45
Age <22 1,206 740 15 445 6
22-24 1,001 736 16 242 7
25-30 1,048 822 28 184 14
31-35 396 329 16 43 8
>35 455 394 19 32 10
Total 4,106 3,021 94 946 45
Active 3,339 2,411 74 813 41
Reserve 299 143 20 133 3
National Guard 468 467 1
Total 4,106 3,021 94 946 45
American Indian or Alaska Native 39 24 1 14
Asian 79 52 5 22
Black or African American 384 332 10 35 7
Hispanic or Latino 427 281 11 131 4
Multiple Races, pending or unknown 44 36 1 5 2
Native Hawaiian or Pacific islander 47 39 1 7
White 3,086 2,257 65 732 32
Total 4,106 3,021 94 946 45
Source: http://siadapp.dmdc.osd.mil/personnel/CASUALTY/OIF-Deaths-After.pdf.
Note: After the end of major combat operations; data subject to change—as of August 1, 2009.
a. Navy totals include one Coast Guard death.
American War and Military Operations Casualties: Lists and Statistics
Congressional Research Service 19
Table 16. Operation Iraqi Freedom: Wounded In Action, Since May 1, 2003
Casualty Type Totals Army Navy Marines Air Force
Hostile 31,103 21,697 621 8,363 422
Non-Hostile
Total 31,103 21,697 621 8,363 422
Male 30,495 21,164 616 8,322 393
Female 608 533 5 41 29
Total 31,103 21,697 621 8,363 422
Officer 1,821 1,356 34 394 37
E5-E9 10,105 8,124 237 1,519 225
E1-E4 19,177 12,217 350 6,450 160
Total 31,103 21,697 621 8,363 422
Age <22 8,672 5,158 128 3,325 61
22-24 7,784 5,631 148 1,912 93
25-30 7,316 5,765 130 1,294 127
31-35 2,983 2,510 72 351 50
>35 2,785 2,384 90 221 90
Not Available 1,563 249 53 1,260 1
Total 31,103 21,697 621 8,363 422
Active 24,569 16,363 520 7,338 348
Reserve 2,413 1,271 101 1,025 16
National Guard 4,121 4,063 58
Total 31,103 21,697 621 8,363 422
American Indian or Alaska Native 332 214 24 92 2
Asian 505 360 19 123 3
Black or African American 2,596 2,245 39 286 26
Hispanic or Latino 1,931 1,466 20 415 30
Multiple races, pending, or unknown 1,622 670 66 863 23
Native Hawaiian or Pacific Islander 185 146 5 30 4
White 23,932 16,596 448 6,554 334
Total 31,103 21,697 621 8,363 422
Source: http://siadapp.dmdc.osd.mil/personnel/CASUALTY/oif-wounded-after.pdf.
American War and Military Operations Casualties: Lists and Statistics
Congressional Research Service 20
Resources
Sources of Statistics The Department of Defense Directorate of Information, Operations, and Reports (DIOR) provides detailed historical tables as well as annual statistics on active duty military deaths at http://siadapp.dmdc.osd.mil/personnel/CASUALTY/castop.htm.
The National Archives and Records Administration (NARA) has published statistics derived from its Southeast Asia Combat Area Casualties Current File. This includes tables on Vietnam casualty data by branch of service, race, religion, state, and other categories at http://www.archives.gov/research/vietnam-war/casualty-statistics.html.
Sources of Published Lists of Names of War Dead The Congressional Research Service also receives requests for lists of the names of war dead, often for use on memorials, tributes, or for other ceremonial purposes. This report cites the following sources of published lists of U.S. military personnel killed in major wars and other combat actions.
World War II
Army casualty lists for World War II are published in World War II Honor List of the Dead and Missing (U.S. War Department, 1946). The lists are also available online at http://www.archives.gov/research/arc/ww2/army-casualties/index.html.
Navy casualty lists are published in State Summary of War Casualties (U.S. Navy Department, 1946). The National Archives also publishes casualty lists online at http://www.archives.gov/research/arc/ww2/navy-casualties/index.html.
Korean War and Vietnam War
The National Archives has made state-level casualty lists from the Korean War and the Vietnam War available at http://www.archives.gov/research/korean-war/casualty-lists/.
Operation Enduring Freedom (OEF)
The DIOR website lists the names of individuals killed in OEF at http://siadapp.dmdc.osd.mil/personnel/CASUALTY/oef_list_of_names.pdf.
Operation Iraqi Freedom (OIF)
The DIOR website lists the names of individuals killed in OIF at http://siadapp.dmdc.osd.mil/personnel/CASUALTY/oif_list_of_names.pdf.
American War and Military Operations Casualties: Lists and Statistics
Congressional Research Service 21
Wars Prior to World War II
Lists of casualties that are not available from a central source may be obtained on a state level from each state’s Adjutant General’s office.1 The Adjutant General of each state is the military commander of the state’s national guard. The following is a list of these offices.
Alabama
Major General A C. Blalock, P.O. Box 3711, Montgomery, AL 36109, (334) 271-7200
Alaska
Brigadier General Thomas H. Katkus, (Acting, as of August 28, 2009), P.O. Box 5800, Fort Richardson, AK 99505-5800, (907) 428-6007
Arizona
Major General Hugo Salazar, Emergency and Military Affairs Department, 5636 East McDowell Road, Phoenix, AZ 85008-3495, (602) 267-2710
Arkansas
Major General William D. Wofford, Camp J.T. Robinson, North Little Rock, AR 72199-9600, (501) 212-5001
California
Major General William H. Wade, II, P.O. 269101, Sacramento, CA 95826, (916) 854-3500
Colorado
Major General H. Michael Edwards, 6848 South Revere Parkway, Centennial, CO 80112-6709, (720) 250-1500
Connecticut
Major General Thaddeus J. Martin, William J. O’Neill Armory, 360 Broad Street, Hartford, CT 06105-3706, (860) 524-4953
Delaware
Major General Francis D. Vavala, USA, National Guard, First Regiment Road, Wilmington, DE 19808-2191, (302) 326-7001
1 Sources: via CRS contact, the Adjutants General Association of the United States at http://www.agaus.org/Documents/TAGSContact29April09.pdf, and the Leadership Library at http://www.leadershipdirectories.com/, by subscription only.
American War and Military Operations Casualties: Lists and Statistics
Congressional Research Service 22
District of Columbia
Major General Errol R. Schwartz, DC National Guard, 2001 East Capitol Street, SE, Washington, DC 20003, (202) 685-9798
Florida
Major General Douglas Burnett, St. Francis Barracks, P.O. Box 1008, Saint Augustine, FL 32085-1008, (904) 823-0100
Georgia
Major General William T. “Terry” Nesbitt, Georgia Department of Defense, P.O. Box 1970, Marietta, GA 30061, (678) 569-6001
Guam
Major General Don Goldhorn, 430 Army Drive, Building 300,, Barrigada, GU 96913-4421, (671) 735-0400
Hawaii
Major General Robert G. F. Lee, 3949 Diamond Head Road, Honolulu, HI 96816-4495, (808) 733-4246
Idaho
Major General Lawrence Lafrenz, Gowen Field, 4040 West Guard Street, Boise, ID 83705-5004, (208) 422-5242
Illinois
Major General William L. Enyart, Military Affairs Department, 1301 N. MacArthur Boulevard, Springfield, IL 62702-2399, (217) 761-3500
Indiana
Major General R. Martin Umbarger, Joint Forces Headquarters-Indiana, 2002 South Holt Road, Indianapolis, IN 46241-4839, (317) 247-3559
Iowa
Brigadier General Timothy E. Orr, 7105 NW 70th Avenue, Johnston, IA 50131-1824, (515) 252-4211
Kansas
Major General Tod Bunting, 2800 SW Topeka Boulevard, Topeka, KS 66611-1287, (785) 274-1001
American War and Military Operations Casualties: Lists and Statistics
Congressional Research Service 23
Kentucky
Brigadier General Edward W. Tonini, Boone National Guard Center, 100 Minuteman Parkway, Frankfort, KY 40601, (502) 607-1558
Louisiana
Major General Bennett C. Landreneau, Camp Beauregard, Building 304 F Street, Pineville, LA 71360, (318) 641-3858
Maine
Major General John W. “Bill” Libby, Camp Keyes, Augusta, ME 04333-0033, (207) 626-4271
Maryland
Adjutant General James A. Adkins, 5th Regiment Armory, 29th Division Street, Baltimore, MD 21201-2288, (410) 576-6097
Massachusetts
Major General Joseph C. Carter, Headquarters, Massachusetts National Guard, 50 Maple Street, Milford, MA 01757, (508) 233-6552
Michigan
Major General Thomas Cutler, 2500 S. Washington Avenue, Lansing, MI 48906, (517) 481-8083
Minnesota
Major General Larry W. Shellito, 20 West 12th Street, St. Paul, MN 55155-2004, (651) 268-8924
Mississippi
Major General William “Bill” Freeman, Jr., P.O. Box 5027, Jackson, MS 39296-5027, (601) 313-6232
Missouri
Brigadier General Stephen L. Danner, 2302 Militia Drive, Jefferson City, MO 65101-1203, (573) 638-9710
Montana
Brigadier General John E. Walsh, 1956 Mt. Majo Street, P.O. Box 4789, Fort Harrison, MT 59636-4789, (406) 324-3010
Nebraska
Brigadier General Judd H. Lyons, 1300 Military Road, Lincoln, NE 68508-1090, (402) 309-7210
American War and Military Operations Casualties: Lists and Statistics
Congressional Research Service 24
Nevada
Brig Gen William R. Burks, Nevada National Guard JFHQ, 2460 Fairview Drive, Carson City, NV 89701-5502, (775) 887-7302
New Hampshire
Major General William N. Reddel III, 1 Minuteman Way, Concord, NH 03301-5652, (603) 225-1200
New Jersey
Major General Glenn K. Rieth, New Jersey Department of Military and Veterans Affairs, 101 Eggert Crossing Road, Lawrenceville, NJ 08648-2805, (609) 530-6956
New Mexico
Major General Kenny C. Montoya, 47 Bataan Boulevard, Santa Fe, NM 87508, (505) 474-1210
New York
Major General Joseph J. Taluto, 330 Old Niskayuna Road, Latham, NY 12110-2224, (518) 786-4502
North Carolina
Major General William E. Ingram, Jr., 4105 Reedy Creek Road, Raleigh, NC 27607-6410, (919) 664-6101
North Dakota
Major General David A. Sprynczynatyk, P.O. Box 5511, Bismarck, ND 58506-5511, (701) 333-2000
Ohio
Major General Gregory L. Wayt, 2825 West Dublin Granville Road, Columbus, OH 43235-2789, (614) 336-7070
Oklahoma
Major General Myles L. Deering, 3501 Military Circle, Oklahoma City, OK 73111-4398, (405) 228-5201
Oregon
Major General Raymond Fred Rees, P.O. Box 14350, Salem, OR 97309-5047, (503) 584-3991
American War and Military Operations Casualties: Lists and Statistics
Congressional Research Service 25
Pennsylvania
Major General Jessica L. Wright, Building S-O-47, Fisher Avenue, Fort Indiantown Gap, Annville, PA 17003-5002, (717) 861-8500
Puerto Rico
Major General Antonio J. Vicens-Gonzalez, P.O. Box 9023786, San Juan, PR 00904-3786, (787) 289-1631
Rhode Island
Major General Robert Thomas Bray, Headquarters, Rhode Island National Guard, Command Readiness Center, 645 New London Avenue, Cranston, RI 02920-3097, (401) 275-4102
South Carolina
Major General (Ret.) Stanhope S. Spears, One National Guard Road, Columbia, SC 29201-4766, (803) 806-4217
South Dakota
Major General Steven R. Doohen, 2823 West Main, Rapid City, SD 57702-8170, (605) 737-6702
Tennessee
Major General Gus L. Hargett, Jr., Houston Barracks, 3041 Sidco Drive, Nashville, TN 37204-1502, (615) 313-3001
Texas
Major General Jose S. Mayorga, P.O. Box 5218, Austin, TX 78763-5218, (512) 782-5006
U.S. Virgin Islands
Major General Renaldo Rivera, 4031 La Grande Princesse, Lot #1B, Christiansted, St. Croix, VI 00820-4353, (340) 773-7710
Utah
Major General Brian L. Tarbet, 12953 S. Minuteman Drive, Draper, UT 84020-1776, (801) 432-4402
Vermont
Major General Michael D. Dubie, 789 Vermont National Guard Road, Colchester, VT 05446-3099, (802) 338-3124
Virginia
American War and Military Operations Casualties: Lists and Statistics
Congressional Research Service 26
Major General Robert B. Newman, Jr.,1100 Bank Street, 3rd Floor, Richmond VA 23219, (804) 371-2526
Washington
Major General Timothy J. Lowenberg, Camp Murray, Building 1, Tacoma, WA 98430-5000, (253) 512-8201
West Virginia
Major General Allen E. Tackett, 1703 Coonskin Drive, Charleston, WV 25311-1085, (304) 561-6316
Wisconsin
Brigadier General Donald Dunbar, P.O. Box 8111, Madison, WI 53704, (608) 242-3001
Wyoming
Major General Edward L. Wright, 5500 Bishop Boulevard, Cheyenne, WY 82009-3320, (307) 772-5234
Additional Websites Defenselink, the official website for the Department of Defense, issues news releases every weekday that identify military personnel killed, available at http://www.defenselink.mil/news/.
U.S. Department of Defense at http://www.defense.gov
CRS Reports CRS Report RS21578, Iraq: U.S. Casualties, by Susan G. Chesser.
CRS Report RS22537, Iraqi Civilian Casualties Estimates, by Hannah Fischer.
CRS Report R40824, Iraq Casualties: U.S. Military Forces and Iraqi Civilians, Police, and Security Forces, by Hannah Fischer.
CRS Report RS22532, Iraqi Police and Security Forces Casualties Estimates, by Hannah Fischer.
CRS Report RS22452, United States Military Casualty Statistics: Operation Iraqi Freedom and Operation Enduring Freedom, by Hannah Fischer.
American War and Military Operations Casualties: Lists and Statistics
Congressional Research Service 27
Author Contact Information Anne Leland Information Research Specialist [email protected], 7-4704
Mari-Jana "M-J" Oboroceanu Information Research Specialist [email protected], 7-6329
Acknowledgments Barbara Salazar Torreon, information research specialist, and Ann Eschete, reference assistant, contributed to this report.
Related Documents