American River Operations Group (ARG) January 17 th , 2019 Meeting Notes Attendees: USBR: Sarah Perrin, Zarela Guerrero, Spencer Marshall, Claire Hsu, Liz Kiteck, Ian Smith CDFW: Jeanine Phillips, Ken Kundargi, Duane Linander Water Forum: Rod Hall, Lilly Allen East Bay MUD: I-Pei Hsiu, Jose Setka cbec: Chris Hammersmark San Luis Delta Mendota Water Authority: Tom Boardman SARA: Felix Smith, John D. Cox SMUD: Ansel Lundberg Sac State Aquatic Center: DeDe Birch Handouts: • Agenda • Fisheries Update (CDFW) • Lower American River RST Catch Summary (PSMFC) • Bi-weekly Spawning and Stranding Report (CFS) • Upper American River Project Update (SMUD) • Hydrology Report for Water Year 2019 (SMUD) • Daily CVP Water Supply Report • Temperature Control Report – December 1 through January 16 • Folsom Lake Temperature profiles • 90% and 50% Runoff Exceedance Outlook • Sign-in sheet Fishery Update: CDFW • Please refer to the fisheries update handout provided by CDFW Pacific States Marine Fisheries Commission (PSMFC) - Lower American River RST Catch Summary • Please refer to the fisheries update handout provided by PSMFC Cramer Fish Sciences (CFS) - Bi-Weekly Spawning and Stranding Report • Please refer to the fisheries update handout provided by CFS Operations Outlook: SMUD • Please refer to the operations update handouts provided by SMUD CVO • January 16 storm is biggest to date • Forecasting peak inflow of 38,000 CFS • 500 TAF projected storage • 4 to 6 week outlook looks dry • Releasing for spawning and incubation habitat

Welcome message from author
This document is posted to help you gain knowledge. Please leave a comment to let me know what you think about it! Share it to your friends and learn new things together.
Transcript
American River Operations Group (ARG) January 17th, 2019 Meeting Notes
Attendees: USBR: Sarah Perrin, Zarela Guerrero, Spencer Marshall, Claire Hsu, Liz Kiteck, Ian Smith CDFW: Jeanine Phillips, Ken Kundargi, Duane Linander Water Forum: Rod Hall, Lilly Allen East Bay MUD: I-Pei Hsiu, Jose Setka cbec: Chris Hammersmark San Luis Delta Mendota Water Authority: Tom Boardman SARA: Felix Smith, John D. Cox SMUD: Ansel Lundberg Sac State Aquatic Center: DeDe Birch
Handouts:
• Agenda • Fisheries Update (CDFW) • Lower American River RST Catch Summary (PSMFC) • Bi-weekly Spawning and Stranding Report (CFS) • Upper American River Project Update (SMUD) • Hydrology Report for Water Year 2019 (SMUD) • Daily CVP Water Supply Report • Temperature Control Report – December 1 through January 16 • Folsom Lake Temperature profiles • 90% and 50% Runoff Exceedance Outlook • Sign-in sheet
Fishery Update: CDFW
• Please refer to the fisheries update handout provided by CDFW Pacific States Marine Fisheries Commission (PSMFC) - Lower American River RST Catch Summary
• Please refer to the fisheries update handout provided by PSMFC Cramer Fish Sciences (CFS) - Bi-Weekly Spawning and Stranding Report
• Please refer to the fisheries update handout provided by CFS Operations Outlook: SMUD
• Please refer to the operations update handouts provided by SMUD CVO
• January 16 storm is biggest to date • Forecasting peak inflow of 38,000 CFS • 500 TAF projected storage • 4 to 6 week outlook looks dry • Releasing for spawning and incubation habitat
• Lower and middle shutters have been installed for cold water pool conservation; upper shutters will go in once storage is high enough for the shutters to be safely installed
Temperature Management:
• Isothermal conditions in Folsom Lake • CORRECTION: Under the 90% runoff exceedance outlook, MRR for February
should read 1750, not 1500 • 50% runoff exceedance outlook slightly ahead of of the 50% forecast due to last
storm event • Current 50% and 90% forecasts are currently only benchmarks on potential
operations Discussion Presentation
• Jose Setka from EBMUD – Mokelumne Fish Hatchery o Jose to send powerpoint presentation
The next meeting is scheduled to take place on Thursday, February 21st, 2019 at Central Valley Operations Office, 3310 El Camino Ave., Sacramento, CA 95821, in Room 302, at 1:30pm.
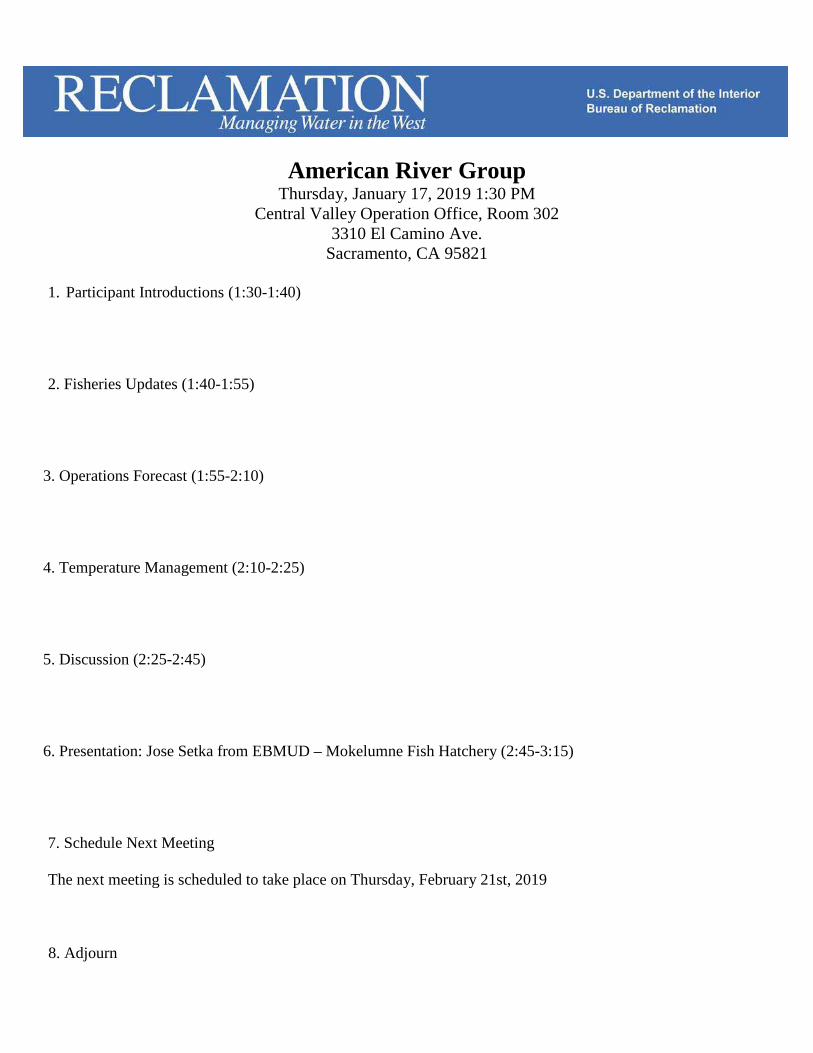
American River Group Thursday, January 17, 2019 1:30 PM
Central Valley Operation Office, Room 302 3310 El Camino Ave.
Sacramento, CA 95821
1. Participant Introductions (1:30-1:40)
2. Fisheries Updates (1:40-1:55)
3. Operations Forecast (1:55-2:10) 4. Temperature Management (2:10-2:25)
5. Discussion (2:25-2:45) 6. Presentation: Jose Setka from EBMUD – Mokelumne Fish Hatchery (2:45-3:15) 7. Schedule Next Meeting The next meeting is scheduled to take place on Thursday, February 21st, 2019
8. Adjourn
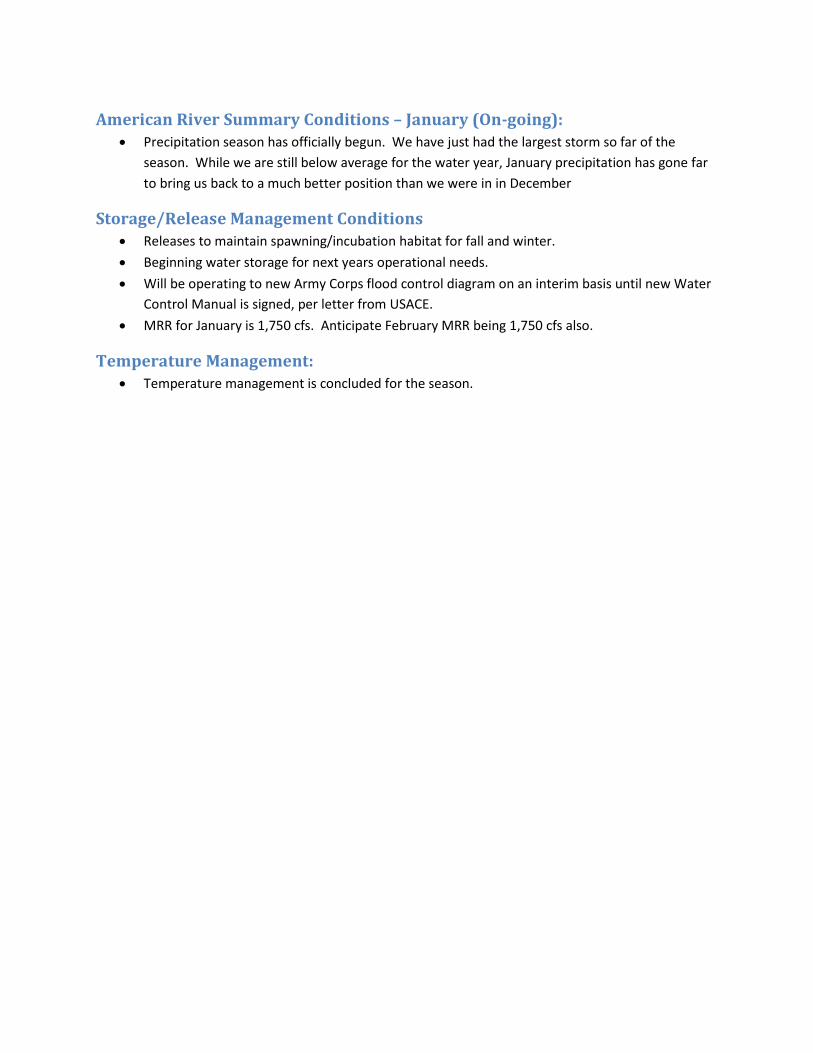
American River Summary Conditions – January (On-going): • Precipitation season has officially begun. We have just had the largest storm so far of the
season. While we are still below average for the water year, January precipitation has gone far to bring us back to a much better position than we were in in December
Storage/Release Management Conditions • Releases to maintain spawning/incubation habitat for fall and winter. • Beginning water storage for next years operational needs. • Will be operating to new Army Corps flood control diagram on an interim basis until new Water
Control Manual is signed, per letter from USACE. • MRR for January is 1,750 cfs. Anticipate February MRR being 1,750 cfs also.
Temperature Management: • Temperature management is concluded for the season.
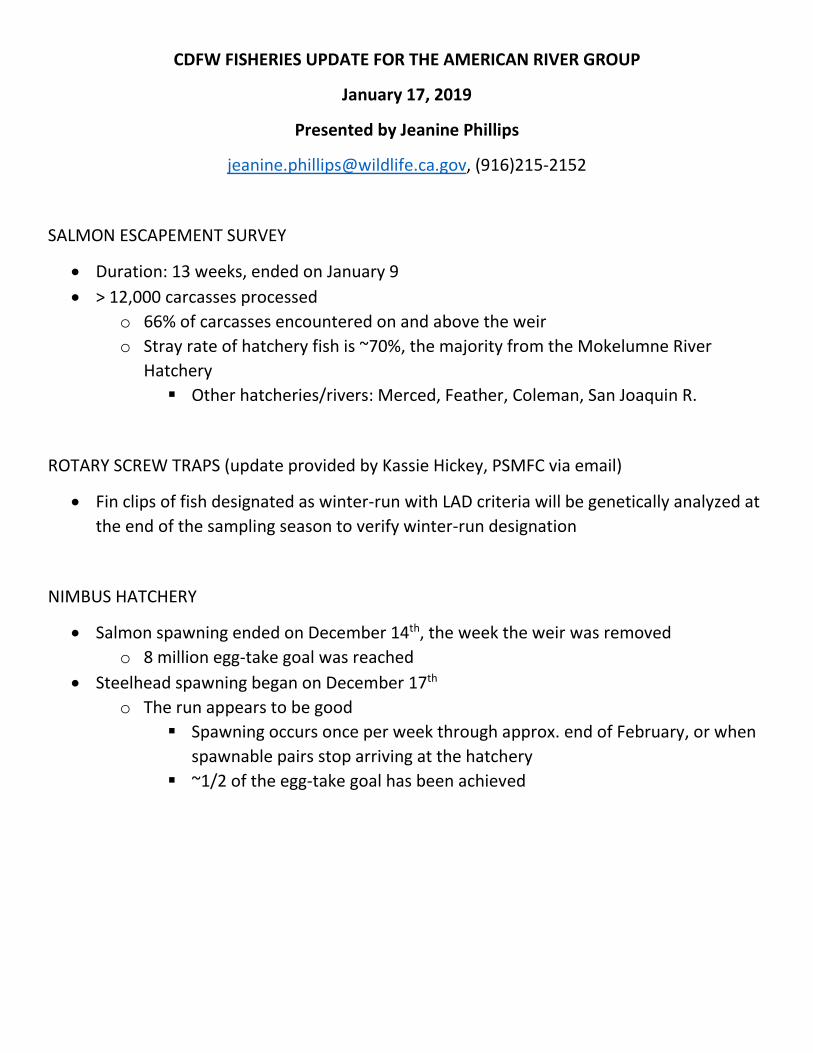
CDFW FISHERIES UPDATE FOR THE AMERICAN RIVER GROUP
January 17, 2019
Presented by Jeanine Phillips
[email protected], (916)215-2152
SALMON ESCAPEMENT SURVEY
• Duration: 13 weeks, ended on January 9 • > 12,000 carcasses processed
o 66% of carcasses encountered on and above the weir o Stray rate of hatchery fish is ~70%, the majority from the Mokelumne River
Hatchery Other hatcheries/rivers: Merced, Feather, Coleman, San Joaquin R.
ROTARY SCREW TRAPS (update provided by Kassie Hickey, PSMFC via email)
• Fin clips of fish designated as winter-run with LAD criteria will be genetically analyzed at the end of the sampling season to verify winter-run designation
NIMBUS HATCHERY
• Salmon spawning ended on December 14th, the week the weir was removed o 8 million egg-take goal was reached
• Steelhead spawning began on December 17th o The run appears to be good
Spawning occurs once per week through approx. end of February, or when spawnable pairs stop arriving at the hatchery
~1/2 of the egg-take goal has been achieved

Lower American River RST Catch Summary Pacific States Marine Fisheries Commission
Sampling start date: 1/10/2019
Thus far we have captured a total of 14 length-at-date (LAD) fall-run and 4 LAD winter-run Chinook salmon.
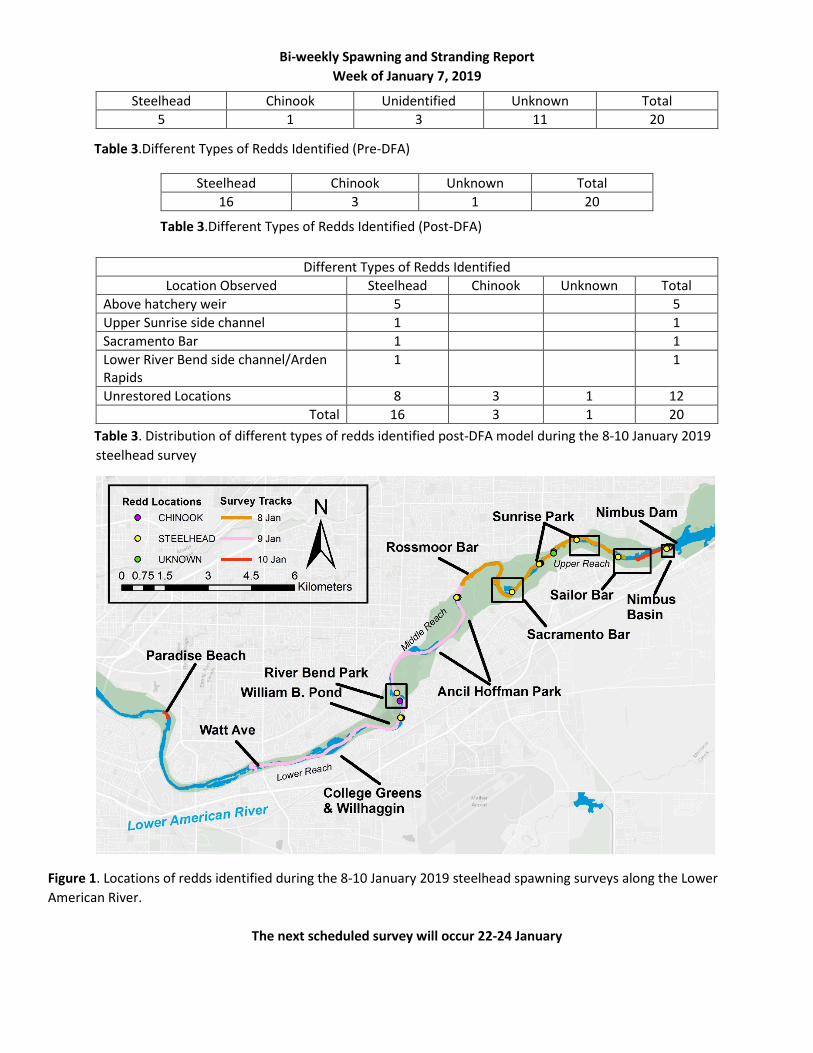
Bi-weekly Spawning and Stranding Report Week of January 7, 2019
Table 3.Different Types of Redds Identified (Pre-DFA)
Table 3.Different Types of Redds Identified (Post-DFA)
Table 3. Distribution of different types of redds identified post-DFA model during the 8-10 January 2019 steelhead survey
Figure 1. Locations of redds identified during the 8-10 January 2019 steelhead spawning surveys along the Lower American River.
The next scheduled survey will occur 22-24 January
Steelhead Chinook Unidentified Unknown Total 5 1 3 11 20
Steelhead Chinook Unknown Total 16 3 1 20
Different Types of Redds Identified Location Observed Steelhead Chinook Unknown Total
Above hatchery weir 5 5 Upper Sunrise side channel 1 1 Sacramento Bar 1 1 Lower River Bend side channel/Arden Rapids
1 1
Unrestored Locations 8 3 1 12 Total 16 3 1 20
SMUD Upper American River Project Update
Conditions – 15 January 2019:
January precipitation at Fresh Pond through 1/15/2019 7:00:00 AM is 4.06 in., which is 43% of the January average of 9.55”. Precip for the water year to date is 17.00” which is 71% of average to date (23.93”) and 30% of the entire water year average of 57.32”.
Reservoir storage for Loon Lake, Union Valley and Ice House Reservoirs is currently at 53% capacity (199,628 acre feet), with Loon Lake at 36,580 af, Ice House at 14,593 af, and Union Valley at 148,454 af. Last year today, storage was at 63% (239,209 acre feet). Total capacity of the three reservoirs is 379,174 acre feet.
The SMUD reservoirs are at 88% of historical average at this date (15 January historical average – 227,112 acre feet / 60% capacity). The reservoirs have not decreased in volume since last week.
During the month of December 2018 SMUD released from the Upper American River Project reservoirs approximately 38,000 acre feet of water, with average flows at 617 cfs below Chili Bar.
So far in January (Jan 1-14), we have released 22,382 AF, at flows of ~806 cfs below Chili Bar on average.
Runoff into the storage reservoir basins is 74% of median to date through Jan 14. The snowpack is 83% of average at selected snow sensors.
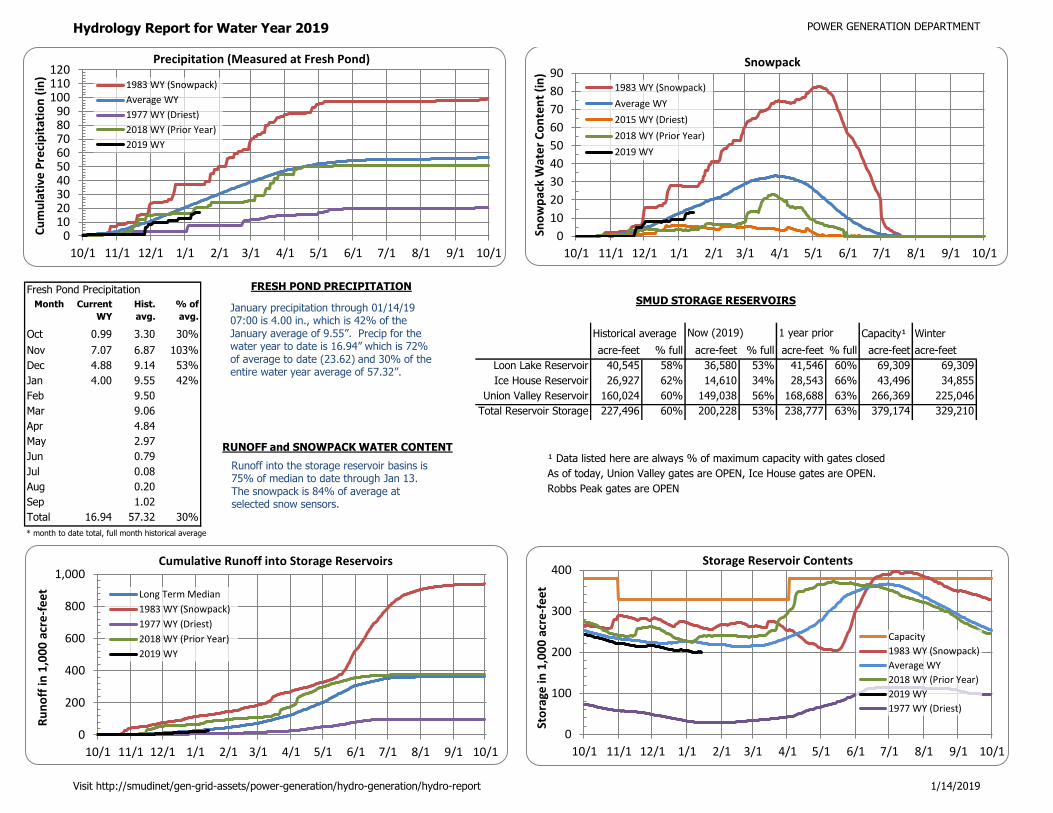
Hydrology Report for Water Year 2019 POWER GENERATION DEPARTMENT
Fresh Pond Precipitation
Month Current
WY
Hist.
avg.
% of
avg.
Oct 0.99 3.30 30% Historical average Capacity¹ Winter
Nov 7.07 6.87 103% acre-feet % full acre-feet % full acre-feet % full acre-feet acre-feet
Dec 4.88 9.14 53% Loon Lake Reservoir 40,545 58% 36,580 53% 41,546 60% 69,309 69,309
Jan 4.00 9.55 42% Ice House Reservoir 26,927 62% 14,610 34% 28,543 66% 43,496 34,855
Feb 9.50 Union Valley Reservoir 160,024 60% 149,038 56% 168,688 63% 266,369 225,046
Mar 9.06 Total Reservoir Storage 227,496 60% 200,228 53% 238,777 63% 379,174 329,210
Apr 4.84
May 2.97
Jun 0.79 ¹ Data listed here are always % of maximum capacity with gates closed
Jul 0.08 As of today, Union Valley gates are OPEN, Ice House gates are OPEN.
Aug 0.20 Robbs Peak gates are OPEN
Sep 1.02
Total 16.94 57.32 30%
* month to date total, full month historical average
Now (2019) 1 year prior
0102030405060708090
100110120
10/1 11/1 12/1 1/1 2/1 3/1 4/1 5/1 6/1 7/1 8/1 9/1 10/1
Cu
mu
lati
ve P
reci
pit
atio
n (
in)
Precipitation (Measured at Fresh Pond)
1983 WY (Snowpack)
Average WY
1977 WY (Driest)
2018 WY (Prior Year)
2019 WY
0
100
200
300
400
10/1 11/1 12/1 1/1 2/1 3/1 4/1 5/1 6/1 7/1 8/1 9/1 10/1
Sto
rage
in 1
,00
0 a
cre
-fe
et
Storage Reservoir Contents
Capacity
1983 WY (Snowpack)
Average WY
2018 WY (Prior Year)
2019 WY
1977 WY (Driest)
0
10
20
30
40
50
60
70
80
90
10/1 11/1 12/1 1/1 2/1 3/1 4/1 5/1 6/1 7/1 8/1 9/1 10/1
Sno
wp
ack
Wat
er
Co
nte
nt
(in
)
Snowpack
1983 WY (Snowpack)
Average WY
2015 WY (Driest)
2018 WY (Prior Year)
2019 WY
0
200
400
600
800
1,000
10/1 11/1 12/1 1/1 2/1 3/1 4/1 5/1 6/1 7/1 8/1 9/1 10/1
Ru
no
ff in
1,0
00
acr
e-f
ee
t
Cumulative Runoff into Storage Reservoirs
Long Term Median
1983 WY (Snowpack)
1977 WY (Driest)
2018 WY (Prior Year)
2019 WY
January precipitation through 01/14/19 07:00 is 4.00 in., which is 42% of the January average of 9.55”. Precip for the water year to date is 16.94” which is 72% of average to date (23.62) and 30% of the entire water year average of 57.32”.
Runoff into the storage reservoir basins is 75% of median to date through Jan 13. The snowpack is 84% of average at selected snow sensors.
SMUD STORAGE RESERVOIRS
RUNOFF and SNOWPACK WATER CONTENT
FRESH POND PRECIPITATION
Visit http://smudinet/gen-grid-assets/power-generation/hydro-generation/hydro-report 1/14/2019

UNITED STATES DEPARTMENT OF THE INTERIORU.S. BUREAU OF RECLAMATION-CENTRAL VALLEY PROJECT-CALIFORNIA
January 17, 2019DAILY CVP WATER SUPPLY REPORT
JANUARY 16, 2019 RUN DATE:RESERVOIR RELEASES IN CUBIC FEET/SECOND
TRINITY
SACRAMENTO
FEATHER
AMERICAN
STANISLAUS
SAN JOAQUIN
LEWISTON
KESWICK
OROVILLE (SWP)
NIMBUS
GOODWIN
FRIANT
RESERVOIR MEDIAN 2018 2019 15
299
3,538
1,750
2,674
960
397
300
3,499
1,750
1,773
221
395
RESERVOIR CAPACITY YR AVG
TRINITY
SHASTA
OROVILLE (SWP)
FOLSOM
NEW MELONES
FED. SAN LUIS
2018 2019
1,758
3,265
1,303
578
1,987
963
1,500
2,519
1,118
352
1,816
719
15
STORAGE IN MAJOR RESERVOIRS IN THOUSANDS OF ACRE-FEET
MILLERTON
TOTAL NORTH CVP
357 301
8,551 6,906
2,448
4,552
3,538
977
2,420
966
520
11,363
% OFYR AVG 15
RESERVOIRCURRENT
YR AVG
TRINITY
SHASTA
FOLSOM
NEW MELONES
1983
294
1,700
1,235
433
118
1,054
306
134
15
MILLERTON 607 196
% OF
ACCUMULATED INFLOW FOR WATER YEAR TO DATE IN THOUSANDS OF ACRE-FEET
WY WY WY YR
AVG 15
2019 1977
DAM YR
RESERVOIRCURRENT
TRINITY ATFISH HATCHERY
SACRAMENTO AT SHASTA DAM
AMERICAN AT BLUE CANYON
STANISLAUS ATNEW MELONES
1983 19.60
30.44
40.78
14.73
0.54
1.56
3.69
0.80
SAN JOAQUIN ATHUNTINGTON LK
29.60 0.62
ACCUMULATED PRECIPITATION FOR WATER YEAR TO DATE IN INCHES
WY WY WY % OFAVG2019 1977
AVG(N YRS)
35
818
131
76
4.40
5.34
7.61
4.80
13.07
26.43
27.85
13.34
13.80
301
3,709
1,750
1,704
233
151
1,432 105
2,618
1,798
388
1,387
623
290
6,450
96
62
91
131
115
104
107
15.57
207
1,292
554
198
204
57
82
55
68
96
84
27.70
29.39
11.50
17.22
95
95
116
80
57
62
44
41
44
)(
)(
)(
)(
)(
LAST 24 HRS
WY WY
WY WY
----
----
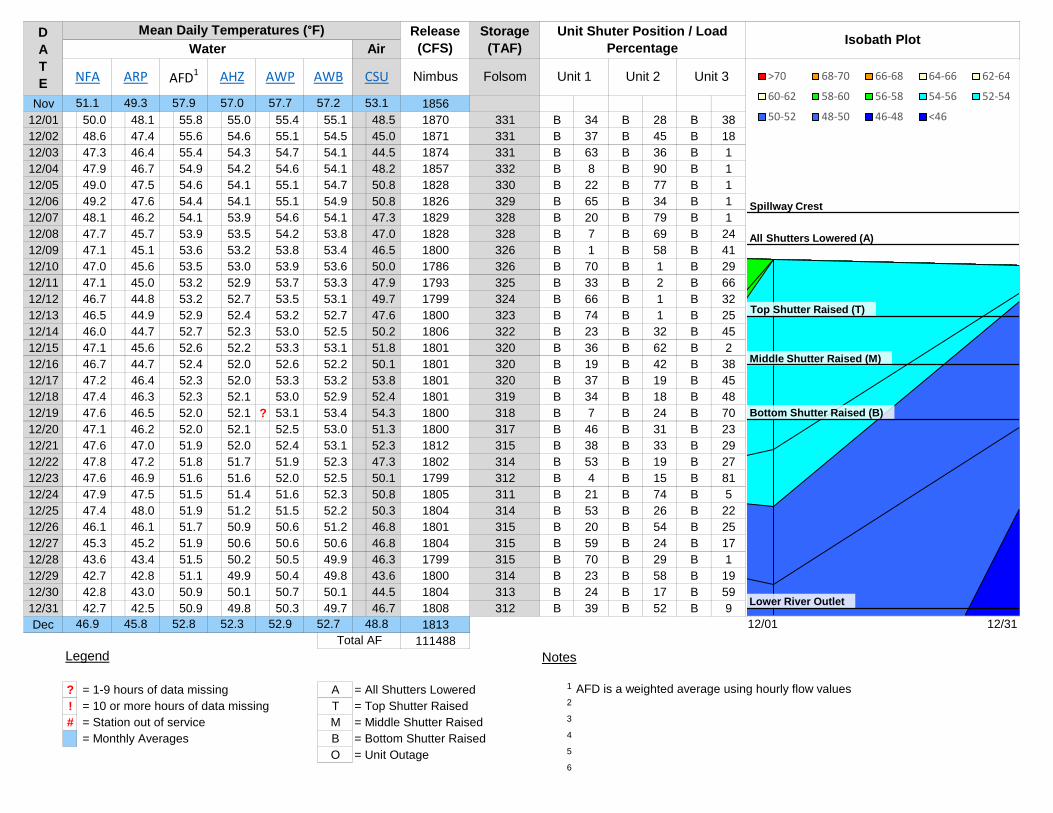
Nov 185612/01 50.0 48.1 55.8 55.0 55.4 55.1 48.5 1870 331 B 34 B 28 B 3812/02 48.6 47.4 55.6 54.6 55.1 54.5 45.0 1871 331 B 37 B 45 B 1812/03 47.3 46.4 55.4 54.3 54.7 54.1 44.5 1874 331 B 63 B 36 B 112/04 47.9 46.7 54.9 54.2 54.6 54.1 48.2 1857 332 B 8 B 90 B 112/05 49.0 47.5 54.6 54.1 55.1 54.7 50.8 1828 330 B 22 B 77 B 112/06 49.2 47.6 54.4 54.1 55.1 54.9 50.8 1826 329 B 65 B 34 B 112/07 48.1 46.2 54.1 53.9 54.6 54.1 47.3 1829 328 B 20 B 79 B 112/08 47.7 45.7 53.9 53.5 54.2 53.8 47.0 1828 328 B 7 B 69 B 2412/09 47.1 45.1 53.6 53.2 53.8 53.4 46.5 1800 326 B 1 B 58 B 4112/10 47.0 45.6 53.5 53.0 53.9 53.6 50.0 1786 326 B 70 B 1 B 2912/11 47.1 45.0 53.2 52.9 53.7 53.3 47.9 1793 325 B 33 B 2 B 6612/12 46.7 44.8 53.2 52.7 53.5 53.1 49.7 1799 324 B 66 B 1 B 3212/13 46.5 44.9 52.9 52.4 53.2 52.7 47.6 1800 323 B 74 B 1 B 2512/14 46.0 44.7 52.7 52.3 53.0 52.5 50.2 1806 322 B 23 B 32 B 4512/15 47.1 45.6 52.6 52.2 53.3 53.1 51.8 1801 320 B 36 B 62 B 212/16 46.7 44.7 52.4 52.0 52.6 52.2 50.1 1801 320 B 19 B 42 B 3812/17 47.2 46.4 52.3 52.0 53.3 53.2 53.8 1801 320 B 37 B 19 B 4512/18 47.4 46.3 52.3 52.1 53.0 52.9 52.4 1801 319 B 34 B 18 B 4812/19 47.6 46.5 52.0 52.1 ? 53.1 53.4 54.3 1800 318 B 7 B 24 B 7012/20 47.1 46.2 52.0 52.1 52.5 53.0 51.3 1800 317 B 46 B 31 B 2312/21 47.6 47.0 51.9 52.0 52.4 53.1 52.3 1812 315 B 38 B 33 B 2912/22 47.8 47.2 51.8 51.7 51.9 52.3 47.3 1802 314 B 53 B 19 B 2712/23 47.6 46.9 51.6 51.6 52.0 52.5 50.1 1799 312 B 4 B 15 B 8112/24 47.9 47.5 51.5 51.4 51.6 52.3 50.8 1805 311 B 21 B 74 B 512/25 47.4 48.0 51.9 51.2 51.5 52.2 50.3 1804 314 B 53 B 26 B 2212/26 46.1 46.1 51.7 50.9 50.6 51.2 46.8 1801 315 B 20 B 54 B 2512/27 45.3 45.2 51.9 50.6 50.6 50.6 46.8 1804 315 B 59 B 24 B 1712/28 43.6 43.4 51.5 50.2 50.5 49.9 46.3 1799 315 B 70 B 29 B 112/29 42.7 42.8 51.1 49.9 50.4 49.8 43.6 1800 314 B 23 B 58 B 1912/30 42.8 43.0 50.9 50.1 50.7 50.1 44.5 1804 313 B 24 B 17 B 5912/31 42.7 42.5 50.9 49.8 50.3 49.7 46.7 1808 312 B 39 B 52 B 9Dec 1813
111488Legend Notes
? = 1-9 hours of data missing A = All Shutters Lowered 1 AFD is a weighted average using hourly flow values! = 10 or more hours of data missing T = Top Shutter Raised 2
# = Station out of service M = Middle Shutter Raised 3
= Monthly Averages B = Bottom Shutter Raised 4
O = Unit Outage 5
6
Unit 2 Unit 3
Unit Shuter Position / Load Percentage
12/01 12/31Total AF
52.7 48.852.9
51.1 49.3 57.9
Isobath Plot
52.346.9 45.8 52.8
57.0 57.7
Storage (TAF)
FolsomNimbusAWB
Mean Daily Temperatures (°F)Water Air
Release (CFS)
DATE Unit 1
57.2 53.1
CSUNFA ARP AFD1 AHZ AWP >70 68-70 66-68 64-66 62-64
60-62 58-60 56-58 54-56 52-54
50-52 48-50 46-48 <46
Spillway Crest
All Shutters Lowered (A)
Top Shutter Raised (T)
Middle Shutter Raised (M)
Bottom Shutter Raised (B)
Lower River Outlet

Dec 181301/01 41.7 41.0 50.3 49.2 49.6 48.9 43.6 1790 311 B 21 B 5 B 7401/02 41.0 41.1 50.1 49.0 49.5 48.9 41.4 1752 310 B 1 B 23 B 7601/03 41.3 41.2 49.9 49.0 49.5 48.9 41.2 1779 308 B 75 B 1 B 2401/04 41.9 41.9 49.6 49.0 49.7 49.1 42.7 1750 308 B 26 B 48 B 2701/05 41.8 41.6 49.4 48.9 49.2 48.6 44.7 1743 308 B 38 B 35 B 2701/06 43.2 42.9 49.0 48.6 49.1 48.9 47.5 1750 309 B 19 B 45 B 3601/07 44.3 45.3 49.1 48.5 48.9 49.8 51.9 1750 314 B 69 B 24 B 701/08 44.9 44.9 49.1 48.7 48.7 49.7 50.3 1749 318 B 33 B 66 B 101/09 46.5 46.7 48.6 49.1 49.7 50.8 57.2 1777 320 B 1 B 83 B 1601/10 46.5 47.1 48.7 49.3 49.7 50.9 49.8 1778 326 B 1 B 61 B 3801/11 45.8 45.6 48.7 49.5 49.9 51.1 52.2 1775 330 B 10 B 24 B 6601/12 45.0 44.7 48.5 49.2 49.5 50.5 50.8 1776 332 B 49 B 29 B 2201/13 44.7 44.7 48.5 48.8 49.4 49.9 49.3 1779 334 B 1 B 93 B 601/14 44.1 43.8 48.4 48.6 49.1 49.2 47.9 1777 335 B 20 B 1 B 7901/15 44.5 44.0 48.5 48.2 49.0 49.2 49.7 1764 338 B 93 B 4 B 301/16 45.4 45.5 48.9 48.3 48.3 49.8 54.7 1773 352 T 5 T 18 T 7801/1701/1801/1901/2001/2101/2201/2301/2401/2501/2601/2701/2801/2901/3001/31Jan 1766
56057Legend Notes
? = 1-9 hours of data missing A = All Shutters Lowered 1 AFD is a weighted average using hourly flow values! = 10 or more hours of data missing T = Top Shutter Raised 2
# = Station out of service M = Middle Shutter Raised 3
= Monthly Averages B = Bottom Shutter Raised 4
O = Unit Outage 5
6
Unit 2 Unit 3
Unit Shuter Position / Load Percentage
01/01 01/31Total AF
49.6 48.449.3
46.9 45.8 52.8
Isobath Plot
48.943.9 43.9 49.1
52.3 52.9
Storage (TAF)
FolsomNimbusAWB
Mean Daily Temperatures (°F)Water Air
Release (CFS)
DATE Unit 1
52.7 48.8
CSUNFA ARP AFD1 AHZ AWP >70 68-70 66-68 64-66 62-64
60-62 58-60 56-58 54-56 52-54
50-52 48-50 46-48 <46
Spillway Crest
All Shutters Lowered (A)
Top Shutter Raised (T)
Middle Shutter Raised (M)
Bottom Shutter Raised (B)
Lower River Outlet

200
220
240
260
280
300
320
340
360
380
400
420
440
460
43 44 45 46 47 48 49 50 51 52 53 54 55 56 57 58 59 60 61 62 63 64 65 66 67 68 69 70 71 72 73 74 75 76 77 78 79 80 81 82 83 84 85
Pool
Ele
vatio
n (F
eet,
msl
)
Water Temperature (˚ F)
Site A Site B Site C Site D Site E Site Dam
Spillway
Top - Top Shutters
Top - Middle Shutters
Top - Bottom Shutters
W S Intake
Power Penstocks
Lower Tier River Outlets
Upper Tier River Outlets
Folsom Lake Temperature Profiles: 04-Jan-2019

1/17/2019
DRAFT January 2019
90% Runoff Exceedance Outlook:
Federal End of the Month Storage/Elevation (TAF/Feet)Jan Feb Mar Apr May Jun
Folsom 312 302 344 446 522 568 476Elev. 387 395 409 419 425 414
Monthly River Releases (cfs)American 1750 1500 1250 1285 1278 2509MRR 1750 1750
50% Runoff Exceedance Outlook:
Federal End of the Month Storage/Elevation (TAF/Feet)Jan Feb Mar Apr May Jun
Folsom 312 437 579 663 753 958 919Elev. 408 426 435 445 464 461
Monthly River Releases (cfs)American 1750 2000 4000 3500 6500 3111MRR 1750 1750
Please note:
Shaded area represents less confident hydrologic inputs of the future water year.
CVP actual operations do not follow any forecasted operation or outlook; actual operations are based on real-time conditions.
CVP operational forecasts or outlooks consider general system-wide dynamics and do not necessarily address specific watershed/tributary details.
CVP operations are updated monthly as new hydrology information is made available December through May.CVP releases represent monthly averages.
Inflow based on 90% historical average runoff for all months.
Inflow based on 50% historical average runoff for all months.
Related Documents