^AMERICAN METEOROLOGICAL SOCIETY Sponsored by AIR FORCE CAMBRIDGE RESEARCH CENTER Bihliograpln mi Cicitoral <><•< allograph i<- Meteorology Vol. January i*>»">•• No. 1

Welcome message from author
This document is posted to help you gain knowledge. Please leave a comment to let me know what you think about it! Share it to your friends and learn new things together.
Transcript
^AMERICAN METEOROLOGICAL SOCIETY
Sponsored by
AIR FORCE CAMBRIDGE RESEARCH CENTER
Bihliograpln mi Cicitoral <><•< allograph i<- Meteorology
Vol. January i*>»">•• No. 1
c s? o <s ° e >>% g& MS
CO
< u Q O
w a, b, O
3 S U
.Is " o *n
'3 3
' E
.i « u Ill-a 3 aE | JES.> Soil
0 « to
Si 1
c _ c tl 'Z
fij >» 5-1
«— C R C 0 e «i D
!> 4S -s -*
1 § c c
r •? "S .6 22 e = i • -J 2 o -
1 s J
o s £ £ "Z- ao
£ > 3
§ tJ-23
« c *;
? o .
*iE~7-5E
23 •<
to -=f
O o •J o « o w H W s
e.2 S a ~ s s T) a 5 £ « 2 e
n>
§C0 cr-e
vc e
J= .O
3 0. «
•§*i
o -O
O
a.
O Qj
?-:3*f >>_; S
r> 3 " .2 co - - U LJ'J; O g
O
X z
ienc
e ,
SS
S
ysic
al
rolo
gi
z. t—t " x xi o
UO 3 O, 4) co M £ ?, « < 0) ^ 4> u
o .2 := c c 3 P « « Q E c o o O 2 ca
de
kade
m
eri
mer
i
w <<<< a, *
'5b "& £ oT O O 3 --
u- Ui W) JS o o >> o d) ai rl u *• •* Q. O 4) O Q OJ
3 c w >"•
1*
hU. J- U
c
U> ^1 M
i I •—. •"•
2 » * T3 o .2 0 SSS c 1 lL
-^ (A
•SIS'
oi —. « r o ^ •
'5t .
c
-a
5J" 3-pi.
*u.-.
i£^ 3 ">
= "3 E
>.
,?!• 0. x o
;o-£
H. S o
2 • "3
IS"* j W V > J "3 "3 "«
M c c "3 « , c c _
i * *
sfi^p; o
< «
SS 3 —
.81 •n J=
o o v a O O
vi *—'«H « - a £ H « H a z •a &Bi
« « •S-a-a ^3 tn O
; w ja o
: <o S i «* -*- ^ I o o o
c c c H H H
- 3 3 3 T3 C © O O
1^ s 8.8
**• ° 1,'
c : —
. •= 7.
£ 0)
c S
^^ . s 3 &
£ cO <~ 'o =
a ca co • • c c
3 3- O O £
JJ 3. S « - Ir? . a !>.
si O _o O M w .2
s s V
• *
£^ w ! ^ -'/•
~J u ;: — u) .—
4» — JZ
nl s .^ C .
5S^:
•*• PS = uri- 0." « r » -
O «) „
o,2 if •4) O O •0) o o
.3ES * * *
;s
Sex ^§ £ - *-> ^ - ii <i>
IS-a ?•§•& 5 O O
2 i>
j PS s </)
. — tfl -
v; 2 d.
w .i - C 4> a ° -a 5P ^ o . .£ = J3 •o'c S.
C > S j;
| .1 £ 1
?21
s^ o. - ij ?.-•
t« -; > t — M
•J • - be ^ -:
»- ° 5 - - <u -z: "^ : O >. .
o « « w * W
s.5 s
O (i (A >*
-1 - »- — :* "C © _ ; 4» T
c > o : <u — *?. _r
X> -A -
^•S:3' : T3 — | . S 3 c; -
«u »^ —
>>.5
I =
<
H U < a h- n CO <
< u CD O -j O Of O
>- z a
o q -i flQ
flQ
o 2 3 j O u < s
'•O
a
-a
T3 ^J
w o o ai a
to
V)
.j -c
fe !• 5
^ o hi
a ?2 a.
9^0 D in
s a
<
o aT DS" 2 U. U H O 2 « « 5 < u S a a' M u
a w 3 H " — O
2 g o
a
g
i5
1 § ^ -a
W N OH
3 L. tft »l O H^;
o
3 ^w* o ~H»
UJ -a j H 3
I 2
<
5 H
< < -1
a £
X o
PQ
oo
W cd
*? Q Q <
d
U
3
W Pi
Q c
2 C Q. 0 ,4J
c H IS to m (J
j> "!. Q
O 2
Ct,
o •J <! I—t
o H t—(
Q W
o -0
CO r~t Vi
.a s o co"
s I
o —
G c?
w >;
to E ft B O CO
W ^
B I H "3
g"W
"S a *> ?.
•u «" U
• |Q
11 s" • Si B
in .= v. -O
K &, <:
O o I—I a 2 S Q Z < oo t- U < o
S a QQ O
-a
< .2
c - S tl - - » s
= <n m
•a S °« M* 1 S so Q
o >>
O c W 2 H c
W s
-3 c
— .C rt
o
C ° IS* ^ "5 E
o -5 J3 ° to
C W
>^ .2
*_i **
U 2
o .— in
*~ o o p
£ 3 2 3 S '3
•S -jo
•S « w
So c .> - .2 § tJ -S
=q ^ H— cy
CS rj
B
SI si
>- o •9 </>
i- o
a. W
CD . O O O. P .. »> a «-
3 <
Z- o-S
•a c
ft, ci K-i 1) 05 tx> o £ tyi u) K D c«
JS i
!<
Oog
frSS :«:
o J5 ->> Q E • £•«<
•&gfS 2 J H
£^ 3 «,< §
V u 3
• k- C c o «
S " S -5c3
g 8 E Z j o
.»•»•; J3 9
^c5-g
•s s
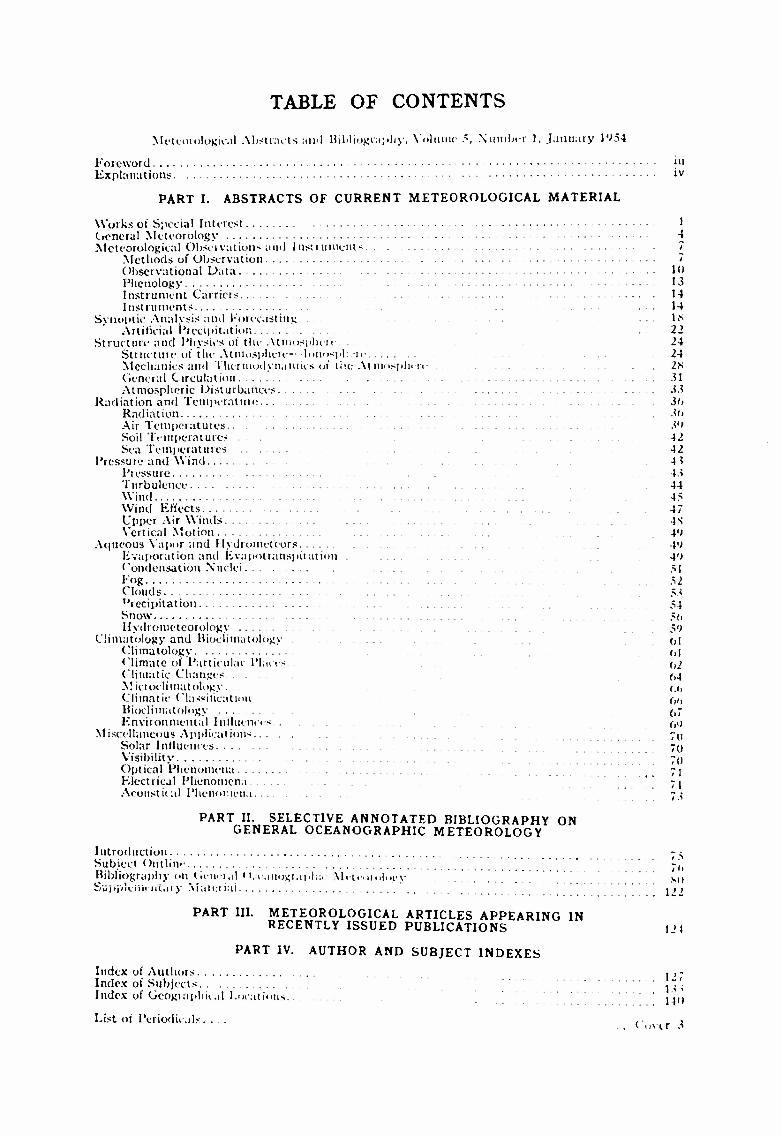
TABLE OF CONTENTS
MKcoiologio.il Abstracts ;.ti'l Bibliography, Volume 5, Xumbrr 1, January P>54
Foreword {'' Explanations tv
PART I. ABSTRACTS OF CURRENT METEOROLOGICAL MATERIAL
Works of Special Interest (icneral Meteorology Meteorological Observation* ami Insttumcnts
Methods of Observation . Observational Data. Phenology Instrument Carriers Instrument?
Synoptic Analysis ami Forecasting Artificial Precipitation
Structure and Physics ol'the Atmosphere Structure of the Atmosphere- -lutictsftl: ie Mechanics and Thermodynamics ot li'.e Aunosphin (icneral C irculatioll Atmospheric Disturbances
Radiation and Temperature Radiation Air Temper at uics Soil Temperatures . Sea Temperatures
Pressure and Wind Pressure Turbulence Wind Wind Effects Upper Air Winds ... Vertical Motion
Aqueous Vapor and Hydrotneteors Evaporation and Fvapotranspiiation Condensation Nuclei Fog Clouds Precipitation Snow Hydrometeorology
Climatology and Biociinuttology . . Climatology Climate of Particular Places Climatic Changes.. . Microelimatology Climatic Classification Biocliroatology Enviionmetual Intluences ...
Miscellaneous Applications Solar Intluences Visibility . Optical Phenomena Electrical Phenomena Acoiisti* al Phenomena
1(1 13 14 14 l.s 22 24 24 2S 31 33 30 M, Ml
42 U 4.i 44 45 47 4S V> VI 4') 51 52 5.1 54 50 5'J ol ol (,2 f.4 f.f>
(Hi
67 (VI 7tl 70 7(1 71 71
PART II. SELECTIVE ANNOTATED BIBLIOGRAPHY ON GENERAL OCEANOGRAPHIC METEOROLOGY
Introduction Subject Outline Bibliography on Uciuial < Vt-.tnogi.tphii Mcteoioloev buj/jVieiiii iii.n y Mateiiai
PART III. METEOROLOGICAL ARTICLES APPEARING IN RECENTLY ISSUED PUBLICATIONS
PART IV. AUTHOR AND SUBJECT INDEXES
Index of Authors Index of Subjects Index of Geographical Location-
List of Periodicals. . . .
i fi Ml
122
121
\27
iin
(over .<

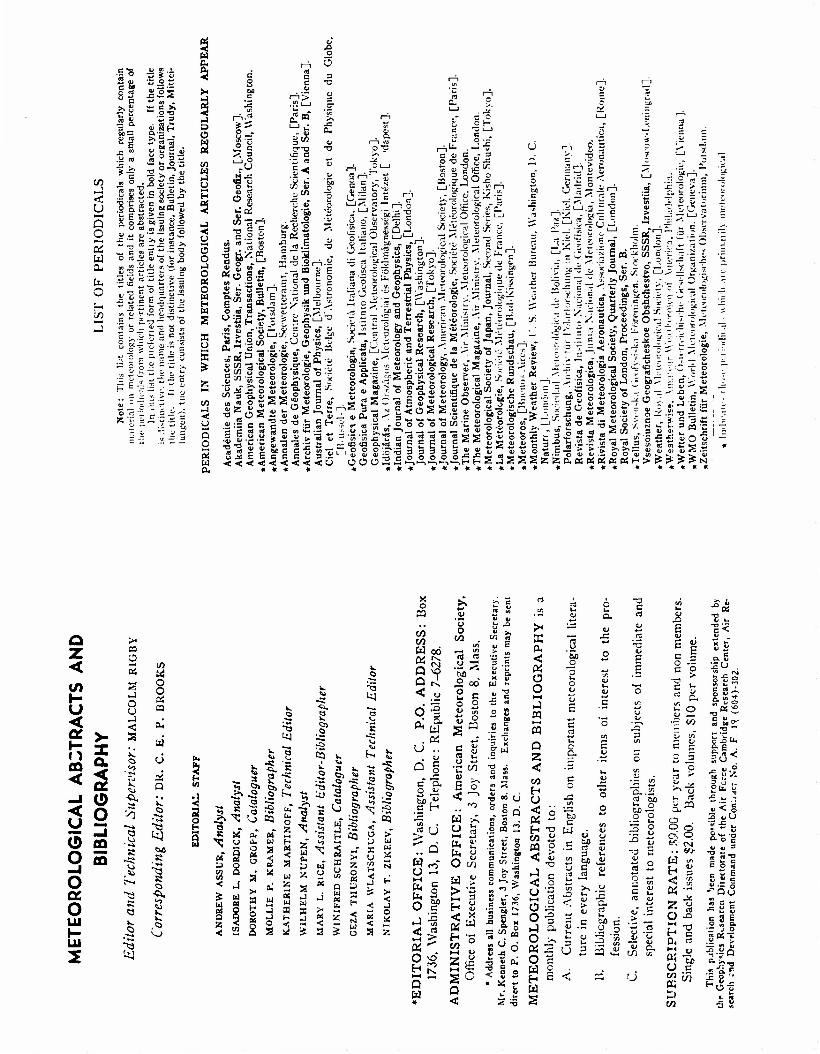
METEOROLOGICAL ABSTRACTS AND BIBLIOGRAPHY
MALCOLM RIOBY, Editor
Vol. 5 JANUARY 1954 No. 1
SPECIAL FEATURE IN THIS ISSUE
A Selective Annotated Bibliography on General Oceanographic Meteorology
(For complete table of contents see back cover)
Published monthly at Prince and Lemon Streets, Lancaster, Pa., by the AMERICAN METEOROLOGICAL SOCIETY, 3 Joy Street, Boston 8, Mass.
Primed and issued by: Lancaster Press, Inc.
•I *
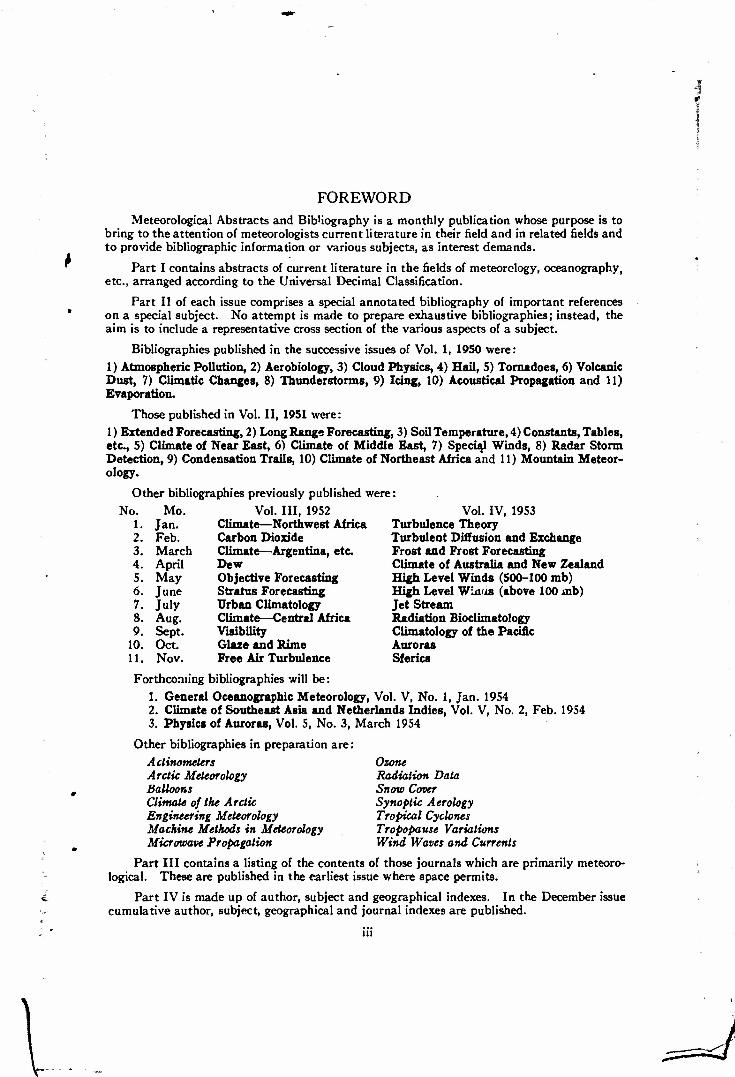
FOREWORD Meteorological Abstracts and Bibliography is a monthly publication whose purpose is to
bring to the attention of meteorologists current literature in their field and in related fields and to provide bibliographic information or various subjects, as interest demands.
Part I contains abstracts of current literature in the fields of meteorology, oceanography, etc., arranged according to the Universal Decimal Classification.
Part II of each issue comprises a special annotated bibliography of important references on a special subject. No attempt is made to prepare exhaustive bibliographies; instead, the aim is to include a representative cross section of the various aspects of a subject.
Bibliographies published in the successive issues of Vol. 1, 1950 were: 1) Atmospheric Pollution, 2) Aerobiology, 3) Cloud Physics, 4) Hail, 5) Tornadoes, 6) Volcanic Dust, 7) Climatic Changes, 8) Thunderstorms, 9) Icing, 10) Acoustical Propagation and 11) Evaporation.
Those published in Vol. II, 1951 were: 1) Extended Forecasting, 2) Long Range Forecasting, 3) Soil Temperature, 4) Constants, Tables, etc., 5) Climate of Near East, 6) Climate of Middle East, 7) Special Winds, 8) Radar Storm Detection, 9) Condensation Trails, 10) Climate of Northeast Africa and 11) Mountain Meteor- ology.
Other bibliographies previously published were: No. Mo. Vol. Ill, 1952 Vol. IV, 1953
1. Jan. Climate—Northwest Africa Turbulence Theory 2. Feb. Carbon Dioxide Turbulent Diffusion and Exchange 3. March Climate—Argentina, etc. Frost and Frost Forecasting 4. April Dew Climate of Australia and New Zealand 5. May Objective Forecasting High Level Winds (500-100 mb) 6. June Stratus Forecasting High Level Wiuus (above 100 mb) 7. July Urban Climatology Jet Stream 8. Aug. Climate—Central Africa Radiation Bioclimatology 9. Sept. Visibility Climatology of the Pacific
10. Oct. Glaze and Rime Auroras 11. Nov. Free Air Turbulence Sferics
Forthcoming bibliographies will be: 1. General Oceanographic Meteorology, Vol. V, No. 1, Jan. 1954 2. Climate of Southeast Asia and Netherlands Indies, Vol. V, No. 2, Feb. 1954 3. Physics of Auroras, Vol. 5, No. 3, March 1954
Other bibliographies in preparation are: A clinometers Ozone Arctic Meteorology Radiation Data Balloons Snow Cover Climate of the Arctic Synoptic Aerology Engineering Meteorology Tropical Cyclones Machine Methods in Meteorology Tropopause Variations Microwave Propagation Wind Waves and Currents
Part III contains a listing of the contents of those journals which are primarily meteoro- logical. These are published in the earliest issue where space permits.
Part IV is made up of author, subject and geographical indexes. In the December issue cumulative author, subject, geographical and journal indexes are published.
iii
EXPLANATIONS
Location of material: For each entry, a symbol is given for at least one library where the material may be found. The Union List of Serials (Gregory) is the source of most of the symbols used. In some cases, where no symbol has been assigned to a library, one will be devised according to the principles of the Union List.
Library symbols used frequently may be found in the following list:
DA: U. S. Dept. of Agriculture Library, Washington, D. C. DBS: U. S. Bureau of Standards Library, Washington, D. C. DGS: U. S. Geological Survey Library, Washington, D. C. DLC: Library of Congress, Washington, D. C. DN-HO: U. S. Navy Hydrographic Office Library, Suitland, Md. DSG: U. S. Army Medical Library, Washington, D. C. DSI: Smithsonian Institution Library, Washington, D. C. DWB: U. S. Weather Bureau Library, Washington, D. C. GB-MO: Great Britain, Meteorological Office Library, Harrow, England. MH-BH: Harvard University, Blue Hill Observatory (and American Meteorological
Society) Library, Milton, Mass. MWB: Marine Biological Laboratory (depository for Woods Hole Oceanographic
Institution), Woods Hole, Mass. NN: New York Public Library, New York, N. Y. NNA: American Geographical Society Library, New York, N. Y.
Other symbols:
* before an entry indicates a good data source. t before an entry indicates a good bibliography. ! before an entry indicates a synoptic case history study accompanied by charts.
Geographic locations are in the English form rather than the form used locally, for example, Moscow for Moskva.
Titles of articles or monographs are in the language of the original article unless otherwise stated. Slavic (Cyrillic) titles are transliterated into the Roman alphabet according to the Library of Congress transliteration scheme.
Abbreviations:
Titles of periodicals are not abbreviated, as a rule.
The months of the year from March to July are not abbreviated. Other months are abbreviated as Jan., Feb., Aug., Sept,, Oct., Nov., and Dec.
The word or abbreviation for Volume (Tom, Band, Jahrgang, Ano, etc.), for Number (Heft, Fascicule, Vypusk, etc.) and for page or pages is omitted from most entries. Thus an entry will read as follows:
Meteorologische Rundschau, 2(5/6) :146-151, May/June 1950.
This indicates that the article appeared in Meteorologische Rundschau, Jahrgang 2 (Vol. 2), Heft 5/6 (No. 5/6), pages 146-151, May/June 1950.
iv
PART I. ABSTRACTS OF CURRENT METEOROLOGICAL MATERIAL
WORKS OF SPECIAL INTEREST
5.1-1 551.5:63(02) 551.582(439.1) *Aujeszky, L4szl6; Berlnyi, Dines and Bill, Blla, MezSgazdasigi meteorologia; Az
agrometeorologiai ismeretek kezikonyve. [Agricultural meteorology; an agrometeorological handbook.] Budapest, Akadlmiai Kiad6, 1951. 550 p. 300 illus. refs. DLC—This text is intended for the general reading public, the college student and the research scientist as well. It comprises a useful handbook of meteorology, climatology and their agricultural applications, especially for those working on Central European crop ecology. In Pt. 1 (p. 15- 271) basic information on meteorological elements, meteorological research, atmospheric dynamics, climatology and world climate is presented in a clear and analytical manner. A special section deals with the climate of Hungary (illustrated with numerous climatic charts). Pt. 2 (p. 275-417) deals with atmospheric phenomena and climatic factors from the point of view of their effect on the development of plants; with weather requirements of plants at various stages of their development, with microclimate and with the utilization of meteoro- logical information for agricultural purposes. Pt. 3 (p. 421-541) contains data on the ecology of 17 principal crops grown in Hungary. It also includes a chapter on the dependence of growing climate on soil properties and one on forest climate. The use of this extensive study as a reference book is facilitated by a subject index. Subject Headings: 1. Meteorology 2. Climate of Hungary 3. Agricultural meteorology 4. Plant ecology S. Textbooks 6. Hungary.—G.T.
5.1-2 551.555.6:551.594.25:551.578.4(99) Barre\ M„ Proprietes electriques du blizzard. [Electrical properties of blizzards.]
Annales de Geopkysique, 9(2):164-183, 1953. 22 figs., refs. MH-BH—An extensive and intensive account of an unplanned investigation of the electrical effects of blizzards on antennas in use at Adllie Land during the 1951 expedition. Radio reception from Washington (WWV) or Hawaii (WWVH) was disturbed for 80 hours in the month of March 1951—sometimes for a day at a t'me. The special antennas, circuits connected with recorders, recorder records during blizzards showing slow development of charges in antennas and excellent photographs of antennas and exposure in connection with terrain and snow are reproduced. Temperature effect and wind effect vary with 1) height of antenna and 2) type of blizzard. The two types of blizzard are (A) mostly falling snow and (B) blowing snow. The first type occurs mainly in winter and usually results in positive charges—more pronounced in the high antenna. Type B occurs usually in spring and is not complicated by containing a mixture of snow flakes and blowing snow as is the case with type A. The crystals are always hard and the charges are negative with light winds and positive with strong winds. The blizzards at temperatures of 0° to — 10°C do not affect radio reception very much. Positive charges are more frequent at temperatures >—15°C, and negative charges more frequent at <—15°C. Strong charges occur with strong winds and great density of the blizzard, but the opposite is not always the case. The noise shows a straight line relation to wind and density of snow. Finally, the vertical structure of 13 blizzards is shown graphically, together with visibility, wind speed and size of particles. The density was measured in terms of water content of snow caught in boxes at 15, 65, 115, 165 and 215 cm above the ground. It showed a rapid decrease in density of the first meter with type B blizzards, but a much slower decrease in general for type A (through more variability because of varying winds and amounts of blowing snow in type A). Results at Adllie Land are not in agreement with those of Mt. Washington (SCHAEFER, 1947) because of greater amount of blowing (hard) snow in blizzards at the former
2 METEOROLOGICAL ABSTRACTS AND BIBLIOGRAPHY
station. Subject Headings: 1. Snow static 2. Vertical structure of blizzards 3. Blizzard electrical charges 4. French Antarctic Expedition 1951 5. Adelie Land, Antarctica.—M.R.
5.1-3 551.584(02) :551.586:63 t*Brooks, F. A. {Calif. Univ. at Davis), Climatic environment: a thermal system. Syllabus
for Agricultural Engineering 106, University California at Davis. Aug. 1951. 153 p. numer- ous figs., graphs, bibliog. at end of each part, eqs. Mimeo. DWB—This syllabus comes the nearest to a textbook on micrometeorology (in the applied sense) of any American contribution. Pt. I contains 3 major chapters on: a) the atmosphere, b) world temperature, wind, precipi- tation and climate and c) air masses, fronts, disturbances and weather maps. Pt. II takes up daytime thermal processes (solar energy, conduction, convection, diffusion, evaporation and heat balance). Pt. Ill has 5 chapters on nighttime thermal processes (radiational coolir g, air draft, heat balance and frost protection). Pt. IV deals with local and regional agricultural climatology. Subject Headings: 1. Agricultural climatology 2. Micrometeorology 3. Text- books.—M.R.
5.1-4 551.586:61 Dordick, Isadore L., Climate and work in Australian New Guinea. Acta Tropica, Basel,
10(3):233-250, 1953. 3 figs., 9 tables, 15 refs. Abstracted from reprint. In English; French and German summaries. DLC—Available data for temperature, vapor pressure and wind speed are summarized, giving annual mean seasonal variation and change with elevation. "Effective temperatures" are computed as an index of the climatic comfort, according to norms, established by the Committee on Atmospheric Comfort of the American Public Health Association. The index varies between 75 and 79° at wind speed of 20 ft/min-1 and between 72 and 76° at 200 ft/min-1 for Lowland New Guinea, compared with the tolerance limit of 85° for light sedentary activity and 80° for heavy work. Therefore an efficient performance of severe physical and complex mental activities can be expected from acclimatized white men. Even more favorable is the climate on the Central Plateau with an elevation of about 5000 ft. Subject Headings: 1. Comfort climate 2. Tropical bioclimatology 3. Australian New Guinea. —A. A.
5.1-5 551.551(08) International Symposium on Atmospheric Turbulence in the Boundary Layer, Massa-
chusetts Institute of Technology, June 4-8, 1951, [Proceedings]]. Organized jointly by the Dept. of Meteorology of the Massachusetts Institute of Technology and the Geophysics Research Directorate of the Air Force Cambridge Research Center under Contract AF 28(099)- 7. U. S. Air Force. Cambridge Research Center, Geophysical Research Papers, No. 19, Dec. 1952; AFCRC Technical Report 53-9. 530 p. numerous figs., refs., tables. MH-BH—This is the first large international symposium devoted exclusively to atmospheric turbulence with numerous contributions by the best American, British, German, French, Australian and Japanese specialists in this field. Three papers deal with the present position in turbulence research and unsolved problems, 4 papers with evaporation and the air-ocean interface, 13 papers ire devoted to the structure of turbulent flow and its observation, with a summary of experimental work, carried out in the United States. Ten papers study eddy fluxes and eddy diffusion, the effect of turbulent flow on the vertical transfer of heat, moisture and momentum, as well as the statistical properties of turbulence. Carefully summarized and edited dis- cussions at the end of each paper and for the whole symposium, increase the value of the volume considerably. Numerous results of experiments can be found in the individual papers; for example, data on the performance of observational equipment, autocorrelation and vertical profiles of wind and temperature, frequency distribution of wind fluctuations, bubble release, photographic observations, etc. Abstracts of the single papers will be published separately. Subject Headings: 1. Atmospheric turbulence 2. Turbulence observations 3. International symposia. I. Hewson, E. W. (ed.) U. Massachusetts Institute of Technology. Dept of Meteorology ni. U. S. Air Force. Cambridge Research Center IV. Contract AF 28(099)-7— A. A.
I. CURRENT ABSTRACTS
5.1-6 SSI.593.54 tPenndorf, Rundolf, On the phenomenon of the colored sun, especially the "bins" sun
of September 1950. U. S. Air Force. Cambridge Research Center, Geophysical Research Papers, No. 20, April 1953. A FCRC Technical Report, 53-7. 41 p. 12 figs., 9 tables, bibliog. p. 41. DWB—This paper presents a thorough and systematic analysis of the optical condi- tions necessary for a colored sun or moon (red, blue or green) and of the conditions actually or theoretically present at the time of the "blue" sun of Sept. 1950. First there is a theoretical discussion of large particle scattering, then a review of observations made of the smoke and radiation conditions during the Sept. 1950 phenomena (3 sets of measurements of radiation were obtained in 1) Gotha, Germany, 2) Bergedorf, Germany and 3) in Edinburgh, Scotland). Unpublished color photographs were made at the Naval Observatory in Washington, D. C. The extinction coefficients are given, the radius and number of particles discussed in theory and related to observations, the anomalous extinction between 3500 and 7000 A for Sept. 1950 treated quantitatively, the spectrum and intensity of a blue and a green sun and the physiological impression of such spectra analyzed, with a conclusion that the reports of "blue" sun are correct. MIE'S theory of large particle scattering is applied and the radius of particles calculated as 0.5 to 0.8M with a concentration of 175 to 127 per cm*. With assumption of 3 size spectra, and of spherical particles (since non-spherical particles have an extinction coeffi- cient differing by <10% from spherical), the intensity distribution of solar spectrum from 3500 to 7000 A gives a maximum between 4100 and 4600 A, similar to that which would appear during a dust storm if particles were of a 0.3j* size and total number of >10*/cm* column. Subject Headings: 1. Blue sun 2. Smoke pall—Sept 1950 3. Extinction coef- ficient 4. Atmospheric optics.—M.R.
5.1-7 551.511:016 tPhysical Review Index, 1921-1950, v. 17-80. Prepared under the direction of J. W.
Buchta. Published for the American Physical Society ... by the American Institute of Physics. N. Y., 1952. [2 v.] Separate author and subject indexes. A previous index, 1893-1920, pub. 1921, indexes v. 1-15, 1893-1912, and Series 2, v. 1-16, 1913-1920. DLC— In the voluminous Subject Index (500 p.) the section on Geophysics covers 7, 2-column pages (p. 196-202) and contains subheadings entitled: (167) Atmosphere—absorption spectra, aurora, night sky, (168) Atmosphere—composition, (169) Atmosphere—electrical phenomena, (170) Atmosphere—general, (171) Earth—age, (172) Earth—general, (173) Earth—magnet- ism, (174) Earth—radioactivity; over 400 references in all. Material of interest is also found under (57) Cosmic rays—atmospheric effects, (111) Lightning and (134) Electromagnetic propagation. In the Author Index (540 p.), hundreds of pertinent articles can be located by reference to works of such prolific writers as E. 0. HULBERT, JOSEPH KAPLAN, O. R. WULF, Ross GUNN, S. J. MAUCHLY and other outstanding physicists. All in all, this work and its predecessors constitute a very valuable contribution to the bibliography of the physics of the atmosphere, especially for those who do not read any language but English. Subject Headings: 1. Bibliographies 2. Cumulative indexes 3. Physics of the atmosphere. I. American Physical Society II. American Institute of Physics m. Buchta, J. W. (ed.)—M.R.
5.1-8 551.511:536.2 t*Ramdas, L. A. (Poona, India), Convective phenomena near a heated surface. Indian
Academy of Sciences, Proceedings, Sec. A, Bangalore, 37(2):304-317, Feb. 1953. 5 figs., table, plate. DLC—The author summarizes and analyzes the results of numerous experi- ments (since 1930) with rising currents of air above a heated plate (2 cm sq) and above heated ground. Lapse rates 2 million times the adiabatic were found just above the ground and 2000 Xadiabatic at 30 cm height, whereas at 7.5 m above ground the rate was 6 Xadiabatic. (Data from Poona, April 1950.) The patterns observed above a hot plate, as observed from smoke ascending around the plate, give an analogy to that above heated ground. The free areas are sharply contrasted with the smoky areas. The rising columns of air are similar to the shimmering areas seen above ho4 roads or fields, and the height to which the columns rise is called the top of the shimmering area. The lapse rates and fluctuations in temperature and height of the top of this layer were measured carefully with extremely small copper-
V
4 METEOROLOGICAL ABSTRACTS AND BIBLIOGRAPHY
constantan thermocouples and recorders, and the conditions in the first mm above the plate by means of interferometric techniques. The conditions which attend the development of the nocturnal inversion in the evening and its destruction after sunrise are shown diagram- matically for the lower 300 m on the basis of these and field measurements. Finally, a thermal repulsion apparatus which studies conditions of convection beneath the hot plate is described. When dust particles are repelled uniformly and deposited on the plate a condition of no con- vection is reached. The remarkable point in these experiments is the maintenance of the convective pattern without turbulence even when considerable wind shear occurs. In such cases the long spindly convective cells merely lean one way or another but are not destroyed. QJnder such conditions of lapse rate and convection, how can theoretical calculations of turbulence be made for the microclimatic layer? ed.~\ A set of 4 series of temperature records made at 18 different heights from 0.5 mm to 913 cm at 0630, 1000, 1400 and 1700h at Poona, shows the height to which the convective cells rise at different times of the day, at 0630 top = 1 to 2 cm, at 1000 and 1400—9 cm, and at 1700—10 cm. Finally, a good list of references to studies on this subject made in India from 1932-1951 by the author and his associates is added. Subject Headings: 1. Extreme lapse rates 2. Convection above heated ground 3. Convection over hot plates 4. Top of convective layer 5. Poona, India.—M.R.
5.1-9 551.510.42:06 United States Technical Conference on Air Pollution, Washington 1950, Air pollution.
New York, McGraw-Hill, 1952. 847 p. figs., tables, refs. DWB—An interdepartmental conference on air pollution was arranged by representatives of the U. S. Weather Bureau, Public Health Service, Bureau of Standards, Dept. of Agriculture, etc. (among whom were Col. B. G. HOLZMAN, SVERRE PETTERSSEN, HARRY WEXLER and DR. H. E. LANDSBERG). The conference took, place on May 3-5, 1950 in Washington, D. C. General panel discussions at the various sessions are reported in the first 33 pages of the sizable volume. The rest of this volume constitutes a compendium of articles by numerous authorities in every field of air pollution research and control. The 97 articles are arranged into 7 panels: 1) Agriculture, 2) Analytic methods and properties, 3) Equipment, 4) Health, 5) Instrumentation, 6) Legisla- tion and 7) Meteorology. Articles of meteorological interest are to be found in all parts of the volume. A detailed index is appended. Individual articles will be abstracted separately and published later. Subject Headings: 1. Atmospheric pollution 2. Atmospheric pollution control 3. Compendiums 4. Conferences.—M.R.
GENERAL METEOROLOGY
See also: Agricultural meteorology (Aujeszky, Berenyi, Bell), 5.1-1; Bibliography on gen- eral oceanograpbic meteorology, p. 75-123.
5.1-10 551.5(04) Barnett, Lincoln, The world we live in, Pt. IV. The canopy of air. Life, Chicago,
34(23):74-98, June 8, 1953. 31 illus. (some in color). DLC—One of the most beautifully illustrated popular articles on the atmosphere, clouds, auroras, winds, fronts, storms, lightning, rain, climate, etc. ever published. Most of the colored pictures are exceptional in vividness of contrast. A large colored model of the atmospheric structure from the surface to 400 mi, one of a wave in the lee of the Sierras, and one of a thunderstorm in Arizona are the most striking of all. Four unusual auroras are similarly illustrated in color. The text is scientifically accurate. The text and illustrations were compiled with the advice and help of ^3 "big name" meteorologists or geophyaicists in a dozen United States, Canadian and Norwegian Institutions. This and others in this series of articles on Geology, Oceanography, etc. repre- sents popular science at its best. Subject Headings: 1. Popular meteorology 2. Atmospheric structure 3. Auroral photographs 4. Origin of atmosphere.—M.R.
5.1-11 551.5(04) Cook, J. Gordon, Can science stop it raining? Featuring the weather, with 10 other
science stories for the non-technical reader. Spotlight on Science, Guildford, Surrey, England, No. 2, 1951. 58 p. Price: 2s. DWB—Half of the 16 chapters of this science booklet deal
I
I -

I. CURRENT ABSTRACTS
with meteorology or related subjects. The history of meteorology and weather forecasting, the climate of Great Britain, large-scale climatic changes, artificial control of precipitation, solar energy utilization and cosmic radiation are discussed in simple terms. Subject Heading: 1. Popular science books.—G.T.
5.1-12 551.5(04) Ficker, Heinrich von (Unw. of Vienna), Wetter und Wetterentwicklung. [Weather and
its formation.] Berlin, Springer-Verlag, 1952. 4th enl. ed. 140 p. 42 figs. Append: Examples of weather charts. Verstdndliche Wissensckafi, Berlin, v. 15. DLC—This popular pocket edition is the standard meteorological textbook for the interested layman in Germany. The author avoids a lengthy discussion of instruments and observation methods but aids the deeper understanding of weather processes in a competent manner. The main objects dis- cussed are: radiation, clouds, fronts, fohn, tornadoes, cyclones, anticyclones, weather maps and weather forecasting. An appendix of 11 weather maps characterizes typical synoptic situations for cold waves, radiation weather, storms, thaw weather, killing frost, floods, etc. Subject Heading: 1. Popular science books.—A.A.
5.1-13 551.5(046) Reichelderfer, Francis W., What's wrong with the weather? U. S. News and World
Report, Wash., D. C, 34(26) :50-54, 59-66, June 26, 1953. port., diagrs. DLC—An ex- tensive interview between DR. REICHELDERFER, chief of the U. S. Weather Bureau, and the editors of the U. S. News and World Report wherein the author gives the latest official informa- tion or opinions on the possibility of atomic explosions influencing the weather (i.e., tornadoes), on the warming of the Arctic, radiation effects of atomic explosions, progress in forecasting tornadoes and hurricanes, long range forecasting and international cooperation in interchange of weather information. It is concluded that the energy of an atom bomb is too small to influence the large-scale weather processes or even hurricanes. Subject Headings: 1. Atomic explosion effects 2. Forecast accuracy.—M.R.
5.1-14 551.5(09) K——, J., Mit nyujt az Steves tenr a meteorol6gianak? [What does the five-year plan
offer to meteorology?] Idojdrds, 55(7/8) :192-194, Tuly/Aug. 1951. illus. on front cover. DLC—Appropriations made available through the Hungarian five-year plan will permit extension and intensification of meteorological services, research and education. A new observatory (to be one of the most up-to-date in Europe) is being constructed near Budapest; meteorological stations are receiving better equipment; several regional observatories and mountain observatories are being established; regular synoptic and aerological services have been introduced; daily and monthly bulletins appear in increased volume; the Meteorological Institute's "Yearbook" will appear more regularly. Forecasting techniques are said to have been improved by adopting methods acquired from Russian scientists and a department of meteorology has been founded at one of the Budapest universities. Subject Headings: 1. Prog- ress in meteorology 2. Meteorological service development 3. Hungary.—G.T.
5.1-15 551.5(09) (73) Troll, Karl, Fortschritte der Meteorologie. [Advances in meteorology.] Erdkunde,
Bonn, 7(3):236, 1953. 5 refs. DLC—Account of recent publications of the American Me- teorological Society: "Compendium of Meteorology," Meteorological Abstracts and Bibliography, with brief references to Bulletin, Journal and Meteorological Monographs. Subject Headings: 1. Progress in meteorology 2. American Meteorological Society.- C.E.P.B.
5.1-16 551.5:6 Reichelderfer, Francis W. (.Chief, U. S. Weather Bureau), The United States Weather
Bureau and Industry. Weather-wise, 6(2) :31-32, 62, April 1953. DWB—The scope of the U. S. Weather Bureau's service to business, agriculture, industry and the general public is indicated in this brief article.1'Numerical values or estimates of the number of reports of various kinds, the number of damaging storms of various kinds and the percentage of the Weather Bureau's efforts that go to the different services are given. Subject Headings: 1. In- dustrial meteorology 2. Meteorological services 3. U. S. Weather Bureau.—M. R. •
6 METEOROLOGICAL ABSTRACTS AND BIBLIOGRAPHY
5.1-17 551.5:659.25 Smith, Charles Pennypacker (Pacific Gas & Electric Co.), Meteorology in a public utility.
Weatherwise, 6(2) :49-50, April 1953. DWB—The Pacific Gas and Electric Co. maintains its own weather forecasting unit to provide the operations department with information as to the temperature, wind, cloudiness and precipitation which may be expected in the next 24 to 36 hours. A1°F drop in temperature will increase demand for gas by 28 million cu.ft. (in North- ern and Central California where 1,100,000 customers use the flow from 48 gas fields). Fore- casts are also made for construction, maintenance and hydroelectric activities; climatological summaries and analyses are also provided for design of planning. Forecasts are prepared 7 days a week in winter, by one full time and 2 relief meteorologists; their spare time in summer is used in studies and research. Subject Headings: 1. Industrial meteorology 2. Public utilities forecasting 3. Northern California.—M.R.
5.1-18 551.5:659.25 Steele, Thornton A. (Western Reserve Univ.), A department store uses weather. Weather-
wise, 6(2):42-43, April 1953. DWB—A sales expectancy index, compiled from a regression equation combining effective temperature (temperature and wind) (T), precipitation (P), depth of snow (D), and percentage of sunshine (5), was worked out for the Younkers Depart- ment Store in Des Moines, Iowa, for early Easter and late Easter seasons, respectively, and an example of its use cited and illustrated graphically. The value of such an index in planning future sales, evaluating actual sales, effectiveness of advertising, etc. is brought out. Good forecasts can add to the value of these aids to business. Subject Headings: 1. Industrial meteorology 2. Sales expectancy indexes.—M.R.
5.1-19 551.5:63(09) Habermehl, R., Zwei Jahrzehnte Agrarmeteorologie. [Two decades of agricultural
meteorology.] Germany. Deutscher Wetterdienst in der US-Zone, Berichte, No. 42:430-433, 1952. fig., 4 refs. DWB—History of development of agricultural meteorology in Germany before the war and in the U. S. Zone since the war, with programs of research institutes. Sub- ject Headings: 1. Agricultural meteorology 2. History of agricultural meteorology.—C.E.P.B.
5.1-20 551.5:63 Maksimov, S. A., Meteorologiia i sel'skoe khozialstvo. [Meteorology and agriculture.]
Leningrad, Cidrometizdat., 1952. 94 p. 25 figs., 15 tables. Price: 2 rubles. DLC— Includes short history of agricultural meteorology in Russia (beginning with LOMONOSOV, 1759) with considerable attention paid to the organization of agrometeorological service in the U.S.S.R. since the Revolution. The work at agrometeorological stations is described. The effects of radiation, soil and air temperatures, snow cover and its conservation, soil moisture, humidity and wind on crops are treated in separate chapters based on actual data from crop growth in U.S.S.R.; harmful meteorological conditions such as drought, hot winds, hail, frost, cloudbursts, glaze, and intense freezing; the means by which the agrometeorological service helps agriculture (forecast, warnings, studies, etc.) and, finally, on the transforma- tion of nature in the U.S.S.R. according to the ideas of MICHURIN and LYSENKO (effect of shelter belts, etc.) are reviewed. Subject Headings: 1. Agricultural meteorology 2. U.S.S.R. —M.R.
5.1-21 551.5:63 Watson, Sir James Scott, Meteorology and agriculture. Weather, 8(7):202-205, July
1953. MH-BH—Popular article on scientific adaptation of cattle, pigs, grass and crops to different climates, on watering crops and on agricultural forecasts. Subject Heading: 1. Agri- cultural meteorology.—C.E.P.B.
5.1-22 551.5:92 Arakawa, H., Dr. Robert D. Fletcher no danwa. [Conversation with Dr. Robert D.
Fletcher.] Meteorological Society of Japan, Journal, 2nd Ser., 30(ll):371-377, Nov. 1952. 3 figs. In Japanese. MH-BH—Account of interviews with DR. FLETCHER of the U. S. Weather Bureau during his visit to Tokyo in July 1952. DR. FLETCHER'S scientific activities,
I. CURRENT ABSTRACTS 7
especially his work in the field of hydrometeorology and wind, wave and swell analysis are discussed and illustrated with diagrams. The author also mentions several suggestions he made to the visitor regarding the development of scientific research groups in Japan, including the establishment of a typhoon project to be attached to the World Meteorological Organization or its Regional Association II. Subject Headings: 1. Public relations 2. Fletcher, Robert D. —G.T.
5.1-23 551.5:92:016 tRaman, Sir C. V., Dr. K. R. Ramanathan on bis sixtieth birthday. Indian Academy of
Sciences, Proceedings, Sec. A, Bangalore, 37(2):167-174, Feb. 1953. bibliog. p. 169-174. DLC—This excellent issue of the Proceedings is dedicated to DR. K. R. RAMANATHAN and contains a number of articles by fellow meteorologists in India and various parts of the world (RAMDAS, ANGSTRSM, PETTERSSEN, VAISALA, VAN MIEGHEM, VASSY and VASSY, PALMEN, BYERS and others). A good photograph and a tribute together with a list of 42 important papers on upper atmosphere physics, synoptic meteorology, climatology, etc. are presented as an introduction. Subject Headings: 1. Biography 2. Ramanathan, K. R. 3. Com- memoratives 4. Bibliographies.—M.R.
METEOROLOGICAL OBSERVATIONS AND INSTRUMENTS
METHODS OF OBSERVATION
See also: Synoptic code, 1949 (U. S. Weather Bureau), 5.1-84; Monthly mean temp, based on thrice daily synoptic observations (Dedebant, Machado), 5.1-173; Meas- urement of thermal conductivity of snow (Yosida), 5.1-239; Sublimation in snow layer (Yosida, Kuroiwa), 5.1-240; Snow survey for stream flow forecasting (Boardman), 5.1-242; Measurement of mass and number of falling snow crystals (Kumai, Hi- guchi), 5.1-245; Snow cover observations in vicinity of shelter belts (Parshin, Salov), 5.1-248; Soil moisture measurement by electrical method (Baier). 5.1-251; Soil mois- ture measurement (Ivanov), 5.1-255; Soil moisture measurement (Kubo), 5.1-256.
5.1-24 551.501:551.508.91:535.56 Kerker, Milton and Hampton, Merle I. (Dept. of Chem., Clarkson Coll. of Tech., Pots-
dam, N. Y.), The use of unfUtered light in determining particle radius by the polarization ratio of the scattered light Optical Society of America, Journal, 43(5):370-372, May 1953. 5 figs., 5 tables, refs. DLC—The light scattering technique of determining the radius of small spherical particles by measurement of the polarization ratio is extended to the case of non- monochromatic light. The new method is applied to sulfur and dibutyl phthallate aerosols irradiated by anunfiltered beam from a mercury vapor lamp. The radii obtained with the unfiltered light are in agreement with those obtained when monochromatic light is used. Subject Headings: 1. Aerosol measurement 2. Polarimeters.—4uthors' abstract.
5.1-25 551.501:551.574.1 Nolan, P. J. and Kenny, P. J., Anomalous loss of condensation nuclei in rubber tubing.
Journal of Atmospheric and Terrestrial Physics, 3(4) :181—185, May 1953. 13 refs., 4 eqs. DWB—Various formulas for diffusion loss of particles passing through narrow tubes or channels are collected. Loss of nuclei in a short length of rubber tubing, about 10%, was much larger than given by these formulas. Loss was measured under different conditions and remedial measures described. Subject Headings: 1. Nuclei count 2. Diffusion through rubber tubing.— C.E.P.B.
5.1-26 551.S01:551.577:551.43 Grunow, J., Niederschlagamessungen am Hang. [Precipitation measurements on a
slope.] Meteorologische Rundschau, 6(5/6) :85-91, May/June 1953. 6 figs., 4 tables, 20 refs. DWB—Gages with horizontal opening receive much too little on windward mountain slopes especially in snow and somewhat too much on leeward slopes. Errors are calculated and compared with observations on a 20° slope on Hohenpeissenberg. Deficit on windward slope
8 METEOROLOGICAL ABSTRACTS AND BIBLIOGRAPHY
13-48%, excess to leeward 5%. Ratios and angle of fall are calculated in terms of daily amount and type of precipitation and a geometrical method of correction presented. The exposure of a gage for hydrological purposes is discussed. Subject Headings: 1. Precipitation measurement 2. Mountain observations.—C.E.P.B.
5.1-27 551.501:551.577.2(771) Sanderson, Earl E. and Johnstone, Don O. (Ohio State Dept. of Natural Resources,
Columbus), Accuracy of determination of annual precipitation over a given area. American Geophysical Union, Transactions, 34(l):49-57, Feb. 1953. 8 figs., 2 tables, 3 refs., 2 eqs. MH-BH—An attempt to develop methods for computing the accuracy with which groups of gages of either regular or irregular spacing measure the annual precipitation amount over areas of various sizes. Study based on a dense network established in the Muskingum River water- shed and near Wilmington, Ohio. Author discusses accuracy of the Thiessen method and of isohyetal maps. No distinction was made between the orographic influence and the purely meteorological variability. Subject Headings: 1. Area! precipitation distribution 2. Repre- sentativeness of observations 3. Ohio.—A.A.
5.1-28 551.501.551.578.4 Garstka, Walter U., Criddle, Wayne D., Rhodes, Forrest L. and others (U. S. Bureau of
Reclamation, Hydrology Branch, Project Planning Div., Denver), Report of the Committee on Snow, 1950-1951. American Geophysical Union, Transactions, 34(1):125-132, Feb. 1953. MH-BH—Survey of current activity in the United States, Canada and Japan consisting of 26 short reports. Among the topics covered are: frozen ground, classification and mechanical properties of snow, melting of snow, evaporation and runoff from snow, snow surveys, oro- graphic and forest influences, frost observations, river ice, avalanche hazard forecasting, snow crystals, use of radar, etc. Subject Headings: 1. Snow research 2. A.G.U. Committee on Snow 3. United States 4. Canada 5. Japan.—A.A.
5.1-29 551.501:551.578.4 Rhodes, F. L. and Wilson, W. T., The Cooperative Snow Investigations Program. Its
objectives and operations. International Union of Geodesy and Geophysics, International Association of Scientific Hydrology, [Transactions'] Oslo 1948, 2:69-85, [1949]. 12 figs. Also in: Western Snow Conference, Proceedings 1948, p. 7-23, Feb. 1949. DWB—Various laboratories and programs of this organization initiated in 1945 by the U. S. Weather Bureau and Corps of Engineers in Sierras (Calif.), Willamette Basin (Oregon) and upper Columbia (Montana), and the details of the investigations being carried.out therein are described. Maps show general location and detailed topography around each. Many photographs of exposures and equipment also included. Subject Headings: 1. Cooperative snow investigations 2. Snow research 3. Western United States.—M.R.
5.1-30 551.501.1:551.578.46 Villeneuve, G. Oscar (Dir. Met. Bur. Quebec), Snow and skiing. Instructions for meteoro-
logical observers. Quebec (Province). Bureau de Meteorologie, Bulletin, No. 2, 2nd ed. Nov. 1947. In English and French. 6+7+p. illus. DWB—A leaflet containing basic instruc- tions for observers appointed by the Meteorological Bureau of the Forest Protection Service in the Province of Quebec. Reports should include information on three factors: 1) height of last snowfall, 2) total height of snow and 3) state of snow surface. A glossary of terms used in snow description, and illustrations showing snow stakes and other instruments are added. Subject Headings: 1. Instruction for observers 2. Snow cover.—G.T.
5.1-31 551.501:551.591 Bouman, M. A. (Natl. Res. Council, Soesterberg, Netherlands), Visual thresholds for line-
shaped targets. Optical Society of America, Journal, 43(3):209-211, March 1953. 2 figs., refs. DWB—Measurements of absolute and contrast thresholds values 7° nasal from the fovea for 6500 and 5250A for line-shaped targets 2' in width, length / between 2-256' and time of observation t between 0.02-1 seconds are presented. The absolute thresholds agree with what was to be expected from the two-quanta theory. For />32' for green flashes and for

I. CURRENT ABSTRACTS 9
l>8' for red ones, #M p,re.nt~J* and for />Q.l second, Nto ptK»nt~t*. When <<0.1 second or Kil' for green and / <8' for red light, Bunsen-Roscoe's and Ricco's law, respectively, is valid. Also, predictions for the behavior of the contrast thresholds for line-shaped sources are made which are also based on the quanta theories for these visual functions. The de- pendence of the contrast threshold <A2VM p«re.nt>A» on / for large / for line-shaped targets is equal to the dependence of (A#M p,rt!ent>Av on t and corresponds with the dependence of (AJVeo p«n:ent)A» on / and on the diameter of d circular flashed in the way predicted by theory. Subject Heading: 1. Contrast threshold.—Author's abstract.
5.1-32 551.501:551.591 Pinegin, N. I., Boldyrev, X. G. and Barteneva, O. C, Raschet dal'nosti vidimosti. fJCal-
culation of the visual range.] Akademiia Nauk, SSSR, Doklady, 84(3) :483-486, May 1952. fig., 2 tables, 7 refs., 2 eqs. DLC—The author reviews the work of A. A. SMIRNOV on the determination of the threshold of discrimination of brightness as a function of the size of objects in cases where the objects were brighter than the background. The formula derived by SMIRNOV expresses a linear dependence of discrimination upon the logarithm of the contrast of objects. A formula for calculating the visibility distance of objects against a background
i In K of the sky on the horizon is given. It is: L = S-— — -, where L = distance of visibility
1 -|-5 oil 3.438 V^7 * s
of the object; 5 = meteorological distance of visibility; AT=contrast of object with background of the sky; g = area of the object; « = threshold of contrast sensitivity of eye of observer; and z=minimum resolving angle. The results of an actual experiment and those obtained by this formula are compared; somewhat higher visibility data are obtained with the latter. Subject Headings: 1. Visibility measurement 2. Contrast threshold.—I.L.D.
5.1-33 551.501.1(02) Villeneuve, G. Oscar (Dir. Bur. of Met., Quebec Province), Manuel de l'observateur en
meteorologie. [Observers manual in meteorology.] Quebec {Province). Bureau de Meteor- ologie, Bulletin, No. 12, 1949. 194 p. 75 figs. (inc. forms), 6 tables, 25 refs. DWB—A complete and nicely edited manual for observers at the 200 or more stations in the network of the Provincial Bureau of Meteorology of Quebec. The manual begins by explaining the meteorological needs of agriculture, navigation, aviation, sylviculture, health, justice, fisheries, sports, hydrology, industry, commerce, insurance, etc., and how the Quebec Met. Bur. at- tempts to fill these needs, especially with the aid of half a dozen special research stations which are named. The location of instruments; types of observations, care and observing of in- struments of all types and making of visual surface observations; the keeping and summarizing of forms and definitions of a number of special phenomena which are sometimes observed, together with useful conversion tables, are covered in the handbook (all in French). Subject Headings: 1. Observers manuals 2. Quebec Province, Canada.—M.R.
5.1-34 551.501.3 Dreyer, A. J., South Africa introduces metric units. World Meteorological Organization,
WMO. Bulletin, 2 (3) :83-85, July 1953. DWB—Practical details connected with the recently completed replacement of thermometer and rain gage's scaled in Fahrenheit and inches by equipment calibrated in centigrades and millimeters are described. The operations involved the Union of South Africa, British South West Africa, Bechuanaland, Basutoland and Swazi- land. A world map shows territories where metric units are in use (67% of the globe's land surface, excluding Greenland and Antarctica). Subject Heading: 1. Units.—G.T.
5.1-35 551.501.3:001:06 *World Meteorological Organization, Value of some physical functions and constants
used in meteorology [and] Definitions and specifications of water vapour in the atmosphere. World Meteorological Organization, I.M.O. Publication, No. 79, 1951. 92 p% tables, ref., eqs. In English and French. Price: Sw. Fr. 2. DWB—Report of subcommission and decisions of the Conference of Directors (1947) on composition of dry air, temperature scale,
10 METEOROLOGICAL ABSTRACTS AND BIBLIOGRAPHY
energy equivalent of calorie, unit of geopotential, gravity, gas constants, enthalpy and specific heat of dry air and of water substance, saturation vapor pressure, etc. The second part gives definitions of mixing ratio, specific humidity, absolute humidity, vapor pressure, saturation vapor pressure, dew point and frost point temperature, relative humidity, thermodynamic wet bulb and equivalent temperature. Subject Headings: 1. Constants 2. Units 3. Water vapor 4. Definitions.—4 .A.
5.1-36 551.501.4:551.506.3(431/5) (09) Hommel, Karlheinz, Der Anschluss der alten Hohenpeissenberger Beobachtungsreihe
an die Messungen bei der neuen Aufstellung auf Grand zweijfthriger Vergleichsablesungen. [The reduction of the old Hohenpeissenberg records to those at the new site by means of a two years' comparison.] Germany. Deutscher .Wetterdienst in der US-Zone, Berichle, No. 42:57-62, 1952. 7 tables, 3 refs. DWB—The history of the station since 1781 is summarized. The earlier window screen was compared with the new free screen and the rain gage exposures compared, by parallel observations April 1950-March 1952. The resulting corrections are discussed in detail. Subject Headings: 1. Long period records 2. History of meteorological stations 3. Record reduction 4. Hohenpeissenberg, Germany.—C.E.P.B.
OBSERVATIONAL DATA
See also: Reduction of old Hohenpeissenberg records . . . (Hommel), 5.1-36; Radio- sonde and rawinsonde code (U. S. Weather Bureau), 5.1-83.
5.1-37 551.506(52) :551.43 Huzimura, I., Shida, I., Fukishima, M. and others, On the changes of meteorological
elements with heights. Tateno, Japan. Aerological Observatory, Journal, 5(l):94-96, March 1951. DWB—Temporary observations were made during 12 days at 6 stations on the slope of Mt. Fuji from 20 to 3776 m above MSL. Results for mountain and valley breeze obtained. Lapse rate temperature greatest in middle zone. Diurnal course of relative humidity and wind velocity at upper stations inverse to that of lower stations. Subject Headings: 1. Vertical variations of meteorological elements 2. Mountain observations 3. Mt Fuji, Japan. I. Shutara, E. II. Shizaki, D. III. Ito, S. IV. Murakoshi, IX.—A. A.
5.1-38 551.506:551.524(52) *Kato, T. (Seikei Univ.), Air temperature in Tokyo and its neighbourhood. Meteorological
Society of Japan, Journal, 2nd Ser., 30(11) :365—371, Nov. 1952. 5 figs., 2 tables. In Japanese, English summary p. 305. MH-BH—Data on maximum and minimum temperatures of some 100 stations in and near Tokyo are tabulated and discussed. Daily and annual mean maximum and minimum temperature distribution and annual mean temperature distribution are shown in charts. The period covered is 1926-1945. Subject Headings: 1. Temperature data 2. Tem- perature distribution 3. Tokyo, Japan.—G. T.
5.1-39 551.506(438) •Kosiba, Aleksander (ed.), Observacje dobowe we Wroclawiu. Observations journalieres
ft Wrosclaw 1950. [Daily observations at Wroclaw, 1950.] Wroclaw. Obserwatorium Meteorologii i Klimatologii, Prace, No. 5:4—48, 1952. 13 tables. In Polish; legends and summary (p. 59) in French. DWB—Complete observational date (three times daily) for the usual climatological elements, including also visibility and sunshine duration. Monthly summaries give also deviation from mean. Weather processes in 1950 are reviewed in detail. Subject Headings: 1. Observational data 2. Wroclaw, Poland.—A.A.
S.l-40 S51.506:551.524.3 (494) •Plantamour, E. (Prof. Astron., Acad. de Geneve), De la temperature ft Geneve d'apres
vingt annees d'observations, 1836 ft 1855. [The temperature at Geneva based on 20 years of observation, 1936 to 1855.] SociiU de Physique el d'Histoire Naturelle de Geneve, MSmoires, 14(2), 1857. 42 p. tables. Abstracted from reprint. DWB—Data presented and methods
I. CURRENT ABSTRACTS 11
of calculation discussed in this study include values of diurnal and annual variation in tem- perature, of monthly means and extremes and of mean temperature at Geneva for each decade from 1836 to 1855 inclusive. Probable errors of the means are indicated. Subject Headings: 1. Temperature data 2. Temperature variations 3. Geneva, Switzerland.—G.T.
5.1-41 551.506:517.512.2 Samatan, Enrique L., Metodo simplificado de an&lisis arm6nico. [[Simplified method of
harmonic analysis.] Meleoros, Buenos Aires, 2(1/2) :112-116, Jan./June 1952. eqs. English summary p. 112. DPA—The derivation of a simple method for harmonic analysis of empirical data is presented, and its application to harmonic analysis of diurnal variations of atmospheric pressure in Argentina cited. The method consists of isolation of harmonics by means of addition and subtraction of more and more restricted groups. Subject Headings: 1. Harmonic analysis 2. Statistics in meteorology.—M.R.
SA-A2 551.506:551.551(71) •Thomas, M. K., Computed gust speeds in Canada. Canada. Meteorological Division,
Circular 2328, Tec. 158, July 14, 1953. 10 p. mostly tables, 4 refs. DWB—From simul- taneous records obtained with Dines pressure tube recording anemometers and with cup anemometers, the author derived two empirical formulas (Va = l9-\-l.22Vit and Ve(max.) = 25 + 1.22 VM) for the relationship between most probable gust speed (Vo) and speed averaged over an hour from the cup anemometer (VM), and between computed maximum gust speed (Vs(max.)) and VM respectively. Values of VM are tabulated for 235 stations throughout Canada and computed values of Vo and Vo(max.) are added wherever (in some 200 cases) VM exceeds 35 mph (at hourly speeds below 35 mph no relationship exists between gusts and corresponding hourly speed). Subject Headings: 1. Gust velocities 2. Gust data 3. Wind data 4. Canada.—G.T.
5.1-43 551.506:551.524(71) *Thomas, M. K. (Met. Div. Toronto), Winter temperature in Toronto. Royal Meteoro-
logical Society, Canadian Branch [Publications'], 4(3), 1953. 10 p. 12 figs., 5 tables, 12 refs. DWB—A continuous record of daily temperature is available for Toronto since 1841. The averages, extremes, and the frequency of extremes for the winter months are listed and discussed. The significance of the position of Toronto in the zone of the westerlies and in the Great Lakes region is noted and comparisons are made with stations of similar latitude. Long term temperature trends and the differences between downtown and suburban tem- peratures are considered. Subject Headings: 1. Winter temperatures 2. Temperature data 3. Urban climates 4. Toronto, Canada.—Author's abstract.
5.1-44 551.406.1 (493) :629.13 •Belgium. Service Meteorologique d'Aviation. R^gie des Voies AeViennes, Bulletin
mensuel. [Monthly bulletin.] First issue received, Jan. 1950; last issued received, June/ Aug. 1952. Subtitle on first page: Climatologie A6ronautique. DWB—Observations of visibility, cloud height and wind for the network of airways reporting stations in Belgium and Luxembourg are tabulated for each of 4 to 8 fixed hours, by class intervals. Surface tem- perature, pressure, wind, dew point and precipitation, sunshine and 850 mb, 700 mb and 500 mb temperature, dew point and wind are given graphically for the month. Frequency of occurrence of simultaneous visibility and ceiling height intervals, state of sea, visibility toward the sea and surface winds (direction and frequency of velocity groups) for several airports are also included. Subject Headings: 1. Airways climatic data 2. Monthly data bulletins 3. Belgium.—M.R.
5.1-45 551.506.1(71) •Canada. Meteorological Division, Monthly record [of] meteorological observations in
Canada. First issue received, Jan. 1940; last issue, Oct. 1950 (gaps in 1944). Toronto, Pub. by the Div. entirely tables. Price: $1.00 per year. DWB—This current monthly edition includes daily maximum and minimum temperature and daily precipitation records for all stations arranged by provinces and river basins, monthly summaries of the observations
1 12 METEOROLOGICAL ABSTRACTS AND BIBLIOGRAPHY fc i If of pressure, temperature, humidity, clouds, visibility and wind at fixed hours for selected stations, monthly summaries of the wind duration and mileage and frequency, as well as of bright sunshine, average for each hour. Subject Headings: 1. Observational data 2. Monthly j data bulletins 3. Canada.—A .A.
5.1-46 551.506.1 (994) :551.591 , :; •Falkland Islands and Dependencies. Meteorological Service, Annual meteorological ,
tables, 1951. Prepared in conjunction with the Meteorological Office, London. [[1952?] 'J 38 p. mostly tables. Inserted: Amendments dated No. 1, 1952. DWB—Standard tables of data for Stanley (Falklands), Grytviken (S. Georgia), Signy Island (South Orkneys), J Admiralty Bay and Deception Islands (S. Shetlands) and Argentine Island (Graham Land) « in latitude 51° to 65°S are presented. Most of the data are for 8 fixed times a day. Wind V speed forecasting tables by directions, visibility, low cloud amount and height, and frequency of hydrometeors are presented in extensive tables. {See item 4.1-43, Jan. 1953, MAB for annual report 1950.) Subject Headings: 1. Annual meteorological reports 2. Ceiling and visibility data 3. Falkland Islands 4. Antarctic Ocean.—M.R.
5A-A7 551.506.1 (494) :06 *fSwitzerland. Meteorologische Zentralanstalt, Annalen. v. 86 and 87, 1949 and 1950.
2 v. graphs, charts, tables, bibliog. DWB—Vol. 86: an elaborate compilation (and some analysis) of the twice daily observational data collected from all the 123 meteorological stations in Switzerland, with appendices consisting of separate articles on weather conditions during 1949, hailstorms, rainfall measurements from 294 stations, sunshine records, earthquake records, aerological data collected from daily radiosonde ascents at Payerne, and a detailed description of a hailstorm at Tessin on May 23, 1950. Also there is a good bibliography of works by Swiss meteorologists or about Switzerland written during 1949. The activities of the various branches of the service are also outlined. Vol. 87: The contents of this annual report for 1950 are as follows: a bibliography of Swiss meteorological and glaciological publica- tions which appeared in Swiss and foreign publications during 1950; daily observations for the entire year at the stations Bern, Neuchatel, Altdorf, Zurich, Chasseron, Bever, Leon, Lugano, Basel, Santis and St. Gotthard; daily atmospheric temperature at the Jungfraujoch; daily maxima and minima and hourly means of atmospheric temperature for Zurich and S&ntis ; daily temperature extremes for 7 normal stations; monthly and annual means for all Swiss meteorological stations; a general survey of the weather during each month of 1950; monthly values of the most important meteorological elements at 9 stations; monthly and yearly totals of precipitation at all 1-3 order stations; results of precipitation totalizers set up in the Alps for the hydrological year 1^49/1950 summarized by R. BOHMER ; an analysis of the precipitation in 1912 by M. GRUTTER; monthly, annual and daily sunshine duration; discussion of the reduction of climatic mean values at Zurich to the new observation station of Krahbuhlstrasse by H. UTTINGER and M. SCHUEPP and a record of radiosonde observations at Payerne. Subject Headings: 1. Annual meteorological reports 2. Observational data 3. Meteorological services 4. Switzerland.—M.R., I.L.D.
5.1-48 551.506.1(649.1) "Tenerife. Centro Meteorologico, Boletfn trimestral. First issue received, v. 6, No. 61.
Jan. 1950; last issue received, v. 8, No. 72, 1952. Publ. by the Centro, Santa Cruz de Tenerife. unpaged., tables, figs. DWB—This quarterly bulletin supercedes the monthly Boletin Mensual Climatologico (title varies; see item 3A-261, Jan. 1952, MAB) which was published from 1945 to 1949 in volumes 1 to 5 (consecutive Nos. 1-60). The quarterly version continues the numbering of the discontinued monthly, starting with v. 6, No. 61. It is a weather review giving a summary of weather development during the three months covered, and observational data from the three major stations on Tenerife Island and a number of cooperative stations on the islands of Tenerife, Palma, Gomera and Hierro. The data are on monthly mean or absolute values of pressure, humidity, insolation, wind, temperature, precipitation and other phenomena. A column of crop reports completes the publication. In some issues popular articles (dealing, for example, with the use of basic meteorological instruments) are included. Subject Headings: 1. Observational data 2. Monthly climatic summaries 3. Tenerife, Canary Islands.—G. T.
* .
I I. CURRENT ABSTRACTS 13
\M 5.1-49 551.506.5(269,99) :358.4:656.7 I* Norwegian-British-Swedish Antarctic Expedition 1949-50. Report by Officer com-
manding R.A.F. Antarctic flight. 113 p. numerous figs. Mimeo. GB-MO—Section 6 "Weather" (p. 35-37) gives a brief account of flying conditions from the base station in 70§°S 11°W in Jan. and Feb. 1950. Subject Headings: 1. Antarctic expeditions 2. "Maudheim" Expedition, 1949-50— C.E.P.B.
PHENOLOGY 5.1-50 551.506.8 Made, Alfred, Bemerkungen zur Vereinfachung des phanologischen Meldeprograms.
* [Remarks on the simplification of the phenological information service.] Germany. Deut- scher Wetterdienst in der US-Zone, Berichte, No. 42:110-114, 1952. fig., 2 tables. DWB— Proposals for making phenological observations simpler and more representative are illustrated by dates of 12 subjects at Halle, 1894-1939 and statistical studies on them. Subject Heading: 1. Phenology. —C.E.P.B.
5.1-51 551.506.8:591.543.4 Menges, Gustav, Beginn und Ende des Winterschlafes unserer einheimischen Amphibien
und Reptilien sowie die Zeiten der LautMusserung unserer einheimischen Froschlurche in graphischen Darstellungen. [Beginning and end of hibernation of our indigenous amphibia and reptiles and the times of croaking of our indigenous frogs shown graphically.] Angewandte Meleorologie, l(8):241-244, Dec. 1952. 2 figs. MH-BH—List of mean dates of hibernation and of croaking in SE England and remarks on animal phenology. Subject Heading:. 1 Animal phenology.—C.E.P.B.
5.1-52 551.506.8(438) *Molga, Marian, Czas trwania okresu wegetacyjnego w Polsce w 1948 r. na podstawie
obserwacji fitofenologicznych. [Length of the growing season in Poland in 1948 determined by means of phytophenological observations.] Poland. Panstwcnoy Instytut Hydrologiczno- Meteorologiczny, Prace, No. 11, 1949. 80 p. 9 maps, mostly tables. In Polish, French summary p. 15. DWB—A voluminous collection of phenological data accompanied by detailed phenological charts of Poland for each separate event used as an indicator, and comments regarding the length of growing season and its determination for such data. The beginning of the growing season was obtained by taking the mean of the dates of flowering of 3 of species, and the end of growing season as the mean date of changing colors and of falling of leaves of the horse chestnut and beech. Subject Headings: 1. Phenological data 2. Growing season 3. Poland.—M.R.
5.1-53 551.506.8:633.1(82) Pascale, Antonio J., Mapa fenol6gico del trigo en la Republic* Argentina. [Phenological
chart for wheat in Argentina.] Meteoros) 2(1/2) :50-65, Jan./June, 1952. 4 figs., table, bibliog. p. 64-65. English summary p. 50. DPA—Isophenes of sowing, earing and harvest- ing of winter and spring wheat for 1947-1950 are presented on separate charts for the wheat growing region of Argentina. The history of phenological charts for agricultural crops is reviev/ed, methods of collecting data from the phenological network of the agrometeorological Dept. of the Servicio Meteorologico Nacional, and of compiling the data and charts discussed and conclusions for each variety listed. Subject Headings: 1. Phenological charts 2. Wheat phenology 3. Argentina.—M.R.
5.1-54 551.506.8(531/5) :551.586:581.036 • 'Schneider, Max, Summe, Mittel und mittlere Extreme der Temperatur von phanologischen
jr. Zeitspannen. [Sum, mean and mean extreme of temperature in phenological intervals.] W Germany. Deutscher Wetterdienst in der US-Zone, Berichte, No. 42:276-281, 1952. 3 figs., ••' 2 tables, 3 refs. DWB—Values are given for 11 stations in S. Germany for: beginning of
apple blossom to beginning of winter rye flowering; the latter to winter rye harvest;—to corn harvest; during corn harvest. Relations to flowering times in different years are close enough to warrant forecasts. Subject Headings: 1. Phenological data 2. Germany.—C.E.P.B.
V
14 METEOROLOGICAL ABSTRACTS AKD BIBLIOGRAPHY
INSTRUMENT CARRIERS
See also: High altitude research (Burgess), 5..1-4. 5.1-55 551.507.321 Vere-Jones, N. W., A low-pressure hydrogen generator. New Zealand. Dept. of Scien-
tific and Industrial Research. Dominion Laboratory, Information Circular, No. 53, Sept. 1952. 5 p. 3 figs., 3 refs. DWB—Apparatus for the production of up to 100 cubic feet of hydrogen, suitable for filling meteorological balloons, is described. The hydrogen is produced by the action of caustic soda on scrap aluminium turnings. The rate of the reaction is controlled by the rate of addition of water. Pressure greater than 1 Ib/sq. in. cannot develop. Produc- tion costs, excluding freight and labor, are just over half that of bottled hydrogen at the factory. The apparatus described was manufactured in New Zealand in 1951 for under £50. Eighteen months experience in the use of the apparatus at Nandi, Fiji, has proved it to be generally satisfactory. Minor modifications will be incorporated in succeeding models. Ferro-silicon may be used instead of aluminium in the same apparatus, though the reaction is more erratic. Subject Headings: 1. Hydrogen generators 2. Balloons.—Author's abstract.
5.1-56 551.507.362:551.515.53 Singer, S. Fred, De dampkring onderzocht met vuurpijlovoertuigen; in de toekomst
onderzoekingen vauit een kustmatige maan? [The atmosphere explored by means of rocket flights; will investigations be made in the future on an artificial moon?] Hemel en Dampkring, 50(10) :161-171, 1952. 4 photos. DLC—Space travel and the investigation of the uppermost atmosphere utilize rocket flights in their investigations and the possibility exists of establishing an artificial moon equipped with astrophysical instruments. Rockets can provide data on the physical and chemical properties of the uppermost reaches of the atmosphere including radiation, the properties of the meteorological variables, aerodynamic phenomena and nuclear reactions. Some V-2 rocket flights carried out in the U. S. are described and the findings on the upper atmosphere resulting from them are summarized. Photographs of aerobee rocket and a diagram showing the types of instruments and their arrangement in an aerobee rocket are reproduced. Subject Headings: 1. Upper atmosphere research 2. Rocket in- strumentation 3. Rocket research.—I.L.D:
5.1-57 551.507.362:535.33 Tousey, R. (Naval Res. Lab., Wash., D. C), Rocket spectroscopy. Optical Society of
America, Journal, 43(4) :245-251, April 1953. 15 figs., refs. DWB—The results of studies of the solar spectrum made from rockets and extending from the ultraviolet to soft X-rays are reviewed. Experiments with spectrographs have given the solar intensity distribution to 2000A, the Fraunhofer spectrum to 2300A with varying resolution reaching 0.6A above 2630A, and the magnesium doublet at 2800A with intense emission cores. The vertical distribution of ozone was determined to 70 km and found to be in agreement with a photo- chemical calculation. Diurnal heating in the ozpne layer was calculated. The intensity of Lyman alpha of hydrogen, 1216A, was measured with photon counters and with a thermo- luminescent phosphor, and solar X-rays from 5-7A were observed by these methods and also by direct photography through filters. The absorption of X-rays was found to occur in the E layer and must account, at least in part, for its production. Subject Headings: 1. Spectros- copy 2. Rocket research.—4uthor's abstract.
INSTRUMENTS
See also: Use of unaltered light in determining particle radius . . . (Kerker, Hampton). 5.1-24; Instrumental problems in atmos. analysis (Washburn, Austin), 5.1-110; Rocket-borne instrumentation . . . (Jackson), 5.1-115; Short period temp, variation measurements with Assmann aspiration psychrometer (Heckert), 5.1-171; Rainfall studies with rain gage and radar (Hudson, Stout, Huff), 5.1-231; Soil moisture measurement (Kubo), 5.1-256.
5.1-58 551.508.26:656.7 Austin, D. C, The performance of various types of resistance thermometers for outside
air temperature measurements from aircraft. Farnborough, England. Royal Aircraft Es-
J
I. CURRENT ABSTRACTS 15
tablishment. Technical Note, No. EL.28, April 1952. 14 p. 4 figs., tables, 5 eqs. Mimeo. R.A.E. Ref: EL/G530-1/DCA/31. GB-MO—Sources of error in aircraft thermometer systems are discussed. Velocity error is expressed as K( V/100)1, where K is less than 1. Mountings of 5 nickel and 3 platinum thermometers and flight test procedure are described and values of K found for each thermometer. An exposed platinum bulb on the nose gave best A" (0.87) and error ±1 °C but for practical reasons other types are preferred. Subject Headings: 1. Ther- mometry 2. Air-borne thermometers.—C.E.P.B.
5.1-59 551.508.26:536.5 Borgars, S. J., A meniscus thermometer for the measurement of small temperature
differentials, particularly at low temperature. Farnborough, England. Royal Aircraft Es- tablishment, R.A.E. Ref: Radio/MD05/SJB/171, May 1952. 12 p. fig., 2 refs., eqs. Mimeo. GB-MO—A thin-walled glass bulb is attached to a horizontal glass capillary tube containing a very short column of liquid (silicon oil); construction and calibration described. Subject Heading: 1. Thermometers.—C.E.P.B.
5.1-60 551.508.26(02) Canada. Meteorological Division, The bimetal thermograph. Canada. Meteorological
Div., Circular 2270, Ins. 49, Instrument Manual 21, April 14, 1953. 6 p. fig. Price: 25 cents. DWB—Practical instructions are given for the operation of the bimetallic thermo- graphs in use at stations of the Canadian Met. Div. The instructions include a description and illustration of the instrument and details of installation, maintenance, handling and adjust- ment. The thermograph may be used for continuous records at meteorological stations or in remote locations. An ordinal y thermometer, which is usually more accurate, should be used as a standard to correct thermograph errors. Subject Headings: 1. Thermographs 2. In- strument manuals.—G.T.
5.1-61 551.508.26 Jehn, Kenneth H., Wet bulb temperatures without a wick. Texas. University. Elec-
trical Engineering Research Laboratory, Contract N6onr-266, Task Order II, NR 082 055, Report No. 20, Sept. 1,1948. 32 p. 15 figs., 18 refs. Also in: Review of Scientific Instruments, 20(9) :668-673, Sept. 1949. DWB—It is desired to determine the feasibility of measuring wet bulb temperatures without a wick. The sensing element is a thermistor bead of small mass and rapid response, which, when dipped into distilled water, retains water in sufficient quantity to register a wet bulb temperature when exposed to the air. The experimental apparatus and procedures are described in detail, and the data presented. It is concluded that wickless wet bulb measurements are feasible, with an accuracy of the order of ±0.1 °C. Subject Headings: 1. Thermistors 2. Temperature measurement. I. Texas. University. Electrical Engineer- ing Laboratory II. Contract N6onr-266, Task Order II, NR 082 OSS.—Author's abstract.
5.1-62 551.508.765:551.571 Vonnegut, Bernard, A capillary collector for measuring the deposition of water drops
on a surface moving through clouds. Review of Scientific Instruments, 20(2) :110-114, Feb. 1949. 8 figs., refs., 5 eqs. DLC-—Describes the capillary collector, successfully test flown several times in a B-17 airplane, and still in operation at M.I.T., Weather Radar Group. Data from one flight demonstrate the collection efficiency (=»a function of the size of the collector, its velocity, and the dropsize) in evaluating the liquid content of the atmosphere. With slight modifications this collector can be used for measurements of other liquid aerosols. Subject Headings: 1. Capillary collectors 2. Water vapor measurement.—W.N.
5.1-63 551.508.769:551.576.31 Jones, H. Spencer (Sussex, Eng.), Cloudiness in relation to choice of astronomical sites.
Science, 116(3021) :572, Nov. 21, 1952. DWB—A brief note to the effect that a comparison between day and night cloudiness records made at Greenwich Observatory and at Herst-
v- — —
16 METEOROLOGICAL ABSTRACTS AND BIBLIOGXAPHY
monceux (the new location of the Greenwich Observatory), England, shows that there is more cloudiness in the daytime than at night, though the effect was more pronounced at Greenwich than at Herstmonceux, which is nearer the coast and hence less affected by diurnal cloud changes. The night observations were made by photographing trails of faint circumpolar stars. Even cirrus clouds affect these, whereas only denser clouds affect the bright star trails. Subject Headings: 1. Night sky cloudiness recorders 2. Diurnal cloud variations 3. Astro- nomical sites 4. Greenwich Observatory, England.—M.R.
5.1-64 551.508.77:551.508.5 Bergeiro Hargain, Jose" Maria, A prop6sito del vecto-pluviometro de orientacion anemo-
sc6pica. [An inclined rain gage with anemoscopic orientation.] Revista Meteor ologica, Montevideo, ll(41):246-248, April 1952. 2 figs. DWB—The apparatus described and illustrated in this note is the combination of two rain gages with opposite inclination. The instrument indicates rainfall amounts on a slope and on an assumed opposite slope. The gage is equipped with a wind vane for continuous windward orientation. Subject Headings: 1. Rain gages 2. Anemoscopic rain gages.—G.T.
5.1-65 551.508.77:551.594.14 Gerdel, R. W. (SIPRE), Radioactive snow gage. Weatherwise, 5(6):127-129, Dec.
1952. 5 figs. MH-BH—An instrument designed at the Central Sierra Snow Laboratory by the author and B. L. HANSEN, and further developed by Motorola, Inc., is described and illustrated. Its operation is based on gamma rays emitted by radioactive cobalt and received by a Geiger-Mueller tube connected with an electronic counter, the number of impulses received indicating the water equivalent of the snow cover under investigation. Calibration character- istics are discussed. The device is particularly useful inasmuch as it is capable of giving continuous readings of changes in snowpack at a single site. Subject Heading: 1. Radioactive snow gages.—G.T.
5.1-66 551.508.77:551.551(09) Warnich, C. C, Wind studies on shielded snow gages. Western Snow Conference, Pro-
ceedings, 17th Annual Meeting, April 1949. p. 37-43. 8 figs., 3 refs. DWB—The first shielded gage is said to be that of JOSEPH HENRY (1853). The most universal shield was a trumpet shaped one devised by F. E. NIPHER (ca. 1878) but it is useful only for rain measure- ment. The Marvin (1908) and Alter (1937) shields are described. They do better for snow measurement than unshielded gages, but do not prevent "bridging." A laboratory study of smoke (air) movements around gages with several shapes of shields, and the field testing of several storage gages near Mullan Pass, Idaho (6000 ft) are described, and illustrations show results of smoke wind tunnel experiments on models. The ring type shield proved least subject to turbulence. Subject Headings: 1. Shielded snow gages 2. Wind effects.—M.R.
5.1-67 551.508.79:551.574.42 Howell, Wallace E., Comparison of three multicylinder icing meters and critique of multi-
cylinder method. U. S. NACA, Technical Note, 2708, June 1952. 40 p. 9 figs., 6 tables. DLC—Three multicylinder icing meters, fundamentally similar but differing from each other in important design details, were compared in use at the Mount Washington Observatory. Comparison of relative effectiveness of the instruments, evaluation of observational errors, determination of the effects of detailed design differences, and recommendations for further improvements of design are presented. An evaluation of the multicylinder method, concerned with the validity of the theoretical basis and the degree to which the instruments and the technique of their use permit accurate determinations of the physical measurements involved, is also included. Subject Headings: 1. Icing meters 2. Instrument comparisons.—Author's abstract.
5.1-68 551.508.8:664.8 Haenni & Cie (Jegenstorf, Switzerland), Appareils de mesure de la presslon, de la tem-
perature, de 1'humidite pour la boucherie. [Apparatus for the measurement of pressure, temperature and humidity in meat packing plant9.] Les Nouvelles de Haenni, Jagenstorf,
I. CURRENT ABSTRACTS 17
No. 36, Nov./Dec. 1951. 8 p. photos, diagrs., graphs. Le thermo-hygrographe Haenni, fig. 508, au service de l'entomologie medicate. [The Haenni hygrothermograph type 508 used in medical entomology.] Ibid., No. 39, May/June 1952. 4 p. 7 figs. DWB—1) A number of instruments are used for recording and control of temperatures in refrigerators for preserving and storing meat. These are described and illustrated. 2) A special use of a hygro- thermograph mentioned in the first paper is reported by R. GEIGY who found it to be very
« satisfactory in micrometeorological measurements. These measurements were made in the tropics during a Swiss expedition which investigated temperature and humidity conditions in regard to the breeding of disease-propagating insects. Photographs of the instrument and of the tropical sites in which it was operated are presented. Subject Headings: 1. Hygro-
§ thermographs 2. Refrigeration 3. Recording equipment. I. Geigy, R.—G.T., M.R.
5.1-69 551.508.8:551.586 Manig, Marianne, Versuche mit einem Taschen-Thermohygrographen. [Investigations
with a pocket hygrothermograph.] Germany. Deutscher Wetterdienst in der US-Zone, Berichie, No. 38:339-342, 1952. 6 figs., 2 refs. DWB—A small recording hygrothermograph was used to explore the layer between the skin and the outer clothes. A number of records are reproduced. It is found that in general temperature and relative humidity change in the same direction, due to the heat regulating mechanism of the body. Subject Headings: 1. Hygrothermographs 2. Bioclimatic research.—C.E.P.B.
5.1-70 551.508.822:621.315 Nagel, J. F., A new telemetering device for measuring instruments. Weather, 8(8) :227-
231, Aug. 1953. 3 figs., 6 refs. MH-6H—A motor driven apparatus, termed "a rheostat which turns eccentrically," is described which makes successive contacts with pointers of measuring instruments. Wiring diagram am.' specimen temperature chart from a radiosonde ascent are included. Instrument was developed by South African Weather Bureau for a new type of radiosonde. Subject Headings: 1. Distant recording equipment 2. Radiosondes. —C.E.P.B.
5.1-71 551.508.822 Nyberg, Alf, On the comparison of radiosonde data in Payerne, May 1950. Sweden.
Meteorologiska och Hydrologiska Institut, Meddelanden, Ser. B, No. 9, 1952. 22 p. 8 tables, fig., 11 refs., eqs. Price: Kr. 2:50. DWB—A detailed statistical study of the data obtained at Payerne during May 1950, when six types of radiosondes were compared by means of simultaneous flights. The systematic differences (due to fog and radiation effects) are shown in tables and examined from the point of view of upper air synoptic analysis as well as for climatological accuracy. Systematic differences as high as 17 mb, 1.8°C, and 60 m in pressure, temperature and height (200 mb) were found, and the mean standard deviation at 500 mb for one sounding was 6 mb, 0.6°C and 18 m respectively, with errors increasing with height. The scatter of data is shown graphically and in tables. If one type of instrument gives con- sistent results even if systematically biased, corrections can be applied and this should always be done where possible. Subject Headings: 1. Radiosonde errors 2. Instrument comparisons 3. Payerne, Switzerland.—M.R.
! 5.1-72 551.508.822 *
*U. S. Weather Bureau, Radiosonde compatibility tests; made at Oklahoma City, Okla- ] homa, June 4-20, 1951. Wash., D. C, March 1952. 273 p. 21 figs., charts, 12 tables. DWB—Details and data from tests, including test procedure (personnel, types of equipment, site and installations and log of tests), possible sources of error and comments on individual
„ flights. Most of the volume is devoted to actual data, presented both in tables and on adia- 5L batic diagrams. Tests were conducted under the sponsorship of the ACC-Met ad Hoc Group
for Analysis of the Comparability of Radiosondes, to see if significant differences existed in instruments used by U. S. Weather Bureau, Air Force and Navy. Conclusion as usual was that not enough data was collected to draw conclusions. Subject Headings: 1. Instrument comparisons 2. Radiosondes.—M.R.
U-
18 METEOROLOGICAL ABSTRACTS AND BIBLIOGRAPHY
5.1-73 551.508.822:551.515.4(54) Venkiteshwaran, S. P. and Tilakan, A. R. B. (Met. Off., Poona), Interesting features
shown by a radiosonde ascent at Poona on April 1950, during a thunderstorm. Indian Journal of Meteorology and Geophysics, Delhi, 3(l):55-59, Jan. 1952. 3 figs., 2 refs. DLC—The variations of pressure and temperature with time experienced by the radiosonde and the rate of rotation of the fan operating the radiometeorograph are shown on graphs; the tephigram obtained from the ascent giving the distribution of dry and wet bulb temperatures, and a table giving the approximate rates of ascent or descent of the radiosonde balloon in the different phases are presented. The movement of the balloon in the thunderstorm during the various phases and the tephigram for ascent are analyzed. The up and down currents are observable, mainly near the boundary of the warm air mass below and the cold air mass above, and the currents extend from about 750 mb to 650 mb. Subject Headings: 1. Radiosonde ascents 2. Tephigrams 3. Thunderstorms 4. Poona, India.—I.L.D.
SYNOPTIC ANALYSIS AND FORECASTING
See also: Baroclinic model of atmos. applied to numerical forecasting (Arnason). 5.1-120.
5.1-74 551.509:681.177 Eliassen, Arnt, Bedre varvarsler? [Better forecasts?] Naturen, 76(10):301-312, 1952.
2 figs. DLC—Deals with developments in weather forecasting. Using the combined tools of data on the movement of cyclones and anticyclones, synoptic charts, simplified models and extrapolation, fairly reliable 1 to 1J day forecasts can be made. The numerical method, with electronic computers, may improve forecasts of 3-4 days. When it becomes possible to calculate atmospheric factors such as friction and heat supply, the forecasts may be extended to 4-5 days, a time period for which the analog method may prove valuable. The one month forecasts of the U. S. Weather Bureau show that statistical methods and the punched card system afford encouraging prospects in weather forecasting. Subject Headings: 1. Weather forecasting 2. Punched card methods 3. Long range forecasting.— W.N.
5.1-75 551.509:551.46 Ivanov, I. V., Obsuzhdenie na Sovete Tsentral'nogo institute prognozov uchebnogo
posobiia "Predskazanie morskikh gidxologicheskikh kharakteristik" (rukopis' K. I. Kudri- avol). [Discussion at the Soviet Central Forecasting Institute on the instruction manual "Forecasting marine hydrological characteristics" (manuscript of K. I. Kudriavaia).] Me- teorologiia i Gidrologiia, No. 4:52, Dec. 1950. DLC—The book was severely criticized at a special session on October 10, 1950. The publishing of the book was postponed and the author was invited to revise the manuscript to conform to the remarks and observations expressed during the discussion. Subject Headings: 1. Seminars 2. Marine forecasting 3. Textbooks 4. Kudriavaia, K. I.—A.M.P.
5.1-76 551.509:06(71) McTaggart-Cowan, P. D. (Axst. Contrnlhr, Canadian Met. Service, Toronto), The Canadian
experiment. American Meteorological Society, Bulletin, 34(2):51-53, Feb. 1953. MH-BH— In a rebuttal to BERGERON'S article "Ways of improving the weather service" (see item 3.5-84, May 1952, MAB), the author takes the stand that meteorologists can be proud of their achieve- ments in improving forecasts, training meteorologists and making local forecast studies, and goes on to relate specific progress in Canada which refutes the criticism of BERGERON, e.g.: 1) specialized service to industry at Hamilton, Ont.; 2) assignment of trained Weather Service meteorologists to other agencies (Forest Service, Agriculture Experiment Stations, Aerial Surveying and National Research Council); 3) support for Defence and Military Services and 4) improvement in trans-oceanic forecasts for aviation. Subject Headings: 1. Forecast im- provement 2. Forecast services 3. Canadian weather service. I. Bergeron, Tor.— M.R.
X. CURRENT ABSTRACTS 19
5.1-77 551.509(04) Pfeiffer, John, Something doing about the weather. New York Times Magazine., July 13,
1952. p. 18-19. illus. DWB—General principles of weather forecasting are explained and new techniques used in collecting and evaluating data are described. Among the features discussed are electronic computers (particularly "Maniac" developed by DR. JOHN VON NEUMANN, Princeton), storm prediction from microseisms and storm detection by radar and sferics. Two photographs are presented, one showing lightning strokes and the other an Air Force observation station in Greenland. Subject Headings: 1. Popular meteorology 2. Weather forecasting.—G. T.
5.1-78 551.509:37(02) U. S. Navy. Fleet Weather Central, Some recent developments in synoptic meteorology.
Aug. 1952. 13 sections, separately paged, refs., illus. DWB—A manual compiled from various sources to use for reference and instruction in training Naval Reserve Aerologists at Norfolk, Va. The contents include excerpts from papers by H. RIEHL on forecasting in mid- latitudes; by J. J. GEORGE on forecasting cyclone movement in the eastern U.S.A.; by WOLFF
and HAGGARD on use of the Pastogram in pressure-height computation; by DUTHIE and HALTINER on estimating height of constant pressure surfaces; by WOBUS on CAVT tables (constant absolute vorticity trajectories) used in map analysis; by WOLFF on blocking patterns at 500 mb level; by HALTINER on verification by use of skill score; and by HARDING on rules for typhoon forecasting. Other aids in analysis and forecasting are included. Subject Head- ings: 1. Training manuals 2. Forecast aids. I. U. S. Bureau of Aeronautics (Navy). Project AROWA.—M. R.
5.1-79 551.509(02) :656.7 Zweng, Charles Alfonso and Zweng, Allan C, Airline transport pilot rating. North
Hollywood, Calif., Pan American Navigation Service, 1950. 423 p. photos, tables, diagrs., charts. DWB—Chapters 12 through 16 (p. 175-270) contain a thorough treatment of meteoro- logical elements for pilots and navigators operating on international airlines. Air masses, fronts, thunderstorms, winds, fog and ice are discussed in detail with explanatory tables, charts, curves, cloud photos, etc. Particular attention is given to symbols used on weather charts and in teletype sequence reports. Special weather forecasts used in flight planning are ex- plained and examples given. A list of 101 questions about meteorology used in pilot rating examinations is found on p. 395-400 and 411-414. A sample "daily weather map" as used by the U. S. Weather Bureau is attached and symbols listed. Subject Headings: 1. Aero- nautical meteorology 2. Airways forecasting 3. Textbooks. I. Pan American Navigation Service.—G.T.
5.1-80 551.509.1:629.13 Engelbrecht, S. A. (Palmietfanlein), Report on a familiarization flight. South Africa.
Weather Bureau, News Letter, No. 35:5, Feb. 29, 1952. DWB—Discussion of weather, com- munications and forecast dissemination in flight from Palmietfontein to Lourenco Marques and return. Delays in transmission of forecasts and weather information were main com- plaints. Subject Headings: 1. Training flights 2. Forecast dissemination 3. South Africa 4. Lourenco Marques, Mozambique.—M.R.
5.1-81 551.509.1 •France. Service Hydrographique de la Marine, Radiosignauz a l'usage des navigateurs.
v. 2, Meteorologie. [Radio signals for the use of navigators, v. 2, Meteorology.] Paris, Imprimerie Nationale, Jan. 1, 1952. 187 p. tables, forms, 9 maps (fold.). France. Service Hydrographique de la Marine, Ouvrage, No. 2A. Addendum, mettant 1'Ouvrage 2A a jour ft la date du ler Juin 1952. [Addendum, bringing Radio Signals for the use of navigators up to June 1, 1952.] [1952] 21 p. table, form (fold, laid in). DWB—Gives details of Inter- national Meteorological Codes (SYNOP, SHIP, AVB, AERO, analysis, national codes of France, the Soviet Union), radiosonde codes, ship reporting system and in the appendix an English-French glossary of simple meteorological terms. The handbook also contains ex- tensive lists of stations broadcast, and types and times of broadcasts from each country and
20 METEOROLOGICAL ABSTRACTS AND BIBLIOGRAPHY
radio station, with material included in each broadcast. Subject Headings: 1. Marine meteoro- logical code, 1949 2. Marine meteorological observations.—MR.
5.1-82 551.509.1:551.557 U. S. Air Weather Service, Upper wind code. U. S. Air Weather Service, Manual, 105-21,
July 1, 1952. 22 p. forms. DWB—Codes used by the U. S. Air Weather Service are based on WMO Code adopted at I.M.O. meeting in Washington Oct. 1947 and effective Jan. 1, 1949. This manual gives details of levels to be reported, coding of each individual element in each group, coding missing observations or data, coding correction and examples of reports and from continental U.SA. and from outside continental U.S.A. in English and metric units, respectively. Appended are details of WMO codes for winds aloft (land, ship, nephoscope), a list of block numbers for the whole earth and regional variations in coding upper wind reports. Subject Headings: 1. International meteorological codes, 1949 2. Upper air wind codes.—M.R.
5.1-83 551.509.1:551.506.7(02) U. S. Weather Bureau, Radiosonde and rawinsonde code in international form as adopted
by the International Meteorological Organization at Paris in 1946 and revised at Washington in 1947. 1949 ed. Washington, 1950. 34 p. forms. DLC—The forms and specifications of the IMO Radiosonde and Rawinsonde Code are given in detail for U. S. Weather Bureau observers and analysts. Some revisions, made in Toronto in 1947, are incorporated in this manual. Subject Headings: 1. International meteorological codes, 1949 2. Radiosonde codes 3. Code specifications 4. Manuals.—M.R.
5.1-84 551.509.1:551.501.1(02) U. S. Weather Bureau, Synoptic code, 1949 edition. Effective 0030 GCT, January 1,1949.
Washington, D. C, Pub. by the Bureau, Nov. 1948. 81 p. tables, forms. DLC—Instruc- tions for coding and decoding synoptic reports at the U. S. Weather Bureau stations are given in detail, based on the International Synoptic Code adopted after much work in Washington, D. C. in Oct. 1947 and made effective Jan. 1, 1949 in most countries. Amendments to and interpretations of the code, based on later decisions of the CSWI or of its Code Subcommissions, are appended. Useful conversion tables are included along with the extensive code specifica- tions for each element of each code group. Subject Headings: 1. International meteorological codes, 1949 2. Code specifications 3. I.M.O. Synoptic code, 1949 4. Manuals.—M.R.
5.1-85 551.509.31:681.14 Bilancini, Raoul, Le calcolatrici elettroniche e la previsione del tempo. [Electronic
computers and weather forecasting.] Rivista di Meteorologia Aeronautica, 12(4):62-63, Oct./Dec. 1952. MH-BH—General principles of the use of electronic computers tor forecasting purposes are outlined. Following announcements made in the Scientific American No. 2, 1952, two electronic computers are briefly described. These computers, smaller but more efficient than previous models, were developed at the Institute for Advanced Studies, Princeton and at the Scientific Laboratory, Los Alamos. Subject Headings: 1. Electronic computers 2. Forecasting techniques.—G.T.
5.1-86 551.509.5:551.575 Gringorten, Irving I. (Geophysics Res. Directorate, Air Force Cambridge Research Center,
Mass.), An objective system for estimating fog and stratus probability at Randolph Field, Texas. American Meteorological Society, Bulletin, 34(2):63-67, Feb. 1953. 4 figs., 3 tables, 13 refs. DWB—In a competition between the Air Weather Service forecasting at Randolph Field and the objective forecasting personnel of the Geophysics Research Directorate of the Air Force Cambridge Research Center both terms averaged 78% accuracy in forecasting fog and stratus during the winter season of 1949-50. Average frequency of low ceilings, advancing maritime air, pressure gradient and mean dew point from 1939 to 1949 show a gradual rise, whereas there has been a similar fall in the frequency of polar outbreaks. An objective aid involves linear regression between days with on-shore pressure gradient and moisture over the Gulf of Mexico and probability of fog and stratus. A test of 13 years of
£•
I. CURRENT ABSTRACTS . 21
data gives an expected number of accurate forecasts between 70% and 86% of total. Subject Headings: 1. Objective forecasting 2. Fog forecasting 3. Stratus forecasting 4. Statistical forecasting 5. Randolf Field, Tex.—M.R.
« 5.1-87 551.509.5:551.515.8(71)
*Hage, K. D., Investigation of forecast issued by the Dominion Public Weather Office at Edmonton for Calgary and Lethbridge, June 18,1951. Canada. Meteorological Div., Circular 2116, Tec. 115; Experience Report, No. 14, June 3, 1952. lip. 8 charts, ref. DWB— Discusses a completely unexpected passage of an active cold front. The slightest disturbance may result in extensive lines of thunderstorms and showers by later afternoon due to surface heating. Author proposes frontal contour analysis up to the tropopause on a 12-hour basis during the summer months. Subject Headings: 1. Frontal analysis 2. Thunderstorm fore- casting 3. Forecast errors 4. Canada.—A.A.
5.1-88 551.509.5:551.515.4 Numata, T. and Miyake, H., Thunderstorm forecasting in Tohoku District Journal
of Meteorological Research, Tokyo, 4(5) :172—178, Aug. 1952. 5 figs., table. In Japanese, English summary p. (13). MH-BH—A practical method of thunderstorm forecasting in Tohoku district is analyzed. (1) Relation between pressure pattern and thunderstorm occurrence probability is shown. (2) The difference of equivalent potential temperature between 700 mb and 1000 mb is used as an index of convective instability. (3) The tem- perature difference at 850 mb between Akita and Sendai may be used for thunderstorm fore- casting. (4) Relation between thunderstorm occurrence probability and winds aloft is clarified. (5) Strong thunderstorms occur before cold front passage. Subject Headings: 1. Thunderstorm forecasting 2. Upper air temperature variations 3. Tohoku District, Japan.—Authors' abstract.
5.1-89 551.509.5:551.515.4 *Oertel, Albert G., Objective method of forecasting thunderstorms in the Fire Weather
District of Northern California during July and August May, 1952. 20+3 p. 4 tables, 4 figs., 6 charts (fold.). DWB—Four years of 500 mb charts and thunderstorm data (1948-51) were used to prepare the scatter diagrams and one year (1947) as a independent test. The parameters selected (from a dozen or more) as giving the best correlation were 500 mb height differences between Las Vegas and Brownsville and between Las Vegas and 50CN, 145°W (in the NE Pacific) and 500 mb temperature at Santa Maria and Oakland, sources of air, cold lows, moisture content (no correlation) and many other factors were studied, and the charts and scattergrams presented. Skill scores for July and Aug. are given in detail, and appear encouraging—especially for Aug. Verification figures of 1952 season are appended, showing high skill score for objective method and even higher for actual forecasts combining objective method and experience. Subject Headings: 1. Thunderstorm forecasting 2. Objective forecasting 3. Fire weather forecasting 4. Northern California.—M.R.
I 5.1-90 551.509.5 \ American Meteorological Society. District of Columbia Branch, Panel discussion on
forecast verification. American Meteorological Society, Bulletin, 33(7):274-278, Sept. 1952. MH-BH—Various points of view on the goals, principles and procedures of forecast verification were discussed at this forum G. W. BRIER analyzed the purposes of forecast verification from the economic, administrative and scientific aspects. The verification of forecasts by means of quality control was stressed by C. P. MOOK and various aspects of scoring were discussed by I. I. GRINGORTEN. Comments from participants from the floor are included. Subject Head- }. ings: 1. Forecast verification. I. Brier, Glenn Wilson II. Mook, C. P. EDL Gringorten, Irving l—I.L.D. ]
5.1-91 551.509.5:551.558.21 Scorer, R. S., Forecasting mountain and lee waves. Meteorological Magazine, London,
82(974):232-234, Aug. 1953. fig., ref. MH-BH—A forecasting diagram of wave length is

22 METEOROLOGICAL ABSTRACTS AND BIBLIOGRAPHY
given for l/Ul, where U is wind in knots across mountain ridge and P^g&IlP — U"/U, in terms of thickness of 100 mb layer and potential temperature difference. Subject Heading: 1. Lee wave forecasting.—C.B.P.B.
ARTIFICIAL PRECIPITATION
5.1-92 551.509.67 American Meteorological Society, Statement on weather modification. May 1, 1953.
2 p. Issued on Society letterhead. Mimeog. DWB—Seeding of supercooled clouds with dry ice and injection of small water drops or salt particles in the base of nonsupercooled cumulus clouds can initiate certain modifications within the cloud and sometimes trigger the release of « precipitation. Poorer results are obtained with silver iodide. Statistical analyses have not shown a significant increase of precipitation by ground-based silver iodide seeding. Large scale weather modifications by cloud seeding are not proved. Subject Headings: 1. Weather modification 2. Cloud seeding.—A.A.
5.1-93 551.509.67(794) §*Battle, John A.; Jones, W. Floyd and Todd, Clement, Cloud-seeding experiments in the
San Diego County and the Santa Ana River Watershed, Nov. 1, 1951 through April 15, 1952. Rev. ed.- June 10, 1952. [Pub. by Santa Ana River Weather Corporation.] 142 p. 88 figs., 7 plates, tables, ref. p. 2. Also: Supplement, Nov. 1, 1951, through April 15, 1952. (Rev. ed.). Oct. 1, 1952. 7 p. tables, map. DWB—Statistical tests showed that about 20% more rain fell in the target area seeded by silver iodide particles than in a control zone. Chance of error 1:12 to 1:10,000. Statistical analysis explained, actual data and scatter diagrams given. Synoptic analysis of 2 single storms made, using tropospheric winds (2000 to 18,000 ft), as well as ascent data. Subject Headings: 1. Cloud seeding experiments 2. Synoptic studies 3. San Diego County, Calif. 4. Santa Ana River, Calif. I. San Diego County Weather Corporation II. Santa Ana River Weather Corporation.—A.A.
5.1-94 551.509.67 i Beaumont, R. T., An analysis of cloud-seeding operations in North Central Oregon.
Oregon. Agricultural Experiment Station, Corvallis, Circular of Information, No. 503, Oct. 1951. 5 p. 2 figs. DWB—Cloud seeding by a silver iodide ground generator operated from Sept. 1950 to June 1951 during actual or probable storm conditions. Although 8 out of 10 months ; showed positive departures from precipitation amounts estimated statistically by means of control area, there was no definite evidence of a positive effect of the seeding operations. Subject Headings: 1. Cloud seeding evaluation 2. Oregon.—A.A.
5.1-95 551.509.67 Blair, Richard, Control of the weather. Discovery, London, 13(4) :113-114, April 1952.
photo. DLC—In connection with recent weather control activities, the author discusses the effect of an increase or decrease in rainfall on the economic welfare of various regions through- out the world. He declares that while increasing precipitation would be vital for many ^ regions, the reverse is the case for other areas. Guano production, the reduction of insects • and diseases, the cultivation of certain fruits and crops and the tourist trade call for diminished rainfall. A photograph showing South African scientists at work with a silver iodide generator j is added. Subject Heading: 1. Weather control.—G.T. „ !
5.1-96 551.509.67(794) \ Hall, Ferguson; Henderson, T. J and Cundiff, Stuart A., Cloud seeding in the Sierra j
near Bishop, California. American Meteorological Society, Bulletin, 34(3) :111-116, March m
1953. 9 figs. DWB—A critical analysis of results of cloud seeding operations by dry ice carried out by the California Electric Power Co. in the High Sierras near Bishop, Calif. Runoff for the three years (1948-50) from the watershed into Bishop Creek compared with runoff from nearby watersheds not affected by the seeded clouds, and with runoff for other years (1926-47 and 1917-47). Also the runoff for the 3 years when seeding was conducted is com- pared with what would be expected from snow survey measurements in the area. Only the
I. CURRENT ABSTRACTS 23
1948 and 1949 runoff was significantly greater in the seeded area, though the average for the 3 years was significant at 5% level; and a 9% increase in flow was indicated for the 3 years with 90% confidence limits between 0 and 18%. The outstanding 1949 values could have been due to 1949 having unusual circulation patterns affecting the immediate area. Less runoff actually occurred than would have been expected from prior snowpack. Subject Headings: 1. Cloud seeding effectiveness 2. Bishop, Calif.—Af.R.
5.1-97 551.509.67:551.577.1(729.1) *Howell, Wallace E., Associates, Inc., Cambridge, Mass., Summary evaluation of cloud
seeding operations in Cuba, 1952. April 1953. 19 p. 7 figs., 5 maps, refs. MH-BH— Effects of cloud seeding operations conducted in five sugar plantations in Cuba are statistically analyzed. Using data from the target and control areas and normals for those areas, regression equations, correlation coefficients, standard errors and probability ratios are computed. Results of the analysis are presented in charts and graphs. The author finds a significant increase of rainfall over the target areas and shows that the probability of such an increase under natural conditions is as small as 1:2,000. Subject Headings: 1. Cloud seeding effective- ness 2. Precipitation distribution 3. Statistical analysis of artificial rainfall 4. Cuba. —G.T.
5.1-98 551.509.67:6 North American Weather Consultants, Pasadena, Calif., Report on cloud seeding opera-
tions in the southern Cascades, Nov. 1951-April 1952. Prepared for California Oregon Power Company. North American Weather Consultants, Pasadena, Calif., Report, 6-8, Sept. 1952. 37 p. 18 figs , numerous tables, 18 refs. DWB—This report covers the operation and evalua- tion of results of a cloud seeding program directed toward increasing snow pack in the Southern Cascades during the 1951-52 winter season. In this report appear discussions of: the physical processes of natural and artificially induced precipitation processes (sections 3 and 4); the instrumentation of the cloud seeding program (section 5); a summary of weather events during the program (section 6); and an evaluation of results (sections 7 and 8). It is concluded that during the 1951-52 season, cloud seeding increased snow pack in the target area by 33% above what could be expected on the basis of comparison with an historically related area to the north. Runoff appears to have been raised by about 25%. It is recommended that essentially the same seeding plan be followed for another year. Subject Headings: 1. Cloud seeding effectiveness 2. Cascade Mountains.—A uthor's abstract.
5.1-99 551.509.67(569.4) Rosenan, Naftali (Israel Met. Service), Climatological analysis of cloud seeding experi-
ments during the second year of the experimental period, 1951/2, in Israel. Hakirya Ministry of Agriculture, Div. of Research, Rainfall Research Committee, Dec. 1952. 6 p. ref., map.— Twenty seven cloud seeding experiments carried out by means of a silver iodide smoke generator on the ground. Various statistical tests were made which show some evidence that experi- ments were successful. Subject Headings: 1. Cloud seeding effectiveness 2. Israel. I. Israel. Rainfall Research Committee.—A.A.
5.1-100 551.509.67 t*Terada, Kazuhiko (Dir. Nagasaki Marine Obs.) et al., On the artificial stimulation of
rain in the Kyusyu area. Oceanography and Meteorology, Nagasaki, Japan, 6(1). 19-88, 1952/53. graphs, diagrs., tables, plates, bibliog. p. 38-39. In Japanese, English summary p. 79-88. MH-BH—The first part deals with artificial production of rime, the second gives a detailed report on experimental stimulation of rain. Dry ice, 1.5 kg each time, was introduced into the atmosphere by balloon and released in a fixed layer. The probable path of the balloon was traced by means of all available aerological information. Precipitation measured in the area of the path indicates that the experiment was rather successful, although it is impossible to determine whether reported meteorological changes were artificial or natural. Subject Headings: 1. Artificial precipitation 2. Cloud seeding 3. Rime 4. Kyusyu, Japan.—A.A.
24 METEOROLOGICAL ABSTRACTS AND BIBLIOGRAPHY
5.1-101 551.509.67 U. S. Dept. of the Interior. Committee for the Evaluation of Bonneville Power Ad-
ministration Cloud-Seeding Operations in the United States Portion of the Pend Oreille River Basin, Report. Pub. by the Dept., July 1952. 94 p. 28 figs., 4 illus., maps, graphs, 15 refs. DWB—Statistical material related to the cloud seeding activities in western Mon- tana, northern Idaho and the northeastern corner of Washington is presented and analyzed. In these experiments six Agl generators were operated from Sept. 21 to Sept. 30, 1951 for a total of 286 generator hours. The statistical study is based on precipitation and runoff data for the operation period which are compared with long period mean values. Probabilities of occurrence and significance of the results obtained are determined. Although some positive effect could be observed, the Committee states that more extensive material would be necessary in order to reach final conclusions. A paper by VINCENT J. SCHAEFER on "The use of silver iodide particles for seeding supercooled clouds" is incorporated into the report. Subject Headings: 1. Statistical analysis of artificial precipitation 2. Cloud seeding with silver iodide 3. Northwestern United States. I. Schaefer, V. J.—G.T.
STRUCTURE AND PHYSICS OF THE ATMOSPHERE
STRUCTURE OF THE ATMOSPHERE—IONOSPHERE
See also: Air pollution, 5.1-9; Planetary upper air frontal zone (Zubian), 5.1-156; Ex- planation of brightness of color of sky (Hulburt), 5.1-158; Ebb and flow of oceans, atmos. and earth (Defant), 5.1-188; Theory of turbulent diffusion in atmos. (Ogura), 5.1-193; Study of ionospheric winds and turbulence by long radio waves (Millman), 5.1-206; Nitrogen content in precip., Sweden (Angstrom. Hogberg), 5.1-234; Opacity and atmos. impurities (Miura), 5.1-299; Polarization measurements of low frequency echoes (Kilpatrick), 5.1-312.
5.1-102 551.510.4:551.1 Landsberg, Helmut E., The origin of the atmosphere. Scientific American, 189(2):
82-86, Aug. 1953. diagrs. DWB—Present composition of the earth's atmosphere is described. Escape velocities for different gases under various temperatures are discussed and the evolution of the atmosphere is deduced from changes in the escape of atmospheric constituents due to the cooling of the earth. Four hypothetical stages of the atmosphere are described and illus- trated by colored schematic diagrams. Three hypotheses on the origin of oxygen (by thermal dissociation, photochemical dissociation or photosynthesis of carbon dioxide in plants) are mentioned and the presence of argon is explained. The atmosphere of Mars, which appears to represent a later stage of development, is suggested as a possible clue for predictions regarding future evolution of the terrestrial atmosphere. The effect of human, especially industrial activities and its compensation by nature is considered. Subject Headings: 1. Origin of atmosphere 2. Atmospheric evolution 3. Atmospheric composition.—G. T.
5.1-103 551.510.41:551.577:016 fEriksson, Erik (.Royal Agri. Col. of Sweden, Uppsala), Composition of atmospheric precipi-
tation. II. Sulfur, chloride, iodine compounds. Bibliography. Tellus, 4 (4) :280-303, Nov. 1952. 11 figs., 14 tables, bibliog. p. 296-303. MH-BH—On the basis of a comprehensive and critical review of the literature (317 references are cited), the author discusses the com- bined sulfur content of the atmosphere and its annual variation; the origin of combined sulfur in the atmosphere; the annual and geographical variations of chloride in precipitation; the origin of chloride in precipitation; the meteorological factors influencing the chloride content of rainwater such as amount of rainfall, wind direction and wind strength and altitude; the Kohler distribution of chloride concentration in white frost formed at high altitudes by pre- cipitation and freezing of supercooled water particles in clouds; the practical importance of the transport of oceanic salt inland; and the iodine content of precipitation and of air. Subject Headings: 1*. Precipitation composition 2. Sulfur content of air 3. Chloride content of air 4. Iodine content of air 5. Bibliographies.—I.L.D.
f
I. CURRENT ABSTRACTS 25
5.1-104 551.510.41:546.214 *Hinzpeter, Hans, Ergebnisse der in den Jahren 1941-1945 in Potsdam durchgeftihrten
Ozonmessungen. [Results of ozone measurements carried out at Potsdam, 1941-1945.] Germany. Deutsche Detnokratische Republik. Meteorologischer und Hydrologischer Dienst, Veroffentlickungen, No. 9, 1952. 22 p. mostly tables, 3 refs. DWB—One of the few systematic measurement series. Instrument: ozone spectrometer according to DOBSON. Intensity measurements in 3110 and 3300A or 4450A; ratio depends on ozone content. Data given for ozone content reduced to normal temperature and pressure together with solar height, path of solar rays through atmosphere and ozone layer, as well as state of sky and visibility during measurement. Subject Headings: 1. Ozone data 2. Potsdam, Germany. —A. A.
5.1-105 551.310.42:551.510.52 *Junge, Christian, Die Rolle der Aerosole und der gasfCrmigen Beimengungen der Luft
im Spurenstoffhaushalt der Troposphare. [The role of aerosols and gaseous im- purities of the atmosphere in the chemical balance of the troposphere.] Tellus, 5(l):l-26, Feb. 1953. 18 figs., 9 tables, bibliog. p. 26. MH-BH—The size distribution curves for aerosols in the atmosphere at Frankfurt a.M. and Feldberg/Ts (800m) are extended to the ranges 0.005 to 0.1M radius on the basis of ion measurements at Frankfurt and Zugspitze, respectively. The maximum frequency occurs at about 0.08M- From these measurements the total volume of impurities in a given volume of air near the ground is calculated according to * categories: Aitken, large and giant nuclei, respectively. The relative importance of the Aitken particles (.005 to .1M) is small compared with that of the 0.1 to 1M (large) or the 1.0 to 20M (giant) particles (the latter 2 size distributions contribute about equal volumes). The results of WOODCOCK on the spectrum of sea salt particles in sea air over the coast of New England agree very well with those obtained by sedimentation methods at Frankfurt. The effect of vertically changing austausch (A) on particle count is illustrated for 5 different time intervals and 3 values of A. The effect is completely negligible at a height of 100 m but is quite pronounced at heights up to 25 m. Finally, an extensive summary is given of recent results of the author, W. JACOBI and W. LIPPERT (see item 4.4-185, April 1953, MAB) on chemical analysis of natural aerosols by determining the dispersion of electrons. Smaller nuclei (<1M) are mostly ammonium sulfate, whereas NaCl nuclei are generally >1M- Elec- tron microscope determinations and, finally, results of chemical analysis of rainwater are discussed and tabulated along with results of other authors in various parts of the world. Subject Headings: 1. Aerosol content of atmosphere 2. Condensation nuclei spectrum 3. Chemical analysis of aerosols 4. Rain composition 5. Frankfurt a.M., Germany.—M.R.
5.1-106 551.510.41:546.214 Long, Arthur R. (U. S. W. B., Montgomery, Ala.), Discussion on atmospheric ozone.
Alabama Academy of Science, Birmingham, Journal, 23/24:145-149, Feb. 1953. 16 refs. Abstracted from reprint. DWB—A review of current knowledge on atmospheric ozone wherein the author describes its chemical and photochemical properties and its variations in space and time. Day-to-day and annual variations of ozone are found to be more markedly related to weather conditions than to solar activity. Subject Headings: 1. Ozone 2. Ozone variations. —G.T.
5.1-107 551.510.41:546.214 Teichert, F., Bericht fiber Ozonmessversuche mit Fluoreszein. [Report of attempts of
measuring ozone with fluorescein.] Zeitschrift fur Meteorologie, 7(2) :33-34, Feb. 1953. 6 refs. DWB—Report of unsuccessful attempts made in a laboratory with artificially ozonized oxygen. Apparatus and methods used are described. The method is not recommended for quantitative measurements of ozone in the lower layers of the atmosphere. Subject Headings: 1. Ozone measurement techniques 2. Laboratory experiments 3. Fluorescein.—A.A.
5.1-108 551.510.42 Baynton, H. W., The role of meteorology in the Detroit-Windsor air pollution study.
Royal Meteorological Society, Canadian Branch, [Publications'], 4(4), 1953. 9 p. fig., refs.
26 METEOROLOGICAL ABSTRACTS AND BIBLIOGRAPHY
DWB—A nontechnical description of the project for study of the amount of air pollution and its effects on health, vegetation, etc. in the Detroit, Mich .-Windsor, Ontario area. The pollution is caused by steamboats operating in internationally controlled waters. Hence the investigation was set up by the International Joint Commission under a Technical Advisory Board on Air Pollution, with a U. S. section and a Canadian section. The details of studies on wind, turbulence, diffusion, lapse rate and precipitation factors affecting pollution in the area are outlined. Lapse rat., or stability, is considered the most crucial meteorological factor. Subject Headings: 1. Atmospheric pollution studies 2. Lapse rates 3. Detroit-Windsor area. —M.R.
5.1-109 551.510.42 *Clayton, George D.; Giever, Paul M.; Sitgreaves, Rosedith; Brinton, Hugh P. and
Gafafer, William, Report of results of sampling the atmosphere in the Detroit River area during 1951. International Joint Commission, Technical Advisory Board on Air Pollution, U.S. Section, March 1, 1953. 55 p. 46 figs., 24 tables+tables in appends., 14 refs. DWB— The extensive report covers the history and terms of reference of the International Joint Commission and its Technical Advisory Board on Air Pollution, and the details of investiga- tions conducted on the U. S. side of the International Waterway during 1951. Air sampling areas and instruments used for sampling are described, and extensive data collected on nature and amounts of contaminants given in tables. Subject Headings: 1. Atmospheric pollution studies 2. Atmospheric pollution data 3. Detroit, Michigan. I. International Joint Com- mission. Technical Advisory Board on Air Pollution. U. S. Section.—M.R.
5.1-110 551.510.42:551.508.91 Washburn, Harold W. and Austin, Robert R., Some instrumentation problems in the
analysis of the.atmosphere. National Air Pollution Symposium, Stanford, Calif., Nov. 10-11, 1949. Proceedings, p. 69-76. 3 figs., 3 tables, 4 refs. DWB—A discussion of two instru- mental analytical methods for determining the kind and amount of contaminants in the atmosphere. These are: 1) the use of Titrilog which records continuously the amount of bromine required to titrate samples of polluted air containing sulphur dioxide, which can be detected in a concentration of 20 parts per million and 2) the use of the mass spectrometer to identify the types of contaminants. Subject Headings: 1. Atmospheric pollution 2. Air sampling and analysis 3. Titrilog 4. Symposia.—J.L.D.
5.1-112 551.510.534:551.524.7 Vassy, E. and Vassy, A., Temperature moyenne de l'ozone atmospherique. [Mean
temperature of atmospheric ozone.] Indian Academy of Sciences, Proceedings, Sec. A, Ban- galore, 37 (2) :195-203, Feb. i953. 2 figs., 19 refs., 6 eqs. DLC—It is shown how the spectro- scopic determination of ozone temperature in the stratosphere would make possible the regular observation of the mean temperature of the atmosphere up to 70 km or so, rather than to 30 km as can be done with radiosondes; also the determination of the daily, seasonal, annual and regional variations in temperature of the high atmosphere would be possible; more data are needed on the amount (depth) of ozone in the ozone layer. Laboratory spectroscopy of
5.11-111 551.510.534 *Ramathan, K. R. and Kulkarni, R. N. (Phys. Res. Lab., Ahmedabad), Height distribution
of atmospheric ozone. Indian Academy of Sciences, Proceedings, Sec. A, Bangalore, 37(2) :321 — 331, Feb. 1953. 4 figs., 2 tables, 12 refs. DLC—Results of observations of height distribution of ozone made at Mt. Abu, North India with a Dobson spectrophotometer from Oct. 1951 to April 1952. Ozone is negligible below 18 km, quite variable from 18-27 km and steady above 27 km. Compared with data at Delhi, Kodaikanal, White Sands, N. Mex., Arosa and Tromso it is evident that ozone extends to lower levels at high latitudes. Ozone increases » greatly with latitude, and is probably destroyed by water vapor carried upward by convection. As it is formed by photochemical dissociation of Oj by sunlight, it is also wanting in the polar j, night. There is a high negative correlation with the height of tropopausc. In subsidence \ areas (cold sinks) Oj may be very great for long periods, just above inversion layer. Subject Heading: 1. Ozone distribution.—M.R. * 1 a
I. CURRENT ABSTRACTS 27
ozone by the authors has enabled them to define ozone temperature (1936) and to make observations at several places in France and the Alps (Mt. Blanc, Jungfraujoch, etc.) since 1935. Subject Headings: 1. Ozone spectroscopy 2. Ozonosphere temperature measurement 3. Alps.—M.R.
5.1-113 551.510.535 tAl'pert, IA. L., Statisticheskii kharakter struktury ionosfery. [Statistical nature of
the ionospheric structure.] Uspekhi Fisicheskikh Nauk, Moscow, 44(1):49-91, Jan. 1953. IS figs., 3 tables, 25 refs., 104 eqs. DLC—An extensive "survey article" reviewing in logical sequence the characteristics of the ionosphere as determined through statistical analysis of
j& * radio propagation data. The various layers of the ionosphere from which reflections occur during quiet periods are shown to be connected with the primary, secondary and tertiary reflections of signals (beautifully illustrated by a recorder record). The diffuse, complex and disturbed nature of the ionospheric layers at certain times makes a complicated statistical study necessary to formulate a theory or model of the ionospheric structure and behavior. The measurement of ionospheric drift is taken up in the final paragraph. The author shows a good knowledge of the literature both native and foreign (3/5 of the references cited are from foreign sources). Subject Headings: 1. Ionospheric structure 2. Electromagnetic wave propagation 3. Survey articles.—M.R.
5.1-114 551.510.535 Hulburt, Edward O. {Naval Res. Lab., Wash., D. C), Physical characteristics of the
upper atmosphere of the earth. (In: U. S. School of Aviation Medicine, Randolph Field, Texas, Physics and medicine of the upper atmosphere. Albuquerque, 1952. p. 35-53. 4 figs., 4 tables, 22 refs.) DLC—The physical and chemical properties of the upper atmos- phere above 80 km above sea level are reviewed. The topics covered are as follows: pressure, density and temperature from rocket experiments, winds in the upper atmosphere as determined by sounding balloons, smoke shells and meteor trails, the composition of the atmosphere, solar ultraviolet spectrum and soft X-rays, atmospheric ozone, the light of the night sky, and the atmosphere above 200 km. Tables giving values of pressure, density and temperature up to 219 km, wind velocities deduced from meteor trails and ozone concentration up to 70 km above New Mexico are presented. Subject Headings: 1. Upper atmosphere physics 2. Upper air soundings.—I.L.D.
5.1-115 551.510.535:551.507.362 Jackson, John E. {Naval Res. Lab., Wash., D. C), Rocket-borne instrumentation for
ionosphere propagation experiments. U. S. Naval Research Laboratory, Upper Atmosphere Research Report, No. 13, Jan. 9, 1952. 39 p. 22+ figs., table, 15 eqs. U. S. Naval Research Laboratory, Report 3909. DWB—The rocket-borne equipment used for the ionosphere propagation experiments conducted during V-2 and Viking flights has been developed and improved to the extent that satisfactory operation has been obtained in all recent flights. Various problems were encountered in the development owing to the limitations imposed by the research vehicle and the method of experimentation. Space and weight, as well as freedom from interference with other cooperating agencies, has to be considered. In addition, the equipment has to be physically rugged and electrically stable to operate successfully under the several conditions of vibration, aerodynamic drag, and temperature changes occurring • during flights. The experiments were conducted by transmitting two crystal-controlled c-w .
'~ radio-frequency signals, one of such frequency as to be substantially affected by the ionosphere i and the other of such frequency as to be essentially unaffected. Thus, since the antenna j
I pattern has to be favorable toward the receiving stations on the ground, a diplexing whip 1 - '• • antenna having a pattern similar to that of dipole has replaced the earlier V-2 tail antennas.
In recent flights, experiments were begun 80 seconds after take-off at an altitude of approxi- i mately 35 miles. Autotune circuits were added to accomplish tuning, i.e., matching between transmitter and antenna impedances, at this time, and a retuning unit was developed to initiate j a second- tuning at a much higher altitude. Antenna impedances during flight could be determined from the telemetering data of the micromatch circuit and of the matching trans- '. former variable condenser position. The problems connected with ionosphere research a
28 METEOROLOGICAL ABSTRACTS AND BIBLIOGRAPHY
instrumentation are no longer considered major sources of difficulty; certain aspects of the I' antenna problem which still remain to be solved tend to reduce radiation efficiency, but ap- m parently do not introduce serious errors in the propagation data provided that the rocket does '•• not spin or tumble. Subject Headings: 1. Ionospheric research 2. Rocket instrumentation 3. V-2 rockets 4. Martin Viking rockets.—Author's abstract.
5.1-116 551.510.535:551.594.5:550.385 Martyn, D. F., The morphology of the ionospheric variations associated with magnetic «
disturbance. I. Variations at moderately low latitudes. Royal Society of London, Proceedings, Ser. A, 218(1132) :1-18, June 9, 1953. 8 figs., 16 refs. 9 eqs. DLC—Variations in height and density of ionosphere, especially F2, are compared with magnetic data for Watheroo, v
Canberra and Washington. In addition to diurnal variations (local time) are storm variations \ persisting for about 3 days after commencement of storm. Initial shape depends on local time of commencement. Ionospheric disturbances are attributed to an electrostatic field \ developed in auroral zone and spread through ionosphere by a drift of ionization. Subject j Headings: 1. Ionospheric variations 2. Magnetic disturbances 3. Auroras.—C.E.P.B. j
3
5.1-117 551.510.535 \ Utah. University, Physical properties of the upper atmosphere. Contract W19-122- -.
ac-15, Progress Reports, Nos. 1-10, June 30, 1948-Dec. 5, 1951. 10 pieces, diagrs., graphs, ; eqs. DWB—Description of construction, theory and performance of a 16 level step-voltage : generator, and a theoretical and experimental analysis of dispersive networks. A helical delay line possessing inductive dispersion was constructed and delays were measured. De- velopmental investigations of antennas for installation in tail fin of V-2 rocket, and receiving antenna for ground installation were carried out. Further development on tests of antenna transmitters, circuits and cameras are indicated and illustrated in last two reports. Subject < Headings: 1. Rocket research 2. Electromagnetic wave dispersion 3. Recording equipment » I. Sinford, Leon B. II. Collins, T. Kirkwood m. Contract W19-122-ac-l5.—M.R.
5.1-118 551.510.535:550.385:551.521.7 \ van Sabben, D., Relationship between radio-propagation disturbance, geomagnetic '•
activity and solar noise. Journal of Atmospheric and Terrestrial Physics, 3(4) :194~199, May 1953. 3 figs. DWB—A radio-propagation disturbance index / is derived and its varia- tions in circuit New York-Amsterdam compared with variations of geomagnetic K. Close agreement is found, / having a mean lag of 7 hrs behind K. A nonrecurrent magnetic storm was generally preceded by an increased flux of radio noise, average interval 2 days. Subject Head- ings: 1. Ionospheric disturbances 2. Magnetic disturbances 3. Solar radio noise.—C.E.P.B.
5.1-119 551.510.535:523.78 Wells, H. W. {Carnegie Inst. of Washington, D. C), Ionospheric effects of solar eclipse
at sunrise, September 1, 1951. Journal of Geophysical Research, 57(2):291-304, June 1952. 9 figs., 6 refs., 3 eqs. MH-BH—Ionospheric observations at three stations in Maryland and Virginia during annular eclipse of Sept. 1, 1951 did not show significant increases of ion pro- duction. They indicate that coronal radiation is not an important factor in production of F2 , ionization. Subject Headings: 1. Ionospheric variations 2. Solar eclipses 3. Maryland 4. Virginia.—C.E.P.B.
MECHANICS AND THERMODYNAMICS OF THE ATMOSPHERE
See also: Physical Review index, 5.1-7; Convective phenomena near heated surface ' (Ramdas), 5.1-8; Radiative transfer in far infrared bands (Elsasser, King), 5.1-165. ' \
5.1-120 551.511:551.509.312 ' Arnason, G. (Univ. of Stockholm), A baroclinic model of the atmosphere applicable to 1
the problem of numerical forecasting in three dimensions. I. Tellus, 4 (4) :356-373, Nov. 1952. 6 figs., 7 tables, refs. DWB—The author develops a three-dimensional baroclinic -. model of the atmosphere which is determined by four parameters, three of which specify the
I. CURRENT ABSTRACTS 29
field of temperature. This model allows for a nonuniform temperature lapse rate in the horizontal and takes into account the observed division of the atmosphere into a troposphere and stratosphere. The number of parameters is reduced to three by utilizing the fact that the horizontal temperature gradient is usually reversed when traversing the tropopause. This model is used to integrate the vorticity equation along the vertical and the coefficients of the resulting two-dimensional equation are discussed. Examination of the coefficients indicates that in middle latitudes the level of mean wind may vary from 2.5-6.5 km and that the level of nondivergence is always higher than the former. On the average, the level of mean wind lies below and the level of nondivergence above the 500 mb surface. The consequence of this for numerical forecasting are discussed. Subject Headings: I. Numerical forecasting 2. At- mospheric models.—From author's abstract.
5.1-121 551.511:533:546.291 Azpiroz Yoldi, Miguel, Sobre la formula de Knudsen. [On Knudsen's formula.] Re-
vista de Geofisica, 11 (42) :154-156, April/June 1952. 7 refs., 3 eqs. MH-BH—A brief article giving an application of DE DONDER'S (1936) theory of affinity to KNUDSEN'S formula used in studying the properties of He II. Subject Headings: 1. Thermodynamics of gases 2. Helium.
' —M.R.
5.1-122 551.511:551.571 Benton, George S., Water vapor transport project Johns Hopkins University. Dept.
of Civil Engineering. Contract AF 19(122)-365, Quarterly Report, No. 4/5, June 12/Dec. 15, 1951, and Technical Report No. 2/3. 75 p. 2+2+20 figs., 6 tables, 2 + 11 refs. DWB— A comprehensive punched card project for the computation by line integration of diver- gence fields for water vapor transport over the U. S. and Canada. Technical Report No. 2 presents a valuable classification for the analysis of a field of motion and its division into mean motion, space eddy, time eddy, and space-time eddy components. The computation of eddy transport is shown. Technical Report No. 3 gives a detailed sample for the calculation of water vapor transfer (March 1949) for North America, Central United States and the Ohio River Basin. Subject Headings: 1. Water vapor transport 2. Large scale eddies 3. United States 4. North America. I. Johns Hopkins Univ. Dept of Civil Engineering II. Contract AF 19(122)-365 HI. Carnahan, Robert L. IV. La Seur, Noel E.—A.A.
5.1-123 551.511:551.515.8 Berliand, M. E. and Dobryshman, E. M., Soveshchanie po voprosam issledovaniia
tranformatsii vozdukha. [Conference on the question of investigating the transformation of air.] Meteorologiia i Gidrologiia, No. 8:49-50, Aug. 1952. DLC—Review of meetings held by the Central Geophysical Observatory in cooperation with the Central Aerological Ob- servatory, Central Institute of Weather Forecasting and Geophysical Observatories of Tashkent, Kiev and Minsk. The adiabatic air transformation (report by S. S. GAIGEROV), heat transformation of cold air masses (by M. V. ZAVARINA), heat transformation of air masses (by M. E. BERLIAND) and actinometric investigations of free atmosphere (by V. G. KASTROV and E. A. LOPUKHINA) were discussed. Special reports on air transformation over the irrigated regions were made by P. A. VORONTSOV (aerological problem) and M. I. IUDIN (change of climate). Subject Headings: 1. Air masses 2. Energy transformation 3. Conferences.—N.T.Z.
5.1-124 551.511 Bugaev, V. A., O poriadke velichin gorizontal'nykh proizvodnykh baricheskogo i tem-
peraturnogo polel atmosfery. [On the order of magnitude of horizontal derivatives of baric and temperature fields of the atmosphere.] Akademiia Nauk, SSSR, Izvestiia, Ser. Geofiz.,
• No. 4:86-97, 1952. 5 figs., 2 tables, 5 refs. DLC—Characteristic values for the horizontal * first, second and third order derivatives in the 700 and 500 mb levels and for the relative * topography 500/1000 mb are given for the evaluation of different terms in hydrodynamic •* equations. Table 1 (p. 88-89) presents averages and standard deviations on the basis of a $' statistical investigation (30 cases). Furthermore, the frequency of different radii of curvature Jfc is discussed. Subject Headings: 1. Dynamic meteorology 2. Pressure fields 3. Temperature K fields.—A. A.
%
I- l
30 METEOROLOGICAL ABSTRACTS AND BIBLIOGRAPHY
5.1-125 551.511 Diubiuk, A. F., Primenenie metoda integrala Fur'e k opredeleniiu vetra po poliu davleniia.
[Application of Fourier's analysis for wind determination along the pressure field.] U.S.S.R. Tsentral'nyl Institut Prognozov, Trudy, 15(42) :48-62, 1949. 3 refs., 105 eqs. DLC—Equa- tions of motion are integrated considering the surface friction in the form of GOLDBERG and MOHN, disregarding in the first approximation the convective terms of acceleration and using the Fourier integral for the solution of these linearized differential equations. In a second approximation, the convective terms are introduced. In the second part of this entirely mathematical discussion, the internal friction is considered using the method of multiple integrals for the solution. Subject Headings: 1. Wind field computation 2. Fourier analysis 3. Dynamics of the atmosphere.—A.A.
5.1-126 551.511 Garmendia Iraundegui, Jos£, Aplicaciones fisicas de los solenoides y de las celulas
triescalares. [Physical applications of solenoids and of three dimensional cells.] Revisla de Geofisica, Madrid, 11 (43) :219—251, July/Sept. 1952. diagrs., eqs. In Spanish, English summary p. 219. DWB—Generalizing Ertel's vorticity theorem for any vector A, the theory is expressed in several forms for all continuous media. The particular cases of irrotational movement, a continuous medium, with a fixed direction and in the solenoidal form are de- veloped and applied to the theorems of THOMSON and V. BJERKNES and, finally, to the case of a viscous fluid and to electrical, magnetic, sound and ray movement and to propagation of electromagnetic waves. The mainly mathematical treatment is amply supplemented by models and vector diagrams. Subject Headings: 1. Mechanics of the atmosphere 2. Ertel's vorticity theorem 3. Solenoids.—M.R.
5.1-127 551.511:551.555.1 Palmen, E. {Academy of Finland), On the vertical eddy flux of momentum in the trade-
wind zone. Indian Academy of Sciences, Proceedings, Sec. A, Bangalore, 37(2): 189-194, Feb. 1953. fig., table, 8 refs., 6 eqs. DLC—The meridional component v (nu) corresponds to the cross-isobaric wind component, and the zonal component U to the component parallel to the isobars. The variation of the zonal component of the shear stress 7\ (tan sub x) with height is then determined by:
du . . , dTx p -rr = 2w sin 4>pv-\—-—.
dl dz The stress due to horizontal shear is neglected as it is only significant in large scale disturbances. Ht denotes the level where there is no vertical eddy flux of momentum or the level of strongest east wind. H2 is the level where the meridional component vanishes. In the model presented, Hi is at 700 m and H2 at 3000 m. Zonal stress at different heights 0-4 km at lat. 13°N in Jan. is given in table, as compiled from model at 700 mb (H2) the shear stress is calculated as I dyne cm-1. By a different method, the author computed the 20-30°N stress at 700 mb as 0.5 dyne cm-1 or 1.2 that at 13°N. {See item 5.1-128 below.) Subject Headings: 1. Angular momentum flux 2. Meridional momentum flux 3. Shear stress over oceans 4. Trade wind models.—M.R.
5.1-128 551.511 Palmen, E. and Alaka, M. A. (Univ. of Chicago), On the budget of angular momentum
in the zone between equator and 30°N. Tellus, 4(4):324-331, Nov. 1952. 3 figs., 3 tables, II refs. MH-BH—Using available empirical data for the month of Jan. the author calculates a complete budget of angular momentum for the zone 20-30°N. The budget is based upon a consideration of the following quantities in the belt 0-30 °N; "(1) the horizontal and vertical flux of angular momentum due to the mean transport resulting from a mean meridional circula- tion, (2) the horizontal and eddy flux of angular momentum and (3) the angular momentum transfer from earth to atmosphere due to the surface stress of the wind." It is shown that the mean mass transport in the tropical circulation accumulates high relative momentum in the upper atmosphere of the 20-30°N belt and the eddy transport distributes this momentum
GENERAL CIRCULATION
See also: Starr's invariant (Platzman), 5.1-129; Dynamic climatology of Sicily (Cicala), 5.1-295.
5.1-131 551.513:551.589.1 Borchert, John R. (Univ. of Minnesota), Regional differences in the world atmospheric
circulation. Association of American Geographers, Annals, 43(l):14-26, March 1953. 6 figs., refs. DLC—A "climatic boundary" is defined as "a zone across which a relatively large difference in the properties of the moving atmosphere is generated with relatively great fre- quency." World maps on which such zones are marked for Jan. and July are presented. They show major regional differences in prevailing winds and static climatic regions derived from these. Subject Headings: 1. Air mass climatology 2. Circulation patterns.—G.T.
5.1-132 551.513:551.557 551.587(53,567) Frost, R., Upper air circulation in low latitudes in relation to certain climatological dis-
continuities. Great Britain. Meteorological Office, Professional Notes, 7(107), 1953. 25 p. 7 figs., 6 tables, 25 refs. M.O. 524 g. DWB—Starting with a note by D. DEWAR (item 3.3-87, March 1952, MAB) about sudden changes of tropopause level and surface temperature in Iraq in May and Oct., the relations between jet stream and tropopause in the tropics are examined, with world charts of tropopause pressure and vector mean winds, and with vertical meridional sections and tephigrams. The mean zonal wind field is tabulated and related to mean zonal temperature field, and with time of onset of Indian monsoon. It is suggested that the sudden onset of the monsoon results from breakdown of lower tropopause barrier.
I. CURRENT ABSTRACTS 31
northwards and downwards from the subtropical jet. Subject Headings: 1. Angular momentum flux 2. Trade wind belt—I.L.D.
5.1-129 551.511:551.513 Platzman, George W. (Univ. of Chicago), Starr's invariant Tellus, 4(4):352-355, Nov.
1952. 2 figs., 3 refs., eqs. MH-BH—A critical discussion of the article by STARR (Note on recent study of stability by R. Fj0rtoft, see item 2.8-57, Aug. 1951, MAB) in which he pointed out that the integral "for two-dimensional flow of an inviscid incompressible fluid between parallel rigid walls (which coincide say with latitude circles) on a sphere is invariant." The author analyzes STARR'S inference that "if vorticity distribution is monotone, so that dL [L— absolute vorticity] is everywhere positive or everywhere negative then zonal flow cannot develop into disturbed motion." Subject Headings: 1. Dynamic stability 2. Zonal circulation. I. Fjjfrtoft, R. II. Starr, Victor P.—I.L.D.
i
5.1-130 551.511 Van Mieghem, Jacques, Comments on the vorticity equation. Indian A cademy of Sciences,
Proceedings, Sec. A, Bangalore, 37(2):204~212, Feb. 1953. 8 refs., 10 eqs. DLC—In dealing with large values of absolute vorticity (2XCoriolis parameter or more), it is considered neces- sary to make a distinction between individual and local changes in absolute vorticity. Using ] a moving system or curvilinear coordinates, analytical expressions are established for the rate j of individual and of local changes of absolute vorticity which can be used in synoptic analysis. The most convenient form is considered to be the equation of balance of absolute vorticity (Van Mieghem, 1951) giving the local variations of absolute vorticity per unit volume in terms of vorticity flux and vorticity production. It is concluded that: 1) the local increase per unit area in the isentropic surfaces of the absolute vorticity Xn normal to these surfaces is equal to the convergence of the isentropic vorticity flux X%Vg—VK curl* V\ and 2) the local changes of the vertical component f of the absolute vorticity curl V are due chiefly to the convergence or divergence of the horizontal vorticity flux Ck^tVh — W curb, V. Subject Headings: 1. Absolute vorticity changes 2. Synoptic analysis.—M.R. i
v~-
32 METEOROLOGICAL ABSTRACTS AND BIBLIOGRAPHY
(For similar item see 3.7-87, July 1952, MAB.) Subject Headings:-!. Jet stream 2. Upper air climatology 3. Tropopause height 4. Tropics 5. Arabia 6. Iraq.—C.E.P.B.
5.1-133 551.513.1:551.543 'Jackson, S. P., Atmospheric circulation over South Africa. South African Geographical
Journal, Johannesburg, 34:48-60, Dec. 1952. 2 figs., tables, 13 refs. DWB—The classical circulation schemes for South Africa for Jan. and July (BUCHAN, KENDREW, BROOKS and MIRRLEES) do not give the true picture of wind and pressure as actually prevails over the Plateau. The old scheme shows a mean anticyclone in July (winter) with strong outward blowing (monsoonal) winds and a mean cyclone in Jan. (summer) with inward blowing winds. Actual 2 km pressure charts and a consideration of wind direction and velocity frequencies for different times of the day, leads to charts of normal winds and pressures for 0800 and 1400 which are much the same in Jan. as in July (an asymmetrically oriented High with weak circulation and centered over the southeast coast). The disturbances which produce summer rains are not frequent enough to change the mean pressure pattern very much, and the re- duction to sea le/el formula is largely responsible for the old model. Subject Headings: 1. Mean pressure charts 2. Plateau circulation schemes 3. Atmospheric circulation 4. South Africa.—M.R.
5.1-134 551.513.1 Sanders, R. A. (U. S. W. B., Wash., D. C), Blocking Highs over the eastern North Atlantic
Ocean and Western Europe. Monthly Weather Review, 81 (3) :67-73, March 1953. 14 figs., 11 refs. MH-BH—The concept of blocking is briefly reviewed and a definition of "blocking High" in terms applicable to the daily sea level weather map of the eastern North Atlantic Ocean is adopted. The monthly frequency and geographical distribution of blocking Highs as defined are determined from forty years of Historical Weather Maps and presented on charts. Several features of these distributions are discussed in relation to observed monthly weather variations. Subject Headings: 1. Blocking action 2. North Atlantic 3. Western Europe.— Author's abstract.
5.1-135 551.513.2:551.557 Bond, H. G., Easterly jet streams over Darwin. Weather, 8(8):252-253, Aug. 1953.
table. MH-BH—Note on jets of 80 knots from 80-110° at 48,000-58,000 ft in Jan. and Feb. 1953. Subject Headings: 1. Easterly jet stream 2. Australia.—C.E.P.B.
5.1-136 551.513.2 Mironovitch, Valery, Representation de la circulation atmospherique gen6rale pour une
coupe aerologique meridienne a travers les deux hemispheres. [Representation of the general circulation of the atmosphere on a meridional cross section through both hemispheres.] Academic des Sciences, Paris, Comptes Rendus, 236(4) :404-406, Jan. 26,1953. 2 figs. DWB— Meridional cross sections up to 22 km along 50°W in the Northern and 150°W in the Southern Hemisphere for winter and summer separately show the height of the main isobars, the height of the tropopause and the isopleths of the zonal geostrophic wind, utilizing for the equatorial region direct observations of the wind. The tropopause has a discontinuity in the region of the jet stream. The tropical and equatorial tropopauses are distinguished. Subject Headings: 1. Meridional cross sections 2. Tropopause 3. Jet stream.—A.A.
5.1-137 551.513.2:551.557:551.576.1 Track jet streams by cloud formations. Science News Letter, 63 (6) :83-84, Feb. 7, 1953.
DLC—Brief note on a report delivered (during a motion picture presentation) by DR. VINCENT J. SCHAEFER (G.E.) at the 1953 annual meeting of the American Meteorological Society in New York. Four basic cloud formations are identified as indicating the existence of a jet stream. These cloud types are peculiar cirrus streamers, high cirrocumulus, altocumulus and billowing altocumulus. A good photograph of billowing altocumulus is presented. Subject Headings: 1. Jet stream cloud formations 2. Cloud structure. I. Schaefer, Vincent J.—G.T.
«
I. CURRENT ABSTRACTS 33
ATMOSPHERIC DISTURBANCES
See also: Exploration of atmos. by rockets (Singer), 5.1-56; Radiosonde ascent during thunderstorm (Venkiteshwaran, Tilakan). 5.1-73; Forecast investigation (Hage). 5.1- 87; Thunderstorm forecasting, Tohoku District (Numata, Miyake), 5.1-88; Objective method of thunderstorm forecasting (Oertel), 5.1-89; Conference on transformation of air (Bcrliand, Dobryahman), 5.1-123; Low min. temp. June 12-13, W. IT. S. (Hughes, Ross), 5.1-179; Orographic influence on atmos. pressure and currents (Suzuki), 5.1-187; Relation: jet stream and cyclone formation (Riehl), 5.1-208.
5.1-138 551.515.3(729.9) Macky, W. A. (Bermuda Met. Serv.), The Easter tornadoes at Bermuda. Weatherwise,
6(3):74-75, June 1953. 2 figs. MH-BH—Description, photographs and map showing paths of 4 tornadoes which crossed Bermuda on Easter Sunday, April 5, 1953 at 1800 to 1830 local time. One passed directly over Hamilton. Microbarograph trace shows a sharp dip of 8 mb and an equal rise in a very short period. The maximum wind was 89 m.p.h. at the meteoro- logical office. Only 1 life was lost as most everyone was indoors and only 90 buildings were damaged. Subject Headings: 1. Tornadoes 2. Bermuda.—M.R.
5.1-139 551.515.3(76) Newton, Charles H. (U.S.W.B., Texarkana, Arkansas), Tornadoes at Texarkana.
Weatherwise, 5(5) :98, 110, Oct. 1952. MH-BH—A first hand account of the three successive tornadoes that occurred on July 16, 1952. The damage caused by them and the weather associated with the onset of the tornadoes are described. Subject Headings: 1. Tornadoes 2. Texarkana, Arkansas.—I.L.D.
5.1-140 551.515.3(261) Rodewald, Martin, Beobachtung von zwei Wasserhosen. [Observation of two water-
spouts.] Wetterlotse, No. 58:137-139, June 1953. fig. DWB—Nov. 24, 1952, near Svinoy in a convergence cloud en a marked cold front (chart). Subject Headings: 1. Waterspouts 2. North Atlantic—C.E.P.B.
5.1-141 551.515.3(78,4) St. John, Francis, Terror of the winds. The Courier, London, Oct. 1948. p. 81-83.
illus. DWB—A vivid, illustrated account of the nature and damage caused by tornadoes in the U.S.A. and occasionally in NW Europe. Subject Headings: 1. Tornadoes 2. Tornado damage 3. United States 4. Northwest Europe.—M.R.
5.1-142 551.515.3 U. S. Weather Bureau, It looks like a tornado ... an aid for distinguishing tornadoes
from other cloud forms. Wash., D. C, U. S. Weather Bureau, March, 1953. lip. photos, diagrs. Price: $.10. DWB—A small, well illustrated pamphlet giving advice and schematic diagrams to illustrate how tornadoes form and how the layman can distinguish between a real tornado and several other phenomena (virga from a rain cloud, distant thunder shower, roll type squall cloud, shelf type squall cloud, mammatus formation under a thundercloud, dust whirl or waterspout). Some actual tornadoes are described and illustrated. Prompt and accurate reporting of real tornadoes is said to be essential to protection of life and property. Erroneous reports of other phenomena as being tornadoes, cause undue alarm or panic and confusion. Subject Heading: 1. Tornado identification.—M.R.
5.1-143 551.515.3(261) Waterspout, North Atlantic Ocean. Marine Observer, 23(159) :8, Jan. 1953. 2 figs.
MH-BH—Brief account with sketches of waterspouts in 32°27'N, 43°20'W on March 8, 1952 and 25°30'N, S0°WW on March 31, 1952. Subject Headings: 1. Waterspouts 2. North Atlantic—C.E.P.B.
5.1-144 551.515.3(261/4) Waterspout observed on route Cape Town to Barbados. Indian Journal of Meteorology
and Geophysics, 3(1):40, 1952. fig. DWB—Sketch of waterspout observed on March 15, 1951. Subject Headings: 1. Waterspouts 2. Atlantic Ocean.
34 METEOROLOGICAL ABSTRACTS AND BIBLIOGRAPHY
5.1-145 551.515.8:551.524.7 §Bradbury, Dorothy L. and Palm^n, E. {Chicago Univ.), On the existence of a polar-front
at the 500-mb level. American Meteorological Society, Bulletin, 34(2):56-62, Feb. 1953. 7 figs., 2 refs. MH-BH—A 500-mb Northern Hemisphere isotherm chart for Feb. 6, 1952 is presented to show the concentration of isotherms in a narrow belt meandering between 30° and 70°N around the hemisphere. This is shown to be definite proof of a frontal surface at the 500-mb level—a phenomenon which analysts 10-15 years ago refused to consider at all, and which even today many analysts are reluctant to enter on upper level charts. Soundings and reconnaissance flights over the oceans and in the vicinity of the frontal zone bear out the sharpness of the front at 500-mb, the relation it bears to the jet stream and the tropopause, and its role in cyclogenesis. Hence, it is considered to be a useful forecast tool. Subject Headings: 1. Polar fronts 2. Upper air fronts 3. Jet stream 4. Upper air temperatures 5. Northern Hemisphere.—M.R.
5.1-146 551.515.8(47) §Dubentsov, V. R., Letniaia transformatsiia vozdushnykh mass nad kontinentom. [Sum-
mer transformation of air masses over the continent.] U.S.S.R. Tsentral'nyi Institut Prog- nozov, Trudy, 17(44):3-63, 1949. 25 figs., 25 tables, 27 refs. DLC—The author analyzed the process of warming up over European U.S.S.R. and Middle Asia of air masses incoming from Polar regions and Atlantic. Basic factors of the transformation are investigated in detail. It was found that temperature of Arctic air masses rises 3-4°C per day in lower layers during first 3-4 days; the warming process continues 6-7 days. Rise of temperatures for cold air masses incoming from west is not so intensive and is only 2°C per day, and intensity in- creases only when these masses reach southeastern Russia and Middle Asia. Thermal lapse rate in atmospheric layer from 1 up to 5 km usually during the warming process is increased from 0.4-0.5°C up to 0.6-0.7°C and stable mass at first becomes unstable. The analyses of many cases of invasions for the period 1936-1946 show that over European Russia and Middle Asia during summer the process of transformation of cold air mass into mass of warm continental air (which is incorrectly called tropical air) predominated. Subject Headings: 1. Air mass transformation 2. Middle Asia 3. U.S.S.R.—N.T.Z.
5.1-147 551.515.8:551.515.4(45) §Gazzola, Adriano, Temporal! frontali sull'Italia Nord-Occidentale. [Frontal thunder-
storms over northwest Italy.] Rivista di Meteorologia Aeronautica, 12(3):3-17, July/Sept. 1952. 9 figs., 6 refs. French, English and German summaries p. 3. MH-BH—A study of the synoptic situations which produced thunderstorm conditions in northwest Italy between April and Sept. 1951. A particularly detailed analysis is made of the situation on June 23, 1951, by means of surface and 700 mb charts for Europe and a frontal analysis for northwest Italy and the Alps for each 2-hour period from 1200 to 1800 on June 23; and a similar treatment (though more simple) for a situation on Aug. 26, 1879 (analyzed by E. PINI). The geographical distribution of frontal thunderstorms in the summer of 1951 is shown graphically for the region and discussed. Subject Headings: 1. Frontal thunderstorms 2. Synoptic studies 3. North- west Italy.—M.R.
5.1-148 551.515.8(267) Jalu, Raymond and Viaut, Andre\ La circulation generate dans le sud-Ouest de l'Ocean
Indien meridional. [The general circulation in the Southwest Indian Ocean.] Academic des Sciences, Paris, Comptes Rendus, 235(17):968-971, Oct. 27, 1952. DWB—Polar fronts in the Antarctic part of the West Indian Ocean (near Kerguelen) are similar in structure to the Arctic polar fronts but of shorter period (18 to 36 h) and of more rapid eastward displacement (60 to 80 km/h) even in summer. Very rapid changes take place in the strong cyclogenetic region around the Crozet Islands. Effects of meridional circulation, of convergence of ocean currents and of the preferred path for outbreaks of Antarctic continental air near the coast of Enderby Land are discussed. Most formations in summer of 1949-50 were simple cold fronts with open waim sector; no evidence of occlusions or of N-S oriented cold fronts was found. Effects on subtropics noted. Subject Headings: 1. Atmospheric circulation 2. Ant- arctic fronts 3. Cyclogenesis 4. Southwest Indian Ocean 5. Kerguelen, Island.—M.R.
J
I
MMM4MNVMIM* MNMNNMI
I. CURRENT ABSTRACTS 35
5.1-149 551.515.8(52) Kinoshita, Masatoki, On the cold front over the neighborhood of Nagasaki (2nd and 3rd
report). Oceanography and Meteorology, Nagasaki, 5(1/2; 3/4):36-38; 67-69, June; Dec. 1951. 13 figs., 8 refs. In Japanese; English summaries p. 38; 69. DWB—The mechanism of the gust which accompanies cold fronts (and the warm air preceding them) on their passage over the Nagasaki area in winter is investigated. Land-sea temperature differences west of Kyushu, accentuated by the warm Tsushima ocean current, and orographic effects in northern Kyushu are suggested as primary factors in the development of gustiness. The analysis is completed by schematic diagrams and sample charts. Subject Headings: 1. Cold fronts 2. Orographic effects 3. Nagasaki, Japan.—G.T.
5.1-150 551.515.8(47) :551.577 Mishutin,' D. A., "Sukhie" atmosfernye fronty v iuzhnykh stepiakh Ukrainy. ["Dry"
atmospheric fronts in the southern steppes of the Ukraine.] Meteorologiia i Gidrologiia, No. 6:35-36, 1952. ref. DLC—The frequency of cases when the fronts passed over the territory without precipitation was statistically investigated. It was found that in about 45% of cases the movement of fronts (cold, warm and occluded) was not accompanied by precipita- tion. This phenomenon is more frequently observed during Aug. (up to 75% cases were precipitation free). The author suggested that increasing irrigation and water surfaces can create an impulse which will transform these "dry" fronts into normal ones. Subject Headings: 1. Frontal type precipitation 2. Southern Ukraine, U.S.S.R.— N.T.Z.
5.1-151 551.515.8(548) *Ramakrishnan, K. P. and Ganapathiraman, G. V. (Met. Office, Poona), Squalls in Madras. j
Indian Journal of Meteorology and Geophysics, 4(1) :103-104, Jan. 1953. table. MH-8H— An advance note on the results of studies of squalls at Madras based on anemograms for two sites (Madras Harbor and Nungambakkam Observatory). Squalls occur about 25 days a year and mostly in the season May-Nov. (maximum in July). Half are associated with j thunderstorms. Peak of diurnal frequency is I80O-210O local time in summer and 0900-1200 in Oct.-April. In summer most come from SW-NW and in winter from NE and E quadrants. Forty-five percent last over an hour. Frequency of maximum wind speed, pressure, tem- perature and humidity changes and movement of squall (direction and speed) and relationships between these elements are summarized. Subject Headings: 1. Squall frequencies 2. Madras, India.—M.R. j
5.1-152 551.515.8(52) | Shinohara, Takeji, On Japanese polar masses in winter. Tateno, Japan. Aerological
Observatory, Journal, 5(l):42-48, March 1951. 5 figs., 4 refs. DWB—Results of radiosonde observations and observations of upper air currents (1947-1950) were used to make synoptic analyses of cold fronts, "cold domes" and other phenomena within the cold air masses. Ascent curves, a vertical cross section and pressure maps in different heights are given. No results of special value are obtained. Subject Headings: I. Cold fronts 2. Japan.—^4.^4.
? 5.1-153 551.515.8:551.588.2(52) §Sugawara, Y., Uber die durch topographische Einflfisse entstandenen Diskontinuitkts-
I . linien. [On discontinuity lines of topographic origin.] Geophysical Magazine, Tokyo, 14(1):19—25, March 1946. 13 figs., 3 refs. DWB—A synoptic statistical study of frequency of frontal passages in Central Honshu, Japan (1935-9) and the influence of mountains, coast line and the Japanese Current. In Jan. at least 28 fronts pass on the average, whereas in June, July and Aug. only 3 or 4 pass each month. There seems to be a singularity in Oct. (fewer than in Sept.). The fronts are said to be produced when air masses or currents from Siberia, crossing the Japan Sea (warm source) strike :he mountain ranges of Central Honshu and split into two branches. One branch comes down to the Kwanto Plain from the NW and is cold in comparison to the other branch which circles around and comes in from the SW as a warm moist air mass. Subject Headings: 1. Topographic influences 2. Frontal frequencies 3. Synoptx studies 4. Central Honshu, Japan.—M.R.
V-• /
36 METEOROLOGICAL ABSTRACTS AND BIBLIOGRAPHY
5.1-154 551.515.1(261) Terebelski, Jan, Comments on some upper lows in the Azores-Newfoundland region.
Pub. by Trans World Airlines, Inc., Meteorology Dept., [1953?] 12 p. 3 figs., 5 refs. Mimeo. DWB—Discussion of synoptic conditions leading to the formation of upper lows in the North Atlantic based on schematic contour-isotherm maps of the 500 mb surface, consider- ing also typical features of the 300 mb surface. The main factor for the development of the upper low is the formation of a ridge across the central part of a deep trough over mid-Atlantic. Subject Headings: 1. Cold lows aioft 2. North Atlantic Ocean. I. Trans World Airlines, Inc., Meteorology Dept—A. A.
5.1-155 551.515.8:551.515.73 Watanabe, Tadashi and Ito, Y., On the displacement of a large scale air mass accom-
panied with a migratory anticyclone. Journal of Meteorological Research, Tokyo, 3(13) :449- 454, Nov. 1951. In Japanese; English summary p. (29). DWB—In this theoretical analysis of the combined movements of migratory anticyclones moving toward the east and correspond- ing air masses coming from the north, the authors arrived at several rules regarding the final direction of large air masses as a function of the speed of particles in that air mass and of the speed of the anticyclone. Schematic diagrams are presented to illustrate the movement of air masses through several days and at various heights from ground level to 5 km. Subject Headings: 1. Air mass movements 2. Anticyclone movements.—G.T.
5.1-156 . 551.515.8:551.510.52/3 Zubian, G. D., O planetarnol vysotnoi frontal'nol zone. [On the planetary upper-air
frontal zone.] Meteorologiia i Gidrologiia, No. 7:10-16, 1952. 3 figs., 2 tables, 11 refs. DLC—The author notes that works published before by TABOROVSKII, POGOSIAN, BUGAEV, DZHORDZHIO and others, and the practice of synoptic analysis showed the great importance of planetary upper-air frontal zones in development of atmospheric processes. These zones are observed near the tropopause and are more developed during spring and fall, when the first zone in middle latitudes is located over the southern boundary of the polar basin, and the second over the boundary of the middle and subtropical latitudes. During summer synoptic charts usually show only one zone. Three latitudinal zones of the earth with different values of radiation balance cause the formation of these frontal zones. Synoptic situations for the Northern Hemisphere during May 1—4 and Sept. 11-14, 1949 are presented as examples proving the existence of two zones, and situations on May 26-29 and Feb. 1-2, 24-25, 1949 as examples showing the confluence of both zones into one. Subject Headings: 1. Frontal zones 2. Tropo- pause.—N.TZ.
RADIATION AND TEMPERATURE
RADIATION
See also: Relationship: Radio-propagation disturbance, geomagnetic activity and solar noise (van Sabben), 5.1-118; Earth in radiation field of tun and universe (Hanle). 5.1-296.
5.1-157 551.521.14 Burt, Wayne V. (Johns Hopkins Univ., Baltimore), A note on the reflection of diffuse
radiation by the sea surface. American Geophysical Union, Transactions, 34(2): 199-200, April 1953. table, 7 refs., 3 eqs. MH-BH—A re-examination of average albedo of a sea surface computed theoretically by SCHMIDT (1915) and comparison of SCHMIDT'S value of 17% with JUDD'S theoretical value of 6.6% and measured values obtained by various investigators (including the author) reveals that a lower value should be used for sea surface albedo than the one which persistently appears in the literature. Subject Heading: 1. Albedo of sea sur- faces.—G.T.
5.1-158 551.521.4:551.593.55:551.510.534 Hulburt, E. O. (Naval Res. Lab., Wash., D. C), Explanation of the brightness and color
of the sky, particularly the twilight sky. Optical Society of America, Journal, 43(2) :113-118, Feb. 1953. 7 figs., 2 tables, refs., 17 eqs. DWB—By use of the Rayleigh scattering theory
1
\
I. CURRENT ABSTRACTS 37
for pure air, primary scattering and known upper air densities from rockets, the brightness of the zenith twilight sky was calculated and values were obtained two to four times greater than those observed at Sacramento Peak, New Mexico (/. Opt. Soc. Am., 42, 353, 1952). The attenuation of the atmosphere was observed to be twenty percent above that of the Rayleigh theory, and the ozone thickness was measured to be about 2.2 mm. When the absorption of the Chappuis band of ozone in the visible spectrum was added to the Rayleigh theory, the calculated sky brightness came into agreement with observation for solar depression angles below the horizon from about 0° to 6°. For the sun below 7° the calculated zenith sky brightness fell rapidly below the observed brightness, showing that primary scattering in the atmosphere about 60 km does not contribute appreciably to the brightness, as has long been known (/. Opt. Soc. Am. 28, 227, 1938). Calculation showed that during the day the clear sky is blue according to RAYLEIGH, and that ozone has little effect on the color of the daylight sky. But near sunset and throughout twilight ozone affects the sky color profoundly. For example, in the presence of ozone the zenith sky is blue at sunset and throughout twilight (as is observed), the blue at sunset being due about | to Rayleigh and | to ozone, and during twilight wholly to ozone. Subject Headings: 1. Light of the night sky 2. Twilight phenomena 3. Ozone layer.—A uthor's abstract.
5.1-159 551.521.4:551.521.64 Jelley, J. V. and Galbraith, VV., Light pulses from the night sky. Philosophical Magazine,
7th Ser., 44(353) :619-622, June 1953. 2 figs., 2 refs. DWB—Describes work on light flashes in clear weather, detected by a photomultiplier at the focus of a concave mirror. These are associated with cosmic rays and ascribed to radiation produced by them. The frequency increases exponentially with height of origin in the atmosphere. Subject Headings: 1. Light of the night sky 2. Cosmic radiation.—C.E.P.B.
5.1-160 551.521.4 Karimov, M. G., Effektivnaia vysota svecheniia nochnogo neba dlia trekh spektral'nykh
luchel. [Effective height for night sky brightness for three spectral rays.3 AstronomickeskH Zhurnal, Moscow, 19(4):472-475, July/Aug. 1952. 2 tables, 3 refs. DLC—Report on experimental work using V. G. FESENKOV'S calculation method. Brightness of sky as a function of effective height was computed by following equation :
(l+h)(p+x)—' / = /„ V(l+fe)*-sin'2'
where I is brightness of emission layer for zenith, p—coefficient of transparency, *—factor of diffusion light influence. The observations (Dec. 1950-Jan. 1951) showed that the brightness of red and green lines of the spectrum is associated with heights from 200 km up to 320 km and probably is formed in the F layer. At the same time the height of yellow line by the observations of twilight was established as 65 to 130 km. Subject Headings: 1. Night sky brightness heights 2. Night sky spectrum.—N.TZ.
5.1-161 551.521.4 fKhvostikov, I. A., Liuminestsentsiia atmosfery. [Luminescence of the atmosphere.]
Uspekhi Fizicheskikh Nauk, Moscow, 36(3):372-386, Nov. 1948. 4 figs., 16 refs., eq. DLC— A brief history of scientific study of atmospheric luminescence, beginning, of course, with LOMONOSOV (1750) and his interest in the aurora borealis, and continuing down to the discovery of the aurora australis, the light of the night sky (1919) twilight luminescence (1936) and artificial excitation of fluorescence in the atmosphere (1947). Separate sections of this care- fully prepared review article take up the night and twilight luminescence; the sodium lumi- nescence in the tropopause; nature of the light of the night sky (120-250 km height) and photoluminescence measurements and theory. In addition to the author's work, that of EI-VERY and FARNSWORTH (1942) is discussed. Subject Headings: 1. Light of the night sky 2. Photoluminescence 3. Sky light spectroscopy studies.—M.R.
5.1-162 551.521.4 Krasovskii, V. I., Novye izlucheniia nochnogo neba na uchastke 8000-11,000 A. [New
radiation of the night sky in a zone of 8000-11,000 A.] Akademiia Nauk, SSSR, Krymskaia
38 METEOROLOGICAL ABSTRACTS AND BIBLIOGRAPHY
Astrofizicheskaia Observatoriia, Izvestiia, 5:100-104, 1950. 3 figs., 5 refs. DLC—A three- prism spectrograph with linear dispersion of about 1200-2400 Aon 1 mm was constructed for observations during 1950. These observations led to the discovery of six new lines of emission with wave length of 8870, 9391, 9976, 10,217, 10,374 and 10,827 A. It was found that heavy emissions of night sky are present for many sections inside this range. Subject Heading: 1. Night sky spectrum.—N.T.Z.
5.1-163 551.521.4 Roach, F. E., Williams, D. R. and Pettit, Helen B. (U. S. Naval Ord. Test Station, Pasadena ,
and China Lake, Cal.), The diurnal variation of [OIJ5577 in the nightglow; geographical studies. Journal of Geophysical Research, 58(1) :73-82, March 1953. 3 figs., 3 tables, 21 refs. ^ Comments by Vassy, A. and Vassy, E., entitled "Lueur nocturne et activity aurorale" (Night- glow and auroral activity) ibid., 58(2) :283-284, June 1953. In French. DLC—In the re- gion from N latitudes 36° to 44° the nightglow radiation [OI] 5577 has been reported to undergo a diurnal change in intensity, resulting on the average in an intensity maximum approximately one hour after midnight. The amplitude of the maximum is such that it is 1.3 times the mean intensity for the entire night. Marked departures from this average variation are noted on individual nights. Two simultaneous sets of observations at Cactus Peak in California and at the Haute Provence Observatory in France are studied in order to compare the diurnal variation at stations with a large difference of longitude. It is found that the variations have similar patterns in general but with significant differences in detail. On two occasions ap- proximate triangulations on emission maxima yield a height of 180 km. Attention is called to a similarity between the diurnal variation of the nightglow 5577 at low latitudes and of the polar aurora at high latitudes. Subject Headings: 1. Light of the night sky 2. Spectral line 5577 A 3. Haute Provence Observatory, France 4. Cactus Peak, Calif. I. Vassy, A. ; n. Vassy, E.—Authors' abstract.
5.1-164 551.521.4 I Roach, F. E.; Williams, D. R. and Pettit, Helen (U. S. Naval Ord. Test Station, China j
Lake, Calif.), Diurnal variation of [01]5577 in the nightglow. Astrophysical Journal, Chicago, 117(3):456-459, May 1953. 4 figs., 2 tables. DLC—Measurements of intensity of 5577 made at Cactus Peak (Calif.) during two nights (Jan. 1951, Nov. 1952) are reported and discussed. Isophote maps for each hour and variation diagrams are presented. Attention is called to an apparent motion of the localized maximum which is east-to-west before, and j west-to-east after the maximum intensity is reached. During the maximum the motion stops. These observations were made by the U. S. Naval Ordnance Test Station, China Lake, Calif. (For earlier paper on the subject see 4.4-136, April 1953, MAB.) Subject Headings: 1. Light of the night sky 2. Spectral line 5577 A 3. Cactus Peak, Calif.—G. T. *
5.1-165 551.521.61:551.511 tElsasser, Walter M. and King, J. I., Principles of radiative transfer in far infrared at-
mospheric bands. Utah. University. Dept. of Physics, Contract AF 19(122)-392, Tech- nical Report, No. 6, Sept. 30, 1952. 105 p. 10 figs., 30 refs., eqs. DWB—A comprehensive review of the present knowledge of radiative properties of the atmosphere and radiative transfer. The history of investigations of radiative balance and measurement of the elements thereof are summarized. Applications such as to the problem of the ice ages, the formation i of the stratosphere and of frost and fog forecasting are also mentioned briefly. The main . j part of the report consists of a detailed exposition of the theory (hat governs the infrared . radiative processes in the atmosphere (absorption of sunlight in near infrared and transfer in the far infrared). Not only the mathematical and physical data but some sample models are presented. Subject Headings: 1. Radiative transfer 2. Infrared radiation 3. Atmospheric structure. I. Utah. University. Dept of Physics II. Contract AF 19(122)-392.—Jlf./c.
5.1-166 551.521.63:535.24 Barbier, Daniel, Etude photometrique de la region ultraviolette de la lumiere du ciel
nocturne. [Photometric study of the ultraviolet region of nightglow.] Annales d'Astro- physique, 16(2):96-128, 1953. 16 figs., 5 tables, 14 refs. DWB—An automatic photometer,
L.
I. CURRENT ABSTRACTS 39
and its filter, installed at the Haute-Provence Observatory are described. Measurements of UV radiation made with the instrument (Sept. 1951-Aug. 1952) at zenithal distances 75° and 45° are analyzed in detail. Atmospheric diffusion and extinction are considered. The altitude of emission is found to be 200 ±50 km. Diurnal and annual variations of intensity show definite resemblance to those of green light. Localized emission observed on three occasions is attributed to auroras too weak for direct observation. Subject Headings: 1. Pho- tometry 2. Ultraviolet variations 3. Light of the night sky 4. Haute-Provence Observatory, France.—G.T.
5.1-167 551.521.64 Messel, H. and Green, H. S. (Univ. of Adelaide, S. Australia), The angular and lateral
distribution for the nucleon component of the cosmic radiation. Physical Review, 2nd Ser., 87(5) :738-747, Sept. 1, 1952. 25 refs., table, 85 eqs. DLC—A method, generally applicable in reconstructing the distribution functions when only the moments are known, is developed and demonstrated. Various initial conditions are found, and numerical results of an integral primary proton low spectrum with exponent F=I.l is presented. Variation of atmospheric density with height is considered. Subject Heading: 1. Cosmic radiation.—W.N.
5.1-168 551.521.64(98) The Navy hunts cosmic rays. Popular Mechanics Magazine, Chicago, 99(3).-103-105,
266, 268, 270, March 1953. photos, illus. (in color) incl. cover. DWB—Popular account of U.S.N. "Eastwind's" polar expedition. Purpose of the trip was the measurement of cosmic rays by balloon-borne equipment and by Deacon rockets carried up to a considerable height by balloons and automatically launched from there. Data obtained are discussed in general terms. Subject Headings: I. Cosmic ray measurement 2. Arctic expeditions.—G.T.
AIR TEMPERATURES
See also: Air temp., Tokyo (Kato), 5.1-38; Temp, at Geneva, 1836-1855 (Plantamour), 5.1-40; Winter temp., Toronto (Thomas), 5.1-43; Mean temp, of atmos. ozone (Vassy, Vassy), 5.1-112; Existence of polar front at 500 mb (Bradbury, PalmSn), 5.1-146; Influence of etesitn winds on summer temp., Athens (Karapiperis). 5.1-201; Influence of sea on temp. (Arnaud), 5.1-292.
5.1-169 551.524.2(471.1) •Keranen, J., Temperaturkarten von Finnland fur den Zeitraum 1901-1930. [Temperature
charts for Finland, 1901-1930.] Finland. Ilmatieteelinen Keskuslaito, Toimituksia, No. 36, 1952. 19 charts. DWB—Isothermal charts of mean temperature are presented for Finland for each month and for the year for intervals of 1°C. Also the dates of beginning and end of winter and of summer (mean temperatures < and >0°C, and 10CC resp.) and of the growing season (> and <5°C) based in means for 1901-30. A previous set of charts had been pub- lished in 1925 for 1891-1920 by the author. Subject Headings: 1. Isothermal charts 2. Finland 3. Temperature charts.—M.R.
5.1-170 551.524.31 Jaeger, J. C. {Canberra, Australia) and Johnson, C. H. (Hobart, Tasmania), Note on
diurnal temperature variation. Geofisica Pura e Applicata, 24:104-106, Jan./April 1953. fig., 3' refs., 6 eqs. MH-BH—BRUNT'S formula for diurnal variation of surface temperature at equinox is extended to allow calculations for any time of sunrise or sunset. Curves show theoretical variation for sunset at 4, 6 and 8 p.m., respectively, giving the time of maximum as 1.9, 2.4 and 2.9 hours after noon instead of smaller values as calculated by BRUNT or JAMES' formulas. Heat transfer to the air is neglected, however, so empirical results may vary considerably from theoretical. Subject Headings: 1. Diurnal temperature variations 2. Brunt's formula.—M.R.
5.1-171 551.524.32:551.508.71 Heckert, Lothar, Die Bedeutung kurzfristiger Temperaturschwankungen fur die (iblichen
Temperatur- und Feuchtemessungen mit dem Aspirations-Psychrometer nach Assmann.
V^
V
40 METEOROLOGICAL ABSTRACTS AND BIBLIOGRAPHY
[The significance of short period temperature variations for the usual temperature and hu- midity measurements with Assmann's aspiration psychrometer.] Zeitschrift fiir Meteorologie, 7(1):19—23, Jan. 1953. 3 figs., 4 refs. MH-BH—Assmann's psychrometer is too sensitive for macrometeorological observations where short period temperature and moisture fluctua- tions must be eliminated. From this point of view, thermo- and hygrographs give better results. Author uses a special test box for an occasional calibration of these recording in- struments with the Assmann psychrometer. Subject Headings: 1. Temperature measurement 2. Assmann's aspiration psychrometer.— A..4.
5.1-172 551.524.32(52) *Ogawara, M. and Yamazaki, H., Singularities in the annual variation of temperature in < '
Japan. Meteorological Society of Japan, Journal, 31(3).-95-116, March 1953. 11 figs., 12 tables, 21 refs. MH-BH—A detailed statistical study of the temperature minima of April j 5-6 and April 22-23 over Japan. The longest temperature records used are those for Fukuoka (1890-1945), Tokyo (1875-1949) and Abashiri (1890-1945). Correlation with pressure and circulation characteristics is investigated. It is found that the two singularities (unrelated j to each other) can be directly derived from the typical circulation pattern prevailing in the Far East. Subject Headings: 1. Temperature singularities 2. Statistical studies 3. Japan.— i G.T.
5.1-173 551.524.33(82) .-551.501.45 * *Dedebant, Georges and Machado, Emilio A. M., Calcuio del promedio mensual de
temperatura en base a las tridiurnas. [Calculation of the monthly mean temperature based on the average of thrice daily synoptic observations.] Meieoros, Buenos Aires, 2(3/4):190- 203, July/Dec. 1952. 2 figs., tables, 2 refs., eqs. English summary, p. 190. DWB—An ; elaborate set of statistical tests was made for determining the accuracy of mean monthly tern- J peratures for the various months of the year from thrice-daily observations compared to those calculated from hourly, two-hourly, 6-, 12-, 18-, 20- and 24-hourly observations. The cus- tomary synoptic 8-hourly observations are shown to present a singularity, the variation of which (from the "true" mean) is shown in extensive tables for the various months from 1939- , 1948, based on data for the Central Meteorological Observatory, Buenos Aires, Argentina. Formulas are proposed for calculating the mean monthly temperature during each month from thrice-daily (8, 14 and 20 h) synoptic observations at Buenos Aires. Subject Headings: 1. Temperature calculations 2. Statistical techniques 3. Synoptic temperature observations ] 4. Buenos Aires, Argentina.—M.R.
i
5.1-174 551.524.34(777) 551.577.34(777) Barger, Gerald L. (Iowa State College, Ames), Iowa weather, 1953. Iowa Farm Science,
Ames, Iowa, 7(7):13-14, Jan. 1953. 2 charts. DWB—A "forecast" based on probabilities that rainfall will be within certain limits in various sections of Iowa, or that temperatures will be in certain ranges at various times of the year, is presented in the usual graphic form on maps of Iowa. Corrections to adjust the normals for central Iowa to other parts of the state are indicated on the appropriate portion of the map. This approach assumes no change in I normals in the future, and it is emphasized that this is not a forecast in the usual sense of the word. Subject Headings: 1. Temperature probability 2. Precipitation probability 3. Iowa. —M.R.
5.1-175 551.524.34(52) •Ozawa, T. and Fujita, T. (Met. Res. Insl., Japan), Climatic change in the Tohoku District
(I, H, LTI). Meteorological Society of Japan, Journal, 2nd Ser., 30(5,6) :166-182, 190-202; 31(3):77-94, May, June 1952; March 1953. 11 figs., 5 tables, 5 refs., eqs. In Japanese; * English summaries p. 166, 190, 77. DWB—In Chap. 1 of this extensive study, secular varia- tions in summer temperature and in the occurrence of droughts in Tohoku District are analyzed j and several periodicities established. Data on which the analysis is based include records of bad harvests for the period 1610-1949. In Chap. 2 it is found that mean Aug. temperature ' in Miyako corresponds with that in the entire Tohoku District. A periodogram and cor- » relogram analysis is applied to mean Aug. temperature series based on observation records
I. CURRENT ABSTRACTS 41
for the period 1883-1949. In Chap. 3 the stochastic analysis of mean Aug. temperature at Miyako is undertaken on the basis of six components (secular trend, three harmonics and two fluctuations with two cyclic periodicities). Chap. 4 deals with the correlation between Aug. temperature anomalies and other synoptic elements. Close correlation is found between temperature anomalies and upper westerly currents (at Tateno) as well as Aug. typhoons. A correlation is also established between WOLF'S sunspot numbers and subsequent temperature series. In Chap. 5 the correlogram and periodogram analysis is applied to monthly tem- peratures at Miyako and to fluctuations of Aug. mean temperature and pressure at various stations in the Far East. Subject Headings: 1. Temperature variations 2. Temperature periodicities 3. Temperature anomalies 4. Long period records 5. Tohoku District, Japan.—G.T.
5.1-176 551.524.35(73) Ludlum, David M. (erf.), A mild winter across the nation. Weatherwise, 6(2):54-56,
April 1953. MH-BH—The winter (Dec.-Feb.) of 1952-53 was one of the warmest in history for the entire U.S.A. Although 1931-32 and 1933-34 were warm in parts of the country not since 1920-21 has it been so warm throughout the country. Europe had a continental type of winter, and a large HIGH over Siberia poured cold air southward in all directions. Over the U.S.A. the flow was strong from the WSW, precluding many outbreaks of arctic air. The Florida peninsula was the only portion below normal for the 3-month period. In Montana the anomaly was +16° to +20°F in Jan. and the Great Lakes were freer from ice than at any time on record. Record rainfall occurred in the Pacific Northwest (200% of normal in Jan.) as the moist westerlies piled up against the Coast Ranges. Snow was generally deficient. Subject Headings: 1. Mild winters 2. Temperature anomalies 3. United States.—M.R.
5.1-177 551.524.36(45) *Campa, Maria, Deduzione matematica della temperature estreme a Milano (Brera) da
111 anni di osservazione (1838-1948). [Mathematical deductions of extreme temperature at Milan (Brera), based on 111 years of observation, 1838-1948.] Italy. Ujjicio Idrografico del Po, Parma, Publicazione, No. 11, v. 7, 1952. 21 p. 2 figs., 4 tables. Milan. Osservatorio Astronomico de Milano-Merate, Publicazioni, N.S., No. 6. DWB—The mean maximum and minimum temperatures for each of the 73 pentades of the year are developed in a harmonic series with 5 waves. The synoptic curve is computed and the differences between observed mean and calculated values are shown. "Normal" extreme temperatures are given for each day of the year. Another table presents the extreme observed temperatures for each year. Subject Headings: I. Temperature data 2. Statistics in climatology 3. Temperature extremes 4. Long period records 5. Milan, Italy. I. Milan. Osservatorio de Brera.—A.A.
5.1-178 551.524.36:551.584.31 Davies, J. L., Some effects of aspect upon valley temperatures in South Cardiganshire.
Geography, Sheffield, 37(l):19-23, 1952. 2 figs., tables, 8 refs. DLC—Comparison of tem- peratures at a hill-top (600 ft) and two valley stations (one at 150 ft facing SSW and one at 340 ft facing ESE). Maxima highest by 2-3°F in valley facing south, minima lowest in valley facing E. Subject Headings: 1. Topographic effects 2. Temperature extremes 3. Cardigan- shire, Wales.—C.E.P.B.
5.1-179 551.524.36:551.515.8(79) \ •Hughes, Grover D. and Ross, Robert B. (U. S. W.B.), Low minimum temperatures of
June 12-13, in the far west. Monthly Weather Review, 80(6):105-109, June 1952. 12 figs., table, 4 refs. DWB—On June 10, 1952 a low pressure system appearing as a closed circulation centered at the 700 mb level off the British Columbia coast combined with an old cut-off low moving inland from off the California coast, forming a major low pressure trough. The circulation preceding this situation and subsequent developments with record values of low surface and upper air temperature are described and illustrated by means of surface and upper air charts. Minimum temperature data for June 12 and 13, 1952 are tabulated for 25 locations in four western states and compared with previous June minimum temperature records. Subject Headings: 1. Minimum temperatures 2. Synoptic studies 3. Temperature extremes 4. Western United States,—G.T.
42 METEOROLOGICAL ABSTRACTS AND BIBLIOGRAPHY
5.1-180 551.524.37:551.575.5 Gold E., Unusual temperatures recorded during fog. Meteorological Magazine, London,
82(974):246-247, Aug. 1953. table, 3 refs. MH-BH—March .1, 1953, near London, screen temperature 28$ °F, fog, dew on ground, no frost. A surface temperature 3CF above screen temperature during shallow dense fog may be caused by radiation from fog surface. Subject Headings: 1. Frost 2. Fog 3. Temperature anomalies 4. London, England.—C.E.P.B.
SOIL TEMPERATURES 5.1-181 551.525.4:58(774)
*Crabb, George A., Jr. and Smith, James L., Soil-temperature comparisons under varying covers. National Research Council, Wash., D. C. Highway Research Board, Bulletin, 71:32- 80, 1953. 5 figs., numerous tables, 14 refs. Discussion by Carl B. Crawford, p. 48-49. 7 refs. Abstracted from reprint.—Tables and graphs of soil temperature to a depth of 60 in. and corresponding average air temperatures are presented for soil under forest cover, small grain and meadow giving daily values for 1947-1951. The data are based on measurements made at the Michigan Hydrologic Research Station near East Lansing during the period 1947-1951. Soil properties and climatic conditions are discussed. Total precipitation and insolation are indicated. The seasonal variation of response of soil temperature to air tem- perature is analyzed. Subject Headings: 1. Soil temperature variations 2. Vegetation in- fluences 3. East Lansing, Mich. I. Crawford, Carl B.—G. T.
5.1-182 551.525.4:536.2 Kaganov, M. A. and CHudnovskii, A. F., Ob opredelenii koeffitsienta temperaturo-
provodnosti pochvy. [Determination of the coefficient of temperature conductivity of soil.] Akademiia Nauk, S.S.S.R., Izvestiia, Ser. Geofizicheskaia, No. 2:183-190, 1953. 3 tables, 10 refs., 23 eqs. DLC—Methods for determining the coefficient of heat conductivity of the soil based upon the fact that it has a periodic character are surveyed. The coefficient of heat conductivity is determined by measuring soil temperatures at two depths for the diurnal, semiannual or annual periods. Equations for calculating the coefficient of heat conductivity in homogeneous and nonhomogeneous soil and examples of the calculation of this coefficient are given. Subject Headings: 1. Soil temperatures 2. Heat conductivity of soil 3. Heat conductivity coefficient.—I.L.D.
5.1-183 551.525.4:551.578.46 De Backer, Simon, Temperature superflcielle du sol sous le gazon recouvert de neige,
hiver 1950-1951 & Uccle. [Surface temperature of the soil under grass covered with snow during the winter 1950-51 at Uccle.] Belgium. Institut Royal Metcorologique, Memoires, v. 51, 1952. 8 p. 3 figs., table. DWB—Daily soil temperatures (Nov. 30, 1950-Jan. 8, 1951) at depths of 5, 20 and 100 cm were measured by means of copper-constantan thermo- couple; and air temperature was measured at 1.50 cm. A table gives these values together with mean surface temperature of the soil at 1200 hr, maximum and minimum temperatures between 0 and 2400 hr, maximum and minimum air temperature between 0 and 2400 hr, thickness of snow cover, wind direction and velocity and source of water received in the rain gage and a graphic representation of these data together with methods of correlation and the course of mean surface soil temperature from Nov. 18 to Jan. 9, 1951 are given. The coefficient of thermal diffusion of the snow is calculated 1) by the relationship between amplitudes and 2) by the displacement of sinusoidal waves and s. close agreement is found: fc=».0012 and .0010, respectively. The protective action of snow cover upon vegetation with reference to temperature, humidity and aeration are discussed. Subject Headings: 1. Soil temperatures 2. Snow cover effects.—I.L.D.
SEA TEMPERATURES 5.1-184 551.526:551.46
'Whaley, H. H. and Hopkins, T. C, Atlas of the salinity and temperature distribution of Chesapeake Bay, 1949-1951. Johns Hopkins University. Chesapeake Bay Institute, Contract Nonr 248 (2), Graphical summary report, No. 1, March 1952. unpaged. Mostly
1 »
I. CURRENT ABSTRACTS 43
graphs and diagrams. DWB—Atlas presents for each of eight cruises (1 winter, 2 spring, 3 summer, 2 fall) horizontal distribution charts of salinity and temperature at the 0, 10, 20, 30, 40 and 60 ft levels, vertical salinity and temperature cross sections and one vertical section summing up the main channel. Salinity cross sections show the usual picture of a downward stream in the upper layers and an upward stream with higher salinity in the lower layer. More interesting is the horizontal displacement of these streams indicating in all cases a cy- clonic circulation on the salinity charts and cross sections. Subject Headings: 1. Water tem- perature distribution 2. Salinity distribution 3. Chesapeake Bay, Md. I. Johns Hopkins University. Chesapeake Bay Institute. II. Contract Nonr 248 (2).—A.A.
5.1-185 551.526.6(261) Bdhnecke, Gunther and Dietrich, Giinter, Monatskarten der Oberflsxhentemperatur
fur die Nord- und Ostsee und die angrenzenden Gewttsser. [Monthly charts of surface water temperature for the North- and Baltic Sea and the surrounding seas.] Hamburg, Deutsches Hydrographisches Institut, 1951. 1 p. text, 3 tables, 13 maps. DWB—Area covered besides the North and Baltic Seas: English Channel, Irish Sea, North Atlantic from 55 to 66°N up to 10°W. Data reduced to the period 1906-1938. (For paper on the reduction method used see item 2.6-75, June 1951, MAB.) Distance of isotherms 0.5°C. Data (over 3 million single values) are based on ship observations, combined in 1-degree fields and on observations on light ships and at coastal stations. Number of observations for Aug. and Feb. presented on map. Monthly and annual means for fixed observational points presented in table 3. Data from ship observations are carefully corrected according to DIETRICH (see item 2.6-75, June 1951, MAB). Annual distribution of temperature is given in another paper (Deutsche Hydrographie Zeitschri/t, 4, 1951). General warming (=1°C) observed since 1930. The maps give also the ice probability 50-100% and the maximum ice distribution in the years 1920-1950. Subject Headings: 1. Sea surface temperatures 2. Marine atlases 3. Sea ice distribution 4. No-th Sea 5. Baltic Sea 6. North Atlantic.—A .A.
5.1-186 551.526.8 *Millar, Frederick Graham (Canada, Met. Div.), Surface temperatures of the Great Lakes.
Canada. Fisheries Research Board, Journal, 9(7):329-376, 1952. 27 figs., refs. Abstracted from reprint. DWB—Comprehensive study based on thermograph data for 5 to 10 years. Instruments were installed on the condenser intakes of steamships. Author presents a chart of currents, analyzes the annual variation of temperature for each lake, presenting time cross- sections for the steamer routes. First attempt made to draw isotherms for each month. Standard deviations and autocorrelations computed in order to characterize the persistence of lake temperatures. Subject Headings: 1. Lake temperatures 2. Isothermal charts 3. Great Lakes.—.4. .4.
PRESSURE AND WIND
PRESSURE
See also: Atmos. circulation, S. Africa (Jackson), 5.1-134; Wind computation from pres- sure data (Neiburger and others), 5.1-207; Sound velocity in air at low pressures (Caro, Martin), 5.1-313.
5.1-187 551.542:551.588.2 551.515(52) .-551.588.2 Suzuki, Seitaro (Centr. Met. Obs., Tokyo), Orographic influence on atmospheric pressures
and currents. (V). Meteorological Society of Japan, Journal, 30(10) :305-312, Oct. 1952. 22 figs., 9 refs. MH-BH—The author presents surface and upper air charts superimposed on orographic maps to show the close relationship between orography and pressure and circulation pattern. Static and dynamic theories accounting for this relationship are discussed. The paper includes examples of orographic effects on typhoons. Subject Headings: 1. Orographic effects 2. Pressure patterns 3. Circulation patterns 4. Typhoons 5. Japan.—G.T.
5.1-188 551.543:525.6(02) 551.510.535(02) Defant, Albert, Ebbe und Flut des Meeres, der Atmosphere und der Erdfeste. [Ebb
and flow of the oceans, the atmosphere and the solid earth.] Berlin, Springer-Verlag, 1953.
44 METEOROLOGICAL ABSTRACTS AND BIBLIOGRAPHY
119 p. 64 figs., 8 tables. Verstdndliche Wissenschaft, [No.] 49. GB-MO—This little book deals in a popular way with the observation, theory and prediction of oceanic and coastal tides, oscillations and seiches of inland waters, internal tides, atmospheric oscillations, tides in the ionosphere, and in the solid earth. Subject Headings: 1. Tides 2. Atmospheric tides 3. Ionospheric tides 4. Textbooks.—C.E.P.B.
5.1-189 5S1.543 Lewis, L. F., Exceptionally high mean pressure over the British Isles. Meteorological
Magazine, London, 82(974) :250-251, Aug. 1953. 2 figs. MH-BH—Maps of monthly mean pressure, March 1929 and March 1953, closely similar, both showing anticyclone centered over S. England. Subject Headings: 1. Pressure variations 2. British Isles.—C.E.P.B.
5.1-190 551.543.1(825.1) Georgii, Walter, Regulaci6n del tiempo por la doble onda diaria de la preaion atmosferica,
en Mendoza. fJWeather changes in Mendoza due to the semidiurnal atmospheric pressure.] Meleoros, Buenos Aires, 2(3/4): 182-189, July/Dec. 1952. 5 figs. English summary p. 182. DWB—Examples of records of pressure, temperature and humidity and of thunderstorm activity in the province of Mendoza (1951) are cited and illustrated to support the author's theory of the formation of lee thunderstorms (in series moving from the Andes toward the east with the upper current against the westward moving surface easterlies). The marked semidiurnal pressure wave results in a temporary strengthening of the westerlies in the early morning and afternoon (minimum pressure) and strengthening the easterlies in the noon and midnight hours (maximum pressure). The wind changes also produce temperature changes and have a relation to the strength of the Zonda. A model of the complex circulation resulting in the heavy rainstorms of Dec. 1951 is shown cross sectionally. Subject Headings: 1. Semi- diurnal pressure waves 2. Lee waves 3. Zonda 4. Mendoza, Argentina.—M.R.
I
TURBULENCE
See also: Internatl. Symposium on Atmos. Pollution (Hewson), 5.1-5; Gust speeds, Canada (Thomas), 5.1-42; Wind studies on shielded snow gages (Warnich), 5.1-66; Ion concentration variations (Norinder, Siksna), 5.1-305.
5.1-191 551.551:629.315 Frederickson, Paul S., Effect of encountering a wind shift during a turn. Trans World
Airlines, Inc., System Operations Bulletin, No. 52-5, March 3, 1952. 3 p. diagr. Mimeo. DWB—A study of the flight path of a United Airlines Douglas DC-3 which crashed near the runway at Fort Wayne, Ind. on April 28, 1951 at 1931 CST, and of meteorological condi- tions during a violent frontal squall which was responsible for the accident, shows that it is safer to make a right turn than a left turn when entering such a squall, and even safer to enter the squall line at right angles to the wind shift line since this involves the shortest flight path through the downdraft zone. The plane in question evidently was carried by the squall (with gusts up to 80 mph) for 2 or 3 mi. Another flight made the same flight path without accident but being a few seconds earlier was not caught by the approaching squall. Subject Headings: 1. Aircraft accidents 2. Line squalls.—M.R.
5.1-192 551.551:551.556.2 "lizuka, Hajime, Research on the correlation between the turbulence intensity and the
wind velocity on the leeward of windbreak as one method to judge the function of windbreak. Tokyo, Japan. Forest Experiment Station, Bulletin, No. 56:225-231, Dec. 1952. 5 figs., 5 tables. In Japanese. DWB—A brief article with correlations shown graphically and in tables. Subject Headings: 1. Turbulence intensity correlations 2. Windbreak effectiveness 3. Turbulence behind trees.—M.R.
... /
5.1-193 551.551:551.510.42:628.53 Ogura, Y. (Geophys. Inst., Tokyo Univ.), The theory of turbulent diffusion in the atmos-
phere, m. (The theoretical distribution of airborne pollution from tall stacks.) Meteoro-
^=d

1
\ •
I. CURRENT ABSTRACTS 45
logical Society of Japan, Journal, 30(12) =386-397, Dec. 1952. 8 figs., 14 refs., 6 eqs. MH-BH —The author's theory of isotropic turbulent diffusion developed in Pts. I. and II. of this paper (see items 4B-276 and 4B-316, Feb. 1953, MAB) is applied to the case of elevated continuous point sources of atmospheric pollution. Results of the theoretical analysis are compared with similar results of other authors and with observed data. The application of the formulas is illustrated by a numerical example. Subject Headings: 1. Turbulence theory 2. Turbulent diffusion 3. Stack effluents.—G.T.
5.1-194 551.551 Robinson, G. D., Some examples of the energy spectrum of turbulence in the atmosphere
near the ground. Great Britain. Meteorological Research Committee, M.R.P., 808, May 11, 1953. lip. 4 figs., 5 tables, 6 refs. Mimeo. DWB—A number of hot wire records of air speed, 150 cm above ground at Kew Observatory, including large positive and negative tem- perature gradients, were analyzed by autocorrelation of readings at intervals of \ or J sec. The three components of turbulent motion were equal (isotropic turbulence) at frequencies of 3 cycles/sec to limit of observation at 8 c/sec, and energy varied as inverse square of fre- quency, in accord with Kolmogorov. Horizontal components were equal above 1.5 c/sec. The local rate of viscous dissipation appeared to balance the local rate of working of Reynolds stress. Subject Heading: 1. Turbulence spectrum.—C.E.P.B.
5.1-195 551.551:533.17 Sedov, L. I., K obshchel teorii odnomernykh dvizhenil gaza. [On the general theory
of one dimensional gas movements.] Akademiia Nauk, SSSR, Doklady, 85(4):723-726, Aug. 1, 1952. 2 refs., 4 eqs. DLC—The author analyzes the irregular movements of an ideal gas for the flat, cylindrical and spherical waves and suggests a system of equations for conditions of adiabatic movement of any gas and for cases of gas movement occurring inside a striking wave. Subject Headings: 1. Turbulent flow 2. Wave equations.—N.T.Z.
WIND
See also: Electrical properties of blizzards (Barre), 5.1-2; Vertical eddy flux of momentum in trade wind zone (Palmen), 5.1-127.
5.1-196 551.553.1/2 Bleibaum, Irma, Feststellung lokaler Windsysteme mit Hilfe von Beobachtungen
und Registrierungen der Windrichtungen. [Determination of local wind systems by ob- servations and records of wind directions.] Germany. Deutscher Wetterdienst in der US-Zone, Berichte, No. 42:204-208, 1952. 3 figs., table, 8 refs. DWB—From anemograph records at Wasserkuppe (923 m), Friedrichroda (450 m) and Brocken (1142 m) the diurnal variations of wind direction in mountain and valley winds are compared and a seasonal wind system between Alpine chain and foreland deduced. Subject Headings: 1. Diurnal wind variations 2. Alps—C.E.P.B.
5.1-197 551.553.21 Petterssen, Sverre (Univ. of Chicago), On the dynamics of the Indian monsoon. Indian
Academy of Science, Proceedings, Sec. A, Bangalore, 37 (2) :229-233, Feb. 1953. 6 eqs. DLC— The author deals theoretically with the problem of maintenance of the normal or steady summer monsoon circulation at low levels over India. He shows how it is a self-sustaining system, not being dependent on coupling with perturbations from neighboring regions, but being driven by local heat sources and modified or balanced by the frictional forces produced by the Western and Eastern Ghats, the Burma and Assam Mountains and the Himalayas. Some variations in the monsoon, however, may be due to cyclonic activity outside the area. The jet stream usually lies north of India so that relative and absolute vorticity decrease with elevation, The effect of friction is to decrease motion and it reduces or increases vorticity
L•
46 METEOROLOGICAL ABSTRACTS AND BIBLIOGRAPHY
as the motion is cyclonic or anticyclonic, respectively. Subject Headings: 1. Monsoon circulation theory 2. Vorticity 3. India.—M.R.
5.1-198 551.553.21 *Visser, S. W., Some remarks on the European monsoon. Geofisica Pura e Applicata,
24:135-148, Jan./April 1953. 7 figs., 5 tables, 13 refs. DWB—The frequency and strength of the monsoon (NE-E in May and S or SW in Nov.) which alternates with westerly type (cyclonic) circulation over the Netherlands and vicinity, are studied statistically using 42 years (1910-1951) record for Den Helder and Maastricht, and illustrated graphically. The author thinks that the singularities of FLOHN and HESS have no reality and are of little use in studying the monsoon regime of western Europe. He presents KHROMOV'S chart of the monsoon regions of the earth and cites KHROMOV'S definition which is used in the present study. Monthly means used in most wind roses do not show the monsoon as they combine the two types of circulation and hence smooth out the real factors. Ten-day periods are used and calculations are based on the product of the frequency of the direction by the speed (relative wind vector). Nov.-Dec. and May-June are the best months to show the monsoonal reversal of wind pattern, rather than the orthodox Jan. and July. Subject Headings: 1. European monsoons 2. Monsoon circulation 3. Wind frequency diagrams 4. Netherlands.—M.R.
5.1-199 551.554 551.557 Ogura, Yoshimitsu (Geoph. Inst., Tokyo Univ.), Note on the wind velocity profile in the
non-adiabatic atmosphere. Meteorological Society of Japan, Journal, 30(10):329-341, Oct. 1952. 4 figs., 11 refs., 5 eqs. MH-BH—An equation representing variations of wind with height is derived from a basic equation of the energy balance of turbulence. The theoretical results are compared with observational material. Similar equations suggested by other authors are reviewed. Subject Headings: 1. Wind profiles 2. Energy equations 3. Thermo- dynamics of the atmosphere.—G.T.
5.1-200 551.555 fTroll, Carl, Die Lokalwinde der Tropengebirge und ihr Einfluss auf Niederschlag und
Vegetation. Studien zur Vegetations- und Landschaftskunde der Tropen, III. [Local winds on the tropical mountains and their influence on precipitation and vegetation. Studies on vegetation and geography of the tropics, III.] Bonner Geographische Abhandlungen, Bonn, No. 9:124-182, 1952. 13 figs. (incl. 1 fig. in pocket), tables, 69 refs. DWB—The formation of local winds in the mountain chains that traverse South America and Africa from north to south, the effect these winds have upon precipitation and vegetation and the occurrence of drought pockets in valleys are discussed very thoroughly. The following topics are con- sidered: the diurnal climate of the tropics, the diurnal mountain winds including upslope wind, "compensating" winds and mountain and valley winds; the compensating winds of the central plateau—the Bolivian-Peruvian Altiplano; drought pockets and wind gaps of the Andean escapement of Northeast Bolivia; three-dimensional arrangement of the vegetation in the transverse valleys, wind gaps and drought pockets in southeast Bolivia, in the Peruvian Andes and in the equatorial Andes; the plateaus of east Africa between the Red Sea and the Cape of Good Hope; ascending rainfall in the Cape region, the eastern escapement of the south African plateau in Natal; the edge of the east African Plateau and the compensating winds between the Red Sea depression and the surrounding plateaus. Subject Headings: 1. Local winds 2. Wind effects 3 Precipitation 4. Vegetation 5. Tropical climatology 6. Topo- graphic effects.—I.L.D.
5.1-201 551.555.4:551.524.35 (495) Karapiperis, Leonidas N., Influence of the etesian winds on the summer temperature in
Athens. Meteorological Magazine, London, 82 (974) :238-239, Aug. 1953. fig., 6 refs. MH- BH—Mean summer temperature in Athens 1901-1950 runs closely parallel to frequency of
I. CURRENT ABSTRACTS 47
etesian days, but owing to dryness such days seem fresher than sea breeze days. Subject Headings: I. Etesian winds 2. Athens, Greece.—C.E.P.B.
WIND EFFECTS
See also: Correlation between turbulence intensity and wind velocity . . . (Iizuka), 5.1-192.
< 5.1-202 551.556:551.311.3 551.577.61:551.311.2 '/ 'Kiselev, A. N., Sviaz* mezhdu vodnol eroziei i defliatsiel pochvy. [Relation between
, water and wind erosion.] Pochvovedenie, Moscow, No. 9:840-850, Sept. 1952. 19 tables, 5 refs. DLC—Experimental research under carefully defined conditions. Size distribution of soil particles given before and after water erosion (5 ml water over 1 cm'/min, total amount of water 1 1) and deflation by wind (10 m. sec.-1 for 3 minutes and other combinations). Sub- ject Headings: 1. Soil erosion 2. Wind erosion 3. Experimental soil science.—A. A.
5.1-203 551.556:551.465 SHtokman, V. B., Primenenie metoda polnykh potokov dlia rascheta tsirkuliatsii, voz-
btizhdaemol neravnomernym vetrom v more ellipticheskoi formy. [Application of the method of total currents for calculation of circulation induced by irregular wind in the sea of elliptical form.] Akademiia Nauk, SSSR, Izvestiia, Ser. Geofizicheskaia, No. 5:57-68, 1952. 5 figs., 2 tables, 12 refs., 19 eqs. DLC—Solutions of differential equations given for the total resulting current in an inhomogeneous ocean dependent on the given distribution of the longitudinal wind forces on the surface of the ocean and knowing the coefficient of lateral exchange. Border conditions for the seashore are considered. A circular and a parallel wind distribution is discussed and the limiting cases of a circle and an "indefinitely long channel, limited in the indefinitness" is studi .d. Subject Headings: 1. Ocean currents 2. Ocean-atmosphere inter- action 3. Surface friction.—A .A.
5.1-204 551.556:551.465 von Arx, William S. (Woods Hole Oceanographic Inst.), A laboratory study of the wind-
driven ocean circulation. Tellus, 4(4) :311-318, Nov. 1952. 4 figs., 8 refs. MH-BH— A detailed description of the construction and operation of a rotating oceanographic model capable of simulating the ocean circulation is presented. It consists of a basin having the internal form of a paraboloid of revolution, and hence "provides a Coriolis parameter which varies with latitude and a free liquid surface which is accessible for the application of wind stress, heat, light and tracer materials." The limits on scale and degree of similarity and the limits on scale imposed by the diameter and focal length of the paraboloid are analyzed. In experiments carried out with this apparatus, the author has reproduced "westward intensifica- tion of the primary circulations in compartments shaped like the North Atlantic and North Pacific basins. Sargasso Sea-like features and several details have also appeared, which are qualitatively like contemporary views of the major motions of the sea." Subject Headings: 1. Wind driven currents 2. Oceanic circulation models.—I.L.D,
5.1-205 551.556.2 Iizuka, Hajime, On the width of windbreak. Tokyo, Japan. Forest Experiment Station,
Bulletin, No. 56:1-218, Dec. 1952. 139 figs., 27 plates, 57 tables, 28 refs. In Japanese; English summary p. 198-200. DWB—A most thorough empirical study of the effect of
,~ • different types of windbreaks on the wind conditions at different heights and distances behind ^ the trunks or crowns of the trees. Thickness of trunk has a greater effect in reducing wind ^ m speed to the lee, than does distance apart (of trees). Type of crown is also of prime importance. T Detailed measurements made with varying wind direction relative to line of trees, wind speeds, |p heights, distance from trees (to 8Xheight) and exposure (inland or on coast), and with lab- fr. oratory models in wind tunnels are given in tables and graphs and are discussed at length. |5 Windbreaks and equipment are shown in drawing and photographs. Turbulence considera- £." tions are paramount. Subject Headings: 1. Windbreak effectiveness 2. Turbulence behind F. trees 3. Micrometeorological wind profiles.—M.R.
V
48 METEOROLOGICAL ABSTRACTS AND BIBLIOGRAPHY
UPPER AIR WINDS
See also: Upper wind code (U. S. Weather Bureau), 5.1-82; Upper air circulation in low lat in relation to certain climatic discontinuities (Frost), 5.1-133; Easterly jet streams, Australia (Bond), 5.1-136; Track jet stream by cloud formations, 5.1-138; Wind velocity profile in non-tdiabatie atmos. (Ogura), 5.1-199.
5.1-206 551.557:551.510.535:621.396.1 t*Miilman, George H., "A study of ionospheric winds and turbulence utilizing long radio
waves." State College, Pennsylvania, Ionospheric Research, Contract No. AF19(122)-44, Scientific Report No. 37, May 30, 1952. 124 p. 55 figs., 3 tables, eqs. Also: Annales de Geophysique, 8 (4) :365-384, Oct./Dec. 1952. DWB—Author discusses briefly the dynamo theory, the tidal oscillation theory, a model of the upper circulation and the theory of wind measurements—including general equations derived for calculating ionospheric wind speeds and directions (utilizing three spaced-receivers). A method for determining the height of these winds is presented and evidence indicating diurnal and seasonal variations of the movement of upper atmospheric winds is given. Data from July 1951 through March 1952 are statistically analyzed and compared with theoretical postulates. A survey of the problem of fading is included. The 150 Kc/s equipment used is described in detail. Suggestions are made as to further data analysis to study the existence of lunar and solar tidal effects on ionospheric wind movements. Simultaneous short and long wave measurements of winds should be made. (Same item as 4F-109, June 1953, MAB.) Subject Headings: 1. Ionospheric winds 2. Long wave propagation.—W. N.
5.1-207 551.557:551.542.1 Neiburger, Morris; Sherman, Leon; Kellogg, William Welch and Gustafson, A. F. On
the computation of wind from pressure data. Journal of Meteorology, 5(3) :87-92, June 1948. 4 figs., 3 tables, 4 refs., 9 eqs. DWB—From a statistical analysis of geostrophic- and gradient- wind computations for all stations reporting winds on two 700-mb charts, it is shown that there is a variability of about 25 percent in the computations by different individuals, and that the computed values differed by about 35 percent from the observed wind speed on the average. The percentual deviation was smaller for strong winds. The gradient wind computed using approximate trajectory curvature was only slightly better than the geostrophic, and using contour curvature it was worse. The geostrophic wind thus appears to be the best approxima- tion which can be computed from the pressure field alone. Theoretical expressions for the deviations of the computed from the observed speeds and velocities are derived. These show that the gradient speed is always greater than the true speed. The gradient speed is shown to be a better approximation than the geostrophic for most cases, but for some cases of curved cross-isobaric flow the geostrophic speed is closer to the true speed. The vector deviation of the gradient wind is, of course, larger than the scalar for cross-isobaric flow. Subject Headings: 1. Geostrophic winds 2. Gradient winds.—Author's abstract.
5.1-208 551.557 551.515.127(73) §*Riehl, Herbert and Teweles, Sidney, Jr., A further study on the relation between the jet
stream and cyclone formation. Tellus, 5(1):66 79, Feb. 1953. 10 figs., tables, refs. MH-BH— Events at sea level and aloft over the U. S. are related to the approach of a speed maximum in the jet stream. In the left hand portion of the area downstream from the jet maximum where air at the jet level is decelerated, frontogenesis, cyclogenesis and spread of precipitation occur. Other indications of high level divergence to the left of the advancing jet maximum are given by changes in the structure of a nearby cold dome. Insofar as the changes in the cold dome are precedent, they constitute a means of forecasting cyclogenesis. An example for the period 12-14 Nov. 1951 is analyzed synoptically and well-illustrated with cross section, wind profile, 500 and 300 mb contour and height changes and surface charts. (Same item as 4G-127, July 1953, MAB.) Subject Headings: 1. Jet stream analysis 2. Synoptic aerological studies 3. Cyclogenesis 4. United States.—Partly from author's abstract.—M.R.
u
I. CURRENT ABSTRACTS 49
VERTICAL MOTION
See also: Mountain and lee wave forecasting (Scorer), 5.1-91; Iridescent wavelike clouds (Barrington. Wilkins), 5.1-303.
5.1-209 SSI.558.1 Scorer, R. S., Waves across the Irish Sea. Gliding, London, 4(l):24-25, Spring 1953.
diagr., photos. Slater, A. E., More Irish sea wave clouds. Ibid., 26-27. diagrs. Sanders, A. A. J., Waves from Ulster to Kent Ibid., 27-28. DWB—Cloud formations over the Irish Sea observed from the ground or in flight, and indicating the existence of thermal waves, are discussed and shown in photographs. Atmospheric conditions prevailing during wave formation are described. A case in which up to a hundred consecutive waves could be observed is reported. Subject Headings: 1. Thermals 2. Cloud formations 4. Irish Sea. L Slater, A. E. II. Sanders, A. A. J.—G.T.
5.1-210 551.558.1:797.5 Swinn, R. (Egyptian Gliding School), Standing waves over the Pyramids. Gliding,
London, 4(l):4-6, Spring 1953. DWB—The author interprets the pyramid waves as part of two long chains of waves on either side of the Nile Valley, marking the temperature difference between the cultivated and the desert regions. Roll clouds are characteristic of these waves. A flight up to 5200 ft (top of the wave lift) is described. Two cloud photographs are presented. Subject Headings: 1. Standing waves 2. Gliding 3. Cloud formations 4. Nile Valley, Egypt —G.T.
5.1-211 551.558.21:629.13 *Jenkins. C. F., Forecasting the mountain wave. U. S. Air Force. Cambridge Research
Center, Air Force Surveys in Geophysics, No. 15, Sept. 1952. 32 p. figs. DWB—Paper deals with one of the most dangerous of flight conditions. Discussion based on extensive observa- tions in the Sierra Nevada Mountains, made mainly from sailplanes. A cross section of the air flow over mountain ridges is discussed. The characteristic cloud forms are: 1) the fohn wall, which hides the mountains and is connected with downdrafts up to 5000 ft/min; 2) the rotor cloud in the lee, with strong updrafts and severe turbulence; 3) lenticular clouds above the rotor; 4) mother of pearl clouds at a height of 25 km. Under dry conditions, no clouds exist, but the danger still remains. Tips on flying the wave are given. A number of mean and single characteristic synoptic charts and wind and temperature profiles are presented in order to show the possibilities of forecasting. The most favorable condition is the approach of a cold front and/or a trough aloft from west or northwest. A wind speed of 25 knots or more, normal to the range line at mountain top level is necessary for a well developed wave, as well as a stable state of the air below 600 mb during the approach of the trough. Subject Headings: 1. Mountain meteorology 2. Sierra wave 3. Aeronautical meteorology 4. Orographic turbulence 5. Sierra Nevada Mountains.—A.A.
AQUEOUS VAPOR AND HYDROMETEORS
EVAPORATION AND EVAPOTRANSPIRATION
i See also: Capillary collector for measuring water drops . . . (Vonnegut), 62; Water * vapor transport project (Benton), 5.11-122.
? 5.1-212 551.571.3:551.576.12 | Ayer, H. S. (£/. 5. W.B., Olympic, Wash.), Dewpoint variations under stratus conditions r in Western Washington. [1952?] 2 p. 2 figs. Mimeo. DWB—A study was made of *- 36 cases of stratus in the region between the Pacific Coast and the Cascade foothills, between
June and Sept. 1951. The dew points at Tatoosh Island, North Head and Seattle-Tacoma Airport, Wash, at 4 p.m. were correlated and it was found that the inland (Seattle) dew point
i
50 METEOROLOGICAL ABSTRACTS AND BIBLIOGRAPHY
ran about 2° lower and in periods of change lagged 6-12 hrs behind those at the 2 coastal stations. Furthermore, daily weather charts showed a good correlation between direction of flow and dew point, inland-flow from the S-SW giving dew points in middle, or high 50°'s and from W-NW dew points in low 50's or high 40's. This is shown to be in keeping with sea surface temperatures off shore. Subject Headings: 1 Dew point variations 2. Stratus effects 3. Western Washington. I. IT. S. Weather Bureau.—M.R.
5.1-213 551.571.3:656.6! McClimont, W., Moisture damage to cargoes. A paper read before the North East
Coast Institution of Engineers and Shipbuilders in Newcastle upon Tyne on the 7th March, 1952, with the discussion and correspondence upon it, and the author's reply thereto. North East Coast Institution of Engineers and Shipbuilders, London, Transactions, 68:249-270, D107- D120, 1952. 13 figs., table, refs. p. 259; refs. in D section. Abstracted from reprint. DWB—The author points out that "landing condition" of storage atmosphere are based upon a consideration of temperature and moisture in the hold in relation to the properties of the material of the cargo. Examples of temperature and moisture transfer between cargo and outside atmosphere are presented. The extent and prevalence of environmental damage to cargo resulting from temperature and moisture transfer and the properties of hygroscopic cargoes such as natural textile fibers, rice and fresh fruits are summarized. An extensive discussion of this paper is appended and graphs showing variations in day temperature during voyages, effect of atmospheric dew point and moisture exchange between tobacco and ventila- tion, and moisture equilibrium of various cargoes are included. Subject Headings: 1. Ship climates 2. Moisture damage 3. Damage to cargoes.—I.L.D.
5.1-214 551.573:551.579(43) Reichel, Eberhard (Munich), Die Zunahme der Verdunstung als eine Ursache des Wasser-
maugels. [Increase m evapotranspiration as a cause of the water-deficiency.] Die Wasser- Wirtschaft, Stuttgart, 43(5) :123-126, Feb. 1953. 5 tables, 9 refs. DLC—Starting with 1946, decreasing runoff in German rivers was observed. The author shows that summer and winter precipitation in 1946-1951 was nearly normal, but the (annual) temperature was 0.8° higher. The resulting increase in evapotranspiration was computed according to WUNDT, THORN- THWAITE, BERGSTF.N, FISCHER and KELLER and found to be 25-30 [mm/annum °C]. Subject Headings: 1. Evapotranspiration effects 2. Runoff decrease 3. Germany.—A.A.
5.1-215 551.573:631.6:677 Salakhov, F. S. and Korobkin, S. F., Oroshenie khlopchatnika dozhdevaniem v zapadnykh
refonakh Azerbaldzhanskol SSR. [Irrigation of cotton plants by sprinkling in the western regions of Azerbaidzhan SSR.] Gidrotekhnika i Melioratsiia, Moscow, No. 4:12-19, 1952. 3 figs., 5 tables. DLC—Transpiration of cotton studied in relation to saturation deficit, green mass and method of irrigation. Sprinkling is far more economical and favorable than other irrigation methods. Subject Headings: 1. Transpiration 2. Sprinkling 3. Irrigation 4. Cotton.—A.A.
5.1-216 551.573:631.67 Thornthwaite, Charles W. (Seabrook, N. J.), Climate and scientific irrigation in New
Jersey. Seabrook, N. J., Johns Hopkins Univ. Laboratory of Climatology, Jan. 1953. 15 p. DWB—Methods used in the past for determining necessity for irrigation (such as observing plants or the soil) are found inadequate and have been replaced at Seabrook by regular evapo- transpiration measurements which make it possible to determine exact amount of hidden drought. The vast possibilities of multiplying agricultural production and extending it to presently non-arable regions (like Southern New Jersey) by means of irrigation, are depicted in persuasive terms. The lecture was prepared for presentation at a luncheon conference of the 38th New Jersey State agricultural convention held at Trenton on Jan. 27, 1953. Subject Headings: 1. Evapotranspiration 2. Irrigation 3. Seabrook, N. J.—G.T.

I. CURRENT ABSTRACTS 51
CONDENSATION NUCLEI
See also: Anomalous loss of condensation nuclei (Nolan, Kenny), 5.1-25; Comparison of 3 multicylinder icing meters (Howell), 5.1-67.
5.1-217 551.574.1 Grabovskii, P. I. (Leningrad), O proiskhozhdenii atmosfernykh iader kondesatsiL [The
origin of atmospheric condensation nuclei.] Priroda, Moscow, No. 1:89—91, Jan. 1953. 3 refs. Hungarian trans, in: Idojdrds, 57(1):32—34, Jan./Feb. 1953. DLC—Popular review. Author made a critical survey of hypotheses on the origin of condensation nuclei and found
, that the most important cause may be sea water spraying into the air. Transfer of chloride ions into the atmosphere by spraying at least 15.10* tons per annum. Back transfer by precipitation in form of condensation nuclei only 1.4.10" tons. Water loss of oceans by spray- ing is about 1% of the loss by evaporation. Subject Headings: 1. Condensation nuclei 2. Sa- line nuclei 3. Salt spray. I. Gelled, Sandor (trans.).—A. A.
5.1-218 551.574.1:548 Wylie, R. G., The condensation of a vapour at a crystalline surface. Australian Journal
of Scientific Research, Ser. A, Physical Sciences, 5(4).-628-646, Dec. 1952. fig., table, 24 refs., 33 eqs. MH-BH—The theory of self-nucleation in a supersaturated vapour has been de- veloped with considerable success by BECKER and D6RING (1935), but little attention has hitherto been given to condensation at a solid surface. A theory is given for the nucleation of liquid condensates on a plane surface and at lines and corners formed by the intersection of plane surfaces. It is suggested that the line and corner sites are representative of typical features of real crystalline surfaces. The equilibrium properties and free energies of formation of embryos at these sites, which are required for the nucleation theory, have been given in the previous paper. The theory shows that the supersaturation for which nucleation proceeds at a just observable rate on a plane surface increases rapidly as the contact angle increases from zero. Unless an edge free energy is introduced, no supersaturation is necessary for nucleation at a line or corner of intersection of plane surfaces when the contact angle is less than a threshold value which depends on the angles between the planes. As the contact angle increases above the threshold value the supersaturation required for observable con- densation increases considerably. The effect of contamination of the substrate surface is considered and the suggestions are made that, if a small amount of soluble contamination is present it is likely to become localized at surface steps and corners, sensitizing them as nucleation sit?s, and that microscopic observation of incipient condensation on solid surfaces may provide a tool for the investigation of surface structure. Subject Heading: 1. Condensa- tion nuclei—Author's abstract.
5.1-219 551.574.1:551.586:615.8 *Zenker, H., Messungen des Kerngehaltes der Luft in Heringsdorf/Usedom. Ein Beitrag
zur lufthygienischen Uberprufung der Kur- und Erholungsgebiete. [[Measurements of nuclei content of the air in Heringsdorf. A contribution to the examination of atmospheric hygiene of health resorts and convalescent places.~] Angewandle Meteorologie, 1(10):304-313, June 1953. 8 figs., 8 tables, 14 refs. MH-BH—Heringsdorf is on NE coast of island of Usedom in the Baltic (salinity 5%). Nuclei counts were made on a pier, the beach, a park in the town 250 m inland, and a pinewood. These show characteristic differences. Histograms and , nuclei wind roses show numbers of nuclei in winds from different directions and at different ; seasons; on the beach and pier winds off the sea are much the cleanest and healthiest; such winds are most frequent March-June. The wood also has cleaner air than the town. Subject I Headings: 1. Nuclei count 2. Balneology 3. Medical climatology 4. Usedom, Baltic Sea.— C.E.P.B. j
i
5.1-220 551.574.42 j Mason, B. J. (Imperial Coll., London) and Owston, P. G. (Univ. Coll., London), Ice crystals i
of spiral form grown from the vapor. Philosophical Magazine, 7th Ser., 43(343) :911-912, • Aug. 1952. ref. DWB—Some unusual ice crystals were formed on cooling pipes in a cold
<
f
52 METEOROLOGICAL ABSTRACTS AND BIBLIOGRAPHY
chamber after 3$ years of growth at a constant air temperature — 10°C. They were similar to the "crevasse hoar" described by SELIGMAN in "Snow structure and ski fields," p. 73, London, 1936. The spiral form is attributed to an incomplete hexagonal edge in an initial formation, probably arising from some obstruction connected with the rapport in which the crystal grew. Subject Headings: 1. Spiral ice crystals 2. Hoar frost formation.—M.R.
FOG
See also: Objective system of estimating fog and stratus (Gringorten), 5.1-86; Unusual temp, during fog (Gold). S.l-180.
5.1-221 551.575:634 tByers, Horace R. (Depl. of Met., Chicago Univ.), Coast redwoods and fog drip. Ecology,
Brooklyn, N. Y., 34(1):192-193, Jan. 1953. 12 refs. Abstracted from reprint. DWB— Contrary to the prevailing notion that California redwoods thrive on fog drip in summer (CANNON—1901), the author gives meteorological, orographical and ecological evidence to support his observation that the California redwood groves are located in coastal valleys where fog drip seldom occurs. Douglas fir, or Monterey Cyprus and pine, may be found where the fog (which is really stratus at 800 to 1200 ft and seldom lower than 300 ft above the valleys) drip is heavy, but redwoods occur in the lower lying areas where stratus is not a wet fog but a dry cloud canopy or even breaks away due to orographic effects. Subject Headings: 1. California stratus 2. Fog drip 3. Redwood trees.—M.R.
5.1-222 551.575:551.463 'Hakodate Marine Observatory, Report on the marine observation for sea fog in 1951.
Journal of Meteorological Research, Tokyo, v. 4, Suppl. No., p. 81-120, March 1952. 9 figs., tables. In Japanese; English summary p. 326-327. MH-BH—This memoir, illustrated by numerous graphs and diagrams, summarizes results of an expedition from June 14-July 5 near 42°N, 140-145°E. Contents: Introduction, by Y. TAKENOUCHI; Marine meteorological and fog observations, by Y. FUJII and M. TSUKAGOSHI (frequent hourly observations of wind, air and sea temperature, R.H. and visibility); Oceanographic observations (temperature and chlorinity at 0, 25 and 50 m) by M. TORII; Aspiration resistance thermometer, by M. NA-
KAIIMA; Vertical temperature distribution heights 0.5-10.5 m, by M. NAKAIIMA, M. TORII and S. TAKINAMI; Marine hot-wire anemometer for turbulence, by M. NAKAIIMA and T. Ku- WATA; Wave analyzer for turbulence, by T. KUWATA; Turbulent air flow above the sea, and its relation to fog dissipation and stability of lowest layer, by Y. TAKENOUCHI ; Drop size distribution of sea fog, by Y. FUJII and S. TAKINAMI; Water content of sea fog and its relation to visibility, by Y. TAKENOUCHI and H. KATSUURA; and Dissolved substances (mainly CI) in sea fog compared with sea water, by Y. TAKENOUCHI and J. IIZUKA. Subject Headings: 1. Sea fog 2. Japan.—C.E.P.B.
5.1-223 551.575.1 Best, A. C. {Met. Office, London), The relative humidity in radiation fog. Tellus, 5(1) :32-
35, Feb. 1952. table, 3 refs., 9 eqs. MH-BH—An equation is derived for the variation of relative humidity in the presence of a given number of fog droplets and with a steadily falling temperature. Although there is no explicit solution it is shown that there is an upper boundary to the relative humidity, depending on mass of nucleus, rate of fall of temperature and ambient temperature. A table shows some numerical values for this upper boundary at 288° and 278CA, for different rates of fall of temperature and for 10,100 and 1000 drops/cm*. Tem- perature has a very small effect on the upper limit of relative humidity (Hb). H\, increases with rate of fall of temperature (o) and decreases as N (number of drops) increases. It is concluded that; with ordinary salt concentrations and rates of fall of temperature, the relative humidity in radiation fog should not exceed 100.1%. Subject Headings: 1. Radiation fog 2. Supersaturation in fog.—M.R.
5.1-224 551.575.1 Fleagle, Robert G., A theory of fog formation. Journal of Marine Research, 12(1) :43-50,
1953. 2 figs., 5 refs., 11 eqs. Also: Washington. University. Dept. of Meteorology and
I. CURRENT ABSTRACTS 53
Climatology. Contribution No. 10. DWB—The theory of radiative temperature change above a cold and a warm water surface is reviewed and applied to the case of cold air flowing over warm water and warm air over cold water. It is shown that over cold water the air immediately above the surface would be warmed from the radiation coming from the warmer air above, so fog could not form in that shallow surface layer, but above that the air would be cooled and fog would form. For the opposite case, the air would be cooled from above in the first meter or so, but warmed above the surface layer; hence, fog could form at the surface, but would have a definite upper boundary. Observations made with thermocouples on a 4 m mast above a fresh water lake in the San Juan Islands and over a cold current, agree with the theory (Aug. 19 and Aug. 26, 1952, respectively). Subject Headings: 1. Fog formation 2. Ra- diative balance over water surfaces 3. Radiation fog.—M. R.
CLOUDS
See also: Cloudiness and choice of astronomical sites (Jones), 5.1-63; Track jet stream by cloud formations, 5.1-138; Dew point variations under stratus (Ayer), 5.1-212.
5.1-225 551.576 Galligan, Agnes M., Variability of subjective cloud observations, I. U. S. Air Force.
Cambridge R-search Center, Air Force Surveys in Geophysics, No. 33, March 1953. 13 p. 4 figs., 5 tables. Also: U. S. Air Force. Cambridge Research Center, AFCRC Technical Report, 53-10. DWB—Cloud amount and height observations were obtained from a group of Air Force observers to estimate the variability which can be expected from subjective observations. Considerable variation was evident in the observational data obtained. Mean cloud amounts for each day are given with their standard deviation and range. The vari- ability was greater in the middle range of cloud amount—i.e., around 5/10—and decreased as the cloud amount approached 0/10 and 10/10. Cloud heights demonstrated wide variations and the distributions were irregular. The mean cloud heights are presented with the range of the middle 50% of the observations. The lack of agreement in the type of sky cover ob- served is also clearly indicated. It appears that the subjective observations of this study could not be made to the degree of accuracy requested. Subject Headings: 1. Cloud observa- tions 2. Cloud height.—Author's abstract.
5.1-226 551.576:77 Schaefer, Vincent (Tech. Adv., Munitalp Foundation, Inc.), Cloud photography project
Weatherwise, 6(3):72-73, 85, June 1953. photo. MH-BH—A continuing program for photography of special cloud formations at 10 or more forest lookout stations in the West, under the sponsorship of the Munitalp Foundation, Inc. and the direct supervision of the author and JACK BARROWS of the U. S. Forest Service is described. Other projects consist of studies of jet stream clouds and the equipping of a mobile weather observatory at the University of Washington under the direction of DR. P. E. CHURCH. Time lapse pictures of clouds are also to be made in Sweden, the Bahamas and at a mountain observatory in Peru. Subject Headings: 1. Cloud moving picture photography 2. Jet stream cloud formations 3. Mobile weather stations. I. Church, P. E. II. Munitalp Foundation, Inc.—M.R.
5.1-227 551.576.11:629.13 Appleman, H. (Hqs., Air Weather Service, Wash., D. C), The formation of oxhaust con-
densation trails by jet craft American Meteorological Society, Bulletin, 34(l):14-20, Jan. 1953. 4 figs., 2 tables, 13 refs. MH-BH—The critical temperature for the formation of a saturated wake is studied as a function of the moisture and heat added from the aircraft to the air, the mixing ratio and the temperature, humidity and pressure of the environment air. The necessary conditions for the formation of visible trails or "negative contrails" can be directly derived from constructed curves, applicable to any jet aircraft with a normal water to heat ratio in its exhaust. The author assumes that contrails are composed of ice crystals, going first through an intermediate state of saturation with respect to water. Minimum visible water content is 0.004 gm m~* (0.01 gm m"' for a distinct trail). Subject Headings: 1. Exhaust trails 2. Condensation trails 3. Jet aircraft.—A.A.
r r ?
54 METEOROLOGICAL ABSTRACTS AND BIBLIOGRAPHY
5.1-228 551.576.2:523.78(485) Lindholm, F. (Swedish Met. and Hydrological Inst.), Expectancy of clear days in the
Central Zone of the total eclipse of the sun June 30, 1954, in Sweden. Tellus, 5(1) .-101-104, Feb. 1953. 2 figs., 3 tables, 4 refs. MH-BH—The occurrence of the total solar eclipse in 1954, visible in southern Sweden, has raised the question regarding the cloudiness conditions which may be expected in this part of the country at the time of the eclipse. A detailed investigation of the average sunshine conditions at Swedish stations situated along the track of the totality has therefore been made. From this is concluded that the coastal regions are decidedly more favorable than the inland. A comparison between the western and eastern
i coasts leads to the conclusion that the average cloudiness at 15h, the hour of observation nearest the totality, is slightly higher on the West coast than at locations on northern Oland and southern Gotland. Regarding the number of clear sky days at different places the coasts are also more favorable even than the inlands, and of those the northern part of Oland seems to be considerably more favorable even than the outer part of the West coast. The statistics refer to observations at 14h June 20-July 10 in the years 1931-1950. Subject Headings: 1. Solar eclipses 2. Cloudiness 3. Sweden.—Author's abstract.
5.1-229 551.576.36:551.576.4 Arnold, George L. (Wash., D. C), A relation between frequencies of cloud cover and
cloud height American Geophysical Union, Transactions, 34(2):189-193, April 1953. 4 figs., 3 refs. MH-BH—A method of relating the frequency of six tenths or more sky cover to the frequency of various ceiling heights is presented to show how the latter may be estimated in areas where only total sky cover has been observed and recorded. Tests show that the method has significant value above 1000 ft. Subject Headings: 1. Cloud frequencies 2. Ceiling height estimates 3. Climagrams.—Author's abstract.
PRECIPITATION
See also: Precip. measurements on a slope (Grunow), 5.1-26; Accuracy of determination of annual precip. (Sanderson, Johnstone), 5.1-27; Evaluation of cloud seeding (Howe'l, W. E. Assoc.). 5.1-97; Composition of atmoi. precip. (Eriksson), 5.1-103; Dry atmos. fronts, S. Ukrainian steppes (Mishutin), 5.1-151; Iowa weather, 1953 (Barger),
5.1-231 551.577:551.508.85 *tHudson, H. R, Jr., Stout, G. E. and Huff, F. A. (III. State Water Survey, Engineering
Subdiv.), Rainfall studies using rain-gage networks and radar. American Society of Civil Engineers, Proceedings, v. 79, Separate, No. 178, March 1953. 26 p. 15 figs., 2 tables, refs., 4 eqs. DWB—The results of three years' work on concentrated rain-gage networks and on measurements of rainfall extent and intensity by means of radar are described. Thunder- storm rainfall is shown to be multicellular, so that the application of area-depth data is more complex than is usually assumed. The orientation, duration, and path of storm cells are
I shown to have marked effects on area-depth curves for a given basin. Data on area-depth relationships are presented for networks having areas of 5.2 sq miles, 95 sq miles, and 280 sq miles. The effects of gage density on mean rainfall errors are investigated. The heaviest storms were found to be associated with cold fronts. The theory and development of radar
V e v
i
5.1-174; Relation between soil and wind erosion (Kiselev), 5.1-202; Precip. in Europe j at max. of last ice age (Klein), 5.1-276; Effect of day-to-day solar variations on weather (Mauchly). 5.1-297. ]
5.1-230 551.577 i Dietrich, Sigismond de R., Rainfall in Miami, Florida 1914-1951. Association of American
Geographers, Annals, 43(2)-.166-167, June 1953. DWB—Miami is more often subject to inadequate rainfall than not, owing to distribution and variability of rainfall and to edaphic and topographic conditions. Hurricanes exert little influence either upon the mean annual amount of precipitation or upon the fall maximum of precipitation. Thunderstorms are the principal source of Miami's rainfall. Subject Headings: 1. Precipitation variations 2. Thunderstorm rainfall 3. Miami, Florida.—I.L.D. ,
^==d
I. CURRENT ABSTRACTS 55
for rainfall measurement are reviewed. Available methods of measuring rainfall by radar are discussed. Data collected in the study on radar signal strength and rainfall intensity are presented and analyzed using a new analytical approach. It is concluded that radar is able to depict rainfall extent better than rain gaging, and that radar can measure rainfall intensities as ably as do the rain-gage networks generally used. Subject Heading*: I. Radar rainfall I measurement 2. Rain gage networks 3. Rainfall data.—Authors' abstract. \
! 5.1-232 551.577(438) 551.579.4(438)
*Poland. Panstwowy Instytut Hydrologiczno-Meteorologiczny, Wisia i rzeki przymorza na wsch6d od Wisry. [The Vistula and the rivers on the Baltic Coast.] Poland. Panstwowy
• Instytut Hydrologiczno-Meteorologiczny, Rocznik Hydrograficzny, 1945. Pub. 1950. 90 p. figs., mostly tables. In Polish; legends in Polish and French. DWB—Besides the voluminous water level data for rivers of Poland, the mean monthly precipitation for 1945, for 1933/37 j and ratio of 1945 to 1933/37 are given for 8 river basins of Poland and the results analyzed (page 89). The same is done for water level readings on 15 basins, and the 1945 levels plotted on a graph for each basin; periods when each river was covered with ice at several stations are shown graphically for winter 1944/45. A large chart shows location of rivers and river gaging stations. Subject Headings: 1. Precipitation data 2. River stages 3. River ice 4. Poland. —M.R.
5.1-233 551.577(494) •Uttinger, Heinrich, Die Niederschlagsmengen in der Schweiz, 1901-1940. Beilage, i
Niederschlagskarte der Schweiz. [Precipitation in Switzerland, 1901-40. Suppl. in pocket, Rainfall map of Switzerland.] Zurich, Verlag des Schweizerischen Wasserwirtschaftsver- bandes, 1949. 27 p. mostly tables, 18 refs. In French and German. DLC—The mean monthly and annual precipitation has been calculated for 484 stations in Switzerland for the period 1901-1940, and presented in table I. Table II gives the mean annual precipitation for 107 other stations and 142 recording gages. Table III gives the highest and lowest annual total precipitation (for 1901-40) at 347 stations. The data are arranged by regions or river basins, and are used to construct a large colored isohyetal chart for Switzerland. The probable , error of the means, the variability from year to year and from place to place are discussed. The isohyetal chart shows zones of 60, 60-80 . . _. 280-320, and 320 annual precipitation, and is based on data for 733 stations. Previous isohyetal charts (French, German, Swiss and Italian) were consulted in drawing this. (For similar work on S. Switzerland see item 10-128, Oct. 1950, MAB.) Subject Headings: 1. Precipitation data 2. Isohyetal charts 3. Switzer- land. I. Switzerland. Meteorologische Zentralanstalt—M.R.
t
5.1-234 551.577.11:551.510.41 I Angstrom, Anders, and Hogberg, Linus (Swedish Met. and Hydrological Inst., Stockholm),
On the content of nitrogen in atmospheric precipitation in Sweden. II. Tellus, 4(4):271- \ 279, Nov. 1952. 5 figs., 6 tables, 5 refs., 5 eqs. MH-BH—On the basis of the previously developed equation, 5= a log (1+P) in which 5 is the quantity of nitrogen transferred through the precipitation P and a is an arbitrary constant denoting the nitrogen concentration at the beginning of precipitation, the author has computed aNH4 — N and the total amount of NH« — N kg/ha for the different seasons and for the year for various parts of Sweden. Maps showing the geographical distribution of annual amount of NH« in precipitation and the
»• - geographical distribution of the average values of a for the year are given. It is suggested that the concentration of fixed nitrogen in precipitation is the result of a photochemical process which explains the almost constant ratio between NH«—N and NO« — N found frequently in
! the temperate zone. Subject Headings: 1. Nitrogen content of precipitation 2. Precipitation ! i . analysis 3. Sweden.—I.L.D. \ *•• i f 5.1-235 551.577.2(86) j
t*Schmidt, R. D., Die Niederschlagsverteilung im andinen Kolumbien. [Precipitation dis- Ife; tribution in Andean Colombia.] Banner Geographische Abhandlungen, Bonn, No. 9:99-119, 9\ 1952. diagr. and map in text, 5 maps and table in pocket, bibliog. p. 118-119. DWB— '• T- On the basis of data from rainfall stations and descriptions of vegetation and landscape, the \ T.
m '0
56 METEOROLOGICAL ABSTRACTS AND BIBLIOGRAPHY
author constructed charts showing mean annual precipitation, mean monthly precipitation for Feb., May, July and Oct., the annual march of precipitation and regions with equal seasonal precipitation for the Andean region of western Colombia. Eight precipitation regions have been established. These are: the northern trade wind region, the eastern lowlands region, the Cordillera of Bogota, the basin of the upper Magdalena, the mountain region of Medellfn, the basin of the upper Cauca and the Pacific region. The rainfall characteristics of each region and the effect of rainfall upon vegetation and the relationship between rainfall and relief, namely, the altitude of the zone of maximum precipitation and the drought valleys are discussed. A table giving mean monthly precipitation for 123 stations is included. Subject Headings: 1. Precipitation distribution 2. Precipitation data 3. Western Colombia.—I.L.D.
5.1-236 551.577.2:551.579.4:626.8 §Jens, Stifel W. (St. Louis, Mo.), Engineering meteorology. Illinois. State Water Survey
Div., Bulletin, No. 41:99-116, 1952. DWB—An excellent presentation of the current in- terpretation, techniques and usefulness of precipitation data as applied to hydrologic engineer- ing. The desirability of widened meteorological knowledge is stressed. In the discussion hydrometeorology is shown as a link between engineering and meteorology. Subject Headings: 1. Precipitation data 2. Hydrometeorology 3. Engineering meteorology.—W.N.
5.1-237 551.577.33(675) 551.577.61(675) :635.4 *Monti, J. R. (Contp. du Congo pour le Commerce et VIndustrie), La periodicite des pluies
au Mayumbe et lew relation avec la production de cacao. [Periodicity of rainfall in Mayoumba and the relation of rainfall to cacao production.] Belgium. Direction GSnSrale de VAgri- culture, Bulletin Agricole du Congo Beige, 44(3):493-510, June 1953. 5 tables, graphs, refs. Dutch summary p. 510. DWB—Monthly rainfall amounts at Ganda-Sundi are tabulated for each year from 1909 to 1952. An analysis of annual totals reveals a 4-year periodicity up to 1927 but no definite relationship can be established after that date. A graphical com- parison shows a definite relationship between rainfall amount and cacao production. Data on rainfall amounts at Temvo (1915-1949) are appended. They confirm the existence of a 4-year periodicity and of the effect of rainfall on cacao crops. Subject Headings: 1. Rainfall periodicities 2. Rainfall effects 3. Cacao production 4. Mayoumba, Belgian Congo.—G.T.
5.1-238 551.577.36 Stidd, C. K. (U. S. W. B., Wash., D. C), Cube-root-normal precipitation distributions.
American Geophysical Union, Transactions, 34(1):31—35, Feb. 1952. 5 figs., 8 refs. MH-BH —The integral of the rainfall histogram for almost every place and duration can be plotted as a straight line using a normal probability abscissa and the cube root of the rainfall amount as ordinate. Zero rainfall must be counted. Method tested for extreme climatic conditions. Rainfall climate of a single place (example Hilo, Hawaii) can be described by a family of graphs showing rainfall vs. probability for periods of various length. Subject Headings: 1. Rainfall frequency distribution 2. Statistical techniques 3. Hilo, Hawaii.—A.A.
SNOW
See also: Elect, properties of blizzards (Barre), 5.1-2; Report of Committee on Snow, 1950-51 (Garstka and others), 5.1-28; Coop. Snow Investigations program (Rhodes, Wilson), 5.1-29; Snow and skiing (Villeneuve), 5.1-30; Surface temp, of soil under grass with snow cover (De Backer), 5.1-183.
5.1-239 551.578.4:536.2:551.501 Yosida, Zyungo and Iwai, Yutaka, Measurement of thermal conductivity of amass of snow.
Teion Kagaku [Low Temperature Science], Sapporo, Japan, 3:79-87, 1950. 5 figs., table, 3 refs. In Japanese; English summary p. 87. DWB—The authors devised a method of measuring the thermal conductivity of snow without inserting any thermometer into the sample. A mass of snow is put in an airtight vessel with double wall. A thin tube of glass, which pierces the wall of the vessel, leads the pressure of air included among the snow to a U-tube oil-manometer. The pressure measured with this manometer gives the mean temperature of the air which is
I. CURRENT ABSTRACTS 57
the same as the mean temperature of the snow in the vessel. By circulation of a water solution of ethyleneglycol, the temperature of the wall is kept at about 1°C for a considerable time and then is changed suddenly to about — 6°C by circulation of another solution at that tem- perature. The pressure on the manometer decreases gradually. Plotting the logarithm of the values of pressure against time, we can calculate the thermal diffusivity of the snow. The product of the density p, specific heat and thermal diffusivity give the thermal conductivity p. The authors obtained a simple empirical relation between y. and p. Log,0 M=» — 4+2P (/* in cal/°C. cm. sec; P in gr/cm*). Subject Headings: 1. Snow physics 2. Thermal conductivity of snow.—Authors' abstract.
5.1-240 551.578.4:551.501 Yosida, Zyungo and Kuroiwa, Daisuke, Sublimation in the interior of snow layer. Teion
Kogaku [Low Temperature Science], Sapporo, Japan, v. 3:89-100, 1950. 7 figs., In Japanese; English summary p. 100. DWB—Four cages, which were made of wire gauze and contained a mass of snow in each of them, were buried in the interior of snow layer (thickness: 1.8 cm.) at various heights from the ground surface. The weights of cages were measured every day. Increase or decrease of weight means respectively condensation of water vapor into or evapo- ration of it from the snow by sublimation. Water vapor evaporated in the neighborhood of the ground surface and condensed on the snow in the upper part of the snow layer. By such a sublimation heat was conveyed from the lower part of the snow layer to the upper part. The quantity of heat thus conveyed was calculated and it was found to be as large as the quan- tity of heat conveyed by thermal conduction. The diffusion of water vapor through a mass of snow was determined by experimental measurements. The bottom of a small can (diameter: 5.5 cm., height: 3.5 cm.) was taken off and a wire gauze was stretched in its place. Four such cans were piled up and the upper and lower ends of the pile were maintained at the temperatures — 1°C and — 6°C, respectively, for several hours. Water vapor evaporated from the snow put in the cans and diffused downwards. Diffusion coefficient of the water vapor was calculated from the amount of decrease in the weight of snow in each can and was found to be 3-4 times greater than that through free air. It was supposed that evaporation and condensation of water vapor occurring at the opposite surfaces of a pairs of neighboring ice grains in the <?now caused this increase of diffusion coefficient. Subject Headings: 1. Snow physics 2. Sublimation of snow.—A uthors' abstract.
5.1-241 551.578.46:531.311.12(988) Bader, Henry, Sorge's law of densification of snow on high polar glaciers. U. S. Snow,
Ice and Permafrost Research Establishment, SIPRE Research Paper, 2, [1953?] fig., 2 refs., eqs. This paper formerly listed as SIPRE Report 14. DLC—SORGE assumed that for a stationary glacier, where there is no melting in summer, the snow density versus the depth below the snow surface is invariant with time. The author uses this concept in c. ler to derive the specific velocity of densification and shows that the annual accumulation can be computed, knowing the rate of approach of two points and the density for these points. The depth density curve itself is described by an empirical formula. A check against data obtained at Eismitte, Greenland, gave good results (average annual accumulation 314 mm water equiva- lent). Subject Headings: 1. Snow densification 2. Snow density profiles 3. Glacier nourish- ment 4. Eismitte, Greenland. I. Sorge, E.—A.A.
5.1-242 551.578.46:551.501 Boardman, Horace P. (Prof. Emeritus, Univ. of Nevada), Snow surveys for forecasting
stream flow in Western Nevada. Nevada. University. Agricultural Experiment Station, Bulletin, No. 184, Sept. 1949. 120 p. 17 tables, 23 graphs., diagr. DWB—Means of snow water content and springtime runoff, reduced to 45-year normals, computed for a number of snow courses in the Truckee, Tahoe, Carson and Walker basins in the Central Sierra, as well as regression equations for April-July runoff vs. snow water content with graphical and a detailed tabular presentation of data (1922-48). The method of "weighting formulas" for the whole basin is explained. Snowmelt runoff can be forecast much better using snowcourse data than winter precipitation records. Subject Headings: 1. Snow surveys 2. Hydrologic forecasting 3. Nevada.—A.A.
^—~~ -J
58 METEOROLOGICAL ABSTRACTS AND BIBLIOGRAPHY
5.1-243 551.578.46:531:796 Bowden, F. P., Friction on snow and ice. Royal Society of London, Proceedings, Ser. A,
217(1131) :462-478, May 21, 1953. 10 figs., 9 tables, 14 refs. DLC—Experiments on friction of ski on snow and ice at different temperatures at Davos, Switzerland, confirmed that drop in friction at appreciable sliding speed is due to localized surface melting caused by frictional heating. Effect of various coatings on surface of ski were tested, the best results being given by polytetrafluoroethylene. This also gave best results on sand. The influence of the contact angle and of wetting was also investigated. Subject Headings: 1. Snow mechanics 2. Skiing. —C.E.P.B.
5.1-244 551.578.46:621.395 Ito, H., Investigation on the snow accretion on telegraph wires. Journal of Meteorological
Research, Tokyo, 4(6):251-267, Sept. 1952. 11 figs., 6 tables, 5 refs., 12 eqs. In Japanese; English summary p. (19). MH-BH—In view of extensive damage suffered by communication lines (statistical material presented for 10-year period, west coast of N. Honshu) the mechanism of snow accretion was investigated in 1950-51. As a result of the investigation the author presents detailed data on the amount of snow accumulated and on concurrent atmospheric phenomena, such as temperature, wind velocity, depth of snowfall, surface pressure distribution and upper air conditions. Correlations between atmospheric phenomena and snow accretion are established and integrated into formulas to be used in forecasting accretion conditions. Numerical results obtained by applying this forecasting method are compared with measured quantities of accumulated snow. Subject Headings: I. Snow accumulation on wires 2. Snow damage 3. Public utilities forecasting 4. Industrial meteorology.—G.T.
5.1-245 551.578.46(52) :551.501 •Kumai, Motoi and Higuchi, Keiji {Hokkaido Univ., Sapporo), Measurement of the mass
and number of falling snow crystals in the atmosphere. Meteorological Society of Japan, Journal, 2nd Ser., 30(11) :345-355, Nov. 1952. 21 figs., 3 tables, 13 refs. In Japanese; English summary p. 345. MH-BH—Replicas of falling snow crystals were obtained on an ethylene dichloride solution of formvar spread over paper or glass. Some 1000 such replicas were prepared on Mt. Taisetsu, Hokkaido (at 1050 m) during the three winters 1950-1952. On the basis of 34 specimens taken on March 2, 1951, the total mass and the number of snow crystals in the snowfall are calculated. It is found to be in good agreement with the liquid water content of the cumulus cloud. Subject Headings: 1. Snow sampling 2. Snow crystals 3. Snow analysis 4. Mt Taisetsu, Japan.—G.T.
5.1-246 551.578.46(238) Lliboutry, Louis, L'origine des penitents de neige. [Origin of ''nieve penitente"].
Academic des Sciences, Paris, Comptes Rendus, 236(9) :952-954, March 2, 1953. refs. DWB— The author's interpretation of the formation of nieve penitente and of "micropenitents" is based on his observations of temperature, dew point and state of the snow in the Santiago Andes. According to his theory sublimation is the decisive factor in the development of such fields of pinnacled snow. On a sunny day depressions in a snow field become permeated with water and reach a higher temperature than the ridges. Thus the crevices tend to deepen. As an intermediate state between a uniform snow field and "nieve penitente" the snow often shows a honeycomb pattern. Subject Headings: 1. Nieve penitente 2. Snow mechanics 3. Glaciers 4. Andes.—G.T.
5.1-247 551.578.46:551.311.12 Lliboutry, Louis, Les penitents de glace et la transformation de la neige en glace dans
les Andes de Santiago. [Ice "penitents" and the transformation of snow to ice in the Santiago Andes.] Acadimie des Sciences, Paris, Comptes Rendus, 236(11) :1191—1193, March 16, 1953. refs. DWB—On the basis of observations made in the Santiago Andes, the author analyzes the structure and stratification of "nieve penitente." He finds that several layers of brown dust (corresponding to dry periods with strong wind) settle on penitents and glaciers every year. A considerable portion of the pinnacled snow is transformed to "ice penitents" in the
I. CURRENT ABSTRACTS 59
course of a year. Subject Headings: 1. Nieve penitente 2. Snow mechanics 3. Glacier formation 4. Andes.—G.T.
. , 5.1-248 551.578.46:551.501.1 ] Parshin, V. N. and Salov, M. S., O postanovke nabliudenil nad snezhnym pokrovom v
ralonakh polezashchitnykh lesonasazhdeniL [Organizing snow cover observations in the vicinity of shelter belts.] Meteorologiia i Gidrologiia, No. 7:32-35, 1952. 6 refs. DLC— j The authors show by many examples that the measurement techniques used at present for determining thickness of snow cover give incorrect results. Especially unsatisfactory results are obtained for an area with large open spaces or diverse forms of relief. Official manual issued by the State Hydrometeorological Service of the U.S.S.R. in 1950 neglected the complete observations of snow cover and provided for investigations for agricultural purposes only. A fixation of the measurement point by straw markers recommended in the manual can change the normal conditions of snow cover stratification. Subject Headings: 1. Snow cover 2. Ob- servation techniques.—N.T.Z.
HYDROMETEOROLOGY
See also: Increase of evaporation as cause of water deficiency (Reichel), 5.1-214; En- j gineering met. (Jens), 5.1-236.
5.1-249 551.579:019.941 tAmerican Geophysical Union, Southwest Pacific Regional Meeting, Stanford University,
Feb. 6-7, 1953, Abstracts of papers of Sections of Hydrology and Meteorology. Stanford, 1953. 6 figs. DWB—A collection of summaries of 31 papers presented at the A.G.U. SW Pacific Reg. Meeting. The papers abstracted deal with precipitation evaluation, hydrology, snow survey and their practical applications, with atmospheric dynamics, visibility, etc.
j Subject Headings: 1. Meteorological abstracts 2. Hydrometeorology.—G.T. \ i
5.1-250 551.579(08) \ Institution of Water Engineers, London. Hydrological Research Group, Hydrological
measurements. (Papers prepared by the Hydrological Research Group for the Hydrological Symposium, London, Nov. 12, 1952.) Institute of Water Engineers, London, Journal, 7(3) :178— 195, May 1953. refs. Discussion and written communications p. 226-237; 267-268; 270-272. DWB—Methods and practices of hydrologic measurement (precipitation, evaporation, per- colation, runoff, ground-water level and storage) in Great Britain are reviewed briefly with ample quotation of the pertinent literature. Many theoretical and practical problems are taken up in the summarized oral discussion and in the written communications which followed
f the delivery of the papers at their Hydrological Symposium in London on Nov. 12, 1952. Subject Headings: 1. Hydrologic measurements 2. Symposia. I. Institution of Water En- gineers, London. Hydrological Symposium, Nov. 12, 1952.—G.T.
5.1-251 551.579.5:551.501 Baier, W., Elektrische Metnoden zur Messung der Bodenfeuchte. [Electric methods I
for measurement of soil moisture.] Germany. Deutscher WeUerdienst in der US-Zone, S BerichU, No. 32:18-22, 1952. 5 figs., 10 refs. German summary p. 18. DWB—Usual methods for indirect measurement of soil moisture are compared and the studies of the author
i on the electric conductivity of gypsum blocks in the soil are summarized. The hygroscopic gypsum has a significant lag. The author tried a mixture of soil and 10% gypsum. Applica- j tion of nylon blocks, which have a great reaction velocity, discussed but the measurement results are significantly influenced by different soil solutions. Subject Heading: 1. Soil moisture
-*- measurement—A. A
f 5.1-252 551.579.5:551.501 j X *Baier, W., Ergebnisse von Bodenfeuchteuntersuchungen in Stuttgart-Hohenheim. ' • [Results of soil moisture measurements at Stuttgart-Hohenheim.] Germany. Deutscher
WeUerdienst in der US-Zone, Berichte, No. 37, 1952. 35 p. 14 figs., 12 tables. 21 refs., append. *
\
•=d
II
I
i 60 METEOROLOGICAL ABSTRACTS AND BIBLIOGRAPHY
DWB—The soil moisture content denned as utilizable moisture was investigated at Hohenheim during the year 1949-1950. Soil samples were removed daily up to a depth of 1 m by means of a soil auger; the moisture content of 10 cm samples was determined by weighing after desiccations. This detailed and comprehensive study contains: 1) a description of the method for determining soil moisture content, and of the characteristics of the soils investigated including the position of the soil parcels, the texture, structure and structural changes in the soil in the course of the study, the water capacity, the minimum water capacity and field capacity, and hygroscopic characteristics of the soil; 2) an analysis of the climate of Hohenheim and the course of the weather dating 1949/1950 and 3) absolute soil moisture in percent weight, \ relative soil moisture, annual course of soil moisture; soil moisture in cultivated and fallow j soil, soil moisture under various crops and soil moisture balance. The climatic and soil moisture data are given in tables. Subject Headings: 1. Soil moisture measurement 2. Soil j physics 3. Hohenheim, Germany.—I.L.D. \
i
5.1-253 551.579.5:551.501 J Bethlahmy, Nedavia, A method for approximating the water content of soils. American
Geophysical Union, Transactions, Pt. 1,33 (5) :699-706, Oct. 1952. fig., 8 tables, 4 refs. MH- j BH—Describes the laboratory, field and mathematical procedures used to calibrate the fiber- glas soil moisture units employed in the experiments of 1948 in a brush covered watershed in northeastern Pennsylvania. The purpose was (1) to determine the soil-water relationships in sc~ub oak areas and (2) the daily changes in the storage of water in the soil mantle. A .' conversion table is obtained (taking into account the regression equations) for direct translation of the resistance readings into inches of water. The results of this preliminary study show that valid calibration curves are obtainable only if the original structure of the soil is main- tained. Subject Heading: 1. Soil moisture measurement.—W.N.
5.1-254 551.579.5:631.4 flsachenko, A. G., Rukovodiashchie geograficheskie idei G.N. Vysotskogo i ego vklad v
geograficheskuiu teoriiu. £The leading geographical ideas of G. N. Vysotskii and his con- tribution to geographical theory.] Vsesoiuznoe Geograjicheskoe Obshchestvo, S.S.S.R., Iz- vestiia, 84(5):478-489, Sept./Oct. 1952. bibliog. p. 489. DLC—G. N. VYSOTSKII'S principal \ interests were in the fields of soil science, geobotany and forestry and in their interrelationships. In his studies on the zonal distribution of soil and plants in the Soviet Union, he analyzed the relationship between soil moisture content as a result of precipitation, evaporation and soil leaching on the one hand and soil characteristics and vegetation on the other. This article < gives an extensive account of VYSOTSKII'S contributions to geographic theory and includes a list of his most important writings. Subject Headings: 1. Soil moisture 2. Soils 3. Vegetation zones 4. Geographical theory 5. Bibliographies 6. Vysotskii, G. N.—I.L.D.
5.1-255 551.579.5:551.501 Ivanov, P. V., Bystryl metod opredeleniia vlazhnosti pochv. [A quick method for the
determination of soil moisture.] Pochvovedenie, Moscow, No. 3:61-65, 1953. 2 figs., 2 tables, 2 refs. DLC—Rapid drying of soil samples (3-5 g) for the determination of soil moisture can be achieved by burning alcohol three times directly on the sample in a small container. Alcohol consumption is 4 cm* the first time and 1.5-2.0 cm* the second and third times. The amount of > burned organic matter is negligible, the accuracy very high, according to 28 tests made with parallel measurements in desiccation chambers. Subject Heading: 1. Soil moisture measure- ment.—A. A. j
5.1-256 551.508.79:551.579.5:551.501 '•• Kubo, J., A new method for the soil moisture measurement. Japan. Central Meteoro-
logical Observatory, Tokyo, Memoir of Industrial Meteorology, 16(1) :37-43, Aug. 1952. 9 figs., * i 4 refs. In Japanese; English summary p. 3. MH-BH—The author developed a new ap- paratus for soil moisture measurement. The method used with this apparatus is that reported by A. U. MOMIN (cf. Agricultural Meteorology, Vol. 6, No. 1). The instrument consists of a special mercury thermometer with half the bulb wound with electrically heated wire. When the bulb in the soil is heated, the time required for attaining a constant temperature rise of
-==^
f
I. CURRENT ABSTRACTS 61
the thermometer is proportional to the soil moisture. Consequently the soil moisture can easily be determined by measuring the heating time required for a constant temperature rise of the thermometer. Subject Headings: 1. Soil moisture measurement 2. Soil moisture instruments.—Author's abstract.
5.1-257 551.579.5:63 Markkink, G. F., Betrekkingen russen cultuurgewassen en bodemvocht. [Relations
between crops and soil moisture]. (In: Nederlandse Centrale Organisatie voor Toegepast- Natuurwetenschappelijk Onderjoek. Commissie voor Hydrologischen Onderzoek, Verslagen Technische Bijeekomsten, 1-6, 1946-1950. Pub. 1952. p. 185-201. 13 figs., table. In Dutch; English, Esperanto and French summaries p. 294-295, 323-324.) DWB—Author discusses relations between relative moisture, suction force, pF values and the water transport to the plant and presents a valuable review (with graphical data) of previous investigations on the relation between the water-consumption and the dry matter production of different crop;, giving author and year of publication, but not a single reference. Subject Headings: 1. Transpiration 2. Agricultural meteorology 3. Soil moisture.—A. A.
CLIMATOLOGY AND BIOCLIMATOLOGY
CLIMATOLOGY
See also: Upper air circulation in low l»t. in relation to certain climatic discontinuities (Frost), 5.1-133; Influence of sea on temp. (Arnaud), 5.1-292.
5.1-258 551.58:63 Ramenskii, L. G., TSatsenkin, P. A. and Rabotnov, T. A., K voprosu o sel'skokhozialst-
vennol klimatologiL [On the problem of agricultural climatology.] Vsesoiuznoe Geogra- ficheskoe Obshchestvo, S.S.S.R., Izvestiia, 84(5):501-502; Sept./Oct. 1952. DLC—A more intensive investigation of climate in relation to agriculture is proposed. The topics requiring special study are: the effect of radiation, of the atmosphere and of the aqueous and soil en- vironment upon plant growth and development; the relationship of the individual climatic variables and their geographic distribution to agricultural regions; the microclimates of localities; changes in weather and forecasting possibilities; crop yield forecasting and climatic amelioration. In addition, all the indicators used by agricultural climatology should be biologically and ecologically based, and be completely independent of calendar dates. Subject Heading: 1. Agricultural climatology.—I.L.D.
5.1-259 551.58:63(71) Robertson, G. W., Some agrometeorological problems in Canada. Royal Meteorological
Society, Canadian Branch [Publications], 4(2), 1953. lip. 7 figs., 2 tables, 13 refs. DWB —This report is based on a preliminary agrometeorological study started at Ottawa in the summer of 1952. Taking account of the special climatic features of Canada (such as short growing season, etc.) the response of plants to day length, cumulative heat, radiation losses, etc. are analyzed and integrated into a formula of effective crop temperature. Attention is called to the necessity of considering radiant energy, transpiration and wind, if serious errors in evaluating environmental factors are to be avoided. Development of better in- struments and methods is indicated as immediate objective of the project. Subject Headings: 1. Agricultural climatology 2. Growing season 3. Heat balance 4. Climate of Canada 5. Canada.—G.T.
5.1-260 551.58:63 Seabrook, John M. {Seabrook Farms, N. /.), Applied climatology at Seabrook Farms.
Weatherwise, 6(2) :36-37, 59, April 1953. DWB—The various phases of climatological activity which benefit the Seabrook Farms and their vast truck garden and processing operations (20,000 acres) are outlined by the owner and manager of these farms. The problems which the Laboratory of Climatology at Seabrook (under Johns Hopkins Univ.) have helped solve are: a) irrigation—when, where and how much water to add to fields; b) phenology—preparing
l~
62 METEOROLOGICAL ABSTRACTS AND BIBLIOGRAPHY
planting schedules for the half dozen major crops, so the harvest and labor will be smooth and efficient and c) micrometeorological studies to improve crops. Weather forecasts or artifical rain inducement are not "indicated." Subject Headings: 1. Agricultural climatology 2. Applied climatology 3. Seabrook Farms, N. J.—M.R. ':
S.l-26i 551.58:35 Senter, William O. (Maj. Gen., U. S. Air Force), Climatology applied by the air force.
Weatherwise, 6(2) :51—52, April 1953. DWB—Examples of major operations in which knowl- edge of climatology was a guiding factor are: the invasion of Poland by the Germans in 1939 and that of South Korea in 1950. To a lesser extent, climatology assisted in the Berlin Airlift of 1948 (graphical example is given of comparison between estimated and actual hours of , I contact, instrument, GCA and closed conditions at Tempelhof for Nov. and Dec.). The functions of the several groups in the Directorate of Climatology of the Air Weather Service | are outlined, and the fact emphasized that problems are solved by specialists in this Directorate and results expressed in operational terms. Descriptive climatology has been replaced by applied climatology. Subject Headings: 1. Military climatology 2. Applied climatology 3. U. S. Air Weather Service. Directorate of Climatology.—M.R.
5.1-262 551.58:519.24 I Thom, Herbert C. S. (Climatological Specialist, V. S. W. B., Wash., D. C), Climatology J
in the Weather Bureau. Paper presented at CBIAC Meeting at Portland, Oregon, Feb. 20, 1952. 5 p. 4 figs. Mimeo. DWB—A discussion of the value of climatological analysis in predicting weather fluctuations and of the value of climatic data in economic planning and activities. A simple account of the application of statistical analysis to climatological data, i with particular reference to precipitation of eastern Oregon, is presented. Subject Headings: j 1. Climatology 2. Climatic analysis 3. Statistics in climatology 4. U. S. Weather Bureau 5. Eastern Oregon.—I.L.I). \
5.1-263 551.58 (09) (268) Wright, John K., The open polar sea. Geographical Review, N. Y., 43 (3) :338-365, J
July 1953. 2 figs., refs. DWB—Historical account of earlier hypothesis regarding the climate of the Arctic. Up to the middle of the 19th century it was assumed by many scientists (PETER- • MANN and others) that the climate around the pole is mild and open navigable water exists. The arguments were based in the beginning on seamen's stories, later on misextrapolation of j climatic observations, ocean currents, biological signs, etc. Subject Headings: 1. History of climatology 2. Arctic Sea.—A.A. ]
CLIMATE OF PARTICULAR PLACES
See also: Agricultural met. (Aujeszky, Berenyi, Bell), 5.1-1; Investigation station in desert (Kliushlcin), 5.1-282.
5.1-264 551.582(54) I Ahmad, Kazi S., Climatic regions of East Pakistan. Pakistan Geographical Review,
Lahore, 7(2):102-112, 1952. 2 ilius., 12 refs. DLC -After a general description of climatic characteristics of East Pakistan, as represented by temperature, winds, rainfall, fog, etc., . I the author discusses the geographic distribution of the five climatic types (ranging from ] "tropical very wet" to "sub-tropical moderately wet") prevailing over that territory. A map \ is drawn up with 15 climatic graphs inserted at the locations they represent. Subject Headings: \ 1. Climatic regions 2. Climate of East Pakistan 3. Pakistan.—G.T. i
5.1-265 551.582(519) \ Borsos, J6zsef, Adatok Korea eghajlatihoz. [Data on the climate of Korea.] Idojdrds, i
55 (7/8): 197-198, July/Aug. 1951. table. DLC—Monthly means (for the period 1921- I 1930) of pressure, temperature and precipitation are tabulated for the Korean seaport cities Joshin (40°40 N; 129°12'E) and Jinsen (37°29'N; 126°38'E) and compared with corresponding \
^=W
I
I. CURRENT ABSTRACTS 63
data for Budapest (1901-1930). It is found that winter months are considerably colder in Korea than in Hungary. The annual precipitation of Korea (most of it occurring in summer) exceeds that of Hungary by 50-100%. A typical feature of Korean climate is abundant dew produced by the proximity of the ocean and strong cooling at night. Subject Headings: 1. Climate of Korea 2. Climatic analogs 3. Korea 4. Budapest, Hungary.—G. 1.
5.1-266 551.582:63(438) *Guminski, Romuald, Wazniejsze elementy klimatu rolniczego Polsi pohidniowo-wschod-
niej. [The most important elements of southeast Poland's agroclimate.] Poland. Pan- stwowy Instytut Hydrologiczno-Meteorologiczny, Wiadomos'ci Sliizby, 3(1):57-113, 1951. 29 figs., 34 tables. DWB—A climatic outline of southeastern Poland from the agricultural point of view. It is based on a detailed analysis of complete observational data (60 stations) concerning two most important elements: mean, annual and monthly air temperature for the period 1881-1930 and mean amounts of precipitation for 1891-1930. Other elements are analyzed on the basis of observational data for shorter periods and are considered as provisional. The whole work is abundantly provided with tables, charts and maps thoroughly explained in the text. It gives a picture of the landscape of southeastern Poland, the thermal elements of its climate, the soil temperature, precipitation (rainfall and snow cover), some phenological data and, finally, the division of the territory into climatic zones and provinces. Subject Headings: 1. Agricultural meteorology 2. Climatic data 3. Poland.—A.M.P.
5.1-267 551.582(569.4) •Lorch, J. (Met. Service of Israel), Climatological data for the Negev. Israel. Meteoro-
logical Service, Series A, Meteorological Notes, No. 4, 1952. 12 p. 7 figs. In English, legends in English and Hebrew. DLC—Data, obtained in 1946-1947, discussed. Hourly frequencies of temperature and relative humidity given. Subject Headings: 1. Climatic data 2. Tem- perature frequencies 3. Humidity frequencies 4. Negev, Israel,—A.A.
5.1-268 551.582(649) Paterson, Sten Sture, Kanarieoarna—natur och naringar. [The Canary Islands-
nature and food products.] Ymer, Stockholm, 72(2) :161-182, 1952. 9 figs., 10 refs. English summary p. 182. DLC—The subtropical climate of the islands, which is tempered by the Atlantic location of the islands and the cool southward Canary stream between the islands and the continent is discussed. The precipitation is concentrated in two periods—Jan. and Nov., increasing east to west with altitude and decreasing temperature. The "south-weather," which has a depressing biological influence, occurs in winter with southern air currents bringing hot humid air from the equator. Air pressure is normally constant, but severe short lived storms bring damage to the banana plantations and soil. Irrigation is a problem in the lower parts of the islands. Annual mean temperature and precipitation values (1942-48) are given in a table. Subject Headings: 1. Climate of the Canary Islands 2. Canary Islands.— W.N.
5.1-269 551.582(467) *Pedreschi, Luigi, Minorca, la meno nota delle Baleari. [Minorca, a sketch of the Balearic
Islands.] Societd Geografica Italiana, Rome, Bollettino, Ser. 8, 5(3/4):256-278, May/Aug. 1952. diagrs., tables, 50 refs. In Italian; English summary p. 278. DWB—On p. 259 important recent studies or charts on the climate of the Balearics are reviewed. On p. 261- 266 a brief analysis of the winds, rainfall and other climato-geographic factors ot Minorca with several isohyetal charts and a table of total annual precipitation of 6 stations for each year 1911-1924 and the mean annual for the period are given. The rest of the article deals with geomorphology, population, economy, vegetation and culture with respect to other islands in the Mediterranean. Subject Headings: 1. Climate of Minorca 2. Precipitation distribution 3. Minorca, Balearic Islands.—M.R.
5.1-270 551.582.1(73) •Borchert, John R. (Univ. of Minnesota), The climate of the central North American
grassland. Association of American Geographers, Annals, 40(l):l-39, March 1950. 21
v~
64 METEOROLOGICAL ABSTRACTS AND BIBLIOGRAPHY
figs., refs. DLC—By means of numerous isohyetal and other isopleth charts, the climatic characteristics of the eastern part of the United States and especially the prairies between the east slope of the Rockies and the Mississippi River are vividly depicted and described clearly in the text. The sources of information used in this study are faithfully indicated in footnotes. Ecological aspects, historical and geological changes in climate and vegetation, synoptic conditions giving rise to normal or abnormal temperature, humidity, wind and rain- fall (drought, floods, dust storms, etc.) are portrayed. This is one of the more analytical geographic-climatological studies of a given region. Subject Headings: 1. Climate of Mid- western United States 2. Climate of Eastern United States 3. Synoptic climatology 4. United States.—M./c.
5.1-271 551.582.2(45) *Polli, Silvio, Dati dimatologici di Trieste e dintorni. [Climatic data of Trieste and
neighborhood.] Trieste. Istituto Talassografico, Publicazioni, No. 284, 1953. 10+p. tables. DWB, DLC—Monthly climatic data are tabulated for Trieste (100-year records) and che nearby towns of Barcola (21 years), Servola (16), Opicina (27), Basovizza (34) and 5. Croce (10). Geographical conditions of the localities are described. There appears to be a considerable difference between coastal stations and those situated on the subalpine pro- montories. Subject Headings: 1. Climatic data 2. Climate of Trieste 3. Long period records 4. Trieste.—G.T.
5.1-272 551.582.2(718) *Hare, F. Kenneth (Assoc. Prof. Geography, McGill Univ.), The climate of the island of
Newfoundland: a geographical analysis. Canada. Dept. of Mines and Technical Surveys. Geographical Branch, Geographical Bulletin, No. 2:36-88, 1952. 21 figs., 10 tables + tables in append., refs. In English; French summary p. 88. DLC—A comprehensive study, giving charts of mean, maximum and minimum temperature for Jan. and July, first and latest day of frost, duration of frost free season, annual precipitation and snowfall, beginning and duration of growing season, annual potential evapotranspiration, moisture index and moisture surplus according to THORNTHWAITE and frequency of fog in surrounding seas. Climatological data (temperature, rainfall, cloudiness) presented for 27 stations. Additional selected data given for humidity (at Gander), rainfall variability, frequency of fog, blowing and drifting snow, cloud heights, visibility, "thick weather" and gales. Formation of climatic conditions ex- plained by distribution of ocean currents and ice. Some discussion devoted to access by air and by sea. Subject Headings: 1. Climate of Newfoundland 2. Climatic data 3. New- foundland.—A. A.
CLIMATIC CHANGES
5.1-273 551.583 Brooks, Charles E. P., Outlook unsettled; climate does not stand still. Sunday Times,
London, April 5, 1953. diagr. Abstracted from a clipping. DLC—Deals with trends in warmth and raininess over the British Isles since 1 A.D. The curve prior to 1680 is con- structed from notes in old chronicles, consideration of Norse voyages, etc. Subject Headings: 1. Climatic changes 2. Great Britain.—A. A.
5.1-274 551.583(73) Rodewald, Martin {Hamburg), Rfickgang der Klhnaanderungen in den Vereinigten
Staaten. [Retreat of climatic changes in the United States.] Geografiska Annaler, 39(1/2): 159-167, 1952. 7 figs., table, 3 refs. DWB—In order to determine the cause of climatic change in the United States the author investigated the variations from the normal of the air temperature and precipitation for the decades 1931-40 and 1941-50. As compared with 1931-40 there was a decrease in temperature and an increase in precipitation deviation from the normal. The excess of temperature above the normal declined from +0.44°C to +0.14°C and the precipitation increased from —3.3% below to +3.7% above the normal. Isolines
„ J
I. CURRENT ABSTRACTS 65
illustrating regional distribution show that as compared with 1931-1940 the greatest heat excess and greatest moisture deficiency has shifted. The largest temperature excess is shown by the Atlantic States which also show the greatest moisture deficit. Also the Middle West has experienced the greatest change which during the period 1941-50 has become cooler by 0.5 to 0.7°C and wetter by as much as 20%. Subject Headings- 1. Climatic changes 2. United States.—I.L.D.
5.1-275 551.583.2 Le Danois, Edouard, Le rythme des climats dans l'histoire de la terre et de l'humanitfe.
[The rhythm of climate in the history of the earth and of man.] Paris, Payot, 1950. 204 p. 18 figs. Bibhotheque Historique. DLC—The theory is propounded that the oceans are the | principal source of the heat energy which produces the atmospheric circulation and climatic variation. The waters of the oceans consist of two layers differing in origin (polar and tropical) and in salinity. The tropical waters encroach upon the polar waters and the amplitude of the movements has a periodicity determined by lunar and also by solar periods. This peri- odicity of internal oceanic tides, moon, sun and earth is used to account for climatic changes during geologic time; climatic rhythms of various durations are established. The author describes geologic climates, the biological and climatic consequences of the oceanic encroach- ments, and presents a naive account of climatic determinism in the rise and fall of civilization { and in the history of France. Also the origin of deserts and present climatic trends are dis- j cussed. Subject Headings: 1. Climatic changes 2. Oceanic influences.—I.L.D.
! 5.1-276 551.583.3 (4) :551.577.2 Klein, Annemarie, Die Niederschlage in Europa im Maximum der letzten Eiszeit. Ver-
> such einer Rekonstruktion aus dem Hohenunterschied zwischen damaliger und heutiger Schneegrenzlage. [The precipitation in Europe at the maximum of the last ice age. At- tempt at a reconstruction from the height difference between the snow line then and now.] Petertnanns Geographische Miiteilungen, 97(2) :98-104, 1953. chart, 4 tables, 21 refs. DWB— Assuming that a fall of July temperature by 0.7-0.9°C or an increase of annual precipitation by 150 mm would depress snow line by 100 m, the annual precipitation at Wurm maximum is calculated from the temperatures estimated from frost and forest limits. The values found range from 21% of present precipitation in Hohe Tatra to 80% over northern inland ice sheet. Subject Headings: 1. Precipitation charts 2. Quaternary climates 3. Europe.—C.E.P.B.
5.1-277 551.583.7:551.311 fCailleux, Andre\ Morphoakopische Analyse der Geschiebe und Sandkorner und ihre
- Bedeutung fur die PalMoklimatologie. [Morphoscopic analysis of erratics and sand grains and their significance for paleoclimatology.] Geologische Rundschau, Stuttgart, 40(1) :11-19, 1952. 4 tables, 6 figs., 38 refs. DLC—Rounded limestone erratics come either from fluvio- glacial rivers or rivers in a warm rainy climate; those flattened, little rounded and asymmetric from periglacial rivers. Rounded matt quartz grains are wind-worn. Good examples are found in recent Sahara sands, in periglacial Quaternary of central Europe and in many early
*• geological formations. The reason for their early abundance may be that land plants had not yet appeared. Subject Headings: 1. Sub-aerial deposits 2. Paleoclimates.—C.E.P.B.
I 5.1-278 551.583.7:552.578 i Schwarzbach, Martin (Cologne), Zur Frage des Zusammenhangs zwischen Erdolmutterge- L stein und Vorzeitklima. [The question of the connection between petroleum bearing rock i- . and early climate.] Geologische Rundschau, Stuttgart, 40(1) :81-83, 1952. refs. Discussion j* on preceding article by H. Borchert, p. 83. DLC—H. BORCHERT considered that oil-bearing k rocks were formed in deep water whe^ there was no polar ice. Author thinks other, non- Jf climatic, factors were involved, because: 1) the Red Sea sediment, for example, is poor in i organic material; 2) oil-bearing rocks are mostly shallow water deposits and 3) the poles were %, mostly ice free but oil-bearing rocks are rare. Subject Headings: 1. Paleoclimates 2. Petro- ls leum bearing rocks. I. Borchert, H.—C.E.P.B.
1:
66 METEOROLOGICAL ABSTRACTS AND BIBLIOGRAPHY
MICROCLIMATOLOGY
See also: Climatic environment (Brooks), 5.1-3; Effects of aspect on valley temp. (Davies), S.l-178.
5.1-279 551.584 Biel, Erwin R. (Prof. Met., Rutgers Univ.), Climate may be hotter, colder near the ground.
Science Digest, Chicago, 33 (2) :84, Feb. 1953. DWB—Plants on the surface of the ground i must undergo a much wider range of temperature and humidity than would be suspected from readings made in a conventional instrument shelter at 6 ft height. However, more can } be done to alter the microclimate than can be done to change the general climate. Examples such as dusting snow with black powder, growing shelter belts, irrigation, etc. are cited. * | Subject Headings: 1. Microclimatology 2. Microclimatic amelioration.—M.R.
5.1-280 551.584.61 % *Ota, Iwao, Some observations of microclimate in glass-room. Tokyo. Forest Experiment
Station, Bulletin, No. 59:85-98, March 1953. graphs, diagr., photo. In Japanese; English summary p. 98. DWB—Comparative data are presented for the microclimate in a glass room \ and in the field. The data were obtained for 12 months starting Feb. 1951. The micro- \ climates in the glass room differed from those in the field according to opening conditions of 4 windows and doors and according to weather conditions. Each location within the room showed different microclimatic conditions. Control of opening conditions and proper adjust- ment of the arrangement of plants is recommended. Subject Headings: 1. Greenhouse climates 2. Indoor temperatures.—Author's abstract.
| 5.1-281 551.584 | Roberts, M. H., Some aspects of microclimatology. Farming in South Africa, Pretoria, 1
27(318):437-440, Sept. 1952. 4 figs., 4 refs. DA—The ordinary climatic records are based 1 upon observations made at a height of 4 ft; weather stations are generally planned in repre- ? sentative localities; climatic classifications are based upon means. Hence the usual climatic data are not suitable for studying the climate at plant level or the microclimate. The varia- | tions of the various meteorological elements within the microclimatic layer, the topographical influences upon microclimate—leeward and windward sides of hills, solar orientation—the role of turbulence, and the effect of soil and soil cover are discussed qualitatively. Subject Heading: 1. Microclimatology.—I.L.D. \
f CLIMATIC CLASSIFICATION {
5.1-282 551.585.53 551.582(58) Kliushkin, E. A., Nauchno-issledovatel'skaia stantsiia v pustyne. [Scientific research
station in a desert.] Priroda, Moscow, No. 1:70-73, Jan. 1953. illus. DLC—A sand and desert research station at Repetek near Chardihou in Turkmenian S.S.R. was established s- in 1912. Research in climate, moisture and of sand movement, ecology, agriculture, etc. (250 scientific papers published) carried out. Annual precipitation 100 mm (mostly from Dec. to i April); maximum temperature 40°C (49° in lower layers, 80° at the sand surface), minimum temperature —27°C; relative humidity often <10%; wind SW in winter, NW in summer. i Subject Headings: I. Desert research 2. Desert climates 3. Repetek, Turkmeninstan, * i U.S.S.R.—A .A. I
5.1-283 551.585:63 Fair, T. J. D., Agricultural regions and the European rural farm population of Natal. • j
South African Geographical Journal, Johannesburg, 34:3-19, Dec. 1952. 6 figs., 10 refs. DWB—The different agricultural regions are described in detail. On p. 7 is found a brief * description of how altitude (temperature) and rainfall (or drought) affect agriculture in ' Natal. Farming is successful when terrain is not too rugged at elevations up to 5500 ft, and when annual rainfall is >30". Where rainfall is <30" the land is considered marginal since it occurs in deep valleys where summer temperatures are too high for most types of farming.
t
I. CURRENT ABSTRACTS 67
A chart of mean annual rainfall for Natal (according to 5 class intervals) is presented on p. 8. \ Subject Headings: 1. Agroclimatic regions 2. Rainfall distribution 3. Altitudinal influences \ 4. Natal, South Africa.—M.R.
\ BIOCLIMATOLOGY
See also: Climatic environment (Brooks), 5.1-3; Sum, mean and mean extreme temp, in phenologic»l intervals (Schneider), 5.1-54; Pocket bygrothermograph investigations (Manig), 5.1-69; Nuclei content of air in health resorts (Zenker). 5.1-219.
5.1-284 551.586:63 Whyte, Robert Orr, Crop production and environment. London, Faber and Faber,
1946. 372 p. 32 plates, bibliog. p. 337-355. DLC—Book deals, inter alia, with effects of light and other radiation, and temperature on plants including vernalization, hardening and effects of altering periods of exposure to light and humidity. Geographic distribution of crops in relation to climate also dealt with. Main purpose of book is to explain to practical cultivators the work of plant biologists. Subject Headings: I. Crop yield 2. Environmental influences on crops.—C.E.P.B.
5.1-285 551.586:631:632.1 fOale, Robert Frederick, The influence of phonological period rainfall on the yield of
corn in Iowa. Thesis (M.Sc.)—Iowa State College of Agriculture and Mechanic Arts, 1948. 71 p. 15 figs., 9 tables, 31 refs. Mimeo. DWB—After an extensive review of the literature on weather and corn yield, the author cites statistical tests made by J. WARREN SMITH on the relation between rainfall and yield of corn, indicating that the rainfall for the first two weeks after tasseling is the most critical. Other studies in Iowa, Illinois and Indiana show varying correlations—some indicate the rainfall before tasseling is the most important. Studies made on the basis of extensive corn phenology and weather data for several individual Iowa counties indicate that there are two critical periods: one 3 to 5 weeks before corn is 75% silked, and one 2 weeks after; the second period being less critical than the first. Tem- perature and excessive rainfall are complicating factors, as well as the time trend which is due to use of hybrid corn and better farming methods. Subject Headings: 1. Corn phenology 2. Crop yield 3. Rainfall damage to crops 4. Iowa.—M.R.
5.1-286 551.586:632.7:634.9 Schimitschek, Erwin (Mariabrunn Forstlicht Bundes-Versuchsanstalt), Ursachen von
Ma8senvermehrungen der Tannentrieblaus Dreyfusia Nilsslini C.B. [Causes of the mass increase of the spruce louse Dreyfusia Niisslini C.B.~\ Wetter und Leben, Sonderheft, No. 1:48-54, May 1952. fig., 6 refs. MH-BH—The effect of climatic conditions upon the life cycle of this particular insect is discussed. Warm, dry, spring weather is followed by increases in the population of spruce louse and such favorable weather has persisted since 1945. The importance of microclimatic factors in the development of the spruce louse in the areas that are marginal for the growth of spruce is examined. The increase in spruce lice in lower Austria between Mondsee and Altersee indicates also that areas with high precipitation but with favorable temperatures can be propitious for the life cycle of the spruce louse. The utilization
. . of microclimatic principles for combating this pest is considered. Subject Headings: 1. Forest i entomology 2. Insect control.—I.L.D. i
I 5.1-287 551.586:632.9 634 t*Hawboldt, L. S., Climate and birch dieback. Nova Scotia. Dept. of Lands and Forests,
Bulletin, No. 6, March 1952. 37 p. 11 figs., 3 tables, 68 refs. MH-BH—The history of various birch diseases is summed up and their symptoms and development are described. Literature containing comments on climate and dieback and on recent climatic fluctuations is quoted. Conclusive evidence as to a direct effect of weather conditions on birch diseases is found to be lacking but the healthiest stands in general appear to be situated on sites where
V—
68 METEOROLOGICAL ABSTRACTS AND BIBLIOGRAPHY
moisture and temperature conditions are favorable. Data on the extent of birch dieback and on temperature and precipitation in Nova Scotia and New Brunswick (1870-1949) are tabulated. Subject Headings: 1. Climatic influences 2. Plant diseases 3. Forestry 4. Nova Scotia 5. New Brunswick.—G.T.
5.1-288 551.586:632.9 Schrddter, Harald, tfber die Bedeutung klimatischer Faktoren fur das Rutensterben der
Himbeeren. [On the importance of climatic factors in the death of raspberry vines.J An- gewandU MeUorologie, 1 (6): 184-189, June 1952. 3 figs., table, 6 refs. MH-BH—An in- vestigation of the climatic conditions which favor the infection of raspberry vines by the fungi Didymella applanata and Leptosphaeria coniothyrium and the consequent death of the vines. Mean daily temperatures (0700, 1300 and 1900) at a height 50 cm within the stands and time of incubation of the disease after infection were recorded. Empirical equations relating incubation time to mean temperature by means of a hyperbolic function show that the period of incubation depends upon temperature in such a way that the disease becomes visible only when the infection attains and exceeds a given temperature summation, which depends upon the raspberry variety; the temperature summation begins with thermal de- velopmental zero point of 5CC. The influence of soil moisture is manifested in the fact that localities with slight variations in soil moisture are most unfavorable for the disease producers. Subject Headings: 1. Agricultural climatology 2. Plant diseases 3. Temperature effects.— I.L.D.
5.1-289 551.586:633.1 Daigo, Y. and Suzuki, Y., Climatic division concerning (sic) with the yield of aquatic
rice, wheat, common barley and naked barley. Journal of Meteorological Research, Tokyo, 3(3):79-98, Feb. 1951. 11 figs., 8 tables, 2 refs. In Japanese; English summary p. (5). DWB—An examination of the climatic factors influencing the yield of these crops showed that the yield of aquatic rice is closely related to the vegetation period, the number of days of minimum temperature above 5°C during the year, and the amount of precipitation from May to Oct.; and that the yields of wheat and barley are closely related to the number of days with minimum temperature below 5°C during a year and the amount of precipitation from April to June. Regression equations between yield per ton for each of these crops and the climatic conditions are given. Subject Headings: 1. Grain crops 2. Ecology 3. Temperature effects 4. Precipitation effects 5. Agricultural climatology.—I.L.D.
5.1-290 551.586:633.35:581.5 von Poletika, W., Vergleichcnde KlimaOkologie der Sojaanbaugebiete Eurosiens und
Nordamerikas unter besonderer Beriicksichtigung der deutschen Verhiltnisse. [Com- parative climatic ecology of the soya regions of Eurasia and N. America with special reference to Germany.] Germany. Deutscker Wetlerdienst in the US-Zone, Berichte, No. 42:406-414, 1952. 9 figs., table, 13 refs. DWB—The ecological limits of soya culture are set out, and a "hydrothermic" coefficient /sT-ZiV/(2/w:10) defined, ^V-rainfall, tw — temperature above 10°C. Soya area in U.S.A. is compared with maize area. Supplement gives climatic condi- tions and values of K for 97 stations in soya areas of Eurasia and U.S.A. Subject Headings: 1. Soya bean cultivation 2. Germany 3. United States 4. Eurasia.—C.B.P.B.
5.1-291 551.586:634:632.7(79) Jeppson, L. R., Climate and citrus mites. California Citrograph, Los Angeles, 37(7) :277-
299, May 1952. DWB—Since 1941 the prevalence of the citrus red mite (and several other citrus mites) has been increasing in the Riverside and Redland, Calif, areas and to some extent in the San Joaquin Valley. It has not been found in the warmer and drier parts of the state, however. Effectiveness of control measures depends on weather (most effective from 75°- 90°F, and adversely influenced by moisture). Mite populations are influenced by small variations in weather conditions, so different varieties of mites thrive in different climatic
I. CURRENT ABSTRACTS 69
zones of California and in different years. Research along these lines is being made by the Divisions of Biological Control and Entomology of the University of California. Subject Headings: 1. Agricultural climatology 2. Citrus mites 3. Citrus fruits 4. Southern Cali- fornia.—M.R.
ENVIRONMENTAL INFLUENCES AND SYNOPTIC CLIMATOLOGY
\ See also: Regional differences in world *tmos. circulation (Borchert), 5.1-131; Discon- \ tinuity lines of topographic origin (Sugawara), 5.1-154; Orographic influences on
atmos. pressure and currents (Suguki), 5.1-187.
5.1-292 551.588.1:551.524.3(449.3) 551.589 §Arnaud, C, Influence de la mer sur les temperatures. Quelques types de vent d'Est
[Influence of the sea on temperature. Some types of eastern winds.] La MetSorologie, 4th Ser., No. 26:55-67, April/June 1952. 17 figs., ref. English and Spanish summaries p. 55. MH-BH—A statistical and synoptic study of the seasonal, diurnal and local variations in temperature and in wind (especially the East wind or sea breeze) at Toulon-la-Mitre and at Luc (which is only 49 km from Toulon). The Toulon station, located on a point in the Medi- terranean, naturally is cooler in the daytime and warmer at night in the warm months, and warmer in the daytime during winter, than Luc, which has a continental climate. The magnitude of the differences in temperature and wind are striking and the time of maximum temperature (sometimes before the sea b«t*ze reaches a maximum and sometimes after) is unusual compared with continental stations. The 3 synoptic types that produce east winds of short or long duration or rainfall, are illustrated by series of analyzed surface charts. Sub- ject Headings: 1. Marine influences 2. Temperature variations 3. Synoptic climatology 4. Toulon-la-Mitre, France 5. Luc, France.—M.R.
5.1-293 551.588.1 Hela, Ilrno, Regional distribution of the continentality in the climate of the oceans.
Geophysica, Helsinki, 4(2):41-47, 1953. 3 figs., table, 6 refs. DWB—A modified con- tinentality index, based on latitude and annual temperature range, is proposed with constants derived from climatic data for Siberia and NE Atlantic, which also gives reasonable values in tropical regions. Continentality maps, presented for the oceans between 0° and 60°N, show the great climatic effect of the Asiatic and North American continents on the seasonal temperature variation over the sea. Subject Headings: 1. Continentality 2. Annual tem- perature range 3. Ocean climates.—A. A.
5.1-294 551.588.1 t*Lauer, Wilhem, Humide und aride Jahreszeiten in Afrika und Stidamerika und ihre
Beziehung zu den Vegetationsgiirteln. [Wet and dry seasons in Africa and South America, and their relation to vegetation zones.] Bonner Geographische Abhandlungen, Bonn, No. 9:15-98, 1952. maps, 12 diagrs., 29 tables in text, map and 4 tables at end of book, bibliog. p. 86-96. DWB—Using the aridity index of DE MARTONNE, the author has determined the aridity or humidity of each month for Africa and South America and has classified the climates of these continents on the basis of the number of humid months per year. This classification together with "isohygromens" are represented on a map. A comparison of the isohygromens for the two continents with the climatic vegetation types shows that the large scale natural
V vegetation zonation of Africa and South America is a reflection of the number of humid or arid months. Subject Headings: 1. Arid zone climatology 2. de Martonne index 3. Climatic
| classifications 4. Africa 5. South America.—I.L.D.
i f ' 5.1-295 551.588.2(45) :551.513.2
Cicala, Aldo, Contributo alia climatologia dinamica della Sicilia. [Contribution to the • dynamic climatology of Sicily.] Rivista di Meteorologia Aeronautica, 12(l):22-30, Jan./
March, 1952. 9 figs. Italian, French, English and German summaries p. 22. MH-BH— Jc< A study of the orographic effects on different types of air flow over Sicily. Air flow from each
gradient is discussed with respect to seasonal frequency, cyclonic activity, resulting precipita- k
70 METEOROLOGICAL ABSTRACTS AND BIBLIOGRAPHY
tion, cloudiness, surface wind speed, etc., especially in the N and E portions. Subject Headings: 1. Dynamic climatology 2. Climate of Sicily 3. Sicily.—M.R.
MISCELLANEOUS APPLICATIONS
SOLAR INFLUENCES 5.1-296 551.590.2:551.521
fHanle, Wilhelm (Justus-Liebig-Hochschule, Giessen), Die Erde im Strahlungsfeld von Sonne und Kosraos. [The earth in the radiation field of the sun and universe.] Giessen, W. Schmitz, Dec. 1948. 39 p. 2 tables, 23 figs., bibliog. p. 37-38. Giessener Naturwissen- schaftliche Vortrdge, No. 1. DLC—A review of current knowledge of solar and cosmic radiation effects on the earth's atmosphere, etc.; corpuscular and wave radiation; the nature of the sun; visible radiation, UV, infrared, short wave, X and gamma radiation; meteors and meteorites; particle radiation and, finally, effects at high altitudes and the short and long period variations are discussed in separate chapters. Useful tables of the relative masses of meteorites, electrons, positrons, protons, neutrons, etc., and the electromagnetic spectrum with corresponding wave length, frequency and energy in electron volts are appended. Subject Headings: 1. Solar radiation effects 2. Cosmic radiation 3. Electromagnetic spectrum.—M.R.
5.1-297 551.590.21:551.577(73) *Mauchly, John W. (Eckert-Mauchly Div., Remington Rand, Inc.), Evidence for effects
of day-to-day solar variations on weather. Rev. digest of paper to be presented April 30, 1953 before the American Meteorological Society meeting in Washington, D. C. (Climatology session) 6 p. tables. Mimeo. DWB—Mean ratio of average precipitation over North America on solar disturbed days to the mean on all days, computed for 48 months, is 9.2% below unity which is 3.05 times the standard deviation expected by chance. Combining the deviation with similar ratios computed for wind speed at single stations, and applying HOT- TELING'S "T" test, a still higher significance level was found. Subject Headings: 1. Solar influences 2. Precipitation 3. U.S.A.—A.A.
VISIBILITY
See also: Visual thresholds (Bouman), 5.1-31; Visual range calculation (Pinegin. Boldy- rev. Barteneva), 5.1-32; Annual met. tables (Falkland Islands, Met. Service). 5.1-46.
5.1-298 551.591(52) •Kurihara, S. (Niigata Univ.), Statistical research on visibility. Meteorological Society
of Japan, Journal, 31(2):60-75, Feb. 1953. 7 figs., 7 tables, 8 refs., 5 eqs. In Japanese; English summary p. 60-63. MH-BH—This study is based on meteorological observations at Takada, Nagano, Kumagaya and Yokohama (1949-1951). The data presented in tabular and graphical form show the relation between visibility and relative humidity, wind direction, wind velocity and snowfall. Seasonal and diurnal variations of visibility are also analyzed. Empirical formulas are derived for the dependence of visibility on these factors. Subject Headings: 1. Visibility 2. Visibility variations 3. Visibility data 4. Japan.—G. 7".
5.1-299 551.591:551.510.42(52) Miura, Akira (Tohoku Univ.), Opacity and atmospheric impurities. Tokoku University,
Science Reports, 5th Ser., Geophysics, 4 (3) :116-124, March 1953. 26 figs., 16 refs. MH-BH— On the basis of simultaneous observations of visibility, relative humidity, wind speed, the number of condensation nuclei and the quantity of atmospheric impurities, the author under- takes a graphical investigation of correlations between these factors. The observations were made at Tohoku University (Aug. 1951-July 1952). Instruments and methods used are described. It is found that opacity at Sendai increases with increasing humidity and at- mospheric impurities; it decreases with wind speed over the land; it appears to be practically independent of the number of condensation nuclei. Subject Headings: 1. Visibility 2. At- mospheric pollution 3. Sendai, Japan.—G.T.
^=^
I. CURRENT ABSTRACTS 71
OPTICAL PHENOMENA
See also: Colored sun (Penndorf), 5.1-6; Explanation of brightness and color of sky (Hulburt), 5.1-158.
5.1-300 551.593 Piaskovskaia-Fesenkova, E. V., Nekotorye svolstva atmosfernykh indikatris rasseianiia
sveta. [[Some characteristics of the atmospheric indices of light scattering.J Akademiia Nauk, S.S.S.R., Doklady, 88(l):53-56, 1953. 3 tables, ref., 9 eqs. DLC—Author came to the conclusion that for a certain angle of scattering 55°<#<60° the ratio nix is practically constant (1/4*-) and does not depend on the form of the atmospheric indices of scattering or the wave length (M—coefficient of scattering under the angle 6, i—optical thickness of the atmosphere in the given part of the spectrum without absorption). This conclusion, verified by observations, is checked against the theoretical results of KRAT which give the same result. Subject Headings: 1. Scattering of light 2. Atmospheric optics.—A.A.
5.1-301 551.593.1 Squire, Charles F. (The Rice Inst., Houston), Note on reflection and diffraction from ice
crystals in the sky. Optical Society of America, Journal, 42(10):782, Oct. 1952. photo. Jackinot, P. and Squire, C. F., (same title) ibid., 43(4):318, April 1953. ref. DWB—In Note 1 the author presents a photograph (one among several taken in flight on Feb. 6, 1952 at 12,000 ft over the Tennessee mountains around noon) showing a circular spot of sunlight reflected by ice crystals and an elliptical diffraction ring surrounding it. Details of photo- graphic exposure are described. Note 2 gives a simple explanation of the elliptical diffraction ring; the only requirement is an arrangement of the flat surfaces of the ice crystals in a hori- zontal plane with which the sun's rays form a certain angle. Subject Headings: 1. Refraction phenomena. I. Jackinot, P.—G.T.
5.1-302 551.593.55 Berthier, Pierre, Variations d'intensite des raies 6300 et 6364 A de l'oxygene au cours
des crepuscules du matin et du soir. [Variations of the intensity of the 6300 and 6364 A radiation of oxygen during twilight.] Academic des Sciences, Paris, Comptes Rendus, 236(16): 1593-1595, April 20, 1953. 2 figs., refs. DWB—This paper is a contribution to the study of the twilight oxygen spectrum by measurements made with a spectrograph having par- ticularly strong dispersivity (340 A/mm at 6300 A). The instrument was constructed by J. COJAN. Results of the measurements are graphically analyzed. The curve of luminescence as a function of altitude shows maximum intensity between 90 and 100 km. Subject Headings: 1. Spectrophotometry 2. Twilight luminescence spectra 3. Oxygen spectra.—G.T.
5.1-303 551.593.652:551.558.21 Barrington, C. R.; Wilkins, J. W., Iridescent wavelike clouds. Meteorological Magazine,
London, 82(974) :248-249, Aug. 1953. fig., plate. MH-BH—BARRINGTON describes up to 16 ACu bands at London Airport, Feb. 19, 1953, forming crests of successive waves. WILKINS describes similar clouds seen from Dunkeld, Scotland, May 25, 1953. Subject Headings: 1. Nacreous clouds 2. Lee waves.—C.E.P.B.
ELECTRICAL PHENOMENA
See also: Elect, properties of blizzards (Barre), 5.1-2; Radioactive snow gage (Gerdel). 5.1-65; Morphology of ionospheric variations associated with magnetic disturbance (Martyn). 5.1-116.
5.1-304 551.594 Israel, Hans, Rapporti fra i fenomenl elettrici e meteorologici nell'atmosfera. [Relation-
ship between electric and meteorological phenomena of the atmosphere.] Geofisica e Meteor o- logia, Genoa, 1(2):94-14, Jan./Feb. 1953. 15 figs. DWB—A comprehensive summary of current knowledge concerning diurnal and seasonal variations in the electric field of the earth and atmosphere, under different latitudinal, geographical and meteorological conditions. The
72 METEOROLOGICAL ABSTRACTS AND BIBLIOGRAPHY
relation to the diurnal variation in water vapor in the atmosphere is vividly illustrated as are also other variations (examples of graphs from stations in all parts of the world are reproduced). Subject Headings: 1. Electrical phenomena 2. Diurnal atmospheric electricity variations. —M.R.
5.1-305 551.594.1:551.551(485) Norinder, Harald and Siksna, Reinhards, Variations of the concentration of ions at
different heights near the ground during quiet nights at Uppsala. Arkw for Geofysik, Stock- holm, 1(19) .-519-541, 1953. 20 figs., refs. p. 540-541. DWB—Ion density in the air near the ground was measured by section of air from different levels. Its dependence on turbulence is discussed. Apparatus and techniques used are described. Some disturbances arose from insect and radioactive deposits. Results presented graphically for selected nights, dis- tinguishing small and large ions and showing also temperature, humidity and wind conditions. Subject Headings: 1. Ion density 2. Turbulence in the frictional layer 3. Uppsala, Sweden.— A.A.
5.1-306 551.594.1 'Argentina. Servicio Meteorologico Nacional, Resumen y analysis de observaciones de
electricidad atmosferica (Pilar), 1924-1936. [Resume' and analysis of observations of atmos- pheric electricity at Pilar Geophysical Observatory, 1924-1936.] Argentina. Servicio Meteoroldgico Nacional, Series B, Sec. 2, Pt. 3, No. 1, 1952. mostly tables and graphs. DWB —This report presents an elaborate statistical and graphical analysis of the data on atmospheric potential gradient, ionization and coefficient of dispersion for each month from 1924-36. Analyses include average diurnal and seasonal values of these elements and correlation with precipitation, wind speed, etc. The station is described. Subject Headings: 1. Magnetic observatories 2. Atmospheric potential gradient data 3. Ionization data 4. Pilar Geo- physical Observatory, Cordoba, Argentina.—M.R.
5.1-307 551.594.11 Venkiteshwaran, S. P., Dhar, N. C. and Huddar, B. B., On the measurement of the
electrical potential gradient in the upper air over Poona by radiosondes. Indian Academy of Sciences, Bangalore, Proceedings, Sec. A, 37(2):260-267, Feb. 1953. 3 figs., 4 refs. DLC— A method of measuring continuous variations in potential gradient with height is described and illustrated. The device is attached to an ordinary U. S. Signal Corps radiosonde and the record received is similar to the usual temperature record—that is, a continuous series of dots show the ambient electrical conditions except when the transmitter arm is recording pressure at fixed intervals. Either positive or negative or both types of potential gradient can be recorded if the connections are properly arranged before the ascent. Lead nitrate fuses or polonium collectors give similar soundings as shown by 2 flights made about a half hour apart at Poona. Subject Headings: 1. Atmospheric potential gradient measurement 2. Radio- sondes 3. Poona, India.—M.R.
5.1-308 551.594.12 Vitale, Bruno, L'equilibrio ionico nella bassa atmosfera e le teorie sulla ricombinazione.
[The ion equilibrium of the lower atmosphere and the theories of recombination.] Annali di Geofisica, 5(2):257-271, April 1952. 3 figs., 2 tables, 15 ref. Italian and English summaries p. 270-271. MH-BH—Simplifying hypotheses used in the study of ion equilibrium are examined as well as their applicability to the study of the low atmosphere. A similar analysis is conducted on the ion recombination theories and on the theoretical expressions of the re- combination coefficients. With the use of particular simplifying hypotheses, relationships between limit ionic densities, recombination coefficients and some meteorological agents responsible for the equilibrium, namely temperature and condensation nuclei size, are obtained. Subject Headings: 1. Ion equilibrium 2. Ion recombination theory.—Author's abstract.
5.1-309 551.594.14 Hess, Victor F. (Fordham Univ., N. Y.), On the ionization produced by gamma radiation
from the ground and from the atmosphere. Journal of Geophysical Research, 58(1):67—72,
I. CURRENT ABSTRACTS 73
March 1953. table, 5 refs., 4 eqs. DWB—Two new methods for quick determination of the ionization produced by the gamma rays from the radioactive substances in the ground are discussed. The first ("absorption method") utilizes partial screening of a portable ionization meter with a lead shield of one centimeter from the bottom and from the sides, and empirical determination of its absorbing power. This method was tried out in field experiments and its results agree very well with the results obtained with the conventional method (alternative measurements over soil and over water). The second method ("well method") consists in placing a cylindrical ionization chamber inside an iron housing with a wall 10 cm thick, but open at the top and on the bottom. The chamber is used in two positions inside this "iron well" and from the difference of ionization observed at these two positions the total value of the terrestrial gamma radiation can be derived. Both methods can also be used for determining the gamma radiation coming from the atmosphere ("air radiation"); however, the smallness of this effect makes it difficult to get reliable results. Discrepancies arising in this case are discussed. Subject Heading: 1. Radioactive emanations.—Author's abstract.
5.1-310 551.594.21 Norinder, Harald and Siksna, Reinhards, Ionic density of the atmospheric air near the
ground during thunder-storm conditions. Arkiv for Geofysik, Stockholm, 1 (16) :453-472, 1953. 14 figs., refs. p. 471-472. DWB—Investigating ionic density near the ground during thunderstorms, a rise of the concentration of small ions of both polarities during showers of precipitation was observed. The increase occurs in few minutes, and the density then de- creases rapidly (sample figures shown). "Corona discharge of the high charged precipitation particle and the radioactive substances in precipitation may be assumed as the producers of ions." No influence of lightning strokes on ionic density was observed. Some observations made on "showers" of large ions. Subject Headings: 1. Thunderstorm electricity 2. Ion density.—A. A.
5.1-311 551.594.51 Sayers, N. D. and Emeleus, K. G. (Queen's Univ., Belfast), Experiments on production
of auroral radiation. Physical Society of London, Proceedings, Ser. A, v. 65, Pt. 3(387) :219-226, March 1, 1952. 3 figs., 14 refs. DWB—Further experiments have been made on the pro- duction in the laboratory of the "forbidden" red and green auroral lines, and the ultra- violet transauroral line of OI. The mean concentration of oxygen atoms in the l'So and 5*D states in the colums has been found from absolute intensity measurements. The decay of the green radiation produced by a Tesla discharge through a high pressure source has been in- vestigated with a photomultiplier tube. It occurs at approximately the rate to be expected if the atoms in the 'S state are undergoing spontaneous transitions to lower atomic levels, but complicating factors make it difficult to deduce transition probabilities from the experiment. Subject Headings: 1. Auroral radiations 2. Artificial auroras.—Authors' abstract.
5.1-312 551.594.7:551.510.535 Kilpatrick, E. L. (Nail. Bureau of Standards, Wash., D. C), Polarization measurements
of low frequency echoes. Journal of Geophysical Research, 57(2) :221-226, June 1952. 3 figs., 3 refs. MH-BH—Polarization of a 160 kc plane polarized signal propagated upwards and reflected by the ionosphere at Sterling, Virginia, October 15-November 30, was characterized by a stable elliptical pattern oriented 60-70°E of magnetic north, ratio of axes \ to { and left hand rotation of polar vector. Short periods of unstable polarization occurred at sunrise, sunset and irregular times. Subject Heading: 1. Ionospheric reflection.—C.E.P.B.
ACOUSTICAL PHENOMENA 5.1-313 551.596.1:551.547 Caro, D. E. and Martin, L. H., Velocity of sound in air at low pressures. Nature, London,
172(4374) .-363-364, Aug. 22, 1953. 5 refs., 2 eqs. DLC—A significant increase of velocity of sound has been reported below 15 cmHg. New experiments are described. After correction it was found that at 1000 and 250 cycles/sec there is no variation of free-space velocity with pressure down to 5 mmHg. Subject Heading: 1. Acoustical propagation.—C.E.P.B.
74 METEOROLOGICAL ABSTRACTS AND BIBLIOGRAPHY
5.1-314 551.596.1:534.2 fPost, E. J. (Natl. Res. Council, Ottawa, Canada), Radiation pressure and dispersion.
Acoustical Society of America, Journal, 25(l):55-60, Jan. 1953. 3 figs., bibliog. p. 59-60, 8 eqs. DLC—The present paper starts with a brief discussion of the two components of acoustical radiation pressure in contrast with the single component obtained for electromagnetic i radiation in vacuum. The two components of acoustical radiation pressure are correlated in a simple manner with the two distinct interaction possibilities of the obstacle and the medium, , i i.e., interaction with the wave motion only or interaction with the wave motion as well as with the medium itself. This picture appears to be consistent with the earlier conclusions of BRILLOUIN and RICHTER. Afterwards the result is generalized for dispersive media. It is j shown that the component which is usually stated to be independent of the equation of state j in the existing nondispersive theories should contain the time parameters of the equation of { state in the form of a multiplying factor group, velocity over phase velocity. The present paper stresses the basic concepts rather than mathematical detail and concludes with an extensive bibliography and commentary. Subject Headings: 1. Acoustical propagation 2. i Bibliographies.—Author's abstract. \
PART n. SELECTIVE ANNOTATED BIBLIOGRAPHY ON GENERAL OCEANOGRAPHIC METEOROLOGY
By: Mollie P. Kramer
INTRODUCTION Centennial
(1853-1953)
The convening of the first international Maritime Conference at Brussels for the adoption of a uniform system of meteorological observations at sea as suggested
by Matthew Fontaine Maury.
The undisputed influence of the oceans on weather and climate coupled with the growing interest being expressed by meteorologists in oceanography as the latter science "comes of age" have occasioned a series of bibliographies on oceanographic meteorology in this journal, the second and most comprehensive of which appears below.
For regional references to the Marine meteorology and climatology of the Pacific Ocean, see Vol. 4, No. 9, Sept. 1953, Meteorological Abstracts and Bibliography. Similar regional studies for the Atlantic, Indian and Antarctic Oceans are in preparation. Bibliographies on the physical and dynamical aspects of oceanography as related to meteorology, specifically Energy and mass exchange between the sea and atmosphere, Wind waves, Winds and ocean currents and Storm floods will also appear in subsequent issues. Descriptive comments on the contents of and omissions from the general bibliography below follow.
Textbooks and manuals This section is fairly exhaustive in its inclusion of those textbooks generally found in the libraries
of oceanographic institutions. Expeditions
Reference is made to the complete scientific results of each major oceanographic expedition or to selected advance articles dealing with recent expeditions (Finnish Atlantic, 1939; "Albatross," 1947-48; Maudheim, 1949-52; "Galathea," 1950-52; Project Skijump, 1951-52) in cases where the scientific results have not yet been published. Reports of research during the "Campagnes scientifi- ques du Prince de Monaco," the "Marion" Expedition to Davis Strait and Baffin Bay (1928), the Gulf Stream Multiple Ship Survey (1950), the cruises of the Texas Agricultural and Mechanical College research vessel "Alaska" in the Gulf of Mexico (1951-52), the investigations of the Scripps Institution of Oceanography "Crest" and "Horizon" along the California coast and other similar reports have been omitted either because they deal almost exclusively with marine biology, sedi- mentation, chemistry and bathymetry or because their limited geographic scope made the inclusion of such reports in the regional bibliographies on marine meteorology more meaningful. For a Chronological list of the main maritime discoveries and explorations see the Hydrographic Review. Monaco. 21:130-169, 1944.
Charts and atlases The inclusion of charts and atlases has been limited to the better known publications dealing
generally with entire oceans or the world and to selected examples of the Japanese and German wartime charts. Charts of lesser geographical scope such as the K. Ncdcrlandsch Meteomlogisch Instituut Red Sea and Gulf of Aden {see 2J-239, Oct. 1951, MAB) or Zeen rond Australia (see 4D-197, April 1953, MAB) will be included where possible in the regional bibliographies to appear subsequently. For charts and atlases of the Pacific, see items 41-1, -8, -25, -48, -90, -92, -136, -151, -161, -229, and -248 in Sept. 1953, MAB. Other well known sources of local marine meteoro- logical data not included are the Great Britain. Hydrographic OfHce Pilots and the U. S. Hydro- graphic Office Coastal pilots and Sailing directions and the U. S. Naval air pilots. For further information on Recent British marine meteorological and surface current atlases, see article by H. Jameson in the Marine Observer, 21(152):115-119, April 1951. Space limitations have also made impossible the inclusion of charts and tables of sea surface temperature and salinity such as the monthly charts prepared chiefly for fishery use by the Conseil Permanent International pour 1'Exploration de la Mer.
75
^d
76 METEOROLOGICAL ABSTRACTS AND BIBLIOGRAPHY
Marine meteorology
This section, constituting the largest subdivision of the bibliography, comprises what is hoped will be a representative selection of references dealing with marine influences on weather, general analogies and interrelationships between oceanography and meteorology, forecasting for ocean areas, microseisms and ocean storms, ocean weather ships and merchant marine cooperation, saline nuclei, and a few observations of meteorological elements over the sea. For example, only a limited number of references to wind over the sea are included (e.g., see SA-136, -142, -146, -202 below) because that subject will receive fuller treatment in a future bibliography. Likewise, reference has been made to only certain outstanding articles dealing with energy exchange such as those by Jacobs (SA-176) and Sverdrup (5A-179) on energy transformation and evaporation respectively.
Periodicals Some comments on the issuing bodies or institutions have been incorporated in the abstracts.
For further information see the extensive list of oceanographic institutions, their activities, facilities and provisions for publication of results in Vaughan, International aspects of oceanography (5A-27) Certain periodicals such as the Institute EspaHol de Oceanografia, Boletin, the University of Wash- ington, Publications in Oceanography or the Conseil Permanent International pour l'Exploration de la Mer, Publicaciones de circonstance are omitted because their subject matter is almost entirely marine biology.
Bibliographies The Union of South Africa, Weather Bureau at Pretoria, is preparing a bibliography on Ant-
arctic and the Southern Ocean which to our knowledge has not yet been published. References included represent a fairly random selection of regional bibliographies and a few references to lists of the contents of well known periodicals.
Major data sources
In the Outline of Contents below there will be found a section (Charts and Tabulated Data) in which all major data sources included in this bibliography have been grouped, regardless if they take the form of periodicals, expedition reports, marine atlases or whatever. The research worker should also bear in mind that over 20,000.000 marine weather observations (including German and Japanese) taken during the last century by mariners the world over are recorded on punched cards on file at the National Weather Records Center at Asheville, North Carolina. Large quantities of un- published oceanographic and marine meteorological data are also on file at the U. S. Hydrography Office, the Woods Hole Oceanographic Institution, the Seewetteramt in Hamburg, Germany, and at other world famous research centers.
The asterisk (*) is used to denote a good source of data, the dagger (f) a good source of references and the symbol ($) a source of synoptic material. The library symbol DN-HO identifies material most easily obtainable at the U. S. Hydrographic Office library in Suitland, Md. The symbol MWB stands for the library of the Marine Biological Laboratory (depository for the Woods Hole Oceanographic Institution) at Woods Hole, Mass., which, to our knowledge, is the only convenient source of a few of the items listed below and where almost all of them can be found. Interlibrary loans with Woods Hole can be arranged between Oct. 15 and April 15.
We wish to express our appreciation to Dr. Columbus O'D. Iselin of the Woods Hole Oceano- grapbic Institution for his interest and guidance in the early stages of the preparation of this bib- liography and to Dr. Harald U. Sverdrup, Director of the Norsk Polarinstitutt, Oslo, for his valuable suggestions regarding the contents of this and ensuing oceanographic bibliographies.
OUTLINE OF CONTENTS
PLAN OF OUTLINE
Textbook! and Manuals (subdivided by language of publication) Major Expedition Report! (listed chronologically by beginning date of expedition
and grouped geographically by region investigated) Chart! and Tabulated Data (comprising publications devoted exclusively to charts
and data as well as noteworthy sources of charts and data in textbooks, expedition reports, etc.; grouped geographically by oceanic region and by subject according to meteorological or oceanographical element charted or tabulated)
Marine Meteorology (comprising descriptive accounts of weather and meteorology at sea; subdivided into a Subject outline by meteorological element, theory or technique discussed and a Geographic outline by region described)
Periodicals (arranged by language and by country) Bibliographies (grouped by subject and by geographic region)
IT. BIBLIOGRAPHY ON GENERAL OCEANOGRAPHIC METEOROLOGY 77
TEXTBOOKS AND MANUALS
{5A-1 to -58)
Language of Publication Dutch, 5A-42. -44, -52 English, 5A-1 to -3. -10. -13, -14. -17, -19.
-21, -23, -26. -27, -31 to -33, -35 to -37, -39, -47 to -51, -56 to -58, -247, -250
French, 5A-4, -7, -12. -20. -30 German, 5A-6, -8, -9, -18, -22, -25, -29, -34,
-55 Italian, 5A-24. -46, -54 Norwegian, 5A-28, -43 Russian, 5A-11. -38, -41. -45, -53, -251 Spanish, 5A- 5, -15, -16, -40
MAJOR EXPEDITION REPORTS (5A-59 to -85)
Chronological List of Expeditions Challenger Expedition 1873-1876(5A-59) Norsk Nordhavsexpedition ("V0ringen")
1876-1878 (5A-60) Deutsche Tiefsee-Expedition ("Valdivia")
1898-1899 (5A-61) Second Norwegian Arctic Expedition
("Fram") 1898-1902 (5 A-62) Deutsche SUdpolar Expedition ("Gauss")
1901-1902(5A-63) Scottish National Antarctic Expedition
("Scotia") 1902-1904 (5A-64) DeuxiSme Expedition Antarctique Francaise
("Pourquoi-Pas") 1908-1910(5A-65) "Michael Sars" North Atlantic deep-sea
expedition 1910(5A-66) Australasian Antarctic Expedition ("Aurora")
1911-1914(5A-67) "Maud" Expedition (Norwegian North Polar)
1918-1925 (5A-68)
Danish "Dana" Expeditions 1920-1922 (SA- 69)
"Meteor" Expedition (Deutsche Atlantische) 1925-1927 (SA-70,-71)
"Discovery," "William Scoresby" and "Dis- covery II" Expeditions 1925-1950(5A-72)
Norwegian Antarctic Expeditions ("Norvegia" and "Whale") 1927-1928(5A-73)
"Carnegie" Expedition (Cruise VII) 1928- 1929(5A-74)
"Snellius" Expedition (Netherlands East Indies) 1929-1930 (5A-75)
"Nautilus" Expedition 1931 (5A-76) John Murray Expedition ("Mabahiss") 1933-
1934(5A-77) Papanin Expedition ("Severnyi Polius")
1937-1938 (5A-78) "Sedov" Drifting Expedition 1937-1940(5A-
79) Finnish Atlantic Expedition 1939 (5A-80) Operations Highjump (4th Byrd Antarctic
Expedition) 1946-1947 (5A-81) "Albatross" Expedition (Swedish Deep Sea)
1947-1948 (5A-82) Australian National Antarctic Research Ex-
pedition 1947-1949 (5A-67) Maudheim Expedition (Norwegian-British-
Swedish Antarctic 1949-1952 (5A-83, -246) "Galathea" Expedition 1950-1952 (5A-84) Project Skijump in the Polar Sea 1951-
1952(5A-85)
Geographical Outline of Expeditions Voyages of circumnavigation, 5A-59, -82, -84 Atlantic Ocean, 5A-60, -61, -63, -64, -66,
-69 to -74, -80 Pacific Ocean, 5A-74, -75 Indian Ocean, 5A-61, -72, -77 Arctic Ocean, 5A-62, -68, -76, -78, -79 Antarctic Ocean, 5A-64, -65, -67, -72, -73.
-81, -83, -85
CHARTS AND TABULATED DATA
Geographic Region
World
i» Atlantic Ocean V
North Atlantic
*
South Atlantic Marginal Seas
Pacific Ocean North Pacific
South Pacific Marginal Seas
Indian Ocean
r Arctic Ocean
|fer Antarctic Ocean
'k
(SA-86 to -115)
Charts 5A-27, -32, -88, -94. -96. -103,
-107.-108.-113 5A-34,-89,-97,-115
5A-87, -90 to -92, -101, -104, -105,-109 to-112.-184
5A-90
5A-25, -89, -97, -99. -115 5A-66, -104, -105, -109, -111,
-112,-184 5A-67. -104 5A-99, -102, -164 5A-25. -67, -77, -89, -97, -104,
-115 5A-87, -92, -101, -102, -105,
-111.-112 5A-67, -92, -101
Tabulated Data 5A-59, -93 to -95. -106. -114
5A-61, -63, -73, -74, -80, -100, -133
5A-60. -69, -105, -110
5A-64, -70 5A-86 5A-74, -100 5A-66, -105, -213
5A-67 5A-9, -75, -164 5A-61, -67, -100, -133
5A-38, -60, -62, -68, -76, -78, -79, -85, -102, -105
5A-64, -65, -67,.-72, -73, -81. -83
78 METEOROLOGICAL ABSTRACTS AND BIBLIOGRAPHY
Meteorological and Oceanograpbical Elements
Air temperature
Upper air temperature
Atmospheric disturbances (storms at sea)
Anticyclones Cyclones Hurricanes Thunderstorms Typhoons
Atmospheric pressure
Upper air pressure
Cloudiness
Magnetic declination Ocean currents
Precipitation
Sea ice
Sea surface temperature' and salinity
State of the sea
Weather Wind
Surface wind
Upper air wind
Gales Visibility, fog. haze, humidity
Charts 5A-2S. -34, -66. -88. -90, -91,
-96, -97, -107. -115
5A-67, -99, -105, -109
5A-88, -90,-109. -115
5A-184 5A-97, -104, -184 5A-104 5A-107 5A-104 5A-25, -34, -66, -67, -88. -96,
-99. -104, -105, -109. -112, -115,-184
5A-67. -99, -105, -184
5A-25, -34. -91, -97. -107
5A-88.-104, -109.-115 5A-25. -32. -34, -88, -90, -96,
-109, -115 5A-25, -34. -90, -94, -97, -107
5A-87, -90, -92, -101, -102, -108,-111,-164
5A-25, -27, -32, -34. -66, -77. -87. -90. -91. -97, -108, -109, -115. -184
5A-97
5A-91. -184
5A-25. -34. -67. -90, -91. -96, -97, -99, -104, -105. -107
5A-67. -99, -104. -105, -109, -110
5A-115 5A-90. -97, -104, -107, -109.
-115
Tabulated Data SA-59, -60, -62 to -65. -68,
-72, -73, -75, -79. -81, -83, 88. -91, -95, -100, -106,
-133 5A-61, -66, -67, -70. -74. -78,
-80, -86,-105, -114
5A-59 to -62. -64 to -68, -70. -72 to -75. -78 to -81, -88. -93. -95. -100. -105. -106. -114,-133
5A-67. -70, -74. -80, -81, -105. -114
5A-63, -64, -68. -78, -80, -86. -91, -100, -133
5A-9, -70, -79, -86. -93
5A-64, -79. -93 to -95, -100, -106. -133
5A-38, -79, -93, -102. -111. -164
5A-9. -59, -63, -64. -66. -68 to -70. -73. -74, -76, -79, -85, -86, -91,-93
5A-59, -69, -70, -72, -81. -86. -93
5A-69. -79, -86, -91
5A-59. -60, -62 to -70, -72, -78 to -80, -83, -86. -91, -100. -105, -133
5A-67, -74. -80, -81, -105, -110, -114
5A-64. -68, -80, -81. -86
I
MARINE METEOROLOGY (5A-U6 to -207)
SUBJECT OUTLINE
Descriptive accounts of meteorological ele- ments at sea
Cloudiness, 5A-133, -149 Convective currents, 5A-151, -168, -176,
-186 Humidity. 5A-149, -184 Polar outbreaks, 5A-190 Precipitation, 5A-118, -133 Pressure, 5A-126, -133, -149 Saline nuclei, 5A-138, -162. -163, -171,
-196, -197 Sea surface temperature and salinity, 5A-
124, -126, -149, -184
Solar radiation, 5A-124. -125 Storms at sea, 5A-181
Anticyclones, 5A-156 Cyclones, 5A-193 Hurricanes, 5A-143, -183 Typhoons, 5A-128. -198
Temperature. 5A-133, -149, -184 Winds, SA-122, -126, -133, -136, -146,
-149. -184, -197 Upper air winds, 5A-190, -202 Trade winds, 5A-123, -130, -142
Visibility (inch fog and haze), 5A-189 Weather observation at sea
Expeditions (see detailed breakdown above), 5A-59 to -85
Merchant marine and navy observational programs, 5A-147,-155,-157,-181.-203, -206

II. BIBLIOGRAPHY ON GENERAL OCEANOGRAPHIC METEOROLOGY 79
5A-144. -152, -154. -167, GEOGRAPHIC OUTLINE
I
Weatherships, -175, -200
Observational techniques, 5A-149, -150, -152, -158, -162, -171, -189, -202
Ocean weather forecasting, 5A-141, -150, -165. -167. -170, -184
Ice forecasting (sec bibliography on the Synoptic meteorology of the Arctic in a subsequent issue of Meteorological Ab- stracts)
Microseismic storm tracking, 5A-143. -147, -148, -153. -181. -183. -198
Ocean weather map preparation. 5A-141. -160. -206
Radar reconnaissance, 5A-167, -201 Tropical storm forecasting, 5A-160
Interrelationships of oceans and atmosphere Air mass modification over the sea, 5A-169 Air flow over islands, 5A-186 Atmospheric and oceanic circulation, 5A-
205 (a bibliography on Winds and Ocean Currents will appear subsequently in Meteorological Abstracts)
Energy exchange between sea and atmos- phere, 5A-173. -176, -178. -179, -207 (a bibliography on this subject will appear subsequently in Meteorological Abstracts)
Marine influences on climate, 5A-123, -125, -132, -155, -161, -205
Ocean currents and weather, 5A-139, -140, -170
Ocean temperatures and long range fore- casting, 5A-117. -120, -121,-124, -126, -129
Lake influences on climate, 5A-134 Analogies between ocean and atmosphere
Stability criteria. 5A-131 Inertia oscillations, 5A-137 Circulation, 5A-137, -151 Temperature distribution, 5A-173
Oceanographic research, 5A-166, -177, -180, -182, -187, -188, -195, -204. -247
Ocean geography, 5A-135 History of oceanography and marine meteor-
ology, 5A-116, -119. -127. -130. -145, -174, -191, -247, -249
International cooperation in marine meteor- ology, 5A-119 -144, -154, -172, -175. -195, -199, -201, -247, -249
Sea ice (see also bibliography on the General meteorology of the Arctic to appear in MAB)
Characteristics, 5A-164 Distribution, 5A-164 Glossaries of terminology, 5A-194 International ice patrol, 5A-201, -232
Applications of marine meteorology Industrial, 5A-165, -192 Military, 5A-145 Study of climatic change, 5A-159, -172
Oceans Atlantic Ocean, 5A-118, -122, -130, -133,
-153, -167, -206 North Atlantic. 5A-11V, -120, -121, -123.
-124. -144, -152, -154, -184 to -186 Marginal Seas, 5A-120, -143, -148, -161,
-175,-183 Pacific Ocean, 5A-118. -122, -130, -141,
-181 North Pacific, 5A-184 Marginal Seas. 5A-136, -164, -198
Indian Ocean, 5A-118, -122, -130. -133, -206
Arctic Ocean Marginal seas, 5A-136
Antarctic Ocean, 5A-190, -206 Land
Europe. 5A-123. -32, -137, -153, -169 Scandinavia, 5A-117. -120, -170 Yugoslavia, 5A-188
Peru, 5A-1<0, -170 U.S.S.R.. 5A-134. -166, -177, -180 United States, 5A-187, -204
PERIODICALS; AND SERIALS (5A-20S to -234)
By language Dutch, 5A-21V English, 5A-212, -213, -215, -216, -218, -219.
-221. -222. -224 to -228, -230, -232 to -234. -236, -248
French, 5A-215. -218, -220, -221 German. 5A-208 to -211, -215 to -219, -231,
-245 Italian, 5A-223 Japanese, 5A-225, -229 Russian, 5A-244 Spanish, 5A-214
By country Germany
Deutsches Hydrographisches Institut (Hamburg), 5A-217, -231
Deutsche Seewarte (Hamburg), 5A-208. -209
Deutscher Wetterdienst, Seewetteramt, 5A- 245
Institut ftlr Meereskunde (Berlin, Uni- versitat), 5A-211
Great Britain Meteorological Office (London), 5A-227
Indonesia (K.) Magnetisch en Meteorologisch Ob-
servatorium te Batavia, 5A-219 International organizations
International Council for the Exploration of the Sea. 5A-215.-216
International Hydrographic Bureau (Monaco). 5A-221
International Union of Geodesy and Geophysics, 5A-222
Italy Istituto Idrografico (Genoa), 5A-223
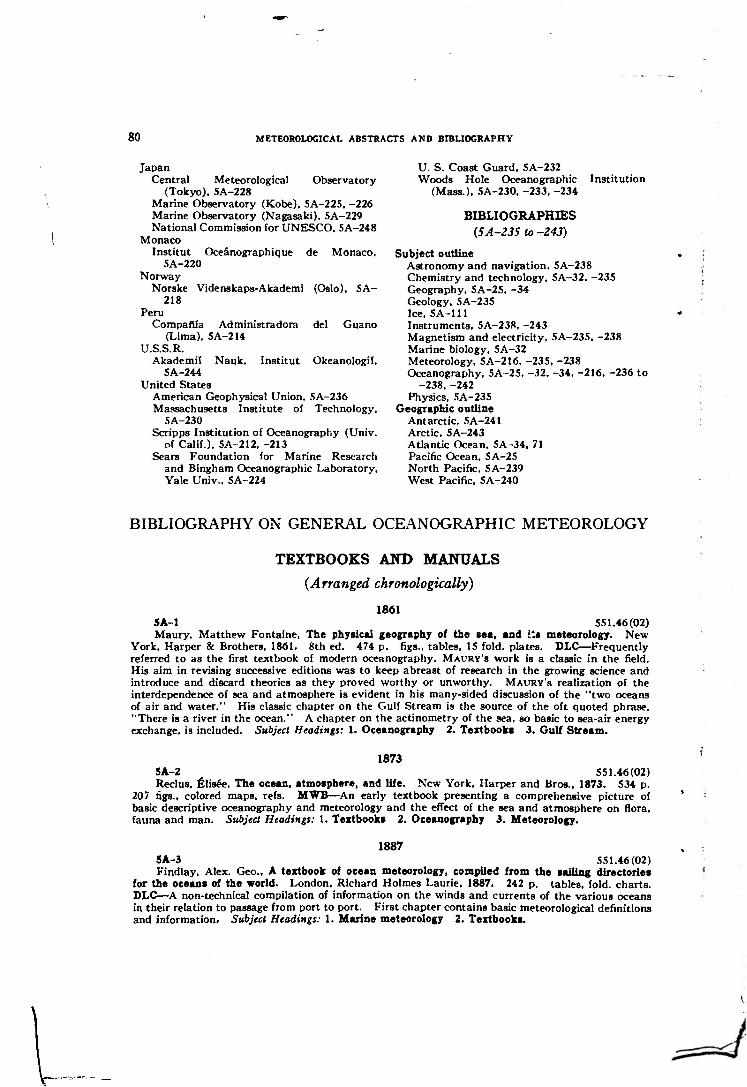
80 METEOROLOGICAL ABSTRACTS AND BIBLIOGRAPHY
Observatory Japan
Central Meteorological (Tokyo), 5A-228
Marine Observatory (Kobe), 5A-225, -226 Marine Observatory (Nagasaki), 5A-229 National Commission for UNESCO, 5A-248
Monaco Institut Oce&nographique de Monaco,
5A-220 Norway
Norske Videnskaps-Akademi 218
Peru Compaftla Administradora
(Lima). 5A-214 U.S.S.R.
Akademit Nauk, Institut 5A-244
United States American Geophysical Union, Massachusetts Institute of
5A-230 Scripps Institution of Oceanography (Univ.
of Calif.), 5A-212, -213 Sears Foundation for Marine Research
and Bingham Oceanographic Laboratory, Yale Univ., 5A-224
(Oslo), 5A-
del Guano
Okeanologil,
5A-236 Technology,
U. S. Coast Guard, 5A-232 Woods Hole Oceanographic Institution
(Mass.), 5A-230, -233. -234
BIBLIOGRAPHIES {5A-235 to -243)
Subject outline Astronomy and navigation, SA-238 Chemistry and technology, 5A-32. -235 Geography, 5A-2S, -34 Geology. 5A-235 Ice. 5A-111 Instruments, 5A-238, -243 Magnetism and electricity, 5A-235, -238 Marine biology, 5A-32 Meteorology, 5A-216, -235, -238 Oceanography, 5A-25. -32, -34. -216. -236 to
-238, -242 Physics, SA-235
Geographic outline Antarctic, 5A-241 Arctic, 5A-243 Atlantic Ocean. 5A-34, 71 Pacific Ocean, 5A-25 North Pacific, 5A-239 West Pacific. 5A-240
BIBLIOGRAPHY ON GENERAL OCEANOGRAPHIC METEOROLOGY
TEXTBOOKS AND MANUALS
(Arranged chronologically)
1861 5A-1 551.46(02) Maury, Matthew Fontaine, The physical geography of the sea, and £U meteorology. New
York, Harper & Brothers, 1861. 8th ed. 474 p. figs., tables, 15 fold, plates. DLC—Frequently referred to as the first textbook of modern oceanography. MAURV'S work is a classic in the field. His aim in revising successive editions was to keep abreast of research in the growing science and introduce and discard theories as they proved worthy or unworthy. MAURY'S realization of the interdependence of sea and atmosphere is evident in his many-sided discussion of the "two oceans of air and water." His classic chapter on the Gulf Stream is the source of the oft quoted phrase, "There is a river in the ocean." A chapter on the actinometry of the sea, so basic to sea-air energy exchange, is included. Subject Headings: 1. Oceanography 2. Textbooks 3. Gulf Stream.
1873 5A-2 551.46(02) Reclus, Elisee. The ocean, atmosphere, and life. New York, Harper and Bros., 1873. 534 p.
207 figs., colored maps, refs. MW»—An early textbook presenting a comprehensive picture of basic descriptive oceanography and meteorology and the effect of the sea and atmosphere on flora, fauna and man. Subject Headings: 1. Textbooks 2. Oceanography 3. Meteorology.
1887 5A-3 551.46(02) Findlay, Alex. Geo., A textbook of ocean meteorology, compiled from the sailing directories
for the oceans of the world. London, Richard Holmes Laurie, 1887. 242 p. tables, fold, charts. DLC—A non-technical compilation of information on the winds and currents of the various oceans in their relation to passage from port to port. First chapter contains basic meteorological definitions and information. Subject Headings: 1. Marine meteorology 2. Textbooks.
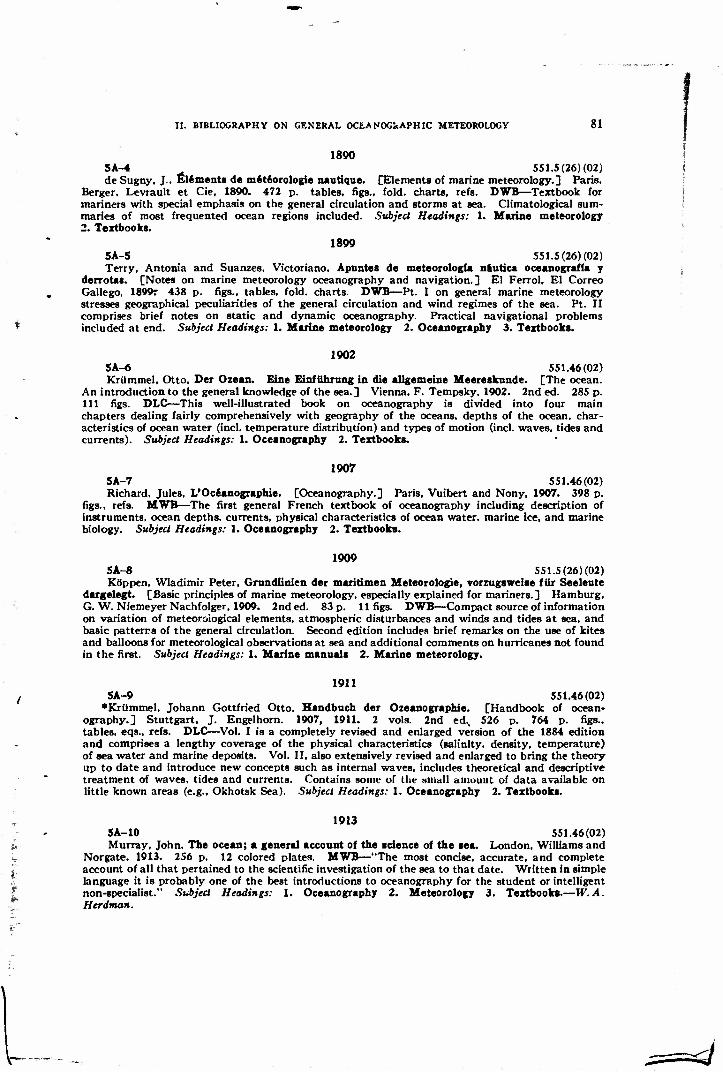
II. BIBLIOGRAPHY ON GENERAL OCEANOGfcAPHIC METEOROLOGY 81
1890 5A-4 551.5(26) (02) i de Sugny. J., Elements de m6t6orologie nantique. [Elements of marine meteorology.] Paris.
Berger. Levrault et Cie. 1890. 472 p. tables, figs., fold, charts, refs. DWB—Textbook for mariners with special emphasis on the general circulation and storms at sea. Climatological sum- maries of most frequented ocean regions included. Subject Headings: 1. Marine meteorology 2. Textbooks.
1899 5A-S 551.5 (26) (02) Terry. Antonia and Suanzes, Victoriano. Apuntes de meteorologia niutica oceanografla y ;
derroUs. [Notes on marine meteorology oceanography and navigation.] El Ferrol, El Correo Gallego, 1899r 438 p. figs., tables, fold, charts. DWB—Pt. I on general marine meteorology stresses geographical peculiarities of the general circulation and wind regimes of the sea. Pt. II comprises brief notes on static and dynamic oceanography. Practical navigational problems included at end. Subject Headings: 1. Marine meteorology 2. Oceanography 3. Textbooks.
1902 5A-<J 551.46(02) Krilmmel, Otto. Der Ozean. Erne Einfiihrung in die allgemeine Meereskunde. [The ocean.
An introduction to the general knowledge of the sea.] Vienna, F. Tempsky, 1902. 2nd ed. 285 p. Ill figs. DLC—This well-illustrated book on oceanography is divided into four main chapters dealing fairly comprehensively with geography of the oceans, depths of the ocean, char- acteristics of ocean water (incl. temperature distribution) and types of motion (incl. waves, tides and currents). Subject Headings: 1. Oceanography 2. Textbooks.
1907 5A-7 551.46(02) Richard, Jules, L'Oceanographie. [Oceanography.] Paris, Vuibert and Nony, 1907. 398 p.
figs., refs. MWB—The first general French textbook of oceanography including description of instruments, ocean depths, currents, physical characteristics of ocean water, marine ice, and marine biology. Subject Headings: 1. Oceanography 2. Textbooks.
1909 5A-8 551.5 (26) (02) K6ppen. Wladimir Peter, Grundlinien der maritimen Meteorologie, vorzugsweise fttr Seelente
dargelegt. [Basic principles of marine meteorology, especially explained for mariners.] Hamburg, G. W. Niemeyer Nachfolger, 1909. 2nd ed. 83 p. 11 figs. DWB—Compact source of information on variation of meteorological elements, atmospheric disturbances and winds and tides at sea, and basic patterns of the general circulation. Second edition includes brief remarks on the use of kites and balloons for meteorological observations at sea and additional comments on hurricanes not found in the first. Subject Headings: 1. Marine manual* 2. Marine meteorology.
1911 5A-9 551.46(02)
•KrUmmel, Johann Gottfried Otto. Handbuch der Ozeanographie. [Handbook of ocean- ography.] Stuttgart, J. Engelhorn. 1907, 1911. 2 vols. 2nd ed., 526 p. 764 p. figs., tables, eqs.. refs. DLC—-Vol. I is a completely revised and enlarged version of the 1884 edition and comprises a lengthy coverage of the physical characteristics (salinity, density, temperature) of sea water and marine deposits. Vol. II, also extensively revised and enlarged to bring the theory up to date and introduce new concepts such as internal waves, includes theoretical and descriptive treatment of waves, tides and currents. Contains some of the ttinall amount of data available on little known areas (e.g., Okhotsk Sea). Subject Headings: 1. Oceanography 2. Textbooks.
1913 5A-10 551.46(02) Murray, John. The ocean; a general account of the science of the tea. London, Williams and
Norgate, 1913. 256 p. 12 colored plates. MWB—"The most concise, accurate, and complete account of all that pertained to the scientific investigation of the sea to that date. Written in simple language it is probably one of the best introductions to oceanography for the student or intelligent non-specialist." Subject Headings: 1. Oceanography 2. Meteorology 3. Textbooks.—W.A. Herdman.
82 METEOROLOGICAL ABSTRACTS AND BIBLIOGRAPHY
1917 5A-11 551.46(02) Shokal'skil, IUlil Mikhallovich, Okeanografiia. [Oceanography.] 1917. 614 p. 247 figs-
tables, bibliog. p. 587-596. In Russian with French resum£ appended. DLC—One of the most comprehensive early textbooks of oceanography including sections on temperature and salinity, marine ice, oceanic exploration, tides, currents (charts, measurement, influence on climate), winds at sea, sea levei variations (particularly Baltic and Black Sea), ocean depths and bottom configura- tion, and instruments. Subject Headings: 1. Oceanography 2. Textbooks 3. Ocean currents.
1920 \ 5A-12 551.46(02)
Berget, Alphonse, Les problemes de l'ocean. [Problems of the ocean.] Paris, ET. Flammarion, 1920. 329 p. figs. DLC—A series of essays written with the goal of familiarizing readers with the wide scope of the science of oceanography and the rapid progress made during its first 50 years as a recognized field of study. Subject Heading: 1. Oceanography.
1921 5A-13 551.46(02) Jenkins, James Travis, A textbook of oceanography. London, Constable and Co., Ltd., 1921.
206 p. col. front., 42 figs., refs., appends. DLC—First modern textbook on oceanography in English, a non-technical presentation of the outlines of the science including geographical, geological and physical (waves, tides and currents) features of the oceans. Subject Headings: 1. Oceanography 2. Textbooks.
1923 5A-14 551.46(02) Herdman, William Abbott, Founders of oceanography and their work, an introduction to the
science of the sea. New York. Green & Co., 1923. 340 p. 28 plates. DLC—Not intended to be a textbook of oceanography, HERDMAN'S book is in part a series of biographical sketches of the outstanding early contributors to the field written by one who knew them personally. The balance consists of chapters devoted to selected subjects (e.g., hydrography and currents) within the field which indicate the scope of oceanography and the need for further scientific investigation. Subject Headings: 1. Oceanography 2. Biography.
1925 5A-15 551.5 (26) (02) Paredes y Castro, Jos£ Garcia de. Meteorologfa nautica y oceanografla. [Nautical meteorology
and oceanography.] 2nd ed. Barcelona, Fidel Gir6, 1925. 414 p. 133 figs., plates, tables, append. DWB—A well indexed text of basic meteorology and oceanography with emphasis on the forecasting of meteorological elements and disturbances at sea. Subject Headings: 1. Marine meteorology 2. Textbooks 3. Forecasting at sea.
1928 5A-16 551.5 (26) (02) Coyecque, Marcelo, Nociones de meteorologfa general niutica con elementos de oceanografla.
[Notes on general and nautical meteorology with elements of oceanography.] Barcelona, Guinart and Pujolar, 1928. 360 p. 195 figs., fold, charts, appends. DLC—A general textbook of meteor- ology containing sections on storms at sea (p. 240), forecasting at sea (p. 28) and a basic coverage of oceanography embracing instrumentation, sea water, marine ice, waves and currents. Information on transmission of meteorological observations at sea appended. Subject Headings: 1. Marine meteorology 2. Textbooks.
5A-17 551.46(02) Johnstone, James, An introduction to oceanography, with special reference to geography and
geophysics. London, Hodder and Stoughton, 1928. 2nd ed. rev. 368 p. illus. (incl. maps), plate, 5 fold, charts., diagrs., biblio., appends. DLC—"Although an attempt has been made here to deal in a general way with the science of oceanography, it is rather with the outlook of the student of geography and geology that the book has been written." In addition to chapters on such subjects as the geographical divisions of the oceans, ocean depth, and the sea bottom, a lengthy coverage of oceanic circulation is included in which the currents of the various oceans are discussed separately. Historically, the last chapter entitled "Secular changes in the ocean" is of great interest. Subject Headings: 1. Oceanography 2. Textbooks 3. Ocean currents.
1 U~-
r •
II. BIBLIOGRAPHY ON GENERAL OCEANOGRAPHIC METEOROLOGY 83
1929 SA-18 551.46(02) Defant. Albert, Einfuhrung in die Geophysik. III. Dynamische Ozeanographie. [Intro-
duction to geophysics. III. Dynamic oceanography.] Nalurwissenschaftliche Monographien und Lehrbiicher, Berlin, v. 9, 1929. 222 p. 87 figs., tables, refs., eqs. MWB—Drawing largely from his experience on the "Meteor" {see 5A-70) author presents the physical and theoretical explanations of motion in the sea. Special emphasis on general oceanic circulation and dynamics of ocean cur- rents. Subject Headings: 1. Dynamic oceanography 2. Textbooks.
1930 5A-19 551.46(02) Marmer, Harry Aaron, The sea. New York, D. Appleton and Co., 1930. 312 p. 45 ligs.
DWB—An informal, non-technical presentation of the salient features of the knowledge of the sea to date containing chapters of popular interest on such subjects as the sea of ancient times, the northwest passage, and legendary isles. Subject Heading: 1. Oceanography. i
1931 i 5A-20 551.5 (26) (02) ] Berget, Alphonse, Lecons d'oceanographie physique: 2ma partie: l'oc6an et I'atmosphere. [Les- 1
sons in physical oceanography: 2nd part: the ocean and the atmosphere.] Institut Ocfanographique, 1 Monaco, Annales, New Ser., Vol. 11, 1931. 396 p. 193 figs. DLC—Chapters 1-4 deal with the chemical and optical characteristics of the atmosphere; Chapter 5 with solar radiation and Chapters 6-11 with winds and general physics of the atmosphere. Chapters 14—17 again deal with winds, ' storms and other atmospheric movements, by themselves and in relation to oceanic drifts and currents. Chapter 18 treats of climate as it may be related to oceanographic matters. Remainder deals with currents and drifts. Adequately illustrated. Subject Headings: 1. Marine meteorology 2. Ocean currents. j
•I 5A-21 551.46(02) Bigelow, Henry Bryant, Oceanography, its scope, problemb and economic importance. New
York, Houghton Mifflin Co., 1931. 263 p. DLC—"The book is an attempt to appraise the present (1931) condition of oceanographic research with reference to the more outstanding problems, so as to take bearings for future research. It is in no sense a textbook or compendium." Of special \ interest to meteorologists is Chap. 4 (by CHARLES F. BROOKS) on the relationship between ocean- ography and meteorology and the excellent section 5 of Chap. 6 dealing with oceanography and seasonal weather forecasting. Emphasis is laid on the difficulty of the problem of establishing "beyond reasonable doubt whether, or in what parts of the ocean, temperature abnormalities or other changes in the water do actually antedate alterations in the weather of the overlying air with i regularity." Subject Headings: 1. Marine meteorology 2. Long range forecasting 3. Sea tem- peratures. I. Brooks, Charles F.
1932 5A-22 551.46(02) Schumacher, A., Ozeanographie. [[Oceanography. ] Handwdrterbuck der Nalururissensckaften.
Jena, vol. 7:529-561, 1932. 2nd ed. 20 figs., refs., eqs., tables. MWB—A useful reference work treating briefly the broad principles of the subject. Gain and loss of heat by the sea, distribution \ of temperature and its seasonal changes, relative amounts of precipitation and evaporation, and i formation of ice are treated at some length. Sections on currents and waves included. Subject « Headings: 1. Oceanography 2. Heat exchange sea-atmosphere.
1935 5A-23 551.5 (26) (02) Great Britain. Meteorological Office, A handbook of weather, currents and ice for seamen.
Great Britain, Meteorological Office, 1935. 154 p. 34 figs., tables, append. DLC—A well indexed and illustrated handbook containing brief chapters on general marine meteorology, tropical cyclones, winds, currents, ice and ocean pilotage. Instrument correction tables, Beaufort Scale and humidity tables appended. Subject Headings: 1. Marine manuals 2. Marine meteorology.
5A-24 551.5 (26) (02) •Italy. Istituto Idrografico, Manuale de meteorologia nautica. [Manual of marine meteor-
ology.] 1935. 2nd ed. 290 p. 81 figs., 10 tables. DLC—First part deals with the basic meteoro- logical elements, and periodic and non-periodic variations of the weather. Part two emphasizes the applications of meteorology to marine navigation and includes discussions of shipboard instru-
—^
84 METEOROLOGICAL ABSTRACTS AND BIBLIOGRAPHY
ments and observational techniques, sources of meteorological information for the navigator, and weather forecasting at sea. Reduction and conversion tables included as well as an English-Italian glossary of meteorological terms. Subject Headings: 1. Marine manuals 2. Marine meteorology 3. Glossaries.
SA-2S 551.5(26) (I?) f*§Schott, Gerhard, Geographic dea Indiachen und Stillen Ozeans. [Geography of the Indian
and Pacific Oceans.] Hamburg, C. Boysen, 1935. 413 p. 114 figs., fold, map, 37 tables, refs. DWB—A comprehensive coverage of all phases of the geography of the area. Of special interest to meteorologists is Chap. 6 on the chief meteorological and oceanographical characteristics of the surface waters of the two oceans. A series of detailed, colored charts fully illustrate the text. Un- annotated (30-60 items) bibliographies chiefly in German and English included; p. 171, The chief meteorological and oceanographical qualities of the surface of the Indian and Pacific Oceans; p. 256, The natural regions of the Indian Ocean; p. 326, The natural regions of the Pacific Ocean. (Same item as 41-93, Sept. 1953, MAB.) Subject Headings: 1. Ocean climates 2. Marine meteorology 3. Textbooks 4. Bibliographies 5. Pacific Ocean 6. Indian Ocean.
1937 5A-26 551.5 (26) (02)
{Brown, Charles H., Meteorology for masters and mates. 8th ed. Glasgow. Brown, Son and Ferguson, 1937. 240 p. figs., tables, fold. maps. DLC—This textbook of meteorology devotes special attention to those subjects of particular marine significance such as construction and use of instruments, ocean storms, currents and ice. The International Convention Code, instructions for constructing weather maps and a glossary are included. Subject Headings: 1. Marine meteorology 2. Textbooks.
5A-27 551.46(02) Vaughan, Thomas Wayland, International aspects of oceanography. Washington, D. C,
National Academy of Science?, 1937. 225 p. 10 figs., tables, 36 plates (incl. fold, charts). DWB— A unique and valuable stuu> .r^nsored by the National Academy and comprising a summary (chiefly in chart form) of the degree of physical exploration to date in the various oceans and a catalog of institutions (research and educational) engaged in oceanographic work. Numerous charts show structure of ocean basins, temperature, salinity, density and tides. Data unanalyzed. Subject Headings: 1. Oceanography 2. Oceanographic institutes.
1938 5A-28 551.5:656.6(02)
JPctterssen, Sverre and Spinnagr, Finn, Meteorologi for sjoYolk. [Meteorology for seamen, ] Bergen, John Griegs Forlag, 1938. 160 p. 88 figs. (incl. 9 synoptic charts). 11 tables. Issued in pocket, a booklet by Sverre Petterssen and John Gasland entitled: Vaermeldinger for skibsfarten. [Weather reports for navigation.] 86 p. 5 figs., codes, symbols, 26 tables, 14 indices of meteoro- logical stations. DLC—A well-illustrated and modern text (in Norwegian) on meteorology for mariners. The greater part of the book is concerned with air masses, fronts, cyclones, anticyclones, weather analysis and forecasting, tropical storms and actual case histories of synoptic situations illustrated by a score of analyzed charts for the North Atlantic. A supplementary handbook is included which gives the basic data for international marine weather reporting networks, com- munications and codes (now obsolete). A minimum of space is devoted to orthodox treatment of the atmosphere, instruments, clouds, wind, etc. (Same item as 5-11, May 1950, MAB.) Subject Headings: 1. Marine meteorology 2. Synoptic analysis 3. Textbooks. I. Gasland, John.—MR.
1940 5A-29 55!.5(26)(02) Defant, A., Kuhlbrodt, E., Roll, U. and others, Wind, Wetter und Wellen aof dem Weltmeere.
[Wind, weather and waves on the oceans of the world. ] Berlin, E. S. Mittler &. Sohn, 1940. 150 p. 59 figs., 16 plates. DLC—A compilation of short studies by six of Germany's outstanding scientists giving a picture of the relationships of ocean and atmosphere, a view of ocean climate as investigated by new aerological methods, and an illustrated account of the size and behavior of storm waves. Subject Headings: 1. Marine meteorology 2. Ocean climates 3. Oceans. I. Seilkopf, Helnrich II. Thorade, H. III. Wilst, Georg.
5A-30 551.5 (26) (02) Rouch. Jules Alfred. Meteorologie et physique du globe. Vol. I, Meteorologi* nautique.
Vol. II, Physique des mers. [Meteorology and physics of the globe. V. I, Marine meteorology.
II. BIBLIOGRAPHY ON GENERAL OCEANOGRAPHIC METEOROLOGY 85
V. II, Physics of the ocean.] Paris, Soci6t6 d'Editions Geographiques, Maritimes et Coloniales, 1940/1941. 2 v. tables, figs., plates. Note: A 2nd rev. and enlarged edition of vol. 1 was pub- lished in 1950 by the same publisher. DLC—A brief but comprehensive coverage of marine meteor- ology (vol. 1) and physical oceanography (vol. 2). Atmospheric structure, instruments for ob- servations at sea, weather forecasting at sea, interpretation of the marine weather map, storm types and movement, optical phenomena at sea, measurement and description of ocean water salinity, density and temperature, waves, tides and currents, terrestrial magnetism and atmospheric electricity are among the main topics discussed in the two volumes. The 1950 edition of vol. I contains some upper air information not included in the first edition. Subject Headings: 1. Marine meteorology 2. Oceanography 3. Textbooks!
1942 5A-31 551.5(26)(02)
t*5Sverdrup, Harald Ulrik, Oceanography for meteorologists. New York, Prentice-Hall, Inc., 1942. 246 p. 70 figs., 4 charts, refs. DLC—Author describes methods used in physical ocean- ography and summarizes our present knowledge of the current systems of the oceans and of the processes that maintain them. From this book a meteorologist can readily obtain information as to the findings in physical oceanography that have bearing upon problems of the atmosphere. Emphasis laid on the importance of dealing with the entire system, comprising atmosphere and oceans, when studying the circulation of the atmosphere. Subject Headings: 1. Oceanography 2. Marine meteorology 3. Textbooks.
5A-32 551.46(02) tSverdrup, Harald Ulrik; Johnsoi.. Martin W. and Fleming, Richard H., The oceans, their
physics, chemistry and general biology. New York, Prentice-Hall, Inc., 1942. 1087 p. 265 figs., 126 tables, 7 fold, charts, eqs., bibliogs. DLC, DWB—The most outstanding comprehensive textbook of oceanography embracing all phases of the science of the sea. An exceptional number of fine illustrations and lengthy bibliographies, worldwide in scope, accompany each chapter. Seven folding charts of bottom topography, salinity, temperature and surface current distribution and detailed subject and author indexes complete this unique and monumental study of the oceans. Bibliographies included are as follows: p. 45-46, The earth and the ocean basins; p. 93-97, Physical properties of sea water; p. 150-152. Distribution of temperature, salinity, density; p. 163-164, Distribution of variables in the sea; p. 222-227, Chemistry of sea water; p. 263-266, Organisms and the composition of sea water; p. 284-285, The sea as a biological environment; p. 328-330, Popula- tions of the sea; p. 385-388, Observations and collections at sea; p. 430, Statics and kinematics; p. 511-151, Dynamics of ocean currents; p. 602-604, Waves and tides; p. 755-761, The water masses and currents of the oceans; p. 795-798, Phytoplankton and physical-chemical environment; p. 873- 878. Animals and physical-chemical environment; p. 920-924, Interrelations of marine organisms; p. 944-945, Organic production in the sea; p. 1045-1049, Marine sedimentation. Subject Headings: 1. Oceanography 2. Textbooks 3. Bibliographies.
5A-33 551.501(26) tU. S. Maritime Service Institute, Marine meteorology, Pta. 1-2. [1942.] 2 pieces, forms
(some fold.), refs., bibliog. Mimeo. DWB—A collection of 14 laboratory or text assignments with questions, official instructions and maps as an aid in the preparation of marine weather observations. Subject Headings: 1. Marine meteorology 2. Laboratory manuala.—A. A.
1944 5A-34 551.5:551.46(261/4) Schott, Gerhard, Geographic dea Atlantischen Ozeana. [Geography of the Atlantic Ocean.]
3rded. Hamburg, C. Boysen, 1944. 438 p. 141 figs., 27 col. plates, refs. (1st ed. pub. in 1912.) DLC—According to the author, this third and latest edition is a "new book" almost completely rewritten and vastly improved over earlier editions by the inclusion of charts based on data from the "Meteor" (1925-27) and other oceanographical expeditions. One of the author's prime aims is to show the dynamic interrelation between ocean and atmosphere. A new section containing aerological data up to 4000m above the sea surface has been added to the chapter (VI) entitled "Chief characteristics of the atmosphere over the Atlantic Ocean." Lengthy, well illustrated chapters on the history, physical and human geography, geology, climatology and marine biology of the Atlantic combine to make SCHOTT'S work a monumental and comprehensive regional study. (Same item as 3.8-14, Aug. 1952. MAB.) Subject Headings: 1. Marine climatology 2. Textbooks 3. Ocean climates 4. Atlantic Ocean.
86 METEOROLOGICAL ABSTRACTS AND BIBLIOGRAPHY
5A-35 551.5(26):629.13 U. S. Navy. Naval Air Technical Training Command, Climate and weather for flight in naval
operational zones. Washington, Office of the Chief of Naval Operations, 1944. 200 p. 187 figs., tables, glossary. DLC—A training manual for naval air pilots arranged in such way as to give them a picture of the general climatic pattern of the ocean and coastal areas over which they fly, of the weather hazards and helps to aviation peculiar to specific regions, and of typical weather situations they might expect to encounter taking into account season, air mass and frontal character* istics, prevailing winds, ocean currents and topographic influences. Subject Headings: 1. Marine manual a 2. Marine meteorology 3. Aeronautical meteorology.
1945 5A-36 551.5 (26) (02) Stewart, John Q., Coasts, waves, and weather. Boston, Ginn & Co., 1945. 348 p. figs.,
photos, charts, biblio. p. 340-342. DPI/—A well-illustrated book designed primarily to "explain to marine and air navigators the physical environment in which navigation must be carried on." Pts. II and III are entitled, respectively, "Oceanography for navigators" and "Meteorology for navigators." Subject Headings: 1. Marine meteorology 2. Textbooks 3. Ocean waves 4. Ocean currents 5. Sea ice.
5A-37 551.46(02) Stommel. Henry, Science of the seven seas. New York, Cornell Maritime Press, 1945. 208 p.
illus., bibliog. p. 200-201. DLC—A small, well-illustrated handbook which describes, lists and explains in elementary fashion some of the natural phenomena observed at sea. Subject Headings: 1. Oceanography 2. Marine meteorology 3. Textbooks.
5A-38 551.311.181 •tZubov, N. N., L'dy Arktiki. [Arctic ice.] Moscow, Glavsevmorput. Izdat., 1945. 360 p.
195 figs., 121 tables, 179 refs. DPL, DLC—A comprehensive treatise on the physical and chemical properties of sea waters, the processes changing the temperature and salinity of the ocean, the processes forming water masses, the interaction between the ocean and atmosphere and the formation properties and behavior of the ice of the Arctic Ocean. The individual chapters are as follows: 1) Some characteristics of sea water; 2) Change of temperature and salinity of the ocean; 3) Mixing of waters of the oceans; 4) Ice formation and ice characteristics in the sea; 5) Physical and chemical characteristics of sea ice; 6) Growth of ice; 7) Deformation of ice; 8) Melting of sea ice; 9) Ebb and flow phenomena and ice; 10) Lee currents and ice; 11) Wind and ice drift; 12) Circulation of waters and ice of the Arctic Ocean, and 13) Seasonal and secular variations of ice distribution. The treat- ment is theoretical, mathematical and descriptive.. There are numerous equations, diagrams, statistical data and illustrations. Subject Headings: 1. Sea ice 2. Energy exchange sea-atmosphere 3. Arctic Ocean.—I.L.D.
1947 5A-39 551.46(02) Coker, Robert Erwin, This great and wide sea. Chapel Hill, N. C, Univ. of North Carolina
Press, 1947. 325 p. 91 plates, 2 tables, 23 figs., refs., bibliog. p. 301-302. DLC—A relatively brief, comprehensive and non-technical presentation of some of the basic phenomena of the ocean as a place of life for plants and animals. Emphasis laid on the unity of the seas as they constitute a single dynamic mechanism worldwide in operation and influence. Well illustrated with photographs. No marine meteorology. Subject Headings: 1. Textbooks 2. Oceanography.—From author's preface.
5A-40 551.5(26) tDominguez-Aguirre. Ernesto, Meteorologfa nintica. [Marine meteorology.] Veracruz,
Mexico, 1947. 316 p. 93 figs., fold, charts, tables, eqs. DLC—A clearly illustrated textbook of marine meteorology containing a classified bibliography and a glossary of meteorological terms in Spanish. Nine of the 50 chapters deal with storms, in particular a3 they influence navigation. Subject Headings: 1. Textbooks 2. Storms at sea 3. Glossaries.
5A-41 551.46(02) tZubov, Nikolai Nikolaevich, Dinamicheskaia okeanologia. [Dynamic oceanology. ] Moscow,
Gidromet. Izdat., 1947. 430 p. 229 figs.. 56 tables, bibliog. (130 refs.) p. 423-426, eqs. DLC— The author, as head of the Institute of Oceanology in the Hydrometeorological Service, approached the subject of dynamic oceanography from the point of view of the researcher rather than the practical hydrographer or oceanographic meteorologist. After discussing the structure and physico-chemical characteristics of sea water, and the various surfaces and forces operating in the ocean, he takes up
V. II. BIBLIOGRAPHY ON GENERAL OCEANOGRAPHIC METBOKOLOGY 87
the exchange or mixing of water masses, then waves, tides, tidal phenomena and ice, ocean currents, wind and movements of ice, variations in sea level, and finally there are 40 pages on the interaction of the sea and atmosphere. (Same item as 2-185, Feb. 19S0, MAB.) Subject Headings: 1. Ocean- ography 2. Textbooks 3. Energy exchange sea-atmosphere 4. Bibliographies.—M.R.
1949 5A-42 551.5:656.6 551.46(02) Bossen, P. and Zee, P. Van der, Maritieme msteorologle en oceanografle. [Maritime meteor-
ology and oceanography.] 8th ed. Amsterdam, Kweekschool voor de Zeevaart, 1949, 312 p., 102 figs., 15 charts. Issued in pocket as appendix, a separate booklet entitled: Omschrijvingen, code- cijfers en symbolen nodig bij invullen van het meteorologisch journaal en de weerkaart op zee., [De- finitions, code numbers and symbols for use in meteorological logs and weather charts at sea.] 24 p. codes, symbols. DLC—-A substantial text in the Dutch language, covering the basic principles of meteorology, climatology and oceanography, and even some of the more advanced theoretical aspects which would be interest to the marine observer or navigator. The greatest attention is paid to storms (hurricanes, cyclones, squalls, etc.), wind systems (trades, monsoons, doldrums), and to marine observations. This eighth edition contains a supplement giving the details of the latest (Toronto) marine code, and some sample synoptic charts drawn according to recent methods of air mass analysis. {Same item as 8-3, Aug. 1950, MAB.) Subject Headings: 1. Marine meteorology 2. IMO Marine Code, 1949 3. Textbooks 4. Netherlands.—M.R.
5A-43 551.5 (26) :629.12 (02) (03) (481) Johnsen, Olaf and Bryn, Zacharias, Meteorologi og oceanogran for sjjtfolk. [Meteorology and
oceanography for seamen.] 8th ed. Arthur Stene (ed.). Oslo, Aschehoug, 1949. 194 p. 7 plates (folded), 102 figs., tables. English-Norwegian Glossary, p. 189-190. First published 1920 under the title: "Kortfattet meteorologi og oceanogran for sj^folk." DLC—A revision of the seventh edition (1943) of a standard textbook for use in Norwegian schools of marine navigation. The meteorological part covers the general principles of meteorology, instruments, movement of air masses and fronts, observational techniques, weather codes and charts, their construction and analysis, climatology of oceans and coastal areas, winds, monsoons and hurricanes. The section on oceanography deals mainly with methods of observing currents, waves, ice, temperatures and depths, and characteristics of the main sea routes of the world. A glossary of 130 English-Norwegian terms used in meteorology is appended. The illustrations and sample synoptic charts are excellent. (See also item 5-11, May 1950, MAB.) Subject Headings: 1. Marine meteorology 2. Marine navigation 3. Textbooks 4. Glossaries 5. Norway. I. Stene, Arthur (ed.) II. Dannevig, Petter.—M.R.
5A-44 551.501.1 (26) (02) •Netherlands. Meteorologisch Instituut, Handleiding voort het verrichten van meteorologjsche
waarnemingen op zee. [Handbook for making meteorological observations at sea.] 2nd rev. ed. Gravenhage, Staatsdrukkerij- en Uitgeverijbedrijf, 1949. 119 p. 7 tables, 9 figs., photos, (mostly with English legends), refs. Netherlands. Meteorologisch Instituut, [UitgaveJ, No. 118a. DLC—- Includes discussion of currents, air pressure, wind, air and sea temperature, humidity, waves, fog and precipitation, cloudiness, visibility, and state of the weather. In addition observations of particular oceanographic meteorological, biological, optical, magnetic, and astronomic quantities are discussed. Correction, reduction and psychrometer tables are included. Subject Headings: 1. Marine meteorology 2. Marine manuals.
Hi
SA-iS 551.465(02) Shulelkin, Vasilil V., Ocherki po fizike moria. [Outlines of the physics of the sea.] Moscow,
Akademiia Nauk, 1949. 334 p. 190 figs. DLC—A readable yet scholarly presentation of the basic problems of oceanography, with many excellent illustrations (both photographic and schematic) of scores of instruments used in oceanogiaphy and hydrography, as well as charts, pertinent scenes, etc. A long chapter at the beginning traces the history of the science from the earliest voyages to the present, with emphasis on instrumentation. The arrangement of the material follows a rational pattern: 1) the sun as source of energy for the atmospheric and oceanic movements, 2) heat or energy exchange in the sea, 3) effect of oceans on continents, 4) recurrent phenomena in the hydrologic cycle, 5) cause or mechanism of ocean currents, 6) wave phenomena, 7) tides, 8) optical and 9) acoustical properties of the sea, and, finally, some problems of marine biology and fisheries. A great deal of original material and research is presented in this smaller and more popular edition of the author's voluminous work "Fizika moria" (Physics of the sea) (see item 2-184, Feb. 1950, MAB). The author is now chief of the Hydro-meteorological Service of the U.S.S.R. and a member of the Akademiia Nauk. (Same item as 8-148, Aug. 1950, MAB.) Subject Headings: 1. Ocean- ography 2. Hydrography 3. Textbooks.—M.R.
.&•-
88 METEOROLOGICAL ABSTRACTS AND BIBLIOGRAPHY
5A-46 551.5(26)(02) tSomma, Alberto, Elementi di meteorologia ed ocennografle. Parte Prim*, Meteorologia.
Parte Second*, OceanografU. [Elements of meteorology and oceanography. Part I, Meteorology. Part II, Oceanography.] Padua, Casa Editrice Dott. Antonio Milani, 1949, 1952. Pt. I. 457 p. 197 figs., 37 refs. Pt. II, 758 p. 322 figs., 84 refs. DLC—A two volume treatise on meteorology and oceanography and their interrelationships. Pt. I, comprising the usual textbook chapters on the various meteorological elements, solar radiation, mechanics and thermodynamics of the at- p mosphere, atmospheric disturbances, circulation, electricity and optics, and forecasting is charac- terized by a decided emphasis on application to marine navigation. Append. C, p. 446-450, contains information on weather ships. Pt. II is devoted to the physical characteristics of water, waves, tides and ocean currents. Subject Headings: 1. Marine meteorology 2. Oceanography 3. Text- books. •
1950 ;
5A-47 551.5:656.6(02) ] Burgess, C. R.. Meteorology for seamen. Glasgow, Brown, Son and Ferguson, 1950. 252 p. j
illus. MH-BH—Pt. I, general theory of meteorology. Pi- II. climates of the oceans, including air masses. Pt. Ill, weather forecasting. Pt. IV, observing and recording the weather. (Same item as 10-5, Oct. 1950, MAB.) Subject Headings: 1. Marine meteorology 2. Textbooks. \
5A-48 551.46(02) | Colman, John S., The sea and its mysteries. London, G. Bell & Sons, Ltd., 1950. 285 p.
36 figs., 16 plates. DLC—The general principles of marine science, physical and biological, are j set forth and discussed in a fairly elementary fashion. Accurate material on wave motion, winds, and ocean currents is included. Subject Headings: 1. Oceanography 2. Textbooks 3. Ocean waves 4. Ocean currents.
5A-49 551.501.1 (26) (02) Great Britain. Meteorological Office, Marine observer's handbook. 7th ed. London, H.M.
Stationery Office. 1950. 122 p. 32 figs.. 22 cloud photos. 18 tables. M.O. 522b. MH-BH—The standard book of instructions in British practice. Pt. I. Instrumental observations. Pt. II. Non-instrumental observations (including estimation of cloud height, ocean waves, currents and ice). Pt. Ill, Phenomena, meteorological, miscellaneous (aurora, magnetic storms, radio phe- nomena), astronomical. Pt. IV. Meteorological work at sea, including organization of voluntary ships' reports and International Convention for the Safety of Life at Sea, 1948. Tables include correction and reduction of barometers arid conversion of units, diurnal variations of pressure, humidity tables and conversion of apparent wind force and direction to true. This is the first part of the new series of "Manuals" planned by the Meteorological Office to reach publication. See companion volume, "Meteorology for mariners," published by the Great Britain Meteorological Office, for the theory and application of meteorology to the seaman's profession. (Same item as 2.2-11, Feb. 1951, MAB.) Subject Headings: 1. Marine manuals 2. Instruction for observers.
5A-50 551.501.1 (26) (02) *U. S. Weather Bureau, Manual of marine meteorological observations. U. S. Weather Bureau,
Circular M, 1950. 8th ed. 100 p. tables, chart. DWB—Contains codes, procedures and ob- servational techniques suggested by the U. S. Weather Bureau for meteorological observations at sea. Subject Headings: 1. Marine meteorology 2. Marine manuals.
1951 5A-51 551.5 (02) (26) Oonn, William L., Meteorology with marine applications. 2nd rev. ed. New York, McGraw-
Hill, 1951. 465 p. figs., table, refs. DWB—The chief revision which appears in the 2nd ed. is the rewriting of Chap. 12 which contains the 1949 IMO Marine Code in great detail, and a sample of the Weather Bureau's new form for recording ships' observations in this code. Station models for synoptic charts and other revisions up to Aug. 1950 are also included. The remainder of the book is much the same as the first edition (see item 212-4, Feb. 1951, MAB), with emphasis on modern • concepts of synoptic meteorology, air masses and fronts, and considerable space devoted to ocean- ographic aspects and marine climates. (Same item as 3.8-13, Aug. 1952, MAB.) Subject Headings: 1. Marine meteorology 2.1.M.O. Marine Code, 1949 3. Textbooks.—M.R.
SA-52 551.46(02) •fGroen, P., De wateren der Wereldzee. [The waters of the oceans.] Amsterdam, C. De Boer,
Jr., 1951. 375 p. 148 figs., 4 maps, 52 plates, 25 tables, bibliog. p. 367-370. DLC—A beautifully
|i II. BIBLIOGRAPHY ON GENERAL OCEANOGRAFHIC METEOROLOGY 89
\- illustrated (photos) textbook of oceanography primarily descriptive in approach. Major subdivisions include oceanic exploration, physical qualities of sea water, marine ice, waves, tides, and mass and heat balance of the oceans. Bibliography contains numerous references arranged chronologically and grouped by subject matter. Alphabetical author and subject index included. Subject Headings: 1. Oceanography 2. Textbooks.
5A-53 551.46(02) fSnezhinskil, V. A., Prakticheskaia okeanograflia (raboty v otkrytom more). [Practical ocean-
ography (for work in the open ocean).] Leningrad, Gidromet. Izdat., 1951. 599 p. 371 figs., 37 tables, 140 refs. DLC—Recent and practical textbook on methodology of oceanographic research, with emphasis on work of Russian or Soviet scientists. The history of various types of investigations of the seas, stations, expeditions; cross sections, basic observations, methods and accuracy of observations are given due attention, but the main part or, the work (and illustrations) deals with instruments—apparatus for physical, chemical and biological observations in the oceans. The text is divided into six main parts comprising 17 chapters. The first part deats with organization, preparation and completion of oceanographic work; Pt. II with oceanographic sounding equipment of four general types; Pt. Ill with soundings: Pt. IV with movements of sea water; Pt. V with temperature, salinity and transparency (optics) of sea water and Pt. VI with studies of ocean- atmosphere energy exchange. The last part contains two chapters, one on actinometric observations at sea and one on evaporation and convective heat exchange. The instruments and devices used by Russian oceanographers, the calibration and accuracy of the instruments and the recording and computation of results are all described and illustrated in great detail. (Same item as 3.11-8, Nov. 1952, MAB.) Subject Headings: 1. Oceanographic instruments 2. Oceanographic observations 3. Soviet science 4. Textbooks.—MR.
SA-54 551.S:551.46(02) fVercelli, Francesco, n mere—i laghi—i ghiacciai. [Ocean, lakes, glaciers.] Turin, Unione
Tipografico-Editrice Torinese, 1951. 622 p. numerous photos, figs., charts, bibliog. p. xiii-xvi. Review in Italian by A. Vatova, L'Idrosfera e le sue condizioni. [The hydrosphere and its condi- tions.] [1952] available at DWB. DLC—A comprehensive, popularly written and profusely illustrated coverage of physical and dynamic oceanography, marine meteorology and morphology, sedimentation, limnology, snow and ice forms and glaciers. Chap. 5 includes discussion of evap- oration, heat exchange and effects of ocean and atmosphere on one another. Other manifestations of ocean-atmosphere interaction discussed in Chap. 9 (waves) and Chap. 10 (circulation). This is believed to be the first attempt at so broad, voluminous and vivid a coverage of the many aspects of oceanographic, limnological and glaciological activity enumerated above. A few colored charts and a number of tables and graphs giving quantitative data on each of the topics covered give the work a superficial resemblance to SCHOTT'S classical works on the geography of the Atlantic and of the Pacific and Indian Oceans. Subject Headings: 1. Oceanography 2. Marine meteorology 3. Textbooks 4. Ice 5. Glaciers. I. Vatova, K.—M.R.
1952 5A-55 S51.5(26)(02) Krauss, Joseph (Bad Schwarlau) and Stein, Walter (Bremen), Wetter- und Meereskuade filr
Seefahrer. [Weather and oceanography for mariners.] 3rd rev. ed. Berlin, Springer, 1952. ; 171 p. 76 figs., 3 tables (folded in pocket). DLC—The first edition of this textbook or handbook
of marine meteorology was issued in 1917 by KRAUSS under the title "GrundzUge der maritimen ». Meteorologie und Ozeanographie." The second edition appeared in 1931. The present edition • brings the material on weather map preparation, meteorological codes and reports up to date by s- . incorporating the latest ideas on frontal analysis and the results of the I.M.O. code which became
effective Jan. 1. 1949 into the appropriate chapters. The service of the ocean weather ships in the Atlantic and Pacific, the station started in 1949 at Kismitte, Greenland, the service for marine
i;- interests which the Deutscher Seewetterdienst (Hamburg) maintains in the North Sea Region, and f the ice warning service in the Baltic and Straits around Denmark, are described in some detail and fc « illustrated with appropriate charts. A good portion of the work deals with currents, current ob- JT servations, meteorological navigation and ice conditions. Meteorological material is of the type
found in all texts on marine meteorology, though this work gives more concrete examples and is well organized for use as a handbook. The important rules or passages which would be most often referred to are marked by heavy black lines in the margin. Examples are given of both the German form of ship weather observation log, and the form they use for coding the 6-hourly reports for International Broadcast (1944 code). Subject Headings: 1. Marine meteorology 2. I.M.O. Marine Code, 1949 3. Ice patrol service 4. Textbooks. I. Meldau, H.—M.R.
r
^=*4
90 METEOROLOGICAL ABSTRACTS AND BIBLIOGRAPHY
5A-56 551.5(26) 551.582 *Tannehill, Ivan Ray, Weather around the world. 2nd ed. Princeton University Press, 1952.
212 p. 59 figs., 5 tables, refs. DWB—This "general introduction to world weather for the layman" is written with a definite marine meteorological slant. Opening with a chapter on wind and waves, the author goes on to describe other standard meteorological phenomena never losing sight of the interrelationship of sea and atmosphere. Weather characteristics of ten geographic regions of the world are outlined and considerable temperature, humidity, precipitation and cloudiness data ap- pended. The second edition differs from the first by the inclusion of a final chapter on weather aloft. (Same item as 3.10-15, Oct. 1952, MAB.) Subject Headings: 1. Marine meteorology 2. World climate.
1953 5A-57 551.509,1 (26) (02) U. S. Weather Bureau, Weather service for merchant shipping. 3d ed. Wash., D. C, July
1953. 67 p. diagrs., forms. DWB—Schedules of principal marine weather broadcasts for all major ocean areas of the world for which such service is available. Time of transmission, call sign, radio frequency and time of observation is given, as well as the type of current reports. Charts for selected regions show forecast areas. Subject Heading: 1. Marine weather service.
5A-58 551.46(02) tProudman, Joseph, Dynamical oceanography. London, Methuen, 1953. 409 p. diagrs.,
tables, eqs., refs. Review by H. Stommel in Science, 118(3065)-.365, Sept. 25, 1953. DLC—First textbook in English devoted to theoretical oceanography. The dynamical natures of all the chief kinds of water movements are elucidated and their characteristic relationships demonstrated. Included are chapters on gravity, pressure, turbulence, internal friction, thermodynamics (Chap. 10, unique in oceanographic literature), seiches, progressive waves, and tides. Starting from the fundamental principles of dynamics and of thermodynamics, with the physical properties of sea water, and assuming the conditions which arise outside the ocean, deductions are made relating to the movement of the waters of the ocean. Most of the mathematical parts of the book (kept basic for sake of readers with little mathematical knowledge) refer to conditions which have been ideally simplified, but the theoretical relationships deduced are compared with corresponding relationships based on observations made at sea. A detailed table of contents, author and subject indexes, historical summaries and bibliographies at the end of each chapter add considerably to the book's value as a reference work. Subject Headings: 1. Textbooks 2. Dynamic oceanography. I. Stommel, H.—From author's introduction.
MAJOR EXPEDITION REPORTS
{Arranged chronologically) 5A-59 551.46:91.04 551.506.5(26)
•Report on the scientific results of the voyage of H.M.S. Challenger during the years 1873-76 under the command of Captain George S. Wares . . . and the late Captain Frank Tourle Thomson, R.If. Prepared under the superintendence of the late Sir C. Wyville Thomson . . . and now of John Murray. Edinburgh. H. M. Stationery Office, 1880-1895. 50 v. Edited by the Challenger Office, figs., tables, charts. DLC—A monumental series of large volumes, chiefly zoological but containing also the most extensive meteorological and oceanographical data available to that date. The "Challenger." a pioneer ship in oceanographic work, furnished data for a general map of the ocean basins, their main contour lines, and deep and bottom temperatures; located the exact position of many islands and rocks, determined currents at the surface and at various depths and collected invaluable quantities of marine life data and samples. Daily meteorological observations Dec. 1872-May 1876 are tabulated on pages 305-744 of [Pt. I] Narrative. Vol. II. [Pt. II] Physics and Chemistry, Vol. II, Pt. II contains a "Report on atmospheric circulation" by A. BUCHAN, based on Challenger observations 1872-1876 and other meteorological observations. Subject Headings: 1. Challenger Expedition, 1872-1876 2. Expeditionary climatic data 3. Oceans. I. Great Britain. Challenger Office II. Buchan, Alexander.
5A-60 551.506.5(98) •Den lforske Nordhavsexpedition, 1876-1878. [The Norwegian North-Atlantic Ocean Expedi-
tion, 1876-1878.] Christiania, Gr0ndahl & Stfn, 1880-1901. 7 v. in 28 pts. illus., plates, maps, tables. DLC—Scientific reports of an expedition sponsored by the Norwegian government for a physical and biological exploration of the waters between Norway, Iceland, Jan Mayen and West Spitsbergen, carried out in the "V0ringen," under the leadership of Capt. C. WILLK. The seven
!
*•
H. BIBLIOGRAPHY ON GENERAL OCEANOGRAPHIC METEOROLOGY 91
volumes comprise 28 parts, by various authors with text in both English and Norwegian. Vol. 2, No. 1 (pub. 1883) by H. MOHN is entitled "Meteorology" and contains the tabulated meteorological observations (wind, pressure, temperature, humidity, cloudiness, precipitation amount and type, state of sea) of the expedition. Pt. 2 of the same volume by MOHN (1887) is entitled "The North Ocean, its depths, temperature and circulation." Subject Headings: 1. "Vjfaingen" Expedition, 1876-1878 2. Oceanographie expeditions 3. Arctic Ocean 4. North Atlantic. I. Mohn, Henrik (ed.) a. Sars, Georg Ossian (ed.).
5A-6! 551.46:91.04 •Wissenschaftliche Ergebnisse dor Deutschen Tiefsee-Expedition auf dem Dampfer "Valdivia"
1898-1899. Jena, Gustav Fischer, 1902-1940. 24 v. figs., maps, plates, tables. DLC—Volume I, "Oceanographie und Maritime Meteorologie," of this long series is devoted to an account by GERHARD SCHOTT of the oceanographical and marine meteorological observations aboard the German vessel "Valdivia" in the Atlantic and Indian Oceans. Included are a well illustrated textual dis- cussion, an atlas of 40 plates, charts, explanations of instruments, and numerous tables, temperature diagrams and profiles. Remainder of the series is largely marine biological. Subject Headings: 1. Dentsche Tiefaee Expedition, 1898-99 2. Expeditionary climatic data 3. Oceanographie data 4. Atlantic Ocean 5. Indian Ocean. I. Schott, Gerhard II. Chun, Karl (ed.)
5A-62 551.506.5(98) •Norske Videnskaps Akademi i Oslo, Report of the Second Norwegian Arctic Expedition in the
"Fram" 1898-1902. Kristiania, T. O. Brjjgger, 1907-1930. 5 v. figs., tables, plates, fold, charts, maps. DLC—Among the varied scientific treatises which comprise the results of the second "Fram" expedition is a lengthy tabulation by H. MOHN (v. I, No. 4) of the extensive meteorological data collected at Rice Strait (78°45.7'N. 74°56.5'W; Sept. 1898-July 1899), Havnefjord (76°29.4'N, 84°3.7'W; Oct. 1899-Aug. 1900). Gaasefjord (76°48.9'N, 88°39.5'W; Sept. 1900-Aug. 1901; 76° 39.8'N, 88°38.3'W; Sept. 1901-July 1902) and on shipboard in the Arctic and the North Atlantic in the interim periods. Subject Headings: 1. "Fram" Expedition, 2nd, 1898-1902 2. Expeditionary climatic data 3. Arctic expeditions 4. Arctic Ocean. I. Mohn, H.
5A-63 551.46:91.04 •Die Deutsche Sudpolar-Expedition auf dem Schiff "Gauss" unter Leitung von Erich von
DrygalsM, Aug. 1901-April 1902. Berlin. UniversitSt. Institutfur Meereskunde, VerdffenMchungen. Nos. 1, 2 and 5,1902. figs., tables, fold, charts. Also published separately. Berlin, (K.) Hofbuch- handlung, E. S. Mittler & Sohn, 1902-1903. 3 v. in 2. DLC—First report is an account of the scientific (topography, geology, oceanography, bacteriology, biology and geomagnetism) observations on the cruse of the "Gauss" from Kiel, Germany, to Cape Town to Kerguelen Island (ca. 50°S, 70°E) in the Indian Ocean. Included also (Pt. 2) are tables and charts of meteorological data (pressure, sea and air temperatures, wind, cloudiness) from the northeast and southeast Atlantic, Aug.-Oct. 1901. Subject Headings: 1. Dentsche Sud-Polar Expedition, 1901-1902 2. Expeditionary climatic data 3. Marine meteorological data 4. East Atlantic. I. Drygalski, Eric von.
5A-64 551.46:91.04 551.506.5(269) •Scottish National Antarctic Expedition, 1902-1904, Report on the Scientific Results of the
Voyage of S.Y. "Scotia" during the years 1902, 1903 and 1904, under the leadership of William S. Bruce. Edinburgh, The Scottish Oceanographical Laboratory, 1907-1920. 8 v. figs., tables, plates. DLC—Vol. II, Physics, Pt. I, Meteorology by R. C. MOSSMAN contains extensive tabulated pressure, temperature, humidity, wind, cloud, sea surface temperature and precipitation data collected between Nov. 1902 and July 1904 on board the Scottish vessel "Scotia" in the South Atlantic and Antarctic Oceans, at Laurie Island, South Orkneys, at Cape Pembroke, Falkland Islands and in the Weddell Sea. Pts. II and III of same volume devoted to magnetism and tides. Subject Headings: 1. Scottish National Antarctic Expedition, 1902-1904 2. Antarctic expeditions 3. Expeditionary climatic data 4. South Atlantic 5. Antarctic Ocean. L Mossman, Robert Cockburn.
5A-65 551.506.5(99) •Charcot, Jean B. A. E., Deuxieme Expedition Antarctique Francaise (1908-1910), commandee
par le dr. Jean Charcot. Sciences Physiques: Documents Sdentifiques. Paris, Masson et Cie, 1911-1921. 28 v. figs., tables, charts. DLC—One lengthy volume (1911) "Observations meteoro- logiques" by J. ROUCH is devoted to discussion and tabulation of the extensive meteorological data compiled on the cruise of the French vessel "Pourquoi-Pas" on a circular toute from Cape Horn to the Shetland Islands, west along the coast of the South American Antarctic to about 120°W,
^=W
92 METEOROLOGICAL ABSTRACTS AND BIBLIOGRAPHY
70°S, then northeastward to southern Chile. Subject Headings: 1. Expedition Antaxctique Francaise, 2nd, 1908-1910 2. Antarctic expeditions 3. Expeditionary climatic data 4. Antarctic Ocean. I. Rouch, J.
5A-66 551.46:91.04 *§Bergen, Norway. Museum, Report on the scientific results of the "Michael Sars" North
Atlantic deep-sea expedition 1910. 4 v. Bergen, John Grieg, 1930-1932. figs., tables, refs. DLC—Vols. II-IV are devoted to marine biology. Vol. I, however, contains the tables, charts and » j cross section based on the meteorological and oceanographical data compiled during the expedition. j The text goes far beyond a mere descriptive discussion of the observations, treating such subjects as energy exchange between sea and atmosphere and the dynamics of the sea. Subject Headings: j 1. "Michael Sars" North Atlantic Deep-sea Expedition, 1910 2. Expeditionary climatic data 3. Oceanographic data 4. North Atlantic. I. Murray, Sir John II. Hjort, Johan III. Holland- • j Hansen, Bjorn. j
i 5A-67 551.506.5(99) 551.506.7(99) j
•{Australasian Antarctic Expedition, 1911-1914, Scientific Reports, Series A, B and C. Sydney, Australia. Govt. Printer, 1918-1937. 22 v. figs., tables, charts, plates. DLC—-Series A com- prises reports on geography, oceanography and geology. Ser. C is devoted to zoology and botany and Ser. B, vols. I and II, to terrestrial magnetism. Vols. Ill to VII of Ser. B contain a wealth of j tabulated meteorological data for Macquarie Island, Cape Denison Station, Adfilie Land, Queen Mary Land, Antarctic Ocean (log of S.Y. "Aurora"), a discussion of all these observations and a j series of daily weather charts, Feb. 1912-Jan. 1913, extending from Australasia and New Zealand ' to the Antarctic Continent. Monthly barograms and weekly thermograms for selected stations also included. Also: Australian National Antarctic Research Expeditions, 1947-1949, A.N.A.R.E. Reports, Series D, volumes 1-4 published 1950-1953. DVB—Devoted to the meteorology of Heard and Macquarie Islands. Vol. 1 (see items 3.5-52, May 1952 and 4.6-36, June 1953, MAB) ; includes a discussion of results of observations (1948), a description of meteorological stations on both islands, a review of modern methods of synoptic analysis for the Southern Ocean and analyzed weather > charts. Volumes 2-4 contain tables of detailed surface and upper air observations. The data, j available on request for reproduction or analysis, are filed on punched cards at the Meteorological ; Branch, Dept. of the Interior, Melbourne, Australia. Publication of a discussion of the meteorology of the sub Antarctic region is planned as soon as five years of observations have been collected and analyzed. Subject Headings: 1. Australian National Antarctic Research Expeditions, 1947-1949 2. i Australasian Antarctic Expedition, 1911-1914 3. Expeditionary climatic data 4. Upper air observations 5. Heard Island, South Indian Ocean 6. Macquarie Island, South Pacific Ocean ', 7. Antarctica. I. Australia, Dept. of External Affairs. Antarctic Div.—G. T. I
5A-68 551.506.5(268) Maud Expedition, 1918-1925, Scientific results of the Norwegian North Polar Expedition with 4
the "Maud," 1918-1925. Bergen, Geofysisk Institutt, 1927-1933. 5 v. figs., tables, plates, i refs. DLC, DWB—Extensive wind, humidity, sea and air temperature, air pressure and cloudiness data (Vol. 3, 1930, Meteorology, Pt. II, by H. U. SVERDRUP, see 4E-41, May 1953. MAB) recorded by the staff of the "Maud" en route to and from the Polar ice pack, while imprisonea by the pack for several winters and during sledging expeditions on the pack. Subject Headings: 1. "Maud" Ex- pedition, 1918-1925 2. Expeditionary climatic data 3. Arctic expeditions 4. Arctic Ocean. I. Srerdrup, H. U. >
5A-69 551.46:91.04 j •Schmidt, Johannes, The Danish "Dana" expeditions 1920-22 in the North Atlantic and the
Golf of Panama. Oceanographic Reports, No. 1-8, edited by the "Dana" Committee. London. Wheldon & Wesley, 1926-1931. figs., tables, plates. DLC—Expedition reports consist of eight beautifully illustrated but chiefly marine biological monographs by separate authors. Of particular > meteorological interest is No. 1 (pub. 1929) by JOHANNES SCHMIDT entitled "Introduction to the oceanographical reports" and containing extensive tabulated data for weather, wind, state, tem- perature and salinity of the sea and depth in some cases for 565 stations in the North Atlantic and hydrographic data for 287 stations. Subject Headings: 1. "Dana" Expeditions, 1920-1922 2. Oceanographic expeditions 3. Nortn Atlantic. *
5A-70 551.46:91.04(261/4) •Deutsche Atlantische Expedition auf dem Forschungs- und Vermessungsschiff "Meteor,"
1925-1927, Wluenschaftliche Ergebnisse. 16 v. Berlin and Leipzig, 1932-1939. figs., tables, charts. DLC, MWB—Results represent the most comprehensive oceanographic survey yet at- tempted of the South Atlantic and include a descriptive account of the expedition (v. 1); soundings,
*
II. BIBLIOGRAPHY ON GENERAL OCEANOGRAPHIC METEOROLOGY 93
morphological profiles and geology (v. 2-3); oceanography, currents, waves, evaporation, tem- perature-salinity measurements (v. 4-7); chemistry of the sea (v. 8-9); marine biology (v. 10-13); and meteorological (v. 14) and aerological observations (v. 15-16). Subject Headings: I. "Meteor" Expedition, 1925-1927 2. Expeditionary climatic data 3. South Atlantic. I. Defant, Albert {ed.).
SA-71 551.46:91.04:016 tThorade, Hermann, Vorlaufige Ergebnisse der Deutschen Atlantiichen Expedition auf
"Meteor." [Preliminary results of the Deutsche Atlantische Expedition on the "Meteor."] Petermanns Geographische Milteilungen, 75:65-69, 1929. 70 refs. DWB—Author lists and discusses briefly 70 interim studies and reports on various phases of the "Meteor" expedition work. Subject Headings: 1. "Meteor" Expedition, 1925-1927 2. Bibliographies.
5A-72 551.506.5(99) *Discovery Reports. Vol. 1, 1929. Latest issue. Vol. 26, 1953. Vol. 1-25 issued by the Dis-
covery Committee of Great Britain. Vol. 26 (latest rec'd) by National Institute of Oceanography. 26 v. figs., plates, tables, fold, charts. DLC—Meteorological (pressure, temperature, wind and waves) hydrological and biological data for 299 RSS "Discovery." 1107 RSS "William Scoresby" and 2072 RSS "Discovery II" stations, 1925-1950 in the Atlantic and Indian Oceans but principally in the Antarctic Ocean are tabulated in the "Station Lists" in Vols. 1, 2, 3, 4, 21, 22, 25, and 26. Subject Headings: 1. "Discovery II" Expeditions, 1925-1950 2. Expeditionary climatic data 3. Ant- arctic Ocean.
5A-73 551.506.5(261/4)(269) *Norske Videnskaps-Akademi i Oslo, Scientific Results of the Norwegian Antarctic Expeditions
1927-1928 et Sqq, instituted and financed by Consul Lars Christensen. Oslo, 1929-1951. 3 v. figs., tables, refs., fold, charts. MWB—The three volumes consist of a series of 32 monographs by individual authors based on the observations made by the Norwegian ships "Odd I," "Norvegia," "Torlyn," "Thorshavn" and "Whale" in circumnavigating Antarctica or traversing the Atlantic from 60°S-60°N, 1927-1935. Subject matter is largely marine biological, geological and zoological with the exception of Vol. 1, No. 10 and 11 by HAKON MOSBY on "The sea surface and the air" and "The waters of the Atlantic Antarctic Ocean" which contain extensive tabulated meteorological and oceanographical data respectively for the 60°N to 60°S Atlantic passages of the "Norvegia" and "Whale" 1927-28. Subject Headings: 1. Norwegian Antarctic Expeditions 1927-1928 2. Expedi- tionary climatic data 3. Oceanographic data 4. Atlantic Ocean 5. Antarctic Ocean. I. Holtedahl, Olaf (ed.) U. Mosby, Hlkon.
5A-74 551.506.5(26) •Carnegie Institution of Washington. Dept. of Terrestrial Magnetism, Scientific remits of the
Cruise VII of the Carnegie during 1928-1929 under command of Captain J. P. Ault. Carnegie Institution of Washington, Publications No. 536. 537, 542. 544, 545, 547, 555, 556, 562, 565, 568, 571, 1942-1946. figs., tables, charts. DLC—On the seventh and last cruise of the Carnegie (1928- 29, 45,000 nautical miles), in addition to the work in geomagnetism and electricity, an extensive program of oceanographic research was included (sonic soundings, temperature and salinity ob- servations, bottom samples, chemical investigations). Plankton in upper 100m were investigated and atmospheric circulation and evaporation over the ocean were studied and upper air soundings made. Results are published in monograph form under individual authorship as Publications of the Carnegie Institution. Meteorological volumes (No. 544, 1943, by W. C. JACOBS and K. B. CLARKE; No. 547, 1943, by ANDREW THOMSON) contain extensive tabulated data for the Atlantic and Pacific Oceans for 169 pilot balloon flights not exceeding 10.5 km in height. Subject Headings: 1. Carnegie Expedition, VII, 1928-1929 2. Expeditionary climatic data 3. Atlantic Ocean 4. Pacific Ocean. I. Jacobs, W. C. II. Clarke, K. B. III. Thomson, Andrew.
5A-75 551.46:91.04 551.506.5(92) •Snellius-Expedition, 1929-1930, The Snellius-Expeditton In the eastern part of the Netherlands
East-Indies 1929-1930, under the leadership of P. M. ran Kiel. Scientific Results. Leiden. E. J. Brill, 1933-1950. 6 v. figs., tables, plates, photos, charts, refs. DLC—In 16 months (33,000 miles) of cruising in the watere of the East Indian Archipelago lying to the eastward of Java and Borneo, observations were made to determine bottom character and configuration, water exchange between the deep basins and the oceans and the chemical and physical characteristics of the water. Biological and geological observations also made. Meteorological data tabulated by element ob- served are found in vol. Ill "Meteorological Observations." by S. W. VISSER. Subject Headings: 1. Snellius Expedition, 1929-1930 2. Expeditionary climatic data 3. Netherlands East Indies
v 4. Oceanographic data. I. van Riel, P. M. II. Visser, Simon Willem.
94 METEOROLOGICAL ABSTRACTS AND BIBLIOGRAPHY
5A-76 551.46 91.04 •Sverdrup, Harald Ulrik and Soule, F. M., Scientific results of the "nautilus" expedition, 1931.
Pt. I. Introduction and narrative; Pt. II. Oceanography; Pt. in. Echo sounding. Papers in Physical Oceanography and Meteorology, Cambridge. 2(1), 1933. 76 p. 46 figs., tables, refs., eqs. DwB—Because of mechanical difficulties which prevented the submarine Nautilus from submerging and crossing the Arctic under the ice, the expedition did not reach its goal and the scientific results are smaller than hoped for. They do include, however, detailed oceanographic, chemical and magnetic observations and echo soundings to 82°N. Subject Headings: 1. Nautilus Expedition, 1931 2. Submarines 3. Arctic exploration 4. Arctic Ocean.
5A-77 551.46:91.04 •British Museum (Natural History). The John Murray Expedition, 1933-1934, scientific reports.
Vol. 1, 1935-36—Vol. 9, No. 5. 1953 (latest rec"d.). figs., tables, fold, charts. MWB—Vol. I is devoted to introductory comments and topography. Folding chart shows the 1933-34 voyage of the "Mabahiss" in the Red Sea, Gulf of Aden and Indian Ocean. Vol. II, Meteorological, chemical and physical investigations, contains Oct. 1933-May 1934 monthly charts of mean sea temperature. The balance of the volumes are concerned with zoology. Subject Headings: 1. John Murray Expedi- tion, 1933-1934 2. Indian Ocean 3. Red Sea 4. Gulf of Aden.
5A-78 551.582 (268) :551.506.5 $t*Ekspeditsiia SSSR na Severnyl Polius, 1937, Trudy drelfuiuschchei stantsii "Severnyl Polius";
nauchnye otchety i rezul'taty nabliudenil drelfuiuahchel Ekspeditsii Glavsevmorputi 1937-1938 gg. [Transactions of the drifting station "Severnyl Polius." Scientific account and results of observa- tions on the drifting expedition of the Glavsevmorputi in 1937-1938.] 2 v. Leningrad. Izdat. Glavsevmorputi, 1940-1945. DLC—Vol. I, contains a descriptive account of expedition, map of route and a complete list of coordinates of drift. Vol. II contains descriptions and discussion of meteorological apparatus and observations, p. 5-30; meteorological service of the expedition, p. 31- 63; atmospheric circulation in the central polar basin, p. 64-177; tables of hourly or synoptic ob- servations and various types of summaries, p. 187-397; cloud photographs, p. 401-423; and 58 synoptic charts on color backgrounds, p. 427-484, mostly Northern Hemisphere analyzed charts for 1937 and 1938. (For fuller abstract see item 1-127, Jan. 1950, MAB.) Subject Headings: 1. Arctic exploration 2. "Severnyl Polius" Expedition, 1937-1938. I. Fedorov, Evgenil Kon- stantinovich (ed.).
5A-79 551.506.5(98) Badigin, Konstantin Sergeevich, Na Korable "Georgil Sedov" cherez Ledovityl Okean. [On
the "Georgil Sedov" through the Arctic Ocean.] Moscow, Izdat. Glavsevmorputi, 1940. 606 p. figs., illus., maps (fold.). DLC—First 545 pages of this book give a popular description of the drifting expedition (Oct. 1937-Jan. 1940) with scattered scientific information. The preliminary scientific results are summarized by ZUBOV and BADIGIN on the last 60 pages, giving hydrographic data (depths, temperature sections) as well as meteorological data for temperature, pressure (with maps of seasonal and annual distribution for 1937-39) precipitation (annual total 74 mm), severity of weather, auroras, ice thickness, wind direction and speeds, ice-drift (mean angle of deviation from wind direction was 24°) and steady currents. Detailed discussion devoted to the relation between the ice-drift and the mean monthly isobars. (For further information, see abstract No. 903, Arctic Bibliography. 1953.) Subject Headings: 1. "Sedov" Drifting Expedition, 1937-1940 2. Arctic expeditions 3. Ice drift 4. Arctic Ocean. I. Zubov, N. N.—A.A.
5A-80 551.506.5(263) 551.501.7 •Vuorela, Lauri A , Contribution to the aerology of i>c tropical Atlantic. Journal of Meteorology,
5(3) :115-117, June 1948. 4 figs., 6 refs. Also: Some r.iulti from the Finnish Atlantic Expedition 1939. Helsinki, Universitel. Meteorologiska Ittstitulet, Mitteilungen, No. 72, 1953. 20 p, 7 figs., 7 tables, 16 refs. Suomalainen Tiedeakatemia, Helsinki, Toimituksia, Ser. A, I, No. 155, 1953. And: Synoptic aspects of tropical regions of the Atlantic Ocean, West Africa and South America. Ibid., Ser. A, I, No. 79, 1950. Unchecked. DLC, DWB—First article presents two detailed vertical meridional sections (based on 110 radiosonde ascents, average height 21 km) between northwestern Europe and Buenos Aires for Aug.-Sept. and Oct.-Nov. showing tropopause, trade wind inversion, zonal wind components in m/sec and isotherms in °C. No data included. Second reference is a report concerning the trade wind inversion and the distribution of humidity and cloudiness over the Atlantic. Vertical meridional sections show relative humidity and mixing ratio (g/kg) for the out- bound and homeward voyages. Subject Headings: 1. Finnish Atlantic Expedition, 1939 2. Synoptic aerology 3. Radiosonde observations 4. Trade wind inversion 5. Atlantic Ocean.
II. BIBLIOGRAPHY ON GENERAL OCEANOGRAPHIC METEOROLOGY 95
SA.-3! 551.506.7(269) j *U. S. Office of Naval Operations, Aerological observations and summaries for the Antarctic,
from Dec. 15, 1946 to March 15, 1947. A project of Operations Highjump, Task; Force 68. U. S. Ofice of Naval Operations, NAVAER 50-1R-214, Jan. 1948. 404 p. almost entirely tables. DWB —A summary of meteorological data in extenso obtained during one of the greatest undertakings \ in the history of marine weather research and made available to the scientific world quickly after the termination of the expedition, "Operations Highjump." Observations from ships were made all \ around the Antarctic continent and at Little America (79°S, 164°W). Most of the report is devoted to complete hourly surface observations, including also swell, state of the sea, ceiling height, etc. ' Upper air wind observations were made twice daily by pibals and sometimes with rawins. Numerous \ radiosonde data give pressure height, temperature and humidity up to 60 mb. Means for the whole I duration of the expedition are computed for 20 ocean areas located mainly between 60 and 65°S to the north of the ice pack in the vicinity of the Antarctic front and separately for Little America. j Subject Headings: 1. Marine meteorological observations 2. Upper air data 3. Antarctic Ocean 4. little America 5. Operations Highjump. I. U. S. Navy. Task Force 68.—A. A.
5A-82 551.46:91.04 ] Pettersson, Hans, Med Albatross over havsdjupen. [With the Albatross on the deep sea.]
Stockholm, Albert Bonniers F6rlag, 1950. 239 p. 133 figs. DLC—Beautifully illustrated com- : mentary on the Swedish Deep Sea Expedition, 1947-48. No scientific results included. Subject Headings: 1. "Albatross" Expedition, 1947-48 2. Oceanographic expeditions.
5A-83 551.506.5:91.04(99) j Robin. G. de Q., Norwegian-British-Swedish Antarctic expedition, 1949-52. Polar Record, I
6(45)-.608-616, Jan. 1553. 2 figs., 3 photos. Also: Reece, Alan, The base of the Norwegian-British- < Swedish Antarctic Expedition, 1949-52. Ibid., p. 617 630. 4 figs., 3 photos, table. DLC—ROBIN describes general course of expedition, setting up of bases, journeys and flight routes and summarizes scientific results. REECE in the first of a series of articles describes equipment in base at Maudheim ; (71°6'S, 10°58'W). An Appendix gives monthly winds and temperatures 1950-51. (Same item as 4.10-40, Oct. 1953, MAB. For abstract of a survey of the second year's work of the expedition, see item 4.10-39, Oct. 1953, MAB.) Subject Headings: 1. Antarctic expeditions 2. Maudheim * Expedition, 1949-52 3. Antarctica. I. Reece, Alan.—C.E.P.B. \
l
5A-84 551.46.-91.04 Mielche, Hakon, Galathea laegger ud. Rejsen rundt om Afrika. [Galathea sets out. Voyage
around Africa.] Copenhagen, Steen Hasselbalsha Forlag, 1951. 224 p. photos. Also: Galathea i 0sten. [Galathea in the East.] 1952. 190 p. photos. And: Galathea vender hjem. [Gala- thea returns home.] 1953. 190 p. photos. DLC—A series of three popular, illustrated books descriptive of the Galathea's 1950-52 cruise from Copenhagen southward around Africa, across the Indian, Pacific and Atlantic Oceans and home to Denmark. No scientific results included. Subject Headings: 1. "Galathea" Expedition, 1950-52 2. Oceanographic expeditions.
5A-85 551.46:91.04(268) •Worthiri-ton, L. V., Oceanographic results of project Skijump I and Skijump II in the Polar
Sea, 1951-1952. American Geophysical Union, Transactions, 34(4):543-551, Aug. 1953. 4 figs., 3 tables, 5 refs. DLC—Hydrographic data (temperature and salinity) are give- for 8 stations in the "mare incognitum," the Arctic Ocean north of America. According to an added map, only for the eastern part of the Soviet sector is oceanographic information still lacking. A large anticyclonic eddy was discovered as the probable oceanic circulation north of Alaska, suggesting the existence of a submarine ridge across the Arctic basin. The observations were made from ice floes with the aid of naval planes. Subject Headings: 1. Oceanic circulation 2. Oceanographic data 3. Project Skijump 4. Arctic exploration.—A.A.
CHARTS AND TABULATED DATA (Arranged chronologically by countries)
DENMARK 5A-84S 551.506.1:551.46(268) (489)
•Denmark. Meteorologisk Institut, Nautisk-Meteorologisk Arbog. Nautical-Meteorological Annual, v. 1, 1897. Last issue received, 1952 (pub. 1953). Almost entirely tables. In English and Danish. Also: Nautisk-Meteorologisk Arbog, II Del. Meteorologiski Obaervationer. Nau- tical-Meteorological Annual, Part LT. Meteorological Observations, v. 1, 1932. Last issue
V- *w
96 METEOROLOGICAL ABSTRACTS AND BIBLIOGRAPHY
received, 1937 (pub. 1952). Almost entirely tables. In English and Danish. DWB—Previous to 1897, the hydrographical and meteorological observations of lightships were published as Pt. 3 of their Meteorologiske Arbog. From 1897-1931, the Nautisk-Meteorologisk Arbog included these data, and beginning again in 1942 (?) these data appear in the Nautisk-Meteorologisk Arbog. From 1932-1941, the Naut. Met. Arbog lacked these data, so data for those years will appear as Pt. 2 of the correspond- ing Nautisk-Meteorologisk Arbog for that year. In present form, the Arbog for each year contains tabulated wind, cloudiness, weather, air and sea temperature, visibility, current, state of the sea and salinity data for 12 light ship stations in the North Sea, Skagerrak, Kattegat and Baltic Sea and for 19 Danish coastal stations. (Same item as 3.10-44, Oct. 1952 MAB.) Subject Headings: 1. Marine meteorological data 2. Yearbooks 3. Denmark.
5A-87 551.311.181 Denmark. Meteorologisk Institut, Isforholdene i de Arktiske have. 1900-1939; 1946-1950.
State of ice in the Arctic seas. Denmark. Meteorologisk Institut, Nautisk-Meteorologisk Arbog, Tillaeg [Appendix], 1900-1950 (latest ree'd.). charts. In English. DWB—"Reports on the state of the ice in the Arctic seas were published by the Danish Meteorological Institute for each of the years 1901-1939 and 1946-1950. For the intervening years, 1940-1945, the Institute is endeavoring to collect data which will make possible a later publication of reports from these years." North Atlantic sea surface temperature charts were included through the 1939 (?) issue. Annual reports (currently prepared by HELGK THOMSEN, Chief of the Nautical Section) consist of discussion of the annual and seasonal ice characteristics and of monthly details by regions plus color charts showing ice types and extent for that particular year as contrasted with average conditions for 1898-1922. When publication resumed in 1946 data from the Soviet and partly the American Arctic were no longer available. Subject Headings: 1. Sea ice 2. Arctic Ocean 3. North Atlantic. I. Thomsen, Helge.
FRANCE 5A-88 551.5823(26)
•France. Bureau Central Meteorologique, Atlas de m6teorologie maritime public a l'occaaion de l'Sxposition maritime international du Havre. [Atlas of marine meteorology published on the occasion of the International Maritime Exposition at Le Havre.] Paris, Gauthier-Villars, 1887. 35 p. 7 figs., tables, 33 plates. DWB—Introductory notes by LEON TEISSERENC DE BORT precede ocean charts showing pressure, wind, storms, currents, temperature and magnetic declination. Subject Heading: 1. Marine atlases. I. Teisserenc de Bort, Lion.
GERMANY 5A-89 551.582.3(26) Wilhelmshaven, Germany. Marineobservatorium, Klimadienst, Stiller Ozean Klimakarten.
[Pacific Ocean climatic charts. ] 1940. Also: Atlantischer Ozean Klimakarten. [Atlantic Ocean climatic charts.] 1940. And: Indischer Ozean Klimakarten. [Indian Ocean climatic charts.] 1940. charts and tables. MWB—Subject Heading: 1. Marine climatic charts.
5A-90 551.582.3(261) Hamburg. Deutsche Seewarte, Monatskarten f Or den Nordatlantischen Ozean, nenbearbeitet
von der Deutschen Seewarte, 1939-1940. [Monthly charts for the North Atlantic, revised by the Deutsche Seewarte.] Hamburg, Oberkommando der Kriegsmarine, 1940. 48 p. Also: Monats- karten fur den Stidatlantischen Ozean. [Monthly charts for the South Atlantic] Hamburg, 1944. 52 p. DWB—Monthly charts for the Atlantic, 60°N-6°S and 10°N-5°S compiled by the Deutsche Seewarte from British, Dutch and German ship reports with variable but substantial periods of record for different elements. Recorded on charts arc wind roses for 5" squares, limits of drifting ice, limits of sand and dust, fog frequencies, ocean currents, sea surface temperature, salinity and density, air pressure and prevailing wind direction, wind speed, storm frequencies (Beaufort force ^ 8), air temperature, precipitation and frozen precipitation frequencies. Selected synoptic situations shown. Subject Headings: 1. Marine meteorological charts 2. North Atlantic 3. South Atlantic,—R. Quirot.
5A-91 551.582.3(261) Germany. Meteorologisches Amt ftlr Nordwestdeutschland, Klimatologie des ostlichen Tells
des Mittelatlantischen Ozeans nach Schiffsbeobachtungen. Seeraum: 40CN bis Aquator, 30°W bis zur iberischeo und airikanischen Kiiate. [Climatology of the eastern part of the mid-Atlantic from ship's observations. Ocean area: 40°N to equator, 30°W to the Iberian and African coasts.] Hamburg, 1947. 47 p. 14 tables, numerous charts. DWB—Monthly charts show mean wind, pressure, cloudiness, air and sea temperature and weather based on approximately 500,000 punched-
II. BIBLIOGRAPHY ON GENERAL OCEANOGRAPHIC METEOROLOGY 97
card recorded ships' observations from the years 1912-14, 1918-21 and particularly 1922-39. Mean monthly data tabulated by element observed in approximately 4° square subdivisions of the African coastal waters and East Atlantic. Subject Headings: 1. Marine climatic chart* 2. East Atlantic. 1. Kuhlbrodt, Erich (ed.).
SA-92 5S1. 311.1(26) Hamburg. Deutsches Hydrographisches Institut, Atlas der Eisverhaltnisse dea Nordat-
lantischen Ozeans und tJbersichtskarten der Eisverhaltnisse dea Nord- und Stidpolargebietes. [Atlas of ice conditions in the North Atlantic Ocean and general charts of the ice conditions of the North and South Polar regions.] Hamburg, 1950. 24 p. 34 col. charts, bibliog. p. 24. Hamburg. Deutsches Hydrographisches Institut, No. 2335. DLC, DWB—Monthly charts show mean (1919- 1943) ice characteristics and extent in the North Atlantic, Arctic and Antarctic (1929-1939) oceans. Text devoted to a discussion of the geographical distribution of ice and to the definition of the various types of ice. Subject Headings: 1. Sea ice 2. Marine atlases 3. North Atlantic 4. Arctic Ocean 5. Antarctic Ocean. I. Bttdel, Julius {ed.).
5A-93 551.5(02) 55.03(02) 52(02) t*Landolt, Hans H. and Bornstein, Richard, Zahlenwerte und Funktionen aus Chemle, As-
tronomic, Geophysik und Technik. [Tables and equations in physics, chemistry, astronomy, geophysics and technology.] 6th ed. Edited by Arnold Eucken. Berlin, Springer, 1950-1952. Vol. 3, Astronomie and Geophysik. 1952. Prepared by Georg Joos; Julius Bartels and Paul ten BrUggencate, eds. 795 p. tables, charts, figs., bibliogs. DWB, DLC—Section 326 on Oceanography (v. 3, p. 426-541) by G. DIETRICH and J. JOSEPH gives hundreds of tables and references on physical and chemical constants of the oceans, sea ice, effect of atmospheric pressure, optics, surface tem- perature (diurnal and secular variation), salinity, and dynamic oceanography (currents, waves, austausch, tides, ice conditions). Section 327 (p. 542-563) by FRIEDRICH takes up hydrography of flowing water, lakes, ground water, etc. including evaporation, effect of precipitation, hydrologic cycle, etc. (Same item as 4.4-9, April 1953, MAB.) Subject Headings: 1. Geophysical tables 2. Oceanographic data. I. Eucken, Arnold (ed.) II. Dietrich, G. III. Joseph, J. IV. Friedrich —MR.
5A-94 551.577.21 551.577.32 *M611er, Fritz, Vierteljahreskarten des Hiederschlaga fur die game Erde. [Quarterly charts
of rainfall for the whole earth.] Petermanns Geographische Mitteilungen, 95(1):l-7, 1951. 2 figs., fold, chart, 3 tables, 43 refs. DLC—The chief difficulty in constructing these charts was the pre- cipitation over the oceans. After discussing correction by estimates of evaporation and use of island and coast stations, SCHOTT is followed for Atlantic and for the remainder MEINARDUS' charts (1934) are decreased by J. The large scale seasonal equal area charts are discussed and the mean precipitation for each season is calculated by 5° zones of latitude for land (after BROOKS and HUNT). sea and total. Two types of annual variation, Atlantic and West Pacific, are found over the oceans. (Same item as 3.4-200, April 1952, MAB.) Subject Headings: 1. Precipitation amount 2. Precipita- tion variations 3. Global precipitation 4. Precipitation at sea.—C.B.P.B.
GREAT BRITAIN 5A-95 551.582.2(26)
*Great Britain. Meteorological Office, Reseau Mondial. Monthly and annual summaries of pressure, temperatures, and precipitation at land stations, generally two for each ten-degree square of latitude and longitude [1910-1932]. London, H.M. Stationery Office, 1917-1940. 23 vols. fold, charts, tables. Title varies. DWB—One of the most comprehensive sources of data from which anomalies of temperature and pressure all over the world can be plotted. Publication of data commenced in 1917, with the annual volume for 1911. The volume for 1921 was the first to include data from the oceans (for 5° squares, mostly in the Atlantic Ocean). Published under the auopices of the International Meteorological Committee. (Same item as 3C-13, March 1952, MAB.) Sub- ject Headings: 1. Climatic data 2. Marine climatic data 3. World climate.
SA-96 551.5823 Great Britain. Meteorological Office, Meteorological charts for the world. London, H.M.
Stationery Office. Dec. 31, 1928. Charts Nos. 2917-18 ;2930-34. AU charts. DWB—Quarterly charts of 60°S-70°N show mean directions and velocities of stream and drift currents as well as winds, isotherms and isobars for the Pacific, Atlantic and Indian Oceans. Charts were compiled from Great Britain Meteorological Office and Hydro-graphic Office and U. S. Hydrographic Office charts. (Same item as 41-55, Sept. 1953, MAB.) Subject Headings: 1. World meteorological charts 2. Marine meteorological charts 3. Oceans.
V~ ._-
98 METEOROLOGICAL ABSTRACTS AND BIBLIOGRAPHY
5A-97 551.5823(26) Great Britain, Meteorological Office, Monthly meteorological charts of the Atlantic Ocean.
London, H.M. Stationery Office, 1948. 122 p. charts. M.O. 483. Also: of the Western Pacific. 1947. 122 p. charts. M.O. 484. — of the Eastern Pacific Ocean. 1950. 122 p. charts. M.O. 518. And: of the Indian Ocean. 1949. 98 p. charts. M.O. 519. DWB —Four large atlases, which deal comprehensively with the climatology of the oceans, month by month. Prepared during war primarily for operational purposes. AU data shown on charts of the oceans by isopleths except wind and swell data which, being vector quantities, do not lend them- selves to such representation. Observations generally grouped in 5° squares. Monthly mean, maximum and minimum sea and air temperatures and range between maximum and mean plotted as well as isotherms of the mean monthly differences between sea and air temperatures. Cloud data represented by four charts for each month. Other weather factors represented include fog, mist, haze, lightning, and precipitation. Wind roses constructed for each 5° square. "Swell" roses showing direction and intensity, typical monthly cyclonic storm tracks and correction and conversion tables also included. Subject Headings: 1. Marine climatic charts 2. Marine atlases 3. Oceans.
5A-98 551.582.3 (26) :016 tGreat Britain. Hydrographic Office, Catalogue of Admiralty charts and other Hydrographic
publications, 1953. Complete edition . . . corrected to 30th April 1953. 79 p. Its: Hydro- graphic Publication, H.D. 374. 1952. Price: 5s.Od. DWB—An enormous number of pilot and other charts published by the British Admiralty are listed according to specific parts of the earth, and according to index number, showing their location on survey maps. Contains also index of a few recent meteorological and ice charts, oceanographical diagrams, sailing directions, radio stations and tidal publications. Subject Headings: 1. Marine pilot charts 2. Sailing directions 3. Bibliog- raphies.—A. A.
JAPAN 5A-99 551.582.3(265/6) Japan. Hydrographic Dept., Military weather charts, Indian Ocean. Tokyo, May 1943.
Also: Military weather charts, northern North Pacific Ocean. Dec. 1943. North Pacific weather charts. Sept. 1939. Military weather charts, Aleutians, Hawaii, west coast of United States. July 1944. Military weather charts, South China Sea and surrounding areas. Aug. 1944. Mili- tary weather charts, vicinity of Coral Sea. Feb. 1943. Entirely in Japanese. MWB—Subject Headings: 1. Marine climatic charts 2. Pacific Ocean 3. China Sea.
NETHERLANDS 5A-100 551.506(26)
•Netherlands. Meteorologisch Instituut, Oceanographische en meteorologlsche Waarnemingen in den Atlantischen Oceaan. [Oceanographic and meteorological observations in the Atlantic Ocean.] Netherlands. (K.) Meteorologisch Instituut. No. 110.1856-1925. Also: Monthly meteoro- logical data for ten-degree squares in the Atlantic and Indian Oceans. And:... in the Oceans. Ibid., No. 107, 107A, 107B, Jan. 1900-Dec. 1930. And: Oceanographische en meteorologlsche Waarnemingen in den Indischen Oceaan. [Oceanographic and meteorological observations in the Indian Ocean.] Ibid., No. 104, 1924-1930. DN-HO—Wind, pressure, temperature, cloudiness and hydro-meteor data (1856-) for 10° squares in the Atlantic, Pacific and Indian Oceans. Subject Headings: 1. Marine climatic charts 2. Oceans.
NORWAY 5A-101 551.582.3 (26) :55t.311.1 Maurstad, Alf, Atlas of sea ice. Geofysiske Publikasjoner, Oslo, 10(11), 1935. 17 p. 10
plates, 2 refs. DLC—Textual discussion of development of sea-ice, ice terminology, glacier ice in the sea and the freezing, melting and physical properties of ice in the sea precedes forty photographs illustrating the various types of marine ice. Subject Headings: 1. Sea ice 2. Atlases.
U.S.SJL 5A-102 551.311.181 (268)(266.5)
•U.S.S.R. Gidrograficheskoe Upravlenie, Svedeniia o sostoianli l'dor na moriakh SSSR. [The state of the ice in the seas of the U.S.S.R. j Vol. 1-8. 1924/25-1931/32 (publ. 1926-1936). illus., tables, charts. Title-page, tables of contents and captions to tables in Russian and English; text in Russian. DLC—Contains list of stations arranged by seas with name of observer. Tables of freezing and of the breaking up of sea waters include dates of first ice, first land ice, interruption
II. BIBLIOGRAPHY ON GENERAL OCEANOGRAPHIC METEOROLOGY 99
of navigation, and final clearing of ice, number of days of ice, greatest noted extent of land ice and greatest thickness of ice. Short description of the state of the ice given for the major embayments of the Barents, White, Kara, Bering, Okhotsk and East Siberian Seas. (Abstract No. 18215, Arctic Institute of North America, Arctic Bibliography. Vol. 2:2694, 1953.) Subject Headings: 1. Sea ice 2. Soviet Arctic.—From Arctic Bibliography.
5A-103 551.582.3(26,47) Isakov, I. S., Pervyf torn morskogo atlasa. [The first volume of the marine atlas.] Akademiia
Nauk, SSSR, Izvesliia, Ser. Geogr., No. 1:72-74. 1951. DWB—Comments made on the new Soviet marine atlas which, although its main purpose is to depict ocean and sea regions, attempts to be more comprehensive through the inclusion of atmospheric and oceanic data. Names of archi- pelagos, islands, etc. discovered by and named for Russian explorers particularly noted. A new classification of ocean bottoms and system of relief coloration for land and ocean regions are added. Atlas itself not yet seen. {Same item as 3.9-206, Sept. 1952, MAB.) Subject Headings: 1. Marine atlases 2. U.S.S.R.—A.M.P.
UNITED STATES 5A-104 551.582.3(26) U. S. Hydrographic Office. Pilot charts of the North Atlantic Ocean. Dec. 1883-Dec. 1953
(latest rec'd). Also: . . . North Pacific Ocean. 1894-Dec. 1953 (latest rec'd). . . . Indian Ocean. Dec. 1909-Dec. 1953 (latest rec'd). . . . South Atlantic Ocean. June 1909-Dec. 1953 (latest rec'd). . . . South Pacific Ocean. Sept. 1909-Dec. 1953 (latest rec'd). . . . Central American waters. 1915-1953 (latest rec'd). And: . . . upper air North Atlantic Ocean. Dec. 1927-June 1945 (no more pub'd). . . . upper air North Pacific Ocean. 1929-June 1945 (no more pub'd). DWB—Monthly charts constructed in Mercator's projection and containing information such as great circle routes, curves of equal magnetic variations, storm tracks, number of days with fog, and wind roses for 5° squares. Barometric pressure shown on inset charts. Articles, tables and graphs of special meteorological interest appear on the backs of many of the charts. Chart No. 2603, Indian Ocean, Oct. 1953, has on its reverse side an index of pilot chart articles, Jan. 1948- Oct. 1953 and addresses from which back issues of Pilot Charts may be obtained. Subject Headings: 1. Marine climatic charts 2. Oceans.
5A-105 551.509.21(01) U. S. Weather Bureau, Daily synoptic series, Historical weather maps, Northern Hemisphere,
sea level. Jan. 1899-June 1939. Continued as: Daily Series, synoptic weather maps; Northern Hemisphere sea level and 500 millibar charts with synoptic data tabulations. Jan. 1949-Feb. 1952 (latest rec'd). DWB—The older series of charts consisted of monthly volumes of daily synoptic weather maps for 1300Z for the period Jan. 1, 1899-June 30, 1939. The July 1939-Sept. 1945 charts were never and probably never will be prepared. The U. S. Air Force published the Oct. 1945- Sept. 1947 charts at which time the Weather Bureau resumed publication. The present series which was divided in Jan. 1952 into two parts, Pt. I. (Northern Hemisphere Sea Level and 500 millibar charts) devoted to maps and Pt. II (Northern Hemisphere Sea Level and Upper Air Data Tabulations) to data, is one of the best sources of data from ships at sea. Subject Headings: 1. Syn- optic charts 2. Marine meteorological charts 3. Northern Hemisphere.
5A-106 551.506.3 551.582.2 •Clayton, Henry Helm (ed.). World weather records. Smithsonian Miscellaneous Collections,
v. 79, 90. 105, 1927-1947. 3 v. tables. Title varies. Smithsonian Institution, Publications, 2913, 3218, 3803. DWB—A long and homogeneous series of observations in the form of monthly means of pressure and temperature and totals of rainfall for selected stations generally belonging to the Roseau Mondial (see 5A-95 above). Numerous stations in the Atlantic, Pacific and Indian Oceans included. Vol. 79 contains frntn the earliest available observations to 1920. Vol. 90 covers 1921-1930 and Vol. 105, 1931-1940. Subject Headings: 1. World climate 2. Climatic data 3. Marine climatic data.
5A-107 551.582.3(26) McDonald, Willard F., Atlas of climatic charts of the oceans. U. S. Weather Bureau, No. 1247,
1938. 130 charts. DWB—Charts derived from approximately Sj million observations taken on ships at sea during a period of more than 50 years. Data from islands and continents not introduced in order that the material may be truly representative of conditions on the open sea. Charts include winds, visibility, cloudiness, rainfall and thunderstorms and temperature for all oceans. Subject Headings: 1. Marine climatic charts 2. Marine atlases I. U. S. Weather Bureau.
100 METEOROLOGICAL ABSTRACTS AND BIBLIOGRAPHY
5A-108 551.582.3:551.526.6 tCalifornia. University. Sctipps Institution of Oceanography, World atlas of sea surface
temperatures. 1944. all charts. 41 refs. DLC, DWB—Believed to be the most accurate pattern of sea surface temperature of the world prepared to date (1944). Isotherms are shown for intervals of 5°F except that in regions of small horizontal temperature gradients 2.5° isotherms have been entered. Information on ice limits shown. Subject Headings: 1. Sea temperatures 2. Marine atlases.
5A-109 551.582.3(26) :551.557.2 U. S. Hydrographic Office, Atlas of monthly pilot charts of the upper air, North Atlantic and
North Pacific Oceans. 1945. 24 p. of col. charts. HO Publ. No. 560. DLC, DWB—Monthly charts show frequency of wind direction and velocity at surface, 2500 ft, 5000 ft and 10,000 ft for island and coastal stations and 5° ocean squares. Also recorded are pressure, air and sea temperature, fog, storms, currents, magnetic variation, and airplane and steamer routes. Inset maps show gales and monthly isobars and isotherms. Subject Headings: 1. Marine climatic charts 2. Upper air winds 3. Marine pilot charts 4. Atlantic Ocean 5. Pacific Ocean.
5A-H0 551.582.3(261) :551.557.2 U. S. Weather Bureau, Wind frequency distribution. North Atlantic Ocean, 6 and 10 km.
And: Northwest Pacific Ocean, 3, 6 and 10 km. Wash., July 1945 and Sept. 1946. tables and charts. DWB—Contains Baillie wind roses representing frequencies of wind direction and wind speed for each specified level, 1942-1944 (Atlantic) and 1939-1940 (Pacific). Subject Headings: 1. Marine meteorological charts 2. Winds at sea 3. North Pacific 4. North Atlantic.
5A-111 551.582.3 (01) :5S1.311.1 *tU. S. Hydrographic Office, Ice atlas of the Northern Hemisphere. 1946, 106 p. charts,
1700 refs., tables. H.O. Pub. No. 550. DLC—Includes monthly Northern Hemisphere charts of ice distribution and character, ice data tables and charts by geographic regions, and 1700 references of worldwide scope to pertinent literature. Subject Headings: 1. Sea ice 2. Marine atlases 3. North- ern Hemisphere.
5A-112 551.582.3(01) U. S. Weather Bureau, Normal weather maps, Northern Hemisphere. Sea level pressure.
Wash., 1946. 1 p. 13 charts. DWB—Contain normal monthly and annual sea level distribution of pressure as determined for the 40} year period (1899-1939) covered by the "Daily Historical Weather Maps" (.see 5A-105 above). Subject Headings: 1. Marine climatic charts 2. Pressure distribution 3. Northern Hemisphere.
5A-113 551.509.1 (09) :551.582.3 Wexler, Harry and Tepper, Morris, Results of the wartime historical and normal map program.
American Meteorological Society. Bulletin, 28(4) :175-178, April 1947. DWB—Discussion of the type and contents of the various classes of wartime maps prepared (from 1899-1939 data) by the Army Air Forces, U. S. Navy and Weather Bureau. Maps included are: 1) Daily historical weather maps; 2) Normal monthly weather maps; and 3) Miscellaneous maps, charts and tables. Subject Headings: 1. World climate 2. Climatic charts.
5A-114 551.506.1-551.582.2 *!_'. S. Weather Bureau, Monthly climatic data for the world by continents. Vol. 1. May 1948—
v. 6. 1953 (latest rec'd). tables. DLC—Extensive tabulated surface and upper air data including observations from Air Weather Service island stations in the Pacific and ocean weather ships in the Atlantic and Pacific. Based on monthly "CLIMAT" broadcasts verified in most cases by con- firmation copies sent by air mail. (Same item as 2.11-21, Nov. 1951, MAB.) Subject Headings: 1. Marine climatic data 2. World climate 3. Climat broadcasts.
5A-115 551.582.3(26) U. S. Hydrographic Office, Atlas of pilot Cuaiis of the Atlantic Ocean. And:... of the Pacific
and Indian Oceans. Wash., D. C, Jan. 1, 1950. Ail charts. H. O. Publ. Nos. 576 and 577. DN- HO—Bound volumes of monthly charts showing pressure, air and sea temperature, fog, storms, currents, magnetic variation, air and steamer routes and gales. Subject Headings: 1. Marine climatic charts 2. Marine pilot charts 3. Atlantic Ocean 4. Pacific Ocean 5. Indian Ocean.
II. BIBLIOGRAPHY ON' GENERAL OCEANOGRAPHIC METEOROLOGY 101
MARINE METEOROLOGY (Arranged chronologically)
1851 5A-116 551.5(09)(26):06 Maury, Matthew Fontaine, On ^he establishment of an universal system of meteorological
observations by sea and land. Wash., D. C. C. Alexander. 1851. 30 p. DLC—A pamphlet of historical interest containing reprints of official correspondence between the United States (much of it by Maury) and Great Britain regarding the worldwide standardization of meteorological observations on land and sea and the need for an international conference of meteorologists. Subject Headings: 1. Maritime Conference, Brussels, 1853 2. Progress in meteorology 3. Marine me- teorology.
1877 5A-117 551.5(26) Scott, Pobert H., Remarks on the present condition of maritime meteorology. Royal Meteoro-
logical Society, Quarterly Journal, 3(20):185-198, Oct. 1877. DWB—Review of early marine me- teorological organization and work on the part of the Dutch, English, French, Germans and Ameri- cans after the Brussels Conference in 1853. Need for standardized marine meteorological charts stressed. Subject Headings: 1. Marine meteorology 2. History of meteorology.
1896 5A-11S 551.588.1 Pettersson, Otto, Ober die Beziehungen zwischen hydrographischen und meteorologischen
PhSnomenen. [On the relation between hydrographical and meteorological phenomena.] Me- leorologische Zeitschrift, 13(8)-.285-318, Aug. 1896. 14 figs., refs. DWB—First statistical proof of the effect, particularly on winter climate in Scandinavia, of the position and heat transport of the Gulf Stream and of the periodic and non-periodic variations of the latter. More intense investigation of ocean surface layers (to 800m) urged. Subject Headings: 1. Marine influences 2. Climate of Scandinavia 3. North Atlantic.
1898 5A-119 551.577.2(26) Supan, Alexander, Die jahrlichen Niederschlagsmengen auf den Meeren. [The yearly
amounts of precipitation on the oceans.] Petermanns Geographische Mitteilungen. 44:179-182, 1898. 2 tables, refs. DWB—From tabulated ships' observations of the number of days with rain experienced in small subdivisions of the Atlantic, Pacific and Indian Oceans, approximate rainfall amounts are derived. Subject Headings: 1. Rainfall distribution 2. Precipitation at sea.
5A-120 551.588.1:551.465 Pettersson, Otto, On the probable occurrence in the Atlantic current of variations periodical,
and otherwise, and their bearing on meteorological and biological phenomena, with an introduction. Conseil Permanent International pour VExploration de la Mer, Copenhagen, Rapports et Procts-Vcrbaux, Vcl. 3, 1905. English Edition, General Report on the work of the period July 1902-JuIy 1904 with 10 appendixes. Append. A. 36 p. 23 figs., refs. DLC—Introductory remarks on the bathy- metric features and topography of the northeastern Atlantic precede an extensive discussion of seasonal and annual variations in the water and heat transport of the Atlantic current as evidenced by invasions of warm water into the Barents Sea and the Kattegat, the retardation of the seasons in the countries surrounding the Norwegian Sea, North Sea and Baltic, and by changes in character and abundance of marine life. Subject Mendings: 1. Marine influences 2. Heat exchange sea- atmosphere 3. Northeast Atlantic. I. Kyle, H. M. (trans.)
1910 5A-121 551.588.1:551.465
•Petersen, Johannes, Unperiodische Tenperaturschwankungen im Golfstrom und deren Be- ziehung zu der Luftdruckverteilung. [Non-periodic temperature variations in the Gulf Stream and their relation to air pressure distribution.] Annalen der Hydrographie und Maritimen Meleor- ologie, 38:397-417, 1910. 8 figs., tables, refs. DWB—Detailed description of movements of the Icelandic Low back and forth between southern Greenland and the Norwegian Sea in response to the changing distribution of water temperatures induced by its own winds. Temperature data tabulated. Subject Headings: 1. Sea temperature variations 2. Pressure at sea 3. Icelandic Low 4. North Atlantic.
102 METEOROLOGICAL ABSTRACTS AND BIBLIOGRAPHY
1911 5A-122 551.552(26) Liitgens, Rudolf, Die Grbsse der hauptsachlichsten Windgebiete auf dem Meere. [The
size of the major wind regions over the oceans.] Annalen der Hydrographie und Maritimen Me- teorologie, 39(5):265-267, 1911. 5 tables. DWB—Tabulation and comparison of the major wind areas in the Atlantic, Indian and Pacific Oceans and in high latitudes show the total of monsoon, trade and calm belts cover 46% of the world water surface (the trades alone 31%). the westerlies 24%, the transition zone 19.5% and the equatorial calms 9%. Subject Headings: 1. Winds at sea 2. Atmospheric circulation.
1916 5A-123 551.588.1:551.555.1
*Galle, P. H., On the relation between fluctuations in the strength of the trade winds of the North-Atlantic Ocean in summer and departures from the normal of the winter temperature in Europe. (K.) Akademie van Welenschappen le Amsterdam. Afdeeling voor de Wis- en Naluur- kundige Welenschappen, Proceedings of the Section of Sciences, 18(9) :1435-1448. 1916. figs., tables, refs., eqs. DLC—Review of earlier approaches to the same problem with references to the literature. Table II (p. 1441-1445) contains correlation factors between departures in.the strength of the northeast trade over three periods (May-Oct.; June-Oct.; June-Nov.) and those of the temperatures during the following winter in Europe for 135 stations or districts, 1899/1900-1913/ 1914. Subject Headings: 1. Marine influences 2. Long range forecasting 3. Gulf Stream varia- tions 4. Climate of Europe.
5A-124 551.526.6:551.590.21 t*Helland-Hansen, Bjorn and Nansen, Fridtjof, Temperaturschwankungen des nordetlantischen
Ozeans und in der Atmosphere; einleitende Studien tiber die Ursachen der kliinatologischen Schwankungen. [Temperature variations in the North Atlantic Ocean and in the atmosphere; introductory studies on the causes of climatological variations.] Videnskaps-Selskabel i Kristiania, Malh.-naturv. Klasse, Skrifter, No. 9, 1916. 341 p. 48 plates, 97 figs., tables, refs. English trans, with additions by the authors and by Charles G. Abbot, in: Smithsonian Miscellaneous Collections. 70(4), 1920. 408 p. DLC. Abstract in: Monthly Weather Review, 46:177-178. April 1918. DWB —Classic paper in which the authors, through a detailed study of sea surface temperature variations using 1898-1910 Deutsche Seewarte data, find that sea-surface temperatures in the North Atlantic are closely related to the immediately preceding departures of winds from normal directions and strengths. Study also made of the periodicity of the variations of the surface temperature of the Atlantic Ocean and of the air temperature of the continents. Analysis of meteorological elements (air pressure, wind velocity, rainfall, cloudiness, temperature) on land and sea results in a composite picture of the meteorological fluctuations in which "different groups of regions vary intact in a definite direction while another group varies in an opposite sense and still others show transition phenomena." Variations in terrestrial phenomena and sunspot activity compared and partial explanation given for the former's not being directly dependent on the latter. Complicated as the relations appear, the authors feel that further investigation of meteorological data may reveal the ways in which changes in solar radiation first affect the higher layers of the atmosphere and then are transmitted to the lower layers where they affect the surface pressure distribution, winds, sea surface temperatures and, finally, weather. Extensive tabulated data included. Postscript to translation, p. 267-333 contains reviews of several papers (1914-1917) resulting from research which established beyond doubt that radiation from the sun varies periodically in a manner similar to sunspots as well as within short intervals of a few days and that correlations exist between these fluctuations in solar radiation and meteorological and magnetic changes on the earth. Subject Headings: 1. Sea surface temperature variations 2. Sunspot activity 3. Solar radiation 4. North Atlantic. I. Abbot, C. G.
5A-125 551.5(26) Pettersson, Hans, Meteorological aspects of oceanography. Monthly Weather Review, 44(6):
338-341. June 1916. 2 figs., 2 refs. DWB—Brief survey of ocean effects on weather including influence of ocean on air temperatures, atmospheric circulation and rainfall. Author compares "that great regulator, the octan," to "a kind of 'savings bank' for solar energy receiving deposits in seasons of excessive insolation and paying them back in seasons of want." Subject Headings: 1. Marine influences 2. Climate of Europe 3. North Atlantic.
1918 5A-126 551.526.6:551.509.33 Brooks. Charles F„ Ocean temperatures in long range forecasting. Monthly Weather Review.
46(11):510-512, Nov. 1918. refs. DWB—Brief discussion of origin and movement of water
II. BIBLIOGRAPHY ON GENERAL OCEANOGRAPHIC METEOROLOCY 103
surface temperature departures, the control which ocean temperatures exert on atmospheric pressure and winds, and what weather is associated with various pressure types. Possible applications to long range forecasting in the North Pacific mentioned. Subject Heaaings: 1. Marine influences 2. Long range forecasting 3. Sea temperatures 4. North Pacific.
1925 5A-127 551.5(26) Smith, H. T., Marine meteorology: history and progress. Marine Observer, 2:33-35, 90-92,
173-175, 1925. figs. DWB—Pt. I deals with the early history of marine meteorology from VIRGIL,
37 B. C, through the invention of the barometer to the 1853 international Brussels Conference instigated by MAURY. Pt. II on the "Middle Period" is concerned with the early program of the British Meteorological Department (founded 1854) and the introduction of periodical ocean charts. Pt. Ill, "Present Day" includes a sample specimen of a coded ship's log and corresponding punched card. Subject Headings: 1. History of meteorology 2. Marine meteorology.
1927 5A-128 551.501.83:551.515.2 Gherzi, E., Atmospherics and typhoons at sea. Marine Observer, 4(44):159-160, Aug. 1927.
2 figs. DLC—Brief article citing several interesting cases in which ships reported definite decreases in sferics with the approach of typhoons indicating that typhoon centers do not necessarily cause radio disturbances. {.Same item as 4K-58, Nov. 1953, MAB.) Subject Heading: 1. Sferics from typhoons.
5A-129 551.588.1 Littlehales, G. W., The ocean among the factors of the control of climate: Symposium on some
factors of climatic control. National Research Council, of Washington, Bulletin, No. 61:26-31, 1927. DLC—A non-technical generalized account of currents and winds. Author remarks on water transport along the Norwegian coast as it affects temperature and points out that "a tract of ocean 450 miles square and one-tenth of a mile deep, in being reduced one degree in temperature would give off enough heat to raise the temperature of the atmosphere 10° over the whole of the U. S. up to a height of 2 miles." Subject Headings: 1. Marine influences 2. Ocean currents.
1928 5A-130 551.555.1 Barlow, E. W., The trade winds. I. Historical and general. II. Atlantic, Pacific and Indian
Oceans. III. Historical theories of the trade winds. IV. The general circulation. Marine Ob- server, 5 (49,53,57,59) :31-34, 93-100, 183-186, 228-234, Jan., May, Sept., Nov. 1928. figs., tables. DWB—A summary of knowledge to date on the trade winds containing a detailed consideration of the characteristics of the trades in the three major oceans and a short account of the general circula- tion as related to the trades. Subject Headings: 1. Trade winds 2. Atmospheric circulation.
1929 5A-131 551.511(26) Hesselberg, T., Die Stabilitatsbeschleunigung im Meere und in der Atmosphere. [The
stability acceleration in the ocean and in the atmosphere.] Annalen der Hydrographie und Maritimen Meleorologie, 57(9):273-282, 1929. 2 tables. 19 eqs. DWB-—In 1915, the author and H. U. SVER-
e —ef
DRUP derived the expression E = —-—; where E is stability, e is the density of the water at level z, a.z
and e' is the density of a water particle P that through some impulse is moved from the level z+Az a short distance Az to level z (Bergens Museums Aarbok 1914/15, No. 15). Later HESSELBERG re-
1 e—e' vised the expression to read E' = -— to take into account the fact that the acceleration with
e Az which the particle P attempts to move itself from its new position to its old is inversely proportional to the density of the particle (Annalen der Hydrographie, 46(3/4) :118—129. 1918). In this article he improves the expression once again to account for the dependence of the acceleration of the particle
ge—e' P in its new position on the acceleration g of gravity. E" — -—. Subject Headings: 1. Stability
e Az 2. Oceans.
1930 SA-132 551.588.1 Brooks, C. E. P., The role of the oceans in the weather of western Europe. Royal Meteoro-
logical Society, Quarterly Journal, 56(234):131-140, April 1930. 2 figs. DLC—Apparent "effect
104 METEOROLOGICAL ABSTRACTS ANJ1 BIBLIOGRAPHY
which variations in the great ocean currents of the Atlantic, and in the amount of ice in the Arctic Ocean have on seasonal weather changes in western Europe" dealt with. Way in which effects on European climate of slight temperature and ice variations are magnified through the influence they exert on the pressure pattern pointed out. Subjec' Headings: 1. Marine influences 2. Climate of Western Europe 3. Sea ice 4. Sea temperature variations 5. Western Europe.
1932 5A-133 551.581(26)
*Harries, H. D., tJber die Veranderlichkeit von Monatswerten meteorologischer und hydro- logischer Elemente der Aquatorialsee. [On the variability of monthly values for meteorological and hydrological elements of the Equatorial ocean.] Annalen der Hydrographie und Marttimen Meleorologie, 60(12) :496-499, Dec. 1932. 3 tables. DLC—Monthly mean (1921-1930) wind, air pressure and temperature, cloudiness and hydrometeor data for Indian (0-10°NT, 70-90°E; 0-10°S, 70-90°E) and Atlantic (15-25°N, 25-35°W; S-15°N, 25-35°W; 0-10°S. 0-10°W) Oceans tabulated. Annual mean fluctuations of the various elements computed. Subject Headings: 1. Marine meteoro- logical data 2. Equatorial meteorology 3. Indian Ocean 4. Atlantic Ocean.
1935 5A-134 551.588.1
*Defant, Albert, Der Einfluss des Baikalsees auf das Klima seiner LTmgebung. [The influence of Lake Baikal on the climate of the surrounding lands.] Geografiska Annaler, Stockholm, 17:285- 299, 1935. 7 figs., tables, refs., eqs. DLC—A case study of the moderating effect of Lake Baikal on the severe continental climate of south central Siberia. Monthly vertical and horizontal tem- perature distributions over the lake and surrounding territory tabulated. Subject Headings: 1. Lakes 2. Lake Baikal, TJ.S.S.R.
1936 5A-135 551.5:551.46 Schott, Gerhard, Die Aufteilung der drei Ozeane in natiirliche Regionen. [The division
of the three oceans into natural regions.] Pelermanns Geographischc Milleilungen, 82(6,7/8) :165- 170; 218-222, 1936. plates, tables, refs. DLC—When defining the natural regions of the oceans, SCHOTT attempts to put equal emphasis on the characteristic meteorological conditions (e.g., trade winds) as well as on the oceanographical features (e.g., currents, water mass characteristics). His 39 suggested subdivisions of the Atlantic, Pacific and Indian Oceans and their relative sizes tabulated on p. 221. Subject Headings: 1. Geography 2. Oceans.
1939 5A-136 551.554(26) Ulanov, Kh. K., Izmenenie skorosti vetra s vysotol nad morem. [The change of the velocity
of wind with height above the sea.] Akademiia Nauk SSSR, Izvestiia, Ser. Geogr. i Geofiz., No. 3:308-314,1939. 3 figs., 7 refs., 3 eqs. In Russian; English summary, p. 313-314. Abstract in: American Meteorological Society, Bulletin, 23(2): 81, Feb. 1942. DLC—Wind velocity observed at heights of 30. 100, 200 and 300 cm above a raft and simultaneous humidity and temperature observa- tions at 10 or 20, 50, 100 and 200 cm were carried out during the White Sea expedition of the State Hydrological Institute (U.S.S.R.) in the summer of 1938. Results show vertical distribution of velocities (3O-30O cm above sea) not in agreement with Rossby theoretical curves, wind velocity distribution with height not dependent on stratification of temperature in layer 2-3 m above sea, vertical gradient of wind velocities increasing with increasing velocity, and vertical gradient above 3-4 m decreasing with increasing height. Subject Headings: 1. Micrometeorology 2. Marine meteorology 3. Wind profiles 4. White Sea.
1940 5A-137 551.513.2:551.515 551.465 Defant, F.. Tragheitsschwingungen im Ozean und in der Atmosphere. [Inertia oscillations in
the ocean and the atmosphere.] Berlin. Universitdt. Meteorologists Instilut, Veroffenllichungen, 4(2), 1940. 66 p. 18 figs., 11 tables, 21 refs., numerous eqs. DLC—Theory of inertia oscillations AS a result of a disturbance of a steady stream on the rotating earth is developed and their propagation in water and air analyzed, considering also separately the effect of friction. Furthermore, the drift stream theory is outlined for sudden and slow changes of the wind or the pressure field in the ocean. The theoretical results are compared with oceanographic observations and also with atmospheric phenomena, namely oscillations of wind velocity and of the isobaric field. Subject Headings: 1. Inertia oscillations 2. Ocean currents 3. Atlantic Ocean 4. Europe.—A.A.
II. BIBLIOGRAPHY ON GENERAL OCEANOGRAPHIC METEOROLOGY 105
5A-138 551.574.1 Wright, H. L., Sea-salt nuclei. Royal Meteorological Society, Quarterly Journal, 66(283) :3-12,
Jan. 1940. fig., table, refs. DWB—A summary of the published data on the origin, composition, behavior, and size distribution of sea salt nuclei. Subject Heading: 1. Saline nuclei.
1941 SA-139 551.5:551.46
tCarruthers, J. N., Some interrelationships of meteorology and oceanography. Royal Meteoro- logical Society, Quarterly Journal, 67 (291) :207-246, 1941. 13 figs., 36 refs., 4 appends. Also: Callendar, G. S., The ocean's influence on weather. Ibid., p. 383-384. And: Frankcom, E. N., Some interrelationships of meteorology and oceanography. Ibid., p. 384-385. DWB—Survey of some of the outstanding literature on various phases of oceanography and meteorology and their interrelationships combined with a discussion of wind effects of water with special emphasis on variations of the Gulf Stream and resultant influences on European weather. Much information drawn from C. O'D. ISELIN'S 1940 paper on long period variations in the transport of the Gulf stream. Three brief appended articles present the findings (about wind and water movement) of scientists whose preoccupations have been largely with fishery matters. Subject Headings: 1. Marine influences 2. Gulf Stream variations 3. Fishing industry. I. Callendar, G. S. II. Frankcom, E. IT.
1942 5A-140 551.588.1(85) Schweigger, Erwin, Los fendmenos en el mar desde 1925 hasta 1941, en relaci6n con obser-
vaciones meteoroldgicas efectuadas en Puerto Chicama. [Phenomena in the sea from 1925 until 1941 in relation to meteorological observations recorded at Port Chicama.J (In: Tres estudios referentes a la oceanografila del Peru. [Three studies on the oceanography of Peru.] Lima, Peru, Jir6n Junto [1942].) 64 p. 7 graphs, 12 tables, bibliog. p. 64. DLC—-Basing his remarks on data collected at Port Chicama, the author expands his discussion to cover the general interrelation of sea and atmosphere on the Peruvian coast as well as the effects of that interrelation witnessed during specified years. The barometric pressure pattern is cited as one of the chief factors controlling winds and sea and air temperatures. Special mention is made of the current called "El Niflo" which brings torrential rains to Peru and severe losses to the key guano industry. Subject Headings: 1. Marine influences 2. El Nifio Current 3. Peru.
1943 5A-141 551.509.58(265/6) Riehl, Herbert and Elford, C. Robert, Ocean analysis from coastal reports. Chicago. Uni-
versity. Institute of Meteorology, Misc. Report, No. 9. March 1943. 18 p. 15 figs., 2 tables, 9 refs. DWB—A method is outlined for obtaining weather estimates and forecasts of a general nature over any ocean area of the middle and high latitudes for which aerological data from adjacent shores are available. The method of reconstructing the weather conditions over the ocean from shore data is illustrated by the analysis of two different weather situations over the northeast Pacific Ocean, using reports from the Pacific Coast, Alaska, and Honolulu only. Two independent analyses of each case were prepared to demonstrate that two forecasters using this method should arrive at the same conclusions. (Same item as 3E-48, May 1952, MAB.) Subject Headings: 1. Objective forecasting 2. Marine meteorology 3. Pacific Ocean.
5A-142 551.554:532.59 Westwater, F. L., Wind structure over the sea. Royal Meteorological Society. Quarterly Journal,
69(301):207-213, July 1943, 6 figs., 4 refs. DWB-—From observations on aircraft carriers fre- quency distributions of angles between surface wind and isobars are constructed for SE Trades (mean back 4°) and Atlantic-Mediterranean (mean veer 8°). The distributions are asymmetric and it is suggested that this is due to difference between wave speed and wind speed. The backing in SE Trades and small veer in Atlantic are attributed to ocean currents moving with the wind and i educing or overcoming friction. Subject Headings: 1. Marine meteorology 2. Winds at sea.—C.E.P.B.
1946 5A-143 550.342:551.515.2 Gilmore, Marion H., Microseisms and ocean storms. Seismological Society of America, Bulletin,
36(2):89-119. April 1946. 15 figs. MWB—Method described for determining at a tripartite station direction microseisrnic waves are travelling. Figures compare microseismic activity at Guantanomo Bay, Cuba, with hurricane tracks in 1944 and 1945. Remarkable case of microseisms at Richmond, Fla., which doubled in amplitude simultaneously with a wind increase from 55 to 85
106 METEOROLOGICAL ABSTRACTS AND BIBLIOGRAPHY
knots in a hurricane approximately ISO miles distant used to add weight to theory that microseisms are produced by some force within the hurricane itself rather than by surf. Subject Headings: I. Microseismic storm tracking 2. Hurricane tracking 3. Caribbean Area.
5A-144 551.507.2 Nine nations act on ocean weather station program. Air-Sea Safety, Wash., D. C, 1 (1) :25-38,
Nov. 1946. photos., chart. DWB—After an introductory discussion of the importance of weather observations from ocean areas and resume of attempts during the war to provide such reports, the terms of the 1946 International Agreement on North Atlantic Ocean Weather Stations are listed. A chart (p. 34-35) shows the location of the 13 ships comprising the proposed network. Subject Headings: 1. Weather ships 2. North Atlantic.
5A-145 551.46:355.463 Seiwell, H. R., Military oceanography in tactical operations of World War II. American
Geophysical Union, Transactions, 27(5) :677-681, Oct. 1946. 2 refs. See also article by same author in Military Engineer, 39(259):202-210, May 1947. DWB—An account of the organization and work (planning of major amphibious operations, publication of the Daily Hydrographic Bulletin, forecasting state of sea) of the military oceanographic team which operated in the European and Pacific theaters of war. Subject Headings: 1. Military oceanography 2. World War II.
SA-146 551.551(26) Tasson, A., La structure du vent dans les basses couches au-dessus de la mer et au voisinage
d'un navire. [The structure of the wind in the lowest layers above the sea and in the vicinity of a ship.] La Mitiorologie, 4th Ser., No. 3:322-330, July/Sept. 1946. 2 figs., 4 tables, 19 refs. DWB •—Author first reviews PRANDTL'S and KARMAN'S laws of increase of wind speed with altitude and then discusses the disturbing influence of a ship on air flow in the low levels above the sea as illus- trated by the disagreement between observations at different positions on the ship and the variation of those observations with wind speed: wind speed increase with height is rapid when warm air blows over cold water, slow in reverse case. Subject Headings: 1. Winds at sea 2. Marine me- teorology.
1947 SA-147 550.342:551.515 Gilmore, Marion H., Tracking ocean storms with the seismograph. American Meteorological
Society, Bulletin, 28(2):73-85, Feb. 1947. 11 figs., table. DWB—A report of the first 3 years operation of the U. S. Navy Microseismic Research Project. It is concluded that deep depressions at sea do cause microseisms which, when recorded by a tripartite microseismograph station on shore, may serve as an aid in the locating and forecasting of ocean storms. Subject Headings: 1. Micro- seismic storm tracking 2. Storms at sea 3. U. S. Navy. Microseismic Research Project.
5A-148 550.342.551.509 Gutenberg, B., Microseisms and weather forecasting. Journal of Meteorology, 4(l):21-28,
1947. 6 figs., refs., 5 eqs. MH-BH—Certain types of microseisms are correlated with atmospheric disturbances and can be used in weather forecasting, especially in locating tropical disturbances. Publications referring to this method are mentioned. The method's routine application by the U. S. Navy Department in locating hurricanes in the Caribbean area is discussed, as well as the precautions which must be taken in drawing conclusions from the amplitudes of microseisms. Subject Headings: 1. Microseismic storm tracking 2. Hurricane tracking 3. Caribbean Area.—Author's abstract.
5A-149 551.501.1 (26) Jameson, H,, Observing weather at sea. I. Air temperature and humidity. Marine Observer,
17(137):46-50. July 1947. Kirk, T. H.. II. Sea surface temperature. Ibid., 17(138):100-102, Oct. 1947. Jameson. H., HI. The marine mercurial barometer. Ibid., 18(139):30-33, Jan. 1948. Barlow. E. W., IV. Observation of cloud forms. Ibid., 18(140):107-112, April. 1948. Kirk. T. H., V. Wind. Ibid., 18(141):171-174, 1948. figs., photos, tables. DWB—Series of brief articles on the general techniques and difficulties of observing the various meteorological elements at sea. Subject Headings: 1. Marine meteorology 2. Ocean weather observation. I. Kirk, T. H. II. Bar- low, E. W.
5A-150 551.509.31(26) Kirk, T. H., The importance of ships observations to the forecaster. I. Ships' observations
and the synoptic method. Marine Observer. 17(137) :30-40, July 1947. 6 figs. II. Theoretical aspects of synoptic analysis. Ibid., 17(138) :83-92, Oct. 1947. 4 figs. III. Practical aspects of
II. BIBLIOGRAPHY UN GENERAL OCEANOGRAPHIC METEOROLOGY 107
synoptic analysis. Ibid., 18(139):18-30. Jan. 1948. 8 figs., tables. IV. The oceans and the weather. lHd., 18(140) :96-101, April 1948. 2 figs. DLC—A series of short articles attempting to give some idea of the method used by forecasters to interpret observational data, particularly over the sea and to present some aspects of the physical aspects of the interaction between atmos- phere and oceans. Several ocean charts and diagrams (after BJERKNES) illustrate the text. Subject Headings: 1. Synoptic analysis 2. Marine meteorology.
5A-1S1 551.554:551.46 Woodcock, Alfred H. and Wyman, Jeffries, Convective motion in air over the sea. New York
Academy of Science, Annals, 48(8):749-776, Sept. 15, 1947. 8 figs., table. 9 plates, refs. Discussion by Bernhard Haurwitz, p. 767. DLC—The classic experiments of BERNARD, in which he observed a regime of polygonal convection cells set up in a thin layer of liquid heated from the bottom until a certain critical temperature gradient was reached, are described and the counterparts of such cells in the atmosphere pointed out. The main part of the paper consists of diagrams photographs and explanations of the convection patterns displayed by smoke screens laid down at sea. Systematic dark and light bands on the sea surface lying parallel to the wind were explained tentatively as evidence of eithe/ longitudinal roll vortices in the air or a system of internal waves in the mixed surface layer. Subject Headings: 1. Convection over the sea 2. Marine meteorology.—Author's abstract.
1948 5A-152 • 551.507.2 Brown, J. E., The sea-going meteorologist's aspect of work in ocean weather ships. Weather
3 (7) :216-218, July 1948. fig., photos. DWB—Brief description of the space allocation on board British weather ship, "Weather Watcher" and account of difficulties associated with upper air soundings in heavy weather. Subject Headings: 1. Weather ships 2. Upper air soundings 3. North Atlantic.
5A-153 550.342:551.506(26) Neis, B., Mikroseismik und Wetter. [Microseisms and weather.] Zeitschrift fur Meleorologie,
2(1/2):1-10. Jan./Feb. 1948. 3 figs., chart. 10 refs. DWB—First part deals with wind waves and surf as causes of microseismic activity recorded at shore station. Second part compares microseismie activity in Europe with major weather patterns over the Atlantic. Subject Headings: 1. Microseisms 2. Europe 3. Atlantic Ocean.
5A-154 551.507.2 Ocean weather ships. Esso Air World, New York, l(4):94-95, Sept. 1948. illus. DWB—
A brief, illustrated account of the meteorological and air-sea rescue work of the thirteen ocean weather ships maintained in the North Atlantic by nine nations under an international agreement reached in London, Sept. 1946. Subject Headings: 1. Weather ships 2. North Atlantic.
1949 SA-155 551.5:551.46 Barlow, E. W., The contributions of the merchant seaman to oceanography and some aspects
of the interrelation between meteorology and oceanography. Marine Observer, 19(143) :41-48, Jan. 1949. 5 figs. Abstract of paper read before Challenger Soc., London June 23, 1948. Original unchecked. DLC—Description of the charts compiled by the British Meteorological Office from current observations supplied by merchant seamen and brief comments on the meteorological effects of the difference between sea and air temperatures. Subject Headings: 1. Ocean current charts 2. Marine influences 3. Sea temperature variations 4. Merchant marine.
5A-156 551.515.7:551.513.7 Becker, Richard. Der planetarische Jahresgang der maritimsubtropischen Hochdruckkerne.
[The planetary annual variation of the maritime-subtropical anticyclones.] Annalen der Meleor- ologie, 2(1/2) :48-51, Jan./Feb. 1949. figs.. 8 refs. English summary, p. 48. DWB—Over the continents in each hemisphere, pressure is high in winter and low in summer. The subtropical anticyclones over the oceans on the other hand reach their greatest development in June or July in both hemispheres. The explanation given is that the evacuation of air from the great northern continents in summer, due to the great annual range of temperature, raises the pressure over all the rest of the world, but earlier in the northern oceans (June) than in the southern (July). (Same item as 2-95, Feb. 1950, MAB.) Subject Headings: 1. Anticyclones 2. Dynamics of the atmos- phere.—M.R.
\—
108 METEOROLOGICAL ABSTRACTS AND BIBLIOGRAPHY
5A-1S7 551.501.1(26) Frankcom, C. E. N., The merchant seaman as a meteorologist. II j'ine Observer, 19(143):34-
41, Jan. 1949. 4 fig3. Abstract of paper read before Challenger Soc., London, June 23, 1948. Original unchecked. DLC—Account of the pressure, air and sea temperature, humidity, wave and current observations taken aboard merchant vessels at six hour intervals and radioed to meteoro- logical centers of countries desiring them. Subject Headings: 1. Marine meteorological observations 2. Merchant marine.
SA-1S8 551.582(26) Jameson, H., Ships' observations and the climatologist. I. The collection of the observations.
II. The representation of observations by isopleths. III. The representation of vector quantities. IV. The representation of high and low values. Marine Observer, 18:161-165; 219-222. 1948 and 19:50-55; 103-104, 1949. figs. DWB—In Pt. I, the system of Marsden (10°) squares used in marine climatology is briefly described. Pt. II deals with the representation of marine observations, involving only one constituent, by isopleths. Pt. Ill is concerned with the charting of vector quantities such as wind and current which involve two constituents, namely magnitude and direction. Pt. IV explains use of five percentile maximum and minimum temperatures on British marine climatological charts. Subject Heading: 1. Marine climatology.
5A-159 551.583.3(26) Ovey, C. D., Note on the evidence for climatic changes from sub-oceanic cores. Weather,
4(7):228-231, 1949. fig., photo. 5 refs. DWB—From cores obtained by use of the Kullenberg piston core-sampler used on the Swedish Deep Sea Expedition, 1947-48, with the "Albatross" (see 5A-82 above), past climatic changes can be detected over a period of at least a million years. Present evidence shows that the tropics were colder than today and icebergs flowed at least as far south as the Azores. Subject Headings: 1. Climatic changes 2. Ice ages 3. Sub-oceanic cores.
5A-160 551.501.1:656.6(02) Tannehill, Ivan R., Preparation and use of weather maps at sea. 3rd ed. U. S. Weather
Bureau, Circular R; W.B. No. 1151, 2d Revision, 1949. 117 p. 64 figs., fold, map, 2 tables, append, with 37 code tables. DWB—This new edition of Circular R includes all of the necessary tables and specifications of the Toronto code (effective Jan. 1, 1949), and in addition to instructions for plotting and analyzing simple weather charts, a great deal of information and illustrations on air masses, fronts, disturbances, tropical cyclones, the general circulation, centers of action, wind systems, squalls, fog, etc. The section on observing and predicting hurricane movements by winds, swells, clouds, etc., is quite complete. (Same item as 9-12, Sept. 1950, MAR.) Subject Headings: 1. Marine meteorology 2. Instruction for observers 3. Manuals. I. U. S. Weather Bureau.—M.R.
5A-161 551.5:551.46 Thomson, Andrew, The meteorologist looks at the oceans. Royal Society of Canada, Trans-
action, Ser. 3, vol. 43, Sect. 5:157-162, 1949. table. DLC—Importance of meteorological ob- servations at sea and knowledge of heat exchange over the sea discussed. Climatic effect of wind blowing over open and frozen water mentioned with emphasis on the Hudson Bay region. Subject Headings: 1. Marine meteorology 2. Marine influences 3. Hudson Bay.
5A-162 551.574.1 Woodcock, Alfred H. and Gifford, Mary M., Sampling atmospheric sea salt nuclei over the
ocean. Woods Hole Oceanographic Institution, Marine Meteorology, Contract N6onr-277, Task Order II, NR-082-021, Technical Report No. 1, Jan. 1949. 32 p. 14 figs., photos, tables, numerous refs. With a supplement by Mary M. Gifford, Efficiency of ^deposition of nuclei on "ribbons" one millimeter wide. p. 30-32. Also in: Journal o; Meteorology, 8(2) :17/-1V7, Oct. 1949. DWB— A method of sampling air-borne sea-salt nuclei over the open ocean is described. Data are given showing the distribution of the weight and number of nuclei up to a height of 305m (fig. 11). It is suggested that those sea-salt nuclei act as condensation nuclei in the formation of sea fogs. The range of the weights is comparable to the range of average weights measured at shore stations by other authors. Subject Headings: 1. Saline nuclei 2. Condensation nuclei 3. Marine meteorology. I. Woods Hole Oceanographic Institution U. Contract N6onr-277.—A ulhors' abstract.
1950 5A-163 551.574.1 Aliverti, G. and Lovera, G., Sui nuclei di condensazione di origine maritima. [On condensation
nuclei of maritime origin.] Geofisica Pura e Applicala, 16(3/4):133-135, April/June 1950. 4 refs. Italian and English summaries p. 133. MH-BH—Calculation of the probable number ol saline
II. BIBLICK.KAI'HY ON- GENERAL OCEANOGRAPHIC METEOROLOGY 109
condensation nuclei taken by the atmosphere from the sea under various conditions. Critical evaluation of similar calculations made by G. C. SIMPSON and by H. KOHLER. Effect of bubbling and of sea spray discussed. (Same item as 2.4-123, April 1951, MAB.) Subject Headings: 1. Con- densation nuclei 2. Saline nuclei.—M. R.
5A-164 551.311.181 •Fukutomi, Takaharu; Kusunoki, Kou and Tabata, Tadasi, Study of sea-ice, 3rd-8th, 15th
Reports. Teion Kagaku (Ixrw Temperature Science), Sapporo, Japan, 3:131-206, 1950; [15th Report] 8:59-88, 1951. figs., tables, eqs., refs. In Japanese, English summary at end of each report. DWB—Elaborate studies of formation, extent, depth, etc. of ice along shores and in the Okhotsk Sea depending on temperature, salinity, depth, wind conditions, cyclonic storms, etc. Some years the whole Okhotsk Sea is frozen except where warm currents enter. Total amount averages 120 X1010 m3 in a winter. A statistical method of predicting first and last ice on Hok- kaido coast is worked out from preceding conditions at Abashire. The entire series is accompanied by data and curves or charts. Subject Headings: 1. Sea ice 2. Sea ice forecasting 3. Okhotsk Sea.—MR.
5A-165 551.5:550.83 Glenn, Alfred H. and Bates, Charles C, The meteorological and oceanographic aspects of
geophysical prospecting. Geophysics, Menasha, Wise, 15(2):247-256, April 1950. 2 figs., 2 tables. 12 refs. DGS—Authors discuss the relationship cf the professional consulting meteorologist to the Weather Bureau and special applications of industrial climatology and of oceanography to offshore oil drilling operations. Applications of short range forecasting and of punched card technique to forecasting weather and wave conditions required for special operations, for scheduling work areas, for planning exploration and for determining soil trafficability are considered. Im- portance and need for investigating microseisms, the dynamics of sedimentation with special reference to tides, wave refraction and current patterns are stressed. (Same item as 2.8-10, Aug. 1951, MAB; see also 3-133, March 1950, MAB.) Subject Headings: 1. Industrial meteorology 2. Industrial • oceanography 3. Off shore oil industry.— I.L.D.
5A-166 551.46(47) Lednev, V. A. and Rudovits, L. F., Ob okeanograflcheskikh rabotakh SSSR za poslednie
tridtsat' let. [On oceanogTaphic work of the USSR during the past thirty years.] Meteorologiia i Gidrologiia, No. 4:14-17, Dec. 1950. DLC—A paper summarizing the progress and results of oceanographic investigations carried out by the official Oceanographic and Marine Biological In- stitutes during the past 30 years, and by the Marine Hydrophysical Institute, the Oceanographical Institute of the Akademiia Nauk and the Marine Hydrophysical Laboratory at Kotsiveli on the Black Sea. Research has been performed in the Arctic Seas, the Black and Azov Seas and the Pacific Ocean and adjacent seas. Subject Headings: 1. Oceanographic research 2. Progress in oceanography 3. U.S.S.R.— A.M.P.
5A-167 551.501.81:551.507.2 Milburn, K., Radar in ocean weather ships. Marine Observer, 20(147):40-44, 55, 56, Jan.
1950. 2 figs. DWB—General review of the use of radar. Synoptic forecasting in the North Atlantic is limited in detail, yet of importance to aircraft due to localization of fronts and presence of thunderstorms. (Same item as 5-18, May 1950, MAB.) Subject Headings: 1. Radar equipment 2. Radar storm detection 3. Weather ships 4. North Atlantic.—M.R.
5A-168 551.558.1(26) Millar, F. Graham, Air currents revealed by soaring gulls. Marine Observer, 20(149) :154-157,
July 1950. 2 figs., 3 refs. MH-BH—Gulls soar over open sea in updrafts between convection cells when sea is warmer than air and wind force is 4 or less. Circulation can also'be observed in drift of floating objects and in steam fog. (Same item as 2.1-127, Jan. 1951, MAB.) Subject Headings: 1. Convection over the sea 2. Bird soaring.—C.E.P.B.
5A-169 551.511:551.543 Prager, Erwin, Zur Frage der Erwarmung kalter Festlandsluft nach ihrem Obertritt auf See.
[On the question of warming of cold continental air after its passage over the sea.] Annalen der Meteorologie, 3(1/2) :10-19, Jan./Feb. 1950. 6 figs. English summary p. 10. DWB—Observations are analyzed during two cold periods 14-25 Dec. 1946 and 1-12 Jan. 1947 at coastal stations and lightships off NW Germany. Sea temperature was +5 to 10°C, decreasing slowly. Air tem- perature was —5 to — 15°C at Hamburg and Jever but averaged 10°C higher (on extreme days over 15° higher) at lightships. Rate of warming about 0.3°C per 10 km. Structure of air shown by
110 METEOROLOGICAL ABSTRACTS AND BIBLIOGRAPHY
temperature and equivalent potential temperpture from radiosondes at Hamburg and Jever. The cold air was thin, not reaching 900 mb, wit1: an inversion above; this is the normal condition. (Same item as 6-48. June 1950. MAB.) SubjfJ Headings: 1. Air mass modification 2. Energy exchange sea-atmosphere 3. Marine influences.—C.E.P.B.
5A-170 551.46:551.509.33 Queney, P., Contribution eventuelle de l'oceanograpbie aux previsions metGorologiques. [Pos-
sible contributions of oceanography to meteorological forecasting.] France. Comili Central d'Ocednographie et d'Htudes des C6les, Bulletin d' Information, 2(6):201-208, 19S0. DLC—Con- tributions to long range forecasting and fluctuations in surface circulation of the ocean are discussed. The theory of the effects of such fluctuations on the atmosphere is set forth ,*.nd confirmed by ob- servations on the coasts of Norway and Peru. Remarks by J. BESSEMOULIN on the atmospheric and oceanic circulation include a discussion of the annual evolution of these circulatory systems and their interdependence. Subject Headings: 1. Marine influences 2. Long range forecasting 3. Oceanic circulation. I. Bessemoulin, J.
5A-171 551.510.42 Woodcock, Alfred H., Sea salt in a tropical storm. Journal of Meteorology. 7 (6) :397-401, Dec.
1950. 4 figs., 2 tables, 6 refs. Also: Woods Hole Oceanographic Institution, Contribution, No. 528. MH-BH—Air-borne sea salt in a tropical storm was sampled at Pompano, Florida. The method of sampling is described and the sea salt per cubic centimeter of air was measured by titration and the isopiest.c method. The atmospheric sea salt determinations by these methods are similar in mag- nitude. The weight and number distribution of sea salt nuclei resembles that found in the same area during moderate winds. The hygroscopic properties of sea salt nuclei are discussed. The weight of water condensed in the nuclei can be determined by the equation Wv, = W,(C~l — 1), where Ww is weight of water present, W, is weight of sea salt and C is concentration of sea salt by weight fraction. The increase in air temperature is determined by the equation AT = W*LCP; where AT is increase in air temperature, L heat of vaporization of water and Cp is specific heat of moist air. Significant amounts of latent heat were released below 100% relative humidity. (Same item as 2.4-52, April 1951, MAB.) Subject Headings: 1. Saline nuclei 2. Hurricanes 3. Florida. —I.L.D.
5A-172 551.588 Wundt, Walter, Die hydrographische und klimatische Auswirkung der Abdiimmung von
Meeresengen. [The hydrographic and climatic results of damming up ocean straits.] Petermanns Ceographische Milteilungen, Gotha, 94(4) :212-215, 19S0. 7 refs. DLC—An interesting account of possible international ocean-strait damming projects which could lie undertaken in the Baltic. Black Sea, Red Sea, Mediterranean, etc. Associated land reclamation, political repercussions, climatic change and increased water power supply discussed. Subject Headings: 1. Damming ocean straits 2. Land reclamation.
1951 5A-173 551.5:551.46 Aliverti, Guiseppina, L'atmosfera e gli oceani, analogic e interdipendenze. [The atmosphere
and the oceans, analogies and interdependences. ] Rivista di Meteorologia Aeronautica, Rome, 11 (?): 3-12, April/June, 1951. 12 figs., 4 refs. Italian, French, English and German summaries, p. 3. MH-BH—A review of the main contributions to meteorology by oceanographers and vice-versa. The particular contributions of DEFANT, BJERKNES, PETTERSON, SVERDRUP and JACOPS are discussed and several of their charts reproduced to illustrate the temperature distribution in the sea, radiation and energy exchange between sea and atmosphere. The analogies between the two sciences and the need for meteorologists to broaden the scope of their research is stressed. (Same item as 3.11-25, Nov. 1952. MAB.) Subject Headings: I. Marine meteorology 2. Energy exchange sea-atmosphere. —MR.
5A-174 551.583(26) Brooks, Charles E. P.. Oceans through the ages. Marine Observer, 21 (152) :103-110, April
1951. 2 figs., tables. DWB—Brief description of origin and history of the oceans, ocean currents and weather of warm periods and of Quaternary and Permo-Carboniferous ice ages. Ends with an account of ocean changes in Post-glacial. (Same item as 2.10-160, Oct. 1951, MAB.) Subject Headings: I. Oceans 2. Climatic changes.—C.E.P.B.
5A-175 551.507.2 Frankcom, C. E. N., The international operation of Ocean Weather Station "Mike." Marine
Observer, 21 (151):23-25, Jan. 1951. DWB—Description and photo of O.W.S. "Polarfront I" now
I
V-
i
II. BIBLIOGRAPHY ON GENERAL OCEANOGRAPHIC METEOROLOGY 111
maintained jointly by Norway, S\ oden, Belgium and Denmark in 66°N, 2°E. [Same item as 2.8-18, Aug. 1951, MAB.) Subject Headings: 1. Marine meteorology 2. Weather ships 3. Norwegian Sea.—C.E.P.B.
5A-176 551.511:551.524.4:551.526.6 tjacobs, Wood row Cooper, Large-scale aspects of energy transformation over the oceans.
(In: Compendium of meteorology. Boston, American Meteorological Society, 1951. p. 1057-1070. 5 figs., 8 tables, 41 refs.) MH-BH—Comprehensive and clear account of the "large scale and more or less long-term (average) aspects of the convective transfer of energy between sea and atmosphere." Discussion covers: 1) rate of exchange of sensible heat, 2) rate of exchange of energy in the latent form of water vapor, 3) rate of total heat loss from the oceans through convection, and 4) rate of total heat gain by the atmosphere through convection. (For fuller abstract see item 4.1-5, Jan. 1953, MAB.) Subject Headings: 1. Energy exchange sea-atmosphere 2. Marine meteorology.— I.L.D.
5A-177 551.46 tLineikin, P. S„ O nekotorykh voprosakh teoreticheskol okeanografii. [Some problems of
theoretical oceanography.] Voprosy Geografii, No. 26, Gidrologiia, p. 220-234, 1951. bibliog. p. 232-234. DLC—Author summarizes 23 current problems which should be solved in regard to sea currents (steady and unsteady drift currents, influence of moving cyclones, influence of bottom and seashore configurations, etc.), to wind waves (initial wind velocity, unsteady cases, refraction of waves, forecasting, etc.), to tidal flow and seiche phenomena (forced oscillations, flow tides in seas with ice cover, etc.). to the dynamics of ice cover (drift of ice fields, ice pressure, growth of ice, etc.), as well as in regard to turbulent mixing of water masses (unsteady case of thermal convection, heat transfer caused by the wind field in a homogeneous and nonhomogeneous sea). The short dis- cussions of each problem in connection with the comprehensive bibliography give a fair idea of results to date of Russian research. A few foreign references are included. Subject Headings: 1. Oceano- graphic theory 2. Ocean currents 3. Sea ice 4. Turbulent miring of water 5. U.S.S.R.—A.A.
5A-178 551.513.1:551.556 Priestley, C. H. B., A survey of the stress between the ocean and atmosphere. Australian
Journal of Scientific Research, Ser. A., Physical Sciences, 4(3) :315-328, Sept. 1951. 4 figs., 3 tables, 10 refs., 4 eqs. MH-BH—A survey is made of the mean east-west component of stress between the ocean and atmosphere for each season and each ocean, and for the mean of all oceans. The averaging is carried out for each 5° latitude zone from 55CN to 55°S. The result provides a first approximation to the total torque about the earth's axis, on the atmosphere as a whole, in the various latitude belts. From them is derived a table showing the distribution of total northward flux of atmospheric angular momentum for the annual mean and the four seasons individually, allowing for the changes occurring during spring and autumn. A brief comparative discussion of both the stress and flux results is given. (Same item as 3.5-9, May 1952, MAB.) Subject Headings: 1. Marine meteorology 2. Ocean-atmosphere stress 3. Energy exchange sea-atmosphere 4. Atmospheric circulation 5. Angular momentum flux.—A.A.
5A-179 551.573(26) Sverdrup, Harald Ulrik, Evaporation from the oceans. (In: Compendium of meteorology.
Boston, American Meteorological Society, 1951. p. 1071-1081. 3 figs., 2 tables, 30 refs., 37 eqs.) MH-BH—Various methods for determining evaporation from the ocean reviewed are: 1) extra- polation from land values, 2) direct measurements at sea, 3) computation of evaporation from meteoro- logical elements at sea. History of each method given, fundamental equations developed, theoretical considerations analyzed and results obtained presented. (Same item as 4.7-8, July 1953, MAB.) Subject Headings: 1. Evaporation from seas 2. Evaporation measurement 3. Marine meteorology. —I.L.D.
5A-180 551.46:06 Zenkevich, L. A., Rabota so vet ski kh okeanologov v 1949-1950. [Work of Soviet oceanologists
in 1949-1950.] Akcdemiia Nauk, SSSR, Izvestiia, Ser. Geogr., No. 1:79, 1951. [Note.] DWB— Soviet advance in oceanology is noted. Material on processes occurring at bottoms of different seas has been assembled. Since 1949 investigating expeditions have proceeded under supervision of the author aboard a special floating laboratory. (See 5A-166 above.) Subject Headings: 1. Oceanographic research 2. Oceanographic research laboratories 3. U.S.S.R.—A.M.P.
1952 5A-181 551.515(265) :550.342 Alcaraz, Arturo and Kintanar, Roman (Weather Bur. Manila), Pacific microseisms. Inter-
natU/r.il Union of Geodesy and Geophysics, Association of Seismology, Publications du Bureau Central
II. BIBLIOGRAPHY ON GENERAL OCEANOGRAPHIC METEOROLOGY 113
similarly examined; R.H. increases with wind force and tends to be high with Ti,>T, or T. — Th = 10° + ; RH. is low when T,-Tk = 0-10°F. (Same item as4.3-190, March 1953, MAB.) Subject
Headings: 1. Humidity variations 2. Sea temperatures 3. North Atlantic.—C.E.P.B.
SA-186 551.558.1:551.553.11 •Malkus, Joanne Starr and Bunker, Andrew P., Observational studies of the air flow over
Nantucket Island during the summer of 1950. Woods Hole Oceanographic Institution, Contract N6onr-27702, NR-082-021. Project Marine Meteorology, Technical Report No. 15, Sept. 1951. 68 p. 41 figs., 18 tables, 9 refs. Stern, Melvin E. and M.rlkus Joanne Starr, Airflow over a heated island. Ibid., Technical Report No. 18, April 1952. 47 p. diagrs., refs., eqs. DWB—During the summer of 1950, eight individual case studies were made of air flow, cloud and aerological condi- tions over Nantucket Island. Since the island is nowhere higher than 15 m above sea level, and there are no topographic obstructions or latitudinal factors to consider, it is thought that this study will give a good picture of the effect of local heating on a marine air mass. Cloud photographs, airplane soundings, cross sections and air flow diagrams are presented for each case, with some discussion. In addition to usual temperature, humidity and wind data for various heights, the turbulence index, water temperatures, heat flow at ground and solar radiation records are presented. In No. 18, the streamlines of the mean convective motions arising as the result of the passage of a stable atmosphere over a heated island are investigated. The effects of changes of wind speed, stability and eddy conductivity on the streamlines are pictured, discussed and compared with observations. (Same item as 4.8-160 and 4.10-9, Aug. and Oct. 1953, MAB.) Subject Headings: 1. Marine meteorology 2. Air flow over islands 3. Convective clouds 4. Turbulence index 5. Cloud photography 6. Nantucket Island. I. Woods Hole Oceanographic Institution II. Con- tract N6onr-27702 (NR-082-021) III. Stern, Melvin E.—Af./?.
5A-187 551.46 National Academy of Sciences, Washington. D. C. Committee on Oceanography, Ocean-
ography, 1951; a report on the present status of the science of the sea. Washington, National Academy of Sciences, National Research Council, 1952. 36 p. photos. DLC—Outline of recent accomplishments in basic oceanographic research and discussion of applications of oceanography in peace and war precede a brief review of the resources in facilities, personnel and income available in the U. S. for the support of oceanographic research. Committee's recommendations for govern- ment support and for international cooperation found on p. 27-28. Subject Headings: 1. Oceano- graphic research 2. United States.
5A-I88 551.46:06(497.1) Pax, Ferdinand, Jugoslavische Meeresforschung. [Yugoslav marine investigation.] Natur-
•wissenschafllichc Rundschau. 5(11) :462-464, Nov. 1952. fig. DWB—The Institute for Marine Investigation and Sea Fisheries at Split, founded 1930, includes physiographic, biological and fishery sections. A general account of the organization and researches is given. Subject Headings: 1. Oceanographic research 2. Split, Yugoslavia. Institut za Oceanografiju i Ribarstvo 3. Yugo- slavia.—C.E. P. B.
5A-189 551.591.3(26) Rouch, Jules Alfred Pierre, Mesure de la visibilite au dessus de la mer. [Visibility measure-
ment at sea.] Geofisica Pura e Applicata, 21:41-42, 1952. eq. English summary p. 41. MH-BH —Measuring the distance to the clearly visible horizon at sea provides a good means of estimating visibility which itself is an indicator of air-sea temperature spread, air mass charaotei islics, frontal patterns, turbulence, etc. (Same item as 3I-2f>8. Seot. 1952, MAB.) Subject Headings: i. Visibility measurement 2. Visibility at sea 3. Air-sea temperature variations 4. Marine meteorology.
5A-190 551.515.8(99) •Schmitt, W., Two intensive polar outbreaks in the southern oceans. South Africa. Weather
Bureau, Nolos, 1 (4):193-201, 1952. 4 figs., 3 tables. 4 refs. DWB—The features of two polar outbreaks which occurred on May 8 and May 20, 1952 are analyzed. The path of a vigorous polar outbreak on May 20, in the Palmer Peninsula and Falkland Islands region, is followed until May 30. when it reached the Kerguelen Archipelago in the central Indian Ocean and approached Amsterdam Island, where a record upper wind (RAWIN) of 252 knots at 26,000 ft was measured (on May 30) as a spectacular finale. Both this severe polar outbreak and a similar outbreak on May 8 can be traced back to the Bellingshausen Sea and the Ellsworth Highland in West Antarctica. Synoptic and aerological evidence is accumulating that the major polar outbreaks affecting the south-w.-stern Atlantic Ocean originate almost exclusively in this area. Similarly, the meteorologically important area for the eastern Indian Ocean and thc'Attstralia-Ne-.v Zealand sector appears to be the northern
114 METEOROLOGICAL ABSTRACTS AND BIBLIOGRAPHY
boundary of Enderby Land and eastern Queen Maud Land. Subject Headings: 1. Polar outbreaks 2. Synoptic studies 3. Antarctica.—A ulhor's abstract.
5A-191 551.46:91.04 tSewell. R. B. Seymour, Oceanographic exploration 1851-1951. Science Progress, 40(159):403-
418, July 1952. 47 refs. DWB—A history of the various oceanographical expeditions and develop- ment of methods of research, and a brief survey of the present position. Ends with founding in 1949 of British National Institute of Oceanography. Subject Headings: 1. Oceanographic research 2. Oceanographic expeditions.—C.E.P.B.
5A-192 551.5.06:551.465:622.323 Shliamin, B. A., O spetsializirovannom gidrometeorologicheskom obsluzhivanii nsftianikov
moria. [On special hydrometeorological service for marine oil prospectors.] Meteorologiia i Gidrologiia, No. 6:12-15, 1952. DLC—Report about specifications of service. The work carried out during the last years has shown that the service can be most effective when hydrometeorological observations are made close to the oil derricks. The characteristics of sea swell, ice conditions and storms and their prediction are the most important subjects of a hydrometeorological service. Subject Headings: 1. Hydrometeorological services 2. Off shore oil industry.—N.T.Z.
5A-193 551.515.1(26) U. S. Bureau of Aeronautics (Navy), Climatology of ocean cyclones. U. S. Bureau of Aero-
nautics (Navy), Project AROWA (TED-UNL-MA-501), Task 13, Technical Report, Dec. 1952. 30 p. 2 refs.. numerous charts. DWB—Monthly charts based on 1929-1938 data from the His- torical Northern Hemisphere Synoptic Maps show average eastward movement, average direction of movement and a numerical analysis of speed of eastward movement of cyclones over most of the Northern Hemisphere. Subject Headings: 1. Storms at sea 2. Cyclone movement 3. Northern Hemisphere. I. Project AROWA (TED-UNL-MA-501).
5A-194 551.311.181:03 U. S. Hydrographic Office, A functional glossary of ice terminology. U. S. Hydrogrophic Office,
H.O. Publication, No. 609, 1952. 88 p. 110 figs., bibliog. p. 87-88. Price: $0.80. DWB—A revised, enlarged, illustrated edition of H.O. Study No. 103, "A functional glossary of ice ter- minology." Subject Headings: 1. Oceanography 2. Ice 3. Glossaries.
5A-195 551.46(06) Wimpenny, R. S., The International Council for the Exploration of the Sea. Nature, London,
170(4335)-.906-908, Nov. 29, 1952. DWB—History of the Council (formed 1902), mainly to study- conservation of North Sea fisheries. Includes a reference to warming up of waters of Northern Hemisphere and its effect on Arctic fisheries. Subject Headings: 1. Oceanographic research 2. In- ternational Council for the Exploration of the Sea.—C.E.P.B.
SA-196 551.574.1 Woodcock, Alfred H., Atmospheric salt particles and raindrops. Journal of Meteorology,
9(3):200-212, June 1952. 16 figs., 7 tables, 31 refs. MH-BH, DWB. Also: Woods Hole Oceano- graphic Institution, Contract N6onr-27702(NR-082-021), Technical Report No. 14. Sept. 1951. 28 p. photos, diagrs., graphs, bibliog. DWB—Atmospheric sea salt data are presented in the form of distribution curves which show the number of sea salt particles (of a given weight range) sampled at different altitudes plotted against the weight. Computations show that "in the process of growth the droplets containing each salt particle grow to raindrop size through coalescence with much more numerous and relatively non-saline cloud droplets. The numbers of droplets in cumulus clouds over the sea are compared to the numbers of condensation nuclei in the sub-cloud layer and the to number of larger sea-salt particles." A method of sampling the large sparsely-distributed salt particles in the atmosphere is described briefly. (Same item as 3.11-184, Nov. 1952, MAB.) Sub- ject Headings: 1. Saline nuclei 2. Condensation nuclei 3. Marine meteorology. I. Woods Hole Oceanographic Institution II. Contract N6onr-27702(NR-082-021).
5A-197 551.574.1 Woodcock, Alfred H., Salt nuclei in marine air as a function of altitude and wind force. Woods
Hole Oceanographic Institution, Contract Nonr-798(00), Technical Report. No. 3, Dec. 1952. 7 p. 8 figs., 12 refs. Also in: Journal of Meteorology, 10(5) :362-371, Oct. 1953. DWB—Shows that marine atmospheres contain widely varying amounts of large sea-salt nuclei, the quantity depending largely upon altitude and wind speed. It is expected that this knowledge will prove useful in studies of rain formation over the sea, oceanic islands, and perhaps over continental land masses as well. Data show changes in numbers and sizes of sea-sait particles in marine air over the
II. BIBLIOGRAPHY ON GENERAL OCEANOGRAPHIC METEOROLOGY 115
sea as altitude, position, and time of sampling are varied. Large changes with time in the amount of airborne salt near cloud base are related to changes in wind force at the sea surface. Greater wind force is associated with increasing amounts of salt, especially at the large end of the particle weight range. Suggested that bursting air bubbles in "white caps" on the open sea are a major source of the salt nuclei. Under similar wind conditions, variations in particle number and size at various altitudes within the lower atmosphere are similar in Hawaii, Florida and South Australia. Subject Headings: 1. Saline nuclei 2. Rain formation 3. Marine meteorology. I. Woods Hole Oceano- graphic Institution II. Contract Nonr-798(00).—Author's abstract.
SA-198 551.515.2(914) :550.342 Ylanan. Carlos W. (Weather Bur. Manila), Typhoons and micro&eismic storms. International
Union of Geodesy and Geophysics. Association of Seismology, Publications du Bureau Central Siismologique International, Ser. A, Travaux Scienlifiques, No. 18:91-107, 1952. 3 tables, 3 figs. DWB, DLC—Correlation between typhoons and microseismic disturbances has been the subject of study at the Weather Bureau Station at Diliman, Quezon City, during the two seasons that it has been in operation. This paper presents evaluation of the results so far obtained. Summary of the different typhoons and storms is presented together with the effects produced on the microseisms recorded with particular emphasis on amplitude. Effect of distance of the disturbance on amplitude discussed and some instances of the effect of ocean depth noted. Results point overwhelmingly to cyclonic origin of microseismic storms. Subject Headings: 1. Microseismic storm tracking 2. Ty- phoons 3. Pacific ocean 4. Quezon City, Philippine Islands.—Author's abstrac'
1953 5A-199 551.5 (26) :06 Canfield, N. L., Matthew Fontaine Maury and the World Meteorological Organization. 1853—
a meteorological centennial—1953. On back of: U. S. Hydrographic Office, Pilot chart of the Indian Ocean. Sept. 1953. chart, photos. H.O. Pub. No. 2603. DWB—Historical account of the growth of international meteorological cooperation from the first Maritime Conference instigated by MAURY and held al Brusseh in 1853 to the birth of the World Meteorological Organization in 1951 (with its technical commission of Maritime Meteorology). WMO membership, purposes, constituent bodies and organization outlined. Resolutions of the first meeting of the WMO Com- mission of Maritime Meteorology listed. They show clearly the fulfillment of Maury's insistence 100 years ago on standardizing marine meteorological and oceanographic observations for all oceans. Subject Headings: 1. World Meteorological Organization 2. History of meteorology 3. Marine meteorology 4. Maury, Matthew Fontaine 5. Maritime Conference, Brussels, 1853.
5A-200 551.507.2 Frankcom, C. E. N., Ocean meteorological networks. Marine Observer, 23(161):151-155,
July 1952. 3 maps. German summary by M. Rodewald in: Wellerlolse, No. 60:171-174, Aug. 1953. DWB—A study of the supply of weather information from the oceans by "selected ships" (see Weather, 8(5):140-143, May 1953; Meteorological Magazine, London, 82(971):146-148, May 1953). It is illustrated by world maps showing 1) position of all selected ships on Nov. 30, 1950; 2) ships sending radio reports Oct. 1, 1950, and 3) relative density of shipping. Subject Headings: 1. Weather ships 2. Marine meteorology. I. Rodewald, M.—C.E.P.B.
5A-201 551.311.17:06:656.61 Graves, G. van A., International Ice Patrol. Marine Observer, 23(160):109-110, April 1953.
2 photos. DWB—Account of work, including use of radar equipped planes. Subject Headings: 1. Icebergs 2. International Ice Patrol.—C.E.P.B.
SA-202 551.501.7:551.507.321:551.557(26) Great Britain. Naval Weather Service, Computation of upper winds from balloon ascents
at sea. Great Britain. Naval Weather Service, Memo, No. 149/52, 1953. 4 p. fig. Mimeo. GB-MO—Describes computation of upper winds from visual or radar measurements from a moving ship. Plotted track method adds displacements of ship and balloon, using forms D6504 or 6501. For long ascents the relative velocity method, adding velocities, is preferred. The quickest is the semi-automatic A.R.L. Table method. Subject Heading: 1. Upper air wind computation.—C.E.P.B.
5A-203 551.509.1(26) James. P. A. A., The seaman assists the weatherman. Weather, 8(1):13-15, Jan. 1953. DWB
—Account of organization of voluntary radio reporting service of ships to Meteorological Office, London. Subject Heading: 1. Ships weather messages.—C.E.P.B.
116 METEOROLOGICAL ABSTRACTS AND BIBLIOGRAPHY
5A-204 551.46:06 Lynian, John (U. S. Navy, Hydrographic Office), Oceanographic activities of the Hydrographic
Office, 1946-1952. American Geophysical Union, Transactions, 34(1) :122-124. Feb. 1953. 28 refs. MH-BH—Oceanographic and seismic surveys were performed mainly for the North Atlantic. Report on data collection and processing given. Over three million punched cards of surface ocean weather observations and 2,500,000 cards, representing surface currents, temperature, sea and swell from the Deutsche Seewarte deck, as well as 452,000 cards of Japanese oceanographic data were added to the collection. List of publications of the office given as well as list of papers written by the personnel of the office. Subject Headings: 1. Oceanographic research 2. Punched card collections 3. U. S. Navy. Hydrographic Office.—.4..4.
5A-205 551.5(26) :551.46 Neumann, Gerhard, Ozean und Atmosphare. Bemerkungen ttber einige meteorologisch
wichtige Wechselbeziehungen. COcean and atmosphere. Remarks on some meteorologically important interrelations.] Nalurwissenschaflliche Rundschau, 6(10):405-411, Oct. 1953. 5 figs., 4 refs. DWB—Two points are amplified: 1) the dependence of oceanic circulation on general atmospheric circulation and their similarity, including convergence and divergence zones, and 2) the regulating effect of oceans on temperature. These are illustrated by examples, also showing effect of air-water temperature difference in N. Atlantic on precipitation, fog and storminess. The relation between non-periodic variations of atmosphei ic-hydrospheric circulation and temperature anomalies is examined. Subject Headings: 1. Marine meteorology 2. Ocean-atmosphere inter- action.—C.E.P.B.
5A-20S 551.509.21(26) Research into the weather of southern oceans. Marine Observer, 23(160) :84-88. April 1953.
fig. DWB—Summary of work of British Naval Weather Service center at Simonstown in South Africa in organizing a system of ships' reports and preparation of weather charts. A typical chart is illustrated and some weather sequences described. Subject Headings: 1. Synoptic charts 2. South Atlantic 3. Indian Ocean.—C.E.P.B.
5A-207 551.46 Tully, John P., Oceanography—science of the sea. Canadian Geographical Journal, 47:148-
165, Oct. 1953. illus., photos. DLC—An interesting popular introduction to oceanography, well- illustrated with simplified diagrams of the principal physical processes in the oceans and between ocean and atmosphere and with photographs of oceanographic instruments. Subject Heading: 1. Oceanography.
PERIODICALS
(Arranged alphabetically by title) 5A-208 551.5(06)
•Annalen der Hydrographie und Maritimen Meteorologie. Hamburg, Deutsche Seewarte, v. 1, no. 1, 1873. Ceased publication with v. 72, No. 11. 1944. Subject and author index for 1921- 1940 published separately, Hamburg, 1943. DLC, DWB—Monthly journal in German, v. 1-3 of which were entitled Hydrographische Mitteilungen. Important source of articles or data in me- teorology, hydrography, climatology and oceanography. From 1935 to 1944, nearly three-quarters of the material was meteorological. Elaborate (often colored) fold-in charts and a large amount of detailed statistical and descriptive materu.1, provide a first class source for oceanic areas or adjacent coasts and islands from the Arctic to the Antarctic, surpassed only by expeditions report which, however, ^enernlly suffer a 5 to 15 year delay '*n publication. HnnHreH? of short or medium length articles give accurate observations of unusual phenomena encountered by seamen or scientists on voyages as well as on expeditions. Included also are numerous articles on secular variations in climate of oceanic and continental areas and other studies obviously made by statisticians who utilized a large quantity of observational material. Publication of this journal lapsed in 1944 but it was succeeded by two new journals, Annalen der Meteorologie, published in the British Zone of Germany (Hamburg) and the Deutsche Hydrographische Zeitschrijt (see 5A-217 below). (For fuller abstract, see item 2-6, Feb. 1950, MAB.) Subject Headings: 1. Periodicals ?. Marine me- teorology 3. Hydrography 4. Oceanography 5. Germany. I. Hamburg. Deutsche Seewarte. —M.R.
5A-209 551.5 (26) (05) *Aus dem Archiv der Deutschen Seewarte. Hamburg. Deutsche Seewarte, v. 1, 1878—v. 63,
1943-44. figs., tables, charts. DLC—The Norddeutsche Seewarte, established in 1868, was taken over in 1875 by the German Government as the Deutsche Seewarte for the purpose of investi-
II. BIBLIOGRAPHY ON GENERAL OCEANOCRAPHIC METEOROLOGY 117
gating navigation, instruments, oceanography and tides, meteorology and astronomy for the pro- motion of maritime commerce and industry. Each volume of "Aus dem Archiv" consists of ap- proximately four fo six monographs in German on meteorological and oceanographical subjects such as climate, expedition reports and wind driven currents. The series is amply illustrated with charts, maps, photos, tables, etc. Subject Headings: 1. Periodicals 2. Marine meteorology. I. Hamburg. Deutsche Seewarte.
5A-210 551(06) t*Beitrage zur Geophysik. Leipzig, Becker & Erler, v. 1, 1887—v. 62, 1952 (latest rec'd).
Editors: Dr. Georg Gerland, Stuttgart, and V. Conrad, Vienna. Corresponding editors: Abbott, Angstrom, Berlage, van Everdingen, Fleming, Gutenberg, Koppen, Linke, Stormer, Vegard, Weick- mann, etc. Author and subject index, pub. 1933, covers v. 1-35. DWB, DLC—The volumes of this journal (popularly known as Gerlands Beitrage) comprise one of the leading sources of funda- mental scientific articles on oceanography as well as all the other branches of geophysics. Reviews by leading scientists all over the world occupy a large portion of each issue and several pages of classified bibliographies appear in each volume. Most articles are in German, but there are many in English, French, Italian, Swedish, etc., with summaries in one or more languages. Contributors in addition to the editorial advisors listed above include V. and J. BJERKNES, DEFANT, HAURWITZ and scores of others. Articles are outstanding in their wealth of supporting data, charts, theoretical back- ground and illustrative material. (For fuller abstract see 2-10, Feb. 1950, MAB.) Subject Headings: 1. Oceanography 2. Geophysics 3. Periodicals.
5A-211 551.5 (26) (05) •Berlin. Universitiit. Institut fUr Meereskunde, Veroffentlichungen. Old Series, No. 1-15,
1902-1913 (ceased publication). New Series: (A) Geographisch-Naturwissenschaftliche Reihe, No. 1-41, 1912-1944 (ceased publication). (B) Historisch-Volkswirtschaftliche Reihe, 13 Hefte. Also: Meereskunde, Sammlung Volkstttmlicher Vortrage zum Verstandnis der Nationalen Bedeutung von Meer und Seewesen, v. 1, 1907—v. 18, No. 206, 1932. Pub. of Berlin. Universitat, Institut fur Meereskunde. Superseded by Das Meer in Volkstttmlichen Darstellungen. Berlin, E. S. Mittler, v. 1, 1933—v. 7, 1939. figs., tables, fold, charts. DLC—Four different series of monographs in German representing results of research by members of the German Institut ffir Meereskunde, of the Univ. of Berlin (established 1900) on all phases of physical and dynamic oceanography, in- cluding oceanic stratification, current dynamics, expedition reports and general circulation of the oceans. Subject Headings: 1. Periodicals 2. Oceanography
5A-212 551.46:06(05) California. Univ. Scripps Institution of Oceanography, Bulletin. University of California
Press, Berkeley, California, v. 1, 1927—v. 6, 1951-1952 (latest rec'd). V. 1-4 (8) have subtitle: Technical Series. DLC—The contributions to this series were, in the early years, largely marine biological in subject matter. Recently, however, there are more numerous papers dealing with physical and dynamic oceanography and meteorology written by staff members of Scripps and well- known outside contributors such as W. C. JACOBS and H. BYERS. Subject Headings: 1. Periodicals 2. Oceanography.
5A-213 551.5(26)(05) •California. University. Scripps Institution of Oceanography, Contributions, New Series.
No. 1-, 1937-. DLC, DA—Annual series of bound reprints of all contributions other than those papers published in the Bulletin of the Scripps Institution of Oceanography. Subject matter em- braces all fields of oceanography with emphasis on marine biology. The long list of distinguished con- tributors includes H. U. SVERDRUP, G. F. MCEWEN, R. H. FLEMING, C. E. ZOBELL and W. C. JACOBS. Incorporated in the series are the "Oceanographic observations of the "E. W. Scripps" cruises of 1938-," compiled by H. U. SVERDRUP and staff, published by the University of California Press, Berkeley, 1942- and comprising the "Scripps Institution of Oceanography, Records of Observations." (Same item as 41-99, Sept. 1953, MAB.) Subject Headings: 1. Oceanography 2. Oceanographic institutes 3. Periodicals. I. Sverdrup, Harald Ulrik.
5A-2I4 551.5(05) Compania Administradora del Guano, Lima. Peru, Boletin. Vol. 1. 1925—v. 29(3). March
1953 (latest rec'd). DLC—The Compania originated in Lima in 1909 as a semi-official corporation for the purpose of working in pure and applied science, agriculture, meteorology, zoology and oceanography in connection with the guano supply. Its small monthly publication contains a few articles on marine meteorology (e.g., variation of sea and air temperatures) and some climatic data for the coast of Peru. Subject Headings: 1. Periodicals 2. Climate of Peru 3. Guano industry.
, w
118 METEOROLOGICAL ABSTRACTS AND BIBLIOGRAPHY
5A-21S 551.46:06(05) •Conseil Permanent International pour l'Exploration de la Mer, Copenhagen, Bulletin Hydro-
graphique. 1908-. maps, charts, tables. DLC—The Bulletin is a continuation of the Bulletin Trimeslriel des Rlsullats Acquis Pendants les Croisieres Piriodiques, etc. (1902-1908) and incor- porated the Bulletin Planktonique (1908-1912) of the same organization. Annual volumes in German and English or French and English contain extensive tables of temperature and salinity data at surface and selected depths, chemical composition data and current data chiefly from the Baltic and North Seas and North Atlantic. Data supplied largely by oceanographic research vessels of member nations. Subject Headings: I. Periodicals 2. Oceanographic data 3. North Sea 4. Baltic Sea 5. North Atlantic.
5A-216 551.46:06(05) tConseil Permanent International pour l'Exploration de la Mer, Copenhagen, Journal, v. 1,
1926—v. 18(3), 1953 (latest rec'd). figs., refs., tables. DLC—Each issue consists of general articles (chiefly on marine biology), reviews of outstanding oceanogranhica! papers, and bibliography. Reviews generally appear in English or German with an occasional one in French or Spanish. Most valuable to meteorologists are the bibliographies containing references to marine meteorology, currents, salinity and temperature distribution, energy exchange and winds. Subject Headings: 1. Periodicals 2. Oceanographic bibliographies.
5A-217 551.46:06(05) Deutsche Hydrographische Zeitschrift. Hamburg, Deutsches Hydrographisches Institut,
v. 1, Jan. 1948—v. 5, 1952 (latest rec'd). figs., tables, fold, charts, refs., eqs. Vol 1, 1948 was issued with English title: German Hydrographic Journal. DLC—Published in six issues yearly it replaces the former Annalen der Hydrographie und Maritimen Meteorologie (see 5A-208 above). Subjects dealt with include coastal and open sea surveying, nautical science, navigation, chro- nometry, terrestrial magnetism, tides, and physical and chemical oceanography. Only the oceano- graphical aspects of marine meteorology and climatology receive attention, because other facets of those subjects are more fully treated by the Meteorological Office for Northwest Germany. Reviews of bibliographies included. Subject Headings: 1. Periodicals 2. Oceanography. I. Hamburg. Deutsches Hydrographisches Institut.
5A-218 550.3(05) Geofysiske Publikasjoner. Oslo, Norske Videnskaps-Akademi, v. 1, 1920—v. 19(1), 1953
(latest rec'd). DLC, DWB—Volumes consist of from 5 to 17 monographs in German, English or French on meteorology, terrestrial magnetism, physical and dynamical oceanography and other subdivisions of geophysics. Included among the oceanographical studies are oceanographic surveys of the North Atlantic (v. 4, No. 2-4) expedition reports and tidal investigations. Subject Headings: 1. Periodicals 2. Geophysics 3. Oceanography 4. Meteorology. I. Norway. Geofysiske {Commission II. Norske Videnskaps-Akademi i Oslo.
5A-219 551.5(05) •Indonesia. Djawatan Meteorologi dan Geofisik, Verhandelingen. No. 1, 1911—No. 42,
1952 (latest rec'd). figs., tables, fold, charts, refs. DLC—The Verhandelingen (a continuation of those of the Magnetisch en Meteorologisch Observatorium te Batavia, which was established in 1866 under the Netherlands East Indies government) are a series of monographs in German, Dutch or English reporting research accomplished in general meteorological (considerable upper air) and geophysical work and studies of sea water temperatures and other physical aspects of the sea by VAN BEMMELEN, BRAAK, VISSER, BOEREMA, BERLAGE and others. Most articles deal with the Kast Indies regions. Subject Heading: 1. Periodicals 2. Oceanography 3. Marine meteorology. I. Indonesia (K.) Magnetisch en Meteorologisch Observatorium te Djakarta.
5A-220 551.46:06(05) Institut Oceanographique, Monaco, Bulletin. Monaco. Musee Oceanographique de l'lnstitut,
v. 1, No. 1, Jan. 1904. Latest issue received v. 49(1002), 1952. v. 1-3, Nos. 1-87 entitled: Bulletin du Musie Oceanographique de Monaco. DLC—The Musee was founded by Albert I, Prince of Monaco, in 1897 as an independent institution and began the publication of the Bulletin in 1904. In 1906 the Institut Oceanographique was established, and the Musee was placed under its direction, the Institut continuing the publication of the Bulletin. Each volume consists of 20 to 30 short monographs in French with the exception of an occasional contribution in German or English. The subject matter is broad in scope, emphasizing marine biology but covering also many facets of physical oceanography. Numerous reports of the work of the research ship "La Princessi-AIice" are included. Subject Headings: 1. Periodicals 2. Oceanography.
V-
II. BIBLIOGRAPHY ON GENERAL OCEANOGRAPHIC METEOROLOGY 119
5A-221 551.46(05) International Hydrographic Review. Monaco, International Hydrographic Bureau, v. I,
1923—v. 30(1), May 1953 (latest rec'd). figs., tables, fold, charts, bibliogs. DLC—Published in French and English. Issued under title, Hydrographic Review, 1923-1946. One number only issued in 1923; in 1924 and thereafter there were two issues annually, May and Nov. except in 1926 when only one number appeared. Each volume consists of two numbers (200-300 p.) containing articles by authorities of many nations dealing with nearly every aspect of hydrography and. many allied sciences. Contains bibliography of hydrographic publications. Subject Headings: 1. Peri- odicals 2. Hydrography 3. Oceanography. I. International Hydrographic Bureau, Monaco.
5A-222 551.46:06(05) t*International Union of Geodesy and Geophysics. Association of Physical Oceanography.
Publication Scientifique. No. 1, 1931-No. 11, 1950 (latest rec'd). illus., maps (part fold). DLC— This series supersedes in part the Association's Bulletin (No. 1-17, 1921-31, Venice) which ceased publication in 1931. First two numbers were published in Helsingfors. All are chiefly in English and appear in monograph form on subjects in physical and chemical oceanography, marine biology and submarine geology. Considerable data and numerous bibliographies. Subject Headings: 1. Oceanography 2. Serial publications.
5A-223 551.46:06(05) •Italy. Istituto Idrografico, Annali Idrografici, v. 1. 1900—v. 12(1-2), 1925-1923 (latest rec'd).
DLC—Volumes covering from one to three years consist of brief notes on hydrography, navigation and meteorology, resumes of the work of the Istituto Idrografico for the period in question and results of cruises of the Istituto Geofisico di Trieste. Subject Headings: 1. Periodicals 2. Ocean- ography.
5A-224 551.46(05) •Journal of Marine Research. Sears Foundation for Marine Research and Bingham Oceano-
graphic Laboratory, Yale University, New Haven, Conn., Vol. 1, 1937—v. 12, 1953 (latest rec'd). DLC—This journal with its board of editors including Y. H. OLSEN, ISELIN, LEIPPER, MERRIMAN, PARR, MUNK, REVELLE, ROSSBY, SVERDRUP ami THOMPSON is among the finest oceanographic series in the United States. Innumerable figures, charts, and tables illustrate the articles by leading authors in the field. Subject matter embraces marine biology, submarine geology, marine meteor- ology and physical and chemical oceanography Subject Headings: 1. Periodicals 2. Marine meteorology 3. Oceanography. I. Setrs Foundation for Marine Research. II. Bingham Oceano- graphic Laboratory.
SA-225 551.46(05) •Journal of Oceanography. Kobe, Japan, Marine Observatory, Vol. 1-13, 1929-1942. Ser. 2,
v. 1(1). 1950—v. 2, 1951 (latest rec'd). figs., tables, fold, charts. DLC—Monthly publication in Japanese with English "Table of contents" and figure subheadings. Contains material of marine meteorological interest including reports of typhoons, ship weather observations, coastal observations of sea, swell, salinity and temperature and oceanographic observations in the Pacific. Subject Headings: 1. Periodicals 2. Oceanography. I. Kobe, Japan. Marine Observatory.
5A-226 551.46(05) Kobe, Japan. Marine Observatory, Memoirs, v. 1, 1922—v. 10, 1952 (latest rec'd). tables,
fold, charts. DLC -Quarterly journal in oceanography in English containing articles by Japanese authors on subject dealing with oceanography and marine meteorology. Considerable attention given *o theoretical oceanography and typhoon studies. Subject Headings: 1. Periodicals 2. Ocean- ography.
5A-227 551.5(05) Marine Observer. London, Meteorological Office, v. 1, 1924; latest issue received, v. 23(162),
1953. 340 p. per volume, illus. DLC—This quarterly journal of marine meteorology (published monthly 1924-1932, suspended Oct. 1939-July 1947) is a continuation of articles printed on backs of "Monthly Pilot and Meteorological Charts" (1901-1923) for the benefit of naval and merchant seamen interested in or cooperating with the Meteorological Service. Material comprises illustrated popular but original articles and short contributions in marine meteorology and oceanography. {Same item as 1-14, Jan. 1950, MAB.) Subject Headings: 1. Periodicals 2. Oceanography 3. Ma- rine meteorology. I. Great Britain. Meteorological Office.—MR.
I

120 METEOROLOGICAL ABSTRACTS AND BIBLIOGRAPHY
5A-228 551.46(05) Oceanographical Magazine. Tokyo, Central Meteorological Observatory, v. 1, March 1949—
v. 4, No. 4, March 1953 (latest rec'd). Japanese title: Obun Kayo Hdkoku. charts, diagrs. DLC— Quarterly journal in English containing brief articles on the dynamics and thermodynamics of the oceans, energy exchange between sea and atmosphere, water mass analysis, theory of ocean currents, tidal analysis and annual reports of sea and weather observation on Antarctic whaling grounds. Subject Headings: 1. Periodicals 2. Oceanography 3. Marine meteorology. I. Japan. Central Meteorological Observatory, Tokyo.
5A-229 551.5:551.46(05) Oceanography and Meteorology. Nagasaki, Japan, Marine Observatory, v. 1, No. 1, Feb.
1946—v. 6, No. 1, 1952/1953 (latest rec'd). figs., tables, refs. MWB—Four issues comprise each volume. Table of contents and an occasional abstract or article appear in English but other- wise the publication is completely in Japanese. Papers deal often with oceanographic instrumenta- tion, water mass analysis, cold fronts and forecasting. Subject Headings: 1. Periodicals 2. Ocean- ography 3. Meteorology. I. Nagasaki, Japan. Marine Observatory.
5A-230 551.46(05) t*§Papers in Physical Oceanography and Meteoro.'ogy. Cambridge, Mass., Massachusetts
Institute of Technology and Woods Hole Oceanographic Institution, v. 1, 1930—v. 12(4). May 1953 (latest issue rec'd). maps, diagrs. DLC—Vol. 1, No. 1-4, appeared as M.I.T. Meteorological Papers, after which issue, the series title was changed to its present form. Each volume consists of four separate monographs on research carried out in the fields of meteorology, physical and chemical oceanography and marine biology. Among the numerous well known authors contributing are such men as H. U. Sverdrup, C.-G. Rossby, H. R. Seiwell, C. O'D. Iselin, H. B. Bigelow and J. N'amias. A wealth of data and synoptic material is included as well as numerous bibliographies. Subject Headings: 1. Serial publications 2. Meteorology 3. Oceanography. I. Massachusetts Institute of Technology II. Woods Hole Oceanographie Institution.
5A-231 551.46(05) Der See wart: Nautische Zeitschrift fur die deutsche Seeschiffahrt. Hamburg, Deutsches
Hydrographisches Institut, and Hamburg, Seewetteramt, v. 1, 1932—v. 14(5), Oct. 1953 (latest rec'd). photos, diagrs., »-efs. DWB—A small illustrated journal containing brief popular articles on oceanography, marine meteorology and other subjects of interest to marine shippers. Simple charts and descriptions of selected harbors included. Subject Headings: 1. Periodicals 2. Marine meteorology 3. Oceanography. I. Hamburg. Seewetteramt II. Hamburg. Deutsches Hydro- graphisches Institut.
5A-232 551.5(26X05) 551.311.1 *U. S. Coast Guard, Bulletin. No. 1, 1912—No. 37, 1952 (latest rec'd). tables, fold, charts.
DLC—Bulletins contain annual reports of the International Ice Observation and Ice Patrol Service in the North Atlantic Ocean in its work of determining set and drift of icebergs and field ice, reporting presence by radio, rendering assistance to ships and making current, salinity, bathymetricand upper air observations. Comprehensive and detailed accounts of scientific observations with numerous charts (oceanographic, ice distribution, weather) and tables included. Subject Headings: 1. Peri- odicals 2. Sea ice 3. International Ice Patrol 4. North Atlantic.
5A-233 551.46:06(05) Woods Hole Oceanographic Institution, Collected Reprints. 1933, pub. March 1934. Latest
bound issue 1951, pub. July 1952. DLC—An extremely useful series. Each volume contains all "contributions from the Woods Hole Oceanographic Institution which appeared during the stated year in publications other than Papers in Physical Oceanography and Meteorology." The Annual Report of the Director is often included with the reprints for the year. The subject matter is broad in scope touching on almost all phases of oceanography. Outstanding among the long list of well-known authors are H. U. SVERDRUP, C. O'D. ISELIN*, H. R. SEIWELL, A. C. REDFIELD, H. B. BIGELOW and P. E. CHURCH. Subject Headings: 1. Reprints 2. Oceanography.
5A-234 5 (26)551. :06(05) Woods Hole Oceanographic Institution, Marine meteorology. Contract N6-onr-277, Task
Order II, NR-082-021. Technical reports, No. 1, 1949—No. 25, 1953 (latest rec'd). charts, diagrs., photos, tables. DWB—A series of monographs under separate authorship presenting the results of varied aspects of marine meteorological research accomplished at the Woods Hole Oceanographic Institution under the sponsorship of the ONR. Subject Headings: 1. Marine meteorology 2. Me- teorological research. I. Contract N6-onr-277, Task Order H, NR-082-021.
II. BIBLIOGRAPHY ON GENERAL OCEANOGRAPHIC METEOROLOGY 121
BIBLIOGRAPHIES
(Arranged chronologically)
1890 5A-235 551.46:016
tHamburg. Deutsche Seewarte, Katalog der Bibliothek der Deutschen Seewarte. [Catalogue of the libn. y of the Deutsche Seewarte. ] Hamburg, Hammerich and Lesser, 1890. 619 p. 10,600 refs. DLC —An alphabetical list within major subject subdivisions of the 10,660 works in the library of the Deutsche Seewarte at the end of 1889. Largest categories are meteorology (2769), physics (1617), magnetism and electricity (974), geology (.607) and chemistry and technology (563). Subject Heading: 1. Bibliographies.
1920 5A-236 550.3(02)
t American Geophysical Union, Transactions. Published by the National Research Council of the National Academy of Sciences, Washington, D. C. v. 1, 1920—v. 34(4), Aug. 1953 (latest rec'd). DWB, DLC—Issues appearing every two months (after 1944) contain extensive geophysical bibliographies including one subdivision devoted to oceanography and comprising 20 to 30 unan- noted recent references. Subject Headings: 1. Bibliographies 2. Oceanography.
1928 5A-237 551.46:016
fBibliographia Oceanographica. [Oceanographic bibliography.] Italy, Consiglio Nazionale delle Ricerche, Comitato Nazionale per la Geologia, Geografia e Talassografia. v. 1, 1928—v. 20, 1947 (latest rec'd). Published 1929-1952. DLC—A fairly comprehensive, partially annotated (in Italian) bibliography of modern works on all phases of oceanography prepared under the direction of the Italian delegation of the International Commission for the Scientific Exploration of the Mediterranean. Subject Headings: 1. Oceanographic bibliographies. I. Magrini, Johannes (founder) II. Brunino, Gustavo (ed.) III. Italy. Consiglio Nazionale delle Ricerche. Comitato Nazionale per la Geologia, Geografia e Talassografia.
1937 5A-238 551.46:016
tSpiess, H. C, Sechzig Jahre "Aus dem Archiv der Deutschen Seewarte." [Sixty years of Aus dem Archiv der Deutschen Seewarte.] Annalen der Hydrographie, 65(10):467-479, Oct. 1937. 264 refs. DLC—In a chronological list of 264 contributions from the Deutsche Seewarte (1878- 1937), 113 deal with meteorology, 42 with oceanography, 35 with astronomy and navigation, 22 with magnetism and 12 with instruments. Alphabetical author index follows list of works. No subject index. Subject Headings: 1. Bibliographies. I. Aus dem Archiv der Deutschen Seewarte, Hamburg.
1941 5A-239 551.46:016
tGrier, Mary Catharine (comp.). Oceanography of the North Pacific Ocean, Bering Sea and Bering Strait: a contribution toward a bibliography. Washington. University, Univ. of Washington Publications, Library Series, V. 2, 1941. 290 p. DLC—Extensive coverage of physical ocean- ography and marine biology of the region. References, a few briefly abstracted, include books, magazine articles and other documents in English and foreign languages. [Same item as 41-127, Sept. 1953, MAB.) Subject Headings: 1. Oceanographic bibliographies 2. North Pacific 3. Btring Sea 4. Bering Strait.
1946 5A-240 551.46:016
tGrier, Mary ^atbarine (cymp). References on the physical oceanography of the western Pacific Ocean. U. S. Hydrographie Office, Publication, No. 238, 1946. 74 p. 1227 refs. DLC— Second publication of bibliographic material compiled during World War II by Navy Hydrographie Office and reflecting the geographical limits of the war in the Pacific. Of 1227 references in many languages, about J are briefly annotated. Reference made to recent editions of sailing directions, pilots, tide tables, and chart catalogs. Indexes of subjects, geographic names and expeditions included. (Same item as 41-174, Sept. 1953, MAB.) Subject Headings: 1. Oceanographic bibli- ographies 2. West Pacific.
1951 5A-241 551.46 (99) :016 55.15 (99) :016
tU. S. Bureau of Aeronautics (Navy), Antarctic bibliography. Prepared by the U. S. Naval Photographic Interpretation Center. U. S. Office of Naval Operations, NAVAER 10-35-591, Feb.
122 METEOROLOGICAL ABSTRACTS AND BIBLIOGRAPHY
1, 1951. 147 p. all rcfs. 3 maps in separate pocket. DWB—Contains 365 references to the meteorology and climatology (p. 42-50) and 172 to the oceanography (p. 56-61) of the Antarctic. Subject Headings: 1. Antarctic bibliographies 2. Oceanograpbic bibliographies 3. Antarctic Ocean 4. Antarctica.
1952 5A-242 551.5:551.46:016
tU. S. Hydrographic Office. Oceanograpbic and marine meteorological bibliography, Annali Idrografici, years 1900 thru 1923. Washington. 1952. H.O. Misc. No. IS, 257-2. All refs. DN- HO—Unannotated, unindexed list of contents of the Italian journal, Italy. Istituto Hidrografico, Annali Idrografici (see 5A-223), v. 1, 1900—v. 11. 1923—v. 12 (1-2) 1925-1928 arranged chrono- logically and then alphabetically by author within years. References presented in such form that they can be cut apart into index cards and arranged by their subject headings if desired. Subject Heading: 1. Oceanograpbic bibliographies.
1953 5A-243 016(98) Arctic Institute of North America, Arctic bibliography. Prepared for and in cooperation with
the Department of Defense, under the direction of the Arctic Institute of North America. [Edited by Marie Tremaine. ] Wash.. D. C. Govt. Print. Office, 1953. 3 v. continuously paged, 4478 p. DLC—The subject and geographic place index in vol. 3, p. 4064-4079. contains well over 800 refer- ences to various aspects of oceanography. Scope of the literature is worldwide but all titles are translated and all abstracts written in English. (For complete abstract, see item 4.11-1, Nov. 1953, MAB.) Subject Headings: 1. Arctic bibliographies 2. Oceanograpbic bibliographies 3. Cli- matology 4. Arctic. I. Tremaine, Marie (ed.) II. U. S. Dept. of Defense.
SUPPLEMENTARY MATERIAL
5A-244 551.46(05) Akademiia Nauk, SSSR. Institut Okeanologii, Trudy, v. 1, 1946—v. 6, 1951 (latest rec'd).
figs., refs., tables, illus. DLC—This Russian periodical for oceanography appears at irregular intervals. Each issue with 130-280 pages contains 7-20 articles, written mostly by members of the Oceanographic Institute in Leningrad. About 25% of the papers cover topics of interest to meteor- ologists, for example, propagation of thermal variations, dissipation of energy, horizontal and vertical austausch, evaporation, heat balance, surface temperatures and their measurement, ocean currents and their dependence on wind, sea waves, etc. Subject Headings: 1. Oceanography 2. Ma- rine meteorology 3. Periodicals.—A.A.
5A-245 551.5 (26) (05) Der Wetterlotse. Hamburg, Seewetteramt, No. 1, Jan. 1949—No. 58, June 1953 (latest
rec'd). figs., tables, refs. DWB—A small monthly publication designed primarily for the use of ships' officers and theiefore devoted largely to subjects of marine meteorological interest with emphasis on the Baltic and North Seas and the North Atlantic. Subject Headings: 1. Marine meteorology 2. Periodicals. I. Hamburg. Seewetteramt.
5A-246 551.506.5:91.04(99) Giaver. John. Maudheim. To Ar i Antarktis. Den norsk-british-svenske vitenskapelige
ekspedisjon til Antarktis 1949-1952. [Maudheim. Two years in the Antarctic. The Norwegian- British-Swedish Scientific Expedition to the Antarctic. 1949-1952.] Oslo, Gyldendal Norsk Forlag, 1952. 373 p. numerous photos, diagrs. Biographical sketches of members of the expedition, p. 368-373. DLC—The book is a descriptive commentary on daily life and scientific work at Maudheim. Brief attention afforded local weather. No data included. Subject Headings: 1. Maud- heim Expedition, 1949-52 2. Antarctic expeditions 3. Antarctica.
5A-247 551.46:91.04 tSewell, R. B. Seymour, Oceanographic exploration 1851-1951. Science Progress, London,
40(159):403-418, July 1952. 47 refs. DLC—A history of the various oceanographic expeditions and development of methods of research, and a brief survey of the present position. Ends with the foundation in 1949 of [British] National Institute of Oceanography. Subject Headings: 1. Ocean- ograpbic research 2. Oceanographic expeditions.—C.E.P.B.
II. BIBLIOGRAPHY ON GENERAL OCEANOGRAPHIC METEOROI-OGY 123
5A-248 551.46(05) tRecords of Oceanographic Works in Japan, New Series, v. 1, No. 1, Match 1953. Continu-
ation of the Records of Oceanographic Works in Japan, v. 1. March 1928—v. 12, no. 2, March 1941. Compiled by the Special Committee on Marine Resources in tiie UNESCO Committee of the Science Council of Japan. (Pub. by Japanese National Commission for UNESCO.) 153 p. diagrs., tables, refs. In English. DWB, MH-BH—A journal devoted to promoting the development of marine resources by publication of worthy papers on pure and applied oceanography. No marine meteorology in the first issue. Subject matter deals chiefly with ocean currents and waves, tem- perature, salinity and chemical composition of sea water and marine biology. Subject Headings: 1. Oceanography 2. Periodicals. I. Ishibashi, Masayoshi Ud.) II. Japan. Science Council. UNESCO Committee III. Japanese National Commission for UNESCO.
5A-249 551.5:06 (26) :92 Schumacher, Arnold, Matthew Fontaine Maury und die Briisseler Konferenz 1853. [Matthew
Fontaine Maury and the Brussels Conference 1853.] Deutsche Hydrographische Zeilschrift, 6(2) :87- 93, 1953. 2 figs., 13 refs. DWB—An account of MAURY'S life and pioneer work in marine meteor- ology, including organization of voluntary meteorological observations on ships and plotting of best sailing ship routes. The main events of his life are tabulated from his birth in Spottsylvania Co., Virginia in 1806 to his death at Lexington in 1873. Subject Headings: 1. Biography 2. Marine meteorology 3. Maritime Conference, Brussels, 1853 4. Maury, Matthew Fontaine.—C.E.P.B.
5A-250 551.5 (26) :387 •Bowditch, Nathaniel, American practical navigator. U. S. Hydrographic Office, Pub., No. 9,
1943. 391+387 p. 137 figs., 43 tables, eqs., appends. DLC—One of the most comprehensive and complete coverages of all phases of navigation expressed in a clear, concise style with emphasis on practicality and usability. The first edition appeared in 1802 after which 9 more editions were published before the author's death in 1838. The work was so highly esteemed that the U. S. Hydrographic Office took over (1866) and perpetuates its publication and revision. A complete review of the 1938 (reprinted 1943) revision is under way at the H.O. with the new edition scheduled to appear in about 1955. Pt. I, devoted to text and appendixes, includes sections on ocean currents (p. 259), ocean waves (p. 266), winds (p. 268), cyclonic storms (p. 274) and ice movement in the North Atlantic (p. 298). Pt. II is composed entirely of navigational tables. Subject Headings: 1. Marine manuals 2. Marine meteorology 3. Marine navigation. I. U. S. Hydrographic Office.
5A-251 551.46(02) Shokal'shil, IUlil MikhaTlovich, Fizicheskaia okeanografiia. [Physical oceanography.]
Leningrad. 1933. 360 p. 162 figs., refs. DLC—The physical aspects of oceanography are treated here from the geographical point of view, avoiding lengthy theoretical discussions, but presenting comprehensive information, accumulated in the world literature up to that time on the distribution of land and water, water level variations, the bottom of the oceans, composition of sea water, distribution of temperature, sea ice, transparency, sound propagation, etc. Approximately half of the book deals with dynamic aspects as waves, tides and ocean currents, including wind effects. Numerous small scale maps show the geographic distribution of physical parameters and cross sections show their vertical characteristics. Subject Headings: 1. Physical oceanography 2. Ocean currents 3. Textbooks.—A. A.
PART in. METEOROLOGICAL ARTICLES APPEARING IN RECENTLY ISSUED PUBLICATIONS
Note: The contents of periodicals included in this section are for information only, and will not be listed in the monthly indexes until abstracted. When material is furnished in advance of date of publication, the pagination may be omitted.
American Geophysical Union, Transactions, Volume 34, Number 5, October 1953. Paulhus, J. L. H. and Gilman, C. S.: Evaluation of probable maximum precipitation, p. 701-708. Saucier, Walter J.: Horizontal deformation in atmospheric motion, p. 709-719. Burns, Joseph I.: Small-scale topographic effects on precipitation distribution is San Dimas
Experimental forest. Discussion by Walter T. Wilson, p. 761-768. Rhodes, Forrest L.: Report of the Committee on Snow, 1951-1952, p. 777-778. Ackermann. William C.: Report of the Committee on Precipitation, 1952-1953, p. 778-779.
Meteorological Society of Japan, Journal, Volume 31, Number 4, April 1953. Sekihara, Kyo: On a relation between the distribution of ultraviolet sky radiation and the
optical thickness of the atmosphere, p. 117-124. Ogura. Yoshimitsu: Note on the theory of turbulent diffusion in the lower layer of the atmos-
phere, p. 125-131. Arakawa, H.: Critical study on the angular-momentum-transfer method and vorticity-transfer
method in the investigation of zonal circulation of the atmosphere, p. 132-138. Kamamoto, Hiroo: D.C. self synchronous-motor used as wind direction meter, p. 139-155.
Number 5, May 1953.
Yamashita, R.: On 'land and sea breezes,' p. 157-172. Murakami, T.: On the seasonal variation of upper flow patterns. Part 1. From winter to
spring, p. 173-193.
Number 6, June 1953.
Arakawa, H.: On the maintenance of westerlies and tropical revolving wind systems, p. 195-205. Ogura, Y. and Miyakoda, K.: Some remarks on the "Turbulent element model" of the isotropic
turbulence, p. 206-218. Itoo, K.; Yano, T. and Hama, K.: Size distribution, crystal form and falling velocity of snow-
flake, p. 219-231. Miyamoto, M. and Kojima, K.: The relation between the kinematic energy of typhoons and
latitude of their generations, p. 232-235.
Number 7, July 1953.
Okita, T.: On the mechanism of dissipation of fog by model wood, p. 237-247. Matsumoto, Seiichi; Hiroshi, Itoo and Arakawa, Akio: On the monthly mean distribution of
temperature, wind and relative humidity of the atmosphere over Japan from March 1951 to February 1952, p. 248-258.
Kobayashi, T. and Hori. J.: Application of Wiener's theory of prediction to the problem of long period weather forecasting (I), p. 259-267.
Number 8, August 1953.
Ogura, Y.; Sekiguchi, Y. and Miyakoda, K.: Classification of turbulent diffusions in the atmos- phere, p. 271-285.
Magono, C.: Volume distribution of the large precipitation elements, p. 286-297.
Meteorologische Rundschau, [Frankfurt], Volume 6, Number 7/8, July/August 1953. Kaiser, Heinz: Die Anwendung des Reynoldsschen Ahnlichkeitsgesetzes auf Stromungs-
widersttlndc und Ausbreitungsvorggnge in turbulenten Grenzschichten, [Application of
124
III. RECENT ACCESSIONS 125
the Reynolds law of similarity to flow-resistance and diffusion processes at turbulent boundaries], p. 121-125.
Aichele, H.: Lokalklimatische Froststudien am westlichen Bodensee, [Local climatic frost studies on part of western Lake Constance], p. 126-130.
Franken, E.: Statistik des ersten und letzten Auftretens von Frbsten bestimmter Starkestufen in Miinster/Westfalen, [Statistics of first and last occurrence of frosts of specified severity in Monster], p. 130-131.
Gressel, W.: Eine f Ur das Alpengebiet charakteristische Zirkulation, [A circulation characteristic of the Alpine region], p. 131-133.
Doege. W. and Krebs, H.-D.: Betrachtung zum Platzwetter in Neubiberg, [Consideration of district weather in NTeubiberg], p. 133-135.
Troeger, Heinz: Die Beziehung zwiscben der Anderung der Polhbhe und meteorologischen Elementen, [The relation between changes of pole height and meteorological elements], p. 136-137.
Keil. Karl: Der Anteil Deutscblands an der Entwicklung der internationalen Zusammenarbcit auf meteorologischem Gebiet, [The part of Germany in the development of international cooperation in meteorology], p. 137-138.
Kreutz, W.: Volumanderung der Bodenoberflache in AbhBngigkeit vom Wetter, [Change of volume of the soil according to weather], p. 138-140.
Milller, Hans Gerhard: Zur WSrmebilanz der Schneedecke, [On the heat balance of the snow- cover], p. 140-143.
Faust, Heinrich: Die mitteleuropaischen Grosswetterlagen bei Existenz eines Azorentiefs, [The Central European general weather type during an Azores low], p. 143-145.
Friedrichs, H.: Die Himmelsstrahlung als Funktion des Trttbungsfaktors T und des Kurzstrah- lungsfaktors Tj; ftir einzelne Sonnenhohenstufen, [Sky radiation as a function of the turbidity factor T and of the short-wave radiation factor TR for individual sun heights], p. 145.
Meteoros, [Buenos Aires], Volume 3, Number 1, January/March 1953. Diaz, Emilio L.: El efecto dinamico de la Cordillera de Los Andes y el aislamiento de la accion
perturbadora regional y superior, [The dynamic effect of the Cordillera of the Andes and isolation of the regional and upper air perturbations], p. 7-30.
Dedebant, G.; di Maio, R. and Machado. E. A. M.: Los numeros aleatorios y su aplicaci6n a la meteorologta, [The variatc- numbers and its application to meteorology], p. 31-53.
Michajlikov, Vladimir and Juarez. Guillermo A.: Tres afios de experiencias de temple contra la sequia en trigo y en mafz, [Three ycirs' •'•xperience in the temper method against drought in wheat and corn], p. 54-80.
Ledesma, Nestor Rene: Registro fitofenologico integral, [Integral phytophenological registry], p. 81-96.
Pascale. Antonio Juan: Comportamiento fotoperi6dico de la algunos trigos Argentinos, [Photo- periodic behaviour of some Argentine wheat varieties], p. 97-112.
Revista de Gevfisica, [Madrid], Volume 11, Number 44, October/December 1952. Garmendia fraundegui, J.: Algunas aplicaciones de la teoria de torbellinos, [Some applications
of the turbulence theory], p. 328-332. Garmendia Iraundegui, J.: La teoria de torbellinos y los invariantes integrates, [The theory of
turbulence and the integral invariants], p. 333-337. Lorente. Jose M.i Frecuencia de la velocidades del viento: obtencion aproximadu de su curva,
[Frequency of wind velocity: the approximate construction of its curve], p. 339-348.
Weather, [London], Volume 8, Number I1., November 1953. Johnson. D. H.; The jet stream, Part II, p. 325-329. Riddell, L. H.: Malham Tarn revisited, p. 330-331. Stark, R. G.: November storms in Newfoundland, p. 332. Bonacina, L. C. W.: An estimation of the Great London fog of 5-8 December, 1952, p. 333-334. Meetham, A. R.: Localized pockets or one blanket? p. 335-336. Marwick, H.: Weather words in the Orkney dialect, p. 337-342. Scorer, R. S.: Pressure-fluctuation in mountain eddies, p. 343-345. Ashford, O. M.: Unusual types, p. 347-349.
World Meteorological Organization, WMO Bulletin, Volume 11, Number 4, October 1953. Van Mieghem. J.: International co-ordination of meteorological research, p. 96-101. Veranneman, N. L.: Synoptic meteorology, p. 101-107.
i
126 METEOROLOGICAL ABSTRACTS AND BIBLIOGRAPHY
First Session of Regional Association IV (North America), p. 108-109. Activities of the Technical Commissions, p. 110-111. Collaboration with other international organizations, p. 112-115. Technical assistance programme, p. 116-118. Fourth Session of Executive Committee, p. 118. Treussart, H.: French automatic weather station, p. 119-121. Gordon, A. H.: Dynamic climatology, p. 121-124. Membership of WMO, p. 124. New and notes, p. 125-127. Recent WMO publications, u. 128-120.
Zeitschrift fiir Meteorologie, [Berlin], Volume 7, Number 6, June 1953. Hinzpeter, Hans: Zum Ausscheiden Professor Dr. Falckenbergs aus dem Meteorologischen und
Hydrologischen Dienst, [Resignation of Prof. Dr. Falckenberg from the Mc'eorological and Hydrological Service], p. 161-162.
Falckenberg, G.: Ein Beitrag zu dem Problem der Eigenstrahlung der freien Atmosphare, [A contribution to the problem of radiation of the atmosphere itself], p. 162-167.
Skeib, GUnter: Ein rotierender Strahlungsumsatzmesser mit induktiver Obertragung dvr Messpannung, [A rotational radiation balance meter with inductive transfer of test voltage], p. 167-171.
Robitzsh, M.: Tropfenadiabaten, [Drop adiabats], p. 172-175. Heyer, E. and Griinewald, G.: Der Nordseeorkan vom 31. Januar bis 1. Februar 1953 und
seine Ursachen, [The hurricane in the North Sea from Jan. 31 to Feb. 1, 1953 and its causes], p. 176-183.
Voigts, Heinrich: Gang der Jahresmitteltemperaturen im Sonnenfleckenzyklus, [The cycle of the annual mean temperatures in sunspot cycle], p. 183-188.
Die Witterung in der Deutschen Demokratischen Republik, April 1953, [The weather in the German Democratic Republic, April 1953], p. 188.
V
I
PART IV. AUTHOR AND SUBJECT INDEX
In this section will be found references to the number given at the head of each abstract or entry. In Part I each entry begins with the number S.1-, and in the bibliography on General Oceanographic Meteorology (Part II) each entry begins with the number and letter 5A-. This index is divided into three parts:
Index of Authors Index of Subjects Index of Geographical Locations
INDEX OF AUTHORS
Santa Bar-
5A-144 Okeanologii,
Angstrom, Anders, S. 1-234 Abbott. C. G. 5A-124 Aerophysics Research Foundation,
bara. Calif.. SA-184 Ahmad, Kazi S., 5.1-264 Air-Sea Safety, Washington, D. C, Akademia Nauk, SSSR, Institut
5A-244 Alaka. M. A., 5.1-128 Alcaraz, Arturo, 5A-181 Aliverti, Guiseppina, 5A-163, 5A-173 Al'pert. IA. L., 5.1-113 American Geophysical Union, 5.1-249, 5A-236 American Institute of Physics, 5.1-7 American Meteorological Society, 5.1-90, 5.1-92 American Physical Society, 5.1-7 Annalen der Hydrographie und Maritimen
Meteorologie, 5A-208 Appleman, H., 5.1-227 Arakawa, H., 5.1-22 Arctic Institute of North America, 5A-243 Argentina. Servicio Meteorol6gico Nacional.
5.1-306 Arnason, G., 5.1-120 Arnaud, C.. 5.1-292 Arnold, George L., 5.'.-229 Aus dem Archiv der Deutschen Seewarte,
5A-209. 5A-238 Austin, D. C, 5.1-58 Austin, Robert R., 5.1-110 Aujeszky, Laszlo, 5.1-1 Australia. Dept. of External Affairs, Antarctic
Div., 5A-67 Australasian Antarctic Expedition, 5A-67 Ayer, H. S.. 5.1-212 Azpiroz Yoldi, Miguel, 5.1-121
Bader, Henri, 5.1-241 Badigin, Konstantin Sergeevich, 5A-79 Baier, W., 5.1-251, 5.1-252 Barbier, Daniel, 5.1-166 Barger, Gerald L., 5.1-174 Barlow, E. W., 5A-130, 5A-149, 5A-155 Barnett, Lincoln, 5.1-10 Barre. M., 5.1-2
Barrington, C. R., 5.1-303 Barteneva, O. C. 5.1-32 Bates. Charles C, 5A-165 Battle, John A., 5.1-93 Baynton, H. W., 5.1-108 Beaumont, R. T., 5.1-94 Becker, Richard, 5A-156 Beitrage zur Geophysik, 5A-210 Belgium. Service Meteorologique -'Aviation,
5.1-44 Bell, Bfla. 5.1-1 Benton. George S„ 5 1-122 Berenyi, Denes, 5.1-1 Bergeiro Hargain, Jos£"Marla, 5.1-o4 Bergen, Norway. Museum, SA-66 Bergeron, Tor, 5.1-76 Berget, Alphonse, 5A-12, 5A-20 Berliand. M. E., 5.1-123 Berlin. Universitat. Institut f Ur Meereskunde,
5A-211 Berthier, Pierre, 5.1-302 Bessemoulin, J., 5A-170 Best, A. C, 5.1-223 Bethlamy, Nedavia, 5.1-253 Bibliographia Oceanographica, 5A-237 Biel, Erwin R., 5.1-279 Bigelow, Henry Bryant, 5A-21 Bilancini, Raoul, 5.1-85 Bingham Oceanographic Laboratory, 5A-224 Blaik, Maurice, 5A-183 Blair, Richard, 5.1-95 Bleibaum, Irma, 5.1-196 Boardman, Horace Prentiss, 5.1-242 Bohnecke. Gttnther, 5.1-185 Bornstein, Richard, 5A-93 Boldyrev, N. G., 5.1-32 Bond, H. G., 5.1-135 Borchert. John R., 5.1-131. 5.1-270 Borgars, S. J., 5.1-59 Boroos, Jozsef, 5.1-265 Bossen, P., 5A-42 Bouman, M. A., 5.1-31 Bowden, F. P., 5.1-243 Bowditch. Nathaniel, 5A-250 Bradbury. Dorothy L., 5.1-145
127
I-
128 METEOROLOGICAL ABSTRACTS AND BIBLIOGRAPHY
Brier Glenn Wilson, 5.1-90 Brinton, Hugh P., 5.1-109 British Museum (Natural History), 5A-77 Brooks, Charles E. P., 5.1-273, 5A-132, 5A-174 Brooks, Charles F., 5A-21 Brooks, Charles F., 5A-126 Brooks, F. A., 5.1-3 Brown, Charles H., 5A-26 Brown, J. E.. 5A-152 Brunino, Gustavo (ed.), 5A-237 Bryn, Zeicharias, 5A-43 Buchan, Alexander, 5A-59 Buchta, J. W. {ed.), 5.1-7 BUdel. Julius (ed.), SA-92 Bugaev. V. A., 5.1-124 Bunker, Andrew F., 5A-186 Burgess, C. R., 5A-47 Burt, Wayne V., 5.1-157 Byers, Horace R., 5.1-221
Cailleux, Andre, 5.1-277 California. Univ. Scripps Institution of Ocean-
ography. 3A-108, 5A-212, 5A-213 Callendar, G. S., 5A-139 Campa, Maria, 5.1-177 Canada. Meteorological Division, 5.1-45, 5.1-
60 Canfield, N. L., 5A-199 Carapiperis, L. N., see Karapiperis, L. N. Carnahan, Robert L., 5.1-122 Carnegie Institution of Washington, Dept. of
Terrestrial Magnetism, 5A-74 Caro, D. E., 5.1-313 Carruthers, J. N.. 5A-139 Chudnovskii, A. F., 5.1-182 Chun, Karl (ed.), 5A-61 Church, P. E.. 5.1-226 Cicala. Aldo, 5.1-295 Clayton. George D., 5.1-109 Clayton. Henry Helm (comp.), 5A-106 Coast Guard Bulletin. 5A-232 Coker, Robert Erwin, 5A-39 Collins, T. Kirkwood, 5.1-117 Colman. John S., 5A-48 Columbia Univ. Lamont Geological Observa-
tory, 5A-183 Compaftia Administradora del Guano, 5A-214 Conseil Permanent International pour l'Expedi-
tion de la Mer, 5A-215, 5A-216 Contract AF 19(122)-365, 5.1-122 Contract AF 19(122)-392, 5.1-165 Contract AF 28(099)-7, 5.1-5 Contract N189s-81138. 5A-184 Contract Nonr-248(2). 5.1-184 Contract Nonr-798(00), 5A-197 Contract N6onr-266, Task Order II. NR 082 055,
5.1-61 Contract N6onr-277, 5A-162 Contract N6onr-277, Task Order II, NR-082-
021. 5A-234 Contract N6onr-27133. 5A-183 Contract N6-onr-27702 (NR-082-021). 5A-186.
5A-196 Contract W 19-122-ac-15, 5.1-117
Cook, J. Gordon, 5.1-11 Coyecque, Marcelo, 5A-16 Crabb, George A., Jr., 5.1-181 Crawford. Catl B.. 5.1-181 Criddle, Wayne D., 5.1-28 Cundiff, Stuart A., 5.1-96
Daigo. Y., 5.1-289 Dale, Robert Frederick, 5.1-285 Dannevig. Peter, 5A-43 Davies, J. L.. 5.1-178 Deacon, G. E. R., 5A-182 De Backer, Simon, 5.1-183 Dedebant, Georges, 5.1-173 Defant. Albert. 5.1-188, 5A-18, 5A-29. 5A-70,
5A-134. 5A-137 Denmark. Meteorologisk Institut. 5A-86, 5A-
87 de Sugny, J., 5A-4 Deutsche Atlantische Expedition. 1925-1927,
5A-70 Deutsche Sildpolar-Expedition, Aug. 1901-
April 1902. 5A-63 Deutscher Hydrographische Zeitschrift. 5A-217 Dhar, N. C, 5.1-307 Dietrich, Gunther, 5.1-185 , 5A-93 Dietrich, Sigismond de R., 5.1-230 Discovery Reports. 1929, 5A-72 Diubiuk, 5.1-125 Dobryshman. E. M.. 5.1-123 Dominguez Guirre, Ernesto. 5A-40 Donn, William L... 5A-51. 5A-183 Dordick, Isadore L.. 5.1-4 Dreyer, A. J., 5.1-34 Drygalski, Eric von, 5A-63 Dubentsov, V. R., 5.1-146
Ekspeditsiia SSSR na Severnyl Polius. 1937. 5A-78
Elford, C. Robert, 5A-141 Eliassen, Arnt, 5.1-74 Elliott. Robert D.. 5A-184 Elsasser, Walter M., 5.1-165 Emeleiis, K. G.. 5.1-311 Engelbrecht. S. A.. 5.1-80 Erikson, Erik, 5.1-103 Esso Air World. N. Y.. 5A-154 Eucken, Arnold, 5A-93
Fair. T. J. D.. 5.1-283 Falkland Islands and Dependencies. Meteoro-
logical Service. 5.1-46 Fedorov, Evgenit Konstantinovich (ed.), 5A-78 Ficker, Heinrich von. 5.1-12 Findlay, Alex. Geo, 5A-3 Fj«(rtoft. R.. 5.1-129 Fleagle. Robert G.. 5.1-224 Fleming, Richard H.. 5A-32 Fletcher. Robert D.. 5.1-22 Ficker, Heinrich, 5.1-12 France. Bureau Central Meteorologique, 5A-
88 France. Service Hydrographique de la Marine.
5.1-81
IV. AUTHOR AND SUBJECT INDEXES 129
Franckom, C. E. N„ >A-139, 5A-157, 5A-175, 5A-20O
Frederickson. Paul S., 5.1-191 Fried rich. —, 5A-93 Frost, R., 5.1-132 Fujita, T.. 5.1-175 Fukushima, M.. 5.1-37 Fukutomi. Takaharu, 5A-164
Galbraith. W.. 5.1-159 Gafafer, William, 5.1-109 Galle, P. H., 5A-123 Galligan, Agnes M., 5.1-225 Ganapathiraman, G. V., 5.1-151 Garmendia Iraundegui, Jose, 5.1-126 Garstka. Walter U.. 5.1-28 Gasland. John, 5A-28 Gazzola, Adriano, 5.1-147 Geigy, R., 5.1-68 Geofysiske Publikasjoner, 5A-218 Georgii, Walter, 5.1-190 Gerdel. Robert W„ 5.1-65 Germany. Meteorologisches Amt f Or Nordwest-
deutschland. 5A-91 Gherzi. E., 5A-128 Giaver, John, 5A-246 Giever, Paul M., 5.1-109 Gifford, Mary M., 5A-162 Gilmore, Marion H., 5A-143, 5A-147 Glenn, Alfred H.. 5A-16S Gold, E., 5.1-180 Gordon, Adrian Hugo, 5A-185 Grabb. George A., 5.1-181 Grabovskii, P. I., 5.1-217 Graves, G.. 5A-201 Great Britain. Naval Weather Service, 5A-202 Great Britain. Challenger Office. 5A-59 Great Britain. Hydrographic Office, 5A-98 Great Britain. Meteorological Office, 5A-23,
5A-49, 5A-95 to 5A-97, 5A-227 Green. H. S., 5.1-167 Grier, Mary Catharine, 5A-239. 5A-240 Gringorten, Irving I., 5.1-86, 5.1-90 Groen, P., 5A-52 Grunow, J., 5.1-26 Guminski, Romuald, 5.1-266 Gustafson, A. F., 5.1-207 Gutenberg, B., 5A-148
Habermehl, R.. 5.1-19 Haenni & Cie, 5.1-68 Hage. K. D., 5.1-87 Hakodate Marine Observatory. 5.1-222 Hall, Ferguson, 5.1-96 Hamburg. Deutsche Seewarte, 5A-90, 5A-208,
5A-235 Hamburg. Deutsches Hydrographisches In-
stitut, 5A-92, 5A-217, 5A-231 Hamburg. Seewetteramt, 5A-231, 5A-245 Hampton, Merle I., 5.1-24 Hanle. Wilhelm. 5.1-296 Hare. F. Kenneth. 5.1-272 Harries. H. D., 5A-133
Hawboldt. L. S., 5.1-287 Heckert, Lothar, 5.1-171 Hela, Ilmo, 5.1-293 Helland-Hansen. Bjorn. 5A-66. 5A-124 Henderson. T. J., 5.1-96 Herdman, William Abbott, 5A-14 Hess, Victor F., 5.1-309 Hesselberg, T., 5A-131 Hewson, E. W. (ed.), 5.1-5 Higuchi, Keiji. 5.1-245 Hinzpeter, Hans, 5.1-104 Hjort, Johan, 5A-66 Hdgberg, Linus, 5.1-234 Holtedahl, Olaf (ed.). 5A-73 Hommel, Karlheinz, 5.1-36 Hopkins. T. C, 5.1-184 Howell. Wallace E., 5.1-67, 5.1-9 Huddar, B. B., 5.1-307 Huff, F. A., 5.1-231 Hughes, Grover D., 5.1-179 Hulburt. Edward O., 5.1-114, 5.1-158 Huzimura, I., 5.1-37
lizuka, Hajime, 5.1-192, 5.1-205 Indian Journal of Meteorology and Geophysics,
5.1-144 Indonesia. Djawatan Meteorologi dan Geofisik,
5A-219 Indonesia (K.). Magnetisch en Meteorologisch
Observatorium te Djakarta, 5A-219 Institut Oceanographique, Monaco, 5A-220 Institution of Water Engineers, London,
Hydrological Research Group, 5.1-250 International Council for the Exploration of the
Sea, see Conseil Permanent International pour l'Exploration de la Mer
International Hydrographic Bureau, Monaco, 5A-221
International Joint Commission. Technical Advisory Board on Air pollution. U. S. Section, 5.1-109
International Symposium on Atmospheric Tur- bulence in the Boundary Layer, Massachusetts Institute of Technology, June 4-8, 1951, 5.1-5
International Union of Geodesy and Geophysics. Association of Physical Oceanography, 5A-222
Isachenko, A. G., 5.1-254 Isakov. I. S., 5A-103 Ishibashi, Masayoshi (ed.), 5A-248 Israel, Hans, 5.1-304 Israel. Rainfall Research Committee, 5.1-99 Italy. Consiglio Nazionale delle Ricerche.
Comitato Nazionale per la Gcologia, Geografia e Talassografia, 5A-237
Italy. Istituto Idrografico della R. Marina, 5A-223
Italy. Istituto Idrografico, Genoa, 5A-24 Ito, H., 5.1-244 Ito, S., 5.1-37 Ito, Y.. 5.1-155 Ivanov, I. V., 5.1-75 Ivanov, P. V., 5.1-255 Iwai, Yutaka. 5.1-239
130 METEOROLOGICAL ABSTRACTS AND BIBLIOGRAPHY
Jackinot. P.. 5.1-301 Jackson. John E., 5.1-115 Jackson, S. P., 5.1-133 Jacobs, Woodrow C, 5A-74, 5A-176 Jaeger, J. C, 5.1-170 Jalu, Raymond, 5.1-148 James, P. A. A., SA-203 Jameson, H., 5A-149. 5A-158 Japan. Science Council, UNESCO Com-
mittee. 5A-248 Japan. Central Meteorological Observatory,
Tokyo, 5A-228 Japan. Hydrographic Dept., 5A-99 Japanese National Commission for UNESCO,
5A-248 JeHey, J. V., 5.1-159 Jehn, Kenneth H., 5.1-61 Jenkins, C. F., 5.1-211 Jenkins, James Travis, 5A-13 Jens, StifelW., 5.1-236 Jeppson, L. R., 5.1-291 Johns Hopkins Univ. Chesapeake Bay In-
stitute, 5.1-184 Johns Hopkins Univ. Dept. of Civil Engineer-
ing, 5.1-122 Johnsen, Olaf, 5A—43 Johnson, Martin W., 5A-32 Johnstone, Don O., 5.1-27 Johnstone, James, 5A-17 Jones, H. Spencer, 5.1-63 Jones. W. Floyd. 5.1-93 Joseph, J.. 5A-93 Journal of Marine Research, 5A-224 Journal of Oceanography, 5A-225 Junge. Christian, 5.1-105
K—, J., 5.1-14 Kaganov, M. A.. 5.1-182 Karapiperis. Leonidas'N., 5.1-201 Karimov, M. G., 5.1-160 Karo. E. D., 5.1-313 Kato. T., 5.1-38 Kellog, William Welch, 5.1-207 Kenny. P. J., 5.1-25 Keranen, J., 5.1-169 Kerker, Milton, 5.1-24 Kerr. Raymond E., Jr., 5A-184 KHvostikov. I. A., 5.1-161 Kilpatrick, E. L.. 5.1-312 King, J. I.. 5.1-165 Kinoshita, Masatoki, 5.1 149 Kintanar, Roman, 5A-181 Kirk, T. H., 5A-149, 5A-150 Kiselev. A. N., 5.1-202 Klarke. K. B., 5A-74 Klein, Annemarie, 5.1-276 Kliushkin, E. A.. 5.1-282 Knudsen. Martin, 5A-119 Kobe, Japan. Marine Observatory, 5A-225,
5A-226 Koppen, Wladimir Peter, 5A-8 Korobkin, S. F., 5.1-215 Kosiba, Aleksander, 5.1-39 Krasovskil, V. I., 5.1-162
Krauss, Joseph, 5A-55 Kriimmel, Johann Gottfried Otto. 5A-9, 5A-6 KrUmmel, Otto, Kubo. J.. 5.1-256 Kuhlbrodt, E., 5A-29, 5A-91 Kulkarni, R. N., 5.1-111 Kumai, Motoi, S. 1-245 Kurihara, S., 5.1-298 Kuroiwa, Daisuke, 5.1-240 Kusunoki, Kou, 5A-164 Kyle. H. M. (trans.), 5A-120
Landolt, Hans H.. 5A-93, 5A-166 Landsberg, Helmut E., 5.1-102 Le Danois, Edoard, 5.1-275 LaSeur, Noel E., 5.1-122 Lauer. Wilhelm. 5.1-294 Lednev, V. A., 5A-166 Lewis. L. F.. 5.1-189 Lindholm, F., 5.1-228 Lineikin, P. S., 5A-177 Littlehales, G. W., 5A-129 Lliboutry. Louis. 5.1-246, 5.1-247 Long, Arthur R., 5.1-106 Lorch. J., 5.1-267 Lovera. G., 5A-163 Ludlum, David M. (ed.). 5.1-176 LUtgens. Rudolf. 5A-122 Lyman, John, 5A-204
McClimont, W., 5.1-213 McDonald, Willard, F., 5A-107 Machado, Emilio A. M., 5.1-173 Macky, W. A., 5.1-138 McTaggart-Cowan, P. D.. 5.1-76 Made. Alfred, 5.1-50 Magrini, Johannes (founder), 5A-237 Maksimov, S. A., 5.1-20 Malkus, Joanne Starr, 5A-186 Manig, Marianne, 5.1-69 Marine Observer. 5.1-143, 5A-206. 5A-227 Markkink, G. F., 5.1-157 Marmer, Harry Aaron, 5A-19 Martin, L. H.. 5.1-313 Martyn, D. F., 5.1-116 Mason, B. J.. 5.1-220 Massachusetts Institute of Technology, Dept.
of Meteorology, 5.1-5, 5A-230 Mauchly, John W., 5.1-297 Maud Expedition. 1918-1925. 5A-68 Maurstad, Alt", iA-101 Maury, Mathew Fontaine. 5A-1, 5A-116, 5A-19".1
Meldau. H., 5A-55 Menges, Gustav, 5.1-51 Messel. H., 5.1-167 Mielche, Hakon, 5A-84 Milan. Osservatorio de Brera, 5.1-177 Milburn, K, 5A-167 Millar, Frederick Graham. 5.1-186, 5A-168 Millman, George H., 5.1-206 Mironovitch, Vale>y, 5.1-136 Mishutin, D. A., 5.1-150 Miura, Akira, 5.1-299 Miyake, H., 5.1-88
_ J
IV. AUTHOR AND SUBJECT INDEXES 131
Moller, Fritz, SA-94 Molga, Marian, 5.1-52 Mohn, Henrik (erf.), 5A-60, 5A-62 Monaco, Institut Oceanographique, see In-
stitut Oceanographique, Monaco Monti, J. R., 5.1-237 Mosby, Hakon, 5A-73 Mook, C. P.. 5.1-90 Mossman, Robert Cockburn, 5A-64 Munitalp Foundation, Inc., 5.1-226 Murakoshi, N., 5.1-37 Murray, Sir John, 5A-10, 5A-66
Nagasaki, Japan. Marine Observatory, 5A-229 Nagel, J. F., 5.1-70 Nansen, Fridtjof, 5A-124 National Academy of Sciences, 5A-187 Neiburger. Morris, 5.1-207 Neis. B., 5A-153 Netherlands. Meteorologisch Institut, 5A—44,
5A-100 Neumann, Ger.iard, 5A-205 Newton, Charles, 5.1-139 Nolan, P. J.. 5.1-25 Norinder, Harald, 5.1-305, 5.1-310 Norske Nordhavsexpedition, 1876-1878, 5A-60 Norske Videnskaps Akademi i Oslo, 5A-62,
5A-73, 5A-218 North American Weather Consultants, Pasa-
dena, Calif., 5.1-98 Norway. Geofysiske {Commission, 5A-218 Norwegian-British-Swedish Antarctic Expedi-
tion, 5.1-49 Numata, T., 5.1-88 Nyberg, Alf, 5.1-71
Oceanographical Magazine, 5A-228 Oceanography and Meteorology, 5A-229 Oertel, Albert G., 5.1-89 Ogawara, M., 5.1-172 Ogura, Yoshimitsu. 5.1-193, 5.1-199 Ota, Iwao, 5.1-280 Ovey. C. D., 5A-159 Ozawa.T., 5.1-175
Palmen, E., 5.1-127, S.l-128, 5.1-145 Pan American Navigation Service, 5.1-79 Papers in Physical Oceanography and Meteor-
ology, 5A-230 Paredes y Castro, Jose Garcia de, 5A-15 Parshin, V.N.. 5.1-248 Pascale, Antonio J., 5.1-53 Paterson, Sten Sture, 5.1-268 Pax, Fprdinand. 5A-188 Pedreschi, Luigi. 5.1-269 Penndorf, Rudolf. 5.1-6 Petersen, Johannes, 5A-121 Peterson, Sten Sture, 5.1-268 Peterssen. Sverre. 5.1-197, 5A-28 Petterson, Hans, 5A-82, 5A-125 Pet'ergson, Otto. 5A-118, 5A-120 Pettit, Helen B., 5.1-163, 5.1-164 Pfeiffer, John, 5.1-77 Physical Review Index, 1921-1950, 5.1-7
Piaskovskaia-FeBenkova, E. V., 5.1-300 Pinegin, N. I., 5.1-32 Plantamour, E., 5.1—40 Platzman, George W., 5.1-129 Poland. Panstwowy Instytut Hydrologiczno-
Meteorologiczny, 5.1-232 Polli, Silvio, 5.1-271 Popular Mechanics Magazine, 5.1-168 Post, E. J., 5.1-314 Prager, Erwin, 5A-169 Priestley. C. H. B., 5A-178 Project AROWA (TED-UNL-MA-501), 5A-193 Proudman, Joseph, 5A-58
Queney. P., 5A-170
Rabotnov, T. A., 5 1-258 Ramakrishnan, K. P., 5.1-151 Raman, Sir C. V.. 5.1-23 Ramathan. K. R., 5.J-111 Ramdas, L. A., 5.1-8 Ramenskil, L. G., 5.1-258 Reclus, Elisee, 5A-2 Records of Oceanographic Works in Japan,
5A-248 Reece, Alan, 5A-83 Reichel. Eberhard, 5.1-214 Reichelderfer, Francis W., 5.1-13, 5.1-16 Rhodes, Forrest L., 5.1-28, 5.1-29 Richard. Jules, 5A-7 Riehl, Herbert. 5.1-208, 5A-141 Roach, F. E.. 5.1-163. 5.1-164 Roberts. M. H.. 5.1-281 Robertson, G. W.. 5.1-259 Robin. G. de Q., 5A-83 Robinson. G. D., 5.1-194 Rodewald, Martin, 5.1-140, 5.1-274. SA-200 Roll. U.. 5A-29 Rosenan, Naftali. 5.1-99 Ross, Robert B., 5.1-179 Rouch, Jules Alfred. 5A-30. 5A-65. 5A-189 Rudovits, L. F„ 5A-166
St. John, Francis, 5.1-141 Salakhov, F. S., 5.1-215 Salov. M. S., 5.1-248 Samatan, Enrique L., 5.1-43 San Diego County Weather Corporation,
5.1-93 Sanders, A. A. J.. 5.1-209 Sanders, R. A., 5.1-134 Sanderson. Earl E.. 5.1-27 Santa Ana River Weather Corporation, 5.1-93 Sanzes, Vicloiiano, 5A 5 Sars, Georg Ossian (<rf.), 5A-60 Sayers, N. D., 5.1-311 Schaeffer, Vincent J., 5.1-101, 5.1-137, 5.1-226 Schimitschek, Erwin, 5.1-286 Schmidt, Johannes, 5A-69 Schmidt. R. D., 5.1-235 Schmitt. W.. 5A-190 Schneider, Max, 5.1-54 Schott, Gerhard. 5A-25, 5A-34. 5A-61. 5A-135
~J
132 M ETEOROLOCICAI. ABSTRACTS AND BIBLIOGRAPHY
Schrodter, Harald, S.1-288 Schumacher, A., 5A-22, 5A-249 Schwarzbach, Martin. 5.1-278 Schweigger, Erwin, 5A-140 Science News Letter, 5.1-137 Scorer, R. S., 5.1-91, 5.1-209 Scott, Robert H., 5A-117 Scottish National Antarctic Expedition, 1902-
1904. 5A-64 Seabrook, John M., 5.1-260 Sears Foundation for Marine Research, 5A-224 Sedov. L. I., 5.1-195 Seewart D., 5A-231 Seilkopf, Heinrich, 5A-29 Seiwell. H. R., 5A-145 Senter, William O., 5.1-261 Sewel, R. B. Seymour, 5A-191, 5A-247 Sherman, Leon, 5.1-207 Shida, I., 5.1-37 Shinohara, Takeji, 5.1-152 Shizaki. D., 5.1-37 Shliamin, B. A., 5A-192 SHokal'skil, IUHI Mikhallovich. 5A-11. 5A-251 SHtokman, V. B., 5.1-203 Shuleikin, Vasilil V.. 5A-45 Shutara, E., 5.1-37 Siksna, Reinhards. 5.1-305, 5.1-310 Sinford, Leon B.. 5.1-117 Singer. S. Fred. 5.1-56 SitgTeaves, Rosedith, 5.1-109 Slater. A. E.. 5.1-209 Smith, Charles Pennypacker, 5.1-17 Smith, H. T., 5A-127 Smith. James L.. 5.1-181 Snellius-Expedition, 1929-1930. 5A-75 Snezhinskil, V. A., 5A-53 Somma, Alberto, 5A-46 Sorge. E., 5.1-241 Soule, F. M., 5A-76 Spiess, H. C, 5A-238 Spinnagr, Finn, 5A-28 Squire. Charles F., 5.1-301 Starr, Victor, 5.1-129 Steele. Thornton A., 5.1-18 Stene, Arthur (ed.), 5A-43 Stern, Melvin E., 5A-186 Stewart. John Q., 5A-36 Stidd, C. K., 5.1-238 Stommel, Henry, 5A-37, 5A-58 Stout, G. E., 5.1-231 Suanzes, Victoriano, 5A-5 Sugawara, Y., 5.1-153 Supan, Alexander, 5A-119 Suzuki, Seitaro, 5.1-187 Suzuki, Y., 5.1-289 Sverdrup, Harald Ulrik, 5A-31. 5A-32, 5A-68,
5A-76, 5A-179. 5A-213 Swinn, R., 5.1-210 Switzerland. Meteorologische Zentralanstalt,
5.1-47, 5.1-233
Tabata, Tadasi, 5A-164 Tannehill. Ivan R., 5A-56, 5A-160 Tasson, A., 5A-146
Teichert. F. 5.1-107 Teissenrenc de Bort, L^n, 5A-88 Tenerife. Centro Meteorologico, 5.1-48 Tepper, Morris, 5A-113 Terada, Kazuhiko, 5.1-100 Terebelski, Jan, 5.1-154 Terry, Antonia, 5A-5 Teweles, Sidney, Jr., 5.1-208 Texas. University. Electrical Engineering
Laboratory, 5.1-61 Thorn, Herbert C. S.. 5.1-262 Thomas. M. K., 5.1-42, 5.1-43 Thomsen. Helge, 5A-87 Thomson, Andrew, 5A-74, 5A-161 Thorade. Hermann, 5A-74, 5A-29, 5A-71 Thornthwaite, Charles W., 5.1-216 Tilakan. A. R. B.. 5.1-73 Todd, Clement. 5.1-93 Tousey, R., 5.1-57 Trans World Airlines, Inc. Meteorology Dept.,
5.1-154 Tremaine, Marie (ed.), 5A-243 Troll, Karl, 5.1-15. 5.1-200 TSatsenkin, P. A., 5.1-258 Tully, John P., 5A-207
Ulanov, Kh.K., 5A-136 U.S.S.R. Gidrograficheskoe Upravlenie. Gidro-
meteorotogicheskil Sektor, 5A-102 U. S. Air Force. Cambridge Research Center,
5.1-5 U. S. Air Weather Service, 5.1-82 U. S. Bureau of Aeronautics (Navy), 5A-193.
5A-241 U. S. Bureau of Aeronautics (Navy). Project
AROWA. 5.1-78. 5A-184 U. S. Coast Guard. 5A-232 U. S. Dept. of Defense. 5A-243 U. S. Dept. of the Interior, 5.1-101 U. S. Hydrographic Office, 5A-104, 5A-109,
5A-111, 5A-115, SA-194. 5A-242 U. S. Maritime Service Institute, 5A-33 U. S. Navy. Fleet Weather Central, 5.1-78 U. S. Navy. Naval Air Technical Training
Command, 5A-35 U. S. Navy. Task Force 68. 5A-81 U. S. Office of Naval Operations, 5A-81 U. S. Technical Conference on Air Pollution,
Washington, 1950, 5.1-9 U. S. Weather Bureau, 5.1-72, 5.1-83, 5.1-84,
5.1-142. 5.1-212, 5A-50, 5A-57. 5A-105, SA-107, 5A-110, 5A-112, AA-114, 5A-i60
Utah. University. Dept. of Physics. 5.1-117. S.1-165
Uttinger, Heinrkh. 5.1-233
Van Mieghem, Jacques, 5.1-130 van Riel, P. M., 5A-75 van Sabben, D., 5.1-118 Vassy, A.. 5.1-112, 5.1-163 Vassy, E., 5.1-112, 5.1-163 Vat ova. A., 5A-54 Vaughan, Thomas Wayland, 5A-27 Venkiteshwaran, S. P., 5.1-73, 5.1-307 Vercelli, Francesco, SA-54
I
IV. AUTHOR AND SUBJECT INDEXES 133
Vere-Jones. N. W., 5.1-55 Viaut, Andre, 5.1-148. 5.1-163 Villeneuve. G. Oscar. 5.1-30, 5.1-33 Visser, Simon Willem. 5.1-198, 5A-75 Vitale, Bruno, 5.1-308 von Arx, William S., 5.1-204 Vonnegut, Bernard, 5.1-62 von Poletika, W., 5.1-290 Voyage of H.M.S. Challenger during the years
1878-1876. 5A-59 Vuorela, Lauri, A., 5A-80
Warnich, C. C. 5.1-66 Washburn, Harold W.. 5.1-110 Watanabe, Tacashi, 5.1-155 Watson, Sir James Scott. 5.1-21 Wells. H. W., 5.1-119 Westwater. F. L., 5A-142 Wexler. Harry. 5A-113 Whaley, H. H, 5.1-184 Whyte. Robert Orr. 5.1-284 Wilhelmshaven Marineobservatorium, 'A-89 Wilkins, J. W., 5.1-303 Williams. D. R., 5.1-163, 5.1-164 Wilson. W. T., 5.1-29 Wimpenny. R. S., SA-195
Wissenschaftliche Ergebnisse der Deutschen Tiefsee-Expedition, 1898-1899, Jena, 5A-61
Woodcock, Alfred H., 5A-151, 5A-162, 5A-171, 5A-196, 5A-197
Woods Hole Oceanographic Institution, 5A-162, 5A-186, 5A-196, 5A-197, 5A-230, 5A-233, 5A-234
World Meteorological Organization, 5.1-35 Worthington, L. V., 5A-85 Wright, John K.. 5.1-263 Wright, H. L., 5A-130 Wiist. Georg, 5A-29 Wundt, Walter. 5A-172 Wylie. R. G.. 5.1-218 Wyman, Jeffries, 5A-151
Yamazaki. H.. 5.1-172 Ylanan, Carlos W., 5A-198 Yosida. Zyungo. 5.1-239. 5.1-240
Zee, P. van der, 5A-42 Zenker. H., 5.1-219 Zenkevich. L. A., 5A-180 Zubian, G. D., 5.1-156 Zubow, N. N., 5A-38. 5A-41, 5A-79 Zweng, Allan C, 5.1-79 Zweng, Charles Alfonso, 5.1-79
INDEX OF SUBJECT HEADINGS
Absolute vorticity changes, 5.1-130 Acoustical propagation, 5.1-313, 5.1-314 Aeronautical meteorology, 5.1-79, 5.1-211,
5A-35 Aerosol content of atmosphere, 5.1-105 Aerosol measurement, 5.1-24 Agricultural climatology, 5.1-3, 5.1-258, 5.1-
259, 5.1-266, 5.1-288. 5.1-289, 5.1-291 Agricultural meteorology, 5.1-1, 5.1-19 to 5.1-
257, 5.1-266 Agro-climatic regions, 5.1-283 Air-borne thermometers, 5 1-58 Aircraft accidents, 5.1-191 Air flow over islands, 5A-186 Air mass climatology, 5.1-131 Air mass modification, 5A-169 Air mass movements, 5.1-155 Air mass transformation, 5.1-146 Air masses, 5.1-123 Air sampling and analysis, 5.1-110 Air-sea temperature variations, 5A-189 Airways climatic data, 5.1-44 Airways forecasting, 5.1-79 '•Albatross" Expedition, 1947-1948, 5A-82 Albedo of sea surfaces, 5.1-157 Altitudinal influences, 5.1-283 American Geophysical Union, Committee on
Snow, 5.1-28 American Meteorological Society, 5.1-14 Anemoscopic rain gages, 5.1-64 Angular momentum flux, 5.1-127, 5.1-128, 5A-
178 Animal phenology, 5.1-51
Annual meteorological reports, 5.1-46, 5.1-47 Annual temperature range, 5.1-293 Antarctic bibliographies, 5A-241 Antarctic expeditions, 5.1-49, 5A-64, 5A-65,
5A-83, 5A-246 Antarctic fronts, 5.1-148 Anticyclone movement, 5.1-155 Anticyclones, 5A-156 Applied climatology, 5.1-260, 5.1-251 Arctic bibliographies, 5A-243 Arctic expeditions, 5.1-168, 5A-62, 5A-68,
5A-79 Arctic exploration, 5A-76, 5A-78, 5A-85 Areal precipitation distribution, 5.1-27 Arid zone, climatology, 5.1-294 Artificial auroras, 5.1-311 Artificial precipitation, 5.1-100 Assmann's aspiration psychrometer, 5.1-171 Astronomical sites, 5.1-63 Atlases, 5A-101 Atmospheric circulation, 5.1-133, 5.1-148, 5A-
122, 5A-130, 5A-178 Atmospheric composition, 5.1-102 Atmospheric evolution, 5.1-102 Atmospheric models, 5.1-120 Atmospheric optics, 5.1-6, 5.1-300 Atmospheric pollution, 5.1-9, 5.1-110, 5.1-299 Atmospheric pollution control, 5.1-9 Atmospheric pollution data, 5.1-109 Atmospheric pollution studies, 5.1-108, 5.1-109 Atmospheric potential gradient data, 5.1-306 Atmospheric potential gradient measurement.
5.1-307
V-
134 METEOROLOGICAL ABSTRACTS AND BIBLIOGRAPHY
Atmospheric structure, 5.1-10, 5.1-165 Atmospheric tides, 5.1-188 Atmospheric turbulence, 5.1-5 Atomic explosion effects, 5.1-13 Auroras, 5.1-116 Auroral photographs, 5.1-10 Auroral radiations, 5.1-311 Australasian Antarctic Expedition, 1911-1914,
5A-67 Australian National Antarctic Research Expedi-
tions, 5A-67
Balloons, 5.1-55 Balneology, 5.1-219 Bibliographies, 5.1-7, 5.1-23, 5.1-103, 5.1-254.
5.1-314, 5A-25. 5A-32, 5A-41, 5A-71. SA-98, SA-235. 5A-236, 5A-238
Bioclimatic research, 5.1-69 Biography, 5.1-23. 5A-14. 5A-249 Bird soaring, 5A-168 Blizzard electrical charges, 5.1-2 Blocking action. 5.1-134 Blue sun, 5.1-6 Brunt's formula, 5.1-170
Cacao production, 5.1-237 California stratus, 5.1-221 Canadian weather service, 5.1-76 Capillary collectors, 5.1-62 Carnegie Expedition, 1928-1929, 5A-74 Ceiling and visibility data, 5.1-46 Ceiling height estimates, 5.1-229 Challenger Expedition, 1872-1876. 5A-59 Chemical analysis of aerosols, 5.1-105 Chloride content of air, 5.1-103 Circulation patterns, 5.1-131. 5.1-187 Citrus fruits, 5.1-291 Citrus mites, 5.1-291 Climagrams, 5.1-229 Climate of Canada, 5.1-259 Climate of Canary Islands, 5.1-268 Climate of East Pakistan, 5.1-264 Climate of Eastern U. S.. 5.1-270 Climate of Europe, 5A-123, 5A-125 Climate of Hungary, 5.1-1 Climate of Korea. 5.1-265 Climate of Midwest, 5.1-270 Climate of Minorca, 5.1-269 Climate of Newfoundland, 5.1-272 Climate of Peru. 5A-214 Climate of Scandinavia, 5A-118 Climate of Sicily, 5.1-295 Climate of Trieste, 5.1-271 Climate of Western Europe, 5A-132 Climatic analogs, 5.1-265 Clinv.tic analysis, 5.1-262, 5.1-266 Climatic changes. 5.1-273 to 5.1-275, SA-159,
5A-174 Climatic charts, 5A-113 Climatic classifications, 5.1-266, 5.1-294 Climatic data, 5.1-45. 5.1-266. 5.1-267, 5.1-271,
5.1-272, 5A-9S. 5A-106 Climatic influences, 5.1-287
Climatic regions, 5.1-264 Climatology, 5.1-262, 5A-243 Cloud formations. 5.1-209, 5.1-210 Cloud frequencies. 5.1-229 Cloud height, 5.1-225 Cloud index, 5A-186 Cloud moving picture photography, 5.1-226 Cloud observations, 5.1-225 Cloud photography, 5A-186 Cloud seeding. 5.1-92, 5.1-97. 5.1-100 Cloud seeding effectiveness. 5.1-96 to 5.1-99 Cloud seeding evaluation, 5.1-94, 5.1-99 Cloud seeding experiments, 5.1-93 Cloud seeding with silver iodide, 5.1-101 Cloud structure, 5.1-137 Cloudiness, 5.1-228 Code 8pecifi"~ations, 5.1-83, 5.1-84 Cold currents. 5A-119 Cold fronts, 5.1-149, 5.1-152 Cold lows aloft, 5.1-154 Comfort climate, 5.1-4 Commemoratives, 5.1-23 Compendiums, 5.1-9 Condensation nuclei, 5.1-217, 5.1-218. 5A-162,
5A-163, 5A-196 Condensation nuclei spectrum, 5.1-105 Condensation trails, 5.1-227 Conferences, 5.1-9, 5.1-123 Constants, 5.1-35 Continentality, 5.1-293 Contrast threshold. 5.1-31. 5.1-32 Convection above heated ground, 5.1-8 Convection over hot plates, 5.1-8 Convection over the sea, 5A-151, 5A-16S Convective clouds, 5A-186 Cooperative snow investigations, 5.1-29 Corn phenology, 5.1-285 Cosmic radiation, 5.1-159. 5.1-167. 5.1-296 Cosmic ray measurement, 5.1-168 Cotton, 5.1-215 Crop yield, 5.1-284. 5.1-285 Cumulative indexes, 5.1-7 Cyclogenesis. 5.1-148, 5.1-208 Cyclone movement, 5.1-193
Damage to cargoes, 5.1-213 Damming ocean straits, 5A-172 "Danna" Expeditions, 1920-1922, 5A-69 Definitions, 5.1-35 de Martoime index, 5.1-294 Desert climates. 5.1-282 Desert research. 5.1-282 Deutsche Atlantische Expedition (See: "Meteor"
Expedition) Deutsche SUd-Polar Expedition, 1901-1902,
5A-63 Dew point variations, 5.1-212 Diffusion through rubber tubing, 5.1-25 "Discovery II" Expeditions, 1925-1950, 5A-72 Distant recording equipment, 5.1-70 Diumal atmospheric electricity variations, 5.1-
304 Diurnal cloud variations, 5.1-63 Diurnal temperature variations, 5.1-170
=4
IV. AUTHOR AND SUBJECT INDEXES 135
Diurnal wind variations, 5.1-196 Dynamic climatology, 5.1-295 Dynamic meteorology, 5.1-124 Dynamic oceanography, 5A-18, 5A-58 Dynamic stability, 5.1-129 Dynamics of the atmosphere, 5.1-125, 5A-156
Easterly jet stream, 5.1-135 Ecology, 5.1-289 Electrical phenomena, 5.1-304 Electromagnetic spectrum, 5.1-296 Electromagnetic wave dispersion, 5.1-117 Electromagnetic wave propagation, 5.1-113 Electronic computers. 5.1-85 Energy equations, 5.1-199 Energy exchange sea-atmosphere, 5A-38, 5A-41,
5A-169, 5A-173, 5A-176, 5A-178 Energy transformation, 5.1-123 Engineering meteorology, 5.1-236 Environmental influences on crops, 5.1-284 Equatorial meteorology, 5A-l 33 Ertel's vorticity theorem, 5.1-126 Etesian winds, 5.1-201 European monsoons, 5.1-198 Evaporation from seas, 5A-179 Evaporation measurement, 5A-179 Evapotranspiration, 5.1-216 Evapotranspiration effects, 5.1-214 Exhaust trails, 5.1-227 Expedition Antarctique Francaise. 2nd, 1908-
1910, 5A-6S Expeditionary climatic data, 5A-59, 5A-61 to
5A-68, 5A-70, 5A-72. 5A-73 to 5A-75 Experimental soil science, 5.1-202 Extinction coefficient, 5.1-6 Extreme lapse rates, 5.1-8
Finnish Atlantic Expedition, 1939, 5A-80, 5A-81
Fire weather forecasting, 5.1-89 Fishing industry, 5A-139 Fletcher, Robert D., 5.1-22 Fluorescein, 5.1-107 Fog, 5.1-180 Fog drip, 5.1-221 Fog forecasting, 5.1-&6 Fog formation, 5.1-224 Forecast accuracy, 5.1-13 Forecast aids, 5.1-78 Forecast dissemination, 5.1-80 Forecast errors, 5.1-87 Forecast improvement, 5.1-76 Forecast services, 5.1-76 Forecast verification, 5.1-90 Forecasting manuals, 5A-184 Forecasting at sea, 5.1-15 Forecasting techniques, 5.1-85 Forest entomology, 5.1-286 Forestry. 5.1-287 Fourier analysis, 5.1-125 Fram II Expedition, 1898-1902, 5A-62 French Antarctic Expedition 1951, 5.1-2 Frontal analysis, 5.1-87
Frontal frequencies, 5.1-153 Frontal thunderstorms, 5.1-147 Frontal type precipitation, 5.1-150 Frontal zones, 5.1-156 Frost. 5.1-180
"Galathea" Expedition, 1950-1952. 5A-84 "Gauss" Expedition (See: Deutsche Sfld-Polar
Expedition) Geographical theory, 5.1-254 Geography, 5A-135 Geophysical tables, 5A-93 Geophysics, 5.1-218, 5A-210 Geostrophic winds, 5.1-207 Glacier formation, 5.1-247 Glacier nourishment, 5.1-241 Glaciers, 5.1-246, 5A-54 Gliding, 5.1-210 Global precipitation, 5.1-94 Glossaries, 5A-24, 5A-40, 5A-43, 5A-194 Gradient winds, 5.1-207 Grain crops, 5.1-289 Greenhouse climates, 5.1-280 Greenwich Observatory, England, 5.1-63 Growing season, 5.1-52, 5.1-259 Guano industry, 5A-214 Gulf Stream variations, 5A-123, 5A-139 Gust data, 5.1-42 Gust velocities, 5.1-42
Handbooks, 5A-55 Harmonic analysis, 5.1-41 Haute Provence Observatory, France, 5.1-163,
5.1-166 Heat balance, 5.1-259 Heat conductivity coefficient, 5.1-182 Heat conductivity of soil, 5.1-182 Heat exchange sea-atmosphere, 5A-22, 5A-120 Helium, 5.1-121 History of agricultural meteorology, 5.1-19 History of climatology, 5.1-263 History of meteorological stations, 5.1-36 History of meteorology, 5A-117, 5A-127, 5A-199 Hoar frost formation, 5.1-220 Humidity frequencies, 5.1-267 Humidity variations, 5A-185 Hurricane forecasting, 5A-183 Hurricane tracking, 5A-143, 5A-148 Hurricanes, 5A-171 Hydrogen generators, 5.1-55 Hydrography, 5A-45, 5A-95, 5A-208, 5A-221 Hydrologic forecasting, 5.1-242 Hydrologic measurements, 5.1-250 Hydrometeorological abstracts, 5.1-249 Hydrometeorological services, 5A-192 Hydrometeorology, 5.1-236, 5.1-249 Hygrothermographs, 5.1-68, 5.1-69
Ice, 5A-54, 5A-194 Ice ages, 5A-159 Ice drift. 5A-79 Ice patrol service, 5A-55 Icebergs, 5A-201 Icelandic Low, 5A-l 21
\r
136 METEOROLOGICAL ABSTRACTS AND BIBLIOGRAPHY
Icing meters, 5.1-67 Indoor temperatures. 5.1-280 Industrial meteorology. 5.1-16 to 5.1-18, 5.1-
244, 5A-165 Industrial oceanography, 5A-165 Inertia oscillations, 5A-137 Infrared radiation, 5.1-165 Insect control, 5.1-286 Insect pests, 5.1-291 Insolation. 5.1-291 Instructions for observers, 5.1-30, 5A-49, 5A-
160 Instrument comparisons, 5.1-67, 5.1-71, 5.1-72 Instrument manuals, 5.1-60 International Council for the Exploration of the
Sea. 5A-195 International Ice Patrol, 5A-201, 5A-232 I.M.O. Marine Code, 1949. 5A-42, 5A-51. 5A-55 I.M.O. Synoptic Code. 1949, 5.1-84 International meteorological codes, 1949, 5.1-82,
5.1-83. 5.1-84 International symposia, 5.1-5 Iodine content of air, 5.1-103 Ion density, 5.1-305, 5.1-310 Ion equilibrium, 5.1-308 Ion recombination theory, 5.1-308 Ionization data, 5.1-306 Ionospheric disturbances, 5.1-118 Ionospheric reflection, 5.1-312 Ionospheric research, 5.1-115 Ionospheric tides, 5.1-188 Ionospheric structure, 5.1-113 Ionospheric variations, 5.1-116, 5.1-119 Ionospheric winds, 5.1-206 Irrigation. 5.1-215. 5.1-216 Isohyetical charts, 5.1-233 Isothermal charts, 5.1-169, 5.1-186
Jet aircraft, 5.1-227 Jet stream, 5.1-132, 5.1-136. 5.1-145 Jet stream analysis, 5.1-208 Jet stream cloud formations, 5.1-137. 5.1-226 John Murray Expedition, 1933-1934, 5A-77
Kudriavaia, K. I., 5.1-75
Laboratory experiments, 5.1-107 Laboratory manuals, 5A-33 Lake temperatures, 5.1-186 Lakes and climate, S. 1-134 Land reclamation, 5A-172 Lapse rates, 5.1-108 Large scale eddies, 5.1-122 Lee wave forecasting, 5.1-911 Lee waves. 5.1-190. 5.1-303 Light of the night sky. 5.1-158, 5.1-159, 5.1-163,
5.1-164. 5.1-166 Line squalls. 5.1-191 Local winds, 5.1-200 Long period records, 5.1-36, 5.1-175, 5.1-177,
5.1-271 Long range forecasting, 5.1-74, 5A-21, 5A-123,
SA-126, SA-170 Long wave propagation, 5.1-206
"Mabahiss" Expedition {See: John Murray Expedition)
Magnetic disturbances, 5.1-116, 5.1-118 Magnetic observatories, 5.1-306 Manuals, 5.1-83, 5.1-84, 5A-160 Marine atlases, 5.1-185, 5A-88, 5A-92. 5A-97,
5A-103, 5A-107, 5A-108, 5A-111 Marine climatic charts, 5A-89, 5A-91, 5A-95,
5A-99. 5A-100. 5A-104, 5A-105. 5A-107. 5A-109 to 5A-111. 5A-114, 5A-115. 5A-123
Marine climatic data, 5A-106, 5A-U4 Marine climatology, 5A-35, 5A-158 Marine forecasting, 5.1-75 Marine influences. 5.1-275, 5.1-292, 5A-118.
5A-120. 5A-125, 5A-126, 5A-129, 5A-I32. 5A-139, 5A-140, 5A-155. 5A-161. 5A-169. 5A-170, 5A-175. SA-176
Marine manuals, 5A-8, 5A-23, 5A-24. 5A-35, 5A-44, 5A-19, 5A-S0, 5A-250
Marine meteorological charts, 5A-90, 5A-96, 5A-105, SA-110
Marine meteorological code, 1949, 5.1-81 (See International Meteorological Codes)
Marine meteorological data, 5A-63, 5A-133 Marine meteorological observations, 5.1-81,
5A-81. 5A-157 Marine meteorology, 5A-1 to -251 Marine navigation, 5A-43. 5A-250 Marine pilot charts, 5A-98, 5A-109, 5A-115 Marine weather services, 5A-57 Maritime Conference, Brussels, 1853, 5A-116,
5A-199, 5A-249 Martin Viking rockets, 5.1-115 "Maud" Expedition, 1918-1925. 5A-68 Maudheim Expedition. 1918-1925. 5A-49. 5A-
83, 5A-246 Maury. Matthew Fontaine, 5A-249 Mean pressure charts, 5.1-133 Mechanics of the atmosphere, 5.1-126 Medical climatology, 5.1-219 Merchant marine, 5A-155, 5A-157 Meridional cross sections, 5.1-136 Meridional momentum flux, 5.1-127 "Meteor" Expedition, 1925-1927, 5A-70, 5A-71 Meteorological abstracts. 5.1-249 Meteorological research, 5A-234 Meteorological service development, 5.1-14 Meteorological services, 5.1-16, 5.1-47 Meteorology. 5.1-1, 5A-2, 5A-10, 5A-218, 5A-
229. 5A-?30 "Michael Sars" North Atlantic Deep-sea Expedi-
tion, 1910, SA-66 Microclimatic amelioration, 5.1-279 Microclimatology, 5.1-279, 5.1-281, 5A-136 Micrometeorological wind profiles, 5.1-205 Micrometeorology, 5.1-3, 5A-136 Microseismic storm detection, 5A-143, 5A-i4",
5A-148 Microseismic storm tracking, 5A-143, 5A-147,
5A-148. 5A-181. 5A-183, 5A-198 Microseisms. 5A-153 Mild winters, 5.1-176 Military climatology, 5.1-261 Military oceanography, ^A-145
IV. AUTHOR AND SUBJECT INDEXES 137
Minimum temperatures, 5.1-179 Mobile weather station!., 5.1-226 Moisture damage, 5.1-.';13 Monsoon circulation, 5.1-198 Monsoon circulation theory, 5.1-197 Monthly climatic data, 5.1-45, 5A-48 Monthly climatic summaries, 5.1--48, 5.1-45,
5.1-47 Monthly data bulletins. 5.1-44, 5.1-45 Mountain meteorology, 5.1-211 Mountain observations, 5.1-26, 5.1-37
Nacreous clouds, 5.1-303 Nautilus Expedition 1931, 5A-76 Nieve penitente. 5.1-246, 5.1-247 Night sky brightness height, 5.1-160 Night sky cloudiness recorders, 5.1-63 Night sky spectrum, 5.1-160, 5.1-162 Nitrogen content of precipitation, 5.1-234 Norsk Nordhavsexpedition (See: "V0ringen"
Expedition) Norwegian-Antarctic Expeditions, 1927-1928,
5A-73 Norwegian Arctic Expedition, 2nd (See: "Fram"
Expedition, 1898-1902) Norwegian-British-Swedish Antarctic Expedi-
tions (See,: Maudheim Expedition) Norwegian North Polar Expedition (See:
"Maud" Expedition) Nuclei count, 5.1-25, 5.1-219 Numerical forecasting, 5.1-120
Objective forecasting, 5.1-86, 5.1-89, 5A-141 Observation techniques, 5.1-248 Observational data. 5.1-39, 5.1-45, 5.1-47,
5.1-48 Observers manuals, 5.1-33 Ocean-atmosphere interaction, 5.1-203, 5A-178,
5A-205 Ocean-atmosphere stress, 5A-149 Ocean climates, 5.1-293, 5A-25, 5A-29, 5A-34 Ocean current charts. 5A-155 Ocean currents, 5.1-203, 5A-11, 5A-17, 5A-20,
SA-36, 5A-48. 5A-129, 5A-137, 5A-177, 5A- 251
Ocean waves, 5A-36, 5A—48 Ocean weather observation, 5A-149 Oceanic circulation, 5A-85, 5A-170 Oceanic circulation models, 5.1-204 Oceanographic bibliographies, 5A-216, 5A-237.
5A-239 to 5A-241, 5A 243 Oceanographic data, 5A-61, 5A-66, 5A-73,
5A-75. 5A-85, 5A-93, 5A-215 Oceanographic expeditions, 5A-60, 5A-69. 5A-
82, 5A-84. 5A-191. 5A-247 Oceanographic institutes, 5A-27, 5A-213 Oceanographic instruments, 5A-53 Oceanographic observations, 5A-53 Oceanographic research, 5A-166, 5A-180, 5A-
182, 5A-187, 5A-188, 5A-191. 5A-195. 5A- 204. 5A-247
Oceanographic research laboratories, 5A-180 Oceanographic theory, 5A-177 Oceanography, 5A-1 to 5A-251
Oceans. 5A-29. 5A-59, 5A-96, 5A-97, 5A-100, 5A-104, 54.-119, 5A-131. 5A-135. 5A-174
Off «>ore oil industry. 5A-165, 5A-192 Operations Highjump, 5A-81 Origin of atmosphere, 5.1-10, 5.1-102 Orographic effects. 5.1-149, 5.1-187 Orographic turbulence, 5.1-211 Oxygen spectra, 5.1-302 Ozone, 5.1-106 Ozone data, 5.1-104 Ozone distribution, 5.1-111 Ozone layer, 5.1-158 Ozone measurement techniques, 5.1-107 Ozone spectroscopy, 5.1-112 Ozone variations, 5.1-106 Ozonosphere temperature measurement, 5.1-112
Paleoclimates. 5.1-277, 5.1-278 Papanin Expedition (See: "Severnyl Polius"
Expedition) Periodicals, 5A-208. 5A-209 to 5A-221, 5A-223
to 5A-29, 5A-231, 5A-232, 5A-244, 5A-245, 5A-248
Petroleum bearing rocks, 5.1-278 Phenological charts, 5.1-53 Phenological data, 5.1-52, 5.1-54 Phenology. 5.1-50 Photoluminescence, 5.1-161 Photometry. 5.1-166 Physical oceanography, 5A-251 Physics of the atmosphere, 5.1-7 Pilar Observatory, C6rdoba, Argentina, 5.1-306 Plant diseases, 5.1-287, 5.1-288 Plant ecology, 5.1-1 Plateau circulation schemes, 5.1-133 Polar fronts, 5.1-145 Polar outbreaks, 5A-190 Polarimeters, 5.1-24 Popular meteorology, 5.1-10, 5.1-77 Popular science books. 5.1-11, 5.1-12 Potential gradient measurement, 5.1-307 "Pourquoi-Pas" Expedition (See: Expedition
Antarctique Francaise, 2nd) Precipitation, 5.1-200, 5.1-297 Precipitation amount, 5A-94 Precipitation analysis, 5.1-234 Precipitation at sea, 5A-94, 5A-119 Precipitation charts, 5.1-276 Precipitation composition, 5.1-103 Precipitation data, 5.1-232. 5.1-233, 5.1-235,
5.1-236 Precipitation distribution, 5.1-97, 5.1-235, 5.1-
269 Precipitation effects, 5.1-289 Precipitation measurement, 5.1-26 Precipitation probability, 5.1-174 Precipitation variations, 5.1-230, 5A-94 Pressure at sea, 5A-121 Pressure distribution, 5A-112 Pressure heidu, 5.1-124 Pressure patterns, 5.1-187 Pressure variations, 5.1-189 Progress in meterorology. 5.1-14, 5.1-15 Progress in oceanography, 5A-166
*-
138 METEOROLOGICAL ABSTRACTS AND BIBLIOGRAPHY
Project Skijump, 5A-85 Public relations, 5.1-22 Public utilities forecasting, 5.1-17, 5.1-244 Punched card collections, 5A-204 Punched card methods, 5.1-74
Quaternary climates, 5.1-276
Radar equipment, 5A-167 Radar rainfall measurement, 5.1-231 Radar storm detection, SA-167 Radiation fog, 5.1-223, 5.1-224 Radiative balance over water surfaces, 5.1-224 Radiative transfer, 5.1-165 Radioactive emanations, 5.1-309 Radioactive snow gages, 5.1-65 Radiosonde ascents, 5.1-73 Radiosonde codes, 5.1-83 Radiosonde errors, 5.1-71 Radiosonde observations, 5A-80 Radiosondes, 5.1-70, 5.1-72, 5.1-307 Rain composition, 5.1-105 Rain formation, 5A-197 Rain gage networks, 5.1-231 Rain gages, 5.1-64 Rainfall damage to crops, 5.1-285 Rainfall data. 5.1-231 Rainfall distribution. 5.1-283, 5A-119 Rainfall effects, 5.1-237 Rainfall frequency distribution, 5.1-238 Rainfall periodicities, 5.1-237 Ramanathan, K. R., 5.1-23 Record reduction, 5.1-36 Recording equipment, 5.1-68, 5.1-117 Redwood trees, 5.1-221 Refraction phenomena, 5.1-301 Refrigeration, 5.1-68 Representativeness of observations, 5.1-27 Reprints, 5A-233 Rime, 5.1-100 River ice, 5.1-232 River stages, 5.1-232 Rocket instrumentation, 5.1-56, 5.1-115 Rocket research, 5.1-56, 5.1-57, 5.1-117 Runoff decrease, 5.1-214
Sailing directions, 5.1-98 Sales expectancy indexes, 5.1-18 Saline nuclei, 5.1-217, 5A-138, 5A-162. 5A-163.
5A-171, 5A-196. 5A-197 Salinity distribution, 5.1-184 Salt spray, 5.1-217 Scattering of light, 5.1-300 "Scotia" Expedition (See: Scottish National
Antarctic Expedition) Scottish National Antarctic Expedition. 1902-
1904, 5A-64 Sea fog, 5.1-222 Sea ice, 5A-36, 5A-38, 5A-87, 5A-92, 5A-101,
5A-102, 5A-111, 5A-132, 5A-164, 5A-177, 5A-232
Sea ice distribution, 5.!-185 Sea ice forecasting, 5A-164 Sea surface temperature variations. 5A-124
Sea surface temperatures, 5.1-185 Sea temperatures, 5A-21, 5A-108, 5A-126, 5A-
1S5 Sea temperature variations, 5A-121, 5A-132,
5A-155 "Sedov" Drifting Expedition. 1937-1940. 5A-79 Semidiurnal pressure waves, 5.1-190 Seminars, 5.1-75 Serial publications, 5A-222, 5A-230 "Severnyi Polius" Expedition 1937-1938, 5A-78 Sferics from typhoons, 5A-128 Shear stress over oceans, 5.1-127 Shielded snow gages, 5.1-66, 5.1-127 Ship climates, 5.1-213 Ship's weather messages, 5A-203 Sierra wave, 5.1-211 Single station forecasting, 5A-184 Skiing, 5.1-243 Sky light spectroscopy studies, 5.1-161 Smoke pall—Sept. 1950, 5.1-6 Snellius Expedition, 1929-1930. 5A-75 Snow accumulation, on wires 5.1-244 Snow analysis, 5.1-245 Snow cover, 5.1-30, 5.1-248 Snow cover effects, 5.1-183 Snow crystals, 5.1-245 Snow damage, 5.1-244 Snow densification, 5.1-241 Snow density profiles, 5.1-241 Snow mechanics. 5.1-243. 5.1-246. 5.1-247 Snow physics. 5.1-239, 5.1-240 Snow research, 5.1-28, 5.1-29 Snow sampling, 5.1-245 Snow static, 5.1-2 Snow st'rveys, 5.1-242 Soil erosion, 5.1-202 Soil moisture, 5.1-254, 5.1-25/ Soil moisture instruments, 5.1-256 Soil moisture measurement, 5.1-251 to 5.1-253,
5.1-255, 5.1-256 Soil physics, 5.1-252 Soil temperature variations, 5.1-181 Soil temperatures, 5.1-182, 5.1-183
.Soils, 5.1-254 Solar eclipses, 5.1-119. 5.1-228 Solar influences, 5.1-297 Solar radiation, 5A-124 Solar radiation effects, 5.1-296 Solar radio noise, 5.1-118 Solenoids. 5.1-126 Sound propagation, 5.1-314 Soviet science, 5A-53 Soya bean cultivation, 5.1-290 Spectral line, 5577 A, 5.1-163, 5.1-164 Spectrophotometry, 5.1-302 Spectroscopy, 5.1-57 Spiral ice crystals, 5.1-220 Split, Yugoslavia. Institut za Oceanografiju i
Ribarstvo, 5A-188 Sprinkling, 5.1-215 Squall frequencies, 5.1-151 Stability, 5A-131 Stack effluents. 5.1-193 Standing waves, 5.1-210 Statistical analysis, 5.1-177
J
IV. AUTHOR AND SUBJECT INDEXES 139
Statistical analysis of artificial precipitation, 5.1-97, 5.1-101
Statistical forecasting, 5.1-86 Statistical studies. 5.1-172 Statistical techniques, 5.1-173, 5.1-238 Statistics in climatology, 5.1-177, 5.1-262 Statistics in meteorology. 5.1-41 Storms at sea. 5A-40. 5A-147, 5A-181, 5A-193 Stratus effects, 5.1-211 Stratus forecasting, 5.1-86 Sub-aerial deposits, 5.1-277 Sublimation of snow, 5.1-240 Submarines, 5A-76 Sub-oceanic cores, 5A-159 Sulphur content of air, 5.1-103 Sunshine, 5.1-228 Sunspot activity, 5A-124 Supersaturation in fog, 5.1-223 Surface friction. 5.1-203 Survey articles, 5.1-113 Swedish Deep Sea Expedition (See: "Albatross"
Expedition) Symposia, 5.1-110. 5.1-250 Synoptic aerological studies. 5.1-208 Synoptic aerology, 5A-80 Synoptic analysis, 5.1-130, 5A-28, 5A-150 Synoptic climatology. 5.1-271. 5.1-292 Synoptic charts, 5A-105, 5A-206 Synoptic studies, S.l-93. 5.1-147, 5.1-153.
5.1-179, 5A-190 Synoptic temperature observations, 5.1-173
Temperature anomalies, 5.1-175, 5.1-176, 5.1- 180
Temperature calculations, 5.1-173 Temperature charts, 5.1-169 Temperature data, 5.1-38, 5.1-40, 5.1-43,
5.1-177 Temperature distribution, 5.1-38 Temperature effects. 5.1-288, 5.1-289 Temperature extremes, 5.1-177.5.1-178. 5.1-179 Temperature fields, 5.1-124 Temperature frequencies, 5.1-267 Temperature measurement, 5.1-61, 5.1-171 Temperature periodicities, 5.1-175 Temperature probability, 5.1-174 Temperature singularities, 5.1-172 Temperature variations, 5.1-40, 5.1-175, 5.1-292 Tephigrams, 5.1-73 Textbooks, 5.1-1, 5.1-3, 5.1-75, 5.1-79, 5.1-
188, SA-1 tr. SA-7, 5A-9 to 5A-11. 5A-15. SA-17. 5A-18, 5A-25, 5A-26, 5A-28, 5A-30 to 5A-32. 5A-36, 5A-37. 5A-39 to 5A-43. 5A-45 to 5A-48. 5A-51 to 5A-55. 5A-58. 5A-251
Thermal conductivity of snow, 5.1-239 Thermals. 5.1-209 Thermistors, 5.1-61 Thermodynamics of gases, 5.1-121 Thermodynamics of the atmosphere, 5.1-199 Thermographs, 5.1-60 Thermometers, 5.1-59 Thermometry, 5.1-58 Thunderstorm electricity, 5.1-310 Thuaderstuiut forecasting, 5.1-87 to 5.1-89 Thunderstorm rainfall, 5.1-230
Thunderstorms, .5.1 -73 Tides. 5.1-188 Titrilog, 5.1-110 Top of convective layer, 5.1-8 Topographic effects, 5.1-178, 5.1-200 Topographic influences, 5.1-153 Tornado damage, 5.1-141 Tornado identification, 5.1-142 Tornadoes, 5.1-138, 5.1-139, 5.1-141 Trade wind belt, 5.1-128 Tropical bioclimatology, 5.1-4 Trade wind models, 5.1-127 Trade winds, 5A-130 Training flights, 5.1-80 Training manuals, 5.1-78 Translations, 5.1-4 Transpiration, 5.1-215, 5.1-257 Tropical bioclimatology, 5.1-4 Tropical climatology, 5.1-200 Tropopause, 5.1-136, 5.1-156 Tropopause height, 5.1-132 Tropospheric data, 5A-184 Turbulence behind trees, 5.1-192, 5.1-205 Turbulence in the frictional layer, 5.1-305 Turbulence index, 5A-186 Turbulence intensity correlations, 5.1-192 Turbulence observations, 5.1-5 Turbulence spectrum, 5.1-194 Turbulence theory, 5.1-193 Turbulent diffusion, 5.1-193 Turbulent flow, 5.1-195 Turbulent mixing of water, 5A-177 Twilight luminescence spectra, 5.1-203 Twilight phenomena. 5.1-158 Typhoons. 5.1-187, 5A-198
Ultraviolet variations, 5.1-166 U. S. Air Weather Service. Directorate of
Climatology, 5.1-261 U. S. Navy. Hydrographic Office. 5A-204 U. S. Navy. Microseismic Research Project,
5A-147 U. S. Weather Bureau. 5.1-16. 5.1-262, 5A-160 Units, 5.1-34, 5.1-35 Upper air climatology, 5.1-132 Upper air data, 5A-81 Upper air fronts. 5.1-145 Upper air observations, 5A-67 Upper air soundings, 5.1-114, 5A-152 Upper air temperature variations, 5.1-88 Upper air temperatures, 5.1-145 Upper air wind codes, 5.1-82 Upper air wind computation, 5A-202 Upper air winds, 5.1-109 Upper atmosphere physics, 5.1-114 Upper atmosphere research, 5.1-56 Urban climates, 5.1-43
V-2 rockets. 5.1-115 Vegetation. 5.1-200 Vegetation influences, 5.1-181 Vegetation zones, 5.1-254 Vertical structure of blizzards/5.1-2 Vertical variations of meteorological elements,
5.1-37 Visibility, 5.1-298. 5.1-299
V-
140 METEOROLOGICAL ABSTRACTS AND BIBLIOGRAPHY
Visibility at sea, 5A-189 Visibility data, 5.1-298 Visibility measurement, 5.1-32, SA-189 Visibility variations, 5.1-298 Vjiringen Expedition, 1876-1878, 5A-60 Vorticity, 5.1-197 Vysotskil, G. N., 5.1-254
Water temperature distribution, 5.1-184 Water vapor, 5.1-35 Water vapor measurement, 5.1-62 Water vapor transport, 5.1-122 Waterspouts, 5.1-140, 5.1-143, 5.1-144 Wave equation, 5.1-195 Weather control. 5.1-95 Weather forecasting, 5.1-7,4 5.1-77 Weather modification, 5.1-92 Weather ships, 5A-144, 5A-152, 5A-154. 5A-167,
5A-175. 5A-200 Wheat phenology, 5.1-53
Wind data, 5.1-42 Wind driven currents, 5.1-204 Wind effects, 5.1-66, 5.1-200 Wind erosion, 5.1-202 Wind field computation, 5.1-125 Wind frequency diagrams, 5.1-198 Wind profiles, 5.1-199, 5A-136 Windbreak effectiveness, 5.1-192, 5.1-205 Winds at sea. 5A-110. 5A-122, 5A-142, 5A-146 Winter temperatures, 5.1-43 World climate, 5A-56. 5A-95. 5A-106, SA-U3.
5A-114 World meteorological charts. 5.1-96 World Meteorological Organization. 5A-199 World War II, 5A-I45
Yearbooks, 5A-86
Zonal circulation. 5.1-129 Zonda, 5.1-190
INDEX OF GEOGRAPHICAL LOCATIONS NORTHERN HEMISPHERE. 5.1-145, 5A-112,
5A-105, 5A-111, 5A-193 TROPICS, 5.1-132 NORTH AMERICA. 5.1-122
Arctic, 5A-243 Soviet Arctic, 5A-102
Canada, 5.1-28, 5.1-42, 5.1-45. 5.1-87, 5.1-259
Hudson Bay, 5A-161 New Brunswick, 5.1-287 Newfoundland, 5.1-282 Nova Scotia, 5.1-287 Quebec Province, 5.1-33 Toronto, 5.1-43
Caribbean Region, 5A-143, 5A-148 Cuba. 5A-97
Great Laxes, 5.1-186 Greenland
Eismitte. 5.1-241 United States, 5.1-122. 5.1-141. 5.1-
5.1-208. 5.1-270. 5.1-274. 5.1-290, 297. 5A-187
Arkansas Texarkana, 5.1-139
California Bishop, 5.1-96 Cactus Peak, 5.1-163. 5.1-164 Cascade Mountains, 5.1-98 Northern California. 5.1-17, 5.1-89.
291 San Diego County 5.1-93 Santa Ana- River, 5.1-93 Sierra Nevada Mountains, 5.1-211
Florida, 5A-171 Miami, 5.1-230
Iowa. 5.1-174. 5.1-285 Maryland. 5.1-119
Chesapeake Bay, 5.1-184 Massachusetts
Nantucket Island, 5A-186
176. 5.1-
5.1-
Michigan Detroit, 5.1-109 East Lansing, 5.1-181
Nevada, 5.1-242 New Jersey
Seabrook Farms, 5.1-216, 5.1-260 Northwestern United States. 5.1-101 Ohio. 5.1-27 Oregon, 5.1-94
Eastern Oregon, 5.1-262 Texas
Randolph Field, 5.1-86 Virginia, 5.1-119 Washington
Western Washington, 5.1-212 Western United States, 5.1-29, 5.1-179
SOUTH AMERICA, 5.1-294 Andes, 5.1-246, 5.1-247 Argentina, 5.1-53
Buenos Aires, 5.1-173 C6rdoba
Pilar Geophysical Observatory, 5.1-306 Mendoza, 5.1-190
Colombia Western Colombia, 5.1-235
Peru. 5A-140 EUROPE, 5.1-276, 5A-137, 5A-153
Alps, 5.1-112. 5.1-196 Belgium, 5.1-44 British Isles, 5.1-189. 5.1-273
England London. 5.1-180 Greenwich Observatory, 5.1-63
Irish Sea, 5.1-209 Wales
Cardiganshire, 5.1-178 Denmark, 5A-86 Finland, 5.1-170 France
Haute-provence Observatory, 5.1-163, 5.1- 166
\-
IV. AUTHOR AND SUBJECT INDEXES 141
Luc, 5.1-292 Toulon-la-Mitre, 5.1-292
Germany. 5.1-54, 5.1-214. 5A-208 Frankfurt a.M., 5.1-105 Hohenheim, 5.1-252 Hohenpeissenberg, 5.1-36 Potsdam, 5.1-104
Greece Athens, 5.1-201, 5A-242
Hungary, 5.1-1. 5.1-14 Budapest. 5.1-265
Italy Milan, 5.1-177 Northwest Italy, 5.1-147 Sicily, 5.1-295
Netherlands, 5.1-198, 5A-42 Northwest Europe, 5.1-141 Norway, 5A-43 Poland, 5.1-52, 5.1-232, 5.1-266
Wroclaw, 5.1-39 Spain
Balearic Islands Minorca, 5.1-269
Canary Islands, 5.1-268 Tenerife. 5.1-48
Sweden, 5.1-228. 5.1-234 Uppsala, 5.1-305
Switzerland, 5.1-47, 5.1-233 Geneva, 5.1-40 Payerne, 5.1-71
Trieste, 5.1-271 U.S.S.R., S.l-20, 5.1-146. 5A-103. 5A-166,
5A-177, 5A-180 Southern Ukraine, 5.1-150 Soviet Arctic, 5A-102
Western Europe, 5.1-134, 5A-132 Yugoslavia. 5A-188
ASIA Arabia, 5.1-132
Gulf of Aden, 5A-77 Asiatic U.S.S.R., 5.1-146
Lake Baikal, 5A-134 Okhotsk Sea, 5A-164 Turkmenistan
Repetek. 5.1-282 China, 5A-99 India, 5.1-197
Madras, 5.1-151 Poona. 5.1-8. 5.1-73. 5.1-307
Iraq, 5 1-132 Israel, 5.1-99
Negev. 5.1-267 Japan, 5.1-28, 5.1-152, 5.1-172, 5.1-187,
5.1-222, 5.1-298 Central Honshu, 5.1-153 Kyusyu. 5.1-100 Mount Fuji, 5.1-37 Mount Taisetsu, 5.1-245 Nagasaki, 5.1-149 Sendai, 5.1-299 Tohoku District. 5.1-175 Tokyo, 5.1-38
Korea, 5.1-265 Middle Asia, 5.1-146 Pakistan, 5.1-264
AFRICA. 5.1-294 Belgian Congo
Mayumbe, 5.1-237 Egypt
Nile Valley. 5.1-210 Mozambique
Lourenso Marques, 5.1-80 South Africa, 5.1-80. 5.1-133. 5.1-294
Natal, 5.1-283 AUSTRALASIA
Australia, 5.1-135 Australian New Guinea, 5.1-4
Indonesia, 5A-75 ANTARCTICA, 5A-67, 5A-83, 5A-190, 5A-241,
5A-246 Adelie Land, 5.1-2 Little America, 5A-81
OCEANS, SEAS AND ISLANDS Antarctic Ocean, 5.1-46, 5A-64. 5A-65, 5A-
67. 5A-72. 5A-81. 5A-92, 5A-241 Arctic Ocean, 5.1-263. 5A-38, 5A-60, 5A-62,
5A-68, SA-76. 5A-79, SA-87, 5A-92 Atlantic Ocean, 5.1-144, 5A-34, 5A-61. 5A-73.
5A-74, 5A-80, 5A-109, 5A-115. 5A-133. 5A-137. 5A-153
East Atlantic, 5A-63. 5A-91 North Atlantic. 5.1-134, 5.1-140. 5.1-143.
5.1-154. 5.1-185. 5A-60. 5A-66. 5A-69. 5A-87, 5A-90. 5A-92, 5A-110, 5A-118. 5A-120, 5A-121. 5A-124, SA-125. 5A- 144. 5A-152, 5A-154. 5A-167. 5A-184. 5A-185. 5A-215. 5A-232
Bermuda, 5.1-138 Caribbean Sea, 5A-46 Gulf Stream, 5A-1 Norwegian Sea, 5A-175
South Atlantic. 5A-64, 5A-90, 5A-206 Falkland Islands, 5.1-46
Baltic Sea 5.1-185. 5.1-215 Usedom. 5.1-219
Bering Sea, 5A-239 Bering Strait, 5A-239 China Sea, 5A-90
Indian Ocean, 5A-25, 5A-61, 5A-77. 5A-115, 5A-133. 5A-206
South Indian Ocean Heard Island. 5A-67 Kerguelen Island. 5.1-148
Southwest Indian Ocean, 5.1-148 North Sea, 5.1-185, 5A-215 Pacific Ocean, 5A-25. 5A-74. 5A-90: 5A-109,
5A-115, 5A-141, 5A-181, 5A-198 El Niflo Current, 5A-140 Hilo, Hawaii, 5.1-238 Netherlands East Indies, 5A-75 North Pacific, 5A-110. 5A-126, 5A-184,
SA-239 Philippine Islands
Quezon City, 5.1-181, 5A-198 South Pacific Ocean
Macquarie Island, 5A-67 West Pacific, 5A-240
Red Sea, 5A-77 White Sea, 5A-136
Related Documents