American Housing Survey Metropolitan Area Samples Histories: 1973 – 2013 LAST UPDATED: APRIL 2019 U.S. DEPARTMENT OF HOUSING AND URBAN DEVELOPMENT U.S. CENSUS BUREAU U.S. DEPARTMENT OF COMMERCE Department of Housing and Urban Development | Office of Policy Development and Research

Welcome message from author
This document is posted to help you gain knowledge. Please leave a comment to let me know what you think about it! Share it to your friends and learn new things together.
Transcript
American Housing Survey Metropolitan Area Samples Histories: 1973 – 2013
LAST UPDATED: APRIL 2019
U.S. DEPARTMENT OF HOUSING AND URBAN DEVELOPMENT U.S. CENSUS BUREAU U.S. DEPARTMENT OF COMMERCE
Department of Housing and Urban Development | Office of Policy Development and Research
–
Contents ......................................................................................................... 181 Albany
1.1 National Longitudinal Sample (1985 – 2013) ......................................................... 18
1.2 Independent Metropolitan Area Oversample Longitudinal History (1974 – 1980). 18
1.3 Metropolitan Area Definition (1974, 1977, 1980)................................................... 18
2 Allentown .................................................................................................... 19
2.1 National Longitudinal Sample (1985 – 2013) ......................................................... 19
2.2 Independent Metropolitan Area Oversample Longitudinal History (1976 – 1980). 19
2.3 Metropolitan Area Definition (1976, 1980) ............................................................ 19
3 Anaheim ...................................................................................................... 20
3.1 National Longitudinal Sample (1985 – 2013) ......................................................... 20
3.2 Independent Metropolitan Area Oversample Longitudinal History (1974 – 2011). 20
3.3 Metropolitan Area Definition (1974, 1977, 1981, 1986, 1990, 1994, 2002, 2011)..... 20
4 Atlanta......................................................................................................... 21
4.1 National Longitudinal Sample (1985 – 2013) ......................................................... 21
4.2 Independent Metropolitan Area Oversample Longitudinal History (1975 – 2011). 21
4.3 Metropolitan Area Definition (1975, 1978, 1982)................................................... 21
4.4 Metropolitan Area Definition (1987, 1991) ............................................................ 21
4.5 Metropolitan Area Definition (1996, 2004) ............................................................ 22
4.6 Metropolitan Area Definition (2011) ..................................................................... 22
5 Austin .......................................................................................................... 24
5.1 National Longitudinal Sample (1985-2013) ........................................................... 24
5.2 Independent Metropolitan Area Oversample Longitudinal History (2013)............ 24
5.3 Metropolitan Area Definition (2013) ..................................................................... 24
6 Baltimore ..................................................................................................... 25
6.1 National Longitudinal Sample (1985 – 2013) ......................................................... 25
6.2 Independent Metropolitan Area Oversample Longitudinal History (1976 – 2013). 25
6.3 Metropolitan Area Definition (1976, 1979, 1983)................................................... 25
6.4 Metropolitan Area Definition (1987, 1991, 1998, 2007, 2013) ................................ 25
Metropolitan Area Histories 1973 to 2013 2

–
7 Birmingham ................................................................................................. 27
7.1 National Longitudinal Sample (1985 – 2013) ......................................................... 27
7.2 Independent Metropolitan Area Oversample Longitudinal History (1976 – 2011). 27
7.3 Metropolitan Area Definition (1976, 1980) ............................................................ 27
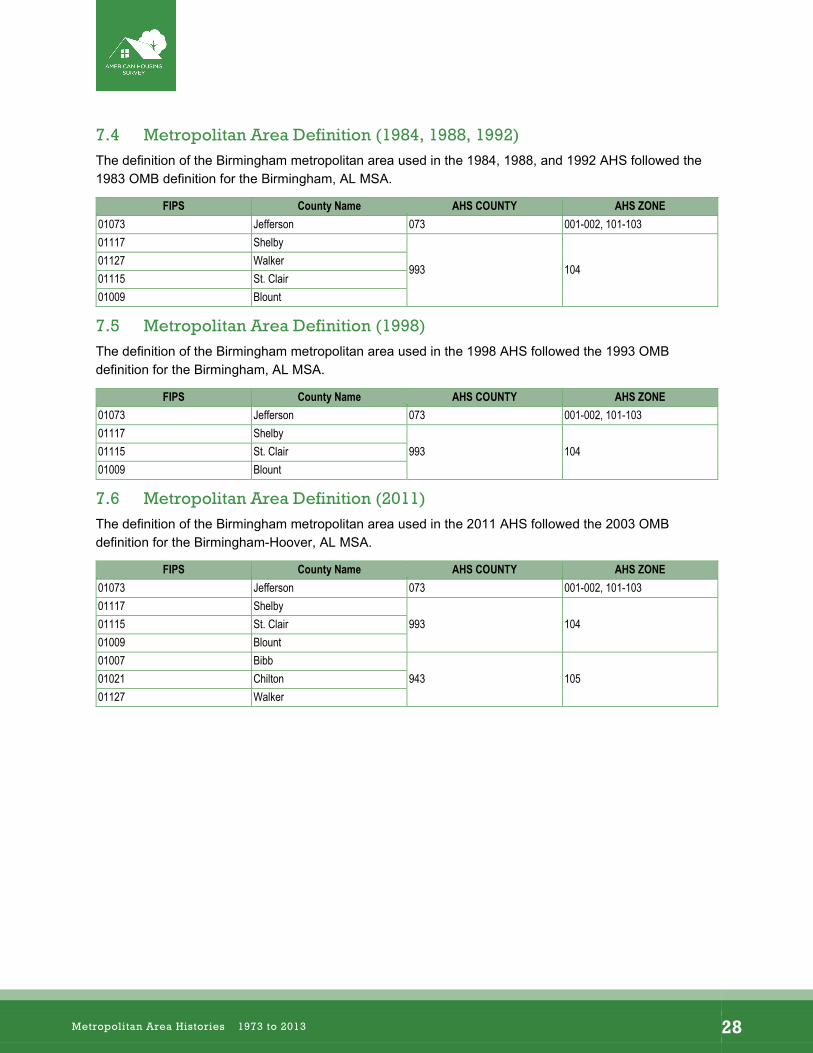
7.4 Metropolitan Area Definition (1984, 1988, 1992)................................................... 28
7.5 Metropolitan Area Definition (1998) ..................................................................... 28
7.6 Metropolitan Area Definition (2011) ..................................................................... 28
8 Boston ......................................................................................................... 29
8.1 National Longitudinal Sample (1985 – 2013) ......................................................... 29
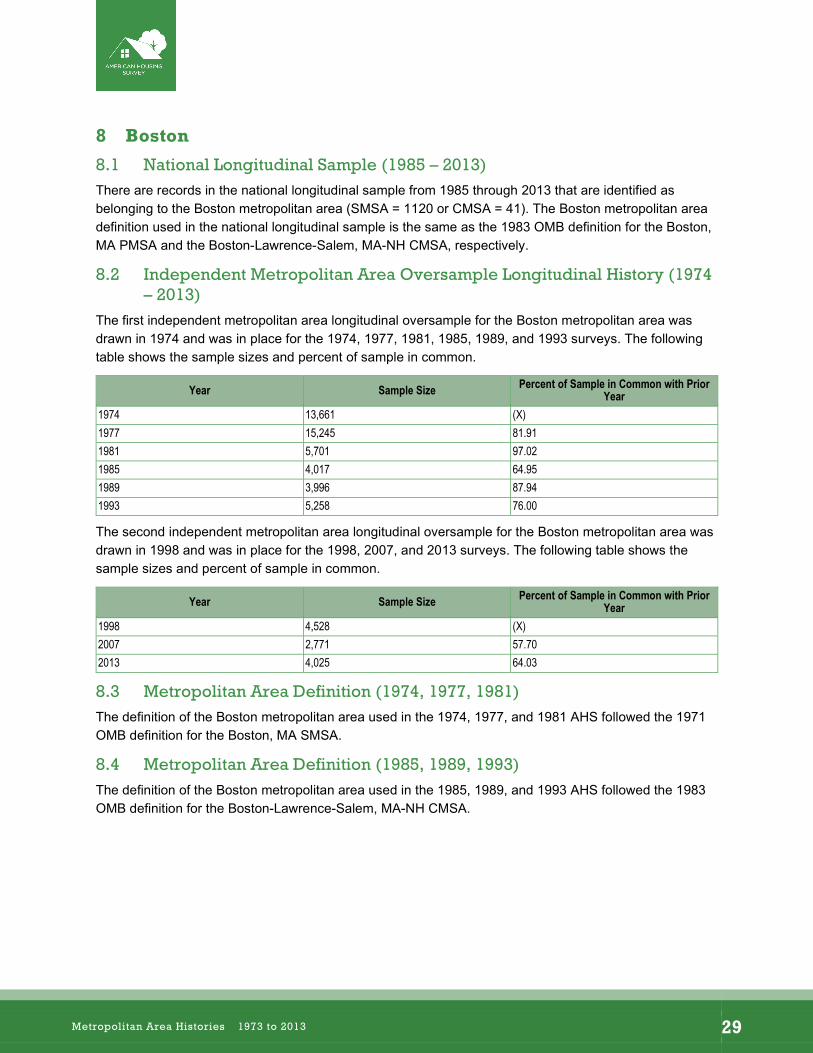
8.2 Independent Metropolitan Area Oversample Longitudinal History (1974 – 2013). 29
8.3 Metropolitan Area Definition (1974, 1977, 1981)................................................... 29
8.4 Metropolitan Area Definition (1985, 1989, 1993)................................................... 29
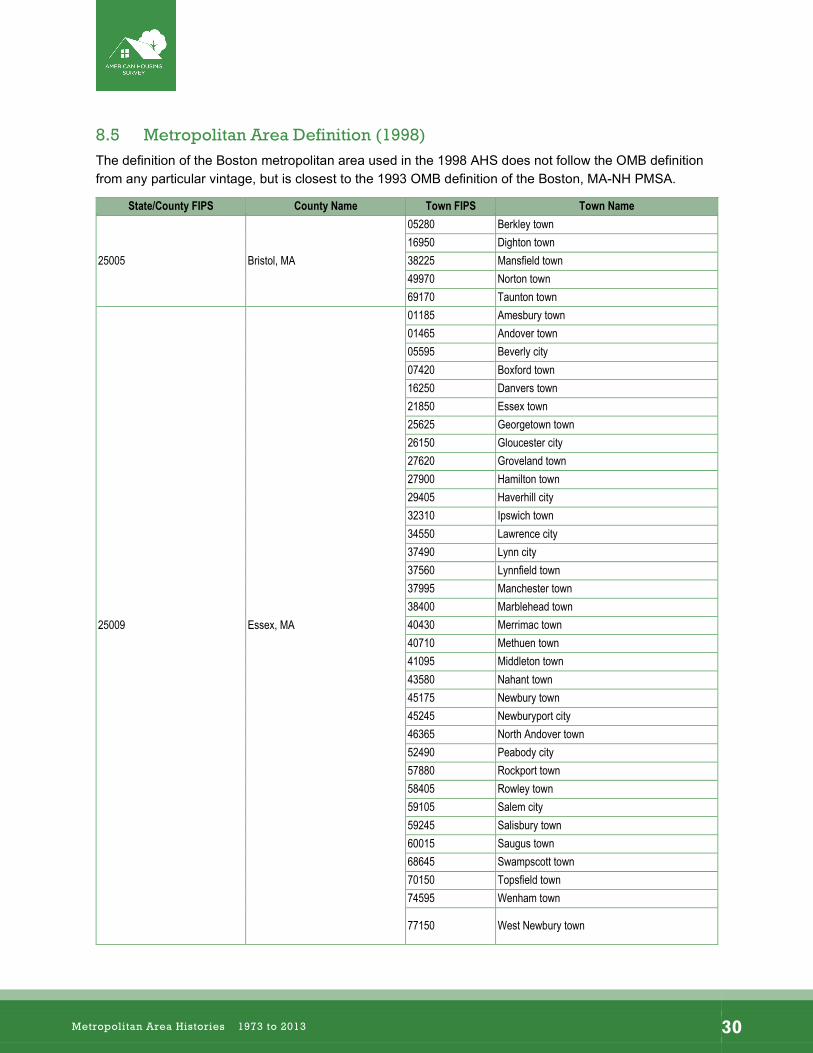
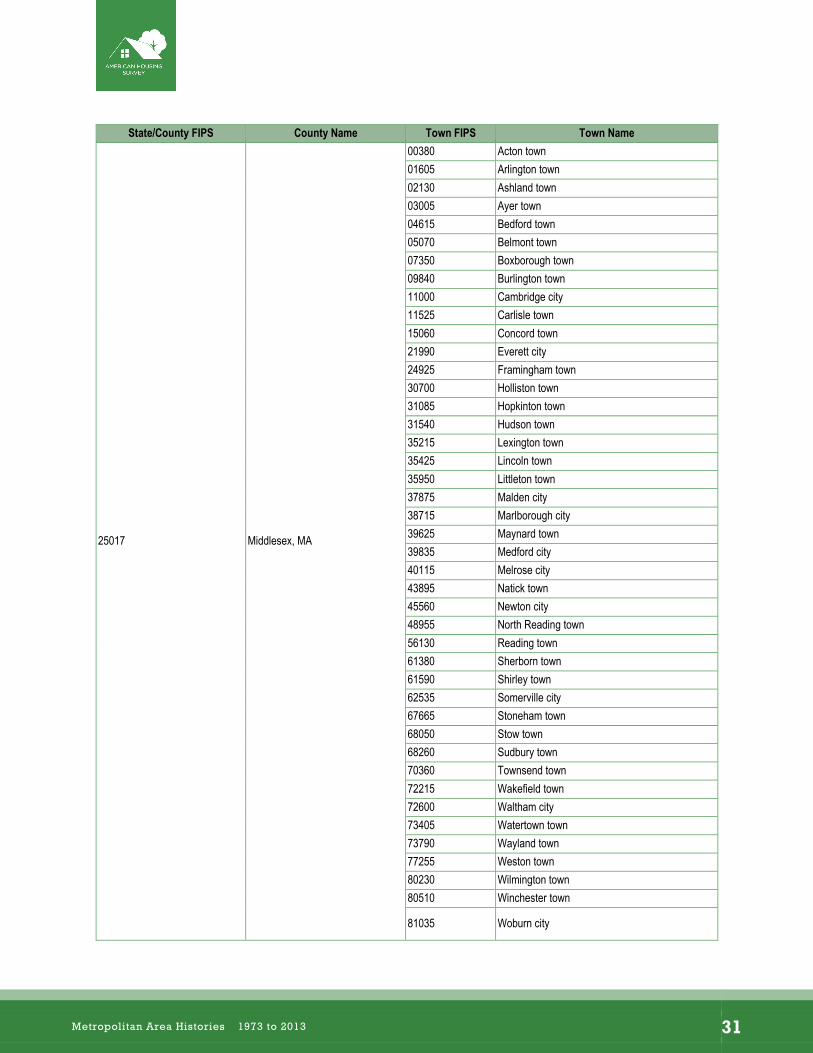
8.5 Metropolitan Area Definition (1998) ..................................................................... 30
8.6 Metropolitan Area Definition (2007, 2013) ............................................................ 33
9 Buffalo ......................................................................................................... 37
9.1 National Longitudinal Sample (1985 – 2013) ......................................................... 37
9.2 Independent Metropolitan Area Oversample Longitudinal History (1976 – 2011). 37
9.3 Metropolitan Area Definition (1976, 1979) ............................................................ 37
9.4 Metropolitan Area Definition (1984, 1988, 1994, 2002).......................................... 37
9.5 Metropolitan Area Definition (2011) ..................................................................... 37
10 Charlotte ..................................................................................................... 38
10.1 National Longitudinal Sample (1985 – 2013) ......................................................... 38
10.2 Independent Metropolitan Area Oversample Longitudinal History (1995 – 2011). 38
10.3 Metropolitan Area Definition (1995, 2002) ............................................................ 38
10.4 Metropolitan Area Definition (2011) ..................................................................... 38
11 Chicago....................................................................................................... 39
11.1 National Longitudinal Sample (1985 – 2013) ......................................................... 39
11.2 Metropolitan/National Longitudinal Sample Longitudinal History (1975 – 2013) ... 39
11.3 Metropolitan Area Definition (1975, 1979, 1983)................................................... 40
Metropolitan Area Histories 1973 to 2013 3

–
11.4 Metropolitan Area Definition (1987, 1991) ............................................................ 40
11.5 Metropolitan Area Definition (1995, 1999, 2003)................................................... 40
11.6 Metropolitan Area Definition (2009, 2013) ............................................................ 41
12 Cincinnati .................................................................................................... 42
12.1 National Longitudinal Sample (1985 – 2013) ......................................................... 42
12.2 Independent Metropolitan Area Oversample Longitudinal History (1975 – 2011). 42
12.3 Metropolitan Area Definition (1975, 1978, 1982)................................................... 42
12.4 Metropolitan Area Definition (1986, 1990, 1998)................................................... 43
12.5 Metropolitan Area Definition (2011) ..................................................................... 43
13 Cleveland .................................................................................................... 44
13.1 National Longitudinal Sample (1985 – 2013) ......................................................... 44
13.2 Independent Metropolitan Area Oversample Longitudinal History (1976 – 2011). 44
13.3 Metropolitan Area Definition (1976, 1979) ............................................................ 44
13.4 Metropolitan Area Definition (1984, 1988, 1992)................................................... 44
13.5 Metropolitan Area Definition (1996, 2004) ............................................................ 45
13.6 Metropolitan Area Definition (2011) ..................................................................... 45
14 Colorado Springs ......................................................................................... 46
14.1 National Longitudinal Sample (1985 – 2013) ......................................................... 46
14.2 Independent Metropolitan Area Oversample Longitudinal History (1975 – 1978). 46
14.3 Metropolitan Area Definition (1975, 1978) ............................................................ 46
15 Columbus .................................................................................................... 47
15.1 National Longitudinal Sample (1985 – 2013) ......................................................... 47
15.2 Independent Metropolitan Area Oversample Longitudinal History (1975 – 2011). 47
15.3 Metropolitan Area Definition (1975, 1978, 1982)................................................... 47
15.4 Metropolitan Area Definition (1987, 1991) ............................................................ 47
15.5 Metropolitan Area Definition (1995, 2002) ............................................................ 48
15.6 Metropolitan Area Definition (2011) ..................................................................... 48
16 Dallas .......................................................................................................... 49
16.1 National Longitudinal Sample (1985 – 2013) ......................................................... 49
Metropolitan Area Histories 1973 to 2013 4
–
16.2 Independent Metropolitan Area Oversample Longitudinal History (1974 – 2011). 49
16.3 Metropolitan Area Definition (1974, 1977, 1981)................................................... 49
16.4 Metropolitan Area Definition (1985, 1989, 1994, 2002).......................................... 49
16.5 Metropolitan Area Definition (2011) ..................................................................... 50
17 Denver ........................................................................................................ 51
17.1 National Longitudinal Sample (1985 – 2013) ......................................................... 51
17.2 Independent Metropolitan Area Oversample Longitudinal History (1976 – 2011). 51
17.3 Metropolitan Area Definition (1976, 1979, 1983)................................................... 51
17.4 Metropolitan Area Definition (1986, 1990) ............................................................ 52
17.5 Metropolitan Area Definition (1995) ..................................................................... 52
17.6 Metropolitan Area Definition (2004, 2011) ............................................................ 52
18 Detroit ......................................................................................................... 53
18.1 National Longitudinal Sample (1985 – 2013) ......................................................... 53
18.2 Metropolitan/National Longitudinal Sample Longitudinal History (1974 – 2013) ... 53
18.3 Metropolitan Area Definition (1974, 1977, 1981)................................................... 53
18.4 Metropolitan Area Definition (1985, 1989, 1993)................................................... 54
18.5 Metropolitan Area Definition (1995, 1999, 2003)................................................... 54
18.6 Metropolitan Area Definition (2009, 2013) ............................................................ 55
19 Fort Worth ................................................................................................... 56
19.1 National Longitudinal Sample (1985 – 2013) ......................................................... 56
19.2 Independent Metropolitan Area Oversample Longitudinal History (1974 – 2011). 56
19.3 Metropolitan Area Definition (1974, 1977, 1981)................................................... 56
19.4 Metropolitan Area Definition (1985, 1989, 1994)................................................... 56
19.5 Metropolitan Area Definition (2002) ..................................................................... 57
19.6 Metropolitan Area Definition (2011) ..................................................................... 57
20 Grand Rapids ............................................................................................... 58
20.1 National Longitudinal Sample (1985 – 2013) ......................................................... 58
20.2 Independent Metropolitan Area Oversample Longitudinal History (1976 – 1980). 58
20.3 Grand Rapids Metropolitan Area Definition.......................................................... 58
Metropolitan Area Histories 1973 to 2013 5

–
21 Hartford....................................................................................................... 59
21.1 National Longitudinal Sample (1985 – 2013) ......................................................... 59
21.2 Independent Metropolitan Area Oversample Longitudinal History (1975 – 2013). 59
21.3 Metropolitan Area Definition (1975, 1979, 1983)................................................... 59
21.4 Metropolitan Area Definition (1987, 1991) ............................................................ 59
21.5 Metropolitan Area Definition (1996, 2004) ............................................................ 59
21.6 Metropolitan Area Definition (2013) ..................................................................... 60
22 Honolulu ...................................................................................................... 62
22.1 National Longitudinal Sample (1985 – 2013) ......................................................... 62
22.2 Independent Metropolitan Area Oversample Longitudinal History (1976 – 1983). 62
22.3 Metropolitan Area Definition (1976, 1979, 1983)................................................... 62
23 Houston ....................................................................................................... 63
23.1 National Longitudinal Sample (1985–2013)........................................................... 63
23.2 Independent Metropolitan Area Oversample Longitudinal History (1976–2013)... 63
23.3 Metropolitan Area Definition (1976, 1979, 1983)................................................... 63
23.4 Metropolitan Area Definition (1987, 1991) ............................................................ 64
23.5 Metropolitan Area Definition (1998) ..................................................................... 64
23.6 Metropolitan Area Definition (2007, 2013) ............................................................ 64
24 Indianapolis ................................................................................................. 65
24.1 National Longitudinal Sample (1985 – 2013) ......................................................... 65
24.2 Independent Metropolitan Area Oversample Longitudinal History (1976 – 2011). 65
24.3 Metropolitan Area Definition (1976, 1980) ............................................................ 65
24.4 Metropolitan Area Definition (1984, 1988, 1992)................................................... 66
24.5 Metropolitan Area Definition (1996, 2004) ............................................................ 66
24.6 Metropolitan Area Definition (2011) ..................................................................... 67
25 Jacksonville ................................................................................................. 68
25.1 National Longitudinal Sample (1985 – 2013) ......................................................... 68
25.2 Independent Metropolitan Area Oversample Longitudinal History (2013)............ 68
25.3 Metropolitan Area Definition (2013) ..................................................................... 68
Metropolitan Area Histories 1973 to 2013 6

–
26 Kansas City .................................................................................................. 69
26.1 National Longitudinal Sample (1985 – 2013) ......................................................... 69
26.2 Independent Metropolitan Area Oversample Longitudinal History (1975 – 2011). 69
26.3 Metropolitan Area Definition (1975, 1978, 1982)................................................... 69
26.4 Metropolitan Area Definition (1986, 1990) ............................................................ 70
26.5 Metropolitan Area Definition (1995, 2002) ............................................................ 70
26.6 Metropolitan Area Definition (2011) ..................................................................... 71
27 Las Vegas .................................................................................................... 72
27.1 National Longitudinal Sample (1985 – 2013) ......................................................... 72
27.2 Independent Metropolitan Area Oversample Longitudinal History (1976 – 2013). 72
27.3 Metropolitan Area Definition (1976, 1979) ............................................................ 72
27.4 Metropolitan Area Definition (2013) ..................................................................... 72
28 Louisville ..................................................................................................... 73
28.1 National Longitudinal Sample (1985 – 2013) ......................................................... 73
28.2 Independent Metropolitan Area Oversample Longitudinal History (1976-2013) ... 73
28.3 Metropolitan Area Definition (1976, 1980, 1983)................................................... 73
28.4 Metropolitan Area Definition (2013) ..................................................................... 74
29 Los Angeles ................................................................................................. 75
29.1 National Longitudinal Sample (1985 – 2013) ......................................................... 75
29.2 Metropolitan/National Longitudinal Sample Longitudinal History (1974 – 2011) ... 75
29.3 Metropolitan Area Definition (1974, 1977, 1980)................................................... 76
29.4 Metropolitan Area Definition (1985, 1989) ............................................................ 76
29.5 Metropolitan Area Definition (1995, 1999, 2003)................................................... 76
29.6 Metropolitan Area Definition (2011) ..................................................................... 76
30 Madison....................................................................................................... 77
30.1 National Longitudinal Sample (1985 – 2013) ......................................................... 77
30.2 Independent Metropolitan Area Oversample Longitudinal History (1975 – 1981). 77
30.3 Metropolitan Area Definition (1975, 1977, 1981)................................................... 77
31 Memphis...................................................................................................... 78
31.1 National Longitudinal Sample (1985 – 2013) ......................................................... 78
Metropolitan Area Histories 1973 to 2013 7
–
31.2 Independent Metropolitan Area Oversample Longitudinal History (1974 – 2011). 78
31.3 Metropolitan Area Definition (1974) ..................................................................... 78
31.4 Metropolitan Area Definition (1977, 1980) ............................................................ 79
31.5 Metropolitan Area Definition (1984, 1988, 1992)................................................... 79
31.6 Metropolitan Area Definition (1996) ..................................................................... 79
31.7 Metropolitan Area Definition (2004) ..................................................................... 79
31.8 Metropolitan Area Definition (2011) ..................................................................... 80
32 Miami .......................................................................................................... 81
32.1 National Longitudinal Sample (1985 – 2013) ......................................................... 81
32.2 Independent Metropolitan Area Oversample Longitudinal History (1975 – 2013). 81
32.3 Metropolitan Area Definition (1975, 1979, 1983)................................................... 81
32.4 Metropolitan Area Definition (1986, 1990, 1995, 2002).......................................... 82
32.5 Metropolitan Area Definition (2007, 2013) ............................................................ 82
33 Milwaukee ................................................................................................... 83
33.1 National Longitudinal Sample (1985 – 2013) ......................................................... 83
33.2 Independent Metropolitan Area Oversample Longitudinal History (1975 – 2011). 83
33.3 Metropolitan Area Definition (1975, 1979) ............................................................ 83
33.4 Metropolitan Area Definition (1984, 1988, 1994, 2002, 2011) ................................ 83
34 Minneapolis-St. Paul ..................................................................................... 84
34.1 National Longitudinal Sample (1985 – 2013) ......................................................... 84
34.2 Independent Metropolitan Area Oversample Longitudinal History (1974 – 2013). 84
34.3 Metropolitan Area Definition (1974, 1977, 1981)................................................... 84
34.4 Metropolitan Area Definition (1985, 1989, 1993)................................................... 85
34.5 Metropolitan Area Definition (1998, 2007, 2013)................................................... 85
35 Nashville ..................................................................................................... 86
35.1 National Longitudinal Sample (1985 – 2013) ......................................................... 86
35.2 Independent Metropolitan Area Oversample Longitudinal History (2013)............ 86
35.3 Metropolitan Area Definition (2013) ..................................................................... 86
36 New Orleans ................................................................................................ 87
Metropolitan Area Histories 1973 to 2013 8
–
36.1 National Longitudinal Sample (1985 – 2013) ......................................................... 87
36.2 Independent Metropolitan Area Oversample Longitudinal History (1975 – 2011). 87
36.3 Metropolitan Area Definition (1975, 1978, 1982)................................................... 87
36.4 Metropolitan Area Definition (1986, 1990) ............................................................ 88
36.5 Metropolitan Area Definition (1995, 2004) ............................................................ 88
36.6 Metropolitan Area Definition (2009, 2011) ............................................................ 88
37 New York..................................................................................................... 89
37.1 National Longitudinal Sample (1985 – 2013) ......................................................... 89
37.2 Metropolitan/National Longitudinal Sample Longitudinal History (1976 – 2013) ... 89
37.3 Metropolitan Area Definition (1976, 1980, 1983)................................................... 90
37.4 Metropolitan Area Definition (1987, 1991) ............................................................ 90
37.5 Metropolitan Area Definition (1995, 1999, 2003)................................................... 90
37.6 Metropolitan Area Definition (2009, 2013) ............................................................ 91
38 Norfolk-Virginia Beach-Newport News .......................................................... 92
38.1 National Longitudinal Sample (1985 – 2013) ......................................................... 92
38.2 Independent Metropolitan Area Oversample Longitudinal History (1975 – 2011). 92
38.3 Metropolitan Area Definition (1975, 1978) ............................................................ 93
38.4 Metropolitan Area Definition (1984, 1988, 1992)................................................... 93
38.5 Metropolitan Area Definition (1998) ..................................................................... 94
38.6 Metropolitan Area Definition (2011) ..................................................................... 94
39 Northern New Jersey .................................................................................... 95
39.1 National Longitudinal Sample (1985 – 2013) ......................................................... 95
39.2 Metropolitan/National Longitudinal Sample Longitudinal History (1974 – 2013) ... 95
39.3 Metropolitan Area Definition (1983) ..................................................................... 96
39.4 Metropolitan Area Definition (1995, 1999, 2003)................................................... 97
39.5 Metropolitan Area Definition (2009, 2013) ............................................................ 98
40 Oakland....................................................................................................... 99
40.1 National Longitudinal Sample (1985 – 2013) ......................................................... 99
40.2 Independent Metropolitan Area Oversample Longitudinal History (1998 – 2011). 99
Metropolitan Area Histories 1973 to 2013 9
–
40.3 Metropolitan Area Definition (1998, 2011) ............................................................ 99
41 Oklahoma City ........................................................................................... 100
41.1 National Longitudinal Sample (1985 – 2013) ........................................................100
41.2 Independent Metropolitan Area Oversample Longitudinal History (1976 – 2013)100
41.3 Metropolitan Area Definition (1976, 1980) ...........................................................100
41.4 Metropolitan Area Definition (1984, 1988, 1992, 1996, 2004) ...............................101
41.5 Metropolitan Area Definition (2013) ....................................................................101
42 Omaha....................................................................................................... 102
42.1 National Longitudinal Sample (1985 – 2013) ........................................................102
42.2 Independent Metropolitan Area Oversample Longitudinal History (1976 – 1979)102
42.3 Metropolitan Area Definition (1976, 1979) ...........................................................102
43 Orlando ..................................................................................................... 103
43.1 National Longitudinal Sample (1985 – 2013) ........................................................103
43.2 Independent Metropolitan Area Oversample Longitudinal History (1974 – 2013)103
43.3 Metropolitan Area Definition (1974, 1977, 1981)..................................................103
43.4 Metropolitan Area Definition (2013) ....................................................................103
44 Philadelphia .............................................................................................. 104
44.1 National Longitudinal Sample (1985 – 2013) ........................................................104
44.2 Metropolitan/National Longitudinal Sample Longitudinal History (1975 – 2013) ..104
44.3 Metropolitan Area Definition (1975, 1978, 1982)..................................................105
44.4 Metropolitan Area Definition (1985, 1989) ...........................................................105
44.5 Philadelphia Metropolitan Area Definition (1995, 1999, 2003) .............................105
44.6 Metropolitan Area Definition (2009, 2013) ...........................................................106
45 Phoenix ..................................................................................................... 107
45.1 National Longitudinal Sample (1985 – 2013) ........................................................107
45.2 Independent Metropolitan Area Oversample Longitudinal History (1974 – 2011)107
45.3 Metropolitan Area Definition (1974, 1977, 1981)..................................................107
45.4 Metropolitan Area Definition (1985, 1989, 1994, 2002).........................................107
45.5 Metropolitan Area Definition (2011) ....................................................................107
Metropolitan Area Histories 1973 to 2013 10
–
46 Pittsburgh.................................................................................................. 108
46.1 National Longitudinal Sample (1985 – 2013) ........................................................108
46.2 Independent Metropolitan Area Oversample Longitudinal History (1974 – 2011)108
46.3 Metropolitan Area Definition (1974, 1977, 1981)..................................................108
46.4 Metropolitan Area Definition (1986, 1990) ...........................................................109
46.5 Metropolitan Area Definition (1995, 2004) ...........................................................109
46.6 Metropolitan Area Definition (2011) ....................................................................109
47 Portland..................................................................................................... 110
47.1 National Longitudinal Sample..............................................................................110
47.2 Independent Metropolitan Area Oversample Longitudinal History (1975 – 2011)110
47.3 Metropolitan Area Definition (1975, 1979, 1983)..................................................110
47.4 Metropolitan Area Definition (1986, 1990, 1995)..................................................111
47.5 Metropolitan Area Definitions (2002)...................................................................111
47.6 Metropolitan Area Definitions (2011)...................................................................111
48 Providence ................................................................................................ 112
48.1 National Longitudinal Sample (1985 – 2013) ........................................................112
48.2 Independent Metropolitan Area Oversample Longitudinal History (1976 – 2011)112
48.3 Metropolitan Area Definition (1976, 1980) ...........................................................112
48.4 Metropolitan Area Definition (1984, 1988, 1992)..................................................112
48.5 Metropolitan Area Definition (1998) ....................................................................113
48.6 Metropolitan Area Definition (2011) ....................................................................113
49 Raleigh ...................................................................................................... 116
49.1 National Longitudinal Sample (1985 – 2013) ........................................................116
49.2 Independent Metropolitan Area Oversample Longitudinal History (1976 – 1979)116
49.3 Metropolitan Area Definition (1976, 1979) ...........................................................116
50 Richmond .................................................................................................. 117
50.1 National Longitudinal Sample (1985 – 2013) ........................................................117
50.2 Independent Metropolitan Area Oversample Longitudinal History (2013)...........117
50.3 Metropolitan Area Definition (2013) ....................................................................117
Metropolitan Area Histories 1973 to 2013 11
–
51 Riverside ................................................................................................... 118
51.1 National Longitudinal Sample (1985 – 2013) ........................................................118
51.2 Independent Metropolitan Area Oversample Longitudinal History (1975 – 2011)118
51.3 Metropolitan Area Definition (1975, 1978, 1982)..................................................118
51.4 Metropolitan Area Definition (1986, 1990, 1994, 2002, 2011) ...............................118
52 Rochester .................................................................................................. 119
52.1 National Longitudinal Sample (1985 – 2013) ........................................................119
52.2 Independent Metropolitan Area Oversample Longitudinal History (1975 – 2013)119
52.3 Metropolitan Area Definition (1975, 1978, 1982)..................................................119
52.4 Metropolitan Area Definition (1986, 1990) ...........................................................120
52.5 Metropolitan Area Definition (1998) ....................................................................120
52.6 Metropolitan Area Definition (2013) ....................................................................120
53 Sacramento ................................................................................................ 121
53.1 National Longitudinal Sample (1985 – 2013) ........................................................121
53.2 Independent Metropolitan Area Oversample Longitudinal History (1976 – 2011)121
53.3 Metropolitan Area Definition (1976, 1980, 1983)..................................................121
53.4 Metropolitan Area Definition (1996, 2004) ...........................................................122
53.5 Metropolitan Area Definition (2011) ....................................................................122
54 Saginaw ..................................................................................................... 123
54.1 National Longitudinal Sample (1985 – 2013) ........................................................123
54.2 Independent Metropolitan Area Oversample Longitudinal History (1974 – 1980)123
54.3 Metropolitan Area Definition (1974, 1977, 1980)..................................................123
55 Salt Lake City............................................................................................. 124
55.1 National Longitudinal Sample (1985 – 2013) ........................................................124
55.2 Independent Metropolitan Area Oversample Longitudinal History (1974 – 1998)124
55.3 Metropolitan Area Definition (1974, 1977, 1980)..................................................124
55.4 Metropolitan Area Definition (1984, 1988, 1992, 1998).........................................124
56 San Diego .................................................................................................. 125
56.1 National Longitudinal Sample (1985 – 2013) ........................................................125
56.2 Independent Metropolitan Area Oversample Longitudinal History (1975 – 2011)125
Metropolitan Area Histories 1973 to 2013 12

–
56.3 Metropolitan Area Definition (1975, 1978, 1982)..................................................125
56.4 Metropolitan Area Definition (1987, 1991, 1994, 2002, 2011) ...............................125
57 San Francisco............................................................................................. 126
57.1 National Longitudinal Sample (1985 – 2013) ........................................................126
57.2 Independent Metropolitan Area Oversample Longitudinal History (1975 – 2011)126
57.3 Metropolitan Area Definition (1975, 1978, and 1982) ...........................................126
57.4 Metropolitan Area Definition (1985, 1989, 1993)..................................................127
57.5 Metropolitan Area Definition (1998, 2011) ...........................................................127
58 San Antonio................................................................................................ 128
58.1 National Longitudinal Sample (1985 – 2013) ........................................................128
58.2 Independent Metropolitan Area Oversample Longitudinal History (1975 – 2013)128
58.3 Metropolitan Area Definition (1975, 1978, 1982)..................................................128
58.4 Metropolitan Area Definition (1986, 1990) ...........................................................128
58.5 Metropolitan Area Definition (1995) ....................................................................129
58.6 Metropolitan Area Definition (2004) ....................................................................129
58.7 59.7 Metropolitan Area Definition (2013).............................................................129
59 San Jose ..................................................................................................... 130
59.1 National Longitudinal Sample (1985 – 2013) ........................................................130
59.2 Independent Metropolitan Area Oversample Longitudinal History (1984 – 2011)130
59.3 Metropolitan Area Definition (1984, 1988, 1993, 1998).........................................130
59.4 Metropolitan Area Definition (2011) ....................................................................130
60 Seattle ....................................................................................................... 131
60.1 National Longitudinal Sample (1985 – 2013) ........................................................131
60.2 Independent Metropolitan Area Oversample Longitudinal History (1974 – 2013)131
60.3 Metropolitan Area Definition (1974, 1977, 1981)..................................................131
60.4 Metropolitan Area Definition (1976, 1979, 1983)..................................................132
60.5 Metropolitan Area Definition (1987, 1991) ...........................................................132
60.6 Metropolitan Area Definition (1996) ....................................................................132
60.7 Metropolitan Area Definition (2004) ....................................................................132
Metropolitan Area Histories 1973 to 2013 13
–
60.8 Metropolitan Area Definition (2009) ....................................................................133
60.9 Metropolitan Area Definition (2013) ....................................................................133
61 Spokane .................................................................................................... 134
61.1 National Longitudinal Sample (1985 – 2013) ........................................................134
61.2 Independent Metropolitan Area Oversample Longitudinal History (1974 – 1981)134
61.3 Metropolitan Area Definition (1974, 1977, 1981)..................................................134
62 Springfield ................................................................................................ 135
62.1 National Longitudinal Sample (1985 – 2013) ........................................................135
62.2 Independent Metropolitan Area Oversample Longitudinal History (1975 – 1978)135
62.3 Metropolitan Area Definition (1975, 1978) ...........................................................135
63 St. Louis ..................................................................................................... 136
63.1 National Longitudinal Sample (1985 – 2013) ........................................................136
63.2 Independent Metropolitan Area Oversample Longitudinal History (1976 – 2011)136
63.3 Metropolitan Area Definition (1976, 1980, 1983)..................................................136
63.4 Metropolitan Area Definition (1987, 1991) ...........................................................137
63.5 Metropolitan Area Definition (1996, 2004) ...........................................................137
63.6 Metropolitan Area Definition (2011) ....................................................................138
64 Tampa ....................................................................................................... 139
64.1 National Longitudinal Sample (1985 – 2013) ........................................................139
64.2 Independent Metropolitan Area Oversample Longitudinal History (1985 – 2013)139
64.3 Metropolitan Area Definition (1985, 1989 1993, 1998, 2007, 2013) .......................139
65 Tucson....................................................................................................... 140
65.1 National Longitudinal Sample (1985 – 2013) ........................................................140
65.2 Independent Metropolitan Area Oversample Longitudinal History (2013)...........140
65.3 Metropolitan Area Definition (2013) ....................................................................140
66 Washington................................................................................................ 141
66.1 National Longitudinal Sample (1985 – 2013) ........................................................141
66.2 Independent Metropolitan Area Oversample Longitudinal History (1974 – 2013)141
66.3 Metropolitan Area Definition (1974, 1977, 1981)..................................................141
66.4 Metropolitan Area Definition (1985, 1989, 1993)..................................................142
Metropolitan Area Histories 1973 to 2013 14

–
66.5 Metropolitan Area Definition (1998) ....................................................................142
66.6 Metropolitan Area Definition (2007, 2013) ...........................................................143
67 Wichita ...................................................................................................... 144
67.1 National Longitudinal Sample (1985 – 2013) ........................................................144
67.2 Independent Metropolitan Area Oversample Longitudinal History (1974 – 1981)144
67.3 Metropolitan Area Definition (1974, 1977, 1981)..................................................144
Metropolitan Area Histories 1973 to 2013 15
–
Overview The purpose of this document is to explain how the Department of Housing and Urban Development (HUD) and the U.S. Census Bureau (Census Bureau) implemented independent metropolitan area longitudinal oversamples from 1973 - 2013.
The American Housing Survey (AHS) is a longitudinal survey in which the same housing units are surveyed repeatedly. Since it began in 1973, the AHS has been composed of a national longitudinal sample and independent metropolitan area longitudinal oversamples. From 1973 to 2013, there were two national longitudinal samples (1973–1983 and 1985–2013). During this time, the Census Bureau also surveyed independent longitudinal oversamples for more than 60 metropolitan areas, each spanning various time periods.
The national longitudinal sample microdata records and the AHS independent metropolitan area longitudinal oversamples microdata records are published as separate public use files (PUFs)1. There were three exceptions to this practice and these exceptions were put in place to improve the precision of national estimates while still maintaining the ability to produce metropolitan area estimates with an acceptable level of precision. The three exceptions were:
• The AHS metropolitan area sample microdata records from the Big 5 (Chicago, Detroit, New York City, Northern New Jersey, and Philadelphia) metropolitan areas were integrated into the national longitudinal sample PUF for 2009 and 2013.
• The AHS metropolitan area sample microdata records from Los Angeles was integrated into the national longitudinal sample PUF for 2011.
• The AHS metropolitan area sample microdata records from the Big 6 areas (the Big 5 plus Los Angeles) was integrated into the national longitudinal sample PUF for 1995, 1999, and 2003.
Specific metropolitan areas are identified in the national longitudinal sample PUF. However, other than the exceptions above, the national longitudinal sample does not include enough records in specific metropolitan areas to produce reliable estimates. That is why the AHS includes independent metropolitan area longitudinal oversamples.
This history of the independent metropolitan area longitudinal oversamples can be complicated for users to understand for at least two reasons. First, considering the whole time period from 1973 and 2013, there is no long-term pattern to when specific metropolitan area longitudinal oversamples were surveyed. In the early years, an attempt was made to survey metropolitan area longitudinal oversamples in a regular pattern, but this pattern was abandoned for administrative and budget reasons.
1 When the 2011 estimates were initially released, the national longitudinal sample and metropolitan area samples records were merged into one "combined national sample PUF." The combined file was only created for 2011, and in following years the separate national and metropolitan PUFs were again created. In April 2019, to make 2011 more comparable to other years, the 2011 PUF was re-released as separate national longitudinal sample and metropolitan area sample PUFs (with revised weights).
Metropolitan Area Histories 1973 to 2013 16
–
The second reason the history of the independent metropolitan area longitudinal oversamples is complicated is that many samples were re-drawn, thereby breaking the longitudinally of the oversample. However, there was no discernable pattern to which metropolitan areas were chosen to have their oversample “re-set.”
The third reason the history of the independent metropolitan area longitudinal oversamples is complicated is that the geographic definition (i.e., counties) used to define a metropolitan area for the AHS changed over time. It is well-known that the Office of Management and Budget (OMB) redefines metropolitan areas every ten years. In some instance, the AHS program followed suit, while in other instance, it did not. In a few instances, the AHS program simply developed their own definition for metropolitan areas.
We developed this document to help AHS users navigate the complexity. Within this document, metropolitan areas are presented in alphabetical order. For each metropolitan area, the following information is presented:
• The national longitudinal sample metropolitan area definition.
• The longitudinal history of the independent metropolitan area longitudinal oversample(s).
• The geographic definition of the independent metropolitan area longitudinal oversample(s), by survey year.
Metropolitan Area Histories 1973 to 2013 17
–
1 Albany
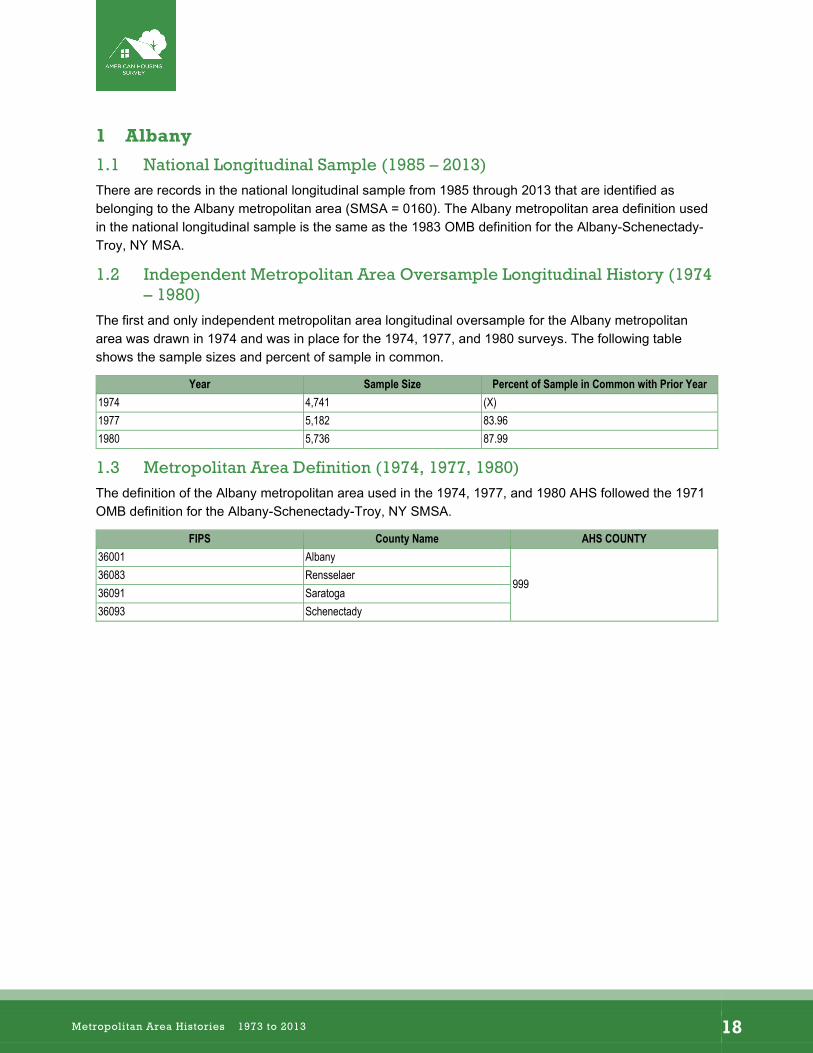
1.1 National Longitudinal Sample (1985 – 2013) There are records in the national longitudinal sample from 1985 through 2013 that are identified as belonging to the Albany metropolitan area (SMSA = 0160). The Albany metropolitan area definition used in the national longitudinal sample is the same as the 1983 OMB definition for the Albany-Schenectady-Troy, NY MSA.
1.2 Independent Metropolitan Area Oversample Longitudinal History (1974 – 1980)
The first and only independent metropolitan area longitudinal oversample for the Albany metropolitan area was drawn in 1974 and was in place for the 1974, 1977, and 1980 surveys. The following table shows the sample sizes and percent of sample in common.
Year Sample Size Percent of Sample in Common with Prior Year 1974 4,741 (X) 1977 5,182 83.96 1980 5,736 87.99
1.3 Metropolitan Area Definition (1974, 1977, 1980) The definition of the Albany metropolitan area used in the 1974, 1977, and 1980 AHS followed the 1971 OMB definition for the Albany-Schenectady-Troy, NY SMSA.
FIPS County Name AHS COUNTY 36001 Albany
99936083 Rensselaer 36091 Saratoga 36093 Schenectady
Metropolitan Area Histories 1973 to 2013 18
–
2 Allentown
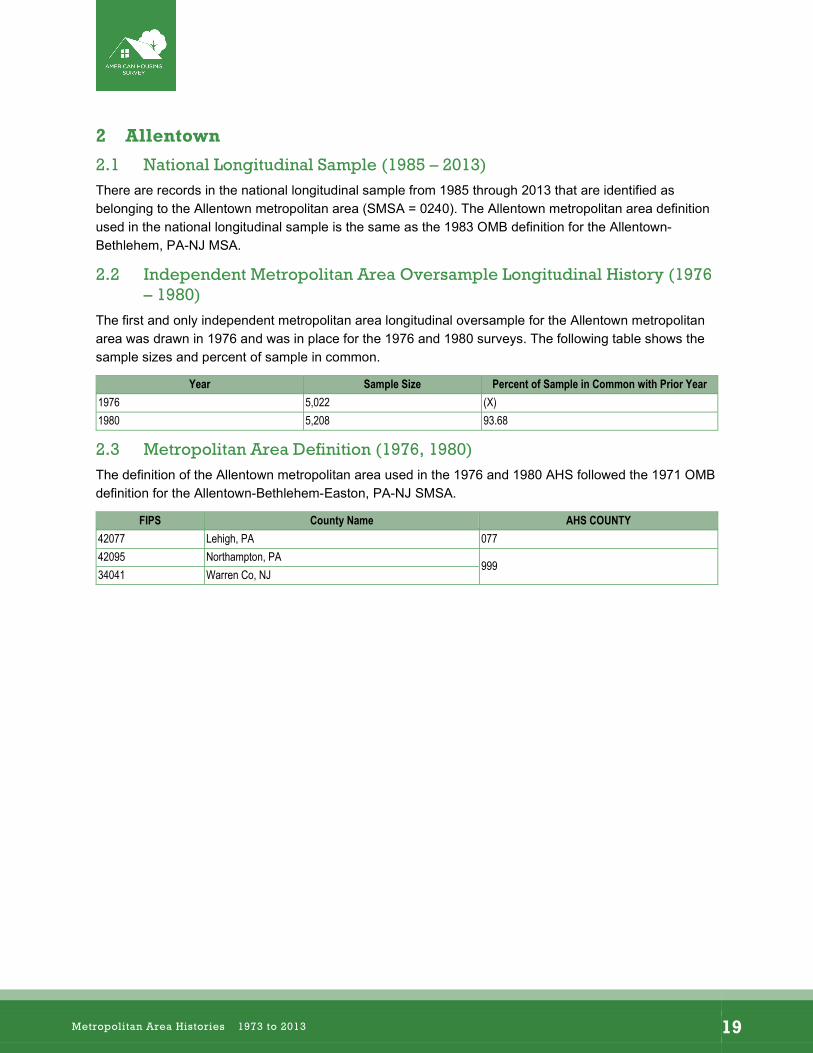
2.1 National Longitudinal Sample (1985 – 2013) There are records in the national longitudinal sample from 1985 through 2013 that are identified as belonging to the Allentown metropolitan area (SMSA = 0240). The Allentown metropolitan area definition used in the national longitudinal sample is the same as the 1983 OMB definition for the Allentown-Bethlehem, PA-NJ MSA.
2.2 Independent Metropolitan Area Oversample Longitudinal History (1976 – 1980)
The first and only independent metropolitan area longitudinal oversample for the Allentown metropolitan area was drawn in 1976 and was in place for the 1976 and 1980 surveys. The following table shows the sample sizes and percent of sample in common.
Year Sample Size Percent of Sample in Common with Prior Year 1976 5,022 (X) 1980 5,208 93.68
2.3 Metropolitan Area Definition (1976, 1980) The definition of the Allentown metropolitan area used in the 1976 and 1980 AHS followed the 1971 OMB definition for the Allentown-Bethlehem-Easton, PA-NJ SMSA.
FIPS County Name AHS COUNTY 42077 Lehigh, PA 077 42095 Northampton, PA
99934041 Warren Co, NJ
Metropolitan Area Histories 1973 to 2013 19
–
3 Anaheim
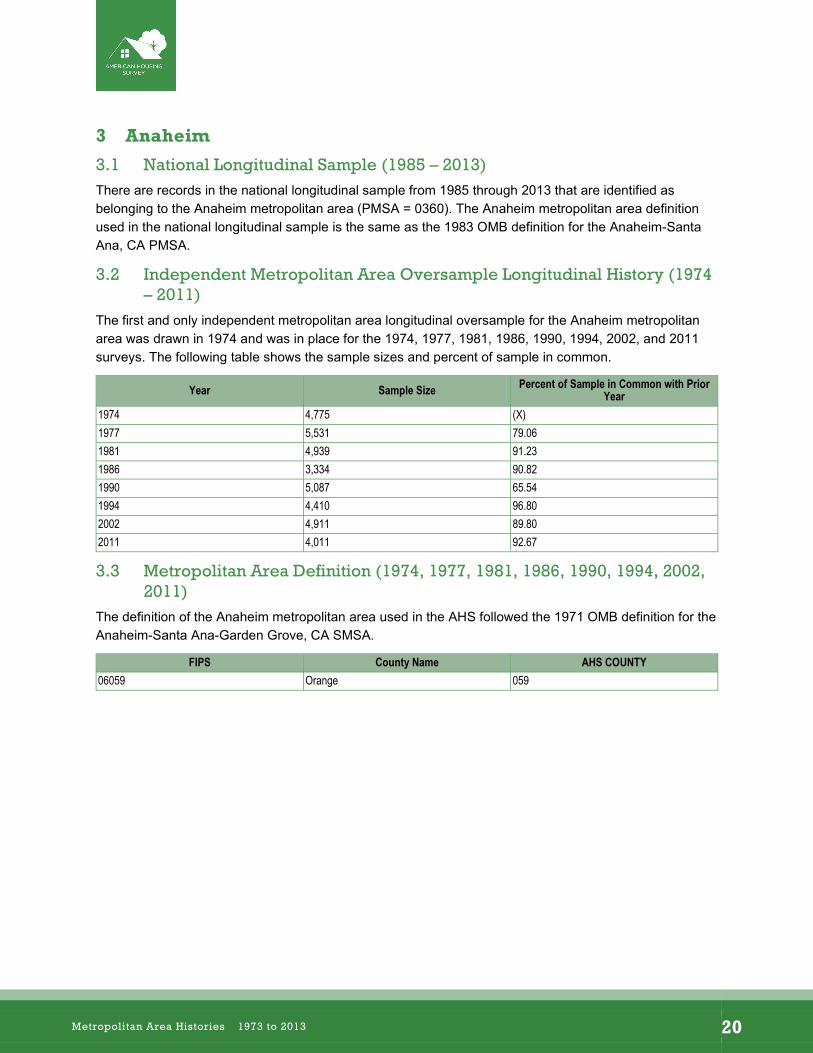
3.1 National Longitudinal Sample (1985 – 2013) There are records in the national longitudinal sample from 1985 through 2013 that are identified as belonging to the Anaheim metropolitan area (PMSA = 0360). The Anaheim metropolitan area definition used in the national longitudinal sample is the same as the 1983 OMB definition for the Anaheim-Santa Ana, CA PMSA.
3.2 Independent Metropolitan Area Oversample Longitudinal History (1974 – 2011)
The first and only independent metropolitan area longitudinal oversample for the Anaheim metropolitan area was drawn in 1974 and was in place for the 1974, 1977, 1981, 1986, 1990, 1994, 2002, and 2011 surveys. The following table shows the sample sizes and percent of sample in common.
Year Sample Size Percent of Sample in Common with PriorYear
1974 4,775 (X) 1977 5,531 79.06 1981 4,939 91.23 1986 3,334 90.82 1990 5,087 65.54 1994 4,410 96.80 2002 4,911 89.80 2011 4,011 92.67
3.3 Metropolitan Area Definition (1974, 1977, 1981, 1986, 1990, 1994, 2002, 2011)
The definition of the Anaheim metropolitan area used in the AHS followed the 1971 OMB definition for the Anaheim-Santa Ana-Garden Grove, CA SMSA.
FIPS County Name AHS COUNTY 06059 Orange 059
Metropolitan Area Histories 1973 to 2013 20
–
4 Atlanta
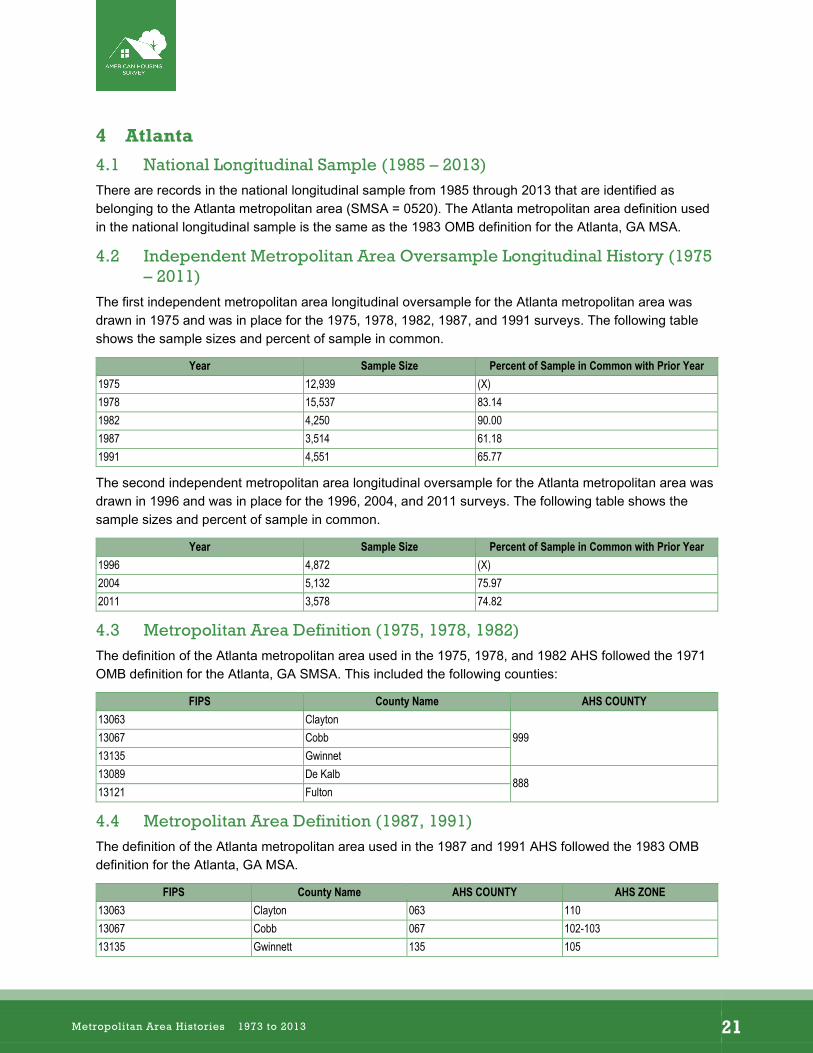
4.1 National Longitudinal Sample (1985 – 2013) There are records in the national longitudinal sample from 1985 through 2013 that are identified as belonging to the Atlanta metropolitan area (SMSA = 0520). The Atlanta metropolitan area definition used in the national longitudinal sample is the same as the 1983 OMB definition for the Atlanta, GA MSA.
4.2 Independent Metropolitan Area Oversample Longitudinal History (1975 – 2011)
The first independent metropolitan area longitudinal oversample for the Atlanta metropolitan area was drawn in 1975 and was in place for the 1975, 1978, 1982, 1987, and 1991 surveys. The following table shows the sample sizes and percent of sample in common.
Year Sample Size Percent of Sample in Common with Prior Year 1975 12,939 (X) 1978 15,537 83.14 1982 4,250 90.00 1987 3,514 61.18 1991 4,551 65.77
The second independent metropolitan area longitudinal oversample for the Atlanta metropolitan area was drawn in 1996 and was in place for the 1996, 2004, and 2011 surveys. The following table shows the sample sizes and percent of sample in common.
Year Sample Size Percent of Sample in Common with Prior Year 1996 4,872 (X) 2004 5,132 75.97 2011 3,578 74.82
4.3 Metropolitan Area Definition (1975, 1978, 1982) The definition of the Atlanta metropolitan area used in the 1975, 1978, and 1982 AHS followed the 1971 OMB definition for the Atlanta, GA SMSA. This included the following counties:
FIPS County Name AHS COUNTY 13063 Clayton
99913067 Cobb 13135 Gwinnet 13089 De Kalb
88813121 Fulton
4.4 Metropolitan Area Definition (1987, 1991) The definition of the Atlanta metropolitan area used in the 1987 and 1991 AHS followed the 1983 OMB definition for the Atlanta, GA MSA.
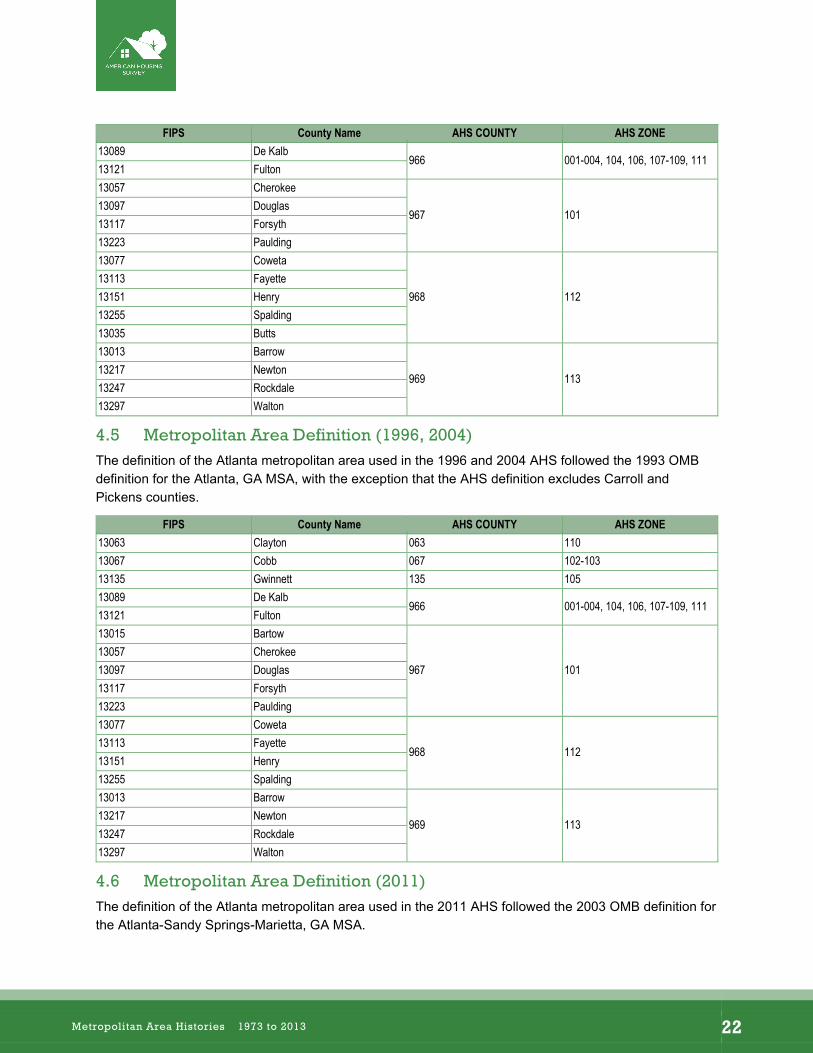
FIPS County Name AHS COUNTY AHS ZONE 13063 Clayton 063 110 13067 Cobb 067 102-103 13135 Gwinnett 135 105
Metropolitan Area Histories 1973 to 2013 21
–
FIPS County Name AHS COUNTY AHS ZONE 13089 De Kalb
966 001-004, 104, 106, 107-109, 111 13121 Fulton 13057 Cherokee
967 10113097 Douglas 13117 Forsyth 13223 Paulding 13077 Coweta
968 112 13113 Fayette 13151 Henry 13255 Spalding 13035 Butts 13013 Barrow
969 11313217 Newton 13247 Rockdale 13297 Walton
4.5 Metropolitan Area Definition (1996, 2004) The definition of the Atlanta metropolitan area used in the 1996 and 2004 AHS followed the 1993 OMB definition for the Atlanta, GA MSA, with the exception that the AHS definition excludes Carroll and Pickens counties.
FIPS County Name AHS COUNTY AHS ZONE 13063 Clayton 063 110 13067 Cobb 067 102-103 13135 Gwinnett 135 105 13089 De Kalb
966 001-004, 104, 106, 107-109, 111 13121 Fulton 13015 Bartow
967 101 13057 Cherokee 13097 Douglas 13117 Forsyth 13223 Paulding 13077 Coweta
968 11213113 Fayette 13151 Henry 13255 Spalding 13013 Barrow
969 11313217 Newton 13247 Rockdale 13297 Walton
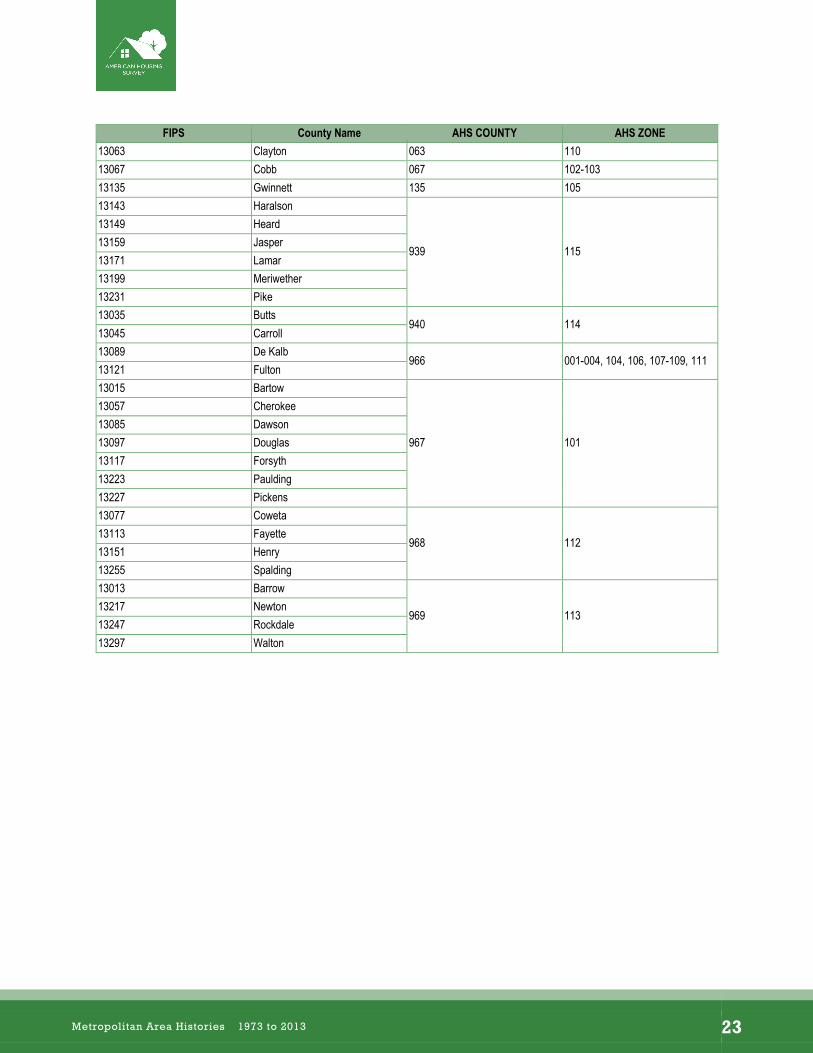
4.6 Metropolitan Area Definition (2011) The definition of the Atlanta metropolitan area used in the 2011 AHS followed the 2003 OMB definition for the Atlanta-Sandy Springs-Marietta, GA MSA.
Metropolitan Area Histories 1973 to 2013 22
–
FIPS County Name AHS COUNTY AHS ZONE 13063 Clayton 063 110 13067 Cobb 067 102-103 13135 Gwinnett 135 105 13143 Haralson
939 115
13149 Heard 13159 Jasper 13171 Lamar 13199 Meriwether 13231 Pike 13035 Butts
940 11413045 Carroll 13089 De Kalb
966 001-004, 104, 106, 107-109, 111 13121 Fulton 13015 Bartow
967 101
13057 Cherokee 13085 Dawson 13097 Douglas 13117 Forsyth 13223 Paulding 13227 Pickens 13077 Coweta
968 11213113 Fayette 13151 Henry 13255 Spalding 13013 Barrow
969 11313217 Newton 13247 Rockdale 13297 Walton
Metropolitan Area Histories 1973 to 2013 23
–
5 Austin
5.1 National Longitudinal Sample (1985-2013) There are records in the national longitudinal sample from 1985-2013 that are identified as belonging to the Austin metropolitan area (SMSA = 0640). The Austin metropolitan area definition used in the national longitudinal sample is the same as the 1983 OMB definition for the Austin, TX MSA.
5.2 Independent Metropolitan Area Oversample Longitudinal History (2013)
The first and only independent metropolitan area longitudinal oversample for the Austin metropolitan area was drawn in 2013. The following table shows the sample size.
Year Sample Size Percent of Sample in Common with Prior Year 2013 4,185 (X)
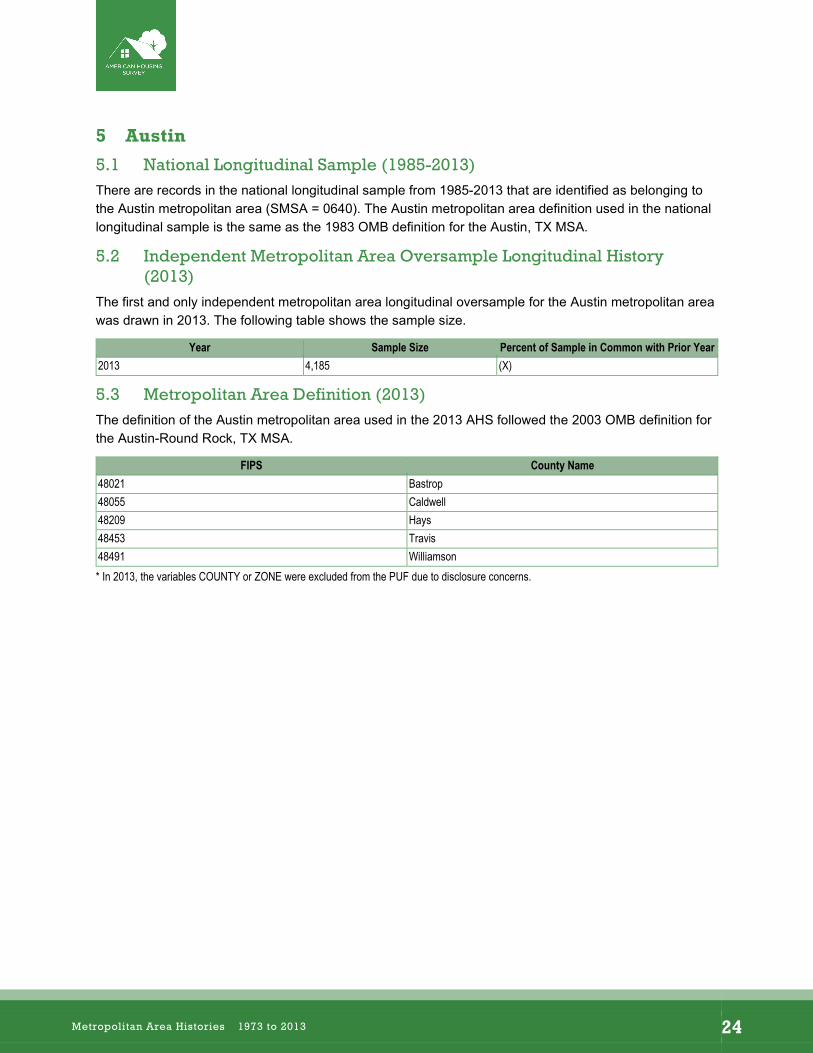
5.3 Metropolitan Area Definition (2013) The definition of the Austin metropolitan area used in the 2013 AHS followed the 2003 OMB definition for the Austin-Round Rock, TX MSA.
FIPS County Name 48021 Bastrop 48055 Caldwell 48209 Hays 48453 Travis 48491 Williamson * In 2013, the variables COUNTY or ZONE were excluded from the PUF due to disclosure concerns.
Metropolitan Area Histories 1973 to 2013 24

–
6 Baltimore
6.1 National Longitudinal Sample (1985 – 2013) There are records in the national longitudinal sample from 1985 through 2013 that are identified as belonging to the Baltimore metropolitan area (SMSA = 0720). The Baltimore metropolitan area definition used in the national longitudinal sample is the same as the 1983 OMB definition for Baltimore, MD MSA.
6.2 Independent Metropolitan Area Oversample Longitudinal History (1976 – 2013)
The first independent metropolitan area longitudinal oversample for the Baltimore metropolitan area was drawn in 1976 and was in place for the 1976, 1979, 1983, 1987, and 1991 surveys. The following table shows the sample sizes and percent of sample in common.
Year Sample Size Percent of Sample in Common with Prior Year 1976 5,270 (X) 1979 5,436 92.79 1983 4,287 95.52 1987 3,317 89.63 1991 4,413 64.67
The second independent metropolitan area longitudinal oversample for the Baltimore metropolitan area was drawn in 1998 and was in place for the 1998, 2007, and 2013 surveys. The following table shows the sample sizes and percent of sample in common.
Year Sample Size Percent of Sample in Common with Prior Year 1998 4,714 (X) 2007 2,733 82.47 2013 4,065 61.92
6.3 Metropolitan Area Definition (1976, 1979, 1983) The definition of the Baltimore metropolitan area used in the 1976, 1979, and 1983 AHS followed the 1971 OMB definition for the Baltimore, MD SMSA.
FIPS County Name AHS COUNTY 24510 Baltimore City 510 24005 Baltimore 005 24003 Anne Arundel
99924013 Carroll 24025 Harford 24027 Howard
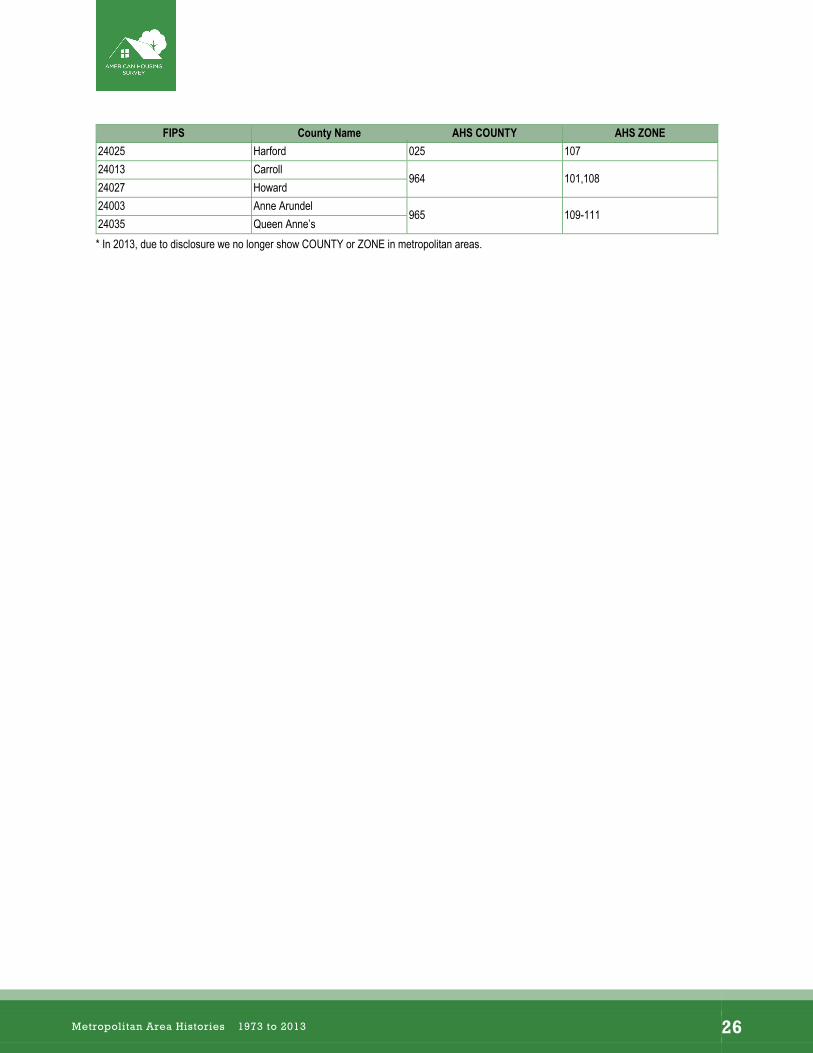
6.4 Metropolitan Area Definition (1987, 1991, 1998, 2007, 2013) The definition of the Baltimore metropolitan area used in the 1987, 1991, 1998, 2007, and 2013 AHS followed the 1983 OMB definition for the Baltimore, MD MSA.
FIPS County Name AHS COUNTY AHS ZONE 24510 Baltimore City 510 001-006 24005 Baltimore 005 102-106
Metropolitan Area Histories 1973 to 2013 25
–
FIPS County Name AHS COUNTY AHS ZONE 24025 Harford 025 107 24013 Carroll
964 101,108 24027 Howard 24003 Anne Arundel
965 109-111 24035 Queen Anne’s * In 2013, due to disclosure we no longer show COUNTY or ZONE in metropolitan areas.
Metropolitan Area Histories 1973 to 2013 26

–
7 Birmingham
7.1 National Longitudinal Sample (1985 – 2013) There are records in the national longitudinal sample from 1985 through 2013 that are identified as belonging to the Birmingham metropolitan area (SMSA = 1000). The Birmingham metropolitan area definition used in the national longitudinal sample is the same as the 1983 OMB definition for the Birmingham, AL MSA.
7.2 Independent Metropolitan Area Oversample Longitudinal History (1976 – 2011)
The first independent metropolitan area longitudinal oversample for the Birmingham metropolitan area was drawn in 1976 and was in place for the 1976, 1980, 1984, 1988, and 1992 surveys. The following table shows the sample sizes and percent of sample in common.
Year Sample Size Percent of Sample in Common with Prior Year 1976 5,235 (X) 1980 5,408 90.26 1984 4,184 87.57 1988 3,774 93.80 1992 5,229 72.16
The second independent metropolitan area longitudinal oversample for the Birmingham metropolitan area was drawn in 1998 and was in place for the 1998 and 2011 surveys. The following table shows the sample sizes and percent of sample in common.
Year Sample Size Percent of Sample in Common with Prior Year 1998 5,066 (X) 2011 4,387 58.19
7.3 Metropolitan Area Definition (1976, 1980) The definition of the Birmingham metropolitan area used in the 1976 and 1980 AHS followed the 1971 OMB definition for the Birmingham, AL SMSA.
FIPS County Name AHS COUNTY 01073 Jefferson
99901117 Shelby 01127 Walker
Metropolitan Area Histories 1973 to 2013 27
–
7.4 Metropolitan Area Definition (1984, 1988, 1992) The definition of the Birmingham metropolitan area used in the 1984, 1988, and 1992 AHS followed the 1983 OMB definition for the Birmingham, AL MSA.
FIPS County Name AHS COUNTY AHS ZONE 01073 Jefferson 073 001-002, 101-103 01117 Shelby
993 10401127 Walker 01115 St. Clair 01009 Blount
7.5 Metropolitan Area Definition (1998) The definition of the Birmingham metropolitan area used in the 1998 AHS followed the 1993 OMB definition for the Birmingham, AL MSA.
FIPS County Name AHS COUNTY AHS ZONE 01073 Jefferson 073 001-002, 101-103 01117 Shelby
993 10401115 St. Clair 01009 Blount
7.6 Metropolitan Area Definition (2011) The definition of the Birmingham metropolitan area used in the 2011 AHS followed the 2003 OMB definition for the Birmingham-Hoover, AL MSA.
FIPS County Name AHS COUNTY AHS ZONE 01073 Jefferson 073 001-002, 101-103 01117 Shelby
993 10401115 St. Clair 01009 Blount 01007 Bibb
943 10501021 Chilton 01127 Walker
Metropolitan Area Histories 1973 to 2013 28
–
8 Boston
8.1 National Longitudinal Sample (1985 – 2013) There are records in the national longitudinal sample from 1985 through 2013 that are identified as belonging to the Boston metropolitan area (SMSA = 1120 or CMSA = 41). The Boston metropolitan area definition used in the national longitudinal sample is the same as the 1983 OMB definition for the Boston, MA PMSA and the Boston-Lawrence-Salem, MA-NH CMSA, respectively.
8.2 Independent Metropolitan Area Oversample Longitudinal History (1974 – 2013)
The first independent metropolitan area longitudinal oversample for the Boston metropolitan area was drawn in 1974 and was in place for the 1974, 1977, 1981, 1985, 1989, and 1993 surveys. The following table shows the sample sizes and percent of sample in common.
Year Sample Size Percent of Sample in Common with Prior Year
1974 13,661 (X) 1977 15,245 81.91 1981 5,701 97.02 1985 4,017 64.95 1989 3,996 87.94 1993 5,258 76.00
The second independent metropolitan area longitudinal oversample for the Boston metropolitan area was drawn in 1998 and was in place for the 1998, 2007, and 2013 surveys. The following table shows the sample sizes and percent of sample in common.
Year Sample Size Percent of Sample in Common with PriorYear
1998 4,528 (X) 2007 2,771 57.70 2013 4,025 64.03
8.3 Metropolitan Area Definition (1974, 1977, 1981) The definition of the Boston metropolitan area used in the 1974, 1977, and 1981 AHS followed the 1971 OMB definition for the Boston, MA SMSA.
8.4 Metropolitan Area Definition (1985, 1989, 1993) The definition of the Boston metropolitan area used in the 1985, 1989, and 1993 AHS followed the 1983 OMB definition for the Boston-Lawrence-Salem, MA-NH CMSA.
Metropolitan Area Histories 1973 to 2013 29
–
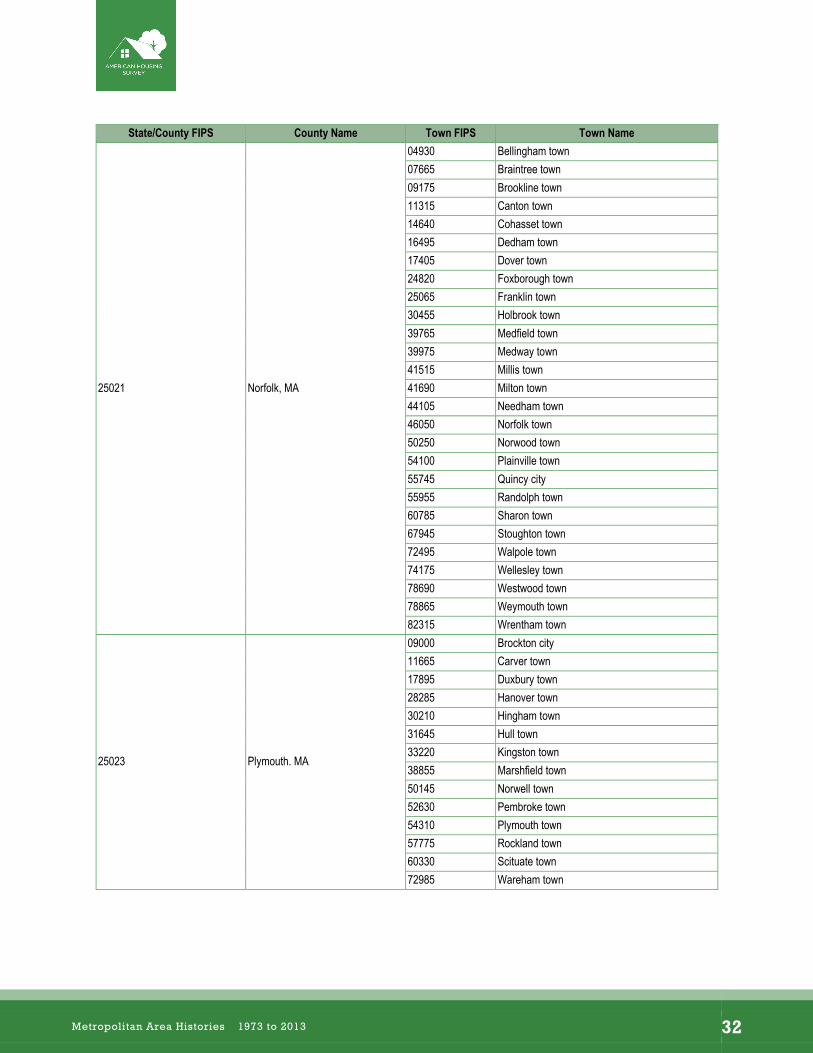
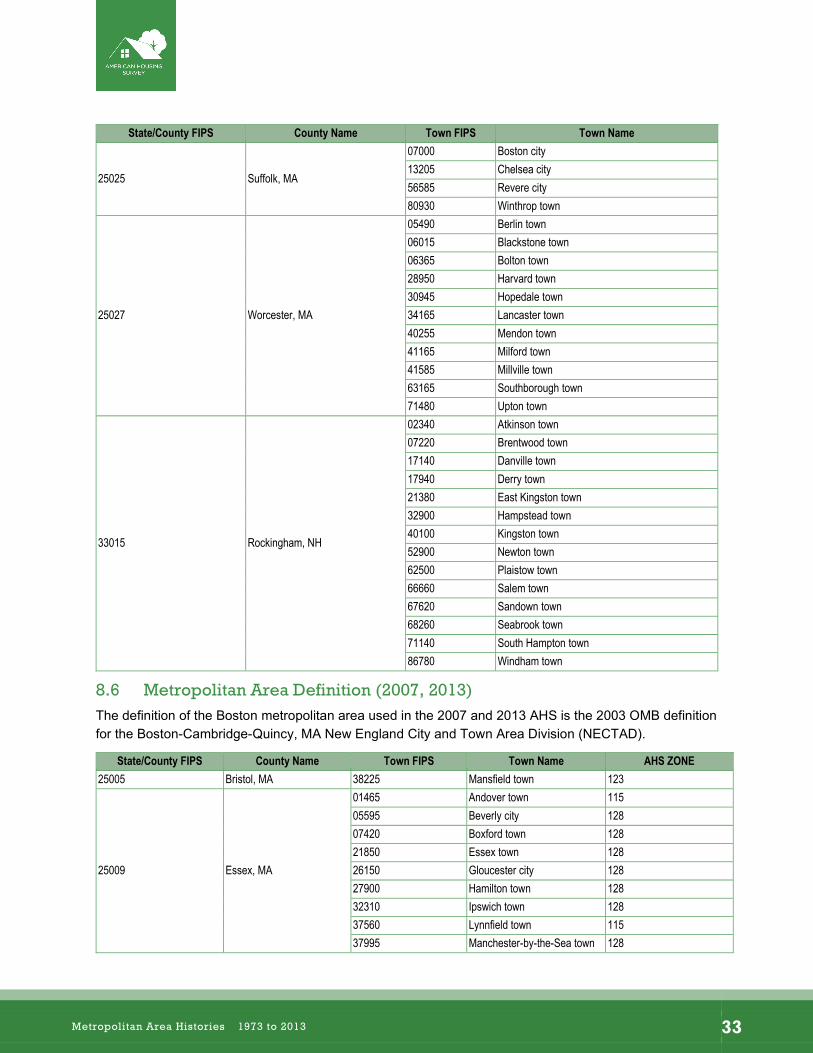
8.5 Metropolitan Area Definition (1998) The definition of the Boston metropolitan area used in the 1998 AHS does not follow the OMB definition from any particular vintage, but is closest to the 1993 OMB definition of the Boston, MA-NH PMSA.
State/County FIPS County Name Town FIPS Town Name
25005 Bristol, MA
05280 Berkley town 16950 Dighton town 38225 Mansfield town 49970 Norton town 69170 Taunton town
25009 Essex, MA
01185 Amesbury town 01465 Andover town 05595 Beverly city 07420 Boxford town 16250 Danvers town 21850 Essex town 25625 Georgetown town 26150 Gloucester city 27620 Groveland town 27900 Hamilton town 29405 Haverhill city 32310 Ipswich town 34550 Lawrence city 37490 Lynn city 37560 Lynnfield town 37995 Manchester town 38400 Marblehead town 40430 Merrimac town 40710 Methuen town 41095 Middleton town 43580 Nahant town 45175 Newbury town 45245 Newburyport city 46365 North Andover town 52490 Peabody city 57880 Rockport town 58405 Rowley town 59105 Salem city 59245 Salisbury town 60015 Saugus town 68645 Swampscott town 70150 Topsfield town 74595 Wenham town
77150 West Newbury town
Metropolitan Area Histories 1973 to 2013 30
–
State/County FIPS County Name Town FIPS Town Name
25017 Middlesex, MA
00380 Acton town 01605 Arlington town 02130 Ashland town 03005 Ayer town 04615 Bedford town 05070 Belmont town 07350 Boxborough town 09840 Burlington town 11000 Cambridge city 11525 Carlisle town 15060 Concord town 21990 Everett city 24925 Framingham town 30700 Holliston town 31085 Hopkinton town 31540 Hudson town 35215 Lexington town 35425 Lincoln town 35950 Littleton town 37875 Malden city 38715 Marlborough city 39625 Maynard town 39835 Medford city 40115 Melrose city 43895 Natick town 45560 Newton city 48955 North Reading town 56130 Reading town 61380 Sherborn town 61590 Shirley town 62535 Somerville city 67665 Stoneham town 68050 Stow town 68260 Sudbury town 70360 Townsend town 72215 Wakefield town 72600 Waltham city 73405 Watertown town 73790 Wayland town 77255 Weston town 80230 Wilmington town 80510 Winchester town
81035 Woburn city
Metropolitan Area Histories 1973 to 2013 31
–
State/County FIPS County Name Town FIPS Town Name
25021 Norfolk, MA
04930 Bellingham town 07665 Braintree town 09175 Brookline town 11315 Canton town 14640 Cohasset town 16495 Dedham town 17405 Dover town 24820 Foxborough town 25065 Franklin town 30455 Holbrook town 39765 Medfield town 39975 Medway town 41515 Millis town 41690 Milton town 44105 Needham town 46050 Norfolk town 50250 Norwood town 54100 Plainville town 55745 Quincy city 55955 Randolph town 60785 Sharon town 67945 Stoughton town 72495 Walpole town 74175 Wellesley town 78690 Westwood town 78865 Weymouth town 82315 Wrentham town
25023 Plymouth. MA
09000 Brockton city 11665 Carver town 17895 Duxbury town 28285 Hanover town 30210 Hingham town 31645 Hull town 33220 Kingston town 38855 Marshfield town 50145 Norwell town 52630 Pembroke town 54310 Plymouth town 57775 Rockland town 60330 Scituate town 72985 Wareham town
Metropolitan Area Histories 1973 to 2013 32
–
State/County FIPS County Name Town FIPS Town Name
25025 Suffolk, MA
07000 Boston city 13205 Chelsea city 56585 Revere city 80930 Winthrop town
25027 Worcester, MA
05490 Berlin town 06015 Blackstone town 06365 Bolton town 28950 Harvard town 30945 Hopedale town 34165 Lancaster town 40255 Mendon town 41165 Milford town 41585 Millville town 63165 Southborough town 71480 Upton town
33015 Rockingham, NH
02340 Atkinson town 07220 Brentwood town 17140 Danville town 17940 Derry town 21380 East Kingston town 32900 Hampstead town 40100 Kingston town 52900 Newton town 62500 Plaistow town 66660 Salem town 67620 Sandown town 68260 Seabrook town 71140 South Hampton town 86780 Windham town
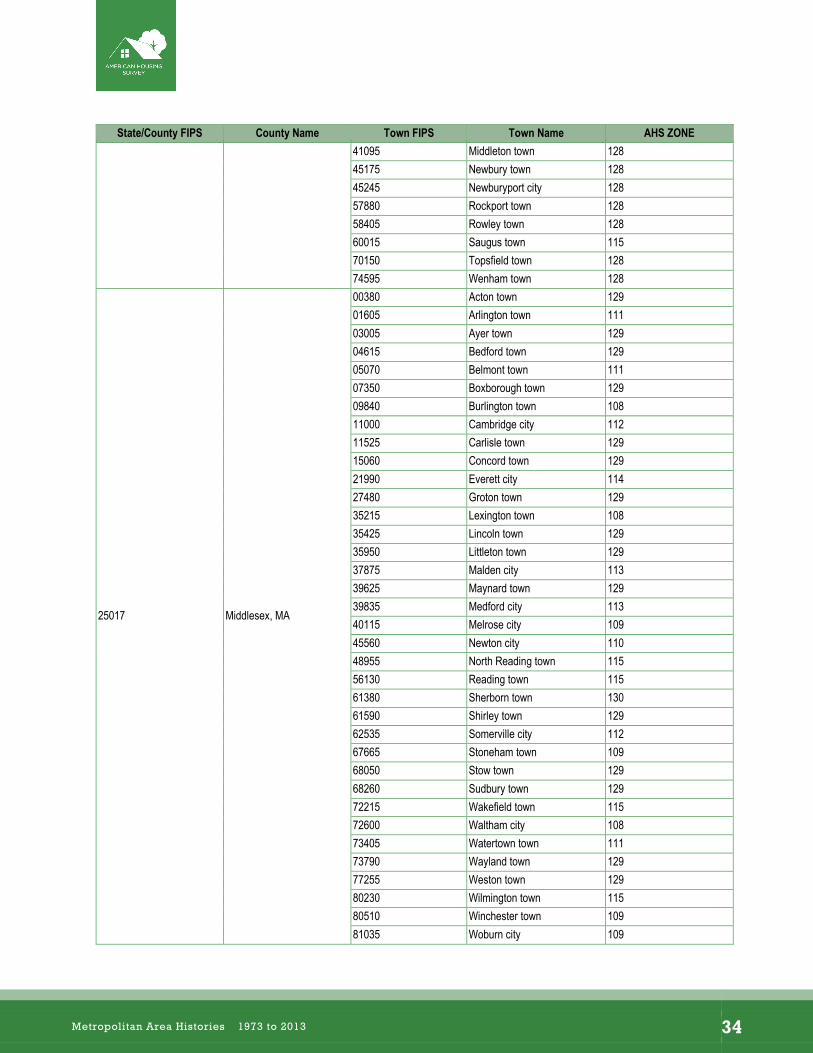
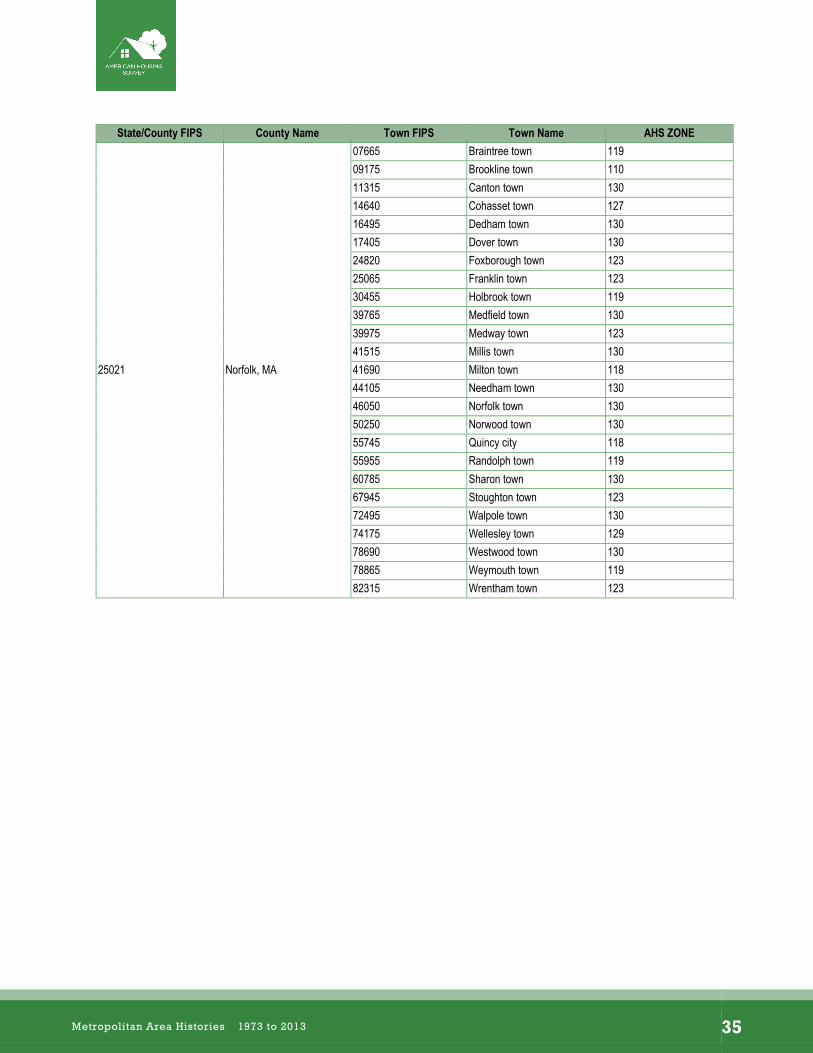
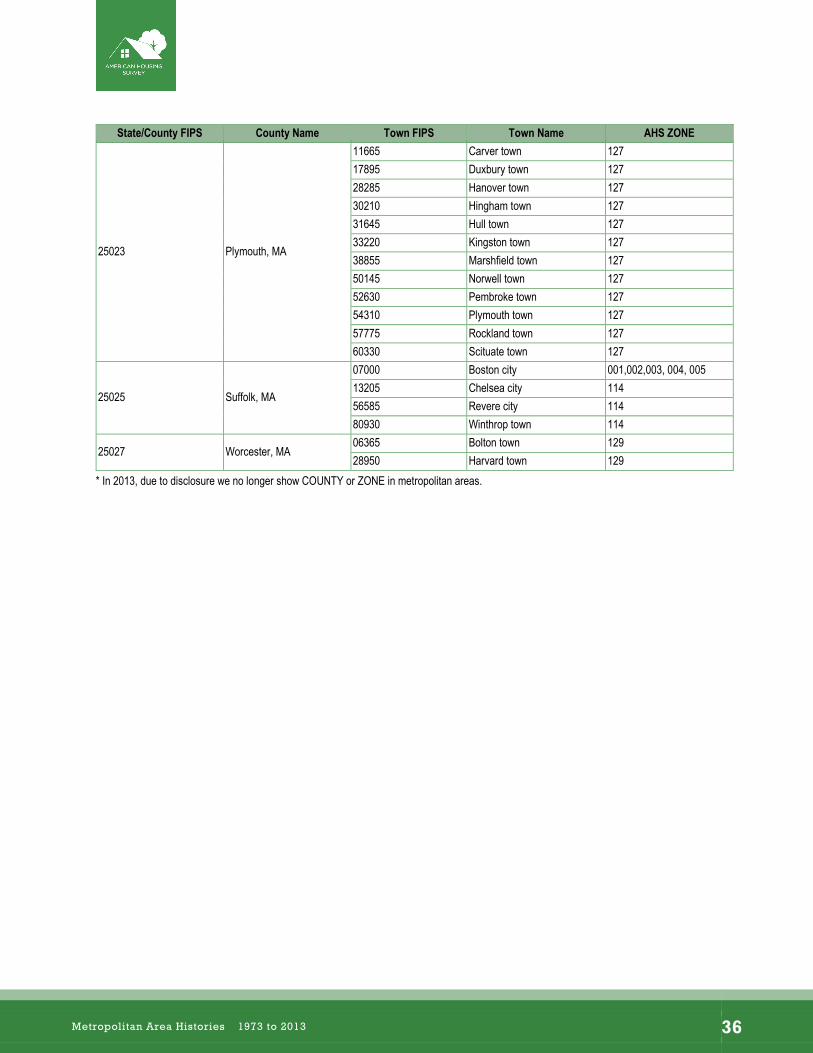
8.6 Metropolitan Area Definition (2007, 2013) The definition of the Boston metropolitan area used in the 2007 and 2013 AHS is the 2003 OMB definition for the Boston-Cambridge-Quincy, MA New England City and Town Area Division (NECTAD).
State/County FIPS County Name Town FIPS Town Name AHS ZONE 25005 Bristol, MA 38225 Mansfield town 123
01465 Andover town 115 05595 Beverly city 128 07420 Boxford town 128 21850 Essex town 128
25009 Essex, MA 26150 Gloucester city 128 27900 Hamilton town 128 32310 Ipswich town 128 37560 Lynnfield town 115 37995 Manchester-by-the-Sea town 128
Metropolitan Area Histories 1973 to 2013 33
–
State/County FIPS County Name Town FIPS Town Name AHS ZONE 41095 Middleton town 128 45175 Newbury town 128 45245 Newburyport city 128 57880 Rockport town 128 58405 Rowley town 128 60015 Saugus town 115 70150 Topsfield town 128 74595 Wenham town 128
25017 Middlesex, MA
00380 Acton town 129 01605 Arlington town 111 03005 Ayer town 129 04615 Bedford town 129 05070 Belmont town 111 07350 Boxborough town 129 09840 Burlington town 108 11000 Cambridge city 112 11525 Carlisle town 129 15060 Concord town 129 21990 Everett city 114 27480 Groton town 129 35215 Lexington town 108 35425 Lincoln town 129 35950 Littleton town 129 37875 Malden city 113 39625 Maynard town 129 39835 Medford city 113 40115 Melrose city 109 45560 Newton city 110 48955 North Reading town 115 56130 Reading town 115 61380 Sherborn town 130 61590 Shirley town 129 62535 Somerville city 112 67665 Stoneham town 109 68050 Stow town 129 68260 Sudbury town 129 72215 Wakefield town 115 72600 Waltham city 108 73405 Watertown town 111 73790 Wayland town 129 77255 Weston town 129 80230 Wilmington town 115 80510 Winchester town 109 81035 Woburn city 109
Metropolitan Area Histories 1973 to 2013 34
–
State/County FIPS County Name Town FIPS Town Name AHS ZONE
25021 Norfolk, MA
07665 Braintree town 119 09175 Brookline town 110 11315 Canton town 130 14640 Cohasset town 127 16495 Dedham town 130 17405 Dover town 130 24820 Foxborough town 123 25065 Franklin town 123 30455 Holbrook town 119 39765 Medfield town 130 39975 Medway town 123 41515 Millis town 130 41690 Milton town 118 44105 Needham town 130 46050 Norfolk town 130 50250 Norwood town 130 55745 Quincy city 118 55955 Randolph town 119 60785 Sharon town 130 67945 Stoughton town 123 72495 Walpole town 130 74175 Wellesley town 129 78690 Westwood town 130 78865 Weymouth town 119 82315 Wrentham town 123
Metropolitan Area Histories 1973 to 2013 35
–
State/County FIPS County Name Town FIPS Town Name AHS ZONE
25023 Plymouth, MA
11665 Carver town 127 17895 Duxbury town 127 28285 Hanover town 127 30210 Hingham town 127 31645 Hull town 127 33220 Kingston town 127 38855 Marshfield town 127 50145 Norwell town 127 52630 Pembroke town 127 54310 Plymouth town 127 57775 Rockland town 127 60330 Scituate town 127
25025 Suffolk, MA
07000 Boston city 001,002,003, 004, 005 13205 Chelsea city 114 56585 Revere city 114 80930 Winthrop town 114
25027 Worcester, MA 06365 Bolton town 129 28950 Harvard town 129
* In 2013, due to disclosure we no longer show COUNTY or ZONE in metropolitan areas.
Metropolitan Area Histories 1973 to 2013 36
–
9 Buffalo
9.1 National Longitudinal Sample (1985 – 2013) There are records in the national longitudinal sample from 1985 through 2013 that are identified as belonging to the Buffalo metropolitan area (CMSA = 10 or PMSA = 1280). The 1983 OMB definition for the Buffalo metropolitan area is too small to show along with other geography variables found on the national file, but it is a component of the Buffalo-Niagara Falls CMSA along with the Buffalo, NY PMSA.
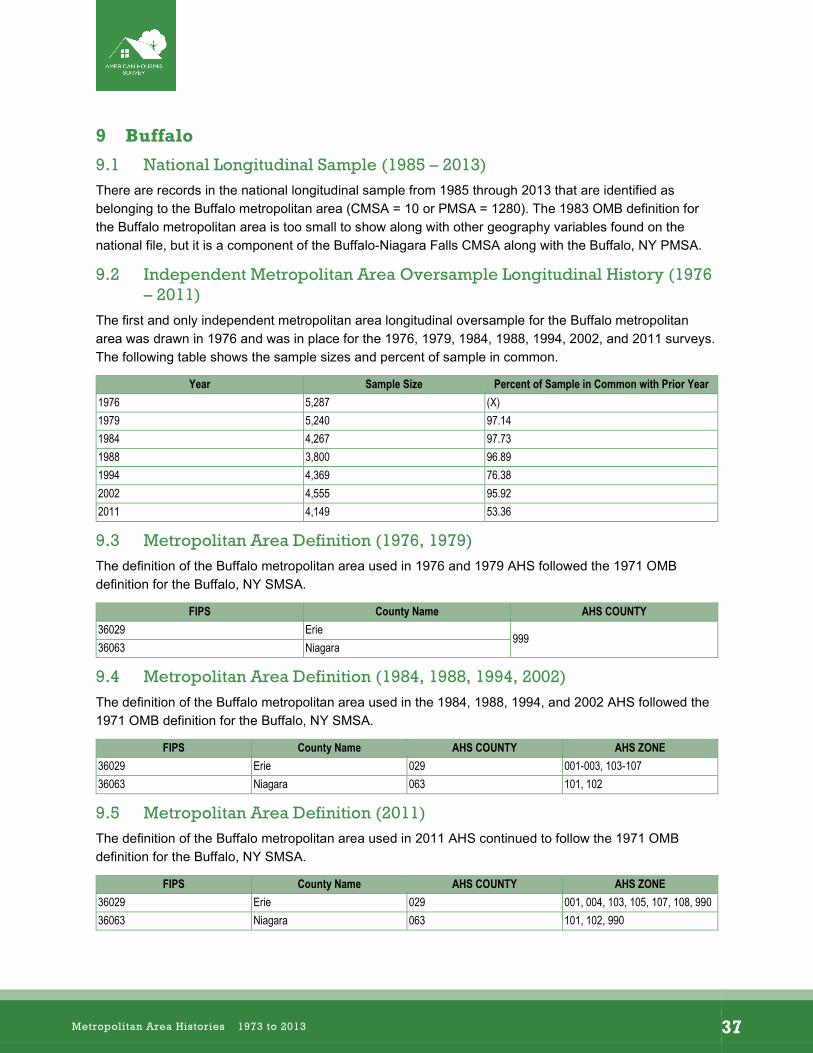
9.2 Independent Metropolitan Area Oversample Longitudinal History (1976 – 2011)
The first and only independent metropolitan area longitudinal oversample for the Buffalo metropolitan area was drawn in 1976 and was in place for the 1976, 1979, 1984, 1988, 1994, 2002, and 2011 surveys. The following table shows the sample sizes and percent of sample in common.
Year Sample Size Percent of Sample in Common with Prior Year 1976 5,287 (X) 1979 5,240 97.14 1984 4,267 97.73 1988 3,800 96.89 1994 4,369 76.38 2002 4,555 95.92 2011 4,149 53.36
9.3 Metropolitan Area Definition (1976, 1979) The definition of the Buffalo metropolitan area used in 1976 and 1979 AHS followed the 1971 OMB definition for the Buffalo, NY SMSA.
FIPS County Name AHS COUNTY 36029 Erie
99936063 Niagara
9.4 Metropolitan Area Definition (1984, 1988, 1994, 2002) The definition of the Buffalo metropolitan area used in the 1984, 1988, 1994, and 2002 AHS followed the 1971 OMB definition for the Buffalo, NY SMSA.
FIPS County Name AHS COUNTY AHS ZONE 36029 Erie 029 001-003, 103-107 36063 Niagara 063 101, 102
9.5 Metropolitan Area Definition (2011) The definition of the Buffalo metropolitan area used in 2011 AHS continued to follow the 1971 OMB definition for the Buffalo, NY SMSA.
FIPS County Name AHS COUNTY AHS ZONE 36029 Erie 029 001, 004, 103, 105, 107, 108, 990 36063 Niagara 063 101, 102, 990
Metropolitan Area Histories 1973 to 2013 37
–
10 Charlotte
10.1 National Longitudinal Sample (1985 – 2013) For disclosure purposes, there are no records in the national longitudinal sample from 1985 through 2013 that are identified as belonging to the Charlotte metropolitan area. The Charlotte metropolitan area definition used in the national longitudinal sample is the same as the 1983 OMB definition for the Charlotte- Gastonia-Rock Hill, NC-SC MSA.
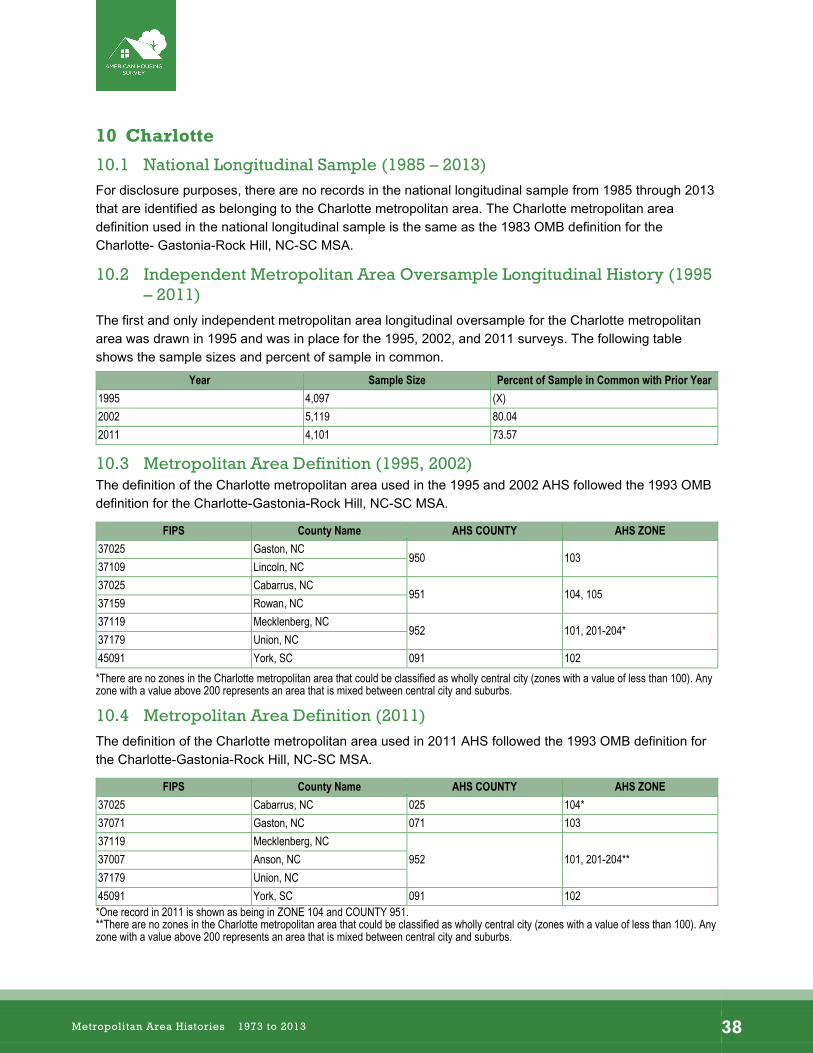
10.2 Independent Metropolitan Area Oversample Longitudinal History (1995 – 2011)
The first and only independent metropolitan area longitudinal oversample for the Charlotte metropolitan area was drawn in 1995 and was in place for the 1995, 2002, and 2011 surveys. The following table shows the sample sizes and percent of sample in common.
Year Sample Size Percent of Sample in Common with Prior Year 1995 4,097 (X) 2002 5,119 80.04 2011 4,101 73.57
10.3 Metropolitan Area Definition (1995, 2002) The definition of the Charlotte metropolitan area used in the 1995 and 2002 AHS followed the 1993 OMB definition for the Charlotte-Gastonia-Rock Hill, NC-SC MSA.
FIPS County Name AHS COUNTY AHS ZONE 37025 Gaston, NC
950 10337109 Lincoln, NC 37025 Cabarrus, NC
951 104, 105 37159 Rowan, NC 37119 Mecklenberg, NC
952 101, 201-204* 37179 Union, NC 45091 York, SC 091 102 *There are no zones in the Charlotte metropolitan area that could be classified as wholly central city (zones with a value of less than 100). Any zone with a value above 200 represents an area that is mixed between central city and suburbs.
10.4 Metropolitan Area Definition (2011) The definition of the Charlotte metropolitan area used in 2011 AHS followed the 1993 OMB definition for the Charlotte-Gastonia-Rock Hill, NC-SC MSA.
FIPS County Name AHS COUNTY AHS ZONE 37025 Cabarrus, NC 025 104* 37071 Gaston, NC 071 103 37119 Mecklenberg, NC
952 101, 201-204** 37007 Anson, NC 37179 Union, NC 45091 York, SC 091 102 *One record in 2011 is shown as being in ZONE 104 and COUNTY 951.**There are no zones in the Charlotte metropolitan area that could be classified as wholly central city (zones with a value of less than 100). Any zone with a value above 200 represents an area that is mixed between central city and suburbs.
Metropolitan Area Histories 1973 to 2013 38
–
11 Chicago
11.1 National Longitudinal Sample (1985 – 2013) There are records in the national longitudinal sample from 1985 through 2013 that are identified as belonging to the Chicago metropolitan area (SMSA = 0620, 1600, 3690, 3965, or 9991). The Chicago metropolitan area definition used in the national longitudinal sample is the same as the 1983 OMB definition for the Aurora-Elgin, IL PMSA, Chicago, IL PMSA, Joliet, IL PMSA, and Lake County, IL PMSA, respectively (SMSA = 9991 includes the four PMSAs that make up the AHS definition of the Chicago metropolitan area).
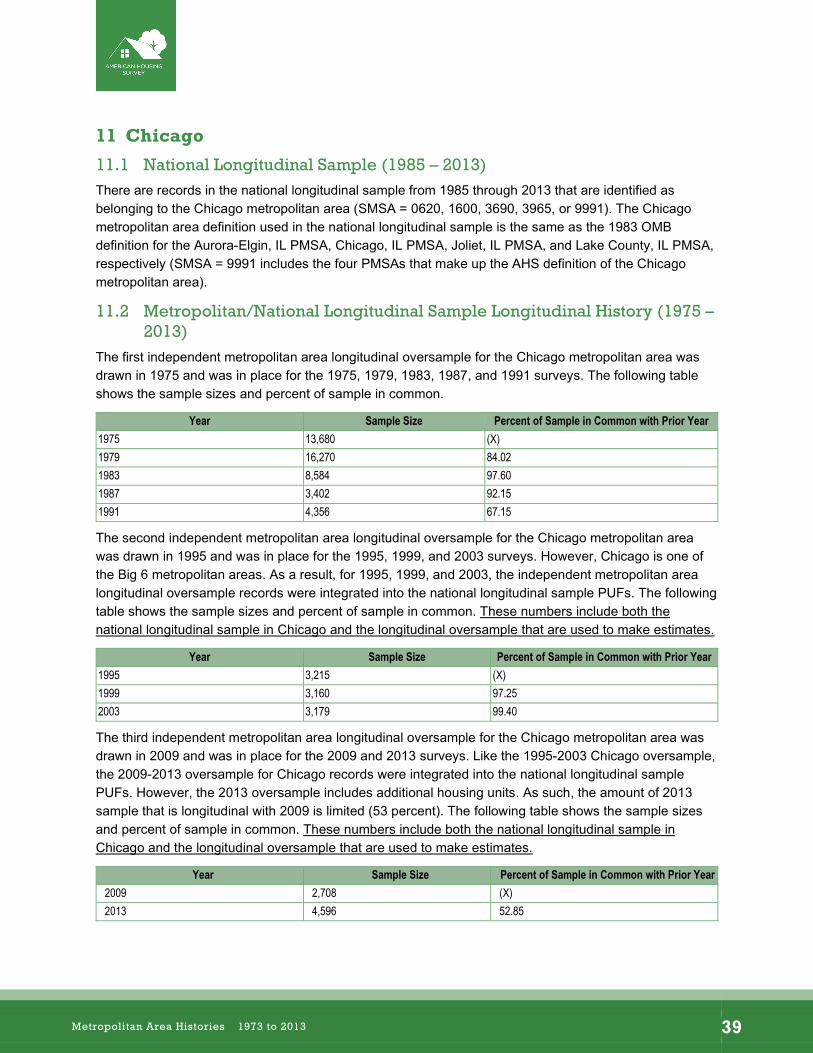
11.2 Metropolitan/National Longitudinal Sample Longitudinal History (1975 – 2013)
The first independent metropolitan area longitudinal oversample for the Chicago metropolitan area was drawn in 1975 and was in place for the 1975, 1979, 1983, 1987, and 1991 surveys. The following table shows the sample sizes and percent of sample in common.
Year Sample Size Percent of Sample in Common with Prior Year 1975 13,680 (X) 1979 16,270 84.02 1983 8,584 97.60 1987 3,402 92.15 1991 4,356 67.15
The second independent metropolitan area longitudinal oversample for the Chicago metropolitan area was drawn in 1995 and was in place for the 1995, 1999, and 2003 surveys. However, Chicago is one of the Big 6 metropolitan areas. As a result, for 1995, 1999, and 2003, the independent metropolitan area longitudinal oversample records were integrated into the national longitudinal sample PUFs. The following table shows the sample sizes and percent of sample in common. These numbers include both the national longitudinal sample in Chicago and the longitudinal oversample that are used to make estimates.
Year Sample Size Percent of Sample in Common with Prior Year 1995 3,215 (X) 1999 3,160 97.25 2003 3,179 99.40
The third independent metropolitan area longitudinal oversample for the Chicago metropolitan area was drawn in 2009 and was in place for the 2009 and 2013 surveys. Like the 1995-2003 Chicago oversample, the 2009-2013 oversample for Chicago records were integrated into the national longitudinal sample PUFs. However, the 2013 oversample includes additional housing units. As such, the amount of 2013 sample that is longitudinal with 2009 is limited (53 percent). The following table shows the sample sizes and percent of sample in common. These numbers include both the national longitudinal sample in Chicago and the longitudinal oversample that are used to make estimates.
Year Sample Size Percent of Sample in Common with Prior Year 2009 2,708 (X) 2013 4,596 52.85
Metropolitan Area Histories 1973 to 2013 39
–
11.3 Metropolitan Area Definition (1975, 1979, 1983) The definition of the Chicago metropolitan area used in 1975, 1979, and 1983 AHS followed the 1973 OMB definition for the Chicago, IL SMSA.
FIPS County Name AHS COUNTY 17031 Cook 031 17043 DuPage 043 17089 Kane 089 17097 Lake 097 17111 McHenry 999 17197 Will 999
11.4 Metropolitan Area Definition (1987, 1991) The definition of the Chicago metropolitan area used in the 1987 and 1991 AHS followed the 1983 OMB definition for the following areas: Aurora-Elgin, IL PMSA, Chicago, IL PMSA, Joliet, IL PMSA, and Lake County, IL PMSA.
FIPS County Name AHS COUNTY AHS ZONE
17031 Cook 031 001-022, 106-108, 110-114, 121-125, 128-132
17043 DuPage 043 115-116, 118-120, 126 17089 Kane 089 109, 117 17097 Lake 097 102-105 17111 McHenry 111 101 17197 Will 963 127 17063 Grundy 963 127 17093 Kendall 963 127
11.5 Metropolitan Area Definition (1995, 1999, 2003) In 1995, 1999, and 2003 the national AHS included oversample in the Chicago metropolitan area that allowed the AHS to provide metro level statistics from the national level dataset. AHS County and ZONE variables are excluded from the files with the Chicago oversample because they would have violated Census disclosure rules when combined with other national only geography variables such as urban/rural status. The 1995, 1999, and 2003 Chicago area definition is listed in the table below, and continues to match the 1983 OMB definitions for the following PMSAs: Aurora-Elgin, IL PMSA (0620), Chicago, IL PMSA (1600), Joliet, IL PMSA (3690), and Lake County, IL PMSA (3965).
FIPS County Name AHS COUNTY AHS ZONE 17031 Cook (X) (X) 17043 DuPage (X) (X) 17089 Kane (X) (X) 17097 Lake (X) (X) 17111 McHenry (X) (X) 17197 Will (X) (X) 17063 Grundy (X) (X) 17093 Kendall (X) (X)
Metropolitan Area Histories 1973 to 2013 40
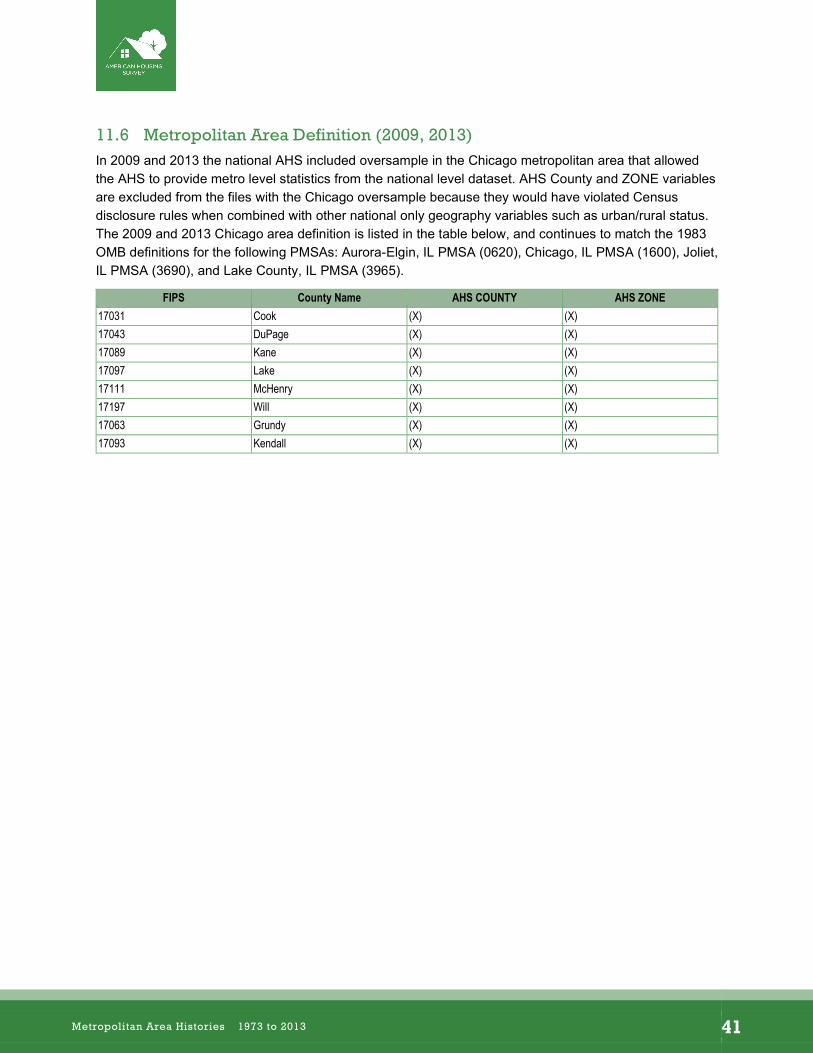
–
11.6 Metropolitan Area Definition (2009, 2013) In 2009 and 2013 the national AHS included oversample in the Chicago metropolitan area that allowed the AHS to provide metro level statistics from the national level dataset. AHS County and ZONE variables are excluded from the files with the Chicago oversample because they would have violated Census disclosure rules when combined with other national only geography variables such as urban/rural status. The 2009 and 2013 Chicago area definition is listed in the table below, and continues to match the 1983 OMB definitions for the following PMSAs: Aurora-Elgin, IL PMSA (0620), Chicago, IL PMSA (1600), Joliet, IL PMSA (3690), and Lake County, IL PMSA (3965).
FIPS County Name AHS COUNTY AHS ZONE 17031 Cook (X) (X) 17043 DuPage (X) (X) 17089 Kane (X) (X) 17097 Lake (X) (X) 17111 McHenry (X) (X) 17197 Will (X) (X) 17063 Grundy (X) (X) 17093 Kendall (X) (X)
Metropolitan Area Histories 1973 to 2013 41
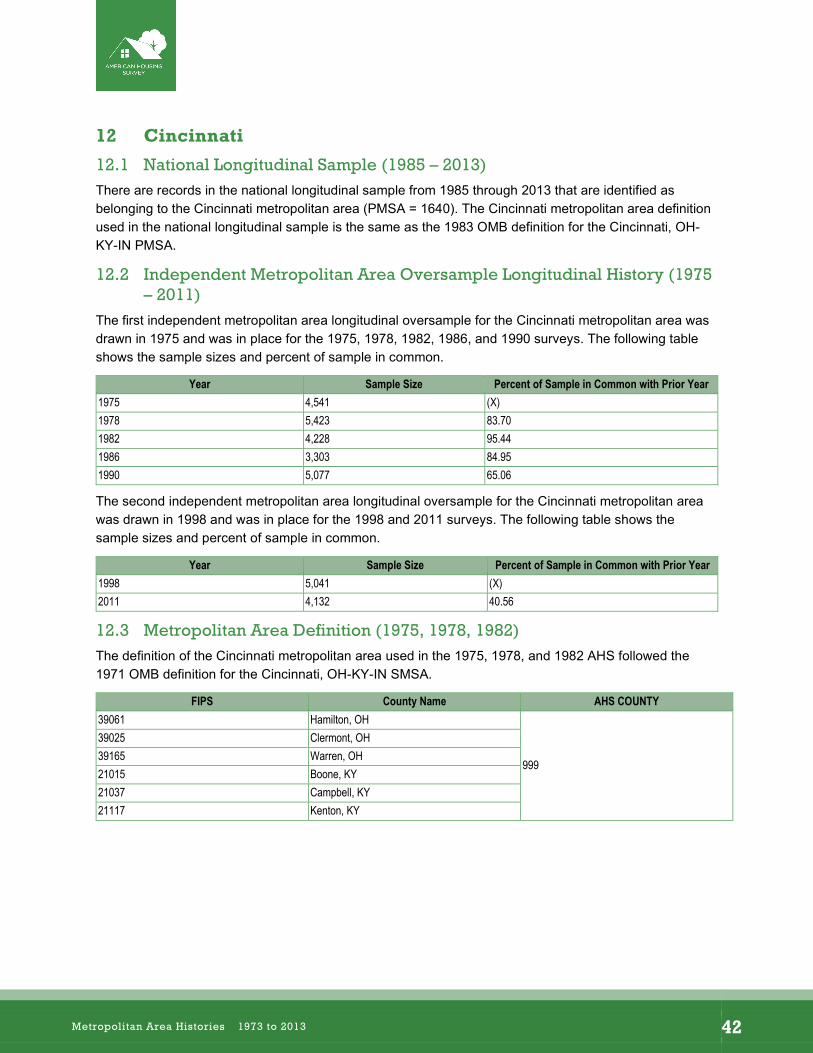
–
12 Cincinnati
12.1 National Longitudinal Sample (1985 – 2013) There are records in the national longitudinal sample from 1985 through 2013 that are identified as belonging to the Cincinnati metropolitan area (PMSA = 1640). The Cincinnati metropolitan area definition used in the national longitudinal sample is the same as the 1983 OMB definition for the Cincinnati, OH-KY-IN PMSA.
12.2 Independent Metropolitan Area Oversample Longitudinal History (1975 – 2011)
The first independent metropolitan area longitudinal oversample for the Cincinnati metropolitan area was drawn in 1975 and was in place for the 1975, 1978, 1982, 1986, and 1990 surveys. The following table shows the sample sizes and percent of sample in common.
Year Sample Size Percent of Sample in Common with Prior Year 1975 4,541 (X) 1978 5,423 83.70 1982 4,228 95.44 1986 3,303 84.95 1990 5,077 65.06
The second independent metropolitan area longitudinal oversample for the Cincinnati metropolitan area was drawn in 1998 and was in place for the 1998 and 2011 surveys. The following table shows the sample sizes and percent of sample in common.
Year Sample Size Percent of Sample in Common with Prior Year 1998 5,041 (X) 2011 4,132 40.56
12.3 Metropolitan Area Definition (1975, 1978, 1982) The definition of the Cincinnati metropolitan area used in the 1975, 1978, and 1982 AHS followed the 1971 OMB definition for the Cincinnati, OH-KY-IN SMSA.
FIPS County Name AHS COUNTY 39061 Hamilton, OH
999
39025 Clermont, OH 39165 Warren, OH 21015 Boone, KY 21037 Campbell, KY 21117 Kenton, KY
Metropolitan Area Histories 1973 to 2013 42
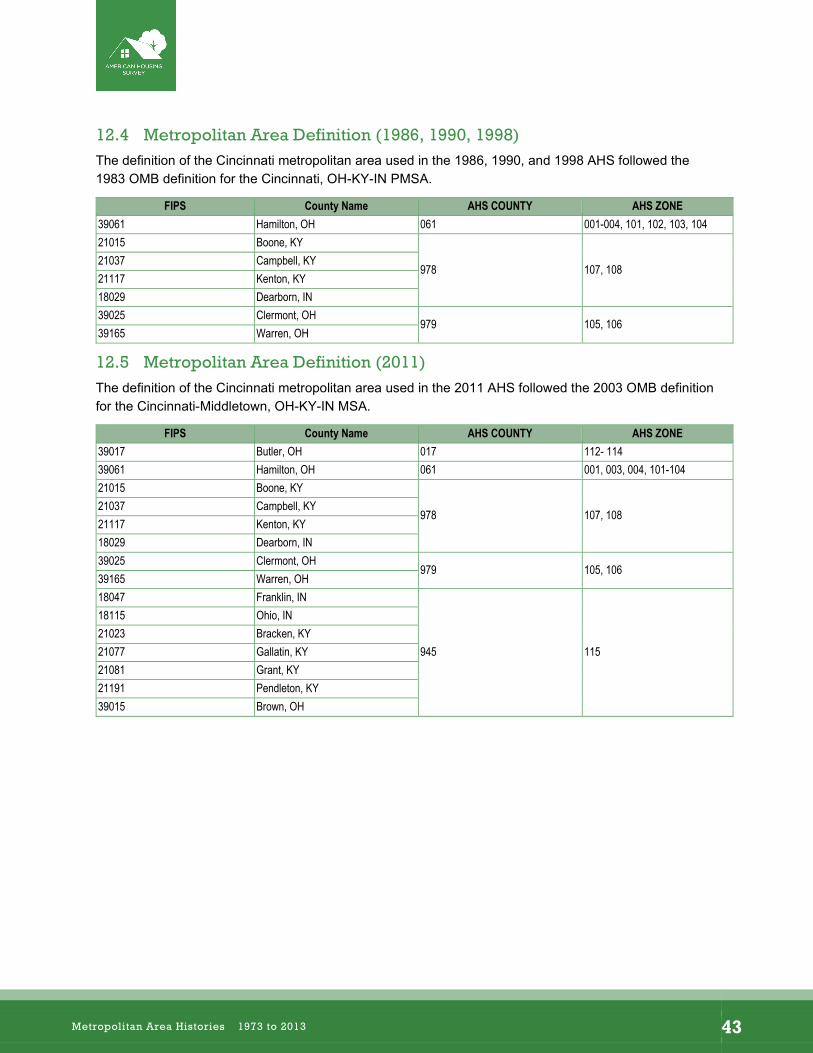
–
12.4 Metropolitan Area Definition (1986, 1990, 1998) The definition of the Cincinnati metropolitan area used in the 1986, 1990, and 1998 AHS followed the 1983 OMB definition for the Cincinnati, OH-KY-IN PMSA.
FIPS County Name AHS COUNTY AHS ZONE 39061 Hamilton, OH 061 001-004, 101, 102, 103, 104 21015 Boone, KY
978 107, 108 21037 Campbell, KY 21117 Kenton, KY 18029 Dearborn, IN 39025 Clermont, OH
979 105, 106 39165 Warren, OH
12.5 Metropolitan Area Definition (2011) The definition of the Cincinnati metropolitan area used in the 2011 AHS followed the 2003 OMB definition for the Cincinnati-Middletown, OH-KY-IN MSA.
FIPS County Name AHS COUNTY AHS ZONE 39017 Butler, OH 017 112- 114 39061 Hamilton, OH 061 001, 003, 004, 101-104 21015 Boone, KY
978 107, 108 21037 Campbell, KY 21117 Kenton, KY 18029 Dearborn, IN 39025 Clermont, OH
979 105, 106 39165 Warren, OH 18047 Franklin, IN
945 115
18115 Ohio, IN 21023 Bracken, KY 21077 Gallatin, KY 21081 Grant, KY 21191 Pendleton, KY 39015 Brown, OH
Metropolitan Area Histories 1973 to 2013 43
–
13 Cleveland
13.1 National Longitudinal Sample (1985 – 2013) There are records in the national longitudinal sample from 1985 through 2013 that are identified as belonging to the Cleveland metropolitan area (SMSA = 1680). The Cleveland metropolitan area definition used in the national longitudinal sample is the same as the 1983 OMB definition for the Cleveland, OH PMSA.
13.2 Independent Metropolitan Area Oversample Longitudinal History (1976 – 2011)
The first independent metropolitan area longitudinal oversample for the Cleveland metropolitan area was drawn in 1976 and was in place for the 1976, 1979, 1984, 1988, and 1992 surveys. The following table shows the sample sizes and percent of sample in common.
Year Sample Size Percent of Sample in Common with Prior Year 1976 5,229 (X) 1979 5,215 95.92 1984 4,203 97.57 1988 3,744 97.09 1992 4,767 78.54
The second independent metropolitan area longitudinal oversample for the Cleveland metropolitan area was drawn in 1996 and was in place for the 1996, 2004, and 2011 surveys. The following table shows the sample sizes and percent of sample in common.
Year Sample Size Percent of Sample in Common with Prior Year 1996 4,742 (X) 2004 4,722 94.90 2011 4,129 54.88
13.3 Metropolitan Area Definition (1976, 1979) The definition of the Cleveland metropolitan area used in the 1976 and 1979 AHS followed the 1971 OMB definition for the Cleveland, OH SMSA.
FIPS County Name AHS COUNTY 39035 Cuyahoga 035 39055 Geauga 999 39085 Lake 999 39103 Medina 999
13.4 Metropolitan Area Definition (1984, 1988, 1992) The definition of the Cleveland metropolitan area used in the 1984, 1988, and 1992 AHS followed the 1983 OMB definition for the Cleveland, OH PMSA.
FIPS County Name AHS COUNTY AHS ZONE 39035 Cuyahoga 035 001-005, 101-108 39055 Geauga 992 109 39085 Lake 992 110
Metropolitan Area Histories 1973 to 2013 44
–
FIPS County Name AHS COUNTY AHS ZONE 39103 Medina 992 111
13.5 Metropolitan Area Definition (1996, 2004) The definition of the Cleveland metropolitan area used in 1996 and 2004 AHS followed the 1993 OMB definition for the Cleveland-Lorain-Elyria, OH PMSA, with the exception that the AHS definition excludes Lorain county.
FIPS County Name AHS COUNTY AHS ZONE 39035 Cuyahoga 035 001-005, 101-108 39055 Geauga 992 109-112 39085 Lake 992 109-112 39103 Medina 992 109-112 39007 Ashtabula 992* 109-112 *In 2004, most records in ZONE 112 showed a county value of 007.
13.6 Metropolitan Area Definition (2011) The definition of the Cleveland metropolitan area used in the 2011 AHS followed the 2003 OMB definition for the Cleveland-Elyria-Mentor MSA.
FIPS County Name AHS COUNTY AHS ZONE 39035 Cuyahoga 035 001-005, 101-108 39055 Geauga 992 109-111 39085 Lake 992 109-111 39093 Lorain 093 113-114 39103 Medina 992 109-111
Metropolitan Area Histories 1973 to 2013 45
–
14 Colorado Springs
14.1 National Longitudinal Sample (1985 – 2013) There are records in the national longitudinal sample from 1985 through 2013 that are identified as belonging to the Colorado Springs metropolitan area (SMSA = 1720). The Colorado Springs metropolitan area definition used in the national longitudinal sample is the same as the 1983 OMB definition for the Colorado Springs, CO MSA.
14.2 Independent Metropolitan Area Oversample Longitudinal History (1975 – 1978)
The first and only independent metropolitan area longitudinal oversample for the Colorado Springs metropolitan area was drawn in 1975 and was in place for the 1975 and 1978 surveys. The following table shows the sample sizes and percent of sample in common.
Year Sample Size Percent of Sample in Common with Prior Year 1975 4,623 (X) 1978 5,477 84.15
14.3 Metropolitan Area Definition (1975, 1978) The definition of the Colorado Springs metropolitan area used in the 1975 and 1978 AHS followed the 1971 OMB definition for the Colorado Springs, CO SMSA.
FIPS County Name AHS COUNTY 18720 El Paso 999
Metropolitan Area Histories 1973 to 2013 46
–
15 Columbus
15.1 National Longitudinal Sample (1985 – 2013) There are records in the national longitudinal sample from 1985 through 2013 that are identified as belonging to the Columbus metropolitan area (SMSA = 1840). The Columbus metropolitan area definition used in the national longitudinal sample is the same as the 1983 OMB definition for the Columbus, OH MSA.
15.2 Independent Metropolitan Area Oversample Longitudinal History (1975 – 2011)
The first independent metropolitan area longitudinal oversample for the Columbus metropolitan area was drawn in 1975 and was in place for the 1975, 1978, 1982, 1987, and 1991 surveys. The following table shows the sample sizes and percent of sample in common.
Year Sample Size Percent of Sample in Common with Prior Year 1975 4,541 (X) 1978 5,476 82.85 1982 4,250 95.06 1987 3,285 73.94 1991 4,286 66.12
The second independent metropolitan area longitudinal oversample for the Columbus metropolitan area was drawn in 1995 and was in place for the 1995, 2002, and 2011 surveys. The following table shows the sample sizes and percent of sample in common.
Year Sample Size Percent of Sample in Common with Prior Year 1995 4,193 (X) 2002 4,936 84.95 2011 4,157 69.88
15.3 Metropolitan Area Definition (1975, 1978, 1982) The definition of the Columbus metropolitan area used in the 1975, 1978, and 1982 AHS followed the 1971 OMB definition for the Columbus, OH SMSA.
FIPS County Name AHS COUNTY 39049 Franklin
99939041 Delaware 39129 Pickaway
15.4 Metropolitan Area Definition (1987, 1991) The definition of the Columbus metropolitan area used in the 1987 and 1991 AHS followed the 1983 OMB definition for the Columbus, OH MSA.
FIPS County Name AHS COUNTY AHS ZONE 39049 Franklin
962 001-004, 101, 103, 104 39041 Delaware 39129 Pickaway 39089 Licking 960 102
Metropolitan Area Histories 1973 to 2013 47
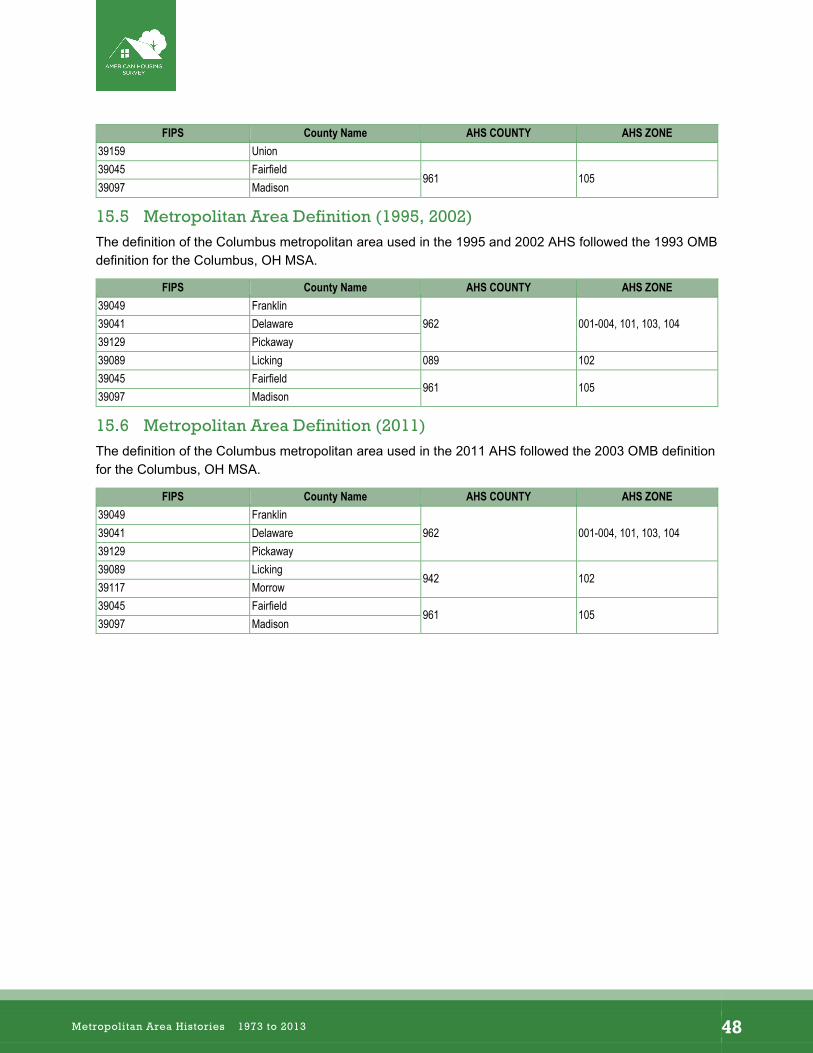
–
FIPS County Name AHS COUNTY AHS ZONE 39159 Union 39045 Fairfield
961 10539097 Madison
15.5 Metropolitan Area Definition (1995, 2002) The definition of the Columbus metropolitan area used in the 1995 and 2002 AHS followed the 1993 OMB definition for the Columbus, OH MSA.
FIPS County Name AHS COUNTY AHS ZONE 39049 Franklin
962 001-004, 101, 103, 104 39041 Delaware 39129 Pickaway 39089 Licking 089 102 39045 Fairfield
961 10539097 Madison
15.6 Metropolitan Area Definition (2011) The definition of the Columbus metropolitan area used in the 2011 AHS followed the 2003 OMB definition for the Columbus, OH MSA.
FIPS County Name AHS COUNTY AHS ZONE 39049 Franklin
962 001-004, 101, 103, 104 39041 Delaware 39129 Pickaway 39089 Licking
942 10239117 Morrow 39045 Fairfield
961 10539097 Madison
Metropolitan Area Histories 1973 to 2013 48
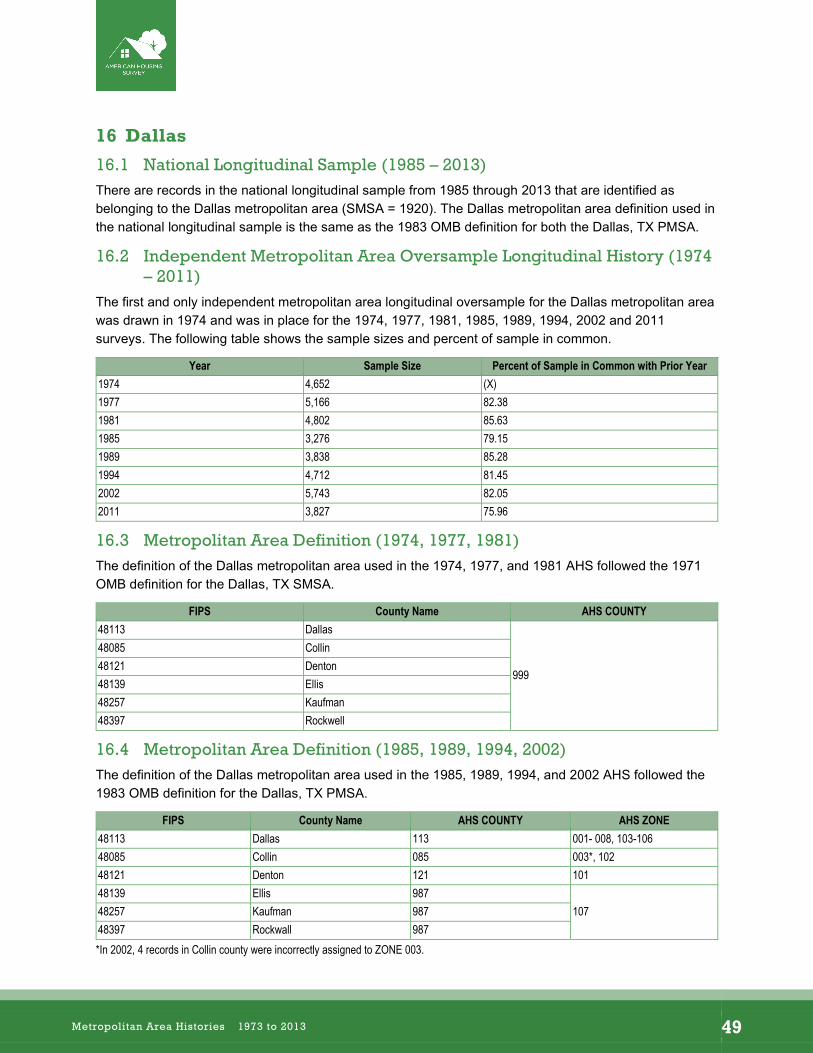
–
16 Dallas
16.1 National Longitudinal Sample (1985 – 2013) There are records in the national longitudinal sample from 1985 through 2013 that are identified as belonging to the Dallas metropolitan area (SMSA = 1920). The Dallas metropolitan area definition used in the national longitudinal sample is the same as the 1983 OMB definition for both the Dallas, TX PMSA.
16.2 Independent Metropolitan Area Oversample Longitudinal History (1974 – 2011)
The first and only independent metropolitan area longitudinal oversample for the Dallas metropolitan area was drawn in 1974 and was in place for the 1974, 1977, 1981, 1985, 1989, 1994, 2002 and 2011 surveys. The following table shows the sample sizes and percent of sample in common.
Year Sample Size Percent of Sample in Common with Prior Year 1974 4,652 (X) 1977 5,166 82.38 1981 4,802 85.63 1985 3,276 79.15 1989 3,838 85.28 1994 4,712 81.45 2002 5,743 82.05 2011 3,827 75.96
16.3 Metropolitan Area Definition (1974, 1977, 1981) The definition of the Dallas metropolitan area used in the 1974, 1977, and 1981 AHS followed the 1971 OMB definition for the Dallas, TX SMSA.
FIPS County Name AHS COUNTY 48113 Dallas
999
48085 Collin 48121 Denton 48139 Ellis 48257 Kaufman 48397 Rockwell
16.4 Metropolitan Area Definition (1985, 1989, 1994, 2002) The definition of the Dallas metropolitan area used in the 1985, 1989, 1994, and 2002 AHS followed the 1983 OMB definition for the Dallas, TX PMSA.
FIPS County Name AHS COUNTY AHS ZONE 48113 Dallas 113 001- 008, 103-106 48085 Collin 085 003*, 102 48121 Denton 121 101 48139 Ellis 987
10748257 Kaufman 987 48397 Rockwall 987 *In 2002, 4 records in Collin county were incorrectly assigned to ZONE 003.
Metropolitan Area Histories 1973 to 2013 49

–
16.5 Metropolitan Area Definition (2011) The definition of the Dallas metropolitan area used in the 2011 AHS followed the 2003 OMB definition for the Dallas-Plano-Irving, TX Metropolitan Division.
FIPS County Name AHS COUNTY AHS ZONE 48113 Dallas 113 001- 008, 103-106 48085 Collin 085 102 48121 Denton 121 101 48139 Ellis 987 107 48257 Kaufman 987 107 48397 Rockwell 987 107 48231 Hunt 987 107 48119 Delta 987 107
Metropolitan Area Histories 1973 to 2013 50

–
17 Denver
17.1 National Longitudinal Sample (1985 – 2013) There are records in the national longitudinal sample from 1985 through 2013 that are identified as belonging to the Denver metropolitan area (SMSA = 2080). The Denver metropolitan area definition used in the national longitudinal sample is the same as the 1983 OMB definition for the Denver, CO PMSA.
17.2 Independent Metropolitan Area Oversample Longitudinal History (1976 – 2011)
The first independent metropolitan area longitudinal oversample for the Denver metropolitan area was drawn in 1976 and was in place for the 1976, 1979, 1983, 1986, and 1990 surveys. The following table shows the sample sizes and percent of sample in common.
Year Sample Size Percent of Sample in Common with Prior Year 1976 5,326 (X) 1979 5,899 87.10 1983 4,312 90.10 1986 3,241 88.00 1990 4,942 65.58
The second independent metropolitan area longitudinal oversample for the Denver metropolitan area was drawn in 1995 and was in place for the 1995, 2004, and 2011 surveys. The following table shows the sample sizes and percent of sample in common.
Year Sample Size Percent of Sample in Common with Prior Year 1995 4,326 (X) 2004 4,834 80.62 2011 3,777 86.63
17.3 Metropolitan Area Definition (1976, 1979, 1983) The definition of the Denver metropolitan area used in the 1976, 1979, and 1983 AHS followed the 1971 OMB definition for the Denver, CO SMSA.
FIPS County Name AHS COUNTY 08031 Denver 031 08001 Adams 777 08005 Arapahoe 777 08013 Boulder 888 08059 Jefferson 888
Metropolitan Area Histories 1973 to 2013 51
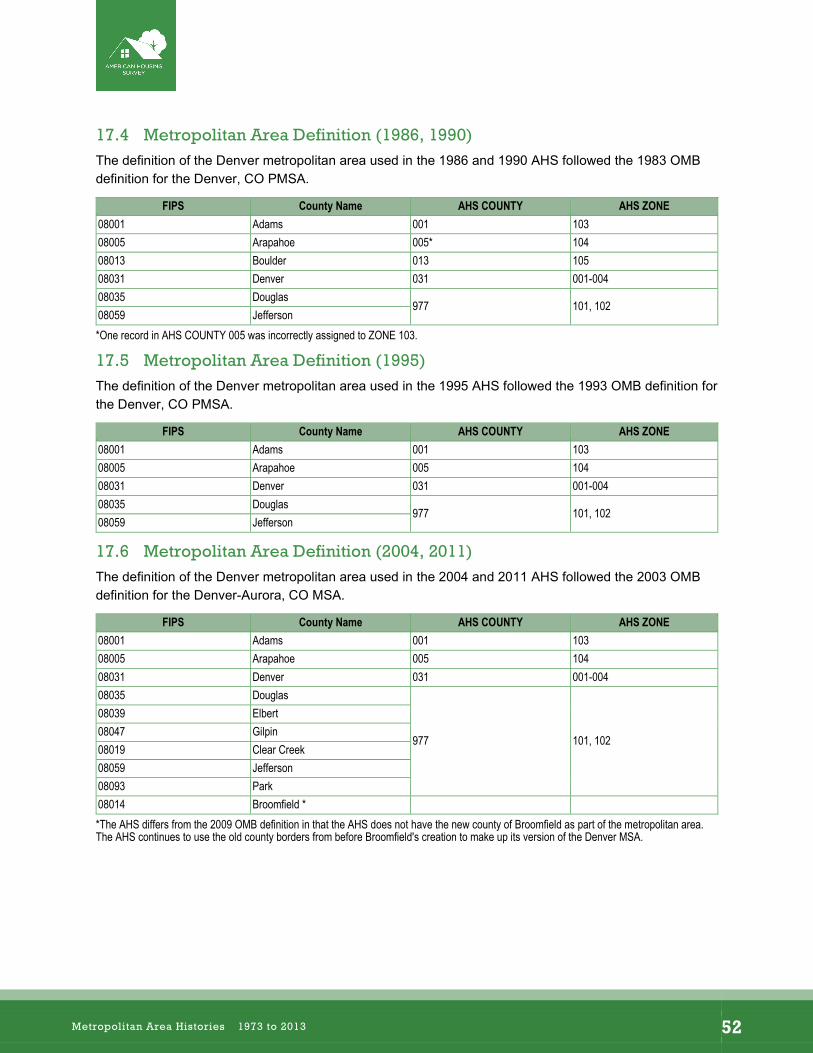
–
17.4 Metropolitan Area Definition (1986, 1990) The definition of the Denver metropolitan area used in the 1986 and 1990 AHS followed the 1983 OMB definition for the Denver, CO PMSA.
FIPS County Name AHS COUNTY AHS ZONE 08001 Adams 001 103 08005 Arapahoe 005* 104 08013 Boulder 013 105 08031 Denver 031 001-004 08035 Douglas
977 101, 102 08059 Jefferson *One record in AHS COUNTY 005 was incorrectly assigned to ZONE 103.
17.5 Metropolitan Area Definition (1995) The definition of the Denver metropolitan area used in the 1995 AHS followed the 1993 OMB definition for the Denver, CO PMSA.
FIPS County Name AHS COUNTY AHS ZONE 08001 Adams 001 103 08005 Arapahoe 005 104 08031 Denver 031 001-004 08035 Douglas
977 101, 102 08059 Jefferson
17.6 Metropolitan Area Definition (2004, 2011) The definition of the Denver metropolitan area used in the 2004 and 2011 AHS followed the 2003 OMB definition for the Denver-Aurora, CO MSA.
FIPS County Name AHS COUNTY AHS ZONE 08001 Adams 001 103 08005 Arapahoe 005 104 08031 Denver 031 001-004 08035 Douglas
977 101, 102
08039 Elbert 08047 Gilpin 08019 Clear Creek 08059 Jefferson 08093 Park 08014 Broomfield * *The AHS differs from the 2009 OMB definition in that the AHS does not have the new county of Broomfield as part of the metropolitan area. The AHS continues to use the old county borders from before Broomfield's creation to make up its version of the Denver MSA.
Metropolitan Area Histories 1973 to 2013 52

–
t
18 Detroit
18.1 National Longitudinal Sample (1985 – 2013) There are records in the national longitudinal sample from 1985 through 2013 that are identified as belonging to the Detroit metropolitan area (SMSA = 2160). The Detroit metropolitan area definition used in the national longitudinal sample is the same as the 1983 OMB definition for the Detroit, MI PMSA.
18.2 Metropolitan/National Longitudinal Sample Longitudinal History (1974 – 2013)
The first independent metropolitan area longitudinal oversample for the Detroit metropolitan area was drawn in 1974 and was in place for the 1974, 1977, 1981, 1985, 1989, and 1993 surveys. The following table shows the sample sizes and percent of sample in common.
Year Sample Size Percent of Sample in Common with Prior Year 1974 13,804 (X) 1977 14,286 88.26 1981 5,299 96.68 1985 6,516 57.15 1989 3,839 85.36 1993 5,233 73.36
The second independent metropolitan area longitudinal oversample for the Detroit metropolitan area was drawn in 1995 and was in place for the 1995, 1999, and 2003 surveys. However, Detroit is one of the Big 6 metropolitan areas. As a result, for 1995, 1999, and 2003, the independent metropolitan area longitudinal oversample records were integrated into the national longitudinal sample PUFs. The following table shows the sample sizes and percent of sample in common. These numbers include both the national longitudinal sample in Detroit and the longitudinal oversample that are used to make estimates.
Year Sample Size Percent of Sample in Common with Prior Year 1995 2,029 (X) 1999 2,132 95.17 2003 2,186 97.53
The third independent metropolitan area longitudinal oversample for the Detroit metropolitan area was drawn in 2009 and was in place for the 2009 and 2013 surveys. Like the 1995-2003 Detroit oversample, the 2009-2013 oversample for Detroit records were integrated into the national longitudinal sample PUFs. However, the 2013 oversample includes additional housing units. As such, the amount of 2013 sample that is longitudinal with 2009 is limited (53 percent). The following table shows the sample sizes and percent of sample in common. These numbers include both the national longitudinal sample in Detroit and the longitudinal oversample that are used to make estimates.
Year Sample Size Percent of Sample in Common with Prior Year 2009 2,712 (X) 2013 4,629 53.42
18.3 Metropolitan Area Definition (1974, 1977, 1981) The definition of the Detroit metropolitan area used in the 1974, 1977, and 1981 AHS followed the 1973 OMB definition for the Detroit, MI SMSA.
Metropolitan Area Histories 1973 to 2013 53
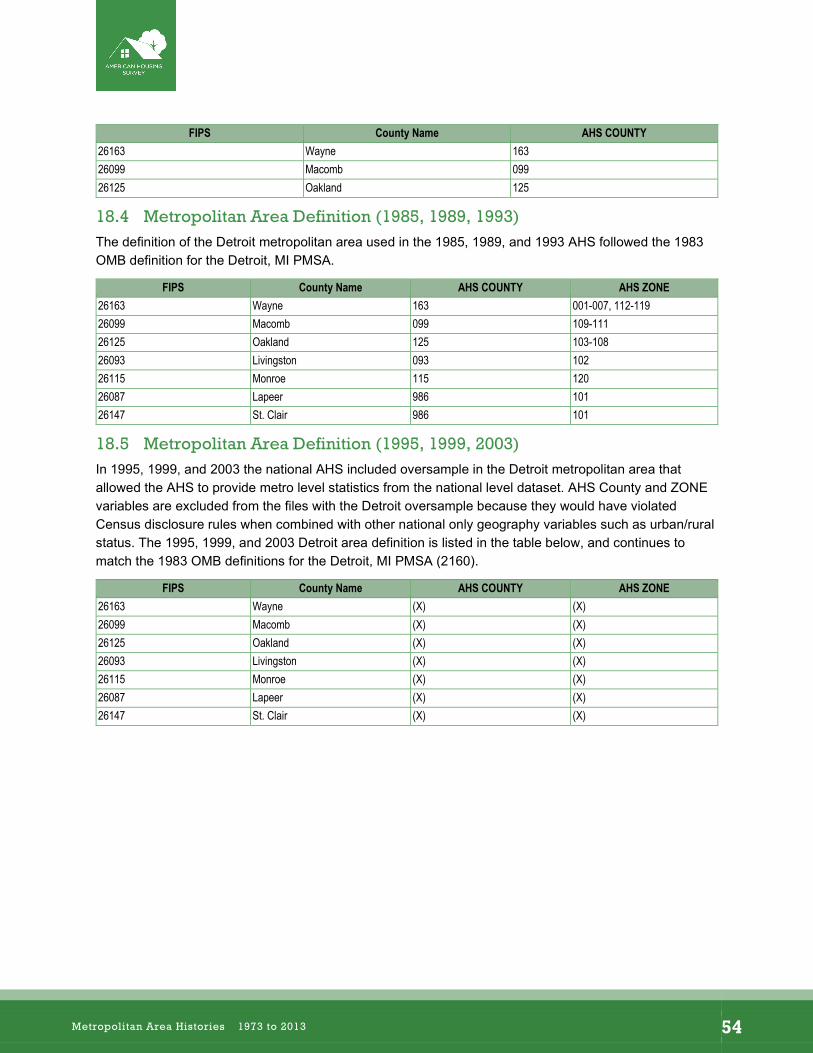
–
FIPS County Name AHS COUNTY 26163 Wayne 163 26099 Macomb 099 26125 Oakland 125
18.4 Metropolitan Area Definition (1985, 1989, 1993) The definition of the Detroit metropolitan area used in the 1985, 1989, and 1993 AHS followed the 1983 OMB definition for the Detroit, MI PMSA.
FIPS County Name AHS COUNTY AHS ZONE 26163 Wayne 163 001-007, 112-119 26099 Macomb 099 109-111 26125 Oakland 125 103-108 26093 Livingston 093 102 26115 Monroe 115 120 26087 Lapeer 986 101 26147 St. Clair 986 101
18.5 Metropolitan Area Definition (1995, 1999, 2003) In 1995, 1999, and 2003 the national AHS included oversample in the Detroit metropolitan area that allowed the AHS to provide metro level statistics from the national level dataset. AHS County and ZONE variables are excluded from the files with the Detroit oversample because they would have violated Census disclosure rules when combined with other national only geography variables such as urban/rural status. The 1995, 1999, and 2003 Detroit area definition is listed in the table below, and continues to match the 1983 OMB definitions for the Detroit, MI PMSA (2160).
FIPS County Name AHS COUNTY AHS ZONE 26163 Wayne (X) (X) 26099 Macomb (X) (X) 26125 Oakland (X) (X) 26093 Livingston (X) (X) 26115 Monroe (X) (X) 26087 Lapeer (X) (X) 26147 St. Clair (X) (X)
Metropolitan Area Histories 1973 to 2013 54
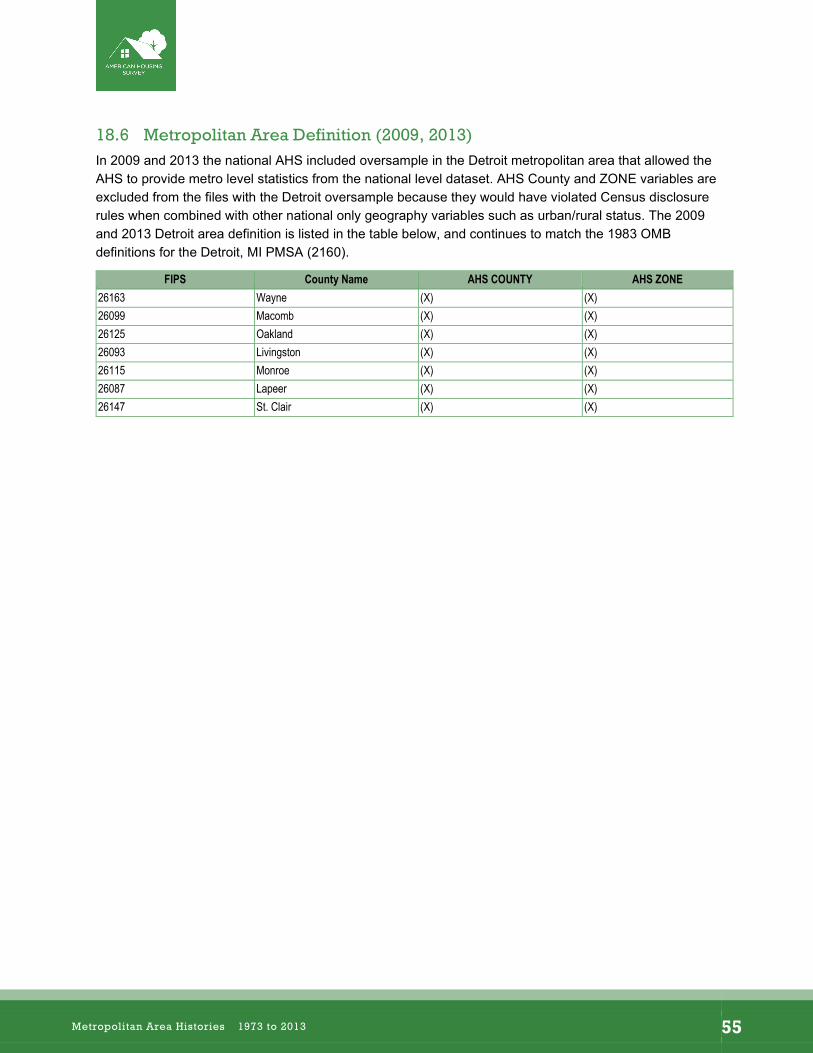
–
18.6 Metropolitan Area Definition (2009, 2013) In 2009 and 2013 the national AHS included oversample in the Detroit metropolitan area that allowed the AHS to provide metro level statistics from the national level dataset. AHS County and ZONE variables are excluded from the files with the Detroit oversample because they would have violated Census disclosure rules when combined with other national only geography variables such as urban/rural status. The 2009 and 2013 Detroit area definition is listed in the table below, and continues to match the 1983 OMB definitions for the Detroit, MI PMSA (2160).
FIPS County Name AHS COUNTY AHS ZONE 26163 Wayne (X) (X) 26099 Macomb (X) (X) 26125 Oakland (X) (X) 26093 Livingston (X) (X) 26115 Monroe (X) (X) 26087 Lapeer (X) (X) 26147 St. Clair (X) (X)
Metropolitan Area Histories 1973 to 2013 55
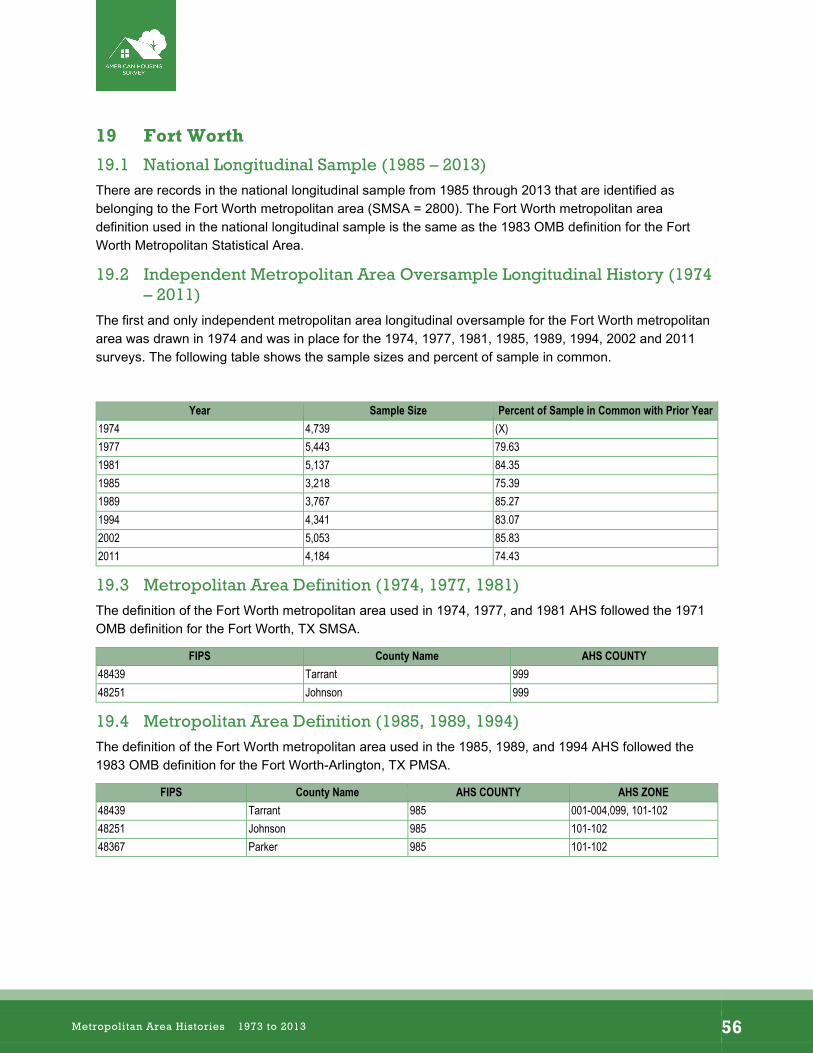
–
19 Fort Worth
19.1 National Longitudinal Sample (1985 – 2013) There are records in the national longitudinal sample from 1985 through 2013 that are identified as belonging to the Fort Worth metropolitan area (SMSA = 2800). The Fort Worth metropolitan area definition used in the national longitudinal sample is the same as the 1983 OMB definition for the Fort Worth Metropolitan Statistical Area.
19.2 Independent Metropolitan Area Oversample Longitudinal History (1974 – 2011)
The first and only independent metropolitan area longitudinal oversample for the Fort Worth metropolitan area was drawn in 1974 and was in place for the 1974, 1977, 1981, 1985, 1989, 1994, 2002 and 2011 surveys. The following table shows the sample sizes and percent of sample in common.
Year Sample Size Percent of Sample in Common with Prior Year 1974 4,739 (X) 1977 5,443 79.63 1981 5,137 84.35 1985 3,218 75.39 1989 3,767 85.27 1994 4,341 83.07 2002 5,053 85.83 2011 4,184 74.43
19.3 Metropolitan Area Definition (1974, 1977, 1981) The definition of the Fort Worth metropolitan area used in 1974, 1977, and 1981 AHS followed the 1971 OMB definition for the Fort Worth, TX SMSA.
FIPS County Name AHS COUNTY 48439 Tarrant 999 48251 Johnson 999
19.4 Metropolitan Area Definition (1985, 1989, 1994) The definition of the Fort Worth metropolitan area used in the 1985, 1989, and 1994 AHS followed the 1983 OMB definition for the Fort Worth-Arlington, TX PMSA.
FIPS County Name AHS COUNTY AHS ZONE 48439 Tarrant 985 001-004,099, 101-102 48251 Johnson 985 101-102 48367 Parker 985 101-102
Metropolitan Area Histories 1973 to 2013 56
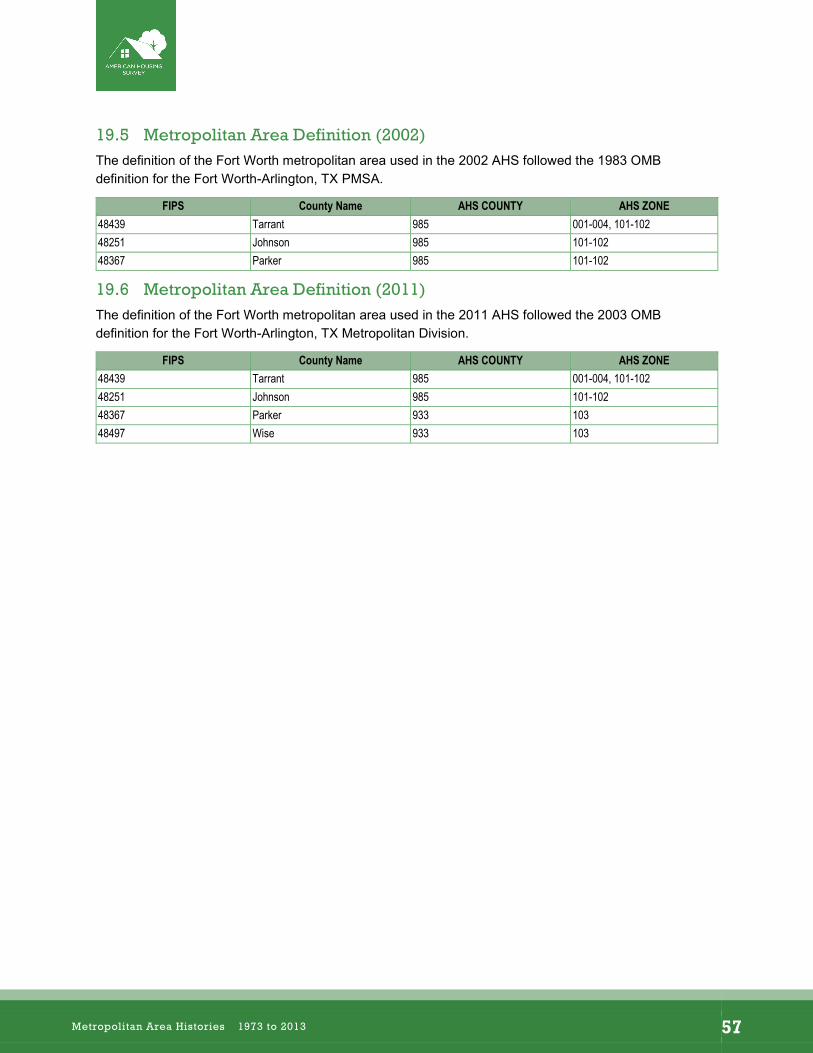
–
19.5 Metropolitan Area Definition (2002) The definition of the Fort Worth metropolitan area used in the 2002 AHS followed the 1983 OMB definition for the Fort Worth-Arlington, TX PMSA.
FIPS County Name AHS COUNTY AHS ZONE 48439 Tarrant 985 001-004, 101-102 48251 Johnson 985 101-102 48367 Parker 985 101-102
19.6 Metropolitan Area Definition (2011) The definition of the Fort Worth metropolitan area used in the 2011 AHS followed the 2003 OMB definition for the Fort Worth-Arlington, TX Metropolitan Division.
FIPS County Name AHS COUNTY AHS ZONE 48439 Tarrant 985 001-004, 101-102 48251 Johnson 985 101-102 48367 Parker 933 103 48497 Wise 933 103
Metropolitan Area Histories 1973 to 2013 57
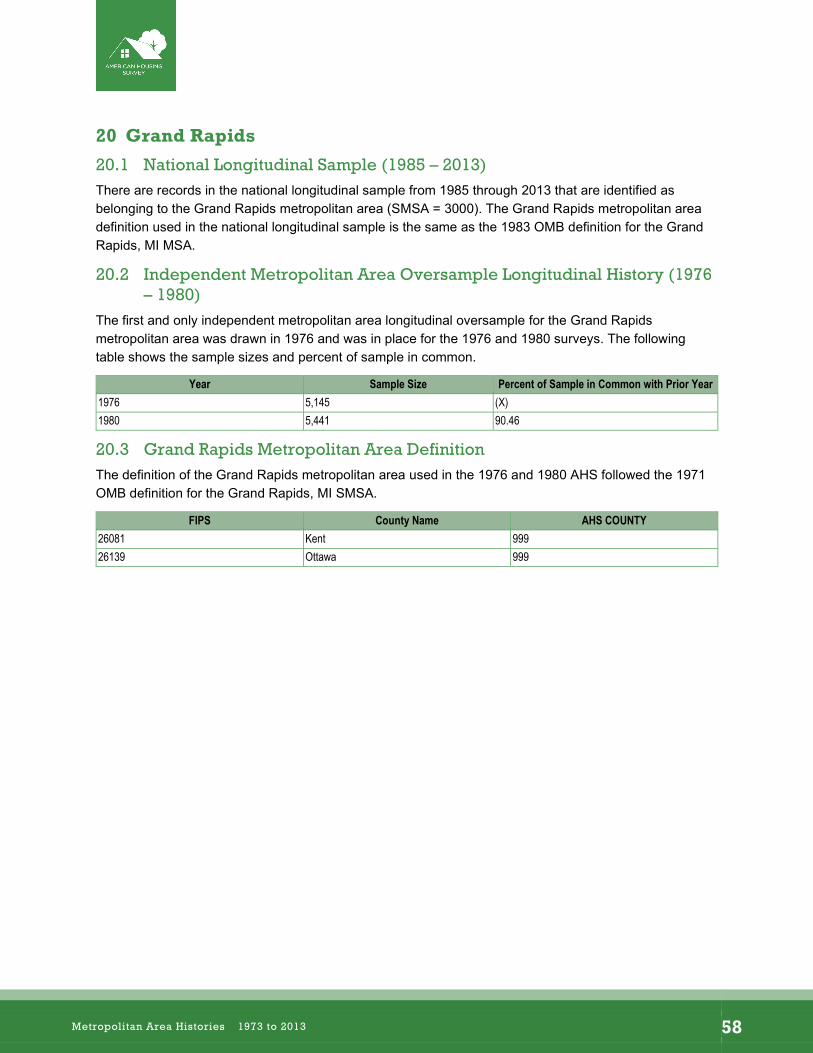
–
20 Grand Rapids
20.1 National Longitudinal Sample (1985 – 2013) There are records in the national longitudinal sample from 1985 through 2013 that are identified as belonging to the Grand Rapids metropolitan area (SMSA = 3000). The Grand Rapids metropolitan area definition used in the national longitudinal sample is the same as the 1983 OMB definition for the Grand Rapids, MI MSA.
20.2 Independent Metropolitan Area Oversample Longitudinal History (1976 – 1980)
The first and only independent metropolitan area longitudinal oversample for the Grand Rapids metropolitan area was drawn in 1976 and was in place for the 1976 and 1980 surveys. The following table shows the sample sizes and percent of sample in common.
Year Sample Size Percent of Sample in Common with Prior Year 1976 5,145 (X) 1980 5,441 90.46
20.3 Grand Rapids Metropolitan Area Definition The definition of the Grand Rapids metropolitan area used in the 1976 and 1980 AHS followed the 1971 OMB definition for the Grand Rapids, MI SMSA.
FIPS County Name AHS COUNTY 26081 Kent 999 26139 Ottawa 999
Metropolitan Area Histories 1973 to 2013 58
–
21 Hartford
21.1 National Longitudinal Sample (1985 – 2013) There are records in the national longitudinal sample from 1985 through 2013 that are identified as belonging to the Hartford, CT metropolitan area (PMSA = 3280 or CMSA = 41). The Hartford metropolitan area definition used in the national longitudinal sample is the same as the 1983 OMB definition for the Hartford, CT PMSA and Hartford-New Britain-Middletown, CT CMSA, respectively.
21.2 Independent Metropolitan Area Oversample Longitudinal History (1975 – 2013)
The first independent metropolitan area longitudinal oversample for the Hartford metropolitan area was drawn in 1975 and was in place for the 1975, 1979, 1983, 1987, and 1991 surveys. The following table shows the sample sizes and percent of sample in common.
Year Sample Size Percent of Sample in Common with Prior Year 1975 4,706 (X) 1979 5,494 85.62 1983 4,287 95.82 1987 3,381 55.58 1991 4,266 68.50
The second independent metropolitan area longitudinal oversample for the Hartford metropolitan area was drawn in 1996 and was in place for the 1996, 2004, and 2013 surveys. The following table shows the sample sizes and percent of sample in common.
Year Sample Size Percent of Sample in Common with Prior Year 1996 4,662 (X) 2004 4,728 92.98 2013 4,440 78.04
21.3 Metropolitan Area Definition (1975, 1979, 1983) The definition of the Hartford metropolitan area used in the 1975, 1979, and 1983 AHS followed the 1971 OMB definition for the Hartford, CT SMSA.
21.4 Metropolitan Area Definition (1987, 1991) The definition of the Hartford metropolitan area used in the 1987 and 1991 AHS followed the 1983 OMB definition for the Hartford-New Britain-Middletown, CT CMSA.
21.5 Metropolitan Area Definition (1996, 2004) The definition of the Hartford metropolitan area used in the 1996 and 2004 AHS matches the 1993 OMB definition for the Hartford, CT MSA.
Metropolitan Area Histories 1973 to 2013 59
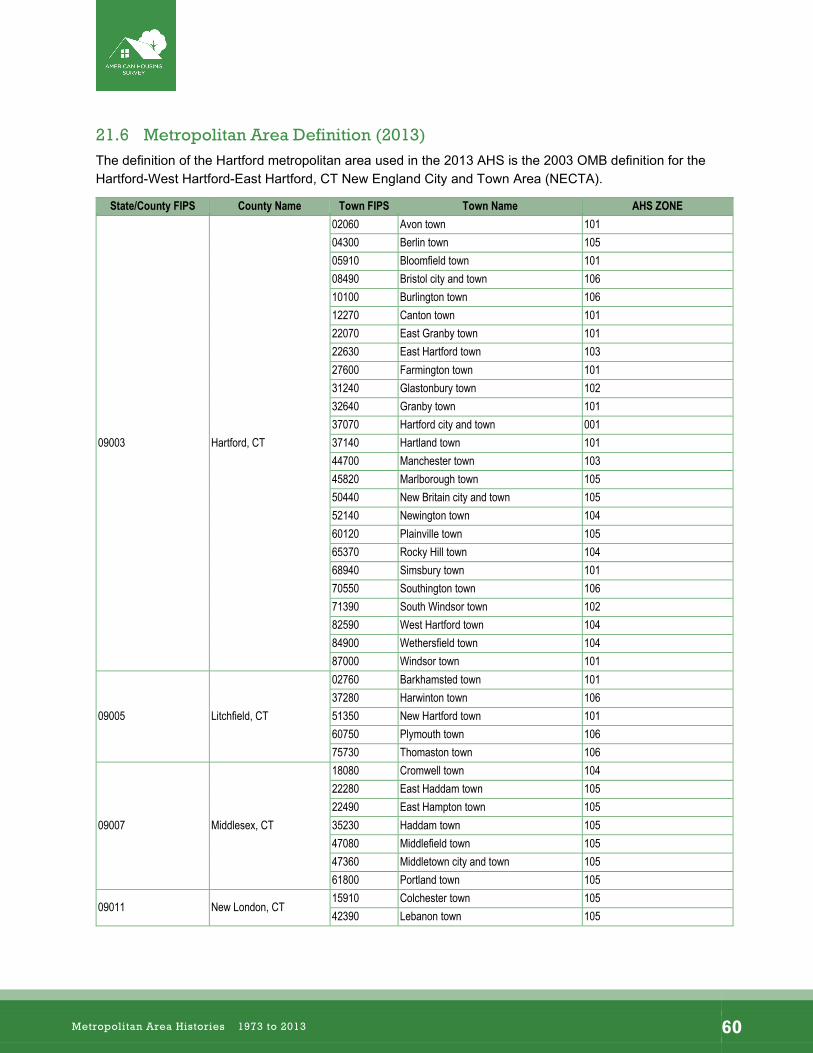
–
21.6 Metropolitan Area Definition (2013) The definition of the Hartford metropolitan area used in the 2013 AHS is the 2003 OMB definition for the Hartford-West Hartford-East Hartford, CT New England City and Town Area (NECTA).
State/County FIPS County Name Town FIPS Town Name AHS ZONE
09003 Hartford, CT
02060 Avon town 101 04300 Berlin town 105 05910 Bloomfield town 101 08490 Bristol city and town 106 10100 Burlington town 106 12270 Canton town 101 22070 East Granby town 101 22630 East Hartford town 103 27600 Farmington town 101 31240 Glastonbury town 102 32640 Granby town 101 37070 Hartford city and town 001 37140 Hartland town 101 44700 Manchester town 103 45820 Marlborough town 105 50440 New Britain city and town 105 52140 Newington town 104 60120 Plainville town 105 65370 Rocky Hill town 104 68940 Simsbury town 101 70550 Southington town 106 71390 South Windsor town 102 82590 West Hartford town 104 84900 Wethersfield town 104 87000 Windsor town 101
09005 Litchfield, CT
02760 Barkhamsted town 101 37280 Harwinton town 106 51350 New Hartford town 101 60750 Plymouth town 106 75730 Thomaston town 106
09007 Middlesex, CT
18080 Cromwell town 104 22280 East Haddam town 105 22490 East Hampton town 105 35230 Haddam town 105 47080 Middlefield town 105 47360 Middletown city and town 105 61800 Portland town 105
09011 New London, CT 15910 Colchester town 105 42390 Lebanon town 105
Metropolitan Area Histories 1973 to 2013 60
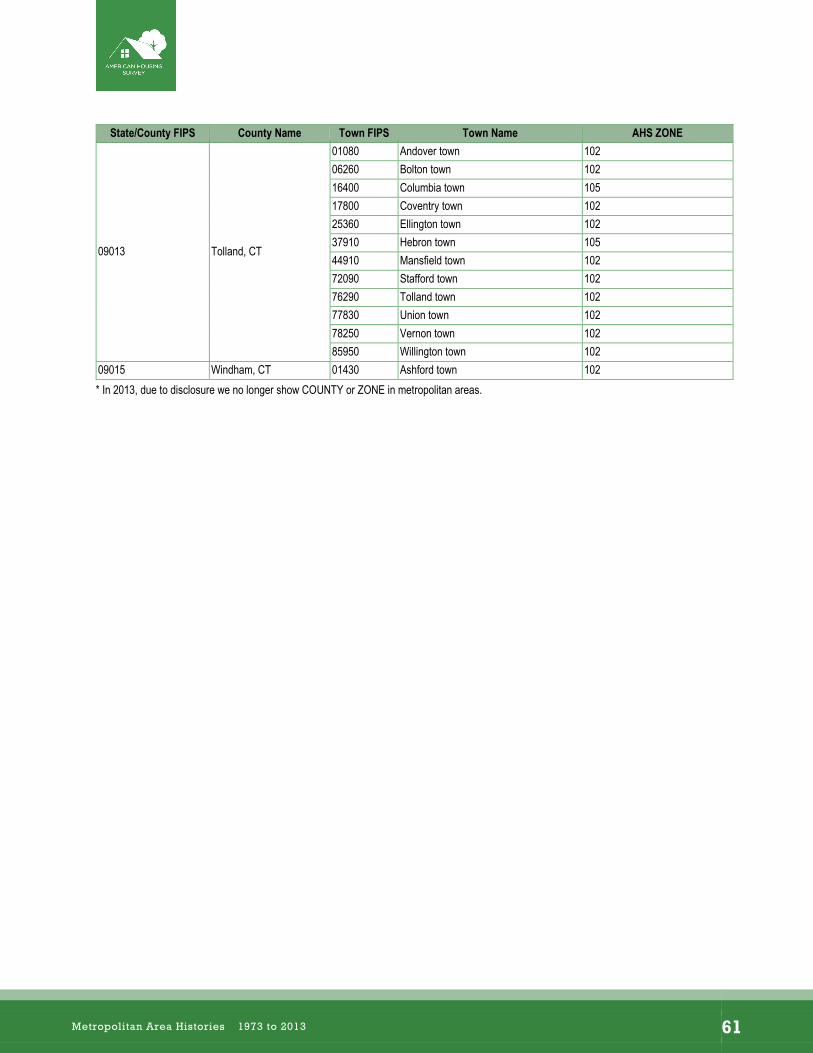
–
State/County FIPS County Name Town FIPS Town Name AHS ZONE
09013 Tolland, CT
01080 Andover town 102 06260 Bolton town 102 16400 Columbia town 105 17800 Coventry town 102 25360 Ellington town 102 37910 Hebron town 105 44910 Mansfield town 102 72090 Stafford town 102 76290 Tolland town 102 77830 Union town 102 78250 Vernon town 102 85950 Willington town 102
09015 Windham, CT 01430 Ashford town 102 * In 2013, due to disclosure we no longer show COUNTY or ZONE in metropolitan areas.
Metropolitan Area Histories 1973 to 2013 61
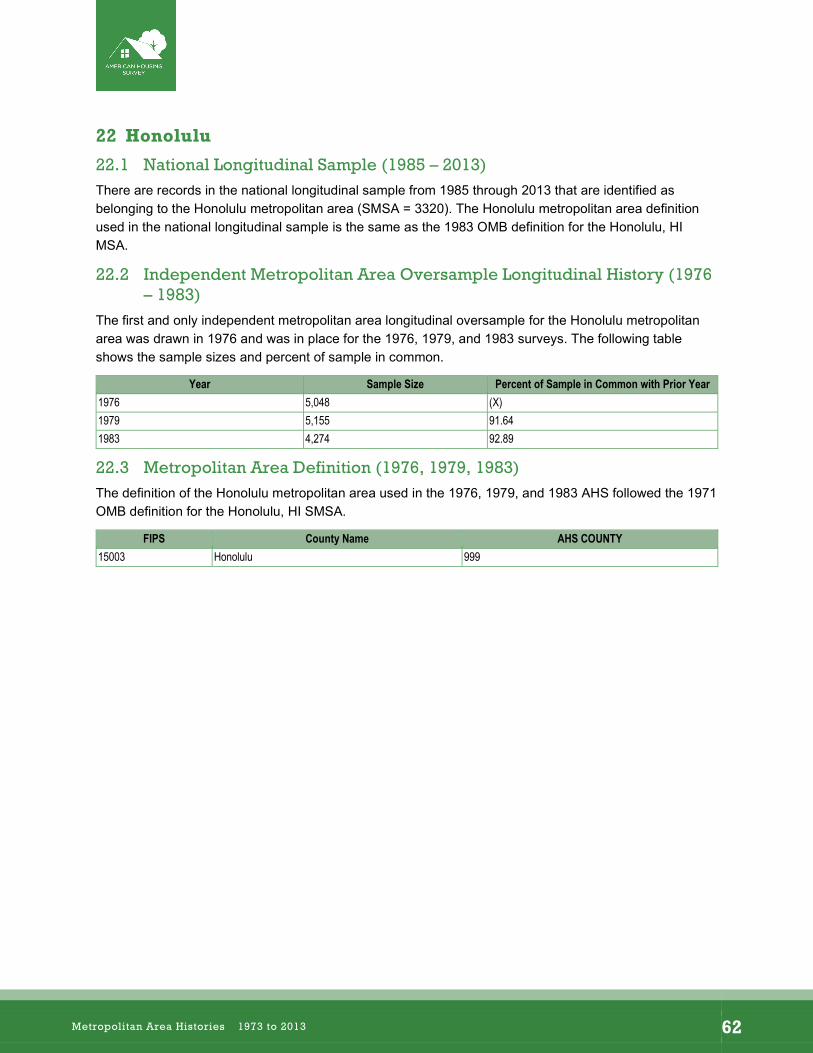
–
22 Honolulu
22.1 National Longitudinal Sample (1985 – 2013) There are records in the national longitudinal sample from 1985 through 2013 that are identified as belonging to the Honolulu metropolitan area (SMSA = 3320). The Honolulu metropolitan area definition used in the national longitudinal sample is the same as the 1983 OMB definition for the Honolulu, HI MSA.
22.2 Independent Metropolitan Area Oversample Longitudinal History (1976 – 1983)
The first and only independent metropolitan area longitudinal oversample for the Honolulu metropolitan area was drawn in 1976 and was in place for the 1976, 1979, and 1983 surveys. The following table shows the sample sizes and percent of sample in common.
Year Sample Size Percent of Sample in Common with Prior Year 1976 5,048 (X) 1979 5,155 91.64 1983 4,274 92.89
22.3 Metropolitan Area Definition (1976, 1979, 1983) The definition of the Honolulu metropolitan area used in the 1976, 1979, and 1983 AHS followed the 1971 OMB definition for the Honolulu, HI SMSA.
FIPS County Name AHS COUNTY 15003 Honolulu 999
Metropolitan Area Histories 1973 to 2013 62
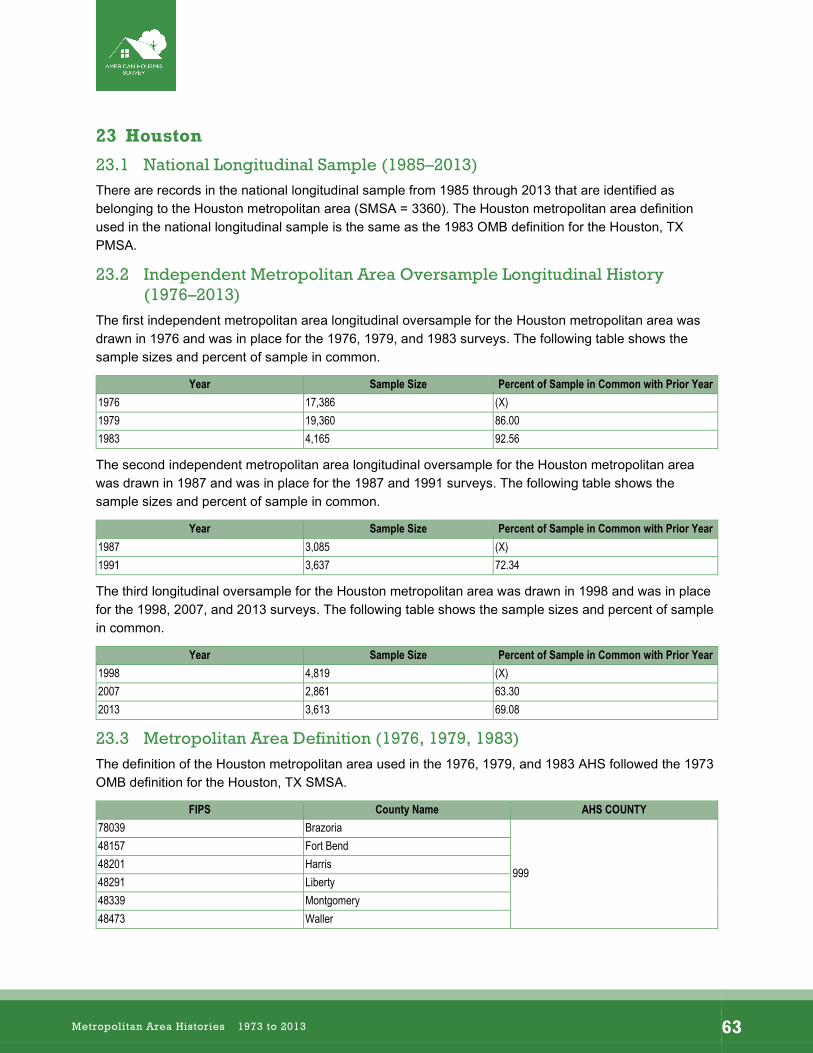
–
23 Houston
23.1 National Longitudinal Sample (1985–2013) There are records in the national longitudinal sample from 1985 through 2013 that are identified as belonging to the Houston metropolitan area (SMSA = 3360). The Houston metropolitan area definition used in the national longitudinal sample is the same as the 1983 OMB definition for the Houston, TX PMSA.
23.2 Independent Metropolitan Area Oversample Longitudinal History (1976–2013)
The first independent metropolitan area longitudinal oversample for the Houston metropolitan area was drawn in 1976 and was in place for the 1976, 1979, and 1983 surveys. The following table shows the sample sizes and percent of sample in common.
Year Sample Size Percent of Sample in Common with Prior Year 1976 17,386 (X) 1979 19,360 86.00 1983 4,165 92.56
The second independent metropolitan area longitudinal oversample for the Houston metropolitan area was drawn in 1987 and was in place for the 1987 and 1991 surveys. The following table shows the sample sizes and percent of sample in common.
Year Sample Size Percent of Sample in Common with Prior Year 1987 3,085 (X) 1991 3,637 72.34
The third longitudinal oversample for the Houston metropolitan area was drawn in 1998 and was in place for the 1998, 2007, and 2013 surveys. The following table shows the sample sizes and percent of sample in common.
Year Sample Size Percent of Sample in Common with Prior Year 1998 4,819 (X) 2007 2,861 63.30 2013 3,613 69.08
23.3 Metropolitan Area Definition (1976, 1979, 1983) The definition of the Houston metropolitan area used in the 1976, 1979, and 1983 AHS followed the 1973 OMB definition for the Houston, TX SMSA.
FIPS County Name AHS COUNTY 78039 Brazoria
999
48157 Fort Bend 48201 Harris 48291 Liberty 48339 Montgomery 48473 Waller
Metropolitan Area Histories 1973 to 2013 63
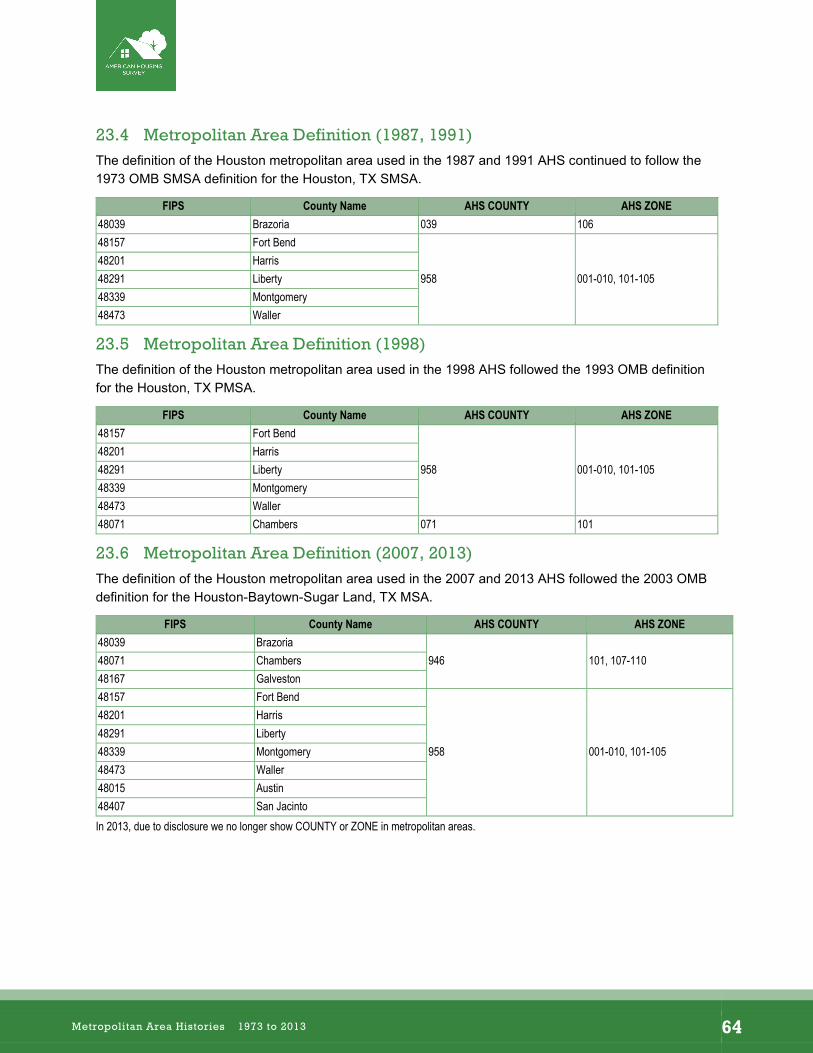
–
23.4 Metropolitan Area Definition (1987, 1991) The definition of the Houston metropolitan area used in the 1987 and 1991 AHS continued to follow the 1973 OMB SMSA definition for the Houston, TX SMSA.
FIPS County Name AHS COUNTY AHS ZONE 48039 Brazoria 039 106 48157 Fort Bend
958 001-010, 101-105 48201 Harris 48291 Liberty 48339 Montgomery 48473 Waller
23.5 Metropolitan Area Definition (1998) The definition of the Houston metropolitan area used in the 1998 AHS followed the 1993 OMB definition for the Houston, TX PMSA.
FIPS County Name AHS COUNTY AHS ZONE 48157 Fort Bend
958 001-010, 101-105 48201 Harris 48291 Liberty 48339 Montgomery 48473 Waller 48071 Chambers 071 101
23.6 Metropolitan Area Definition (2007, 2013) The definition of the Houston metropolitan area used in the 2007 and 2013 AHS followed the 2003 OMB definition for the Houston-Baytown-Sugar Land, TX MSA.
FIPS County Name AHS COUNTY AHS ZONE 48039 Brazoria
946 101, 107-110 48071 Chambers 48167 Galveston 48157 Fort Bend
958 001-010, 101-105
48201 Harris 48291 Liberty 48339 Montgomery 48473 Waller 48015 Austin 48407 San Jacinto In 2013, due to disclosure we no longer show COUNTY or ZONE in metropolitan areas.
Metropolitan Area Histories 1973 to 2013 64
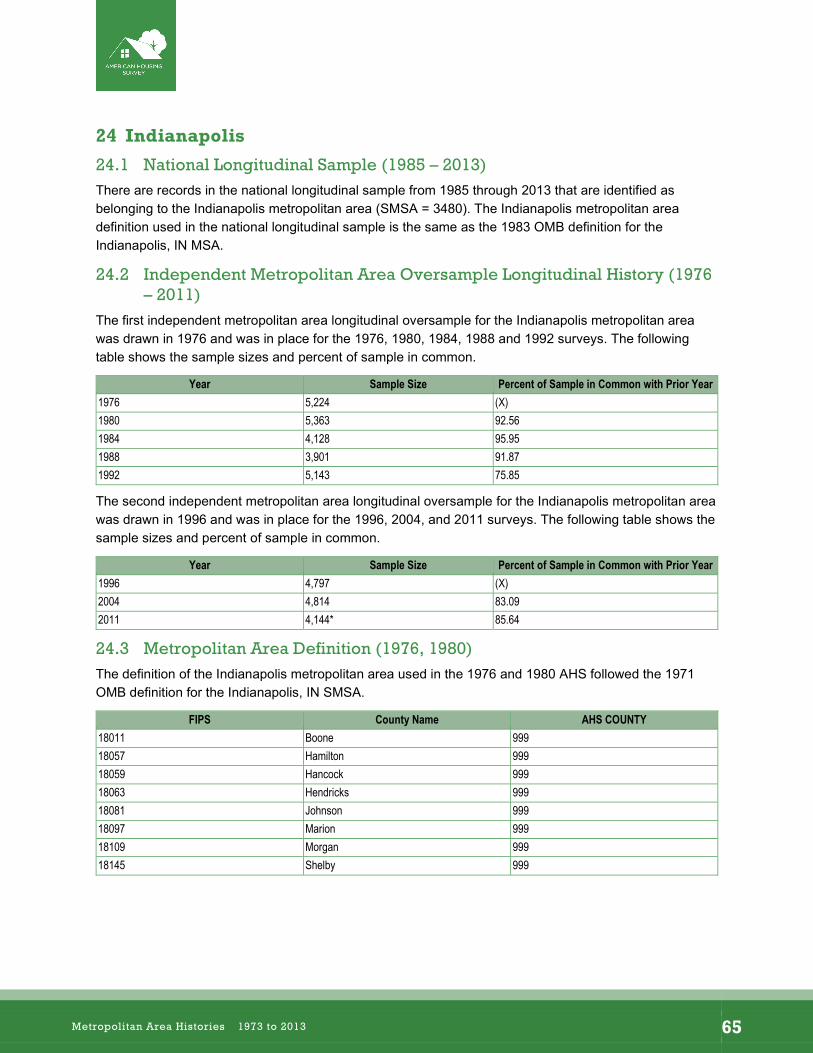
–
24 Indianapolis
24.1 National Longitudinal Sample (1985 – 2013) There are records in the national longitudinal sample from 1985 through 2013 that are identified as belonging to the Indianapolis metropolitan area (SMSA = 3480). The Indianapolis metropolitan area definition used in the national longitudinal sample is the same as the 1983 OMB definition for the Indianapolis, IN MSA.
24.2 Independent Metropolitan Area Oversample Longitudinal History (1976 – 2011)
The first independent metropolitan area longitudinal oversample for the Indianapolis metropolitan area was drawn in 1976 and was in place for the 1976, 1980, 1984, 1988 and 1992 surveys. The following table shows the sample sizes and percent of sample in common.
Year Sample Size Percent of Sample in Common with Prior Year 1976 5,224 (X) 1980 5,363 92.56 1984 4,128 95.95 1988 3,901 91.87 1992 5,143 75.85
The second independent metropolitan area longitudinal oversample for the Indianapolis metropolitan area was drawn in 1996 and was in place for the 1996, 2004, and 2011 surveys. The following table shows the sample sizes and percent of sample in common.
Year Sample Size Percent of Sample in Common with Prior Year 1996 4,797 (X) 2004 4,814 83.09 2011 4,144* 85.64
24.3 Metropolitan Area Definition (1976, 1980) The definition of the Indianapolis metropolitan area used in the 1976 and 1980 AHS followed the 1971 OMB definition for the Indianapolis, IN SMSA.
FIPS County Name AHS COUNTY 18011 Boone 999 18057 Hamilton 999 18059 Hancock 999 18063 Hendricks 999 18081 Johnson 999 18097 Marion 999 18109 Morgan 999 18145 Shelby 999
Metropolitan Area Histories 1973 to 2013 65

–
24.4 Metropolitan Area Definition (1984, 1988, 1992) The definition of the Indianapolis metropolitan area used in the 1984, 1988, and 1992 AHS followed the 1983 OMB definition for the Indianapolis, IN MSA.
FIPS County Name AHS COUNTY AHS ZONE 18011 Boone 996 101 18057 Hamilton 995 102 18059 Hancock 995 102 18063 Hendricks 996 101 18081 Johnson 994 103 18097 Marion 997 005 18109 Morgan 994 103 18145 Shelby 994 103
24.5 Metropolitan Area Definition (1996, 2004) The definition of the Indianapolis metropolitan area used in the 1996 and 2004 AHS followed the 1993 OMB definition for the Indianapolis, IN MSA.
FIPS County Name AHS COUNTY AHS ZONE 18011 Boone 996 101 18057 Hamilton 995 102 18059 Hancock 995 102 18063 Hendricks 996 101 18081 Johnson 994 103 18095 Madison 095 104 18097 Marion 997 001-005 18109 Morgan 994 103 18145 Shelby 994 103
Metropolitan Area Histories 1973 to 2013 66

–
24.6 Metropolitan Area Definition (2011) The definition of the Indianapolis metropolitan area used in the 2011 followed the 2003 OMB definition for the Indianapolis, IN MSA. Each pseudo code in this metropolitan area contains a part of Marion county.
This differs from other metropolitan areas where counties are not divided amongst pseudocounties. The breakdown of Marion county is as follows:
The central city part of Marion county (ZONES 001-005) was pseudo coded to 997.
Pseudo code 996 contains Boone county and Hendricks county and part of Marion county.
Pseudo code 995 contains Hamilton county and Hancock county and part of Marion county.
Pseudo code 994 contains Brown county, Putnam county, Johnson county, Morgan county, Shelby county, and part of Marion county.
FIPS County Name AHS COUNTY AHS ZONE 18011 Boone 996 101 18013 Brown 994 103 18057 Hamilton 995 102 18059 Hancock 995 102 18063 Hendricks 996 101 18081 Johnson 994 103 18097 Marion 994, 995, 996, 997 001-005 18109 Morgan 994 103 18133 Putnam 994 103 18145 Shelby 994 103
Metropolitan Area Histories 1973 to 2013 67
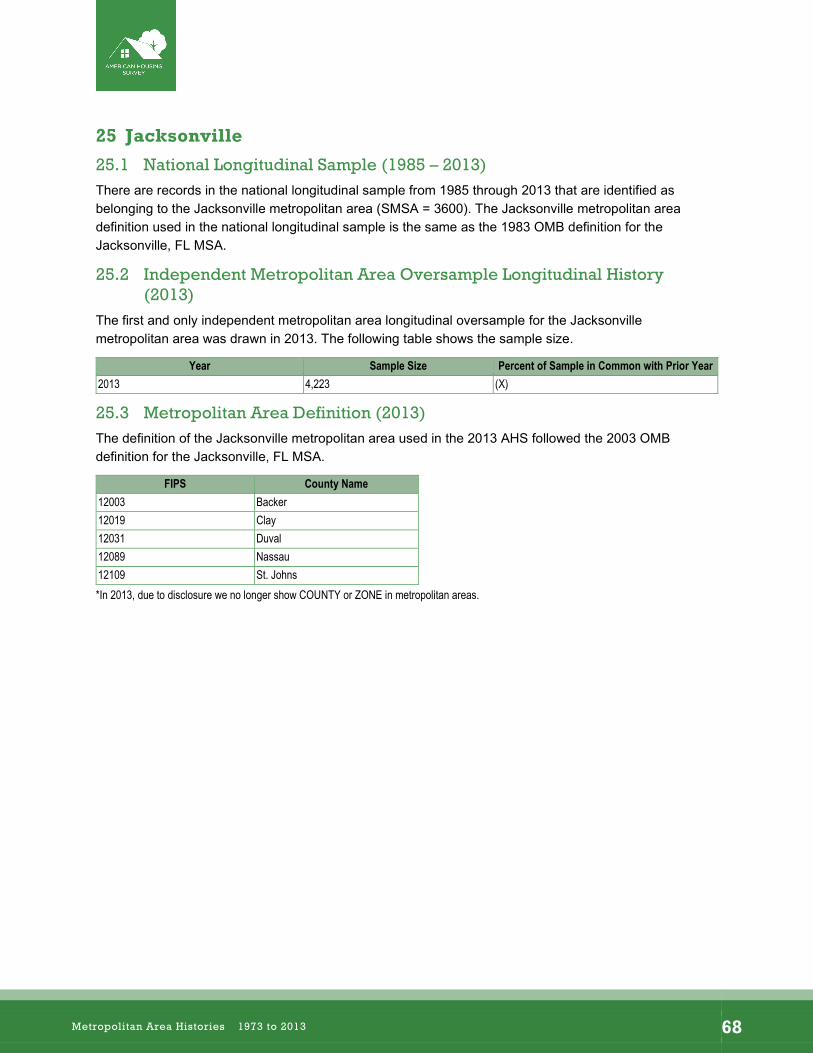
–
25 Jacksonville
25.1 National Longitudinal Sample (1985 – 2013) There are records in the national longitudinal sample from 1985 through 2013 that are identified as belonging to the Jacksonville metropolitan area (SMSA = 3600). The Jacksonville metropolitan area definition used in the national longitudinal sample is the same as the 1983 OMB definition for the Jacksonville, FL MSA.
25.2 Independent Metropolitan Area Oversample Longitudinal History (2013)
The first and only independent metropolitan area longitudinal oversample for the Jacksonville metropolitan area was drawn in 2013. The following table shows the sample size.
Year Sample Size Percent of Sample in Common with Prior Year 2013 4,223 (X)
25.3 Metropolitan Area Definition (2013) The definition of the Jacksonville metropolitan area used in the 2013 AHS followed the 2003 OMB definition for the Jacksonville, FL MSA.
FIPS County Name 12003 Backer 12019 Clay 12031 Duval 12089 Nassau 12109 St. Johns *In 2013, due to disclosure we no longer show COUNTY or ZONE in metropolitan areas.
Metropolitan Area Histories 1973 to 2013 68
–
26 Kansas City
26.1 National Longitudinal Sample (1985 – 2013) There are records in the national longitudinal sample from 1985 through 2013 that are identified as belonging to the Kansas City metropolitan area (SMSA = 3760). The Kansas City metropolitan area definition used in the national longitudinal sample is the same as the 1983 OMB definition for the Kansas City, MO PMSA.
26.2 Independent Metropolitan Area Oversample Longitudinal History (1975 – 2011)
The first independent metropolitan area longitudinal oversample for the Kansas City metropolitan area was drawn in 1975 and was in place for the 1975, 1978, 1982, 1986, and 1990 surveys. The following table shows the sample sizes and percent of sample in common.
Year Sample Size Percent of Sample in Common with Prior Year 1975 4,467 (X) 1978 5,374 83.05 1982 4,085 96.11 1986 3,411 72.97 1990 5,402 63.14
The second independent metropolitan area longitudinal oversample for the Kansas City metropolitan area was drawn in 1995 and was in place for the 1995, 2002, and 2011 surveys. The following table shows the sample sizes and percent of sample in common.
Year Sample Size Percent of Sample in Common with Prior Year 1995 4,232 (X) 2002 4,830 87.62 2011 3,978 71.92
26.3 Metropolitan Area Definition (1975, 1978, 1982) The definition of the Kansas City metropolitan area used in the 1975, 1978, and 1982 AHS followed the 1971 OMB definition for the Kansas City, MO-KS SMSA.
FIPS County Name AHS COUNTY 29047 Clay, MO
999
29095 Jackson, MO 29165 Platte, MO 29037 Cass, MO 20091 Johnson, KS 20209 Wyandotte, KS
Metropolitan Area Histories 1973 to 2013 69
–
26.4 Metropolitan Area Definition (1986, 1990) The definition of the Kansas City metropolitan area used in the 1986 and 1990 AHS followed the 1983 OMB definition for the Kansas City, MO PMSA.
FIPS County Name AHS COUNTY AHS ZONE 29095 Jackson, MO 095 001-003, 102, 103 29047 Clay, MO
976 003, 101 29165 Platte, MO 29037 Cass, MO 29107 Lafayette, MO 29177 Ray, MO 20091 Johnson, KS
975 104-106 20103 Leavenworth, KS 20121 Miami, KS 20209 Wyandotte, KS
26.5 Metropolitan Area Definition (1995, 2002) The definition of the Kansas City metropolitan area used in the 1995 and 2002 AHS followed the 1993 OMB definition for the Kansas City, MO-KS MSA.
FIPS County Name AHS COUNTY AHS ZONE 29095 Jackson, MO 095 001- 003, 102, 103 29047 Clay, MO
976 003, 107, 108
29165 Platte, MO 29037 Cass, MO 29049 Clinton, MO 29107 Lafayette, MO 29177 Ray, MO 20091 Johnson, KS
975 104-106 20103 Leavenworth, KS 20121 Miami, KS 20209 Wyandotte, KS
Metropolitan Area Histories 1973 to 2013 70
–
26.6 Metropolitan Area Definition (2011) The definition of the Kansas City metropolitan area used in the 2011 AHS followed the 2003 OMB definition for the Kansas City, MO-KS MSA.
FIPS County Name AHS COUNTY AHS ZONE 29047 Clay, MO
976 003, 004, 102, 103, 107, 108
29165 Platte, MO 29013 Bates, MO 29025 Caldwell, MO 29037 Cass, MO 29049 Clinton, MO 29095 Jackson, MO 29107 Lafayette, MO 29177 Ray, MO 20059 Franklin, KS
975 104-106
20091 Johnson, KS 20103 Leavenworth, KS 20107 Linn, KS 20121 Miami, KS 20209 Wyandotte, KS
Metropolitan Area Histories 1973 to 2013 71
–
27 Las Vegas
27.1 National Longitudinal Sample (1985 – 2013) There are records in the national longitudinal sample from 1985 through 2013 that are identified as belonging to the Las Vegas metropolitan area (SMSA = 4120). The Las Vegas metropolitan area definition used in the national longitudinal sample is the same as the 1983 OMB definition for the Las Vegas, NV MSA.
27.2 Independent Metropolitan Area Oversample Longitudinal History (1976 – 2013)
The first independent metropolitan area longitudinal oversample for the Las Vegas metropolitan area was drawn in 1976 and was in place for the 1976 and 1979 surveys. The following table shows the sample sizes and percent of sample in common.
Year Sample Size Percent of Sample in Common with Prior Year 1976 5,401 (X) 1979 6,983 74.68
The second independent metropolitan area longitudinal oversample for the Las Vegas metropolitan area was drawn for the 2013 survey. The following table shows the sample size.
Year Sample Size Percent of Sample in Common with Prior Year 2013 4,121 (X)
27.3 Metropolitan Area Definition (1976, 1979) The definition of the Las Vegas metropolitan area used in the 1976 and 1979 AHS followed the 1973 OMB definition for the Las Vegas, NV SMSA.
FIPS County Name AHS COUNTY 32003 Clark 999
27.4 Metropolitan Area Definition (2013) The definition of the Las Vegas metropolitan area used in the 2013 AHS followed the 2003 OMB definition for the Las Vegas-Paradise, NV MSA.
FIPS County Name 32003 Clark *In 2013, due to disclosure we no longer show COUNTY or ZONE in metropolitan areas.
Metropolitan Area Histories 1973 to 2013 72
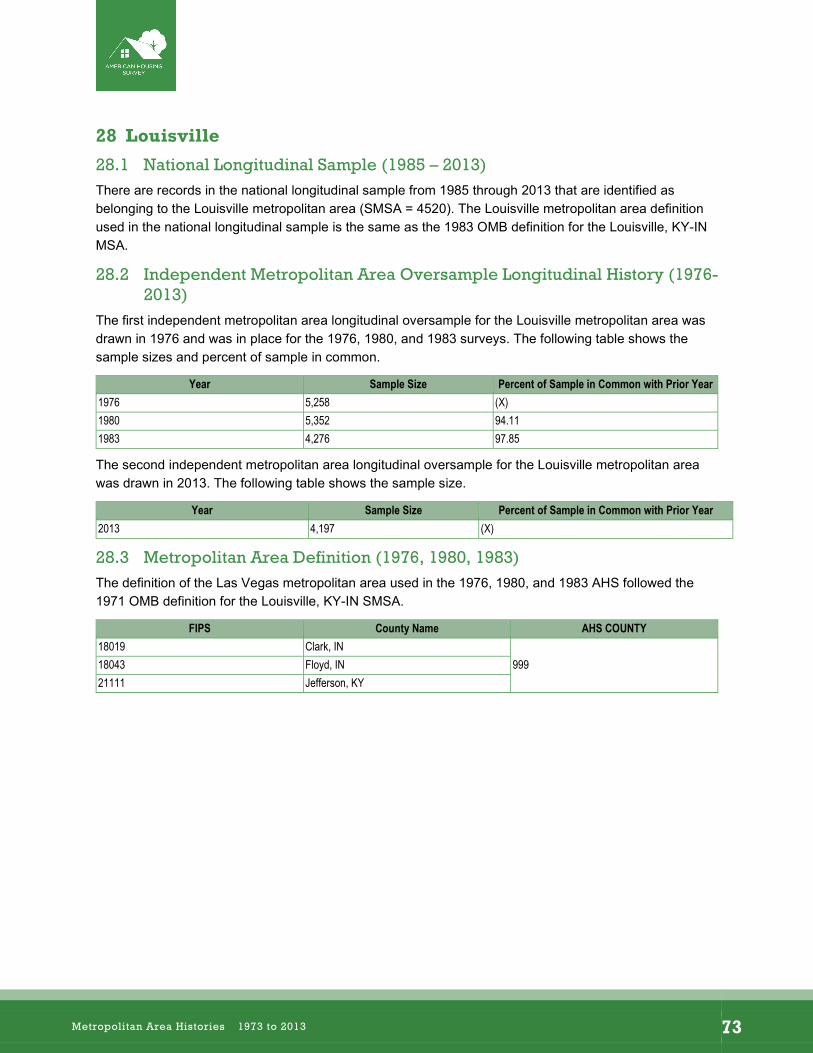
–
28 Louisville
28.1 National Longitudinal Sample (1985 – 2013) There are records in the national longitudinal sample from 1985 through 2013 that are identified as belonging to the Louisville metropolitan area (SMSA = 4520). The Louisville metropolitan area definition used in the national longitudinal sample is the same as the 1983 OMB definition for the Louisville, KY-IN MSA.
28.2 Independent Metropolitan Area Oversample Longitudinal History (1976-2013)
The first independent metropolitan area longitudinal oversample for the Louisville metropolitan area was drawn in 1976 and was in place for the 1976, 1980, and 1983 surveys. The following table shows the sample sizes and percent of sample in common.
Year Sample Size Percent of Sample in Common with Prior Year 1976 5,258 (X) 1980 5,352 94.11 1983 4,276 97.85
The second independent metropolitan area longitudinal oversample for the Louisville metropolitan area was drawn in 2013. The following table shows the sample size.
Year Sample Size Percent of Sample in Common with Prior Year 2013 4,197 (X)
28.3 Metropolitan Area Definition (1976, 1980, 1983) The definition of the Las Vegas metropolitan area used in the 1976, 1980, and 1983 AHS followed the 1971 OMB definition for the Louisville, KY-IN SMSA.
FIPS County Name AHS COUNTY 18019 Clark, IN
99918043 Floyd, IN 21111 Jefferson, KY
Metropolitan Area Histories 1973 to 2013 73
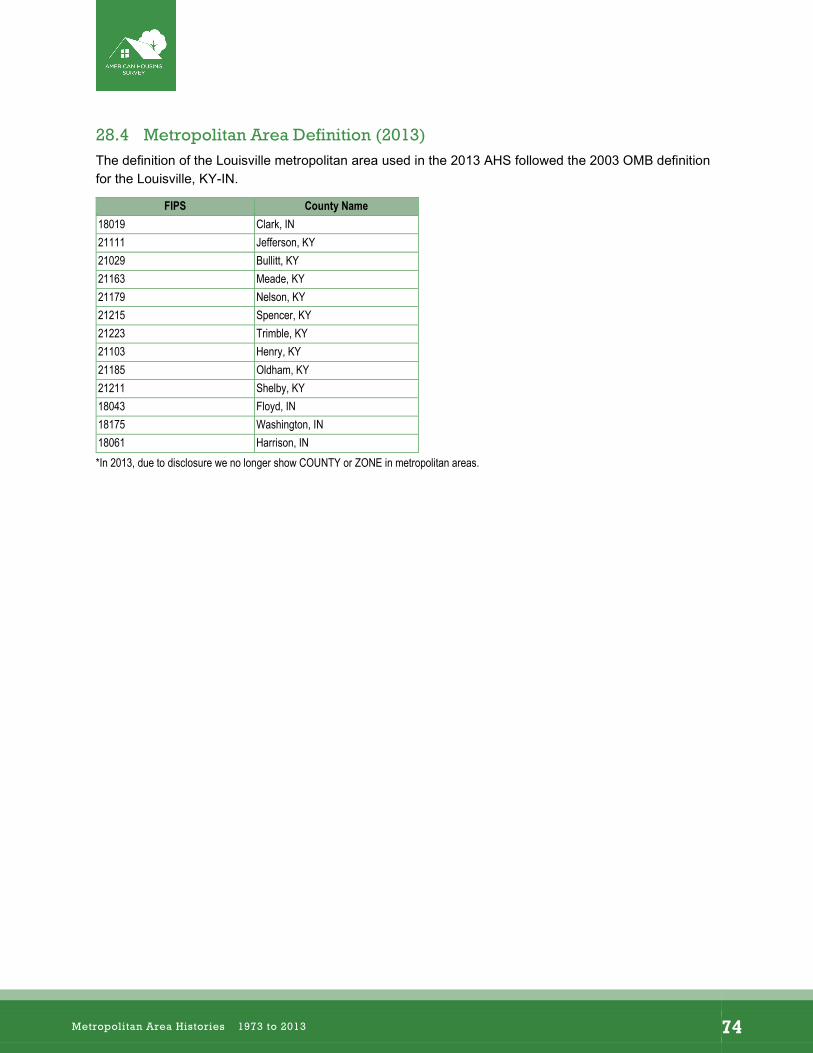
–
28.4 Metropolitan Area Definition (2013) The definition of the Louisville metropolitan area used in the 2013 AHS followed the 2003 OMB definition for the Louisville, KY-IN.
FIPS County Name 18019 Clark, IN 21111 Jefferson, KY 21029 Bullitt, KY 21163 Meade, KY 21179 Nelson, KY 21215 Spencer, KY 21223 Trimble, KY 21103 Henry, KY 21185 Oldham, KY 21211 Shelby, KY 18043 Floyd, IN 18175 Washington, IN 18061 Harrison, IN *In 2013, due to disclosure we no longer show COUNTY or ZONE in metropolitan areas.
Metropolitan Area Histories 1973 to 2013 74
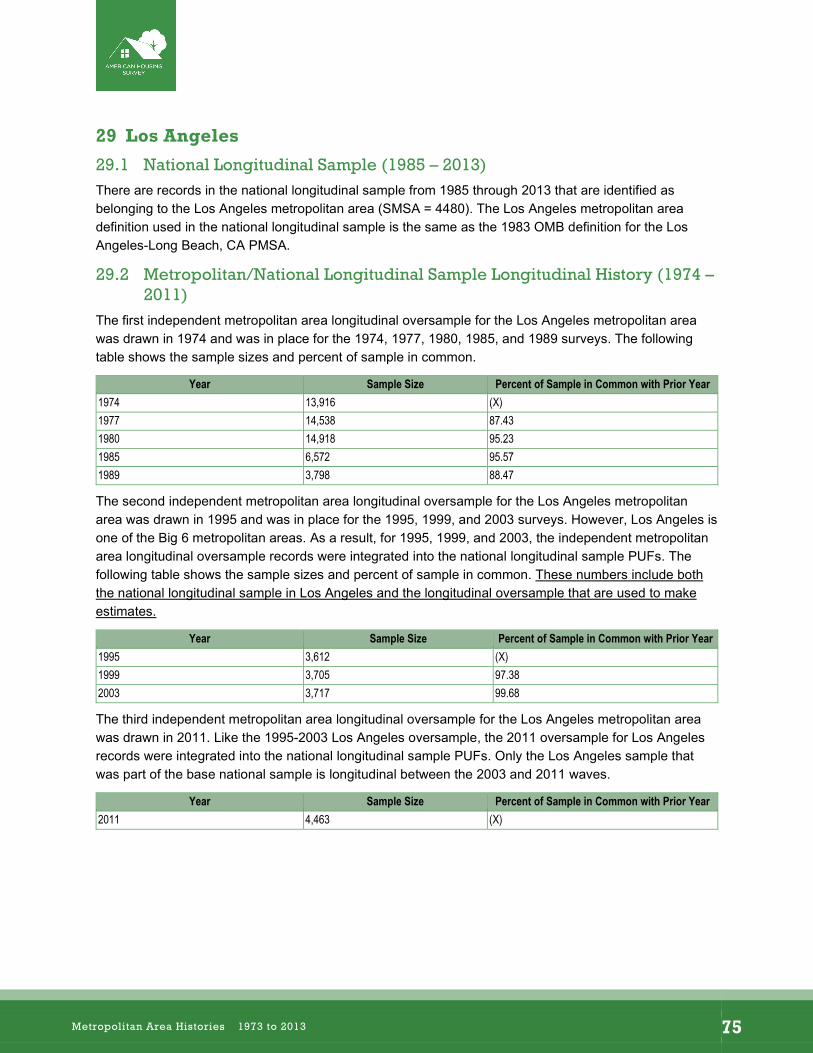
–
29 Los Angeles
29.1 National Longitudinal Sample (1985 – 2013) There are records in the national longitudinal sample from 1985 through 2013 that are identified as belonging to the Los Angeles metropolitan area (SMSA = 4480). The Los Angeles metropolitan area definition used in the national longitudinal sample is the same as the 1983 OMB definition for the Los Angeles-Long Beach, CA PMSA.
29.2 Metropolitan/National Longitudinal Sample Longitudinal History (1974 – 2011)
The first independent metropolitan area longitudinal oversample for the Los Angeles metropolitan area was drawn in 1974 and was in place for the 1974, 1977, 1980, 1985, and 1989 surveys. The following table shows the sample sizes and percent of sample in common.
Year Sample Size Percent of Sample in Common with Prior Year 1974 13,916 (X) 1977 14,538 87.43 1980 14,918 95.23 1985 6,572 95.57 1989 3,798 88.47
The second independent metropolitan area longitudinal oversample for the Los Angeles metropolitan area was drawn in 1995 and was in place for the 1995, 1999, and 2003 surveys. However, Los Angeles is one of the Big 6 metropolitan areas. As a result, for 1995, 1999, and 2003, the independent metropolitan area longitudinal oversample records were integrated into the national longitudinal sample PUFs. The following table shows the sample sizes and percent of sample in common. These numbers include both the national longitudinal sample in Los Angeles and the longitudinal oversample that are used to make estimates.
Year Sample Size Percent of Sample in Common with Prior Year 1995 3,612 (X) 1999 3,705 97.38 2003 3,717 99.68
The third independent metropolitan area longitudinal oversample for the Los Angeles metropolitan area was drawn in 2011. Like the 1995-2003 Los Angeles oversample, the 2011 oversample for Los Angeles records were integrated into the national longitudinal sample PUFs. Only the Los Angeles sample that was part of the base national sample is longitudinal between the 2003 and 2011 waves.
Year Sample Size Percent of Sample in Common with Prior Year 2011 4,463 (X)
Metropolitan Area Histories 1973 to 2013 75
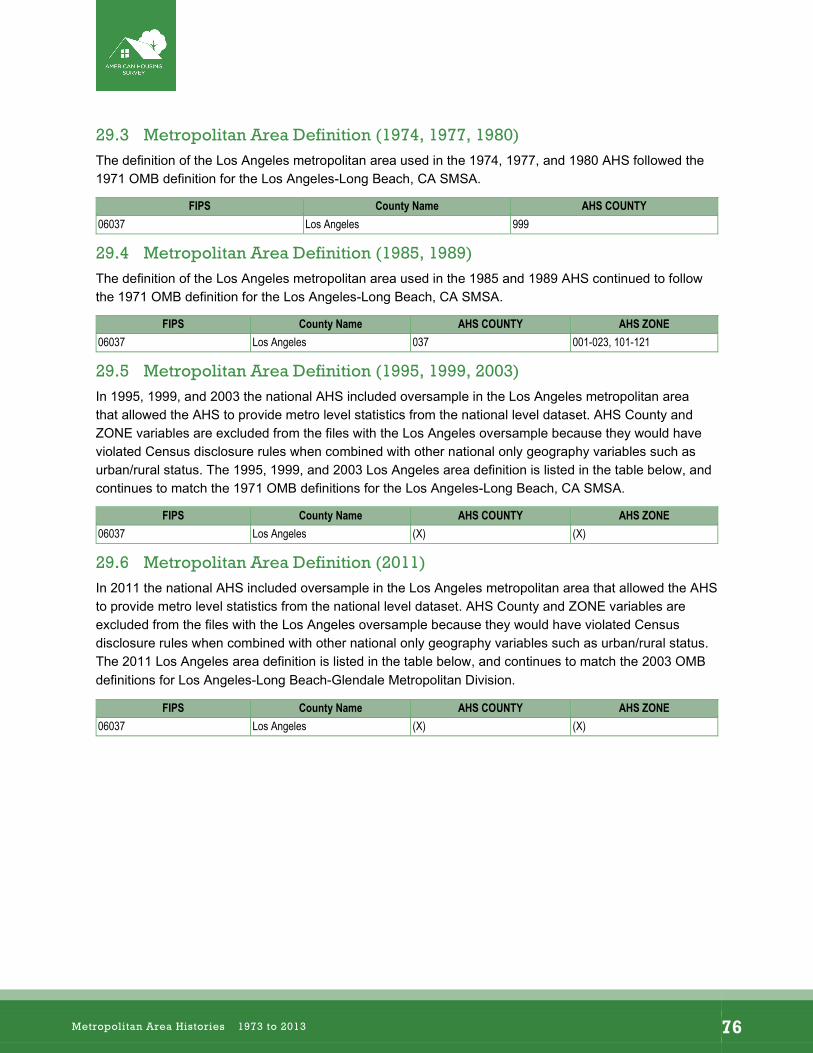
–
29.3 Metropolitan Area Definition (1974, 1977, 1980) The definition of the Los Angeles metropolitan area used in the 1974, 1977, and 1980 AHS followed the 1971 OMB definition for the Los Angeles-Long Beach, CA SMSA.
FIPS County Name AHS COUNTY 06037 Los Angeles 999
29.4 Metropolitan Area Definition (1985, 1989) The definition of the Los Angeles metropolitan area used in the 1985 and 1989 AHS continued to follow the 1971 OMB definition for the Los Angeles-Long Beach, CA SMSA.
FIPS County Name AHS COUNTY AHS ZONE 06037 Los Angeles 037 001-023, 101-121
29.5 Metropolitan Area Definition (1995, 1999, 2003) In 1995, 1999, and 2003 the national AHS included oversample in the Los Angeles metropolitan area that allowed the AHS to provide metro level statistics from the national level dataset. AHS County and ZONE variables are excluded from the files with the Los Angeles oversample because they would have violated Census disclosure rules when combined with other national only geography variables such as urban/rural status. The 1995, 1999, and 2003 Los Angeles area definition is listed in the table below, and continues to match the 1971 OMB definitions for the Los Angeles-Long Beach, CA SMSA.
FIPS County Name AHS COUNTY AHS ZONE 06037 Los Angeles (X) (X)
29.6 Metropolitan Area Definition (2011) In 2011 the national AHS included oversample in the Los Angeles metropolitan area that allowed the AHS to provide metro level statistics from the national level dataset. AHS County and ZONE variables are excluded from the files with the Los Angeles oversample because they would have violated Census disclosure rules when combined with other national only geography variables such as urban/rural status. The 2011 Los Angeles area definition is listed in the table below, and continues to match the 2003 OMB definitions for Los Angeles-Long Beach-Glendale Metropolitan Division.
FIPS County Name AHS COUNTY AHS ZONE 06037 Los Angeles (X) (X)
Metropolitan Area Histories 1973 to 2013 76

–
30 Madison
30.1 National Longitudinal Sample (1985 – 2013) There are records in the national longitudinal sample from 1985 through 2013 that are identified as belonging to the Madison metropolitan area (SMSA = 4720). The Madison metropolitan area definition used in the national longitudinal sample is the same as the 1983 OMB definition for the Madison, WI MSA.
30.2 Independent Metropolitan Area Oversample Longitudinal History (1975 – 1981)
The first and only independent metropolitan area longitudinal oversample for the Madison metropolitan area was drawn in 1975 and was in place for the 1975, 1977, and 1981 surveys. The following table shows the sample sizes and percent of sample in common.
Year Sample Size Percent of Sample in Common with Prior Year 1975 4,766 (X) 1977 5,258 82.83 1981 4,604 92.09
30.3 Metropolitan Area Definition (1975, 1977, 1981) The definition of the Madison metropolitan area used in the 1975, 1977, and 1981 AHS followed the 1971 OMB definition for the Madison, WI SMSA.
FIPS County Name AHS COUNTY 55025 Dane 999
Metropolitan Area Histories 1973 to 2013 77
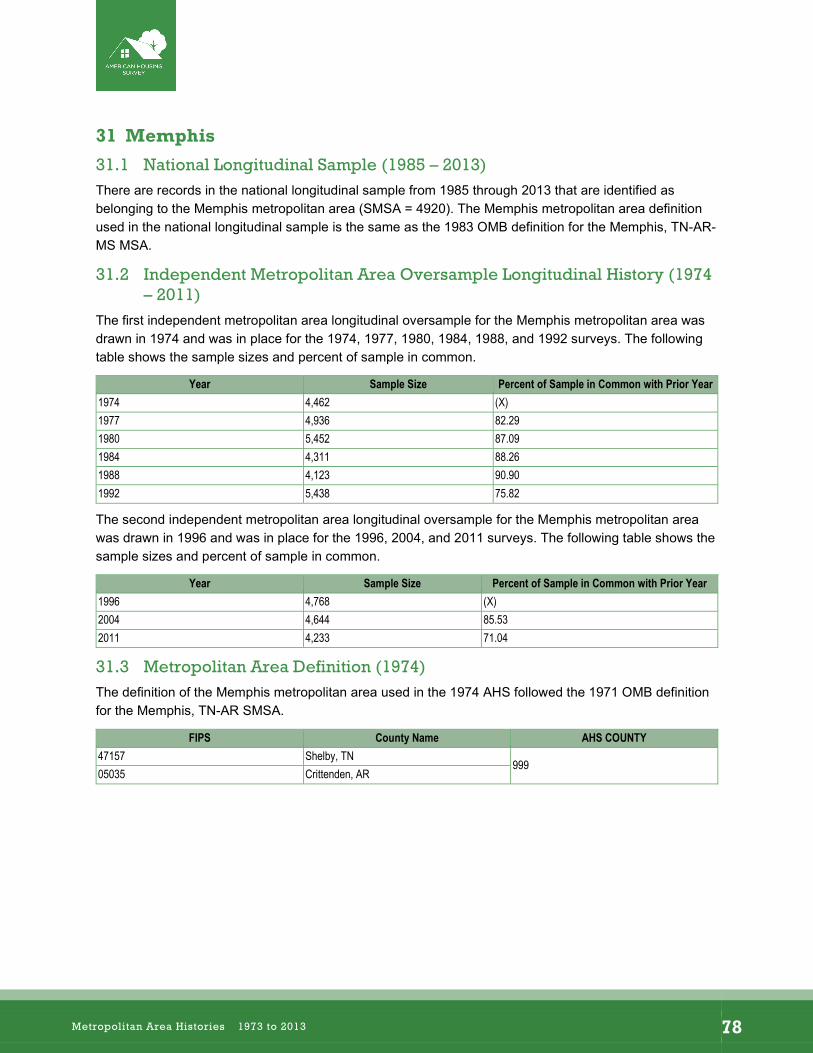
–
31 Memphis
31.1 National Longitudinal Sample (1985 – 2013) There are records in the national longitudinal sample from 1985 through 2013 that are identified as belonging to the Memphis metropolitan area (SMSA = 4920). The Memphis metropolitan area definition used in the national longitudinal sample is the same as the 1983 OMB definition for the Memphis, TN-AR-MS MSA.
31.2 Independent Metropolitan Area Oversample Longitudinal History (1974 – 2011)
The first independent metropolitan area longitudinal oversample for the Memphis metropolitan area was drawn in 1974 and was in place for the 1974, 1977, 1980, 1984, 1988, and 1992 surveys. The following table shows the sample sizes and percent of sample in common.
Year Sample Size Percent of Sample in Common with Prior Year 1974 4,462 (X) 1977 4,936 82.29 1980 5,452 87.09 1984 4,311 88.26 1988 4,123 90.90 1992 5,438 75.82
The second independent metropolitan area longitudinal oversample for the Memphis metropolitan area was drawn in 1996 and was in place for the 1996, 2004, and 2011 surveys. The following table shows the sample sizes and percent of sample in common.
Year Sample Size Percent of Sample in Common with Prior Year 1996 4,768 (X) 2004 4,644 85.53 2011 4,233 71.04
31.3 Metropolitan Area Definition (1974) The definition of the Memphis metropolitan area used in the 1974 AHS followed the 1971 OMB definition for the Memphis, TN-AR SMSA.
FIPS County Name AHS COUNTY 47157 Shelby, TN
99905035 Crittenden, AR
Metropolitan Area Histories 1973 to 2013 78
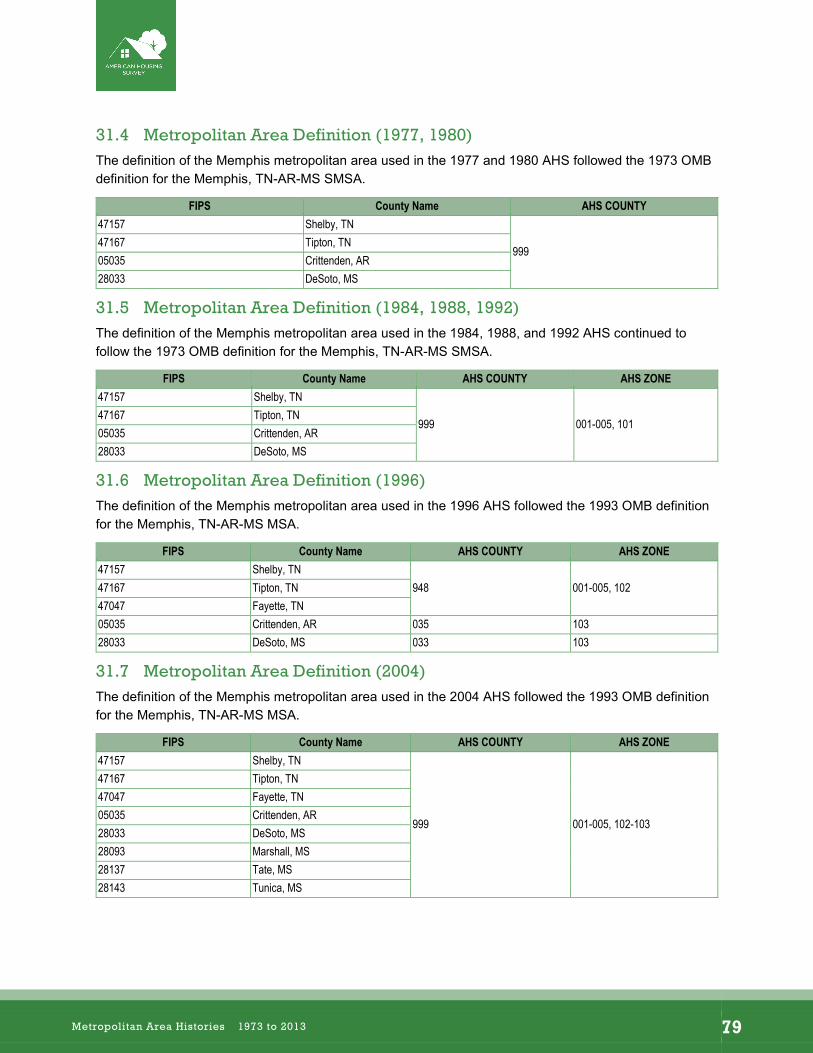
–
31.4 Metropolitan Area Definition (1977, 1980) The definition of the Memphis metropolitan area used in the 1977 and 1980 AHS followed the 1973 OMB definition for the Memphis, TN-AR-MS SMSA.
FIPS County Name AHS COUNTY 47157 Shelby, TN
99947167 Tipton, TN 05035 Crittenden, AR 28033 DeSoto, MS
31.5 Metropolitan Area Definition (1984, 1988, 1992) The definition of the Memphis metropolitan area used in the 1984, 1988, and 1992 AHS continued to follow the 1973 OMB definition for the Memphis, TN-AR-MS SMSA.
FIPS County Name AHS COUNTY AHS ZONE 47157 Shelby, TN
999 001-005, 101 47167 Tipton, TN 05035 Crittenden, AR 28033 DeSoto, MS
31.6 Metropolitan Area Definition (1996) The definition of the Memphis metropolitan area used in the 1996 AHS followed the 1993 OMB definition for the Memphis, TN-AR-MS MSA.
FIPS County Name AHS COUNTY AHS ZONE 47157 Shelby, TN
948 001-005, 102 47167 Tipton, TN 47047 Fayette, TN 05035 Crittenden, AR 035 103 28033 DeSoto, MS 033 103
31.7 Metropolitan Area Definition (2004) The definition of the Memphis metropolitan area used in the 2004 AHS followed the 1993 OMB definition for the Memphis, TN-AR-MS MSA.
FIPS County Name AHS COUNTY AHS ZONE 47157 Shelby, TN
999 001-005, 102-103
47167 Tipton, TN 47047 Fayette, TN 05035 Crittenden, AR 28033 DeSoto, MS 28093 Marshall, MS 28137 Tate, MS 28143 Tunica, MS
Metropolitan Area Histories 1973 to 2013 79
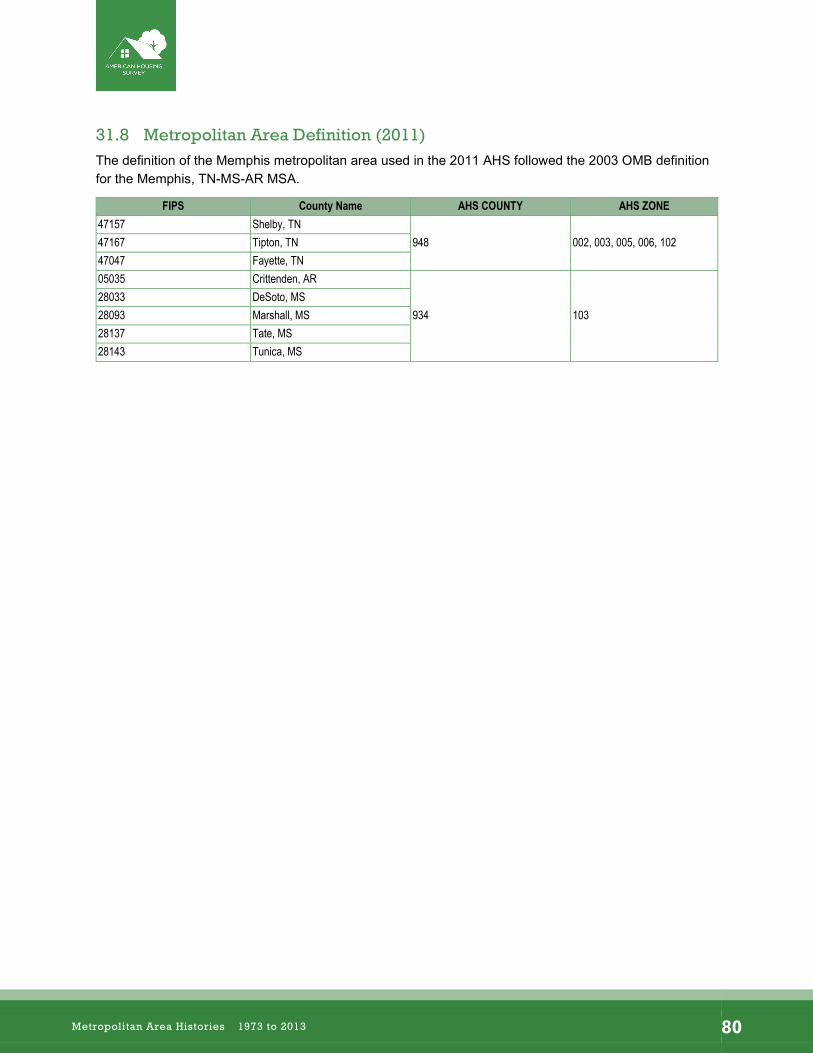
–
31.8 Metropolitan Area Definition (2011) The definition of the Memphis metropolitan area used in the 2011 AHS followed the 2003 OMB definition for the Memphis, TN-MS-AR MSA.
FIPS County Name AHS COUNTY AHS ZONE 47157 Shelby, TN
948 002, 003, 005, 006, 102 47167 Tipton, TN 47047 Fayette, TN 05035 Crittenden, AR
934 103 28033 DeSoto, MS 28093 Marshall, MS 28137 Tate, MS 28143 Tunica, MS
Metropolitan Area Histories 1973 to 2013 80

–
32 Miami
32.1 National Longitudinal Sample (1985 – 2013) There are records in the national longitudinal sample from 1985 through 2013 that are identified as belonging to the Miami metropolitan area (SMSA = 5000 or CMSA = 56). The Miami metropolitan area definition used in the national longitudinal sample is the same as the 1983 OMB definition for the Miami-Hialeah, FL PMSA and the Miami-Fort Lauderdale, FL CMSA, respectively.
32.2 Independent Metropolitan Area Oversample Longitudinal History (1975 – 2013)
The first independent metropolitan area longitudinal oversample for the Miami metropolitan area was drawn in 1975 and was in place for 1975, 1979, 1983, 1986, and 1990 surveys. The following table shows the sample sizes and percent of sample in common.
Year Sample Size Percent of Sample in Common with Prior Year 1975 4,305 (X) 1979 5,575 77.15 1983 4,258 91.78 1986 3,222 57.08 1990 5,508 58.50
The second independent metropolitan area longitudinal oversample for the Miami metropolitan area was drawn in 1995 and was in place for the 1995, 2002, 2007, and 2013 surveys. The following table shows the sample sizes and percent of sample in common.
Year Sample Size Percent of Sample in Common with Prior Year 1995 4,287 (X) 2002 4,770 89.87 2007 2,647 67.17 2013 3,558 95.54
32.3 Metropolitan Area Definition (1975, 1979, 1983) The definition of the Miami metropolitan area used in the 1975, 1979, and 1983 AHS followed the 1971 OMB definition for the Miami, FL SMSA.
FIPS County Name AHS COUNTY 12025 Dade 025
Metropolitan Area Histories 1973 to 2013 81
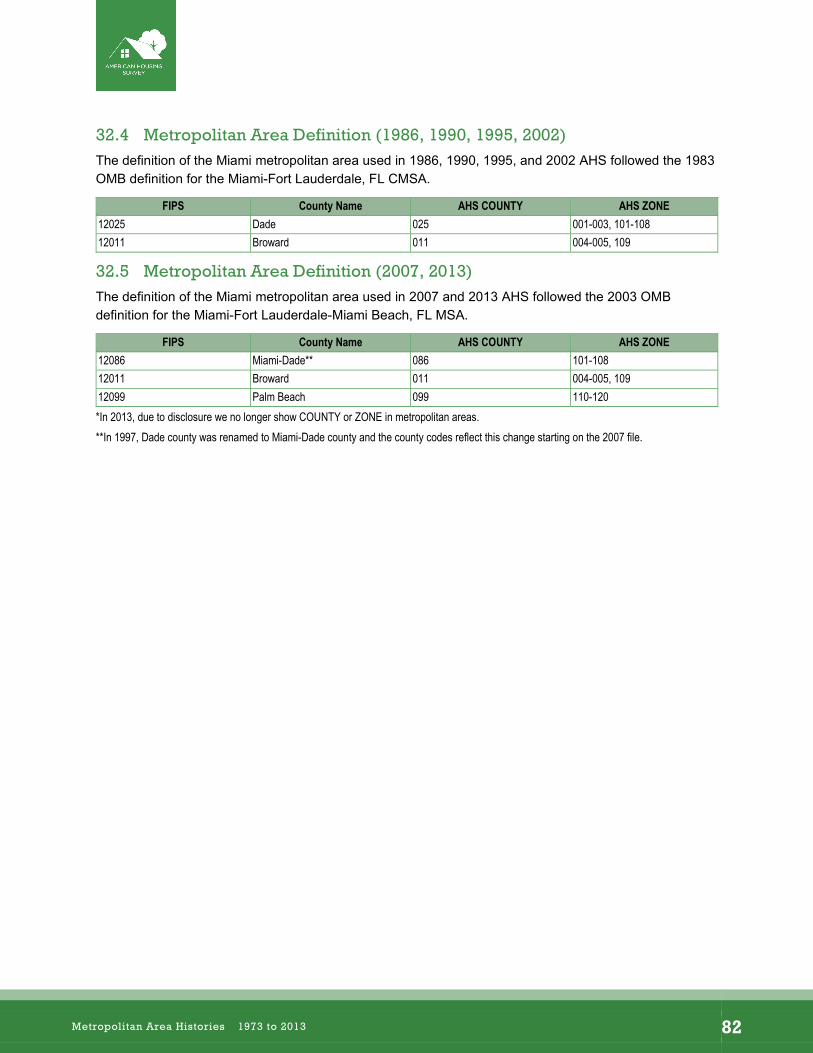
–
32.4 Metropolitan Area Definition (1986, 1990, 1995, 2002) The definition of the Miami metropolitan area used in 1986, 1990, 1995, and 2002 AHS followed the 1983 OMB definition for the Miami-Fort Lauderdale, FL CMSA.
FIPS County Name AHS COUNTY AHS ZONE 12025 Dade 025 001-003, 101-108 12011 Broward 011 004-005, 109
32.5 Metropolitan Area Definition (2007, 2013) The definition of the Miami metropolitan area used in 2007 and 2013 AHS followed the 2003 OMB definition for the Miami-Fort Lauderdale-Miami Beach, FL MSA.
FIPS County Name AHS COUNTY AHS ZONE 12086 Miami-Dade** 086 101-108 12011 Broward 011 004-005, 109 12099 Palm Beach 099 110-120 *In 2013, due to disclosure we no longer show COUNTY or ZONE in metropolitan areas. **In 1997, Dade county was renamed to Miami-Dade county and the county codes reflect this change starting on the 2007 file.
Metropolitan Area Histories 1973 to 2013 82
–
33 Milwaukee
33.1 National Longitudinal Sample (1985 – 2013) There are records in the national longitudinal sample from 1985 through 2013 that are identified as belonging to the Milwaukee metropolitan area (SMSA = 5080). The Milwaukee metropolitan area definition used in the national longitudinal sample is the same as the 1983 OMB definition for the Milwaukee, WI PMSA.
33.2 Independent Metropolitan Area Oversample Longitudinal History (1975 – 2011)
The first and only independent metropolitan area longitudinal oversample for the Milwaukee metropolitan area was drawn in 1975 and was in place for the 1975, 1979, 1984, 1988, 1994, 2002, and 2011 surveys. The following table shows the sample sizes and percent of sample in common.
Year Sample Size Percent of Sample in Common with Prior Year 1975 4,720 (X) 1979 5,541 85.13 1984 4,222 96.54 1988 3,839 95.99 1994 4,419 76.08 2002 4,823 91.62 2011 4,202 54.19
33.3 Metropolitan Area Definition (1975, 1979) The definition of the Milwaukee metropolitan area used in the 1975 and 1979 AHS followed the 1971 OMB definition for the Milwaukee, WI SMSA.
FIPS County Name AHS COUNTY 55079 Milwaukee 079 55089 Ozaukee
99955131 Washington 55133 Waukesha
33.4 Metropolitan Area Definition (1984, 1988, 1994, 2002, 2011) The definition of the Milwaukee metropolitan area used in the 1984, 1988, 1994, 2002, and 2011 AHS followed the 1983 OMB definition for the Milwaukee, WI PMSA.
FIPS County Name AHS COUNTY AHS ZONE 55079 Milwaukee 079 001-006, 101-102 55133 Waukesha 133 104 55131 Washington 991
10355089 Ozaukee 991
Metropolitan Area Histories 1973 to 2013 83
–
34 Minneapolis-St. Paul
34.1 National Longitudinal Sample (1985 – 2013) There are records in the national longitudinal sample from 1985 through 2013 that are identified as belonging to the Minneapolis-St. Paul metropolitan area (SMSA = 5120). The Minneapolis-St. Paul metropolitan area definition used in the national longitudinal sample is the same as the 1983 OMB Minneapolis-St. Paul, MN-WI MSA.
34.2 Independent Metropolitan Area Oversample Longitudinal History (1974 – 2013)
The first independent metropolitan area longitudinal oversample for the Minneapolis-St. Paul metropolitan area was drawn in 1974 and was in place for the 1974, 1977, 1981, 1985, 1989, and 1993 surveys. The following table shows the sample sizes and percent of sample in common.
Year Sample Size Percent of Sample in Common with Prior Year 1974 4,594 (X) 1977 4,827 87.01 1981 4,330 89.65 1985 3,762 75.54 1989 3,892 84.22 1993 5,308 73.31
The second independent metropolitan area longitudinal oversample for the Minneapolis-St. Paul metropolitan area was drawn in 1998 and was in place for the 2007 and 2013 surveys. The following table shows the sample sizes and percent of sample in common.
Year Sample Size Percent of Sample in Common with Prior Year 1998 4,796 (X) 2007 2,847 83.14 2013 3,990 65.74
34.3 Metropolitan Area Definition (1974, 1977, 1981) The definition of the Minneapolis-St. Paul metropolitan area used in the 1974, 1977, and 1981 AHS followed the 1971 OMB definition for the Minneapolis-St. Paul, MN SMSA.
FIPS County Name AHS COUNTY 27053 Hennepin, MN 053 27123 Ramsey, MN
99927003 Anoka, MN 27037 Dakota, MN 27163 Washington, MN
Metropolitan Area Histories 1973 to 2013 84
–
34.4 Metropolitan Area Definition (1985, 1989, 1993) The definition of the Minneapolis-St. Paul metropolitan area used in the 1985, 1989, and 1993 AHS followed the 1983 OMB definition for the Minneapolis-St. Paul, MN-WI MSA.
FIPS County Name AHS COUNTY AHS ZONE 27053 Hennepin, MN 053 001-003, 101-104 27123 Ramsey, MN 123 004-005, 105 27003 Anoka, MN* 003 106 27037 Dakota, MN 037 107 27163 Washington, MN 163 108 27019 Carver, MN
984 109
27025 Chisago, MN 27059 Isanti, MN 27139 Scott, MN 27171 Wright, MN 55109 St. Croix, WI *Note: One record in Anoka county was assigned ZONE 001 in 1993.
34.5 Metropolitan Area Definition (1998, 2007, 2013) The definition of the Minneapolis-St. Paul metropolitan area used in the 1998, 2007, and 2013 AHS followed the 1993 OMB definition for the Minneapolis-St. Paul, MN-WI MSA.
FIPS County Name AHS COUNTY AHS ZONE 27053 Hennepin, MN 053 001-003, 101-104 27123 Ramsey, MN 123 004-005, 105 27003 Anoka, MN 003 106 27037 Dakota, MN 037 107 27163 Washington, MN 163 108 27019 Carver, MN
984 109
27025 Chisago, MN 27059 Isanti, MN 27139 Scott, MN 27141 Sherburne, MN 27171 Wright, MN 55093 Pierce, WI 55109 St. Croix, WI *In 2013, due to disclosure we no longer show COUNTY or ZONE in metropolitan areas.
Metropolitan Area Histories 1973 to 2013 85
–
35 Nashville
35.1 National Longitudinal Sample (1985 – 2013) There are records in the national longitudinal sample from 1985 through 2013 that are identified as belonging to the Nashville metropolitan area (SMSA = 5360). The Nashville metropolitan area definition used in the national longitudinal sample is the same as the 1983 OMB definition for the Nashville, TN MSA.
35.2 Independent Metropolitan Area Oversample Longitudinal History (2013)
The first and only independent metropolitan area longitudinal oversample for the Nashville metropolitan area was drawn in 2013. The following table shows the sample size.
Year Sample Size Percent of Sample in Common with Prior Year 2013 4,166 (X)
35.3 Metropolitan Area Definition (2013) The definition of the Nashville metropolitan area used in the 2013 AHS followed the 2003 OMB definition for the Nashville-Davidson--Murfreesboro, TN Metropolitan Statistical Area.
FIPS County Name 47015 Cannon 47021 Cheatham 47037 Davidson 47043 Dickson 47081 Hickman 47111 Macon 47147 Robertson 47149 Rutherford 47159 Smith 47165 Sumner 47169 Trousdale 47187 Williamson 47189 Wilson *In 2013, due to disclosure we no longer show COUNTY or ZONE in metropolitan areas.
Metropolitan Area Histories 1973 to 2013 86
–
36 New Orleans
36.1 National Longitudinal Sample (1985 – 2013) There are records in the national longitudinal sample from 1985 through 2013 that are identified as belonging to the New Orleans metropolitan area (SMSA = 5560). The New Orleans metropolitan area definition used in the national longitudinal sample is the same as the 1983 OMB definition for the New Orleans, LA MSA.
36.2 Independent Metropolitan Area Oversample Longitudinal History (1975 – 2011)
The first independent metropolitan area longitudinal oversample for the New Orleans metropolitan area was drawn in 1975 and was in place for the 1975, 1978, 1982, 1986, and 1990 surveys. The following table shows the sample sizes and percent of sample in common.
Year Sample Size Percent of Sample in Common with Prior Year 1975 4,508 (X) 1978 5,550 81.12 1982 4,281 93.13 1986 3,319 88.04 1990 4,831 68.70
The second independent metropolitan area longitudinal oversample for the New Orleans metropolitan area was drawn in 1995 and was in place for the 1995, 2004, 2009, and 2011 surveys. The following table shows the sample sizes and percent of sample in common.
Year Sample Size Percent of Sample in Common with Prior Year 1995 4,246 (X) 2004 4,516 94.02 2009 4,888 55.34 2011 4,545 97.40
36.3 Metropolitan Area Definition (1975, 1978, 1982) The definition of the New Orleans metropolitan area used in the 1975, 1978, and 1982 AHS followed the 1973 OMB definition for the New Orleans, LA SMSA.
FIPS Parish Name AHS COUNTY 22051 Jefferson 999 22071 Orleans 071 22087 St. Bernard 999 22103 St. Tammany 999
Metropolitan Area Histories 1973 to 2013 87
–
36.4 Metropolitan Area Definition (1986, 1990) The definition of the New Orleans metropolitan area used in the 1986 and 1990 AHS followed the 1983 OMB definition for the New Orleans, LA MSA.
FIPS Parish Name AHS COUNTY AHS ZONE 22071 Orleans 071 001-005 22051 Jefferson
974 102-104 22087 St. Bernard 22089 St. Charles 22095 St. John the Baptist 22103 St. Tammany 103 101
36.5 Metropolitan Area Definition (1995, 2004) The definition of the New Orleans metropolitan area used in the 1995 and 2004 AHS followed the 1993 OMB definition for the New Orleans-Metairie-Kenner, LA MSA.
FIPS Parish Name AHS COUNTY AHS ZONE 22071 Orleans 071 001- 005 22051 Jefferson
974 102- 104
22087 St. Bernard 22089 St. Charles 22095 St. John the Baptist 22075 Plaquemines 22093 St. James 22103 St. Tammany 103 101
36.6 Metropolitan Area Definition (2009, 2011) The definition of the New Orleans metropolitan area used in 2009 and 2011 AHS followed the 2003 OMB definition for the New Orleans-Metairie-Kenner, LA MSA. Zones 001, 002, and 003 were masked as zone 006 and zones 004 and 005 were masked into zone 007 in order to protect disclosure due to the decreased population in the New Orleans metropolitan area after Hurricane Katrina.
FIPS Parish Name AHS COUNTY AHS ZONE 22071 Orleans 071 006, 007 22051 Jefferson
974 102-104 22087 St. Bernard 22089 St. Charles 22095 St. John the Baptist 22075 Plaquemines 22103 St. Tammany 103 101
Metropolitan Area Histories 1973 to 2013 88
–
37 New York
37.1 National Longitudinal Sample (1985 – 2013) There are records in the national longitudinal sample from 1985 through 2013 that are identified as belonging to the New York metropolitan area (SMSA =5380, 5600, or 9992). The New York metropolitan area definition used in the national longitudinal sample is the same as the New York portion of the 1983 OMB New York- Northern New Jersey-Long Island, NY-NJ-CT CMSA. This includes the following three PMSAs: the Nassau- Suffolk, NY PMSA; the New York, NY PMSA; and the Orange county, NY PMSA.
37.2 Metropolitan/National Longitudinal Sample Longitudinal History (1976 – 2013)
The first independent metropolitan area longitudinal oversample for the New York metropolitan area was drawn in 1976 and was in place for the 1976, 1980, 1983, 1987, and 1991 surveys. The following table shows the sample sizes and percent of sample in common.
Year Sample Size Percent of Sample in Common with Prior Year 1976 16,121 (X) 1980 14,823 96.50 1983 8,573 98.25 1987 3,380 92.01 1991 4,698 70.73
The second independent metropolitan area longitudinal oversample for the New York metropolitan area was drawn in 1995 and was in place for the 1995, 1999, and 2003 surveys. However, New York is one of the Big 6 metropolitan areas. As a result, for 1995, 1999, and 2003, the independent metropolitan area longitudinal oversample records were integrated into the national longitudinal sample PUFs. The following table shows the sample sizes and percent of sample in common. These numbers include both the national longitudinal sample in New York and the longitudinal oversample that are used to make estimates.
Year Sample Size Percent of Sample in Common with Prior Year 1995 2,602 (X) 1999 2,744 94.83 2003 2,801 97.97
The third independent metropolitan area longitudinal oversample for the New York metropolitan area was drawn in 2009 and was in place for the 2009 and 2013 surveys. Like the 1995-2003 New York oversample, the 2009-2013 oversample for Chicago records were integrated into the national longitudinal sample PUFs. However, the 2013 oversample includes additional housing units. As such, the amount of 2013 sample that is longitudinal with 2009 is limited (51 percent). The following table shows the sample sizes and percent of sample in common. These numbers include both the national longitudinal sample in New York and the longitudinal oversample that are used to make estimates.
Year Sample Size Percent of Sample in Common with Prior Year 2009 2,969 (X) 2013 4,814 50.81
Metropolitan Area Histories 1973 to 2013 89
–
37.3 Metropolitan Area Definition (1976, 1980, 1983) The definition of the New York metropolitan area used in the 1976, 1980, and 1983 AHS followed the 1971 OMB definition for the New York, NY SMSA.
FIPS County Name AHS COUNTY 36005 Bronx 005 36047 Kings 047 36059 Nassau 059 36061 New York 061 36081 Queens 081 36085 Richmond 085 36087 Rockland 999 36103 Suffolk 103 36119 Westchester 999
37.4 Metropolitan Area Definition (1987, 1991) The definition used in the AHS for New York in 1987 and 1991 matches the New York portion of the 1983 OMB New York-Northern New Jersey-Long Island, NY-NJ-CT CMSA. This includes the following three PMSAs: the Nassau-Suffolk, NY PMSA; the New York, NY PMSA; and the Orange county, NY PMSA.
Beginning in 1987, the AHS definition for the New York metropolitan area used in the metro sample matches the definition used on the national file. This definition will remain the same through the remaining sample years (1987 to 2013).
FIPS County Name AHS COUNTY AHS ZONE 36005 Bronx (X) (X) 36047 Kings (X) (X) 36059 Nassau (X) (X) 36061 New York (X) (X) 36071 Orange (X) (X) 36079 Putnam (X) (X) 36081 Queens (X) (X) 36085 Richmond (X) (X) 36087 Rockland (X) (X) 36103 Suffolk (X) (X) 36119 Westchester (X) (X)
37.5 Metropolitan Area Definition (1995, 1999, 2003) In 1995, 1999, and 2003 the national AHS included oversample in the New York metropolitan area that allowed the AHS to provide metro level statistics from the national level dataset. AHS County and ZONE variables are excluded from the files with the New York oversample because they would have violated Census disclosure rules when combined with other national only geography variables such as urban/rural status. The 1995, 1999, and 2003 New York area definition is listed in the table below, and matches the New York portion of the 1983 OMB New York- Northern New Jersey-Long Island, NY-NJ-CT CMSA. This includes the following three PMSAs: the Nassau- Suffolk, NY PMSA (5380); the New York, NY PMSA (5600); and the Orange county, NY PMSA (5950).
Metropolitan Area Histories 1973 to 2013 90
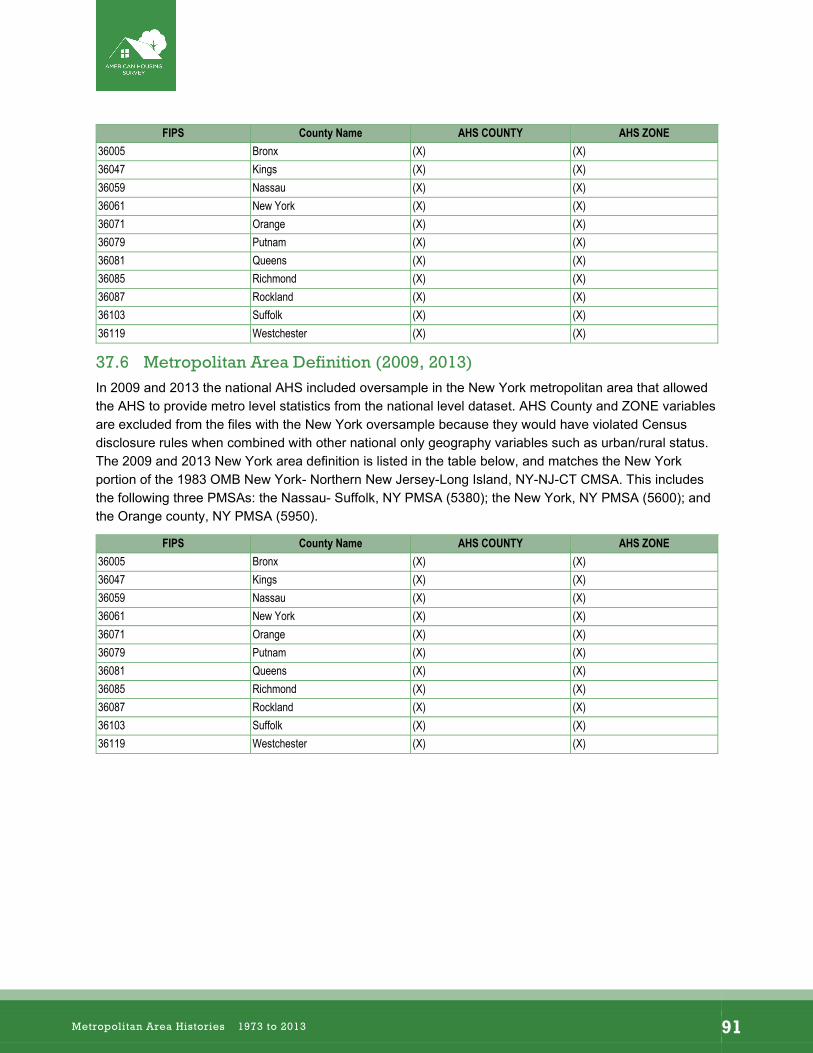
–
FIPS County Name AHS COUNTY AHS ZONE 36005 Bronx (X) (X) 36047 Kings (X) (X) 36059 Nassau (X) (X) 36061 New York (X) (X) 36071 Orange (X) (X) 36079 Putnam (X) (X) 36081 Queens (X) (X) 36085 Richmond (X) (X) 36087 Rockland (X) (X) 36103 Suffolk (X) (X) 36119 Westchester (X) (X)
37.6 Metropolitan Area Definition (2009, 2013) In 2009 and 2013 the national AHS included oversample in the New York metropolitan area that allowed the AHS to provide metro level statistics from the national level dataset. AHS County and ZONE variables are excluded from the files with the New York oversample because they would have violated Census disclosure rules when combined with other national only geography variables such as urban/rural status. The 2009 and 2013 New York area definition is listed in the table below, and matches the New York portion of the 1983 OMB New York- Northern New Jersey-Long Island, NY-NJ-CT CMSA. This includes the following three PMSAs: the Nassau- Suffolk, NY PMSA (5380); the New York, NY PMSA (5600); and the Orange county, NY PMSA (5950).
FIPS County Name AHS COUNTY AHS ZONE 36005 Bronx (X) (X) 36047 Kings (X) (X) 36059 Nassau (X) (X) 36061 New York (X) (X) 36071 Orange (X) (X) 36079 Putnam (X) (X) 36081 Queens (X) (X) 36085 Richmond (X) (X) 36087 Rockland (X) (X) 36103 Suffolk (X) (X) 36119 Westchester (X) (X)
Metropolitan Area Histories 1973 to 2013 91
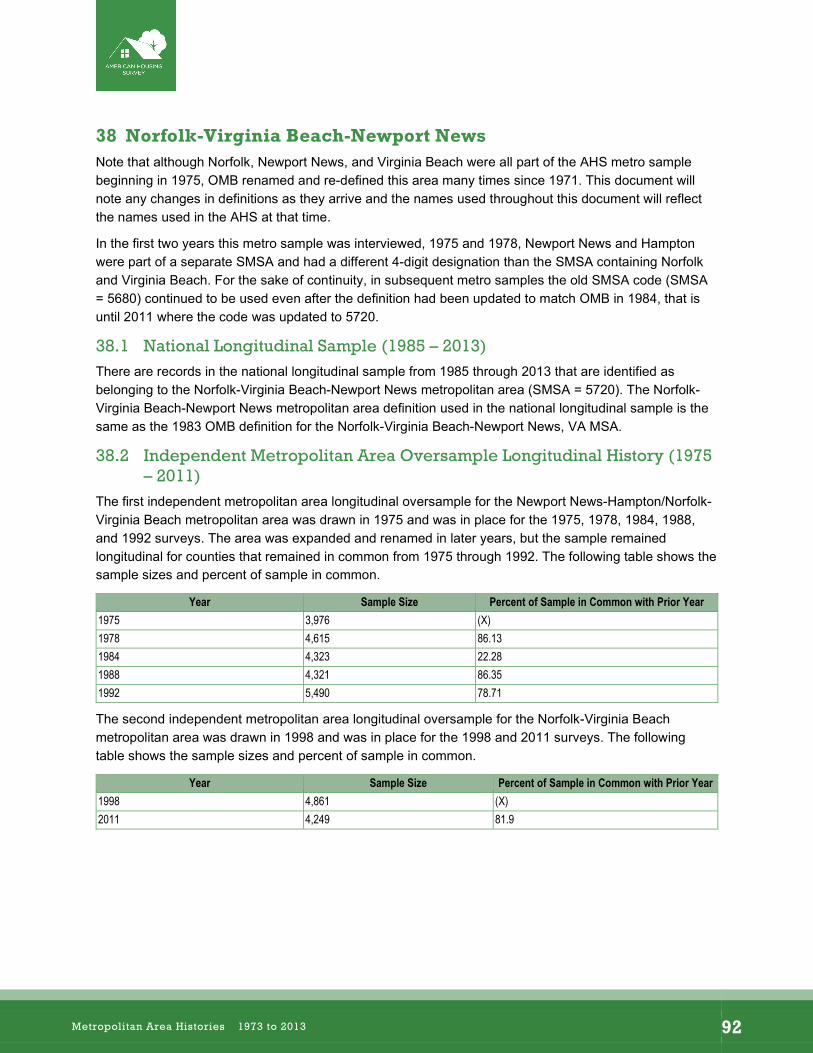
–
38 Norfolk-Virginia Beach-Newport News Note that although Norfolk, Newport News, and Virginia Beach were all part of the AHS metro sample beginning in 1975, OMB renamed and re-defined this area many times since 1971. This document will note any changes in definitions as they arrive and the names used throughout this document will reflect the names used in the AHS at that time.
In the first two years this metro sample was interviewed, 1975 and 1978, Newport News and Hampton were part of a separate SMSA and had a different 4-digit designation than the SMSA containing Norfolk and Virginia Beach. For the sake of continuity, in subsequent metro samples the old SMSA code (SMSA = 5680) continued to be used even after the definition had been updated to match OMB in 1984, that is until 2011 where the code was updated to 5720.
38.1 National Longitudinal Sample (1985 – 2013) There are records in the national longitudinal sample from 1985 through 2013 that are identified as belonging to the Norfolk-Virginia Beach-Newport News metropolitan area (SMSA = 5720). The Norfolk-Virginia Beach-Newport News metropolitan area definition used in the national longitudinal sample is the same as the 1983 OMB definition for the Norfolk-Virginia Beach-Newport News, VA MSA.
38.2 Independent Metropolitan Area Oversample Longitudinal History (1975 – 2011)
The first independent metropolitan area longitudinal oversample for the Newport News-Hampton/Norfolk-Virginia Beach metropolitan area was drawn in 1975 and was in place for the 1975, 1978, 1984, 1988, and 1992 surveys. The area was expanded and renamed in later years, but the sample remained longitudinal for counties that remained in common from 1975 through 1992. The following table shows the sample sizes and percent of sample in common.
Year Sample Size Percent of Sample in Common with Prior Year 1975 3,976 (X) 1978 4,615 86.13 1984 4,323 22.28 1988 4,321 86.35 1992 5,490 78.71
The second independent metropolitan area longitudinal oversample for the Norfolk-Virginia Beach metropolitan area was drawn in 1998 and was in place for the 1998 and 2011 surveys. The following table shows the sample sizes and percent of sample in common.
Year Sample Size Percent of Sample in Common with Prior Year 1998 4,861 (X) 2011 4,249 81.9
Metropolitan Area Histories 1973 to 2013 92
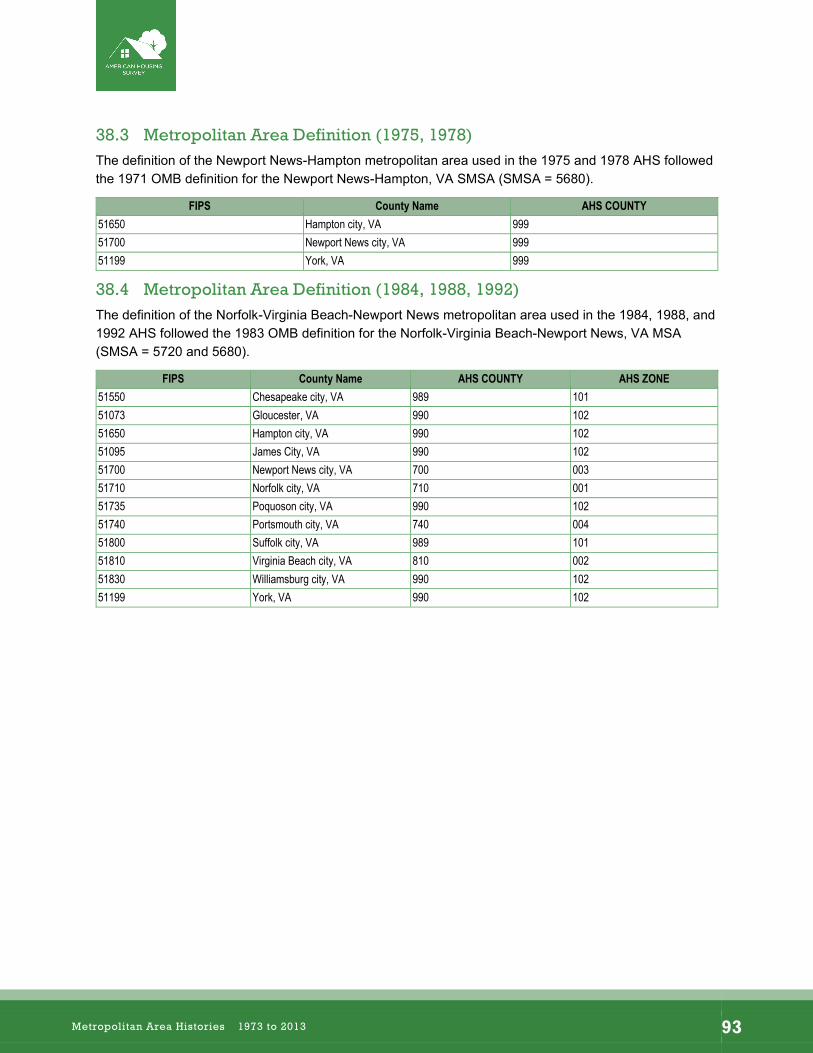
–
38.3 Metropolitan Area Definition (1975, 1978) The definition of the Newport News-Hampton metropolitan area used in the 1975 and 1978 AHS followed the 1971 OMB definition for the Newport News-Hampton, VA SMSA (SMSA = 5680).
FIPS County Name AHS COUNTY 51650 Hampton city, VA 999 51700 Newport News city, VA 999 51199 York, VA 999
38.4 Metropolitan Area Definition (1984, 1988, 1992) The definition of the Norfolk-Virginia Beach-Newport News metropolitan area used in the 1984, 1988, and 1992 AHS followed the 1983 OMB definition for the Norfolk-Virginia Beach-Newport News, VA MSA (SMSA = 5720 and 5680).
FIPS County Name AHS COUNTY AHS ZONE 51550 Chesapeake city, VA 989 101 51073 Gloucester, VA 990 102 51650 Hampton city, VA 990 102 51095 James City, VA 990 102 51700 Newport News city, VA 700 003 51710 Norfolk city, VA 710 001 51735 Poquoson city, VA 990 102 51740 Portsmouth city, VA 740 004 51800 Suffolk city, VA 989 101 51810 Virginia Beach city, VA 810 002 51830 Williamsburg city, VA 990 102 51199 York, VA 990 102
Metropolitan Area Histories 1973 to 2013 93
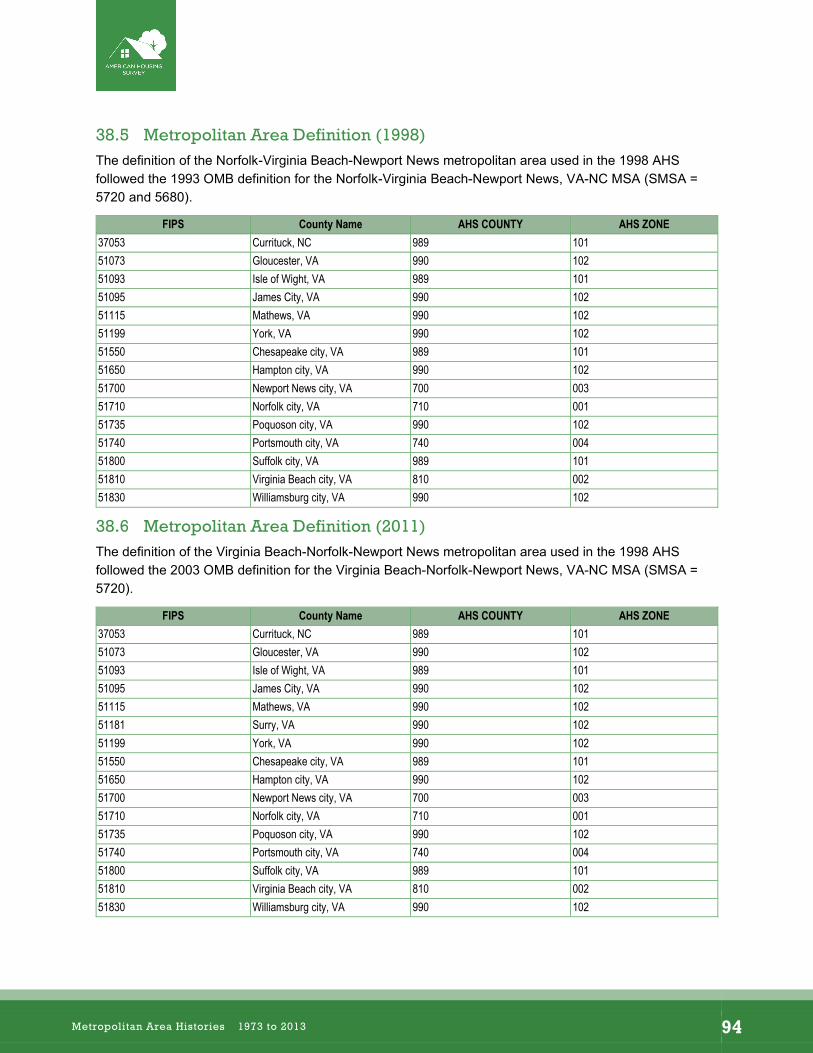
–
38.5 Metropolitan Area Definition (1998) The definition of the Norfolk-Virginia Beach-Newport News metropolitan area used in the 1998 AHS followed the 1993 OMB definition for the Norfolk-Virginia Beach-Newport News, VA-NC MSA (SMSA = 5720 and 5680).
FIPS County Name AHS COUNTY AHS ZONE 37053 Currituck, NC 989 101 51073 Gloucester, VA 990 102 51093 Isle of Wight, VA 989 101 51095 James City, VA 990 102 51115 Mathews, VA 990 102 51199 York, VA 990 102 51550 Chesapeake city, VA 989 101 51650 Hampton city, VA 990 102 51700 Newport News city, VA 700 003 51710 Norfolk city, VA 710 001 51735 Poquoson city, VA 990 102 51740 Portsmouth city, VA 740 004 51800 Suffolk city, VA 989 101 51810 Virginia Beach city, VA 810 002 51830 Williamsburg city, VA 990 102
38.6 Metropolitan Area Definition (2011) The definition of the Virginia Beach-Norfolk-Newport News metropolitan area used in the 1998 AHS followed the 2003 OMB definition for the Virginia Beach-Norfolk-Newport News, VA-NC MSA (SMSA = 5720).
FIPS County Name AHS COUNTY AHS ZONE 37053 Currituck, NC 989 101 51073 Gloucester, VA 990 102 51093 Isle of Wight, VA 989 101 51095 James City, VA 990 102 51115 Mathews, VA 990 102 51181 Surry, VA 990 102 51199 York, VA 990 102 51550 Chesapeake city, VA 989 101 51650 Hampton city, VA 990 102 51700 Newport News city, VA 700 003 51710 Norfolk city, VA 710 001 51735 Poquoson city, VA 990 102 51740 Portsmouth city, VA 740 004 51800 Suffolk city, VA 989 101 51810 Virginia Beach city, VA 810 002 51830 Williamsburg city, VA 990 102
Metropolitan Area Histories 1973 to 2013 94
–
39 Northern New Jersey
39.1 National Longitudinal Sample (1985 – 2013) There are records in the national longitudinal sample from 1985 through 2013 that are identified as belonging to the Northern New Jersey metropolitan area (SMSA =5640, 0875, 5015, 3640, 5190, or 9993). The Northern New Jersey metropolitan area definition used in the national longitudinal sample is the same as the New Jersey portion of the 1983 OMB New York-Northern New Jersey-Long Island, NY-NJ-CT CMSA. This includes the following PMSAs: the Newark, NJ PMSA; the Bergen-Passaic, NJ PMSA; the Middlesex- Somerset-Hunterdon, NJ PMSA; the Jersey City, NJ PMSA; and the Monmouth-Ocean, NJ PMSA.
39.2 Metropolitan/National Longitudinal Sample Longitudinal History (1974 – 2013)
Two metropolitan areas, Newark, NJ and Paterson-Clifton-Passaic, NJ, which eventually the Northern New Jersey metropolitan area, had their own samples drawn before becoming part of the “Big 6.”
The longitudinal oversample for the Newark, NJ metropolitan area was drawn in 1974 and was in place for the 1974, 1977, and 1981 surveys. The following table shows the sample sizes and percent of sample in common.
Year Sample Size Percent of Sample in Common with Prior Year 1974 4,598 (X) 1977 4,819 87.20 1981 3,946 97.29
The longitudinal oversample for the Paterson-Clifton-Passaic, NJ metropolitan area was drawn in 1975 and was in place for the 1975, 1978, and 1982 surveys. The following table shows the sample sizes and percent of sample in common.
Year Sample Size Percent of Sample in Common with Prior Year 1975 4,728 (X) 1978 5,280 89.45 1982 4,265 98.43
The first independent metropolitan area longitudinal oversample for the Northern New Jersey metropolitan area was drawn in 1987 and was in place for the 1987 and 1991 surveys. The following table shows the sample sizes and percent of sample in common.
Year Sample Size Percent of Sample in Common with Prior Year 1987 3,368 (X) 1991 4,658 72.31
Metropolitan Area Histories 1973 to 2013 95
–
The second independent metropolitan area longitudinal oversample for the Northern New Jersey metropolitan area was drawn in 1995 and was in place for the 1995, 1999, and 2003 surveys. However, Northern New Jersey is one of the Big 6 metropolitan areas. As a result, for 1995, 1999, and 2003, the independent metropolitan area longitudinal oversample records were integrated into the national longitudinal sample PUFs. The following table shows the sample sizes and percent of sample in common. These numbers include both the national longitudinal sample in Northern New Jersey and the longitudinal oversample that are used to make estimates.
Year Sample Size Percent of Sample in Common with Prior Year 1995 1,336 (X) 1999 1,453 91.95 2003 1,496 97.13
The third independent metropolitan area longitudinal oversample for the Northern New Jersey metropolitan area was drawn in 2009 and was in place for the 2009 and 2013 surveys. Like the 1995-2003 Northern New Jersey oversample, the 2009-2013 oversample for Northern New Jersey records were integrated into the national longitudinal sample PUFs. However, the 2013 oversample includes additional housing units. As such, the amount of 2013 sample that is longitudinal with 2009 is limited (51 percent). The following table shows the sample sizes and percent of sample in common. These numbers include both the national longitudinal sample in Chicago and the longitudinal oversample that are used to make estimates.
Year Sample Size Percent of Sample in Common with Prior Year 2009 2,680 (X) 2013 4,741 50.71
39.3 Metropolitan Area Definition (1983) The Northern New Jersey metropolitan area is made up of several SMSAs. Because Northern New Jersey is part of the “Big 6,” and as such is only made up of national records, COUNTY and ZONE information is not available for this area. The SMSAs of Northern New Jersey are made up of the following PMSAs: Newark, NJ PMSA (5640), Bergen-Passaic, NJ PMSA 0875), Middlesex-Somerset-Hunterdon, NJ PMSA (5015), Jersey City, NJ PMSA (3640), and Monmouth-Ocean, NJ PMSA (5190).
FIPS County Name AHS COUNTY AHS ZONE 34003 Bergen, NJ (X) (X) 34013 Essex, NJ (X) (X) 34017 Hudson, NJ (X) (X) 34019 Hunterdon, NJ (X) (X) 34023 Middlesex, NJ (X) (X) 34025 Monmouth, NJ (X) (X) 34027 Morris, NJ (X) (X) 34029 Ocean, NJ (X) (X) 34031 Passaic, NJ (X) (X) 34035 Somerset, NJ (X) (X) 34037 Sussex, NJ (X) (X) 34039 Union, NJ (X) (X)
Metropolitan Area Histories 1973 to 2013 96
–
39.4 Metropolitan Area Definition (1995, 1999, 2003) In 1995, 1999, and 2003 the national AHS included oversample in the Northern New Jersey metropolitan area that allowed the AHS to provide metro level statistics from the national level dataset. AHS County and ZONE variables are excluded from the files with the Northern New Jersey oversample because they would have violated Census disclosure rules when combined with other national only geography variables such as urban/rural status. The 1995, 1999, and 2003 Northern New Jersey area definition is listed in the table below, and matches the New Jersey portion of the 1983 OMB New York-Northern New Jersey-Long Island, NY-NJ-CT CMSA (as defined above), with the exception that the AHS definition excludes Warren county, NJ. This includes the following PMSAs: Newark, NJ PMSA (5640), Bergen-Passaic, NJ PMSA (0875), Middlesex-Somerset-Hunterdon, NY PMSA (5015), Jersey City, NJ PMSA (3640), Monmouth-Ocean, NJ PMSA (5190), and Trenton, NJ PMSA (8480).
FIPS County Name AHS COUNTY AHS ZONE 34003 Bergen, NJ (X) (X) 34013 Essex, NJ (X) (X) 34017 Hudson, NJ (X) (X) 34019 Hunterdon, NJ (X) (X) 34021 Mercer, NJ (X) (X) 34023 Middlesex, NJ (X) (X) 34025 Monmouth, NJ (X) (X) 34027 Morris, NJ (X) (X) 34029 Ocean, NJ (X) (X) 34031 Passaic, NJ (X) (X) 34035 Somerset, NJ (X) (X) 34037 Sussex, NJ (X) (X) 34039 Union, NJ (X) (X)
Metropolitan Area Histories 1973 to 2013 97
–
39.5 Metropolitan Area Definition (2009, 2013) In 2009 and 2013 the national AHS included oversample in the Northern New Jersey metropolitan area that allowed the AHS to provide metro level statistics from the national level dataset. AHS County and ZONE variables are excluded from the files with the Northern New Jersey oversample because they would have violated Census disclosure rules when combined with other national only geography variables such as urban/rural status. The 2009 and 2013 Northern New Jersey area definition is listed in the table below, and matches the New Jersey portion of the 1983 OMB New York-Northern New Jersey-Long Island, NY-NJ-CT CMSA (as defined above), with the exception that the AHS definition excludes Warren county, NJ. This includes the following PMSAs: Newark, NJ PMSA (5640), Bergen-Passaic, NJ PMSA (0875), Middlesex-Somerset-Hunterdon, NY PMSA (5015), Jersey City, NJ PMSA (3640), Monmouth-Ocean, NJ PMSA (5190), and Trenton, NJ PMSA (8480).
FIPS County Name AHS COUNTY AHS ZONE 34003 Bergen, NJ (X) (X) 34013 Essex, NJ (X) (X) 34017 Hudson, NJ (X) (X) 34019 Hunterdon, NJ (X) (X) 34021 Mercer, NJ (X) (X) 34023 Middlesex, NJ (X) (X) 34025 Monmouth, NJ (X) (X) 34027 Morris, NJ (X) (X) 34029 Ocean, NJ (X) (X) 34031 Passaic, NJ (X) (X) 34035 Somerset, NJ (X) (X) 34037 Sussex, NJ (X) (X) 34039 Union, NJ (X) (X)
Metropolitan Area Histories 1973 to 2013 98
–
40 Oakland
40.1 National Longitudinal Sample (1985 – 2013) There are records in the national longitudinal sample from 1985 through 2013 that are identified as belonging to the Oakland metropolitan area (SMSA = 5775). The Oakland metropolitan area definition used in the national longitudinal sample is based on the 1983 OMB definition for the Oakland, CA PMSA.
40.2 Independent Metropolitan Area Oversample Longitudinal History (1998 – 2011)
Between 1974 and 1993, the Oakland metropolitan area was included in the AHS definition of San Francisco. More information regarding those years can be found in the San Francisco section of this document.
Beginning in 1998, a new sample of the Oakland metropolitan area was drawn that was separate from the San Francisco sample. This sample was part of a panel that was interviewed in 1998 and 2011. The following table shows the sample sizes and percent of sample in common.
Year Sample Size Percent of Sample in Common with Prior Year 1998 4,753 (X) 2011* 3,994 88.18 *Does not include the records in the National sample that were part of the Oakland metropolitan area.
40.3 Metropolitan Area Definition (1998, 2011) Beginning in 1998, the San Francisco and Oakland metropolitan areas were split into two separate surveys. These correspond to the 1983, 1993, and 2003 OMB definitions for the Oakland and San Francisco areas. The San Francisco section of this document has more information about the area in particular beginning with 1998. The AHS definition matches the 2003 OMB definition for the Oakland-Fremont-Hayward, CA Metropolitan Division.
FIPS County Name AHS COUNTY AHS ZONE 06001 Alameda 001 007, 108-111 06013 Contra Costa 013 103-107
The 2011 AHS PUF included both national and metropolitan records for Oakland area. The definitions for each included the same counties because OMB did not change the MSA defined counties between 1983 and 2003.
Metropolitan Area Histories 1973 to 2013 99

–
41 Oklahoma City
41.1 National Longitudinal Sample (1985 – 2013) There are records in the national longitudinal sample from 1985 through 2013 that are identified as belonging to the Oklahoma City metropolitan area (SMSA = 5880). The Oklahoma metropolitan area definition used in the national longitudinal sample is the same as the 1983 OMB definition for the Oklahoma City, OK MSA
41.2 Independent Metropolitan Area Oversample Longitudinal History (1976 – 2013)
The first independent metropolitan area longitudinal oversample for the Oklahoma metropolitan area was drawn in 1976 and was in place for the 1976, 1980, 1984, 1988, and 1992 surveys. The following table shows the sample sizes and percent of sample in common.
Year Sample Size Percent of Sample in Common with Prior Year 1976 5,328 (X) 1980 5,698 89.14 1984 4,407 76.36 1988 4,011 94.66 1992 5,201 77.08
The second independent metropolitan area longitudinal oversample for the Oklahoma metropolitan area was drawn in 1996 and was in place for the 1996, 2004, and 2013 surveys. The following table shows the sample sizes and percent of sample in common.
Year Sample Size Percent of Sample in Common with Prior Year 1996 4,747 (X) 2004 4,829 87.49 2013 5,061 73.58
41.3 Metropolitan Area Definition (1976, 1980) The definition of the Oklahoma metropolitan area used in the 1976 and 1980 AHS followed the 1971 OMB definition for the Oklahoma City, OK SMSA.
FIPS County Name AHS COUNTY 40109 Oklahoma
99940017 Canadian 40027 Cleveland
Metropolitan Area Histories 1973 to 2013 100
–
41.4 Metropolitan Area Definition (1984, 1988, 1992, 1996, 2004) The definition of the Oklahoma City metropolitan area used in the 1984, 1988, 1992, 1996, and 2004 AHS followed the 1983 OMB definition for the Oklahoma City, OK MSA.
FIPS County Name AHS COUNTY AHS ZONE 40017 Canadian
988 001-003, 101-103
40027 Cleveland 40083 Logan 40087 McClain 40109 Oklahoma 40125 Pottawatomie
41.5 Metropolitan Area Definition (2013) The definition of the Oklahoma metropolitan area used in the 2013 AHS followed the 2003 OMB definition for the Oklahoma City, OK MSA.
FIPS County Name 40017 Canadian 40027 Cleveland 40083 Logan 40087 McClain 40109 Oklahoma 40051 Grady 40081 Lincoln *In 2013, due to disclosure we no longer show COUNTY or ZONE in metropolitan areas.
Metropolitan Area Histories 1973 to 2013 101
–
42 Omaha
42.1 National Longitudinal Sample (1985 – 2013) There are records in the national longitudinal sample from 1985 through 2013 that are identified as belonging to the Omaha metropolitan area (SMSA = 5920). The Omaha metropolitan area definition used in the national longitudinal sample is the same as the 1983 OMB definition for the Omaha, NE-IA MSA.
42.2 Independent Metropolitan Area Oversample Longitudinal History (1976 – 1979)
The first and only independent metropolitan area longitudinal oversample for the Omaha metropolitan area was drawn in 1976 and was in place for the 1976 and 1979 surveys. The following table shows the sample sizes and percent of sample in common.
Year Sample Size Percent of Sample in Common with Prior Year 1976 5,219 (X) 1979 5,323 93.05
42.3 Metropolitan Area Definition (1976, 1979) The definition of the Omaha metropolitan area used in the 1976 and 1979 AHS followed the 1973 OMB definition for the Omaha, NE-IA SMSA.
FIPS County Name AHS COUNTY 19155 Pottawattamie, IA 999 31153 Sarpy, NE 999 31055 Douglas, NE 999
Metropolitan Area Histories 1973 to 2013 102
–
43 Orlando
43.1 National Longitudinal Sample (1985 – 2013) There are records in the national longitudinal sample from 1985 through 2013 that are identified as belonging to the Orlando metropolitan area (SMSA = 5960). The Orlando metropolitan area definition used in the national longitudinal sample is the same as the 1983 OMB definition for the Orlando, FL MSA.
43.2 Independent Metropolitan Area Oversample Longitudinal History (1974 – 2013)
The first independent metropolitan area longitudinal oversample for the Orlando metropolitan area was drawn in 1974 and was in place for the 1974, 1977, and 1981 surveys. The following table shows the sample sizes and percent of sample in common.
Year Sample Size Percent of Sample in Common with Prior Year 1974 5,136 (X) 1977 5,118 80.53% 1981 4,659 86.76%
The second independent metropolitan area longitudinal oversample for the Orlando metropolitan area was drawn in 2013. The following table shows the sample size.
Year Sample Size Percent of Sample in Common with Prior Year 2013 4,129 (X)
43.3 Metropolitan Area Definition (1974, 1977, 1981) The definition of the Orlando metropolitan area used in the 1974, 1977, and 1981 AHS followed the 1971 OMB definition for the Orlando, FL SMSA.
FIPS County Name AHS COUNTY 12095 Orange 999 12117 Seminole 999
43.4 Metropolitan Area Definition (2013) The definition of the Orlando metropolitan area used in the 2013 AHS followed the 2003 OMB definition for the Orlando, FL MSA.
FIPS County Name 12069 Lake 12095 Orange 12097 Osceola 12117 Seminole *In 2013, due to disclosure we no longer show COUNTY or ZONE in metropolitan areas.
Metropolitan Area Histories 1973 to 2013 103
–
44 Philadelphia
44.1 National Longitudinal Sample (1985 – 2013) There are records in the national longitudinal sample from 1985 through 2013 that are identified as belonging to the Philadelphia metropolitan area (SMSA = 6160). The Philadelphia metropolitan area definition used in the national longitudinal sample is the same as the 1983 OMB definition for the Philadelphia, PA-NJ PMSA.
44.2 Metropolitan/National Longitudinal Sample Longitudinal History (1975 – 2013)
The first independent metropolitan area longitudinal oversample for the Philadelphia metropolitan area was drawn in 1975 and was in place for the 1975, 1978, 1982, 1985, and 1989 surveys. The following table shows the sample sizes and percent of sample in common.
Year Sample Size Percent of Sample in Common with Prior Year 1975 13,608 (X) 1978 16,327 83.27 1982 4,246 97.08 1985 6,774 48.44 1989 3,915 87.43
The second independent metropolitan area longitudinal oversample for the Philadelphia metropolitan area was drawn in 1995 and was in place for the 1995, 1999, and 2003 surveys. However, Philadelphia is one of the Big 6 metropolitan areas. As a result, for 1995, 1999, and 2003, the independent metropolitan area longitudinal oversample records were integrated into the national longitudinal sample PUFs. The following table shows the sample sizes and percent of sample in common. These numbers include both the national longitudinal sample in Philadelphia and the longitudinal oversample that are used to make estimates.
Year Sample Size Percent of Sample in Common with Prior Year 1995 2,060 (X) 1999 2,295 89.76 2003 2,353 97.54
The third independent metropolitan area longitudinal oversample for the Philadelphia metropolitan area was drawn in 2009 and was in place for the 2009 and 2013 surveys. Like the 1995-2003 Philadelphia oversample, the 2009-2013 oversample for Philadelphia records were integrated into the national longitudinal sample PUFs. However, the 2013 oversample includes additional housing units. As such, the amount of 2013 sample that is longitudinal with 2009 is limited (50 percent). The following table shows the sample sizes and percent of sample in common. These numbers include both the national longitudinal sample in Philadelphia and the longitudinal oversample that are used to make estimates.
Year Sample Size Percent of Sample in Common with Prior Year 2009 2,353 (X) 2013 4,628 49.85
Metropolitan Area Histories 1973 to 2013 104
–
44.3 Metropolitan Area Definition (1975, 1978, 1982) The definition of the Philadelphia metropolitan area used in the 1975, 1978, and 1982 AHS followed the 1973 OMB SMSA definition for the area. This included the following counties:
FIPS County Name AHS COUNTY 42101 Philadelphia 101 42017 Bucks 017 42029 Chester 029 42045 Delaware 045 42091 Montgomery 091 34007 Camden 007 34015 Gloucester 999 34005 Burlington 999
44.4 Metropolitan Area Definition (1985, 1989) The definition of the Philadelphia metropolitan area used in 1985 and 1989 AHS followed the 1983 OMB definition for the Philadelphia, PA-NJ PMSA.
FIPS County Name AHS COUNTY AHS ZONE 42101 Philadelphia 101 001-013, 099 42017 Bucks 017 105-107 42029 Chester 029 108-110 42045 Delaware 045 111-114 42091 Montgomery 091 101-104 34007 Camden 007 118-121 34015 Gloucester 999 122 34005 Burlington 999 115-117
44.5 Philadelphia Metropolitan Area Definition (1995, 1999, 2003) In 1995, 1999, and 2003 the national AHS included oversample in the Philadelphia metropolitan area that allowed the AHS to provide metro level statistics from the national level dataset. AHS County and ZONE variables are excluded from the files with the Philadelphia oversample because they would have violated Census disclosure rules when combined with other national only geography variables such as urban/rural status. The 1995, 1999, and 2003 Philadelphia area definition is listed in the table below, and matches the 1983 OMB definition for Philadelphia, PA-NJ PMSA (6160).
FIPS County Name AHS COUNTY AHS ZONE 42101 Philadelphia (X) (X) 42017 Bucks (X) (X) 42029 Chester (X) (X) 42045 Delaware (X) (X) 42091 Montgomery (X) (X) 34007 Camden (X) (X) 34015 Gloucester (X) (X) 34005 Burlington (X) (X)
Metropolitan Area Histories 1973 to 2013 105
–
44.6 Metropolitan Area Definition (2009, 2013) In 2009 and 2013 the national AHS included oversample in the Philadelphia metropolitan area that allowed the AHS to provide metro level statistics from the national level dataset. AHS County and ZONE variables are excluded from the files with the Philadelphia oversample because they would have violated Census disclosure rules when combined with other national only geography variables such as urban/rural status. The 2009 and 2013 Philadelphia area definition is listed in the table below, and matches the 1983 OMB definition for Philadelphia, PA-NJ PMSA (6160).
FIPS County Name AHS COUNTY AHS ZONE 42101 Philadelphia (X) (X) 42017 Bucks (X) (X) 42029 Chester (X) (X) 42045 Delaware (X) (X) 42091 Montgomery (X) (X) 34007 Camden (X) (X) 34015 Gloucester (X) (X) 34005 Burlington (X) (X)
Metropolitan Area Histories 1973 to 2013 106
–
45 Phoenix
45.1 National Longitudinal Sample (1985 – 2013) There are records in the national longitudinal sample from 1985 through 2013 that are identified as belonging to the Phoenix metropolitan area (SMSA = 6200). The Phoenix metropolitan area definition used in the national longitudinal sample is the same as the 1983 OMB definition for the Phoenix, AZ MSA.
45.2 Independent Metropolitan Area Oversample Longitudinal History (1974 – 2011)
The first and only independent metropolitan area longitudinal oversample for the Phoenix metropolitan area was drawn in 1974 and was in place for the 1974, 1977, 1981, 1985, 1989, 1994, 2002, and 2011 surveys. The following table shows the sample sizes and percent of sample in common.
Year Sample Size Percent of Sample in Common with Prior Year 1974 4,672 (X) 1977 5,565 76.86 1981 5,612 80.06 1985 3,645 78.77 1989 4,001 80.53 1994 4,977 80.39 2002 5,056 74.51 2011 3,731 74.30
45.3 Metropolitan Area Definition (1974, 1977, 1981) The definition of the Phoenix metropolitan area used in the 1974, 1977, and 1981 AHS followed the 1971 OMB definition for the Phoenix, AZ SMSA.
FIPS County Name AHS COUNTY 04013 Maricopa 999
45.4 Metropolitan Area Definition (1985, 1989, 1994, 2002) The definition of the Phoenix metropolitan area used in the 1985, 1989, 1994, and 2002 AHS followed the 1983 OMB definition for the Phoenix, AZ MSA.
FIPS County Name AHS COUNTY AHS ZONE
04013 Maricopa 013 001-008, 101-103, 99*, 199*
*ZONE codes of 99 and 199 indicate there was insufficient data to assign a ZONE.
45.5 Metropolitan Area Definition (2011) The definition of the Phoenix metropolitan area used in the 2011 AHS followed the 2003 OMB SMSA definition for the Phoenix, AZ MSA.
FIPS County Name AHS COUNTY AHS ZONE 04013 Maricopa 013 001-008, 101-103 04021 Pinal 021 104
Metropolitan Area Histories 1973 to 2013 107
–
46 Pittsburgh
46.1 National Longitudinal Sample (1985 – 2013) There are records in the national longitudinal sample from 1985 through 2013 that are identified as belonging to the Pittsburgh metropolitan area (SMSA = 6280 or SMSA = 0845). The Pittsburgh metropolitan area definition used in the national longitudinal sample is the same as the 1983 OMB definition for both the Beaver County, PA PMSA and the Pittsburgh, PA PMSA.
46.2 Independent Metropolitan Area Oversample Longitudinal History (1974 – 2011)
The first independent metropolitan area longitudinal oversample for the Pittsburgh metropolitan area was drawn in 1974 and was in place for the 1974, 1977, 1981, 1986, and 1990 surveys. The following table shows the sample sizes and percent of sample in common.
Year Sample Size Percent of Sample in Common with Prior Year 1974 4,762 (X) 1977 4,902 89.07 1981 4,150 94.41 1986 3,185 80.75 1990 4,688 67.94
The second independent metropolitan area longitudinal oversample for the Pittsburgh metropolitan area was drawn in 1995 and was in place for the 1995, 2004, and 2011 surveys. The following table shows the sample sizes and percent of sample in common.
Year Sample Size Percent of Sample in Common with Prior Year 1995 4,435 (X) 2004 4,723 93.90 2011 3,955 69.00
46.3 Metropolitan Area Definition (1974, 1977, 1981) The definition of the Pittsburgh metropolitan area used in the 1974, 1977, and 1981 AHS followed the 1971 OMB definition for the Pittsburgh, PA SMSA.
FIPS County Name AHS COUNTY 42003 Allegheny 003 42007 Beaver 999 42125 Washington 125 42129 Westmoreland 129
Metropolitan Area Histories 1973 to 2013 108
–
46.4 Metropolitan Area Definition (1986, 1990) The definition of the Pittsburgh metropolitan area used in the 1986 and 1990 AHS followed the 1983 OMB definition for the Pittsburgh, PA MSA.
FIPS County Name AHS COUNTY AHS ZONE 42007 Beaver 007 101 42003 Allegheny 003 001-004, 102-107 42051 Fayette 051 110 42125 Washington 125 108 42129 Westmoreland 129 109
46.5 Metropolitan Area Definition (1995, 2004) The definition of the Pittsburgh metropolitan area used in the 1995 and 2004 AHS followed the 1993 OMB definition for the Pittsburgh, PA MSA.
FIPS County Name AHS COUNTY AHS ZONE 42007 Beaver 007 101 42003 Allegheny 003 001-004, 102-107 42051 Fayette 051 110 42125 Washington 125 108 42129 Westmoreland 129 109 42019 Butler 019 111
46.6 Metropolitan Area Definition (2011) The definition of the Pittsburgh metropolitan area used in the 2011 AHS followed the 2003 OMB definition for the Pittsburgh, PA MSA.
FIPS County Name AHS COUNTY AHS ZONE 42007 Beaver 007 101 42003 Allegheny 003 002-004, 102-107 42051 Fayette 051 110 42129 Westmoreland 129 109 42019 Butler 019 111 42005 Armstrong
938 10842125 Washington
Metropolitan Area Histories 1973 to 2013 109

–
47 Portland
47.1 National Longitudinal Sample There are no records in the national longitudinal sample that are identified as belonging to the Portland metropolitan area.
47.2 Independent Metropolitan Area Oversample Longitudinal History (1975 – 2011)
The first independent metropolitan area longitudinal oversample for the Portland metropolitan area (SMSA = 6440) was drawn in 1975 and was in place for the 1975, 1979, 1983, 1986, and 1990 surveys. The following table shows the sample sizes and percent of sample in common.
Year Sample Size Percent of Sample in Common with Prior Year 1975 4,709 (X) 1979 6,097 77.17 1983 4,214 94.87 1986 3,248 91.10 1990 5,055 64.25
The second independent metropolitan area longitudinal oversample for the Portland metropolitan area was drawn in 1995 and was in place for the 1995, 2002, and 2011 surveys. The following table shows the sample sizes and percent of sample in common.
Year Sample Size Percent of Sample in Common with Prior Year 1995 4,186 (X) 2002 4,917 85.13 2011 4,019 84.42
47.3 Metropolitan Area Definition (1975, 1979, 1983) The definition of the Portland metropolitan area used in the 1975, 1979, and 1983 AHS followed the 1971 OMB definition for the Portland, OR-WA SMSA, with the exception that the AHS excludes Clark county, WA.
FIPS County Name AHS COUNTY 41051 Multnomah 999 41009 Clackamas 999 41067 Washington 999
Metropolitan Area Histories 1973 to 2013 110
–
47.4 Metropolitan Area Definition (1986, 1990, 1995) The definition of the Portland metropolitan area used in the 1986, 1990, and 1995 AHS followed the 1983 OMB definition for the Portland-Vancouver, OR-WA CMSA.
FIPS County Name AHS COUNTY AHS ZONE 53011 Clark, WA 011 101 41051 Multnomah, OR 973 103-104 41009 Clackamas, OR 973 103-104 41067 Washington, OR 972 102 41071 Yamhill, OR 972 102
47.5 Metropolitan Area Definitions (2002) The definition of the Portland metropolitan area used in the 2002 AHS followed the 1993 OMB definition for the Portland-Vancouver, OR-WA PMSA.
FIPS County Name AHS COUNTY AHS ZONE 53011 Clark, WA 011 101 41051 Multnomah, OR 973 001- 003, 103-104 41009 Clackamas, OR 973 001- 003, 103-104 41067 Washington, OR 067 001, 105 53013 Columbia, WA 972 106 41071 Yamhill, OR 972 106
47.6 Metropolitan Area Definitions (2011) The definition of the Portland metropolitan area used in the 2011 AHS followed the 2003 OMB definition for the Portland-Vancouver-Beaverton, OR-WA MSA.
FIPS County Name AHS COUNTY AHS ZONE 53011 Clark, WA 944 101 41051 Multnomah, OR 973 001-003, 103-104 41009 Clackamas, OR 973 001-003, 103-104 41067 Washington, OR 067 105 53013 Columbia, WA 972 106 41071 Yamhill, OR 972 106 53059 Skamania, WA 944 101
Metropolitan Area Histories 1973 to 2013 111
–
48 Providence
48.1 National Longitudinal Sample (1985 – 2013) There are records in the national longitudinal sample from 1985 through 2013 that are identified as belonging to the Providence metropolitan area (PMSA = 6480 or CMSA = 80). The Providence metropolitan area definition used in the national longitudinal sample is the same as the 1983 OMB definition for both the Providence, RI PMSA and the Providence-Pawtucket-Fall River, RI-MA CMSA.
48.2 Independent Metropolitan Area Oversample Longitudinal History (1976 – 2011)
The first independent metropolitan area longitudinal oversample for the Providence metropolitan area was drawn in 1976 and was in place for the 1976, 1980, 1984, 1988, and 1992 surveys. The following table shows the sample sizes and percent of sample in common.
Year Sample Size Percent of Sample in Common with Prior Year 1976 5,345 (X) 1980 5,408 94.38 1984 4,456 88.62 1988 4,163 92.94 1992 5,303 78.43
The second independent metropolitan area longitudinal oversample for the Providence metropolitan area was drawn in 1998 and was in place for the 1998 and 2011 surveys. The following table shows the sample sizes and percent of sample in common.
Year Sample Size Percent of Sample in Common with Prior Year 1998 4,724 (X) 2011 4,368 55.79
48.3 Metropolitan Area Definition (1976, 1980) The definition of the Providence metropolitan area used in the 1976 and 1980 AHS followed the 1971 OMB Providence-Pawtucket-Warwick, RI-MA Standard Metropolitan Statistical Area definition.
48.4 Metropolitan Area Definition (1984, 1988, 1992) The definition of the Providence metropolitan area used in the 1984, 1988, and 1992 AHS followed the combination of two 1983 OMB PMSAs – the Pawtucket-Woonsocket-Attleboro, RI-MA PMSA and the Providence, RI PMSA.
Metropolitan Area Histories 1973 to 2013 112
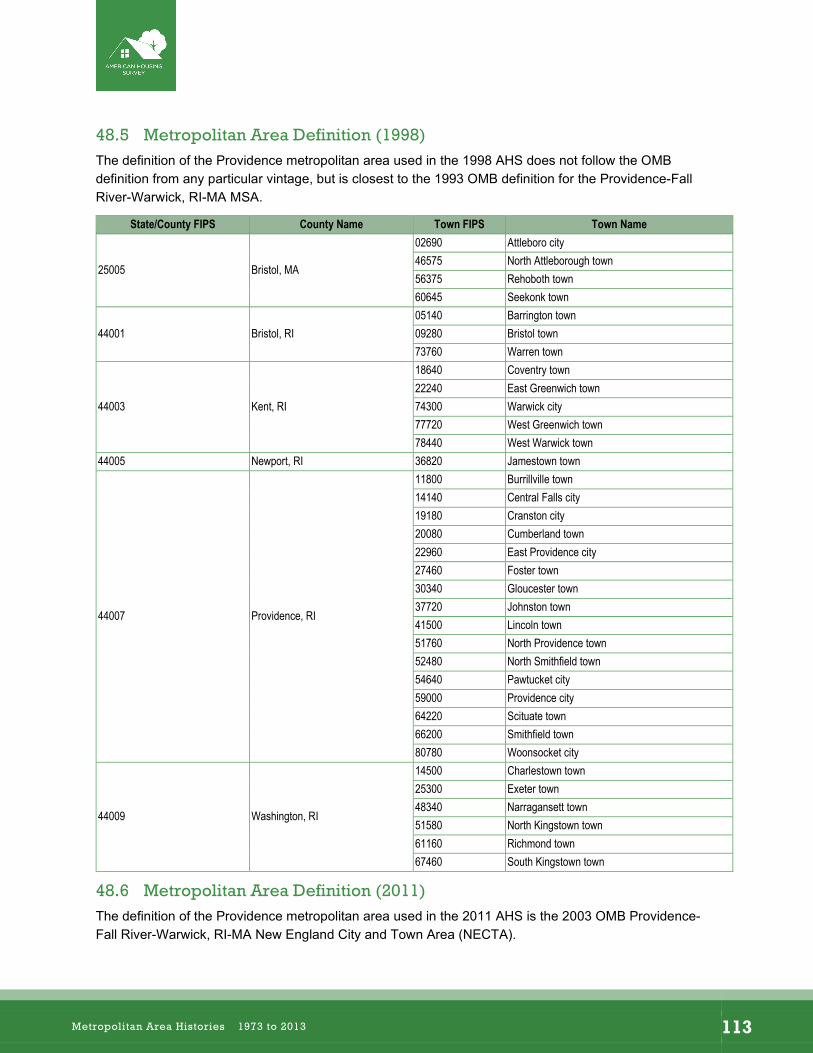
–
48.5 Metropolitan Area Definition (1998) The definition of the Providence metropolitan area used in the 1998 AHS does not follow the OMB definition from any particular vintage, but is closest to the 1993 OMB definition for the Providence-Fall River-Warwick, RI-MA MSA.
State/County FIPS County Name Town FIPS Town Name
25005 Bristol, MA
02690 Attleboro city 46575 North Attleborough town 56375 Rehoboth town 60645 Seekonk town
44001 Bristol, RI 05140 Barrington town 09280 Bristol town 73760 Warren town
44003 Kent, RI
18640 Coventry town 22240 East Greenwich town 74300 Warwick city 77720 West Greenwich town 78440 West Warwick town
44005 Newport, RI 36820 Jamestown town
44007 Providence, RI
11800 Burrillville town 14140 Central Falls city 19180 Cranston city 20080 Cumberland town 22960 East Providence city 27460 Foster town 30340 Gloucester town 37720 Johnston town 41500 Lincoln town 51760 North Providence town 52480 North Smithfield town 54640 Pawtucket city 59000 Providence city 64220 Scituate town 66200 Smithfield town 80780 Woonsocket city
44009 Washington, RI
14500 Charlestown town 25300 Exeter town 48340 Narragansett town 51580 North Kingstown town 61160 Richmond town 67460 South Kingstown town
48.6 Metropolitan Area Definition (2011) The definition of the Providence metropolitan area used in the 2011 AHS is the 2003 OMB Providence-Fall River-Warwick, RI-MA New England City and Town Area (NECTA).
Metropolitan Area Histories 1973 to 2013 113
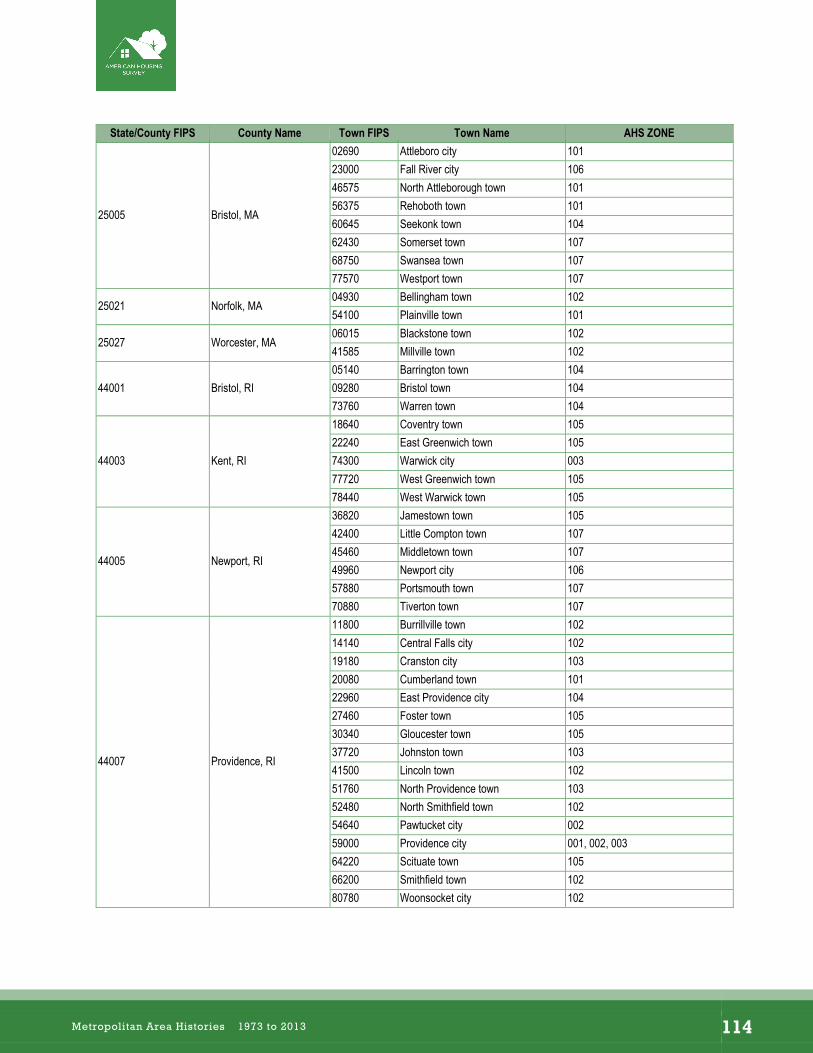
–
State/County FIPS County Name Town FIPS Town Name AHS ZONE
25005 Bristol, MA
02690 Attleboro city 101 23000 Fall River city 106 46575 North Attleborough town 101 56375 Rehoboth town 101 60645 Seekonk town 104 62430 Somerset town 107 68750 Swansea town 107 77570 Westport town 107
25021 Norfolk, MA 04930 Bellingham town 102 54100 Plainville town 101
25027 Worcester, MA 06015 Blackstone town 102 41585 Millville town 102
44001 Bristol, RI 05140 Barrington town 104 09280 Bristol town 104 73760 Warren town 104
44003 Kent, RI
18640 Coventry town 105 22240 East Greenwich town 105 74300 Warwick city 003 77720 West Greenwich town 105 78440 West Warwick town 105
44005 Newport, RI
36820 Jamestown town 105 42400 Little Compton town 107 45460 Middletown town 107 49960 Newport city 106 57880 Portsmouth town 107 70880 Tiverton town 107
44007 Providence, RI
11800 Burrillville town 102 14140 Central Falls city 102 19180 Cranston city 103 20080 Cumberland town 101 22960 East Providence city 104 27460 Foster town 105 30340 Gloucester town 105 37720 Johnston town 103 41500 Lincoln town 102 51760 North Providence town 103 52480 North Smithfield town 102 54640 Pawtucket city 002 59000 Providence city 001, 002, 003 64220 Scituate town 105 66200 Smithfield town 102 80780 Woonsocket city 102
Metropolitan Area Histories 1973 to 2013 114
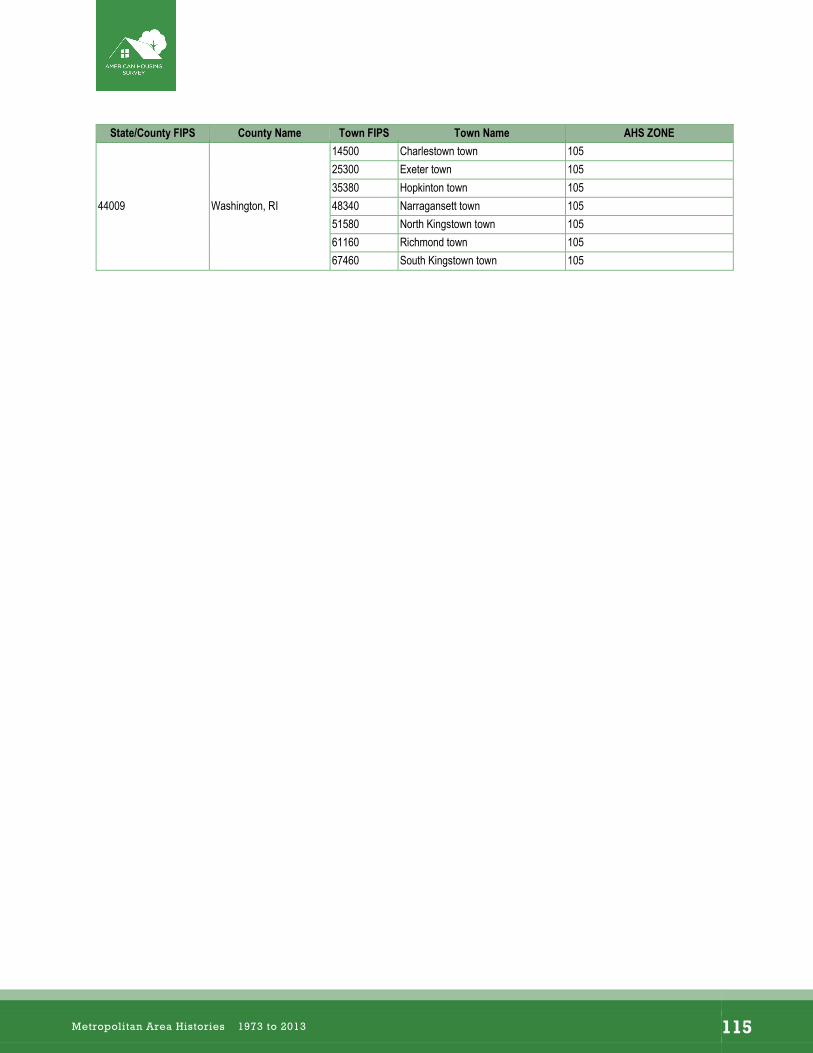
–
State/County FIPS County Name Town FIPS Town Name AHS ZONE 14500 Charlestown town 105 25300 Exeter town 105 35380 Hopkinton town 105
44009 Washington, RI 48340 Narragansett town 105 51580 North Kingstown town 105 61160 Richmond town 105 67460 South Kingstown town 105
Metropolitan Area Histories 1973 to 2013 115
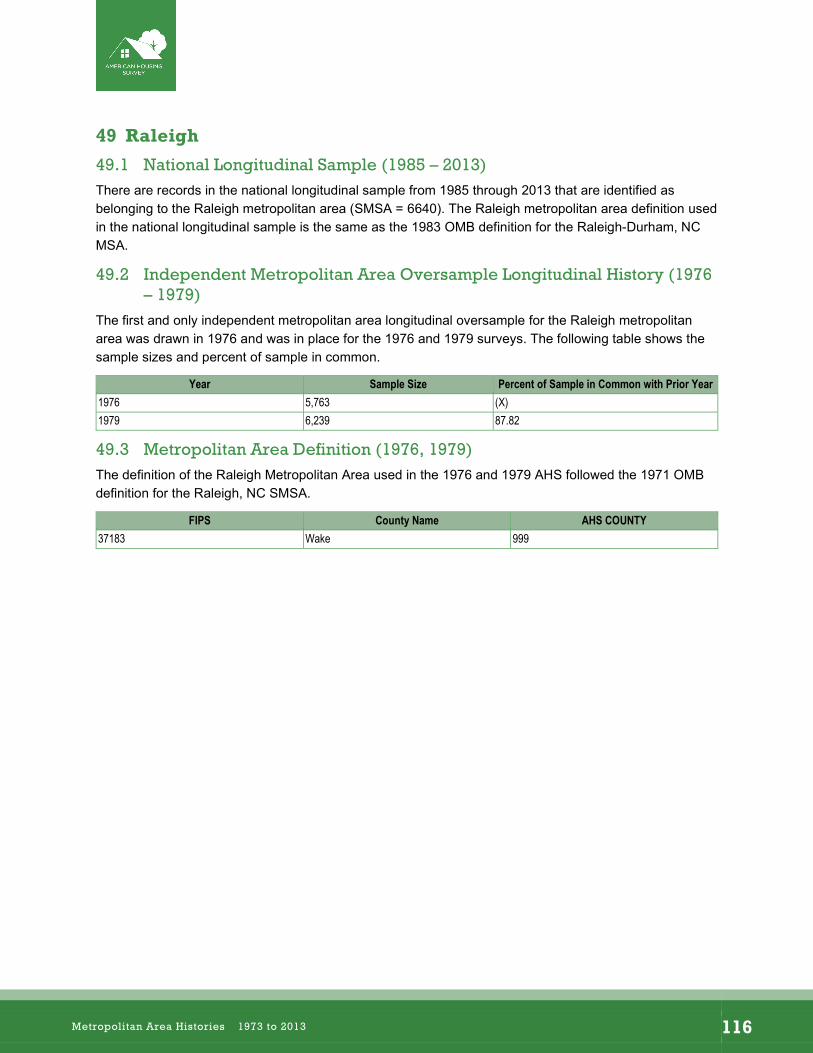
–
49 Raleigh
49.1 National Longitudinal Sample (1985 – 2013) There are records in the national longitudinal sample from 1985 through 2013 that are identified as belonging to the Raleigh metropolitan area (SMSA = 6640). The Raleigh metropolitan area definition used in the national longitudinal sample is the same as the 1983 OMB definition for the Raleigh-Durham, NC MSA.
49.2 Independent Metropolitan Area Oversample Longitudinal History (1976 – 1979)
The first and only independent metropolitan area longitudinal oversample for the Raleigh metropolitan area was drawn in 1976 and was in place for the 1976 and 1979 surveys. The following table shows the sample sizes and percent of sample in common.
Year Sample Size Percent of Sample in Common with Prior Year 1976 5,763 (X) 1979 6,239 87.82
49.3 Metropolitan Area Definition (1976, 1979) The definition of the Raleigh Metropolitan Area used in the 1976 and 1979 AHS followed the 1971 OMB definition for the Raleigh, NC SMSA.
FIPS County Name AHS COUNTY 37183 Wake 999
Metropolitan Area Histories 1973 to 2013 116
–
50 Richmond
50.1 National Longitudinal Sample (1985 – 2013) There are no records in the national longitudinal sample that are identified as belonging to the Richmond metropolitan area.
50.2 Independent Metropolitan Area Oversample Longitudinal History (2013)
The first and only independent metropolitan area longitudinal oversample for the Richmond metropolitan area (SMSA = 6760) was drawn in 2013. The following table shows the sample size.
Year Sample Size Percent of Sample in Common with Prior Year 2013 4,242 (X)
50.3 Metropolitan Area Definition (2013) The 2013 Richmond area interviewed in the AHS matches the 2003 OMB definition for the Richmond, VA MSA.
FIPS County Name 51007 Amelia 51033 Caroline 51036 Charles City 51041 Chesterfield 51049 Cumberland 51053 Dinwiddie 51075 Goochland 51085 Hanover 51087 Henrico 51097 King and Queen 51101 King William 51109 Louisa 51127 New Kent 51145 Powhatan 51149 Prince George 51183 Sussex 51570 Colonial Heights city 51670 Hopewell city 51730 Petersburg city 51760 Richmond city *In 2013, due to disclosure we no longer show COUNTY or ZONE in metropolitan areas.
Metropolitan Area Histories 1973 to 2013 117
–
51 Riverside
51.1 National Longitudinal Sample (1985 – 2013) There are records in the national longitudinal sample from 1985 through 2013 that are identified as belonging to the Riverside metropolitan area (SMSA = 6780 or 7280). The Riverside metropolitan area definition used in the national longitudinal sample is the same as the 1983 OMB definition for the Riverside-San Bernardino, CA PMSA.
51.2 Independent Metropolitan Area Oversample Longitudinal History (1975 – 2011)
The first independent metropolitan area longitudinal oversample for the Riverside metropolitan area was drawn in 1975 and was in place for the 1975 and 1978 surveys. The following table shows the sample sizes and percent of sample in common.
Year Sample Size Percent of Sample in Common with Prior Year 1975 4,679 (X) 1978 6,398 73.11
The second independent metropolitan area longitudinal oversample for the Riverside metropolitan area was drawn in 1982 and was in place for the 1982, 1986, 1990, 1994, 2002, and 2011 surveys. The following table shows the sample sizes and percent of sample in common.
Year Sample Size Percent of Sample in Common with Prior Year 1982 4,130 (X) 1986 3,320 71.71 1990 5,873 56.52 1994 5,218 93.81 2002 5,932 87.96 2011 3,902 79.01
51.3 Metropolitan Area Definition (1975, 1978, 1982) The definition of the Riverside metropolitan area used in the 1975, 1978, and 1982 AHS followed the 1971 OMB definition for the San Bernardino-Riverside-Ontario, CA SMSA.
FIPS County Name AHS COUNTY 06071 San Bernardino 999 06065 Riverside 999
51.4 Metropolitan Area Definition (1986, 1990, 1994, 2002, 2011) The definition of the Riverside metropolitan area used in the 1986, 1990, 1994, 2002 (SMSA = 7280), and 2011 (SMSA = 6780) AHS followed the 1973 OMB definition for the Riverside-San Bernardino- Ontario, CA SMSA.
FIPS County Name AHS COUNTY AHS ZONE 06071 San Bernardino 071 002, 101-104 06065 Riverside 065 001, 105-107
Metropolitan Area Histories 1973 to 2013 118
–
52 Rochester
52.1 National Longitudinal Sample (1985 – 2013) There are records in the national longitudinal sample from 1985 through 2013 that are identified as belonging to the Rochester metropolitan area (SMSA = 6840). The Rochester metropolitan area definition used in the national longitudinal sample is the same as the 1983 OMB definition for the Rochester, NY MSA.
52.2 Independent Metropolitan Area Oversample Longitudinal History (1975 – 2013)
The first independent metropolitan area longitudinal oversample for the Rochester metropolitan area was drawn in 1975 and was in place for the 1975, 1978, 1982, 1986, and 1990 surveys. The following table shows the sample sizes and percent of sample in common.
Year Sample Size Percent of Sample in Common with Prior Year 1975 4,626 (X) 1978 5,550 83.30 1982 4,213 97.10 1986 3,284 75.03 1990 5,080 64.59
The second independent metropolitan area longitudinal oversample for the Rochester metropolitan area was drawn in 1998 and was in place for the 1998 and 2013 surveys. The following table shows the sample sizes and percent of sample in common.
Year Sample Size Percent of Sample in Common with Prior Year 1998 4,763 (X) 2013 4,726 86.23
52.3 Metropolitan Area Definition (1975, 1978, 1982) The definition of the Rochester metropolitan area used in the 1975, 1978, and 1982 AHS followed the 1971 OMB definition for the Rochester, NY MSA, with the exception that the AHS definition excludes Wayne county.
FIPS County Name AHS COUNTY 36051 Livingston 999 36055 Monroe 999 36073 Orleans 999
Metropolitan Area Histories 1973 to 2013 119
–
52.4 Metropolitan Area Definition (1986, 1990) The definition of the Rochester metropolitan area used in the 1986 and 1990 AHS followed the 1983 OMB definition for the Rochester, NY MSA.
FIPS County Name AHS COUNTY AHS ZONE 36051 Livingston 971 105 36055 Monroe 055 001, 101-104 36069 Ontario 971 105 36073 Orleans 971 105 36117 Wayne 971 105
52.5 Metropolitan Area Definition (1998) The definition of the Rochester metropolitan area used in the 1998 AHS followed the 1993 OMB definition for the Rochester, NY MSA.
FIPS County Name AHS COUNTY AHS ZONE 36037 Genesee 971 105 36051 Livingston 971 105 36055 Monroe 055 001,101-104 36069 Ontario 971 105 36073 Orleans 971 105 36117 Wayne 971 105
52.6 Metropolitan Area Definition (2013) The definition of the Rochester metropolitan area used in the 2013 AHS followed the 2003 OMB Metropolitan Statistical Area definition for the area. Genesee county was removed.
FIPS County Name 36051 Livingston 36055 Monroe 36069 Ontario 36073 Orleans 36117 Wayne *In 2013, due to disclosure we no longer show COUNTY or ZONE in metropolitan areas.
Metropolitan Area Histories 1973 to 2013 120
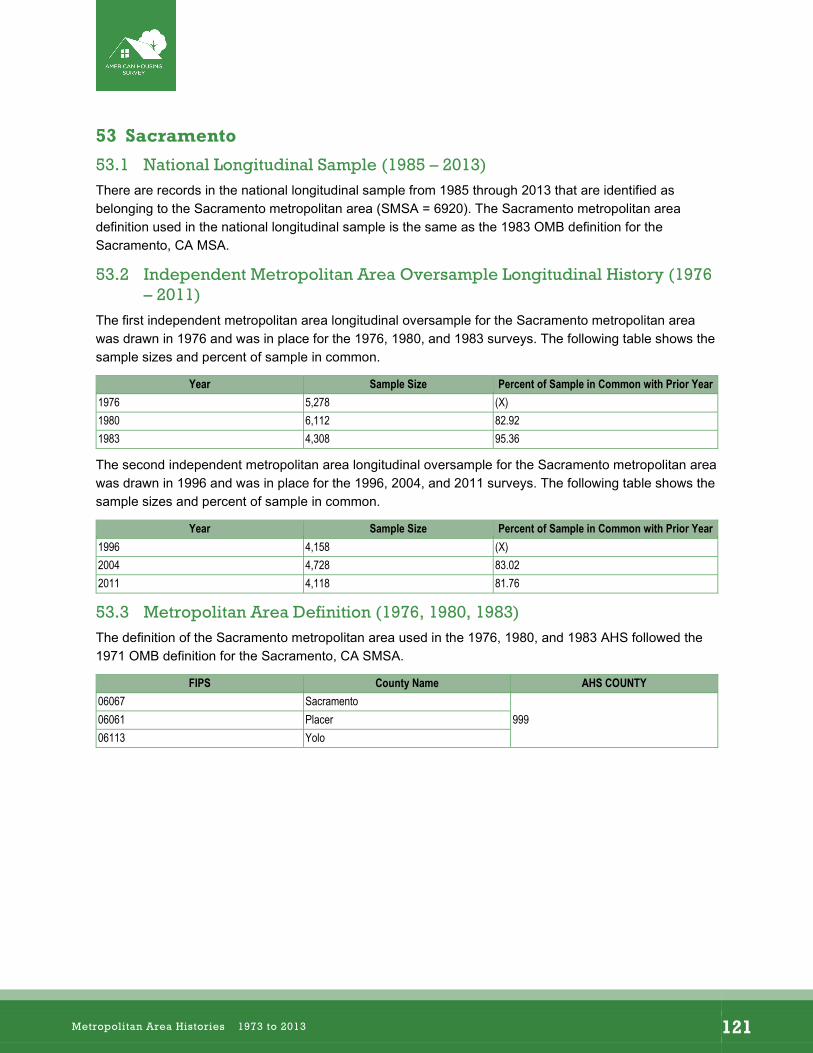
–
53 Sacramento
53.1 National Longitudinal Sample (1985 – 2013) There are records in the national longitudinal sample from 1985 through 2013 that are identified as belonging to the Sacramento metropolitan area (SMSA = 6920). The Sacramento metropolitan area definition used in the national longitudinal sample is the same as the 1983 OMB definition for the Sacramento, CA MSA.
53.2 Independent Metropolitan Area Oversample Longitudinal History (1976 – 2011)
The first independent metropolitan area longitudinal oversample for the Sacramento metropolitan area was drawn in 1976 and was in place for the 1976, 1980, and 1983 surveys. The following table shows the sample sizes and percent of sample in common.
Year Sample Size Percent of Sample in Common with Prior Year 1976 5,278 (X) 1980 6,112 82.92 1983 4,308 95.36
The second independent metropolitan area longitudinal oversample for the Sacramento metropolitan area was drawn in 1996 and was in place for the 1996, 2004, and 2011 surveys. The following table shows the sample sizes and percent of sample in common.
Year Sample Size Percent of Sample in Common with Prior Year 1996 4,158 (X) 2004 4,728 83.02 2011 4,118 81.76
53.3 Metropolitan Area Definition (1976, 1980, 1983) The definition of the Sacramento metropolitan area used in the 1976, 1980, and 1983 AHS followed the 1971 OMB definition for the Sacramento, CA SMSA.
FIPS County Name AHS COUNTY 06067 Sacramento
99906061 Placer 06113 Yolo
Metropolitan Area Histories 1973 to 2013 121
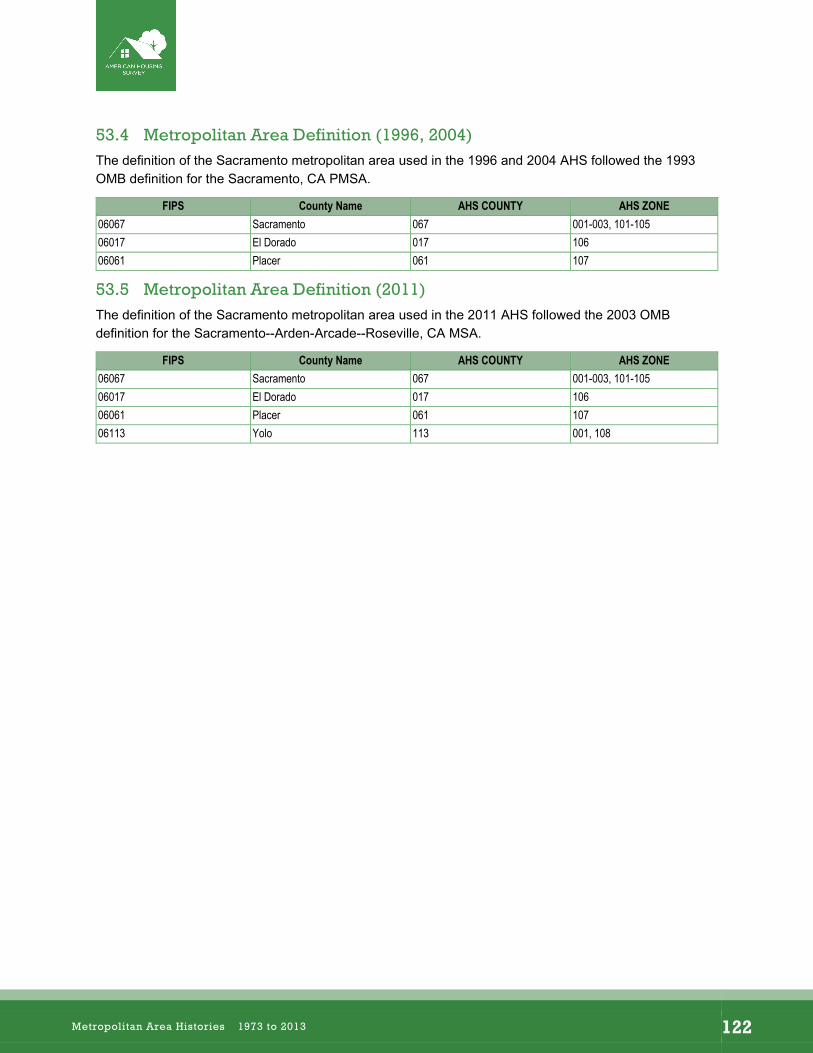
–
53.4 Metropolitan Area Definition (1996, 2004) The definition of the Sacramento metropolitan area used in the 1996 and 2004 AHS followed the 1993 OMB definition for the Sacramento, CA PMSA.
FIPS County Name AHS COUNTY AHS ZONE 06067 Sacramento 067 001-003, 101-105 06017 El Dorado 017 106 06061 Placer 061 107
53.5 Metropolitan Area Definition (2011) The definition of the Sacramento metropolitan area used in the 2011 AHS followed the 2003 OMB definition for the Sacramento--Arden-Arcade--Roseville, CA MSA.
FIPS County Name AHS COUNTY AHS ZONE 06067 Sacramento 067 001-003, 101-105 06017 El Dorado 017 106 06061 Placer 061 107 06113 Yolo 113 001, 108
Metropolitan Area Histories 1973 to 2013 122
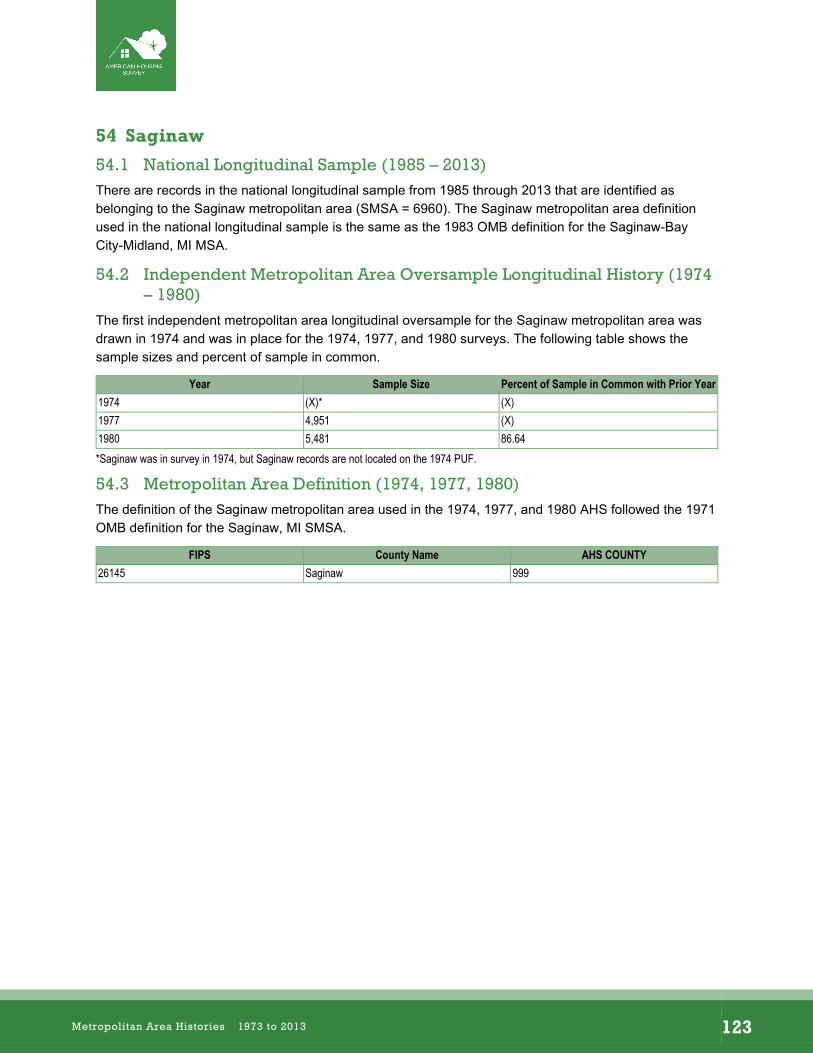
–
54 Saginaw
54.1 National Longitudinal Sample (1985 – 2013) There are records in the national longitudinal sample from 1985 through 2013 that are identified as belonging to the Saginaw metropolitan area (SMSA = 6960). The Saginaw metropolitan area definition used in the national longitudinal sample is the same as the 1983 OMB definition for the Saginaw-Bay City-Midland, MI MSA.
54.2 Independent Metropolitan Area Oversample Longitudinal History (1974 – 1980)
The first independent metropolitan area longitudinal oversample for the Saginaw metropolitan area was drawn in 1974 and was in place for the 1974, 1977, and 1980 surveys. The following table shows the sample sizes and percent of sample in common.
Year Sample Size Percent of Sample in Common with Prior Year 1974 (X)* (X) 1977 4,951 (X) 1980 5,481 86.64 *Saginaw was in survey in 1974, but Saginaw records are not located on the 1974 PUF.
54.3 Metropolitan Area Definition (1974, 1977, 1980) The definition of the Saginaw metropolitan area used in the 1974, 1977, and 1980 AHS followed the 1971 OMB definition for the Saginaw, MI SMSA.
FIPS County Name AHS COUNTY 26145 Saginaw 999
Metropolitan Area Histories 1973 to 2013 123
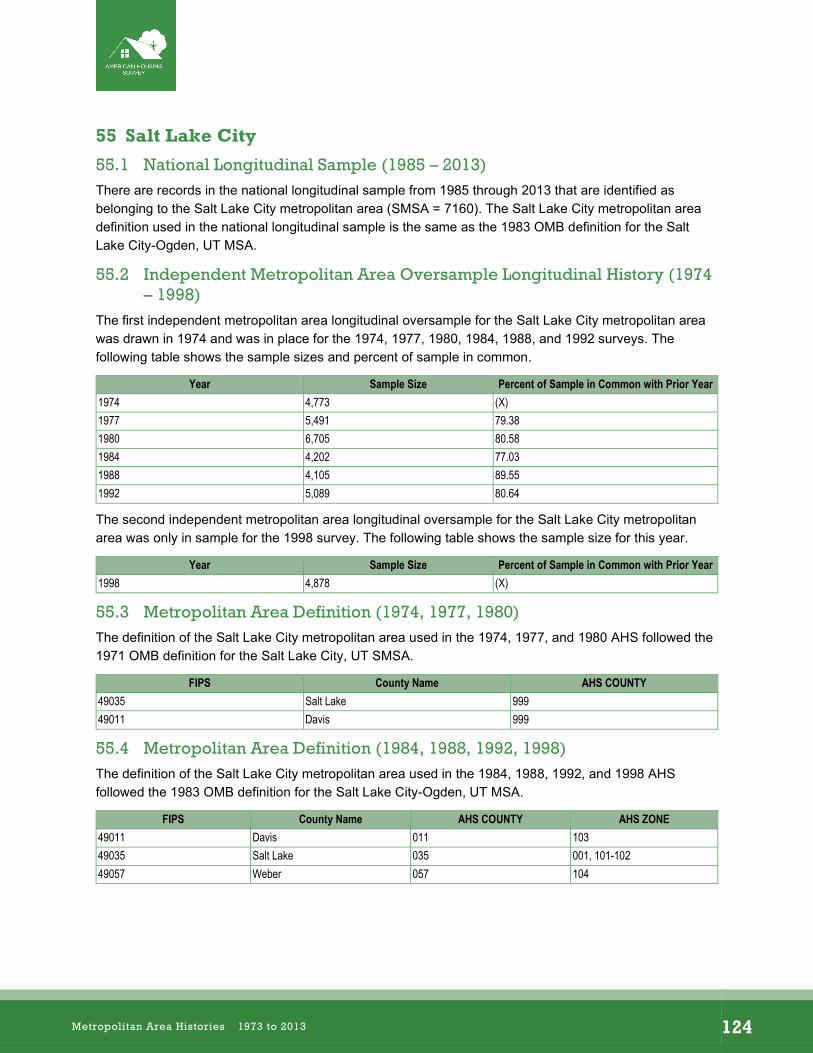
–
55 Salt Lake City
55.1 National Longitudinal Sample (1985 – 2013) There are records in the national longitudinal sample from 1985 through 2013 that are identified as belonging to the Salt Lake City metropolitan area (SMSA = 7160). The Salt Lake City metropolitan area definition used in the national longitudinal sample is the same as the 1983 OMB definition for the Salt Lake City-Ogden, UT MSA.
55.2 Independent Metropolitan Area Oversample Longitudinal History (1974 – 1998)
The first independent metropolitan area longitudinal oversample for the Salt Lake City metropolitan area was drawn in 1974 and was in place for the 1974, 1977, 1980, 1984, 1988, and 1992 surveys. The following table shows the sample sizes and percent of sample in common.
Year Sample Size Percent of Sample in Common with Prior Year 1974 4,773 (X) 1977 5,491 79.38 1980 6,705 80.58 1984 4,202 77.03 1988 4,105 89.55 1992 5,089 80.64
The second independent metropolitan area longitudinal oversample for the Salt Lake City metropolitan area was only in sample for the 1998 survey. The following table shows the sample size for this year.
Year Sample Size Percent of Sample in Common with Prior Year 1998 4,878 (X)
55.3 Metropolitan Area Definition (1974, 1977, 1980) The definition of the Salt Lake City metropolitan area used in the 1974, 1977, and 1980 AHS followed the 1971 OMB definition for the Salt Lake City, UT SMSA.
FIPS County Name AHS COUNTY 49035 Salt Lake 999 49011 Davis 999
55.4 Metropolitan Area Definition (1984, 1988, 1992, 1998) The definition of the Salt Lake City metropolitan area used in the 1984, 1988, 1992, and 1998 AHS followed the 1983 OMB definition for the Salt Lake City-Ogden, UT MSA.
FIPS County Name AHS COUNTY AHS ZONE 49011 Davis 011 103 49035 Salt Lake 035 001, 101-102 49057 Weber 057 104
Metropolitan Area Histories 1973 to 2013 124
–
56 San Diego
56.1 National Longitudinal Sample (1985 – 2013) There are records in the national longitudinal sample from 1985 through 2013 that are identified as belonging to the San Diego metropolitan area (SMSA = 7320). The San Diego metropolitan area definition used in the national longitudinal sample is the same as the 1983 OMB definition for the San Diego, CA MSA.
56.2 Independent Metropolitan Area Oversample Longitudinal History (1975 – 2011)
The first and only independent metropolitan area longitudinal oversample for the San Diego metropolitan area was drawn in 1975 and was in place for the 1975, 1978, 1982, 1987, 1991, 1994, 2002, and 2011 surveys. The following table shows the sample sizes and percent of sample in common.
Year Sample Size Percent of Sample in Common with Prior Year 1975 6,111 X 1978 8,279 73.74 1982 6,861 92.51 1987 6,464 81.87 1991 7,106 78.58 1994 7,186 98.89 2002 7,684 93.52 2011 3,962 93.59
56.3 Metropolitan Area Definition (1975, 1978, 1982) The definition of the San Diego metropolitan area used in the 1975, 1978, and 1982 AHS followed the 1973 OMB definition for the San Diego, CA SMSA.
FIPS County Name AHS COUNTY 06073 San Diego 999
56.4 Metropolitan Area Definition (1987, 1991, 1994, 2002, 2011) The definition of the San Diego metropolitan area used in the 1987, 1991, 1994, 2002, and 2011 AHS continued to follow the 1973 OMB definition for the San Diego, CA SMSA.
FIPS County Name AHS COUNTY AHS ZONE 06073 San Diego 073 001-005, 101-105
Metropolitan Area Histories 1973 to 2013 125
–
57 San Francisco
57.1 National Longitudinal Sample (1985 – 2013) There are records in the national longitudinal sample from 1985 through 2013 that are identified as belonging to the San Francisco metropolitan area (SMSA = 7360). The definition used in the national longitudinal sample is based on the 1983 OMB San Francisco, CA PMSA definition, meaning that Alameda and Contra Costa counties were part of the Oakland metropolitan area (see the Oakland section of this document for additional information). For San Francisco, this definition remained the same in 1993 and 2003.
57.2 Independent Metropolitan Area Oversample Longitudinal History (1975 – 2011)
The first independent metropolitan area longitudinal oversample for the San Francisco-Oakland metropolitan area was drawn in 1975 and was in place for the 1975, 1978, 1982, 1985, 1989, and 1993 surveys. The following table shows the sample sizes and percent of sample in common.
Year Sample Size Percent of Sample in Common with Prior Year 1975 13,646 (X) 1978 16,169 84.37 1982 4,251 95.84 1985 6,656 49.38 1989 3,965 85.93 1993 5,265 75.31
The second independent metropolitan area longitudinal oversample for the San Francisco metropolitan area was drawn in 1998 and was in place for the 1998 and 2011 surveys. The following table shows the sample sizes and percent of sample in common.
Year Sample Size Percent of Sample in Common with Prior Year 1998 4,813 (X) 2011 4,085 92.53
57.3 Metropolitan Area Definition (1975, 1978, and 1982) The definition of the San Francisco metropolitan area used in the 1975, 1978, and 1982 AHS followed the 1971 OMB definition for the San Francisco-Oakland, CA SMSA.
FIPS County Name AHS COUNTY 06001 Alameda 001 06013 Contra Costa 999 06041 Marin 999 06075 San Francisco 075 06081 San Mateo 081
Metropolitan Area Histories 1973 to 2013 126
–
57.4 Metropolitan Area Definition (1985, 1989, 1993) The 1985, 1989, and 1993 AHS definitions for San Francisco-Oakland continued to use the 1971 OMB definition of the San Francisco-Oakland, CA SMSA.
FIPS County Name AHS COUNTY AHS ZONE 06001 Alameda 001 007, 108-111, 199* 06013 Contra Costa 013 103-107 06041 Marin 041 101-102 06075 San Francisco 075 001-006 06081 San Mateo 081 112-115 *ZONE values of 199 were for areas with missing ZONE information
57.5 Metropolitan Area Definition (1998, 2011) The definition of the San Francisco metropolitan area used in the 1998 and 2011 AHS followed the 1983 OMB definition for the San Francisco, CA PMSA.
FIPS County Name AHS COUNTY AHS ZONE 06041 Marin 041 101-102 06075 San Francisco 075 001-006 06081 San Mateo 081 112-115
Metropolitan Area Histories 1973 to 2013 127
–
58 San Antonio
58.1 National Longitudinal Sample (1985 – 2013) There are records in the national longitudinal sample from 1985 through 2013 that are identified as belonging to the San Antonio metropolitan area (SMSA = 7240). The San Antonio metropolitan area definition used in the national longitudinal sample is the same as the 1983 OMB definition for the San Antonio, TX MSA.
58.2 Independent Metropolitan Area Oversample Longitudinal History (1975 – 2013)
The first independent metropolitan area longitudinal oversample for the San Antonio metropolitan area was drawn in 1975 and was in place for the 1975, 1978, 1982, 1987, and 1990 surveys. The following table shows the sample sizes and percent of sample in common.
Year Sample Size Percent of Sample in Common with Prior Year 1975 4,691 (X) 1978 5,579 83.98 1982 4,296 88.48 1986 3,346 78.42 1990 5,092 65.71
The second independent metropolitan area longitudinal oversample for the San Antonio metropolitan area was drawn in 1995 and was in place for the 1995, 2004, and 2013 surveys. The following table shows the sample sizes and percent of sample in common.
Year Sample Size Percent of Sample in Common with Prior Year 1995 4,358 (X) 2004 4,863 83.94 2013 5,056 62.40
58.3 Metropolitan Area Definition (1975, 1978, 1982) The definition of the San Antonio metropolitan area used in the 1975, 1978, and 1982 AHS followed the 1971 OMB definition for the San Antonio, TX SMSA.
FIPS County Name AHS COUNTY 48029 Bexar
99948187 Guadalupe
58.4 Metropolitan Area Definition (1986, 1990) The definition of the San Antonio metropolitan area used in the 1986 and 1990 AHS followed the 1983 OMB definition for the San Antonio, TX MSA.
FIPS County Name AHS COUNTY AHS ZONE 48029 Bexar
970 001-007, 101, 102 48091 Comal 48187 Guadalupe
Metropolitan Area Histories 1973 to 2013 128
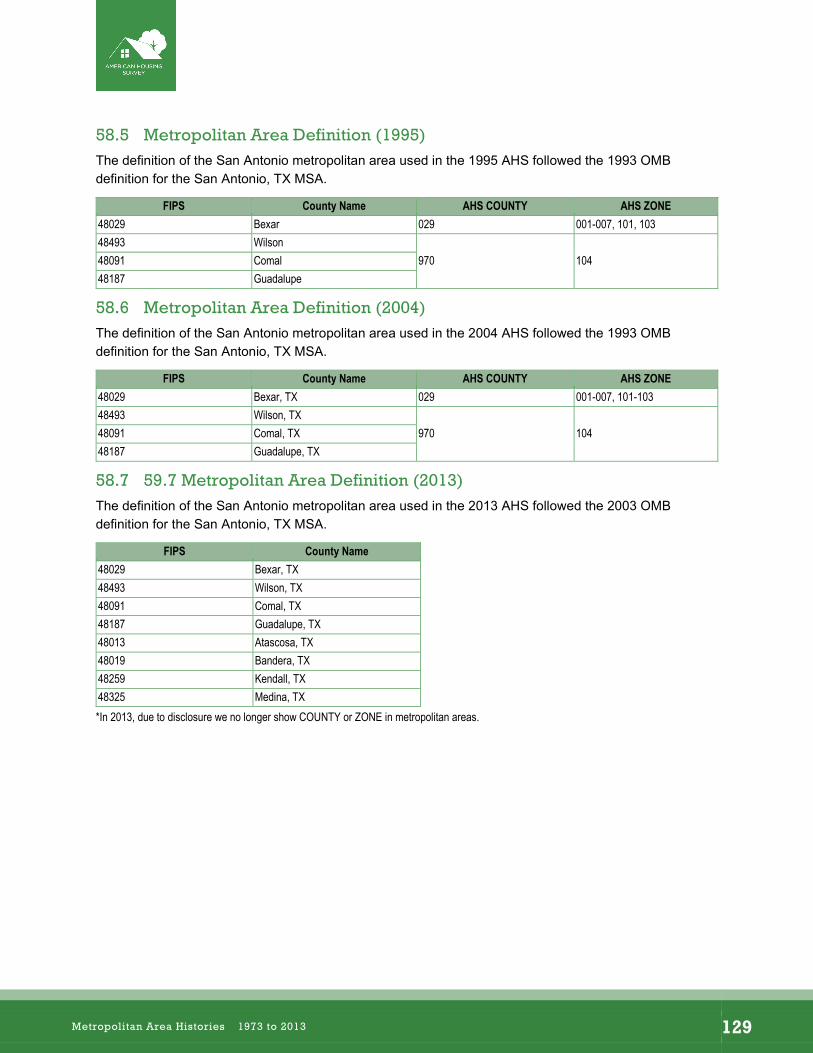
–
58.5 Metropolitan Area Definition (1995) The definition of the San Antonio metropolitan area used in the 1995 AHS followed the 1993 OMB definition for the San Antonio, TX MSA.
FIPS County Name AHS COUNTY AHS ZONE 48029 Bexar 029 001-007, 101, 103 48493 Wilson
970 10448091 Comal 48187 Guadalupe
58.6 Metropolitan Area Definition (2004) The definition of the San Antonio metropolitan area used in the 2004 AHS followed the 1993 OMB definition for the San Antonio, TX MSA.
FIPS County Name AHS COUNTY AHS ZONE 48029 Bexar, TX 029 001-007, 101-103 48493 Wilson, TX
970 10448091 Comal, TX 48187 Guadalupe, TX
58.7 59.7 Metropolitan Area Definition (2013) The definition of the San Antonio metropolitan area used in the 2013 AHS followed the 2003 OMB definition for the San Antonio, TX MSA.
FIPS County Name 48029 Bexar, TX 48493 Wilson, TX 48091 Comal, TX 48187 Guadalupe, TX 48013 Atascosa, TX 48019 Bandera, TX 48259 Kendall, TX 48325 Medina, TX *In 2013, due to disclosure we no longer show COUNTY or ZONE in metropolitan areas.
Metropolitan Area Histories 1973 to 2013 129
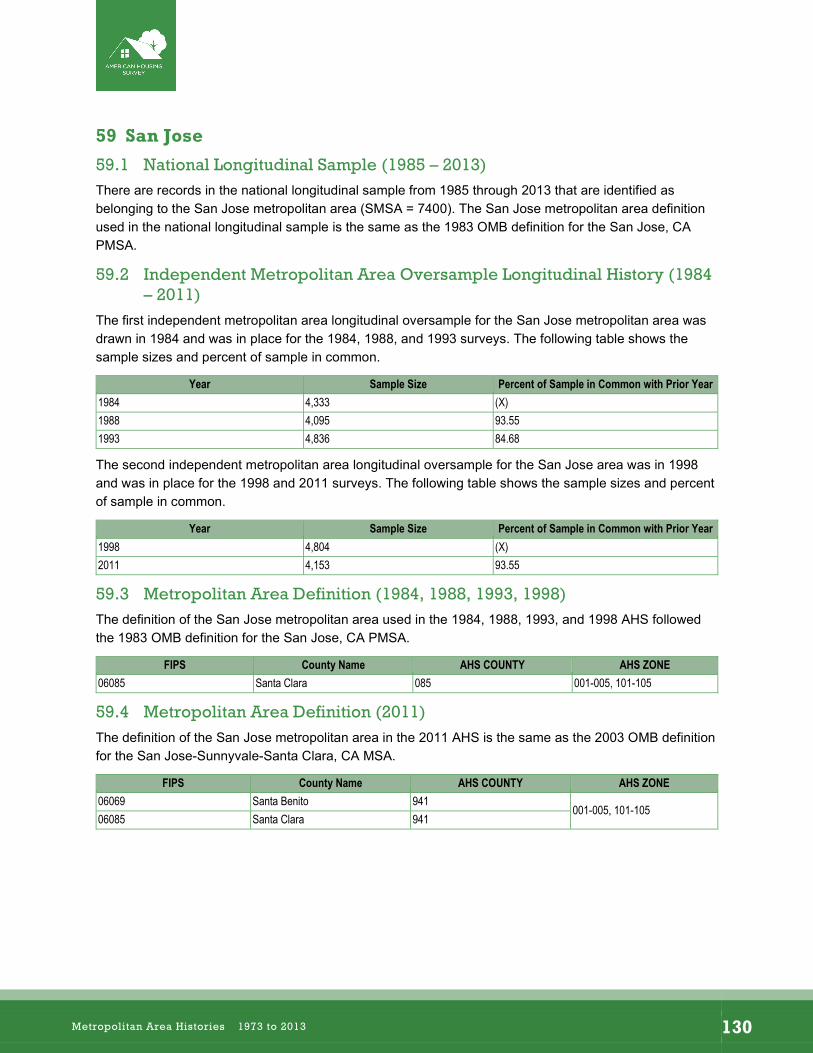
–
59 San Jose
59.1 National Longitudinal Sample (1985 – 2013) There are records in the national longitudinal sample from 1985 through 2013 that are identified as belonging to the San Jose metropolitan area (SMSA = 7400). The San Jose metropolitan area definition used in the national longitudinal sample is the same as the 1983 OMB definition for the San Jose, CA PMSA.
59.2 Independent Metropolitan Area Oversample Longitudinal History (1984 – 2011)
The first independent metropolitan area longitudinal oversample for the San Jose metropolitan area was drawn in 1984 and was in place for the 1984, 1988, and 1993 surveys. The following table shows the sample sizes and percent of sample in common.
Year Sample Size Percent of Sample in Common with Prior Year 1984 4,333 (X) 1988 4,095 93.55 1993 4,836 84.68
The second independent metropolitan area longitudinal oversample for the San Jose area was in 1998 and was in place for the 1998 and 2011 surveys. The following table shows the sample sizes and percent of sample in common.
Year Sample Size Percent of Sample in Common with Prior Year 1998 4,804 (X) 2011 4,153 93.55
59.3 Metropolitan Area Definition (1984, 1988, 1993, 1998) The definition of the San Jose metropolitan area used in the 1984, 1988, 1993, and 1998 AHS followed the 1983 OMB definition for the San Jose, CA PMSA.
FIPS County Name AHS COUNTY AHS ZONE 06085 Santa Clara 085 001-005, 101-105
59.4 Metropolitan Area Definition (2011) The definition of the San Jose metropolitan area in the 2011 AHS is the same as the 2003 OMB definition for the San Jose-Sunnyvale-Santa Clara, CA MSA.
FIPS County Name AHS COUNTY AHS ZONE 06069 Santa Benito 941
001-005, 101-105 06085 Santa Clara 941
Metropolitan Area Histories 1973 to 2013 130
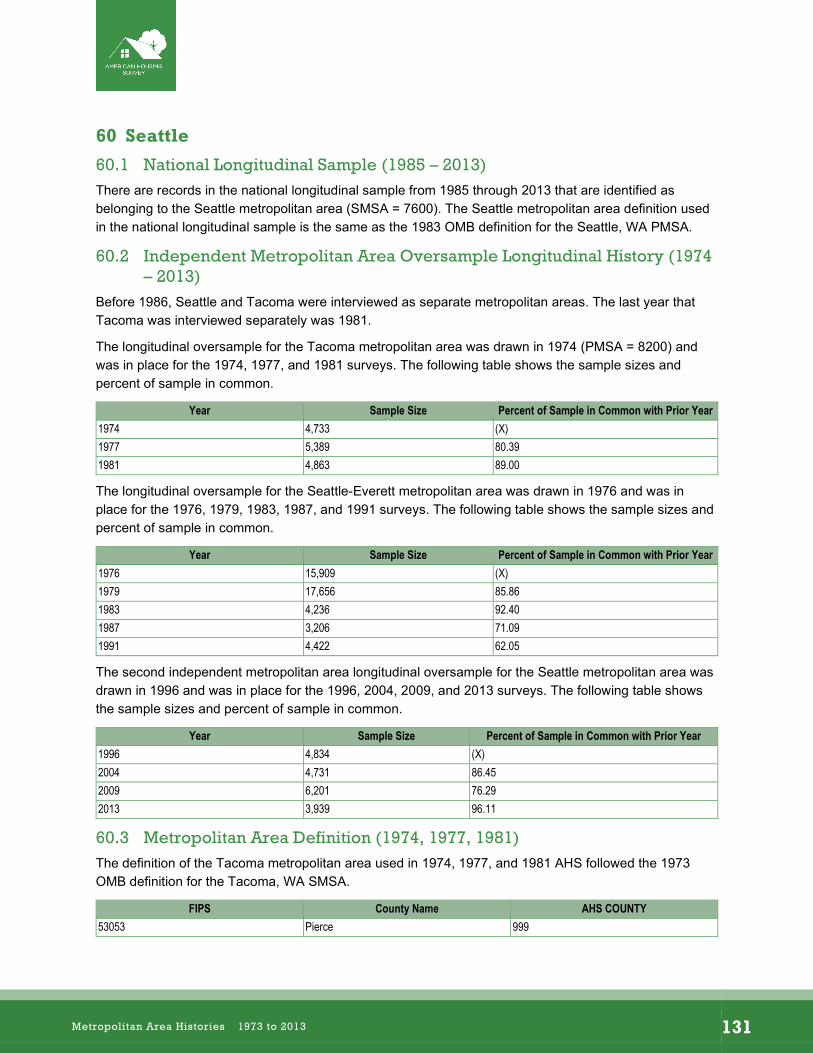
–
60 Seattle
60.1 National Longitudinal Sample (1985 – 2013) There are records in the national longitudinal sample from 1985 through 2013 that are identified as belonging to the Seattle metropolitan area (SMSA = 7600). The Seattle metropolitan area definition used in the national longitudinal sample is the same as the 1983 OMB definition for the Seattle, WA PMSA.
60.2 Independent Metropolitan Area Oversample Longitudinal History (1974 – 2013)
Before 1986, Seattle and Tacoma were interviewed as separate metropolitan areas. The last year that Tacoma was interviewed separately was 1981.
The longitudinal oversample for the Tacoma metropolitan area was drawn in 1974 (PMSA = 8200) and was in place for the 1974, 1977, and 1981 surveys. The following table shows the sample sizes and percent of sample in common.
Year Sample Size Percent of Sample in Common with Prior Year 1974 4,733 (X) 1977 5,389 80.39 1981 4,863 89.00
The longitudinal oversample for the Seattle-Everett metropolitan area was drawn in 1976 and was in place for the 1976, 1979, 1983, 1987, and 1991 surveys. The following table shows the sample sizes and percent of sample in common.
Year Sample Size Percent of Sample in Common with Prior Year 1976 15,909 (X) 1979 17,656 85.86 1983 4,236 92.40 1987 3,206 71.09 1991 4,422 62.05
The second independent metropolitan area longitudinal oversample for the Seattle metropolitan area was drawn in 1996 and was in place for the 1996, 2004, 2009, and 2013 surveys. The following table shows the sample sizes and percent of sample in common.
Year Sample Size Percent of Sample in Common with Prior Year 1996 4,834 (X) 2004 4,731 86.45 2009 6,201 76.29 2013 3,939 96.11
60.3 Metropolitan Area Definition (1974, 1977, 1981) The definition of the Tacoma metropolitan area used in 1974, 1977, and 1981 AHS followed the 1973 OMB definition for the Tacoma, WA SMSA.
FIPS County Name AHS COUNTY 53053 Pierce 999
Metropolitan Area Histories 1973 to 2013 131
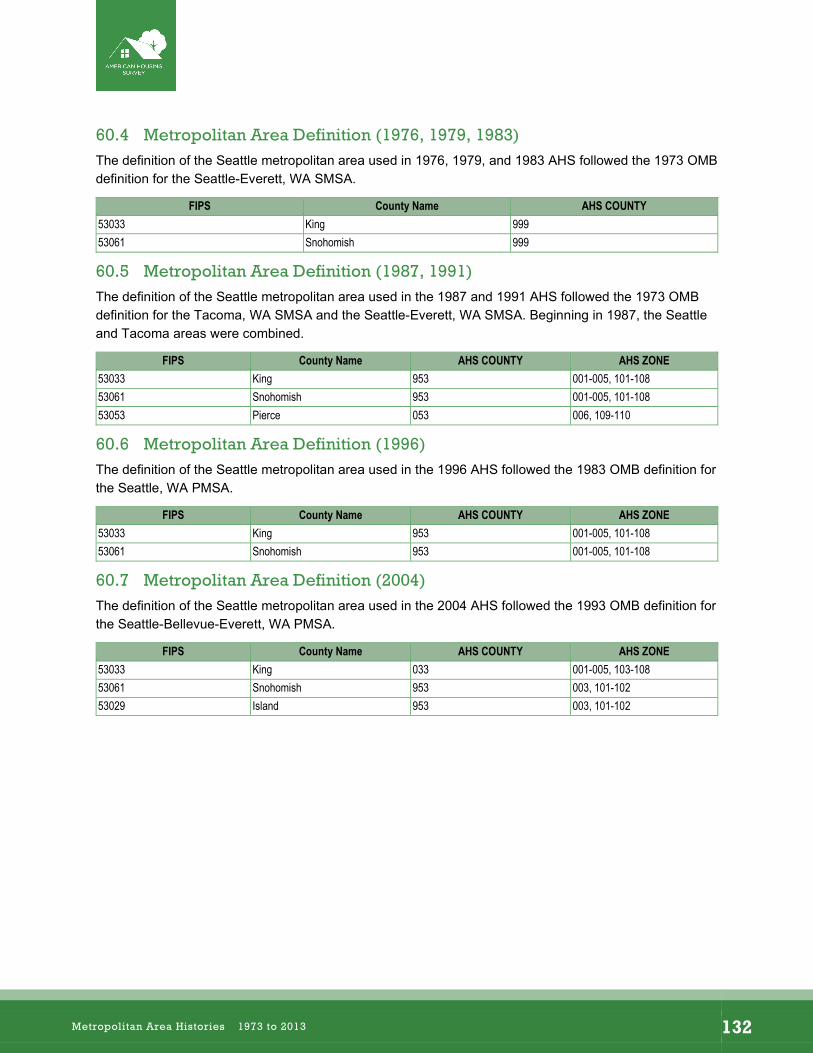
–
60.4 Metropolitan Area Definition (1976, 1979, 1983) The definition of the Seattle metropolitan area used in 1976, 1979, and 1983 AHS followed the 1973 OMB definition for the Seattle-Everett, WA SMSA.
FIPS County Name AHS COUNTY 53033 King 999 53061 Snohomish 999
60.5 Metropolitan Area Definition (1987, 1991) The definition of the Seattle metropolitan area used in the 1987 and 1991 AHS followed the 1973 OMB definition for the Tacoma, WA SMSA and the Seattle-Everett, WA SMSA. Beginning in 1987, the Seattle and Tacoma areas were combined.
FIPS County Name AHS COUNTY AHS ZONE 53033 King 953 001-005, 101-108 53061 Snohomish 953 001-005, 101-108 53053 Pierce 053 006, 109-110
60.6 Metropolitan Area Definition (1996) The definition of the Seattle metropolitan area used in the 1996 AHS followed the 1983 OMB definition for the Seattle, WA PMSA.
FIPS County Name AHS COUNTY AHS ZONE 53033 King 953 001-005, 101-108 53061 Snohomish 953 001-005, 101-108
60.7 Metropolitan Area Definition (2004) The definition of the Seattle metropolitan area used in the 2004 AHS followed the 1993 OMB definition for the Seattle-Bellevue-Everett, WA PMSA.
FIPS County Name AHS COUNTY AHS ZONE 53033 King 033 001-005, 103-108 53061 Snohomish 953 003, 101-102 53029 Island 953 003, 101-102
Metropolitan Area Histories 1973 to 2013 132
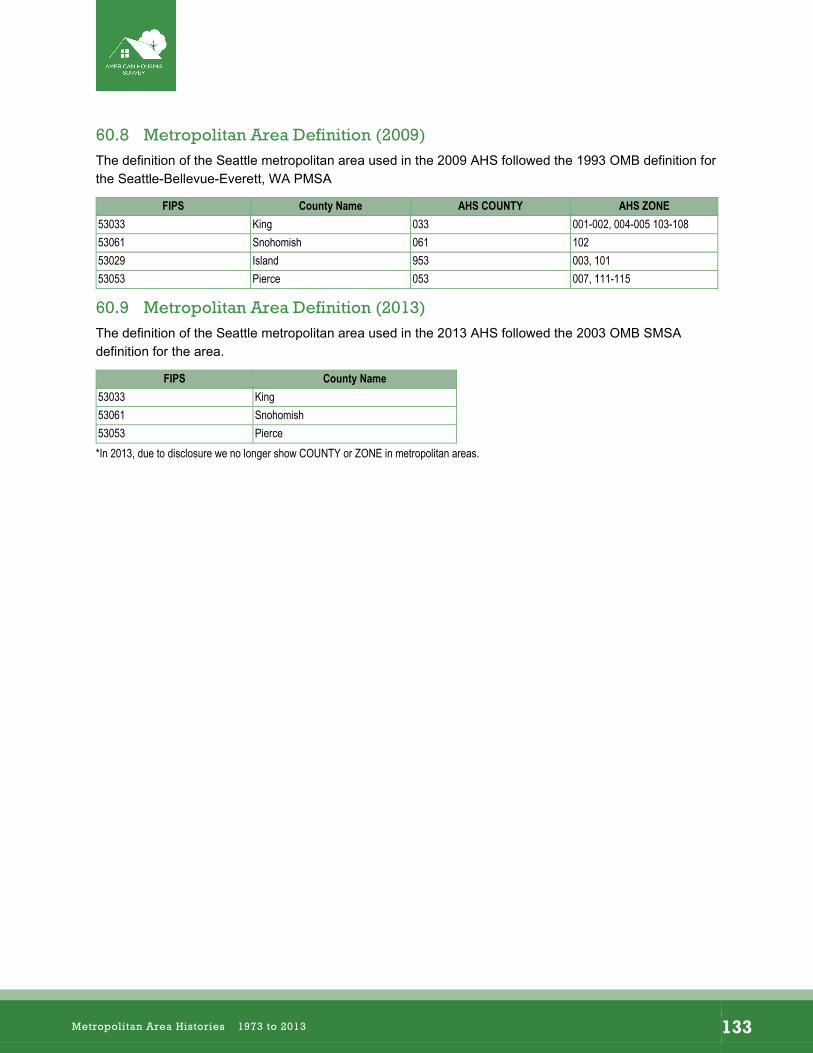
–
60.8 Metropolitan Area Definition (2009) The definition of the Seattle metropolitan area used in the 2009 AHS followed the 1993 OMB definition for the Seattle-Bellevue-Everett, WA PMSA
FIPS County Name AHS COUNTY AHS ZONE 53033 King 033 001-002, 004-005 103-108 53061 Snohomish 061 102 53029 Island 953 003, 101 53053 Pierce 053 007, 111-115
60.9 Metropolitan Area Definition (2013) The definition of the Seattle metropolitan area used in the 2013 AHS followed the 2003 OMB SMSA definition for the area.
FIPS County Name 53033 King 53061 Snohomish 53053 Pierce *In 2013, due to disclosure we no longer show COUNTY or ZONE in metropolitan areas.
Metropolitan Area Histories 1973 to 2013 133

–
61 Spokane
61.1 National Longitudinal Sample (1985 – 2013) There are records in the national longitudinal sample from 1985 through 2013 that are identified as belonging to the Spokane metropolitan area (SMSA = 7840). The Spokane metropolitan area definition used in the national longitudinal sample is the same as the 1983 OMB definition for the Spokane, WA MSA.
61.2 Independent Metropolitan Area Oversample Longitudinal History (1974 – 1981)
The first and only independent metropolitan area longitudinal oversample for the Spokane metropolitan area was drawn in 1974 and was in place for the 1974, 1977, and 1981 surveys. The following table shows the sample sizes and percent of sample in common.
Year Sample Size Percent of Sample in Common with Prior Year 1974 4,703 (X) 1977 5,213 82.43 1981 4,746 88.87
61.3 Metropolitan Area Definition (1974, 1977, 1981) The definition of the Spokane metropolitan area used in the 1974, 1977, and 1981 AHS followed the 1971 OMB definition for the Spokane, WA SMSA.
FIPS County Name AHS COUNTY 53063 Spokane 999
Metropolitan Area Histories 1973 to 2013 134
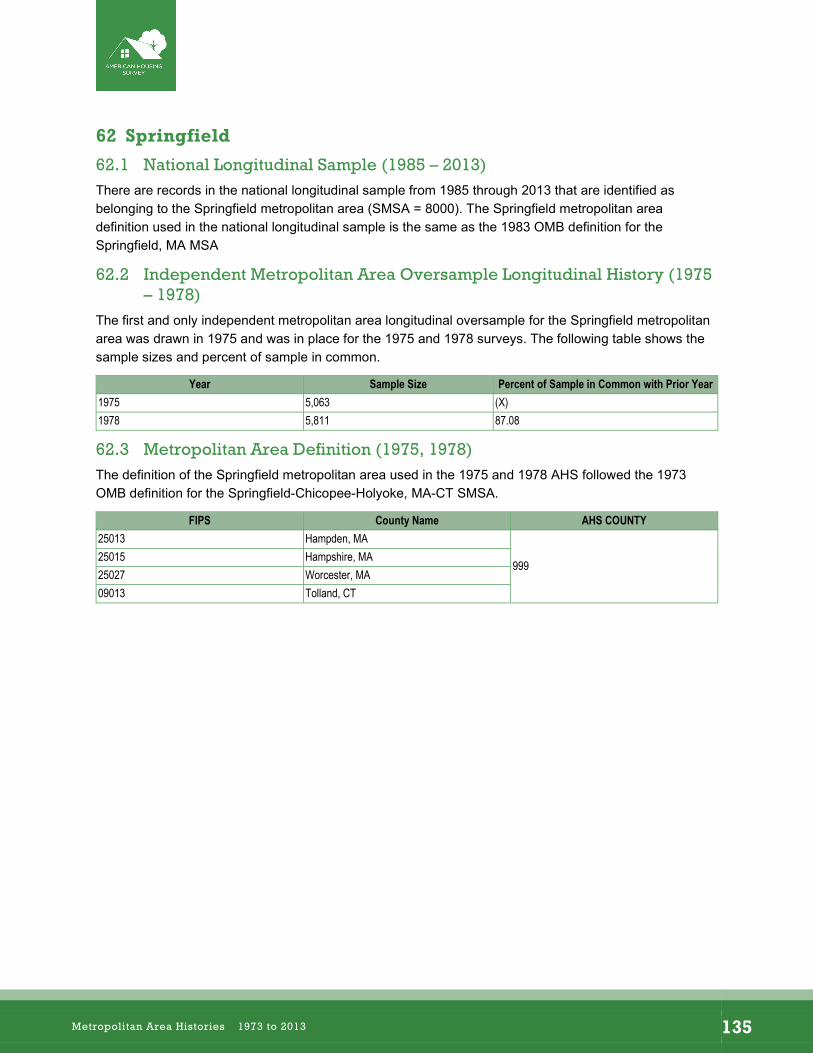
–
62 Springfield
62.1 National Longitudinal Sample (1985 – 2013) There are records in the national longitudinal sample from 1985 through 2013 that are identified as belonging to the Springfield metropolitan area (SMSA = 8000). The Springfield metropolitan area definition used in the national longitudinal sample is the same as the 1983 OMB definition for the Springfield, MA MSA
62.2 Independent Metropolitan Area Oversample Longitudinal History (1975 – 1978)
The first and only independent metropolitan area longitudinal oversample for the Springfield metropolitan area was drawn in 1975 and was in place for the 1975 and 1978 surveys. The following table shows the sample sizes and percent of sample in common.
Year Sample Size Percent of Sample in Common with Prior Year 1975 5,063 (X) 1978 5,811 87.08
62.3 Metropolitan Area Definition (1975, 1978) The definition of the Springfield metropolitan area used in the 1975 and 1978 AHS followed the 1973 OMB definition for the Springfield-Chicopee-Holyoke, MA-CT SMSA.
FIPS County Name AHS COUNTY 25013 Hampden, MA
99925015 Hampshire, MA 25027 Worcester, MA 09013 Tolland, CT
Metropolitan Area Histories 1973 to 2013 135
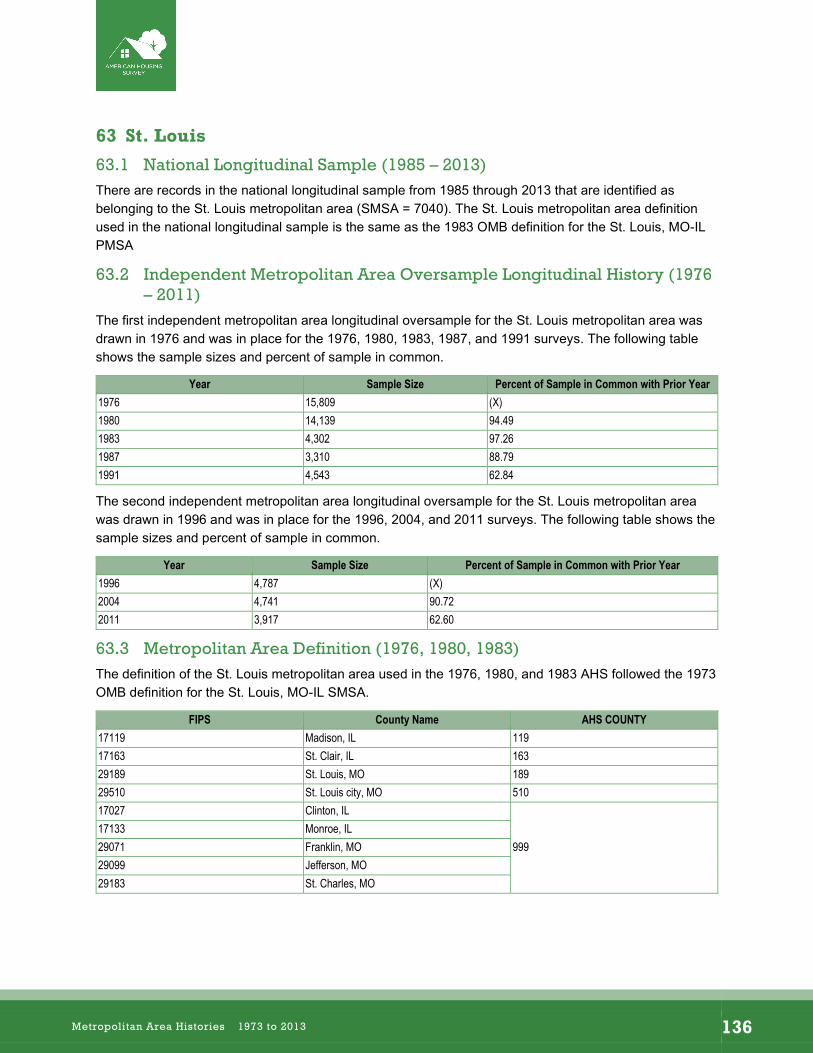
–
63 St. Louis
63.1 National Longitudinal Sample (1985 – 2013) There are records in the national longitudinal sample from 1985 through 2013 that are identified as belonging to the St. Louis metropolitan area (SMSA = 7040). The St. Louis metropolitan area definition used in the national longitudinal sample is the same as the 1983 OMB definition for the St. Louis, MO-IL PMSA
63.2 Independent Metropolitan Area Oversample Longitudinal History (1976 – 2011)
The first independent metropolitan area longitudinal oversample for the St. Louis metropolitan area was drawn in 1976 and was in place for the 1976, 1980, 1983, 1987, and 1991 surveys. The following table shows the sample sizes and percent of sample in common.
Year Sample Size Percent of Sample in Common with Prior Year 1976 15,809 (X) 1980 14,139 94.49 1983 4,302 97.26 1987 3,310 88.79 1991 4,543 62.84
The second independent metropolitan area longitudinal oversample for the St. Louis metropolitan area was drawn in 1996 and was in place for the 1996, 2004, and 2011 surveys. The following table shows the sample sizes and percent of sample in common.
Year Sample Size Percent of Sample in Common with Prior Year 1996 4,787 (X) 2004 4,741 90.72 2011 3,917 62.60
63.3 Metropolitan Area Definition (1976, 1980, 1983) The definition of the St. Louis metropolitan area used in the 1976, 1980, and 1983 AHS followed the 1973 OMB definition for the St. Louis, MO-IL SMSA.
FIPS County Name AHS COUNTY 17119 Madison, IL 119 17163 St. Clair, IL 163 29189 St. Louis, MO 189 29510 St. Louis city, MO 510 17027 Clinton, IL
999 17133 Monroe, IL 29071 Franklin, MO 29099 Jefferson, MO 29183 St. Charles, MO
Metropolitan Area Histories 1973 to 2013 136
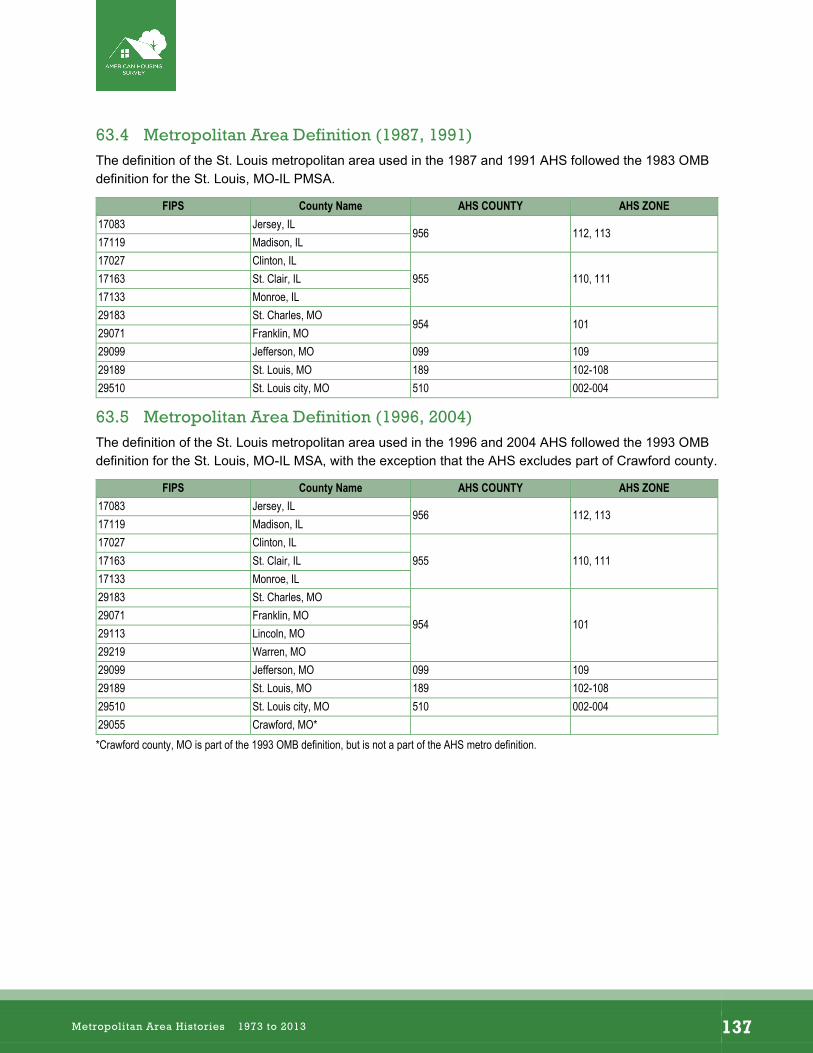
–
63.4 Metropolitan Area Definition (1987, 1991) The definition of the St. Louis metropolitan area used in the 1987 and 1991 AHS followed the 1983 OMB definition for the St. Louis, MO-IL PMSA.
FIPS County Name AHS COUNTY AHS ZONE 17083 Jersey, IL
956 112, 113 17119 Madison, IL 17027 Clinton, IL
955 110, 111 17163 St. Clair, IL 17133 Monroe, IL 29183 St. Charles, MO
954 10129071 Franklin, MO 29099 Jefferson, MO 099 109 29189 St. Louis, MO 189 102-108 29510 St. Louis city, MO 510 002-004
63.5 Metropolitan Area Definition (1996, 2004) The definition of the St. Louis metropolitan area used in the 1996 and 2004 AHS followed the 1993 OMB definition for the St. Louis, MO-IL MSA, with the exception that the AHS excludes part of Crawford county.
FIPS County Name AHS COUNTY AHS ZONE 17083 Jersey, IL
956 112, 113 17119 Madison, IL 17027 Clinton, IL
955 110, 111 17163 St. Clair, IL 17133 Monroe, IL 29183 St. Charles, MO
954 10129071 Franklin, MO 29113 Lincoln, MO 29219 Warren, MO 29099 Jefferson, MO 099 109 29189 St. Louis, MO 189 102-108 29510 St. Louis city, MO 510 002-004 29055 Crawford, MO* *Crawford county, MO is part of the 1993 OMB definition, but is not a part of the AHS metro definition.
Metropolitan Area Histories 1973 to 2013 137
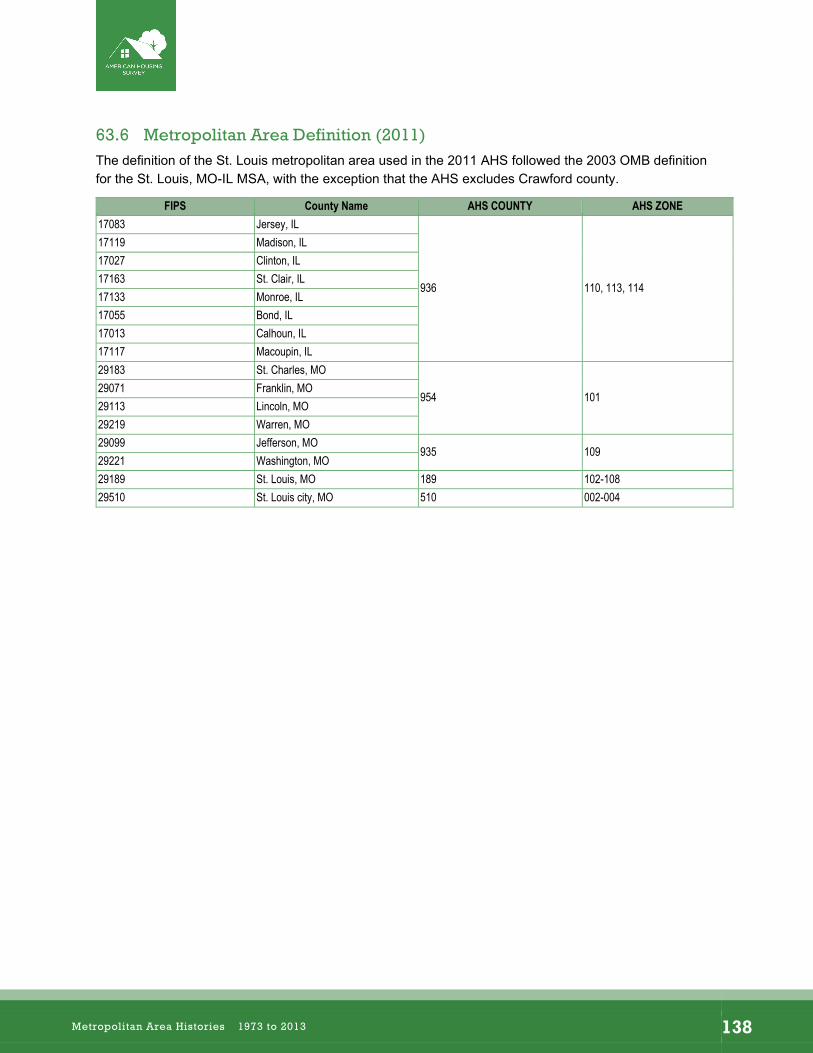
–
63.6 Metropolitan Area Definition (2011) The definition of the St. Louis metropolitan area used in the 2011 AHS followed the 2003 OMB definition for the St. Louis, MO-IL MSA, with the exception that the AHS excludes Crawford county.
FIPS County Name AHS COUNTY AHS ZONE 17083 Jersey, IL
936 110, 113, 114
17119 Madison, IL 17027 Clinton, IL 17163 St. Clair, IL 17133 Monroe, IL 17055 Bond, IL 17013 Calhoun, IL 17117 Macoupin, IL 29183 St. Charles, MO
954 10129071 Franklin, MO 29113 Lincoln, MO 29219 Warren, MO 29099 Jefferson, MO
935 10929221 Washington, MO 29189 St. Louis, MO 189 102-108 29510 St. Louis city, MO 510 002-004
Metropolitan Area Histories 1973 to 2013 138
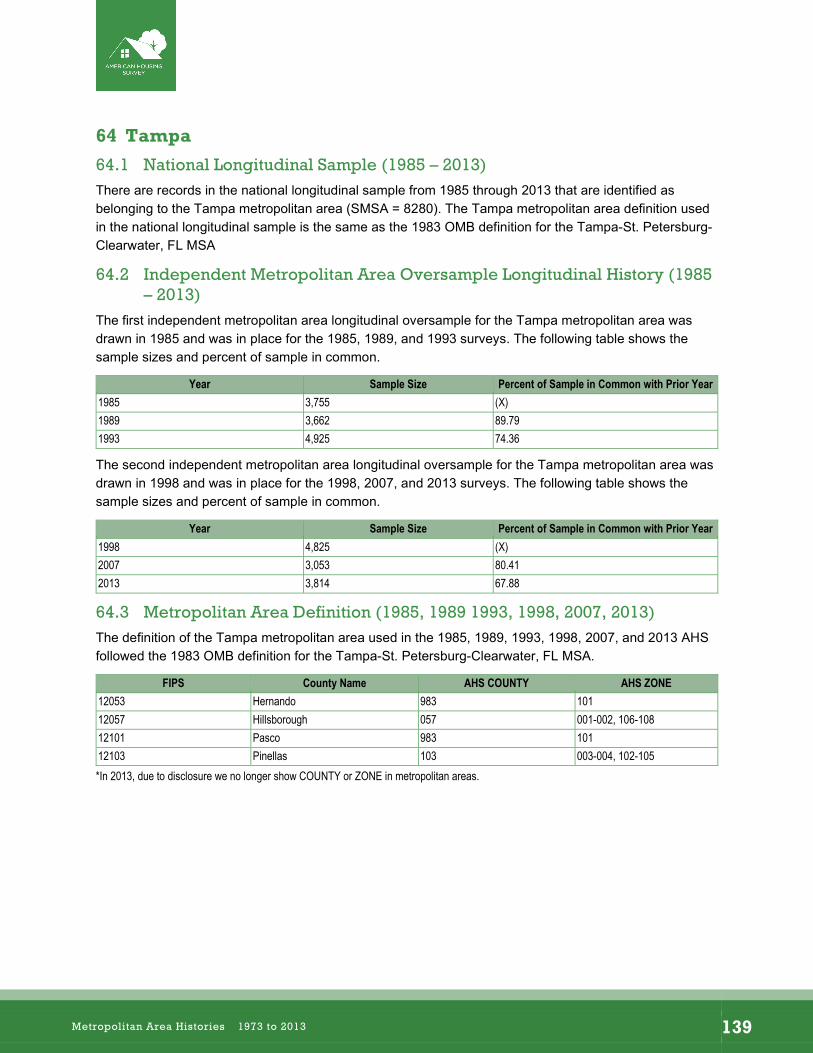
–
64 Tampa
64.1 National Longitudinal Sample (1985 – 2013) There are records in the national longitudinal sample from 1985 through 2013 that are identified as belonging to the Tampa metropolitan area (SMSA = 8280). The Tampa metropolitan area definition used in the national longitudinal sample is the same as the 1983 OMB definition for the Tampa-St. Petersburg-Clearwater, FL MSA
64.2 Independent Metropolitan Area Oversample Longitudinal History (1985 – 2013)
The first independent metropolitan area longitudinal oversample for the Tampa metropolitan area was drawn in 1985 and was in place for the 1985, 1989, and 1993 surveys. The following table shows the sample sizes and percent of sample in common.
Year Sample Size Percent of Sample in Common with Prior Year 1985 3,755 (X) 1989 3,662 89.79 1993 4,925 74.36
The second independent metropolitan area longitudinal oversample for the Tampa metropolitan area was drawn in 1998 and was in place for the 1998, 2007, and 2013 surveys. The following table shows the sample sizes and percent of sample in common.
Year Sample Size Percent of Sample in Common with Prior Year 1998 4,825 (X) 2007 3,053 80.41 2013 3,814 67.88
64.3 Metropolitan Area Definition (1985, 1989 1993, 1998, 2007, 2013) The definition of the Tampa metropolitan area used in the 1985, 1989, 1993, 1998, 2007, and 2013 AHS followed the 1983 OMB definition for the Tampa-St. Petersburg-Clearwater, FL MSA.
FIPS County Name AHS COUNTY AHS ZONE 12053 Hernando 983 101 12057 Hillsborough 057 001-002, 106-108 12101 Pasco 983 101 12103 Pinellas 103 003-004, 102-105 *In 2013, due to disclosure we no longer show COUNTY or ZONE in metropolitan areas.
Metropolitan Area Histories 1973 to 2013 139
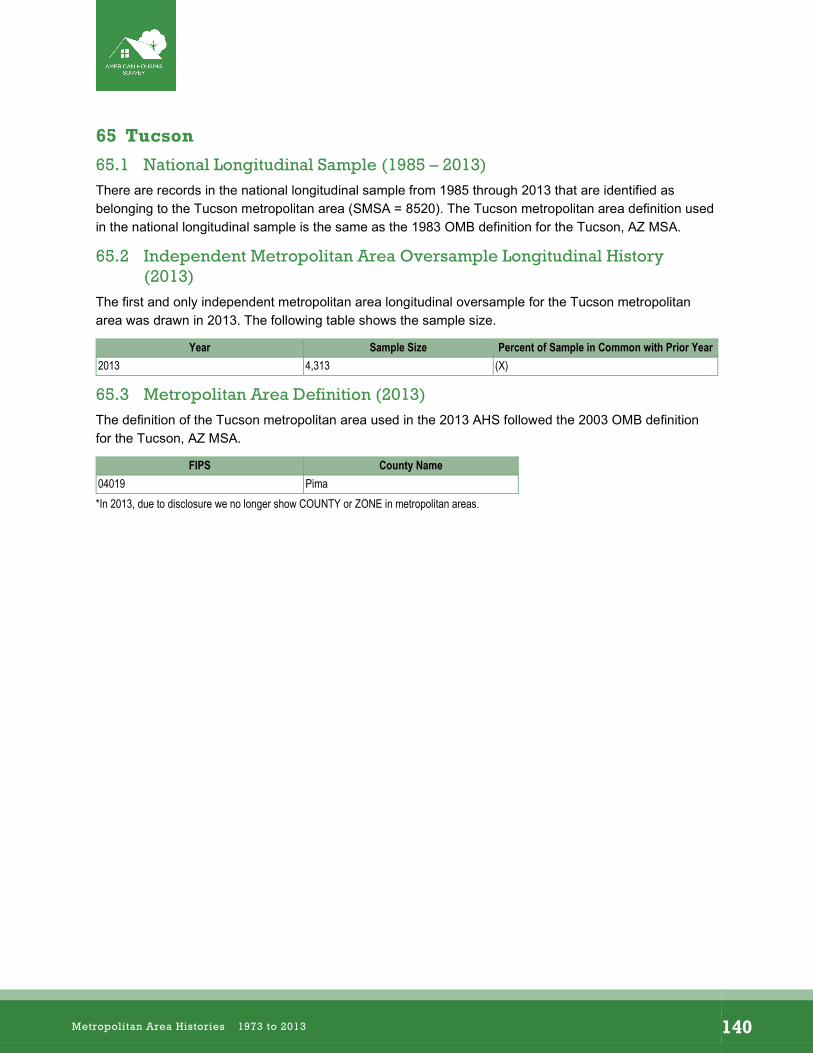
–
65 Tucson
65.1 National Longitudinal Sample (1985 – 2013) There are records in the national longitudinal sample from 1985 through 2013 that are identified as belonging to the Tucson metropolitan area (SMSA = 8520). The Tucson metropolitan area definition used in the national longitudinal sample is the same as the 1983 OMB definition for the Tucson, AZ MSA.
65.2 Independent Metropolitan Area Oversample Longitudinal History (2013)
The first and only independent metropolitan area longitudinal oversample for the Tucson metropolitan area was drawn in 2013. The following table shows the sample size.
Year Sample Size Percent of Sample in Common with Prior Year 2013 4,313 (X)
65.3 Metropolitan Area Definition (2013) The definition of the Tucson metropolitan area used in the 2013 AHS followed the 2003 OMB definition for the Tucson, AZ MSA.
FIPS County Name 04019 Pima *In 2013, due to disclosure we no longer show COUNTY or ZONE in metropolitan areas.
Metropolitan Area Histories 1973 to 2013 140
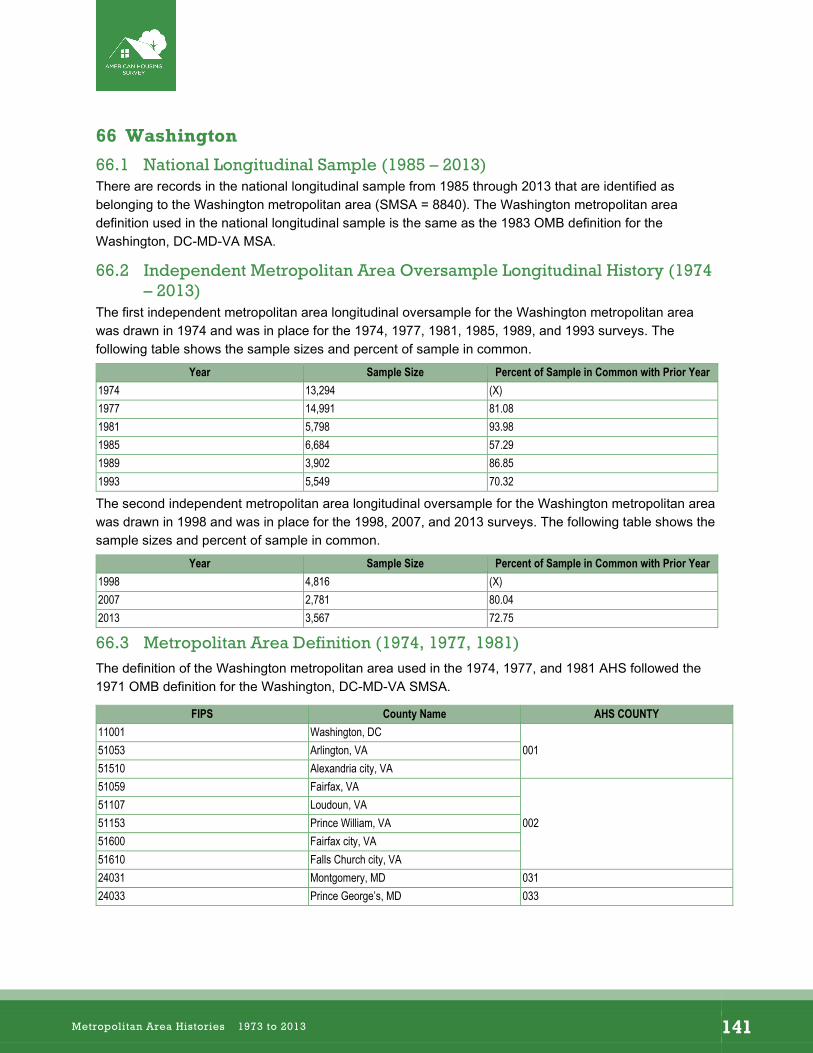
–
66 Washington
66.1 National Longitudinal Sample (1985 – 2013) There are records in the national longitudinal sample from 1985 through 2013 that are identified as belonging to the Washington metropolitan area (SMSA = 8840). The Washington metropolitan area definition used in the national longitudinal sample is the same as the 1983 OMB definition for the Washington, DC-MD-VA MSA.
66.2 Independent Metropolitan Area Oversample Longitudinal History (1974 – 2013)
The first independent metropolitan area longitudinal oversample for the Washington metropolitan area was drawn in 1974 and was in place for the 1974, 1977, 1981, 1985, 1989, and 1993 surveys. The following table shows the sample sizes and percent of sample in common.
Year Sample Size Percent of Sample in Common with Prior Year 1974 13,294 (X) 1977 14,991 81.08 1981 5,798 93.98 1985 6,684 57.29 1989 3,902 86.85 1993 5,549 70.32
The second independent metropolitan area longitudinal oversample for the Washington metropolitan area was drawn in 1998 and was in place for the 1998, 2007, and 2013 surveys. The following table shows the sample sizes and percent of sample in common.
Year Sample Size Percent of Sample in Common with Prior Year 1998 4,816 (X) 2007 2,781 80.04 2013 3,567 72.75
66.3 Metropolitan Area Definition (1974, 1977, 1981) The definition of the Washington metropolitan area used in the 1974, 1977, and 1981 AHS followed the 1971 OMB definition for the Washington, DC-MD-VA SMSA.
FIPS County Name AHS COUNTY 11001 Washington, DC
00151053 Arlington, VA 51510 Alexandria city, VA 51059 Fairfax, VA
002 51107 Loudoun, VA 51153 Prince William, VA 51600 Fairfax city, VA 51610 Falls Church city, VA 24031 Montgomery, MD 031 24033 Prince George’s, MD 033
Metropolitan Area Histories 1973 to 2013 141
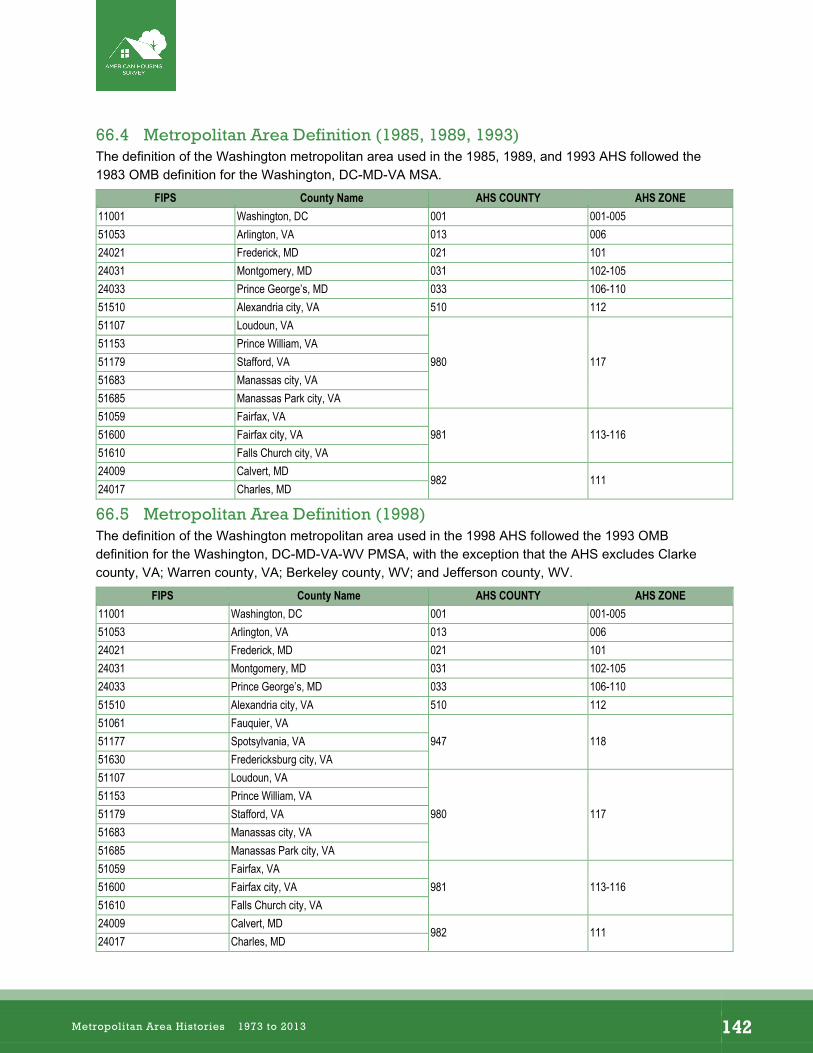
–
66.4 Metropolitan Area Definition (1985, 1989, 1993) The definition of the Washington metropolitan area used in the 1985, 1989, and 1993 AHS followed the 1983 OMB definition for the Washington, DC-MD-VA MSA.
FIPS County Name AHS COUNTY AHS ZONE 11001 Washington, DC 001 001-005 51053 Arlington, VA 013 006 24021 Frederick, MD 021 101 24031 Montgomery, MD 031 102-105 24033 Prince George’s, MD 033 106-110 51510 Alexandria city, VA 510 112 51107 Loudoun, VA
980 117 51153 Prince William, VA 51179 Stafford, VA 51683 Manassas city, VA 51685 Manassas Park city, VA 51059 Fairfax, VA
981 113-116 51600 Fairfax city, VA 51610 Falls Church city, VA 24009 Calvert, MD
982 11124017 Charles, MD
66.5 Metropolitan Area Definition (1998) The definition of the Washington metropolitan area used in the 1998 AHS followed the 1993 OMB definition for the Washington, DC-MD-VA-WV PMSA, with the exception that the AHS excludes Clarke county, VA; Warren county, VA; Berkeley county, WV; and Jefferson county, WV.
FIPS County Name AHS COUNTY AHS ZONE 11001 Washington, DC 001 001-005 51053 Arlington, VA 013 006 24021 Frederick, MD 021 101 24031 Montgomery, MD 031 102-105 24033 Prince George’s, MD 033 106-110 51510 Alexandria city, VA 510 112 51061 Fauquier, VA
947 11851177 Spotsylvania, VA 51630 Fredericksburg city, VA 51107 Loudoun, VA
980 117 51153 Prince William, VA 51179 Stafford, VA 51683 Manassas city, VA 51685 Manassas Park city, VA 51059 Fairfax, VA
981 113-116 51600 Fairfax city, VA 51610 Falls Church city, VA 24009 Calvert, MD
982 11124017 Charles, MD
Metropolitan Area Histories 1973 to 2013 142
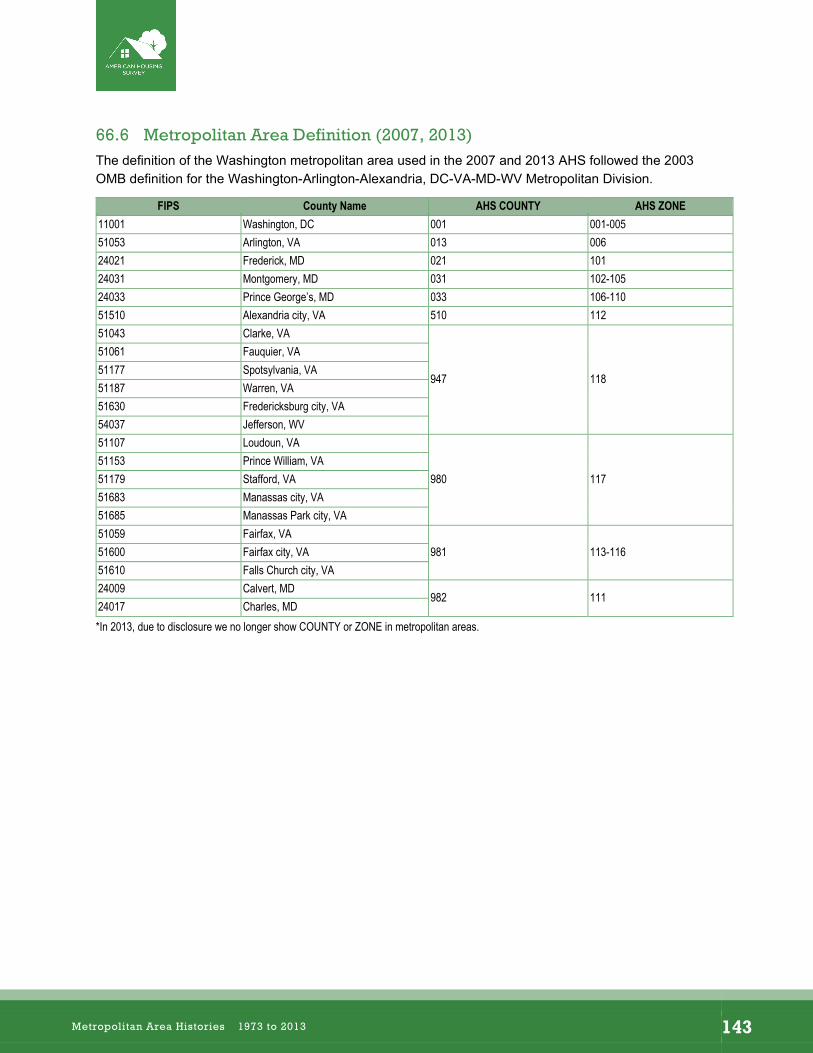
–
66.6 Metropolitan Area Definition (2007, 2013) The definition of the Washington metropolitan area used in the 2007 and 2013 AHS followed the 2003 OMB definition for the Washington-Arlington-Alexandria, DC-VA-MD-WV Metropolitan Division.
FIPS County Name AHS COUNTY AHS ZONE 11001 Washington, DC 001 001-005 51053 Arlington, VA 013 006 24021 Frederick, MD 021 101 24031 Montgomery, MD 031 102-105 24033 Prince George’s, MD 033 106-110 51510 Alexandria city, VA 510 112 51043 Clarke, VA
947 118
51061 Fauquier, VA 51177 Spotsylvania, VA 51187 Warren, VA 51630 Fredericksburg city, VA 54037 Jefferson, WV 51107 Loudoun, VA
980 117 51153 Prince William, VA 51179 Stafford, VA 51683 Manassas city, VA 51685 Manassas Park city, VA 51059 Fairfax, VA
981 113-116 51600 Fairfax city, VA 51610 Falls Church city, VA 24009 Calvert, MD
982 11124017 Charles, MD *In 2013, due to disclosure we no longer show COUNTY or ZONE in metropolitan areas.
Metropolitan Area Histories 1973 to 2013 143
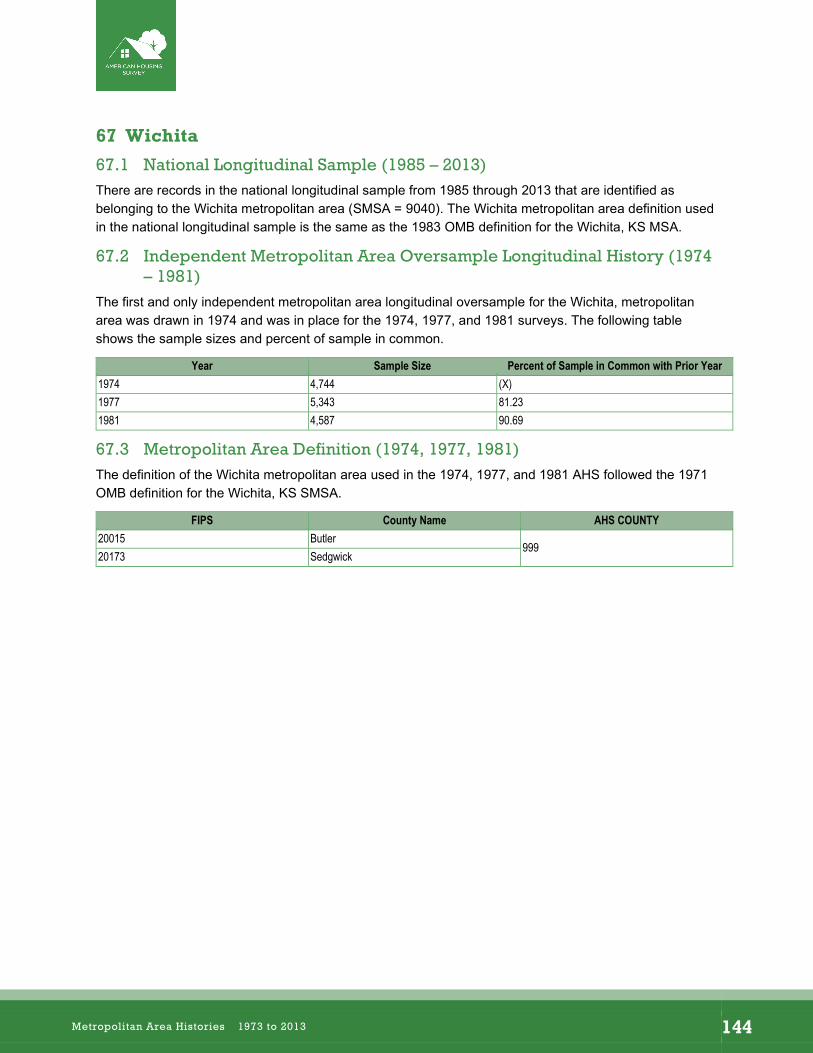
–
67 Wichita
67.1 National Longitudinal Sample (1985 – 2013) There are records in the national longitudinal sample from 1985 through 2013 that are identified as belonging to the Wichita metropolitan area (SMSA = 9040). The Wichita metropolitan area definition used in the national longitudinal sample is the same as the 1983 OMB definition for the Wichita, KS MSA.
67.2 Independent Metropolitan Area Oversample Longitudinal History (1974 – 1981)
The first and only independent metropolitan area longitudinal oversample for the Wichita, metropolitan area was drawn in 1974 and was in place for the 1974, 1977, and 1981 surveys. The following table shows the sample sizes and percent of sample in common.
Year Sample Size Percent of Sample in Common with Prior Year 1974 4,744 (X) 1977 5,343 81.23 1981 4,587 90.69
67.3 Metropolitan Area Definition (1974, 1977, 1981) The definition of the Wichita metropolitan area used in the 1974, 1977, and 1981 AHS followed the 1971 OMB definition for the Wichita, KS SMSA.
FIPS County Name AHS COUNTY 20015 Butler
99920173 Sedgwick
Metropolitan Area Histories 1973 to 2013 144
U.S. Department of Housing and Urban Development
Office of Policy Development and Research
Washington, DC 20410-6000
June 2019
Related Documents