INVESTORS PRESENTATION as of 31.03.2015

Ameriabank: IR Presentation Q1 2015
Aug 18, 2015
Welcome message from author
This document is posted to help you gain knowledge. Please leave a comment to let me know what you think about it! Share it to your friends and learn new things together.
Transcript
INVESTORS PRESENTATION
as of 31.03.2015
2
Ameria Group at a Glance
Armenia Macro Indicators
Armenian Banking sector indicators
Ameriabank Balance Sheet
Ameriabank Income statement
Ratios and StatementsAnnex 1: Ameriabank statements and Peers
Annex 1: Ameriabank statements and Peers
3
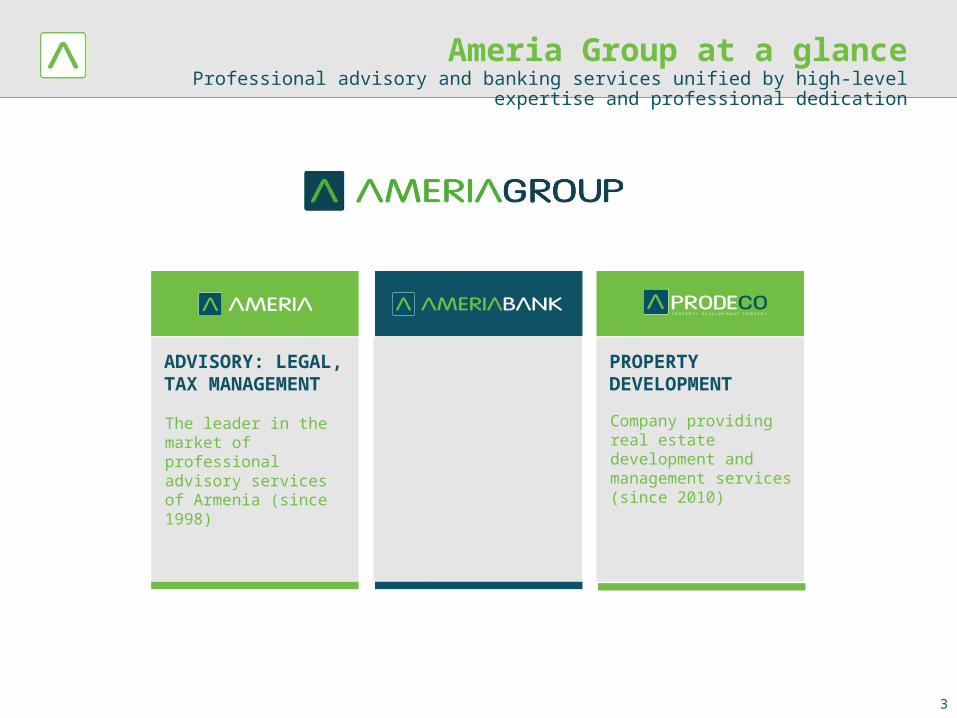
Ameria Group at a glanceProfessional advisory and banking services unified by high-level expertise and
professional dedication
CORPORATE, RETAIL AND INVESTMENT BANKINGUniversal bank with integrated corporate, retail and investment banking services (founded in 1910 as a branch of Caucasian Trade Bank)
ADVISORY: LEGAL, TAX MANAGEMENTThe leader in the market of professional advisory services of Armenia (since 1998)
PROPERTY DEVELOPMENT
Company providing real estate development and management services (since 2010)
Trust and satisfaction of our clients
Creating unique corporate culture and development model of an international company, uniting the efforts of SUCCESSFUL PEOPLE
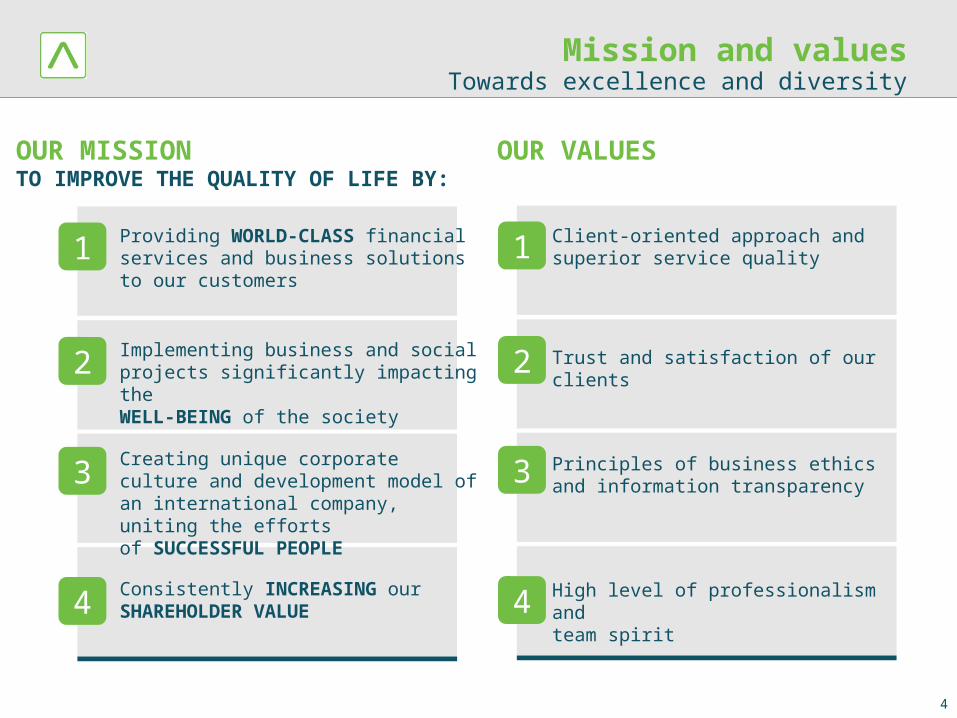
Mission and valuesTowards excellence and diversity
OUR MISSION TO IMPROVE THE QUALITY OF LIFE BY:
OUR VALUES
Providing WORLD-CLASS financial services and business solutions to our customers
Implementing business and social projects significantly impacting theWELL-BEING of the society
Consistently INCREASING our SHAREHOLDER VALUE
1
2
3
4
Client-oriented approach and superior service quality
Principles of business ethics and information transparency
High level of professionalism and team spirit
1
2
3
4
4

Our partners and DirectorsNames talk for themselves
ANDREW MKRTCHYAN
19 years of experience in investment and management advisory by standing at the roots of investment banking establishment in Armenia, board member in a number of private/public organizations.
Chairman of the Board (CEO, Ameria Group)
RUBEN VARDANIAN
Prominent investment banker with more than 21 years of experience, key figure in Russia’s capital markets establishment, a Founding Partner of Moscow School of Management SKOLKOVO , board member at numerous entities in Russia and abroad, member of the Economic Advisory Board at the IFC, the private-sector arm of the World Bank Group.
Board Member (Chairman of the
Board, IDEA Foundation)
NOUBAR AFEYAN
PhD Board Member (MP/CEO, Flagship
Ventures)
More than 25 years of experience in venture capital management (co-founder of more than 24 life science /high-tech startups) and lecturing at MIT, serves on a number of public and private company boards.
ROBERT VON REKOWSKYIndependent Board
Member (VP, Emerging Mkt Strategy, Fidelity
Investments)
26 years of experience in global asset management and portfolio management experience, board member in a number of private/public organizations.
GOR NAKHAPETYAN
More than 20 years of experience in managing one of the largest investment companies of Russia, member of the Supervisory board of Multimedia Art Museum.
Board Member (Dean's Advisor, Moscow School
of Management SKOLKOVO)
5
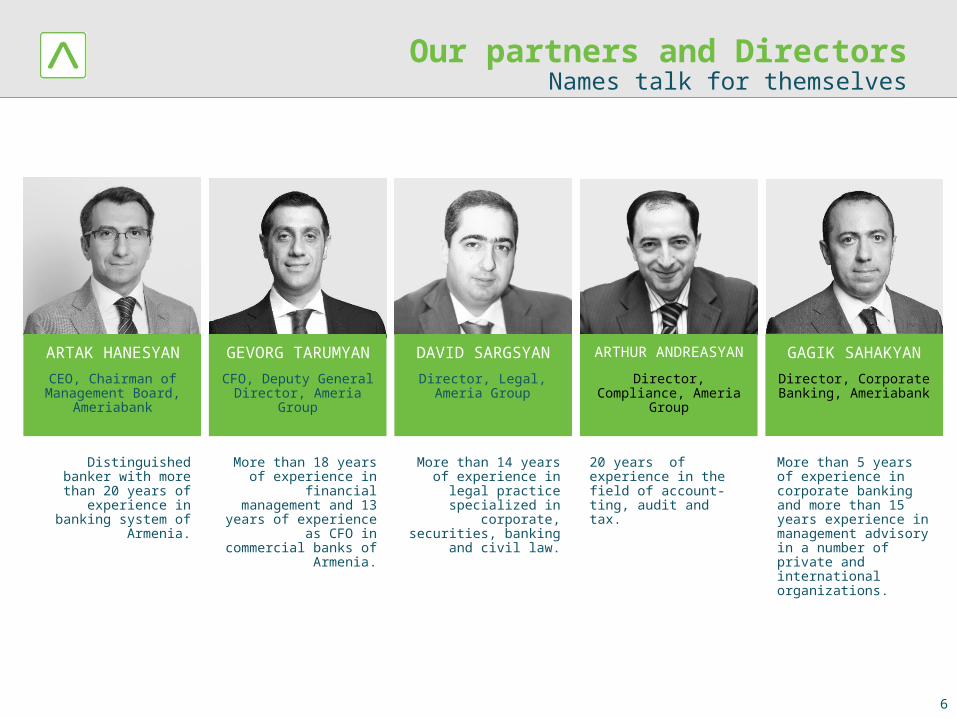
Our partners and Directors
ARTAK HANESYAN
Distinguished banker with more than 20
years of experience in banking system of
Armenia.
CEO, Chairman of Management Board,
Ameriabank
GEVORG TARUMYAN
CFO, Deputy General Director, Ameria Group
DAVID SARGSYAN
Director, Legal, Ameria Group
More than 18 years of experience in financial
management and 13 years of experience as
CFO in commercial banks of Armenia.
More than 14 years of experience in legal
practice specialized in corporate, securities, banking and civil law.
Names talk for themselves
ARTHUR ANDREASYAN
20 years of experience in the field of account-ting, audit and tax.
Director, Compliance, Ameria Group
GAGIK SAHAKYAN
More than 5 years of experience in corporate banking and more than 15 years experience in management advisory in a number of private and international organizations.
Director, Corporate Banking, Ameriabank
6
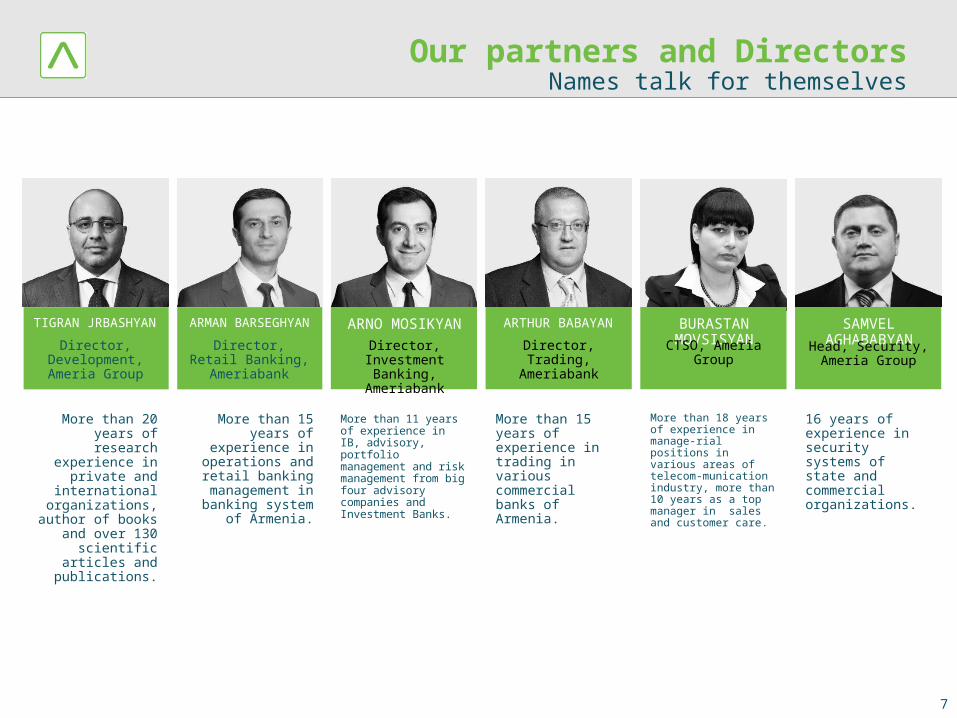
Our partners and Directors
TIGRAN JRBASHYAN
Director, Development, Ameria Group
ARMAN BARSEGHYAN
Director, Retail Banking,
Ameriabank
More than 20 years of research
experience in private and
international organizations,
author of books and over 130
scientific articles and publications.
More than 15 years of
experience in operations and
retail banking management in
banking system of Armenia.
Names talk for themselves
ARNO MOSIKYAN
More than 11 years of experience in IB, advisory, portfolio management and risk management from big four advisory companies and Investment Banks.
Director, Investment
Banking, Ameriabank
ARTHUR BABAYAN
More than 15 years of experience in trading in various commercial banks of Armenia.
Director, Trading, Ameriabank
BURASTAN MOVSISYANCTSO, Ameria
Group
SAMVEL AGHABABYANHead, Security, Ameria Group
More than 18 years of experience in manage-rial positions in various areas of telecom-munication industry, more than 10 years as a top manager in sales and customer care.
16 years of experience in security systems of state and commercial organizations.
7
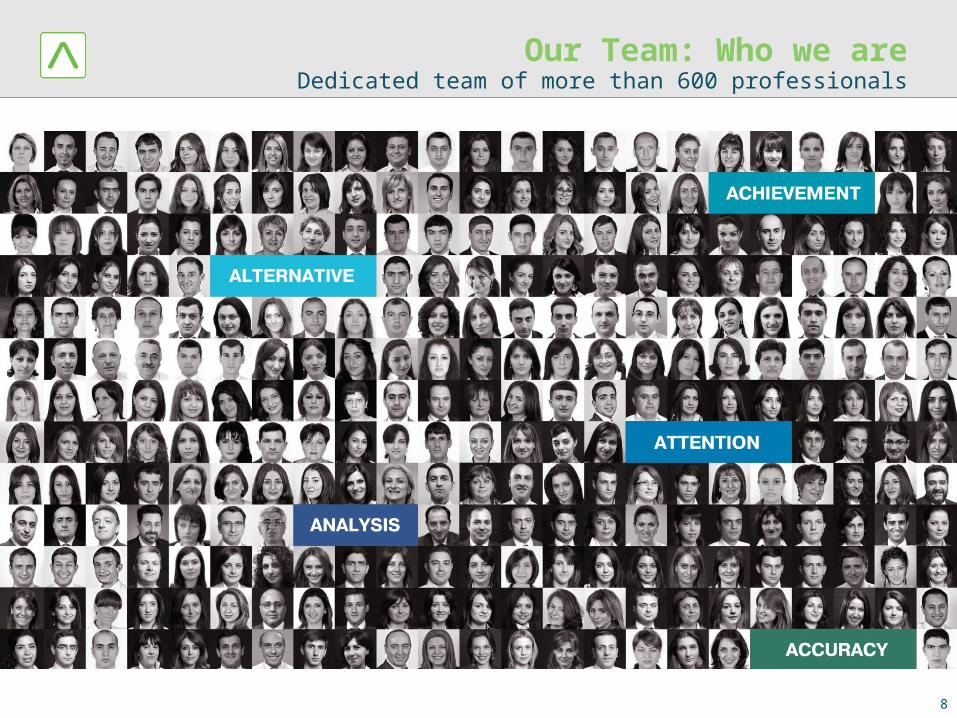
Our Team: Who we areDedicated team of more than 600 professionals
8
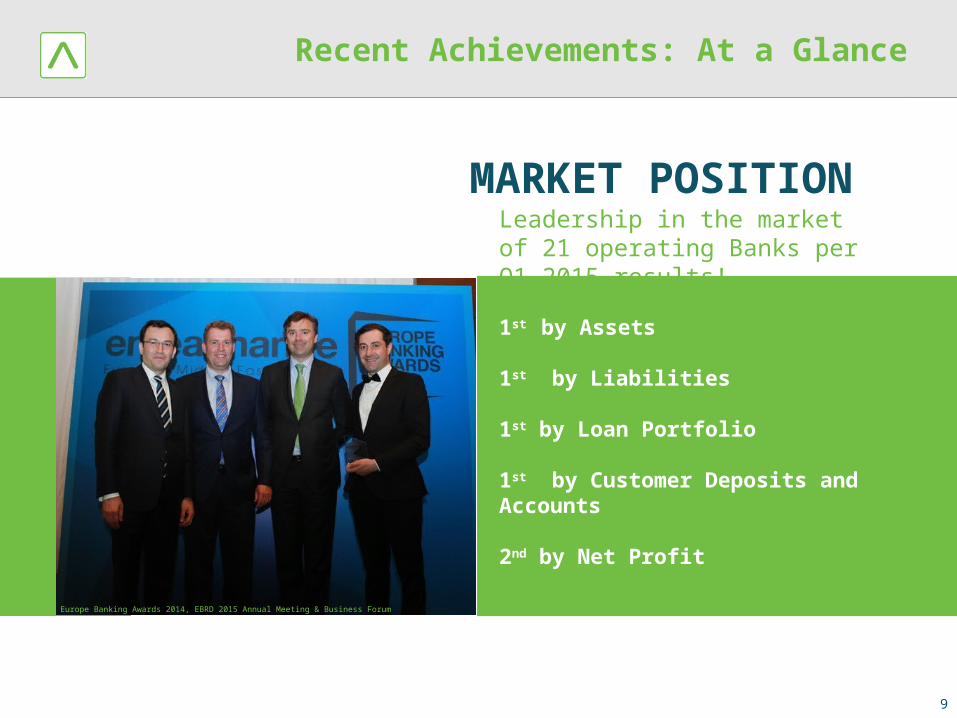
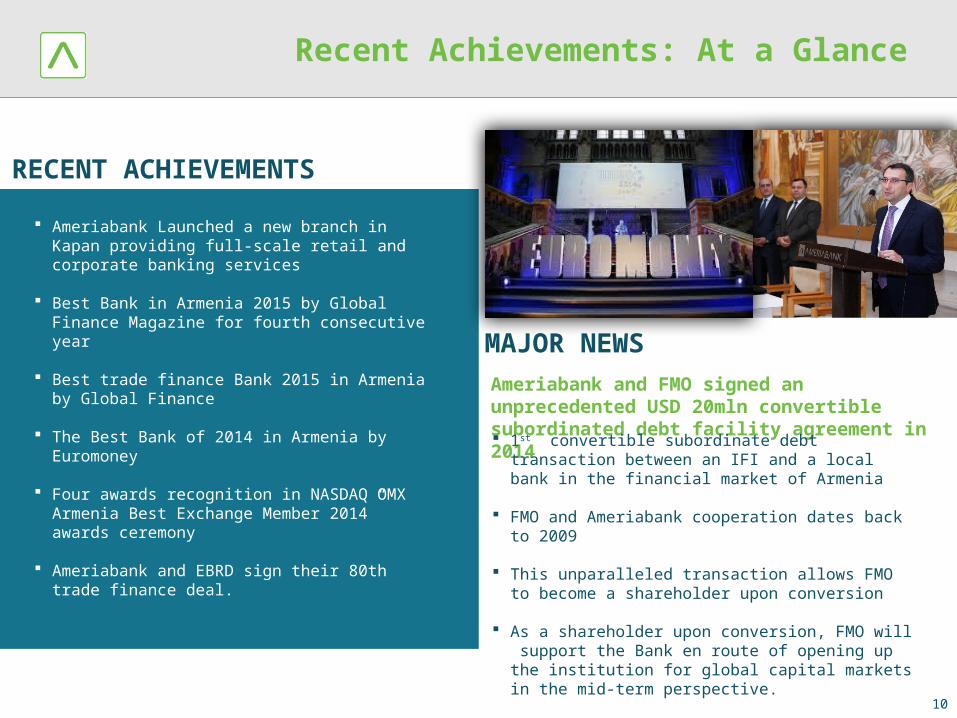
Recent Achievements: At a Glance
MARKET POSITIONLeadership in the market of 21 operating Banks per Q1 2015 results!
1st by Assets
1st by Liabilities
1st by Loan Portfolio
1st by Customer Deposits and Accounts
2nd by Net Profit
9
Europe Banking Awards 2014, EBRD 2015 Annual Meeting & Business Forum
Recent Achievements: At a Glance
RECENT ACHIEVEMENTS
Ameriabank Launched a new branch in Kapan providing full-scale retail and corporate banking services
Best Bank in Armenia 2015 by Global Finance Magazine for fourth consecutive year
Best trade finance Bank 2015 in Armenia by Global Finance
The Best Bank of 2014 in Armenia by Euromoney
Four awards recognition in NASDAQ OMX Armenia Best Exchange Member 2014” awards ceremony
Ameriabank and EBRD sign their 80th trade finance deal.
MAJOR NEWSAmeriabank and FMO signed an unprecedented USD 20mln convertible subordinated debt facility agreement in 2014 1st convertible subordinate debt transaction
between an IFI and a local bank in the financial market of Armenia
FMO and Ameriabank cooperation dates back to 2009
This unparalleled transaction allows FMO to become a shareholder upon conversion
As a shareholder upon conversion, FMO will support the Bank en route of opening up the institution for global capital markets in the mid-term perspective.
10
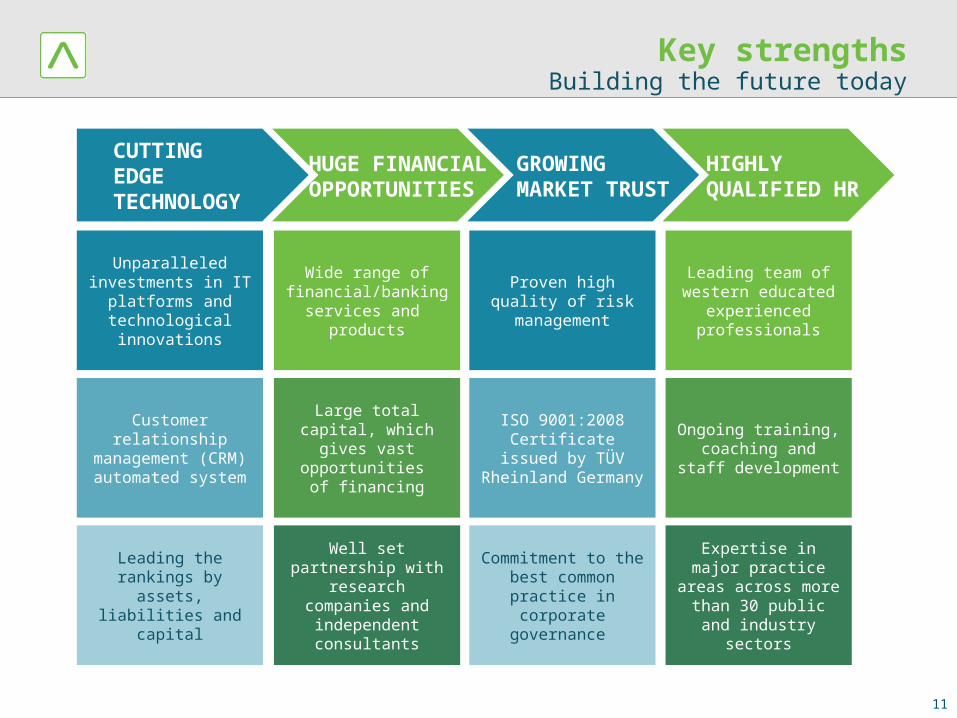
Key strengthsBuilding the future today
CUTTING EDGE TECHNOLOGY
Wide range of financial/banking
services and products
Leading the rankings by assets,
liabilities and capital
ISO 9001:2008 Certificate issued by
TÜV Rheinland Germany
Leading team of western educated
experienced professionals
Well set partnership with research
companies and independent consultants
Expertise in major practice areas
across more than 30 public and industry
sectors
Customer relationship
management (CRM) automated system
Large total capital, which gives vast
opportunities of financing
Ongoing training, coaching and staff
development
Unparalleledinvestments in IT
platforms and technological innovations
Commitment to the best common
practice in corporate governance
Proven high quality of risk management
HUGE FINANCIAL OPPORTUNITIES
GROWING MARKET TRUST
HIGHLY QUALIFIED HR
11
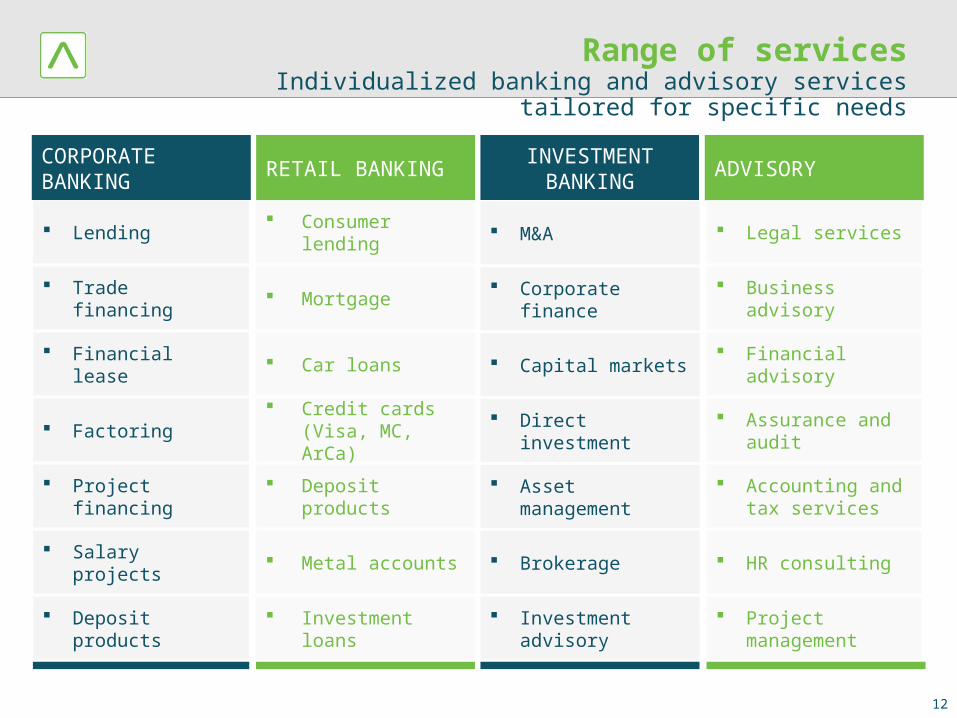
Range of servicesIndividualized banking and advisory services tailored for
specific needs
CORPORATE BANKING
RETAIL BANKING
Lending
Trade financing
Financial lease
Factoring
Project financing
Salary projects
Deposit products
Consumer lending
Mortgage
Car loans
Credit cards (Visa, MC, ArCa)
Deposit products
Metal accounts
Investment loans
INVESTMENT BANKING
ADVISORY
M&A
Corporate finance
Capital markets
Direct investment
Asset management
Brokerage
Investment advisory
Legal services
Business advisory
Financial advisory
Assurance and audit
Accounting and tax services
HR consulting
Project management
12
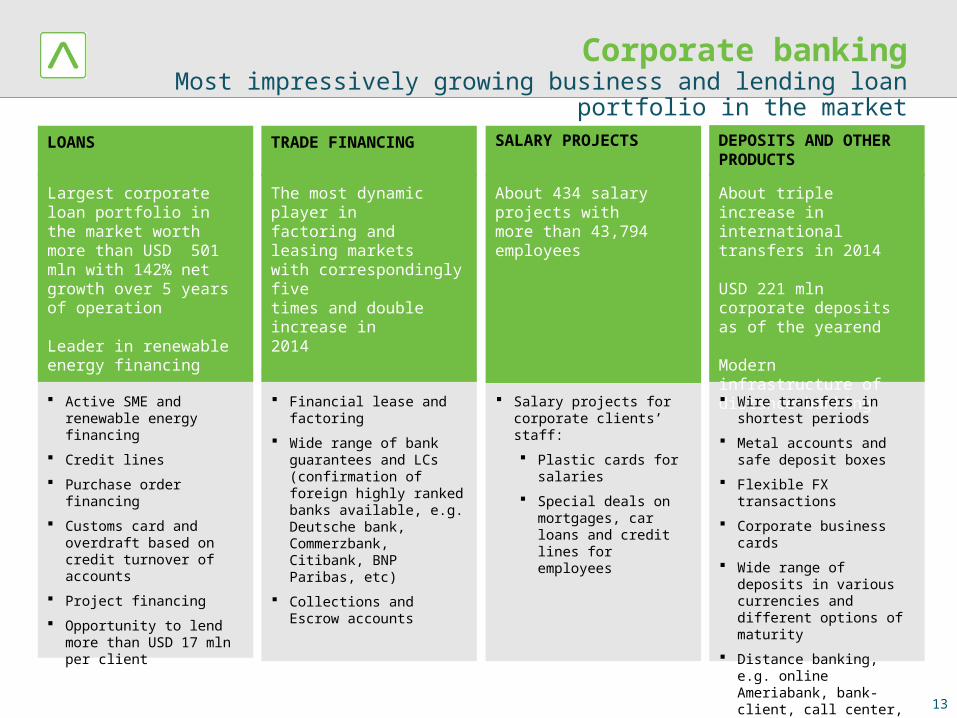
Corporate bankingMost impressively growing business and lending loan
portfolio in the marketLOANS
Largest corporate loan portfolio in the market worth more than USD 501 mln with 142% net growth over 5 years of operation
Leader in renewable energy financing
Active SME and renewable energy financing
Credit lines
Purchase order financing
Customs card and overdraft based on credit turnover of accounts
Project financing
Opportunity to lend more than USD 17 mln per client
TRADE FINANCING SALARY PROJECTS DEPOSITS AND OTHER PRODUCTS
The most dynamic player infactoring and leasing marketswith correspondingly fivetimes and double increase in2014
Financial lease and factoring
Wide range of bank guarantees and LCs (confirmation of foreign highly ranked banks available, e.g. Deutsche bank, Commerzbank, Citibank, BNP Paribas, etc)
Collections and Escrow accounts
About 434 salary projects withmore than 43,794 employees
Salary projects for corporate clients’ staff:
Plastic cards for ��salaries
Special deals on mortgages, car loans and credit lines for employees
About triple increase ininternational transfers in 2014
USD 221 mln corporate depositsas of the yearend
Modern infrastructure ofdistance banking
��Wire transfers in shortest periods
Metal accounts and safe ��deposit boxes
Flexible FX transactions�� Corporate business cards�� Wide range of deposits in
various currencies and different options of maturity
Distance banking, e.g. online Ameriabank, bank-client, call center, etc.
13
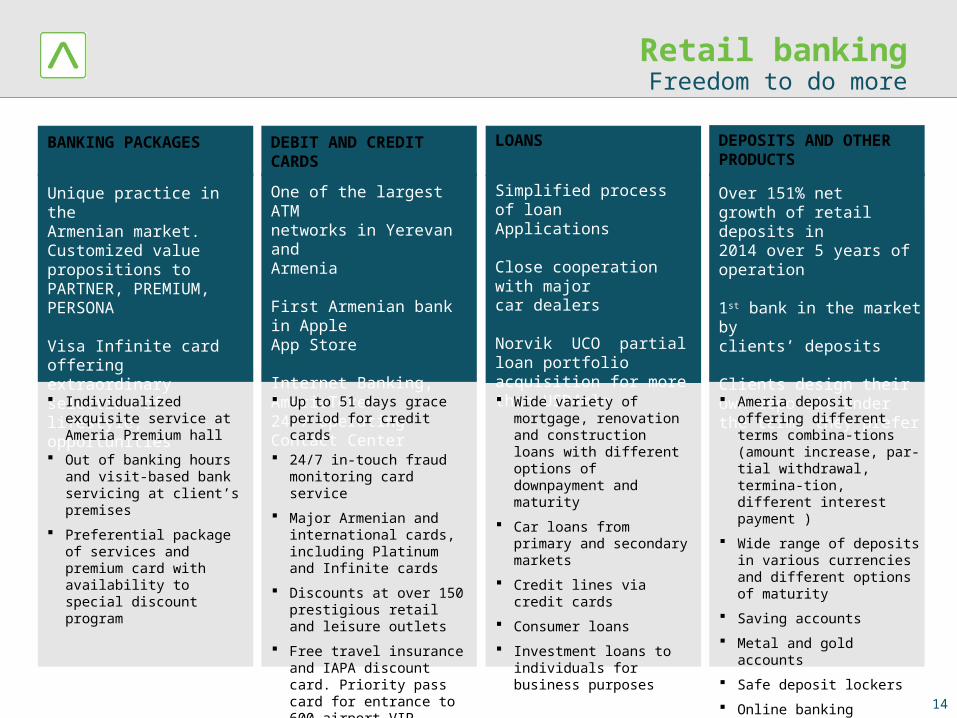
Retail bankingFreedom to do more
BANKING PACKAGES
Unique practice in theArmenian market.Customized value propositions to PARTNER, PREMIUM, PERSONA
Visa Infinite card offeringextraordinary selection oflifestyle, opportunities Individualized exquisite
service at Ameria Premium hall
Out of banking hours and visit-based bank servicing at client’s premises
Preferential package of ��services and premium card with availability to special discount program
DEBIT AND CREDIT CARDS
LOANS DEPOSITS AND OTHER PRODUCTS
One of the largest ATMnetworks in Yerevan andArmenia
First Armenian bank in AppleApp Store
Internet Banking, AmeriaToken24/7 operating Contact Center Up to 51 days grace
period for credit cards
24/7 in-touch fraud monitoring card service
Major Armenian and international cards, including Platinum and Infinite cards ��
Discounts at over 150 prestigious retail and leisure outlets
Free travel insurance and IAPA discount card. Priority pass card for entrance to 600 airport VIP lounges
Simplified process of loanApplications
Close cooperation with majorcar dealers
Norvik UCO partial loan portfolio acquisition for more than USD4mln Wide variety of
mortgage, renovation and construction loans with different options of downpayment and maturity
Car loans from primary and secondary markets
Credit lines via credit cards
Consumer loans
Investment loans to ��individuals for business purposes
Over 151% netgrowth of retail deposits in 2014 over 5 years of operation
1st bank in the market byclients’ deposits
Clients design their own depo-sit under the terms they prefer Ameria deposit offering
different terms combina-tions (amount increase, par-tial withdrawal, termina-tion, different interest payment )
Wide range of deposits in various currencies and different options of maturity
Saving accounts
Metal and gold accounts
Safe deposit lockers
Online banking�� Express transfer system
14
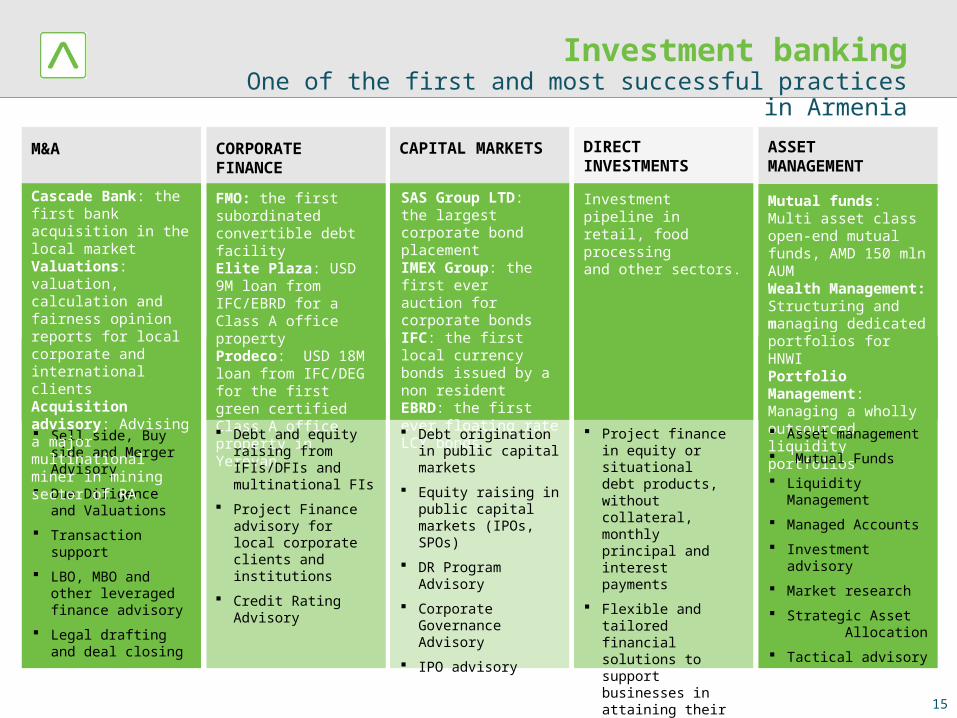
Investment bankingOne of the first and most successful practices in Armenia
M&A
Sell side, Buy side and Merger Advisory
Due Diligence and Valuations
Transaction support�� LBO, MBO and
other leveraged finance advisory
Legal drafting and ��deal closing
Cascade Bank: the first bank acquisition in the local marketValuations: valuation, calculation and fairness opinion reports for local corporate and international clientsAcquisition advisory: Advising a major multinational miner in mining sector of RA
CORPORATE FINANCE
FMO: the first subordinated convertible debt facilityElite Plaza: USD 9M loan from IFC/EBRD for a Class A office property Prodeco: USD 18M loan from IFC/DEG for the first green certified Class A office property in Yerevan Debt and equity
raising from IFIs/DFIs and multinational FIs
Project Finance advisory for local corporate clients and institutions
Credit Rating Advisory
CAPITAL MARKETS
SAS Group LTD: the largest corporate bond placement IMEX Group: the first ever auction for corporate bondsIFC: the first local currency bonds issued by a non resident EBRD: the first ever floating rate LCY bonds
Debt origination in public capital markets
Equity raising in public capital markets (IPOs, SPOs)
DR Program Advisory
Corporate Governance Advisory
IPO advisory
DIRECT INVESTMENTS
Investment pipeline inretail, food processingand other sectors.
Project finance in equity or situational debt products, without collateral, monthly principal and interest payments
Flexible and ��tailored financial solutions to support businesses in attaining their financial or strategic objectives
ASSET MANAGEMENT
Mutual funds: Multi asset class open-end mutual funds, AMD 150 mln AUM Wealth Management: Structuring and managing dedicated portfolios for HNWIPortfolio Management: Managing a wholly outsourced liquidity portfolios Asset management
Mutual Funds
Liquidity Management
Managed Accounts
Investment ����advisory
Market research
Strategic Asset Allocation
Tactical advisory
15
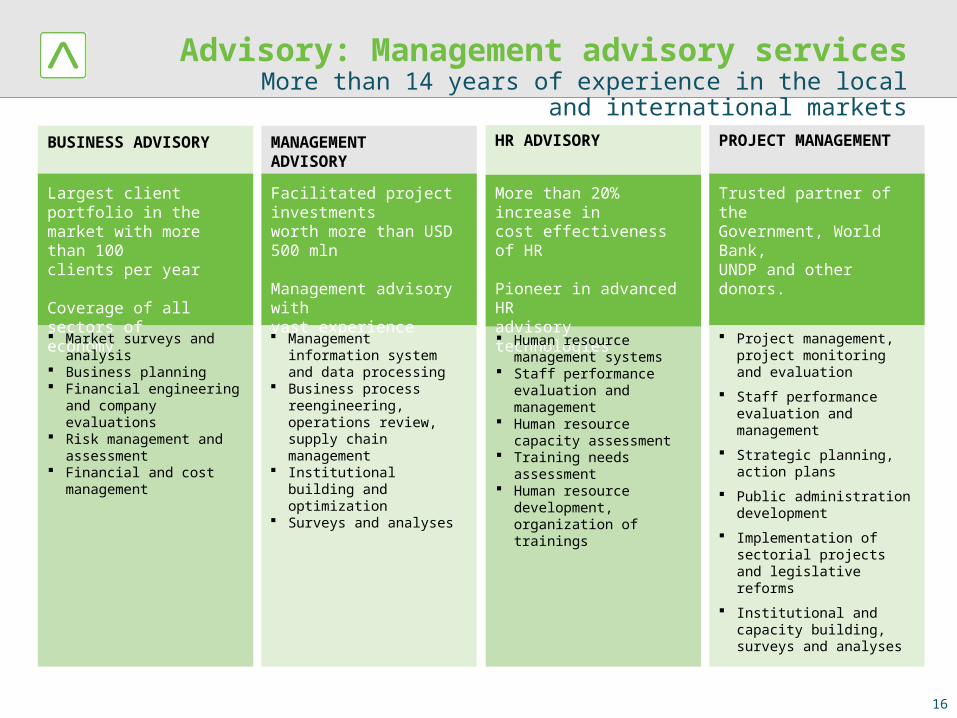
Advisory: Management advisory servicesMore than 14 years of experience in the local and
international marketsBUSINESS ADVISORY
Largest client portfolio in themarket with more than 100clients per year
Coverage of all sectors ofeconomy
MANAGEMENT ADVISORY
HR ADVISORY PROJECT MANAGEMENT
Facilitated project investmentsworth more than USD 500 mln
Management advisory withvast experience
More than 20% increase incost effectiveness of HR
Pioneer in advanced HRadvisory technologies
Trusted partner of theGovernment, World Bank,UNDP and other donors.
Market surveys and analysis
Business planning Financial engineering ��
and company evaluations
Risk management and ��assessment
Financial and cost management
Management information system and data processing
Business process ��reengineering, operations review, supply chain management
Institutional building and ��optimization
Surveys and analyses��
Human resource management systems
Staff performance ��evaluation and management
Human resource capacity assessment
Training needs ��assessment
Human resource ��development, organization of trainings
Project management, ��project monitoring and evaluation
Staff performance evaluation and management
Strategic planning, ��action plans
Public administration development
Implementation of ��sectorial projects and legislative reforms
Institutional and capacity ��building, surveys and analyses
16
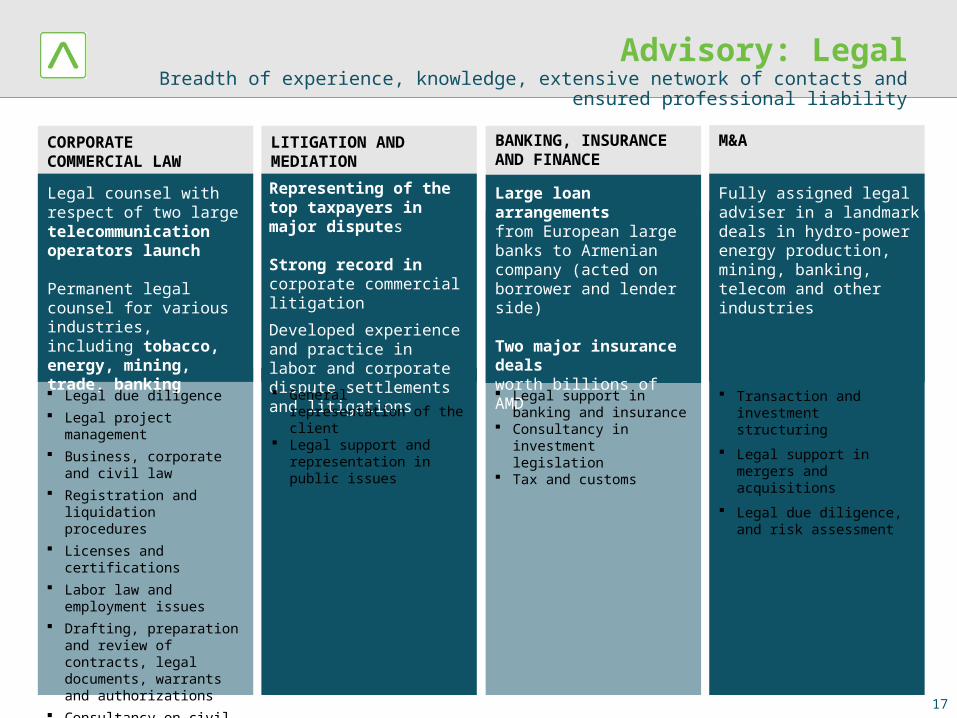
Advisory: LegalBreadth of experience, knowledge, extensive network of contacts and ensured
professional liability
CORPORATE COMMERCIAL LAW
Legal counsel with respect of two large telecommunication operators launch
Permanent legal counsel for variousindustries, including tobacco, energy, mining, trade, banking
LITIGATION AND MEDIATION
BANKING, INSURANCE AND FINANCE
M&A
Representing of the top taxpayers in major disputes
Strong record incorporate commercial litigation
Developed experience and practice in labor and corporate dispute settlements and litigations
Large loan arrangementsfrom European large banks to Armenian company (acted on borrower and lender side)
Two major insurance dealsworth billions of AMD
Fully assigned legal adviser in a landmark deals in hydro-power energy production, mining, banking, telecom and other industries
Legal due diligence Legal project ��
management Business, corporate and ��
civil law Registration and ��
liquidation procedures Licenses and ��
certifications Labor law and ��
employment issues Drafting, preparation and ��
review of contracts, legal documents, warrants and authorizations
Consultancy on civil, ��corporate and international law
Transaction and ����investment structuring
Legal support in mergers and acquisitions
Legal due diligence, and ��risk assessment
General representation of the client
Legal support and representation in public issues
Legal support in banking and insurance
Consultancy in investment legislation
Tax and customs
17
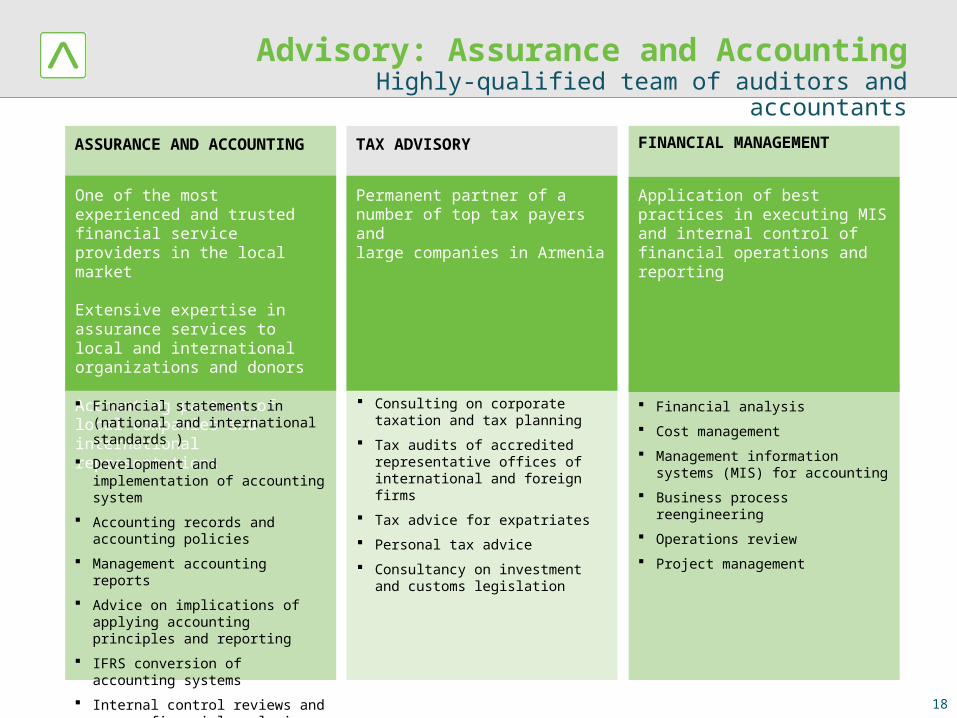
Advisory: Assurance and AccountingHighly-qualified team of auditors and accountants
ASSURANCE AND ACCOUNTING
One of the most experienced and trusted financial service providers in the local market
Extensive expertise in assurance services to local and international organizations and donors
Accounting partner of local companies and international representations
TAX ADVISORY FINANCIAL MANAGEMENT
Permanent partner of anumber of top tax payers andlarge companies in Armenia
Application of best practices in executing MIS and internal control of financial operations and reporting
Financial statements in (national and international standards )
Development and implementation of accounting system
Accounting records and accounting policies
Management accounting reports
Advice on implications of applying accounting principles and reporting
IFRS conversion of accounting systems
Internal control reviews and financial analysis
Consulting on corporate taxation and tax planning
Tax audits of accredited ��representative offices of international and foreign firms
Tax advice for expatriates
Personal tax advice�� Consultancy on investment and
customs legislation
Financial analysis
Cost management
Management information systems (MIS) for accounting
Business process reengineering
Operations review
Project management
18
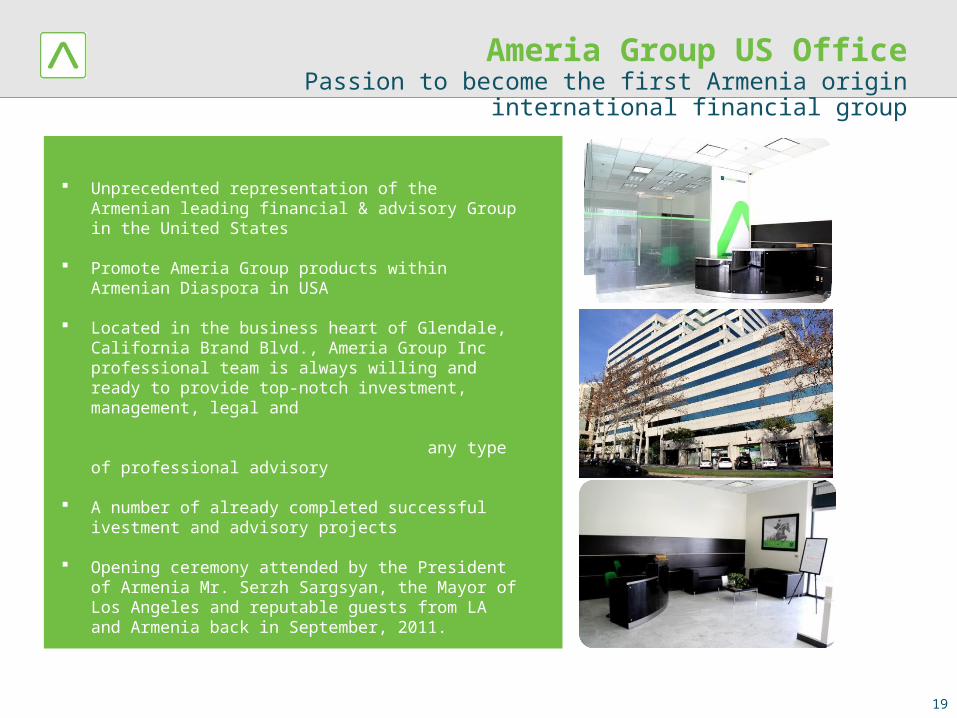
Ameria Group US OfficePassion to become the first Armenia origin international
financial group
Unprecedented representation of the Armenian leading financial & advisory Group in the United States
Promote Ameria Group products within Armenian Diaspora in USA
Located in the business heart of Glendale, California Brand Blvd., Ameria Group Inc professional team is always willing and ready to provide top-notch investment, management, legal and any type of professional advisory
A number of already completed successful ivestment and advisory projects
Opening ceremony attended by the President of Armenia Mr. Serzh Sargsyan, the Mayor of Los ��Angeles and reputable guests from LA and Armenia back in September, 2011.
19
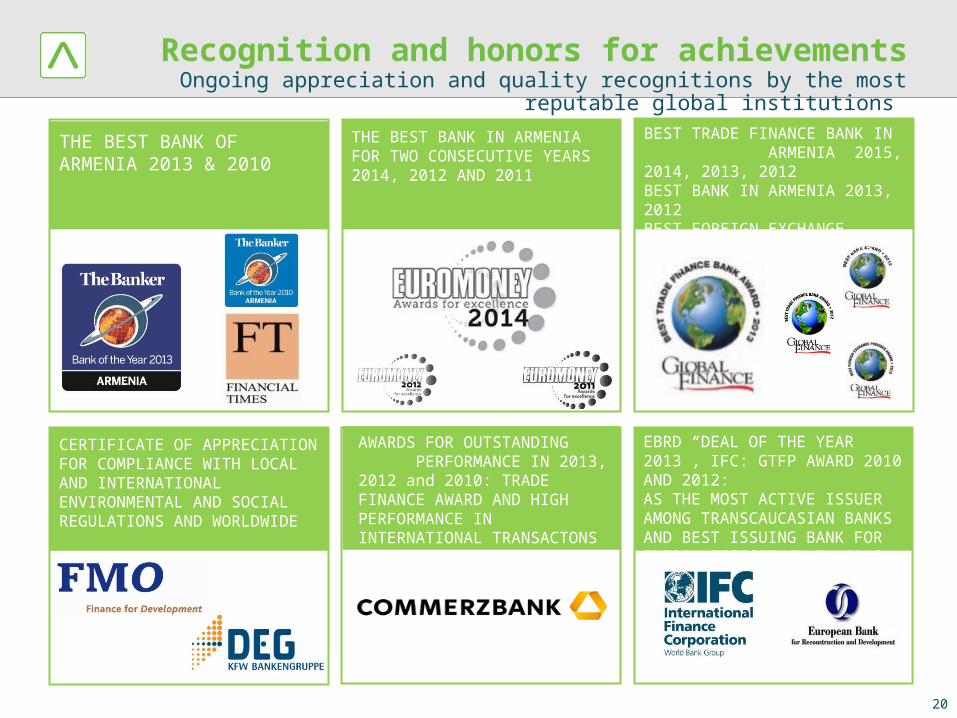
Recognition and honors for achievementsOngoing appreciation and quality recognitions by the most reputable
global institutions
THE BEST BANK OF ARMENIA 2013 & 2010
THE BEST BANK IN ARMENIA FOR TWO CONSECUTIVE YEARS 2014, 2012 AND 2011
BEST TRADE FINANCE BANK IN ARMENIA 2015, 2014, 2013, 2012BEST BANK IN ARMENIA 2013, 2012BEST FOREIGN EXCHANGE PROVIDER IN ARMENIA 2013, 2012
CERTIFICATE OF APPRECIATIONFOR COMPLIANCE WITH LOCAL AND INTERNATIONAL ENVIRONMENTAL AND SOCIAL REGULATIONS AND WORLDWIDE
AWARDS FOR OUTSTANDING PERFORMANCE IN 2013, 2012 and 2010: TRADE FINANCE AWARD AND HIGH PERFORMANCE IN INTERNATIONAL TRANSACTONS AWARD
EBRD “DEAL OF THE YEAR 2013”, IFC: GTFP AWARD 2010 AND 2012:AS THE MOST ACTIVE ISSUER AMONG TRANSCAUCASIAN BANKS AND BEST ISSUING BANK FOR ENERGY EFFICIENCY IN 2012
20
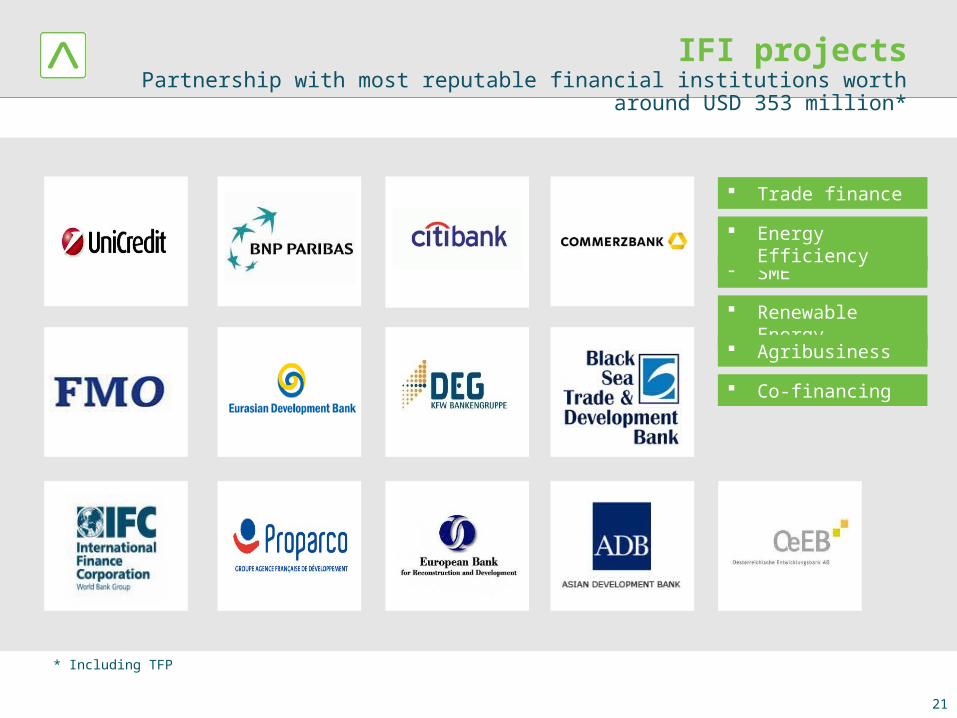
IFI projectsPartnership with most reputable financial institutions worth around USD
353 million*
SME
Co-financing
Trade finance
Renewable Energy
Energy Efficiency
Agribusiness
* Including TFP
21

CSR ProjectsStrong foundation of integrity, trust and ethical behavior in all businesses and
towards all stakeholders
5th Christmas charity auction aimed at treatment of children with life-threatening diseases. Acquiring of cutting edge medical technology for children medical treatment at “Sourb Astvatsamayr ” Medical Centre.
encouraging healthy lifestyle through Ameria tennis cup, biking tournaments and parking lots for bikers, tree planting events.
preservation of Armenian historical cultural heritage, concert sponsorships for world known singers as Joe Cocker, George Benson, Al Jarreau, Nino Katamadze, Jetro Tull etc.
scholarships to gifted children with exceptional academic performance to study at international UWC Dilijan School.
collaboration since 2010 aimed at funding various immensely crucial projects in Nagorno Karabakh.
Children Healthcare
Healthy Lifestyle & Environment
Art, & Cultural Heritage All-Armenia Fund
Education
22
23
Ameria Group at a Glance
Armenia Macro Indicators
Armenian Banking sector indicators
Ameriabank Balance Sheet
Ameriabank Income statement
Ratios and Statements
Annex 1: Ameriabank statements and Peers
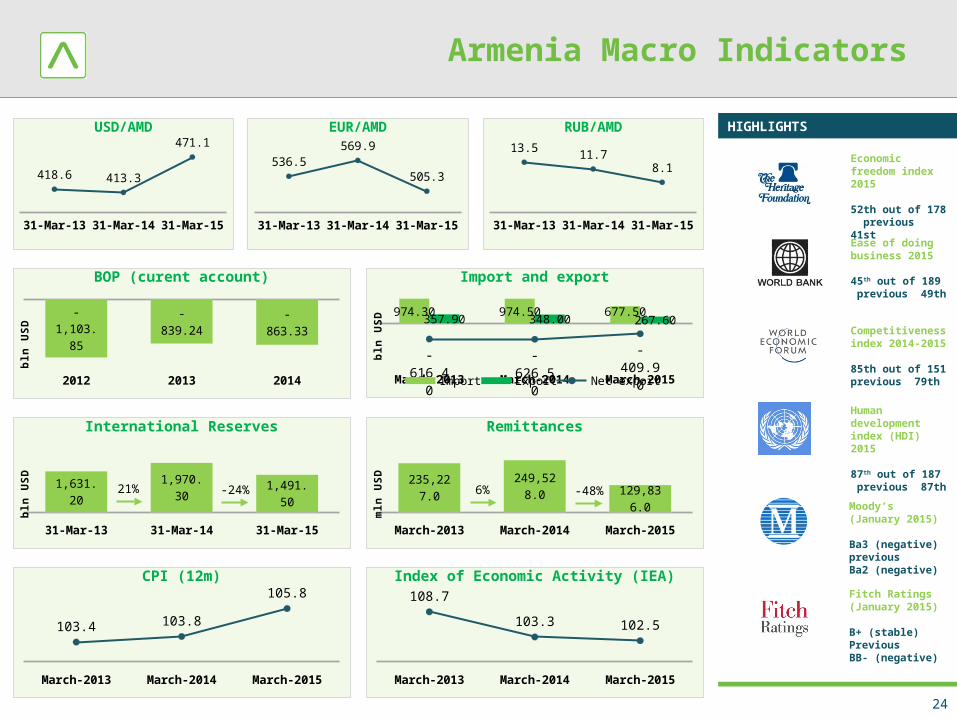
Armenia Macro Indicators
24
HIGHLIGHTS
Economic freedom index 2015
52th out of 178 previous 41st
Ease of doing business 2015
45th out of 189 previous 49th
Competitiveness index 2014-2015
85th out of 151 previous 79th
Human development index (HDI) 2015
87th out of 187 previous 87th
Moody’s (January 2015)
Ba3 (negative) previousBa2 (negative)
Fitch Ratings (January 2015)
B+ (stable) PreviousBB- (negative)
31-Mar-13 31-Mar-14 31-Mar-15
418.6 413.3
471.1USD/AMD
2012 2013 2014
-1,103.85
-839.24 -863.33
bln
USD
BOP (curent account)
March-2013 March-2014 March-2015
974.30 974.50 677.50357.90 348.00 267.60
-616.40 -626.50 -409.90
Import Export Net exportbl
n U
SD
Import and export
31-Mar-13 31-Mar-14 31-Mar-15
536.5569.9
505.3
EUR/AMD
31-Mar-13 31-Mar-14 31-Mar-15
13.5 11.78.1
RUB/AMD
March-2013 March-2014 March-2015
108.7
103.3 102.5
Index of Economic Activity (IEA)
March-2013 March-2014 March-2015
103.4 103.8
105.8CPI (12m)
31-Mar-13 31-Mar-14 31-Mar-15
1,631.20 1,970.30 1,491.50
bln
USD
International Reserves
21% -24%
March-2013 March-2014 March-2015
235,227.0
249,528.0 129,836.
0mln
USD
Remittances
6% -48%
25
Ameria Group at a Glance
Armenia Macro Indicators
Armenian Banking sector indicators
Ameriabank Balance Sheet
Ameriabank Income statement
Ratios and Statements
Annex 1: Ameriabank statements and Peers
Armenian banking sector indicators
26
HIGHLIGHTS
* ROA, ROE, NIM ratios for 1Q2015 are annualized.
BANKING SYSTEM
Annualized ROA was 1.4% and 1.2% for 1Q2013 and 1Q2014 respectively.Annualized ROE was 8.4% and 7.6% for 1Q2013 and 1Q2014 respectively.Annualized NIM was 6.9% and 6.1% for 1Q2013 and 1Q2014 respectively.
2013 2014 1Q2015
1.7%
0.9%0.3%
2.2% 2.0%1.5%
ROAA (Market)
ROAA
2013 2014 1Q2015
7.24 7.13 6.95 bln
USD
Assets
2013 2014 1Q2015
4.38 4.50 4.38 bln
USD
Loans
2013 2014 1Q2015
4.00 3.57 3.44 bln
USD
Deposits
1Q2013 1Q2014 1Q2015
20.75 22.10 4.72 mln
USD
Profit
2013 2014 1Q2015
10.7%5.6%
1.8%
16.5% 17.6%13.7%
ROAE (Market)
ROAE
2013 2014 1Q2015
50.9% 49.4%55.8%
40.5%46.4%
39.7%
CIR (Market)
CIR
2013 2014 1Q2015
7.0%5.9%
4.8%6.1%5.4%
4.8%
NIM (Market)
NIM
2013 2014 1Q2015
60.4%
63.1% 63.1%
55.9%
71.6%66.6%
Loans to Assets (Market)
Loans to Assets
2013 2014 1Q2015
16.7%
14.4%15.1%
14.6%13.1% 13.6%
CAR (Market)
CAR
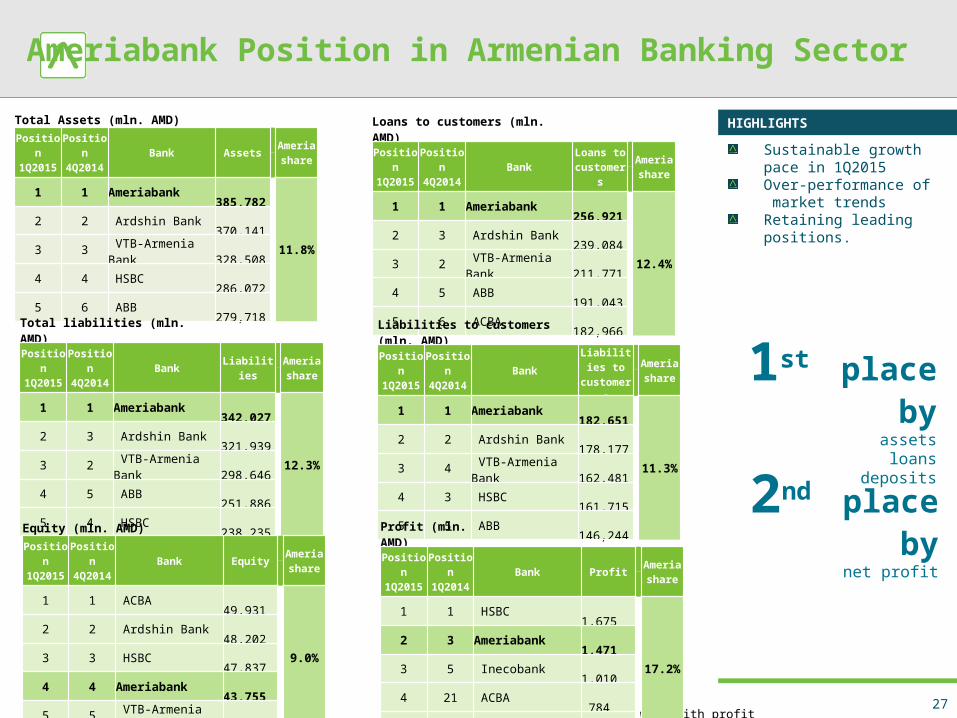
Ameriabank Position in Armenian Banking Sector
27
HIGHLIGHTS
Sustainable growth pace in 1Q2015Over-performance of market trends Retaining leading positions.
1st place byassetsloans
deposits
2nd place bynet profit
* Share within those banks which work with profit
Total Assets (mln. AMD)
Position 1Q2015
Position 4Q2014 Bank Assets Ameria
share
1 1 Ameriabank 385,782
11.8%2 2 Ardshin Bank 370,141 3 3 VTB-Armenia Bank 328,508 4 4 HSBC 286,072 5 6 ABB 279,718
Loans to customers (mln. AMD)
Position 1Q2015
Position 4Q2014 Bank Loans to
customers Ameria
share
1 1 Ameriabank 256,921
12.4%2 3 Ardshin Bank 239,084 3 2 VTB-Armenia Bank 211,771 4 5 ABB 191,043 5 6 ACBA 182,966
Total liabilities (mln. AMD)
Position 1Q2015
Position 4Q2014 Bank Liabilities Ameria
share
1 1 Ameriabank 342,027
12.3%2 3 Ardshin Bank 321,939 3 2 VTB-Armenia Bank 298,646 4 5 ABB 251,886 5 4 HSBC 238,235
Liabilities to customers (mln. AMD)
Position 1Q2015
Position 4Q2014 Bank Liabilities to
customers Ameria
share
1 1 Ameriabank 182,651
11.3%2 2 Ardshin Bank 178,177 3 4 VTB-Armenia Bank 162,481 4 3 HSBC 161,715 5 5 ABB 146,244
Equity (mln. AMD)
Position 1Q2015
Position 4Q2014 Bank Equity Ameria
share
1 1 ACBA 49,931
9.0%2 2 Ardshin Bank 48,202 3 3 HSBC 47,837 4 4 Ameriabank 43,755 5 5 VTB-Armenia Bank 29,861
Profit (mln. AMD)
Position 1Q2015
Position 1Q2014 Bank Profit Ameria
share
1 1 HSBC 1,675
17.2%2 3 Ameriabank 1,471 3 5 Inecobank 1,010 4 21 ACBA 784 5 2 Ardshin Bank 726
28
Ameria Group at a Glance
Armenia Macro Indicators
Armenian Banking sector indicators
Ameriabank Balance Sheet
Ameriabank Income statement
Ratios and Statements
Annex 1: Ameriabank statements and Peers
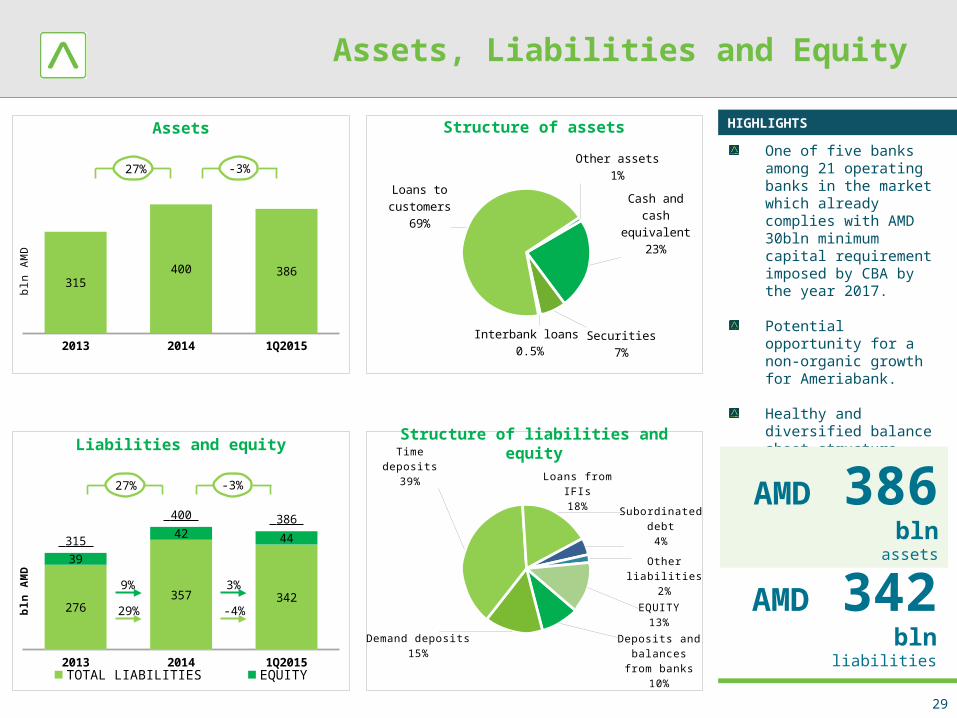
Assets, Liabilities and Equity
29
HIGHLIGHTS
One of five banks among 21 operating banks in the market which already complies with AMD 30bln minimum capital requirement imposed by CBA by the year 2017.
Potential opportunity for a non-organic growth for Ameriabank.
Healthy and diversified balance sheet structure.
AMD 386bln
assets
AMD 342bln
liabilities
Cash and cash equivalent
23%
Securities7%
Interbank loans 0.5%
Loans to cus-tomers
69%
Other assets1%
Structure of assets
2013 2014 1Q2015
315 400 386
bln
AMD
27% -3%
Assets
2013 2014 1Q2015
276 357 342
39
42 44 315
400 386
TOTAL LIABILITIES EQUITY
bln
AM
D
27% -3%
Liabilities and equity
29%
9%
-4%
3%
Deposits and balances from
banks10%
Demand deposits15%
Time deposits39%
Loans from IFIs18%
Subordinated debt4%
Other liabilities2%
EQUITY13%
Structure of liabilities and equity
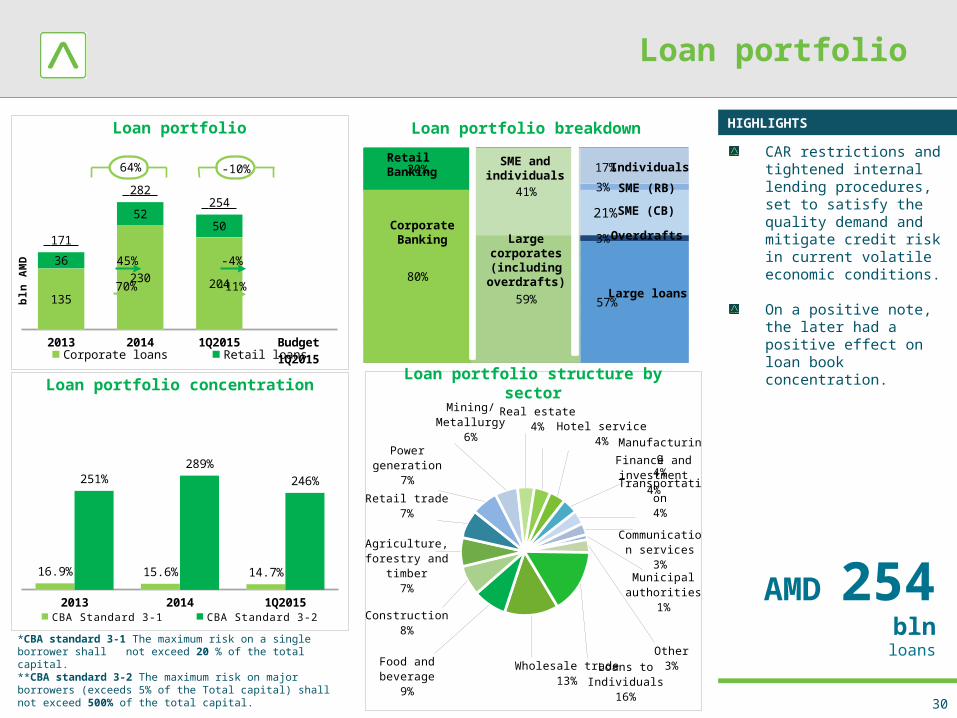
Loan portfolio
30
HIGHLIGHTS
CAR restrictions and tightened internal lending procedures, set to satisfy the quality demand and mitigate credit risk in current volatile economic conditions.
On a positive note, the later had a positive effect on loan book concentration.
AMD 254blnloans*CBA standard 3-1 The maximum risk on a single borrower shall
not exceed 20 % of the total capital. **CBA standard 3-2 The maximum risk on major borrowers (exceeds 5% of the Total capital) shall not exceed 500% of the total capital.
2013 2014 1Q2015 Budget 1Q2015
135
230 204
36
52 50
171
282 254
Corporate loans Retail loans
bln
AM
D
64% -10%
Loan portfolio
70%
45%
-11%
-4%
2013 2014 1Q2015
16.9% 15.6% 14.7%
251%289%
246%
CBA Standard 3-1 CBA Standard 3-2
Loan portfolio concentration
Wholesale trade13%
Food and beverage9%
Construction8%
Agriculture, forestry and timber
7%
Retail trade7%
Power generation7%
Mining/Metallurgy6%
Real estate4% Hotel service
4% Finance and investment
4% Manufacturing4%
Transportation4%
Communication services
3%
Municipal authori-ties1%
Other3%Loans to Individ-
uals16%
Loan portfolio structure by sector
80%
59% 57%
20%
41%
3%
21%
3%
17%
Chart Title
Retail Banking
Corporate Banking Large corporates
(including overdrafts)
SME and individuals
Large loans
Overdrafts
SME (CB)
SME (RB)
Individuals
Loan portfolio breakdown
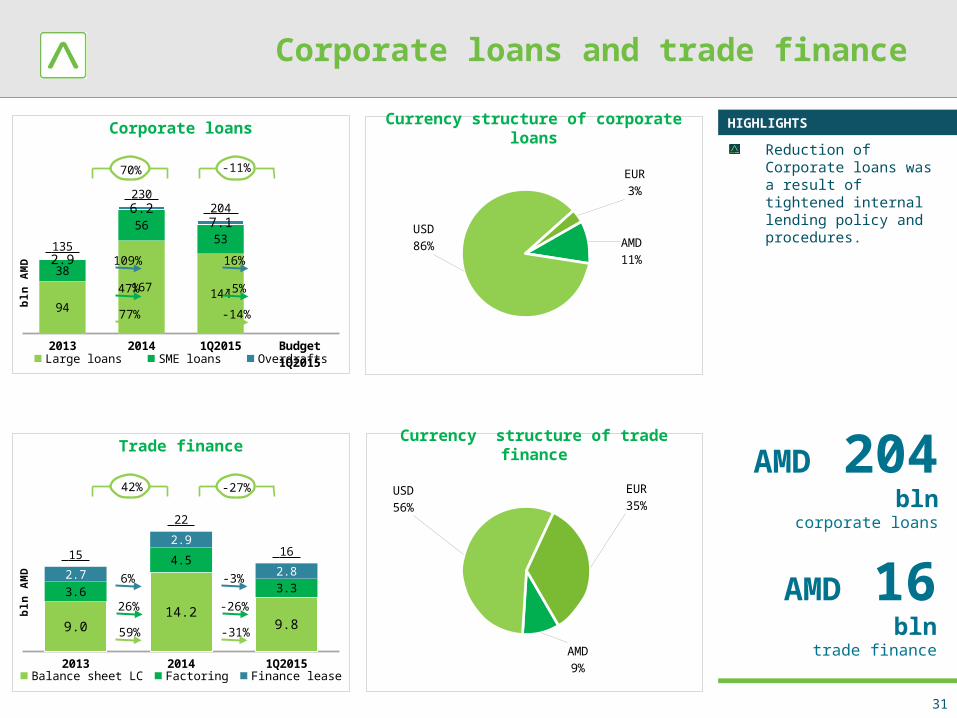
Corporate loans and trade finance
31
HIGHLIGHTS
AMD 204bln
corporate loans
AMD 16bln
trade finance
Reduction of Corporate loans was a result of tightened internal lending policy and procedures.
2013 2014 1Q2015 Budget 1Q2015
94
167 144
38
56 53
2.9
6.2 7.1
135
230 204
Large loans SME loans Overdrafts
bln
AM
D
70% -11%
Corporate loans
77%
47%
-14%
-5%
109% 16%
2013 2014 1Q2015
9.0 14.2
9.8
3.6
4.5
3.3 2.7
2.9
2.8 15
22
16
Balance sheet LC Factoring Finance lease
bln
AM
D
42% -27%
Trade finance
59%
26%
-31%
-26%
6% -3%
AMD9%
USD56%
EUR35%
Currency structure of trade finance
AMD11%
USD86%
EUR3%
Currency structure of corporate loans
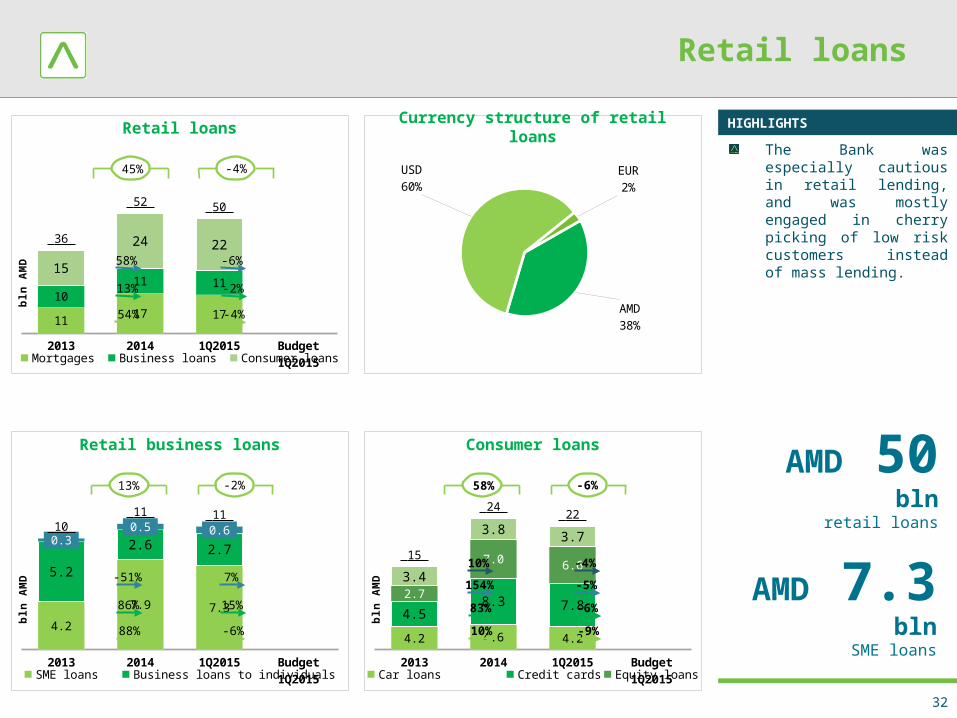
Retail loans
32
HIGHLIGHTS
AMD 50bln
retail loans
AMD 7.3bln
SME loans
The Bank was especially cautious in retail lending, and was mostly engaged in cherry picking of low risk customers instead of mass lending.
Retail loans
2013 2014 1Q2015 Budget 1Q2015
11 17 17 10
11 11 15
24 22 36
52 50
Mortgages Business loans Consumer loans
bln
AM
D
45% -4%
54%
13%
-4%
-2%
58% -6%
AMD38%
USD60%
EUR2%
Currency structure of retail loans
2013 2014 1Q2015 Budget 1Q2015
4.2
7.9 7.3
5.2
2.6 2.7 0.3
0.5 0.6 10 11 11
SME loans Business loans to individuals Overdrafts
bln
AM
D
13% -2%
Retail business loans
88%
86%
-6%
15%
-51% 7%
2013 2014 1Q2015 Budget 1Q2015
4.2 4.6 4.2
4.5 8.3 7.8
2.7
7.0 6.6 3.4
3.8 3.7
15
24 22
Car loans Credit cards Equity loans Other retail loans
bln
AM
D
58% -6%
Consumer loans
10%
83%
-9%
-6%
154% -5%
10% -4%
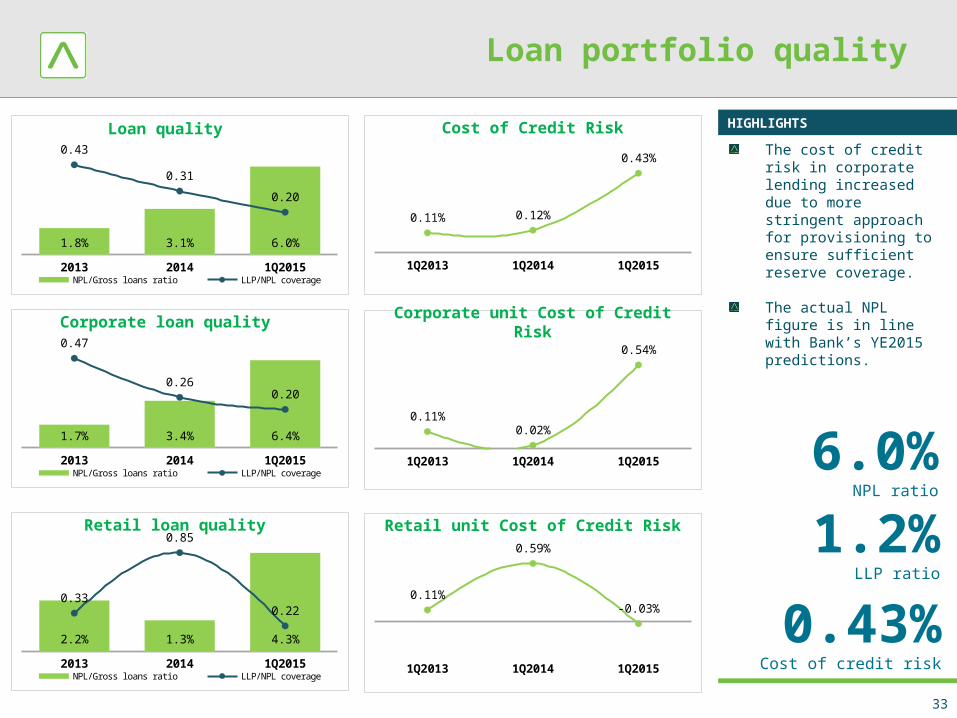
Loan portfolio quality
33
HIGHLIGHTS
6.0%NPL ratio
1.2%LLP ratio
The cost of credit risk in corporate lending increased due to more stringent approach for provisioning to ensure sufficient reserve coverage.
The actual NPL figure is in line with Bank’s YE2015 predictions.
0.43%Cost of credit risk
2013 2014 1Q2015
1.8% 3.1% 6.0%
0.43
0.31
0.20
NPL/Gross loans ratio LLP/NPL coverage
Loan quality
2013 2014 1Q2015
1.7% 3.4% 6.4%
0.47
0.26 0.20
NPL/Gross loans ratio LLP/NPL coverage
Corporate loan quality
2013 2014 1Q2015
2.2% 1.3% 4.3%
0.33
0.85
0.22
NPL/Gross loans ratio LLP/NPL coverage
Retail loan quality
1Q2013 1Q2014 1Q2015
0.11% 0.12%
0.43%
Cost of Credit Risk
1Q2013 1Q2014 1Q2015
0.11%0.02%
0.54%
Corporate unit Cost of Credit Risk
1Q2013 1Q2014 1Q2015
0.11%
0.59%
-0.03%
Retail unit Cost of Credit Risk
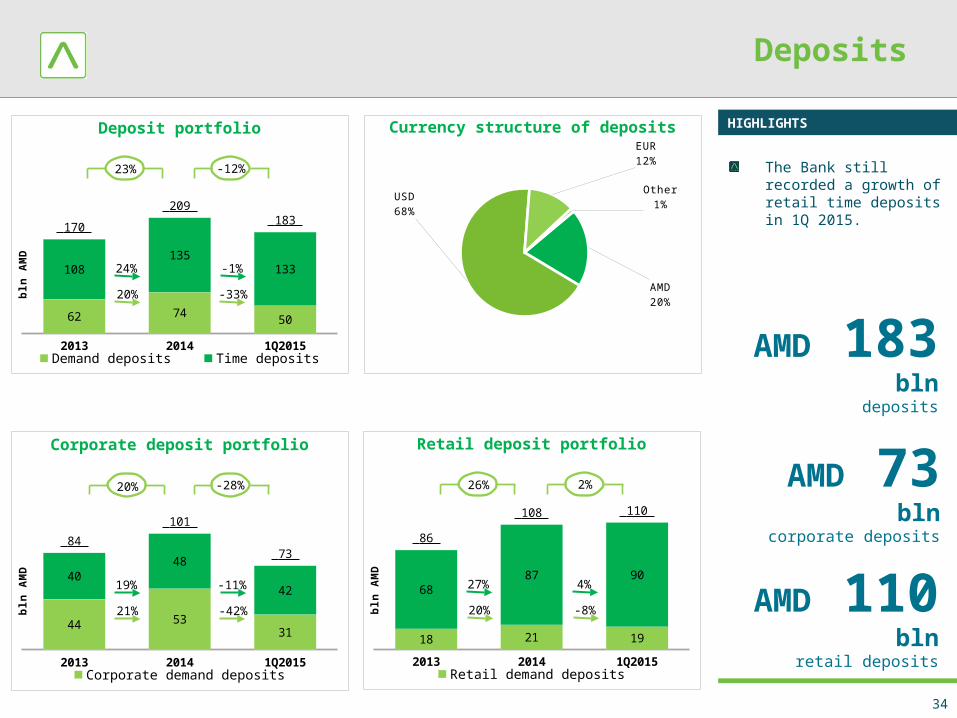
Deposits
34
HIGHLIGHTS
AMD 183bln
deposits
AMD 73bln
corporate deposits
The Bank still recorded a growth of retail time deposits in 1Q 2015.
2013 2014 1Q2015
62 74 50
108 135
133
170
209 183
Demand deposits Time deposits
bln
AM
D
23% -12%
Deposit portfolio
20%
24%
-33%
-1%
2013 2014 1Q2015
44 53 31
40 48
42
84
101
73
Corporate demand deposits Corporate time deposits
bln
AM
D
20% -28%
Corporate deposit portfolio
21%
19%
-42%
-11%
Currency structure of deposits
AMD20%
USD68%
EUR12%
Other1%
2013 2014 1Q2015
18 21 19
68 87 90
86
108 110
Retail demand deposits Retail time deposits
bln
AM
D
26% 2%
Retail deposit portfolio
20%
27%
-8%
4%
AMD 110bln
retail deposits
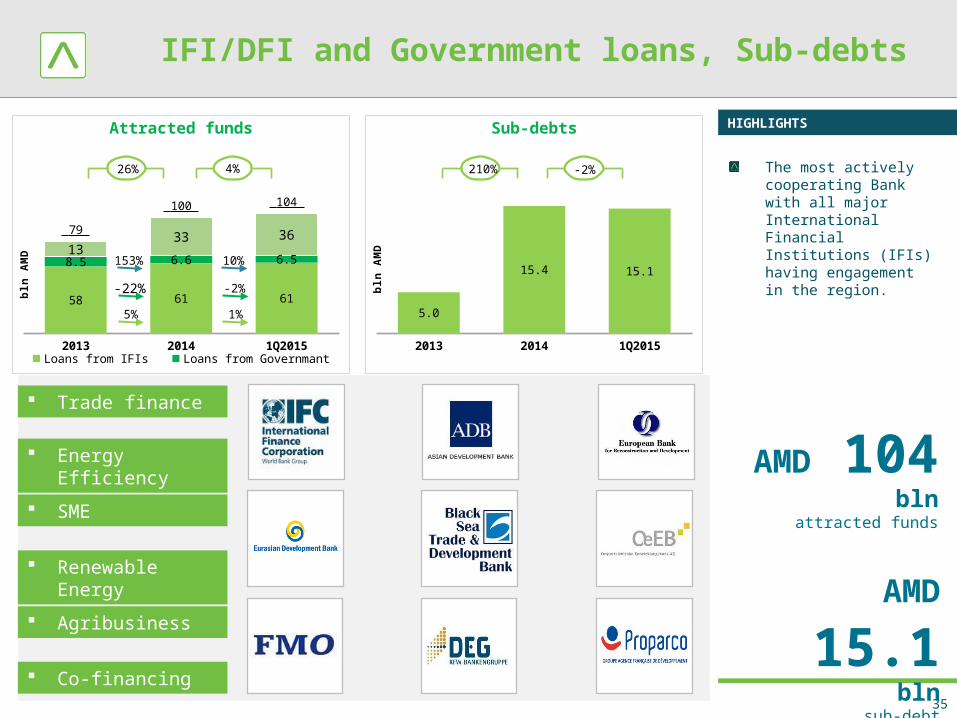
IFI/DFI and Government loans, Sub-debts
35
HIGHLIGHTS
AMD 104bln
attracted funds
AMD 15.1bln
sub-debt
The most actively cooperating Bank with all major International Financial Institutions (IFIs) having engagement in the region.
SME
Co-financing
Trade finance
Renewable Energy
Energy Efficiency
Agribusiness
2013 2014 1Q2015
5.0
15.4 15.1
bln
AM
D
210% -2%
Sub-debts
2013 2014 1Q2015
58 61 61
8.5 6.6 6.5 13
33 36 79
100 104
Loans from IFIs Loans from Governmant Trade finance
bln
AM
D
26% 4%
Attracted funds
5%
-22%
1%
-2%
153% 10%
36
Ameria Group at a Glance
Armenia Macro Indicators
Armenian Banking sector indicators
Ameriabank Balance Sheet
Ameriabank Income statement
Ratios and Statements
Annex 1: Ameriabank statements and Peers
Interest income
37
HIGHLIGHTS
Advances to customers
91%
Securities7%
Money market
1%
Interest income structure
Due to banks 23%
Due to customers
43%
Due to IFI29%
Other4%
Interest expense structure
2013 2014 1Q2015
6.1%5.8%
4.8%
Net Interest Margin (NIM)
We as largest bank with FX borrowings and FX Lending bear largest AMD reservation costs and thus our NIM was affected most due to temporarily tightened reservation regime by CBA.
AMD 3.8bln
net interest income
Interest income Interest expense Net interest income
5.3
2.7 2.6
6.1
3.1 3.1
8.6
4.9 3.8
1Q2013 1Q2014 1Q2015 Series4
bln
AMD
16%
Interest income
40% 15% 57% 17% 23%
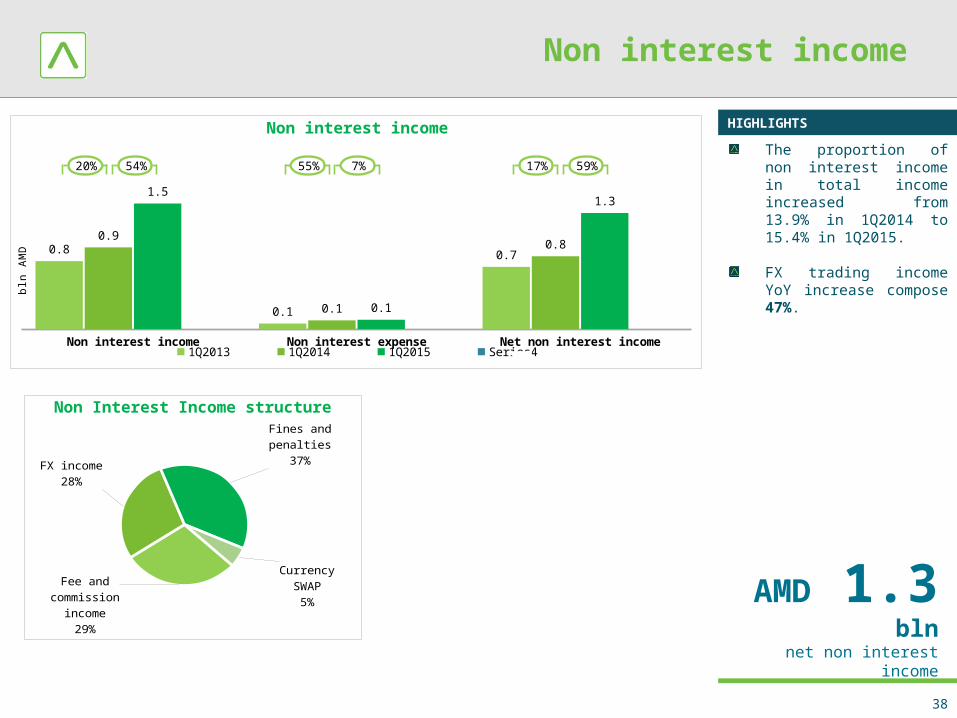
Non interest income
38
HIGHLIGHTS
The proportion of non interest income in total income increased from 13.9% in 1Q2014 to 15.4% in 1Q2015.
FX trading income YoY increase compose 47%.
Fee and commission income
29%
FX income28%
Fines and penal-ties37%
Currency SWAP5%
Non Interest Income structure
AMD 1.3bln
net non interest income
Non interest income Non interest expense Net non interest income
0.8
0.1
0.7
0.9
0.1
0.8
1.5
0.1
1.3
1Q2013 1Q2014 1Q2015 Series4
bln
AMD
20%
Non interest income
54% 55% 7% 17% 59%
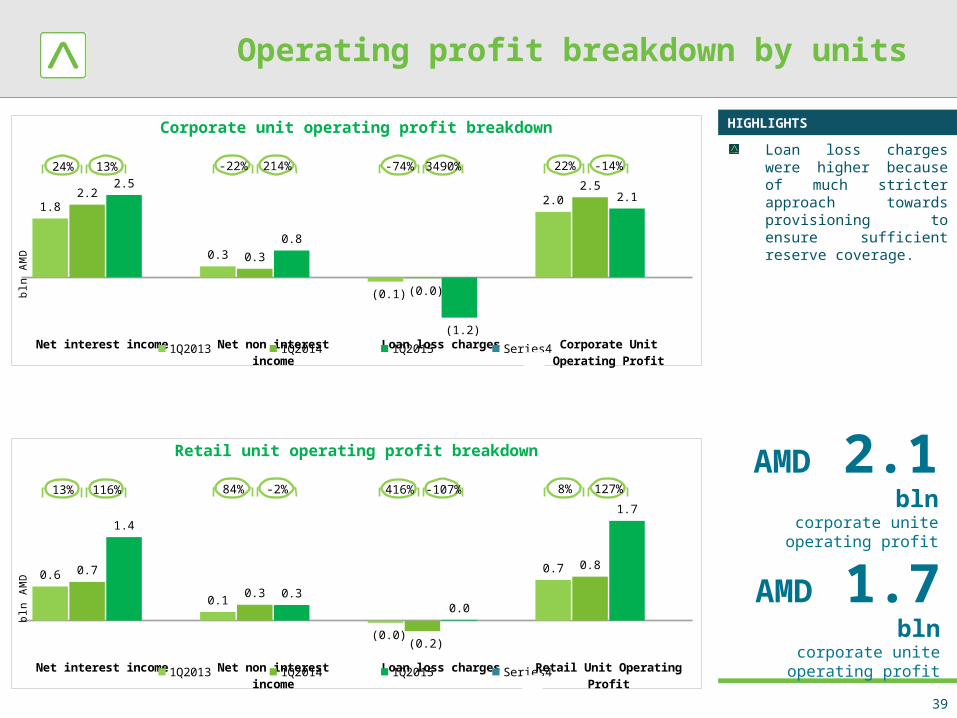
Operating profit breakdown by units
39
HIGHLIGHTS
Loan loss charges were higher because of much stricter approach towards provisioning to ensure sufficient reserve coverage.
Net interest income Net non interest income Loan loss charges Corporate Unit Operating Profit
1.8
0.3
(0.1)
2.0 2.2
0.3
(0.0)
2.5 2.5
0.8
(1.2)
2.1
1Q2013 1Q2014 1Q2015 Series4
bln
AMD
24%
Corporate unit operating profit breakdown
13% -22% 214% -74% 3490% 22% -14%
Net interest income Net non interest income Loan loss charges Retail Unit Operating Profit
0.6
0.1
(0.0)
0.7 0.7
0.3
(0.2)
0.8
1.4
0.3 0.0
1.7
1Q2013 1Q2014 1Q2015 Series4
bln
AMD
13%
Retail unit operating profit breakdown
116% 84% -2% 416% -107% 8% 127%
AMD 2.1bln
corporate unite operating profit
AMD 1.7bln
corporate unite operating profit
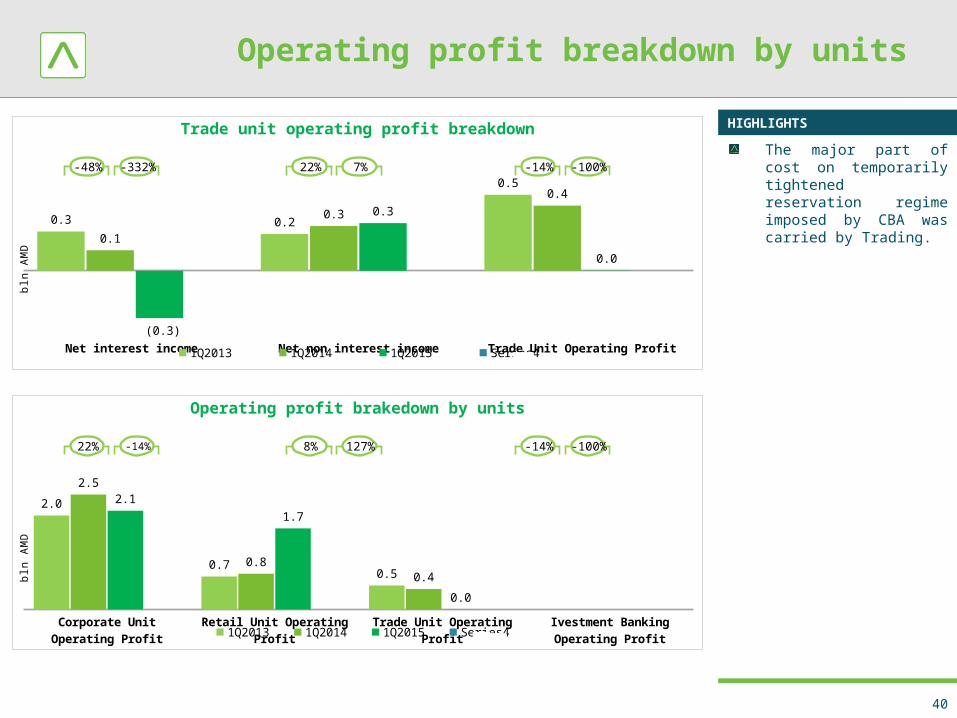
Operating profit breakdown by units
40
HIGHLIGHTS
The major part of cost on temporarily tightened reservation regime imposed by CBA was carried by Trading.
Net interest income Net non interest income Trade Unit Operating Profit
0.3 0.2
0.5
0.1
0.3
0.4
(0.3)
0.3
0.0
1Q2013 1Q2014 1Q2015 Series4
bln
AMD
-48%
Trade unit operating profit breakdown
-332% 22% 7% -14% -100%
Corporate Unit Operating Profit Retail Unit Operating Profit Trade Unit Operating Profit Ivestment Banking Operating Profit
2.0
0.7 0.5
2.5
0.8 0.4
2.1 1.7
0.0
1Q2013 1Q2014 1Q2015 Series4
bln
AMD
22%
Operating profit brakedown by units
-14% 8% 127% -14% -100%
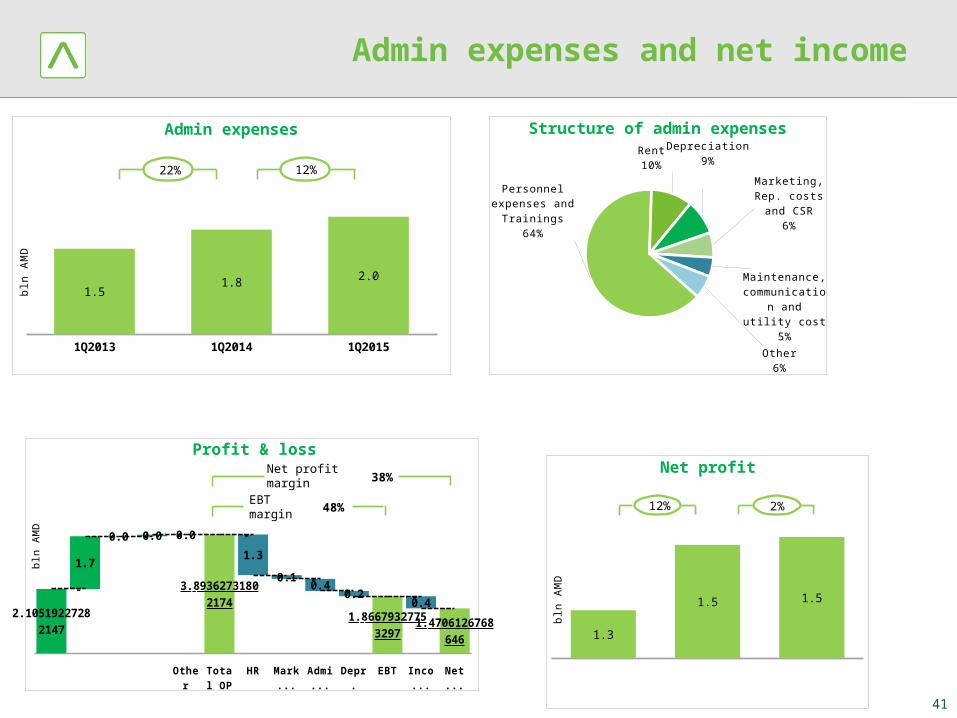
Admin expenses and net income
41
1Q2013 1Q2014 1Q2015
1.5 1.8 2.0
bln
AMD
22% 12%
Admin expenses
Personnel expenses and Trainings
64%
Rent10%
Depreciation9% Marketing, Rep.
costs and CSR6%
Maintenance, communication and utility cost
5%
Other6%
Structure of admin expenses
OP of CB
OP of RB
OP of TD
OP of IB
Other Total OP
HR Mark. & PR
Admin exp.
Depr. EBT In-come
tax
Net Profit
2.10519227282147
3.89362731802174
1.86679327753297 1.470612676864
6 2.1
3.8 3.8 3.9 2.6 2.4 2.0 1.9 1.5
-
- - -
1.3
0.1 0.4
0.2 0.4
1.7
0.0 0.0 0.0 -
- - - -
bln
AMD
Profit & loss
38%Net profit margin
48%EBT margin
1Q2013 1Q2014 1Q2015
1.3
1.5 1.5
bln
AMD
Net profit
12% 2%
42
Ameria Group at a Glance
Armenia Macro Indicators
Armenian Banking sector indicators
Ameriabank Balance Sheet
Ameriabank Income statement
Ratios and Statements
Annex 1: Ameriabank statements and Peers
Ratios
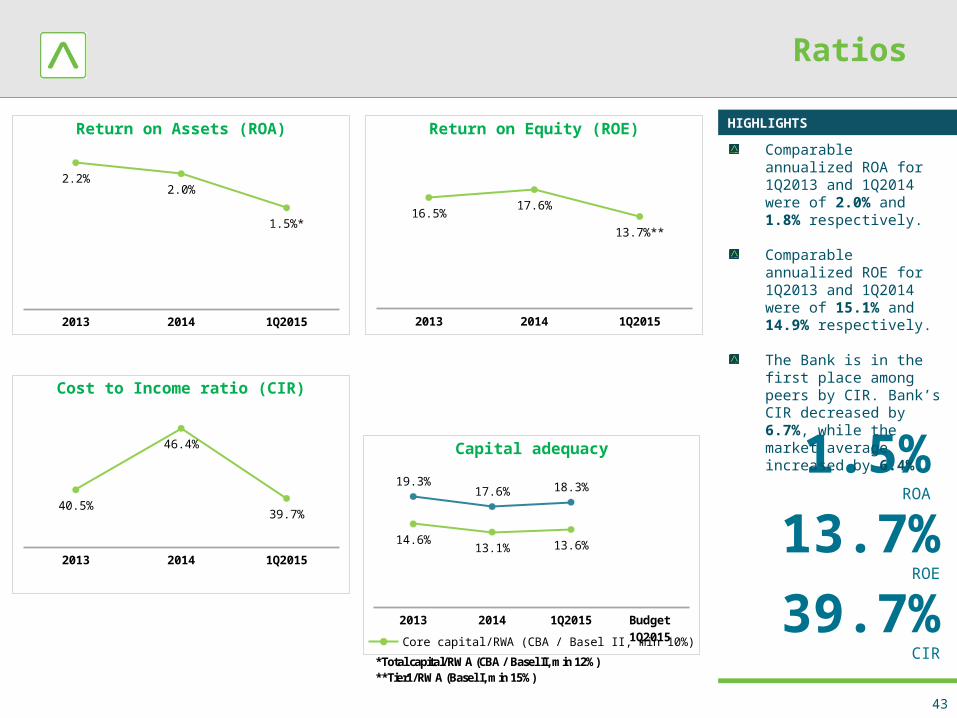
43
HIGHLIGHTS
*Total capital/RWA (CBA / Basel II, min 12%)**Tier1/RWA (Basel I, min 15%)
1.5%ROA
13.7%ROE
39.7%CIR
Comparable annualized ROA for 1Q2013 and 1Q2014 were of 2.0% and 1.8% respectively.
Comparable annualized ROE for 1Q2013 and 1Q2014 were of 15.1% and 14.9% respectively.
The Bank is in the first place among peers by CIR. Bank’s CIR decreased by 6.7%, while the market average increased by 6.4%.
2013 2014 1Q2015 Budget 1Q2015
14.6%13.1% 13.6%
19.3%17.6% 18.3%
Total capital/RWA Tier1/RWA
Capital adequacy
2013 2014 1Q2015
16.5%17.6%
13.7%**
Return on Equity (ROE)
2013 2014 1Q2015
2.2%2.0%
1.5%*
Return on Assets (ROA)
2013 2014 1Q2015
40.5%
46.4%
39.7%
Cost to Income ratio (CIR)
Ratios
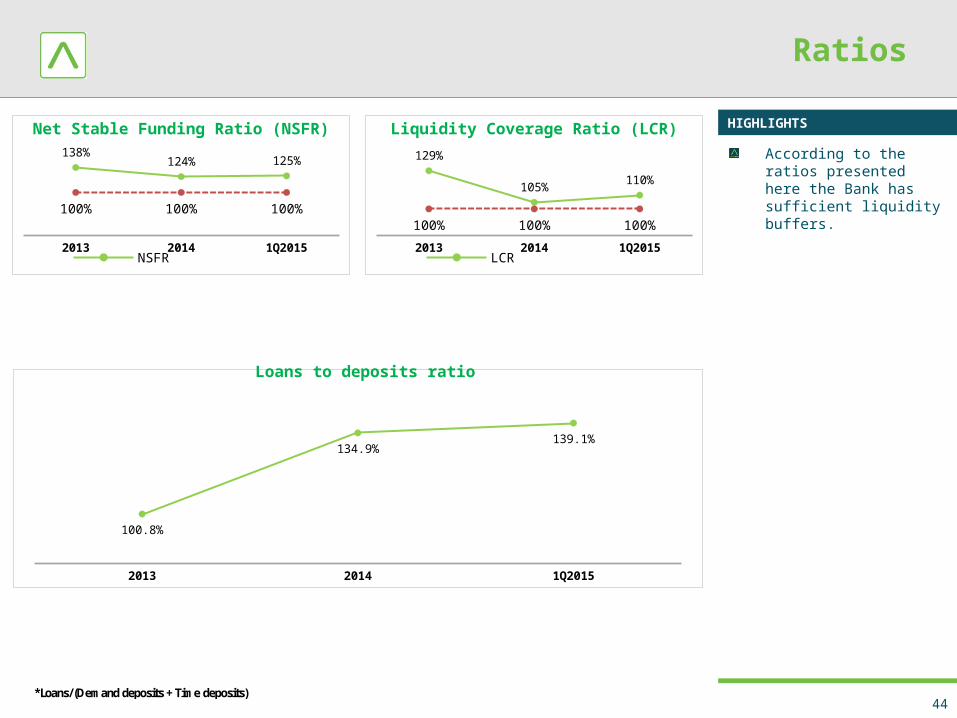
44
HIGHLIGHTS
*Loans/(Demand deposits + Time deposits)
2013 2014 1Q2015
138%124% 125%
100% 100% 100%
NSFR Minimum requirement
Net Stable Funding Ratio (NSFR)
2013 2014 1Q2015
129%
105% 110%
100% 100% 100%
LCR Minimum requirement
Liquidity Coverage Ratio (LCR)
2013 2014 1Q2015
100.8%
134.9%139.1%
Loans to deposits ratio
According to the ratios presented here the Bank has sufficient liquidity buffers.
45
Ameria Group at a Glance
Armenia Macro Indicators
Armenian Banking sector indicators
Ameriabank Balance Sheet
Ameriabank Income statement
Ratios and Statements
Annex 1: Ameriabank statements and Peers
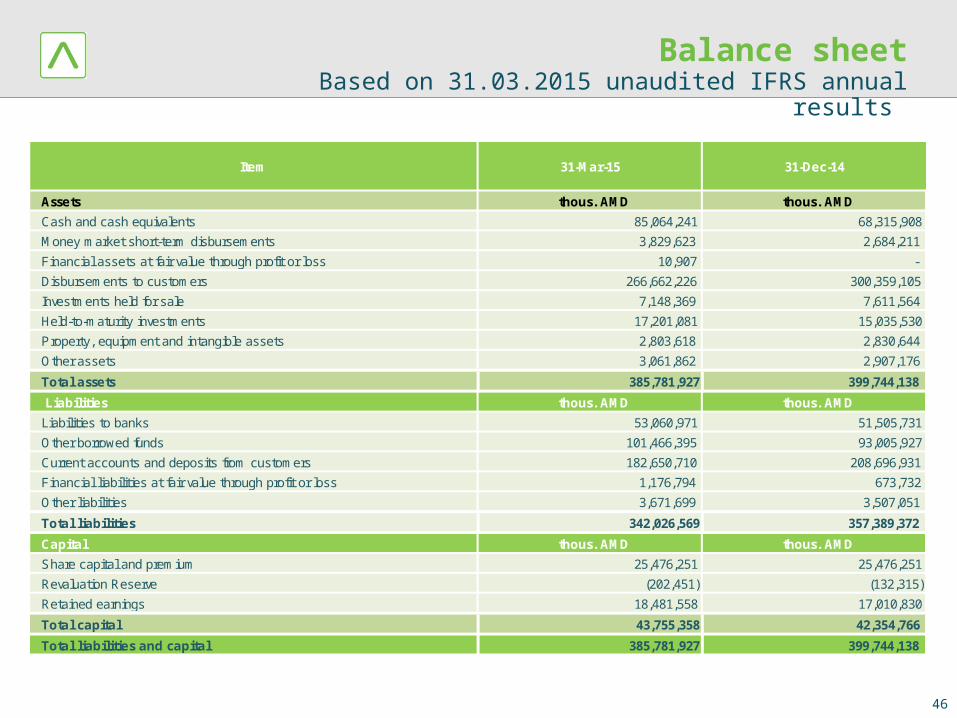
Balance sheetBased on 31.03.2015 unaudited IFRS annual results
46
Item 31-Mar-15 31-Dec-14
Assets thous. AMD thous. AMD
Cash and cash equivalents 85,064,241 68,315,908
Money market short-term disbursements 3,829,623 2,684,211
Financial assets at fair value through profit or loss 10,907 -
Disbursements to customers 266,662,226 300,359,105
Investments held for sale 7,148,369 7,611,564
Held-to-maturity investments 17,201,081 15,035,530
Property, equipment and intangible assets 2,803,618 2,830,644
Other assets 3,061,862 2,907,176
Total assets 385,781,927 399,744,138
Liabilities thous. AMD thous. AMD
Liabilities to banks 53,060,971 51,505,731
Other borrowed funds 101,466,395 93,005,927
Current accounts and deposits from customers 182,650,710 208,696,931
Financial liabilities at fair value through profit or loss 1,176,794 673,732
Other liabilities 3,671,699 3,507,051
Total liabilities 342,026,569 357,389,372
Capital thous. AMD thous. AMD
Share capital and premium 25,476,251 25,476,251
Revaluation Reserve (202,451) (132,315)
Retained earnings 18,481,558 17,010,830
Total capital 43,755,358 42,354,766
Total liabilities and capital 385,781,927 399,744,138
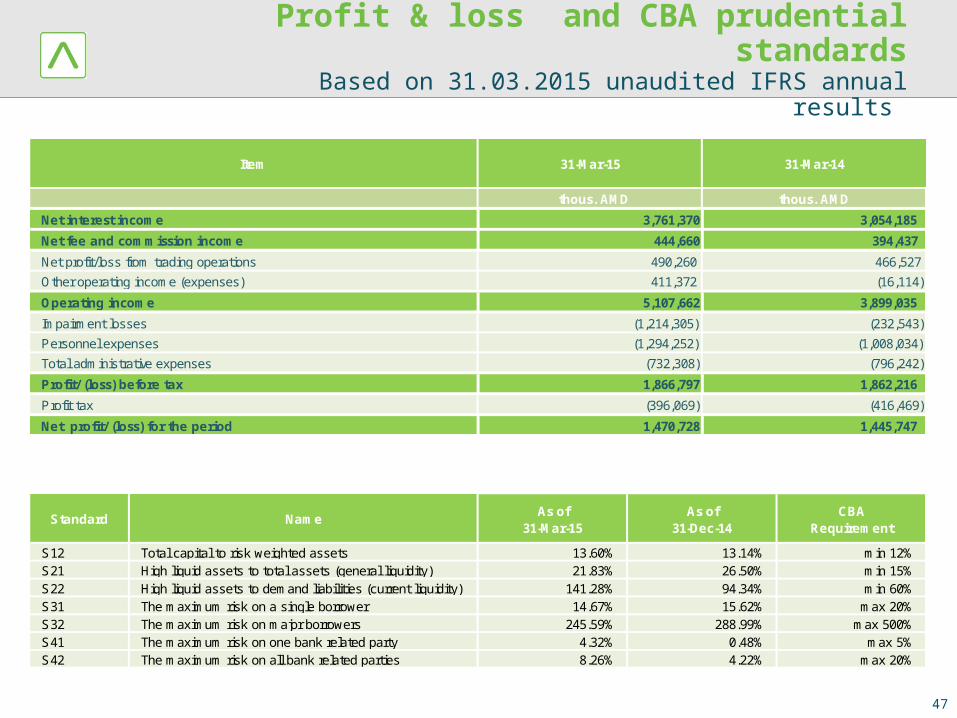
Profit & loss and CBA prudential standardsBased on 31.03.2015 unaudited IFRS annual results
47
Item 31-Mar-15 31-Mar-14
thous. AMD thous. AMD
Net interest income 3,761,370 3,054,185
Net fee and commission income 444,660 394,437
Net profit/loss from trading operations 490,260 466,527
Other operating income (expenses) 411,372 (16,114)
Operating income 5,107,662 3,899,035
Impairment losses (1,214,305) (232,543)
Personnel expenses (1,294,252) (1,008,034)
Total administrative expenses (732,308) (796,242)
Profit/ (loss) before tax 1,866,797 1,862,216
Profit tax (396,069) (416,469)
Net profit/ (loss) for the period 1,470,728 1,445,747
Standard NameAs of
31-Mar-15As of
31-Dec-14CBA
Requirement
S12 Total capital to risk weighted assets 13.60% 13.14% min 12%S21 High liquid assets to total assets (general liquidity) 21.83% 26.50% min 15%S22 High liquid assets to demand liabilities (current liquidity) 141.28% 94.34% min 60%S31 The maximum risk on a single borrower 14.67% 15.62% max 20%S32 The maximum risk on major borrowers 245.59% 288.99% max 500%S41 The maximum risk on one bank related party 4.32% 0.48% max 5%S42 The maximum risk on all bank related parties 8.26% 4.22% max 20%
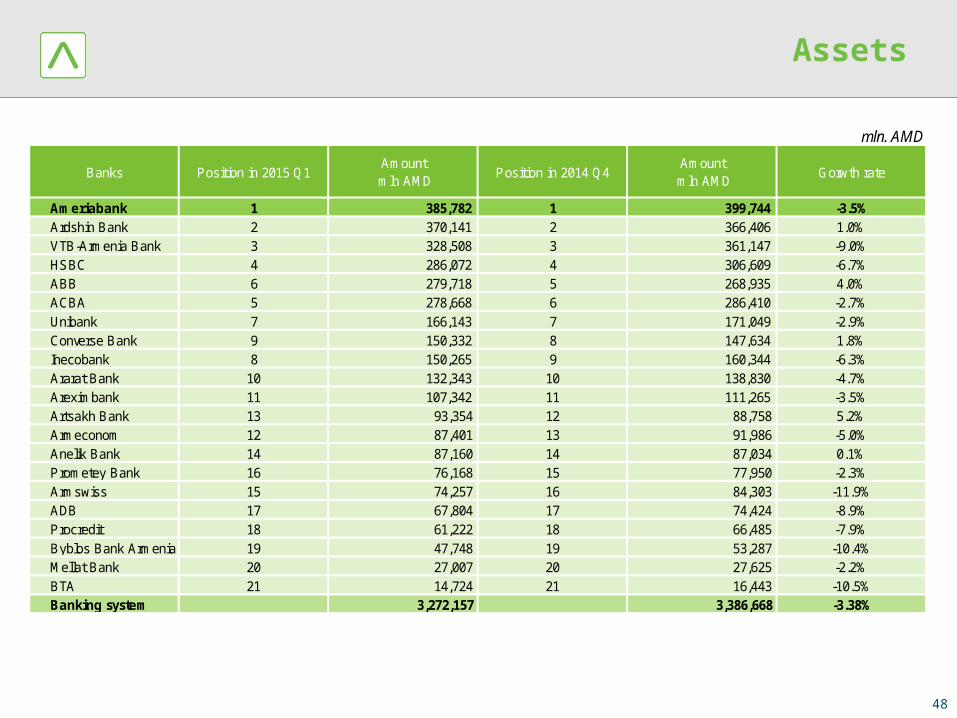
Assets
48
mln. AMD
Ameriabank 1 385,782 1 399,744 -3.5%Ardshin Bank 2 370,141 2 366,406 1.0%VTB-Armenia Bank 3 328,508 3 361,147 -9.0%HSBC 4 286,072 4 306,609 -6.7%ABB 6 279,718 5 268,935 4.0%ACBA 5 278,668 6 286,410 -2.7%Unibank 7 166,143 7 171,049 -2.9%Converse Bank 9 150,332 8 147,634 1.8%Inecobank 8 150,265 9 160,344 -6.3%Ararat Bank 10 132,343 10 138,830 -4.7%Areximbank 11 107,342 11 111,265 -3.5%Artsakh Bank 13 93,354 12 88,758 5.2%Armeconom 12 87,401 13 91,986 -5.0%Anelik Bank 14 87,160 14 87,034 0.1%Prometey Bank 16 76,168 15 77,950 -2.3%Armswiss 15 74,257 16 84,303 -11.9%ADB 17 67,804 17 74,424 -8.9%Procredit 18 61,222 18 66,485 -7.9%Byblos Bank Armenia 19 47,748 19 53,287 -10.4%Mellat Bank 20 27,007 20 27,625 -2.2%BTA 21 14,724 21 16,443 -10.5%Banking system 3,272,157 3,386,668 -3.38%
Banks Position in 2015 Q1Amount
mln AMDPosition in 2014 Q4
Amount mln AMD
Gorwth rate
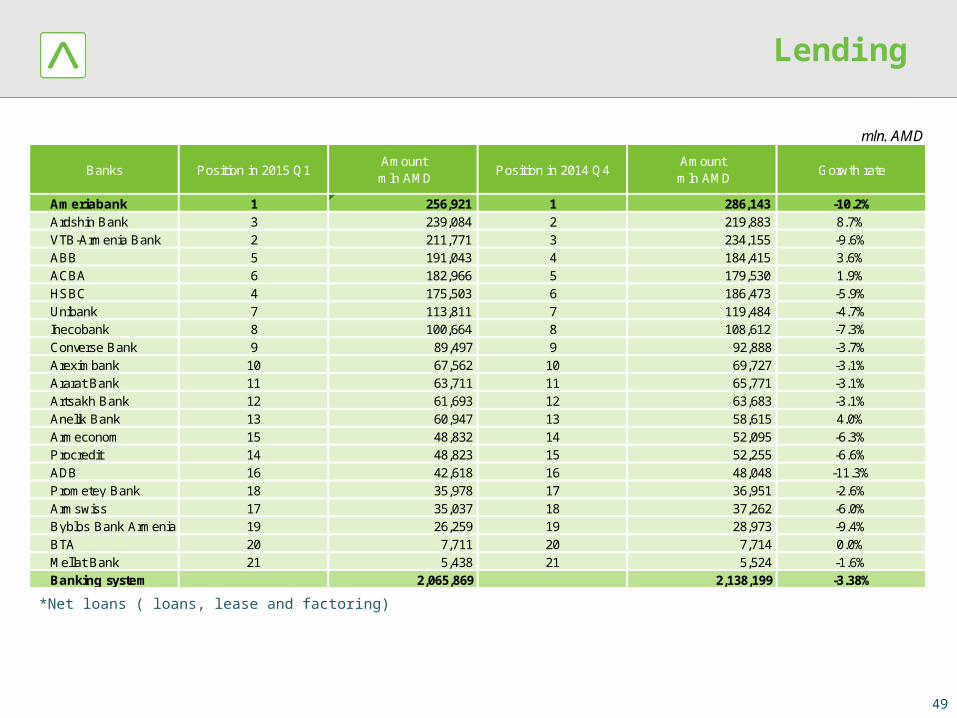
Lending
49
*Net loans ( loans, lease and factoring)
mln. AMD
Ameriabank 1 256,921 1 286,143 -10.2%Ardshin Bank 3 239,084 2 219,883 8.7%VTB-Armenia Bank 2 211,771 3 234,155 -9.6%ABB 5 191,043 4 184,415 3.6%ACBA 6 182,966 5 179,530 1.9%HSBC 4 175,503 6 186,473 -5.9%Unibank 7 113,811 7 119,484 -4.7%Inecobank 8 100,664 8 108,612 -7.3%Converse Bank 9 89,497 9 92,888 -3.7%Areximbank 10 67,562 10 69,727 -3.1%Ararat Bank 11 63,711 11 65,771 -3.1%Artsakh Bank 12 61,693 12 63,683 -3.1%Anelik Bank 13 60,947 13 58,615 4.0%Armeconom 15 48,832 14 52,095 -6.3%Procredit 14 48,823 15 52,255 -6.6%ADB 16 42,618 16 48,048 -11.3%Prometey Bank 18 35,978 17 36,951 -2.6%Armswiss 17 35,037 18 37,262 -6.0%Byblos Bank Armenia 19 26,259 19 28,973 -9.4%BTA 20 7,711 20 7,714 0.0%Mellat Bank 21 5,438 21 5,524 -1.6%Banking system 2,065,869 2,138,199 -3.38%
Banks Position in 2015 Q1Amount
mln AMDPosition in 2014 Q4
Amount mln AMD
Gorwth rate
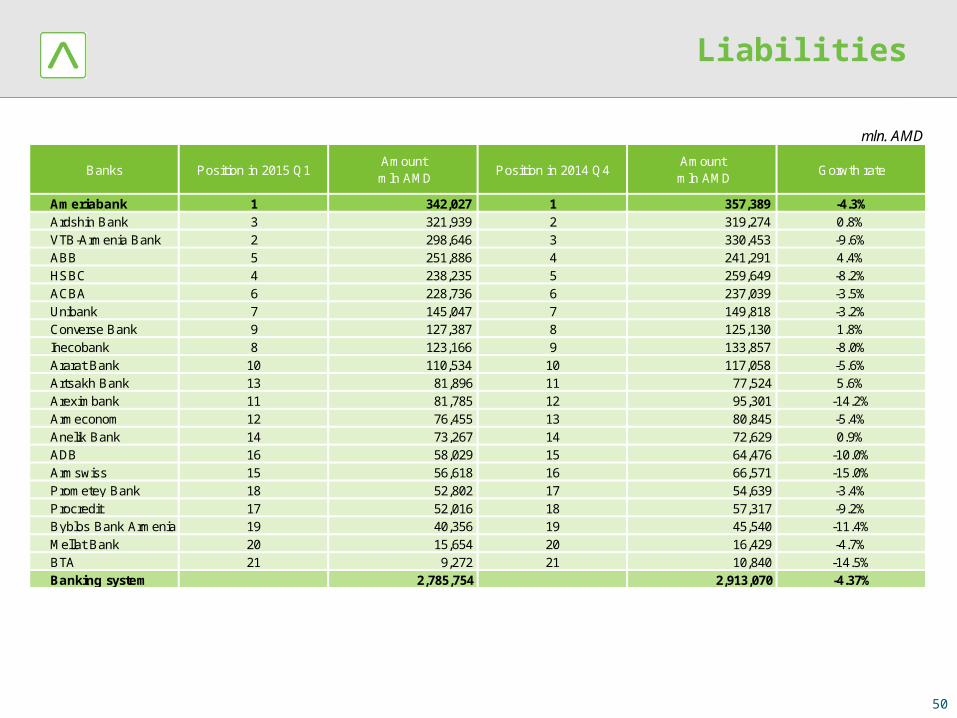
Liabilities
50
mln. AMD
Ameriabank 1 342,027 1 357,389 -4.3%Ardshin Bank 3 321,939 2 319,274 0.8%VTB-Armenia Bank 2 298,646 3 330,453 -9.6%ABB 5 251,886 4 241,291 4.4%HSBC 4 238,235 5 259,649 -8.2%ACBA 6 228,736 6 237,039 -3.5%Unibank 7 145,047 7 149,818 -3.2%Converse Bank 9 127,387 8 125,130 1.8%Inecobank 8 123,166 9 133,857 -8.0%Ararat Bank 10 110,534 10 117,058 -5.6%Artsakh Bank 13 81,896 11 77,524 5.6%Areximbank 11 81,785 12 95,301 -14.2%Armeconom 12 76,455 13 80,845 -5.4%Anelik Bank 14 73,267 14 72,629 0.9%ADB 16 58,029 15 64,476 -10.0%Armswiss 15 56,618 16 66,571 -15.0%Prometey Bank 18 52,802 17 54,639 -3.4%Procredit 17 52,016 18 57,317 -9.2%Byblos Bank Armenia 19 40,356 19 45,540 -11.4%Mellat Bank 20 15,654 20 16,429 -4.7%BTA 21 9,272 21 10,840 -14.5%Banking system 2,785,754 2,913,070 -4.37%
Banks Position in 2015 Q1Amount
mln AMDPosition in 2014 Q4
Amount mln AMD
Gorwth rate
Deposits
51
mln. AMD
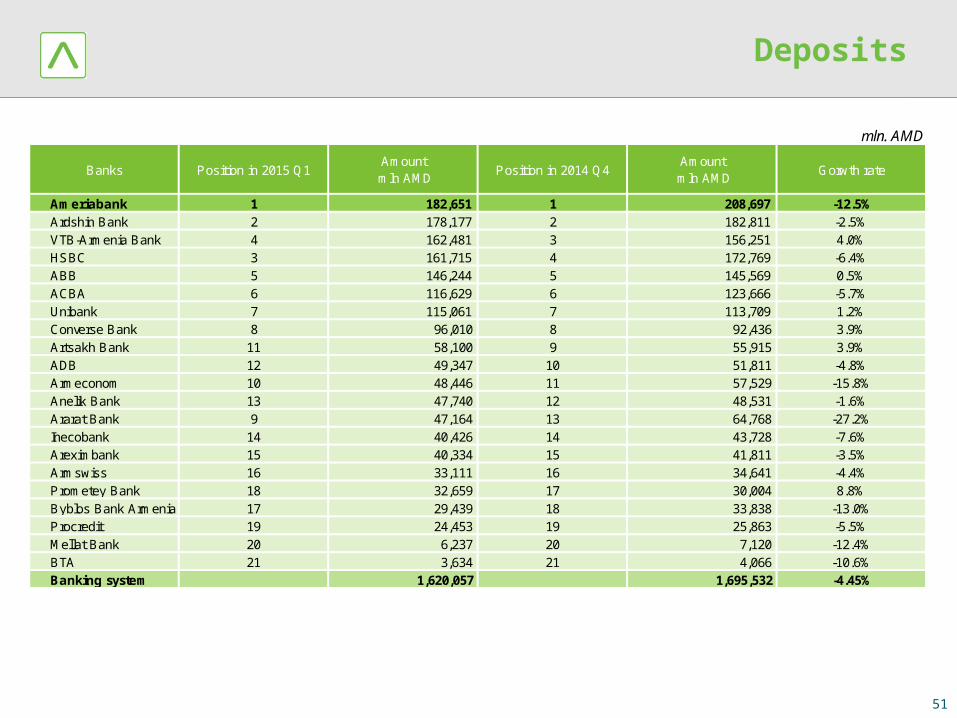
Ameriabank 1 182,651 1 208,697 -12.5%Ardshin Bank 2 178,177 2 182,811 -2.5%VTB-Armenia Bank 4 162,481 3 156,251 4.0%HSBC 3 161,715 4 172,769 -6.4%ABB 5 146,244 5 145,569 0.5%ACBA 6 116,629 6 123,666 -5.7%Unibank 7 115,061 7 113,709 1.2%Converse Bank 8 96,010 8 92,436 3.9%Artsakh Bank 11 58,100 9 55,915 3.9%ADB 12 49,347 10 51,811 -4.8%Armeconom 10 48,446 11 57,529 -15.8%Anelik Bank 13 47,740 12 48,531 -1.6%Ararat Bank 9 47,164 13 64,768 -27.2%Inecobank 14 40,426 14 43,728 -7.6%Areximbank 15 40,334 15 41,811 -3.5%Armswiss 16 33,111 16 34,641 -4.4%Prometey Bank 18 32,659 17 30,004 8.8%Byblos Bank Armenia 17 29,439 18 33,838 -13.0%Procredit 19 24,453 19 25,863 -5.5%Mellat Bank 20 6,237 20 7,120 -12.4%BTA 21 3,634 21 4,066 -10.6%Banking system 1,620,057 1,695,532 -4.45%
Banks Position in 2015 Q1Amount
mln AMDPosition in 2014 Q4
Amount mln AMD
Gorwth rate
Equity
52
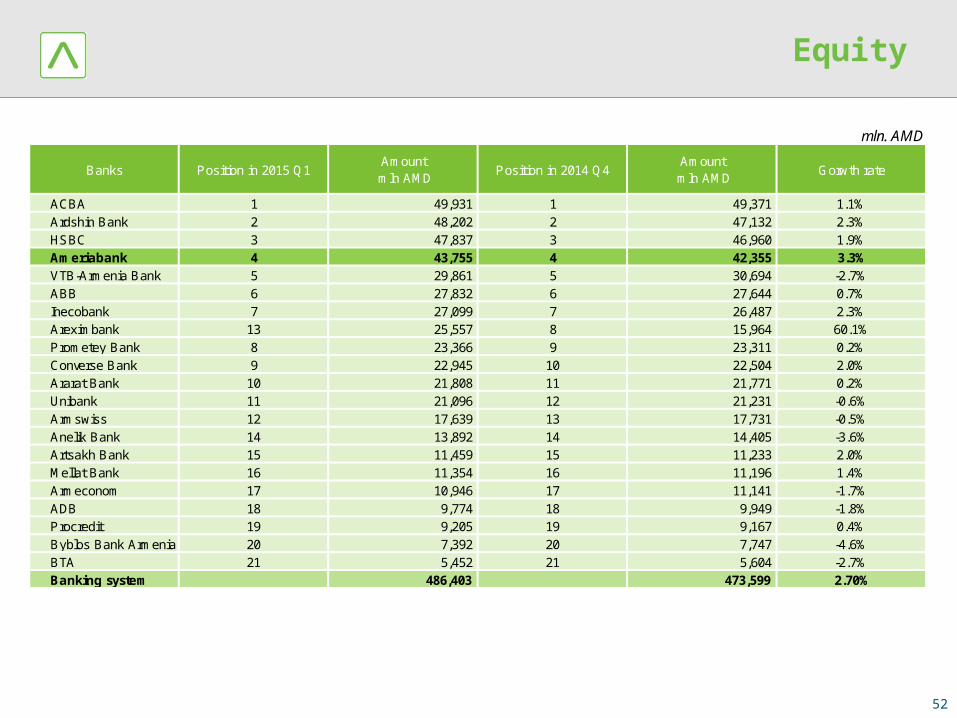
mln. AMD
ACBA 1 49,931 1 49,371 1.1%Ardshin Bank 2 48,202 2 47,132 2.3%HSBC 3 47,837 3 46,960 1.9%Ameriabank 4 43,755 4 42,355 3.3%VTB-Armenia Bank 5 29,861 5 30,694 -2.7%ABB 6 27,832 6 27,644 0.7%Inecobank 7 27,099 7 26,487 2.3%Areximbank 13 25,557 8 15,964 60.1%Prometey Bank 8 23,366 9 23,311 0.2%Converse Bank 9 22,945 10 22,504 2.0%Ararat Bank 10 21,808 11 21,771 0.2%Unibank 11 21,096 12 21,231 -0.6%Armswiss 12 17,639 13 17,731 -0.5%Anelik Bank 14 13,892 14 14,405 -3.6%Artsakh Bank 15 11,459 15 11,233 2.0%Mellat Bank 16 11,354 16 11,196 1.4%Armeconom 17 10,946 17 11,141 -1.7%ADB 18 9,774 18 9,949 -1.8%Procredit 19 9,205 19 9,167 0.4%Byblos Bank Armenia 20 7,392 20 7,747 -4.6%BTA 21 5,452 21 5,604 -2.7%Banking system 486,403 473,599 2.70%
Banks Position in 2015 Q1Amount
mln AMDPosition in 2014 Q4
Amount mln AMD
Gorwth rate
Net Profit
53
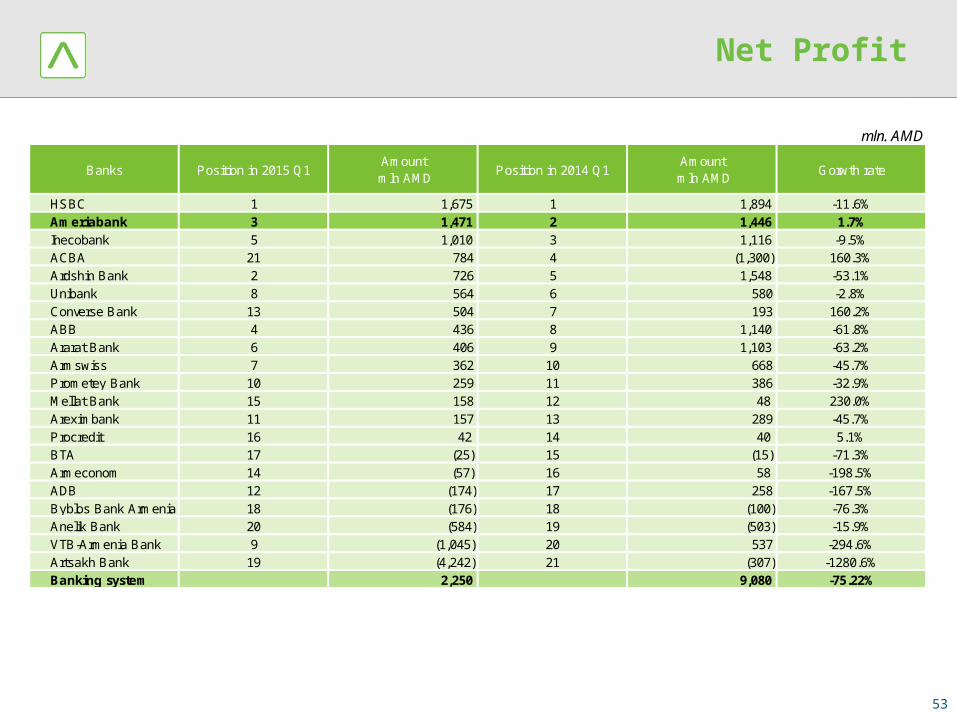
mln. AMD
HSBC 1 1,675 1 1,894 -11.6%Ameriabank 3 1,471 2 1,446 1.7%Inecobank 5 1,010 3 1,116 -9.5%ACBA 21 784 4 (1,300) 160.3%Ardshin Bank 2 726 5 1,548 -53.1%Unibank 8 564 6 580 -2.8%Converse Bank 13 504 7 193 160.2%ABB 4 436 8 1,140 -61.8%Ararat Bank 6 406 9 1,103 -63.2%Armswiss 7 362 10 668 -45.7%Prometey Bank 10 259 11 386 -32.9%Mellat Bank 15 158 12 48 230.0%Areximbank 11 157 13 289 -45.7%Procredit 16 42 14 40 5.1%BTA 17 (25) 15 (15) -71.3%Armeconom 14 (57) 16 58 -198.5%ADB 12 (174) 17 258 -167.5%Byblos Bank Armenia 18 (176) 18 (100) -76.3%Anelik Bank 20 (584) 19 (503) -15.9%VTB-Armenia Bank 9 (1,045) 20 537 -294.6%Artsakh Bank 19 (4,242) 21 (307) -1280.6%Banking system 2,250 9,080 -75.22%
Gorwth rateBanks Position in 2015 Q1Amount
mln AMDPosition in 2014 Q1
Amount mln AMD
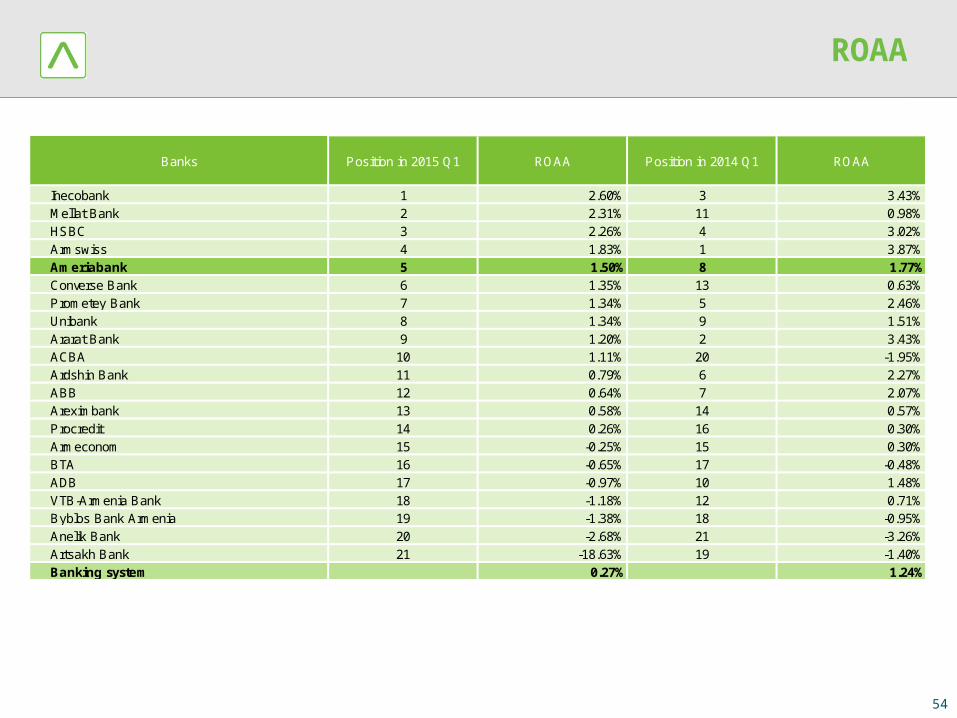
ROAA
54
1 2.60% 3 3.43%2 2.31% 11 0.98%3 2.26% 4 3.02%4 1.83% 1 3.87%5 1.50% 8 1.77%6 1.35% 13 0.63%7 1.34% 5 2.46%8 1.34% 9 1.51%9 1.20% 2 3.43%
10 1.11% 20 -1.95%11 0.79% 6 2.27%12 0.64% 7 2.07%13 0.58% 14 0.57%14 0.26% 16 0.30%15 -0.25% 15 0.30%16 -0.65% 17 -0.48%17 -0.97% 10 1.48%18 -1.18% 12 0.71%19 -1.38% 18 -0.95%20 -2.68% 21 -3.26%21 -18.63% 19 -1.40%
0.27% 1.24%
Position in 2015 Q1 ROAA Position in 2014 Q1 ROAABanks
InecobankMellat Bank
ArmswissHSBC
AreximbankABBArdshin BankACBAArarat Bank UnibankPrometey Bank Converse Bank Ameriabank
Banking systemArtsakh BankAnelik Bank Byblos Bank ArmeniaVTB-Armenia Bank ADBBTA ArmeconomProcredit
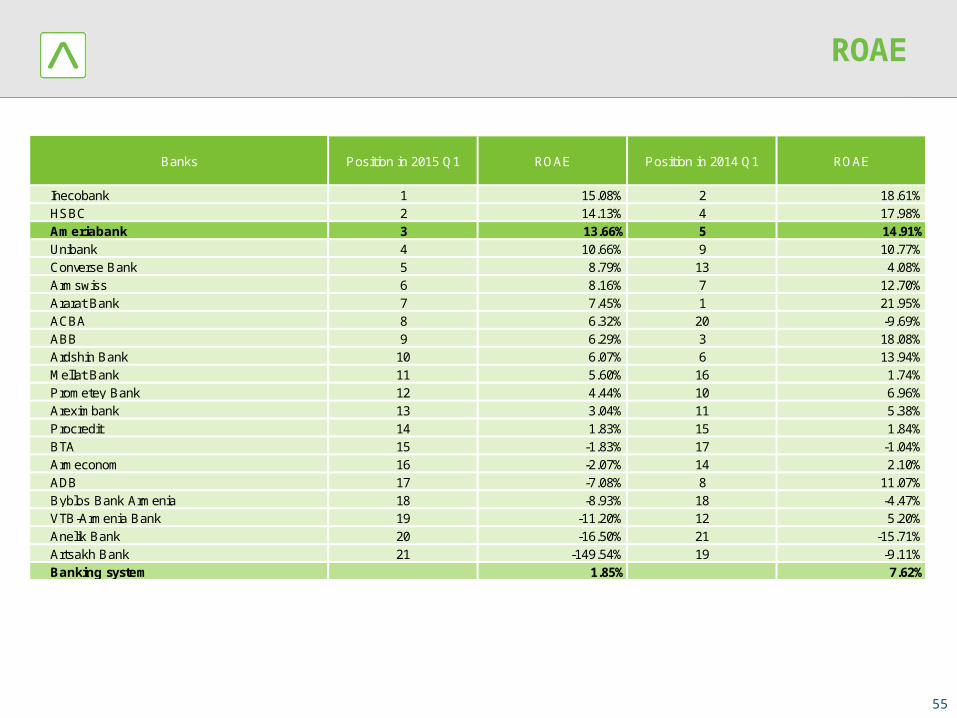
ROAE
55
1 15.08% 2 18.61%2 14.13% 4 17.98%3 13.66% 5 14.91%4 10.66% 9 10.77%5 8.79% 13 4.08%6 8.16% 7 12.70%7 7.45% 1 21.95%8 6.32% 20 -9.69%9 6.29% 3 18.08%
10 6.07% 6 13.94%11 5.60% 16 1.74%12 4.44% 10 6.96%13 3.04% 11 5.38%14 1.83% 15 1.84%15 -1.83% 17 -1.04%16 -2.07% 14 2.10%17 -7.08% 8 11.07%18 -8.93% 18 -4.47%19 -11.20% 12 5.20%20 -16.50% 21 -15.71%21 -149.54% 19 -9.11%
1.85% 7.62%
ROAE
InecobankHSBC
Banks
AmeriabankUnibankConverse Bank ArmswissArarat Bank ACBA
Position in 2015 Q1 ROAE Position in 2014 Q1
BTA ArmeconomADBByblos Bank ArmeniaVTB-Armenia Bank Anelik Bank
ABBArdshin BankMellat Bank Prometey Bank AreximbankProcredit
Artsakh BankBanking system
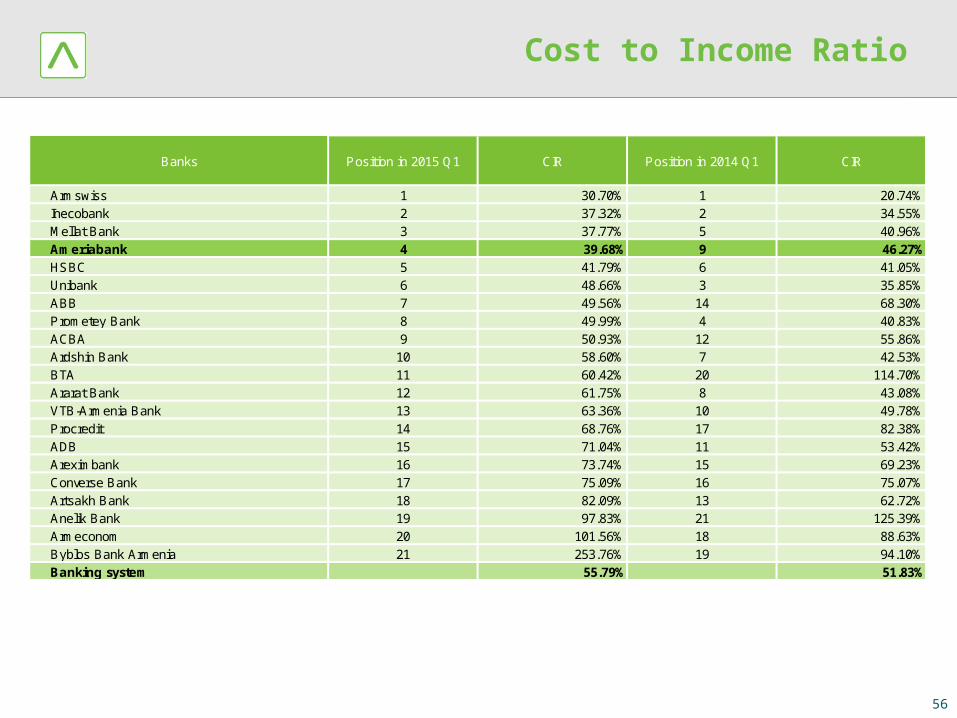
Cost to Income Ratio
56
1 30.70% 1 20.74%2 37.32% 2 34.55%3 37.77% 5 40.96%4 39.68% 9 46.27%5 41.79% 6 41.05%6 48.66% 3 35.85%7 49.56% 14 68.30%8 49.99% 4 40.83%9 50.93% 12 55.86%
10 58.60% 7 42.53%11 60.42% 20 114.70%12 61.75% 8 43.08%13 63.36% 10 49.78%14 68.76% 17 82.38%15 71.04% 11 53.42%16 73.74% 15 69.23%17 75.09% 16 75.07%18 82.09% 13 62.72%19 97.83% 21 125.39%20 101.56% 18 88.63%21 253.76% 19 94.10%
55.79% 51.83%Byblos Bank ArmeniaBanking system
ADBAreximbankConverse Bank Artsakh BankAnelik Bank Armeconom
ACBAArdshin BankBTA Ararat Bank VTB-Armenia Bank Procredit
Mellat Bank AmeriabankHSBCUnibankABBPrometey Bank
Position in 2015 Q1 CIR Position in 2014 Q1 CIR
ArmswissInecobank
Banks
Disclaimer
The information contained in this presentation has not been independently verified and no representation or warranty expressed or implied is made as to, and no reliance should be placed on, the fairness, accuracy, completeness or correctness of this information or opinions contained herein. None of Ameriabank cjsc or any of its affiliates, advisors or representatives shall have any liability whatsoever (in negligence or otherwise) for any loss howsoever arising from any use of this document or its content or otherwise arising in connection with this document. This document does not constitute any offer and neither it nor any part of it shall form the basis of or be relied upon in connection with any contract or commitment whatsoever.
This presentation contains forward-looking statements. Forward-looking statements are statements that are not historical facts; they include statements about our beliefs and expectations and the assumptions underlying them. These statements are based on plans, estimates and projections as they are currently available to the management of Ameriabank. Forward-looking statements therefore speak only as of the date they are made, and we undertake no obligation to update publicly any of them in light of new information or future events. By their very nature, forward-looking statements involve risks and uncertainties. A number of important factors could therefore cause actual results to differ materially from those contained in any forward-looking statement. Copies of this document are readily available upon request or can be downloaded from www.ameriabank.am.
57
Lousinè VardanyanHead of Ameria Group Investor Relations
[email protected]@ameriabank.am
9 G. Lusavorich street, Yerevan0015, Republic of Armenia
Phone: + 374 10 561111Fax: +37410 513133E-mail: [email protected]
Related Documents


