RESEARCH ARTICLE Open Access Amenable mortality as a performance indicator of Italian health-care services Maria P Fantini 1*† , Jacopo Lenzi 1† , Giuseppe Franchino 1† , Cristina Raineri 1† , Alessandra Burgio 2† , Luisa Frova 2† , Gianfranco Domenighetti 3† , Walter Ricciardi 4† and Gianfranco Damiani 4† Abstract Background: Mortality amenable to health-care services (‘amenable mortality’) has been defined as “premature deaths that should not occur in the presence of timely and effective health care” and as “conditions for which effective clinical interventions exist.” We analyzed the regional variability in health-care services using amenable mortality as a performance indicator. Convergent validity was examined against other indicators, such as health expenditure, GDP per capita, life expectancy at birth, disability-free life expectancy at age 15, number of diagnostic and laboratory tests per 1,000 inhabitants, and the prevalence of cancer and cardiovascular diseases. Methods: Amenable mortality rate was calculated as the average annual number of deaths in the population aged 0–74 years per 100,000 inhabitants, and it was then stratified by gender and region. Data were drawn from national mortality statistics for the period 2006–08. Results: During the study period (2006–08), the age-standardized death rate (SDR) amenable to health-care services in Italy was 62.6 per 100,000 inhabitants: 66.0 per 100,000 for males and 59.1 per 100,000 for females. Significant regional variations ranged from 54.1 per 100,000 inhabitants in Alto Adige to 76.3 per 100,000 in Campania. Regional variability in SDR was examined separately for male and females. The variability proved to be statistically significant for both males and females (males: Q-test = 638.5, p < 0.001; females: Q-test = 700.1, p < 0.001). However, among men, we found a clear-cut divide in SDR values between Central and Southern Italy; among women, this divide was less pronounced. Amenable mortality was negatively correlated with life expectancy at birth for both genders (male: r = -0.64, p = 0.002; female: r = -0.88, p <0.001) and with disability-free life expectancy at age 15 (male: r = -0.70, p <0.001; female: r = -0.67, p <0.001). Amenable mortality displayed a statistically significant negative relationship with GDP per capita, the quantity of diagnostic and laboratory tests per 1,000 inhabitants, and the prevalence of cancer. Conclusions: Amenable mortality shows a wide variation across Italian regions and an inverse relationship with life expectancy and GDP per capita, as expected. Keywords: Amenable mortality, Health-care services performance, Socioeconomic status, Gender Background The performance of health-care systems in terms of maximizing population health has been a major concern of policy makers [1-5]. Explicit frameworks defining the goals of a health system, against specific outcomes and performance indicators are required [6]. In recent years, the concept of amenable mortality has been used as a proxy for performance of health-care sys- tems by Nolte and McKee [7-9] and Tobias and Yeh [10]. These authors took the term “amenable mortality”, developed by European researchers in the 1980s and 1990s [8,11], to assess the quality and performance of health systems over time [8,9]. Mortality amenable to health-care services (hereafter amenable mortality) has been defined as “premature deaths that should not occur in the presence of timely and effective health care” [9] and as “conditions for * Correspondence: [email protected] † Equal contributors 1 Department of Medicine and Public Health, Alma Mater Studiorum, University of Bologna, Bologna 40126, Italy Full list of author information is available at the end of the article © 2012 Fantini et al.; licensee BioMed Central Ltd. This is an Open Access article distributed under the terms of the Creative Commons Attribution License (http://creativecommons.org/licenses/by/2.0), which permits unrestricted use, distribution, and reproduction in any medium, provided the original work is properly cited. Fantini et al. BMC Health Services Research 2012, 12:310 http://www.biomedcentral.com/1472-6963/12/310

Welcome message from author
This document is posted to help you gain knowledge. Please leave a comment to let me know what you think about it! Share it to your friends and learn new things together.
Transcript

Fantini et al. BMC Health Services Research 2012, 12:310http://www.biomedcentral.com/1472-6963/12/310
RESEARCH ARTICLE Open Access
Amenable mortality as a performance indicator ofItalian health-care servicesMaria P Fantini1*†, Jacopo Lenzi1†, Giuseppe Franchino1†, Cristina Raineri1†, Alessandra Burgio2†, Luisa Frova2†,Gianfranco Domenighetti3†, Walter Ricciardi4† and Gianfranco Damiani4†
Abstract
Background: Mortality amenable to health-care services (‘amenable mortality’) has been defined as “prematuredeaths that should not occur in the presence of timely and effective health care” and as “conditions for whicheffective clinical interventions exist.” We analyzed the regional variability in health-care services using amenablemortality as a performance indicator. Convergent validity was examined against other indicators, such as healthexpenditure, GDP per capita, life expectancy at birth, disability-free life expectancy at age 15, number of diagnosticand laboratory tests per 1,000 inhabitants, and the prevalence of cancer and cardiovascular diseases.
Methods: Amenable mortality rate was calculated as the average annual number of deaths in the population aged0–74 years per 100,000 inhabitants, and it was then stratified by gender and region. Data were drawn from nationalmortality statistics for the period 2006–08.
Results: During the study period (2006–08), the age-standardized death rate (SDR) amenable to health-care servicesin Italy was 62.6 per 100,000 inhabitants: 66.0 per 100,000 for males and 59.1 per 100,000 for females. Significantregional variations ranged from 54.1 per 100,000 inhabitants in Alto Adige to 76.3 per 100,000 in Campania.Regional variability in SDR was examined separately for male and females. The variability proved to be statisticallysignificant for both males and females (males: Q-test = 638.5, p < 0.001; females: Q-test = 700.1, p < 0.001).However, among men, we found a clear-cut divide in SDR values between Central and Southern Italy; amongwomen, this divide was less pronounced. Amenable mortality was negatively correlated with life expectancy atbirth for both genders (male: r = −0.64, p = 0.002; female: r = −0.88, p <0.001) and with disability-free lifeexpectancy at age 15 (male: r = −0.70, p <0.001; female: r = −0.67, p <0.001). Amenable mortality displayed astatistically significant negative relationship with GDP per capita, the quantity of diagnostic and laboratory testsper 1,000 inhabitants, and the prevalence of cancer.
Conclusions: Amenable mortality shows a wide variation across Italian regions and an inverse relationship withlife expectancy and GDP per capita, as expected.
Keywords: Amenable mortality, Health-care services performance, Socioeconomic status, Gender
BackgroundThe performance of health-care systems in terms ofmaximizing population health has been a major concernof policy makers [1-5]. Explicit frameworks defining thegoals of a health system, against specific outcomes andperformance indicators are required [6].
* Correspondence: [email protected]†Equal contributors1Department of Medicine and Public Health, Alma Mater Studiorum,University of Bologna, Bologna 40126, ItalyFull list of author information is available at the end of the article
© 2012 Fantini et al.; licensee BioMed CentralCommons Attribution License (http://creativecreproduction in any medium, provided the or
In recent years, the concept of amenable mortality hasbeen used as a proxy for performance of health-care sys-tems by Nolte and McKee [7-9] and Tobias and Yeh[10]. These authors took the term “amenable mortality”,developed by European researchers in the 1980s and1990s [8,11], to assess the quality and performance ofhealth systems over time [8,9].Mortality amenable to health-care services (hereafter
amenable mortality) has been defined as “prematuredeaths that should not occur in the presence of timelyand effective health care” [9] and as “conditions for
Ltd. This is an Open Access article distributed under the terms of the Creativeommons.org/licenses/by/2.0), which permits unrestricted use, distribution, andiginal work is properly cited.

Fantini et al. BMC Health Services Research 2012, 12:310 Page 2 of 12http://www.biomedcentral.com/1472-6963/12/310
which effective clinical interventions exist” [10]. Asmight be expected, the correlation between amenablemortality rates and life expectancy is high since amen-able mortality is, by definition, included in overall mor-tality, even if amenable mortality rates may differ incountries with similar life expectancy at birth [11]. Fur-thermore, amenable mortality also correlates withdisability-adjusted life expectancy with better face valid-ity [7].Nolte and McKee carried out a comprehensive study
[9] of amenable mortality in 19 Organization for Eco-nomic Co-operation and Development (OECD) coun-tries between 1997–98 and 2002–03, and they found aclear decline in amenable mortality in all the countriesinvestigated. In that study, Italy showed a reduction inamenable mortality from 88.7 per 100,000 (1997–98) to74.0 per 100,000 (2002), and in 2002 it ranked fifthamong the 19 OECD countries.Another recent study [11] has provided estimates of
amenable mortality for a large set (31) of OECD countries,and it assessed the sensitivity of this indicator by compar-ing the two widely used lists (those of Nolte and McKee[9] and Tobias and Yeh [10]). Results published by theOECD [11] show that in 2007 age-standardized amenablemortality rates ranged from 60 to 200 deaths per 100,000in the OECD countries. The above two lists provided simi-lar results for most countries. Eastern European countriesand Mexico had the highest rates; Japan, France, Italy,Sweden, and Iceland had the lowest ones. Mortality ratesfor Italy (2006 data) ranged from 65 deaths per 100,000(Nolte and McKee’s list) to 71 per 100,000 (Tobias andYeh’s list). Italy ranked third in both lists.
PiedmontAosta Valley
LombardyAlto Adige
TrentinoVeneto
Friuli-Venezia GiuliaLiguria
Emilia-RomagnaTuscany
UmbriaMarche
LazioAbruzzo
MoliseCampania
PugliaBasilicataCalabria
SicilySardinia
50 55 60
SDR
Figure 1 Forest plot showing the regional SDRs (with 95% confidenceyears 2006–08.
Amenable mortality is also a useful indicator for meas-uring the performance of health-care systems. As a strat-egy to deal with shrinking resources while increasinglocal government accountability, efficiency, quality, andinnovation in the health-care sector, the process ofdecentralization of powers from national to regionallevels has been widely implemented across Europeanhealth-care systems [12]. Therefore, the distribution ofpowers between central and regional levels as well astheir respective roles in funding and providing health-care services is crucial.In Italy, the central government is responsible for na-
tional health planning and annual funding. It also hasthe exclusive power to set the so-called essential levelsof care (Livelli Essenziali di Assistenza; LEAs), an expli-cit, publicly funded health-benefit package to which allcitizens are entitled. Regions have virtually exclusive re-sponsibility for the organization and administration ofpublicly financed health care [13]. Therefore, monitoringthe performance of regional levels of the health-care sys-tem has become of increasing interest in policy decisionmaking.The aim of this study was twofold. The first was to
analyze the regional variability in health-care servicesusing amenable mortality as a performance indicator.The second was to examine the convergent validity ofamenable mortality against other indicators, such ashealth expenditure, GDP per capita, life expectancy atbirth, disability-free life expectancy at age 15, numberof diagnostic and laboratory tests per 1,000 inhabi-tants, and the prevalence of cancer and cardiovasculardiseases.
65 70 75 80
with 95%CIs (x100,000)
intervals [CIs]) in relation to the Italian average (red line) for the

Piedmont
Aosta ValleyLombardy Veneto
Friuli-V.G.
LiguriaEmilia-Romagna
Tuscany
Umbria
Marche
Lazio
Abruzzo
Molise
Campania
Puglia
Basilicata
Calabria
Sicily
Sardinia
Alto Adige
Trentino
76.35
54.09
Figure 2 Geographical distribution of regional SDRs in Italy for the years 2006–08.
Fantini et al. BMC Health Services Research 2012, 12:310 Page 3 of 12http://www.biomedcentral.com/1472-6963/12/310

Fantini et al. BMC Health Services Research 2012, 12:310 Page 4 of 12http://www.biomedcentral.com/1472-6963/12/310
MethodsA cross-sectional study was carried out on individualdata from national mortality statistics for the period2006–08 using data from the Italian National Instituteof Statistics (ISTAT), where the causes of death arecoded using the ICD-10 classification. Nolte andMcKee [7-9] and Tobias and Yeh [10] prepared twodifferent lists of causes of death amenable to health-care [7]. These two lists were used by OECD to gener-ate estimates of amenable mortality for 31 countries[11]. After reviewing the two sets of estimates ofamenable mortality for OECD countries provided byNolte and McKee’s and Tobias and Yeh’s lists, wedecided to choose Nolte and McKee’s list because itoffers on average more conservative figures.Amenable mortality rate was calculated as the average
annual number of deaths over the population aged0–74 years per 100,000 inhabitants, and it was thenstratified by gender, region (19 regions and the twoautonomous provinces of Trentino and Alto Adige) and10 disease categories defined by Gay et al. in an OECDreport (see Additional file 1: Table S1) [11]. We com-puted age-standardized death rates (SDRs) using the2005 OECD population as the standard population.Forest plots and Cochrane’s Q-test were used to com-
pare the regional SDRs with the Italian average. Wecomputed 95% confidence intervals using Chiang’s nor-mal approximation to Poisson distribution [14]. Regional
Piedmont
Aosta Valley
Lombardy
Alto Adige
Trentino
Veneto
Friuli-Venezia Giulia
Liguria
Emilia-Romagna
Tuscany
Umbria
Marche
Lazio
Abruzzo
Molise
Campania
Puglia
Basilicata
Calabria
Sicily
Sardinia
40 50 60 70 80SDR with 95%CIs (x100,000)
Males
Figure 3 Forest plots showing the regional SDRs (with 95% CIs) by ge2006–08.
SDRs for specific disease categories were plotted in rela-tion to the Italian average using radar graphs.We examined the relationship between amenable mor-
tality and life expectancy at birth as well as disability-free life expectancy at age 15, using linear regressionmodels stratified by gender as suggested in the literature[7,11]. Disability-free life expectancy at age 15 indicatesthe expected number of healthy life-years. Linear regres-sion models were also used to analyze the relationshipbetween regional SDRs and public health expenditureper capita, GDP per capita, number of diagnostic and la-boratory tests per 1,000 inhabitants, cancer prevalence,and prevalence of cardiovascular diseases.Disability-free life expectancy, cancer prevalence, and
prevalence of cardiovascular diseases were drawn fromthe ISTAT Multiscope National Survey [15]. Publichealth expenditure and GDP per capita were drawn fromRapporto Osservasalute for 2011 [16]. The number ofdiagnostic and laboratory tests was taken from the Min-istry of Health data on health-care activities [17].Results are provided by regions. Northern Italy
includes Piedmont, Aosta Valley, Lombardy, Alto Adige,Trentino, Veneto, Friuli-Venezia Giulia, Liguria andEmilia-Romagna; Central Italy includes Tuscany, Umbria,Marche and Lazio; Southern Italy includes Abruzzo,Molise, Campania, Puglia, Basilicata, Calabria, Sicily, andSardinia. Statistical analyses were performed using Stata11 [18].
Piedmont
Aosta Valley
Lombardy
Alto Adige
Trentino
Veneto
Friuli-Venezia Giulia
Liguria
Emilia-Romagna
Tuscany
Umbria
Marche
Lazio
Abruzzo
Molise
Campania
Puglia
Basilicata
Calabria
Sicily
Sardinia
40 50 60 70 80SDR with 95%CIs (x100,000)
Females
nder in relation to the Italian average (red line) for the years

Fantini et al. BMC Health Services Research 2012, 12:310 Page 5 of 12http://www.biomedcentral.com/1472-6963/12/310
ResultsDifferences in amenable mortality among Italian regionsDuring the study period (2006–08), the SDR in Italywas 62.6 per 100,000 inhabitants: 66.0 per 100,000 formales and 59.1 per 100,000 for females. Figures 1 and 2shows the regional distribution of SDRs. A statisticallysignificant regional variation was found, with a rangefrom 54.1 per 100,000 in Alto Adige to 76.3 per100,000 in Campania. Specifically, results indicate thatfor five regions (Piedmont, Lazio, Campania, Calabria,and Sicily), SDRs were statistically significantly higherthan the national average, whereas for six regions(Aosta Valley, Friuli-Venezia Giulia, Abruzzo, Molise,Basilicata, and Sardinia) the rates did not differ
Figure 4 a. Radar plot showing the regional SDRs for cancers in relatb. Radar plot showing the regional SDRs for cardiovascular diseases in relat
statistically significantly from the national average. Fi-nally, in ten regions (Lombardy, Trentino, Alto Adige,Veneto, Liguria, Emilia-Romagna, Tuscany, Umbria,Marche, and Puglia), SDRs were statistically signifi-cantly lower than the national average. Southern Italygenerally had higher SDRs than Northern Italy, exceptfor Piedmont and Puglia.Figure 3 shows the regional distribution of SDRs by
gender. The regional variability proved to be statisticallysignificant for both males and females (males: Q-test =638.5, p < 0.001; females: Q-test = 700.1, p < 0.001).However, among men, we found a clear-cut divide inSDR values between Central and Southern Italy; specific-ally, in general 95% CIs of SDRs exceeded the national
ion to the Italian average (black line) for the years 2006–08.ion to the Italian average (black line) for the years 2006–08.

Fantini et al. BMC Health Services Research 2012, 12:310 Page 6 of 12http://www.biomedcentral.com/1472-6963/12/310
value in Southern regions, while in Northern and Cen-tral regions were lower than the national average.Among women, the regional variability proved to begreater than among men, but 95% CIs of regional SDRsdid not reveal a clear-cut geographical pattern. Campaniahad the highest gender-specific SDRs.Cancer and cardiovascular diseases were the lead-
ing causes of amenable mortality (23.0 and 29.3 per100,000) and accounted, respectively, for 36.5% and49.0% of overall amenable mortality. Figure 4a, bshows the radar plots of the regional SDRs compared with
Campania
Friuli-Venezia Giulia
Sardin
Sic
5060
7080
90S
DR
(x1
00,0
00)
77 77.5 78 7Life expec
r(p-value)=-0.6377(0.0019)
Bas
Calabria
Campania
E
Friuli-Venezia G
LazLiguria
Piedmont
Sicily
Aosta Valley
4050
6070
80S
DR
(x1
00,0
00)
82.5 83 83.5Life expec
r(p-value)=-0.8822(<0.0001)
a
b
Figure 5 a. Amenable mortality vs. life expectancy at birth (males) fob. Amenable mortality vs. life expectancy at birth (females) for the year 200
the national average for these diseases. Though regionalSDRs for cancer exhibited a limited departure from the na-tional average, regional SDRs for cardiovascular diseaseswere above the mean in Southern Italy and below themean in Central and Northern Italy.
Convergent validity of the indicatorTo investigate the convergent validity of amenablemortality, we examined the association betweenSDRs and some health indicators. We observed astatistically significant negative correlation between
Abruzzo
Basilicata
Calabria
Emilia-Romagna
Lazio
LiguriaLombardy
Marche
Molise
Piedmont
Puglia
ia
ily
TuscanyTrentinoAlto Adige
UmbriaAosta Valley
Veneto
8.5 79 79.5 80tancy at birth
Abruzzo
ilicata
milia-Romagna
iulia
io
Lombardy
Marche
Molise
Puglia Sardinia
Tuscany
Trentino
Alto Adige
Umbria
Veneto
84 84.5 85 85.5tancy at birth
r the year 2008 (males). Data source: Health for All 2011 [19].8. Data source: Health for All 2011 [19].

Piedmont
Aosta Valley
Lombardy
Alto Adige
Trentino
Veneto
Friuli-Venezia Giulia
Liguria
Emilia-Romagna
Tuscany
Umbria
Marche
Lazio
Abruzzo
Molise
Campania
Puglia
Basilicata
Calabria
Sicily
Sardinia
4050
6070
80S
DR
(x1
00,0
00),
200
6
61 62 63 64 65 66Disability-free life expectancy at age 15, 2005
r(p-value)=-0.6705(0.0009)
Piedmont
Aosta Valley
LombardyAlto Adige Trentino
Veneto
Friuli-Venezia Giulia
Liguria
Emilia-RomagnaTuscany
Umbria Marche
LazioAbruzzo
Molise
Campania
Puglia
Basilicata
CalabriaSicily
Sardinia50
6070
8090
SD
R (
x100
,000
), 2
006
59 59.5 60 60.5 61 61.5Disability-free life expectancy at age 15, 2005
r(p-value)=-0.7027(0.0004)
a
b
Figure 6 a. Amenable mortality vs. disability-free life expectancy at age 15 (males). Data source: Indagine Istat su condizioni di salute ericorso ai servizi sanitari 2004–2005 [15]. b. Amenable mortality vs. disability-free life expectancy at age 15 (females). Data source: Indagine Istat sucondizioni di salute e ricorso ai servizi sanitari 2004–2005 [15].
Fantini et al. BMC Health Services Research 2012, 12:310 Page 7 of 12http://www.biomedcentral.com/1472-6963/12/310
SDR and life expectancy at birth for both genders(male: r = −0.64, p = 0.002; female: r = −0.88, p <0.001) (Figure 5a, b) [19] and between SDR anddisability-free life expectancy at age 15 (male: r =−0.70, p < 0.001; female: r =−0.67, p < 0.001)(Figure 6a, b). Furthermore, we found a statisticallysignificant inverse relationship between SDR and theregional prevalence of cancer (r = −0.53; p = 0.013)(Figure 7) and a non statistically significant negative correl-ation between SDR and the prevalence of cardiovasculardiseases (r = −0.43; p = 0.051) (Figure 8).
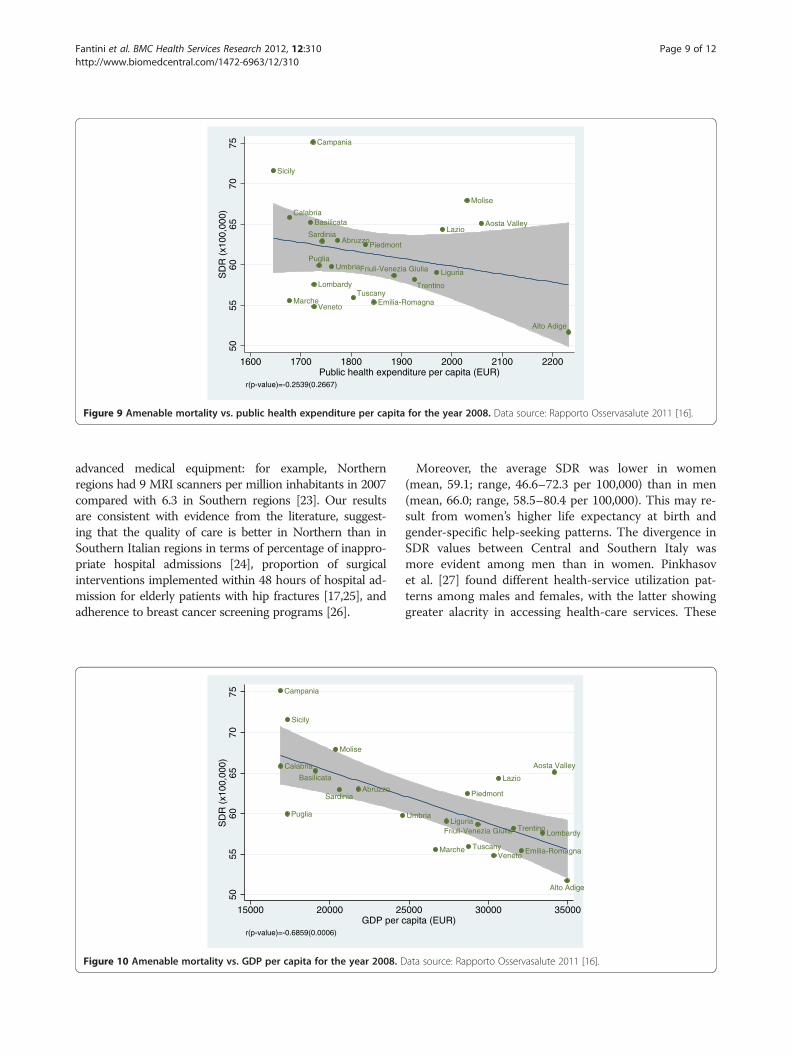
Relationship of amenable mortality with socioeconomicindicatorsWhen we examined the effect of socioeconomic andresource-consumption indicators on SDRs, we found anon statistically significant association between SDR andpublic health spending per capita (r = −0.25; p = 0.267)(Figure 9); however, we found a strong negative correl-ation between SDR and GDP per capita (r = −0.69;p < 0.001) (Figure 10) and between SDR and num-ber of diagnostic and laboratory tests per 1,000 inha-bitants (r = −0.52; p = 0.016) (Figure 11).

Piedmont
Aosta Valley
Lombardy
Alto Adige
Trentino
Veneto
Friuli-Venezia Giulia
Liguria
Emilia-Romagna
TuscanyUmbria
Marche
Lazio
Abruzzo
Molise
Campania
Puglia
Basilicata Calabria
Sicily
Sardinia50
6070
80S
DR
(x1
00,0
00),
200
6
4 6 8 10 12 14Cancer prevalence (x1,000), 2005
r(p-value)=-0.5299(0.0135)
Figure 7 Amenable mortality vs. cancer prevalence; cancer includes all types of malignant tumors. Data source: Indagine Istat sucondizioni di salute e ricorso ai servizi sanitari 2004–2005 [15].
Fantini et al. BMC Health Services Research 2012, 12:310 Page 8 of 12http://www.biomedcentral.com/1472-6963/12/310
DiscussionEvidence from the most recent studies indicates thatamenable mortality can be used to assess health-careperformance across countries over time. Italy showedthe third-lowest amenable mortality in 2005 among 31OECD countries, indicating a good performance ofhealth-care services [11].Our study shows that for the period 2006–08, the SDR
was 62.6 per 100,000 inhabitants, though there were re-gional differences with a clear-cut divide being evident
Piedmont
Alto Adige
Trentino
Tuscany
Lazio
Molise
Campania
Puglia
Basilicata C
Sicily
5560
6570
7580
SD
R (
x100
,000
), 2
006
.8 .9 1Relative prevalence of ca
r(p-value)=-0.4308(0.0513)
Figure 8 Amenable mortality vs. relative prevalence of cardiovascularinfarction, and angina pectoris. Data source: Indagine Istat su condizioni
between Central and Southern Italy. In Italy, disparities inthe geographical distribution have been documented foreducational level (percentage of the population with onlyelementary education: 22.5% in the North and 27.2% in theSouth) [20], income (family average net income: 37,440euros in the North and 27,971 euros in the South) [21], andpoverty (incidence of relative poverty: 4.9% in the Northand 23.0% in the South) [22]. With regard to health-caresupply, Southern regions have a smaller number of hospitalbeds, more private facilities, and a poorer endowment of
Aosta Valley
Lombardy
Veneto
Friuli-Venezia Giulia
Liguria
Emilia-Romagna Umbria
Marche
Abruzzo
alabria
Sardinia
1.1 1.2 1.3rdiovascular diseases, 2005
diseases, including stroke, hypertension, acute myocardialdi salute e ricorso ai servizi sanitari 2004–2005 [15].
Piedmont
Aosta Valley
Lombardy
Alto Adige
Trentino
Veneto
Friuli-Venezia Giulia Liguria
Emilia-RomagnaTuscany
Umbria
Marche
LazioAbruzzo
Molise
Campania
Puglia
BasilicataCalabria
Sicily
Sardinia50
5560
6570
75S
DR
(x1
00,0
00)
1600 1700 1800 1900 2000 2100 2200Public health expenditure per capita (EUR)
r(p-value)=-0.2539(0.2667)
Figure 9 Amenable mortality vs. public health expenditure per capita for the year 2008. Data source: Rapporto Osservasalute 2011 [16].
Fantini et al. BMC Health Services Research 2012, 12:310 Page 9 of 12http://www.biomedcentral.com/1472-6963/12/310
advanced medical equipment: for example, Northernregions had 9 MRI scanners per million inhabitants in 2007compared with 6.3 in Southern regions [23]. Our resultsare consistent with evidence from the literature, suggest-ing that the quality of care is better in Northern than inSouthern Italian regions in terms of percentage of inappro-priate hospital admissions [24], proportion of surgicalinterventions implemented within 48 hours of hospital ad-mission for elderly patients with hip fractures [17,25], andadherence to breast cancer screening programs [26].
Abruzzo
Molise
Campania
Puglia
Basilicata
Calabria
Sicily
Sardinia
5055
6065
7075
SD
R (
x100
,000
)
15000 20000 25GDP per c
r(p-value)=-0.6859(0.0006)
Figure 10 Amenable mortality vs. GDP per capita for the year 2008. D
Moreover, the average SDR was lower in women(mean, 59.1; range, 46.6–72.3 per 100,000) than in men(mean, 66.0; range, 58.5–80.4 per 100,000). This may re-sult from women’s higher life expectancy at birth andgender-specific help-seeking patterns. The divergence inSDR values between Central and Southern Italy wasmore evident among men than in women. Pinkhasovet al. [27] found different health-service utilization pat-terns among males and females, with the latter showinggreater alacrity in accessing health-care services. These
Piedmont
Aosta Valley
Lombardy
Alto Adige
Trentino
Veneto
Friuli-Venezia GiuliaLiguria
Emilia-RomagnaTuscany
Umbria
Marche
Lazio
000 30000 35000apita (EUR)
ata source: Rapporto Osservasalute 2011 [16].

Piedmont
Aosta Valley
Lombardy
Alto Adige
Trentino
Veneto
Friuli-Venezia GiuliaLiguria
Emilia-Romagna
Tuscany
Umbria
Marche
LazioAbruzzo
Molise
Campania
Puglia
BasilicataCalabria
Sicily
Sardinia50
5560
6570
75S
DR
(x1
00,0
00)
6000 8000 10000 12000 14000Number of diagnostic and laboratory tests per 1,000 inhabitants
r(p-value)=-0.5181(0.0161)
Figure 11 Amenable mortality vs. number of diagnostic and laboratory tests per 1,000 inhabitants for the year 2008. Data source:Ministero della Salute – Sistema Informativo Sanitario 2008 [17].
Fantini et al. BMC Health Services Research 2012, 12:310 Page 10 of 12http://www.biomedcentral.com/1472-6963/12/310
gender-specific attitudes may have an impact on morbid-ity, mortality, and life expectancy.In our study, cancer and cardiovascular diseases
proved to be the leading causes of amenable mortality,accounting for 85.5% of the overall indicators. A greaterregional variability was found for cardiovascular diseasesthan for cancer. This finding may suggest that Nolte andMcKee’s list is especially sensitive to conditions forwhich effective and appropriate health care is essential,such as cardiovascular diseases.The convergent validity of amenable mortality with
some health indicators was partially supported by a highnegative correlation between SDR and life expectancy atbirth and disability-free life expectancy at age 15 forboth genders.Our study shows that amenable mortality is related to
GDP per capita, but not to health expenditure percapita. A possible interpretation of this finding is thatSDR is influenced by organizational and care deliverymodels and different priority settings—not by theamount of dedicated resources. Recently, Nagy et al. [28]also reported a positive association between amenablemortality and deprivation status in both genders.Several caveats should be noted in the use of amenable
mortality as an outcome indicator of health-system per-formance. First, it is important to note that thecategorization of a condition as amenable is essentiallybased on a judgment about the effectiveness of medicalinterventions in treating different conditions and pre-venting death [9]. Furthermore, the selection of causesof death that are “amenable to health care” is time-dependent: technological progress constantly increases
the opportunities to prevent premature deaths throughsecondary prevention and treatments. Therefore, the listof causes of death that are amenable to health carechanges over time and needs to be regularly updated[11]. However, our investigation was over a relativelyshort period of time (2006–08), during which there wasprobably no major change in this trend.Moreover, we chose to use Nolte and McKee’s list of
causes of death amenable to health-care. Unlike Tobiasand Yeh’s list, Nolte and McKee’s list included amongdeath causes adverse events to patients during surgicaland medical care, which are strongly related to qualityof care. Last, Tobias and Yeh’s list included amongthe death causes chronic obstructive pulmonary disease(age >45 years), whose prognosis is more related to life-style than to health care, and bladder and thyroid cancer,where treatment and surgical interventions are moder-ately effective.Second, the prevalence of diseases whose deaths are
amenable to health-care may vary across regions. For in-stance, if the prevalence of cancer is substantially higher inone region, this region will need to devote more resourcesto avoid deaths from this disease category [11]. To addressthis issue, we analyzed the relationship between amenablemortality and disease prevalence for cancer and cardiovas-cular diseases. We found evidence that amenable mortalitydisplays a negative relationship with the prevalence of can-cer. This may suggest that when this specific condition iscommon, health services become more experienced and ef-fective in treating the condition.Third, health-service performance may depend on the
quantity of resources available to provide effective
Fantini et al. BMC Health Services Research 2012, 12:310 Page 11 of 12http://www.biomedcentral.com/1472-6963/12/310
interventions. However, as previously noted, we discoveredno relationship between SDR and per capita public healthexpenditure.Keeping these limitations in mind, the present study pro-
vides, in the context of decentralization of powers in healthcare, an easily calculated, valid indicator for monitoring theperformance of health-care systems as a basis for evidence-based policy decision making. This indicator could be use-ful not only for a comparison between systems but also todetect variations in a health-care system over time. And theindicator could be a positive element in continuous effortsto improve the policies, organization and quality in adecentralized health-care system.
ConclusionsOur results highlight that, in line with other health-careperformance indicators, amenable mortality is lower inNorth and Central regions of Italy than in Southernregions. We argue that this indicator can be used to informpolicy decision-making processes in decentralized health-care systems and monitor their effectiveness and equity.Amenable mortality exhibits an inverse relationship withlife expectancy, prevalence of cancer and cardiovasculardiseases, and socioeconomic and resource consumptionindicators. Further investigation is warranted to analyze thetrend of SDRs at a subnational level over time.
Additional file
Additional file 1: Table S1. Nolte and McKee’s list of causes of deatharranged into 10 disease categories.
Competing interestsThe authors declare that they have no competing interests.
Authors’ contributionsMPF, GDa, and WR contributed to the conception of this paper. MPF andGDa conceived the study design; LF and AB provided data sources andparticipated in the study design. GF provided the acquisition of data; JL andCR conceived the statistical methodology and performed statistical analyses.GDa, MPF, GF, and JL drafted the manuscript. MPF and JL had full access toall of the data in the study and take responsibility for the integrity of thedata and accuracy of the data analysis. GDo critically revised the draft andcontributed to the final writing of the paper. All authors read and approvedthe final manuscript.
Author details1Department of Medicine and Public Health, Alma Mater Studiorum,University of Bologna, Bologna 40126, Italy. 2Health and Assistance Unit,Italian National Institute of Statistics, ISTAT, Rome, Italy. 3Institute of PublicCommunication and Institute of Microeconomics and Public Economics,University of Lugano, Lugano 6900, Switzerland. 4Department of PublicHealth, Università Cattolica del Sacro Cuore, Rome, Italy.
Received: 4 January 2012 Accepted: 4 September 2012Published: 10 September 2012
References1. Collins C, Green A, Hunter D: Health sector reform and the
interpretation of policy context. Health Policy 1999, 47(1):69–83.
2. Maynard A, Bloor K: Health care reform: informing difficult choices.Int J Health Plann Manag 1995, 10(4):247–264.
3. Strandberg-Larsen M, Schiøtz ML, Silver JD, Frølich A, Andersen JS,Graetz I, Reed M, Bellows J, Krasnik A, Rundall T, Hsu J: Is the KaiserPermanente model superior in terms of clinical integration?: acomparative study of Kaiser Permanente, Northern California andthe Danish healthcare system. BMC Health Serv Res 2010,10:91.
4. Strandberg-Larsen M: Measuring integrated care: an internationalcomparative study. Dan Med Bull 2011, 58(2):B4245.
5. Quam L, Smith R: US and UK health care: a special relationship?What can the UK and US health system learn from each other?BMJ 2005, 330(7490):530–533.
6. Smith P: Use of performance indicators in the public sector.J R Stat Soc 1990, 153(1):53–72.
7. Nolte E, McKee M: Measuring the health of nations: analysis ofmortality amenable to health care. BMJ 2003,327(7424):1129.
8. Nolte E, McKee M: Does health care save lives? Avoidable mortalityrevisited. London: Nuffield Trust; 2004.
9. Nolte E, McKee M: Measuring the health of nations: updating anearlier analysis. Health Aff 2008, 27(1):58–71.
10. Tobias M, Yeh LC: How much does health care contribute to healthgain and to health inequality? Trends in amenable mortality inNew Zealand 1981–2004. Aust N Z Public Health 2009,33(1):70–78.
11. Gay JG, Paris V, Devaux M, de Looper M: Mortality amenable to healthcare in 31 OECD countries: estimates and methodological issues. OECDPublishing: OECD Health Working Papers–No. 55; 2011.
12. Saltman RB, Bankauskaite V, Vrangbaek K: Decentralization in healthcare. Strategies and outcomes. In European Observatory on HealthSystems and Policy Series. Edited by McGraw-Hill Education. New York:Open University Press; 2007.
13. France G, Taroni F, Donatini A: The Italian health-care system. HealthEcon 2005, 14:S187–S202.
14. Chiang CL: Standard error of the age adjusted death rate. In VitalStatistics–Special Reports, Selected Studies. Edited by US Dept. of HEW.1961:275–285.
15. Istituto Nazionale di Statistica: Condizioni di salute, fattori di rischio ericorso ai servizi sanitari. 2005. Available from: http://www3.istat.it/salastampa/comunicati/non_calendario/20070302_00/.
16. Osservatorio Nazionale sulla: Salute delle Regioni Italiane. Milano:Rapporto Osservasalute; 2011.
17. Ministero della Salute – Sistema Informativo Sanitario: Attività diassistenza sanitaria. 2008. Available from: http://www.salute.gov.it/salaStampa/documenti/AA_7.pdf.
18. StataCorp: Stata Statistical Software: Release 11. College Station, TX:StataCorp LP; 2009.
19. Istituto Nazionale di Statistica: Health for All Italia – Sistemainformativo territoriale su sanità e salute. 2011. Available from: http://www.istat.it/it/archivio/14562.
20. Istituto Nazionale di Statistica: Forze di lavoro Media. 2009. Availablefrom: http://www3.istat.it/dati/catalogo/20101116_00/.
21. Istituto Nazionale di Statistica: Distribuzione del reddito e condizioni divita in Italia. 2009. Available from: http://www3.istat.it/salastampa/comunicati/non_calendario/20101229_00.
22. Geddes M: La povertà delle famiglie italiane e la manovra economica.2011. Available from: http://saluteinternazionale.info/2011/07/la-poverta-delle-famiglie-italiane-e-la-manovra-economica/.
23. Istituto Nazionale di Statistica: Struttura e attività degli istituti di cura.2007. Available from: http://www.istat.it/it/archivio/47158.
24. Agenzia Nazionale per i Servizi Sanitari Regionali: DRG a rischio diinappropriatezza, anni. 2004. Available from: http://www.agenas.it/agenas_pdf/43DRG_anni_2001-04_maggio_2007.pdf.
25. Carretta E, Bochicchio V, Rucci P, Fabbri G, Laus M, Fantini MP: Hipfracture: effectiveness of early surgery to prevent 30-day mortality.Int Orthop 2011, 35(3):419–424.
26. Osservatorio Nazionale Screening: Ottavo rapporto. Firenze.; 2009.27. Pinkhasov RM, Wong J, Kashanian J, Lee M, Samadi DB, Pinkhasov
MM, Shabsigh R: Are men shortchanged on health? Perspective

Fantini et al. BMC Health Services Research 2012, 12:310 Page 12 of 12http://www.biomedcentral.com/1472-6963/12/310
on health care utilization and health risk behavior in menand women in the United States. Int J Clin Pract 2010, 64(4):475–487.
28. Nagy C, Juhász A, Beale L, Páldy A: Mortality amenable to healthcare and its relation to socio-economic status in Hungary.Eur J Public Health 2004, in press.
doi:10.1186/1472-6963-12-310Cite this article as: Fantini et al.: Amenable mortality as a performanceindicator of Italian health-care services. BMC Health Services Research 201212:310.
Submit your next manuscript to BioMed Centraland take full advantage of:
• Convenient online submission
• Thorough peer review
• No space constraints or color figure charges
• Immediate publication on acceptance
• Inclusion in PubMed, CAS, Scopus and Google Scholar
• Research which is freely available for redistribution
Submit your manuscript at www.biomedcentral.com/submit
Related Documents


![Development and Health Introduction Standard Question [Sample Question] Infant Mortality Rate per 1000 live births is a social indicator of development.](https://static.cupdf.com/doc/110x72/56649e7a5503460f94b7b795/development-and-health-introduction-standard-question-sample-question-infant.jpg)