Ambient and excess mantle temperatures, olivine thermometry, and active vs. passive upwelling Keith D. Putirka a, ⁎ , Michael Perfit b , F.J. Ryerson c , Matthew G. Jackson d a California State University, Fresno, Department of Earth and Environmental Sciences, 2576 E. San Ramon Ave., MS/ST24, Fresno, CA 93710, USA b University of Florida, Department of Geological Sciences, Box 112120, Gainesville, FL 32611-2120, USA c Lawrence Livermore National Laboratory, Institute of Geophysics and Planetary Physics, L-206, Livermore, CA 94550, USA d MIT-Woods Hole Oceanographic Institution Joint Program, Woods Hole, MA, 02543, USA Accepted 22 January 2007 Abstract Mantle temperatures provide a key test of the mantle plume hypothesis, and olivine-liquid equilibria provide perhaps the most certain means of estimating mantle temperatures. Here, we review mantle temperature estimates and olivine thermometers, and calculate a new convective geotherm for the upper mantle. The convective geotherm is determined from estimates of sub-mid- ocean ridge (MOR) mantle potential temperatures (T p is the T the mantle would have if it rose adiabatically without melting, and provides a reference for measuring excess temperatures at volcanic hot spots; T ex = T p hot spot - T p MOR ). The Siqueiros Transform has high MgO glass compositions that have been affected only by olivine fractionation, and yields T p Siqueiros = 1441 ± 63 °C. Most mid- ocean ridge basalts (MORB) have slightly higher FeO liq than at Siqueiros; if Fo max (=91.5) and Fe 2+ –Mg exchange at Siqueiros apply globally, then upper mantle T p is closer to1466 ± 59 °C. Since our global MORB database was not filtered for hot spots besides Iceland, Siqueiros may in fact be representative of ambient mantle, so we average these estimates to obtain T p MOR = 1454 ± 81 °C; this value is used to calculate T ex . Global MORB variations in FeO liq indicate that 95% of the sub-MORB mantle has a global T range of ±140 °C; 68% of this range (1σ) exhibits temperature variations of ± 34 °C. Our estimate for T p MOR defines the convective mantle geotherm; this estimate is consistent with T estimates from sea floor bathymetry, and overlaps within 1σ estimates derived from phase transitions at the 410 km and 670 km seismic discontinuities. Mantle potential temperatures at Hawaii and Samoa are identical at 1722 °C and at Iceland is 1616 °C; hence T ex is ≈ 268 °C at Hawaii and Samoa and 162 °C at Iceland. Furthermore, T p estimates at Hawaii and Samoa exceed maximum T p estimates at MORs by N 100 °C. Our T ex estimates agree with estimates based on excess topography and dynamic models of mantle flow and melt generation. Rayleigh number calculations further show that if our values for T ex extend to depths as small as 135 km, thermally driven, active upwellings will ensue. Hawaii, Samoa and Iceland thus almost assuredly result from thermally driven active upwellings, or mantle plumes. Estimates of T ex account for generalized differences in H 2 O contents between ocean islands and MORs, and are robust against variations in CO 2 , and major element components, and thus cannot be explained away by the presence of volatiles or more fusible source materials. However, our temperature variations at MORs do not account for H 2 O variations within the MORB source region. © 2007 Elsevier B.V. All rights reserved. Keywords: Mantle plumes; Hot spots; Thermometry; Olivine; Geothermal gradient; Mid-ocean ridge 1. Overview The recent debate over the existence of mantle plumes has to some extent strayed from a fundamental issue: Do Chemical Geology 241 (2007) 177 – 206 www.elsevier.com/locate/chemgeo ⁎ Corresponding author. E-mail addresses: [email protected] (K.D. Putirka), [email protected] (M. Perfit), [email protected] (F.J. Ryerson), [email protected] (M.G. Jackson). 0009-2541/$ - see front matter © 2007 Elsevier B.V. All rights reserved. doi:10.1016/j.chemgeo.2007.01.014

Welcome message from author
This document is posted to help you gain knowledge. Please leave a comment to let me know what you think about it! Share it to your friends and learn new things together.
Transcript

(2007) 177–206www.elsevier.com/locate/chemgeo
Chemical Geology 241
Ambient and excess mantle temperatures, olivine thermometry, andactive vs. passive upwelling
Keith D. Putirka a,⁎, Michael Perfit b, F.J. Ryerson c, Matthew G. Jackson d
a California State University, Fresno, Department of Earth and Environmental Sciences, 2576 E. San Ramon Ave., MS/ST24, Fresno, CA 93710, USAb University of Florida, Department of Geological Sciences, Box 112120, Gainesville, FL 32611-2120, USA
c Lawrence Livermore National Laboratory, Institute of Geophysics and Planetary Physics, L-206, Livermore, CA 94550, USAd MIT-Woods Hole Oceanographic Institution Joint Program, Woods Hole, MA, 02543, USA
Accepted 22 January 2007
Abstract
Mantle temperatures provide a key test of the mantle plume hypothesis, and olivine-liquid equilibria provide perhaps the mostcertain means of estimating mantle temperatures. Here, we review mantle temperature estimates and olivine thermometers, andcalculate a new convective geotherm for the upper mantle. The convective geotherm is determined from estimates of sub-mid-ocean ridge (MOR) mantle potential temperatures (Tp is the T the mantle would have if it rose adiabatically without melting, andprovides a reference for measuring excess temperatures at volcanic hot spots; Tex=Tp
hot spot−TpMOR). The Siqueiros Transform hashigh MgO glass compositions that have been affected only by olivine fractionation, and yields Tp
Siqueiros =1441±63 °C. Most mid-ocean ridge basalts (MORB) have slightly higher FeOliq than at Siqueiros; if Fomax (=91.5) and Fe2+–Mg exchange at Siqueirosapply globally, then upper mantle Tp is closer to1466±59 °C. Since our global MORB database was not filtered for hot spotsbesides Iceland, Siqueiros may in fact be representative of ambient mantle, so we average these estimates to obtain Tp
MOR=1454±81 °C; this value is used to calculate Tex. Global MORB variations in FeOliq indicate that 95% of the sub-MORB mantle has aglobal T range of ±140 °C; 68% of this range (1σ) exhibits temperature variations of ±34 °C. Our estimate for Tp
MOR defines theconvective mantle geotherm; this estimate is consistent with T estimates from sea floor bathymetry, and overlaps within 1σestimates derived from phase transitions at the 410 km and 670 km seismic discontinuities. Mantle potential temperatures at Hawaiiand Samoa are identical at 1722 °C and at Iceland is 1616 °C; hence Tex is ≈268 °C at Hawaii and Samoa and 162 °C at Iceland.Furthermore, Tp estimates at Hawaii and Samoa exceed maximum Tp estimates at MORs by N100 °C. Our Tex estimates agree withestimates based on excess topography and dynamic models of mantle flow and melt generation. Rayleigh number calculationsfurther show that if our values for Tex extend to depths as small as 135 km, thermally driven, active upwellings will ensue. Hawaii,Samoa and Iceland thus almost assuredly result from thermally driven active upwellings, or mantle plumes. Estimates of Texaccount for generalized differences in H2O contents between ocean islands and MORs, and are robust against variations in CO2,and major element components, and thus cannot be explained away by the presence of volatiles or more fusible source materials.However, our temperature variations at MORs do not account for H2O variations within the MORB source region.© 2007 Elsevier B.V. All rights reserved.
Keywords: Mantle plumes; Hot spots; Thermometry; Olivine; Geothermal gradient; Mid-ocean ridge
⁎ Corresponding author.E-mail addresses: [email protected] (K.D. Putirka),
[email protected] (M. Perfit), [email protected] (F.J. Ryerson),[email protected] (M.G. Jackson).
0009-2541/$ - see front matter © 2007 Elsevier B.V. All rights reserved.doi:10.1016/j.chemgeo.2007.01.014
1. Overview
The recent debate over the existence of mantle plumeshas to some extent strayed from a fundamental issue: Do

178 K.D. Putirka et al. / Chemical Geology 241 (2007) 177–206
mid-plate volcanoes result from passive, or thermallydriven active mantle upwelling? Morgan's (1971) plumeproposal has two facets: 1) hot spots are the sites of activemantle upwelling and 2) the source of excess heat forthermal plumes is at the core mantle boundary. Muchrecent work has focused on part 2). For example, somesuggest a core contribution to lavas from Hawaii(Brandon et al., 1999; Humayun et al., 2004), andWalker(2000) and Walker et al. (2002) have proposed severalmechanisms for core–mantle mass transfer; a corecontribution, though, is still unclear. Some have thusquestioned the existence of thermally driven plumes withmuch attention given to seismic velocity anomalies,which can be interpreted as maps of temperaturedistributions. Some interpretations suggest that certainhot spots are connected to the core (e.g., Nataf andVanDecar, 1993;Wolfe et al., 1997;Montelli et al., 2004),while others suggest that thermal anomalies are confinedto the upper mantle (e.g., Humphreys et al., 2000; Foulgeret al., 2000; Christiansen et al., 2002). The debate has ledto the proposal that all hot spots are shallow features—unconnected to narrow hot upwellings (Anderson, 1998;Foulger and Natland, 2003). But even if the core–mantleboundary was not the site of plume nucleation, a plumemodel might still be viable. The key issue is not whetherthe core contributesmass, orwhether seismic low velocityanomalies are continuous from the surface to 2890 km,but rather: is there evidence that thermal anomalies exist?Thermally driven mantle plumes exist if hot spots can beshown to derive from thermally buoyant, “active”upwellings, as opposed to the passive mantle upwellingsthat give rise to mid-ocean ridge basalts. We suggest thatthe plume debate be recast to consider whether hot spotsare sites of thermally driven active upwellings, andpropose an observation-driven petrologic approach toidentify mantle plumes.
Thermal upwellings, by definition, arise from sourceswith excess heat—and can be detected through estimatesof “excess temperatures” fromvolcanic rocks.Anti-plumearguments lead to two significant implications: either (1)thermally buoyant upwelling currents do not exist or (2)such thermal currents have no impact on terrestrialvolcanism. Alternative models for intra-plate volcanisminclude: lithospheric delamination (Foulger et al., 2005),small-scale passive mantle upwelling and lithosphererifting (Christiansen et al., 2002), focusing of magmaalong lithosphere-scale cracks (Shaw and Jackson, 1973;Jackson et al., 1975), or compositional anomalies thatdepress the mantle solidus and promote partial melting(Bonatti, 1990; Green et al., 2001; Presnall andGudfinnsson, 2005). In contrast to the thermal plumemodel, these models do not require a source of excess
heat. If significant excess temperatures are not observed at“hot spots”, then the thermally driven mantle plumemodel is likely to be incorrect, and these alternativemodels must be more vigorously explored.
In the discussion of T estimates, it is useful to have aconceptual reference, whichMcKenzie and Bickle (1988)provide in the form of a “mantle potential temperature”,Tp. Tp represents the T a parcel of mantle would have if itwere to rise to a planetary surface along an adiabat withoutmelting (Fig. 1). Mantle potential temperatures thus reflectthe “convective”, as opposed to the conductive mantlegeotherm. In regard to mantle melting, all parcels ofmantle that have the same Tp, will intersect the solidus atthe same depth, provided there are no differences inmantlecomposition. The most direct measure of “excess heat” isthrough identification of Tex, a “mantle excess tempera-ture.” Tex is the temperature difference between the core ofa mantle melting anomaly, and surrounding ambientmantle (Tex=Tp
hot spot−TpAMG; and because MORs are dueto passive upwelling, Tp
AMG=TpMOR). The concept of Tex
is central to all thermal plume models, which require that(1) mantle excess temperatures provide sufficient thermalbuoyancy to sustain active upwellings, and (2) that suchthermal currents impinge the base of the lithosphere, andthrough their excess temperatures, give rise to sustainedand voluminous volcanism, at random locations relative toplate boundaries. Whether the source of excess heat lies atthe core–mantle boundary, the top of the lower mantle, orelsewhere, is important, but not decisive. IfTex approacheszero at any particular hot spot the thermal plume model islikely incorrect at that locality, or at least not the exclusivemechanism for hot spot volcanism there. However, if Texcan be shown to be significant at least at some hot spots,active upwellings, and hence plumes of some form, arelikely to exist. Olivine thermometry is the most precisetemperature measurement tool available to petrologists,which we apply to mid-ocean ridge basalts to delimit thesub-MOR mantle geotherm (henceforth referred to as the“average mantle geotherm” or AMG), and to Hawaii,Samoa and Iceland to test whether they derive frommantle sources with excess heat.
2. A review of some estimates of mantle temperatures
2.1. Prior T estimates of the sub-mid-ocean ridge(MOR) mantle
Alternatives to the plume model involve melting inthe absence of a thermal perturbation. Opponentsof the mantle plume hypothesis thus contend that Tex(=Tp
hot spot−Tpambient) is small, on the order of tens ofdegrees C (Anderson, 1998; Foulger et al., 2005;
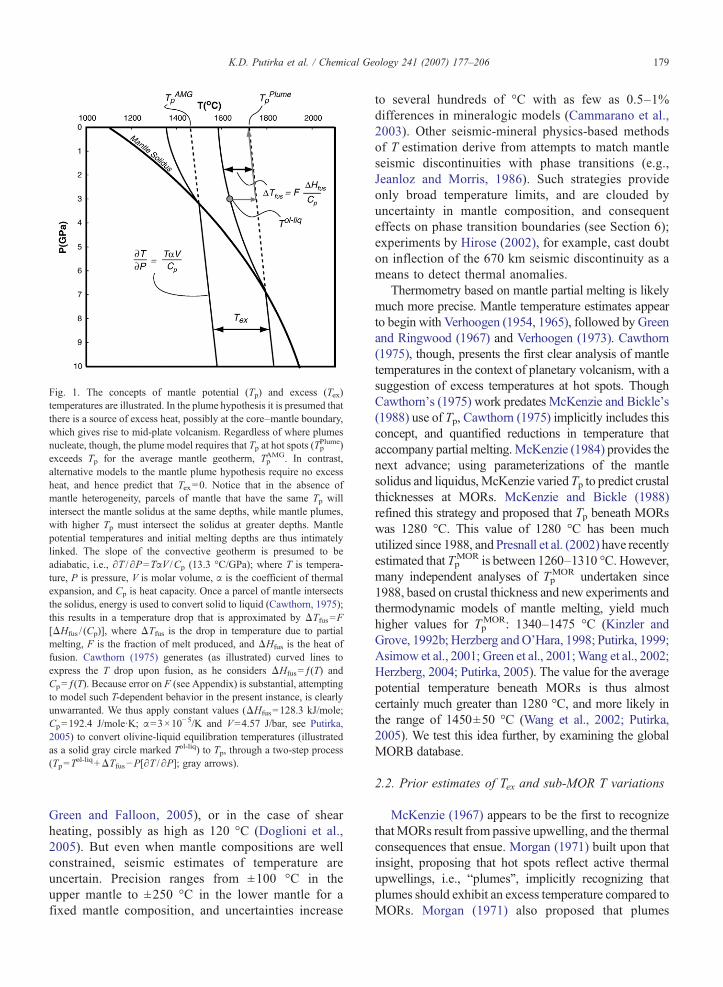
Fig. 1. The concepts of mantle potential (Tp) and excess (Tex)temperatures are illustrated. In the plume hypothesis it is presumed thatthere is a source of excess heat, possibly at the core–mantle boundary,which gives rise to mid-plate volcanism. Regardless of where plumesnucleate, though, the plume model requires that Tp at hot spots (Tp
Plume)exceeds Tp for the average mantle geotherm, Tp
AMG. In contrast,alternative models to the mantle plume hypothesis require no excessheat, and hence predict that Tex=0. Notice that in the absence ofmantle heterogeneity, parcels of mantle that have the same Tp willintersect the mantle solidus at the same depths, while mantle plumes,with higher Tp must intersect the solidus at greater depths. Mantlepotential temperatures and initial melting depths are thus intimatelylinked. The slope of the convective geotherm is presumed to beadiabatic, i.e., ∂T /∂P=TαV /Cp (13.3 °C/GPa); where T is tempera-ture, P is pressure, V is molar volume, α is the coefficient of thermalexpansion, and Cp is heat capacity. Once a parcel of mantle intersectsthe solidus, energy is used to convert solid to liquid (Cawthorn, 1975);this results in a temperature drop that is approximated by ΔTfus=F[ΔHfus / (Cp)], where ΔTfus is the drop in temperature due to partialmelting, F is the fraction of melt produced, and ΔHfus is the heat offusion. Cawthorn (1975) generates (as illustrated) curved lines toexpress the T drop upon fusion, as he considers ΔHfus=ƒ(T) andCp=ƒ(T). Because error on F (see Appendix) is substantial, attemptingto model such T-dependent behavior in the present instance, is clearlyunwarranted. We thus apply constant values (ΔHfus=128.3 kJ/mole;Cp=192.4 J/mole·K; α=3×10⁻⁵/K and V=4.57 J/bar, see Putirka,2005) to convert olivine-liquid equilibration temperatures (illustratedas a solid gray circle marked Tol-liq) to Tp, through a two-step process(Tp=T
ol-liq+ΔTfus−P[∂T /∂P]; gray arrows).
179K.D. Putirka et al. / Chemical Geology 241 (2007) 177–206
Green and Falloon, 2005), or in the case of shearheating, possibly as high as 120 °C (Doglioni et al.,2005). But even when mantle compositions are wellconstrained, seismic estimates of temperature areuncertain. Precision ranges from ±100 °C in theupper mantle to ±250 °C in the lower mantle for afixed mantle composition, and uncertainties increase
to several hundreds of °C with as few as 0.5–1%differences in mineralogic models (Cammarano et al.,2003). Other seismic-mineral physics-based methodsof T estimation derive from attempts to match mantleseismic discontinuities with phase transitions (e.g.,Jeanloz and Morris, 1986). Such strategies provideonly broad temperature limits, and are clouded byuncertainty in mantle composition, and consequenteffects on phase transition boundaries (see Section 6);experiments by Hirose (2002), for example, cast doubton inflection of the 670 km seismic discontinuity as ameans to detect thermal anomalies.
Thermometry based on mantle partial melting is likelymuch more precise. Mantle temperature estimates appearto begin with Verhoogen (1954, 1965), followed by Greenand Ringwood (1967) and Verhoogen (1973). Cawthorn(1975), though, presents the first clear analysis of mantletemperatures in the context of planetary volcanism, with asuggestion of excess temperatures at hot spots. ThoughCawthorn's (1975) work predates McKenzie and Bickle's(1988) use of Tp, Cawthorn (1975) implicitly includes thisconcept, and quantified reductions in temperature thataccompany partial melting.McKenzie (1984) provides thenext advance; using parameterizations of the mantlesolidus and liquidus,McKenzie variedTp to predict crustalthicknesses at MORs. McKenzie and Bickle (1988)refined this strategy and proposed that Tp beneath MORswas 1280 °C. This value of 1280 °C has been muchutilized since 1988, and Presnall et al. (2002) have recentlyestimated that Tp
MOR is between 1260–1310 °C. However,many independent analyses of Tp
MOR undertaken since1988, based on crustal thickness and new experiments andthermodynamic models of mantle melting, yield muchhigher values for Tp
MOR: 1340–1475 °C (Kinzler andGrove, 1992b; Herzberg andO'Hara, 1998; Putirka, 1999;Asimow et al., 2001; Green et al., 2001;Wang et al., 2002;Herzberg, 2004; Putirka, 2005). The value for the averagepotential temperature beneath MORs is thus almostcertainly much greater than 1280 °C, and more likely inthe range of 1450±50 °C (Wang et al., 2002; Putirka,2005). We test this idea further, by examining the globalMORB database.
2.2. Prior estimates of Tex and sub-MOR T variations
McKenzie (1967) appears to be the first to recognizethatMORs result from passive upwelling, and the thermalconsequences that ensue. Morgan (1971) built upon thatinsight, proposing that hot spots reflect active thermalupwellings, i.e., “plumes”, implicitly recognizing thatplumes should exhibit an excess temperature compared toMORs. Morgan (1971) also proposed that plumes
180 K.D. Putirka et al. / Chemical Geology 241 (2007) 177–206
nucleate at the core–mantle boundary, though interest-ingly Hess (1962; his Fig. 8) appears to be the first torecognize that the core–mantle boundarymay provide thethermal energy to drive active mantle upwellings; in thisregard, the difference between Morgan (1971) and Hess(1962) is a matter of where upwellings impinge Earth'ssurface. In any case, McKenzie (1984) provided the firstestimate of Tex with a vague note that Tex≈200 °C, basedon “numerical models of mantle convection.” Wyllie(1988) provided the first petrologic estimate of Tex (atHawaii) of ≈300 °C. Wyllie's calculations assumed thatmelting extended into the garnet stability field at Hawaii,but not beneath MORs; it is now known, however, thatMORBs derive from melting at garnet–peridotite depths(Salters and Hart, 1989; MELT Seismic Team, 1998),invalidating that approach. Klein and Langmuir (1987)examined temperature variations along the global MORsystems and found differences in sub-ridge temperaturesof as much as 250 °C from an analysis of crustal thicknessand melt fraction, and partial melting experiments. Theiranalysis included MORBs from latitude 63.85–64.79 °Non the mid-Atlantic ridge, and thus encompassed theIceland hot spot. The Klein and Langmuir (1987) estimateof 250 °C has sometimes beenmisunderstood to representthe thermal variations of normal MORB mantle (Ander-son, 2000), however, their 250 °C range clearly representsT Iceland–T coldest MORB; it is thus neither an estimate of aMORB “thermal standard deviation”, nor an estimate ofexcess temperature, which for Iceland would be TIceland–Tavg. MORB. Shen and Forsyth (1995) and Presnall et al.(2002) obtained smaller variations for the sub-MORmantle, on the order of 100–140 °C. Shen and Forsyth's(1995) estimate also covered Iceland, and attempted toaccount for mantle heterogeneity. More recently, Asimowand Langmuir (2003) and Asimow et al. (2004) haveshown howH2O variations can diminish apparent thermaldeviations in the sub-MORmantle. Asimow et al. (2004),
Table 1Calculated parental (or mean primary) magma compositions
Avg. MORB Siqueiros Iceland
SiO2 48.0 48.5 47.2TiO2 0.9 0.9 0.7Al2O3 15.2 15.9 12.3FeOt b 8.4 8.0 9.3MnO 0.1 0.1 0.2MgO 14.6 13.2 18.2CaO 10.6 11.1 10.5Na2O 2.2 2.3 1.4K2O 0.0 0.0 0.1a Compositions Kilauea-H and MORB-H are “representative primary mag
other compositions are from this study; see Appendix A for calculation prob FeOt is FeO total, see Appendix A.
for example, showed that excess crustal thickness at theAzores can be explained by thermal anomalies that rangefrom 75 °C for a dry mantle, down to 35 °C for a mantlethat contains 700 ppm H2O. Their results support, at leastpartly, Bonatti (1990), who suggested from his observa-tions of abyssal peridotites, that thick crust at the Azorescould be produced entirely by differences in mantle H2O.Excluding calculations involving variable H2O contents,most all these T estimates are based on the thickness ofocean crust, with the presumption that thick crust requireshigh degrees of melting, which in turn requires hightemperatures. Such estimates depend upon uncertainassumptions of melt productivity during adiabaticupwelling, and the efficiency of melt extraction fromthe mantle. An opposing view is that thick crust indicatesfreezing point depression of the peridotite solidus due tothe presence of volatiles (Bonatti, 1990), or the presenceof more fertile mantle components (Green et al., 2001).
Albarede (1992), Herzberg and O'Hara (1998),Herzberg (2004) and Putirka (1999, 2005) have alsoestimated melting depths and temperatures. Their workshows that major oxide compositions are sufficientlydifferent between MORBs and ocean-island basalts(OIBs) so as to require that at least some OIBs arederived at greater pressures and temperatures. Herzbergand O'Hara (1998) estimated excess temperatures of100–150 °C at Iceland and 200–250 °C at Hawaii;Putirka (1999) estimated a 300 °C excess T at Hawaii(compared to the East Pacific Rise). By a similaranalysis of komatiites, Herzberg (1995) further sug-gested that mantle excess temperatures have hoverednear 200 °C since the Archean, and could have been ashigh as 300–400 °C for certain Archean mantleplumes. In comparison, at Iceland MacLennan et al.(2001a) obtained TexN200 °C using crustal thicknessand melt composition, while Ito et al. (1999) estimatedTex
Iceland =180 °C based on rheology related to partial
Hawaii Samoa Kilauea-H a MORB-Ha
47.2 45.3 47.5 48.41.6 2.5 1.9 0.89.0 9.2 9.7 16.311.6 12.0 11.4 7.90.2 0.2 0.2 0.121.4 20.5 19.2 12.97.3 8.0 8.0 11.31.4 1.8 1.7 2.20.2 0.7 0.4 0.0
ma” compositions from Herzberg (pers. comm.), for comparison. Allcedures).

Fig. 2. The olivine binary phase diagram, (a) is compared to the Roeder and Emslie (1970) olivine thermometer for natural basaltic liquids. In theolivine binary (a), there is a monotonic relationship between temperature and the Fo content of olivine. Solid lines connect the equilibrium olivine-liquid pair X1
liq and X1ol, which equilibrate at T1. For any olivine with greater Fo content, such as X2
ol, it will equilibrate with a liquid with higher MgOcontent, X2
liq, at a higher T, T2 (connected by dashed lines). But natural liquids do not have an olivine stoichiometry, and the monotonic relationshipbetween Fo and T does not apply. (b) Shows the graphical olivine-liquid thermometer of Roeder and Emslie (1970) (their Fig. 7). The near-horizontallines are isotherms, shown in °C, and calculated from Eq. (1), and models A and B from Putirka (2005). Lines that radiate from the origin are lines ofconstant Fo content, as determined by the Fe–Mg exchange coefficient, KD(Fe–Mg)ol-liq= (XMg
liq XFeol ) / (XMg
liq XFeol ), which is 0.32 in (b). If both XFe
liq andXMgliq are known, the intersection of those compositions will yield the temperature at which olivine will become saturated (from the isotherms), and the
composition of that olivine (from the radiating lines of constant Fo). But one need not use XMgliq as input, and the effect of XFe
liq is very important: Noticethat if a liquid is known to have XFe
liq=0.4, and it is known to have equilibrated with an olivine of Fo 70, the equilibration Twould be ≈1840 °C; incontrast, if a different liquid has XFe
liq=0.2, and is known to have equilibrated with an olivine of Fo 80, the equilibration T would be much lower,≈1630 °C, even the though the Fo content of the equilibrated olivine is greater. It should also be noted that in the latter technique, XMg
liq for the liquidcan be retrieved when FeOliq and Fo are known.
181K.D. Putirka et al. / Chemical Geology 241 (2007) 177–206

182 K.D. Putirka et al. / Chemical Geology 241 (2007) 177–206
melting. Though temperatures were not quantified,Fram and Lesher's (1997) analysis of melting depthsrelated to the Iceland melting anomaly implies compa-
rable temperature differences. More recently, Putirka(2005) used olivine thermometry to calculateTex≈220 °C at Hawaii and ≈170 °C at Iceland.

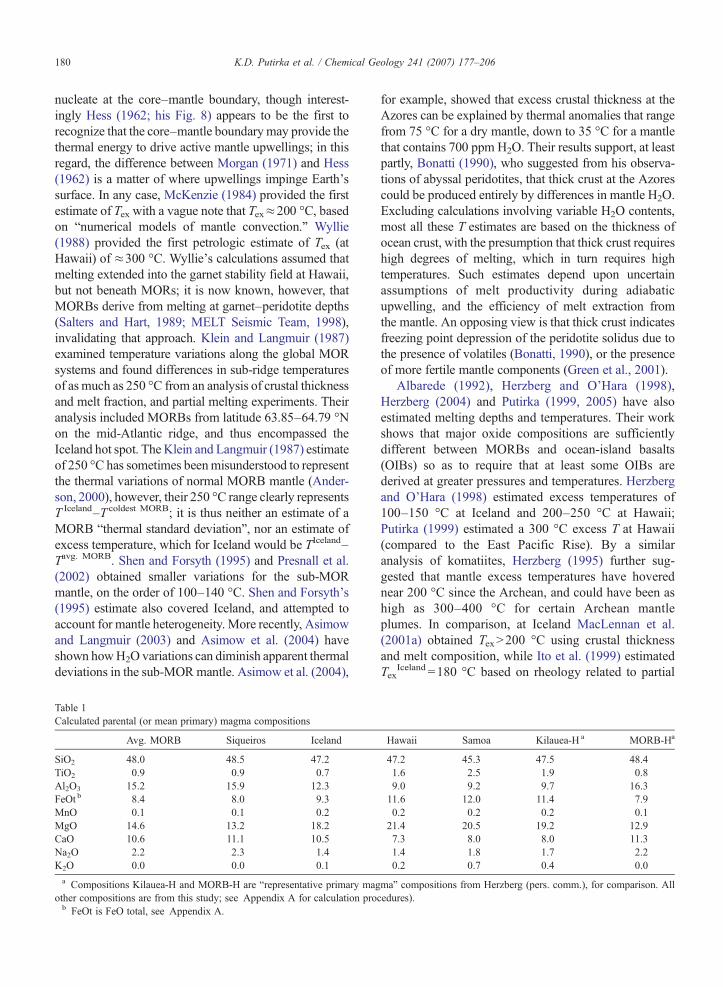
Fig. 3. (a) Eq. (2), (b) Eq. (4), and (c)–(i) other published expressions of DMgol/liq=ƒ(T ), are tested for their ability to recover T for olivine-saturated
partial melting experiments. A one-to-one line is shown in each panel. G&F are data from Gudfinnsson and Presnall (2000); M are data fromMontierth et al. (2000). R2 values, the standard errors of estimate (SEE), and slope and intercept values for the regression equation T(C )measured=mT(C)calculated+b are given for regression lines. Systematic error is indicated by slope and intercept values that deviate from 1 and 0respectively. The equations T(C)Dry=mT(C)c+b compare slope and intercept values for anhydrous experiments only; T(C )Dry and T(C )c arerespectively the reported experimental and calculated values. 1007 experiments were used for testing and calibrations, from the following studies(experiments from LDEO are corrected for the calibration effects as noted in Longhi, 2005): Baker and Eggler (1987), Baker et al. (1994), Bakerand Stolper (1994), Baker et al. (1995), Bartels et al. (1991), Blatter and Carmichael (2001), Dalton and Presnall (1998a,b), Draper and Johnston(1992), Dunn and Sen (1994), Elthon and Scarfe (1984), Esperança and Holloway (1987), Falloon and Green (1987), Falloon et al. (1988), Falloonet al. (1997), Falloon et al. (2001), Fram and Longhi (1992), Gaetani and Grove (1998), Gee and Sack (1988), Grove et al. (1990), Grove et al.(1992), Grove et al. (1997), Grove et al. (2003), Grove and Juster (1989), Gudfinnsson and Presnall (2000), Herzberg and Zhang (1996), Juster et al.(1989), Kinzler and Grove (1985), Kinzler and Grove (1992a), Kogiso et al. (1998), Kogiso and Hirschmann (2001), Longhi (2002), Longhi andPan (1988), Longhi et al. (1978), Longhi et al. (1999), Montierth et al. (2000), Moore and Carmichael (1998), Müntener et al. (2001), Murck andCampbell (1986), Parman et al. (1997), Pichavant et al. (2002), Righter and Carmichael (1996), Robinson et al. (1998), Sack et al. (1987), Schwaband Johnston (2001), Sisson and Grove (1993a,b), Sugawara (2001), Takagi et al. (2005), Thy (1991), Tormey et al. (1987), Trönnes et al. (1992),Vander Auwera and Longhi (1994), Vander Auwera et al. (1998), Wagner and Grove (1997), Walker et al. (1979), Walter (1998), Wasylenki et al.(2003), Xirouchakis et al. (2001), Yang et al. (1996).
183K.D. Putirka et al. / Chemical Geology 241 (2007) 177–206
Petrologic estimates of Tex are consistent withtemperatures inferred from “excess topography”, i.e.,the shallow bathymetry and uplift exhibited at oceanic hotspots. For instance, although Sleep (1990) admitted that
excess temperatures are “not tightly constrained bygeophysical considerations”, he applied Tex=200 °C atHawaii and Iceland to explain their topographic expres-sions. Similarly, Schilling (1991) calculated excess

184 K.D. Putirka et al. / Chemical Geology 241 (2007) 177–206
temperatures for 13 different hot spots, that range from160 °C (Tristan) to 280 °C (Circe), and Watson andMcKenzie (1991) used a combination of excess topog-raphy, geoid height and melt productivity, to derive a Texat Hawaii of 278 °C. Ribe and Christensen (1999)expanded upon the Watson and McKenzie approach toarrive at Tex≈160 °C at Hawaii.
2.3. Some contrasting viewpoints and maximumtemperatures
The weight of dynamic and petrologic T estimatesindicates that the highest mantle temperatures are at hotspots, with values of Tex between 160–300 °C.However, except for Putirka (2005), and Albarede(1992), errors are not well quantified. In addition, Greenet al. (2001) present a serious challenge to this tide ofwork. They observe that maximum forsterite contents(Mg2SiO4; Fo=Mg#ol =XMg
ol / (XMgol +XFe
ol ), where Xiα are
cation fractions of i in phase α) of olivine phenocrysts atMORs match or exceed those found at Hawaii, andconclude that Tp≈1430 °C, at both Hawaii and atMORs. Their strategy of examining Fomax is significant.It is well established that temperatures decreasedramatically along liquid lines of descent (O'Hara,1978), and that any viable model for generation of aprimitive liquid requires equilibration of that liquid with
mantle olivine (O'Hara, 1968, 1970). R.N. Thompson(1978) was perhaps the first to recognize that olivinephenocrysts in MORB range to Fo91, and thattemperature estimates that implicate lower Fo contentslikely underestimate mantle temperatures. Green et al.'s(2001) use of Fomax for MORB phenocrysts is thus avalid attempt to measure the maximum temperatures inthe sub-MOR mantle. Anderson (2000) also provides achallenge to the plume model. He argues that 1) thereare no thermally undisturbed regions of the uppermantle (isotherms in the uppermost mantle are unlikelyto be flat), 2) horizontal temperature variations exceed200 °C at shallow depths, and 3) absolute temperaturesencompass estimates of plume temperatures. In thisview, Tex's as great as 200–250 °C do not require asource of excess heat at depth; though there areproblems with the Anderson (2000) analysis (seeSection 4.), we must understand sub-ridge temperaturevariations to estimate Tex.
To address these issues we test new and publishedolivine-liquid thermometers, and examine globalvariations in FeOliq among MORBs to assess themean and standard deviation of sub-MOR tempera-tures. These results lead to our proposal for a newconvective geotherm, which we compare to otherappraisals of upper mantle temperatures. We thencalculate Tex at Hawaii, Samoa and Iceland.
3. Olivine thermometry
Because primitive oceanic basalts equilibrate with olivine in their source region (O'Hara, 1968), mantletemperatures can be estimated from olivine-liquid equilibria, provided that one can reconstruct coexisting primitiveliquid and olivine compositions. Olivine thermometry provides a test that is independent of temperature estimates thatderive from crustal thickness and has greater precision. To estimate temperatures we require 1) the FeOliq (literally, Feas Fe2+) of mantle-equilibrated liquids, or an FeO–MgO trend-line along which liquids are olivine saturated (seeAppendix A, for calculations regarding FeO), 2) the Fomax of olivines that equilibrate with parental liquidcompositions, 3) the value for the Fe–Mg exchange coefficient between olivine and liquid, KD(Fe–Mg)ol-liq, andestimates of 4) the pressure (P) of olivine-liquid equilibration, and 5) ƒO2 conditions. Temperature can be calculatedfrom these five variables alone, if one applies the composition independent thermometers of Putirka (2005). Toestimate T more precisely we estimate MgOliq for parental liquids (using FeOliq, KD(Fe–Mg)ol-liq and Fomax as input;see Appendix A) and then reconstruct the SiO2
liq and Na2Oliq +K2O
liq for parental liquids to use as input intogeothermometers (Table 1).
It is well established that DMgol/liq =ƒ(T ) and that coexisting olivine-liquid pairs that exhibit low DMg
ol/liq(=XMgol /XMg
liq ,where XMg is the cation fraction of Mg in olivine or liquid) have high melting temperatures (e.g., Roeder and Emslie,1970; Sugawara, 2000; Putirka, 2005). The olivine binary phase diagram (Fig. 2a) shows that high Fo contents requireequilibrium with liquids that have high Mg# (Mg#liq =XMg
liq / (XMgliq +XFe
liq), with Fe as Fe2+). In the olivine binary, there isa monotonic relationship between Fo content and T (and Mg#liq) (Fig. 2). In natural silicate liquids, though, Fe and Mgcan vary independently, and the monotonic relationship between T and Fo content no longer applies. The Mg# of aliquid will still dictate the Mg# (i.e., Fo content) of a coexisting olivine, depending upon the value of the Fe2+–Mgexchange coefficient, KD(Fe–Mg)ol-liq = (X Mg
liq X Feol ) / (X Mg
liq X Feol ), (Roeder and Emslie, 1970; Herzberg and
O'Hara, 1998; Toplis, 2005). But if a liquid has low Fe2+, then even at a high Mg#, it will have low MgOliq, andhence high DMg
ol/liq, and olivine-liquid equilibration will occur at low T. Similarly, if a liquid has high Fe2+, then high
Fig. 4. Temperatures are calculated for experimental data using Eq. (1) in combination with (a) Eqs. (2) and (3), (b) Eqs. (4) and (5) and (c) Eq. (10)from Beattie (1993; using coefficients for Fe and Mg partitioning, and pressure corrections from Herzberg and O'Hara, 2002). Statistics and data areas in Fig. 3.
185K.D. Putirka et al. / Chemical Geology 241 (2007) 177–206
Mg# implies high MgOliq, and therefore low DMgol/liq, and high equilibration T. This insight is not new, and is implicit in
the Roeder and Emslie (1970) olivine thermometer (Fig. 2b; their Fig. 7).
3.1. Thermodynamic basis for olivine thermometry
Since most basalts have had their MgO contents affected by olivine fractionation, primitive MgOliq contents arecommonly estimated by determining the MgO content of a liquid that would be in equilibrium with a high Fo(mantle) olivine, usually taken as Fo90–92 (Albarede, 1992; Kelemen et al., 1997; Green et al., 2001). The quantityDMgol/liq is then calculated by pairing the model primitive liquid with the assumed olivine composition and T is
calculated from DMgol/liq =ƒ(T ). Estimates of MgOliq provide the principal sources of error. However, since FeOliq
remains nearly constant during olivine fractionation (Langmuir and Hanson, 1980; Klein and Langmuir, 1987;Putirka, 2005), an alternative strategy is to use FeOliq (as derived from so called olivine control lines (Powers,1955), where olivine addition/removal controls whole rock composition) for T estimation, and MgOliq becomesoutput, rather than input (Appendix A).
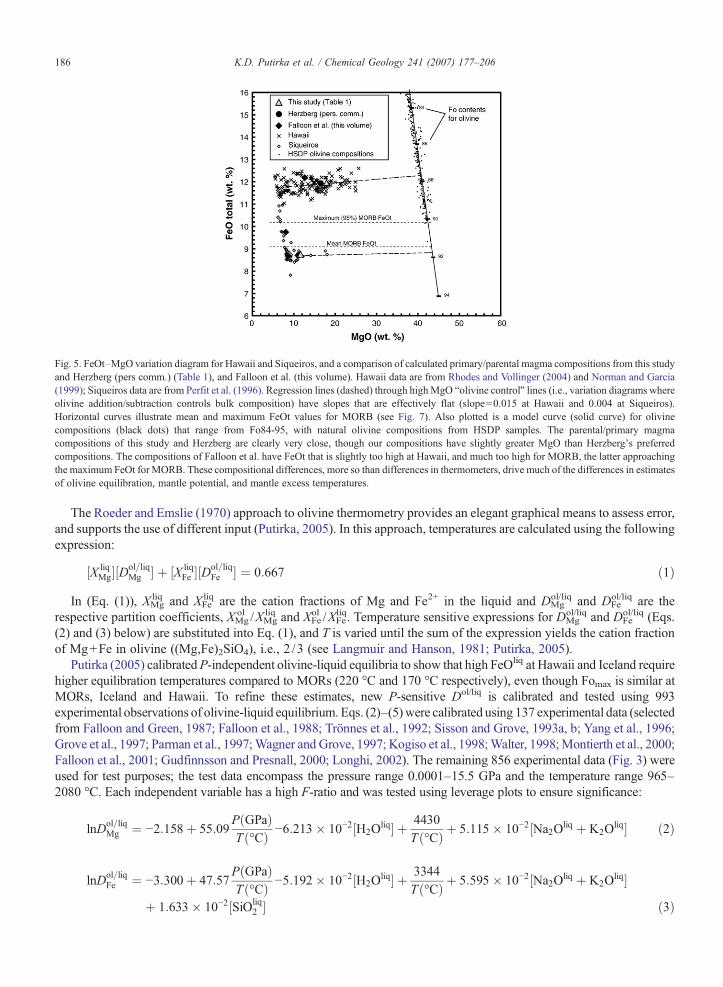
Fig. 5. FeOt–MgO variation diagram for Hawaii and Siqueiros, and a comparison of calculated primary/parental magma compositions from this studyand Herzberg (pers comm.) (Table 1), and Falloon et al. (this volume). Hawaii data are from Rhodes and Vollinger (2004) and Norman and Garcia(1999); Siqueiros data are from Perfit et al. (1996). Regression lines (dashed) through highMgO “olivine control” lines (i.e., variation diagrams whereolivine addition/subtraction controls bulk composition) have slopes that are effectively flat (slope=0.015 at Hawaii and 0.004 at Siqueiros).Horizontal curves illustrate mean and maximum FeOt values for MORB (see Fig. 7). Also plotted is a model curve (solid curve) for olivinecompositions (black dots) that range from Fo84-95, with natural olivine compositions from HSDP samples. The parental/primary magmacompositions of this study and Herzberg are clearly very close, though our compositions have slightly greater MgO than Herzberg's preferredcompositions. The compositions of Falloon et al. have FeOt that is slightly too high at Hawaii, and much too high for MORB, the latter approachingthe maximum FeOt for MORB. These compositional differences, more so than differences in thermometers, drive much of the differences in estimatesof olivine equilibration, mantle potential, and mantle excess temperatures.
186 K.D. Putirka et al. / Chemical Geology 241 (2007) 177–206
The Roeder and Emslie (1970) approach to olivine thermometry provides an elegant graphical means to assess error,and supports the use of different input (Putirka, 2005). In this approach, temperatures are calculated using the followingexpression:
½X liqMg�½Dol=liq
Mg � þ ½X liqFe �½Dol=liq
Fe � ¼ 0:667 ð1Þ
In (Eq. (1)), XMgliq and XFe
liq are the cation fractions of Mg and Fe2+ in the liquid and DMgol/liq and DFe
ol/liq are therespective partition coefficients, XMg
ol /XMgliq and XFe
ol /XFeliq. Temperature sensitive expressions for DMg
ol/liq and DFeol/liq (Eqs.
(2) and (3) below) are substituted into Eq. (1), and T is varied until the sum of the expression yields the cation fractionof Mg+Fe in olivine ((Mg,Fe)2SiO4), i.e., 2 /3 (see Langmuir and Hanson, 1981; Putirka, 2005).
Putirka (2005) calibratedP-independent olivine-liquid equilibria to show that high FeOliq at Hawaii and Iceland requirehigher equilibration temperatures compared to MORs (220 °C and 170 °C respectively), even though Fomax is similar atMORs, Iceland and Hawaii. To refine these estimates, new P-sensitive Dol/liq is calibrated and tested using 993experimental observations of olivine-liquid equilibrium. Eqs. (2)–(5)were calibrated using 137 experimental data (selectedfrom Falloon and Green, 1987; Falloon et al., 1988; Trönnes et al., 1992; Sisson and Grove, 1993a, b; Yang et al., 1996;Grove et al., 1997; Parman et al., 1997;Wagner and Grove, 1997; Kogiso et al., 1998;Walter, 1998;Montierth et al., 2000;Falloon et al., 2001; Gudfinnsson and Presnall, 2000; Longhi, 2002). The remaining 856 experimental data (Fig. 3) wereused for test purposes; the test data encompass the pressure range 0.0001–15.5 GPa and the temperature range 965–2080 °C. Each independent variable has a high F-ratio and was tested using leverage plots to ensure significance:
lnDol=liqMg ¼ −2:158þ 55:09
PðGPaÞTð-CÞ −6:213� 10−2½H2O
liq� þ 4430Tð-CÞ þ 5:115� 10−2½Na2Oliq þ K2O
liq� ð2Þ
lnDol=liqFe ¼ −3:300þ 47:57
PðGPaÞTð-CÞ −5:192� 10−2½H2O
liq� þ 3344Tð-CÞ þ 5:595� 10−2½Na2Oliq þ K2O
liq�þ 1:633� 10−2½SiOliq
2 � ð3Þ

187K.D. Putirka et al. / Chemical Geology 241 (2007) 177–206
In Eqs. (2) and (3), T is in °C and P is in GPa; terms such as SiO2liq, represent the weight % of the indicated oxide in
the liquid phase, whileDMgol-liq refers to the cation fraction ratio of Mg between olivine and liquid. For test data, we make
use of post-1987 1 atm data, because of the development of techniques to minimize alkali loss in open furnace systems(e.g. Tormey et al., 1987).
As we will show, the Beattie (1993) thermometer is remarkably accurate, and so we re-calibrate his Eq. (10), addinga term for water, and additional, thermodynamically derived terms (Putirka, 1998, Eq. (7)) for P:
Tð-CÞ ¼ 15294:6þ 1318:8PðGPaÞ þ 2:4834½PðGPaÞ�28:048þ 2:8532lnDol=liq
Mg þ 2:097ln½1:5ðCLNMÞ� þ 2:575ln½3ðCL
SiO2Þ�−1:41NFþ 0:222H2Oþ 0:5PðGPaÞ
ð4Þ
Tð-CÞ ¼ 461:29þ 84:9PðGPaÞ þ 0:588½PðGPaÞ�20:355þ 0:06986lnDol=liq
Fe −0:00435ln½1:5ðCLNMÞ�−0:0523ln½3ðCL
SiO2Þ�−0:0217NFþ 0:000893H2Oþ 0:04PðGPaÞ
ð5Þ
Because calibration of Eqs. (4) and (5) involves non-linear regressionmethods,F-tests are not possible and the coefficientsderive from regression of all 993 experimental data.We apply the activitymodels of Beattie (1993), but for simplicity, H2O isexpressed in wt.%. In these expressions, CNM
liq =XMgliq +X Fe2+
liq +X Caliq +XMn
liq ; CSiO2liq =X Si
liq; NF=7/2ln(1−X Alliq)+7ln(1−X Ti
liq),where X i
liq is the cation fraction of element i in the liquid phase (see Beattie, 1993).We use these equations with estimates of Fomax, the maximum Fo content of olivines with which parental liquids
(Table 1) may have equilibrated. We cannot demonstrate that primitive liquids have not equilibrated with olivines withhigher Fo contents, but below we show (Section 4) that values of Fomax≈91.5 are generally consistent with anapproach to mantle values. If nothing else, our temperatures are minimum estimates. Herzberg and O'Hara (2002) havesuggested that fractional melting may pose difficulties with the interpretation of high Fo olivines. But we emphasizethat fractional melting still implies equilibrium; provided an equilibrium FeOliq can be identified, it matters littlewhether melts were whisked away by a batch or fractional process. A more serious concern is whether any particularolivine composition has had its composition set by sub-solidus equilibration.
3.2. Tests of new and existing models
Fig. 3 illustrates tests of a number of published olivine-liquid thermometers that utilizeXMgol andXMg
liq as input (Ford et al.,1983; Langmuir et al., 1992; Ariskin et al., 1993; Beattie, 1993; Sugawara, 2000; Gudfinnsson and Presnall, 2001; Putirka,2005). For dry conditions at lowT, themodel of Beattie (1993) (using the pressure correction ofHerzberg andO'Hara (2002)),is clearly the most accurate of any published model; but comparison of one-to-one correlation lines, and slopes and interceptsof regression lines throughT(°C) calculated vs.T(°C)measured shows that Eqs. (2) and (4) exhibit the least error.Whenwatercontents are low, however, it would not be unwarranted to average T estimates from Eqs. (2)–(4) and Beattie (1993).
In contrast to the use of DMgol/liq alone, isotherms in the Roeder and Emslie (1970)-type diagram are calculated using
Eq. (1), and equations such as DMgol/liq =ƒ(T ) and DFe
ol/liq =ƒ(T ) simultaneously (see Langmuir and Hanson, 1981;Putirka, 2005). This approach does not necessarily require XMg
liq as input. We test the precision with which suchisotherms can be calculated, using Eqs. (2)–(5), Putirka (2005), Ford et al. (1983) and the Beattie (1993) (as throughoutthis paper, using the Herzberg and O'Hara (2002) pressure correction) models (Fig. 4). As might be expected, modelsthat exhibit systematic error in their individual D's (Fig. 3), retain their systematic error (Fig. 4), as is evident in the F-ratios, and slope and intercept values (Fig. 4); Eqs. (2)–(5) nearly eliminate this systematic error.
In Appendix A, we compare T estimates for model MORB, Iceland, Samoa and Hawaiian parental liquidcompositions, as calculated by us (Table 1; see Appendix A) and by Herzberg (pers. comm.). These tests (Table A1)show that, provided one is consistent about the choice of input parameters, T estimates from various models differ by aslittle as 27 °C (for MORB), with standard deviations that are within 1σ model error. The large differences between ourmantle potential temperatures, and T estimates of, say, Falloon et al. (this volume), depend as much or more upon thederived or implicit bulk compositions and olivine Fo contents (Fig. 5; see Appendices A and B)). In some cases,though, temperature estimates diverge by more than 100 °C for equivalent input (Table A2), in which case predictedvalues for Fo and KD(Fe–Mg)ol-liq may be used to decide which thermometers yield the best estimates (Appendix A).

188 K.D. Putirka et al. / Chemical Geology 241 (2007) 177–206
4. Ambient mantle temperatures
As noted, Anderson (2000) presents an interestingchallenge to the mantle plume model, proposing thatthe apparent sites of “excess heat” (e.g., Hawaii,Iceland) reflect temperature variations in the upper-most mantle rather than from deeper thermal inputs.The source of Anderson's (2000) proposed 200 °C+thermal variance is unfortunately vague. Some studiescited by Anderson (2000) estimate T variations thatcan in fact be viewed as supportive of the plume model(e.g., Klein and Langmuir, 1987; Schilling, 1991; seeSection 2.2). In addition, seismically detected long-wavelength T variations are not only thermallyimprecise, but are unlikely to capture hot narrowupwellings. It is also unclear to what extent the seismiclong-wavelength T estimates cited by Anderson (2000)were filtered for the effects of cold subducted slabs, orlithosphere roots, whose thermal structures are irrele-vant to the temperature ranges that drive intra-platevolcanism. However, Anderson (2000) raises a funda-mental question: is the variation of temperaturesbeneath MORs so great so as to encompass intra-plate estimates of Tex? If MORB derive from regions ofthe mantle with greater than 200 °C variations in T,especially in the absence of a hot spot influence, thenexcess temperatures of a similar magnitude at mid-plate settings need not be interpreted as deep-seatedthermal plumes. A quantitative estimate of the range ofsub-MOR mantle temperatures is thus required.
Mid-ocean ridge basalts result from passive mantleupwelling (see McKenzie and Bickle (1988) for asummary of the decisive arguments), and thus providea global sampling of the upper mantle, absent theinfluence of putative mantle plumes. To measure themean, range and standard deviation of upper mantletemperatures, we use a global database of 22,591MORBs and 2,845 MORB-derived olivines (PETDB:http://www.petdb.org/), including samples from theSiqueiros Transform (Perfit et al., 1996). TheSiqueiros samples are important because Siqueirosis the only MOR location where liquids can betraced to an olivine-only fractionation line (“olivinecontrol”). These data allow a direct estimate ofprimitive FeOliq contents, and the olivines thatcoexisted with such liquids (Fig. 6a). The globalMORB database is used to examine the global rangein FeOliq (Fig. 7), which reflects the T range in thesub-MOR mantle; though Iceland proper is excludedfrom this MORB data set, there is no additionalfiltering of this database for the effects of hot spot-influenced ridge segments.
4.1. FeO in primitive MORB liquids
For consistency, we first convert all analyses of Fe toFeO total (FeOt; see Appendix A), and calculate FeO(Fe as Fe2+) assuming the ƒO2 conditions of Bezos andHumler (2005) and by use of the models of Kress andCarmichael (1988) (see Appendix A). Where wenote FeO or FeOliq (as opposed to FeOt) we alwaysmean Fe2+O, and all temperatures that require Fe asinput use FeOliq. An inflection in the global MORBdatabase, at approximately 9.5 wt.% MgO, shows thetransition from “olivine control” (fractionation ofolivine alone) at high MgO, to the co-precipitation ofolivine and plagioclase (lower MgO), at least for high Feprimitive liquids. An orthogonal regression line isshown for MORB with MgOb9.5 wt.%, that describesthe olivine+plagioclase fractionation trend. The hori-zontal lines at 7 and 9.6 wt.% FeOtliq represent the upperand lower limits for primitive FeOtliq in MORB that cangenerate 95% of MORB compositions through olivinefractionation, followed by olivine+plagioclase fraction-ation at MgO≤9.5 wt.%. Provided that primitiveMORB equilibrate with olivine, these upper and lowerbounds on FeOtliq must reflect variations in T for thesub-MOR mantle, even if the mantle is heterogeneouswith respect to Fe (Shen and Forsyth, 1995); olivine-liquid thermometers, though, by their calibration,account for such variations, and so are independent ofthe composition of the mantle source (only estimates ofmelt fraction, F, depend upon a model for mantlecomposition; Appendix A).
4.2. Maximum Fo in MORB olivines
To estimate temperature, we must estimate the valuefor themaximum Fo content of olivines equilibrated withMORB. To estimate Fomax for MORBs we compare Foand CaO contents of olivines from the ocean basins (Fig.8a).We include data from abyssal hills, seamounts, fossilspreading ridges, transform fault zones, as well asspreading ridges; the data are filtered so that divalentcation sums in olivine, calculated on a 4-oxygen basis,are between 2.99–3.01. Olivines from ultramafic rockscan be discerned from phenocryst olivines in that theirCaO contents are much lower (b0.17 wt.%) than those ofphenocrysts in lavas (Norman and Garcia, 1999). LowCaO is accompanied by high NiO, and undoubtedlyreflects depletion of a solid residue in CaO due to meltremoval. Phenocryst Fomax values also overlap with Focontents from ultramafic olivines.We cannot exclude thepossibility that ultramafic olivines have re-equilibratedat subsolidus conditions, but the cluster of ultramafic
mperfit
Highlight

Fig. 6. (a) Siqueiros glass and coexisting olivine compositions areconsistent with an Fe–Mg exchange coefficient, KD(Fe–Mg)ol-liq=(X Mg
liq X Feol ) / (X Mg
liq X Feol ), of 0.29 (Hays et al., 2004 and new data).
(b) Maximum Fo contents from HSDP (Hawaii Scientific DrillingProject) lavas (this study) are compared to HSDP whole rockcompositions (Rhodes and Vollinger, 2004); their mean compositionsuggests equilibration at KD(Fe–Mg)ol-liq=0.34. Olivines from sampleSR641 (18.33% MgO) all lie within the ±0.03 window for KD(Fe–Mg)ol-liq suggesting that this HSDP sample might closely approach aparental magma composition. Arrows show the directions in whichwhole-rock-Fomax pairs will be driven, for olivine accumulation,removal, or differentiation. It is not necessary that the mean valuereflects the true KD(Fe–Mg)ol-liq, but if the mean does not reflectequilibrium in this instance, a mass balance problem ensues: high-density olivine-laden slurries must then be preferentially erupted overlow density, olivine-depleted liquids. This seems unlikely, and alsounnecessary, given that experimental studies suggest that KD(Fe–Mg)ol-liq increases with increased P (Herzberg and O'Hara, 1998;Putirka, 2005) (see Appendix for discussion of ƒO2 and calculation ofFe3+/Fe2+ ratios).
189K.D. Putirka et al. / Chemical Geology 241 (2007) 177–206
olivines in Fig. 8a has a mean and maximum for Fo of90.2 and 91.6 respectively, which overlaps with themaximum values obtained from phenocrysts. Thisoverlap occurs in the range that has been inferred torepresent mantle olivine compositions (Fo90–92; Albar-ede, 1992), and indicates that phenocryst Fomax values inall likelihood approach mantle-equilibrated composi-tions. For temperature estimation, we use Fo=91.5, asthis value appears representative of Fomax for globalMORB. One caveat regarding PETDB MORB olivinesis required: 81% (21) of all olivines with FoN91 and100% (6) with FoN91.5 derive from a single study(Eissen, 1982), which comprises 19% (555) of the data-base. If the Eissen (1982) data are excluded, Fomax of theremaining 2290 olivines is 91.3. The Eissen (1982)subset is thus suspected to have some analytical bias. Itshould be noted that olivines with Fo≈91.9 do notderive from samples with the highest FeO, and hencemaximum MOR temperature estimates are unaffected.Fig. 8a suggests that Fomax is unlikely to range muchhigher than 91.6 for most MORBs.
Interestingly, our results (below) suggest an expla-nation for the non-Gaussian distribution of olivinephenocrysts, i.e., the sharp drop in numbers ofphenocrysts at high Fo (Fig. 8b). We propose that themantle geotherm, perhaps aided by a mantle that isapproximately homogenous in its major elementcontent, provides a natural upper limit to olivine Focontents during partial melting.
4.3. Ambient mantle temperature estimates
Fig. 9a shows olivine-equilibration and mantlepotential temperatures for Siqueiros and global MORB(Fig. 7). KD(Fe–Mg)ol-liq is calculated to be 0.31 (seeAppendix A). At Siqueiros, we derive an olivine-liquidequilibration temperature of 1380 °C at 0.8 GPa; themean FeO for MORB is greater than at Siqueiros, and soat 0.8 GPa yields an olivine-equilibration temperature of1405 °C. Our method of temperature estimation impliesa value for parental MORB MgOliq; a completereconstruction for a MORB parental liquid is given inTable 1 (see Appendix A),
We convert these temperatures to mantle potentialtemperatures, Tp (Fig. 1; Appendix A). To calculate T
ol-liq
and Tp, we assume a depth of equilibration of 0.8 GPa,which is at the shallow end of the range of partial meltingdepths estimated by Kinzler and Grove (1992b) andsomewhat more shallow than the 1.15 GPa used for the Tpcalculation by Putirka (2005). In regard to Tp, the globalMORB FeOt range (7 wt.%≤FeOt≤9.6 wt.%) translatesto a range in Tp of 140 °C (excluding Iceland). Siqueiros
mperfit
Highlight

Fig. 7. PETDB (glass and whole rocks) is used to determine global variations in FeOtliq for MORBs. The negative trend exhibited by the majority ofdata have compositions controlled by olivine+plagioclase fractionation. An orthogonal regression line is shown for MORBs with b9.5 wt.% MgO,which is used to define the slopes of the two parallel lines, which encompass 95% of MORBs. Horizontal lines at FeOtliq=7 and 9.6 wt.% indicate therange of primitive FeOtliq contents that can explain 95% of MORB FeO variations through olivine, followed by olivine+plagioclase fractionation.The noted range of FeOliq contents can be use to bracket the range of temperatures that characterize the sub-MOR mantle.
190 K.D. Putirka et al. / Chemical Geology 241 (2007) 177–206
samples lie near themiddle of this rangewithTp=1441 °C,but just below the Tp derived using global mean MORBFeO, which yields Tp=1466 °C. The Siqueiros and meanMORB values represent the average of two Tp valuescomputed using two different estimates formelt fraction,F(Fig. 9). Our preferred estimate for the average mantlegeotherm is the arithmetic average of Tp derived atSiqueiros, and that derived using mean FeOliq fromPETDB MORB: error analysis yields: Tp
MOR=1454±78 °C, presuming Fomax at Siqueiros is valid globally. Weuse 1454 °C to calculate mantle excess temperatures at hotspots relative to MORs.
To estimate the standard deviation of potentialtemperatures beneath MORs, we consider the 1σ valueforMORBFeO contents, which is ±0.57wt.% (computedfor all MORB with 7 wt.%≤FeO≤9.6 wt.%). The 1σFeO variation about the mean MORB FeO (Fig. 9b)translates to a 1σ variation in T in the sub-MOR mantleof ±30 °C (Fig. 9b), or ±34 °C, if an uncertainty of ±0.04on Fomax is included (a ±0.04 uncertainty in Fomax trans-lates to a ±15 °C uncertainty in T ). These observationsindicate that a rather narrow range of temperaturescharacterizes the sub-MOR mantle. Our T estimates donot account for variations in H2O beneath various MORsegments. Recent work that accounts for H2O variations
at the Azores (Asimow et al., 2004) suggests that the sub-MOR temperature range may be further diminished. As a“null hypothesis”, we chose not to filter the globalMORBdatabase for hot spot effects (other than excludingIceland). Siqueiros may indeed be more representativeof mean MORB temperatures, if, as we show for Iceland,Samoa and Hawaii, that near-ridge hot spots are indeedhot. In addition, if the observed value forKD(Fe–Mg)ol-liq
of 0.29 at Siqueiros is valid (Fig. 6), and applies globally,then Tp for MORB (see below) is lower by 25 °C.
4.4. Sources of error: melt fraction (F) and pressure (P)
The above-noted mantle potential temperaturesdepend upon estimates of F and P (see Fig. 1, captionand Appendix A). Estimates of F are very uncertain (seeAppendix A), and so estimates of Tp are much lessaccurate than estimates of olivine-liquid equilibrationreported in Fig. 9 and Table 2. To estimate F weinterpolate between experiments performed on perido-tite bulk compositions (see Appendix A for details); anuncertainty in F of ±5% translates to a thermaluncertainty of ±33 °C. Pressure estimates also enterinto the calculation of Tp, since F=ƒ(P,) and alsobecause of a correction for adiabatic upwelling (Fig. 1).
mperfit
Highlight
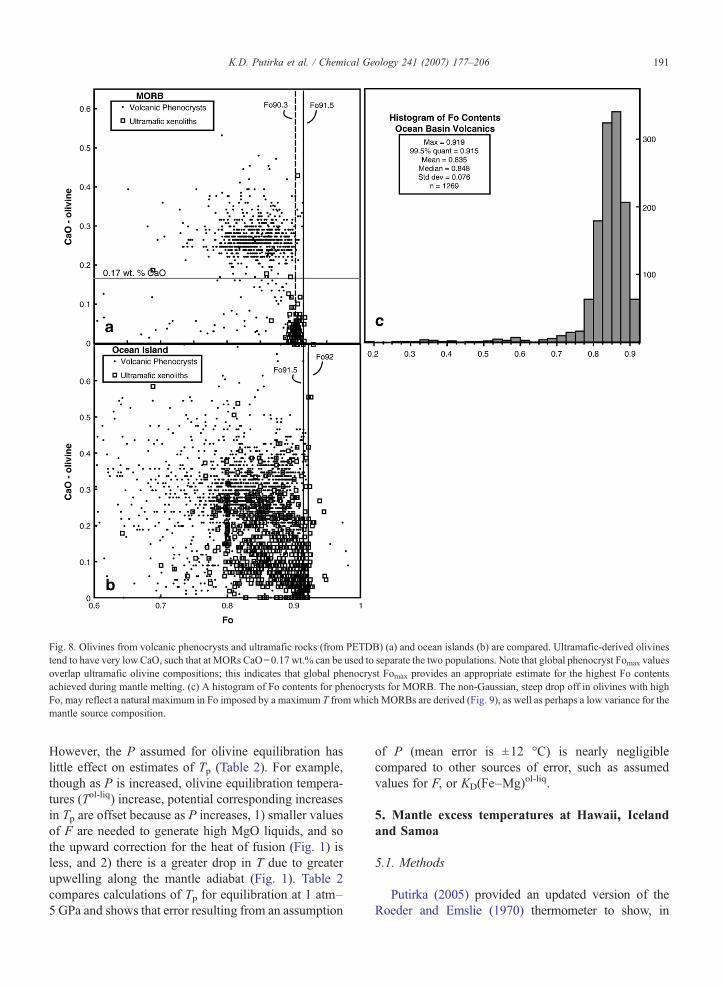
Fig. 8. Olivines from volcanic phenocrysts and ultramafic rocks (from PETDB) (a) and ocean islands (b) are compared. Ultramafic-derived olivinestend to have very low CaO, such that at MORs CaO=0.17 wt.% can be used to separate the two populations. Note that global phenocryst Fomax valuesoverlap ultramafic olivine compositions; this indicates that global phenocryst Fomax provides an appropriate estimate for the highest Fo contentsachieved during mantle melting. (c) A histogram of Fo contents for phenocrysts for MORB. The non-Gaussian, steep drop off in olivines with highFo, may reflect a natural maximum in Fo imposed by a maximum T from which MORBs are derived (Fig. 9), as well as perhaps a low variance for themantle source composition.
191K.D. Putirka et al. / Chemical Geology 241 (2007) 177–206
However, the P assumed for olivine equilibration haslittle effect on estimates of Tp (Table 2). For example,though as P is increased, olivine equilibration tempera-tures (Tol-liq) increase, potential corresponding increasesin Tp are offset because as P increases, 1) smaller valuesof F are needed to generate high MgO liquids, and sothe upward correction for the heat of fusion (Fig. 1) isless, and 2) there is a greater drop in T due to greaterupwelling along the mantle adiabat (Fig. 1). Table 2compares calculations of Tp for equilibration at 1 atm–5 GPa and shows that error resulting from an assumption
of P (mean error is ±12 °C) is nearly negligiblecompared to other sources of error, such as assumedvalues for F, or KD(Fe–Mg)ol-liq.
5. Mantle excess temperatures at Hawaii, Icelandand Samoa
5.1. Methods
Putirka (2005) provided an updated version of theRoeder and Emslie (1970) thermometer to show, in

192 K.D. Putirka et al. / Chemical Geology 241 (2007) 177–206
response to Green et al. (2001), that high FeOliq at Hawaiiand Iceland requires greater values for Tp at theselocalities compared to MOR's, despite similar values forFomax. The Putirka (2005) models were calibrated to testthe effects of H2O and CO2 on calculations of Tex. By
applying similar ƒO2 conditions and KD(Fe–Mg)ol-liq,Hawaii still has a considerable excess Tof 168 °C. We re-calculate Tp at Hawaii and Iceland, and introduce newcalculations for Samoa, using Eqs. (2) and (3), and KD
(Fe–Mg)ol-liq=0.34 (Fig. 6b) at Hawaii and Samoa, and

193K.D. Putirka et al. / Chemical Geology 241 (2007) 177–206
0.32 at Iceland (see Appendix A). Values for KD(Fe–Mg)ol-liq at Hawaii are in part based on the observationthat mean whole rock-olivine compositions are consistentwithKD(Fe–Mg)ol-liq=0.34 (Fig. 6b); to presume a lowervalue for KD(Fe–Mg)ol-liq introduces a mass balanceproblem that can be solved only if high density olivine-rich slurries are somehow preferentially erupted over theirlower density, more highly fractionated counterparts(Fig. 6b). This argument is similar to that posed byWright (1973) when he estimated that the minimumMgOcontent of Hawaiian parental magmas as 15.5 wt.%. Aperhaps under-appreciated fact is that parental liquidsmust represent the sum of all erupted and non-eruptedliquid and crystalline products, and if dense olivineslurries are preferentially left behind in a conduit, eruptedproducts yield minimum estimates for parental MgO.
For consistency, we use the mean KD(Fe–Mg)ol-liq
derived from the models of Herzberg and O'Hara(2002), Toplis (2005), and Putirka (2005) to all localities(including MORB; see Appendix A), which at Hawaiimatches the observed value. We also presume equili-bration at 3 GPa, or near the base of the lithosphere forHawaii and Samoa, and 2.3 GPa, at Iceland. As notedfor MORB, though, Tp estimates are nearly independentof the assumed P of olivine-liquid equilibration(Table 2). In any case, high P, and elevated values forKD(Fe–Mg)ol-liq (due to high P–T; e.g., Herzberg andO'Hara, 1998) at hot spots overlying thick lithosphereare probably the most realistic. Studies show thatclinopyroxenes can be transported from well belowthe base of the crust (e.g., Putirka, 1997; MacLennanet al., 2001b, Klügel and Klein, 2006). High Fo olivines,which by any method yield higher temperatures thanclinopyroxenes, are thus almost certainly mantle-derived, probably from greater depths than the greatestdepths inferred for clinopyroxenes.
At Hawaii, we use data from the Hawaii ScientificDrilling Project (HSDP) and from Norman and Garcia(1999). At Iceland we use data from MacLennan et al.(2001a) and the GEOROC database. At Samoa we usedata from the GEOROC database and new analyses ofpicritic samples. To calculate FeO, we apply the ƒO2
Fig. 9. Olivine saturation models (using the approach detailed in Putirka, 200and Mauna Kea at Hawaii (c), Iceland (d), and Samoa (e). The axes, XMg ancompositions. Near-vertical lines are regression lines through various data subthe regression lines. (a) Shows the range of MORB temperatures calculatedtemperature estimates using the mean ±1σ variations for primitive MORB winext to the isotherms (nearly horizontal lines); these temperatures are converteFig. 1 and Appendix A for calculation strategy) using Eq. (A1) to calculate F. Fcalculation details). In (c), Fomax is 91.3 at Mauna Loa (Baker et al., 1996; tmantle source are inferred from (Dixon et al., 2002). In each graph, the thermoin Table 1and are explained in Appendix A.
conditions of Rhodes and Vollinger (2005) for Hawaiiand presume that the same conditions characterizeSamoa (FeO=0.92[FeOt] on a weight % basis) and atIceland (and MORB) we apply the ƒO2 conditions ofBezos and Humler (2005) (FeO=0.88[FeOt]). Finally,we calculate Fe3+/Fe2+ ratios using the model of Kressand Carmichael (1988) (see Appendix A for details).
5.2. Temperatures at Hawaii, Iceland and Samoa
Olivine equilibration temperatures at 3 GPa at MaunaLoa, Hawaii and at Samoa are 1620 °C and 1625 °Crespectively. At Iceland, olivine equilibration at 2.3 GPa is1520 °C (Fig. 9). Our method implies a value for the MgOcontent of parental magmas at each locality, which can beused to estimate a parental magma composition (Table 1),as well as melt fraction and a mantle potential temperature(see Appendix A). Our calculated mantle potentialtemperatures are insensitive to P (Table 2), but sensitiveto very uncertain estimates of F. Mantle potentialtemperatures at Hawaii and Samoa are estimated to bothbe 1722 °C, while at Iceland our estimate is 1616 °C. Theseestimates exceed MOR maximum Tp values by 105–211 °C and imply mantle excess temperatures, Tex, of268 °C at Hawaii and Samoa, and 162 °C at Iceland. Thesetemperatures rise so far above average and maximumvalues for Tp
MOR that volcanism at Iceland, Samoa andHawaii appear almost certain to derive from thermallydriven mantle plumes. These conclusions account forvariations in water contents between MOR and hot spotsources, and are robust against variations in CO2 and othermajor mantle components, and, except for estimates of F,are independent of any assumed composition for theirmantle sources (see Putirka, 2005; Appendix A).
Opponents to the plume hypothesis might still posit thatƒO2 variations might account for the apparent thermaldifferences. But oxidation states of one log unit above thequartz–fayalite–magnetite buffer (QFM+1) would berequired to explain the proposed model of Mauna Loacompositions byGreen et al. (2001) in the case thatKD(Fe–Mg)=0.30; even higher oxidation states are required in themore likely case thatKD(Fe–Mg) approaches 0.34 or 0.35.
5) are used to estimate temperatures at MORs (a) and (b), Mauna Load XFe are the cation fractions of MgO and FeO for glass or whole rocksets; MgO contents are recovered as shown in Fig. 2, and marked alongusing the global range of primitive FeOliq (Fig. 7). (b) Shows MORBth FeOliq=7–9.6 wt.%. Temperatures of olivine equilibration are givend to mantle potential temperatures, which are shown in parentheses (seeor MORBwe show calculations using A1 and A2 (see Appendix A forhis study) and 90.3 at Mauna Kea (this study). Water contents for themeters require estimates for SiO2
liq and (Na2O+K2O)liq; these are given

Table 2Calculated T(°C) for olivine equilibration, Teq, and mantle potential temperature, Tp
Siqueiros-A1 Siqueiros-A2 Iceland-A1 Hawaii-A1 Samoa-A1 Samoa-A2
Teq[Tp](F) at 5 GPa 1455[1404](1.5) 1455[1412](2.6) 1565[1599](14.3) 1665[1719](18.1) 1665[1661](9.4) 1665[1704](15.9)Teq[Tp](F) at 4 GPa 1435[1407](3.1) 1435[1419](5.0) 1550[1608](15.9) 1645[1723](19.7) 1645[1665](11.0) 1645[1713](18.2)Teq[Tp](F) at 3 GPa 1423[1418](4.7) 1423[1435](7.3) 1525[1605](17.5) 1620[1722](21.3) 1625[1669](12.6) 1625[1722](20.6)Teq[Tp](F) at 2 GPa 1400[1418](6.3) 1400[1440](9.6) 1510[1613](19.1) 1605[1731](23.0) 1605[1673](14.2) 1605[1731](22.9)Teq[Tp](F) at 1 GPa 1380[1420](7.9) 1380[1447](12.0) 1490[1616](20.7) 1585[1736](24.6) 1585[1677](15.8) 1585[1740](25.2)Teq[Tp](F) at 1 atm 1365[1428](9.6) 1365[1460](14.3) 1475[1624](22.3) 1565[1740](26.2) 1570[1686](17.4) 1570[1754](27.6)Average Tp(C) 1416 1435 1611 1728 1672 1727S.D. 8.9 18 8.8 8.5 9.0 18Excess Tex(C) – – 176–195 293–312 237–256 292–311
F is in percent and calculated using Eqs. (A1) or (A2), as indicated in header (see Appendix A).Olivine equilibration temperatures, Teq(°C), are calculated using models (2) and (3), and the liquid compositions in Table 1. We use constant valuesfor KD(Fe–Mg)ol-liq (MORB=0.31; Hawaii and Samoa=0.34; Iceland=0.32) and Fomax (Fig. 9) and presume that ƒO2 is buffered (see Appendix A).Mantle potential temperatures, Tp(°C), are calculated from Teq using the equations of Fig. 1, and models for melt fraction, F, where F=ƒ(P,Ci), whereP is pressure, and Ci are weight percent composition terms, from Table 1; see Eqs. (A1) and (A2) in Appendix A.
Fig. 10. FeOt (FeO total) vs. MgO for Hawaii and Siqueiros lavas (Dataas in Fig. 5). Since Fomax is similar at MORs, Iceland and Hawaii,variations inTare controlled largely by variations in Fe. FeO contents canthus be used to test the reasonableness of estimates of Tex. Calculationsshow that for theMauna Loamodel of Green et al. (2001) to be valid, ƒO2
at Hawaii would need to approach 1 log unit above the quartz–fayalite–magnetite (QFM+1) buffer, for KD(Fe–Mg)ol-liq=0.30; even higheroxygen fugacities are required if KD(Fe–Mg)ol-liq=0.34 or 0.35. ButRhodes and Vollinger (2005) have shown that Hawaiian lavas are morereduced than QFM. It is similarly unreasonable to call upon ƒO2 to yieldoverlapping FeOliq at Samoa and Siqueiros.
194 K.D. Putirka et al. / Chemical Geology 241 (2007) 177–206
Hawaiian lavas, though, are if anything less oxidized thanQFM (Rhodes and Vollinger, 2005), and KD(Fe–Mg) isunlikely to be as low as 0.30 (Fig. 6b). It thus appearsinescapable that excess temperatures at Hawaii (andIceland) are very high, and that variations in ƒO2
(Fig. 10), H2O, CO2 and other major mantle components(Putirka, 2005) are incapable of erasing these differences.
6. An upper mantle convective geotherm
Our estimate for TpMOR should reflect the temperature
of the upper mantle in all regions thermally unperturbedby subduction or rising plumes. As a test, we compareour estimate of Tp
MOR to mantle temperatures derived byother means (Fig. 11). Interestingly, though ourestimates of Tp beneath MORs exceed some publishedestimates, they are consistent with geophysical observa-tions: Temperature estimates from heat flow and seafloor bathymetry (1450±250 °C at 90 km depth; Steinand Stein, 1992), match well with our proposed MORgeotherm. Unfortunately, the temperature of the oliv-ine–spinel phase transition is uncertain due to uncer-tainty related to water contents (e.g., Smyth and Frost,2002), mantle composition (Thybo et al., 2003; Frost,2003) and the placement of phase boundaries (Bina andHelffrich, 1994). Indeed, Cammarano et al. (2003)conclude that inversion of seismic velocities at the410 km discontinuity for temperatures is “unreliable.”Jeanloz and Thompson (1983) suggested a T of 1427±300 °C, which is consistent with the later experiments ofIto and Katsura (1989), and probably still reflective ofcurrent uncertainties, and which overlaps our Tp
AMG.Temperature estimates appear somewhat more certain at670 km. Da Silva et al. (2000) estimate temperatures fora pyrolite (PYR) and a silica enriched (Hi Si) mantle
(Fig. 11). The downward extrapolation of our geothermwould appear to support a layered mantle that isenriched in SiO2 below 670 km. However, Hirose's(2002) experiments on a pyrolite mantle compositionshow that the majorite–perovskite phase transition,having a positive Clapeyron slope, complicates thepicture. Hirose's (2002) experiments are consistent with

Fig. 12. Estimates of excess temperatures, Tex, can be used asminimum estimates of ΔT, in calculating thermal buoyancy from the
195K.D. Putirka et al. / Chemical Geology 241 (2007) 177–206
a 1600–2000 °C T range at 670 km, and hence areconsistent with our MOR geotherm, and a pyrolite lowermantle. Perhaps more importantly, Hirose's (2002)results suggest that the 670 km discontinuity is unlikelyto be uplifted if T670=1800 °C. Seismologists use theobservation of a shallow “670 km” seismic discontinuityas evidence of a thermal anomaly in the lower mantle(based on the negative Clapeyron slope for the spinel–perovskite phase transition in simple mantle systems),and a flat 670 km discontinuity to suggest the absence ofa thermal anomaly. However, Hirose's (2002) workshows that the Clapeyron slopes of spinel/post-spinelphase changes in a pyrolite composition mantle are suchthat even if the 670 km discontinuity is not anomalouslyshallow, excess temperatures might still be rooted in thelower mantle. Finally, Hofmeister (1999) uses thermalconductivity models to calculate a geotherm with acomparatively high implied Tp for a dry mantle(Fig. 11). The errors on this geotherm are unclear, and
Fig. 11. The Tp estimated for MORs is likely to reflect the T of theconvective mantle geotherm. Our proposed geotherm is compared to Testimates derived from the coincidence of seismic discontinuities at410 km and 670 km with associated phase transitions, and thegeotherm proposed by Hofmeister (1999). Tp
AMG=Tp of AverageMantle Geotherm, and is derived from MORBs; Tp
I=Tp of Iceland;TpH=Tp of Hawaii. The gray field about Tp
AMG indicates error on theestimate of Tp
AMG. The inflection at 410 km reflects the anticipated50 K increase in T (Frost, 2003) due to the exothermic phase change ofolivine to wadsleyite, the spinel form of (Mg,Fe)2SiO4. This drop in Tcan be computed from an expression similar to that used in Fig. 1 tocalculate the T drop upon melting, i.e.,ΔT≈F(ΔHr /Cp)=−T(∂P /∂T )(F )(ΔVr) /Cp, where F=the fraction of olivine in mantle peridotite(that converts to spinel), T is the temperature of reaction, ΔHr and ΔVrare the enthalpy and volumes of reaction, Cp is heat capacity and ∂P /∂T is the Clapeyron slope of the olivine–spinel phase transition.
Rayleigh number, Ra. Such calculations show that Ra becomessupercritical (Rac≈1000) at depths that are much more shallow thanlikely sites of plume nucleation, i.e., the 670 km discontinuity, or thecore/mantle boundary.
it is also uncertain that the small amounts of waterpresumed for the upper mantle (Dixon et al., 2002)would bring her geotherm and ours into agreement(Fig. 11). Our mantle potential temperatures are alsolower than those implicit in Fig. 1 of Jeanloz and Morris(1986; ≈1477–1630 °C “cold”, and ≈2100–2200 °C“hot”), but appear to reside within their stated errors.
Another test is to compare initial melting depths thatare implied by our Tp calculations, with those derivedfrom seismic detection of low velocity zones in themantle. Initial melting depths are calculated from theintersection of our convective geotherms with the mantlesolidus. Hirschmann (2000) has reviewed experimentsthat delimit the drymantle solidus. His quadratic fits to thedata have the unfortunate feature of a thermal maximum,which we rectify by fitting Hirschmann's (2000) datausing the functional form ofMcKenzie andBickle (1988):
PðGPaÞ ¼ Tð-CÞ−1120157:17
þ 1:596
� 10−1½expð4:169� 10−3fTð-CÞ−1120gÞ�ð6Þ
Eq. (4) reproduces Hirschmann's “RecommendedFit” for the solidus at Pb10 GPa (his Table 1), and isconsistent with Herzberg and Zhang's (1996) solidusestimates above 10 GPa. Depths are converted from Pusing PREM (Anderson, 1989).

196 K.D. Putirka et al. / Chemical Geology 241 (2007) 177–206
Our values for Tp imply initial melting depths (at thedry solidus) of 220 km beneath Hawaii, 160 km beneathIceland, and 95 km beneath MORs. The latter estimatematches almost precisely the seismic estimate for thebase of the zone of “primary melting” (at 100 km; MELTSeismic Team, 1998) and is consistent with geochemicalevidence that requires melting in the garnet stability field(e.g., Salters and Hart, 1989). The MELT SeismicTeam's zone of “incipient melting” extends to 150 km,and is likely controlled by mantle volatile contents.Unfortunately, no seismic experiment comparable to thatof the MELT Seismic Team (1998) study has beenperformed at Iceland or Hawaii. Current work suggeststhat our calculated initial melting depths are at leastplausible (e.g., Laske et al., 1999; Foulger et al., 2000),but higher resolution studies are needed to provide a testof low velocity zone depths (Laske et al., 1999; Priestleyand Tilmann, 1999; Ritsema and Allen, 2003).
In summary, our proposed geotherm is thus consistentwith sea floor bathymetry, knownmantle phase transitionsand seismically inferred melting depths. By all appear-ances, our proposed geotherm carries much less uncer-tainty (≈ ±78 °C for estimates of mean Tp) than othermethods. We thus suggest that our proposed geothermcould be used as a constraint uponmodels of uppermantleconvection, composition, mineralogy, and thermalconductivity.
7. Active vs. passive upwelling
Given an estimate for the mantle geotherm, does thereexist some minimum threshold Tex, above which activeupwelling is assured? Given that thermal plumes maycool en route to the surface (Leitch et al., 1996; Albers andChristensen, 1996), estimates of Tex provide minimumestimates ofΔT (the temperature difference across a layerof thicknessD) when calculating a Rayleigh number (Ra);Ra gives the balance between buoyancy forces thatenable, and inertial forces that inhibit, convection. We letD, the depth of the convecting layer, vary for a given valueof ΔT, and determine the critical depth (Dc) at which Rabecomes supercritical (Rac≈1000), and calculate
Ra using:Ra ¼ gqD3DTjl
, where g is acceleration due to
gravity, ρ is density (3300 kg/m3), κ is thermal diffusivity(10−6 m2/s) (see Davies, 1999) and μ is viscosity(3.9×10²⁰ Pa·s; King, 1995; King (1995) reports arange of viscosities of 2×10¹⁹–1×10²¹). For Tex atHawaii and Samoa (268 °C) and Iceland (162 °C), Rareaches 1000 at depths of 114 and 135 km respectively(Fig. 12). If circulation encompasses the entire uppermantle (D=670 km; then Ra=14.1×10³ at Iceland and
18.6×10³ at Hawaii) or the entire mantle, Rac values arewell above critical. These calculations suggest thatHawaii, Samoa and Iceland result from active upwellings.Our Testimates do not delimit the depths at which thermalanomalies are nucleated. But to use Iceland as an example,even plume skeptics agree that low seismic velocitiesextend to at least the base of the upper mantle (Foulgeret al., 2000). If low seismic velocities reflect temperaturevariations, then it seems safe to conclude that thermallydriven active upwellings extend to at least to the base ofthe upper mantle.
8. Comparisons to some prior petrologic Tp estimates
Our present work finds agreement, but also importantdifferences, with several recent and early studies. Ourparental liquid compositions for MORB and Hawaii areremarkably similar to the “primary magma” compositionsproposed by Herzberg and O'Hara (2002) (our definitionsfor “primary” and “primitive” magmas overlap; seeAppendix A). Our parental magma compositions atHawaii are also consistent with the minimum MgO(15 wt.%) estimates established by Wright (1973) andClague et al. (1991). Our estimates for Tex are also verysimilar to those estimated by Herzberg and O'Hara (1998)and MacLennan et al. (2001a). In addition, we findagreement with the 250 °C T range estimated by Klein andLangmuir (1987) for T Iceland–T coldest MORB: our estimatefor T Iceland–T coldest MORB is 215–246 °C (Fig. 9). Incontrast, the global MORB T ranges of 100–140 °Cinferred by Presnall et al. (2002) and Shen and Forsyth(1995) include Iceland, and hence are far too small toexplain the global range of MORB olivine equilibrationtemperatures calculated here (Fig. 9). Shen and Forsyth(1995) appear to overestimate the influence of mantleheterogeneity. Presnall et al. (2002) appear not to accountfor the heat of fusion in calculating Tp, and it would alsoappear that phase compositions and proportions inferredfrom synthetic systems do not extrapolate precisely tonatural systems.
As for absolute T estimates, we find agreement withWang et al.'s (2002) estimate of Tol-liq(2.2 GPa)=1435 °Cat the East Pacific Rise (their Tp=1448 °C, if F=6%;compared to our value of Tp=1454 °C), and Leemanet al.'s (2005) study of the Cascades implies thatTp=1400 °C, or higher, depending upon F. But HerzbergandO'Hara (2002) estimate lower temperatures forMORB(Tp=1380 °C) and lower values for Tex at Kilauea, Hawaii(140–190 °C). Our differences with Herzberg and O'Hara(2002) are largely due to the conversion of an olivine-liquidtemperature, Tol-liq, to a mantle potential temperature, Tp.(As shown in the Appendix A, various thermometers yield

197K.D. Putirka et al. / Chemical Geology 241 (2007) 177–206
similarTol-liq estimateswhen consistent input data are used,especially at elevated P). For example, using Herzberg andO'Hara's (2002) Kilauea sample 2E, (their Table 5), whichis similar to our preferred parental liquid, they estimate thatF=14% at 3.3 GPa and that Tol-liq (4 GPa)=1651 °C.Using theirF and the parameters of Fig. 1, we calculate thatTp=1700 °C, which would be in agreement with ourpreferred estimate of Tp
Hawaii =1722 °C. Though unclear, itappears that Herzberg and O'Hara apply F=14% at 1 atmto correct their 1 atm estimate for Tol-liq=1467 °C, whichfrom Fig. 1 yields Tp=1560 °C. Our interpolation ofexperimental data (Eq. (A1)) indicates, however, that F at1 atm is 26.5%, which when applied to their Tol-liq (1 atm),yields Tp=1644 °C, much closer to our preferred value; theremaining difference at 1 atm is because Eq. (2) predicts ahigher T than Beattie (1993) (see Appendix A). Moreinterestingly, had Herzberg and O'Hara (2002) simplymade their corrections from Tol-liq to Tp at elevated P, theywould derive a Tp nearly identical to ours: From theirTable 5: Fmean=21.7%, and Tmean
ol-liq (4 GPa)=1634 °C,which (using Fig. 1) converts to Tp
Kilauea=1725 °C, nearlyidentical to our Tp
Hawaii=1722 °C. We suggest that 1)Herzberg and O'Hara's (2002) estimates for Tp at Kilauea(1520–1570 °C) are too low due to an underestimate of F,especially at 1 atm, and 2) that the discrepancy is rectifiedby considering their mean values for F and Tol-liq atelevated P. More significant is our departure with Greenet al. (2001), who estimate that Tex≈0 °C (see alsocomparisons to Falloon et al. (this volume) inAppendixB).However, Green et al.'s (2001) implicit estimates for FeOtat Hawaii are very low, requiring unacceptably high valuesfor ƒO2 (Fig. 10). Green et al. (2001) also do not appear tocorrect for the heat of fusion when calculating Tp, andimplicitly select a low value for Fomax at Hawaii, byaveraging temperature estimates for volcanoes that are notdirectly over the hot spot.
9. Summary
The key issue in the plume debate is whether mid-platevolcanic activity is caused by passive, or thermally drivenactive upwellings. These models are distinct in thatthermally driven upwellings will exhibit excess tempera-tures that reflect excess heat in their mantle sourceregions.We propose an observation-driven approach, andupdated olivine-liquid thermometers to estimate mantletemperatures and identify mantle plumes. Key observa-tions include estimates of parental FeOliq, as inferred fromolivine control lines (Figs. 5 and 7), maximum Focontents recovered from primitive magmas or mantlexenoliths (Fig. 8), and values for KD(Fe–Mg)ol-liq
determined from mass balance considerations (Fig. 6).
Our T estimates are not entirely model-independent, asthey require (in addition to a geothermometer) an estimateof ƒO2 and, for precision, an estimate of a parentalliquid composition. Our potential temperature, Tp, forthe average mantle geotherm, which we derive fromSiqueiros, and mean FeO contents from MORBs(Fomax=91.5) is Tp
AMG=1454±78 °C. This value definesthe convective geotherm that should apply at any localitythat has not been thermally disturbed by subduction oractive mantle upwelling. Global variations in sub-MORtemperatures have a range of 140 °C, but a very narrow1σvariation of ±34 °C. Clearly, there is support for the viewthat isotherms are nearly flat at depth in thermallyundisturbed regions of the upper mantle (McKenzie,1967; Ahern and Turcotte, 1979; McKenzie and Bickle,1988). Our calculations for T Iceland–Tcoldest MORB (215–246 °C) further support theKlein andLangmuir (1987) viewthat temperature variations (T Iceland–Tcoldest MORB=250 °C)control global variations in FeO, Na2O and SiO2, and thatparental MORB liquids are picritic, and produced at hightemperatures (O'Hara, 1968; Jacques and Green, 1980;Stolper, 1980).
Potential temperatures at Hawaii and Samoa are1722 °C and at Iceland is 1616 °C, and exceed even thehighest temperatures estimated forMORBs byN100 °C.Asource of excess thermal energy seems inescapable. Theseexcess temperatures are favored by us because theyexplain the coincidence at some hot spots of high excesstopography (Sleep, 1990; Schilling, 1991; Watson andMcKenzie, 1991), and primitive liquids that contain (a)high TiO2/Na2O and high Sm/Yb ratios (Putirka, 1999),and (b) high FeO, and low SiO2 contents (Langmuir et al.,1992; Albarede, 1992). What is particularly compelling isthat Ti/Na ratios are controlled by clinopyroxene-, and Sm/Yb ratios by garnet-liquid equilibria. If excess tempera-tures were non-existent, it would be a cruel happenstancethat petrologic indicators of high P–T partial meltingwould be apparent, but lack such a meaning.
Our T estimates do not indicate whether or notplumes nucleate at the core–mantle boundary. How-ever, Morgan (1971) might be correct about the basicmechanism, and also wrong about the site of plumenucleation: The concept of a layered mantle, withplumes nucleating at 670 km, is not new (Allegre andTurcotte, 1985), and has not been entirely discarded(e.g., Tackley, 2000). Since it is unclear that Earth'score contributes mass to mantle upwellings, we suggestthat perhaps the only signal from the core may bethermal in nature, and that dynamic modelers investi-gate whether there is a critical value for Tex beyondwhich plume nucleation at the core–mantle boundaryis assured.

198 K.D. Putirka et al. / Chemical Geology 241 (2007) 177–206
Acknowledgements
KDP acknowledges support from NSF grant EAR03347345, and grants from the College of Science andMathematics, California State University Fresno. MRP'sresearch has been supported by OCE grants 9019154 and0138088. FJR's participation was performed under theauspices of the U.S. Department of Energy by Universityof California Lawrence Livermore National Laboratoryunder contract No.W-7405-Eng-48, and supported by theLLNL Laboratory Directed Research and DevelopmentProgram.We thank Paul Asimow, Leonid Danyushevsky,Trevor Falloon, Claude Herzberg, and Ian Ridley for veryhelpful discussions. Unpublished data generously sup-plied by Falloon et al., were useful in the early phase of thedevelopment and testing of the models presented in thiswork. The paper also greatly benefited from formalreviews by Trevor Falloon, J. Michael Rhodes, and ananonymous reviewer.
Appendix A. Methods
A.1. Calculation of FeOt (FeO total) and Fe3+/Fe2+
Iron in volcanic rocks is variously reported as Fe2O3t,FeOt (t for “total”) or some combination of Fe2O3 andFeO. For consistency, we recast all Fe analyses as FeOtotal: we convert all oxides to a cation fraction, where, forexample, reported Fe2O3 and FeO contents are divided bythe molecular weights of FeO1.5 and FeO respectively(and Al2O3, Na2O and K2O are respectively divided bythe molecular weights of AlO1.5, NaO0.5, and KO0.5, etc.).We calculate the cation sum, FeOtcs=FeO1.5+FeO, andmultiply FeOtcs by the molecular weight of FeO, andsimilarly weight all other oxides by their respectivemolecular weights. Renormalization to 100 yields weightpercent values for FeOt, which is used for all subsequentcalculations, and all graphs in this paper.When Fe2O3 andFeO are both reported, and Fe2O3 / (Fe2O3+FeO)b10%by weight, then if FeOt is calculated as Fe2O3+FeO, theerror is less than 1%.
To calculate Fe2+ /Fe3+and Fe2+ / (Fe2+ +Fe3+) fromFeOt, we use the expressions of Kress and Carmichael(1988). Since Fe2+ /Fe3+ varies with T, we apply aniterative procedure: we calculate Fe2+ / (Fe2+ +Fe3+)over a range of temperatures using our model composi-tions (Table 1) and natural compositions reported inRhodes and Vollinger (2005) and Bezos and Humler(2005). We apply the ƒO2 conditions inferred by theaforementioned studies and presume that ƒO2 isbuffered. We then use a calculated value for T to inferthe cation ratio Fe2+ /Fe3+, and then use this new value
of Fe2+ /Fe3+ to recalculate T. Because of the greatermolecular weight of Fe2O3 compared to FeO, a 2%change in the weight ratio translates to approximately a1% change in the cation ratio Fe2+ / (Fe2+ +Fe3+).
A.2. Calculation of parental magma compositions
The method of T estimation of Putirka (2005) impliesa (predicted) value for MgOliq for parental magmas,which can be used to calculate other oxides. We use theterm “parental” in that our liquid compositions in Table 1represent the liquids that are parental to all observed andburied volcanic and crystalline products related tomantle melting. Our liquids in Table 1 would alsorepresent the mean compositions of what are sometimescalled “primary” liquids, which are generated in themantle, pooled, and then delivered towards the surface.An alternative term might be “pooled primary liquids.”
To reconstruct a parental magma, we first determinethe MgO content of the parental magma. Since FeOt isinvariant along olivine control (Fig. 5), FeOt along anolivine control line (a variation trend controlled byolivine addition/removal only; Figs. 5 and 7) isequivalent to FeOtparental liquid or FeOtpl. With acalculated value for KD(Fe–Mg)ol-liq, we use FeOtpl
and observed Fomax to yield a unique value for MgOpl
(independent of any model for T or mantle composi-tion): Fomax fixes the value for Fe/Mg of olivine, andwith (Fe/Mg)ol the value for KD(Fe–Mg)ol-liq fixes thevalue of Fe/Mg for the liquid. If FeOtpl (and ƒO2) areknown, then MgOpl is fixed by these values. Similarly,given estimates for MgOpl, Fomax and KD(Fe–Mg)ol-liq,one may calculate FeOtpl, which is how we test themodel of Green et al. (2001) (Fig. 10). To reconstruct theremaining parental magma components, we add olivineto a “primitive” lava until the predicted MgO content isachieved. Primitive lavas are derived from a mean ofnatural lava compositions that are sufficiently MgO richto be on an “olivine control” line. We use the followingMgO values as delimiters for our primitive liquids;Siqueiros: 9–10.5 wt.%; Iceland: 9.5–11.5 wt.%;Hawaii: 8–10 wt.%; Samoa, 8.75–1.5 wt.%. Sinceolivine control lines represent mixtures, not liquid linesof descent, we do not perform a “reverse fractionationmodel”, which would have no meaning. We use Fig. 5 todetermine the mean Fo content along an olivine controlline, and use this Fo for correction. This choice enforcesthat our liquids in Table 1 will always lie withinobserved major oxide variation diagrams. We emphasizethat whole rocks that have MgOpl values are unlikely tobe liquids: They are mixtures that have the appropriateMgOpl only by accident, not by virtue of evolution.

Fig. A1. Olivine-liquid thermometers (Beattie, 1993, with corrections byHerzberg and O'Hara, 2002; Eqs. (2) and (4) of this study; Ford et al.,1983) are compared for their ability to predict melting temperatures forpure forsterite (Bowen and Anderson, 1914; Presnall and Walter, 1993).The Beattie (1993) model and Eq. (4) yield the best results, but as shownin Table A2, such comparisons do not translate to systematic error on Testimates or natural samples (see Table A2).
199K.D. Putirka et al. / Chemical Geology 241 (2007) 177–206
A.2.1. Estimating KD(Fe–Mg)ol-liq
Tests show that none of the recent models developed topredictKD(Fe–Mg)ol-liq, i.e., Herzberg and O'Hara, 2002;Putirka, 2005; Toplis, 2005, capture internal variations inKD(Fe–Mg)ol-liq. Regression analysis of experimental data(n=1007, Fig. 3) for KD(Fe–Mg)ol-liq(measured) vs. KD
(Fe–Mg)ol-liq(calculated) shows that all three models yieldR2b0.04, slopes of regression lines that are embarrass-ingly flat (b0.4), and standard errors of estimate that are±0.06. None of these models can be intrinsically preferredover the other, and are poor substitutes for observations(Fig. 6). Because adequate data are not available at alllocalities, wemake use of calculated values for consistency.We first use observed values forKD(Fe–Mg)ol-liq (Fig. 6) toestimate MgOpl, and then iteratively apply the mean KD
(Fe–Mg)ol-liq calculated from Herzberg and O'Hara(2002), Putirka (2005), and Toplis (2005). This methodyields a higher than observedKD(Fe–Mg)ol-liq at Siqueiros(Fig. 6); if the values for KD(Fe–Mg)ol-liq in Fig. 6 areaccurate, however, Tp for MORB is lower by 25 °C, andexcess temperatures are greater by the same amount.
A.3. Comparison of olivine-liquid thermometers
Table A1 shows that at moderate P, when consistentinput is used, various models yield estimates that arewithin 1σ model error. But when such models disagree,which is to be preferred? Beattie (1993) used the olivinebinary to show that his two-lattice solution model issuperior to the regular solution model employed byGhiorso et al. (1983). We extend this test by comparing Testimates for melting of pure forsterite (Presnall andWalter, 1993). The modified Beattie (1993) modeland Eq. (4) provides superior estimates of Fo melting.However, this comparison has limitations: natural liquidsdo not approach the Fo binary, so success in Fig. A1 canhardly lead to confidence in predicting T for naturalsamples. For example, the Beattie (1993) model yieldshigher temperatures than Ford et al. (1983) for Eqs. (2) and(3) for Kilauea-H at 3 GPa (Table A2) even though theBeattie (1993) model yields lower temperatures for pureFo. And though Eq. (4) and Beattie (1993) both closelyreproduce the Fo melting curve, these models disagree byas much as 115 °C (Kilauea-H at 3 GPa, Table A2). Analternative test is to consider that by applying Eq. (1) withexpressions of DMg
ol/liq =ƒ(T) and DFeol/liq =ƒ(T), it is possible
to predict not only T, but also 1)KD(Fe–Mg)ol-liq, sinceKD
(Fe–Mg)ol-liq=DFeol-liq /DMg
ol/iq, and 2) the Fo content of theequilibrium olivine, since XMg
ol =DMgol/liq, XFe
ol =DFeol/liq and
Fo=XMgol / (XMg
ol +XFeol ). Table A2 compares estimates of T,
KD(Fe–Mg)ol-liq and Fo. Note that for Kilauea-H at 3 GPa,Eqs. (4) and (5) yield suspiciously high estimates for KD
(Fe–Mg)ol-liq and a low value for Fo, compared to othermodels. The models are too inaccurate to make judgmentsregarding small variations in such quantities, but thesecomparisons may be useful at differentiating T estimatesthat vary by more than 1−2σ. With differences in T of 1σor less, or small differences in predicted Fo or KD(Fe–Mg)ol-liq it is probably best to average the Testimates sincesuch differences reflect experimental and calibration error.
A.4. Conversion of olivine equilibration temperaturesto mantle potential temperatures, and calculating F
Experiments show that F varies strongly with MgOcontent and P; to estimate F we performed regressionanalysis of peridotite partial melting experiments fromTakahashi et al. (1993), Baker and Stolper (1994), Bakeret al. (1995), Robinson et al. (1998) and Walter (1998),whose data are internally consistent, and yield thefollowing expression:
Fð%Þ ¼ −117:2−1:62PðGPaÞ þ 2:12½SiOliq2 �
þ 4:2½MgOliq�−3:93½FeOliq�: ðA1Þ
In Eq. (A1), compositional parameters are in weight %;n=54, R2=0.96 and the standard error of estimate (SEE)forF is ±4.8%. Eq. (A1) predicts values ofF that approachgeochemical estimates of F at Hawaii (Feigenson et al.,2003) and Iceland (MacLennan et al., 2001a). But this

200 K.D. Putirka et al. / Chemical Geology 241 (2007) 177–206
expression predicts low values of F for MORB (7.9% at1 GPa) compared to interpolation of just the Baker et al.(1995) data (which indicate that F is closer to 13% at1 GPa). When data from Pickering-Witter and Johnston(2000) are included in the regression, F is less preciselyrecovered, but yields higher estimates of F for MORB(apparently by weighting 1 GPa data):
Fð%Þ ¼ −105:1−2:34PðGPaÞ þ 1:789½SiOliq2 �
þ 3:84½MgOliq�−2:26½FeOliq�: ðA2Þ
For Eq. (A2), n=80, R2=0.85 and the SEE is ±8.3%.This expression also yields much higher estimates of F atHawaii (N30%), and Samoa (FN20%). Since thePickering-Witter and Johnston (2000) data may be moreapplicable to the high alkali lavas fromSamoa, we presentTp estimates using Eq. (A2) for both MORB and Samoa(Table 2). Clearly, additional data are needed to betterpredict F and more precisely delimit Tp.
The calculation of F is the only part of our approachthat depends upon an assumption of mantle composition,which we presume to be peridotite. Sobolev et al. (2005)have suggested that the mantle beneath Hawaii has a largefraction of a nearly olivine-free, eclogite-rich component.But eclogite or garnet–pyroxenite dominated sources areneither compatible with trace and major element, andisotopic systematics (Norman and Garcia, 1999; Normanet al., 2002; Putirka, 1999; Stracke et al., 2003), nor thelarge amounts of picrite lavas that occur fromMauna Keato Koolau (Norman and Garcia, 1999; Rhodes andVollinger, 2004; Garcia, 2002), let alone very higholivine-liquid equilibration temperatures (Putirka, 2005;this study). Until the olivine-free mantle model can meetthese challenges, it is not a useful proposition.
Appendix B. Differences between this study, andFalloon et al., this volume
Aswith Green et al. (2001), Falloon et al. (this volume)also infer that at Hawaii, Te≈0 °C. There are several
reasons why we obtain higher T estimates for Hawaii, andTex, and why we believe their lower T estimates areincorrect: (a) Falloon et al. do not correct for the heat offusion (Cawthorn, 1975), which is crucial to any analysisof Tp and Tex (high MgO magmas are generated withgreater thermal energy). (b) MgO is underestimated forFalloon et al.'s parental magma compositions at Hawaii(their Table 1): If we apply the ƒO2 conditions of Rhodesand Vollinger (2005; i.e., FeO=0.92[FeOt]) and acceptFalloon et al's estimate of FeOt, then even if KD(Fe–Mg)ol-liq=0.30, a liquid with FeOt=11.8 wt.% wouldhave 19.2 wt.% MgO for equilibrium with Fo=91.3, and17.8% MgO, for Fo=90.7 (these calculations are model-independent). Yet Falloon et al. report that parental liquidsat Hawaii have MgO=14.8 wt.%. (c) Falloon et al. use avalue of Fomax of 90.7 at Hawaii even though severalstudies have established that Fomax at Hawaii is at least91.3 (Baker et al., 1996; Garcia et al., 1995; Norman andGarcia, 1999; this work, Fig. 8). (d) Falloon et al. estimatea remarkably high value for FeOt for MORB (Fig. 5),which is well above theMORBmean, and approaches theupper 95th percentile for global MORB. Finally, Falloonet al. suggest that KD(Fe–Mg)ol-liq should be 0.29 atHawaii, and 0.32 at MORs. Though Falloon et al., appearnot to use these values for the calculation of Tex, theirsuggested values contradict natural observations (Fig. 6),and the experimental data compiled for this study showthat the effect of TiO2 on KD(Fe–Mg)ol-liq is negligible(slope=−0.006; R2=0.019) compared to T or P. More-over, at Hawaii the lithosphere is thick (e.g., Bock, 1991,Li et al., 2004) and hence Fomax-liquid equilibriumprobably occurs at much greater depths compared toMORs. Regardless of whether one considers variations inKD(Fe–Mg)ol-liq to be driven by temperature (Sobolev andDanyushevsky (1994), pressure (e.g., Herzberg andO'Hara, 1998, Putirka, 2005), or both (Toplis, 2005), KD
(Fe–Mg)ol-liq should be greater at Hawaii. These differ-ences, especially (a)–(d) in the case of Falloon et al. (thisvolume), lead to underestimates of Tol-liq and Tex atHawaii.
Table A1Comparisons of estimates for olivine equilibration temperatures and mantle potential temperatures: T (C )
ol-liq
[T p(C )]; T (C )ol-liq
are calculated fromexpressions of DMg=ƒ(T,P,Xi) and a liquid and olivine composition pair
Kilauea-H
MORB-H HSDP SiqueirosFomax
Fo91.3 Fo91.5 Fo91.3 Fo91.5 P (GPa) 3 0.8 3 0.8 Eq. (2) This study 1578a[1626]b 1356[1419] 1624[1726] 1379[1452] Eq. (4) This study 1564[1612] 1329[1392] 1601[1701] 1345[1418] Beattie (1993) with H&Oc 1566[1614] 1335[1398] 1604[1706] 1352[1425] Ford et al. (1983) 1603[1651] 1336[1399] 1655[1757] 1358[1431] KD(Fe–Mg)ol-liq d 0.29 0.28 0.32 0.30
201K.D. Putirka et al. / Chemical Geology 241 (2007) 177–206
(continued)Table A1 (continued )
Kilauea-H
MORB-H HSDP SiqueirosKD(Fe–Mg)ol-liq Toplis (2005)
0.32 0.28 0.32 0.28 KD(Fe–Mg)ol-liq H&Oe 0.34 0.32 0.35 0.33 KD(Fe–Mg)ol-liq P(2005)f 0.34 0.32 0.34 0.32 Mean Tp (°C) 1626 1402 1722 1432 Tp S.D. 18 12 25 15 Excess T(°C) 224 290aT(C )olivine-liquid equilibrium values are calculated from expressions for DMg=ƒ(T,P,Xi ), assuming liquids have equilibrated with Fomax at the statedpressure. bT
p(brackets) is calculated fromT(C )ol-liq and Eqs. (A1) at Hawaii and (A2) forMORB. CompositionsKilauea-H andMORB-H are primarymagma
compositions considered representative byC.Herzberg (pers comm.; see Table 1). HSDP and Siqueiros are from this study (Table 1). dKD(Fe–Mg)ol-liq impliedby Fomax and liquid composition. cH&O refers to the T correction of Herzberg and O'Hara (2002) applied to the Beattie (1993) model (Beattie's Eq. (10));fPutirka (2005).
Table A2Comparison of predicted values for olivine equilibration temperatures, KD(Fe–Mg)ol-liq, and Fo contents: T(C )olivine-liquid[KD(Fe–Mg)ol-liq](Fo)
Excess T(C )a
Kilauea-H
MORB-H HSDP Siqueiros K−M H−SP (GPa)
1 atm 1 atm 1 atm 1 atm F 22.90% (A1) 12.80% (A1) 26.20% (A2) 14.30% (A1) Eqs. (2) and (3) 1528[0.34](90.2) 1347[0.32](90.6) 1568[0.35](90.9) 1368[0.32](90.9) Tp 1681 1432 1743 1463 249 280 Eqs. (4) and (5) 1412[0.29](91.5) 1285[0.30](91.2) 1446[0.29](92.3) 1300[0.30](91.6) Tp 1565 1370 1621 1395 195 226 Beattie (1993) with H&O 1505[0.31](90.9) 1367[0.31](90.7) 1535[0.31](91.7) 1381[0.31](91.1) Tp 1658 1452 1710 1476 206 234 Ford et al. (1983) 1456[0.31](91.0) 1330[0.31](90.7) 1486[0.31](91.8) 1346[0.31](91.1) Tp 1609 1415 1661 1441 194 220 Mean Tp (°C) 1628 1417 1684 1443 211 240 S.D. 52 35 53 36 26 27Excess T(C)
Kilauea-H MORB-H HSDP Siqueiros K−M K−MP(GPa)
3 0.8 3 0.8 F 13.20% 10.90% 21.30% 12.40% Eqs. (2) and (3) 1585[0.35](90.1) 1360[0.32](90.6) 1627[0.35](90.8) 1381[0.32](90.9) Tp 1633 1423 1729 1454 210 275 Eqs. (4) and (5) 1570[0.36](89.8) 1332[0.33](90.3) 1602[0.35](90.9) 1347[0.33](90.8) Tp 1618 1395 1704 1420 223 284 Beattie (1993) with H&O 1685[0.31](90.9) 1412[0.31](90.7) 1715[0.31](91.7) 1426[0.31](91.1) Tp 1733 1509 1817 1499 224 318 Ford et al. (1983) 1620[0.40](88.7) 1370[0.34](90.0) 1652[0.40](89.7) 1387[0.33](90.5) Tp 1668 1433 1754 1460 235 294 Mean Tp (°C) 1663 1440 1751 1458 223 293 S.D. 51 49 48 32 10 18T(C )olivine-liquid values are calculated from simultaneous solution of Eq. (1) and expressions of DMg=ƒ(T,P,Xi) and DFe=ƒ(T,P,Xi). Focontents of olivine and KD(Fe–Mg)ol-liq (=DFe /DMg) are model output. P and liquid composition are used as input. Mantle potentialtemperatures are calculated from T(C)olivine-liquid and F (from Eqs. (A1) for Hawaii and (A2) for MORB).
aExcess temperatures are K−M=TKilauea-H−TMORB-H and H−S=THSDP−TSiqueiros.
References
Ahern, J.L., Turcotte, D.L., 1979. Magma migration beneath an oceanridge. Earth and Planetary Science Letters 45, 115–122.
Albarede, F., 1992. How deep do common basaltic magmas form anddifferentiate? Journal of Geophysical Research 97, 10997–11009.
Albers, M., Christensen, U.R., 1996. The excess temperature ofplumes rising from the core–mantle boundary. GeophysicalResearch Letters 23, 3567–3570.
Allegre, C.J., Turcotte, D.L., 1985. Geodynamic mixing in themesosphere boundary layer and the origin of oceanic islands.Geophysical Research Letters 4, 207–210.

202 K.D. Putirka et al. / Chemical Geology 241 (2007) 177–206
Anderson, D.L., 1989. Theory of the Earth. Blackwell ScientificPublications, Boston. 366 pp.
Anderson, D.L., 1998. The scales of mantle convection. Tectonophy-sics 284, 1–17.
Anderson, D.L., 2000. The thermal state of the upper mantle; norole for mantle plumes. Geophysical Research Letters 27,3623–3626.
Ariskin, A.A., Frenkel, M.Ya., Barmina, G.S., Nielsen, R.L., 1993.COMAGMAT: a FORTRAN program to model magma differen-tiation processes. Computers and Geosciences 19, 1117–1155.
Asimow, P.D., Langmuir, C.H., 2003. The importance of water tooceanic mantle melting regimes. Nature 421, 815–820.
Asimow, P.D., Hirschmann, M.M., Stolper, E.M., 2001. Calculation ofperidotite partial melting from thermodynamic models of mineralsand melts, IV. Adiabatic decompression and the composition andmean properties of mid-ocean ridge basalts. Journal of Petrology42, 963–998.
Asimow, P.D., Dixon, J.E., Langmuir, C.H., 2004. A hydrous meltingand fractionation model for mid-ocean ridge basalts: application tothe mid-Atlantic ridge near the Azores. Geochemistry, Geophysics,Geosystems 28. doi:10.1029/2003GC000568.
Baker, D.R., Eggler, D.H., 1987. Compositions of anhydrous andhydrous melts coexisting with plagioclase, augite, and olivineor low-Ca pyroxene from 1 atm to 8 kbar; application to theAleutian volcanic center of Atka. American Mineralogist 72,12–28.
Baker, M.B., Stolper, E.M., 1994. Determining the composition ofhigh-pressure mantle melts using diamond aggregates. Geochimicaet Cosmochimica Acta 58, 2811–2827.
Baker, M.B., Grove, T.L., Price, R., 1994. Primitive basalts andandesites from the Mt. Shasta region, N. California: products ofvarying melt fraction and water content. Contributions toMineralogy and Petrology 118, 111–129.
Baker, M.B., Hirschmann, M.M., Ghiorso, M.S., Stolper, E.M., 1995.Compositions of near-solidus peridotite melts from experimentsand thermodynamic calculations. Nature 375, 308–311.
Baker, M.B., Alves, S., Stolper, E.M., 1996. Petrography andpetrology of the Hawaii Scientific Drilling Project lavas:inferences from olivine phenocryst abundances and compositions.Journal of Geophysical Research 101, 11715–11727.
Bartels, K.S., Kinzler, R.J., Grove, T.L., 1991. High pressure phaserelations of primitive high-alumina basalts from Medicine Lakevolcano, northern California. Contributions to Mineralogy andPetrology 108, 253–270.
Beattie, P., 1993. Olivine-melt and orthopyroxene-melt equilibria.Contributions to Mineralogy and Petrology 115, 103–111.
Bezos, A., Humler, E., 2005. The Fe3+/Fe ratios of MORB glasses andtheir implications for mantle melting. Geochimica et Cosmochi-mica Acta 69, 711–725.
Bina, C.R., Helffrich, G., 1994. Phase transition Clapeyron slopes andtransition zone seismic discontinuity topography. Journal ofGeophysical Research 99, 15853–15860.
Blatter, D.L., Carmichael, I.S.E., 2001. Hydrous phase equilibria of aMexican high-silica andesite; a candidate for a mantle origin?Geochimica et Cosmochimica Acta 65, 4043–4065.
Bock, G., 1991. Long-period S to P converted waves and the onset ofpartial melting beneath Oahu, Hawaii. Geophysical ResearchLetters 18, 869–872.
Bonatti, E., 1990. Not so hot “hot spots” in the oceanic mantle. Science250, 107–111.
Bowen, N.L., Anderson, O., 1914. The binary system MgO–SiO2.American Journal of Science 37, 487–500.
Brandon, A.D., Norman, M.D., Walker, R.J., Morgan, J.W., 1999.186Os–187Os systematics of Hawaiian picrites. Earth and PlanetaryScience Letters 174, 25–42.
Cammarano, F., Goes, S., Vacher, P., Giardini, D., 2003. Inferringupper mantle temperatures from seismic velocities. Physics of theEarth and Planetary Interiors 138, 197–222.
Cawthorn, R.G., 1975.Degrees ofmelting inmantle diapers and the originof ultrabasic liquids. Earth and Planetary Science Letters 27, 113–120.
Christiansen, R.L., Foulger, G.R., Evans, J.R., 2002. Upper-mantleorigin of the Yellowstone hotspot. Geological Society of AmericaBulletin 114, 1245–1256.
Clague, D.A., Weber, W.S., Dixon, J.E., 1991. Picritic glasses fromHawaii. Nature 353, 553–556.
Da Silva, C.R.S., Wentzcovitch, R.M., Patel, A., Price, G.D., Karato,S.I., 2000. The composition and geotherm of the lower mantle:constraints from the elasticity of silicate perovskite. Physics of theEarth and Planetary Interiors 118, 103–109.
Dalton, J.A., Presnall, D.C., 1998a. The continuum of primarycarbonatitic–kimberlitic melt compositions in equilibrium withlherzolite: data from the system CaO–MgO–Al2O3–SiO2–CO2 at6 GPa. Journal of Petrology 39, 1953–1964.
Dalton, J.A., Presnall, D.C., 1998b. Carbonatitic melts along the solidusof model lherzolite in the system CaO–MgO–Al2O3–SiO2–CO2
from 3 to 7 GPa. Contributions to Mineralogy and Petrology 131,123–135.
Davies, G.F., 1999. Dynamic Earth: Plates, Plumes and MantleConvection. Cambridge University Press. 458 pp.
Dixon, J.E., Leist, L., Langmuir, C., Schilling, J.-G., 2002. Recycleddehydrated lithosphere observed in plume-influenced mid-ocean-ridge basalt. Nature 420, 385–389.
Doglioni, C., Green, D.H., Mongelli, F., 2005. On the shallow origin ofhotspots and the westward drift of the lithosphere. In: Foulger, G.R.,Natland, J.H., Presnall, D.C., Anderson, D.L. (Eds.), Plates, Plumesand Paradigms. Geological Society of America Special Paper,vol. 388, pp. 735–750.
Draper, D.S., Johnston, A.D., 1992. Anhydrous PT phase relations ofan Aleutian high-MgO basalt; an investigation of the role ofolivine-liquid reaction in the generation of arc high-aluminabasalts. Contributions to Mineralogy and Petrology 112, 501–519.
Dunn, T., Sen, C., 1994. Mineral/matrix partition coefficient fororthopyroxene, plagioclase, and olivine in basaltic to andesiticsystems: a combined analytical and experimental study. Geochi-mica et Cosmochimica Acta 58, 717–733.
Eissen, J.P., 1982, Petrologie comparee de basalts de differentssegments de zones d'accreion oceanique e taux d'accretion varies(Mer Rouge, Atlantique, Pacifique), These, U. Strausberg.
Elthon, D., Scarfe, C.M., 1984. High-pressure phase equilibria of ahigh-magnesia basalt and the genesis of primary oceanic basalts.American Mineralogist 69, 1–15.
Esperança, S., Holloway, J.R., 1987. On the origin of some mica-lamprophyres; experimental evidence from a mafic minette.Contributions to Mineralogy and Petrology 95, 207–216.
Falloon, T.J., Green, D.H., 1987. Anhydrous partial melting of MORBpyrolite and other peridotite compositions at 10 kbar; implicationsfor the origin of primitive MORB glasses. Mineralogy andPetrology 37, 181–219.
Falloon, T.J., Green, D.H., Hatton, C.J., Harris, K.L., 1988. Anhydrouspartial melting of a fertile and depleted peridotite from 2 to 30 Kband application to basalt petrogenesis. Journal of Petrology 29,1257–1282.
Falloon, T.J., Green, D.H., O-Neill, H.-St., Hibberson, W.O., 1997.Experimental tests of low degree peridotite partialmelt compositions;
203K.D. Putirka et al. / Chemical Geology 241 (2007) 177–206
implications for the nature of anhydrous near-solidus peridotite meltsat 1 GPa. Earth and Planetary Science Letters 152, 149–162.
Falloon, T.J., Danyushevsky, L.V., Green, D.H., 2001. Peridotitemelting at 1 GPa; reversal experiments on partial melt composi-tions produced by peridotite-basalt sandwich experiments. Journalof Petrology 42, 2363–2390.
Feigenson, M.D., Bolge, L.L., Carr, M.J., Herzberg, C.T., 2003. REEinverse modeling of HSDP2 basalts: evidence for multiple sources inthe Hawaiian plume. Geochemistry, Geophysics, Geosystems 4 (2),8706. doi:10.1029/2001GC000271.
Ford, C.E., Russell, D.G., Craven, J.A., Fisk, M.R., 1983. Olivine-liquid equilibria: temperature, pressure and composition depen-dence of the crystal/liquid cation partition coefficients forMg, Fe2+,Ca and Mn. Journal of Petrology 24, 256–265.
Foulger, G.R., Natland, J.H., 2003. Is “hotspot” volcanisma consequenceof plate tectonics? Science 300, 921–922.
Foulger, G.R., Pritchard, M.J., Julian, B.R., Evans, J.R., Allen, R.M.,Nolet, G., Morgan, W.J., Bergsson, B.H., Erlendsson, P.,Jakobsdottir, S., Ragnarsson, S., Stefansson, R., Vogfjord, K.,2000. The seismic anomaly beneath Iceland extends does to themantle transition zone and no deeper. Geophysical JournalInternational 142, F1–F5.
Foulger, G.R., Natland, J.H., Anderson, D.L., 2005. Genesis of theIcelandmelt anomaly by plate tectonic processes. In: Foulger, G.R.,Natland, J.H., Presnall, D.C., Anderson, D.L. (Eds.), Plates, Plumesand Paradigms. Geological Society of America Special Paper, vol.388, pp. 595–626.
Fram, M.S., Lesher, C.E., 1997. Generation and polybaric differen-tiation of east Greenland early Tertiary flood basalts. Journal ofPetrology 38, 231–275.
Fram, M.S., Longhi, J., 1992. Phase equilibria of dikes associated withProterozoic anorthosite complexes. American Mineralogist 77,605–616.
Frost, D.J., 2003. The structure and sharpness of (Mg,Fe)2SiO4 phasetransformations in the transition zone. Earth and Planetary ScienceLetters 216, 313–328.
Gaetani, G.A., Grove, T.L., 1998. The influence of melting of mantleperidotite. Contributions toMineralogy and Petrology 131, 323–346.
Garcia, M.O., 2002. Submarine picritic basalt from Ko'olau volcano,Hawai'i: implications for parental magma composition and mantlesource. In: Takahashi, E., Lipman, P.W., Garcia, M.O., Naka, J.,Aramaki, S. (Eds.), Hawaiian Volcanoes: Deep UnderwaterPerspectives. Geophysical Monograph, vol. 128. AGU, Washing-ton DC, pp. 391–402.
Garcia, M.O., Hulsebosch, T.P., Rhodes, J.M., 1995. Olivine-richsubmarine basalts from the southwest rift zone of Mauna Loavolcano: implications for magmatic processes and geochemicalevolution. In: Rhodes, J.M., Lockwood, J.P. (Eds.), Mauna LoaRevealed. Geophysical Monograph, vol. 92. AGU, WashingtonDC, pp. 219–240.
Gee, L.L., Sack, R.O., 1988. Experimental petrology of melilitenephelinites. Journal of Petrology 29, 1233–1255.
Ghiorso,M.S., Carmichael, I.S.E., Rivers, M.L., Sack, R.O., 1983. TheGibbs free energy of natural silicate liquids; an expanded regularsolution approximation for the calculation of magmatic intensivevariables. Contributions toMineralogy and Petrology 84, 107–145.
Green, D.H., Falloon, T.J., 2005. Primary magmas at mid-oceanridges, “hot spots” and other intraplate settings; constraints onmantle potential temperature. In: Foulger, G.R., Natland, J.H.,Presnall, D.C., Anderson, D.L. (Eds.), Plates, Plumes andParadigms. Geological Society of America Special Paper, vol.388, pp. 217–248.
Green, D.H., Ringwood, A.E., 1967. The genesis of basaltic magmas.Contributions to Mineralogy and Petrology 15, 103–190.
Green, D.H., Falloon, T.J., Eggins, S.M., Yaxley, G.M., 2001. Primarymagmas and mantle temperatures. European Journal of Mineral-ogy 13, 437–451.
Grove, T.L., Juster, T.C., 1989. Experimental investigations of low-Capyroxene stability and olivine-pyroxene-liquid equilibria at 1-atmin natural basaltic and andesitic liquids. Contributions toMineralogy and Petrology 103, 287–305.
Grove, T.L., Kinzler, R.J., Bryan, W.B., 1990. Natural and experimen-tal phase relations of lavas from Serocki Volcano. Proceedings ofthe Ocean Drilling Program. Scientific Results 106/109, 9–17.
Grove, T.L., Kinzler, R.J., Bryan,W.B., 1992, Fractionation ofmid-oceanridge basalt (MORB). In: PhippsMorgan, J., Blackman, D.K. Sinton,J.M. (Eds.), Mantle flow and melt generation at mid ocean ridges.Geophys. Monogr. Ser., 7, Am. Geophys. Union., pp. 281–310.
Grove, T.L., Donnelly-Nolan, J.M., Housh, T., 1997. Magmaticprocesses that generated the rhyolite of Glass Mountain, Medicinelake volcano. N. California. Contributions to Mineralogy andPetrology 127, 205–223.
Grove, T.L., Elkins-Tanton, L.T., Parman, S.W., Chatterjee, N.,Muntener, O., Gaetani, G.A., 2003. Fractional crystallization andmantle-melting controls on calk–alkaline differentiation trends.Contributions to Mineralogy and Petrology 145, 515–533.
Gudfinnsson, G.H., Presnall, D.C., 2000. Melting behavior of modellherzolite in the system CaO–MgO–Al2O3–SiO2–FeO at 0.7–2.8 GPa. Journal of Petrology 41, 1241–1269.
Gudfinnsson, G.H., Presnall, D.C., 2001. A pressure-independentgeothermometer for primitive mantle melts. Journal of Geophys-ical Research 106, 16205–16211.
Hays, M.R., Perfit, M.R., Fornari, D.J., Ridley, W., 2004. Magmatism inthe Siqueiros transform:major and trace element evidence formixingand multiple sources. Trans. Am. Geophys. Union, T41A-1165.
Herzberg, C., 1995. Generation of plume magmas through time: anexperimental perspective. Chemical Geology 126, 1–16.
Herzberg, C., 2004. Geodynamic information in peridotite petrology.Journal of Petrology 45, 2507–2530.
Herzberg, C., O'Hara, M.J., 1998. Phase equilibrium constraints on theorigin of basalts, picrites and komatiites. Earth-Science Reviews44, 39–79.
Herzberg, C., O'Hara, M.J., 2002. Plume-associated ultramaficmagmas of Phanerozoic age. Journal of Petrology 43, 1857–1883.
Herzberg, C., Zhang, J., 1996. Melting experiments on anhydrousperidotite KLB-1; composition of magmas in the upper mantle andtransition zone. Journal of Geophysical Research 101, 8271–8295.
Hess, H.H., 1962. History of the ocean basins. In: Engel, A.E., James,H.L., Leonard, B.F. (Eds.), Petrologic studies: A volume in honorof A.F. Buddington. Geological Society of America, pp. 599–620.
Hirose, K., 2002. Phase transitions in pyrolitic mantle around 670-kmdepth: implications for upwelling of plumes from the lower mantle.Journal of Geophysical Research 107, 2078. doi:10.1029/2001JB000597.
Hirschmann, M.M., 2000. Mantle solidus: experimental constraintsand the effects of peridotite composition. Geochemistry, Geophys-ics, Geosystems 1 (2000GC000070).
Hofmeister, A.M., 1999. Mantle values of thermal conductivity andthe geotherm from phonon lifetimes. Science 283, 1699–1706.
Humphreys, E.D., Dueker, K.G., Schutt, D.L., Smith, R.B., 2000.Beneath Yellowstone: evaluating plume and nonplume modelsusing teleseismic images of the upper mantle. GSAToday 10, 1–7.
Humayun, M., Qin, L., Norman, M.D., 2004. Geochemical evidencefor excess Iron in the mantle beneath Hawaii. Science 306, 91–94.
204 K.D. Putirka et al. / Chemical Geology 241 (2007) 177–206
Ito, E., Katsura, T., 1989. A temperature profile of the mantle transitionzone. Geophysical Research Letters 16, 425–428.
Ito, G., Shen, Y., Hirth, G., Wolfe, C.J., 1999. Mantle flow, melting,and dehydration of the Iceland mantle plume. Earth and PlanetaryScience Letters 165, 81–96.
Jackson, E.D., Shaw, H.R., Bargar, K.E., 1975. Calculated geochro-nology and stress field orientation along the Hawaiian chain. Earthand Planetary Science Letters 26, 145–155.
Jacques, A.L., Green, D.H., 1980. Anhydrous melting of peridotite at0–15 kb pressure and the genesis of tholeiitic basalts. Contribu-tions to Mineralogy and Petrology 73, 210–287.
Jeanloz, R., Morris, S., 1986. Temperature distribution in the crust andmantle. Annual Review of Earth and Planetary Sciences 14, 377–415.
Jeanloz, R., Thompson, A.B., 1983. Phase transitions and mantlediscontinuities. Reviews of Geophysics and Space Physics 21,51–74.
Juster, T.C., Grove, T.L., Perfit, M.R., 1989. Experimental constraintson the generation of FeTi basalts, andesites and rhyodacites at theGalapagos Spreading center, 85°W and 95°W. Journal ofGeophysical Research 94, 9251–9274.
Kelemen, P.B., Koga, K., Shimuzu, N., 1997. Geochemistry of gabbrosills in the crust–mantle transition zone of the Oman ophiolite:implications for the origin of the oceanic lower crust. Earth andPlanetary Science Letters 146, 475–488.
King, S.D., 1995. Models of mantle viscosity, A Handbook of PhysicalConstants. American Geophysical Union Ref. Shelf 2, 227–236.
Kinzler, R.J., Grove, T.L., 1985. Crystallization and differentiation ofArchean komatiite lavas from Northeast Ontario; phase equilibri-um and kinetic studies. American Mineralogist 70, 40–51.
Kinzler, R.J., Grove, T.L., 1992a. Primary magmas of mid-ocean ridgebasalts 1. Experiments and methods. Journal of GeophysicalResearch 97, 6885–6906.
Kinzler, R.J., Grove, T.L., 1992b. Primary magmas of mid-ocean ridgebasalts 2. Applications. Journal of Geophysical Research 97,6907–6926.
Klein, E.M., Langmuir, C.H., 1987. Global correlations of ocean ridgebasalt chemistry with axial depth and crustal thickness. Journal ofGeophysical Research 92, 8089–8115.
Klügel, A., Klein, F., 2006. Complex magma storage and ascent atembryonic submarine volcanoes from Madeira Archipelago.Geology 34, 337–340.
Kogiso, T., Hirose, K., Takahashi, E., 1998. Melting experiments onhomogeneous mixtures of peridotite and basalt; application to thegenesis of ocean island basalts. Earth and Planetary Science Letters162, 45–61.
Kogiso, T., Hirschmann, M.M., 2001. Experimental study of clinopyrox-enite partial melting and the origin of ultra-calcic melt inclusions.Contributions to Mineralogy and Petrology 142 (3), 347–360.
Kress, V.C., Carmichael, I.S.E., 1988. Stoichiometry of the ironoxidation reaction in silicate melts. American Mineralogist 73,1267–1274.
Langmuir, C.H., Hanson, G.N., 1980. An evaluation of major elementheterogeneity in the mantle sources of basalts. PhilosophicalTransactions of the Royal Society of London. A 297, 383–407.
Langmuir, C.H., Hanson, G.N., 1981. Calculating mineral-meltequilibria with stoichiometry, mass balance, and single componentdistribution coefficients, in Thermodynamics of Minerals andMelts. In: Newton, R.C., Navrotsky, A., Wood, B.J. (Eds.),Springer-Verlag, pp. 247–271.
Langmuir, C.H., Klein, E.M., Plank, T., 1992. Petrological systematicsof mid-ocean ridge basalts: constraints on melt generation beneathocean ridges. In: Morgan, J.P., Blackman, D.K., Sinton, J.M.
(Eds.), Mantle Flow and Melt Generation at Mid-Ocean Ridges.Geophysical Monograph, vol. 71. AGU, Washington DC,pp. 183–280.
Laske, G., Morgan, J.P., Orcutt, J.A., 1999. First results from theHawaiian SWELL Plot Experiment. Geophysical Research Letters26, 3397–3400.
Leitch, A.M., Steinbach, V., Yuen, D.A., 1996. Centerline temperatureof mantle plumes in various geometries: incompressible flow.Journal of Geophysical Research 101, 21829–21846.
Leeman, W.P., Lewis, J.F., Evarts, R.C., Conrey, R.M., Streck, M.J.,2005. Petrologic constraints on the thermal structure of theCascades arc. Journal of Volcanology and Geothermal Research140, 67–105.
Li, X., Kind, R., Yuan, X., Wölbern, I., Hanka, W., 2004. Rejuvenationof the lithosphere by the Hawaiian plume. Nature 427, 827–829.
Longhi, J., 2002. Some phase equilibrium systematics of lherzolitemelting: I. Geochemistry, Geophysics, Geosystems 3. doi:10.1029/2001GC000204.
Longhi, J., 2005. Temporal stability an pressure calibration of bariumcarbonate and talc/pyrex pressure media in a piston-cylinderapparatus. American Mineralogist 90, 206–218.
Longhi, J., Pan, V., 1988. A reconnaissance study of phase boundariesin low-alkali basaltic liquids. Journal of Petrology 29, 115–147.
Longhi, J., Walker, D., Hays, J.F., 1978. The distribution of Fe and Mgbetween olivine and lunar basaltic liquids. Geochimica etCosmochimica Acta 42, 1545–1558.
Longhi, J., Vander Auwera, J., Fram, M.S., Duchesne, J.-C., 1999. Somephase equilibrium constraints on the origin of Proterozoic (massif)anorthosites and related rocks. Journal of Petrology 40, 339–362.
MacLennan, J., McKenzie, D., Gronvold, K., 2001a. Plume-drivenupwelling under central Iceland. Earth and Planetary ScienceLetters 194, 67–82.
MacLennan, J., McKenzie, D.M., Gronvöld, K., Slater, L., 2001b.Crustal accretion under northern Iceland. Earth and PlanetaryScience Letters 191, 295–310.
McKenzie, D., 1967. Some remarks on heat flow and gravityanomalies. Journal of Geophysical Research 72, 6261–6273.
McKenzie, D., 1984. The generation and compaction of partiallymolten rock. Journal of Petrology 25, 713–765.
McKenzie, D., Bickle, M.J., 1988. The volume and composition ofmelt generated by extension of the lithosphere. Journal ofPetrology 29, 625–679.
MELT Seismic Team, 1998. Imaging the deep seismic structurebeneath a mid-ocean ridge: the MELT experiment. Science 280,1215–1218.
Montelli, R., Nolet, G., Dahlen, F.A., Masters, G., Engdahl, E.R.,Hung, S.-H., 2004. Finite-frequency tomography reveals a varietyof plumes in the mantle. Science 303, 338–343.
Montierth, C., Johnston, A.D., Cashman, K.V., 2000. An empiricalglass-composition-based geothermometer for Mauna Loalavas. In: Rhodes, J.M., Lockwood, J.P. (Eds.), Mauna LoaRevealed. Geophysical Monograph, vol. 92. AGU, WashingtonDC, pp. 207–218.
Moore, G., Carmichael, I.S.E., 1998. The hydrous phase equilibria (to3 kbar) of an andesite and basaltic andesite from western Mexico;constraints on water content and conditions of phenocryst growth.Contributions to Mineralogy and Petrology 130, 304–319.
Morgan, W.J., 1971. Convection plumes in the lower mantle. Nature230, 42–43.
Müntener, O., Kelemen, P.B., Grove, T.L., 2001. The role of H2Oduring crystallization of primitive arc magmas under uppermostmantle conditions and genesis of igneous pyroxenites: and

205K.D. Putirka et al. / Chemical Geology 241 (2007) 177–206
experimental study. Contributions to Mineralogy and Petrology141, 643–658.
Murck, B.W., Campbell, I.H., 1986. The effects of temperature,oxygen fugacity and melt composition on the behavior ofchromium in basic and ultrabasic melts. Geochimica et Cosmo-chimica Acta 50, 1871–1887.
Nataf, H.-C., VanDecar, J., 1993. Seismological detection of a mantleplume? Nature 364, 115–120.
Norman, M.D., Garcia, M.O., 1999. Primitive magmas and sourcecharacteristics of the Hawaiian plume: petrology and geochem-istry of shield picrites. Earth and Planetary Science Letters 168,27–44.
Norman, M.D., Garcia, M.O., Kamenetsky, V.S., Nielsen, R.L., 2002.Olivine-hosted melt inclusions in Hawaiian picrites: equilibration,melting and plume source characteristics. Chemical Geology 183,143–168.
O'Hara, M.J., 1968. Are ocean floor basalts primary magma? Nature220, 683–686.
O'Hara, M.J., 1970. Upper mantle composition inferred fromlaboratory experiments and observation of volcanic products.Physics of Earth and Planetary Interiors 3, 236–245.
O'Hara, M.J., 1978. Thermal history of magmas; the low pressurereference point. Philosophical transactions of the Royal Society ofLondon 288A, 627–629.
Parman, S.W., Dann, J.C., Grove, T.L., de-Wit,M.J., 1997. Emplacementconditions of komatiitemagmas from the 3.49GaKomati Formation,Barberton greenstone belt, SouthAfrica. Earth and Planetary ScienceLetters 150, 303–323.
Perfit, M.R., Fornari, D.J., Ridley, W.I., Kirk, P.D., Casey, J., Kastens,K.A., Reynolds, J.R., Edwards, M., Desonie, D., Shuster, R.,Paradis, S., 1996. Recent volcanism in the Siqueiros transformfault: picritic basalts and implications for MORB magma genesis.Earth and Planetary Science Letters 141, 91–108.
Pichavant, M., Mysen, B.O., Macdonald, R., 2002. Source and H2Ocontent of high-MgO magmas in island arc settings: anexperimental study of primitive calc–alkaline basalt from St.Vincent, Lesser Antilles arc. Geochimica et Cosmochimica Acta66, 2193–2209.
Pickering-Witter, J., Johnston, A.D., 2000. The effects of variable bulkcomposition on the melting systematics of fertile peridotiticassemblages. Contributions to Mineralogy and Petrology 140,190–211.
Powers, H.A., 1955. Composition and origin of basaltic magma of theHawaiian Islands. Geochimica et Cosmochimica Acta 7, 77–107.
Presnall, D.C., Gudfinnsson, G.H., 2005. Carbonate-rich melts in theoceanic low-velocity zone and deep mantle. In: Foulger, G.R.,Natland, J.H., Presnall, D.C., Anderson, D.L. (Eds.), Plates,Plumes and Paradigms. Geological Society of America SpecialPaper, vol. 388, pp. 207–216.
Presnall, D.C., Walter, M.J., 1993. Melting of forsterite, Mg2SiO4, from9.7 to 16.5 GPa. Journal of Geophysical Research 98, 19777–19783.
Presnall, D.C., Gudfinnsson, G.H., Walter, M.J., 2002. Generation ofmid-ocean ridge basalts at pressures from 1 to 7 GPa. Geochmiciaet Cosmochimica Acta 66, 2073–2090.
Priestley, K., Tilmann, F., 1999. Shear-wave structure of thelithosphere above the Hawaiian hot spot from two-station Rayleighwave phase velocity measurements. Geophysical Research Letters26, 1493–1496.
Putirka, K., 1997. Magma transport at Hawaii: inferences based onigneous thermobarometry. Geology 25, 69–72.
Putirka, K., 1998. Garnet+ liquid equilibrium. Contributions toMineralogy and Petrology 131, 273–288.
Putirka, K., 1999. Melting depths and mantle heterogeneity beneathHawaii and the East Pacific Rise: constraints from Na/Ti and rareearth element ratios. Journal of Geophysical Research 104,2817–2829.
Putirka, K., 2005. Mantle potential temperatures at Hawaii, Iceland, andthe mid-ocean ridge system, as inferred from olivine phenocrysts:evidence for thermally-driven mantle plumes. Geochemistry,Geophysics, Geosystems. doi:10.1029/2005GCGC000915.
Rhodes, J.M., Vollinger, M.J., 2004. Composition of basaltic lavassampled by phase-2 of the Hawaii Scientific Drilling Project:geochemical stratigraphy and magma series types. Geochemistry,Geophysics, Geosystems 5 (3). doi:10.1029/2002GC00434.
Rhodes, J.M., Vollinger, M.J., 2005. Ferrous/ferric ratios in 1984 MaunaLoa lavas: a contribution to understanding the oxidation state ofHawaiian magmas. Contributions to Mineralogy and Petrology 149,666–674.
Ribe, N.M., Christensen, U.R., 1999. The dynamical origin of Hawaiianvolcanism. Earth and Planetary Science Letters 171, 517–531.
Righter, K., Carmichael, I.S.E., 1996. Phase equilibria of phlogopitelamprophyres from western Mexico; biotite-liquid equilibria andP–T estimates for biotite-bearing igneous rocks. Contributions toMineralogy and Petrology 123 (1), 1–21.
Ritsema, J., Allen, R.M., 2003. The elusive mantle plume. Earth andPlanetary Science Letters 207, 1–12.
Robinson, J.A.C., Wood, B.J., Blundy, J.D., 1998. The beginning ofmelting of fertile and depleted peridotite at 1.5 GPa. Earth andPlanetary Science Letters 155, 97–111.
Roeder, P.L., Emslie, R.F., 1970. Olivine-liquid equilibrium. Con-tributions to Mineralogy and Petrology 29, 275–289.
Sack, R.O., Walker, D., Carmichael, I.S.E., 1987. Experimentalpetrology of alkalic lavas: constraints on cotectics of multiplesaturation in natural basic liquids. Contributions to Mineralogy andPetrology 96, 1–23.
Salters, V.J.M., Hart, S.R., 1989. The Hf paradox and the role of garnetin the source of mid-ocean ridge basalts. Nature 342, 420–422.
Schilling, J.G., 1991. Fluxes and excess temperatures of mantleplumes inferred from their interaction with migrating mid-oceanridges. Nature 352, 397–403.
Schwab, B.E., Johnston, A.D., 2001. Melting systematics of modallyvariable, compositionally intermediate peridotites and the effectsof mineral fertility. Journal of Petrology 42, 1789–1811.
Shaw, H.R., Jackson, E.D., 1973. Linear island chains in the Pacific:results o thermal plumes or gravitational anchors? Journal ofGeophysical Research 78, 8634–8652.
Shen, Y., Forsyth, D.W., 1995. Geochemical constraints on initial andfinal depths of melting beneath mid-ocean ridges. Journal ofGeophysical Research 100, 2211–2237.
Sisson, T.W., Grove, T.L., 1993a. Experimental investigations of the role ofH2O in calc–alkaline differentiation and subduction zone magmatism.Contributions to Mineralogy and Petrology 113, 143–166.
Sisson, T.W., Grove, T.L., 1993b. Temperatures and H2O contents oflow-MgO high-alumina basalts. Contributions to Mineralogy andPetrology 113, 167–184.
Sleep, N.H., 1990. Hotspots and mantle plumes: some phenomenol-ogy. Journal of Geophysical Research 95, 6715–6736.
Smyth, J.R., Frost, D., 2002. The effect of water on the 410-kmdiscontinuity; an experimental study. Geophysical Research Letters29, 10–13.
Sobolev, A.V., Danyushevsky, L.V., 1994. Petrology and geochemistryof boninites from the north termination of the Tonga Trench:constraints on the generation conditions of primary high-Caboninite magmas. Journal of Petrology 35, 1183–1211.

206 K.D. Putirka et al. / Chemical Geology 241 (2007) 177–206
Sobolev, A.V., Hofmann, A.W., Sobolev, S.V., Nikogosian, I.K., 2005.An olivine-free mantle source of Hawaiian shield basalts. Nature434, 590–597.
Stein, C.A., Stein, S., 1992. A model for the global variation in oceanicdepth and heat flow with lithospheric age. Nature 359, 123–129.
Stolper, E., 1980. A phase diagram for mid-ocean ridge basalts:preliminary results and implications for petrogenesis. Contribu-tions to Mineralogy and Petrology 74, 13–27.
Stracke, A., Salters, V.J.M., Sims, K.W., 2003. Assessing the presenceof garnet–pyroxenite in the mantle sources of basalts throughcombined hafnium–neodymium–thorium isotope systematics.Geochemistry, Geophysics, Geosystems 1 (1999GC000013).
Sugawara, T., 2000. Empirical relationships between temperature,pressure, and MgO content in olivine and pyroxene saturatedliquid. Journal of Geophysical Research 105, 8457–8472.
Sugawara, T., 2001. Ferric iron partitioning between plagioclase andsilicate liquid; thermodynamics and petrological applications.Contributions to Mineralogy and Petrology 141, 659–686.
Tackley, P.J., 2000. Mantle convection and plate tectonics: towardan integrated physical and chemical model. Science 288,2002–2007.
Takagi, D., Sato, H., Nakagawa, 2005. Experimental study of a low-alkali tholeiite at 1–5 kbar: optimal condition for the crystallizationof high-An plagioclase in hydrous arc tholeiite. Contributions toMineralogy and Petrology 149, 527–540.
Takahashi, E., Shimazaki, T., Tsuzaki, Y., Yoshida, H., 1993. Meltingstudy of a peridotite KLB-1 to 6.5 GPa, and the origin of basalticmagmas. Philosophical Transactions of the Royal Society ofLondon 342, 105–120.
Thompson, R.N., Discussion, Bottinga, Y., Allegre, C.J. 1978. Partialmelting under spreading ridges, Philosophical Transactions of theRoyal Society of London, 288A, 524–525.
Thy, P., 1991. High and low pressure phase equilibria of a mildlyalkalic lava from the 1965 Surtsey eruption: experimental results.Lithos 26, 223–243.
Thybo, H., Nielsen, L., Perchuc, E., 2003. Seismic scattering at the topof the mantle transition zone. Earth and Planetary Science Letters216, 259–269.
Toplis, M.J., 2005. The thermodynamics of iron and magnesiumpartitioning between olivine and liquid: criteria for assessing andpredicting equilibrium in natural and experimental systems.Contributions to Mineralogy and Petrology 149, 22–39.
Tormey, D.R., Grove, T.L., Bryan, W.B., 1987. Experimentalpetrology of normal MORB near the Kane Fracture Zone: 22°–25° N, mid-Atlantic Ridge. Contributions to Mineralogy andPetrology 96, 121–139.
Trönnes, R.G., Canil, D., Wei, K., 1992. Element partitioning betweensilicate minerals and coexisting melts at pressure of 1–27 GPa, andimplications for mantle evolution. Earth and Planetary ScienceLetters 111, 241–255.
Vander Auwera, J., Longhi, J., 1994. Experimental study of jotunite(hypersthene monzodiorite): constraints on the parent magma com-position and crystallization conditions (P, T, fO2) of the Bjerkreim–
Sokndal layered intrusion (Norway). Contributions to Mineralogyand Petrology 118, 60–78.
Vander Auwera, J., Longhi, J., Duchesne, J.-C., 1998. A liquid line ofdescent of the jotunite (hypersthene monzodiorite) suite. Journal ofPetrology 39, 439–468.
Verhoogen, J., 1954. Petrological evidence on temperature distributionin the mantle of the earth. Transaction of the American GeophysicalUnion 35, 85–92.
Verhoogen, J., 1965. Phase changes and convection in the Earth'smantle. Philosophical Transactions of the Royal Society of London258A, 276–283.
Verhoogen, J., 1973. Possible temperatures in the oceanic upper mantleand the formation of magma. Geological Society of America Bulletin84, 515–522.
Wagner, T.P., Grove, T.L., 1997. Experimental constraints on theorigin of lunar high-Ti ultramafic glasses. Geochimica etCosmochimica Acta 61, 1315–1327.
Walker, D., 2000. Core participation in mantle geochemistry:geochemical Society Ingerson Lecture, GSA, Denver, October1999. Geochimica et Cosmochimica Acta 64, 2897–2911.
Walker, D., Shibata, T., DeLong, St.E., 1979. Abyssal tholeiites fromthe Oceanographer fracture zone; II, Phase equilibria and mixing.Contributions to Mineralogy and Petrology 70, 111–125.
Walker, D., Clark, S.M., Cranswick, L.M.D., Johnson,M.C., Jones, R.L.,2002. O2 volumes at high pressure from KClO4 decomposition: D″as a siderophile element pump instead of a lid on the core. Geo-chemistry, Geophysics, Geosystems 3. doi:10.1029/2001GC000225.
Walter, M.J., 1998. Melting of garnet peridotite and the origin ofkomatiite and depleted lithosphere. Journal of Petrology 39, 29–60.
Wang, K., Plank, T., Walker, J.D., Smith, E.I., 2002. A mantle meltingprofile across the Basin and Range, SW USA. Journal ofGeophysical Research 107. doi:10.1029/2001JB000209.
Wasylenki, L.E., Baker-, M.B., Kent, A.J.R., Stolper, E.M., 2003.Near-solidus melting of the shallow upper mantle; partial meltingexperiments on depleted peridotite. Journal of Petrology 44,1163–1191.
Watson, S., McKenzie, D., 1991. Melt generation by plumes; a studyof Hawaiian volcanism. Journal of Petrology 32, 501–537.
Wolfe, C.J., Bjarnason, I.Th., VanDecar, J.C., Solomon, S.C., 1997.Seismic structure of the Icelandmantle plume. Nature 385, 245–247.
Wright, T.L., 1973. Magma mixing as illustrated by the 1959 eruption,Kilauea volcano, Hawaii. Geological Society of America Bulletin84, 849–858.
Wyllie, P.J., 1988, Solidus Curves, mantle plumes, and magmageneration beneath Hawaii, 93, 4171–4181.
Xirouchakis, D., Hirschmann, M.M., Simpson, J.A., 2001. The effectof titanium on the silica content and on mineral-liquid partitioningof mantle-equilibrated melts. Geochimica et Cosmochimica Acta65, 2201–2217.
Yang, H.-J., Kinzler, R.J., Grove, T.L., 1996. Experiments and modelsof anhydrous, basaltic olivine–plagioclase–augite saturated meltsfrom 0.001 to 10 kbar. Contributions to Mineralogy and Petrology124, 1–18.
Related Documents